Embed Size (px)
Citation preview

Advanced Placement Report2009-2018
Phoenixville Area High School
Phoenixville Area School District
Phoenixville, Pennsylvania

Number of AP Exams Administeredfrom 2009-2018
210 283 276
382
507
663
848 824
992 1023
0
200
400
600
800
1000
1200
2009 2010 2011 2012 2013 2014 2015 2016 2017 2018

Enrollment vs. Tested Percentage
Year
# of Students
enrolled in all AP
classes
# of Students who
took the test
Percentage of
students who took
the test
2009 285 210 74%
2010 369 283 77%
2011 331 276 83%
2012 454 382 84%
2013 619 507 82%
2014 767 663 86%
2015 957 848 89%
2016 918 824 90%
2017 1082 992 91.7%
2018 1100 1023 93%
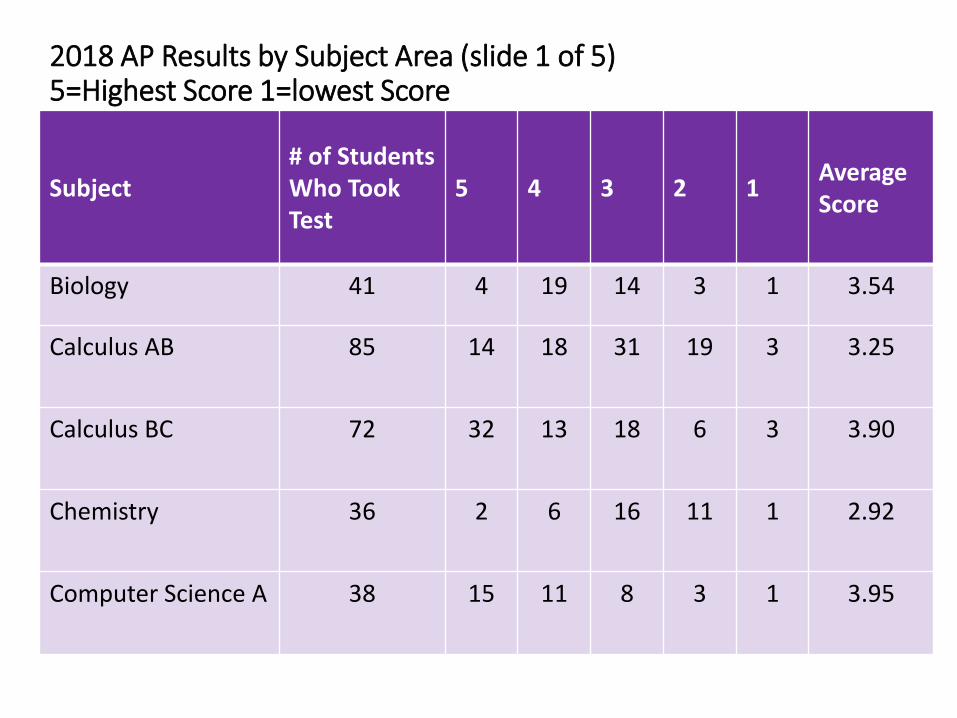
2018 AP Results by Subject Area (slide 1 of 5)5=Highest Score 1=lowest Score
Subject# of Students Who Took Test
5 4 3 2 1AverageScore
Biology 41 4 19 14 3 1 3.54
Calculus AB 85 14 18 31 19 3 3.25
Calculus BC 72 32 13 18 6 3 3.90
Chemistry 36 2 6 16 11 1 2.92
Computer Science A 38 15 11 8 3 1 3.95

2018 AP Results by Subject Area (slide 2 of 5)5=Highest Score 1=Lowest Score
Subject
# of Students Who Took Test
5 4 3 2 1 Average
Computer SciencePrinciples
16 2 4 8 2 3.38
English Language &Culture
55 9 22 16 8 3.58
English Literature & Composition
39 5 17 11 6 3.54
Environmental Science
42 9 17 8 4 4 3.55
European History 19 6 6 5 1 3.95

2018 AP Results by Subject Area (slide 3 of 5)5=Highest Score 1=Lowest Score
Subject
# of Students Who Took Test
5 4 3 2 1 Average
French Language & Culture
2 2 3.00
German Language & Culture
3 1 1 1 3.00
Human Geography 114 42 28 19 16 9 3.68
Latin 2 1 1 1.50
Microeconomics 38 7 17 8 5 1 3.63
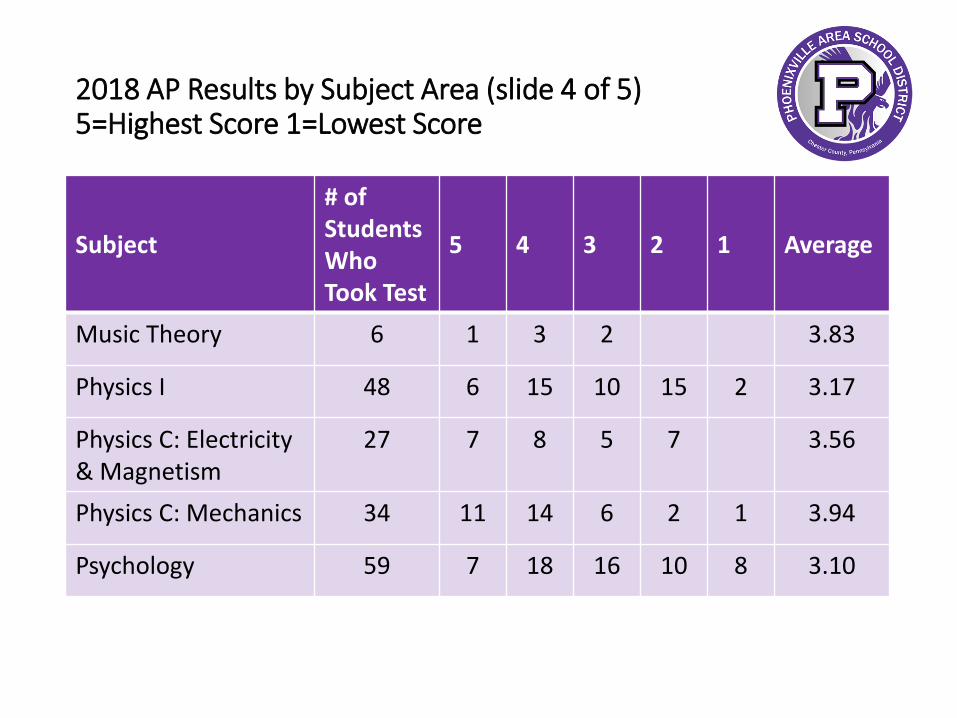
2018 AP Results by Subject Area (slide 4 of 5)5=Highest Score 1=Lowest Score
Subject
# of Students Who Took Test
5 4 3 2 1 Average
Music Theory 6 1 3 2 3.83
Physics I 48 6 15 10 15 2 3.17
Physics C: Electricity& Magnetism
27 7 8 5 7 3.56
Physics C: Mechanics 34 11 14 6 2 1 3.94
Psychology 59 7 18 16 10 8 3.10
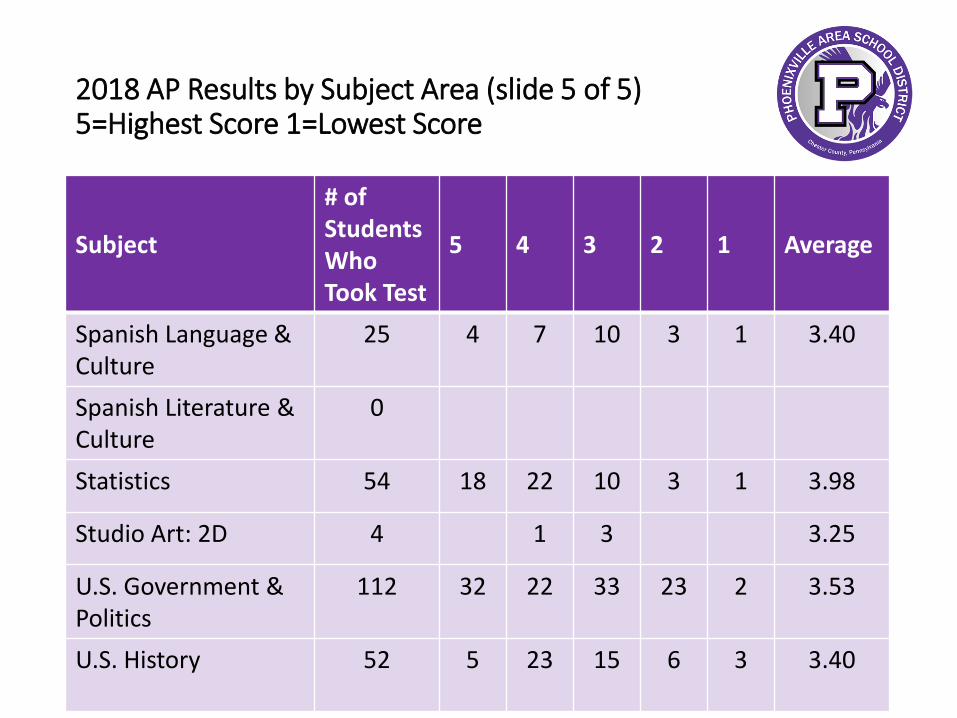
2018 AP Results by Subject Area (slide 5 of 5)5=Highest Score 1=Lowest Score
Subject
# of Students Who Took Test
5 4 3 2 1 Average
Spanish Language &Culture
25 4 7 10 3 1 3.40
Spanish Literature &Culture
0
Statistics 54 18 22 10 3 1 3.98
Studio Art: 2D 4 1 3 3.25
U.S. Government & Politics
112 32 22 33 23 2 3.53
U.S. History 52 5 23 15 6 3 3.40

2018 Score DistributionNational Percentage vs. PAHS
Note: PAHS Scores 3 and above, were higher than the national percentage
Score National Percentage PAHS Percentage
5 13.65% 23.26%
4 19.79% 30.60%
3 25.02% 26.88%
2 23.40% 15.15%
1 18.14% 4.11%
Due to rounding, percentages do not add to 100.

Percentage of Students Who Received a Score of 3 or Higher
Note: PAHS has a higher percentage of students scoring a 3 or higher than students in PA, Nationally and Globally
• Percentage of Phoenixville Area High School: 83.2
• Percentage of Students in Pennsylvania: 68.2
• Percentage of students Nationally: 58.5
• Percentage of students Globally: 61.3
83.2
68.2
58.5 61.3
0
10
20
30
40
50
60
70
80
90
2018
PAHS
Pennsylvania
Nationally
Globally
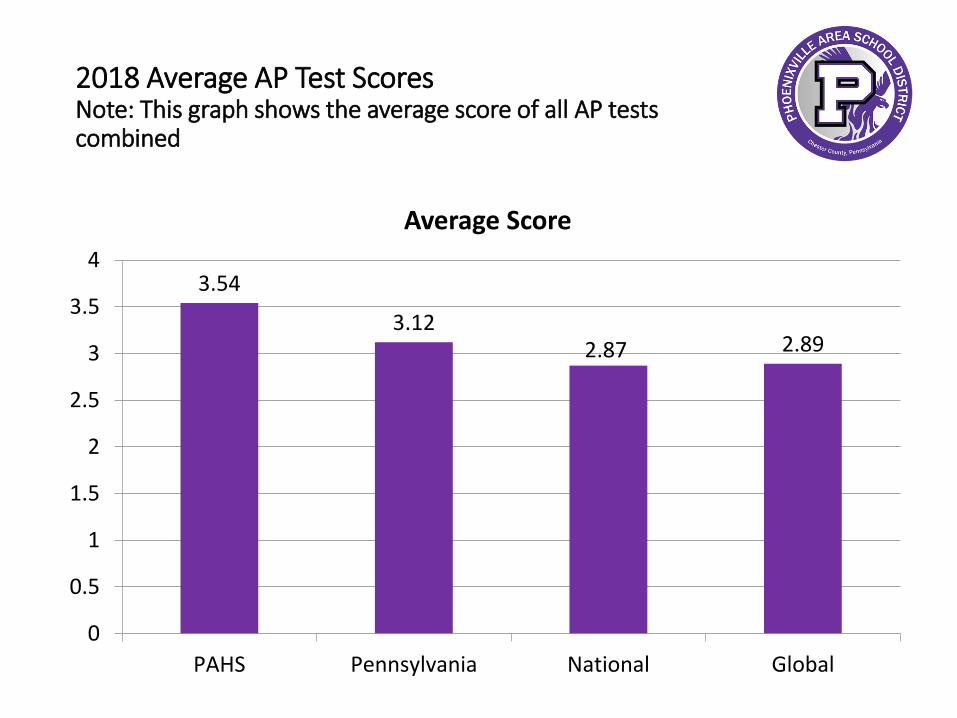
2018 Average AP Test ScoresNote: This graph shows the average score of all AP tests combined
3.54
3.122.87 2.89
0
0.5
1
1.5
2
2.5
3
3.5
4
PAHS Pennsylvania National Global
Average Score

2018 PAHS AP Scholar Students
AP ScholarStudents who score a 3 or higher on 3 + AP Exams
69
AP Scholar with HonorAverage score of 3.25 on all AP Exams taken, and scores of 3
or higher on four or more of these exams29
AP Scholar with DistinctionAverage score of at least 3.5 on all AP Exams taken, and
scores of 3 or higher on five or more of these exams89
National AP ScholarGranted to students in the United States who receive an
average score of at least 4 on all AP Exams taken, and scores of 4 or higher on eight or more of these exams
27
PAHS

2011-2018 PAHS AP Scholars Note: This slide shows the increase in the number of scholars since 2011 across all categories
2011 2012 20103 2014 2015 2016 2017 2018
AP ScholarStudents who score a 3 or higher on 3 + AP Exams
27 22 37 37 50 67 82 69
AP Scholar with HonorAverage score of 3.25 on all AP Exams taken, and
scores of 3 or higher on four or more of these exams8 16 21 18 33 21 30 29
AP Scholar with DistinctionAverage score of at least 3.5 on all AP Exams taken, and scores of 3 or higher on five or more of these
exams
21 26 42 54 52 65 72 89
National AP ScholarGranted to students who receive an average score of
at least on all AP Exams taken, and scores of 4 or higher on 8 or more of these exams.
2 7 7 15 15 16 21 27
AP International DiplomaGranted to students in the United States applying to universities outside the country, who receive a 3 or
higher on 5 or more AP exams.
0 0 0 0 0 0 1 0
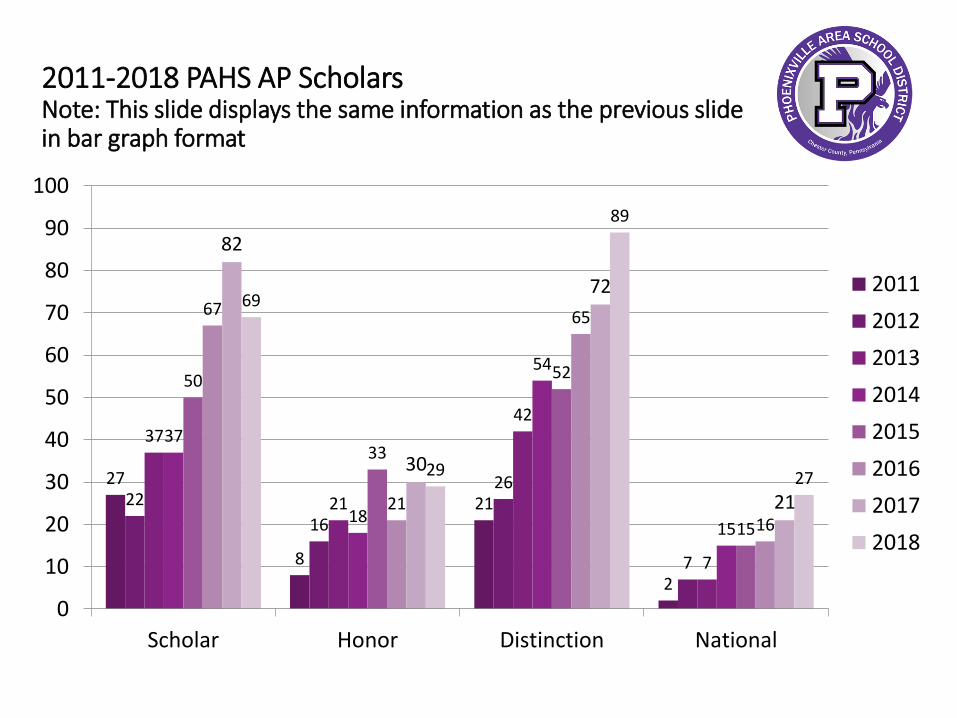
2011-2018 PAHS AP ScholarsNote: This slide displays the same information as the previous slidein bar graph format
27
8
21
2
22
16
26
7
37
21
42
7
37
18
54
15
50
33
52
15
67
21
65
16
82
30
72
21
69
29
89
27
0
10
20
30
40
50
60
70
80
90
100
Scholar Honor Distinction National
2011
2012
2013
2014
2015
2016
2017
2018