Embed Size (px)
Citation preview

International Journal of Photoenergy
Advanced Oxidation Processes for Wastewater TreatmentGuest Editors: Meenakshisundaram Swaminathan,Manickavachagam Muruganandham, and Mika Sillanpaa

Advanced Oxidation Processes forWastewater Treatment

International Journal of Photoenergy
Advanced Oxidation Processes forWastewater Treatment
Guest Editors: Meenakshisundaram Swaminathan,Manickavachagam Muruganandham, and Mika Sillanpaa

Copyright © 2013 Hindawi Publishing Corporation. All rights reserved.
This is a special issue published in “International Journal of Photoenergy.” All articles are open access articles distributed under theCreative Commons Attribution License, which permits unrestricted use, distribution, and reproduction in any medium, provided theoriginal work is properly cited.

International Journal of Photoenergy
Editorial Board
M. Sabry Abdel-Mottaleb, EgyptNihal Ahmad, USANicolas Alonso-Vante, FranceWayne A. Anderson, USAVincenzo Augugliaro, ItalyDetlef W. Bahnemann, GermanyMohammad A. Behnajady, IranIgnazio Renato Bellobono, ItalyRaghu N. Bhattacharya, USAGion Calzaferri, SwitzerlandAdriana G. Casas, ArgentinaWonyong Choi, KoreaVera Cimrova, Czech RepublicVikram L. Dalal, USAD. (Dion) D. Dionysiou, USAMahmoud M. El-Nahass, EgyptAhmed Ennaoui, GermanyChris Ferekides, USADavid Ginley, USABeverley Glass, AustraliaShinya Higashimoto, JapanChun-Sheng Jiang, USAYadong Jiang, China
Shahed Khan, USAC. Harold Langford, CanadaYuexiang Li, ChinaStefan Lis, PolandN. M. Mahmoodi, IranD. Mantzavinos, GreeceUgo Mazzucato, ItalyJacek Miller, PolandKazuhiko Mizuno, JapanJarugu N. Moorthy, IndiaFranca Morazzoni, ItalyFabrice Morlet-Savary, FranceEbinazar B. Namdas, AustraliaM. da Graca P. Neves, PortugalLeonidas Palilis, GreeceLeonardo Palmisano, ItalyRavindra K. Pandey, USADavid Lee Phillips, Hong KongPierre Pichat, FranceXie Quan, ChinaTijana Rajh, USAPeter Robertson, UKAvigdor Scherz, Israel
L. Schmidt-Mende, GermanyPanagiotis Smirniotis, USAZofia Stasicka, PolandJuliusz Sworakowski, PolandNobuyuki Tamaoki, JapanGopal N. Tiwari, IndiaNikolai V. Tkachenko, FinlandVeronica Vaida, USARoel van De Krol, GermanyM. van Der Auweraer, BelgiumEzequiel Wolcan, ArgentinaMan Shing Wong, Hong KongDavid Worrall, UKFahrettin Yakuphanoglu, TurkeyMinjoong Yoon, KoreaJimmy C. Yu, Hong KongHongtao Yu, USAJun-Ho Yum, SwitzerlandKlaas Zachariasse, GermanyLizhi Zhang, ChinaJincai Zhao, China

Contents
Advanced Oxidation Processes for Wastewater Treatment, Meenakshisundaram Swaminathan,Manickavachagam Muruganandham, and Mika SillanpaaVolume 2013, Article ID 683682, 3 pages
Effect of Oxygen and Hydrogen Peroxide on the Photocatalytic Degradation of Monochlorobenzene inTiO2 Aqueous Suspension, Dyi-Hwa Tseng, Lain-Chuen Juang, and Hsin-Hsu HuangVolume 2012, Article ID 328526, 9 pages
Development of Pillared Clays for Wet Hydrogen Peroxide Oxidation of Phenol and Its Application inthe Posttreatment of Coffee Wastewater, Nancy R. Sanabria, Rafael Molina, and Sonia MorenoVolume 2012, Article ID 864104, 17 pages
Photo-Fenton and Fenton Oxidation of Recalcitrant Industrial Wastewater Using Nanoscale Zero-ValentIron, Henrik Hansson, Fabio Kaczala, Marcia Marques, and William HoglandVolume 2012, Article ID 531076, 11 pages
Solar Photocatalytic Degradation of Azo Dye in Aqueous TiO2 Suspension Assisted by Fresnel Lens,Wen-Shiuh Kuo and Wen-Yu ChenVolume 2012, Article ID 303586, 7 pages
Combined Application of UV Photolysis and Ozonation with Biological Aerating Filter in TertiaryWastewater Treatment, Zhaoqian Jing and Shiwei CaoVolume 2012, Article ID 140605, 6 pages
Microbiological Evaluation of the Effectiveness of Sewage Sludge Sanitization with Solar DryingTechnology, Zbigniew Paluszak, Krzysztof Skowron, Małgorzata Sypuła, and Karolina Jadwiga SkowronVolume 2012, Article ID 341592, 11 pages
Treatment of Pesticides in Wastewater by Heterogeneous and Homogeneous Photocatalysis,Catalina Daniela Stan, Igor Cretescu, Cristina Pastravanu, Ioannis Poulios, and Maria DraganVolume 2012, Article ID 194823, 6 pages
Oxidation Degradation of Rhodamine B in Aqueous by UV/S2O82− Treatment System, Xiaoyang Chen,
Zhiyong Xue, Yanlai Yao, Weiping Wang, Fengxiang Zhu, and Chunlai HongVolume 2012, Article ID 754691, 5 pages
Landfill Leachates Treatment by H2O2/UV, O3/H2O2, Modified Fenton, and Modified Photo-FentonMethods, Jeremi Naumczyk, Izabela Prokurat, and Piotr MarcinowskiVolume 2012, Article ID 909157, 9 pages
Bromate Formation Characteristics of UV Irradiation, Hydrogen Peroxide Addition, Ozonation, andTheir Combination Processes, Naoyuki Kishimoto and Eri NakamuraVolume 2012, Article ID 107293, 10 pages
Simultaneous Photocatalytic Reduction of Cr(VI) and Oxidation of Benzoic Acid in AqueousN-F-Codoped TiO2 Suspensions: Optimization and Modeling Using the Response Surface Methodology,Maria Antonopoulou, Aris Giannakas, and Ioannis KonstantinouVolume 2012, Article ID 520123, 10 pages

Energy Effectiveness of Direct UV and UV/H2O2 Treatment of Estrogenic Chemicals in BiologicallyTreated Sewage, Kamilla M. S. Hansen and Henrik R. AndersenVolume 2012, Article ID 270320, 9 pages
Electrochemical Incineration of Phenolic Compounds from the Hydrocarbon Industry UsingBoron-Doped Diamond Electrodes, Alejandro Medel, Erika Bustos, Karen Esquivel, Luis A. Godınez, andYunny MeasVolume 2012, Article ID 681875, 6 pages
Preparation of a Modified PTFE Fibrous Photo-Fenton Catalyst and Its Optimization towards theDegradation of Organic Dye, Zhizhong Ding, Yongchun Dong, and Bing LiVolume 2012, Article ID 121239, 8 pages
Potential of Ceria-Based Catalysts for the Oxidation of Landfill Leachate by Heterogeneous FentonProcess, E. Aneggi, V. Cabbai, A. Trovarelli, and D. GoiVolume 2012, Article ID 694721, 8 pages
Investigation on the Adsorption and Photooxidation of Glycerol at TiO2 Nanotubular Arrays,Simonetta Palmas, Anna Da Pozzo, Michele Mascia, Annalisa Vacca, and Roberto MatarreseVolume 2012, Article ID 914757, 7 pages
Photocatalytic Degradation of Aniline Using TiO2 Nanoparticles in a Vertical Circulating PhotocatalyticReactor, F. Shahrezaei, Y. Mansouri, A. A. L. Zinatizadeh, and A. AkhbariVolume 2012, Article ID 430638, 8 pages
Photoreduction of Cr(VI) Ions in Aqueous Solutions by UV/TiO2 Photocatalytic Processes, Ming Ma,Yung Shuen Shen, and Po Hsiang LinVolume 2012, Article ID 381971, 7 pages
Photocatalytic Treatment of Shower Water Using a Pilot Scale Reactor, Yash Boyjoo, Ming Ang, andVishnu PareekVolume 2012, Article ID 578916, 7 pages
A New Photocatalytic System Using Steel Mesh and Cold Cathode Fluorescent Light for theDecolorization of Azo Dye Orange G, Ming-Chin Chang, Chin-Pao Huang, Hung-Yee Shu,and Yung-Chen ChangVolume 2012, Article ID 303961, 9 pages
Synthesis and Bactericidal Ability of TiO2 and Ag-TiO2 Prepared by Coprecipitation Method, Robert Liu,H. S. Wu, Ruth Yeh, C. Y. Lee, and Yungtse HungVolume 2012, Article ID 640487, 7 pages
Enhancement of Photocatalytic Activity of ZnO/SiO2 by Nanosized Pt for Photocatalytic Degradation ofPhenol in Wastewater, R. M. Mohamed and M. A. BarakatVolume 2012, Article ID 103672, 8 pages
Contents
Degradation of Antibiotics in Wastewater during Sonolysis, Ozonation, and Their SimultaneousApplication: Operating Conditions Effects and Processes Evaluation, Vincenzo Naddeo, Daniele Ricco,Davide Scannapieco, and Vincenzo BelgiornoVolume 2012, Article ID 624270, 7 pages
Contribution of Dissolved Oxygen to Methylene Blue Decomposition by Hybrid Advanced OxidationProcesses System, Heon Lee, Sung Hoon Park, Byung Hoon Kim, Sun-Jae Kim, Sang-Chai Kim,Seong-Gyu Seo, and Sang-Chul JungVolume 2012, Article ID 305989, 6 pages
Rapid Photocatalytic Degradation of Methylene Blue under High Photon Flux UV Irradiation:Characteristics and Comparison with Routine Low Photon Flux, Qian Zhang, Chaolin Li, and Ting LiVolume 2012, Article ID 398787, 7 pages


Hindawi Publishing CorporationInternational Journal of PhotoenergyVolume 2012, Article ID 328526, 9 pagesdoi:10.1155/2012/328526
Research Article
Effect of Oxygen and Hydrogen Peroxide on the PhotocatalyticDegradation of Monochlorobenzene in TiO2 Aqueous Suspension
Dyi-Hwa Tseng,1 Lain-Chuen Juang,2 and Hsin-Hsu Huang1
1 Graduate Institute of Environmental Engineering, National Central University, Jhongli 32001, Taiwan2 Department of Environmental Engineering and Green Environment R & D Center, Vanung University, Jhongli 32061, Taiwan
Correspondence should be addressed to Lain-Chuen Juang, [email protected]
Received 1 June 2012; Accepted 21 August 2012
Academic Editor: Meenakshisundaram Swaminathan
Copyright © 2012 Dyi-Hwa Tseng et al. This is an open access article distributed under the Creative Commons AttributionLicense, which permits unrestricted use, distribution, and reproduction in any medium, provided the original work is properlycited.
The influences of oxygen and hydrogen peroxide (H2O2) on the degradation and mineralization of monochlorobenzene (MCB)during UV/TiO2 process were investigated. Experimental results indicated that oxygen was a determining parameter for promotingthe photocatalytic degradation. The presence of oxygen reduced the illumination time needed for the complete decay of MCB from240 to 120 min. The photocatalytic degradation of MCB in UV/TiO2/O2 photocatalysis followed a simplified two-step consecutivekinetics. The rate constants of degradation (k1) and mineralization (k2) were increased from 0.016 to 0.046 min−1 and from 0.001to 0.006 min−1, respectively, as the initial concentration of dissolved oxygen (DO) was increased from 1.6 to 28.3 mg L−1. Owingto the fact that H2O2 acted as an electron and hydroxyl radicals (·OH) scavenger, the addition of H2O2 should in a proper dosagerange to enhance the degradation and mineralization of MCB. The optimal H2O2 dosage for MCB degradation was 22.5 mg L−1,whereas the most efficient H2O2 dosage for MCB mineralization was 45.0 mg L−1. In order to minimize the adverse effects of higherH2O2 dosage, including the capture of ·OH radicals and competitive adsorption, and to improve the photocatalytic degradationof MCB, the sequential replenishment of H2O2 was suggested. For the stepwise addition of a total H2O2 dosage of 45.0 mg L−1, acomplete destruction of MCB was observed within 120 min of irradiation. Additionally, the mineralization efficiency was about87.4% after 240 min of illumination time.
1. Introduction
During last several decades, the control of organic pollutantshas received much attention for its considerable amount andvariety. However, the conventional biological, physical, andchemical technologies are ineffective and limitative towardthe destruction of toxic and recalcitrant organic pollutants.Heterogeneous photocatalysis, one of the so-called AdvancedOxidation Processes (AOPs), offers an advanced oxidationcapable of pollutant abatement [1, 2]. Many researchershave concluded that the UV/TiO2 process is a promisingtechnology for the degradation and mineralization of organicsubstrates to harmless final products in air and water media[3–6].
The mechanism of the UV/TiO2 process has been dis-cussed extensively in the literature [7–9]. When TiO2 is irra-diated with light energy equal to or higher than its band-gap,
an electron (e−) can be excited from the valence band to theconduction band and leaving a hole (h+) in the valence band
TiO2 + UV −→ h+ + e− (1)
h+ + OH−/H2O −→ ·OH/ ·OH + H+ (2)
e− + h+ −→ heat (3)
If charge separation is maintained, the paired e−-h+ maymigrate to the surface of the photocatalyst. In aqueous phase,the photoinduced h+ is apparently able to oxidize surfacehydroxyl groups or surface-bond water molecules to producehighly reactive and nonselective hydroxyl radicals (·OH)(2). The ·OH radicals are considered to be the dominantoxidizing species contributing to the photocatalytic degrada-tion of organic substrates [10–12]. Nevertheless, the e− can

2 International Journal of Photoenergy
recombine with the h+ (3), causing a decrease in the avail-ability of the photoinduced h+ [13, 14]. Without electronacceptors, the limitation attributed to the recombinationof e−-h+ pairs would reduce the photocatalytic efficiencyand cause radiation energy loss. Therefore, suppressing therecombination of e−-h+ pairs is an important considerationin enhancing the performance of photocatalytic degradation.
In this study, both oxygen and hydrogen peroxide (H2O2)were selected as electron acceptors. Monochlorobenzene(MCB), one of the hydrophobic and volatile organic com-pounds (VOCs), was chosen as a model compound. Theobjectives of the present work were to evaluate the effectof oxygen and H2O2 on the photocatalytic degradation ofMCB. The change in the concentration of MCB with variousoxygen concentrations and H2O2 dosages was examined.Additionally, the extent of mineralization was also estimatedby measuring the concentration of total organic carbon(TOC) in MCB solution.
2. Materials and Methods
2.1. Materials. Anatase TiO2 powder with a specific BETsurface area of 9.3 m2 g−1 and a primary particle size of150 nm was purchased from Acros Organics and used asreceived. Reagent grade MCB (C6H5Cl, MW = 112.56,density = 1.106 g mL−1, vapor pressure = 12 mm Hg at25◦C, and water solubility = 494 mg L−1 at 25◦C) with apurity over 99% was obtained from Merck. H2O2 (30%)was obtained from Fluka Chemical. Other chemicals usedfor analysis, including acetonitrile, acetic acid, potassiumhydrogen phthalate, phosphoric acid, and sodium peroxy-disulfate were of analytical grade. Pure N2 and O2 gases andair were used to adjust the initial dissolved oxygen (DO)concentration to the desired levels. Deionized water wasemployed for solution preparation.
2.2. Experimental Apparatus and Procedure. A hollow cylin-drical photoreactor with a working capacity of 2.5 l andequipped with a water jacket was used in this study. Coolingwater from a thermostatic bath (TUNGTEC BL-20) wascirculated through the photoreactor jacket to keep thetemperature at 30◦C. Irradiation was performed using a15 W blacklight lamp (F15T8 BLB, UVP) with a maximumemission at 365 nm. The UV lamp was vertically immersedin a quartz tube placed in the center of the photoreactor.The light intensity inside the photoreactor, as measuredby potassium ferrioxalate actinometry, was 5.68 μ Einsteins−1. The reaction mixture was continuously agitated by amagnetic stirrer to keep the TiO2 particles suspended.
Two series of experiments were carried out to examinethe effects of oxygen and H2O2 on the photocatalyticdegradation of MCB. Prior to MCB solution preparation, alldeionized water was first purged by N2 gas for 30 min tominimize the amount of DO. Subsequently, the deionizedwater was purged with either air or O2 gas to obtain thepredetermined DO concentration. The initial concentrationof MCB was fixed at 0.1 mM and the TiO2 dosage was1.0 g L−1 unless otherwise stated. The initial pH of solution
was adjusted to 7 by adding an appropriate volume of diluteNaOH or HNO3 solutions. After 30 min of premixing inthe dark, the UV lamp was switched on to initiate thephotocatalytic degradation.
The experimental procedure for the H2O2-assisted batchwas similar to the oxygen-assisted batch. In this case, theMCB solution was prepared using deionized water that hadbeen deoxygenated by N2 gas. After TiO2 powder was addedinto the solution, the solution pH was adjusted to 7 withdilute NaOH or HNO3 solutions. Prior to irradiation, thesuspension was magnetically stirred in the dark for 30 min.After the addition of H2O2 into the suspension, the UV lampwas turned on.
At given irradiation time intervals, samples were with-drawn from the irradiated suspension. These collectedsamples were immediately centrifuged and filtered througha 0.22 μm Millipore filter for further analysis.
2.3. Analytical Methods. The residual MCB measurementwas carried out by HPLC (Biotronik HPLC BT 7900)equipped with a Linear UVIS 200 UV detector and an ODS2C18 column (length 25 cm, inner diameter 4.6 mm). Themobile phase was composed of acetonitrile (70%), water(29%), and acetic acid (1%) and the flow rate was keptat 1.5 mL min−1. The detection wavelength selected fordetecting MCB was 265 nm. A TOC analyzer (O. I. AnalyticalModel 700) equipped with a nondispersive infrared detector(NDIR) was employed to monitor the concentration ofTOC. The DO concentration was quantified by an oxygenmembrane electrode (Oxi 320, WTW).
3. Results and Discussion
3.1. Direct Photolysis and H2O2-Assisted Photolysis. Twopreliminary experiments were carried out to estimate thecontribution of direct photolysis and H2O2-assisted photol-ysis for the removal of MCB. The variation in the MCBconcentration during irradiation can be seen in Figure 1. Forthe direct photolysis, there was about 42.8% degradationof MCB after 240 min of illumination time. This resultimplied that the UV light had evident contribution onthe degradation of MCB which was in agreement withthe observation reported by other researcher [15]. Thechange in the MCB concentration fitted an exponential decaycurve, suggesting the direct photolysis of MCB followed thepattern of pseudo first-order kinetics. A linear regression wasobtained with natural logarithmic normalized concentrationagainst illumination time. The degradation rate constant wascalculated to be 0.002 min−1.
In order to evaluate the degradation ability of H2O2-assisted photolysis, an irradiation experiment was conductedunder the condition of H2O2 dosage equal to 22.5 mg L−1.Corresponding to the obtained experimental result recordedin Figure 1, it was found that the concentration of MCBdecreased gradually during the period of irradiation. Theextent of MCB degradation in the H2O2-assisted photolysiswithin 240 min of irradiation was approximately 60.2%and the pseudo first-order degradation rate constant was

International Journal of Photoenergy 3M
CB
(m
M)
0.12
0.1
0.08
0.06
0.04
0.02
00 50 100 150 200 250
Illumination time (min)
PhotolysisUV/H2O2
Figure 1: Direct photolysis and H2O2-assisted photolysis of MCB.
0.004 min−1. The typical time-dependent MCB concentra-tion in the presence of both UV light and H2O2 was similarto that under the UV irradiation only. It was stated thatH2O2 has an extremely low absorption at UV light of 365 nm[16], therefore, the generation of ·OH radicals due to thephotolysis of H2O2 would be insignificant. As a result, theobservable MCB decay can mainly be ascribed to the directphotolysis. Moreover, the additional MCB degradation canbe explained by the oxidative ability of H2O2.
3.2. UV/TiO2/O2 Photocatalysis
3.2.1. Degradation of MCB. The dependency of the photo-catalytic degradation of MCB on the initial DO concentra-tion was studied in the range from 1.6 to 28.3 mg L−1. Typicaltime-dependent MCB concentration during photocatalyticdegradation is illustrated in Figure 2(a). As can be seen,when TiO2 suspension was exposed to UV light, the MCBconcentration decreased markedly with illumination timein comparison with the same experiment performed in theabsence of TiO2. The difference between direct photolysisand UV/TiO2/O2 photocatalysis revealed that UV light andTiO2 photocatalyst together had a significant effect on thedegradation of MCB. Since ·OH radicals were the key featureof UV/TiO2 process, the degradation of MCB was primarilyrelated to the generated ·OH radicals.
Referring to Figure 2(a), the presence of oxygen wascontributed to the photocatalytic degradation. Completedestruction of MCB was observed after 240 min of irradia-tion when the experiment was performed under initial DOconcentration equal to 1.6 mg L−1. In addition, for the initialDO concentration of 28.3 mg L−1, the illumination timerequired for complete decay of MCB was reduced to 120 min.The depletion of the DO concentration during irradiation,as recorded in Figure 2(b), confirmed that oxygen wasinvolved in the photocatalytic degradation. Accordingly, theimprovement of the degradation of MCB, which is related
to the increasing initial DO concentration, can be attributedto the fact that oxygen acted as electron acceptor to trap thephotoinduced e− [17, 18]
O2 + e− −→ O2·− (4)
O2·− + H+ −→ HO2· (5)
HO2 · +HO2· −→ H2O2 + O2 (6)
O2·− + HO2 · +H+ −→ H2O2 + O2 (7)
Through the reduction of oxygen with e−, reactive superox-ide radical anions (O2·−) was produced (4). Simultaneously,the e−-h+ pair recombination was restrained. Stabilizingthe primary carrier led to promote the generation of·OH radicals. Moreover, other oxidizing species such asHO2· and H2O2 were also formed (5)–(7). It was believedthat additional ·OH radicals would be generated throughsequential reactions [11, 19–21]. Consequently, an increasein the DO concentration would accelerate the degradation ofMCB.
3.2.2. Mineralization of MCB. The decay of TOC duringphotocatalytic degradation was monitored to evaluate themineralization of MCB. From the plot shown in Figure 2(c),the improvement of the mineralization of MCB in the pres-ence of oxygen was observed. The mineralization efficiencyincreased from 42.6 to 93.1% within 240 min of irradiationas initial DO concentration varied from 1.6 to 28.3 mg L−1.Similar observations have been reported in the literature forother model compounds [22–24].
For the initial DO concentrations of 17.9 and28.3 mg L−1, there were still measurable DO concentrationsafter 240 min of illumination time. Since there was sufficientoxygen in the photocatalytic system, the TOC decreasedabidingly during photocatalytic degradation. Moreover,besides the electron acceptor function, oxygen can alsoparticipate in the oxidative reaction to promote themineralization of organic substrates and intermediates[25, 26]. Consequently, the depression of TOC decay wasascribed to the lack of oxygen involved in the photocatalyticdegradation afterward in the case of lower initial DOconcentration.
A comparison of Figures 2(a) and 2(c) indicated that theTOC decayed with illumination time in parallel with theMCB degradation. However, it should be noted that com-plete disappearance of MCB occurred within 120 to 240 minof irradiation under various initial DO concentrations,whereas residual TOC was still observed. This phenomenonimplied that transient organic intermediates were likely topresent in the photocatalytic system.
3.2.3. Two-Step Consecutive Kinetics. Based on the totalorganic carbon concentration in the photocatalytic system,the mass balance can be expressed as [27, 28]
[TOC]t = [MCB]c,t + [Inter·]c,t , (8)
where [TOC]t is the total organic carbon concentration inthe system, [MCB]c,t is the carbon concentration in the MCB

4 International Journal of Photoenergy
MC
B (
mM
)0.12
0.1
0.08
0.06
0.04
0.02
00 50 100 150 200 250
Illumination time (min)
(a)
30
25
20
15
10
5
0
DO
(m
g L−
1)
0 50 100 150 200 250
Illumination time (min)
(b)
8
6
4
2
0
TO
C (
mg
L−
1)
0 50 100 150 200 250
Illumination time (min)
(c)
Inte
rmed
iate
s co
nce
ntr
atio
n,
Two-step consecutive kinetic model
mg
L−
1as
TO
C
8
6
4
2
00 50 100 150 200 250
Illumination time (min)
(d)
Figure 2: Concentration profiles of (a) MCB, (b) DO, (c) TOC, and (d) intermediates during photocatalytic degradation of MCB at variousinitial DO concentrations: (�) 1.6 mg L−1, (�) 3.9 mg L −1, (�) 9.0 mg L −1, (�) 17.9 mg L −1, and (�) 28.3 mg L −1.
at time t, and [Inter·]c,t is the carbon concentration in theintermediates at time t. Correspondingly, the carbon con-centration in the intermediates can be determined from theconcentrations of MCB and TOC. Figure 2(d) illustrates thevariation of carbon concentration in the intermediates fordifferent initial DO concentration during the photocatalyticdegradation of MCB. As can be seen, the intermediatesaccumulated first and decomposed thereafter.
Since the mineralization of MCB occurs through theintermediates, a simplified two-step consecutive kinetics canbe used to describe the photocatalytic degradation [29, 30]
MCB k1−→Intermediates k2−→ultimate product (9)
where k1 is the degradation rate constant of MCB and k2
is the mineralization rate constant of the intermediates.The ultimate product of the photocatalytic degradation can
be CO2, H2O, and relevant inorganic ions. Each step in(9) is assumed to be a first-order and irreversible reaction.Applying the two-step consecutive kinetics, the carbonconcentrations in the MCB and the intermediates can beexpressed by
[MCB]c,t = [MCB]c,oe−k1t (10)
[Inter·]c,t =k1[MCB]c,ok2 − k1
(e−k1t − e−k2t
). (11)
Accordingly, the two rate constants k1 and k2 can be derivedfrom the disappearance of MCB and the intermediates.
As listed in Table 1, the increase in the value of k1 wasproportional to the initial DO concentration. The enhance-ment of k1 was about 3 times higher when the initial DOconcentration was 28.3 mg L−1 rather than 1.6 mg L−1. Takethe calculated k1 and the determined [Inter·]c,t into (11),

International Journal of Photoenergy 5
Table 1: Determination of the two-step consecutive kinetic constant for the photocatalytic degradation of MCB at different DO concen-tration.
DO concentration, mg L−1 k1, min−1 R2 k2, min−1 R2
1.6 0.016 0.9915 0.001 0.9843
3.9 0.020 0.9884 0.003 0.9787
9.0 0.025 0.9940 0.003 0.9681
17.9 0.038 0.9975 0.007 0.9591
28.3 0.046 0.9977 0.006 0.9685
Table 2: Determination of the two-step consecutive kinetic constant for the photocatalytic degradation of MCB at different H2O2 dosage.
H2O2 dosage, mg L−1 k1, min−1 R2 k2, min−1 R2
5.6 0.018 0.9966 0.002 0.9836
11.2 0.023 0.9932 0.002 0.9568
22.5 0.026 0.9956 0.002 0.8682
45.0 0.024 0.9872 0.001 0.8519
78.0 0.011 0.9972 <<0.001 0.9631
the value of mineralization rate constant k2 was obtained. Itwas evident that the mineralization rate constant dependedon the initial DO concentration. The value of k2 increasedwith increasing initial DO concentration to a certain leveland thereafter remained almost constant. The k2 increased8 times when the initial DO concentration was increased to17.9 mg L−1 rather than 1.6 mg L−1. Interestingly, the valuesof k2 were lower than those of k1, this revealed that the min-eralization may be the rate-limiting step in the photocatalyticdegradation of MCB. Therefore, prolonged illuminationtime would be reasonable for complete mineralization.
3.3. UV/TiO2/H2O2 Photocatalysis
3.3.1. Degradation of MCB. According to its high oxidationpotential and electrophilic, H2O2 is a stronger electronacceptor than oxygen [31–33]. A series of experiments wereconducted with deoxygenated TiO2 suspension in order toevaluate the effect of H2O2 dosage on the photocatalyticdegradation of MCB. The examined range of H2O2 dosagewas varied from 5.6 to 78.0 mg L−1. From the typicaltemporal file exhibited in Figure 3(a), it can be seen that thedegradation of MCB was sensitive to the variation of H2O2
dosage. A pseudo first-order kinetic model was provided tosimulate the degradation of MCB. Table 2 summarizes thedegradation rate constant k1 derived from the gradient ofthe plot of the natural logarithm of the normalized MCBconcentration against the illumination time. When the H2O2
dosage increased from 5.6 to 22.5 mg L−1 the value of k1
increased from 0.018 to 0.026 min−1. A further increase inthe H2O2 dosage from 22.5 to 78.0 mg L−1, however, led toa significant decline in the k1 from 0.026 to 0.011 min−1.The optimum H2O2 dosage for the degradation of MCB wasaround 22.5 mg L−1 which was similar to that observed byother researchers [20, 34–36].
The influence of H2O2 dosage on the degradation ofMCB can be explained in terms of the number of generated·OH radicals and the capture of ·OH radicals [36–39]. It iswell known that H2O2 can trap photoinduced e− to stabilizethe paired e−-h+
H2O2 + e− −→ ·OH + OH− (12)
H2O2 + O2·− −→ ·OH + OH− + O2 (13)
H2O2 + ·OH −→ H2O + OH2· (14)
HO2 · + ·OH −→ H2O + O2 (15)
Additional ·OH radicals could be yielded via the reactionbetween H2O2 and e− or O2·− (12) and (13). As a result,the addition of H2O2 into the photocatalytic system wasexpected to promote the degradation of MCB. Exceedingthe optimum dosage, however, the excess H2O2 would trapthe ·OH radicals to form weaker oxidant HO2· radicals.Accordingly, the capture of ·OH radicals was occurredthrough (14) and (15). The decline in the ·OH radicalconcentration, trigged by the higher H2O2 dosage, restrainedthe degradation of MCB.
The variation of DO concentration during the UV/TiO2/H2O2 photocatalysis for a variety of H2O2 dosage is illus-trated in Figure 3(b). It was found that the DO concentrationincreased markedly with illumination time to reach amaximum value and decreased thereafter. The increase in theDO concentration was related to the decomposition of H2O2
[39, 40]
2H2O2 −→ H2O + O2. (16)
Correspondingly, the addition of H2O2 seemed to act as anoxygen source. The later decrease in the DO concentrationimplied that the generated oxygen was involved in themineralization.
6 International Journal of Photoenergy
MC
B (
mM
)0.12
0.1
0.08
0.06
0.04
0.02
00 50 100 150 200 250
Illumination time (min)
(a)
30
25
20
15
10
5
0
DO
(m
g L−
1)
0 50 100 150 200 250
Illumination time (min)
(b)
8
6
4
2
0
TO
C (
mg
L−
1)
0 50 100 150 200 250
Illumination time (min)
(c)
Inte
rmed
iate
s co
nce
ntr
atio
n,
Two-step consecutive kinetic model
mg
L−
1as
TO
C 8
6
4
2
00 50 100 150 200 250
Illumination time (min)
(d)
Figure 3: Concentration profiles for (a) MCB, (b) DO, (c) TOC, and (d) intermediates during photocatalytic degradation of MCB at variousH2O2 dosages: (©) 5.6 mg L−1, (�) 11.2 mg L −1, (�) 22.5 mg L −1, (♦) 45.0 mg L −1, and (�) 78.0 mg L −1.
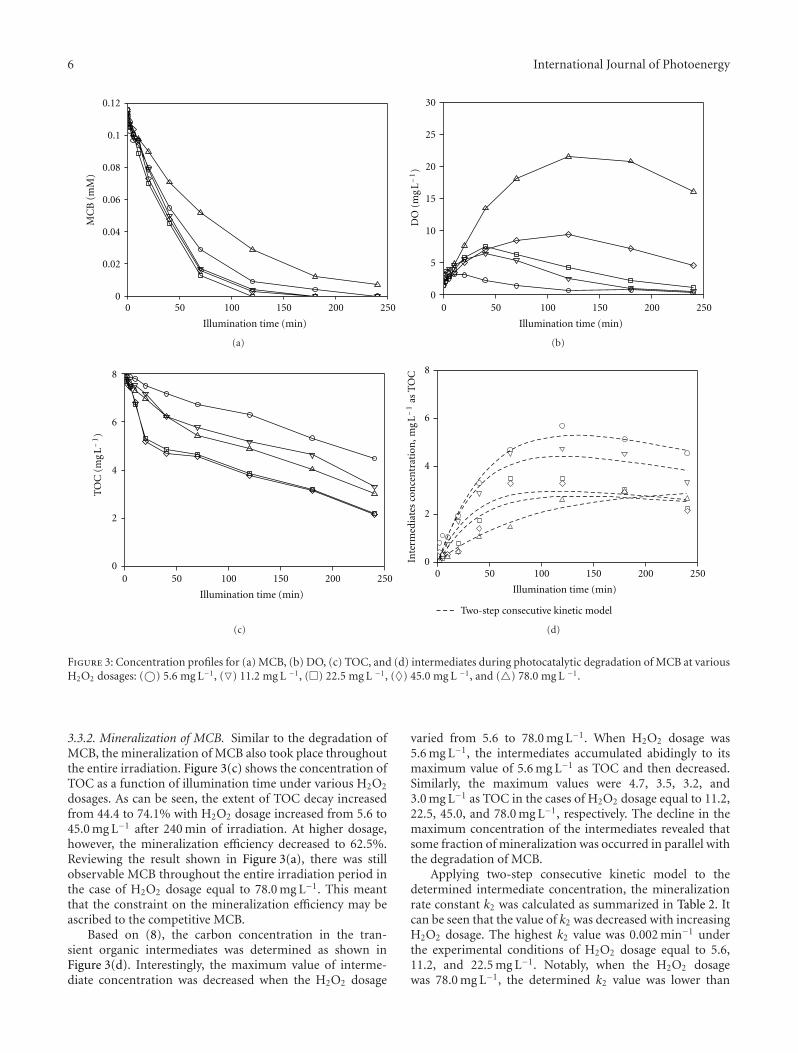
3.3.2. Mineralization of MCB. Similar to the degradation ofMCB, the mineralization of MCB also took place throughoutthe entire irradiation. Figure 3(c) shows the concentration ofTOC as a function of illumination time under various H2O2
dosages. As can be seen, the extent of TOC decay increasedfrom 44.4 to 74.1% with H2O2 dosage increased from 5.6 to45.0 mg L−1 after 240 min of irradiation. At higher dosage,however, the mineralization efficiency decreased to 62.5%.Reviewing the result shown in Figure 3(a), there was stillobservable MCB throughout the entire irradiation period inthe case of H2O2 dosage equal to 78.0 mg L−1. This meantthat the constraint on the mineralization efficiency may beascribed to the competitive MCB.
Based on (8), the carbon concentration in the tran-sient organic intermediates was determined as shown inFigure 3(d). Interestingly, the maximum value of interme-diate concentration was decreased when the H2O2 dosage
varied from 5.6 to 78.0 mg L−1. When H2O2 dosage was5.6 mg L−1, the intermediates accumulated abidingly to itsmaximum value of 5.6 mg L−1 as TOC and then decreased.Similarly, the maximum values were 4.7, 3.5, 3.2, and3.0 mg L−1 as TOC in the cases of H2O2 dosage equal to 11.2,22.5, 45.0, and 78.0 mg L−1, respectively. The decline in themaximum concentration of the intermediates revealed thatsome fraction of mineralization was occurred in parallel withthe degradation of MCB.
Applying two-step consecutive kinetic model to thedetermined intermediate concentration, the mineralizationrate constant k2 was calculated as summarized in Table 2. Itcan be seen that the value of k2 was decreased with increasingH2O2 dosage. The highest k2 value was 0.002 min−1 underthe experimental conditions of H2O2 dosage equal to 5.6,11.2, and 22.5 mg L−1. Notably, when the H2O2 dosagewas 78.0 mg L−1, the determined k2 value was lower than

International Journal of Photoenergy 7
0.001 min−1. According to the principle of the two-stepconsecutive kinetics, the calculation of k2 value was dependon the concentration of the intermediates and the value ofk1. Consequently, the decline of the maximum intermediatesconcentration as H2O2 dosage was increased led to a lower k2
value.
3.4. Evaluation of Oxygen and H2O2 as Electron Acceptors.According to its characteristics as electron acceptor and oxi-dizing agent, the presence of oxygen in photocatalytic systemwas beneficial for the photocatalytic degradation of MCB.The experimental results confirmed that the photocatalyticdegradation of MCB in the presence of oxygen followed asimplified two-step consecutive kinetics. For kinetic analysis,both degradation and mineralization rate constants had beendemonstrated to increase with increasing DO concentration.However, this is an important consideration to bear in mindthat the DO concentration in contaminated water may belimited and aeration would cause the stripping of volatileorganic compound such as MCB.
It is preferential to use H2O2 where there is a limitedavailability of oxygen. Considering its hydrophilic property,the H2O2 would come into contact with the hydroxylatedTiO2 particles in aqueous solution and trap the photoin-duced e−. Furthermore, H2O2 could also serve as an oxygensource to improve the mineralization. Excess H2O2, however,could act as ·OH radical scavenger in the photocatalyticsystem. Moreover, the H2O2 may compete with MCB forthe active sites of TiO2 particle [32, 41–44] to suppress thephotocatalytic degradation of MCB. To avoid the capture of·OH radical and competitive adsorption under high H2O2
dosage, sequential replenishment of H2O2 into UV/TiO2
system was suggested.
Referring to Figure 3, the most efficient degradationwas observed where the H2O2 dosage was 22.5 mg L−1,whereas the optimal H2O2 dosage for MCB mineralizationwas 45.0 mg L−1. Accordingly, total dosage of H2O2 equalto 45.0 mg L−1 was chosen for the evaluation of the photo-catalytic degradation of MCB under various H2O2 additionsequences. In the experiment of stepwise addition of H2O2,22.5 mg L−1 of H2O2 was added into the TiO2 suspension,once before irradiation and again after 40 min of illumina-tion time. As the result illustrated in Figure 4(a), 120 min ofirradiation was sufficient for complete elimination of MCBin the case when a two-step addition was made. On thecontrary, 180 min of illumination time was needed for theone-time addition. The enhancement of the degradationefficiency was correlated to the higher degradation rateconstant when the H2O2 dosage was 22.5 mg L−1 ratherthan 45.0 mg L−1. Moreover, the second addition of H2O2
was attributed to sustain the suppression of the e−-h+ pairrecombination.
Monitoring the variation of DO concentration duringphotocatalytic degradation, it was observed that the oxygenaccumulated continuously within 120 min of illuminationtime then decreased thereafter for both cases (Figure 4(b)).The concentration of the intermediates showed a similar ten-dency as depicted in Figure 4(c). Oxygen generated as a result
MC
B (
mM
)
0.12
0.1
0.08
0.06
0.04
0.02
00 50 100 150 200 250
Illumination time (min)
(a)
12
10
8
6
4
2
0
DO
(m
g L−
1)
0 50 100 150 200 250
Illumination time (min)
(b)In
term
edia
tes
con
cen
trat
ion
,m
g L−
1as
TO
C
8
6
4
2
00 50 100 150 200 250
Illumination time (min)
(c)
Figure 4: Comparison of the photocatalytic degradation of MCBunder various H2O2: (©) two-step addition and (♦) one-timeaddition.
of the decomposition of H2O2 whereas the accumulation ofintermediates was due to the degradation of MCB. Accordingto the effective degradation under the two-step addition ofH2O2, the concentration of intermediates increased fasterthan that under one-time addition of H2O2. Furthermore,since oxygen would participate in the mineralization ofMCB, both the concentrations of oxygen and intermediatesdeclined afterward. A comparison of the experimental pro-files shows that depletion of the intermediates concentrationwas shaper for the two-step addition of H2O2 than thatfor the one-time addition. Correspondingly, after 240 minof irradiation the mineralization efficiency of MCB in thecase of two-step addition of H2O2 was 87.4% higher thanthe value of 74.1% in the case of one-time addition. Theincrement in the mineralization efficiency can be explainedas due to the restraint of the capture of ·OH radicals,the additional ·OH radicals related with second dose ofH2O2, and the participation of oxygen in photocatalyticdegradation. Accordingly, it was evident that the sequential

8 International Journal of Photoenergy
replenishment of H2O2 into UV/TiO2 system was advisableas a way to improve the efficiency of the photocatalytic degra-dation.
4. Conclusions
The direct photolysis and the oxidative potential of H2O2
were proven to have slight contribution on the degradation ofMCB. Notably, UV light and TiO2 together showed a markedeffect. Increasing the DO concentration was beneficial forthe photocatalytic degradation of MCB. Correspondingly,the degradation and mineralization rate constants increasedwith the DO concentration. Owing to the mineralization ofMCB occurs through the intermediates, a simplified two-step consecutive kinetics can be used to describe the photo-catalytic degradation in UV/TiO2/O2 photocatalysis. For theUV/TiO2/H2O2 photocatalysis, H2O2 of lower dosage actedas electron acceptor to enhance the degradation efficiency.When the dosage was high, however, the degradation wassuppressed due to the capture of ·OH radicals and thecompetitive adsorption of H2O2. In order to abate the disad-vantages caused by using a higher H2O2 dosage, sequentialreplenishment of H2O2 into UV/TiO2 system was per-formed. Experimental results demonstrated that both degra-dation and mineralization efficiencies were enhanced by therestraint of the capture of ·OH radicals, the additional ·OHradicals caused from the second stage addition of H2O2, andthe participation of oxygen in photocatalytic degradation.
Acknowledgment
The authors would like to thank the National ScienceCouncil, R.O.C. for financial support of this study underContract no. NSC 90-2211-E-238-003.
References
[1] U. G. Akpan and B. H. Hameed, “Parameters affecting thephotocatalytic degradation of dyes using TiO2-based photo-catalysts: a review,” Journal of Hazardous Materials, vol. 170,no. 2-3, pp. 520–529, 2009.
[2] J. M. Herrmann, “Heterogeneous photocatalysis: fundamen-tals and applications to the removal of various types of aque-ous pollutants,” Catalysis Today, vol. 53, no. 1, pp. 115–129,1999.
[3] G. Balasubramanian, D. D. Dionysiou, M. T. Suidan, I. Baudin,and J. M. Laıne, “Evaluating the activities of immobilized TiO2
powder films for the photocatalytic degradation of organiccontaminants in water,” Applied Catalysis B, vol. 47, no. 2, pp.73–84, 2004.
[4] M. N. Chong, B. Jin, C. W. K. Chow, and C. Saint, “Recentdevelopments in photocatalytic water treatment technology: areview,” Water Research, vol. 44, no. 10, pp. 2997–3027, 2010.
[5] U. Stafford, K. A. Gray, and P. V. Kamat, “Photocatalyticdegradation of organic contaminants: halophenols and relatedmodel compounds,” Heterogeneous Chemistry Reviews, vol. 3,no. 2, pp. 77–104, 1996.
[6] T. Zhang, T. Oyama, S. Horikoshi, J. Zhao, N. Serpone, and H.Hidaka, “Photocatalytic decomposition of the sodium dode-cylbenzene sulfonate surfactant in aqueous titania suspensions
exposed to highly concentrated solar radiation and effects ofadditives,” Applied Catalysis B, vol. 42, no. 1, pp. 13–24, 2003.
[7] M. R. Hoffmann, S. T. Martin, W. Choi, and D. W. Bahne-mann, “Environmental applications of semiconductor photo-catalysis,” Chemical Reviews, vol. 95, no. 1, pp. 69–96, 1995.
[8] I. K. Konstantinou and T. A. Albanis, “Photocatalytic transfor-mation of pesticides in aqueous titanium dioxide suspensionsusing artificial and solar light: intermediates and degradationpathways,” Applied Catalysis B, vol. 42, no. 4, pp. 319–335,2003.
[9] A. Sobczynski, L. Duczmal, and W. Zmudzinski, “Phenoldestruction by photocatalysis on TiO2: an attempt to solvethe reaction mechanism,” Journal of Molecular Catalysis A, vol.213, no. 2, pp. 225–230, 2004.
[10] K. Chhor, J. F. Bocquet, and C. Colbeau-Justin, “Comparativestudies of phenol and salicylic acid photocatalytic degradation:influence of adsorbed oxygen,” Materials Chemistry andPhysics, vol. 86, no. 1, pp. 123–131, 2004.
[11] T. Hirakawa, K. Yawata, and Y. Nosaka, “Photocatalyticreactivity for O2· − and OH· radical formation in anatase andrutile TiO2 suspension as the effect of H2O2 addition,” AppliedCatalysis A, vol. 325, no. 1, pp. 105–111, 2007.
[12] M. Qamar, M. Saquib, and M. Muneer, “Photocatalyticdegradation of two selected dye derivatives, chromotrope 2Band amido black 10B, in aqueous suspensions of titaniumdioxide,” Dyes and Pigments, vol. 65, no. 1, pp. 1–9, 2005.
[13] D. D. Dionysiou, A. A. Burbano, M. T. Suidan, I. Baudin,and J. M. Laıne, “Effect of oxygen in a thin-film rotating diskphotocatalytic reactor,” Environmental Science and Technology,vol. 36, no. 17, pp. 3834–3843, 2002.
[14] C. H. Wu, “Comparison of azo dye degradation efficiencyusing UV/single semiconductor and UV/coupled semicon-ductor systems,” Chemosphere, vol. 57, no. 7, pp. 601–608,2004.
[15] D. S. Bhatkhande, S. B. Sawant, J. C. Schouten, and V.G. Pangarkar, “Photocatalytic degradation of chlorobenzeneusing solar and artificial UV radiation,” Journal of ChemicalTechnology and Biotechnology, vol. 79, no. 4, pp. 354–360,2004.
[16] W. Chu and C. C. Wong, “The photocatalytic degradationof dicamba in TiO2 suspensions with the help of hydrogenperoxide by different near UV irradiations,” Water Research,vol. 38, no. 4, pp. 1037–1043, 2004.
[17] D. Zhang, R. Qiu, L. Song, B. Eric, Y. Mo, and X. Huang, “Roleof oxygen active species in the photocatalytic degradationof phenol using polymer sensitized TiO2 under visible lightirradiation,” Journal of Hazardous Materials, vol. 163, no. 2-3,pp. 843–847, 2009.
[18] T. L. Villarreal, P. Bogdanoff, P. Salvador, and N. Alonso-Vante,“Photocatalytic oxidation on nanostructured chalcogenidemodified titanium dioxide,” Solar Energy Materials and SolarCells, vol. 83, no. 4, pp. 347–362, 2004.
[19] O. Carp, C. L. Huisman, and A. Reller, “Photoinduced reactiv-ity of titanium dioxide,” Progress in Solid State Chemistry, vol.32, no. 1-2, pp. 33–177, 2004.
[20] J. C. Garcia and K. Takashima, “Photocatalytic degradationof imazaquin in an aqueous suspension of titanium dioxide,”Journal of Photochemistry and Photobiology A, vol. 155, no. 1–3, pp. 215–222, 2003.
[21] L. L. Lifongo, D. J. Bowden, and P. Brimblecombe, “Pho-todegradation of haloacetic acids in water,” Chemosphere, vol.55, no. 3, pp. 467–476, 2004.
International Journal of Photoenergy 9
[22] M. S. Dieckmann and K. A. Gray, “A comparison of thedegradation of 4-nitrophenol via direct and sensitized photo-catalysis in TiO2 slurries,” Water Research, vol. 30, no. 5, pp.1169–1183, 1996.
[23] F. L. Palmer, B. R. Eggins, and H. M. Coleman, “The effectof operational parameters on the photocatalytic degradationof humic acid,” Journal of Photochemistry and Photobiology A,vol. 148, no. 1–3, pp. 137–143, 2002.
[24] P. Wongkalasin, S. Chavadej, and T. Sreethawong, “Photocat-alytic degradation of mixed azo dyes in aqueous wastewaterusing mesoporous-assembled TiO2 nanocrystal synthesized bya modified sol-gel process,” Colloids and Surfaces A, vol. 384,no. 1–3, pp. 519–528, 2011.
[25] Y. Wang and C. S. Hong, “TiO2-mediated photomineraliza-tion of 2-chlorobiphenyl: the role of O2,” Water Research, vol.34, no. 10, pp. 2791–2797, 2000.
[26] C. Adan, J. Carbajo, A. Bahamonde, and A. Martınez-Arias, “Phenol photodegradation with oxygen and hydrogenperoxide over TiO2 and Fe-doped TiO2,” Catalysis Today, vol.143, no. 3-4, pp. 247–252, 2009.
[27] L. Tatti, D. Niego, F. Rota et al., “Mathematical modelling ofpilot-plant photomineralization of chlorophenols in aqueoussolution, by photocatalytic membranes immobilizing tita-nium dioxide,” Chemosphere, vol. 34, no. 1, pp. 41–49, 1997.
[28] K. H. Wang, Y. H. Hsieh, and L. J. Chen, “The heterogeneousphotocatalytic degradation, intermediates and mineralizationfor the aqueous solution of cresols and nitrophenols,” Journalof Hazardous Materials, vol. 59, no. 2-3, pp. 251–260, 1998.
[29] Y. Ku, R. M. Leu, and K. C. Lee, “Decomposition of 2-chlorophenol in aqueous solution by UV irradiation with thepresence of titanium dioxide,” Water Research, vol. 30, no. 11,pp. 2569–2578, 1996.
[30] F. Rota, M. Cavassi, D. Niego et al., “Mathematical modellingof photomineralization of phenols in aqueous solution, byphotocatalytic membranes immobilizing titanium dioxide,”Chemosphere, vol. 33, no. 11, pp. 2159–2173, 1996.
[31] N. Daneshvar, D. Salari, and A. R. Khataee, “Photocatalyticdegradation of azo dye acid red 14 in water: investigation ofthe effect of operational parameters,” Journal of Photochem-istry and Photobiology A, vol. 157, no. 1, pp. 111–116, 2003.
[32] D. D. Dionysiou, M. T. Suidan, I. Baudin, and J. M. Laıne,“Effect of hydrogen peroxide on the destruction of organiccontaminants-synergism and inhibition in a continuous-mode photocatalytic reactor,” Applied Catalysis B, vol. 50, no.4, pp. 259–269, 2004.
[33] I. Ilisz, Z. Laszlo, and A. Dombi, “Investigation of the pho-todecomposition of phenol in near-UV-irradiated aqueousTiO2 suspensions—I: effect of charge-trapping species on thedegradation kinetics,” Applied Catalysis A, vol. 180, no. 1-2,pp. 25–33, 1999.
[34] I. Poulios, M. Kositzi, and A. Kouras, “Photocatalytic decom-position of triclopyr over aqueous semiconductor suspen-sions,” Journal of Photochemistry and Photobiology A, vol. 115,no. 2, pp. 123–129, 1998.
[35] J. C. Yu, T. Y. Kwong, Q. Luo, and Z. Cai, “Photocatalyticoxidation of triclosan,” Chemosphere, vol. 65, no. 3, pp. 390–399, 2006.
[36] V. K. Gupta, R. Jain, S. Agarwal, and M. Shrivastava, “Kineticsof photo-catalytic degradation of hazardous dye Tropaeoline000 using UV/TiO2 in a UV reactor,” Colloids and Surfaces A,vol. 378, no. 1–3, pp. 22–26, 2011.
[37] E. R. Bandala, S. Gelover, M. T. Leal, C. Arancibia-Bulnes, A.Jimenez, and C. A. Estrada, “Solar photocatalytic degradationof Aldrin,” Catalysis Today, vol. 76, no. 2–4, pp. 189–199, 2002.
[38] E. Bizani, K. Fytianos, I. Poulios, and V. Tsiridis, “Photocat-alytic decolorization and degradation of dye solutions andwastewaters in the presence of titanium dioxide,” Journal ofHazardous Materials, vol. 136, no. 1, pp. 85–94, 2006.
[39] J. Chen, M. Liu, J. Zhang, X. Ying, and L. Jin, “Photocatalyticdegradation of organic wastes by electrochemically assistedTiO2 photocatalytic system,” Journal of Environmental Man-agement, vol. 70, no. 1, pp. 43–47, 2004.
[40] T. Velegraki, I. Poulios, M. Charalabaki, N. Kalogerakis, P.Samaras, and D. Mantzavinos, “Photocatalytic and sonolyticoxidation of acid orange 7 in aqueous solution,” AppliedCatalysis B, vol. 62, no. 1-2, pp. 159–168, 2006.
[41] B. J. P. A. Cornish, L. A. Lawton, and P. K. J. Robertson,“Hydrogen peroxide enhanced photocatalytic oxidation ofmicrocystin-lR using titanium dioxide,” Applied Catalysis B,vol. 25, no. 1, pp. 59–67, 2000.
[42] T. Hirakawa and Y. Nosaka, “Properties of O·2− and ·OH
Formed in TiO2 aqueous suspensions by photocatalyticreaction and the influence of H2O2 and some ions,” Langmuir,vol. 18, no. 8, pp. 3247–3254, 2002.
[43] T. Sauer, G. Cesconeto Neto, H. J. Jose, and R. F. P. M.Moreira, “Kinetics of photocatalytic degradation of reactivedyes in a TiO2 slurry reactor,” Journal of Photochemistry andPhotobiology A, vol. 149, no. 1–3, pp. 147–154, 2002.
[44] S. Lodha, A. Jain, and P. B. Punjabi, “A novel route for wastewater treatment: photocatalytic degradation of rhodamine B,”Arabian Journal of Chemistry, vol. 4, pp. 383–387, 2011.

Hindawi Publishing CorporationInternational Journal of PhotoenergyVolume 2012, Article ID 864104, 17 pagesdoi:10.1155/2012/864104
Review Article
Development of Pillared Clays for Wet Hydrogen PeroxideOxidation of Phenol and Its Application in the Posttreatment ofCoffee Wastewater
Nancy R. Sanabria, Rafael Molina, and Sonia Moreno
Estado Solido y Catalisis Ambiental (ESCA), Departamento de Quımica, Universidad Nacional de Colombia,Carrera 30 No. 45-03, Bogota, Colombia
Correspondence should be addressed to Sonia Moreno, [email protected]
Received 29 May 2012; Accepted 26 September 2012
Academic Editor: Meenakshisundaram Swaminathan
Copyright © 2012 Nancy R. Sanabria et al. This is an open access article distributed under the Creative Commons AttributionLicense, which permits unrestricted use, distribution, and reproduction in any medium, provided the original work is properlycited.
This paper focuses on the use of pillared clays as catalysts for the Fenton-like advanced oxidation, specifically wet hydrogenperoxide catalytic oxidation (WHPCO). This paper discusses the limitations on the application of a homogeneous Fenton system,development of solid catalysts for the oxidation of phenol, advances in the synthesis of pillared clays, and their potential applicationas catalysts for phenol oxidation. Finally, it analyzes the use of pillared clays as heterogeneous Fenton-like catalysts for a realwastewater treatment, emphasizing the oxidation of phenolic compounds present in coffee wastewater. Typically, the wet hydrogenperoxide catalytic oxidation in a real effluent system is used as pretreatment, prior to biological treatment. In the specific case ofcoffee wet processing wastewater, catalytic oxidation with pillared bentonite with Al-Fe is performed to supplement the biologicaltreatment, that is, as a posttreatment system. According to the results of catalytic activity of pillared bentonite with Al-Fe foroxidation of coffee processing wastewater (56% phenolic compounds conversion, 40% selectivity towards CO2, and high stabilityof active phase), catalytic wet hydrogen peroxide oxidation emerges as a viable alternative for management of this type of effluent.
1. Introduction
1.1. Development of Heterogeneous Fenton-Like Catalysts.One of the most effective technologies to remove organicpollutants from aqueous solutions is the Fenton’s reagenttreatment [1]. Fenton’s reagent was developed in the 1890sby Henry John Horstman Fenton and consists of a homoge-neous solution of hydrogen peroxide and an iron salt [2]. Themechanism for producing free hydroxyl radicals in Fenton(Fe2+/H2O2) and Fenton-like processes (Fe3+/H2O2) is verycomplex and thought to occur in the following stages [3–7]:
Fe2+ + H2O2 −→ Fe3+ + HO− + HO• (1)
Fe3+ + H2O2 −→ Fe–OOH+2 + H+ (2)
Fe–OOH+2 −→ Fe2+ + HO•2 (3)
Fe2+ + HO• −→ Fe3+ + HO− (4)
Fe3+ + H2O2 −→ Fe2+ + HO•2 + H+ (5)
HO• + H2O2 −→ H2O + HO•2 (6)
2Fe2+ + H2O2 + 2H+ −→ 2Fe3+ + 2H2O (7)
Fe3+ + H2O2 −→ Fe2+ + HO•2 + H+ (8)
The success of Fenton processes for the oxidation of a varietyof organic contaminants is attributed to the generation ofhydroxyl radicals formed during the catalytic decompositionof hydrogen peroxide in acidic media, according to the abovescheme [8–13]. This reaction is propagated by ferrous ionregeneration, which mainly occurs due to the reduction ofthe ferric species produced by hydrogen peroxide. However,in these reactions, the rate constant of (1) varies between63 and 76 L/mol·s whereas the rate constant of (5) is in
2 International Journal of Photoenergy
the order of 0.01–0.02 L/mol·s [13–15]. This indicates thatthe consumption of ferrous ions is faster than regeneration.Therefore, during the process, the formation of a largeamount of ferric hydroxide sludge occurs, which supposesadditional separation [13, 16]. Both radicals HO• and HO•2react indiscriminately with organic matter, being the secondless reactive. In a Fenton oxidation, the hydroxyl radicalreacts rapidly with most organic compounds by abstractionof carbon bound hydrogen and double bound addition,initiating a sequence of oxidative degradation reaction whichmay lead to mineralization of CO2, H2O, and the productionof carboxylic acids [6, 17–19].
Catalytic oxidation reactions are almost exclusively lim-ited to transition elements because these may exist inmore than one state of oxidation, making the establishmentof a repetitive oxidation-reduction cycle possible [20–22].Therefore, these reactions also occur with transition metalions such as Fe3+ or Cu2+ and are known as Fenton-typereactions [23] as follows
Mn+ + H2O2 −→M(n+1)+ + HO− + HO•. (9)
The application of a homogeneous Fenton system has asa disadvantage of the separation and reuse of the catalyst(Fe ions in solution). It is also necessary to control thepH solution so to avoid precipitation of iron hydroxide(pH > 5) [23]. To resolve some of the above drawbacks, aheterogeneous Fenton-like catalyst has been developed, thatis, solids containing the cations of transition metals [24, 25].This way, metals and the selected support directly affect thecatalytic activity because they are determinant factors in thestability of the supported metal and its dispersion [26, 27].
A variety of solid catalysts among which are metaloxide (CuO and Cu/Al2O3) [28], Fe-clay [29], metal oxideimpregnated activated carbon (Fe2MO4, M: Fe, and Mn)[30], iron molybdate Fe2(MoO4)3 [31], CuFeZSM-5 zeolite[32], Fe exchanged/supported on zeolite [33–35], goethite[36], Fe0/Fe3O4 composites [37, 38], nano magnetite [39],iron containing SBA-15 [40–42], and Al-Fe-pillared clays[43–45] have been evaluated in Fenton reactions. Somedegraded organic compounds include dye (reactive blue 4[29], methyl orange [30], acid orange II [31], rhodamine 6G[32], acid red 14 [33]), p-chlorophenol [28], 2-chlorophenol[36] and phenol [34, 40–42].
1.2. Heterogeneous Fenton-Like Catalysts for Phenol Oxida-tion. Phenol and its compounds are extremely toxic to theenvironment. These pollutants are released into the surfacewater bodies by oil refineries, pulp and paper, pharmaceu-tical and pesticide industries, and by several other chemicalplants [74]. Phenol is toxic even at low concentrations, andits presence in natural waters can also lead to the formationof substituted compounds during disinfection and oxidationprocesses [75].
Phenol is also relevant in the field of environmentalresearch because it has been chosen frequently as a modelpollutant. Much data is available on its removal and destruc-tion, in particular with respect to wastewater treatments [75].The presence of phenol in the environment is acutely toxic to
mankind; hence, treatment of phenolic pollutants is essentialbefore disposal [76].
Widely studied methods for the removal of phenolinclude biological treatment [77], extraction [78], andwet oxidation [79]. However, advanced oxidation processes(AOPs) such as Fenton, photo-Fenton [80], ozone oxidation[81], and photo-catalytic oxidation [82] are successfully usedfor the removal of phenol [75]. There is an increasing interestin the use of wet hydrogen peroxide catalytic oxidation(WHPCO) for the disposal of phenolic compounds in water,because this method (in comparison, for example, with wetair oxidation) avoids the use of costly reactors, it can beselective towards the conversion of specific substrates, and itis easy to manage [69, 83].
Different solids are used in the wet hydrogen peroxidecatalytic oxidation of phenol solutions, among which arepillared clays with Al-Cu [46, 58], Al-Fe [45, 46, 56],and Al-Ce-Fe [47, 51, 56] Fe-exchanged pillared beidel-lite [59], polymer-supported metal complexes [84], ironspecies supported on silica-based mesoporous molecularsieves of the MCM-41 and HMS-types [85], commer-cial CuO/alumina [86], Fe2O3/CeO2 and WO3/CeO2 [87],CuO/CeO2 [88], crystalline hematite particles embeddedinto a mesostructured SBA-15 matrix [89], Fe/activated car-bon [90–93], Cu/ZSM-5 [94], iron-based mesoporous silica[41], CuO/SBA-15 [95], and Cu-Ni-Al hydrotalcite [96].The effect of temperature, catalyst load, hydrogen peroxideconcentration, dosage strategies on phenol mineralization,hydrogen peroxide consumption efficiencies, and catalyststability were studied [13, 59, 86, 87].
One of the most popular catalysts for the oxidation ofphenol with H2O2 is zeolite Fe-ZSM-5, which has been foundto be very active but shows diffusion limitations due to therelatively small sized pores [97]. Transition metals containingmesoporous materials, such as MCM-41 and SBA-15, havebeen appropriate for the oxidation of phenols due to a largerpore size that is expected to enhance diffusion of reagentsin comparison with microporous materials. However, thesematerials are not stable in the reaction medium and gothrough destruction of mesoporosity and high leaching ofthe active phase [75].
In the search for other iron containing heterogeneousFenton-type catalysts that have a low leaching of the activephase at pH 3-4, where the phenol oxidation with H2O2 ismaximal [75], a new class of catalysts with a bidimensionalopen structure called pillared interlayered clays (PILCs) wasdeveloped. PILCs result from the intercalation of inorganicpolycations into the interlayer space of clays to form rigidcross-linked material of uniform microporosity [98]. Due toa high surface area and permanent porosity, they are veryattractive solids for use in catalysis [99]. The use of pillaredclays as catalytically active supports for phases (mainly Fe andCu) has the advantage that these transition metals show lowleaching into a WHPCO reaction [46, 56, 58, 60, 100].
1.3. Developments in the Synthesis of Pillared Clays. Barrerand MacLeod first introduced the concept of transforminga lamellar solid into a porous structure by inserting laterallyspaced molecular props between the layers of a smectite

International Journal of Photoenergy 3
clay mineral [101]. A pillaring agent is any compoundwhich can be intercalated between adjacent layers of alayered compound, maintaining the spacing between adja-cent layers upon removal of the solvent, and inducingan experimentally observable pore structure between thelayers [102]. When montmorillonites pillared with hydroxyl-aluminium oligomer [Al13O4(OH)24(H2O)12]7+, are heatedin air at 500◦C, the Keggin ions lose their water ligandsforming shorter Al13 blocks (0.84 nm in height) that becomethe structure supporting pillars [103, 104]. Although thepillaring cation is the main Al13, the addition of a secondinorganic cation can improve the thermal, adsorptive andcatalytic properties of the pillared clays [99].
The classical pillaring method involves two steps: first,the addition of the precursor polymer solution (pillaringagent) into the diluted clay mineral dispersion (interca-lation). A second step is the thermal treatment of theintercalated clay mineral [99]. A wide variety of factors caninfluence the intercalation/pillaring process. This variationmakes it difficult to compare the results obtained by differentauthors, and also good reproducibility becomes hard toachieve. The factors influencing this process include thenature of the raw clay used as parent material, nature of themetallic cations, the hydrolysis conditions (concentration,time, and ageing), intercalation time, temperature of synthe-sis and, finally, the washing, drying and calcination processes[105].
Variants of the traditional method have been researchedin order to decrease the water volume and timing of thesynthesis. Thus, it has become possible to decrease thevolume of water by the use of concentrated suspensions,both clay and the pillaring agent [106–111]. Also, the timeof intercalation of montmorillonite with chlorhydrol hasbeen reduced through the use of ultrasound, having led tothe obtaining of Al-PILC with a high thermal stability andtextural properties superior to those of clay modified with anexchange time of 24 h. In overall, during the intercalation,treatment with ultrasound [51, 112, 113] and microwaves[107, 114–116] has been proved to be an adequate methodfor reducing the contact time between clay and the pillaringagent [57].
Although, in the past 30 years, several studies highlight-ing some applications of industrial pillared clays have beenpublished, such materials have not been used as commercialcatalysts primarily due to the difficulty of extending thelaboratory synthesis to an industrial scale [57]. However, in2005, a procedure for pillaring clays with aluminum, whichminimizes the processing time and the amount of water used,allowing its extension to an industrial level was developed.To simplify the synthesis of Al-PILC, nonpurified clay andthe pillaring agent in a solid state are used, so that claypowder and solid Al13 nitrate are placed together in a dialysismembrane [117].
A diversity of raw clays has been used for the preparationof these pillared materials, around 80% correspondingto bentonite-montmorillonite [118]. In pursuing the useand valorization of Colombian clay minerals, a series ofsystematic studies were carried out modifying, via pillaring
of bentonite, clays from Valle del Cauca. One of the largestcompanies in Colombia exploiting and marketing bentoniteis located in that Colombian region. The purpose of usingsuch clays was to obtain catalysts (pillared bentonite) forremoval of phenolic compounds in an aqueous solutionby a heterogeneous Fenton system, in which the ironand/or cerium species were supported on bentonite. Table 1summarizes results of the research conducted.
The first pillared bentonites with Al-Fe and Al-Ce-Fewere synthesized using the conventional method of dilutedpillaring solution and diluted suspension of clay (2 wt%),which involves the use of large volumes of water and longsynthesis times. The pillared clays were very efficient catalystsin the reaction of a phenol oxidation in diluted aqueousmedia under mild experimental conditions (25◦C and atmo-spheric pressure), as well as in the elimination of differentintermediary compounds of the reaction, reaching high-mineralization levels. The catalysts showed high stability inthe reaction media due to the strong interaction between theiron species and the catalyst support. The incorporation ofcerium showed a favorable effect in pillaring of the materials,allowing the increase of the basal spacing and enhancingthe catalytic activity of the catalysts [47–50]. Carriazo et al.performed the characterization of pillaring species of Al-Ce-Fe, finding three different crystalline structures (boehmite,α-Fe2O3, and CeO2) into the solid synthesized from theAl-Ce-Fe polyhydroxocationic solution. The EPR analysisconfirmed the formation of iron oxide particles and the likelyinclusion of isolated Fe3+ species into the alumina matrix[50].
To expand the pillaring process to an industrial scale, itwas necessary to simplify procedures and optimization of theunit operations involved, particularly to decrease the volumeof water and synthesis times. In this regard, Perez et al. usedultrasound for aging and intercalating of pillared bentonitewith Al-Ce and Al-Ce-Fe. The use of ultrasound showed aclear effect in the synthesis of this type of solids allowingthe synthesis in a shorter time and preserving the physical-chemical characteristics as well as catalytic activity in theoxidation reactions [51]. Olaya et al. used microwaves andultrasound, both in the formation of the polymeric precursorand in the stage of intercalation in concentrated suspensionsof clay, finding that this type of radiation improves theformation of pillars and promotes the catalytic activity of thefinal solid [53–55].
With a procedure similar to that developed by Aouadet al. [117], Sanabria et al. propose a new methodology forthe synthesis of clays pillared with mixed Al-Fe and Al-Ce-Fe systems, using minimal volumes of water and reducingintercalation times. This methodology involves the synthesisof the solid polymeric precursor and its use as a pillaringagent. The use of powdered clay and a solid pillaring agent,contained in a dialysis membrane, considerably reduces theamount of water used in the conventional synthesis. Theintercalation of the polymeric precursor in clay is favoredby the use of ultrasound, reducing long contact timesrequired in conventional synthesis into diluted suspensions[52, 56, 57].

4 International Journal of Photoenergy
Table 1: Bentonite-based catalysts for oxidation of phenol using Fenton-like AOPs.
Pillared bentonite Year Synthesis condition Development Reference
B-Fe[50]2003
Pillaring solution: diluteSuspension clay: 2 wt%Time intercalation: 48 h
This is the first work using naturalbentonite from Valle del Cauca. [46]
B-Fe[100]
Al-Fe (10%)
20052007
Pillaring solution: diluteSuspension clay: 2 wt%Time intercalation: 24 h
Addition of Ce during the synthesis of thecatalysts show favorable results inphenol oxidation.
[47–49]Al-Ce-Fe (10%)
Al-Ce-Fe (5%)
Al-Ce-Fe (1%)
B-AlCe(10)Fe(10) 2008Pillaring solution: diluteSuspension clay: 2 wt%Time intercalation: 24 h
The clay pillared with the Al-Ce-Fe mixedsolution is a very active and selectivecatalyst in the phenol oxidation.
[50]
AlCe24USPillaring solution: diluteAging: 24 h or 10 min ultrasound(50 kHz)Suspension clay: 2 wt%Time intercalation: 24 h or 10 min US
Ultrasound considerably reduces themodification time of the pillared clays.The catalysts show physical-chemical andcatalytic properties similar to those whensynthesizing by the conventional method.
AlCeUS24
AlCeFe24US 2008 [51]
AlCeFeUS24
AlCeFe2424
B1-AlFe Pillaring agent: solidClay: powderIntercalation: dialysis membraneTime intercalation: 60 h
Using powdered clay and a solid pillaringagent, the water volume needed in thesynthesis of pillared clays was reduced.
B2-AlFe 2008 [52]
B3-AlFe
AlCe (10%)Pillaring agent: solidAging and intercalation: microwaves(160 W, 10 min) or ultrasound (50 kHz,30 min)Clay: powderIntercalation: dialysis membrane
The use of microwaves and ultrasoundsignificantly reduces the synthesis time ofpillared clays.
MAl-Fe
UAl-Fe 2009 [53]
AlCeFe (10%)
MAl-Fe-Ce
UAl-Fe-Ce
MAlFe(1),
Pillaring solution: diluteAging and intercalation:microwaves (160 W, 10 min) orultrasound (50 kHz, 30 min)Clay: powder
The use of microwaves and ultrasoundsignificantly reduces the synthesis time ofpillared clays.
MAlFe(10)
UAlFe(1)
UAlFe(10)
MAlCeFe(1-1) 2009 [54]
MAlCeFe(5-1)
MAlCeFe(10-10)
UAlCeFe(1-1)
UAlCeFe(5-1)
UAlCeFe(10-10)
B2R, BT21 Pillaring solution: diluteAging and intercalation: microwaves(160 W, 10 min)OH/metal: 2.0Suspension clay: 2%, 3%, and 100%
The use of microwaves significantlyreduces the synthesis time. Additionally,the use of a clay suspension (30%) anddry clay reduces the amount of waterused in the synthesis.
B21, B22 2009 [55]
B301, B302
BD1, BD2
B-Al USPillaring agent: SolidClay: powderIntercalation: dialysis membraneTime intercalation: 30 min (ultrasound,50 kHz)
With the methodology here used, thevolume of water needed and the synthesistime of pillared clays were reduced.
B-AlFe(2) US
B-AlFe(5) US 2009 [56, 57]
B-AlFe(10) US
B-AlFe
B-AlCeFe

International Journal of Photoenergy 5
The synthesis of pillared clays by mixed systems Al-Feand Al-Ce-Fe in a concentrated medium allows a 90%–95% decrease in the volume of water and a reduction inthe intercalation times between 70% and 93% with respectto the conventional synthesis. The pillared clays using thisnew methodology show a catalytic activity and selectivitycomparable to those of solids synthesized by the conventionalmethod in a dilute medium [56, 119]. An important aspectis that the Fe introduced into the clays is preferentiallyassociated with the alumina pillars and not with surface Feoxides (cluster). This is explained by the high stability of theactive phase in the reaction medium [57].
The commercial use of PILCs based catalysts not onlydepends on the optimization of the synthesis, but also on theability to shape the powder material into pellets, agglomer-ates, and so forth. These materials should keep their chemicalproperties, reactivity, and stability in the reaction medium.The manufacture of pellets, Raschig rings and monoliths,that involve pillared montmorillonites has basically beenaccomplished by the use of extrusion techniques [120].
With the developments in the synthesis of pillared claysin a concentrated medium, the manufacture of extrudedmaterials with Al-Fe Al-Ce-Fe pillared bentonites wasachieved. We found that the most adequate composition ofthe mixture of poly(hydroxo metal) bentonite/binder/waterfor the manufacture of extrudates with B-AlFe and B-AlCeFewas 42/28/30. The use of poly(hydroxo metal) bentonite(dried at 60◦C) and not the pillared bentonite (after cal-cination at 400◦C) considerably improved the mechanicalstability of the extrudates. The mechanical resistance of B-AlFe and B-AlCeFe based extrudates depended on the cal-cination temperature. At 500◦C, good mechanical strengthand sufficient stability to immersion in water were achieved.The extrudates largely preserved the structural and texturalproperties of Al-Fe and Al-Ce-Fe-PILC and retained thecatalytic properties of powdered pillared clays [27, 61].
1.4. Wet Hydrogen Peroxide Catalytic Oxidation (WHCPO)of Phenol Using Pillared Clay. Advanced oxidation processes(AOPs) are based on physical and chemical processescapable of fundamental changes in the chemical structureof contaminants, as they involve the generation and useof transitory species with a high oxidation power, mainlythe hydroxyl radical (OH•) [6]. Among advanced oxidationprocesses, the activation of hydrogen peroxide by means ofa solid catalyst (wet hydrogen peroxide catalytic oxidation,WHPCO) has turned out to be the most promising processfor the oxidation of phenol and phenol-like compounds andapplication in the treatment of wastewater [23, 83, 118].
Oxidation processes using hydrogen peroxide as oxidanthave turned out to be a viable alternative for the wastewatertreatments of medium-high total organic carbon concen-trations. Furthermore, iron is an abundant and nontoxicelement; hydrogen peroxide does not give origin to anyharmful by-products and it is a nontoxic and ecologicalreactant [6, 121].
Among the different materials used as support foroxidation reaction in a liquid phase, pillared clays represent
around 7% in the existing literature. However, the interest forpillared clays has increased substantially in the last decade,given their use in different oxidation processes such asWHPCO and photocatalytic oxidation [118]. The propertiesof pillared clays-based catalysts have been mainly studied inthe wet hydrogen peroxide oxidation of phenolic compoundsas model molecules, among them are phenol [44, 45, 48, 57,58, 62, 65, 68], 4-nitrophenol [122, 123], tyrosol [70], andp-coumaric and p-hydroxybenzoic acids [69].
Pillared clays with Al-Fe and Al-Cu are promissorycatalysts for wet hydrogen peroxide oxidation of phenol,because they combine a porous support and active sitesfor the adsorption of organic compounds in the activationof H2O2 [68]. The use of pillared clays with copper ina Fenton reaction would be important since the optimalpH of that reaction is close to 6, while for AlFe-PILC, theoptimum pH ranges between 3.5 and 4.0 [46, 62, 100].The properties of AlCu-PILC were compared with those ofanalogous iron-based clays (AlFe-PILC) in the wet hydrogenperoxide catalytic oxidation of model phenolic compounds.These two catalysts have comparable performances in allthese reactions, although they showed some differences inthe rates of the various steps of the reaction. In particular,AlCu-PILC showed a lower formation of oxalic acid (mainintermediate reaction) with respect to Fe-PILC [69]. Amongthe metals studied as active phase in oxidation processes withpillared clays-supported catalysts, iron is the most frequentlyused metal, followed by titanium, copper, and chromium[118]; hence, some of the most studied are the pillared clayswith Al-Fe.
In general, pillared clays with Al-Fe are efficient inphenol elimination under mild experimental conditions(atmospheric pressure and room temperature) withoutconsiderable leaching of metal ions [44, 46, 56, 60]. AlFe-PILC achieved high conversions of phenol and TOC thusshowing to be very selective towards the formation of CO2,as shown in Table 2.
Cerium (Ce) was introduced into pillared clays withAl and Al-Fe, improving the metallic dispersion properties,increasing the pillars resistance [124–126], and favoring theredox properties of the active metallic phase [48, 127]. Thecatalysts obtained by the pillaring of Colombian bentonitewith Al-Fe or Al-Ce-Fe are highly efficient for the reaction ofphenol oxidation in diluted aqueous media in moderate con-ditions of temperature and pressure (25◦C and atmosphericpressure). The low iron leaching indicate that the active phaseof these catalysts is strongly fixed to the clay support andpillars, and that it is highly stable under oxidizing conditionsof the reaction medium [47, 48].
Most research on the use of pillared clays for theoxidation of phenol was conducted with the powderedcatalyst and a few with pellets of Al-Fe pillared clay [27,61, 66–68]. Therefore, the development of catalysts basedon pillared clays not only depends on the optimization ofthe synthesis, but also on the ability to shape the powdermaterial into structured shapes (e.g., pellets, Raschig rings,and monoliths) that retain the chemical properties andreactivity of the active phase and can be used in fixed bedreactors [27].
6 International Journal of Photoenergy
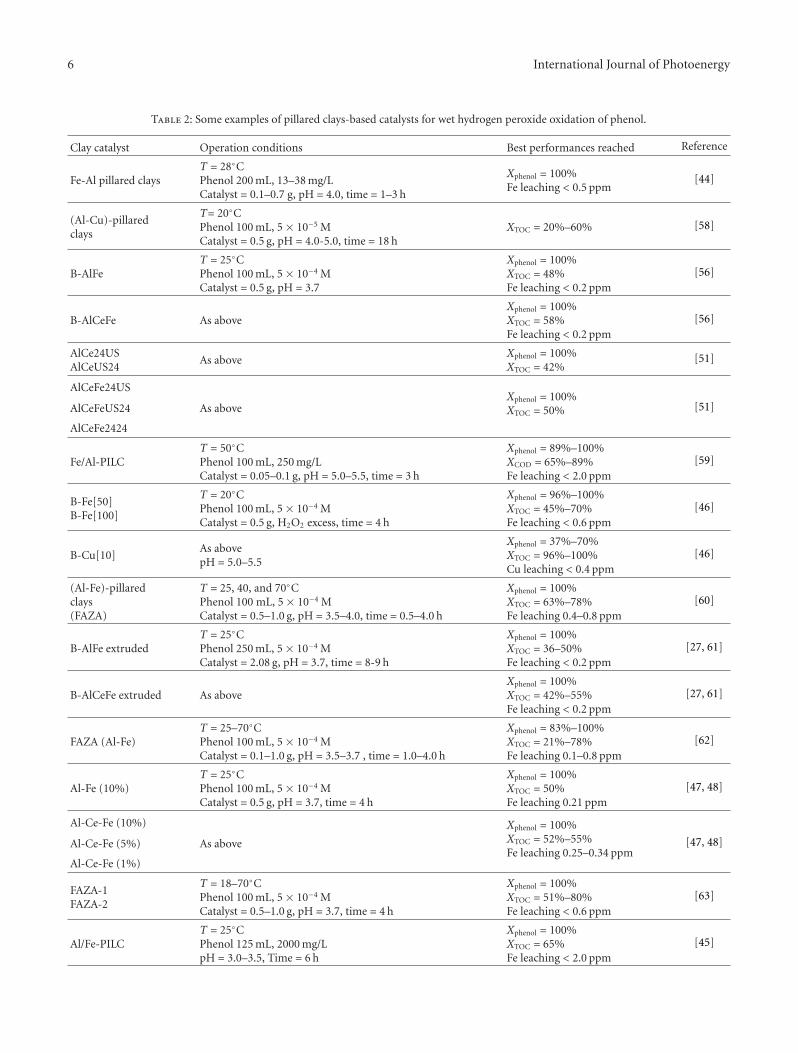
Table 2: Some examples of pillared clays-based catalysts for wet hydrogen peroxide oxidation of phenol.
Clay catalyst Operation conditions Best performances reached Reference
Fe-Al pillared claysT = 28◦CPhenol 200 mL, 13–38 mg/LCatalyst = 0.1–0.7 g, pH = 4.0, time = 1–3 h
Xphenol = 100%Fe leaching < 0.5 ppm
[44]
(Al-Cu)-pillaredclays
T= 20◦CPhenol 100 mL, 5 × 10⁻⁵ MCatalyst = 0.5 g, pH = 4.0-5.0, time = 18 h
XTOC = 20%–60% [58]
B-AlFeT = 25◦CPhenol 100 mL, 5 × 10⁻⁴ MCatalyst = 0.5 g, pH = 3.7
Xphenol = 100%XTOC = 48%Fe leaching < 0.2 ppm
[56]
B-AlCeFe As aboveXphenol = 100%XTOC = 58%Fe leaching < 0.2 ppm
[56]
AlCe24USAlCeUS24
As aboveXphenol = 100%XTOC = 42%
[51]
AlCeFe24USXphenol = 100%XTOC = 50%AlCeFeUS24 As above [51]
AlCeFe2424
Fe/Al-PILCT = 50◦CPhenol 100 mL, 250 mg/LCatalyst = 0.05–0.1 g, pH = 5.0–5.5, time = 3 h
Xphenol = 89%–100%XCOD = 65%–89%Fe leaching < 2.0 ppm
[59]
B-Fe[50]B-Fe[100]
T = 20◦CPhenol 100 mL, 5 × 10⁻⁴ MCatalyst = 0.5 g, H2O2 excess, time = 4 h
Xphenol = 96%–100%XTOC = 45%–70%Fe leaching < 0.6 ppm
[46]
B-Cu[10]As abovepH = 5.0–5.5
Xphenol = 37%–70%XTOC = 96%–100%Cu leaching < 0.4 ppm
[46]
(Al-Fe)-pillaredclays(FAZA)
T = 25, 40, and 70◦CPhenol 100 mL, 5 × 10⁻⁴ MCatalyst = 0.5–1.0 g, pH = 3.5–4.0, time = 0.5–4.0 h
Xphenol = 100%XTOC = 63%–78%Fe leaching 0.4–0.8 ppm
[60]
B-AlFe extrudedT = 25◦CPhenol 250 mL, 5 × 10⁻⁴ MCatalyst = 2.08 g, pH = 3.7, time = 8-9 h
Xphenol = 100%XTOC = 36–50%Fe leaching < 0.2 ppm
[27, 61]
B-AlCeFe extruded As aboveXphenol = 100%XTOC = 42%–55%Fe leaching < 0.2 ppm
[27, 61]
FAZA (Al-Fe)T = 25–70◦CPhenol 100 mL, 5 × 10⁻⁴ MCatalyst = 0.1–1.0 g, pH = 3.5–3.7 , time = 1.0–4.0 h
Xphenol = 83%–100%XTOC = 21%–78%Fe leaching 0.1–0.8 ppm
[62]
Al-Fe (10%)T = 25◦CPhenol 100 mL, 5 × 10⁻⁴ MCatalyst = 0.5 g, pH = 3.7, time = 4 h
Xphenol = 100%XTOC = 50%Fe leaching 0.21 ppm
[47, 48]
Al-Ce-Fe (10%) Xphenol = 100%XTOC = 52%–55%Fe leaching 0.25–0.34 ppm
Al-Ce-Fe (5%) As above [47, 48]
Al-Ce-Fe (1%)
FAZA-1FAZA-2
T = 18–70◦CPhenol 100 mL, 5 × 10⁻⁴ MCatalyst = 0.5–1.0 g, pH = 3.7, time = 4 h
Xphenol = 100%XTOC = 51%–80%Fe leaching < 0.6 ppm
[63]
Al/Fe-PILCT = 25◦CPhenol 125 mL, 2000 mg/LpH = 3.0–3.5, Time = 6 h
Xphenol = 100%XTOC = 65%Fe leaching < 2.0 ppm
[45]

International Journal of Photoenergy 7
Table 2: Continued.
Clay catalyst Operation conditions Best performances reached Reference
MAlFe(1)T = 25◦CPhenol 100 mL, 5 × 10⁻⁴ MCatalyst = 0.5 g, pH = 3.7, time = 4 h
Xphenol = 100%XTOC = 54%–60%
MAlFe(10) [53, 54]
UAlFe(1)
UAlFe(10)
MAlCeFe(1-1)
As aboveXphenol = 100%XTOC = 50%–57%
MAlCeFe(5-1)
MAlCeFe(10-10) [53, 54]
UAlCeFe(1-1)
UAlCeFe(5-1)
UAlCeFe(10-10)
B1-AlFeAs Above
Xphenol = 100%XTOC = 49%–52%Fe leaching < 0.4 ppm
B2-AlFe [52]
B3-AlFe
Fe0.8Al12.2-PILCFe6.5Al6.5-PILC
T = 30–60◦CPhenol : H2O2 = 1 : 14 mol/mol(20 ml, 30 wt% in water)Catalyst = 0.25–1.5 g, time = 1–7 h
Xphenol = 50%–100%Fe leaching <0.01wt%–20 wt%
[64]
Al-Fe-PILCT = 25◦C5–50 mg phenol/L H2OCatalyst = 0.25–1.5 g, pH = 3.5–4.0, time = 1–4 h
Xphenol = 38%–100% [65]
Extrudates Al-Fepillared clay
T = 25–90◦C100–2000 mg phenol/L H2OCatalyst = 0.0–10 g, pH = 3.8–6.0, time = 1–4 h
Xphenol = 100%XTOC = 35%–55%Fe leaching < 0.4 ppm
[66]
FAZA powderFAZA extrudates
T = 20◦CUltrasound assistedPhenol 100 mL, 5 × 10⁻⁴ MCatalyst = 0.5 g, pH = 3.5–4.0, time = 4 h
Xphenol = 100% [67]
FAZAT = 25◦CPhenol 100 mL, 5 × 10⁻⁴ MCatalyst = 0.5–1.0 g, pH = 3.7, time = 4 h
Xphenol = 100%XTOC = 65%Fe leaching < 0.2 ppm
[68]
Extrudates of an Al-Fe pillared clay catalyst suitablefor packed-bed operations are evaluated for oxidation ofphenol using hydrogen peroxide as the oxidant. The reactionwas processed in a semibatch basket reactor under rathermild conditions. Operational parameters were studied underthe following conditions: temperature from 25 to 90◦C,atmospheric pressure, initial phenol concentration from 100to 2000 ppm of the liquid phase, catalyst loading from0 to 10 g/L, and input H2O2 concentration from 0.15 to0.6 mol/L. Under these conditions, the Al-Fe pillared claycatalyst achieves a total elimination of phenol and significanttotal organic carbon (TOC) removal. This catalyst canbe used several times without any change in its catalyticproperties, and, hence, it would be a promising catalyst forindustrial wastewater treatment [66].
Extrudates manufactured with pillared bentonites werealso employed in phenol oxidation at 25◦C and atmosphericpressure. Extrudates with B-AlFe and B-AlCeFe reached100% conversion of phenol and TOC conversion between30% and 62%, after 9 h of reaction. Once the reaction wascompleted (9 h), the catalyst was removed and the leachatewas recovered and analyzed, showing Fe values in the range
of 0.11–0.14 ppm. The outstanding differences in time forthe phenol conversion and TOC of extruded materialscompared to the powdered materials were a consequenceof the agglomeration process and the inherent diffusionallimitations [61]. The extruded catalyst retained its catalyticactivity during at least 10 consecutive tests (80 h), and onlya loss of mechanical stability was observed for the seriescontaining B-AlFe as the active phase. This result provedthe importance of cerium in the synthesis of pillared clayswith mixed systems because it not only increased the catalyticactivity due to its oxygen storage capacity, but also increasedthe mechanical stability of extruded catalysts in the reactionmedium [27].
2. Fenton Oxidation with Pillared Clays forWastewater Treatment
The interest for pillared clays has dramatically increased inthe last years, in great part due to their potential applicationsas catalysts. Metals incorporated in the pillared clay structureare crucial and make them suitable for a number of different

8 International Journal of Photoenergy
applications, most of them belonging to the so-called “greenchemistry” [118]. This way, pillared clays have been testedas catalysts in different oxidation processes. Distribution ofthe pollutants studied in the literature corresponds mainly tophenol (22%), orange II and other dyes (23%), and only 5%to industrial effluents [118].
Table 3 summarizes the research related to the use ofpillared clays in wet hydrogen peroxide catalytic oxidation(WHPCO) of industry wastewater. The studies have basicallyfocused on real olive oil milling wastewater (OMW). Thereason for studying an olive oil mill wastewater effluent isbecause it constitutes a critical environmental problem in theMediterranean area that accounts for 95% of the world oliveoil production [128] and generates 30 million m3 of OMWevery year [129].
Most treatment studies of OMW are focused on aerobicbiodegradation or anaerobic digestion of that material[130]. Unfortunately, due to the effluents’ high toxicity andbiodegradability, no satisfactory results were obtained bythese treatments. Indeed, in order to remove the organiccompounds and reduce the methanogenic bacteria inhibi-tion of the OMW, the WHPCO as pretreatment has beenresearched [83, 131].
Tyrosol, p-coumaric, and p-hydroxybenzoic acids havealso deserved the attention of some researchers becausethey are representative compounds of the polyphenolicfraction typically found in olive processing wastewater [69,70]. The polyphenolic compounds conversion in OMWusing Cu-PILC and Fe-PILC is about 45% and similarfor the two catalysts. Therefore, the rate of polyphenolicconversion is around two to three times higher than therate of TOC abatement, indicating a preferential reductionof these toxic compounds with respect to TOC abatement,in agreement with the goal of toxicity reduction, to improvebiodegradability and to minimize as much as possible TOCreduction, because the OMW after WHPCO should gothrough a biological treatment [69].
3. Environmental Problems Associated withCoffee Wet Processing in Colombia
Coffee is one of the largest agricultural-based productssold in international markets and has become the secondbest-marketed product worldwide, surpassed only by oil[132]. Colombian coffee has become a benchmark for therest of the world due to the country unique weather andtopography, wet processing, and programs to guarantee thecoffee’s origin. Colombia, the largest producer of washedArabica coffee worldwide, counts an estimated average coffeeproduction rate of 11 million bags per year (1 bag equals60 kg of dried coffee beans), with coffee grown by a total of553,000 families covering an area of 914,000 hectares [133].
The coffee fruit consists of a coloured exocarp (skin),a fleshy, yellowish-white mesocarp (pulp), mucilage layers(covering the two beans) and two coats (the first, a thin,fibrous parchment and the second, a fine membrane,silver skin) [134]. Primary coffee processing refers to theprocessing of the coffee fruit to obtain coffee beans (also
called green coffee beans at this stage). Coffee beans areextracted using one of three different methods: dry process-ing, wet processing, or semidry processing [135]. Althoughall methods aim at removing the fruit flesh of the coffeecherry, each method removes the flesh in different ways[136]. In the wet method process, which requires the useof specific equipment and substantial amounts of water, thepulp is eliminated using a pulper, followed by the mucilage’sremoval by natural fermentation. When fermentation iscomplete, the wet processed seeds are washed and dried,and the final product is “washed” or “parchment” coffee.Coffee processed using the wet method typically increases themarket value of the beans because of its ability to add a softacidity, good body, and better flavour [135, 136].
The mucilage, a by-product of coffee wet processing, isprimarily composed by pectin, sugars, water [136, 137], andminor compounds such as tannins, caffeine, and phenols[138]. It is estimated that for every 1 × 10⁶ parchment bags,approximately 55.5 × 10⁶ kg of fresh mucilage is generated,resulting in highly polluted nearby tributary water sourceswhere the waste is discharged [139]. For this reason, theNational Coffee Research Center—Cenicafe has developedmodular anaerobic treatment systems (SMTA, the Spanishacronym) using hydrolytic acidogenic and methanogenicreactors to treat coffee processing wastewater prior to itsrelease, reducing the chemical oxygen demand (COD) byapproximately 87%. The remaining 13% of the COD inthe effluent is nondegrading and corresponds to recalcitrantcompounds, including phenolic compounds [140]. Treat-ment of coffee wastewater in a UASB (upflow anaerobicsludge blanket) reactor showed similar results: between 14%and 44% of phenolic compounds were removed duringanaerobic digestion and, on average, 8% of the CODremained in the effluent and was not degraded [138].Because the SMTA effluent still poses toxic consequencesfor aquatic life, the effluent must go through posttreatmentbefore being discharged into any water source.
To determine the biological impact generated by coffeewet processing wastewater, the National Coffee ResearchCenter of Colombia—Cenicafe conducted bioassays usingChlorella vulgaris (algae), Daphnia pulex (microcrustacean),and Lebistes reticulatus (fish). It was found that the effluentfrom coffee wastewater can be toxic to the ecosystem atconcentrations above 300 ppm of COD, inflicting a 50%mortality of fish, 43% of microcrustaceans, and 40% of algae,a negative impact on the aquatic ecosystem [141].
To complement the biological treatment, an integratedbiosystem that uses macrophytes for posttreatment for coffeewet processing wastewater has been proposed, in order togenerate the least negative impact on the coffee aquaticecosystem [139]. However, the biomass produced in theseaquatic systems should be properly utilized in other processessuch as the production of fertilizers, animal feed, andmushroom growing.
Considering that coffee wastewater is highly biodegrad-able, biological treatments have been widely used [142–144].In Colombia, a posttreatment for coffee wastewater is usuallynot performed because the elimination of 80% of the initial
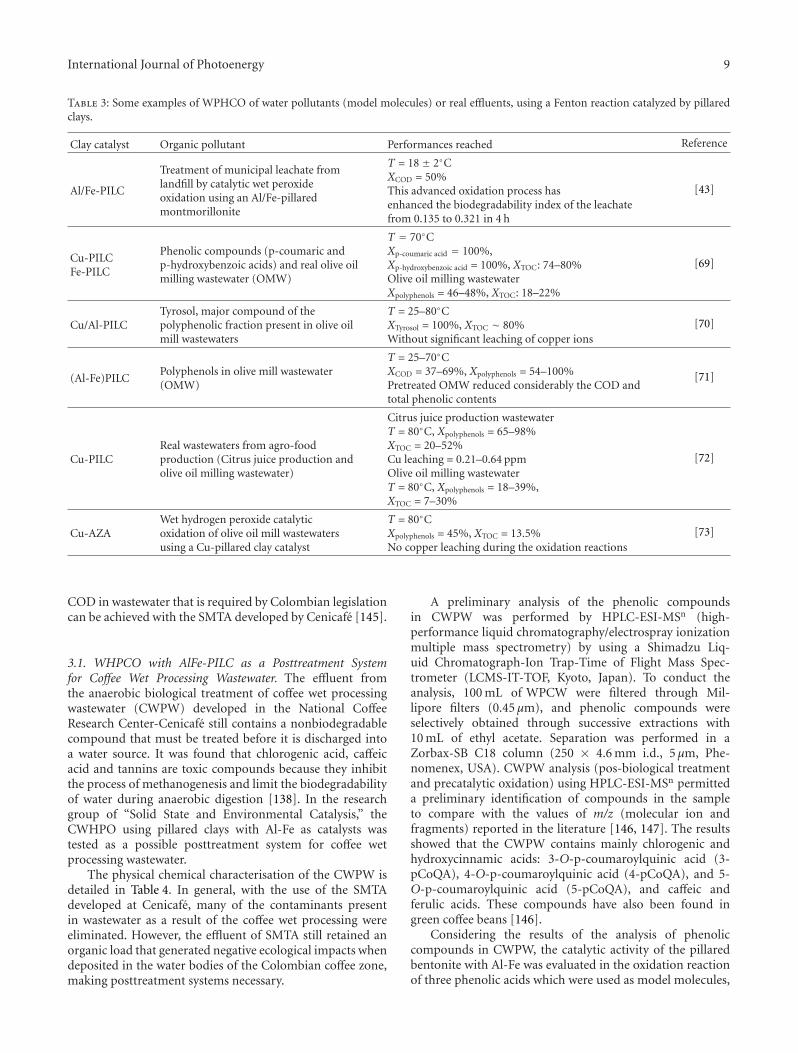
International Journal of Photoenergy 9
Table 3: Some examples of WPHCO of water pollutants (model molecules) or real effluents, using a Fenton reaction catalyzed by pillaredclays.
Clay catalyst Organic pollutant Performances reached Reference
Al/Fe-PILC
Treatment of municipal leachate fromlandfill by catalytic wet peroxideoxidation using an Al/Fe-pillaredmontmorillonite
T = 18 ± 2◦CXCOD = 50%This advanced oxidation process hasenhanced the biodegradability index of the leachatefrom 0.135 to 0.321 in 4 h
[43]
Cu-PILCFe-PILC
Phenolic compounds (p-coumaric andp-hydroxybenzoic acids) and real olive oilmilling wastewater (OMW)
T = 70◦CXp-coumaric acid = 100%,Xp-hydroxybenzoic acid = 100%, XTOC: 74–80%Olive oil milling wastewaterXpolyphenols = 46–48%, XTOC: 18–22%
[69]
Cu/Al-PILCTyrosol, major compound of thepolyphenolic fraction present in olive oilmill wastewaters
T = 25–80◦CXTyrosol = 100%, XTOC ∼ 80%Without significant leaching of copper ions
[70]
(Al-Fe)PILCPolyphenols in olive mill wastewater(OMW)
T = 25–70◦CXCOD = 37–69%, Xpolyphenols = 54–100%Pretreated OMW reduced considerably the COD andtotal phenolic contents
[71]
Cu-PILCReal wastewaters from agro-foodproduction (Citrus juice production andolive oil milling wastewater)
Citrus juice production wastewaterT = 80◦C, Xpolyphenols = 65–98%XTOC = 20–52%Cu leaching = 0.21–0.64 ppmOlive oil milling wastewaterT = 80◦C, Xpolyphenols = 18–39%,XTOC = 7–30%
[72]
Cu-AZAWet hydrogen peroxide catalyticoxidation of olive oil mill wastewatersusing a Cu-pillared clay catalyst
T = 80◦CXpolyphenols = 45%, XTOC = 13.5%No copper leaching during the oxidation reactions
[73]
COD in wastewater that is required by Colombian legislationcan be achieved with the SMTA developed by Cenicafe [145].
3.1. WHPCO with AlFe-PILC as a Posttreatment Systemfor Coffee Wet Processing Wastewater. The effluent fromthe anaerobic biological treatment of coffee wet processingwastewater (CWPW) developed in the National CoffeeResearch Center-Cenicafe still contains a nonbiodegradablecompound that must be treated before it is discharged intoa water source. It was found that chlorogenic acid, caffeicacid and tannins are toxic compounds because they inhibitthe process of methanogenesis and limit the biodegradabilityof water during anaerobic digestion [138]. In the researchgroup of “Solid State and Environmental Catalysis,” theCWHPO using pillared clays with Al-Fe as catalysts wastested as a possible posttreatment system for coffee wetprocessing wastewater.
The physical chemical characterisation of the CWPW isdetailed in Table 4. In general, with the use of the SMTAdeveloped at Cenicafe, many of the contaminants presentin wastewater as a result of the coffee wet processing wereeliminated. However, the effluent of SMTA still retained anorganic load that generated negative ecological impacts whendeposited in the water bodies of the Colombian coffee zone,making posttreatment systems necessary.
A preliminary analysis of the phenolic compoundsin CWPW was performed by HPLC-ESI-MSn (high-performance liquid chromatography/electrospray ionizationmultiple mass spectrometry) by using a Shimadzu Liq-uid Chromatograph-Ion Trap-Time of Flight Mass Spec-trometer (LCMS-IT-TOF, Kyoto, Japan). To conduct theanalysis, 100 mL of WPCW were filtered through Mil-lipore filters (0.45 μm), and phenolic compounds wereselectively obtained through successive extractions with10 mL of ethyl acetate. Separation was performed in aZorbax-SB C18 column (250 × 4.6 mm i.d., 5 μm, Phe-nomenex, USA). CWPW analysis (pos-biological treatmentand precatalytic oxidation) using HPLC-ESI-MSn permitteda preliminary identification of compounds in the sampleto compare with the values of m/z (molecular ion andfragments) reported in the literature [146, 147]. The resultsshowed that the CWPW contains mainly chlorogenic andhydroxycinnamic acids: 3-O-p-coumaroylquinic acid (3-pCoQA), 4-O-p-coumaroylquinic acid (4-pCoQA), and 5-O-p-coumaroylquinic acid (5-pCoQA), and caffeic andferulic acids. These compounds have also been found ingreen coffee beans [146].
Considering the results of the analysis of phenoliccompounds in CWPW, the catalytic activity of the pillaredbentonite with Al-Fe was evaluated in the oxidation reactionof three phenolic acids which were used as model molecules,

10 International Journal of Photoenergy
Table 4: Physicochemical parameters of coffee wet processingwastewater before and after biological treatment in SMTA.
ParametersWater characteristics
Beforea Afterb
pH 4.2 6.5
BOD5 (mg O2/L) 2,990 284
COD (mg O2/L) 6,580 551
COD/BOD 2.2 1.9
Total suspended solids (mg/L) 435 904
Acidity (mg/L) 413 72
Total phenols (mg/L) ND 165aAnalysis conducted at Cenicafe.
bAnalysis after biological treatment in hydrolytic acidogenic and meth-anogenic reactors (SMTA).ND: Not determined because the sample contained a large amount ofreducing sugars that generated interference and overestimated the totalphenols content.
using a similar procedure as that reported in previous studiesfor phenol [46, 49, 56, 57]. The phenolic acids used werechlorogenic (3-caffeoylquinic or 3-CQA), caffeic, and ferulicacids (Figure 1) at the following concentrations: 100 mg/Lfor 3-CQA and 40 mg/L for both caffeic and ferulic acids.
Traditionally, the tests with phenol as a model systemare performed with 40 mg/L but, for 3-CQA, a higherconcentration was used, given that 3-CQA is one of themost abundant compounds in the CWPW [138]. Monitoringof the phenolic acid conversion over time was conductedby high performance liquid chromatography (HPLC) usinga Hitachi D-7000 (LaChrom) instrument equipped witha LiChrospher 60 Select B column, absorbance detectorUV-vis L-7400, and, as a mobile phase, using a mixtureof H2O, H3PO4, and CH3OH. The retention times forchlorogenic, caffeic, and ferulic acids were 9.3, 9.9 and11.0 min, respectively. Selectivity of the catalysts toward CO2
and H2O was evaluated using the analysis of total organiccarbon (TOC) by an AnaTOC equipment.
Wet hydrogen peroxide catalytic oxidation tests of Al-Fe-PILC with chlorogenic (3-CQA), caffeic, and ferulic acidsshowed a beneficial effect when incorporating Fe in thebentonite, both with respect to the phenolic acids conversion(Figure 2) and total organic carbon, TOC (Figure 3). Theconversion of phenolic compounds using the catalyst Al-Fe-PILC was higher for the chlorogenic acid (91%), followed bycaffeic acid (87%) and ferulic acid (78%) after 4 h. Althougha complete oxidation of these acids was not achieved,conversions higher than 78% are considered to be very goodconsidering the complex structure of these compounds andthe fact that the reaction was performed at 25◦C. Selectivityof the Al-Fe-PILC towards CO2 and H2O was higher for thechlorogenic acid (49%), followed by the caffeic acid (37%)and ferulic acid (34%). These results are associated withdifferences in chemical structure. It was also found that thereactivity of phenolic compounds can be drastically affectedby the electronic nature of substituents and by their positionsin the aromatic ring [148, 149].
O
O
O
HOHOHO
HO
OH
OH
Chlorogenic acid (3-CQA)
3-(3, 4-dihydroxycinnamoyl)quinic acid
(a)
O
HO
HO
OH
Caffeic acid
3, 4-dihydroxy-cinnamic acid
(b)
O
HO OH
H3CO
Ferulic acid
3-methoxy-4-hydroxycinnamic acid
(c)
Figure 1: Structure of phenolic acids.
The high conversion of chlorogenic acid can be explainedby the presence of two electron-donating groups (as caffeicacid) and by three additional hydroxyl groups in the estermoiety. An example of the relationship between the chemicalstructure and its reactivity with hydroxyl radical would bethe wet hydrogen peroxide photo-oxidation of p-coumaric,vanillic, ferulic, and caffeic acids when catalysed by (Al-Fe)-PILC, in which the degradation of phenolic compounds was28%, 50%, 58%, and 86%, respectively [148]. Because thehydroxyl radicals generated by the catalytic decomposition ofH2O2 are both reactive and nonselective, the attack positionin the aromatic ring can be located anywhere on the ring[150]. Therefore, the catalytic degradability of some phenoliccompounds has been correlated by the Hammett constant(σ), explaining the effect that different substituents have onthe electronic character of a given aromatic system (electron-withdrawing or electron-donating groups) [148, 150].

International Journal of Photoenergy 11
0 30 60 90 120 150 180 210 2400
20
40
60
80
100
Ph
enol
ic a
cids
con
vers
ion
(%
)
Time (min)
Chlorogenic acid (3-CQA) Caffeic acid Ferulic acid
Figure 2: Phenolic acids conversion with AlFe-PILC.
0 30 60 90 120 150 180 210 2400
10
20
30
40
50
TO
C c
onve
rsio
n (
%)
Time (min)
Chlorogenic acid (3-CQA) Caffeic acid Ferulic acid
Figure 3: Total organic carbon (TOC) conversion with AlFe-PILC.
The reaction scheme for evaluating the catalytic activityof AlFe-PILC in the oxidation of the CWPW was describedin Figure 4. For testing, the semibatch reactor thermostatedat 25◦C was loaded with 100 mL of coffee wastewater, 0.5 gof the catalyst, 0.1 M hydrogen peroxide solution (10 mL,2 mL/h), bubbling air at a constant flow (2 L/h), and broughtto a pH of 3.7 with 0.1 M NaOH or HCl. The total phenolconversion in CWPW was performed using the Folin-Ciocalteu colorimetric method [151, 152]. Selectivity of thecatalysts toward CO2 and H2O or grade of mineralizationwas evaluated using the analysis of total organic carbon(TOC) with an AnaTOC equipment.
pH meter
3.7
Air compressor
Magnetic stirrer
Coffee wastewater
DispenserNaOH or HCl
Sample Total organic carbon (TOC)
Total phenolic compounds
100 mL
Thermostat25 C
Peristaltic pump,
dosing of H2O2
Figure 4: Diagram of the reaction system.
0 30 60 90 120 150 180 210 240 270 3000
10
20
30
40
50
60
TO
C c
onve
rsio
n (
%)
AlFe-PILC Bent AlFe-PILC
Bent
Time (min)
Tota
l ph
enol
con
vers
ion
(%
)
0
10
20
30
40
Figure 5: Catalytic oxidation of coffee wastewater with AlFe-PILC(continuous line) and Bent (dotted line). Total phenols conversion(star) and TOC conversion (diamond).
The AlFe-PILC achieved a high conversion rate of totalphenolic compounds (56%) and mineralization towardsCO2 and H2O (40%) after 5 h reaction time (Figure 5). Thestarting bentonite (Bent) used as a reaction target achieved aconversion rate of phenolic compounds of 8% and selectivityto CO2 and H2O of 4%, values attributed to the activityof iron in the starting clay (8.2% Fe2O3). The chemicaloxygen demand (COD) of coffee processing wastewater afterwet hydrogen peroxide catalytic oxidation was reduced in60%. In terms of stability of the active phase, an averageconcentration of leached iron was <0.22 ppm.
The combination of the two treatment methods, bio-logical (developed by Cenicafe) and catalytic oxidationwith AlFe-PILC, achieved a 96.7% reduction of COD inCWPW. These results are higher than those obtained when

12 International Journal of Photoenergy
coffee processing wastewater was treated by coagulation-flocculation in combination with advanced oxidation pro-cesses (UV/H2O2/O3), where a COD reduction of 87% wasachieved [153]. Therefore, the WHPCO using AlFe-PILCcatalysts is a viable alternative for the posttreatment of coffeeprocessing wastewater.
4. Conclusions
The pillared clays have received considerable attention inthe last decade as catalysts for wet hydrogen peroxideoxidation of phenolic compounds because of their highactivity (conversion of phenolic compound and degree ofmineralization) and environmental compatibility (low cost,easy recovery of the catalyst, are reusable catalysts, oxidationthat can be carried out at room temperature and atmosphericpressure, and that they show high stability of the activephase in the reaction medium). With the developmentsin the synthesis of pillared clays, it has been possible toreduce the water volume and synthesis times, and technicalrequirements for these materials can be useful at industriallevel.
Given the excellent properties of pillared clays in theWHPCO for phenol and other model molecules, as well asreal wastewater treatment, this advanced oxidation processcan be integrated with biological process, as a pre- or post-treatment, depending on the physicochemical characteristicsof the wastewater.
The high conversion of phenolic compounds, the selec-tivity to CO2 and H2O, and stability of the active phase inthe pillared bentonite with Al-Fe in the WHPCO of coffeewastewater show the potentiality of this catalyst for posttreat-ment for this type of effluent. The combination of the twotreatment methods, biological and catalytic oxidation withAlFe-PILC, achieved a 96.7% reduction of chemical oxygendemand in coffee wet processing wastewater.
Acknowledgments
The authors are grateful for the financial support provided byCSIC-COLCIENCIAS and DIB of Universidad Nacional deColombia, Bogota, for the development of several researchprojects conducted over the past 10 years. The authors alsoappreciate the cooperation received from the National CoffeeResearch Center—Cenicafe.
References
[1] R. J. Bigda, “Consider Fenton chemistry for waste-watertreatment,” Chemical Engineering Progress, vol. 91, no. 12, pp.62–66, 1995.
[2] H. J. H. Fenton, “LXXIII.—oxidation of tartaric acid in pres-ence of iron,” Journal of the Chemical Society, Transactions,vol. 65, pp. 899–910, 1894.
[3] C. Walling, “Fenton’s reagent revisited,” Accounts of ChemicalResearch, vol. 8, no. 4, pp. 125–131, 1975.
[4] S. S. Lin and M. D. Gurol, “Catalytic decomposition ofhydrogen peroxide on iron oxide: kinetics, mechanism, and
implications,” Environmental Science and Technology, vol. 32,no. 10, pp. 1417–1423, 1998.
[5] J. Beltran De Heredia, J. Torregrosa, J. R. Dominguez, and J.A. Peres, “Kinetic model for phenolic compound oxidationby Fenton’s reagent,” Chemosphere, vol. 45, no. 1, pp. 85–90,2001.
[6] A. Safarzadeh-Amiri, J. R. Bolton, and S. R. Cater, “The useof iron in advanced oxidation processes,” Journal of AdvancedOxidation Technologies, vol. 1, no. 1, pp. 18–26, 1996.
[7] G. Zelmanov and R. Semiat, “Phenol oxidation kineticsin water solution using iron(3)-oxide-based nano-catalysts,”Water Research, vol. 42, no. 14, pp. 3848–3856, 2008.
[8] F. Haber and J. Weiss, “The catalytic decomposition ofhydrogen peroxide by iron salts,” Proceedings of the RoyalSociety of London A, vol. 147, no. 861, pp. 332–351, 1934.
[9] C. Walling, G. M. El-Taliawi, and R. A. Johnson, “Fenton’sreagent. IV. Structure and reactivity relations in the reactionsof hydroxyl radicals and the redox reactions of radicals,”Journal of the American Chemical Society, vol. 96, no. 1, pp.133–139, 1974.
[10] E. Chamarro, A. Marco, and S. Esplugas, “Use of Fentonreagent to improve organic chemical biodegradability,” WaterResearch, vol. 35, no. 4, pp. 1047–1051, 2001.
[11] C. K. Duesterberg and T. D. Waite, “Process optimizationof fenton oxidation using kinetic modeling,” EnvironmentalScience and Technology, vol. 40, no. 13, pp. 4189–4195, 2006.
[12] W. P. Ting, M. C. Lu, and Y. H. Huang, “The reactor designand comparison of Fenton, electro-Fenton and photoelectro-Fenton processes for mineralization of benzene sulfonic acid(BSA),” Journal of Hazardous Materials, vol. 156, no. 1–3, pp.421–427, 2008.
[13] A. Babuponnusami and K. Muthukumar, “Advanced oxi-dation of phenol: a comparison between Fenton, electro-Fenton, sono-electro-Fenton and photo-electro-Fenton pro-cesses,” Chemical Engineering Journal, vol. 183, pp. 1–9, 2012.
[14] H. Kusic, N. Koprivanac, A. L. Bozic, and I. Selanec, “Photo-assisted Fenton type processes for the degradation of phenol:a kinetic study,” Journal of Hazardous Materials, vol. 136, no.3, pp. 632–644, 2006.
[15] N. Kang, D. S. Lee, and J. Yoon, “Kinetic modeling of Fentonoxidation of phenol and monochlorophenols,” Chemosphere,vol. 47, no. 9, pp. 915–924, 2002.
[16] S. Chou, Y. H. Huang, S. N. Lee, G. H. Huang, and C.Huang, “Treatment of high strength hexamine-containingwastewater by Electro-Fenton method,” Water Research, vol.33, no. 3, pp. 751–759, 1999.
[17] D. F. Bishop, G. Stern, M. Fleischman, and L. S. Marshall,“Hydrogen peroxide catalytic oxidation of refractory organ-ics in municipal waste waters,” IandEC Process Design andDevelopment, vol. 7, no. 1, pp. 110–117, 1968.
[18] E. S. Henle and S. Linn, “Formation, prevention, and repairof DNA damage by iron/hydrogen peroxide,” Journal ofBiological Chemistry, vol. 272, no. 31, pp. 19095–19098, 1997.
[19] E. Neyens and J. Baeyens, “A review of classic Fenton’speroxidation as an advanced oxidation technique,” Journal ofHazardous Materials, vol. 98, no. 1–3, pp. 33–50, 2003.
[20] K. H. Kim, J. R. Kim, and S. K. Ihm, “Wet oxidation ofphenol over transition metal oxide catalysts supported onCe0.65Zr0.35O2 prepared by continuous hydrothermal synthe-sis in supercritical water,” Journal of Hazardous Materials, vol.167, no. 1–3, pp. 1158–1162, 2009.
[21] K. H. Kim and S. K. Ihm, “Heterogeneous catalytic wetair oxidation of refractory organic pollutants in industrial
International Journal of Photoenergy 13
wastewaters: a review,” Journal of Hazardous Materials, vol.186, no. 1, pp. 16–34, 2011.
[22] F. Arena, C. Italiano, A. Raneri, and C. Saja, “Mechanisticand kinetic insights into the wet air oxidation of phenolwith oxygen (CWAO) by homogeneous and heterogeneoustransition-metal catalysts,” Applied Catalysis B, vol. 99, no. 1-2, pp. 321–328, 2010.
[23] X. Domenech, W. F. Jardim, and M. I. Litter, “Procesos avan-zados de oxidacion para la eliminacion de contaminantes,” inEliminacion de contaminantes por fotocatalisis heterogenea, M.Blesa, Ed., pp. 3–26, CYTED, La Plata, Argentina, 2001.
[24] A. N. Soon and B. H. Hameed, “Heterogeneous catalytictreatment of synthetic dyes in aqueous media using Fentonand photo-assisted Fenton process,” Desalination, vol. 269,no. 1–3, pp. 1–16, 2011.
[25] S. Moreno, N. Sanabria, and R. Molina, “Chapter 4. Recenttendences in the synthesis of pillared clays for phenoloxidation,” in Focus on Water Resource Research, E. Heikkine,Ed., pp. 185–209, Nova Science Publischer, New York, NY,USA, 2008.
[26] T. S. R. Prasada Rao and G. Murali Dhar, Recent Advancedin Basic and Applied Aspects of Industrial Catalysis, ElsevierScience B. V., Amsterdam, The Netherlands, 1998.
[27] N. R. Sanabria, R. Molina, and S. Moreno, “Raschig ringsbased on pillared clays: efficient reusable catalysts for oxida-tion of phenol,” Journal of Advanced Oxidation Technologies,vol. 15, no. 1, pp. 117–124, 2012.
[28] J. K. Kim, F. Martinez, and I. S. Metcalfe, “The beneficialrole of use of ultrasound in heterogeneous Fenton-likesystem over supported copper catalysts for degradation ofp-chlorophenol,” Catalysis Today, vol. 124, no. 3-4, pp. 224–231, 2007.
[29] H. Hassan and B. H. Hameed, “Fe-clay as effective heteroge-neous Fenton catalyst for the decolorization of Reactive Blue4,” Chemical Engineering Journal, vol. 171, no. 3, pp. 912–918,2011.
[30] T. D. Nguyen, N. H. Phan, M. H. Do, and K. T. Ngo,“Magnetic Fe2MO4 (M:Fe, Mn) activated carbons: fabrica-tion, characterization and heterogeneous Fenton oxidationof methyl orange,” Journal of Hazardous Materials, vol. 185,no. 2-3, pp. 653–661, 2011.
[31] S. H. Tian, Y. T. Tu, D. S. Chen, X. Chen, and Y.Xiong, “Degradation of Acid Orange II at neutral pHusing Fe2(MoO4)3 as a heterogeneous Fenton-like catalyst,”Chemical Engineering Journal, vol. 169, no. 1–3, pp. 31–37,2011.
[32] M. Dukkanci, G. Gunduz, S. Yilmaz, and R. V. Prihod’ko,“Heterogeneous Fenton-like degradation of Rhodamine 6Gin water using CuFeZSM-5 zeolite catalyst prepared byhydrothermal synthesis,” Journal of Hazardous Materials, vol.181, no. 1–3, pp. 343–350, 2010.
[33] R. Idel-aouad, M. Valiente, A. Yaacoubi, B. Tanouti, andM. Lopez-Mesas, “Rapid decolourization and mineralizationof the azo dye C.I. Acid Red 14 by heterogeneous Fentonreaction,” Journal of Hazardous Materials, vol. 186, no. 1, pp.745–750, 2011.
[34] H. Kusic, N. Koprivanac, and I. Selanec, “Fe-exchangedzeolite as the effective heterogeneous Fenton-type catalystfor the organic pollutant minimization: UV irradiationassistance,” Chemosphere, vol. 65, no. 1, pp. 65–73, 2006.
[35] E. V. Kuznetsova, E. N. Savinov, L. A. Vostrikova, and V. N.Parmon, “Heterogeneous catalysis in the Fenton-type systemFeZSM-5/H2O2,” Applied Catalysis B, vol. 51, no. 3, pp. 165–170, 2004.
[36] G. B. Ortiz de la Plata, O. M. Alfano, and A. E. Cassano,“Decomposition of 2-chlorophenol employing goethite asFenton catalyst II: reaction kinetics of the heterogeneousFenton and photo-Fenton mechanisms,” Applied Catalysis B,vol. 95, no. 1-2, pp. 14–25, 2010.
[37] R. C. C. Costa, F. C. C. Moura, J. D. Ardisson, J. D. Fabris,and R. M. Lago, “Highly active heterogeneous Fenton-like systems based on Fe0/Fe3O4 composites prepared bycontrolled reduction of iron oxides,” Applied Catalysis B, vol.83, no. 1-2, pp. 131–139, 2008.
[38] F. C. C. Moura, M. H. Araujo, R. C. C. Costa et al.,“Efficient use of Fe metal as an electron transfer agentin a heterogeneous Fenton system based on Fe0/Fe3O4
composites,” Chemosphere, vol. 60, no. 8, pp. 1118–1123,2005.
[39] S.-P. Sun and A. T. Lemley, “P-Nitrophenol degradation bya heterogeneous Fenton-like reaction on nano-magnetite:process optimization, kinetics, and degradation pathways,”Journal of Molecular Catalysis A, vol. 349, no. 1-2, pp. 71–79,2011.
[40] F. Martınez, G. Calleja, J. A. Melero, and R. Molina, “Het-erogeneous photo-Fenton degradation of phenolic aqueoussolutions over iron-containing SBA-15 catalyst,” AppliedCatalysis B, vol. 60, no. 3-4, pp. 181–190, 2005.
[41] R. Molina, F. Martınez, J. A. Melero, D. H. Bremner, and A.G. Chakinala, “Mineralization of phenol by a heterogeneousultrasound/Fe-SBA-15/H2O2 process: multivariate study byfactorial design of experiments,” Applied Catalysis B, vol. 66,no. 3-4, pp. 198–207, 2006.
[42] P. Shukla, S. Wang, H. Sun, H. M. Ang, and M. Tade,“Adsorption and heterogeneous advanced oxidation of phe-nolic contaminants using Fe loaded mesoporous SBA-15 andH2O2,” Chemical Engineering Journal, vol. 164, no. 1, pp. 255–260, 2010.
[43] L. A. Galeano, M. A. Vicente, and A. Gil, “Treatment ofmunicipal leachate of landfill by fenton-like heterogeneouscatalytic wet peroxide oxidation using an Al/Fe-pillaredmontmorillonite as active catalyst,” Chemical EngineeringJournal, vol. 178, pp. 146–153, 2011.
[44] M. Luo, D. Bowden, and P. Brimblecombe, “Catalyticproperty of Fe-Al pillared clay for Fenton oxidation of phenolby H2O2,” Applied Catalysis B, vol. 85, no. 3-4, pp. 201–206,2009.
[45] C. B. Molina, J. A. Casas, J. A. Zazo, and J. J. Rodrıguez, “Acomparison of Al-Fe and Zr-Fe pillared clays for catalytic wetperoxide oxidation,” Chemical Engineering Journal, vol. 118,no. 1-2, pp. 29–35, 2006.
[46] J. G. Carriazo, E. Guelou, J. Barrault, J. M. Tatibouet, and S.Moreno, “Catalytic wet peroxide oxidation of phenol over Al-Cu or Al-Fe modified clays,” Applied Clay Science, vol. 22, no.6, pp. 303–308, 2003.
[47] J. Carriazo, E. Guelou, J. Barrault, J. M. Tatibouet, R. Molina,and S. Moreno, “Catalytic wet peroxide oxidation of phenolby pillared clays containing Al-Ce-Fe,” Water Research, vol.39, no. 16, pp. 3891–3899, 2005.
[48] J. Carriazo, E. Guelou, J. Barrault, J. M. Tatibouet, R. Molina,and S. Moreno, “Synthesis of pillared clays containing Al,Al-Fe or Al-Ce-Fe from a bentonite: characterization andcatalytic activity,” Catalysis Today, vol. 107-108, pp. 126–132,2005.
[49] J. G. Carriazo, M. A. Centeno, J. A. Odriozola, S. Moreno, andR. Molina, “Effect of Fe and Ce on Al-pillared bentonite andtheir performance in catalytic oxidation reactions,” AppliedCatalysis A, vol. 317, no. 1, pp. 120–128, 2007.

14 International Journal of Photoenergy
[50] J. G. Carriazo, R. Molina, and S. Moreno, “A study on Al andAl-Ce-Fe pillaring species and their catalytic potential as theyare supported on a bentonite,” Applied Catalysis A, vol. 334,no. 1-2, pp. 168–172, 2008.
[51] A. Perez, M. A. Centeno, J. A. Odriozola, R. Molina, and S.Moreno, “The effect of ultrasound in the synthesis of claysused as catalysts in oxidation reactions,” Catalysis Today, vol.133-135, no. 1–4, pp. 526–529, 2008.
[52] N. Sanabria, A. Alvarez, R. Molina, and S. Moreno, “Synthesisof pillared bentonite starting from the Al-Fe polymericprecursor in solid state, and its catalytic evaluation in thephenol oxidation reaction,” Catalysis Today, vol. 133-135, no.1–4, pp. 530–533, 2008.
[53] A. Olaya, S. Moreno, and R. Molina, “Synthesis of pillaredclays with Al13-Fe and Al13-Fe-Ce polymers in solid stateassisted by microwave and ultrasound: characterization andcatalytic activity,” Applied Catalysis A, vol. 370, no. 1-2, pp.7–15, 2009.
[54] A. Olaya, G. Blanco, S. Bernal, S. Moreno, and R. Molina,“Synthesis of pillared clays with Al-Fe and Al-Fe-Ce startingfrom concentrated suspensions of clay using microwavesor ultrasound, and their catalytic activity in the phenoloxidation reaction,” Applied Catalysis B, vol. 93, no. 1-2, pp.56–65, 2009.
[55] A. Olaya, S. Moreno, and R. Molina, “Synthesis of pillaredclays with aluminum by means of concentrated suspensionsand microwave radiation,” Catalysis Communications, vol. 10,no. 5, pp. 697–701, 2009.
[56] N. R. Sanabria, M. A. Centeno, R. Molina, and S. Moreno,“Pillared clays with Al-Fe and Al-Ce-Fe in concentratedmedium: synthesis and catalytic activity,” Applied Catalysis A,vol. 356, no. 2, pp. 243–249, 2009.
[57] N. R. Sanabria, R. Molina, and S. Moreno, “Effect ofultrasound on the structural and textural properties of Al-Fe pillared clays in a concentrated medium,” Catalysis Letters,vol. 130, no. 3-4, pp. 664–671, 2009.
[58] J. Barrault, C. Bouchoule, K. Echachoui, N. Frini-Srasra, M.Trabelsi, and F. Bergaya, “Catalytic wet peroxide oxidation(CWPO) of phenol over mixed (Al-Cu)-pillared clays,”Applied Catalysis B, vol. 15, no. 3-4, pp. 269–274, 1998.
[59] C. Catrinescu, C. Teodosiu, M. Macoveanu, J. Miehe-Brendle, and R. Le Dred, “Catalytic wet peroxide oxidationof phenol over Fe-exchanged pillared beidellite,” WaterResearch, vol. 37, no. 5, pp. 1154–1160, 2003.
[60] J. Barrault, M. Abdellaoui, C. Bouchoule et al., “Catalytic wetperoxide oxidation over mixed (Al-Fe) pillared clays,” AppliedCatalysis B, vol. 27, no. 4, pp. L225–L230, 2000.
[61] N. R. Sanabria, P. Avila, M. Yates, S. B. Rasmussen, R.Molina, and S. Moreno, “Mechanical and textural propertiesof extruded materials manufactured with AlFe and AlCeFepillared bentonites,” Applied Clay Science, vol. 47, no. 3-4, pp.283–289, 2010.
[62] J. Barrault, J. M. Tatibouet, and N. Papayannakos, “Catalyticwet peroxide oxidation of phenol over pillared clays contain-ing iron or copper species,” Comptes Rendus de l’Academie desSciences, vol. 3, no. 10, pp. 777–783, 2000.
[63] E. Guelou, J. Barrault, J. Fournier, and J. M. Tatibouet, “Activeiron species in the catalytic wet peroxide oxidation of phenolover pillared clays containing iron,” Applied Catalysis B, vol.44, no. 1, pp. 1–8, 2003.
[64] M. N. Timofeeva, S. T. Khankhasaeva, S. V. Badmaevaet al., “Synthesis, characterization and catalytic applicationfor wet oxidation of phenol of iron-containing clays,” AppliedCatalysis B, vol. 59, no. 3-4, pp. 243–248, 2005.
[65] E. E. Kiss, M. M. Lazic, and G. C. Boskovic, “AlFe-pillaredclay catalyst for phenol oxidation in aqueous solution,”Reaction Kinetics and Catalysis Letters, vol. 83, no. 2, pp. 221–227, 2004.
[66] J. Guo and M. Al-Dahhan, “Catalytic wet oxidation of phenolby hydrogen peroxide over pillared clay catalyst,” Industrialand Engineering Chemistry Research, vol. 42, no. 12, pp. 2450–2460, 2003.
[67] A. N. Nikolopoulos, O. Igglessi-Markopoulou, and N.Papayannakos, “Ultrasound assisted catalytic wet peroxideoxidation of phenol: kinetics and intraparticle diffusioneffects,” Ultrasonics Sonochemistry, vol. 13, no. 1, pp. 92–97,2006.
[68] J. M. Tatibouet, E. Guelou, and J. Fournier, “Catalyticoxidation of phenol by hydrogen peroxide over a pillaredclay containing iron. Active species and pH effect,” Topics inCatalysis, vol. 33, no. 1–4, pp. 225–232, 2005.
[69] S. Caudo, G. Centi, C. Genovese, and S. Perathoner, “Copper-and iron-pillared clay catalysts for the WHPCO of model andreal wastewater streams from olive oil milling production,”Applied Catalysis B, vol. 70, no. 1–4, pp. 437–446, 2007.
[70] R. B. Achma, A. Ghorbel, A. Dafinov, and F. Medina,“Copper-supported pillared clay catalysts for the wet hydro-gen peroxide catalytic oxidation of model pollutant tyrosol,”Applied Catalysis A, vol. 349, no. 1-2, pp. 20–28, 2008.
[71] S. Azabou, W. Najjar, M. Bouaziz, A. Ghorbel, and S. Sayadi,“A compact process for the treatment of olive mill wastewaterby combining wet hydrogen peroxide catalytic oxidation andbiological techniques,” Journal of Hazardous Materials, vol.183, no. 1–3, pp. 62–69, 2010.
[72] S. Caudo, C. Genovese, S. Perathoner, and G. Centi, “Copper-pillared clays (Cu-PILC) for agro-food wastewater purifica-tion with H2O2,” Microporous and Mesoporous Materials, vol.107, no. 1-2, pp. 46–57, 2008.
[73] G. Giordano, S. Perathoner, G. Centi et al., “Wet hydrogenperoxide catalytic oxidation of olive oil mill wastewatersusing Cu-zeolite and Cu-pillared clay catalysts,” CatalysisToday, vol. 124, no. 3-4, pp. 240–246, 2007.
[74] M. Pimentel, N. Oturan, M. Dezotti, and M. A. Oturan,“Phenol degradation by advanced electrochemical oxidationprocess electro-Fenton using a carbon felt cathode,” AppliedCatalysis B, vol. 83, no. 1-2, pp. 140–149, 2008.
[75] G. Busca, S. Berardinelli, C. Resini, and L. Arrighi, “Tech-nologies for the removal of phenol from fluid streams: ashort review of recent developments,” Journal of HazardousMaterials, vol. 160, no. 2-3, pp. 265–288, 2008.
[76] H. Ma, X. Zhang, Q. Ma, and B. Wang, “Electrochemical cat-alytic treatment of phenol wastewater,” Journal of HazardousMaterials, vol. 165, no. 1–3, pp. 475–480, 2009.
[77] H. H. P. Fang, D. W. Liang, T. Zhang, and Y. Liu, “Anaerobictreatment of phenol in wastewater under thermophiliccondition,” Water Research, vol. 40, no. 3, pp. 427–434, 2006.
[78] W. Kujawski, A. Warszawski, W. Ratajczak, T. Porebski,W. Capała, and I. Ostrowska, “Removal of phenol fromwastewater by different separation techniques,” Desalination,vol. 163, no. 1–3, pp. 287–296, 2004.
[79] A. Santos, P. Yustos, S. Gomis, G. Ruiz, and F. Garcia-Ochoa,“Reaction network and kinetic modeling of wet oxidation ofphenol catalyzed by activated carbon,” Chemical EngineeringScience, vol. 61, no. 8, pp. 2457–2467, 2006.
[80] M. Perez, F. Torrades, J. A. Garcıa-Hortal, X. Domenech,and J. Peral, “Removal of organic contaminants in paper
International Journal of Photoenergy 15
pulp treatment effluents under Fenton and photo-Fentonconditions,” Applied Catalysis B, vol. 36, no. 1, pp. 63–74,2002.
[81] M. G. Joshi and R. L. Shambaugh, “The kinetics of ozone-phenol reaction in aqueous solutions,” Water Research, vol.16, no. 6, pp. 933–938, 1982.
[82] A. M. Amat, A. Arques, F. Lopez, and M. A. Miranda, “Solarphoto-catalysis to remove paper mill wastewater pollutants,”Solar Energy, vol. 79, no. 4, pp. 393–401, 2005.
[83] S. Perathoner and G. Centi, “Wet hydrogen peroxide catalyticoxidation (WHPCO) of organic waste in agro-food andindustrial streams,” Topics in Catalysis, vol. 33, pp. 207–224,2005.
[84] I. U. Castro, D. C. Sherrington, A. Fortuny et al., “Synthesisof polymer-supported copper complexes and their evaluationin catalytic phenol oxidation,” Catalysis Today, vol. 157, no.1–4, pp. 66–70, 2010.
[85] N. Crowther and F. Larachi, “Iron-containing silicalites forphenol catalytic wet peroxidation,” Applied Catalysis B, vol.46, no. 2, pp. 293–305, 2003.
[86] N. Inchaurrondo, J. Cechini, J. Font, and P. Haure, “Strategiesfor enhanced CWPO of phenol solutions,” Applied CatalysisB, vol. 111-112, pp. 641–648, 2012.
[87] P. Massa, A. Dafinov, F. M. Cabello, and R. Fenoglio,“Catalytic wet peroxide oxidation of phenolic solutionsover Fe2O3/CeO2 and WO3/CeO2 catalyst systems,” CatalysisCommunications, vol. 9, no. 7, pp. 1533–1538, 2008.
[88] P. Massa, F. Ivorra, P. Haure, and R. Fenoglio, “Catalyticwet peroxide oxidation of phenol solutions over CuO/CeO2
systems,” Journal of Hazardous Materials, vol. 190, no. 1–3,pp. 1068–1073, 2011.
[89] G. Calleja, J. A. Melero, F. Martınez, and R. Molina, “Activityand resistance of iron-containing amorphous, zeolitic andmesostructured materials for wet peroxide oxidation ofphenol,” Water Research, vol. 39, no. 9, pp. 1741–1750, 2005.
[90] A. Quintanilla, A. F. Fraile, J. A. Casas, and J. J. Rodrıguez,“Phenol oxidation by a sequential CWPO-CWAO treatmentwith a Fe/AC catalyst,” Journal of Hazardous Materials, vol.146, no. 3, pp. 582–588, 2007.
[91] A. Rey, J. Carbajo, C. Adan et al., “Improved mineralizationby combined advanced oxidation processes,” Chemical Engi-neering Journal, vol. 174, no. 1, pp. 134–142, 2011.
[92] A. Rey, M. Faraldos, J. A. Casas, J. A. Zazo, A. Bahamonde,and J. J. Rodrıguez, “Catalytic wet peroxide oxidation ofphenol over Fe/AC catalysts: influence of iron precursor andactivated carbon surface,” Applied Catalysis B, vol. 86, no. 1-2,pp. 69–77, 2009.
[93] J. A. Zazo, J. A. Casas, A. F. Mohedano, and J. J. Rodrıguez,“Catalytic wet peroxide oxidation of phenol with a Fe/activecarbon catalyst,” Applied Catalysis B, vol. 65, no. 3-4, pp. 261–268, 2006.
[94] K. M. Valkaj, A. Katovic, and S. Zrncevic, “Investigation ofthe catalytic wet peroxide oxidation of phenol over differenttypes of Cu/ZSM-5 catalyst,” Journal of Hazardous Materials,vol. 144, no. 3, pp. 663–667, 2007.
[95] X. Zhong, J. Barbier, D. Duprez, H. Zhang, and S. Royer,“Modulating the copper oxide morphology and accessibilityby using micro-/mesoporous SBA-15 structures as hostsupport: effect on the activity for the CWPO of phenolreaction,” Applied Catalysis B, vol. 121-122, pp. 123–134,2012.
[96] S. Zhou, Z. Qian, T. Sun, J. Xu, and C. Xia, “Catalytic wetperoxide oxidation of phenol over Cu-Ni-Al hydrotalcite,”Applied Clay Science, vol. 53, no. 4, pp. 627–633, 2011.
[97] E. V. Parkhomchuk, M. P. Vanina, and S. Preis, “The activa-tion of heterogeneous Fenton-type catalyst Fe-MFI,” Cataly-sis Communications, vol. 9, no. 3, pp. 381–385, 2008.
[98] D. Tabet, M. Saidi, M. Houari, P. Pichat, and H. Khalaf,“Fe-pillared clay as a Fenton-type heterogeneous catalystfor cinnamic acid degradation,” Journal of EnvironmentalManagement, vol. 80, no. 4, pp. 342–346, 2006.
[99] F. Bergaya, A. Aouad, and T. Mandalia, “Chapter 7.5 Pillaredclays and clay minerals. Developments in clay science,” inHandbook of Clay Science, pp. 393–421, Elsevier, Amsterdam,The Netherlands, 2006.
[100] J. Barrault, C. Bouchoule, J. M. Tatibouet et al., “Catalyticwet peroxide oxidation over mixed (Al-Fe) pillared clays,” inStudies in Surface Science and Catalysis, A. Corma, F. V. Melo,S. Mendioroz, and J. L. Fierro, Eds., pp. 749–754, Elsevier,Amsterdam, The Netherlands, 2000.
[101] R. M. Barrer and D. M. Macleod, “Activation of montmoril-lonite by ion exchange and sorption complexes of tetra-alkylammonium montmorillonites,” Transactions of the FaradaySociety, vol. 51, pp. 1290–1300, 1955.
[102] R. A. Schoonheydt, T. Pinnavaia, G. Lagaly, and N. Gangas,“Pillared clays and pillared layered solids,” Pure and AppliedChemistry, vol. 71, no. 12, pp. 2368–2371, 1999.
[103] M. L. Occelli, J. A. Bertrand, S. A. C. Gould, and J. M.Dominguez, “Physicochemical characterization of a Texasmontmorillonite pillared with polyoxocations of aluminumPart I: the microporous structure,” Microporous and Meso-porous Materials, vol. 34, no. 2, pp. 195–206, 2000.
[104] J. P. Olivier and M. L. Occelli, “Surface area and microp-orosity of pillared rectorite catalysts from a hybrid densityfunctional theory method,” Microporous and MesoporousMaterials, vol. 57, no. 3, pp. 291–296, 2003.
[105] J. L. Valverde, A. Romero, R. Romero, P. B. Garcıa, M. L.Sanchez, and I. Asencio, “Preparation and characterization ofFe-PILCS. Influence of the synthesis parameters,” Clays andClay Minerals, vol. 53, no. 6, pp. 613–621, 2005.
[106] W. Diano, R. Rubino, and M. Sergio, “Al-pillared montmoril-lonite: preparation from concentrated slurries of homoionicCa clay, characterization and thermal stability,” MicroporousMaterials, vol. 2, no. 3, pp. 179–184, 1994.
[107] G. Fetter, G. Heredia, L. A. Velazquez, A. M. Maubert, andP. Bosch, “Synthesis of aluminum-pillared montmorillonitesusing highly concentrated clay suspensions,” Applied Cataly-sis A, vol. 162, no. 1-2, pp. 41–45, 1997.
[108] R. Molina, A. Vieira-Coelho, and G. Poncelet, “Hydroxy-Alpillaring of concentrated clay suspensions,” Clays and ClayMinerals, vol. 40, no. 4, pp. 480–482, 1992.
[109] P. Salerno and S. Mendioroz, “Preparation of Al-pillaredmontmorillonite from concentrated dispersions,” AppliedClay Science, vol. 22, no. 3, pp. 115–123, 2002.
[110] A. Sanchez and M. Montes, “Influence of the preparationparameters (particle size and aluminium concentration) onthe textural properties of Al-pillared clays for a scale-upprocess,” Microporous and Mesoporous Materials, vol. 21, no.1–3, pp. 117–125, 1998.
[111] L. Storaro, M. Lenarda, M. Perissinotto, V. Lucchini, and R.Ganzerla, “Hydroxy-Al pillaring of concentrated suspensionsof smectite clays,” Microporous and Mesoporous Materials, vol.20, no. 4–6, pp. 317–331, 1998.
[112] S. P. Katdare, V. Ramaswamy, and A. V. Ramaswamy, “Ultra-sonication: a competitive method of intercalation for thepreparation of alumina pillared montmorillonite catalyst,”Catalysis Today, vol. 49, no. 1–3, pp. 313–320, 1999.

16 International Journal of Photoenergy
[113] S. P. Katdare, V. Ramaswamy, and A. V. Ramaswamy, “Factorsaffecting the preparation of alumina pillared montmoril-lonite employing ultrasonics,” Microporous and MesoporousMaterials, vol. 37, no. 3, pp. 329–336, 2000.
[114] V. Singh, V. Sapehiyia, and G. L. Kad, “Ultrasound andmicrowave activated preparation of ZrO2-pillared clay com-posite: catalytic activity for selective, solventless acylation of1,n-diols,” Journal of Molecular Catalysis A, vol. 210, no. 1-2,pp. 119–124, 2004.
[115] G. Fetter, V. Hernandez, V. Rodrıguez, M. A. Valenzuela, V.H. Lara, and P. Bosch, “Effect of microwave irradiation timeon the synthesis of zirconia-pillared clays,” Materials Letters,vol. 57, no. 5-6, pp. 1220–1223, 2003.
[116] A. M. De Andres, J. Merino, J. C. Galvan, and E. Ruiz-Hitzky,“Synthesis of pillared clays assisted by microwaves,” MaterialsResearch Bulletin, vol. 34, no. 4, pp. 641–651, 1999.
[117] A. Aouad, T. Mandalia, and F. Bergaya, “A novel methodof Al-pillared montmorillonite preparation for potentialindustrial up-scaling,” Applied Clay Science, vol. 28, no. 1–4,pp. 175–182, 2005.
[118] C. B. Molina, J. A. Casas, A. H. Pizarro, and J. J. Rodriguez,“Pillared Clays as green chemistry catalysts: application towastewater treatment,” in Clay: Types, Properties and Uses,J. P. Humphrey and D. E. Boyd, Eds., pp. 435–474, NovaScience, New York, NY, USA, 2011.
[119] S. Moreno-Guaqueta, R. Molina-Gallego, N. R. Sanabria-Gonzalez, and A. J. Olaya-Avendano, “Procedimiento parala modificacion de arcilla con el sistema mixto Al-Fe o Al-Ce-Fe,” Patente IPC C 01 B 033/020, Superintendencia deIndustria y Comercio, Colombia, 2007.
[120] F. Mohino, A. B. Martin, P. Salerno, A. Bahamonde, and S.Mendioroz, “High surface area monoliths based on pillaredclay materials as carriers for catalytic processes,” Applied ClayScience, vol. 29, no. 2, pp. 125–136, 2005.
[121] L. F. Liotta, M. Gruttadauria, G. Di Carlo, G. Perrini, and V.Librando, “Heterogeneous catalytic degradation of phenolicsubstrates: catalysts activity,” Journal of Hazardous Materials,vol. 162, no. 2-3, pp. 588–606, 2009.
[122] C. Catrinescu, D. Arsene, and C. Teodosiu, “Catalytic wethydrogen peroxide oxidation of para-chlorophenol overAl/Fe pillared clays (AlFePILCs) prepared from different hostclays,” Applied Catalysis B, vol. 101, no. 3-4, pp. 451–460,2011.
[123] L. Chirchi and A. Ghorbel, “Use of various Fe-modifiedmontmorillonite samples for 4-nitrophenol degradation byH2O2,” Applied Clay Science, vol. 21, no. 5-6, pp. 271–276,2002.
[124] M. J. Hernando, C. Pesquera, C. Blanco, and F. Gonzalez,“Synthesis, characterization, and catalytic properties of pil-lared montmorillonite with aluminum/cerium polyoxyca-tions,” Chemistry of Materials, vol. 13, no. 6, pp. 2154–2159,2001.
[125] M. J. Hernando, C. Pesquera, C. Blanco, and F. Gonzalez,“Increase in thermal stability of the texture in montmo-rillonites pillared with aluminum/cerium polyoxocations,”Langmuir, vol. 18, no. 14, pp. 5633–5636, 2002.
[126] G. Fetter, P. Salas, L. A. Velazquez, and P. Bosch, “Ce-Al-pillared clays: synthesis, characterization, and catalytic per-formance,” Industrial and Engineering Chemistry Research,vol. 39, no. 6, pp. 1944–1949, 2000.
[127] S. K. Kim and S. K. Ihm, “Effects of Ce addition andPt precursor on the activity of Pt/Al2O3 catalysts for wet
oxidation of phenol,” Industrial and Engineering ChemistryResearch, vol. 41, no. 8, pp. 1967–1972, 2002.
[128] K. Al-Malah, M. O. J. Azzam, and N. I. Abu-Lail, “Olive millseffluent (OME) wastewater post-treatment using activatedclay,” Separation and Purification Technology, vol. 20, no. 2-3, pp. 225–234, 2000.
[129] J. Herney-Ramirez, M. A. Vicente, and L. M. Madeira,“Heterogeneous photo-Fenton oxidation with pillared clay-based catalysts for wastewater treatment: a review,” AppliedCatalysis B, vol. 98, no. 1-2, pp. 10–26, 2010.
[130] C. Pulgarin, M. Invernizzi, S. Parra, V. Sarria, R. Polania,and P. Peringer, “Strategy for the coupling of photochemicaland biological flow reactors useful in mineralization ofbiorecalcitrant industrial pollutants,” Catalysis Today, vol. 54,no. 2-3, pp. 341–352, 1999.
[131] R. Ben Achma, A. Ghorbel, S. Sayadi, A. Dafinov, and F.Medina, “A novel method of copper-exchanged aluminum-pillared clay preparation for olive oil mill wastewater treat-ment,” Journal of Physics and Chemistry of Solids, vol. 69, no.5-6, pp. 1116–1120, 2008.
[132] R. L. Lucier, The International Political Economy of Coffee:From Juan Valdez to Yank’s Diner, Praeger Publishers, NewYork, NY, USA, 1988.
[133] FNC, “Federacion Nacional de Cafeteros de Colombia.Colombia es cafe,” 2012, http://www.federaciondecafeteros.org/algrano-fnc-es/index.php/comments/colombia es cafe.
[134] H. N. Chanakya and A. A. P. De Alwis, “Environmentalissues and management in primary coffee processing,” ProcessSafety and Environmental Protection, vol. 82, no. 4 B, pp. 291–300, 2004.
[135] J. N. Wintgens and C. H. J. Brando, “Harvesting and greencoffee processing,” in Coffee: Growing, Processing, SustainableProduction: A Guidebook for Growers, Processors, Traders, andResearchers, J. N. Wintgens, Ed., pp. 610–723, Wiley-VCH,Weinheim, Germany, 2009.
[136] G. S. Duarte, A. A. Pereira, and A. Farah, “Chlorogenicacids and other relevant compounds in Brazilian coffeesprocessed by semi-dry and wet post-harvesting methods,”Food Chemistry, vol. 118, no. 3, pp. 851–855, 2010.
[137] N. Rodrıguez-Valencia and D. A. Zambrano-Franco, “Lossubproductos del cafe: fuente de energıa renovable,” AvancesTecnicos Cenicafe, no. 393, pp. 1–8, 2010.
[138] J. Field, “Aguas residuales del cafe,” in Arranque y operacion desistemas de flujo ascedente con mato de lodos—UASB, pp. H1–H11, Universidad del Valle-CVC, Santiago de Calı, Colombia,1987.
[139] N. Rodrıguez-Valencia, Estudio de un biosistema integradopara el postratamiento de las aguas residuales del cafeutilizando macrofitas acuaticas [Ph.D. thesis], UniversidadPolitecnica de Valencia, Valencia, Spain, 2009.
[140] D. A. Zambrano-Franco, N. Rodrıguez-Valencia, U. Lopez-Posada, P. A. Orozco-Restrepo, and A. J. Zambrano-Giraldo,“Tratamiento anaerobio de las aguas mieles del cafe,” BoletinTecnico Cenicafe, vol. 29, pp. 1–28, 2006.
[141] V. Matuk-Velasco, N. Rodrıguez-Valencia, and G. I. Puerta-Quintero, “El impacto biologico de los efluentes del beneficiohumedo de cafe,” Cenicafe, vol. 48, no. 4, pp. 234–252, 1997.
[142] R. Bello-Mendoza and M. F. Castillo-Rivera, “Start-up of ananaerobic hybrid (UASB/filter) reactor treating wastewaterfrom a coffee processing plant,” Anaerobe, vol. 4, no. 5, pp.219–225, 1998.
[143] F. R. L. Fia, A. T. Matos, A. C. Borges, R. Fia, and P. R. Cecon,“Treatment of wastewater from coffee bean processing inanaerobic fixed bed reactors with different support materials:

International Journal of Photoenergy 17
performance and kinetic modeling,” Journal of Environmen-tal Management, vol. 108, pp. 14–21, 2012.
[144] M. Selvamurugan, P. Doraisamy, and M. Maheswari, “Anintegrated treatment system for coffee processing wastewaterusing anaerobic and aerobic process,” Ecological Engineering,vol. 36, no. 12, pp. 1686–1690, 2010.
[145] “Decreto 1594 del 26 de junio de 1984, por el cual sereglamenta parcialmente el Tıtulo 1 de la Ley 9 de 1979,ası como el Capıtulo II del Tıtulo VI -Parte III- LibroII y el Tıtulo III de la Parte 111 -Libro I-del Decreto—Ley 2811 de 1974 en cuanto a usos del agua y residuoslıquidos,” Ministerio de Agricultura de Colombia, BogotaDC, Colombia, 1984.
[146] M. N. Clifford, S. Knight, B. Surucu, and N. Kuhn-ert, “Characterization by LC-MSn of four new classes ofchlorogenic acids in green coffee beans: dimethoxycinna-moylquinic acids, diferuloylquinic acids, caffeoyl-dime-thoxycinnamoylquinic acids, and feruloyl- dimethoxycin-namoylquinic acids,” Journal of Agricultural and Food Chem-istry, vol. 54, no. 6, pp. 1957–1969, 2006.
[147] R. Jaiswal, M. A. Patras, P. J. Eravuchira, and N. Kuhnert,“Profile and characterization of the chlorogenic acids ingreen Robusta coffee beans by LC-MSn: identification ofseven new classes of compounds,” Journal of Agricultural andFood Chemistry, vol. 58, no. 15, pp. 8722–8737, 2010.
[148] S. Azabou, W. Najjar, A. Gargoubi, A. Ghorbel, and S. Sayadi,“Catalytic wet peroxide photo-oxidation of phenolic oliveoil mill wastewater contaminants. Part II. Degradation anddetoxification of low-molecular mass phenolic compoundsin model and real effluent,” Applied Catalysis B, vol. 77, no.1-2, pp. 166–174, 2007.
[149] S. Parra, J. Olivero, L. Pacheco, and C. Pulgarin, “Structuralproperties and photoreactivity relationships of substitutedphenols in TiO2 suspensions,” Applied Catalysis B, vol. 43, no.3, pp. 293–301, 2003.
[150] J. A. Peres, J. R. Domınguez, and J. Beltran-Heredia,“Reaction of phenolic acids with Fenton-generated hydroxylradicals: hammett correlation,” Desalination, vol. 252, no. 1–3, pp. 167–171, 2010.
[151] V. L. Singleton and J. A. Rossi, “Colorimetry of total pheno-lics with phosphomolybdicphosphotungstic acid reagents,”American Journal of Enology and Viticulture, vol. 16, no. 3,pp. 144–158, 1965.
[152] V. L. Singleton, R. Orthofer, and R. M. Lamuela-Raventos,“Analysis of total phenols and other oxidation substrates andantioxidants by means of folin-ciocalteu reagent,” Methods inEnzymology, vol. 299, pp. 152–178, 1998.
[153] T. Zayas Perez, G. Geissler, and F. Hernandez, “Chemicaloxygen demand reduction in coffee wastewater throughchemical flocculation and advanced oxidation processes,”Journal of Environmental Sciences, vol. 19, no. 3, pp. 300–305,2007.

Hindawi Publishing CorporationInternational Journal of PhotoenergyVolume 2012, Article ID 531076, 11 pagesdoi:10.1155/2012/531076
Research Article
Photo-Fenton and Fenton Oxidation of RecalcitrantIndustrial Wastewater Using Nanoscale Zero-Valent Iron
Henrik Hansson,1 Fabio Kaczala,1 Marcia Marques,1, 2 and William Hogland1
1 School of Natural Sciences, Linnaeus University (LNU), Landgangen 3, 392 82 Kalmar, Sweden2 Department of Sanitary and Environmental Engineering, Rio de Janeiro State University (UERJ),Sao Francisco Xavier 524, 20551-013 Rio de Janeiro, RJ, Brazil
Correspondence should be addressed to Marcia Marques, [email protected]
Received 1 June 2012; Revised 20 August 2012; Accepted 7 September 2012
Academic Editor: Manickavachagam Muruganandham
Copyright © 2012 Henrik Hansson et al. This is an open access article distributed under the Creative Commons AttributionLicense, which permits unrestricted use, distribution, and reproduction in any medium, provided the original work is properlycited.
There is a need for the development of on-site wastewater treatment technologies suitable for “dry-process industries,” such as thewood-floor sector. Due to the nature of their activities, these industries generate lower volumes of highly polluted wastewatersafter cleaning activities. Advanced oxidation processes such as Fenton and photo-Fenton, are potentially feasible options fortreatment of these wastewaters. One of the disadvantages of the Fenton process is the formation of large amounts of ferrousiron sludge, a constraint that might be overcome with the use of nanoscale zero-valent iron (nZVI) powder. Wastewater froma wood-floor industry with initial COD of 4956 mg/L and TOC of 2730 mg/L was treated with dark-Fenton (nZVI/H2O2) andphoto-Fenton (nZVI/H2O2/UV) applying a 2-level full-factorial experimental design. The highest removal of COD and TOC(80% and 60%, resp.) was achieved using photo-Fenton. The supply of the reactants in more than one dose during the reactiontime had significant and positive effects on the treatment efficiency. According to the results, Fenton and mostly photo-Fenton arepromising treatment options for these highly recalcitrant wastewaters. Future investigations should focus on optimizing treatmentprocesses and assessing toxic effects that residual pollutants and the nZVI might have. The feasibility of combining advancedoxidation processes with biological treatment is also recommended.
1. Introduction
The discharge of industrial wastewaters into either municipalsewerage system or directly into recipient water bodies hasraised serious concerns during decades, leading to intensiveresearch and development of on-site treatment technologiesfor industrial wastewater. However, whereas investigationshave been focusing on industrial sectors that have wateras an important input to their manufacturing processes,“dry-process industries” such as wood-floor and wood-furniture industries that have no water requirement in theirproduction processes have been neglected [1, 2]. Theseindustries generate wastewaters during cleaning and washingof machinery, surfaces, and floors and regardless of theirrelatively low volumes these cleaning wastewaters have veryhigh chemical oxygen demand (COD) that varies from 3200to 50,000 mg L−1 and the presence of recalcitrant organic
compounds is a limiting factor for biological treatment inconventional centralized treatment plants. Dilution of 50times or more with drinking water has been a commonpractice before discharging these wastewaters into the sewagesystem, which is not a sustainable strategy for the 21st cen-tury. The treatment of wastewaters from the timber industryusing chemical methods has shown limited efficiency [3].The use of biological treatment [1] and sorption/filtrationprocesses [2] has also shown limitations when the mainpurpose is to comply with established standards for dis-charges into recipient water bodies. Advanced oxidationprocesses (AOPs) have previously been used to treat com-plex wastewaters in combinations with biological and/orchemical treatment. These studies have used AOP eitherafter biological treatments to handle the most recalcitrantsubstances [4, 5] or before with the purpose of reducingtoxicity, when the wastewater is too toxic for biological

2 International Journal of Photoenergy
treatment [6, 7]. The Fenton reaction was first observed by H.J. Fenton in 1894 and is described as the enhanced oxidativepower of H2O2 when using iron (Fe) as a catalyst underacidic conditions. It was later found that this enhancementwas due to the generation of hydroxyl radical (HO•) [8]that is one of the strongest oxidants (E = 2.73 V), andit is nonselective and capable of quickly oxidizing a broadrange of organic pollutants [9]. AOPs are based on thegeneration of these very reactive species, which are themain oxidizing species in the Fenton process [10]. TheFenton’s reagent alone or in combination has proven to bean effective way to degrade organic pollutants [11–13] and ithas been used for the treatment of a wide variety of industrialwastewaters [14–16]. The Fenton process is a relativelyeconomical method since it requires no additional energywhen compared to many other AOPs. Furthermore, bothiron and hydrogen peroxide are relatively cheap and safe.In the Fenton process, there is no mass transfer limitation,except during coagulation when high dose of the activatorferrous salt is needed [17]. The Fenton process is wellknown [18]. Iron (Fe) will in aqueous solution under acidicconditions oxidize to Fe2+ [19], which initiates the Fentonreaction:
2Fe0 + 2H2O −→ Fe2+ + H2 + 2OH− (1)
The Fenton reaction is characterized by the catalyticdecomposition of H2O2 as described below [20]:
Fe2+ + H2O2 −→ Fe3+ + OH− + OH• (2)
The hydroxyl radicals created by the process can bescavenged by excess Fe2+ [20]:
OH• + Fe2+ −→ OH− + Fe3+ (3)
This conventional Fenton process may be positively assis-ted by the application of UV-light [20]:
Fe3+ + H2O + hv −→ OH• + Fe2+ + H+ (4)
Photo-Fenton oxidation in the presence of short UV light(UV-C, 180–290 nm) [21] gives a faster oxidation as a conse-quence of the higher quantum yields [12]. When applyingUV-C light, H2O2 can also be hydrolysed contributing tothe HO• formation [8]. The disadvantages of the Fentonprocess include (i) the formation of a high concentrationof anions in the treated wastewater and (ii) large amountsof ferrous iron sludge [22]. Recent studies have attemptedto overcome these drawbacks by applying nZVI togetherwith H2O2 for industrial wastewater treatment [19, 23].This alternative process could overcome the disadvantagesassociated with Fe2+-based AOPs by using the solid formof iron instead of Fe2+ as iron salts. During the last decadethere has been a widespread development of nanomaterialsfor both industrial and domestic use. When the dimensionsof a piece of solid material become very small, its physicaland chemical properties become very different from those ofthe same material in larger bulk form [24]. Nanoparticles asa subset of nanomaterial is currently defined by consensus
Table 1: Wastewater characterization (n = 3).
Parameter Value Mixture∗
pH 2.3 ± 0.5 2.2
Conductivity (mS/cm) 6.3 ± 0.6 5.9
COD (mg/L) 5102 ± 513 4956
TOC (mg/L) 2,801 ± 287 2730∗
Wastewater obtained from a mixture of these three characterized samples.
as single particles with a diameter < 100 nm [24]. Thesmall particle size increases the proportion of atoms locatedat the surface increasing the possibility for the atoms toadsorb, interact, and react with other atoms and molecules[25]. The particles have also the capacity to remain insuspension [25] and, hence, aqueous slurries containingnZVI can easily be pumped and injected where needed. ThenZVI has been mostly used for groundwater remediationand treatment of specific pollutants [25]. Additionally, thetreatment of industrial wastewater using nZVI in Fentonand other processes has also been reported recently [26,27].
The main objective of this investigation was two-folded:(i) to verify the technical feasibility of treating wastewatersgenerated in the wood-floor industry sector using Fentonwith nZVI compared to photo-Fenton with nZVI and (ii)to verify the effects of the selected variables (H2O2/CODratio, H2O2/nZVI ratio and dosing mode) on the treatmentefficiency.
2. Materials and Methods
2.1. Wastewater Samples. The wastewater used in the currentinvestigation was a mixture of different streams of realindustrial wastewater generated during cleaning proceduresin a wood-floor industry in Nybro, Sweden. The qualityand quantity of these wastewaters vary in time, as they aremanually and intermittently generated as a consequenceof different manufacturing processes such as wood gluing,wood filling, cleaning of floors, blade sharpening, and others.These wastewaters are characterized by the presence offormaldehyde, nitrogen [1], metals [28] detergents, and,phenols [29]. At the factory, the wastewater mixture is keptin a full-scale on-site settling/sedimentation tank from wherethe samples for lab studies were taken. Wastewater sampleswere obtained at three different occasions and transported tothe laboratory where they were stored at −20◦C.
In order to obtain an average composition of thewastewater, a mixture of similar proportion of the threesamples stored in the lab (1 : 1 : 1) was prepared. This mixturewas then filtered with a Munktell OOR grade filter paperwith a pore size >10 μm to homogenize the wastewater. Thecharacteristics of the wastewater used in the experiments areshown in Table 1. Proxy indicators such as TOC and CODwere considered suitable to monitor treatability studies ofthis wastewater, since it is well known that these variables aswell as the ratio between them are appropriate to evaluate theefficiency of treatment options [30, 31].

International Journal of Photoenergy 3
Table 2: Variable levels applied in the 2-level factorial design.
Variables Symbol −1 0 +1
H2O2 : COD χ1 2 : 1 3.5 : 1 5 : 1
H2O2 : nZVI χ2 2 : 1 8.5 : 1 15 : 1
Dosing mode χ3 1 2 3
Notations: +1(high level); 0 (centre point); −1 (lower level).
2.2. Experimental Design. To have a better understandingon which independent variables play important roles on thetreatment efficiency measured as percentage reduction ofCOD and TOC (dependent variables), it was applied a two-level full-factorial design with triplicates of the central pointswith the following selected independent variables or factors:(1) H2O2 : COD ratio; (2) H2O2 : nZVI ratio and; (3) thedosing mode. By dosing mode one means the procedure ofadding equal aliquots of the oxidizing agent (H2O2) and thecatalyst (nZVI) at different times throughout the experimentor adding it at once. The levels used for each factor inthis investigation (Table 2) were selected according to theliterature.
The AOS (average oxidation state) value was calculatedusing the COD and TOC data obtained by the above-described experimental design. The AOS value can attaina value between +4, for CO2, and −4, for CH4, the mostoxidized and the most reduced state of carbon (C). The AOSvalue is a rough parameter to estimate the degree of oxidationin a mixed wastewater and was calculated according to thefollowing [31]:
AOS = 4(TOC− COD)TOC
, (5)
where COD and TOC values are expressed in mol O2/L andC/L, respectively.
The statistical software Minitab 16 was used to setup thefull factorial design. For statistical analysis Minitab 16 andGraphPad Prism 5 were used.
2.3. Experimental Setup. Two variations of Fenton treatmentwere investigated: dark-Fenton (nZVI/H2O2) and photo-Fenton (nZVI/H2O2/UV), using, in both cases, commercialnZVI. The commercial nZVI powder consisted of Fe0 surfacestabilized nanoparticles coated with a thin inorganic surfacelayer, which makes it possible long-term storage as themanufacturer delivers it. The material had particle sizesranging between 20–100 nm with an average of 50 nmaccording to the manufacturer (Nano Iron, s.r.o., CzechRepublic). The photo-Fenton studies were carried out ina glass-jacket immersion-type UV-reactor (UV-ConsultingPeschl Mainz, Germany) with a volume of 0.7 L (Figure 1).The distance between the UV-lamp and the liquid phase was15 mm. The reactor was cooled down with distilled water tokeep the liquid phase at room temperature of around 22◦C.The UV-light was emitted at a 150 W in wavelengths rangingbetween 250 and 580 nm with the highest peaks at 310, 360,400, 440, 550, and 580 nm.
Magnetic stirrer
UVpower unit
Magnet
Inlet cooling water
Outlet cooling water
UV
-lam
pC
oolin
g ja
cket
Water level
Sampling port
Figure 1: Schematic view of the UV-reactor used in the photo-Fenton experiments.
The dark-Fenton studies were conducted in 1 L glassbeakers. The difference between standard glass beaker andthe UV-reactor with the light in the off-mode was considerednegligible according to the literature [32, 33]. Air purgingwas not considered in this study in order to keep treatmentoperational costs as low as possible. All glassware wascarefully washed before each experiment.
2.4. Experimental Procedure. All runs were conducted witha volume of 0.5 L of wastewater that was agitated during120 min by a magnetic stirrer at 400 rpm. The pH wasadjusted at the beginning of each run to be kept between2.95 and 3.05. Since this pH range has been reportedto be the optimum for Fenton oxidation [13, 34], every15 min throughout the 120 min of reaction time the pH wasreadjusted if needed. All pH adjustments were done withanalytical grade sodium hydroxide (NaOH) and hydrochlo-ric acid (HCl). The total amounts of nZVI and H2O2 wereadded either at the beginning of each run or in similaraliquots, at different time intervals (Table 3). The nZVI wasadded as slurry formed by 1 : 4 nZVI powder and water, afterbeing stirred in a high speed sheerer for 5 min, according tothe manufacturer’s instructions.
During the photo-Fenton treatment, the wastewater wasexposed to UV-light during the treatment time of 120 min.After both Fenton and photo-Fenton treatments of 120 min,the pH of the wastewater was adjusted to 6.5 and agitated for5 min at 400 rpm to quench the Fenton reaction [35]. In asequence, 5 min after the agitation was stopped, the pH wasraised to 8.5 to form iron precipitates [35]. The supernatantwas then heated to 50◦C and slowly shaken in a water bathfor 30 min to expel any remaining H2O2. The water was then

4 International Journal of Photoenergy
Ta
ble
3:D
osin
gm
odes
(th
ew
ayth
eH
2O
2an
dn
ZV
Iw
ere
adde
ddu
rin
gth
eru
ns)
.
Sam
ple
nu
mbe
r∗To
tala
mou
nt
ofH
2O
2(g
/L)
Tota
lam
oun
tof
nZ
VI
(g/L
)N
um
ber
ofeq
ual
dose
s
0m
in40
min
60m
in80
min
120
min
H2O
2(g
/L)
nZ
VI
(g/L
)H
2O
2(g
/L)
nZ
VI(
g/L
)H
2O
2(g
/L)
nZ
VI
(g/L
)H
2O
2(g
/L)
nZ
VI
(g/L
)
1.1;
2.1;
3.1;
4.1
24,8
1,7
124
,81,
7—
——
——
—
1.2;
2.2;
3.2;
4.2
9,9
0,7
19,
90,
7—
——
——
—
1.3;
2.3;
3.3;
4.3
17,3
2,0
28,
71,
0—
—8,
71,
0—
—
1.4;
2.4;
3.4;
4.4
17,3
2,0
28,
71,
0—
—8,
71,
0—
—
1.5;
2.5;
3.5;
4.5
9,9
0,7
33,
30,
23,
30,
2—
—3,
30,
21.
6;2.
6;3.
6;4.
69,
95,
03
3,3
1,7
3,3
1,7
——
3,3
1,7
Full
trea
tmen
tti
me
1.7;
2.7;
3,7;
4.7
17,3
2,0
28,
71,
0—
—8,
71,
0—
—
1.8;
2.8;
3.8;
4.8
24,8
1,7
38,
30,
68,
30,
6—
—8,
30,
6
1.9;
2.9;
3.9;
4.9
24,8
12,4
38,
34,
18,
34,
1—
—8,
34,
1
1.10
;2.1
0;3.
10;4
.10
24,8
12,4
124
,812
,4—
——
——
—
1.11
;2.1
1;3.
11;4
.11
9,9
5,0
19,
95,
0—
——
——
—∗
Trea
tmen
tsfr
om1.
1to
1.11
:dar
k-Fe
nto
n;f
rom
2.1
to2.
11:P
hot
o-Fe
nto
n.

International Journal of Photoenergy 5
Table 4: COD and TOC reductions (%) with dark-Fenton and photo-Fenton experiments.
Coded variables Dark-Fenton Photo-Fenton
χ1 χ2 χ3 Run % COD reduction % TOC reduction Run % COD reduction % TOC reduction
+1 +1 −1 1.1 42.6 21.4 2.1 78.4 59.4
−1 +1 −1 1.2 34.6 17.3 2.2 70.6 50.0
0 0 0 1.3 42.0 21.4 2.3 80.5 57.8
0 0 0 1.4 39.3 19.9 2.4 78.2 56.7
−1 +1 +1 1.5 35.6 19.0 2.5 77.6 56.0
−1 −1 +1 1.6 35.1 18.9 2.6 76.1 53.9
0 0 0 1.7 38.4 24.2 2.7 61.3 61.7
+1 +1 +1 1.8 43.5 23.0 2.8 60.3 61.7
+1 −1 +1 1.9 77.5 50.3 2.9 81.6 61.6
+1 −1 −1 1.10 49.2 34.9 2.10 78.5 58.0
−1 −1 −1 1.11 38.3 24.7 2.11 70.9 53.6
centrifuged at 614 g for 15 min. After this, the supernatantwas separated and all samples were frozen before analysis.
2.5. Analytical Methods. COD and TOC in the wastewatersamples were analysed spectrophotometrically using HachLange cuvette tests (Hach Lange, Dusseldorf) and measuredwith a Hach Lange DR 5000 spectrophotometer (HachLange, Dusseldorf). The pH and conductivity were measuredwith an HQ40d multiparameter meter.
3. Results and Discussion
3.1. Comparison between Fenton and Photo-Fenton
3.1.1. nZVI Fenton Treatment. The treatments based ondark-Fenton (Table 4 and Figures 2(a) and 2(b)) showedlarge variation in the responses measured as the COD andTOC removal percentages. As observed in Table 4, theremoval of COD and TOC varied from 34% to 77% and from17% to 50%, respectively, depending on the run indicatingthat the ranges of H2O2 : COD; H2O2 : nZVI and dosingmodes combined in different ways have played an importantrole on the COD and TOC removal. There was a significantdifference between COD and TOC reduction % within thedark-Fenton and photo-Fenton processes (paired t-test, P <0.05) as illustrated in Table 4.
The highest reductions for both COD and TOC wereachieved with a setup using high H2O2 : COD ratios andlow H2O2 : nZVI ratio (run 1.9 in Table 4 and 9 inFigure 2(a)), indicating that higher concentrations of theoxidizing agent (H2O2) and the catalyst were able to oxidizea higher amount of COD and TOC, despite the fact thathigh concentrations of nZVI will possibly scavenge hydroxylradicals. The stoichiometric ratio for the reduction of CODby H2O2 is 2.125 which is calculated assuming the completeoxidation of COD [36]:
1 g COD = 1 g O2 = 0.03125 mol O2
= 0.0625 mol H2O2 = 2.125 g H2O2,(6)
(see [36]).
The results have shown that the amount of H2O2 toachieve the best treatment efficiency was twice as muchthe amounts stoichiometrically required. However suchoccurrences can be due to several factors that need tobe further investigated. An important aspect regarding theFenton treatment is the reduction of Fe3+ to Fe2+ makingcrucial the presence of reaction intermediates able to reduceFe3+ and regenerate the catalyst. However, there are reactionintermediates that instead of reducing the Fe3+ remove itfrom the Fe2+/Fe3+ cycle, due to the generation of ironcomplexes, delaying and/or inhibiting the oxidation process[18]. Regardless the use of higher amounts of H2O2 incomparison to the stoichiometric need, the H2O2 : CODratio of 5 : 1 was in a range similar to that reported as beingeffective in previous studies [14, 18]. On the other hand theH2O2 : nZVI ratio of 2 : 1 was lower than the values found inliterature [12, 18, 37].
When analysing the amount of oxidizing agent H2O2
per unit of COD removed (g H2O2/g COD removed) usedin different treatments in Figure 2(b), other treatments canbe considered economically more feasible (runs 1.2, 1.5, 1.6,and 1.11 in Table 4; respectively 2, 5, 6, and 11 in Figure 2(b)).But run 1.9 was much more efficient in terms of CODremoval and it was not considerably worse than the othersabove mentioned regarding g H2O2/g COD removed.
3.1.2. nZVI Photo-Fenton Treatment. The results regardingCOD and TOC removals with photo-Fenton have shown thatthe addition of the UV energy has significantly increasedthe treatment efficiency compared to dark-Fenton (pairedt-test, P < 0.05) (Figures 3(a) and 3(b)). Furthermore,it was observed that during the photo-Fenton process, thereductions of COD and TOC were more homogenous incomparison to those observed for the dark-Fenton treatment(Table 4; Figures 2(c) and 2(d)).
The increase of TOC reduction was significantly higherthan the increase of COD reduction by photo-Fenton(Figure 3(c)). A significant difference was observed betweenthe reductions (in %) of COD and TOC with photo-Fentontreatment (paired t-test, P < 0.05).
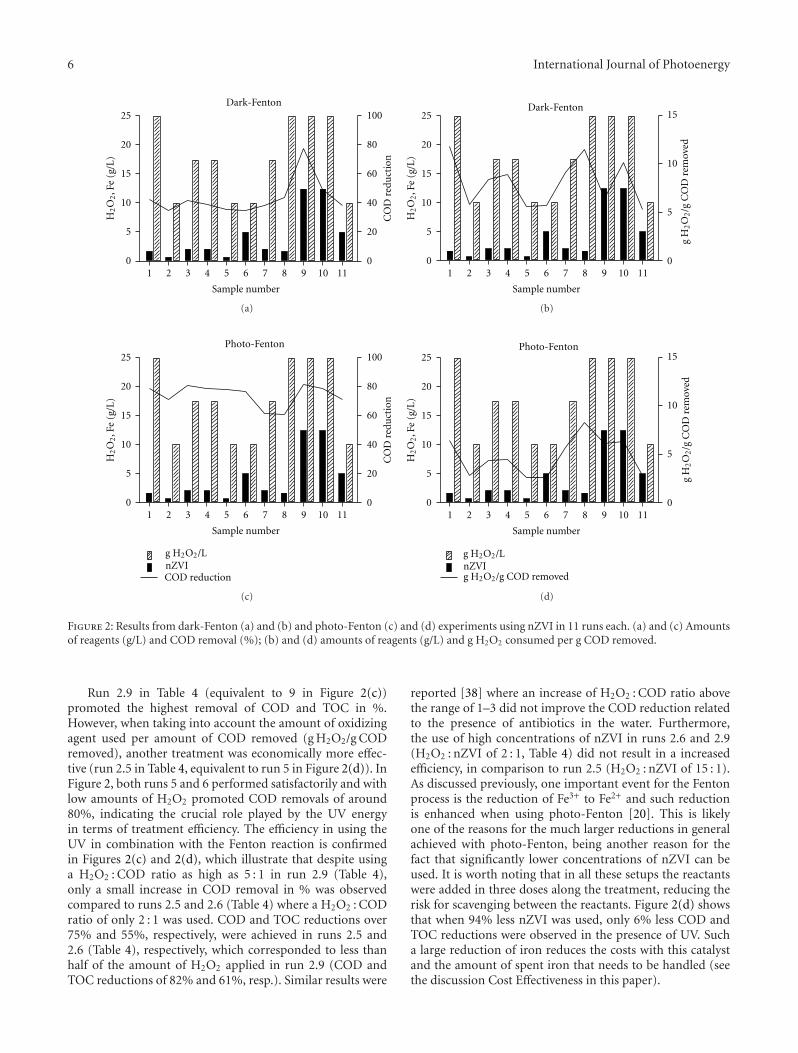
6 International Journal of Photoenergy
Dark-Fenton
Sample number
1 2 3 4 5 6 7 8 9 10 110
5
10
15
20
25
0
20
40
60
80
100H
2O
2, F
e (g
/L)
CO
D r
edu
ctio
n
(a)
Dark-Fenton
5
10
15
Sample number
1 2 3 4 5 6 7 8 9 10 110
5
10
15
20
25
0
H2O
2, F
e (g
/L)
g H
2O
2/g
CO
D r
emov
ed
(b)
Photo-Fenton
Sample number
1 2 3 4 5 6 7 8 9 10 110
5
10
15
20
25
0
20
40
60
80
100
H2O
2, F
e (g
/L)
CO
D r
edu
ctio
n
g H2O2/LnZVICOD reduction
(c)
Photo-Fenton
g H2O2/LnZVI
5
10
15
Sample number
1 2 3 4 5 6 7 8 9 10 110
5
10
15
20
25
0
H2O
2, F
e (g
/L)
g H2O2/g COD removed
g H
2O
2/g
CO
D r
emov
ed
(d)
Figure 2: Results from dark-Fenton (a) and (b) and photo-Fenton (c) and (d) experiments using nZVI in 11 runs each. (a) and (c) Amountsof reagents (g/L) and COD removal (%); (b) and (d) amounts of reagents (g/L) and g H2O2 consumed per g COD removed.
Run 2.9 in Table 4 (equivalent to 9 in Figure 2(c))promoted the highest removal of COD and TOC in %.However, when taking into account the amount of oxidizingagent used per amount of COD removed (g H2O2/g CODremoved), another treatment was economically more effec-tive (run 2.5 in Table 4, equivalent to run 5 in Figure 2(d)). InFigure 2, both runs 5 and 6 performed satisfactorily and withlow amounts of H2O2 promoted COD removals of around80%, indicating the crucial role played by the UV energyin terms of treatment efficiency. The efficiency in using theUV in combination with the Fenton reaction is confirmedin Figures 2(c) and 2(d), which illustrate that despite usinga H2O2 : COD ratio as high as 5 : 1 in run 2.9 (Table 4),only a small increase in COD removal in % was observedcompared to runs 2.5 and 2.6 (Table 4) where a H2O2 : CODratio of only 2 : 1 was used. COD and TOC reductions over75% and 55%, respectively, were achieved in runs 2.5 and2.6 (Table 4), respectively, which corresponded to less thanhalf of the amount of H2O2 applied in run 2.9 (COD andTOC reductions of 82% and 61%, resp.). Similar results were
reported [38] where an increase of H2O2 : COD ratio abovethe range of 1–3 did not improve the COD reduction relatedto the presence of antibiotics in the water. Furthermore,the use of high concentrations of nZVI in runs 2.6 and 2.9(H2O2 : nZVI of 2 : 1, Table 4) did not result in a increasedefficiency, in comparison to run 2.5 (H2O2 : nZVI of 15 : 1).As discussed previously, one important event for the Fentonprocess is the reduction of Fe3+ to Fe2+ and such reductionis enhanced when using photo-Fenton [20]. This is likelyone of the reasons for the much larger reductions in generalachieved with photo-Fenton, being another reason for thefact that significantly lower concentrations of nZVI can beused. It is worth noting that in all these setups the reactantswere added in three doses along the treatment, reducing therisk for scavenging between the reactants. Figure 2(d) showsthat when 94% less nZVI was used, only 6% less COD andTOC reductions were observed in the presence of UV. Sucha large reduction of iron reduces the costs with this catalystand the amount of spent iron that needs to be handled (seethe discussion Cost Effectiveness in this paper).

International Journal of Photoenergy 7
CO
D r
edu
ctio
n (
%)
Dark-Fenton Photo-Fenton0
20
40
60
80
100
(a)
Dark-Fenton Photo-Fenton0
20
40
60
80
100
TO
C r
edu
ctio
n (
%)
(b)
0
20
40
60
80
100
Incr
ease
in r
edu
ctio
n b
y ph
oto-
Fen
ton
(%
)
COD TOC
(c)
Dark-Fenton Photo-Fenton
CO
D/T
OC
0
0.5
1
1.5
2
Untreated
(d)
Figure 3: Boxplots built up with data from COD and TOC values obtained with dark-Fenton and photo-Fenton treatments. (a) CODreduction (in %) with both treatments; (b) TOC reduction (in %) with both treatments; (c) increase (in %) in the percentage of COD andTOC reduction by photo-Fenton compared to dark-Fenton; (d) changes in COD/TOC ratio due to different treatments.
3.1.3. Oxidation and Mineralisation. The results have shownthat the COD and TOC values after both dark- and photo-Fenton treatments were considerably different as indicatedby the COD/TOC ratios (Figure 3(d)). There was nosignificant difference in COD/TOC ratios when comparingphoto-Fenton and dark-Fenton; however, COD/TOC ratiosdecreased after treatment. As illustrated in Figure 4, whereasnegative correlations were found between COD and TOCreduction (in %) and COD/TOC ratio (R2 = 0.86 and0.62, resp.) for the dark-Fenton experiments, only CODremoval (in %) was correlated with COD/TOC ratio (R2 =0.92) in the photo-Fenton investigation. The correlationbetween TOC removal (in %) and COD/TOC for photo-Fenton had coefficient of determination as low as R2 = 0.18.These results suggest that the remaining organic compoundsmeasured as TOC were very recalcitrant and difficult todegrade as indicated by very low COD/TOC ratios after thesetreatments, and even with higher reductions of COD, theTOC value was not lowered. Previous studies have reportedthat a COD/TOC ratio below 1.3 indicates that that residual
organic carbon was mostly related to refractory organiccompounds [16].
Unlike the COD value that is related to organically-bound and inorganic constituents [39], TOC is independentof the oxidation state of the organic matter and onlymeasures organic carbon converted to CO2 [40], suggestingthat changes observed in the COD/TOC ratio can be relatedto the degree of changes in the structure of the organiccompounds after oxidation. Figure 5 shows the AOS valuesbefore and after the treatment with dark-Fenton and photo-Fenton. It was found that by the end of the photo-Fentontreatment, the oxidation states were higher in comparisonto those after the dark-Fenton treatment, confirming thestronger oxidation (higher reduction efficiency for CODand TOC) with photo-Fenton and suggesting the yield ofdifferent end products. Regarding the oxidation states in thedark-Fenton, the AOS value in the run 1.9 was considerablyhigher in comparison to the raw wastewater and to otherdark-Fenton treatments reaching AOS value approximatelyas high as those obtained after the photo-Fenton process.

8 International Journal of Photoenergy
Dark-Fenton
R2 = 0.86
COD reduction (%)
0 20 40 60 80 100
CO
D/T
OC
0
0.5
1
1.5
2
(a)
Dark-Fenton
R2 = 0.62
COD reduction (%)
0 20 40 60 80 100
CO
D/T
OC
0
0.5
1
1.5
2
(b)
COD reduction (%)
Photo-Fenton
0 20 40 60 80 100
CO
D/T
OC
0
0.5
1
1.5
2
R2 = 0.93
(c)
Photo-Fenton
R2 = 0.18
COD reduction (%)
0 20 40 60 80 100
CO
D/T
OC
0
0.5
1
1.5
2
(d)
Figure 4: Correlation between COD and TOC reductions (in %) and COD/TOC ratios obtained with different dark- and photo-Fentontreatment setups.
nZVI
H2O2
Dark-Fenton
Sample number
AO
S
AOS
1 2 3 4 5 6 7 8 9 10 110
5
10
15
20
25
0
1
2
3
H2O
2, F
e (g
/L)
Untreated
(a)
Sample number
AO
S
1 2 3 4 5 6 7 8 9 10 110
5
10
15
20
25
0
1
2
3
H2O
2, F
e (g
/L)
Photo-Fenton
nZVI
H2O2
AOS
Untreated
(b)
Figure 5: Amounts of reagents (g/L) and the AOS values obtained after each run/treatment.

International Journal of Photoenergy 9
Table 5: Results of statistical analyses of independent variables.
Dark-Fenton Photo-Fenton
COD reduction TOC reduction COD reduction TOC reduction
Term Effect P Effect P Effect P Effect P
Constant 0.00 0.00 0.00 0
H2O2 : COD Ratio 17.3 0.01 12.4 0.02 0.9 0.91 6.8 0.07
H2O2 : nZVI Ratio −11.0 0.02 −12.0 0.02 −5.0 0.57 0.0 0.99
Doses 6.8 0.04 3.3 0.12 −0.7 0.94 3.0 0.24
H2O2 : COD Ratio ∗ H2O2 : nZVI Ratio −9.3 0.02 −8.4 0.03 −5.7 0.52 0.9 0.68
H2O2 : COD Ratio ∗ Dose 7.8 0.03 5.2 0.08 −6.8 0.46 0.0 0.99
H2O2 : nZVI Ratio ∗ Dose −5.8 0.05 −1.6 0.40 −4.9 0.58 1.2 0.57
H2O2 : COD Ratio ∗ H2O2 : nZVI Ratio∗Dose −8.0 0.02 −5.3 0.07 −5.7 0.52 −1.8 0.43
Ct Pt 0.07 0.01 0.91 0.39
According to Figure 5, with the exception of runs 2.7 and2.8, AOS values after the photo-Fenton treatments wereapproximately +3 in all remaining runs suggesting thatthe oxidised chemical nature of most of the photo-Fentontreatments reached a stable AOS value and even though thetreatment was to be continued, intermediates with higheroxidation state would not be formed. At the moment thatAOS stabilizes, the chemical treatment is only mineralizingorganic contaminants, but with no partial oxidation [41].This together with the fact that the difference between theCOD and TOC after treatment was considerably reduced bythe photo-Fenton treatment (paired t-test, P < 0.05) indi-cates that a more complete reduction of the organic materialwas achieved when applying the photo-Fenton process. Anincrease in AOS during the treatment as observed in thecurrent study, particularly for the photo-Fenton treatments,has been related to an increase in biodegradability [41] andreduction of toxicity [38].
This was confirmed by the fact that the reduction (in%) obtained with photo-Fenton is greater for TOC than forCOD (paired t-test, P < 0.05), (Figure 3(c)). UV irradiationmight have been responsible, for instance, for breakingdown large aromatic molecules into aliphatic carbon chains,besides its effect on recycling Fe3+ back to Fe2+ [20].
3.1.4. Cost Effectiveness. Even though economic feasibilitywas not the focus of this investigation, one can mentionthat the main costs involved in the studied processes arerelated to the nZVI, the oxidizing agent H2O2, and the energyconsumption of the UV-lamp. Photo-Fenton is reasonablymore expensive than dark-Fenton treatment due to the useof a UV-lamp. However, the results have shown that whenconsidering the overall treatment efficiency of both Fentonand photo-Fenton, the additional costs related to the UV-lamp could be compensated by the less amounts of nZVI toachieve high COD and TOC reduction %. Furthermore, theuse of UV energy has brought advantages since it widened therange of reactant concentrations that could be used and stillachieve very satisfactory treatment performances, makingreasonable to state that is the less the amount of reactants,the more economically feasible the treatment becomes. Such
advantage becomes very important in a full scale plant, wherethe concentration of pollutants in the raw wastewater canvary, which would require the use of different concentrationsof reactants. A clear example is the run 2.5 (Table 4),which had the most satisfactory performance observed withthe photo-Fenton treatment. In run 2.5 with the lowestreactant concentrations, COD and TOC reductions of 78%and 56%, respectively, were achieved, making this the mosteconomically feasible option in this study.
3.2. Effect of Independent Variables. The effects of the inde-pendent variables (H2O2 : COD; H2O2 : nZVI and dosingmode) and the interaction among them on the CODand TOC removal (in %) were obtained based on thedata from the full-factorial design as shown in Table 5.Whereas all factors and respective two-way and three-wayinteractions had significant effects on the COD and TOCremoval efficiency with dark-Fenton process (P < 0.05), nosignificance was found in the case of photo-Fenton (Table 5).Reasonably, H2O2 : COD and H2O2 : nZVI ratios were thefactors that played the most important roles consideringdark-Fenton treatment. Reasonably, negative values wereobtained for the effects caused by the H2O2 : nZVI ratioson COD and TOC reduction in % with dark-Fenton, sincethe lower the ratio is, the higher the treatment efficiencywill be as previously discussed. The results have shown thatby reducing the H2O2 : nZVI ratio from 15 : 1 down to 2 : 1,the reductions (in %) of COD and TOC could be increasedby 11% and 12%, respectively. The significant effect of thedosing mode on both COD and TOC reductions suggeststhat when large amounts of reactants are added at once, thetreatment performance was not increased due to scavenging[37, 42]. On the other hand, by splitting the doses of thereactants into several steps, scavenging was avoided, an effectthat has been described only very few previous studies [42,43]. The results have shown that the studied factors and levelsapplied did not play any significant role in the case of photo-Fenton experiments. These results suggest that the long UV-exposure time has eliminated large differences in the resultsor by combining chemical oxidation and UV irradiationother factors might be involved.

10 International Journal of Photoenergy
4. Conclusions
The following conclusions can be withdrawn from thisinvestigation:
a. COD and TOC can effectively be reduced by at least80% and 60%, respectively, from recalcitrant indus-trial wastewater from the wood industry using photo-Fenton;
b. the most effective treatment setup for dark-Fentonwas achieved with H2O2 : COD ratio of 5 : 1,H2O2 : nZVI ratio of 2 : 1 and with a dose mode thatsupplies the reactants in 3 equal aliquots added atequal time intervals;
c. the most effective treatment setup for photo-Fenton was obtained with H2O2 : COD ratio of 5 : 1,H2O2 : nZVI ratio of 2 : 1, supplying the reactants in 3equal aliquots added at equal time intervals; however,treatments close to the stoichiometry value (2.125)preformed almost as good;
d. there was a significant increase in the mineralizationwhen combining UV with Fenton (photo-Fenton).
Acknowledgments
The financial support to the research project from theSwedish Knowledge Foundation (KK-Stiftelsen), the Euro-pean Regional Development Fund, and the industry ABGustaf Kahr is acknowledged.
References
[1] F. Kaczala, M. Marques, and W. Hogland, “Biotreatability ofwastewater generated during machinery washing in a wood-based industry: COD, formaldehyde and nitrogen removal,”Bioresource Technology, vol. 101, no. 23, pp. 8975–8983, 2010.
[2] S. Laohaprapanon, M. Marques, and W. Hogland, “Removalof organic pollutants from wastewater using wood fly ash as alow-cost sorbent,” Clean, vol. 38, no. 11, pp. 1055–1061, 2010.
[3] M. Krzemieniewski, M. Debowski, A. Dobrzynska, and M.Zielinski, “Chemical oxygen demand reduction of variouswastewater types using magnetic field-assisted fenton reac-tion,” Water Environment Research, vol. 76, no. 4, pp. 301–309,2004.
[4] A. Kyriacou, K. E. Lasaridi, M. Kotsou, C. Balis, and G. Pilidis,“Combined bioremediation and advanced oxidation of greentable olive processing wastewater,” Process Biochemistry, vol.40, no. 3-4, pp. 1401–1408, 2005.
[5] D. Suryaman, K. Hasegawa, and S. Kagaya, “Combinedbiological and photocatalytic treatment for the mineralizationof phenol in water,” Chemosphere, vol. 65, no. 11, pp. 2502–2506, 2006.
[6] I. Oller, S. Malato, J. A. Sanchez-Perez, M. I. Maldonado,and R. Gasso, “Detoxification of wastewater containing fivecommon pesticides by solar AOPs-biological coupled system,”Catalysis Today, vol. 129, no. 1-2, pp. 69–78, 2007.
[7] W. K. Lafi, B. Shannak, M. Al-Shannag, Z. Al-Anber, and M.Al-Hasan, “Treatment of olive mill wastewater by combinedadvanced oxidation and biodegradation,” Separation andPurification Technology, vol. 70, no. 2, pp. 141–146, 2009.
[8] O. Tunay et al., Chemical Oxidation Applications for IndustrialWastewaters, IWA, 2010.
[9] F. Torrades, S. Saiz, and J. A. Garcıa-Hortal, “Using centralcomposite experimental design to optimize the degradation ofblack liquor by Fenton reagent,” Desalination, vol. 268, no. 1–3, pp. 97–102, 2011.
[10] K. Choi and W. Lee, “Enhanced degradation of trichloroethy-lene in nano-scale zero-valent iron Fenton system withCu(II),” Journal of Hazardous Materials, vol. 211-212, pp. 146–153, 2012.
[11] M. I. Badawy, M. Y. Ghaly, and T. A. Gad-Allah, “Advancedoxidation processes for the removal of organophosphoruspesticides from wastewater,” Desalination, vol. 194, no. 1–3,pp. 166–175, 2006.
[12] I. Arslan-Alaton Idil, A. B. Yalabik, and T. Olmez-Hanci,“Development of experimental design models to predictPhoto-Fenton oxidation of a commercially important naph-thalene sulfonate and its organic carbon content,” ChemicalEngineering Journal, vol. 165, no. 2, pp. 597–606, 2010.
[13] K. V. Padoley, S. N. Mudliar, S. K. Banerjee, S. C. Desh-mukh, and R. A. Pandey, “Fenton oxidation: a pretreatmentoption for improved biological treatment of pyridine and 3-cyanopyridine plant wastewater,” Chemical Engineering Jour-nal, vol. 166, no. 1, pp. 1–9, 2011.
[14] D. Hermosilla, N. Merayo, R. Ordonez, and A. Blanco,“Optimization of conventional Fenton and ultraviolet-assistedoxidation processes for the treatment of reverse osmosisretentate from a paper mill,” Waste Management, vol. 32, no.6, pp. 1236–1243, 2012.
[15] P. Bautista, A. F. Mohedano, M. A. Gilarranz, J. A. Casas, andJ. J. Rodriguez, “Application of Fenton oxidation to cosmeticwastewaters treatment,” Journal of Hazardous Materials, vol.143, no. 1-2, pp. 128–134, 2007.
[16] A. M. F. M. Guedes, L. M. P. Madeira, R. A. R. Boaventura,and C. A. V. Costa, “Fenton oxidation of cork cookingwastewater—overall kinetic analysis,” Water Research, vol. 37,no. 13, pp. 3061–3069, 2003.
[17] M. Umar, H. A. Aziz, and M. S. Yusoff, “Trends in the use ofFenton, electro-Fenton and photo-Fenton for the treatmentof landfill leachate,” Waste Management, vol. 30, no. 11, pp.2113–2121, 2010.
[18] P. Bautista, A. F. Mohedano, J. A. Casas, J. A. Zazo, andJ. J. Rodriguez, “An overview of the application of Fentonoxidation to industrial wastewaters treatment,” Journal ofChemical Technology and Biotechnology, vol. 83, no. 10, pp.1323–1338, 2008.
[19] W. Z. Tang and R. Z. Chen, “Decolorization kinetics andmechanisms of commercial dyes by H2O2/iron powder sys-tem,” Chemosphere, vol. 32, no. 5, pp. 947–958, 1996.
[20] M. Tamimi, S. Qourzal, N. Barka, A. Assabbane, and Y.Ait-Ichou, “Methomyl degradation in aqueous solutions byFenton’s reagent and the photo-Fenton system,” Separationand Purification Technology, vol. 61, no. 1, pp. 103–108, 2008.
[21] I. Arslan and I. A. Balcioglu, “Advanced oxidation of rawand biotreated textile industry wastewater with O3, H2O2/UV-C and their sequential application,” Journal of ChemicalTechnology & Biotechnology, vol. 76, no. 1, pp. 53–60, 2001.
[22] B.-H. Moon, Y.-B. Park, and K.-H. Park, “Fenton oxidation ofOrange II by pre-reduction using nanoscale zero-valent iron,”Desalination, vol. 268, no. 1–3, pp. 249–252, 2011.
[23] M. Barreto-Rodrigues, F. T. Silva, and T. C. B. Paiva, “Com-bined zero-valent iron and fenton processes for the treatmentof Brazilian TNT industry wastewater,” Journal of HazardousMaterials, vol. 165, no. 1–3, pp. 1224–1228, 2009.

International Journal of Photoenergy 11
[24] P. J. A. Borm, D. Robbins, S. Haubold et al., “The potentialrisks of nanomaterials: a review carried out for ECETOC,”Particle and Fibre Toxicology, vol. 3, no. 1, article 11, 2006.
[25] R. A. Crane and T. B. Scott, “Nanoscale zero-valent iron: futureprospects for an emerging water treatment technology,” Jour-nal of Hazardous Materials, vol. 211-212, pp. 112–125, 2012.
[26] S. Jagadevan, M. Jayamurthy, P. Dobson, and I. P. Thompson,“A novel hybrid nano zerovalent iron initiated oxidation—biological degradation approach for remediation of recalci-trant waste metalworking fluids,” Water Research, vol. 46, no.7, pp. 2395–2404, 2012.
[27] Q. J. Rasheed, K. Pandian, and K. Muthukumar, “Treatment ofpetroleum refinery wastewater by ultrasound-dispersed nano-scale zero-valent iron particles,” Ultrasonics Sonochemistry,vol. 18, no. 5, pp. 1138–1142, 2011.
[28] F. Kaczala, M. Marques, and W. Hogland, “Lead and vanadiumremoval from a real industrial wastewater by gravitationalsettling/sedimentation and sorption onto Pinus sylvestrissawdust,” Bioresource Technology, vol. 100, no. 1, pp. 235–243,2009.
[29] S. Laohaprapanon, F. Kaczalaa, P. S. Salomonbc, M. Marque-sad, and W. Hoglanda, “Wastewater generated during clean-ing/washing procedures in a wood-floor industry: toxicityon the microalgae Desmodesmus subspicatus,” EnvironmentalTechnology. In press.
[30] Z. Shiyun, Z. Xuesong, and L. Daotang, “Ozonation of naph-thalene sulfonic acids in aqueous solutions. Part I: eliminationof COD, TOC and increase of their biodegradability,” WaterResearch, vol. 36, no. 5, pp. 1237–1243, 2002.
[31] V. Sarria, S. Kenfack, O. Guillod, and C. Pulgarin, “Aninnovative coupled solar-biological system at field pilot scalefor the treatment of biorecalcitrant pollutants,” Journal ofPhotochemistry and Photobiology A, vol. 159, no. 1, pp. 89–99,2003.
[32] F. J. Benitez, F. J. Real, J. L. Acero, C. Garcia, and E. M. Llanos,“Kinetics of phenylurea herbicides oxidation by Fenton andphoto-Fenton processes,” Journal of Chemical Technology andBiotechnology, vol. 82, no. 1, pp. 65–73, 2007.
[33] H. Kusic, N. Koprivanac, and L. Srsan, “Azo dye degradationusing Fenton type processes assisted by UV irradiation: akinetic study,” Journal of Photochemistry and Photobiology A,vol. 181, no. 2-3, pp. 195–202, 2006.
[34] C.-C. Su, M. Pukdee-Asab, C. Ratanatamskulb, and M.-C.Lu, “Effect of operating parameters on decolorization andCOD removal of three reactive dyes by Fenton’s reagent usingfluidized-bed reactor,” Desalination, vol. 278, no. 1–3, pp. 211–218, 2011.
[35] X. Zhu, J. Tian, R. Liu, and L. Chen, “Optimization of Fentonand electro-Fenton oxidation of biologically treated cokingwastewater using response surface methodology,” Separationand Purification Technology, vol. 81, no. 3, pp. 444–450,2011.
[36] M. S. Lucas and J. A. Peres, “Removal of COD from olivemill wastewater by Fenton’s reagent: kinetic study,” Journal ofHazardous Materials, vol. 168, no. 2-3, pp. 1253–1259, 2009.
[37] C. T. Benatti, C. R. G. Tavares, and T. A. Guedes, “Optimiza-tion of Fenton’s oxidation of chemical laboratory wastewatersusing the response surface methodology,” Journal of Environ-mental Management, vol. 80, no. 1, pp. 66–74, 2006.
[38] E. Elmolla and M. Chaudhuri, “Optimization of Fentonprocess for treatment of amoxicillin, ampicillin and cloxacillinantibiotics in aqueous solution,” Journal of Hazardous Materi-als, vol. 170, no. 2-3, pp. 666–672, 2009.
[39] H. Zhang, J. C. Heung, and C. P. Huang, “Optimization ofFenton process for the treatment of landfill leachate,” Journalof Hazardous Materials, vol. 125, no. 1–3, pp. 166–174, 2005.
[40] D. R. Medley and E. L. Stover, “Effects of ozone on thebiodegradability of biorefractory pollutants,” Journal of theWater Pollution Control Federation, vol. 55, no. 5, pp. 489–494,1983.
[41] C. Sirtori, A. Zapata, I. Oller, W. Gernjak, A. Aguera,and S. Malato, “Decontamination industrial pharmaceuticalwastewater by combining solar photo-Fenton and biologicaltreatment,” Water Research, vol. 43, no. 3, pp. 661–668, 2009.
[42] Y. Deng and J. D. Englehardt, “Treatment of landfill leachate bythe Fenton process,” Water Research, vol. 40, no. 20, pp. 3683–3694, 2006.
[43] R. C. Martins, A. F. Rossi, and R. M. Quinta-Ferreira, “Fen-ton’s oxidation process for phenolic wastewater remediationand biodegradability enhancement,” Journal of HazardousMaterials, vol. 180, no. 1–3, pp. 716–721, 2010.

Hindawi Publishing CorporationInternational Journal of PhotoenergyVolume 2012, Article ID 303586, 7 pagesdoi:10.1155/2012/303586
Research Article
Solar Photocatalytic Degradation of Azo Dye in Aqueous TiO2
Suspension Assisted by Fresnel Lens
Wen-Shiuh Kuo and Wen-Yu Chen
Department of Safety, Health and Environmental Engineering, National United University, Miaoi 360, Taiwan
Correspondence should be addressed to Wen-Shiuh Kuo, [email protected]
Received 29 May 2012; Accepted 24 August 2012
Academic Editor: Meenakshisundaram Swaminathan
Copyright © 2012 W.-S. Kuo and W.-Y. Chen. This is an open access article distributed under the Creative Commons AttributionLicense, which permits unrestricted use, distribution, and reproduction in any medium, provided the original work is properlycited.
Solar TiO2 photocatalytic process assisted by a Fresnel lens was investigated for treating an azo dye wastewater of Acid Orange 10(AO10). Response surface methodology (RSM) was employed to assess the effect of critical process parameters (including initialpH of wastewater, concentration of TiO2, and reaction time) on treatment performance in terms of COD and TOC degradationefficiency. Optimized reaction conditions based on the analysis of RSM were established under an initial pH of 6.0, a concentrationof TiO2 of 1 g/L, and a reaction time of 2 h for reaching a 90% COD and TOC degradation of AO10 wastewater. With the assistanceof Fresnel lens, the TOC degradation rate of AO10 wastewater increased significantly from 0.606 h−1 and 0.289 h−1 to 1.477 h−1
and 0.866 h−1 in summer (June) season (UV280–400 nm nm: 39.9–44.8 W/m2) and winter (December) season (UV280–400 nm nm: 23.9–26.9 W/m2), respectively. This could be mainly due to the concentrating effect of Fresnel lens for solar energy, resulting in anincrease of 2∼2.5 times of solar light intensity and a raising heat irradiation in terms of 10∼15 ◦C of wastewater temperature.These results revealed that solar energy could be concentrated effectively by using Fresnel lens and showed a significant promotingeffect on the TiO2 photocatalytic degradation of dye wastewater.
1. Introduction
Over 100,000 different types of dyes are commerciallyavailable and 700,000 tons are produced yearly all over theworld. Nearly 50% of these dyes are azo-type dyes [1]. Azodyes, aromatic moieties linked together by azo (–N=N–)chromophores, represent the largest class of dyes used intextile processing and other industries. The release of thesecompounds into the environment is undesirable, becausethe color matters and their toxic breakdown products canbe mutagenic [2]. In addition, due to the complex aromaticstructure and stability of the azo-dyes, conventional biolog-ical treatments are ineffective for degradation and mineral-ization of the dye molecules [3]. Instead, activated carbonadsorption or coagulation is commonly used. However, newenvironmental laws may consider the spent adsorbents orsludge as hazardous waste and require further treatment.Consequently, intensive research for novel technologies withhigher efficiency and less amount of waste generated has
been stimulated. Advanced oxidation processes (AOPs) havebeen previously described as a promising option to removepersistent pollutants from contaminated water [4]. AOPs areable to produce a highly reactive, nonspecific oxidant, mainlyhydroxyl radicals (•OH). The hydroxyl radical possessesinherent properties that enable it to attack refractory organicpollutants in water to achieve a complete mineralization.However, the production of photons with artificial lightsources requires significant electrical energy demand andUV lamp consumption, leading to a high operation cost inAOPs [5]. Alternatively, solar energy is essentially unlimitedand its utilization is ecologically benign. In the wastewatertreatment sector, solar technology has been extensively usedas an alternative to UV lamps to reduce the operation costin AOPs [6]. In particularly, TiO2 photocatalysis (1)–(3)using solar irradiation has been used as an economicallyviable process and has attracted great interest in recent years[7]. However, solar TiO2 photocatalysis was usually carriedout by using solar irradiation directly, resulting in a lower

2 International Journal of Photoenergy
absorption and utilization of solar energy [8]. To improvethe efficiency of solar TiO2 photocatalysis, it is necessary tomaximize the absorption of solar energy.
TiO2hv(λ< 382 nm)−−−−−−−−→ h+
vb + ecb (1)
h+vb + H2O −→ •OH + H+ (2)
h+vb + OH− −→ •OH (3)
In this study, treatment of an azo dye-Acid Orange 10(AO10) wastewater towards highly mineralization using solarTiO2 photocatalysis enhanced by high-concentrating Fresnellens was investigated. Response surface methodology (RSM)was employed to obtain the optimal reaction conditions ofcritical process parameters (including initial pH of wastew-ater, TiO2 concentration, and reaction time) to reach a 90%of COD and TOC degradation of dye wastewater. Moreover,the effect of Fresnel lens on treatment performance in termsof color, COD, and TOC degradation efficiency of AO10 dyewastewater was examined.
2. Materials and Methods
2.1. Materials. AO10 (C16H10N2O7S2Na2) with a purity of84% was purchased from the Sigma-Aldrich Co. (USA) andused without further purification. The chemical properties ofAO10 are shown in Table 1. An initial AO10 concentrationof 50 mg/L was prepared for all experimental runs. TiO2
powder P25 (mainly anatase form, with a mean particle sizeof 30 nm and a BET surface area of 50 ± 15 m2/g) fromDegussa Co. (Frankfurt, Germany) was used in this study.All other chemicals used in this study were analytical gradeand used as received.
2.2. Procedures. All experiments were carried out in a batchmode. A 1 L glass beaker containing 200 mL of AO10 solutionwas used. The initial pH of the solution was adjusted tothe desired pH by adding 1 N H2SO4 or 1 N NaOH. In thisstudy, a 3-factor ∗ 3-level experimental design with threereplicates at center point according to the methodology ofresponse surface [9] as shown in Table 2 was applied toinvestigate the influence of three factors (namely, initial pH,TiO2 concentration and reaction time) for COD and TOCdegradation efficiency of AO10 wastewater. At the RSM runs,the prepared dye solution was placed into the photoreactorand irradiated by a 1500 W Xe lamp in an Atlas SuntestCPS+ solar simulator (Atlas Co., USA) emitting artificialsolar light with a spectral distribution resembling the solarspectrum (300–800 nm) in which the UV280–400 nm intensityis around 67 ± 0.5 W/m2. In addition, the AO10 solutionwas maintained at 25 ± 0.5◦C in a water bath. During theexperiments, the pH of the solution was monitored using apH meter (SP-701LI 120, Suntex Co., Taiwan) equipped witha glass electrode. Samples were withdrawn from the reactor atpreset time intervals and then stored at 4◦C for the followingADMI, COD, TOC, and IC analysis.
As the optimal values of the process parameters weredeveloped on the basis of RSM application and related
equations, a Fresnel lens made of PMMA (thickness: 2 mm,pitch: 0.5 mm, facet depth: 0.2 mm, and Fresnel circles: 395)was added into solar TiO2 photocatalytic system with adistance of 16 cm above the level of wastewater. To investigatethe effect of Fresnel lens in summer (June) and winter(December) seasons, a similar reactor without Fresnel lenswas also performed under the same natural solar irradiationusing the experimental conditions obtained from RSM runs.A schematic diagram of the photoreactor using Fresnel lensis shown in Figure 1. In addition, two blank experimentsincluding direct photolysis reaction and adsorption on TiO2
only under the experimental conditions of this study wereperformed. The result indicated that the mineralizationefficiency of AO10 solution was less than 2%, which impliedthat the mineralization of AO10 solution due to these effectswas slight in this study.
2.3. Analysis
2.3.1. American Dye Manufacturing Institute (ADMI) Mea-surement. The color of AO10 solution was determinedwith a DR 4000 photometer (HACH Co., USA) for ADMImeasurement. The efficiency of decolorization was calculatedon the basis of ADMI reduction of solution.
2.3.2. Chemical Oxygen Demand (COD) Measurement. CODof solution via a DR 4000 photometer (Hach Co., USA) byusing a K2Cr2O7 as the reacting reagent was measured inorder to understand the changes in the degree of oxidationfor AO10 wastewater.
2.3.3. Total Organic Carbon (TOC) Measurement. TOC ofsolution was measured by using a Shimadzu VCPH analyzer(Shimadzu Co., Japan) in order to know the amount of AO10molecules degraded to CO2 during oxidation.
2.3.4. Ion Chromatography (IC) Analysis. To quantify thedegradation product—oxalate (C2O2
4−
) and acetate (CH3
COO−)—an ion-chromatographic system (Dionex ICS-1000) equipped with an IonPac AS12A column (L: 200 mm,ID: 4.0 mm) was used. Aqueous solutions of 2.7 mM Na2CO3
and 0.3 mM NaHCO3 were used as eluents. Analysis wasperformed under a flow rate of 1.5 mL/min and operated onan isocratic mode.
3. Results and Discussion
3.1. Optimization of Solar Photocatalytic Treatment ofAO10 Wastewater. Figure 2 displays the three-dimensionalresponse surface plots for percent of COD and TOCdegradation efficiencies of AO10 wastewater as a function ofinitial pH and concentration of TiO2. As shown in Figure 2,when the pH of AO10 wastewater was varied from 5 (X1 =−1) to 9 (X1 = 1), the degradation efficiency reached amaximum at pHs 5.5–6.5 followed by a decrease of CODand TOC degradation efficiency in the range 6.5–9.0 in allthe TiO2 concentration ranges studied. This phenomenoncan be explained by the surface charge of TiO2 as a function

International Journal of Photoenergy 3
Table 1: Chemical characteristics of alizarin violet AO10.
Dye Chemical structure λmax (nm) MW, g/mol Category
Acid Orange 10 (C16H10N2O7S2Na2) (C.I. number 16230)
N N
NaO3S
SO3Na
HO
478 452.37 Azo
Table 2: Experimental range and levels of the process independentvariables in this study.
Independent variable FactorRange and level
−1 0 +1
Initial pH X1 5.0 7.0 9.0
TiO2, g/L X2 0.5 1.0 1.5
Reaction time, hr X3 1.0 1.5 2.0
Y (response)—COD orTOC degradation, %
of pH. The zero point of charge (ZPC) for TiO2-P25 isaround pH 6.3–6.8 [10]. Therefore, at more acidic pHenvironment (pH < pHZPC), the TiO2 surface is positivelycharged as expressed by (4), and at alkaline pH, the surface(pH > pHZPC) is negatively charged as expressed by (5)[11]. AO10 in water is negatively charged because the twosodium sulfonate group is hydrolyzed to form dye anion andsodium ions as expressed by (6). At pH values below 6.3,the adsorption of AO10 is favorable due to the electrostaticattraction between the fully ionized sulfonic group andpositively charged TiO2 on the surface. Above pH 6.8, AO10is subjected to electrostatic repulsion between itself and thenegative surface of TiO2. Hence, the adsorption of the AO10dye is less and the degradation efficiency decreased. Similarresult was also observed in the photocatalytic degradationof Acid Orange 7 [12]. However, the effect of initial pH ofdye solution was not significant because of some carboxylacid intermediates such as acetate and oxalate were produced,leading to a gradually decreased pH of solution, and then thereaction of (4) may be dominant.
TiOH + H+ −→ TiOH+2 , pKa1 = 4.95 (4)
TiOH + OH− −→ TiO− + H2O, pKa2 = 7.80 (5)
dye-(SO3Na)2 −→ dye-(SO−3
)2 + 2Na+. (6)
On the other hand, as shown in Figure 2, the effect ofTiO2 concentration was much more considerable than thatof initial pH on the COD and TOC degradation of AO10wastewater. In general, more catalysts will substantially resultin generation of more hydroxyl radicals until an optimumcatalyst concentration is achieved. Hence, the results showedthat, within the pH range studied (5–9), the increase ofcatalyst concentration from 0.5 to 1.0 g/L increased the
Fresnel lens
pH meterThermometer
Magnetic stirrerReactor
Photometer
Figure 1: Schematic diagram of the solar photocatalytic reactorwith and without Fresnel lens.
degradation efficiency. This fact may be due to the increase inthe number of dye molecules adsorbed and more oxidationof dye [13]. Above this value, no obvious improvement isobtained by increasing the concentration of catalyst. Thismay be due to an increased opacity of the suspension andthe shielding effect of light with an excess of TiO2 particles,consequently leading to a decrease in the formation of •OHradicals. Accordingly, the optimum concentration of thecatalyst for efficient solar photodegradation of AO10 wouldbe around 1.0 g/L. This result was consistent with thosereported in the literature [14] for the TiO2 photocatalyticdegradation of Remazol Red dye.
On the basis of RSM application, the empirical relation-ship between the dye degradation efficiency (Y) and theindependent variables is developed and listed in Table 3. Theregression model had a high value of coefficient of determi-nation (r2 > 0.97). This implies that the process efficiencycould be predicted well by the second-order polynomialregression equations under the conditions studied.
Based on the model equations in Table 3, the optimalvalues of the process parameters were established as an initialpH of 6.0, an initial concentration of TiO2 of 1 g/L, anda reaction time of 2 h for reaching a 90% COD and TOCdegradation of AO10 wastewater. In order to confirm theoptimum conditions of AO10 degradation, a five-replicateand t-test analyses were performed. The results showedthat the average COD and TOC degradation efficiency were90.5% and 90.4%, respectively, and the 95% of confidenceintervals for COD and TOC degradation efficiency were89.7∼91.3% and 89.4∼90.8%, respectively. Consequently,

4 International Journal of Photoenergy
CO
D r
emov
al (
%)
X 2(T
iO2)
100
95
90
85
80
75
70
1009590
85807570
− 1
− 0.5
0
0.5
1
− 0.50
0.51
X1 (pH)
(a)
TO
C r
emov
al (
%)
X 2(T
iO2)
100
95
90
85
80
75
70
100959085
80757065
65
− 1
− 0.5
0
0.5
1
− 0.50
0.51
X1 (pH)
(b)
Figure 2: Response surface for (a) COD and (b) TOC degradation efficiency of AO10 wastewater as a function of initial pH and TiO2
concentration. (Reaction time: 2 h, light intensity (UV280–400 nm: 66.5 W/m2, water temperature: 25± 0.5◦C).
Table 3: Polynomial regression equation of AO10 degradation on the basis of COD and TOC removal.
Polynomial regression equation r2
aYCOD = 81.0 + X1 + 9.7X2 + 15.3X3 – 3.9 X12– 0.2 X2
2 – 4.6 X32 – 5X1X2 – 6.9X1X3 – 8.3X2X3 0.971
aYTOC = 74.1 − 5X1 + 10.5X2 + 18.7X3 – 3.2X12 – 2 X2
2 – 5.7 X32 – 2.6X1X2 – 3.7X1X3 – 1.3X2X3 0.997
aYCOD: the COD degradation efficiency of AO10 wastewater.
bYTOC: the TOC degradation efficiency of AO10 wastewater.
the credibility of the optimal conditions obtained in thisstudy was acceptable.
3.2. Effect of Fresnel Lens on the Degradation Efficiencyof AO10 Wastewater. To investigate the effect of Fresnellens, photocatalytic oxidation of AO10 wastewater with orwithout Fresnel lens was performed simultaneously undernatual solar irradiation using the optimal experimentalconditions obtained from RSM runs.
Basically, it was found that the concentrating effect ofFresnel lens for solar energy could result in an increaseof 2.2∼2.5 and 1.8∼2.0 times of solar light irradiation insummer (June) and winter (December) seasons, respectively,as shown in Table 4. Also, a raising heat irradiation in termsof 10∼15◦C of wastewater temperature was observed in thisstudy. Figures 3 and 4 showed the effect of Fresnel lens onthe COD, TOC degradation, and decolorization efficiencyof AO10 wastewater in summer (June) and winter (Dec.)season, respectively. As shown in Figure 3, a 99% of CODand a 94% of TOC degradation of AO10 wastewater wereachieved with the assistance of Fresnel lens, in contrast to
a 94% of COD and a 74% of TOC degradation in solarphotocatalytic process without Fresnel lens observed withina reaction of 2 h. The decolorization efficiency of AO10wastewater was also increased 29% as using Fresnel lensfor a reaction of 1 h only. Moreover, it was found that thedegradation efficiency of AO10 wastewater with the aid ofFresnel lens at a reaction of 1 h was close to that without theassistance of Fresnel lens at a reaction time of 2 h. This couldbe due to a higher light irradiation and water temperaturethat increased the rate of generation of oxidizing speciessuch as •OH radical. This result implied that the higher thesolar light irradiation applied, the higher the generation ofelectron-hole pairs and •OH radicals. A similar phenomenonwas observed in the study of Liu et al. [15]. Their resultindicated that the TOC degradation efficiency of Acid Yellow17 solution increased from 5.1% to 53.2% as the intensityof UV light increased from 12.4 to 31.5 W/m2, indicating apositive effect of increasing light irradiation. In addition, theresults of Lin and Lee [16] indicated that the degradationefficiency of MX-5B dye wastewater improved 15% whilethe temperature of water was increased from 22◦C to 40◦Cin TiO2 photocatalytic process. This is due to a higher
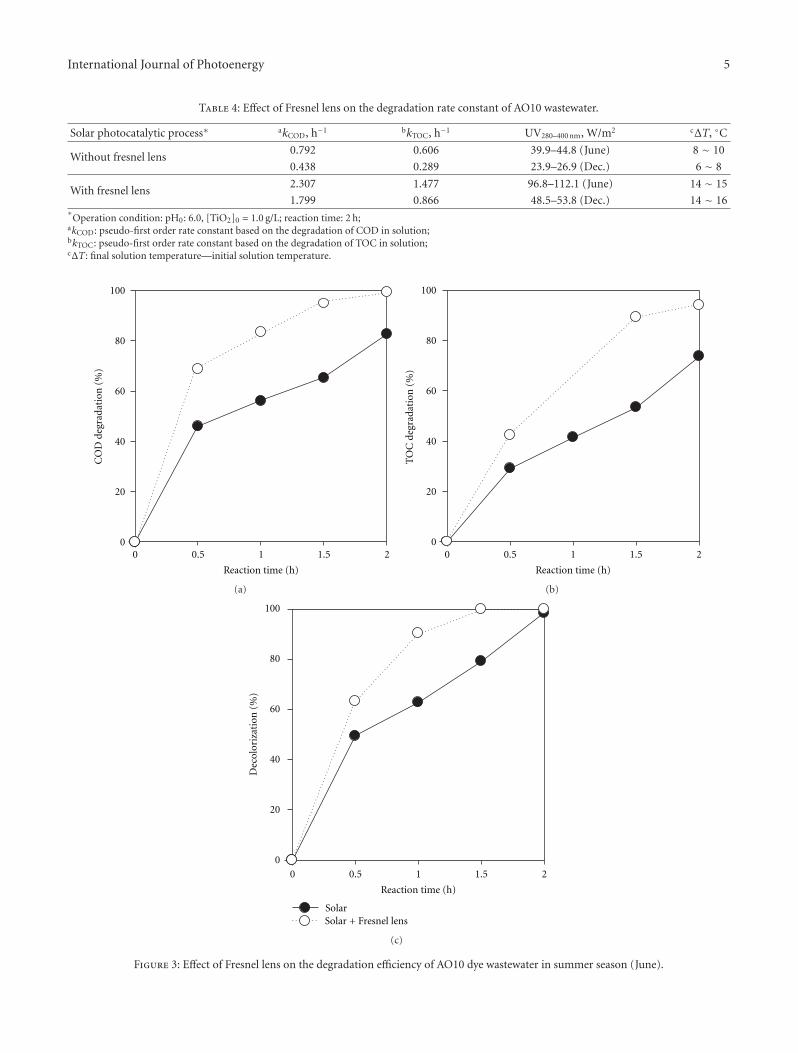
International Journal of Photoenergy 5
Table 4: Effect of Fresnel lens on the degradation rate constant of AO10 wastewater.
Solar photocatalytic process∗ akCOD, h−1 bkTOC, h−1 UV280–400 nm, W/m2 cΔT, ◦C
Without fresnel lens0.792 0.606 39.9–44.8 (June) 8 ∼ 10
0.438 0.289 23.9–26.9 (Dec.) 6 ∼ 8
With fresnel lens2.307 1.477 96.8–112.1 (June) 14 ∼ 15
1.799 0.866 48.5–53.8 (Dec.) 14 ∼ 16∗
Operation condition: pH0: 6.0, [TiO2]0 = 1.0 g/L; reaction time: 2 h;akCOD: pseudo-first order rate constant based on the degradation of COD in solution;bkTOC: pseudo-first order rate constant based on the degradation of TOC in solution;cΔT: final solution temperature—initial solution temperature.
Reaction time (h)
CO
D d
egra
dati
on (
%)
100
80
60
40
20
00 0.5 1 1.5 2
(a)
Reaction time (h)
TO
C d
egra
dati
on (
%)
100
80
60
40
20
00 0.5 1 1.5 2
(b)
Reaction time (h)
Dec
olor
izat
ion
(%
)
100
80
60
40
20
0
0 0.5 1 1.5 2
SolarSolar + Fresnel lens
(c)
Figure 3: Effect of Fresnel lens on the degradation efficiency of AO10 dye wastewater in summer season (June).

6 International Journal of Photoenergy
Reaction time (h)
CO
D d
egra
dati
on (
%)
100
80
60
40
20
00 0.5 1 1.5 2
(a)
Reaction time (h)
TO
C d
egra
dati
on (
%)
100
80
60
40
20
00 0.5 1 1.5 2
(b)
Reaction time (h)
Dec
olor
izat
ion
(%
)
100
80
60
40
20
00 0.5 1 1.5 2
SolarSolar + Fresnel lens
(c)
Figure 4: Effect of Fresnel lens on the degradation efficiency of AO10 dye wastewater in winter season (December).
water temperature that increased the reaction rate between•OH and organic molecules. Accordingly, two promotioneffects were found with the assistance of Fresnel lens. First,the increase of solar light irradiation could enhance theexcitation of electron hole and hence persistent promotionof •OH production. Second, the raise of water temperaturewould be higher due to the effect of solar heat irradiation,which renders additional positive effect on the performanceof solar photocatalytic process.
To quantitatively analyze the effect of Fresnel lens onthe degradation of AO10 wastewater, a pseudo-first-order
model was applied to obtain the rate constants. It was foundthat both the COD and TOC degradation efficiencies ofAO10 wastewater, with or without Fresnel lens, followedthe pseudo-first-order reaction kinetics as indicated byhigh correlation coefficients (r2 > 0.90). It was obviousthat a significant enhancement for the degradation rate ofAO10 wastewater was achieved by using Fresnel lens. Asthe rate constant shown in Table 4, the COD and TOCdegradation rate of AO10 wastewater increased a factor of2.9 and 2.4, respectively, in summer (June) season and afactor of 4.1 and 3.0, respectively, in winter (December)

International Journal of Photoenergy 7
season. The promotion effect of Fresnel lens was moresignificant in winter season. This may be due to a lowersolar irradiation (23.9∼26.9 W/m2) and a lower initial watertemperature (15∼18◦C) in winter season, leading to a muchlower production of •OH radicals in the solar photocatalyticprocess without the assistance of Fresnel lens.
4. Conclusions
Optimized reaction conditions based on the applicationof RSM were established as an initial pH of 6.0, a TiO2
concentration of 1.0 g/L, and a reaction time of 2 h formore than a 90% of COD and TOC degradation of AO10wastewater in solar TiO2 photocatalytic process. Solar energycould be concentrated efficiently by using Fresnel lens andhad a significant effect on the increasing of UV280–400 nm
light intensity of solar irradiation and the temperature ofwastewater, leading to a positive effect on the performanceof solar photocatalytic process. Consequently, the solar TiO2
photocatalytic process with the use of a low cost of PMMAFresnel lens can offer an economical and practical alternativefor the treatment of dye wastewater.
Acknowledgment
Many thanks are due to the kind sponsorship of the NationalScience Council, Taiwan (Project no. NSC 99-2221-E-239-011), without which this work would not have been possible.
References
[1] I. D. Mall, V. C. Srivastava, N. K. Agarwal, and I. M. Mishra,“Removal of congo red from aqueous solution by bagassefly ash and activated carbon: kinetic study and equilibriumisotherm analyses,” Chemosphere, vol. 61, no. 4, pp. 492–501,2005.
[2] C. Bauer, P. Jacques, and A. Kalt, “Photooxidation of an azodye induced by visible light incident on the surface of TiO2 ,”Journal of Photochemistry and Photobiology A, vol. 140, no. 1,pp. 87–92, 2001.
[3] Z. Zhang and H. Zheng, “Optimization for decolorization ofazo dye acid green 20 by ultrasound and H2O2 using responsesurface methodology,” Journal of Hazardous Materials, vol.172, no. 2-3, pp. 1388–1393, 2009.
[4] F. Al Momani, “Impact of photo-oxidation technology on theaqueous solutions of nitrobenzene: degradation efficiency andbiodegradability enhancement,” Journal of Photochemistry andPhotobiology A, vol. 179, no. 1-2, pp. 184–192, 2006.
[5] L. A. Perez-Estrada, S. Malato, A. Aguera, and A. R.Fernandez-Alba, “Degradation of dipyrone and its mainintermediates by solar AOPs. Identification of intermediateproducts and toxicity assessment,” Catalysis Today, vol. 129,no. 1-2, pp. 207–214, 2007.
[6] M. I. Maldonado, P. C. Passarinho, I. Oller et al., “Photocat-alytic degradation of EU priority substances: a comparisonbetween TiO2 and Fenton plus photo-Fenton in a solar pilotplant,” Journal of Photochemistry and Photobiology A, vol. 185,no. 2-3, pp. 354–363, 2007.
[7] S. Malato, P. Fernandez-Ibanez, M. I. Maldonado, J. Blanco,and W. Gernjak, “Decontamination and disinfection of water
by solar photocatalysis: recent overview and trends,” CatalysisToday, vol. 147, no. 1, pp. 1–59, 2009.
[8] A. Duran and J. M. Monteagudo, “Solar photocatalyticdegradation of reactive blue 4 using a Fresnel lens,” WaterResearch, vol. 41, no. 3, pp. 690–698, 2007.
[9] G. E. P. Box, W. G. Hunter, and J. S. Hunter, Statistics forExperimenters: An Introduction to Design. Data Analysis andModel Building, Wiley, New York, NY, USA, 1st edition, 1978.
[10] E. Evgenidou, K. Fytianos, and I. Poulios, “Semiconductor-sensitized photodegradation of dichlorvos in water using TiO2
and ZnO as catalysts,” Applied Catalysis B, vol. 59, no. 1-2, pp.81–89, 2005.
[11] S. Lakshmi, R. Renganathan, and S. Fujita, “Study on TiO2-mediated photocatalytic degradation of methylene blue,”Journal of Photochemistry and Photobiology A, vol. 88, no. 2-3, pp. 163–167, 1995.
[12] P. Bansal, D. Singh, and D. Sud, “Photocatalytic degradationof azo dye in aqueous TiO2 suspension: reaction pathwayand identification of intermediates products by LC/MS,”Separation and Purification Technology, vol. 72, no. 3, pp. 357–365, 2010.
[13] M. S. T. Goncalves, A. M. F. Oliveira-Campos, E. M. M.S. Pinto, P. M. S. Plasencia, and M. J. R. P. Queiroz,“Photochemical treatment of solutions of azo dyes containingTiO2,” Chemosphere, vol. 39, no. 5, pp. 781–786, 1999.
[14] K. Soutsas, V. Karayannis, I. Poulios et al., “Decolorizationand degradation of reactive azo dyes via heterogeneousphotocatalytic processes,” Desalination, vol. 250, no. 1, pp.345–350, 2010.
[15] C. C. Liu, Y. H. Hsieh, P. F. Lai, C. H. Li, and C. L.Kao, “Photodegradation treatment of azo dye wastewater byUV/TiO2 process,” Dyes and Pigments, vol. 68, no. 2-3, pp.191–195, 2006.
[16] Y. C. Lin and H. S. Lee, “Effects of TiO2 coating dosage andoperational parameters on a TiO2/Ag photocatalysis systemfor decolorizing procion red MX-5B,” Journal of HazardousMaterials, vol. 179, no. 1–3, pp. 462–470, 2010.

Hindawi Publishing CorporationInternational Journal of PhotoenergyVolume 2012, Article ID 140605, 6 pagesdoi:10.1155/2012/140605
Research Article
Combined Application of UV Photolysis and Ozonation withBiological Aerating Filter in Tertiary Wastewater Treatment
Zhaoqian Jing and Shiwei Cao
College of Civil Engineering, Nanjing Forestry University, Nanjing 210037, China
Correspondence should be addressed to Zhaoqian Jing, [email protected]
Received 13 May 2012; Accepted 26 September 2012
Academic Editor: Meenakshisundaram Swaminathan
Copyright © 2012 Z. Jing and S. Cao. This is an open access article distributed under the Creative Commons Attribution License,which permits unrestricted use, distribution, and reproduction in any medium, provided the original work is properly cited.
To enhance the biodegradability of residual organic pollutants in secondary effluent of wastewater treatment plants, UV photolysisand ozonation were used in combination as pretreatment before a biological aerating filter (BAF). The results indicated thatUV photolysis could not remove much COD (chemical oxygen demand), and the performance of ozonation was better than theformer. With UV photolysis combined with ozonation (UV/O3), COD removal was much higher than the sum of that with UVphotolysis and ozonation alone, which indicated that UV photolysis could efficiently promote COD removal during ozonation.This pretreatment also improved molecular weight distribution (MWD) and biodegradability greatly. Proportion of organiccompounds with molecular weight (MW) <3 kDalton was increased from 51.9% to 85.9%. COD removal rates with BAF andO3/BAF were only about 25% and 38%, respectively. When UV/O3 oxidation was combined with BAF, the average COD removalrate reached above 61%, which was about 2.5 times of that with BAF alone. With influent COD ranging from 65 to 84 mg/L, theeffluent COD was stably in the scope of 23–31 mg/L. The combination of UV/O3 oxidation with BAF was quite efficient in organicpollutants removal for tertiary wastewater treatment.
1. Introduction
In recent years, contamination of surface and subsurfacewater by organic pollutants has received much attention.Wastewater treatment plants (WWTPs) play important rolesin such pollutants removal. In China, more and moreWWTPs have been built not only in large cities, but also insmall towns and counties. To meet the national dischargestandard for municipal WWTPs, most of them have beenbuilt with secondary treatment processes, which usuallycomprise physical interception, precipitation, and biologicaltreatment. Although the secondary treatment processes areefficient in bulk and soluble pollutants removal, there are stillsome residual organic compounds, nitrogen, phosphorus,and pathogenic bacteria in the effluent. Some researchershave found that there are more than 200 organic micropollu-tants in the secondary effluent of municipal WWTPs [1, 2].Most of these organic pollutants are refractory and difficultto be further degraded, and therefore their discharge in watermay cause long-term environmental effects to aquatic andterrestrial organisms [3, 4].
In late May, 2007, a drinking water crisis took placein Wuxi, Jiangsu Province, China, owing to the large scalegrowth of algae bloom in Wuxi’s drinking water source—Taihu Lake. This crisis has made nearly 170 WWTPs beingrequired to be upgraded with deep treatment or tertiarytreatment to relieve the pollution load to Taihu Lake.Coagulation and filtration have been usually applied intertiary treatment for residual suspended solids and partialcolloid substances removal. However, most refractoryand volatile organic compounds cannot be eliminated bythese processes [5]. Owing to the low biodegradabilityof residual organic compounds, it is difficult to treat thesecondary effluent directly with further biological processes.Appropriate processes should be found for refractorypollutants removal in tertiary wastewater treatment.
Many advanced oxidation processes (AOPs) can be usedfor destruction of refractory and high molecular organiccompounds in wastewater, such as ozonation, ultraviolet(UV) photolysis, hydrogen peroxide (H2O2) oxidation, andFenton oxidation. These AOPs can be used alone or incombination. During these processes, hydroxyl radicals

2 International Journal of Photoenergy
with redox potential of 2.8 V are usually generated as thebasic oxidants for pollutants removal [6]. Hydroxyl radicalsare highly reactive and consequently short-lived. In theapplication of these AOPs, it is vital to provide appropriatereaction conditions and produce enough hydroxyl radicals.Fenton oxidation is usually accomplished in acid conditions,resulting in large quantities of acid and base consumption[7]. It can be used in small scale industrial wastewatertreatment or special pollutants removal. Ozone is a strongoxidant that decomposes in water to form hydroxyl radicalswhich are stronger oxidizing agents than ozone itself. The useof ozonation for refractory and complex organic pollutantsoxidation is very popular in water and wastewater treatment[8, 9]. During ozonation, the high molecular pollutants aredecomposed into small molecular compounds, which arereadily to be biodegraded [10]. Ozonation can also reducethe toxic effects of some micropollutants, but does notdecrease the viability of bacteria [11]. Therefore, it is feasibleto apply ozonation with biological processes in wastewatertreatment. UV light is often used in water and wastewaterdisinfection. UV photolysis can selectively reduce someorganic compounds, but it alone is not efficient enough forpollutants removal. However, many researchers have foundUV photolysis can enhance the oxidation potential of someoxidation processes. When UV is used with H2O2, a strongoxidant whose photolytic dissociation yields hydroxyl radi-cals [12, 13], many recalcitrant pollutants such as pharma-ceuticals and pesticides can be oxidized [14]. When UV pho-tolysis is combined with ozonation (UV/O3 oxidation), morehydroxyl radicals are produced via the photolysis of reactionintermediates such as H2O2 [15], and the organic pollutantsare decomposed more completely. UV/O3 oxidation hasbeen used in pharmaceuticals, drinking water and industrialwastewater treatment [16–18]. In WWTPs, UV/O3 oxidationcan be used as pretreatment for biological process, in whichcomplex pollutants are decomposed into more biodegrad-able substances. Therefore, more organic compounds can beremoved in the subsequent biological treatment process.
As described above, although there are many studies onUV/O3 oxidation in organic pollutants removal from waterand wastewater, there are few studies in the applicationof UV/O3 oxidation with biological processes in tertiarywastewater treatment. In this study, UV/O3 oxidation wascombined with a biological aerating filter (BAF) to treat thesecondary effluent from a WWTP. The application of UV/O3
oxidation in combination with BAF could achieve highorganic pollutants removal with low cost [19]. The character-istics of the secondary effluent were evaluated. COD (chem-ical oxygen demand) removal performance and molecularweight distribution (MWD) changes during UV photolysis,ozonation, and their combination were investigated. Con-trast experiments were also carried out to study the perfor-mances of COD removal with BAF, O3/BAF and UV/O3/BAF.
2. Materials and Methods
2.1. Reactors. A pilot system shown in Figure 1 was builtin a WWTP in Nanjing, Jiangsu Province of China. UV/O3
oxidation was carried out in a cylinder glass reactor withdiameter of 300 mm and effective volume of 4 L. A 10 Wlow-pressure mercury UV lamp with main wavelength of254 nm was installed in the center of the reactor. Ozone wasproduced with an ozone generator (CF-G-3-2.5 g, QingdaoGuolin Industry Co., Ltd, China) with dry air. Ozone dosagewas controlled with a flowmeter.
The wastewater after pretreatment with UV photolysisand ozonation was pumped into a BAF, an organic glasscylinder reactor with diameter of 100 mm. Clay ceramisiteswith diameter of 10 mm were used as filling material withdepth of 1.5 m. This BAF was operated with hydraulic loadof 1.5 m3/m2 h and gas/water ratio of 5 : 1.
2.2. Analytical Methods. The samples from the influent,oxidation reactor, and final effluent of BAF were takenregularly and the concentrations of COD, BOD5 (5-daybiological oxygen demand) and NH4
+-N (ammonia) wereanalyzed according to the standard methods (APHA, 1999).MWD was measured using ultrafiltration membrane filterswith cutoff sizes of 1–100 kDalton. DOC (dissolved organiccarbon) after membrane filtration with different cutoff sizeswas measured using a Shimadzu TOC-V instrument. pH,dissolved oxygen, ozone concentration, and temperaturewere monitored regularly.
2.3. Influent Characteristics. The effluent from the secondaryclarifiers in the WWTP was directly used as influent ofthe combined process. This WWTP was run with an A2/O(anaerobic/anoxic and oxic) process, which had removedmost soluble organic compounds and nitrogen. The mainindexes of influent during this study were as follows: COD63.2–91.4 mg/L, BOD5 9–23 mg/L, NH4
+-N 5.3–8.6 mg/L,pH 7.1–7.4, and water temperature 19–25◦C.
3. Results and Discussion
3.1. Evaluation of Secondary Effluent. COD and BOD5 inthe effluent from the secondary clarifiers of the WWTP in2009 are shown in Figure 2. COD in the effluent rangedfrom 63.2 mg/L to 91.4 mg/L while BOD5 was in the scopeof 9–23 mg/L. According to the national discharge standardfor municipal wastewater treatment plant in China, whenthe effluent from a WWTP is discharged into an enclosedwatershed, COD and BOD5 in the effluent are requiredbelow 50 mg/L and 10 mg/L, respectively. It is obvious thatthe effluent could not meet the national discharge standard.This WWTP was run with A2/O process, in which mostbiodegradable organic compounds had been degraded. Theratio of BOD5/COD (B/C) was low, ranging from 0.17 to0.25, which indicated that most of the residual organicsubstances in the effluent were difficult to be biodegraded.
3.2. COD Removal with UV Photolysis, Ozonation, andUV/O3 Oxidation. Figure 3 shows COD variation in theoxidation reactor with time under UV photolysis, ozonation,and UV/O3 oxidation. It can be seen that COD removalwith UV photolysis alone was low. In 30 min contacting

International Journal of Photoenergy 3
Influent
12
45
6
8
37
Drainage
Figure 1: Schematic diagram for UV/O3 oxidation combined with BAF, (1) UV/O3 oxidation reactor, (2) UV lamp, (3) ozone generator, (4)medium water tank, (5) pump, (6) BAF, (7) aerator, (8) final water tank.
0 1 2 3 4 5 6 7 8 9 10 11 12 130
20
40
60
80
100
COD
B/C
(Months)
0.12
0.16
0.2
0.24
0.28
(B/C
)
CO
D, B
OD
5(m
g/L)
BOD5
Figure 2: COD, BOD5, and B/C changes in the effluent from thesecondary clarifiers.
time, COD only declined from 73.5 mg/L to 65.1 mg/L.The performance of ozonation was much better comparedwith UV photolysis. After 30 min ozonation, COD decreasedfrom 72.2 mg/L to 53.7 mg/L. More than 25% of CODwas removed during ozonation. The combination of UVphotolysis and ozonation led to significant improvement ofCOD removal compared with UV photolysis and ozonationalone. In 30 min, COD reduced from 74.3 mg/L to 40.9 mg/L.The removal rate of COD attained about 45%, which wasmuch higher than the sum of COD removal rates with UVphotolysis and ozonation alone. The results indicated thatUV photolysis could greatly improve COD removal duringozonation [20].
It can also be observed that COD concentrationdecreased with contact time rise. During UV/O3 oxidation,
0 5 10 15 20 25 300
10
20
30
40
50
60
70
80
UV
(Minutes)
CO
D (
mg/
L)
O3UV/O3
Figure 3: COD changes with time under UV photolysis, ozonation,and UV/O3 oxidation (O3 dosage 8 mg/L, temperature 21◦C, pH7.2).
COD decreased from the original 74.3 mg/L to 59.7, 45.4, and40.9 mg/L at contact time of 10, 20, and 30 min, respectively.The extension of contact time was beneficial for CODremoval. Nevertheless, the reactor volume needed to beamplified with contact time extension. More constructioninvestment and operation cost would be required. It canbe seen that contact time influence on COD removal wasrelieved with contact time exceeding 20 min. Therefore thesubsequent experiments were done with contact time of20 min.
3.3. Influence of O3 Dosages on UV/O3 Oxidation. A seriesof experiments of UV/O3 oxidation was done at differentozone dosages in the range of 0–12 mg/L. Results of CODvariation with ozone dosages are shown in Figure 4. It can

4 International Journal of Photoenergy
0 2 4 6 8 10 120
10
20
30
40
50
60
70
80
Initial CODResidual CODRemoval
CO
D (
mg/
L)
0
10
20
30
40
50
Rem
oval
(%
)
O3 dosage (mg/L)
Figure 4: Influence of O3 dosage on COD removal in UV/O3
oxidation (contact time 20 min, temperature 20◦C, pH 7.2).
0
10
20
30
40
50
60
70
(%
)
OriginalUV
<1 1–3 3–10 10–100 >100Molecular weight (kDalton)
O3
UV/O3
Figure 5: Molecular weight distribution under UV photolysis,ozonation, and UV/O3 oxidation (contact time 20 min, O3 dosage8 mg/L, temperature 21◦C, pH 7.2).
be seen that COD removal rose with ozone dosage increase.COD removal increased from 8.3% to 41.6% with dosageranging from 0 to 12 mg/L, while residual COD decreasedfrom 64.2 mg/L to 44 mg/L. It can also be noticed that whenozone dosage was under 2 mg/L, COD removal was low.When ozone dosage was increased from 2 to 8 mg/L, CODremoval was enhanced greatly. These results indicated thatozone dosage was an important factor of UV/O3 oxidation.However, COD changed little when ozone dosage was above8 mg/L. This indicated that there were still some organiccompounds which were difficult to be degraded with UV/O3
0 10 20 30 40 50 60 70 80 900
10
20
30
40
50
60
70
80
90 BAF
InfluentEffluentRemoval
(Days)
CO
D (
mg/
L)
0
10
20
30
40
50
60
70
80
90
Rem
oval
(%
)
O3/BAF UV/O3/BAF
Figure 6: COD removal contrast with BAF, O3/BAF, andUV/O3/BAF (oxidation contact time 20 min, O3 dosage 8 mg/L).
oxidation, and excessive ozone dosage could not makefurther COD removal.
3.4. Molecular Weight Distributions under UV Photolysis,Ozonation, and UV/O3 Oxidation. MWD under differentoperations is shown in Figure 5. In the effluent from thesecondary clarifiers, organics with molecular weight (MW)<1 kDalton were 42.4%. After UV photolysis, there wasa minor increase of organics with MW <3 kDalton. Afterozonation, the proportions of organics with MW <1 kDaltonand 1–3 kDalton were increased obviously. Organics withMW <3 kDalton attained about 74%, which was muchhigher than 51.9% in the original influent. The combinationof UV photolysis and ozonation changed MWD moregreatly. Organics with MW <1 kDalton and 1–3 kDaltonreached 64.7% and 21.2%, respectively. The proportion oforganics >10 kDalton decreased from the original 21.5%to 4.7%. UV/O3 oxidation improved MWD of organicsgreatly and produced more biodegradable substances [21].Consequently, the wastewater after UV/O3 oxidation wasmore appropriate for further biological treatment.
3.5. Performance of UV/O3 Oxidation Combined with BAF.Figure 6 shows COD removal with BAF alone (1–26 d),O3/BAF (27–56 d), and UV/O3/BAF (57–90 d). At the begin-ning, the BAF was started with the activated sludge ofthis WWTP as inoculum. COD removal increased graduallywith time as more biofilm grew on the ceramisites. At theend of Day 16, COD removal rate attained about 24%.Subsequently, COD removal rate was maintained around25%. Owing to the low biodegradability of organics in theinfluent, BAF alone could not remove more COD. COD inthe effluent from the BAF was still above 50 mg/L, exceedingthe standard limit for WWTPs in China.
In the second phase (27–56 d), ozonation was com-bined with BAF, and there was an obvious increase in

International Journal of Photoenergy 5
COD removal. The combination of ozonation and BAFcould remove 33%–44% COD. The average removal ratereached 38%. Ozonation had decomposed partial organiccompounds into biodegradable substances, which could bereadily biodegraded in subsequent BAF.
When UV photolysis and ozonation were combined withBAF (UV/O3/BAF, from Day 57 to Day 90), there was furtherimprovement of COD removal. The average COD removalrate was above 61%, which was 2.5 and 1.6 times of that inBAF and O3/BAF, respectively. With influent COD rangingfrom 65 mg/L to 84 mg/L, the effluent COD was stably main-tained in the scope of 23–31 mg/L. These results indicatedthat the combination of UV/O3 oxidation with BAF wasan appropriate process for low biodegradable wastewatertreatment. UV/O3 oxidation could not only remove partialorganic pollutants, but also efficiently enhance wastewaterbiodegradability [22]. With UV/O3 oxidation combined withBAF, most organics were removed from the wastewater withthe comprehensive activities of physicochemical decomposi-tion and biodegradation.
4. Conclusion
The effluent from the secondary clarifiers of the WWTPcomprises many refractory organic pollutants, most of whichare difficult to be biodegraded. Direct treatment with furtherbiological processes cannot make satisfactory performance.AOPs are usually efficient in refractory pollutants removal,and can be combined with biological processes in lowbiodegradable wastewater treatment. In this study, UV/O3
oxidation was combined with BAF in tertiary treatment. Theresults indicated that although UV photolysis alone was notquite efficient for COD removal, it could improve the per-formance of ozonation. When UV photolysis was combinedwith ozonation, 45% of COD in the wastewater from thesecondary effluent was removed, and more biodegradableorganic compounds were produced. It was really feasibleto combine UV/O3 oxidation with BAF to improve CODremoval in tertiary wastewater treatment. The combinationof UV/O3 oxidation with BAF could remove more than 61%of COD in the wastewater from the second clarifiers, whichwas nearly 2.5 and 1.6 times of that in BAF and O3/BAF,respectively.
Acknowledgments
This research was supported by the project of the priorityacademic program development of Jiangsu Higher Edu-cation Institutions (2011-6), and science and technologyproject of China Housing and Urban-Rural DevelopmentMinistry (2010-K7-10).
References
[1] J. Hollender, S. G. Zimmermann, S. Koepke et al., “Elimi-nation of organic micropollutants in a municipal wastewatertreatment plant upgraded with a full-scale post-ozonationfollowed by sand filtration,” Environmental Science and Tech-nology, vol. 43, no. 20, pp. 7862–7869, 2009.
[2] V. J. P. Vilar, A. I. E. Gomes, V. M. Ramos, M. I. Maldonado,and R. A. R. Boaventura, “Solar photocatalysis of a recalcitrantcoloured effluent from a wastewater treatment plant,” Photo-chemical and Photobiological Sciences, vol. 8, no. 5, pp. 691–698, 2009.
[3] J. Gong, Y. Liu, and X. Sun, “O3 and UV/O3 oxidationof organic constituents of biotreated municipal wastewater,”Water Research, vol. 42, no. 4-5, pp. 1238–1244, 2008.
[4] M. Bundschuh, R. Pierstorf, W. H. Schreiber, and R. Schulz,“Positive effects of wastewater ozonation displayed by in situbioassays in the receiving stream,” Environmental Science andTechnology, vol. 45, no. 8, pp. 3774–3780, 2011.
[5] M. Petala, V. Tsiridis, P. Samaras, A. Zouboulis, and G.P. Sakellaropoulos, “Wastewater reclamation by advancedtreatment of secondary effluents,” Desalination, vol. 195, no.1–3, pp. 109–118, 2006.
[6] F. J. Beltran, M. Gonzalez, and J. F. Gonzalez, “Industrialwastewater advanced oxidation. part 1. UV radiation in thepresence and absence of hydrogen peroxide,” Water Research,vol. 31, no. 10, pp. 2405–2414, 1997.
[7] S. Kenfack, V. Sarria, J. Wethe et al., “From laboratory studiesto the field applications of advanced oxidation processes:a case study of technology transfer from Switzerland toburkina faso on the field of photochemical detoxificationof biorecalcitrant chemical pollutants in water,” InternationalJournal of Photoenergy, vol. 2009, Article ID 104281, 8 pages,2009.
[8] R. G. Rice, “Applications of ozone for industrial wastewatertreatment—a review,” Ozone, vol. 18, no. 6, pp. 477–515, 1997.
[9] K. Ikehata and M. G. El-Din, “Aqueous pesticide degradationby ozonation and ozone-based advanced oxidation processes:a review (part II),” Ozone, vol. 27, no. 3, pp. 173–202, 2005.
[10] F. J. Beltran, J. F. Garcıa-Araya, and P. M. Alvarez, “Winedistillery wastewater degradation. 1. Oxidative treatmentusing ozone and its effect on the wastewater biodegradability,”Journal of Agricultural and Food Chemistry, vol. 47, no. 9, pp.3911–3918, 1999.
[11] M. Misık, S. Knasmueller, F. Ferk et al., “Impact of ozonationon the genotoxic activity of tertiary treated municipal wastew-ater,” Water Research, vol. 45, no. 12, pp. 3681–3691, 2011.
[12] A. Mandal, K. Ojha, A. K. De, and S. Bhattacharjee, “Removalof catechol from aqueous solution by advanced photo-oxidation process,” Chemical Engineering Journal, vol. 102, no.2, pp. 203–208, 2004.
[13] K. J. Friesen, T. M. El-Morsi, and A. S. Abd-El-Aziz, “Pho-tochemical oxidation of short-chain polychlorinated n-alkanemixtures using H2O2/UV and the photo-fenton reaction,”International Journal of Photoenergy, vol. 6, no. 2, pp. 81–88,2004.
[14] M. Klavarioti, D. Mantzavinos, and D. Kassinos, “Removal ofresidual pharmaceuticals from aqueous systems by advancedoxidation processes,” Environment International, vol. 35, no. 2,pp. 402–417, 2009.
[15] W. Zhao, Q. Liao, J. Zhang, Y. Yang, J. Dai, and D. Zhao,“Oxidation of cationic red X-GRL by ozonation combinedwith UV radiation in aqueous solution: degradation, kinetics,and modeling,” Chemical Engineering Journal, vol. 171, no. 2,pp. 628–639, 2011.
[16] F. J. Beltran, J. M. Encinar, and J. F. Gonzalez, “Industrialwastewater advanced oxidation. Part 2. Ozone combined withhydrogen peroxide or UV radiation,” Water Research, vol. 31,no. 10, pp. 2415–2428, 1997.
[17] C. Hofl, G. Sigl, O. Specht, I. Wurdack, and D. Wabner,“Oxidative degradation of AOX and COD by different

6 International Journal of Photoenergy
advanced oxidation processes: a comparative study with twosamples of a pharmaceutical wastewater,” Water Science andTechnology, vol. 35, no. 4, pp. 257–264, 1997.
[18] W. K. Lafi, M. Al-Anber, Z. A. Al-Anber, M. Al-Shannag, andA. Khalil, “Coagulation and advanced oxidation processes inthe treatment of olive mill wastewater (OMW),” Desalinationand Water Treatment, vol. 24, no. 1–3, pp. 251–256, 2010.
[19] A. S. Stasinakis, “Use of selected advanced oxidation processes(AOPs) for wastewater treatment—a mini review,” GlobalNEST Journal, vol. 10, no. 3, pp. 376–385, 2008.
[20] W. S. Kuo, “Synergistic effects of combination of photolysisand ozonation on destruction of chlorophenols in water,”Chemosphere, vol. 39, no. 11, pp. 1853–1860, 1999.
[21] J. Chung and J. O. Kim, “Application of advanced oxidationprocesses to remove refractory compounds from dye wastew-ater,” Desalination and Water Treatment, vol. 25, no. 1–3, pp.233–240, 2011.
[22] K. Ito, W. Jian, W. Nishijima, A. U. Baes, E. Shoto, and M.Okada, “Comparison of ozonation and AOPs combined withbiodegradation for removal of THM precursors in treatedsewage effluents,” Water Science and Technology, vol. 38, no.7, pp. 179–186, 1998.

Hindawi Publishing CorporationInternational Journal of PhotoenergyVolume 2012, Article ID 341592, 11 pagesdoi:10.1155/2012/341592
Research Article
Microbiological Evaluation of the Effectiveness of Sewage SludgeSanitization with Solar Drying Technology
Zbigniew Paluszak,1 Krzysztof Skowron,1, 2
Małgorzata Sypuła,1 and Karolina Jadwiga Skowron1
1 Department of Microbiology, Faculty of Agriculture and Biotechnology, University of Technology and Life Sciences in Bydgoszcz,Bernardynska 6-8, 85-029 Bydgoszcz, Poland
2 Department of Microbiology, Faculty of Pharmacy, Nicolaus Copernicus University in Torun, Collegium Medicum of L. Rydygier inBydgoszcz, M. Skłodowskiej-Curie 9, 85-094 Bydgoszcz, Poland
Correspondence should be addressed to Zbigniew Paluszak, [email protected]
Received 28 May 2012; Accepted 4 September 2012
Academic Editor: Manickavachagam Muruganandham
Copyright © 2012 Zbigniew Paluszak et al. This is an open access article distributed under the Creative Commons AttributionLicense, which permits unrestricted use, distribution, and reproduction in any medium, provided the original work is properlycited.
The aim of study was to estimate the sanitization effectiveness of the sludge solar drying process carried out on technical scale inPoland based on the inactivation of bacteria and parasite eggs. Sewage sludge samples inoculated with Escherichia coli, SalmonellaSenftenberg W775 and enterococci and perlon bags containing Ascaris suum eggs were placed inside the carriers fixed in the driedsludge pile and on the shovels and frame of the sludge turner. The number of reisolated microorganisms was determined with MPNmethod and the percentage of invasive A. suum eggs—with the microscope counting. On the basis of regression equations, thetheoretical survivability and elimination rate of bacteria and parasite eggs were calculated. Experiment showed low hygienizationefficiency of solar drying method. The theoretical survival time was 46–104 days in summer and 90–98 days in winter for S.Senftenberg W775 and, respectively 42–55 and 71–148 days for E. coli, depending on the carriers location. Enterococci were able tosurvive for 52–168 days in summer and in winter its number increased. The decrease in the percentage of invasive A. suum eggswas almost not observed. Results indicated that solar drying is a technology, which does not guarantee biosafety of product.
1. Introduction
Growing effectiveness of sewage treatment technologies re-sults in a considerable increase in generated sewage sludge[1]. The dry matter of stabilized municipal sewage sludge isexpected to amount to 662,000 Mg in Poland in 2015.
A considerable number of viruses, bacteria, and intestinalparasites may be present in sewage derived from hospitals,slaughter houses, and animal farms [2–5].
According to Bien [6], Sahlstrom [7], Pepper et al. [8],and Sun et al. [9], bacteria of the genera: Salmonella (about1,700 types), Shigella (4 species), Escherichia coli, Vibriocholerae, Mycobacterium tuberculosis, Pseudomonas aerug-inosa, Clostridium perfringens, Bacillus anthracis, Listeriamonocytogenes, Streptococcus faecalis, and Proteus vulgarisand viruses of the genera Enterovirus (67 types), Rotavirus,Parvovirus, and Adenovirus (31 types) are frequently isolatedfrom sewage sludge.
Of various methods of sewage treatment in Poland,those consisting in physicochemical processing, includingdrying, are developing dynamically. Conventional dryingallows considerable reduction in the mass and volume ofproduced sludge, but it generates high costs resulting fromthe facility operation and causes a substantial emission ofgaseous pollutions to the atmosphere.
The unconventional, low-temperature technology ofsolar drying of sewage sludge is prospective from the eco-nomic and ecological point of view [10].
Due to sanitary and epidemiological reasons, it is nec-essary to establish biological and microbiological methodswhich allow constant monitoring of sewage sludge sanitiza-tion effectiveness in solar drying process.
The aim of this study was to estimate the sanitizationeffectiveness of the sludge’s solar drying process conductedon technical scale in Poland, based on the inactivationkinetics of indicator bacteria and selected parasite eggs.

2 International Journal of Photoenergy
Figure 1: Solar drying plant in Iława.
Figure 2: Heating floor system in drying hall.
2. Material and Methods
The study was carried out in a solar drying plant of sewagesludge in north Poland in 2 research cycles, in summer andwinter.
2.1. Description of the Examined Technology of Sludge Drying.The solar drying plant is a system used commercially and itworks in full scale at the waste water treatment plant in Iława.This sewage sludge drying installation consists of dryinghalls similar to green houses with gable roof (Figure 1). Theconstruction of the drying hall is made of zinc-coated steeland covered with polycarbonate plates. The dimensions ofthe drying hall are 120 m length, 12 m width, and 6 m height.
The described solar drying plant is a hybrid installation.The main principle of the drying operation is the solareffect, but also the heating floor system (Figure 2) is exploitedfor water evaporation from sewage sludge. The heatingfloor additionally supports the drying process and the heatnecessary for its functioning is made by a heating pumpwhich recovers energy from the treated sewage through thecollector in secondary clarifier.
The solar drying plant is located next to the buildingof mechanical sludge dewatering station, from where dehy-drated sludge is transported into the hall by the transportersystem. Inside the drying hall mechanically dewatered sludgeis spread with an even layer on the concrete floor and thentransported, aerated, granulated and moved to the end ofthe hall by the nave turning sludge device (Figure 3). The
Figure 3: Scheme of solar drying plant with nave turning sludgedevice (http://www.huber.de/).
automatic ventilation system, which consists of mechanicalventilators inside the hall and the automatically openedwindow at the top of the roof, ensures and improves waterevaporation and humidity removal outside the drying hall.
The annual plant capacity is 3,500 t of sewage sludgewhose dry matter content at the beginning of the process isup to 20% and after drying 85–90%. The studies conductedso far show that under the climatic conditions prevailingin Iława, using solar energy allows to evaporate on average988 kg of water from 1 m2 of active surface of the dryer withina year. The drying hall with a total drying area of 1,440 m2
provides evaporation of about 1,422 tons of water.Solar sludge drying is currently the cheapest method of
getting rid of water from the sludge. For example, 1 tone ofwater evaporation in the solar drying system requires usingabout 20–30 kWh, while in conventional drying system basedon traditional fuels above 800 kWh.
2.2. Material for the Study. The material for the study wassewage sludge after mechanical dewatering to a dry mattercontent of 10% to 20%. The presence of native Salmonella,bacteria E. coli, and enterococci was examined in collectedsludge samples. Also the proportion of dry matter and dryorganic matter, pH, and the content of basic macroelementsand heavy metals were determined in the sludge.
2.3. Experimental Design. The study was conducted in 2cycles, summer and winter. In each cycle, 3 replications weremade for each location of the carrier.
The experiment was carried out using carriers in theform of perforated cylinder with a threaded lock.
Samples of municipal sludge with a weight of 25 g werecontaminated with 1 mL of the suspension of Escherichiacoli, bacilli Salmonella Senftenberg W775 and enterococci andplaced in the carriers. Also perlon bags containing live eggs ofAscaris suum were placed inside the carriers. Then they wereclosed and fixed in selected points (in the pile of dried sludgeat the end of the hall, as well as on shovels and frame of thesludge turner).
From each location, 3 carriers were collected for the studyafter 7, 14, 21, and 28 days, respectively.

International Journal of Photoenergy 3
Table 1: Applicable reference methods of municipal sewage sludge research [11].
Number Parameter Method
(1) pH Electrometric determination in water solution
(2) Dry matter content Drying at 105◦C, weighing
(3) Organic substance content Roasting at 600◦C, weighing
(4) Total nitrogen content Mineralization in acid pH with addition of catalyst
(5) Ammonium nitrogen contentDistillation of ammonia and determination withspectrophotometric method
(6) Total phosphorus contentMineralization to phosphorus (V) and determination withspectrophotometry
(7) Calcium and magnesium contentMineralization with acid mixture and determination withatomic spectrometry
(8) Heavy metal content: lead, cadmium, mercury,nickel, zinc, copper and chromium
Atomic absorption spectroscopy after mineralization in aquaregia or concentrated acids
2.4. Monitoring of Climatic Conditions. During the experi-ment, the following parameters were monitored: humidityand temperature in the drying plant (with the use of thehygrothermometer), the temperature in the pile (with theuse of the in-pile thermometer), the intensity of diffuse solarradiation coming to the horizontal plane of the drying plantroof (with the use of pyranometer), and the outside micro-climatic conditions (the climatic station data). Monitoringwas conducted according the methods commonly applied inmeteorology.
2.5. Physicochemical Analyses. The physicochemical analysisof the dried sludge parameters was made at each samplingtime. It involved the assessment of dry matter and organicdry matter content, pH, the content of fertilizer components(total and ammonium nitrogen, total phosphorus, calcium,and magnesium), and heavy metals (lead, cadmium, mer-cury, nickel, zinc, copper, and chromium).
Physicochemical analyses of the sludge were carried outusing the referential methods described in Appendix 5 to theordinance of the Ministry of the Environment of 13rd July2010 on municipal sewage sludge (Dz.U. 2010 nr 137 poz.924) [11]. The applied methods are presented in Table 1.
2.6. Microbiological Analyses. For contamination of the ex-perimental material, suspension of Salmonella SenftenbergW775, bacteria E. coli, and enterococci were used.
From 24-hour pure cultures of the tested microor-ganisms on nutrient agar, bacterial suspensions in 0.90%physiological salt solution with a density of 10 McF (∼3.0 ×10⁹ cfu × cm−3) were prepared.
The number of microorganisms isolated from the car-riers submitted to solar drying process at successive timeswas determined based on the MPN method in the three-tubedesign.
In the process of Salmonella isolation, 1% buffered pep-tonic water was used for initial multiplication (incubationfor 24 hours at 37◦C). Selective enrichment was conductedon the Rappaport medium (incubation for 24 hours at43◦C). BPLS agar was used as the solid growing medium
(incubation for 24 hours at 37◦C). Final identification wascarried out using the PCR reaction for detecting the fragmentinvA [12]. To 5 μL of isolated DNA 20 μL mastermix wasadded, composed of distilled water (8.85 μL), 10x PCRbuffer (2.5 μL; Bioline, cat. no. BIO-37030), magnesiumchloride (1.50 μL–25 mM; Bio-Rad, cat. no. 170-8872),dNTP’s (5 μL–1 mM; Bio-Rad, cat. no. 170-8874), primer139 (5′ GTGAAATTATCGCCACGTTCGGGCAA 3′ 1 μL–10 μM), primer 141 (5′ TCATCGCACCGTCAAAGGAACC3′ 1 μL–10 μM), and Taq polymerase (0.15 μL–5 U/μL; Bio-Rad, cat. no. 170-8870). The initial denaturation of DNAwas conducted at 95◦C for 1 minute. Then 38 cycles werecomprising of denaturation (30 seconds at 95◦C), annealing(30 seconds at 64◦C), and elongation (30 seconds at 72◦C).The last stage of the PCR reaction was the final elongationcarried out for 4 minutes at 72◦C. Electrophoresis wascarried out in 1.8% agarose gel (Bio-Rad, cat. no. 151-0450)at the voltage 5 V × cm−1 for 60 minutes and dyed withethidium bromide (Bio-Rad, cat. no. 161-0433).
To determine E. coli number, the MacConkey liquidmedium was used (incubation for 24 at 43◦C). Then thematerial was sieved on the solid medium ENDO agar(incubation for 24 hours at 43◦C). The final identificationwas carried out based on the set of biochemical tests API20E.
Enterococci determination was carried out using brothwith glucose and azide (incubation for 24 hours at 37◦C) andagar with kanamycin (incubation for 24 hours at 37◦C). Thefinal identification was carried out based on the PhadebactD—Strep Test.
2.7. Parasitological Investigation. Ascaris suum eggs wereobtained from uteruses of sexually mature females andplaced on Petri dishes filled with saline solution. Suspensionin volume of 1 mL with a density from 1.0× 10³ to 6.0× 10³
eggs × cm−3 was introduced to each perlon bag and usedfor experiment. The bags collected during the study wereopened and placed on Petri dishes with tap water. Incubationlasted for 28 days at 28◦C. The percentage of invasive eggs wasdetermined with the microscope counting method.

4 International Journal of Photoenergy
10
15
20
25
30
35
1 3 5 7 9 11 13 15 17 19 21 23 25 27
Time (days)
Temperature in solar drying plantOutside temperatureTemperature in pile
Tem
pera
ture
(C
)
Figure 4: The course of temperature during the summer cycle(July).
0
100
200
300
400
500
600
700
Sola
r ra
diat
ion
(W·m
−2)
1 3 5 7 9 11 13 15 17 19 21 23 25 27
Time (days)
Figure 5: The course of insolation during the summer cycle (July).
2.8. The Statistical Analysis of the Results. The obtainedresults were analyzed statistically in the program SAS 9.2PL. On the basis of regression equations, the theoreticaltimes of survival and elimination rates of the studied bacteriaand parasite eggs were determined. The significance ofdifferences between the theoretical survival rate of individualmicroorganisms in respect of the season and the locationof the carrier was estimated based on Tukey’s test at thesignificance levels P ≤ 0.05 and P ≤ 0.01.
3. Results and Discussion
3.1. Climatic Conditions. The effectiveness of sludge dryingin solar drying plants is very closely connected with climaticconditions.
The detailed course of the analyzed indexes of microcli-mate in the summer cycle was presented in Figures 4, 5, and6.
In the summer cycle, the temperature in the pile of driedsludge remained above 20◦C and its gradual increase duringthe experiment was recorded up to a value of above 28◦C.The air temperature inside the drying plant hall was changingand ranged from 18◦C to 32◦C, with the average value of25.2◦C. The mean difference between the inside temperature
20
30
40
50
60
70
80
90
Rel
ativ
e hu
mid
ity
(%)
Relative humidity in solar drying plantOutside relative humidity
1 3 5 7 9 11 13 15 17 19 21 23 25 27
Time (days)
Figure 6: The course of relative humidity during the summer cycle(July).
0
2
4
6
8
10
Temperature in solar drying plantOutside temperatureTemperature in pile
Tem
pera
ture
(C
)
− 21 3 5 7 9 11 13 15 17 19 21 23 25 27
Time (days)
Figure 7: The course of temperature during the winter cycle (De-cember).
in the drying plant and the outside temperature was onaverage 3.0◦C (Figure 4).
The average daily level of solar radiation during the sum-mer cycle was 327.8 W × m−2, and the maximal radiationrecorded reached the value of 598.4 W×m−2 (Figure 5).
The course of the relative humidity inside the dryingplant hall was dependent on the air humidity outside andin both cases it showed considerable fluctuations. The lowestobserved value of relative humidity inside the hall was 34%,whereas the highest was 74%, on average 58% (Figure 6).
A detailed course of the analyzed indexes of microclimatein the winter cycle was presented in Figures 7, 8, and 9.
The temperatures recorded in the winter period were def-initely lower. The average temperature in the pile remainedat 3.6◦C, whereas the air temperature inside and outside thedrying hall was 3.4◦C and 2.0◦C, respectively, (Figure 7).
Also the solar radiation intensity reached considerablythe lowest level in comparison with the summer cycle. Themaximal value of radiation exceeded 72.0 W×m−2, whereasthe minimal value did not fall below 6.3 W×m−2, giving anaverage of 27.7 W×m−2 (Figure 8). Thus the measured daily

International Journal of Photoenergy 5
0
10
30
20
40
50
60
70
80
Sola
r ra
diat
ion
(W·m
−2)
1 3 5 7 9 11 13 15 17 19 21 23 25 27
Time (days)
Figure 8: The course of insolation during the winter cycle (Decem-ber).
65
70
75
80
85
95
90
100
Rel
ativ
e hu
mid
ity
(%)
Relative humidity in solar drying plantOutside relative humidity
1 3 5 7 9 11 13 15 17 19 21 23 25 27
Time (days)
Figure 9: The course of relative humidity during the winter cycle(December).
intensity of solar radiation was insufficient for the effectivedrying by means of radiation [13].
The monitored air humidity in the winter cycle remainedat the definitely higher level compared with the summer.Average values of the relative humidity inside the dryinghall amounted to about 84%, whereas outside this was 89%(Figure 9). Such a level of the air humidity made convectivedrying of sludge considerably more difficult [13].
The distribution of insolation and air temperature mayvary in different regions of Poland. The total yearly solarradiation intensity in the studied location stays within therange 996–1022 kWh × (m2 × year)−1 [14].
The average long-time relative humidity of the air inPoland expressed in percent during the year is 76%, withthe monthly average ranging from 71% in May to 88%in December. Large fluctuations occur in the daily cycle,irrespective of the season [15].
3.2. Physicochemical Analyses of Sewage Sludge. The averageresults of physicochemical analyses of sewage sludge in thesummer cycle were presented in Table 2.
The dry matter of mechanically dewatered sludge pro-cessed in the drying plant reached the value 16.22%. ThepH value was close to neutral and amounted to pH 6.69.
The content of organic substances in the sludge was 66.9%(Table 2).
The proportion of fertilizer components, phosphorus,calcium, and magnesium, was on the average level of thevalues for municipal sewage sludge, and the concentrationof seven tested heavy metals was low, qualifying the sludgefor use in agriculture (Table 2).
In the summer cycle, an increase in the sludge dry matterwas clearly visible. On 7th day of the study, it grew on averageto more than 40%, and on 28th day of the cycle, sludge inthe pile contained on average 86.4% dry matter. There was adecrease in organic substance proportion on 28th day of thestudy, as well as in total and ammonium nitrogen in driedsludge (Table 2). The other studied indexes were at the samelevel (Table 2).
Average results of physicochemical analyses of sewagesludge in the winter cycle were presented in Table 3.
Mechanically dewatered sludge processed in the dryingplant in the winter cycle contained an average 13.86% drymatter, thus slightly less than in the summer period. The pHvalue had a marginally higher level than that in the summercycle (pH 6.90), but it was also close to neutral. The contentof organic substances in the sludge was on average 64.2% andwas slightly lower than in the summer cycle (Table 3).
Just as in the material intended for drying in the sum-mer, the proportion of fertilizer components, phosphorus,calcium, and magnesium, was characteristic of municipalsewage sludge, and the content of seven studied heavy metalswas low, qualifying sludge for use in agriculture (Table 3). Itis worthy of note that the mercury content in sewage sludgesubjected to solar drying in the winter cycle (Table 3) is muchlower than in summer (Table 2). This difference probablyresults from a slightly different chemical composition ofsewage (higher content of mercury) directed to the sewagetreatment plant during the particular period, which directlyinfluenced the physicochemical parameters of sewage sludge.
During the winter research cycle, a small increase in thesludge dry matter was visible, considerably smaller than inthe summer. On 7th day of the study, it grew to more than18.9%. On 28th day of the study, the sludge in the pilecontained 24.54% D.M (Table 3).
Just as in the summer, also in the winter cycle a decreasein organic substance in the dried sludge from 64.2% to 62.4%was observed. Contrary to the summer period, a distinctdecrease in the total nitrogen content during sludge dryingdid not occur. The other studied indexes were not changed(Table 3).
The humidity of raw material has a substantial effect onthe final level of sewage sludge drying in the solar dryingplant. In the present study, the average dry matter contentin sludge after centrifuge was 16.22% in the summer cycleand 13.86% in the winter cycle (Tables 2 and 3) and did notdiffer significantly from that given by other authors [16–18],where it was in the range 13.80–28.00%. In the summer cycle,the average proportion of dry matter in the sludge driedmaterial after 28 days of the process increased to 86.4% andwas similar to that observed by Bux et al. [16] during 21 daysof solar drying. Slightly better effects of drying were reported

6 International Journal of Photoenergy
Table 2: Average results of physicochemical analyses of sewage sludge in summer cycles.
Average results for summer cycles (replications number = 3)
Parameter Unit Sampling terms for the research (days)
0 7 14 21 28
Dry matter of sludge aftercentrifuge
% 16.22 (±0.16)∗ — — — —
Dry matter of sludge in the pile % — 40.30 (±4.00) 47.20 (±10.68) 69.90 (±10.81) 86.40 (±13.01)
Organic substance % D.M. 66.90 (±0.71) 67.00 (±0.71) 66.60 (±0.90) 65.70 (±1.45) 65.30 (±1.71)
pH — 6.70 (±0.16) 6.70 (±0.16) 6.69 (±0.13) 6.70 (±0.16) 6.70 (±0.18)
Total nitrogen content % D.M. 4.08 (±1.27) 4.05 (±1.28) 3.60 (±1.19) 3.30 (±1.04) 3.20 (±1.04)
Ammonium nitrogen content % D.M. 0.19 (±0.09) 0.16 (±0.10) 0.17 (±0.06) 0.15 (±0.02) 0.15 (±0.02)
Total phosphorus % D.M. 2.14 (±0.99) 2.12 (±0.98) 2.12 (±0.98) 2.05 (±0.94) 2.12 (±0.98)
Calcium content (Ca) % D.M. 1.13 (±0.14) 1.12 (±0.15) 1.12 (±0.15) 1.13 (±0.14) 1.13 (±0.14)
Magnesium content (Mg) % D.M. 0.43 (±0.03) 0.43 (±0.03) 0.43 (±0.03) 0.43 (±0.03) 0.43 (±0.03)
Heavy metals
Lead (Pb) mg/kg D.M. 31.50 (±0.58) 31.50 (±0.58) 31.50 (±0.58) 31.50 (±0.58) 31.51 (±0.53)
Cadmium (Cd) mg/kg D.M. 2.41 (±0.09) 2.42 (±0.07) 2.40 (±0.11) 2.41 (±0.09) 2.41 (±0.09)
Mercury (Hg) mg/kg D.M. 1.03 (±0.60) 1.00 (±0.57) 1.00 (±0.57) 1.00 (±0.57) 1.00 (±0.57)
Nickel (Ni) mg/kg D.M. 16.30 (±3.90) 16.31 (±3.76) 16.30 (±3.90) 16.30 (±3.90) 16.31 (±3.75)
Zinc (Zn) mg/kg D.M. 1100.00 (±84.97) 1100.00 (±84.97) 1100.00 (±84.97) 1100.00 (±84.97) 1100.00 (±84.97)
Copper (Cu) mg/kg D.M. 240.50 (±19.05) 240.50 (±19.05) 240.52 (±20.17) 240.51 (±20.15) 240.50 (±19.05)
Chromium (Cr) mg/kg D.M. 38.37 (±23.56) 38.30 (±23.58) 38.37 (±23.56) 38.36 (±23.55) 38.37 (±23.56)∗
Standard deviation.
Table 3: Average results of physicochemical analyses of sewage sludge in winter cycles.
Average results for winter cycles (replications number = 3)
Parameter Unit Sampling terms for the research (days)
0 7 14 21 28
Sludge dry matter after centrifuge % 13.86 (±0.62)∗ — — — —
Sludge dry matter in the pile % — 18.90 (±3.21) 21.43 (±4.33) 25.12 (±3.93) 24.54 (±4.84)
Organic substance % D.M. 64.20 (±2.17) 65.50 (±2.04) 64.20 (±2.65) 63.40 (±2.87) 62.40 (±3.50)
pH — 6.90 (±0.06) 6.90 (±0.06) 7.00 (±0.11) 6.98 (±0.10) 6.90 (±0.06)
Total nitrogen content % D.M. 2.10 (±0.15) 2.12 (±0.17) 2.00 (±0.06) 2.12 (±0.17) 2.09 (±0.23)
Ammonium nitrogen content % D.M. 0.10 (±0.06) 0.10 (±0.06) 0.11 (±0.04) 0.09 (±0.03) 0.15 (±0.01)
Total phosphorus % D.M. 2.20 (±0.12) 2.22 (±0.13) 2.21 (±0.11) 2.20 (±0.12) 2.20 (±0.12)
Calcium content (Ca) % D.M. 1.15 (±0.03) 1.13 (±0.03) 1.12 (±0.02) 1.15 (±0.03) 1.15 (±0.03)
Magnesium content (Mg) % D.M. 0.23 (±0.04) 0.23 (±0.04) 0.23 (±0.04) 0.34 (±0.05) 0.23 (±0.03)
Heavy metals
Lead (Pb) mg/kg D.M. 22.23 (±2.79) 22.20 (±2.76) 22.20 (±2.76) 22.20 (±2.76) 22.20 (±2.76)
Cadmium (Cd) mg/kg D.M. 1.98 (±0.26) 1.97 (±0.21) 1.89 (±0.20) 1.89 (±0.20) 1.87 (±0.18)
Mercury (Hg) mg/kg D.M. 0.05 (±0.03) 0.05 (±0.03) 0.05 (±0.03) 0.00 (—) 0.05 (±0.03)
Nickel (Ni) mg/kg D.M. 19.50 (±1.94) 19.50 (±2.12) 19.50 (±1.94) 19.50 (±1.94) 19.50 (±1.94)
Zinc (Zn) mg/kg D.M.1248.00
(±131.15)1248.00
(±131.15)1248.00
(±131.15)1249.00
(±125.87)1250.00
(±126.26)
Copper (Cu) mg/kg D.M. 220.70 (±17.43) 220.70 (±17.43) 220.70 (±17.43) 220.70 (±17.50) 220.70 (±17.43)
Chromium (Cr) mg/kg D.M. 27.64 (±2.08) 27.64 (±2.08) 27.64 (±2.08) 27.64 (±2.08) 27.64 (±2.08)∗
Standard deviation.

International Journal of Photoenergy 7
Table 4: Number of indicator bacteria in particular determination times.
Cycle Bacteria number [MPN × g−1]Drying time
(days)
0 7 14 21 28
Sludge from carriers placed on the turner frame
Salmonella Senftenberg W775 4.5 × 10⁷ 3.83 × 10⁶ 9.97 × 10⁷ 4.83 × 10⁵ 2.8 × 10⁵
Summer Escherichia coli 4.33 × 10⁷ 6.83 × 10⁶ 3.17×10⁴ 6.83 × 10³ 4.5 × 10³
Enterococci 6.13 × 10⁷ 5.5 × 10⁶ 4.15 × 10⁷ 2.13 × 10⁵ 1.87 × 10⁵
Salmonella Senftenberg W775 2.13 × 10⁹ 3.83 × 10⁸ 1.38 × 10⁹ 1.73 × 10⁷ 3.83 × 10⁶
Winter Escherichia coli 3.83 × 10⁷ 3.83 × 10⁷ 1.51 × 10⁸ 6.17 × 10⁴ 1.83 × 10⁵
Enterococci 9.0 × 10⁷ 1.82 × 10⁹ 1.25 × 10⁹ 1.07 × 10⁹ 3.25 × 10⁸
Sludge from carriers placed on the turner shovels
Salmonella Senftenberg W775 4.5 × 10⁷ 6.5 × 10⁶ 2.86 × 10⁵ 4.9 × 10³ 4.67 × 10²
Summer Escherichia coli 4.33 × 10⁷ 4.33 × 10⁵ 7.83 × 10⁶ 2.65 × 10⁴ 7.65 × 10³
Enterococci 6.13 × 10⁷ 2.15 × 10⁸ 4.37 × 10⁸ 5.17 × 10⁶ 5.5 × 10⁶
Salmonella Senftenberg W775 2.13 × 10⁹ 1.38 × 10⁹ 1.73 × 10⁸ 2.83 × 10⁶ 1.72 × 10⁷
Winter Escherichia coli 3.83 × 10⁷ 7.17 × 10⁷ 9.67 × 10⁵ 9.33 × 10⁴ 1.55 × 10⁵
Enterococci 9.0 × 10⁷ 6.17 × 10⁸ 2.38 × 10⁸ 3.17 × 10⁸ 1.07 × 10⁹
Sudge from carriers placed in the sludge pile
Salmonella Senftenberg W775 4.5 × 10⁷ 3.17 × 10⁶ 1.77 × 10⁶ 6.17 × 10⁵ 3.17 × 10⁵
Summer Escherichia coli 4.33 × 10⁷ 2.84 × 10⁷ 3.8 × 10⁵ 3.26 × 10⁴ 7.17 × 10²
Enterococci 6.13 × 10⁷ 3.75 × 10⁸ 2.48 × 10⁷ 5.98 × 10⁴ 7.17 × 10³
Salmonella Senftenberg W775 2.13 × 10⁹ 2.13 × 10⁹ 5.58 × 10⁸ 7.83 × 10⁶ 6.83 × 10⁶
Winter Escherichia coli 3.83 × 10⁷ 2.5 × 10⁷ 7.83 × 10⁵ 1.2 × 10⁶ 3.17 × 10⁶
Enterococci 9.0 × 10⁷ 9.17 × 10⁸ 1.67 × 10⁸ 1.13 × 10⁹ 1.67 × 10⁹
by Hertwig [19], as after 20 days of the process sewage sludgecontained 94% dry matter.
3.3. Microbiological Analyses. In the sludge after centrifugingcollected to the analyses, no bacilli of the genus Salmonellawere isolated, and the number of isolated E. coli and entero-cocci was on average 105 and 104 NPL × g−1, respectively.
Using the PCR technique, it was found that the bacteriareisolated from carriers and cultured on BPLS agar belongedto the genus Salmonella. Their presence was proved bythe product of 284 bp corresponding to the fragment invA(Figure 10).
The results of API 20E tests for the microorganismsgrown on ENDO agar determined the code 5144572, typicalof E. coli. The final identification of bacteria grown on agarwith kanamycin and azide based on the Phadebact D-StrepTest confirmed the presence of enterococci.
During sewage sludge solar drying in the summer cycle,a partial elimination of all the studied bacteria was observed(Table 4). This was dependent on the kind of carriers andtheir location. The population of Salmonella SenftenbergW775 decreased during 28 days of the process on average byabout 2 log in sludge from the carriers placed on the frameof the turner and from carriers placed in the pile (Table 4).
In the carriers placed on the shovels of the turner, areduction in their population was on average as much as
M P1 P2 P3 P4 P5 KN M
(bp)
1031900800700600500400
300
200
100
Figure 10: The PCR test confirming the presence of bacilli in thestudied material (M: the size marker, P1: a sample from the carrierplaced on the frame of the turner, P2: a sample from the carrierplaced on the shovels of the turner; P3: a sample from the carrierplaced in the sludge pile, P4: Salmonella Agona, P5: SalmonellaBraenderup H9812 (P4 and P5: positive control), KN: negativecontrol).

8 International Journal of Photoenergy
Table 5: Results of statistical analysis of obtained microbiological data.
Cycle Bacteria Regression equation R2 (%)Theoretical time of
survival (days)Elimination rate (log
MPN × day−1)
Sludge from carriers placed on the turner frame
Summer
SalmonellaSenftenberg W775
y = −0.075x + 7.57 61.11 104A,a,c,j 0.08A,G,a,e,f,j,n
Escherichia coli y = −0.157x + 7.43 88.93 47B,a,c,j 0.16B,D,a,d,j,n
Enterococci y = −0.089x + 7.68 68.95 89A,D,a,d,j 0.09A,D,G,c,e,f,g
Winter
SalmonellaSenftenberg W775
y = −0.103x + 9.48 77.69 94A,E,a,e,j,g 0.10A,D,G,I,b,e,h
Escherichia coli y = −0.106x + 7.85 65.97 75A,B,b,d,f,g 0.11A,D,G,I,b,e,h
Enterococci y = 0.012x + 8.46 6.26 — 0.01C,E,a,e,i,m
Sludge from carriers placed on turner shovels
Summer
SalmonellaSenftenberg W775
y = −0.192x + 7.72 96.57 40B,a,c,j 0.19B,F,a,e,j,n
Escherichia coli y = −0.139x + 7.51 74.77 55B,D,E,c,h,k 0.14A,D,F,H,I,b,d,i,k,l
Enterococci y = −0.050x + 8.23 38.99 168C,F,G,a,c,f,h 0.05E,G,f,j,k
Winter
SalmonellaSenftenberg W775
y = −0.096x + 9.29 70.46 98A,a,c,j 0.10A,D,G,I,e,l,m
Escherichia coli y = −0.111x + 7.78 77.03 71A,B,E,b,d,h,l,k 0.11A,D,G,I,c,e,l,o
Enterococci y = 0.030x + 8.01 36.67 — −0.03C,a,e,j,l,n
Sludge from carriers placed in a sludge pile
Summer
SalmonellaSenftenberg W775
y = −0.070x + 7.28 91.29 104A,a,c,j 0.07A,G,a,e,j,n
Escherichia coli y = −0.187x + 7.84 92.09 42B,a,c,j 0.19B,H,a,e,j,n
Enterococci y = −0.165x + 8.57 79.27 52B,D,c,e,k 0.17B,I,a,g,k,n
Winter
SalmonellaSenftenberg W775
y = −0.107x + 9.60 81.05 90A,D,a,f,i,j,k 0.11A,D,G,I,c,e,l,p
Escherichia coli y = 0.051x + 7.37 50.05 148C,F,G,g,j,k 0.05E,G,g,k,n
Enterococci y = 0.035x + 7.99 40.77 — 0.04C,a,g,h,j,k,o,p,m
A, B, C,. . .Highly statistically significant differences (P ≤ 0.01).
a, b, c,. . . Statistically significant differences (P ≤ 0.05).
5 log. The mean theoretical time of survival of SalmonellaSanftenberg W775 in the summer cycle, calculated basedon the regression equations, was 104 days in dried sludgefrom the carriers placed on the frame of the turner andin the pile. This time was highly statistically significantlylonger than that in the sludge from carriers on the shovelsof the turner (40 days) (Table 5). The elimination rate ofthe bacteria on the shovels was highly significantly higher(0.19 log MPN × day−1) in relation to the other samples(0.08 and 0.07 log MPN × day−1) (Table 5).
At the same time, the number of E. coli isolated fromcarriers located on the frame and shovels of the turnerdecreased on average by about 4 log, whereas in the pile byabout 5 log (Table 4). The mean theoretical times of survivalranged from 42 to 55 days (Table 5).
In the summer cycle, the highest average decrease in thenumber of enterococci, amounting to 4 log, was observedin the sludge from carriers placed in the pile, whereas thelowest, about 1 log, was observed in the material fromcarriers on the turner shovels (Table 4). In the sludge sub-jected to solar drying in the summer cycle, enterococciwere theoretically able to survive on average from 52 days
in the material from carriers placed in the pile to 168days in samples from the turner shovels, at the eliminationrate ranging from 0.05 to 0.17 log MPN × day−1 (Table 5).Highly statistically significant differences in the theoreticalsurvival rates of enterococci were found between the materialfrom the pile and the sludge from the other two locations,and statistically significant differences between samples fromthe turner frame and those from the pile (Table 5).
The available literature data shows that solar drying doesnot provide the complete sanitization of sewage sludge evenin the summer cycles. The study by Bux et al. [16] conductedon technical scale in sludge solar drying plants working withcharging method indicated that during the cycle lasting 21days a reduction in the number of fecal coliform bacteriaby 3 log10 was obtained. Also in experiments conducted inAustralia [20], despite more favorable climatic conditions,a considerable smaller decrease in the number of E. coliwas found in comparison with the present study, amountingto 1 log10. Also in the pilot study conducted in Turkey byOgleni and Ozdemir [21], the number of fecal coliformbacteria in sludge after 12 weeks of solar drying did notfall below 1.0 × 10³ MPN × g−1 D.M., just as during its

International Journal of Photoenergy 9
storage. Mathioudakis et al. [22], in spite of very hightemperatures, from 35 to 40◦C, and large sun exposurefrom 950 to 1000 W × m−2, obtained only a slight reductionin the number of coliform bacteria from 4 × 10⁶ to 2 ×10⁴ MPN × g−− D.M. and of fecal coliform bacteria from 3× 10⁵ to 103 MPN × g−1 D.M. in the dried sludge. Differentresults were obtained by Cota et al. [17] studying sludge atthe pilot sludge drying plant in Mexico. The elimination ofthe studied pathogens proceeded in a very fast rate there.At the beginning of the research cycle, the number of fecalcoliform bacteria amounted to 3.87 × 10⁶ MPN × g−1 D.M.After 4 days (98 h), a decrease in the number up to 7.74 ×10⁴ MPN × g−1 D.M. was obtained, whereas after 11 days(269 h) only up to 1.6× 100 MPN × g−1 D.M. were isolated.
During the winter cycle of sludge solar drying, thenumber of Salmonella Senftenberg W775 decreased on aver-age by 2-3 log, depending on the location (Table 4). Theaverage theoretical time of survival calculated based on theregression line equation ranged from 90 to 98 days, at theelimination rate from 0.11 to 0.10 log MPN × day−1, respec-tively (Table 5). The above values did not differ significantly(Table 5). In the sludge from carriers located on the turnerframe and in the pile, bacilli of Salmonella Senftenberg W775
theoretically survived slightly shorter in the winter cycle ascompared with the summer, whereas in the samples fromthe turner shovels the reverse tendency occurred, and thedifferences in the survival time and elimination rate werehighly statistically significant (Table 5).
A decrease in the number of E. coli in the winter periodwas very low and ranged between 1 and 2 log (Table 4).The average theoretical time of survival of E. coli in thewinter cycle ranged from 75 to 148 days at the eliminationrate within the range 0.05–0.11 log MPN × day−1 (Table 5).Differences in the theoretical survival time between microor-ganisms isolated from the carriers placed in the pile andthose obtained from samples collected at the other twolocations were highly statistically significant, and those in theelimination rate were statistically significant (Table 5). Bacilliof E. coli survived longer in the winter cycle than in summer,and the observed differences in the theoretical survivabilityand elimination rate resulting from the season were highlystatistically significant for the microorganisms isolated fromthe carriers placed in the pile and statistically significant forthe bacilli from the carriers located on the frame of the turner(Table 5).
A low effectiveness of the method of sewage sludgesolar drying in the winter cycle is particularly noticeableon the example of the dynamics of changes in enterococcipopulation count. Conditions prevailing in the drying plantduring winter did not cause the elimination of those bacteria,but contributed to their unexpected multiplication. During28 days of the process, the count of enterococci in sludgefrom the carriers placed on the turner frame increased onaverage by about 1 log, whereas at the other two locationsthe increase was at a level of 2 log (Table 4).
A very low sanitization effectiveness of drying processin the winter cycle observed in the present study confirmsthe results obtained by Mathioudakis et al. [22], who didnot report a significant reduction in the microorganism
0
10
20
30
40
50
60
70
80
90
100
0 7 14 20 28
Inva
sive
egg
s (%
)
Time (days)
FramePileShovel
96 9697 95 9595.67
77 77.6781.67
39.83
95 94.67
2.67
95.67 9596 96 95 9595.67
77 77.6781.67
39.83
95 94.67
2.67
95.67 95
Figure 11: The course of inactivation of Ascaris suum eggs insummer cycle (July).
quantity in winter. The amount of E. coli they found indried wastes was high and ranged from 8 × 10⁵to 2 ×10⁶ MPN × g−1 D.M. Also Ogleni and Ozdamir [21] underautumn and winter conditions obtained a low degree ofelimination of faecal coliforms, not exceeding 1 log10. Buxet al. [16] obtained different results. The authors observeda reduction in faecal coliforms from 2.4 × 10⁵to 9.3 ×101 MPN × g−1 D.M. after 49 days.
3.4. Parasitological Analyses. The results of the study ob-tained in the summer cycle indicated that waste solar dryingresulted in a small inactivation of parasite eggs (Figure 11).However, during the experiment, clear fluctuations in thepercentage of invasive eggs in individual carriers couldbe observed (Figure 11), which may indicate the lack ofuniform conditions during the drying process and its poorsanitization potential.
The environmental impact on retaining invasivenessby Ascaris suum eggs was largely dependent on locationof the carriers. After 28 days of the process, on average93.33% decrease in live parasite eggs was obtained in thecarrier located on the frame (Figure 11). However, a slightreduction, that is, from 1.0% to 1.33%, was obtained in theresearch material placed on the shovel of the turner and inthe waste pile (Figure 11). Such considerable reduction inthe percentage of invasive eggs in the carrier on the framemay result from the fact that material placed inside had thesmallest contact with the mass of dried sludge. Thereforeit was more susceptible to drying and the effect of highertemperature, that is, factors facilitating the elimination ofAscaris suum eggs, which are very sensitive to moisturedeficit.
During the winter cycle, similarly to the summer period,slight fluctuations in the percentage of Ascaris suum eggswere observed in the material collected from the carri-ers, which indicated the lack of proper waste sanitization(Figure 12). In the winter cycle a considerable decrease in

10 International Journal of Photoenergy
Table 6: Values of parameters that determine the way of using sewage sludge [11].
Number Parameter
Type of reuse
Reuse in agriculture andagricultural land
reclamation
Reuse for nonagriculturalland reclamation
Reuse for the cultivation ofplants destined for compost
production; reuse for thecultivation of plants which
are not destined forconsumption and fodder
production
1 Cadmium Cd [mg × kg−1 DM] 20 25 50
2 Copper Cu [mg × kg−1 DM] 1000 1200 2000
3 Nickel Ni [mg × kg−1 DM] 300 400 500
4 Lead Pb [mg × kg−1 DM] 750 1000 1500
5 Zinc Zn [mg × kg−1 DM] 2500 3500 5000
6 Mercury Hg [mg × kg−1 DM] 16 20 25
7 Chromium Cr [mg × kg−1 DM] 500 1000 2500
8 Number of Salmonella [cfu × 100 g−1] 0 u∗ u
9 ATT [egg × kg−1 DM] 0 ≤300 ≤300∗
Undefined.
0
10
20
30
40
50
60
70
80
90
100
0 7 14 20 28
Inva
sive
egg
s (%
)
Time (days)
FramePileShovel
94 9597
89.3390.33 91.33 91.6794.6792.67 92 91 93.33 92.67 91.3394
Figure 12: The course of inactivation of Ascaris suum eggs in wintercycle (December).
percentage of invasive A. suum eggs in the carrier on theframe was not observed, since temperature inside the hallwas lower and air humidity was higher than in the summerseason.
Different results were obtained by Shanahan et al. [23]who, while conducting a study of a system with an aisleturner in south-east Queensland, observed a reduction in thenumber of invasive eggs of Ascaris sp. and Taenia sp. duringwaste solar drying to the level below 1 egg per 4 g of drymatter.
Hertwig [19] proves that the main factor limiting adevelopment of helminth eggs in wastes is a decrease inwater activity index (aw) below 0.65. Obtaining an increasein dry matter to 94% after 20 days of intensive waste drying,he observed the complete elimination of Ascaris suum eggs.
A similar phenomenon was observed by Cota et al. [17]who proved that an increase in the proportion of waste drymatter during solar drying up to 93.33% resulted in theeffective inactivation of the eggs of Ascaris lumbricoides andHymenolepis.
The obtained results of microbiological and parasitolog-ical analyses show that the process of sewage sludge solardrying does not provide sufficient hygienization, and in somecases it favors multiplying microorganisms in dried material.Therefore it is essential to show possibilities for managementof the final product generated in described facility. The basicPolish legal act laying down guidelines of sewage sludgemanagement depending on its properties is the Regulationof the Minister of Environment of 13 July 2010 on municipalsewage sludge (Dz.U. of 2010 no. 137 item 924) [11]. Thisregulation is in accordance with international regulations,including the following:
(i) Regulation (EC) no. 1774/2002 of the European Par-liament and of the Council of 3 October 2002 layingdown health rules concerning animal by-productsnot intended for human consumption,
(ii) Directive 98/34/EC of the European Parliament andof the Council of 22 June 1998 laying down a proce-dure for the provision of information in the field oftechnical standards,
(iii) and Council Directive 86/278/EEC of 12 June 1986 onthe protection of the environment, and in particularof the soil, when sewage sludge is used in agriculture.
The above mentioned regulation [11] includes valuesof parameters determining the way of sewage sludge man-agement (Table 6). It is notable that in most cases sludgesubjected to drying is relatively safe in microbiological andparasitological terms and contain normative amount ofheavy metals. Consequently, the product obtained after solar

International Journal of Photoenergy 11
drying can be used as a fertilizer. However, in the case ofoccurrence of pathogenic bacteria and eggs of gastrointesti-nal parasites in the batch material, as it was in the describedexperiment, the hygienization potential of solar drying plantis insufficient. In such situation, sludge after drying canbe used for nonagricultural land reclamation, cultivation ofplants destined for compost production and cultivation ofplants which are not destined for consumption and fodderproduction, or constitute an energy substrate in the processof burning or coburning.
During the operation of sludge solar drying plant, con-stant microbiological and parasitological monitoring of bothwatered and dried sludge making its final product is ofutmost importance. Only obtaining such results, it is possibleto choose the optimal way of managing processed sludge.
4. Conclusions
Based on the obtained results, it may be concluded thatwaste solar drying is a technology that does not guaranteeobtaining of stable, biologically safe material for agriculturalpurposes. The lack of explicit positive results of eliminationof harmful microflora in both seasons of the year in dryingplants located under various climatic conditions confirmsthat solar drying technology cannot be regarded as aneffective technology of waste sanitization. In this respect, itis much less effective than other biological (e.g., composing),chemical (e.g., liming), and physical (e.g., pasteurization)methods of waste processing. To obtain sanitary clean wastes,the vast majority of the authors report the need for additionalsanitization treatments. Subjecting waste dried material topelletization may guarantee obtaining its proper sanitiza-tion.
References
[1] J. A. Oleszkiewicz, Gospodarka osadami sciekowymi, Poradnikdecydenta, LEM s.c., Krakow, Poland, 1998.
[2] F. O. Kocaer, U. Alkan, and H. S. Baskaya, “The effect ofalkaline-stabilized-sludge application on the microbiologicalquality of soil and leachate,” Journal of Plant Nutrition and SoilScience, vol. 167, no. 6, pp. 704–712, 2004.
[3] M. Michałkiewicz, “Podstawowe testy biologiczne stosowanew eksploatacji oczyszczalni sciekow,” in Proceedings of theEksploatatora Forum, no. 1, 2002.
[4] B. Nørrung and S. Buncic, “Microbial safety of meat in theEuropean Union,” Meat Science, vol. 78, no. 1-2, pp. 14–24,2008.
[5] J. Zamorska, “Organizmy patogenne w osadach sciekowych,”Zeszyty Naukowe PTIE i PTG Oddziału w Rzeszowie, vol. 9,2007.
[6] J. Bien, Osady ScIekowe TeorIa I Praktyka, WydawnictwoPolitechniki Czestochowskiej, Czestochowa, Poland, 2002.
[7] L. Sahlstrom, “A review of survival of pathogenic bacteria inorganic waste used in biogas plants,” Bioresource Technology,vol. 87, no. 2, pp. 161–166, 2003.
[8] I. L. Pepper, J. P. Brooks, and C. P. Gerba, “Pathogens inBiosolids,” Advances in Agronomy, vol. 90, pp. 1–41, 2006.
[9] Y. H. Sun, Y. M. Luo, L. H. Wu, Z. G. Li, J. Song, and P. Christie,“Survival of faecal coliforms and hygiene risks in soils treated
with municipal sewage sludges,” Environmental Geochemistryand Health, vol. 28, no. 1-2, pp. 97–101, 2006.
[10] R. Sobczyk, “Gospodarka komunalnymi osadami sciekowymiteoria a praktyka,” in Proceedings of the 6th Konferencja Nauk-owo-Techniczna Woda-Człowiek-Srodowisko, Lichen, Poland,2007.
[11] “Rozporzadzenie Ministra Srodowiska z dnia 13 lipca 2010 r.w sprawie komunalnych osadow sciekowych,” Dziennik Ustaw,no. 137, p. 924, 2010.
[12] K. Rahn, S. A. De Grandis, R. C. Clarke et al., “Amplificationof an invA gene sequence of Salmonella typhimurium bypolymerase chain reaction as a specific method of detectionof Salmonella,” Molecular and Cellular Probes, vol. 6, no. 4, pp.271–279, 1992.
[13] R. Sobczyk and P. Kabus, “Słoneczne suszarnie osadow,” inForum Eksploatatora, no. 03, Wydawnictwo Seidel-Przywecki,2006.
[14] http://www.neostar.com.pl/.[15] J. Szczygieł and P. Krawczyk, “Uwarunkowania słonecznego
suszenia osadow sciekowych,” Gaz, Woda I TechnIka SanI-tarna, no. 3, pp. 30–44, 2006.
[16] M. Bux, R. Baumann, W. Philipp, T. Conrad, and W.Muhlbauer, “Class—a by solar drying recent experiences inEurope,” in Proceedings of the Water Environment Federation(WEFTEC’01), pp. 309–317, Atlanta, Ga, USA, 2001, session45.
[17] A. D. Cota, C. Figueroa, E. Espinoza et al., “Active SolarDrying of Wastewater Sludge: Physicochemical, Toxicologi-cal, and Nutrimental Characterization,” Mexico, http://www.uacj.mx/docentes/juflores/Documents/, 2007.
[18] S. Nathan and B. Clarke, SolarMix—Innovation in DryingTechnology, CabWater Caboolture Shire Council, ArkwoodOrganic Recycling Pty, Mixwell Specialized Transport Pty,2004.
[19] P. K. Hertwig, Seuchenhygienische Untersuchungen bei derTrocknung und Pelletierung von Klarschlamm. [Diplomarbait],Universitat Hohenheim, 2004.
[20] K. Barr, M. Bux, S. Horn, and J. McLellan, “Accelerated air-drying of sewage sludge using a climate-controlled solardrying hall,” http://www.thermo-system.com/, 2002.
[21] N. Ogleni and S. Ozdemir, “Pathogen reduction effects of solardrying and soil application in sewage sludge,” Turkish Journalof Agriculture and Forestry, vol. 34, pp. 509–515, 2010.
[22] V. L. Mathioudakis, A. G. Kapagiannidis, E. Athanasoulia, V. I.Diamantis, P. Melidis, and A. Aivasidis, “Extended dewateringof sewage sludge in solar drying plants,” Desalination, vol. 248,no. 1–3, pp. 733–739, 2009.
[23] E. F. Shanahan, A. Roiko, N. W. Tindale, M. P. Thomas, R.Walpole, and D. Ipek Kurtboke, “Evaluation of pathogenremoval in a solar sludge drying facility using microbial indi-cators,” International Journal of Environmental Research andPublic Health, vol. 7, no. 2, pp. 565–582, 2010.

Hindawi Publishing CorporationInternational Journal of PhotoenergyVolume 2012, Article ID 194823, 6 pagesdoi:10.1155/2012/194823
Research Article
Treatment of Pesticides in Wastewater by Heterogeneous andHomogeneous Photocatalysis
Catalina Daniela Stan,1 Igor Cretescu,2 Cristina Pastravanu,3
Ioannis Poulios,4 and Maria Dragan1
1 Department of Drug Industry and Pharmaceutical Biotechnology, Grigore T. Popa University of Medicine and Pharmacy,16 Universitatii Street, 700115 Iasi, Romania
2 Department of Environmental Engineering and Management, Faculty of Chemical Engineering and Environmental Protection,Gheorghe Asachi Technical University of Iasi, 73 Professor D. Mangeron Street, 700050 Iasi, Romania
3 Department of Materials Chemistry, “Al. I. Cuza” University of Iasi, 11 Carol I Boulvard, 700506 Iasi, Romania4 Department of Chemistry, Aristotle University of Thessaloniki, 54124 Thessaloniki, Greece
Correspondence should be addressed to Igor Cretescu, [email protected]
Received 1 June 2012; Revised 10 August 2012; Accepted 21 August 2012
Academic Editor: Meenakshisundaram Swaminathan
Copyright © 2012 Catalina Daniela Stan et al. This is an open access article distributed under the Creative Commons AttributionLicense, which permits unrestricted use, distribution, and reproduction in any medium, provided the original work is properlycited.
The effect of different heterogeneous and homogeneous photocatalytic systems on the oxidative degradation of mepiquat chloridein aqueous solutions was investigated. In the case of heterogeneous reactions, the influence of five factors was studied: the typeof catalyst, photocatalyst concentration, pH, pesticide concentration, and the presence of H2O2 and/or Fe3+. For homogeneouscatalysis, other factors were studied: the oxidising agent and the light source. Nearly complete degradation of mepiquat chloridewas obtained after about 180 minutes in the presence of an acid medium (pH3) using a UV-A lamp and TiO2P-25 catalyst (0.5 g/L),for an initial pesticide concentration of 10 ppm. Degradation rates corresponding to homogeneous photocatalysis were lowercompared to those corresponding to the use of TiO2 as the photocatalyst.
1. Introduction
Removing refractory organic pollutants from wastewaters isan important issue given the fact that most of them are toxic,mutagenic, and/or carcinogenic, even in low concentrations,and are a real health threat to humans, animals, as well asto the environment [1]. Heterogeneous and homogeneoussolar photocatalytic detoxification methods (TiO2/H2O2,Fe+3/H2O2) have recently shown great promise for thetreatment of industrial wastewater, groundwater, andcontaminated air [2].
Mepiquat chloride or 1,1-dimethylpiperidine chloride,also known as DPC, is a new plant growth regulator that canbe used on a variety of crops and exerts a variety of effects.It works by inhibiting gibberellic acid synthesis, reducesinternode length, hastens maturity, and retards abscission[3]. In addition, DPC is used to prevent the lodging of winter
wheat; for apples, it can increase calcium absorption, reducedby depression disease; for citrus, it can increase the sugarcontent. In agrochemical products, it is formulated as anemulsifiable concentrate, a water dispersible granulate and asa technical product. This pesticide was first registered in theUSA in 1980 to be used as a growth regulator of cotton, andin 1997 it was reregistered by the Environmental ProtectionAgency (EPA) for its use in the USA [4]. Currently, it isformulated as an emulsifiable concentrate at concentrationslower than 5% (w/v) [5].
Mepiquat chloride has the molecular formula C7H16ClNand a molecular weight of 149.66 g/mol. Figure 1 presents thestructural formula of 1,1-dimethylpiperidine chloride.
Mepiquat chloride is labelled as a potential groundwatercontaminant by the DPR (Department of Pesticide Regula-tion), because it has the potential to move into groundwaterbased on its water solubility, ability to bind to soils (Koc),

2 International Journal of Photoenergy
N+
CH3
Cl−
CH3
Figure 1: Structural formula of 1,1-dimethylpiperidine chloride.
and half-life. Its acute toxicity is classified as moderate bythe IRIS (Integrated Risk Information System) of the USEnvironmental Protection Agency.
In recent years, new and more severe regulations coupledwith enforcement against wastewater discharges have beenestablished in most industrially developed countries [6].This is why various technologies have been developed forthe advanced treatment of wastewater containing pollutantsthat cannot be removed by conventional treatment pro-cesses. Destructive oxidation methods such as heterogeneousphotocatalysis (TiO2/UV-A), ozonation, H2O2/UVB, photo-Fenton, and sonolysis are considered very attractive sincethey transform hazardous pollutants into compounds witha reduced impact on the environment [7]. Also, amongadvanced oxidation processes, homogeneous and heteroge-neous photochemical oxidation processes have proven theirefficiency in the degradation of refractory organic pollutants[8].
Photocatalysis implies the acceleration of a photoinducedreaction by the presence of a catalyst [9]. Photoinducedreactions are activated by the absorption of a photon withsufficient energy, that is, equal to or higher than the band-gap energy (Ebg) of the catalyst [10]. The absorption leads toa charge separation due to the promotion of an electron (e−)from the valence band of the semiconductor catalyst to theconduction band, thus generating a hole (h+) in the valenceband.
The activation equation can be written as:
TiO2 + hν −→ h+ + e− (1)
In this reaction, h+ and e− are powerful oxidising andreducing agents, respectively. The oxidation and reductionreactions can be expressed as:
oxidation reaction: h+ + OH− −→ OH• (2)
reduction reaction: e− + O2ads −→ O2ads− (3)
In order to sustain a photocatalysed reaction, e−-h+
recombination subsequent to the initial charge separationmust be prevented as much as possible [11].
Heterogeneous photocatalysis may be considered a viablealternative for the removal of refractory organics due to sev-eral important advantages such as: complete mineralizationor formation of more readily biodegradable intermediateswhen complex organic compunds are treated, no need ofauxiliary chemicals, no residual formation, easily operationand maintenance of the equipment [12].
Heterogeneous photocatalysis leads to the mineralisationof organic carbon using a semiconductor catalyst in suspen-sion or as a thin film. One advantage of the photocatalytic
process is its mild operating conditions and the fact that itcan be powered by sunlight, thus significantly reducing theamount of electric power required and therefore the operat-ing costs [13]. Heterogeneous photocatalysis is influenced bycatalyst loading, initial pollutant concentration, pH, radiantflux, aeration, the presence of other substances or impurities,and photoreactor geometry [14].
The most widely used semiconductor catalyst in pho-toinduced processes is titanium dioxide (TiO2), because itis chemically and biologically inert, photocatalytically stable,relatively easy to produce and to use, able to efficiently catal-yse reactions, cheap, and without risks to the environment orhumans [15].
Homogeneous photocatalysis uses UV radiation in com-bination with chemical oxidising agents such as hydrogenperoxide or ozone.
2. Experimental
2.1. Light Sources. For the photocatalytic degradation ofmepiquat chloride, a G23 Radium Ralutec UVA lamp (9W/78, 350–400 nm, I = 1.3517 ein/min) and a Radium RalutecVIS lamp (9W/71, I = 0.5898 ein/min) were used.
Actinometry was used to determine the exact radiationintensity of both lamps within the vessels. The radiationintensities obtained for the UVA and the VIS lamp were1.3517 ein/min and 0.3517 ein/min, respectively. After 10–15uses of the lamps, it was necessary to repeat the actinometricdeterminations to check that the lamp intensity remainedconstant.
2.2. Vessels and Reagents. For the photocatalytic experi-ments, a solution of mepiquat chloride pesticide was used. Ascatalysts, TiO2P-25, TiO2UV-100, TiO2-A, TiONa, and ZnOwere studied.
A photochemical reactor (Figure 2) with volume of500 mL was used to carry out the experimental tests. Thereactor was covered with a black cloth to avoid interactionswith ambient light.
2.3. Procedures and Analyses. In the initial 300 mL aqueoussolution of the pesticide (C = 10 mg/L), different quan-tities of catalysts were added. The reaction solutions weremagnetically stirred in the dark for 30 min until adsorp-tion/desorption equilibrium was reached. The solutions werethen irradiated under UV light with continuous magneticstirring. A fixed quantity of each mepiquat chloride solutionwas taken at regular time intervals during the illuminationperiod and filtered through a syringe filter to analysethe amount of pesticide remaining in the solution. DPCconcentrations during the experiments were monitored bya Total Organic Carbon Analyzer (Shimadzu), in order tomeasure the mineralisation of the pesticide.
3. Results and Discussion
3.1. Mepiquat Chloride Degradation by Heterogeneous Photo-catalysis. The influence of five experimental factors was

International Journal of Photoenergy 3
(1) photochemical reactor
(2) pierced cap
(3) quart glass tube
(4) plastic tubes
(5) compressor
(6) magnetic range
(7) magnetic steered
(8) UV lamp
+−
Figure 2: Photocatalysis experimental setup ((1) photochemicalreactor, (2) pierced cap, (3) quart glass tube, (4) plastic tubes,(5) compressor, (6) magnetic range, (7) magnetic steered, (8) UVlamp).
studied: the type of catalyst, photocatalyst concentration,pH, pesticide concentration, and the presence of H2O2
and/or Fe3+. The experiments were conducted by varying onefactor and keeping the others constant.
3.1.1. Influence of the Type of Catalyst. Five types of catalystswere investigated in this study: TiO2P-25, TiO2 UV-100,TiO2-A, TiONa, and ZnO; the results are plotted in Figure 3.
The corresponding amounts of catalyst were added to10 ppm solutions of mepiquat chloride in order to obtain adose of 0.5 g catalyst/L and then irradiated with UV-A light.From Figure 3, it can be seen that the TiO2P-25 catalystexhibited the best behaviour in the degradation of mepiquatchloride and was thus considered the reference catalyst. Theincrease of the TOC values in the case of the ZnO catalystmight be assigned to the desorption of the pesticide from theZnO surface, taking into consideration that the adsorptionof mepiquat chloride on this material is less intense incomparison with the other photocatalysts.
3.1.2. Influence of Catalyst Concentration. The influence ofcatalyst concentration was studied for the TiO2P-25 catalyst,which was chosen as the reference.
The degradation experiments were conducted using thesame pesticide concentration (10 ppm), the same UV-Alamp, and different concentrations of the same photocatalyst.The results are depicted in Figure 4.
As expected, Figure 4 shows that the most advancedpesticide degradation occurred when heterogeneous photo-catalysis was conducted with a higher dose of the catalyst(TiO2P-25).
3.1.3. Influence of pH. The influence of the pH of the solutionwas studied by conducting the photocatalyst experimentswith 0.5 g/L TiO2P-25 catalyst in 10 ppm mepiquat chloridesolution, using the UV-A lamp but adjusting the solution pH
1
2
3
4
5
6
7
0 20 40 60 80 100 120
TO
C (
mg/
L)
Time (min)
TiONa
ZnOTiO2-A
TiO2P-25TiO2UV-100
Figure 3: Pesticide degradation by heterogeneous photocatalysisusing different catalysts (initial conditions: 10 ppm mepiquatchloride, 0.5 g/L catalyst, UV-A lamp).
0
1
2
3
4
5
6
7
0 20 40 60 80 100 120 140 160 180
TO
C (
mg/
L)
Time (min)
0 g/L TiO2P-250.1 g/L TiO2P-250.25 g/L TiO2P-250.5 g/L TiO2P-25
0.75 g/L TiO2P-251 g/L TiO2P-252 g/L TiO2P-25
Figure 4: The TiO2P-25 dose influence on the degradation ofmepiquat chloride (initial conditions: 10 ppm mepiquat chloride,0.5 g/L TiO2P-25, UV-A lamp).
from acidic values (pH3, 4, and 5) to basic values (pH8, 9,and 11)
Figure 5 illustrates the variation in TOC/TOC(0) valuesover time at different pH values. The positive effect of acidicpH on pesticide degradation noted in the figure can beassigned to the fact that the TiO2 surface is positively chargedwhen the solution pH is lower than 6.8, thus facilitating thephotocatalytic process [9].
3.1.4. Influence of the Mepiquat Chloride Concentration. Theinfluence of the mepiquat chloride concentration on thephotocatalytic process was studied using the TiO2P-25 cat-alyst. The degradation experiments were conducted usingpesticide solutions of various initial concentrations, the same

4 International Journal of Photoenergy
0
0.2
0.4
0.6
0.8
1
1.2
0 20 40 60 80 100 120 140 160 180
TO
C/T
OC
(0)
Time (min)
pH = 3pH = 4pH = 5
pH = 8pH = 9pH = 11
Figure 5: Pesticide degradation over time at different pH values ofthe initial solution (initial conditions: 10 ppm mepiquat chloride,0.5 g/L TiO2P-25, UV-A lamp).
0
2
4
6
8
10
12
14
16
0 50 100 150 200 250
TO
C (
mg/
L)
Time (min)
5 mg/L pesticide
10 mg/L pesticide
20 mg/L pesticide
30 mg/L pesticide
Figure 6: Behaviour of different concentrations pesticide solutionsduring heterogeneous photocatalysis using UV-A light and 0.5 g/LTiO2P-25 as the catalyst.
UV-A lamp, and the same photocatalyst concentration(0.5 g/L). The results are shown in Figure 6.
3.1.5. The Influence of H2O2 or Fe+3. The next step of thisstudy focused on enhancing the photocatalysis reaction byadding H2O2 or Fe+3 in different concentrations to the initialsolution.
Figures 7 and 8 show pesticide degradation duringphotocatalysis with TiO2P-25, facilitated by H2O2 and Fe+3,respectively. The best degradation rate was obtained whenthe TiO2P-25 photocatalysis was used alone. It was noted thatno enhancement was obtained by adding H2O2 or Fe+3 at anydose.
3.2. Mepiquat Chloride Degradation by Homogeneous Pho-tocatalysis. Homogeneous photocatalytic oxidation of the
0
1
2
3
4
5
6
7
0 20 40 60 80 100 120 140 160 180
TO
C (
mg/
L)
Time (min)
0 mg/L H2O2
20 mg/L H2O2
50 mg/L H2O2
100 mg/L H2O2
Figure 7: Heterogeneous photocatalysis of mepiquat chloride inthe presence of TiO2P-25 and H2O2 (initial conditions: 10 ppmmepiquat chloride, 0.5 g/L TiO2P-25, UV-A lamp).
0
1
2
3
4
5
6
7T
OC
(m
g/L)
0 20 40 60 80 100 120 140 160 180
Time (min)
0 mg/L Fe+3
3.5 mg/L Fe+37 mg/L Fe+3
14 mg/L Fe+3
Figure 8: Heterogeneous photocatalysis of mepiquat chloride in thepresence of TiO2P-25 and Fe+3 (initial conditions: 10 ppm mepiquatchloride, 0.5 g/L TiO2P-25, UV-A lamp).
pesticide was also tested using two oxidising agents: aphoto-Fenton agent (H2O2 + Fe+3) and a ferrioxalate agent(potassium oxalate + H2O2 +Fe+3) in various concentrations.The influence of light was also studied using UV-A and VISlamps, respectively. The results are depicted in Figures 9 and10, respectively.
In the case of the photo-Fenton reagent, the best resultswere obtained when less oxidant was used: 50 ppm H2O2
and 3.5 ppm Fe+3. When more photo-Fenton agent was used,lower values for pesticide decontamination were obtained.
With the ferrioxalate reagent, an excellent degradationrate was obtained when visible light was used, as can be seenin Figure 11, this being economically reliable. When using theUV-A lamp, photodegradation results were comparable withthose achieved for photo-Fenton homogeneous catalysis.

International Journal of Photoenergy 5
3
3.5
4
4.5
5
5.5
6
6.5
0 20 40 60 80 100 120 140 160
TO
C (
mg/
L)
Time (min)
50 ppm H2O2; 3.5 ppm Fe+3
50 ppm H2O2; 7 ppm Fe+350 ppm H2O2; 14 ppm Fe+3
100 ppm H2O2; 14 ppm Fe+3
Figure 9: Homogeneous photocatalysis of mepiquat chlorideusing the photo-Fenton agent (initial conditions: 10 ppm mepiquatchloride, UV-A lamp).
0
5
10
15
20
25
0 20 40 60 80 100 120
TO
C (
mg/
L)
Time (min)
66 ppm oxalate; 50 ppm H 2O2; 14 ppm Fe+3
66 ppm oxalate; 100 ppm H 2O2; 14 ppm Fe+3
33 ppm oxalate; 50 ppm H 2O2; 7 ppm Fe+3
Figure 10: Homogeneous photocatalysis of mepiquat chlorideusing the ferrioxalate agent (initial conditions: 10 ppm mepiquatchloride, 0.5 g/L TiO2P-25, UV-A lamp).
4. Conclusions
(i) The present study demonstrated the possibility ofoxidative degradation of persistent organic pesticidesby heterogeneous photocatalysis.
(ii) Nearly complete degradation of mepiquat chloridewas obtained after about 180 minutes in the presenceof an acid medium (pH3) using a UV-A lamp andthe TiO2P-25 catalyst (0.5 g/L), for an initial pesticideconcentration of 10 ppm.
(iii) The remnant pesticide concentrations were higherwhen homogeneous photocatalytic oxidation wasinvolved, in comparison with levels obtained in a
0
5
10
15
20
25
0 20 40 60 80 100 120
TO
C (
mg/
L)
Time (min)
66 ppm oxalate; 50 ppm H 2O2; 14 ppm Fe+3
66 ppm oxalate; 100 ppm H 2O2; 14 ppm Fe+3
33 ppm oxalate; 50 ppm H 2O2; 7 ppm Fe+3
Figure 11: Homogeneous photocatalysis of mepiquat chlorideusing the ferrioxalate agent (initial conditions: 10 ppm mepiquatchloride, VIS lamp).
heterogeneous photocatalytic degradation processbased on TiO2.
(iv) Degradation rates corresponding to homogeneousphotocatalysis were lower compared to those corre-sponding to the use of TiO2 as the photocatalyst.In this way, the remnant concentrations of mepiquatchloride were below the drinking water level of com-parison for acute and chronic risk range for infantsand children (6 ppm), but as a consequence of theheterogeneous photocatalysis degradation process,this remnant concentration was about 10 times lowerthan the abovementioned level (0.54 ppm for 0.5 g/LTiO2P-25, Ci = 10 ppm pesticide).
(v) Moreover, we tested the possibility of reusing TiO2P-25 three times and found comparable photocatalyticactivity for the solids with each use. The TiO2
Degussa was recovered by simple washing, providingan economic advantage to this process.
(vi) Our study succeeded in achieving the task of finding asuitable photocatalytic system to provide a mepiquatchloride remnant concentration in accordance withEPA standards.
References
[1] I. Poulios, E. Micropoulou, R. Panou, and E. Kostopoulou,“Photooxidation of eosin Y in the presence of semiconductingoxides,” Applied Catalysis B, vol. 41, no. 4, pp. 345–355, 2003.
[2] G. D. Suditu, M. Secula, C. G. Piuleac, S. Curteanu, and I.Poulios, “Genetic algorithms and neural networks basedoptimization applied to the wastewater decolorization by pho-tocatalytic reaction,” Revista de Chimie, vol. 59, no. 7, pp. 816–825, 2008.
[3] 2012, http://chemyq.com/.[4] 2012, http://www.epa.gov/oppsrrd1/REDs/factsheets/.[5] G. Quintas, S. Garrigues, A. Pastor, and M. de la Guardia, “FT-
Raman determination of Mepiquat chloride in agrochemical

6 International Journal of Photoenergy
products,” Vibrational Spectroscopy, vol. 36, no. 1, pp. 41–46,2004.
[6] M. S. Secula, G. D. Suditu, I. Poulios, C. Cojocaru, and I.Cretescu, “Response surface optimization of the photocat-alytic decolorization of a simulated dyestuff effluent,” Chem-ical Engineering Journal, vol. 141, no. 1–3, pp. 18–26, 2008.
[7] A. F. Caliman, C. Cojocaru, A. Antoniadis, and I. Poulios,“Optimized photocatalytic degradation of Alcian Blue 8 GXin the presence of TiO2 suspensions,” Journal of HazardousMaterials, vol. 144, no. 1-2, pp. 265–273, 2007.
[8] S. Kaniou, K. Pitarakis, I. Barlagianni, and I. Poulios, “Photo-catalytic oxidation of sulfamethazine,” Chemosphere, vol. 60,no. 3, pp. 372–380, 2005.
[9] A. Mills and S. Le Hunte, “An overview of semiconductorphotocatalysis,” Journal of Photochemistry and Photobiology A,vol. 108, no. 1, pp. 1–35, 1997.
[10] O. Carp, C. L. Huisman, and A. Reller, “Photoinduced reactiv-ity of titanium dioxide,” Progress in Solid State Chemistry, vol.32, no. 1-2, pp. 33–177, 2004.
[11] I. Poulios, M. Kositzi, K. Pitarakis, S. Beltsios, and I.Oikonomou, “Photocatalytic oxidation of methomyl in thepresence of semiconducting oxides,” International Journal ofEnvironment and Pollution, vol. 28, no. 1-2, pp. 33–44, 2006.
[12] A. F. Caliman, C. Teodosiu, and I. Balasanian, “Aplications ofheterogeneous photocatalysis for industrial wastewater treat-ment,” Environmental Engeneering and Management Journal,vol. 1, pp. 187–196, 2002.
[13] I. Poulios, A. Avranas, E. Rekliti, and A. Zouboulis, “Photo-catalytic oxidation of Auramine O in the presence ofsemiconducting oxides,” Journal of Chemical Technology andBiotechnology, vol. 75, no. 3, pp. 205–212, 2000.
[14] C. Betianu, F. A. Caliman, M. Gavrilescu, I. Cretescu, C.Cojocaru, and I. Poulios, “Response surface methodologyapplied for Orange II photocatalytic degradation in TiO2
aqueous suspensions,” Journal of Chemical Technology andBiotechnology, vol. 83, no. 11, pp. 1454–1465, 2008.
[15] C. Pastravanu, I. Poulios, E. Popovici, and I. Cretescu, “Acase study of textile wastewater treatment by heterogeneousphotocatalytic degradation,” The Annals of the “Dunarea deJos” University of Galati Fascicle II—Mathematics, Physics,Chemistry, Informatics, vol. 32, pp. 31–38, 2009.

Hindawi Publishing CorporationInternational Journal of PhotoenergyVolume 2012, Article ID 754691, 5 pagesdoi:10.1155/2012/754691
Research Article
Oxidation Degradation of Rhodamine B in Aqueous byUV/S2O8
2− Treatment System
Xiaoyang Chen, Zhiyong Xue, Yanlai Yao, Weiping Wang, Fengxiang Zhu, and Chunlai Hong
Institute of Environmental Resource and Soil Fertilizer, Zhejiang Academy of Agricultural Sciences, Hangzhou 310021, China
Correspondence should be addressed to Chunlai Hong, [email protected]
Received 31 May 2012; Revised 23 August 2012; Accepted 27 August 2012
Academic Editor: Manickavachagam Muruganandham
Copyright © 2012 Xiaoyang Chen et al. This is an open access article distributed under the Creative Commons Attribution License,which permits unrestricted use, distribution, and reproduction in any medium, provided the original work is properly cited.
The UV photolysis of persulfate (S2O82−) is a novel advanced oxidation technologies (AOTs), which leads to the formation of
strong oxidizing radicals, sulfate radicals (SO4•−). The effect of oxidant S2O8
2− concentration, initial dye concentration, initialpH of solution, and various inorganic anions (Cl−, H2PO4
−, and HCO3−) were investigated using Rhodamine B (RhB), a kind of
xanthene dye, as a model pollutant. With the increase of oxidant S2O82−, more SO4
•− produced to attack RhB molecules and resultin the increase of RhB degradation. While the improvement was not sustained above a critical value, beyond which degradationrate does not increase. Initial pH of solution had great effect on the RhB degradation rate during UV/S2O8
2− system. SO4•− is
rather stable in acidic solutions, while increasing system pH results in the transformation of SO4•− to •OH. The effects of three
inorganic anions (Cl−, H2PO4−, and HCO3
−) all had some negative effect on the degradation of RhB. Based on the RhB solutionchanges of the UV-vis absorption intensity during the UV/S2O8
2− treatment, decolorization of RhB accompanied the destructionof aromatic ring structures of RhB molecules.
1. Introduction
Dyes are widely used in textile, leather, pharmaceutical,plastic, paint, and food industries [1].
Nearly more than 800,000 tons dye are produced peryear, and over 15% of the synthetic textile dyes used are lostduring manufacturing or processing operations and releasedas effluents [2, 3]. The effluents will produce adverse effectson the ecoenvironments due to their nonbiodegradability,toxicity, potential carcinogenic and mutagenic nature [3, 4].For the treatment of dye-containing wastewater, traditionalphysicochemical techniques such as adsorption on activatedcarbon, membrane separation and coagulation have difficul-ties in the complete destruction of dye pollutants [5].
Advanced oxidation technologies (AOTs) are attractivealternatives to nondestructive physical water treatment pro-cesses because they are able to mineralize organic con-taminants. AOTs, such as Fenton reagent, photo-Fenton,UV/O3, UV/H2O2, and TiO2-mediated photocatalysis pro-cesses based on the generation reactive hydroxyl radicals
(•OH), have emerged to be promising alternatives for dye-off wastewaters [6–9].
In recently, sulfate radicals-based AOTs have come forthfor the degradation of nonbiodegradable compounds [10–14]. The rapid destruction of organic contaminants bysulfate radicals (SO4
•−) at a near diffusion-controlled rate(109 M−1·s−1) has gained great interest among practition-ers as a potential method for on-site hazardous wasteremediation [15]. Compared to •OH, SO4
•− demonstratehigher reduction potential at neutral pH and are moreselective for oxidizing organic pollutants [16]. In general,SO4
•− can be generated by scission of peroxide bond byradiolytic, photolytic, and thermal activation of persulfate(S2O8
2−), or electron transfer by transition-metal activationof S2O8
2− or peroxymonosulfate [17–20]. Among them, UV-mediated decomposition of persulfate (UV/S2O8
2−) is anefficient oxidative system that can form SO4
•− as majoroxidizing species. Similar to H2O2, S2O8
2− shows significantphotochemical activity under the UV irradiation. S2O8
2− isthe most important oxidant used as SO4
•−-based oxidants
2 International Journal of Photoenergy
(C2H5)2NO
C
COOH
N(C2H5)2Cl
Figure 1: Structure of Rhodamine B.
and thus has drawn increasing attention as an alternativeoxidant in the chemical oxidation of contaminants [11–15, 19–21]. The use of S2O8
2− has several advantages.S2O8
2− itself is a strong oxidant with a standard oxidationpotential of 2.01 V comparable to O3 (2.07 V), nonselectivelyreactive, and relatively stable at room temperature [10, 19–21]. Moreover, a low cost of S2O8
2− facilitates SO4•−-based
AOTs for potential application in wastewater treatment.In this work, a model refractory organic dye pollutant
Rhodamine B (RhB), which contains four N-ethyl groupsat either side of the xanthene ring, was chosen as thetarget pollutant to examine the degradation behavior of theUV/S2O8
2− system. RhB is an important representative ofxanthene dye, widely used as a colorant in textiles and foodstuffs, and is also a well-known water tracer fluorescent,which has the property of carcinogenicity, reproductive anddevelopmental toxicity, neurotoxicity, and chronic toxicitytowards humans and animals [6, 22]. The objective ofthis work was to investigate the factors that influence thedegradation rate of RhB in UV/S2O8
2− treatment systemsuch as oxidant doses, initial dye concentration, and theeffects of anions (Cl−, H2PO4
−, and HCO3−) that are
ubiquitous coexistent in waters on the degradation of RhBwith the UV/S2O8
2− system.
2. Experimental
2.1. Chemicals. RhB (Figure 1) was purchased from AlfaAesar, A Johnson Matthey Company. K2S2O8 was purchasedfrom Tianjing Guangfu Company, China. All other chemicalswere analytical grade and used as received without furtherpurification. For pH adjustment, 0.1 M sulfuric acid and0.1 M sodium hydroxide were used, and all the experimentswere conducted in an air-conditioned room at 25 ± 2◦C.Milli-Q water was used throughout this study. Triplicate(n = 3) experiments were conducted under the identicalcondition.
2.2. Photoreactor and Light Source. The photodegradationexperiments were performed in an XPA-7 merry-go-roundphotochemical reactor (Xujiang Electromechanical Plant,Nanjing, China) with quartz tubes containing the reactionsolutions. A 300 W high-pressure mercury lamp used for
0
0.2
0.4
0.6
0.8
1
Rel
ativ
e in
ten
sity
200 300 400 500 600 700 800
(nm)
Figure 2: Irradiance spectra of the high-pressure mercury lamplight sources.
the photodegradation experiment under UV-vis irradia-tion immersed inside water-cooled quartz well. The lightsource irradiance spectra (Figure 2) were measured witha monochromator (Acton, SP-300). The light intensity(200–420 nm) in the center of the reactive solutions was4.10 mW/cm2 for the mercury lamp.
2.3. Experimental Procedure and Analysis. At specific inter-vals, samples were removed from exposure for UV-vis spectrameasurement. The RhB degradation was characterized bymeasuring absorbency at 554 nm, the peak wavelength ofRhB in the visible region. UV-vis spectra variations wererecorded between 190 and 800 nm employing a Shimaduz1700 UV-vis spectrometer.
3. Results and Discussion
3.1. Effect of Oxidants K2S2O8 on the Photodegradation ofRhB. The effect of oxidant K2S2O8 on the degradationof RhB was investigated at natural pH, and the resultswere shown in Figure 3. Initially, control experiments werecarried out in the absence and presence of either UV lightor K2S2O8 alone. Results showed that mere K2S2O8 wasnot sufficient for the degradation of RhB. There was noobservable color loss in the absence of UV irradiation. OnlyUV light irradiation, there was about 35% degradation ofRhB with 60 min reaction time, while there was 85% withUV/K2S2O8 ([K2S2O8] = 0.2 mM) treatment system at thesame reaction time, which is indicating that UV/K2S2O8 wassuperior to UV alone in terms of the dye removal efficiency.The RhB degradation rate increased with the increasing ofconcentration of oxidant K2S2O8 from 0.2 mM to 0.8 mM.While the improvement was not sustained above a criticalvalue ([K2S2O8] = 1.0 mM), beyond which the reactionrate decreased. This is mainly because that oxidant K2S2O8
has two opposing effects [23, 24]. As the concentration ofoxidant K2S2O8 is increased, more SO4
•− will be availableto attack RhB molecules. Therefore, the rate of reactionincreases. On the other hand, when K2S2O8 is used in
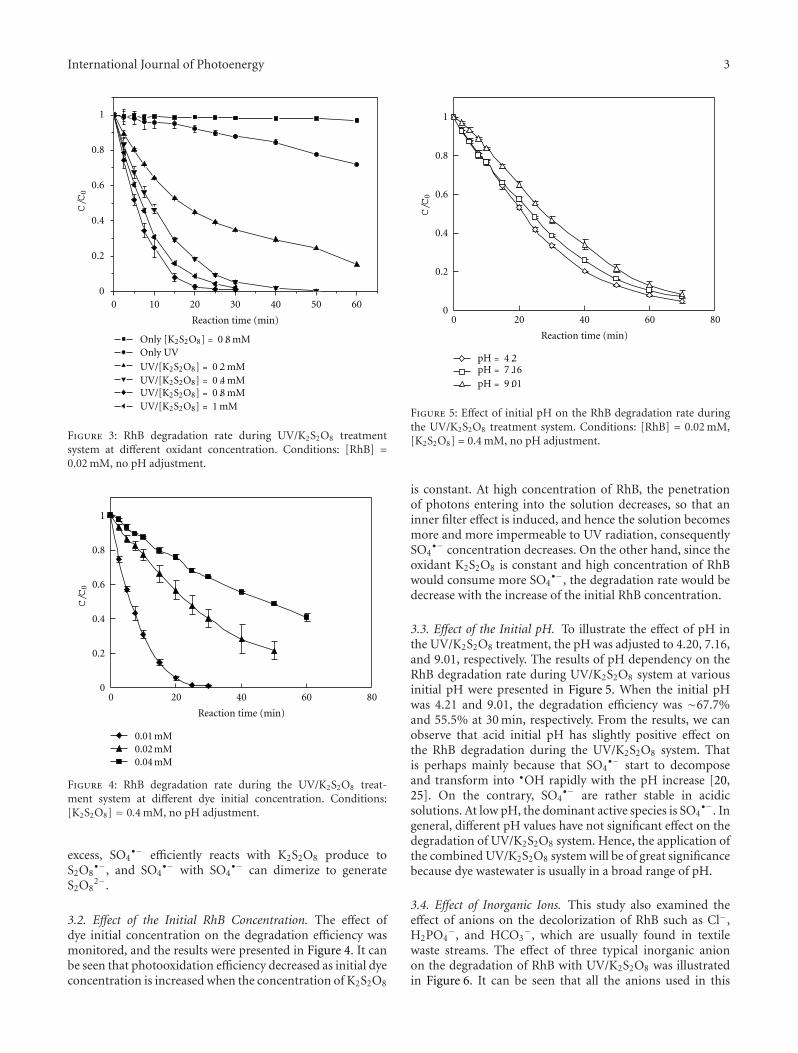
International Journal of Photoenergy 3
0
0.2
0.4
0.6
0.8
1
C/C
0
0 10 20 30 40 50 60
Reaction time (min)
Only [K2S2O8] = 0.8 mMOnly UV
UV/[K2S2O8] = 0.2 mMUV/[K2S2O8] = 0.4 mMUV/[K2S2O8] = 0.8 mMUV/[K2S2O8] = 1 mM
Figure 3: RhB degradation rate during UV/K2S2O8 treatmentsystem at different oxidant concentration. Conditions: [RhB] =0.02 mM, no pH adjustment.
0
0.2
0.4
0.6
0.8
1
C/C
0
0 20 40 60 80
Reaction time (min)
0.01 mM0.02 mM0.04 mM
Figure 4: RhB degradation rate during the UV/K2S2O8 treat-ment system at different dye initial concentration. Conditions:[K2S2O8] = 0.4 mM, no pH adjustment.
excess, SO4•− efficiently reacts with K2S2O8 produce to
S2O8•−, and SO4
•− with SO4•− can dimerize to generate
S2O82−.
3.2. Effect of the Initial RhB Concentration. The effect ofdye initial concentration on the degradation efficiency wasmonitored, and the results were presented in Figure 4. It canbe seen that photooxidation efficiency decreased as initial dyeconcentration is increased when the concentration of K2S2O8
0
0.2
0.4
0.6
0.8
1
C/C
0
0 20 40 60 80
Reaction time (min)
pH = 4.2pH = 7.16pH = 9.01
Figure 5: Effect of initial pH on the RhB degradation rate duringthe UV/K2S2O8 treatment system. Conditions: [RhB] = 0.02 mM,[K2S2O8] = 0.4 mM, no pH adjustment.
is constant. At high concentration of RhB, the penetrationof photons entering into the solution decreases, so that aninner filter effect is induced, and hence the solution becomesmore and more impermeable to UV radiation, consequentlySO4
•− concentration decreases. On the other hand, since theoxidant K2S2O8 is constant and high concentration of RhBwould consume more SO4
•−, the degradation rate would bedecrease with the increase of the initial RhB concentration.
3.3. Effect of the Initial pH. To illustrate the effect of pH inthe UV/K2S2O8 treatment, the pH was adjusted to 4.20, 7.16,and 9.01, respectively. The results of pH dependency on theRhB degradation rate during UV/K2S2O8 system at variousinitial pH were presented in Figure 5. When the initial pHwas 4.21 and 9.01, the degradation efficiency was ∼67.7%and 55.5% at 30 min, respectively. From the results, we canobserve that acid initial pH has slightly positive effect onthe RhB degradation during the UV/K2S2O8 system. Thatis perhaps mainly because that SO4
•− start to decomposeand transform into •OH rapidly with the pH increase [20,25]. On the contrary, SO4
•− are rather stable in acidicsolutions. At low pH, the dominant active species is SO4
•−. Ingeneral, different pH values have not significant effect on thedegradation of UV/K2S2O8 system. Hence, the application ofthe combined UV/K2S2O8 system will be of great significancebecause dye wastewater is usually in a broad range of pH.
3.4. Effect of Inorganic Ions. This study also examined theeffect of anions on the decolorization of RhB such as Cl−,H2PO4
−, and HCO3−, which are usually found in textile
waste streams. The effect of three typical inorganic anionon the degradation of RhB with UV/K2S2O8 was illustratedin Figure 6. It can be seen that all the anions used in this

4 International Journal of Photoenergy
0
0.2
0.4
0.6
0.8
1
C/C
0
0 10 20 30 40 50
Reaction time (min)
Without ions[HCO3
− ] = 10 mM[H2PO4
− ] = 10 mM[Cl− ] = 10 mM
Figure 6: Influence of Cl−, H2PO4− and HCO3
− anions on thedegradation of with UV/K2S2O8 system. Conditions: [RhB] =0.02 mM, [K2S2O8] = 0.4 mM.
work inhibited the RhB degradation. It is well known thatSO4
•− can directly oxidize Cl−, H2PO4−, and HCO3
− viselectron transfer reactions to produce less-active species [13,26–28]. It is well known that SO4
•− can directly oxidizeCl−, H2PO4
− and HCO3− vis electron transfer reactions to
produce less-active species [13, 26–28]. The reaction rateconstants for the reactions of SO4
•− with HCO3−, H2PO4
−,and Cl− are ∼106 L/mol·s, ∼105 L/mol·s and ∼108 L/mol·s,respectively [28, 29]. The reaction rate constants of SO4
•−
with HCO3− and H2PO4
− are less than that of Cl− withSO4
•−. Hence, the inhibiting effect on RhB degradation ofCl− is more obvious than HCO3
− and H2PO4− · SO4
•− werethe dominant oxidative species in the UV/K2S2O8 process,these anions were able to compete with RhB for SO4
•− atvarious rate and thus led to the decrease of degradation ofRhB.
3.5. The UV-Visible Absorption Spectra Analysis. In orderto investigate the change in the molecule of RhB with thereaction time, UV-visible absorption spectra changes in thedye solution were observed, and the corresponding spectraare shown in Figure 7. It can be seen that there are twomain characteristic absorption bands of RhB solution. Oneis UV region (259 nm), and another is in the visible region(554 nm). The UV band absorbance of dye solution at554 nm (n → π transition of C=N, C=O groups) is due tothe color of the dye solution, and it is used to monitor thedecolorization of dye. Absorbance at 259 nm represents thearomatic content of RB, and the decrease of absorbance atthis band indicates the degradation of aromatic part of dye[30]. During the UV/K2S2O8 treatment system, absorptionintensity of RhB in solution became weaker along with thereaction time. It can be explained that the aromatic ringstructures of RhB molecules were destructed with reactionprocess.
0
0.2
0.4
0.6
0.8
1
1.2
1.4
1.6
1.8
Abs
orba
nce
200 300 400 500 600 700 800
Wavelength (nm)
0 min5 min10 min15 min
20 min25 min
30 min40 min
50 min60 min
70 min80 min
Figure 7: UV/Vis spectral changes of RhB with UV/K2S2O8
treatment system. Conditions: [RhB] = 0.02 mmol/L, [K2S2O8] =0.4 mmol/L, no pH adjustment.
4. Conclusion
In this study, application of the UV/K2S2O8 treatmentprocesses to the aqueous degradation of RhB was investi-gated. The efficiency of the UV/K2S2O8 system was inves-tigated in terms of RhB decay. The effects of oxidantsdoses, initial RhB concentration anions, initial pH, andthree kinds of anions (Cl−, H2PO4
− and HCO3−) on the
degradation rate in the UV/K2S2O8 system were investigated.The RhB degradation rate increased with the increasing ofconcentration of oxidant K2S2O8 from 0.2 mM to 0.8 mM.While the improvement was not sustained above a criticalvalue ([K2S2O8] = 1.0 mM), photooxidation efficiencydecreased as initial dye concentration increased at the sameconcentration of K2S2O8. Acid initial pH facilitated the RhBdegradation during the UV/K2S2O8 system because thatSO4
•− are the dominant active species in this pH value area.In the UV/K2S2O8 system, the observed adverse effects ofinorganic anions could be the result of competitive withdye and the inhibiting effect followed the order of Cl− <H2PO4
− < HCO3−. During the UV/K2S2O8 treatment
system, absorption intensity of RhB in solution becameweaker along with the reaction time, which can be explainedthat the aromatic ring structures of RhB molecules weredestructed with reaction process.
Acknowledgment
The study was supported by Zhejiang Provincial Natural Sci-ence Foundation (no. Y5110338) and the National NaturalScience Foundation (no. 20907045) of China.
References
[1] M. A. Behnajady and N. Modirshahla, “Evaluation of electricalenergy per order (EEO) with kinetic modeling on photoox-idative degradation of C. I. Acid orange 7 in a tubular

International Journal of Photoenergy 5
continuous-flow photoreactor,” Industrial and EngineeringChemistry Research, vol. 45, no. 2, pp. 553–557, 2006.
[2] J. W. Lee, S. P. Choi, R. Thiruvenkatachari, W. G. Shim, andH. Moon, “Evaluation of the performance of adsorption andcoagulation processes for the maximum removal of reactivedyes,” Dyes and Pigments, vol. 69, no. 3, pp. 196–203, 2006.
[3] S. Wang, “A Comparative study of Fenton and Fenton-likereaction kinetics in decolourisation of wastewater,” Dyes andPigments, vol. 76, no. 3, pp. 714–720, 2008.
[4] S. K. Ling, S. Wang, and Y. Peng, “Oxidative degradation ofdyes in water using Co2+/H2O2 and Co2+/peroxymonosulfate,”Journal of Hazardous Materials, vol. 178, no. 1–3, pp. 385–389,2010.
[5] I. Arslan-Alaton and J. L. Ferry, “Application of polyoxo-tungstates as environmental catalysts: wet air oxidation of aciddye Orange II,” Dyes and Pigments, vol. 54, no. 1, pp. 25–36,2002.
[6] F. H. AlHamedi, M. A. Rauf, and S. S. Ashraf, “Degradationstudies of Rhodamine B in the presence of UV/H2O2,”Desalination, vol. 238, no. 1–3, pp. 159–166, 2009.
[7] Z. He, S. Yang, Y. Ju, and C. Sun, “Microwave photocat-alytic degradation of Rhodamine B using TiO2 supportedon activated carbon: mechanism implication,” Journal ofEnvironmental Sciences, vol. 21, no. 2, pp. 268–272, 2009.
[8] M. Cheng, W. Ma, J. Li et al., “Visible-light-assisted degrada-tion of dye pollutants over Fe(III)-loaded resin in the presenceof H2O2 at neutral pH values,” Environmental Science andTechnology, vol. 38, no. 5, pp. 1569–1575, 2004.
[9] P. Shukla, I. Fatimah, S. Wang, H. M. Ang, and M. O. Tade,“Photocatalytic generation of sulphate and hydroxyl radicalsusing zinc oxide under low-power UV to oxidise phenoliccontaminants in wastewater,” Catalysis Today, vol. 157, no. 1–4, pp. 410–414, 2010.
[10] Y. Deng and C. M. Ezyske, “Sulfate radical-advanced oxidationprocess (SR-AOP) for simultaneous removal of refractoryorganic contaminants and ammonia in landfill leachate,”Water Research, vol. 45, no. 18, pp. 6189–6194, 2011.
[11] P. Nfodzo and H. Choi, “Triclosan decomposition by sulfateradicals: effects of oxidant and metal doses,” Chemical Engi-neering Journal, vol. 174, no. 2-3, pp. 629–634, 2011.
[12] J. Criquet and N. K. V. Leitner, “Degradation of acetic acidwith sulfate radical generated by persulfate ions photolysis,”Chemosphere, vol. 77, no. 2, pp. 194–200, 2009.
[13] R. H. Waldemer, P. G. Tratnyek, R. L. Johnson, and J. T.Nurmi, “Oxidation of chlorinated ethenes by heat-activatedpersulfate: kinetics and products,” Environmental Science andTechnology, vol. 41, no. 3, pp. 1010–1015, 2007.
[14] G. P. Anipsitakis and D. D. Dionysiou, “Radical generation bythe interaction of transition metals with common oxidants,”Environmental Science and Technology, vol. 38, no. 13, pp.3705–3712, 2004.
[15] C. Liang, Y. J. Chen, and K. J. Chang, “Evaluation of persulfateoxidative wet scrubber for removing BTEX gases,” Journal ofHazardous Materials, vol. 164, no. 2-3, pp. 571–579, 2009.
[16] P. Neta, V. Madhavan, H. Zemel, and R. W. Fessenden, “Rateconstants and mechanism of reaction of so4·- with aromaticcompounds,” Journal of the American Chemical Society, vol. 99,no. 1, pp. 163–164, 1977.
[17] A. Rastogi, S. R. Al-Abed, and D. D. Dionysiou, “Sulfateradical-based ferrous-peroxymonosulfate oxidative system forPCBs degradation in aqueous and sediment systems,” AppliedCatalysis B, vol. 85, no. 3-4, pp. 171–179, 2009.
[18] S. K. Kuriechen, S. Murugesan, S. P. Raj, and P. Marutha-muthu, “Visible light assisted photocatalytic mineralization ofReactive Red 180 using colloidal TiO2 and oxone,” ChemicalEngineering Journal, vol. 174, no. 2-3, pp. 530–538, 2011.
[19] P. Wang, S. Yang, L. Shan, R. Niu, and X. Shao, “Involvementsof chloride ion in decolorization of Acid Orange 7 by activatedperoxydisulfate or peroxymonosulfate oxidation,” Journal ofEnvironmental Sciences, vol. 23, no. 11, pp. 1799–1807, 2011.
[20] Y. F. Huang and Y. H. Huang, “Identification of producedpowerful radicals involved in the mineralization of bisphenolA using a novel UV-Na2S2O8/H2O2-Fe(II,III) two-stage oxida-tion process,” Journal of Hazardous Materials, vol. 162, no. 2-3,pp. 1211–1216, 2009.
[21] D. Salari, A. Niaei, S. Aber, and M. H. Rasoulifard, “Thephotooxidative destruction of C.I. Basic Yellow 2 usingUV/S2O8
2− process in a rectangular continuous photoreac-tor,” Journal of Hazardous Materials, vol. 166, no. 1, pp. 61–66,2009.
[22] S. Merouani, O. Hamdaoui, F. Saoudi, M. Chiha, and C.Petrier, “Influence of bicarbonate and carbonate ions onsonochemical degradation of Rhodamine B in aqueous phase,”Journal of Hazardous Materials, vol. 175, no. 1–3, pp. 593–599,2010.
[23] E. Hayon, A. Treinin, and J. Wilf, “Electronic spectra,photochemistry, and autoxidation mechanism of the sulfite-bisulfite-pyrosulfite systems. The SO2
−, SO3−, SO4
−, andSO5
− radicals,” Journal of the American Chemical Society, vol.94, no. 1, pp. 47–57, 1972.
[24] H. Herrmann, B. Ervens, H. W. Jacobi, R. Wolke, P. Nowacki,and R. Zellner, “CAPRAM2.3: a chemical aqueous phaseradical mechanism for tropospheric chemistry,” Journal ofAtmospheric Chemistry, vol. 36, no. 3, pp. 231–284, 2000.
[25] L. Dogliotti and E. Hayon, “Flash photolysis of persulfate ionsin aqueous solutions. Study of the sulfate and ozonide radicalallions,” Journal of Physical Chemistry, vol. 71, no. 8, pp. 2511–2516, 1967.
[26] S. Canonica, T. Kohn, M. Mac, F. J. Real, J. Wirz, andU. Von Gunten, “Photosensitizer method to determine rateconstants for the reaction of carbonate radical with organiccompounds,” Environmental Science and Technology, vol. 39,no. 23, pp. 9182–9188, 2005.
[27] R. E. Huie and C. L. Clifton, “Temperature dependence ofthe rate constants for reactions of the sulfate radical, SO4
•−,with anions,” Journal of Physical Chemistry, vol. 94, no. 23, pp.8561–8567, 1990.
[28] B. Ouyang, H. J. Fang, C. Z. Zhu, W. B. Dong, and H.Q. Hou, “Reactions between the SO4
•− radical and somecommon anions in atmospheric aqueous droplets,” Journal ofEnvironmental Sciences, vol. 17, no. 5, pp. 786–788, 2005.
[29] X. Y. Vu, Z. C. Bao, and J. R. Barker, “Free radical reactionsinvolving Cl•, Cl2
−•, and SO4•− in the 248 nm photolysis
of aqueous solutions containing S2O82− and Cl−,” Journal of
Physical Chemistry A, vol. 108, no. 2, pp. 295–308, 2004.[30] B. Cuiping, X. Xianfeng, G. Wenqi et al., “Removal of
rhodamine B by ozone-based advanced oxidation process,”Desalination, vol. 278, no. 1–3, pp. 84–90, 2011.

Hindawi Publishing CorporationInternational Journal of PhotoenergyVolume 2012, Article ID 909157, 9 pagesdoi:10.1155/2012/909157
Research Article
Landfill Leachates Treatment by H2O2/UV, O3/H2O2, ModifiedFenton, and Modified Photo-Fenton Methods
Jeremi Naumczyk, Izabela Prokurat, and Piotr Marcinowski
Faculty of Environmental Engineering, Warsaw University of Technology, Nowowiejska 20, 00-653 Warsaw, Poland
Correspondence should be addressed to Jeremi Naumczyk, [email protected]
Received 31 May 2012; Revised 8 August 2012; Accepted 11 August 2012
Academic Editor: Manickavachagam Muruganandham
Copyright © 2012 Jeremi Naumczyk et al. This is an open access article distributed under the Creative Commons AttributionLicense, which permits unrestricted use, distribution, and reproduction in any medium, provided the original work is properlycited.
Advanced oxidation processes (AOPs) such as H2O2/UV, O3/H2O2, modified Fenton, and modified photo-Fenton processeshave been investigated in terms of the treatment of landfill leachate with ratio of BOD5/COD in the range of 0.22 to 0.24. Themodification of Fenton and photo-Fenton processes consisted in the inclusion of precipitation and separation of humic substancesat pH 3. Due to the precipitation, the value of COD decreased by 39% and BOD5 by 7.1%. The modification of the processesallowed us to improve the efficiency and to decrease the doses of reagents necessary to continue the process. Modified photo-Fenton process proved to be the most effective (92.7% COD removal) of all processes investigated. Additionally, modified-Fentonprocess was much more effective than the other two processes when compared up to 120 min, while after longer times it gave theleast satisfactory results. After 30 min of modified-Fenton process BOD5/COD ratio increased to 0.43. The parameter referred toas “efficiency of oxidants” was used to estimate the efficiency of all the processes—its value varied from 178 to 239%. Varioussubstances including phthalates, hydrocarbons, silanes, and siloxanes were identified in raw and treated leachate.
1. Introduction
In advanced oxidation processes (AOPs) the hydroxyl radicalHO• characterized by high redox potential (2,8 V) is pro-duced. The chain reaction evoked by HO• leads to an effec-tive organic pollutants degradation identified by decreasedCOD value [1]. The use of AOPs in landfill leachatetreatment has been the subject of numerous publications,including reviews [1–3]. Despite that it is still difficult toorder different methods in terms of their efficiency to oxidizeorganic compounds. Additionally, the number of studiesreferring to more than two methods is limited. Anotherreason is a wide range of concentrations of organics inleachate varying from a few hundreds to more than tenthousand mg/L COD [1]. According to the review publishedby Kurniawan et al. [1] photo-Fenton and H2O2/O3/UVprocesses are the most effective. The efficiency of O3/H2O2
and H2O2/UV processes is comparable, while Fenton andO3/OH− processes are less effective. In one of the recentlypublished papers [4] O3/OH−, O3/H2O2, and Fenton pro-cesses have been compared. It has been shown that Fenton
process yielding 46% COD removal is far less effective thanthe two remaining processes, in which efficiency is approx-imately 72%. Primo et al. [5] investigated the efficiency ofthe treatment of landfill leachate by means of different AOPs.They also classified the methods according to their efficiencyin the following order: photo-Fenton, Fenton-like > Fenton> H2O2/UV > UV.
Another interesting method among AOPs is oxone/Co2+
process. According to the results of the studies carried outby Sun et al. [6] the efficiency of this method is higherthat the efficiency of Fenton one. Sulfate radical oxidationprocess (SR-AOP) [7] is another method worth mentioning.In this method persulfate (S2O8
2−) is activated by heatingto produce SO4
•− radical, which is a strong oxidant (E 0 =2,4 V). At pH 4 and 50◦C COD removal is estimated to be91% and additionally it is possible to remove ammoniacalnitrogen.
Significant differences observed in COD values arecaused by different age of landfills. Young landfill leachateshows higher COD values and BOD5/COD ratio equal to orhigher than 0.4, which is typical of domestic wastewaters. Old

2 International Journal of Photoenergy
landfill leachate (stabilized) exhibits lower values of COD;its organics are difficult to biodegrade and the BOD5/CODratio is below 0.10. The humic acids with molecular massbetween 10 and 100 kD dominate in old landfill leachate [8].Additionally, the degree of humification increases with theincreasing age of the landfill [9]. Differences in BOD5/CODratio cause different susceptibility of organics to chemicaloxidation [1], which leads to a decrease in the concentrationof high molecular weight organics (>10 kDa) [10]. Withina certain period of chemical oxidation BOD5/COD ratioincreases, which results in better biodegradability. Therefore,AOPs are often used as a pretreatment step before a biologicalprocess. Fenton process has been the most widely usedprocess of all the AOPs [1, 3]. It is also the most commonpretreatment method applied before biological treatment. Incontrast, photo-Fenton method is one of the least studied.Fenton process has a few modifications. One of them consistsin the separation of the sediment of humic substancesprecipitating after pH decrease (preliminary coagulation),which is a necessary step in this process. According to theresults of our studies [9] sediment formation is an instantprocess. However, the amount of the sediment increases intime and depends on the pH value: the lower the pH value,the greater amount of the sediment. After the separation ofsediment the process is continued.
Fenton process after Fe2+ and H2O2 application contin-ues according to the reactions given below [1].
Initial reactions:
Fe2+ + H2O2 + H+ −→ Fe3+ + HO• + H2O (1)
Fe3+ + H2O2 −→ Fe(OOH)2+ + H+ ←→ Fe2+ + HO2• + H+
(2)
Propagation:
H2O2 + HO• −→ HO2• + H2O (3)
H2O2 + HO2• −→ HO• + O2 + H2O (4)
Termination:
Fe2+ + HO• −→ Fe3+ + HO− (5)
Fe3+ + HO2• −→ Fe2+ + H+ + O2 (6)
HO• + HO2• −→ H2O + O2 (7)
HO• + HO• −→ H2O2 (8)
Photo-Fenton process is based on the same reagents asFenton process but the solution is additionally exposed to UVradiation. As a result, the higher concentration of hydroxylradicals is obtained. This is due to the fact that ferric complexion formed in the Fenton reaction ((1), (5)) may be reducedto Fe2+ by near UV, according to the following reaction inacidic solution [11]:
Fe(OH)2+ + hν −→ Fe2+ + HO• (9)
In the presence of hydrogen peroxide, Fe2+ can be oxidizedaccording to (1).
In the H2O2/UV process HO• radicals are generatedaccording to the following reaction:
H2O2 + hν(UV) −→ 2HO• (10)
Additionally, the application of UV light leads to the sit-uation in which organic compounds become more reactivedue to the changes in their molecular structure.
Propagation reactions in H2O2/UV process are exactlythe same as in Fenton and photo-Fenton processes ((3), (4)).Termination reaction follows according to (7) and (8).
AOP employing O3/H2O2 method involves the synergis-tic action of the two reagents. As a result, hydroxyl radicalsare formed according to the following reactions:
O3 + HO− −→ HO2• + O2
•− (11)
H2O2 −→ HO2− + H+ (12)
O3 + HO2− −→ HO• + O2
•− + O2 (13)
O3 + O2•− −→ O3
•− + O2 (14)
O3•− + H2O −→ HO• + HO− + O2 (15)
Oxidation of organic matter in landfill leachates treatedby O3/H2O2 takes place faster than if only one of the above-mentioned oxidants is used. Efficiency expressed as the rateof COD or TOC decrease depends on the ozone dose permg of COD as well as on the H2O2 : O3 ratio. Haapea et al.[12] achieved the highest ratio of TOC decrease for landfillleachates while using ozone dose of 0.5 mg O3/mg COD andH2O2 : O3 ratio equal to 1 : 2. Application of other ratios ofreagents (1 : 4 and 3 : 2) while maintaining the same ozonedose produced less satisfactory results.
The aim of this study was to compare efficiency of fourAOPs in leachate treatment—modified Fenton and modifiedphoto-Fenton process (m-Fenton, m-photo-Fenton), as wellas H2O2/UV and O3/H2O2process. The leachate used in thisstudy can be described as medium stabilized and can becharacterized by the values of BOD5/COD in the range of0.1–0.4. Such type of leachate has not been very often usedin the studies reported in the literature. Additionally, theeffectiveness of oxidation of anthropogenic nonbiodegrad-able pollutants present in the leachate was also investigated.
2. Methods
The paper was conducted on leachate from a landfill site inLubna near Warsaw. Before the tests samples were subjectto 30 min of preliminary sedimentation to separate easilysettleable solids.
2.1. Analysis of Raw and Treated Landfill Leachate. Thedetermination of COD, total solids (TS), conductivity, totalKjeldhal nitrogen (TKN), ammonia (NNH4 ), chlorides (Cl−),pH, H2O2, and alkalinity was carried out according to theEuropean Standards. BOD5 was determined using Selutec

International Journal of Photoenergy 3
Table 1: Characteristics of leachate.
Parameter pH(—)
Conductivity(μS/cm)
Chlorides(mg/L)
Ammonia(mg/L)
TKN(mg/L)
COD(mg/L)
BOD5
(mg/L)BOD5/COD
(—)
Minimum value 7.8 17600 2400 160 700 4960 1080 0.22
Maximum value 8.7 23000 4000 480 940 6100 1486 0.24
Average — 20443 2951 339 797 5678 1315 0.23
BSBdigiO2 respirometer. H2O2 was determined by iodomet-ric method. The analysis of raw and treated landfill leachatewas also carried out using GC/MS (Finnigan GCQ Mat). The1L sample was extracted three times using hexane. Collectedorganic fractions were dried with anhydrous Na2SO4 andevaporated using Heidolph VV-micro vacuum rotary evapo-rator. In the next step, the evaporated extract passed throughglass column filled with silica gel. The purified extractwas evaporated to the volume of 2 mL using the Kuderna-Danish apparatus (Supelco) and analyzed. Separation wasachieved using an RTX-5MS Restek Corporation columnof 60 m length × 0.32 mm i.d. × 0.25 μm film thickness.The GC operated at an injector temperature of 280◦C withan initial column temperature of 60◦C held for 3 min. Thetemperature was programmed to step up with the speedof 3◦C/min until it reached 300◦C, which was held for5 min. The mass spectrometer operated in EI (70 eV) fullscan mode, with ion source temperature of 185◦C. Massspectra were compared to the NIST 98.L published spectra.Xcalibur Qual Browser v.1.2 was used for data acquisitionand handling.
For sediment precipitated at pH 3.0 and leachate after 0,5, 10, 15, and 30 min of Fenton reaction, GC-MS analysis wasalso performed. The separated sediment was then chemicallydried by adding small amounts of anhydrous MgSO4. In thenext step the extraction with dichloromethane in Soxhletapparatus was carried out. The extract was then evaporatedin rotary evaporator using n-hexane as a solvent to obtain thevolume of 5 cm3. Subsequently, it was cleaned up in a columnwith florisil. Further GC/MS analysis was carried out in thesame conditions as the ones used to analyze raw leachate.
2.2. Experiment. M-photo-Fenton process was conductedin 1 L glass cylindrical Heraeus Noblelight photoreactorequipped with a cooling jacket. UV radiation in m-photo-Fenton method was provided by a medium-pressure mer-cury lamp TQ (150 W), immersed in the sleeve. H2O2/UVprocess was carried out in 1 L Heraeus Noblelight with low-pressure mercury lamp (15 W). The leachate was stirred witha magnetic stirrer. In O3/H2O2 method a self-constructed1 L cylindrical Plexiglas reactor with the diameter of 8 cmwas used along with Sander ozone generator. Ozone wasintroduced through a porous-fritted diffuser, with the dosageof 500–1000 mg/h. M-Fenton process was carried out in 2 Lcylindrical reactor equipped with a magnetic stirrer.
After acidifying with 1 M H2SO4 to pH 3.0, the leachatebecame turbid and humic substances started to precipitate.Full clarification was obtained after 5 h and then thesediment was separated. This process is referred to as a pre-liminary coagulation. When the separation of the sediment
had been finished, 35% H2O2 and 10% FeSO4 solutions wereadded and m-Fenton and m-photo-Fenton processes werecontinued. After a certain reaction period the leachate wasneutralized with 10% NaOH and after 30 min of flocculationand sedimentation the supernatant was examined.
During 5 h of sedimentation of raw leachate some finesolids precipitated. Therefore, H2O2/UV and O3/H2O2 treat-ments were also preceded by 5 h of sedimentation in order toenable better comparison of all results.
After reaction periods of 0, 15, 30, 60, 120, 240, and360 min, COD, BOD5 (only in m-Fenton process), pH, andH2O2 concentrations were determined. Before COD analysis,the remaining H2O2 was removed with catalase. All tests wereconducted for 6 different samples of leachate and the resultswere calculated to obtain average values.
3. Results and Discussion
3.1. Raw Leachates. The composition characteristic of thelandfill leachates is given in Table 1. It can be noticed thatthe leachates are rich in organic substances (COD 4960–6100 mg/L), ammonium ions, and chlorides. Due to thefact that the leachates come from an old, medium-stabilizedlandfill site, they have BOD5/COD values of 0.22–0.24. Sincethis ratio is far below 0.4, the leachates can be classified asrefractory to biological treatment.
3.2. AOPs Results
3.2.1. Modified Fenton Process. Changes of COD during theprocess are shown in Figure 1. Preliminary coagulation atpH 3.0 and 5 h of sedimentation led to the average decreasein COD by 39.3% (Figure 1, time “0”). COD value wasdecreasing relatively fast until 60 min. After that the processstarted to slow down. Figure 1 proves that the optimal effectof treatment was obtained for H2O2/Fe (II) doses 3500/500and 3000/1000 mg/L. Application of doses 4000/500 and4000/1000 resulted in slightly worse effect. For the twooptimal doses the value of COD decreased by approximately75% after preliminary coagulation and 60 min of Fentonreaction. For Fenton reaction periods of 15, 120, 240, and360 min these values were 53.6, 77.9, 82.2, and 87.5%,respectively. BOD5 value also decreased during Fentonprocess. Preliminary coagulation at pH 3.0 led to the increasein BOD5/COD ratio to 0.33–0.35. For the above-mentionedoptimal doses and after Fenton reaction period of 15 minthe ratio increased to 0.42–0.45. After that time the ratiostarted to decrease, reaching the average values of 0.36, 0.33,0.30, and 0.26 after 30, 60, 120, and 480 min of reaction,

4 International Journal of Photoenergy
0
10
20
30
40
50
60
70
80
90
100
0 50 100 150 200 250 300 350 400
CO
D r
emov
al (
%)
Time (min)
2500/5003000/500
3000/10003500/500
Preliminary coagulation
Figure 1: COD removal as a function of time for m-Fenton processand different doses of H2O2/Fe (II).
0
10
20
30
40
50
60
70
80
90
100
0 50 100 150 200 250 300 350 400
CO
D r
emov
al (
%)
Time (min)
2500/1003000/100
3500/1504000/200
Preliminary coagulation
Figure 2: COD removal as a function of time for m-photo-Fentonprocess and different doses of H2O2/Fe (II).
respectively. The same ratio was obtained after 20 min ifsmaller reagent doses were used (2500/500).
3.2.2. Modified Photo-Fenton Process. Changes of COD dur-ing the process are shown in Figure 2. Similarly to m-Fenton process, a fast drop of COD occurred until 60 min.After that the process started to slow down. Optimal doseof H2O2/Fe (II) was estimated to be 3500/150 mg/L. Afterreaction periods of 60, 120, 240, and 360 min, COD valuedecreased by 80.1, 83.0, 88.0, and 92.7%, respectively. Dosesof 4000/150 and 4000/200 led to only slightly better results.For doses 4000/100, 4000/150, and 4500/200 (data not shownin the picture to ensure its clarity), the effect was lesspronounced. For doses of 3500/100 the effect was a littlebetter than that for 3000/100.
0102030405060708090
100
0 50 100 150 200 250 300 350 400
CO
D r
emov
al (
%)
Time (min)
2000 3000 35004000 4500 5000
Figure 3: COD removal as a function of time for H2O2/UV processand different doses of H2O2.
0102030405060708090
100
0 50 100 150 200 250 300 350 400
CO
D r
emov
al (
%)
Time (min)
10001500
18002000
Figure 4: COD removal as a function of time for O3/H2O2 processand different doses of H2O2.
3.2.3. H2O2/UV. Figure 3 shows changes in COD values fordifferent doses of H2O2 (2000–6000 mg/L). Five hours of pre-liminary sedimentation resulted in 4.6% COD removal. Theeffect of the process for each sample increased considerablywhen H2O2 dose was increased to 4500 mg/L. Therefore, thisdose can be considered as optimal. The resulted decrease inCOD after 60, 120, 240, and 360 min was equal to 32.7, 68.9,83.6, and 89.2%, respectively. The dose of 5000 mg/L slightlyimproved the process efficiency—91.0% after 360 min. Fordoses 5500 and 6000 mg/L the efficiency was approximatelythe same or slightly lower.
3.2.4. O3/H2O2. The COD values for H2O2 doses varyingfrom 1000 to 2000 mg/L and O3 dose of 750 mg/h are shownin Figure 4. The 3.0% of COD removal due to sedimentationwas taken into account as above. The efficiency of the processincreased when H2O2 dose was increased up to 2000 mg/L.For higher doses (to 3000 mg/L) the efficiency was approx-imately the same. For the dose of 2000 mg/L, considered asoptimal, the decrease in COD value after 60,120, 240, and360 min was equal to 44.8, 67.1, 87.0, and 89.9%, respectively.

International Journal of Photoenergy 5
18:03 28:03 38:03 48:04 58:04
2
1
3
4 5 6
7
8
9
10
4
100%
TOT
(1) Bicyclo[2.2.1]heptan-2-one, 5,5,6-trimethyl-(2) Cyclopentane, 1-methyl-1-(2-methyl-2-propenyl)-(3) Benzenemethanol, 4-trimethyl-(4) Phenol, m-tert-butyl-(4 ) Phenol, 2,3,5,6-tetramethyl-(5) 3,4-undecadiene-2,10-dione, 6,6-dimethyl-(6) o-hydroxybiphenyl(7) Benzophenone(8) 2-cyclopropen-1-one, 2,3-diphenyl-(9) Phenanthrene, 1-methyl-7-(1-methylethyl)-(10) Phthalate, di-isooctyl
Figure 5: Chromatogram of raw leachate.
Decreasing the O3 dose to 500 mg/L caused a considerabledecrease in the efficiency of the process—COD removalrelated to 2000 mg/L H2O2 was similar to the value obtainedfor the higher dose of O3 and 1000 mg/L H2O2. An increasein O3 dose to 1000 mg/L did not improve the efficiency of theprocess even when lower doses of H2O2 were applied.
3.3. GC-MS Analysis. Figure 5 depicts GC-MS chromato-grams obtained for raw leachates. Peaks corresponding to themain identified substances are indicated in the figure.
Substances which were either the main pollutants inraw leachates (Figure 5) were detected in leachates treatedby AOPs in significantly lower concentrations or were notdetected at all. They were oxidized to simple compounds,which cannot be detected by GC/MS method. Due to thematrix complexity it is impossible to derive the sampleand unequivocally identify the products of the oxidation.Simple compounds present in raw leachates were removedand have not been detected either in treated leachatesor in the resulting sediment. The major identified com-pound in treated leachates was di-n-butyl phthalate. Similaramounts of this compound were identified both in sedimentafter preliminary coagulation at pH 3.0 and in remainingleachate. A small part of the total amount of the compoundwas oxidized—after 30 min 70% of di-n-butyl phthalateremained in leachate. Moreover, the presence of aliphatichydrocarbons C26-C40 was reported, 70–80% of whichprecipitated at pH 3. The remaining amount was oxidizedin 90% after 30 min. The list of compounds detected in thegreatest amount in raw and treated leachates is given inTable 2. The table also includes the degree of the decrease in
0
10
20
30
40
50
60
70
80
90
100
0 15 30 60 120 240 360
H2O2/UVH2O2/O3
FentonPhoto-Fenton
Figure 6: COD removal as a function of time for all process.
the compounds’ content after preliminary coagulation andFenton process.
Additionally, small amount of the following substanceshas been detected in raw leachates:
(i) tricosanoic acid methyl ester and dodecanoic acidmethyl ester,
(ii) hasuban-9-ol, 7,8-didehydro-4,5-epoxy-3-methoxy-17-methyl (5-alpha),
(iii) benzene, 1-chloro-3,5-bis(1,1-dimethylethyl)-2-(2-propenyloxy),
(iv) diazene, diphenyl-[E],
(v) cyclopentasiloxane, decamethyl,
(vi) hexa-T-butylthiatrisiletane.
4. Discussion
Figure 6 presents the efficiency of the treatment using thefour methods described in this study, for the doses ofreagents considered as optimal. For the process periods upto 120 min the methods can be ordered with respect to theiroxidation efficiency as follows: m-photo-Fenton > m-Fenton> H2O2/UV ∼ O3/H2O2. After reaction period of 360 minthe highest COD removal was obtained for m-photo-Fentonmethod and the lowest for m-Fenton method. However, thevalues after this period did not vary significantly. For shortreaction periods the prevalence of m-Fenton and m-photo-Fenton methods is evident. It results from considerable CODremoval obtained in coagulation at pH 3, which preceded theFenton reaction. This advantage is observed until 60 min ofthe process. With the progress of m-Fenton and m-photo-Fenton processes, the contribution from the preliminarycoagulation at pH 3.0 to the overall effect of the processesdecreases. Preliminary coagulation does not completelyeliminate the contribution from the final coagulation toCOD removal. This contribution is significantly smaller anddecreases with the increasing time of the process duration
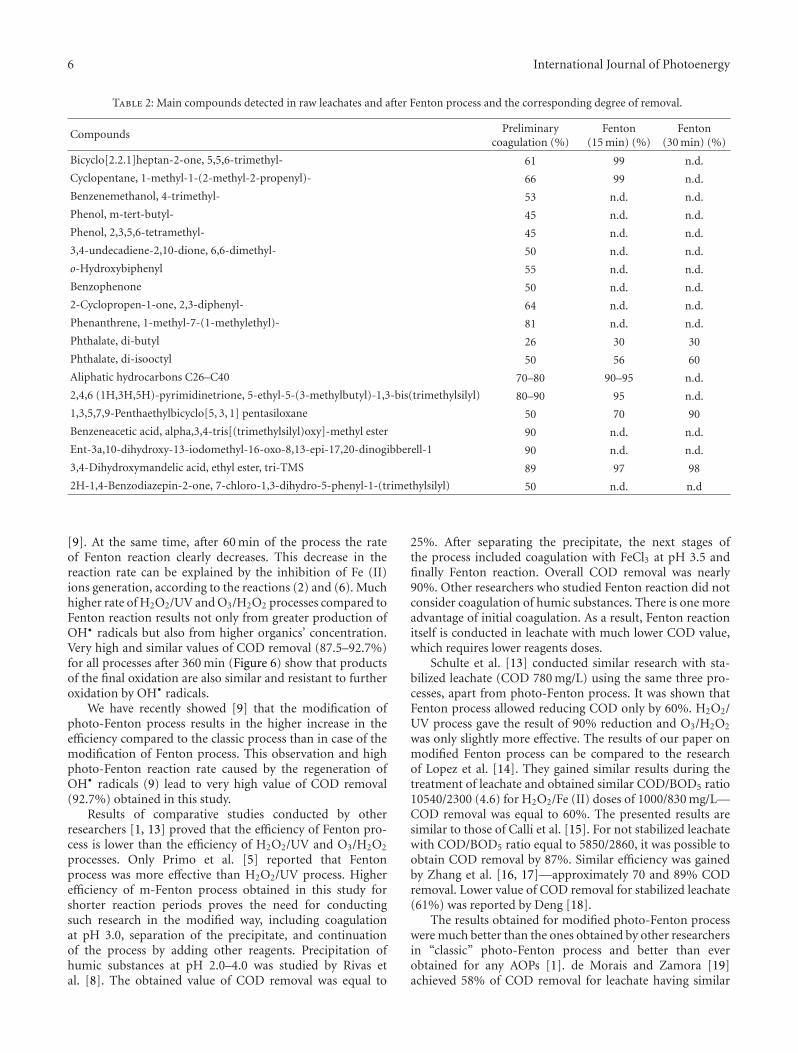
6 International Journal of Photoenergy
Table 2: Main compounds detected in raw leachates and after Fenton process and the corresponding degree of removal.
Compounds Preliminarycoagulation (%)
Fenton(15 min) (%)
Fenton(30 min) (%)
Bicyclo[2.2.1]heptan-2-one, 5,5,6-trimethyl- 61 99 n.d.
Cyclopentane, 1-methyl-1-(2-methyl-2-propenyl)- 66 99 n.d.
Benzenemethanol, 4-trimethyl- 53 n.d. n.d.
Phenol, m-tert-butyl- 45 n.d. n.d.
Phenol, 2,3,5,6-tetramethyl- 45 n.d. n.d.
3,4-undecadiene-2,10-dione, 6,6-dimethyl- 50 n.d. n.d.
o-Hydroxybiphenyl 55 n.d. n.d.
Benzophenone 50 n.d. n.d.
2-Cyclopropen-1-one, 2,3-diphenyl- 64 n.d. n.d.
Phenanthrene, 1-methyl-7-(1-methylethyl)- 81 n.d. n.d.
Phthalate, di-butyl 26 30 30
Phthalate, di-isooctyl 50 56 60
Aliphatic hydrocarbons C26–C40 70–80 90–95 n.d.
2,4,6 (1H,3H,5H)-pyrimidinetrione, 5-ethyl-5-(3-methylbutyl)-1,3-bis(trimethylsilyl) 80–90 95 n.d.
1,3,5,7,9-Penthaethylbicyclo[5, 3, 1] pentasiloxane 50 70 90
Benzeneacetic acid, alpha,3,4-tris[(trimethylsilyl)oxy]-methyl ester 90 n.d. n.d.
Ent-3a,10-dihydroxy-13-iodomethyl-16-oxo-8,13-epi-17,20-dinogibberell-1 90 n.d. n.d.
3,4-Dihydroxymandelic acid, ethyl ester, tri-TMS 89 97 98
2H-1,4-Benzodiazepin-2-one, 7-chloro-1,3-dihydro-5-phenyl-1-(trimethylsilyl) 50 n.d. n.d
[9]. At the same time, after 60 min of the process the rateof Fenton reaction clearly decreases. This decrease in thereaction rate can be explained by the inhibition of Fe (II)ions generation, according to the reactions (2) and (6). Muchhigher rate of H2O2/UV and O3/H2O2 processes compared toFenton reaction results not only from greater production ofOH• radicals but also from higher organics’ concentration.Very high and similar values of COD removal (87.5–92.7%)for all processes after 360 min (Figure 6) show that productsof the final oxidation are also similar and resistant to furtheroxidation by OH• radicals.
We have recently showed [9] that the modification ofphoto-Fenton process results in the higher increase in theefficiency compared to the classic process than in case of themodification of Fenton process. This observation and highphoto-Fenton reaction rate caused by the regeneration ofOH• radicals (9) lead to very high value of COD removal(92.7%) obtained in this study.
Results of comparative studies conducted by otherresearchers [1, 13] proved that the efficiency of Fenton pro-cess is lower than the efficiency of H2O2/UV and O3/H2O2
processes. Only Primo et al. [5] reported that Fentonprocess was more effective than H2O2/UV process. Higherefficiency of m-Fenton process obtained in this study forshorter reaction periods proves the need for conductingsuch research in the modified way, including coagulationat pH 3.0, separation of the precipitate, and continuationof the process by adding other reagents. Precipitation ofhumic substances at pH 2.0–4.0 was studied by Rivas etal. [8]. The obtained value of COD removal was equal to
25%. After separating the precipitate, the next stages ofthe process included coagulation with FeCl3 at pH 3.5 andfinally Fenton reaction. Overall COD removal was nearly90%. Other researchers who studied Fenton reaction did notconsider coagulation of humic substances. There is one moreadvantage of initial coagulation. As a result, Fenton reactionitself is conducted in leachate with much lower COD value,which requires lower reagents doses.
Schulte et al. [13] conducted similar research with sta-bilized leachate (COD 780 mg/L) using the same three pro-cesses, apart from photo-Fenton process. It was shown thatFenton process allowed reducing COD only by 60%. H2O2/UV process gave the result of 90% reduction and O3/H2O2
was only slightly more effective. The results of our paper onmodified Fenton process can be compared to the researchof Lopez et al. [14]. They gained similar results during thetreatment of leachate and obtained similar COD/BOD5 ratio10540/2300 (4.6) for H2O2/Fe (II) doses of 1000/830 mg/L—COD removal was equal to 60%. The presented results aresimilar to those of Calli et al. [15]. For not stabilized leachatewith COD/BOD5 ratio equal to 5850/2860, it was possible toobtain COD removal by 87%. Similar efficiency was gainedby Zhang et al. [16, 17]—approximately 70 and 89% CODremoval. Lower value of COD removal for stabilized leachate(61%) was reported by Deng [18].
The results obtained for modified photo-Fenton processwere much better than the ones obtained by other researchersin “classic” photo-Fenton process and better than everobtained for any AOPs [1]. de Morais and Zamora [19]achieved 58% of COD removal for leachate having similar

International Journal of Photoenergy 7
values of COD and BOD5. Kim et al. [11] while studyingstabilized leachate (COD/BOD5 1150/5) reported the valueof COD removal equal to 70%. In this study the used H2O2
dose was similar to COD value and mass ratio of H2O2/Fe(II) was approximately 15.
The results shown in Figure 6 do not explicitly point outwhich method is more effective—H2O2/UV or O3/H2O2.The advantage of one method over the other is very smalland the difference in the efficiency of the two methods iswithin the experimental error. The efficiency obtained inthis study is similar to that reported by Schulte et al. [13]and Steensen [20], who also achieved COD removal by 90%for stabilized leachate with COD value of 1200 mg/L. deMorais and Zamora [19] obtained the value of 56%, Ince [21]54%, and Shu et al. [22] 65% of COD removal. The resultsobtained by O3/H2O2 method were also similar to the resultspublished by Schulte et al. [13] and much higher than thoseof Haapea et al. [12], who reported only 50% COD removal.
In order to estimate the efficiency of Fenton process, aparameter referred to as “efficiency of hydrogen peroxide”was recommended by Kang and Hwang [23]. However, wesuggest some modifications of this parameter. The parameterreferred to as “efficiency of oxidants” will allow one toestimate the efficiency of both oxidants,
η(%) = ΔCOD0.4706 · [H2O2] + 0.333 · [O3]
· 100%, (16)
where COD—COD removed, mg/L, [H2O2], [O3]—dosesof H2O2 and O3, mg/L,
0.4706- factor—COD theoretically removed (mg) by1 mg H2O2,
0.333- factor—COD theoretically removed (mg) by 1 mgO3.
The values of this parameter for particular processes,without taking into account the results of sedimentationand coagulation at pH 3, for reagent doses considered asoptimal, were equal to 184.6%, 239.8%, 178.3%, and 238.0%for H2O2/UV, O3/H2O2, m-Fenton, and m-photo-Fentonprocessed, respectively. Very high values of this parameterprove that the role of oxygen is significant in oxidationprocesses, since it reacts with organic radicals generated inthe reaction of organic compounds with hydroxyl radical andlater reactions [1].
HO• + RH −→ R• + H2O (17)
R• + O2 −→ RO2• (18)
The organic radical (R•) reacts with oxygen to yieldperoxyl radical (RO2
•), which initiates subsequent chain andoxidation reactions.
It is worth noticing that after 360 min of the processseveral dozen mg/L of H2O2 still remains in the leachate(the amount which has not reacted). Moreover, 30% ofozone leaves the reaction environment and some oxidantsare lost during the processes. Therefore, the role of oxygenin oxidation process may be even twice higher than theparticipation of OH• radicals.
It should be also noted that O3/H2O2 process is char-acterized by the high efficiency of oxidants, which is muchhigher than in H2O2/UV process. In the same time, theefficiency of COD removal is similar for the two processes.Additionally, it is also comparable to the value typicalfor a more effective m-photo-Fenton process. In O3/H2O2
process the dose of H2O2 is more than twice lower than incase of H2O2/UV process. In the O3/H2O2 process muchhigher contribution of oxygen into the oxidation resultsfrom its high dose supplied together with ozone and fromits in situ generation, according to the reaction (13). Inthe H2O2/UV process conducted in the photoreactor, theoxygen is supplied in much smaller quantities. Additionally,H2O2/UV process is more sensitive to the scavenging effect ofH2O2 [1]. Due to this effect, high H2O2 concentration slowsdown the oxidation rate, while at low H2O2 concentrationthe generation of HO• radicals is insufficient.
The results of GC-MS analysis are also interesting. Thepresence of hydrocarbons and phthalates was expected. O-phthalic acid diesters have been detected in many landfillleachates [24]. They are widely used in many materials(PVC, other resins, paints, adhesives), which after theirservice life are landfilled. However, the presence of siliconderivatives silyl ethers, siloxanes, silanes, and siletanes wasunexpected. Similarly to phthalates, they are also used asplastic additives, in cosmetics, defoamers, soaps, deodorants,lubricants, and other materials. Most of organics detected inlandfill leachates in our studies were not reported by otherresearches. Most of them are probably the products of theconversions taking place in the landfill.
4.1. Kinetics of m-Fenton and m-photo-Fenton Process. Thereaction rate of Fenton process causes problems in its de-scription. In order to describe the process of Fenton kineticspseudofirst and second order equations were employed byWu et al. [25]. Godala and Nowicki [26] used a fractional-order equation to describe dihydroxyphenols oxidationkinetics in relation to the concentration of oxidized sub-stances and H2O2. Wu et al. [25] recognized that Fentonprocess kinetics cannot be described by a simple equationand suggested an elaborated model, considering reactionrate constants for the ones described by (1)–(8). The sameauthors [27] suggested a two-stage model consisting of a“rapid reaction stage” followed by a “stagnant stage” forleachate. An attempt to apply these models in this study didnot give satisfactory results. The process seems to be toocomplex and assumptions taken by other authors do notconsider factors such as coagulation or reaction of organicradicals with oxygen. Reference [9] revealed that an empiricalmodel can be successfully employed to describe Fentonreaction rate as a change of COD values in time accordingto the following equation:
d[COD]dt
= −atm[COD], (19)
where “t” time and “a” and “m” constants are dependent onthe initial concentration of reagents.

8 International Journal of Photoenergy
Table 3: The values of the constants and correlation coefficients form-Fenton and m-photo-Fenton processes.
a∗10−2 (—) −m (—) R2 (—)
m-Fenton 2500/500 3.36 0.496 0.920
m-Fenton 3000/500 4.20 0.503 0.927
m-Fenton 3000/1000 4.48 0.503 0.919
m-Fenton 3500/500 4.23 0.494 0.933
m-photo-Fenton 2500/100 4.03 0.430 0.966
m-photo-Fenton 3000/100 4.18 0.436 0.940
m-photo-Fenton 3500/150 5.41 0.456 0.948
m-photo-Fenton 4000/200 4.84 0.4506 0.963
After integration and applying double logarithm thefollowing formula is obtained:
ln ln[COD0][COD]
= n ln t + ln k, (20)
where [COD]0 initial COD, n = m + 1, k = a/n.In the present study the same empirical model has been
used to describe m-Fenton and m-photo-Fenton processesinvolving oxidation reactions as well as final coagulationand sedimentation. High values of correlation coefficient(from 0.919 to 0.966) prove that the above-mentionedequation may be successfully used to describe the kineticsof the decrease in COD value in m-Fenton and m-photo-Fenton processes. The values of the constants and correlationcoefficients for the processes determined in relation to thereagent dose have been included in Table 3.
Constant “a” has the highest values for the individualprocesses when the reagent dose is optimal. Comparingthe values of “m” constant, which is the exponent in theequation, it can be stated that the decrease rate in CODvalue during m-photo-Fenton process depends on time tothe higher extent than in case of m-Fenton process.
5. Conclusions
Adjusting pH to 3.0, which is a necessary step to conductm-Fenton process, leads to a slow precipitation of humicsubstances. However, the separation of the sediment beforeadding next reagents significantly decreases both COD valueand COD/BOD5 ratio. The continuation of m-Fenton or m-photo-Fenton processes results in higher COD removal andthe values obtained in the studied leachate correspond to87.5% and 92.7%, respectively. The reported efficiency of120 min of m-Fenton process was higher than the efficiencyobtained for either O3/H2O2 or H2O2/UV processes, forwhich the values of efficiency were similar. After longerreaction periods the value of the efficiency of m-Fentonprocess was slightly lower than values observed for the othertwo processes. Based on the obtained results, it can bestated that m-photo-Fenton process was definitely the mosteffective of the all processes studied, regardless of the reactionperiod. Additionally, the “efficiency of oxidants” parameter isrecommended to be used to assess the efficiency of AOPs. Its
value allows to estimate the approximate amount of oxygenused in the oxidation process.
References
[1] T. A. Kurniawan, W. H. Lo, and G. Y. S. Chan, “Radicals-catalyzed oxidation reactions for degradation of recalcitrantcompounds from landfill leachate,” Chemical EngineeringJournal, vol. 125, no. 1, pp. 35–57, 2006.
[2] E. Neyens and J. Baeyens, “A review of classic Fenton’s perox-idation as an advanced oxidation technique,” Journal of Haz-ardous Materials, vol. 98, no. 1–3, pp. 33–50, 2003.
[3] Y. Deng and J. D. Englehardt, “Treatment of landfill leachate bythe Fenton process,” Water Research, vol. 40, no. 20, pp. 3683–3694, 2006.
[4] S. Cortez, P. Teixeira, R. Oliveira, and M. Mota, “Evaluationof Fenton and ozone-based advanced oxidation processes asmature landfill leachate pre-treatments,” Journal of Environ-mental Management, vol. 92, no. 3, pp. 749–755, 2011.
[5] O. Primo, M. J. Rivero, and I. Ortiz, “Photo-Fenton process asan efficient alternative to the treatment of landfill leachates,”Journal of Hazardous Materials, vol. 153, no. 1-2, pp. 834–842,2008.
[6] J. Sun, X. Li, J. Feng, and X. Tian, “Oxone/Co2+ oxidation asan advanced oxidation process: comparison with traditionalFenton oxidation for treatment of landfill leachate,” WaterResearch, vol. 43, no. 17, pp. 4363–4369, 2009.
[7] Y. Deng and C. M. Ezyske, “Sulfate radical-advanced oxidationprocess (SR-AOP) for simultaneous removal of refractoryorganic contaminants and ammonia in landfill leachate,”Water Research, vol. 45, no. 18, pp. 6189–6194, 2011.
[8] F. J. Rivas, F. Beltran, F. Carvalho, B. Acedo, and O. Gimeno,“Stabilized leachates: sequential coagulation-flocculation +chemical oxidation process,” Journal of Hazardous Materials,vol. 116, no. 1-2, pp. 95–102, 2004.
[9] A. Krzysztoszek and J. Naumczyk, “Landfill leachate treatmentby Fenton, photo-Fenton processes and their modification,”Journal of Advanced Oxidation Technologies, vol. 15, no. 1, pp.53–63, 2012.
[10] J. J. Wu, C. C. Wu, H. W. Ma, and C. C. Chang, “Treatmentof landfill leachate by ozone-based advanced oxidation pro-cesses,” Chemosphere, vol. 54, no. 7, pp. 997–1003, 2004.
[11] S. M. Kim, S. U. Geissen, and A. Vogelpohl, “Landfill leachatetreatment by a photoassisted Fenton reaction,” Water Scienceand Technology, vol. 35, no. 4, pp. 239–248, 1997.
[12] P. Haapea, S. Korhonen, and T. Tuhkanen, “Treatment ofindustrial landfill leachates by chemical and biological meth-ods: ozonation, ozonation + hydrogen peroxide, hydrogenperoxide and biological post-treatment for ozonated water,”Ozone: Science and Engineering, vol. 24, no. 5, pp. 369–378,2002.
[13] P. Schulte, A. Bayer, F. Kuhn, T. Luy, and M. Volkmer, “H2O2/O3, H2O2/UV and H2O2/Fe2+ processes for the oxidation ofhazardous waste,” Ozone: Science and Engineering, vol. 17, no.2, pp. 119–134, 1995.
[14] A. Lopez, M. Pagano, A. Volpe, and A. C. Di Pinto, “Fenton’spre-treatment of mature landfill leachate,” Chemosphere, vol.54, no. 7, pp. 1005–1010, 2004.
[15] B. Calli, B. Mertoglu, and B. Inanc, “Landfill leachate manage-ment in Istanbul: applications and alternatives,” Chemosphere,vol. 59, no. 6, pp. 819–829, 2005.

International Journal of Photoenergy 9
[16] H. Zhang, J. C. Heung, and C. P. Huang, “Optimization ofFenton process for the treatment of landfill leachate,” Journalof Hazardous Materials, vol. 125, no. 1–3, pp. 166–174, 2005.
[17] H. Zhang, H. J. Choi, and C. P. Huang, “Treatment of landfillleachate by Fenton’s reagent in a continuous stirred tankreactor,” Journal of Hazardous Materials, vol. 136, no. 3, pp.618–623, 2006.
[18] Y. Deng, “Physical and oxidative removal of organics duringFenton treatment of mature municipal landfill leachate,”Journal of Hazardous Materials, vol. 146, no. 1-2, pp. 334–340,2007.
[19] J. L. de Morais and P. P. Zamora, “Use of advanced oxidationprocesses to improve the biodegradability of mature landfillleachates,” Journal of Hazardous Materials, vol. 123, no. 1–3,pp. 181–186, 2005.
[20] M. Steensen, “Chemical oxidation for the treatment of leach-ate—process comparison and results from full-scale plants,”Water Science and Technology, vol. 35, no. 4, pp. 249–256, 1997.
[21] N. H. Ince, “Light-enhanced chemical oxidation for tertiarytreatment of municipal landfill leachate,” Water EnvironmentResearch, vol. 70, no. 6, pp. 1161–1169, 1998.
[22] H. Y. Shu, H. J. Fan, M. C. Chang, and W. P. Hsieh, “Treatmentof MSW landfill leachate by a thin gap annular UV/H2O2
photoreactor with multi-UV lamps,” Journal of HazardousMaterials, vol. 129, no. 1–3, pp. 73–79, 2006.
[23] Y. W. Kang and K. Y. Hwang, “Effects of reaction conditions onthe oxidation efficiency in the Fenton process,” Water Research,vol. 34, no. 10, pp. 2786–2790, 2000.
[24] S. Jonsson, J. Ejlertsson, A. Ledin, I. Mersiowsky, and B.H. Svensson, “Mono- and diesters from o-phthalic acid inleachates from different European landfills,” Water Research,vol. 37, no. 3, pp. 609–617, 2003.
[25] Y. Wu, S. Zhou, F. Qin, K. Zheng, and X. Ye, “Modeling theoxidation kinetics of Fenton’s process on the degradation ofhumic acid,” Journal of Hazardous Materials, vol. 179, no. 1–3,pp. 533–539, 2010.
[26] M. Godala and L. Nowicki, “Kinetics of dihydroxyphenolsoxidation by Fenton reagent,” Ecological Chemistry and Engi-neering, vol. 9, no. 1, pp. 43–52, 2002.
[27] Y. Wu, S. Zhou, K. Zheng, X. Ye, and F. Qin, “Mathematicalmodel analysis of Fenton oxidation of landfill leachate,” WasteManagement, vol. 31, no. 3, pp. 468–474, 2011.

Hindawi Publishing CorporationInternational Journal of PhotoenergyVolume 2012, Article ID 107293, 10 pagesdoi:10.1155/2012/107293
Research Article
Bromate Formation Characteristics ofUV Irradiation, Hydrogen Peroxide Addition, Ozonation, andTheir Combination Processes
Naoyuki Kishimoto1 and Eri Nakamura2
1 Faculty of Science and Technology, Ryukoku University, 1-5 Yokotani, Setaoe-cho, Otsu 520-2194, Japan2 Graduate School of Science and Technology, Ryukoku University, 1-5 Yokotani, Setaoe-cho, Otsu 520-2194, Japan
Correspondence should be addressed to Naoyuki Kishimoto, [email protected]
Received 28 May 2012; Revised 8 August 2012; Accepted 8 August 2012
Academic Editor: Manickavachagam Muruganandham
Copyright © 2012 N. Kishimoto and E. Nakamura. This is an open access article distributed under the Creative CommonsAttribution License, which permits unrestricted use, distribution, and reproduction in any medium, provided the original work isproperly cited.
Bromate formation characteristics of six-physicochemical oxidation processes, UV irradiation, single addition of hydrogen per-oxide, ozonation, UV irradiation with hydrogen peroxide addition (UV/H2O2), ozonation with hydrogen peroxide addition (O3/H2O2), and ozonation with UV irradiation (O3/UV) were investigated using 1.88 μM of potassium bromide solution with orwithout 6.4 μM of 4-chlorobenzoic acid. Bromate was not detected during UV irradiation, single addition of H2O2, and UV/H2O2,whereas ozone-based treatments produced BrO3
−. Hydroxyl radicals played more important role in bromate formation than mole-cular ozone. Acidification and addition of radical scavengers such as 4-chlorobenzoic acid were effective in inhibiting bromateformation during the ozone-based treatments because of inhibition of hydroxyl radical generation and consumption of hydroxylradicals, respectively. The H2O2 addition was unable to decompose 4-chlorobenzoic acid, though O3/UV and O3/H2O2 showedthe rapid degradation, and UV irradiation and UV/H2O2 showed the slow degradation. Consequently, if the concentration oforganic contaminants is low, the UV irradiation and/or UV/H2O2 are applicable to organic contaminants removal without bromateformation. However, if the concentration of organic contaminants is high, O3/H2O2 and O3/UV should be discussed as advancedoxidation processes because of their high organic removal efficiency and low bromate formation potential at the optimumcondition.
1. Introduction
Nowadays, the world demand for water is growing becauseof the rapid population growth. Furthermore, pollution offreshwater resources proceeds in all over the world. Forinstance, China encounters severe water pollution caused byindustrial chemicals, heavy metals, and algal toxin with anextraordinary economic growth [1]. Gadgil [2] reported thatabout half the population in the developing world is sufferingfrom one or more of the six main diseases, diarrhea, ascarisdracunculisis, hookworm, schistosomiasis, and trachoma,which are associated with water supply and sanitation. In theindustrialized countries, micropollutants like pharmaceu-ticals gather much concern as potential contaminants indrinking water [3] and surface water [4]. As a result of thissituation, water supply section has made efforts to supply
a plenty of safe drinking water. In this context, variousadvanced water treatment like UV disinfection, ozonation,and adsorption processes [5–7] have been introduced towater purification plants.
UV irradiation and ozone-based chemical oxidation arewidely used as advanced water purification processes. Theseprocesses can achieve higher level of disinfection and organicpollutants removal [9, 10]. However, bromate (BrO3
−)formation in these chemical oxidation processes may bringa potential health risk, because BrO3
− is a possibly carcino-genic to human [11]. Therefore, it is important to under-stand BrO3
− formation potential in these processes.Various knowledge of the BrO3
− formation during UVand ozone-based chemical oxidation processes has beenaccumulated for past a few decades. For instance, ozonationof bromide-containing water produces BrO3
− via ozone and

2 International Journal of Photoenergy
hydroxyl radical pathways [8], but pH depression [12] andammonia addition [12, 13] successfully decrease BrO3
−
formation. The pH depression decreased 50–63% in BrO3−
formation per a decline in one-pH-unit [12] because of adepression of hydroxyl radical generation and a decrease inhypobromite (BrO−), which is a key intermediate of BrO3
−
formation. The inhibition effect of ammonia addition onBrO3
− formation is caused by bromamines formation fromthe reaction of HOBr with ammonia [14]. The effectiveammonia dose for BrO3
− depression was limited to 200 μg/Land further increase in ammonia addition did not enhancethe BrO3
− minimization [14]. Effect of hydrogen peroxide(H2O2) in ozonation on BrO3
− formation is complicated. AsH2O2 can reduce BrO− into bromide (Br−) [15], it seems tobe useful to depress the BrO3
− formation. However, ozonereacts with hydroperoxide anion (HO2
−) and produces hyd-roxyl radicals (•OH) [16], which promotes oxidation of Br−
[8]. Ozekin et al. [13] reported that an increase in H2O2
dose in ozonized water enhanced BrO3− formation at pH
6.5, though the BrO3− formation at pH 8.5 did not depended
on the H2O2 dose and was smaller than that of ozone alone.Kim et al. [17] pointed out the importance of molar ratioof H2O2/O3 for BrO3
− formation during ozonation withH2O2 addition; the molar ratio of H2O2/O3 above 0.5 andthe dissolved ozone concentration below 0.1 mg/L success-fully depress the BrO3
− formation. The inconsistent resultsbetween Ozekin et al. [13] and Kim et al. [17] may be causedby the difference in their experimental designs: H2O2 wasinjected during ozonation [17] or after ozonation [13]. But,both research groups suggested that the •OH generationunder a certain concentration of dissolved ozone enhancedthe BrO3
− formation during ozone/H2O2 treatment [13, 17].UV light is known to decompose BrO3
− into BrO− and/or Br− [18]. As the result, Collivignarelli and Sorlini [19]reported that BrO3
− formation during ozonation with UV254 nm irradiation (O3/UV) was about 40% lower than thatduring conventional ozonation. However, Ratpukdi et al.[20] showed that the BrO3
− formation potential of O3/UVwas similar to ozonation alone, though ozonation combinedwith vacuum UV irradiation could decrease the BrO3
−
formation. Thus, the BrO3− formation mechanisms of UV
and ozone-based chemical oxidation processes have beenexplored extensively. However, each research was performedusing different reactors, different procedures, and differentwater matrices. Therefore, it is not easy to judge which pro-cess should be selected for BrO3
− control.In this study, BrO3
− formation in UV irradiation, H2O2
addition, ozonation, and their combination processes, UVirradiation with H2O2 addition (UV/H2O2), ozonation withH2O2 addition (O3/H2O2), and ozonation with UV irradi-ation (O3/UV), were discussed using the same reactor andthe same water matrix to provide comparable information oftheir features of BrO3
− formation and its control.
2. Experimental
2.1. Material and Experimental Conditions. A low-pressuremercury vapor lamp (20W, UVL20PH-6, Sen Lights, Japan)
was used as a UV light source. Ozone gas was generated fromanalytical grade oxygen gas with a silent discharge ozonizer(ED-OG-R3Lt, Eco Design, Japan). Hydrogen peroxide waspurchased from Nacalai Tesque, Japan as about 35% aque-ous solution (extra pure grade) and used without furtherpurification. The accurate H2O2 concentration was checkedjust before an experiment and final concentration was set at10, 100, or 1,000 μM. Figure 1 shows the experimental setup.The reactor was made of glass with a volume of 1.9 L. TheUV lamp in a duplex quartz jacket was installed in the centerof the reactor. Ozone was injected through two gas diffusersmade of glass at the injection rate of about 20 mg/min. Inletand outlet ozone gas concentration was monitored withtwo ozone monitors (EG-600, Ebara Jitsugyo, Japan). Theexhaust ozone gas was dried with a gas dryer (DH106-1,Komatsu Electronics, Japan) before ozone monitoring,because water vapor biases the ozone concentration. Oxygengas flow rate was regulated with a mass flow controller(CMQ9200, Yamatake, Japan) at 500 mL/min. Test solutionwas 1.9 L of 1.88 μM potassium bromide (KBr, NacalaiTesque, Japan) solution with or without 6.4 μM of 4-chloro-benzoic acid (4-CBA, Wako Chemicals, Japan). The 4-CBAwas used as a model compound of organic scavengers ofhydroxyl radical (•OH), because it was unreactive with ozone[21]. The solution pH was adjusted by addition of sulfuricacid or sodium hydroxide at around 2.5 or 7. An experimen-tal run continued for 10 or 30 minutes and solution in thereactor was sampled every two or five minutes for chem-ical analyses of BrO3
−, bromide ion (Br−), dissolved ozone,H2O2, 4-CBA, and pH.
2.2. Chemical Analysis. The Br− concentration was analyzedusing an ion chromatography system with a conductivitydetector (DX-500, Dionex, USA). Analytical conditions wereas follows. Column: Dionex IonPac AS12A with a suppres-sor (Dionex ASRS-ULTRA 4 mm); mobile phase: aqueoussolution with 2.7 mM sodium carbonate and 0.3 mM sodiumbicarbonate; flow rate: 1.0 mL/min; sample injection volume:100 μL; oven temperature: 40◦C. The BrO3
− concentrationwas determined by the ion chromatography coupled with apostcolumn system (Dionex BRS-500) [22]. Reaction condi-tions were as follows, reactant A: 1.5 M potassium bromideand 1.0 M sulfuric acid; reactant B: 1.2 mM sodium nitrite;flow rate: 0.4 mL/min for reactant A and 0.2 mL/min forreactant B; reaction temperature: 40◦C; detection: absor-bance at 268 nm. The determination limit was estimated tobe 0.050 μM. Dissolved ozone and H2O2 were analyzed byindigo-colorimetric method [23] and DMP method [24],respectively. The 4-CBA concentration was determined bythe high-performance liquid chromatography (LV-10ADVP,Shimadzu, Japan) [21]. Analytical conditions were as follows:column: ODS-80TM (4.6 × 250 mm, Tosoh, Japan); mobilephase: acetonitrile (70%) and 0.1% phosphoric acid (30%);flow rate: 1.0 mL/min; sample injection volume: 200 μL; oventemperature: 40◦C; detection: absorbance at 234 nm. Thesolution pH was measured with a pH meter (Twin pH B-212,Horiba, Japan).

International Journal of Photoenergy 3
Sampling tapUV lamp
Ozonemonitor
Ozonemonitor
Ozonedecomposer
Diffuser
ReactorMass flowcontroller
Oxygen gas
Ozonegenerator
Stirrer
Exhaustion
Gasdryer
Figure 1: Experimental setup.
3. Results and Discussion
3.1. UV Irradiation, H2O2 Addition, and UV/H2O2 Process.The H2O2 addition did not change concentrations of BrO3
−,Br−, and 4-CBA under both acid and neutral pH conditions(data not shown). Although H2O2 is an oxidant, H2O2 isnucleophilic too. Therefore, H2O2 can oxidize Br− into bro-mine (Br2), but Br2 is reduced into Br− by H2O2 as follows[25]:
2Br− + H2O2 + 2H+ −→ Br2 + 2H2O
Br2 + H2O2 −→ 2H+ + 2Br− + O2
(1)
Accordingly, Br− concentration did not change because ofthe catalytic behavior of Br− as shown in reactions (1). Onthe reactivity of 4-CBA with H2O2, Dionysiou et al. [26] alsoobserved that H2O2 did not decompose 4-CBA under thedark condition. Since the standard electrode potential ofH2O2 (1.736 V versus standard hydrogen electrode (SHE))is lower than that of ozone (2.07 V versus SHE) and •OH(2.38 V versus SHE) [25], the low oxidation potential ofH2O2 may be responsible for the low reactivity with 4-CBA.
Figure 2 shows the time-course changes in Br−, BrO3−,
and 4-CBA concentrations during UV irradiation and UV/H2O2 at neutral pH. The concentration changes at acidiccondition were almost the same at neutral pH, though theH2O2 accumulation was enhanced at acidic condition. Thelow-pressure mercury vapor lamp emits vacuum UV light of185 nm, which can photolyze water molecules into hydrogenatoms and •OH [27]. Therefore, H2O2 accumulation wascaused by H2O2 production via the combination of two•OH [28]. The concentrations of Br− and 4-CBA declinedduring the UV irradiation and UV/H2O2, though BrO3
−
was not generated (Figure 2). No BrO3− formation during
UV irradiation and UV/H2O2 was also reported by Kruithofet al. [29]. The H2O2 concentration in the both treatmentincreased with the passage of time, and the final concen-tration in UV irradiation reached over 10 μM, which was theinitial concentration in UV/H2O2. The 4-CBA degradationin UV irradiation slightly delayed in comparison with thatin UV/H2O2, but the degradation was enhanced with theaccumulation of H2O2. Accordingly, •OH generation via
UV photolysis of H2O2 [27] was believed to contribute tothe 4-CBA degradation during the UV irradiation and UV/H2O2. The decline in Br− concentration without BrO3
−
accumulation indicates the formation of intermediates. VonGunten and Oliveras [8] reported that ozone and •OH oxi-dized Br− to BrO3
− (Figure 3). In this mechanism, hypo-bromite ion (BrO−) and bromite ion (BrO2
−) are the criticalintermediates, which participate in all BrO3
− formationpathways. Accordingly, UV irradiation and UV/H2O2 werethought to produce BrO− and/or BrO2
−. The H2O2 canreduce hypobromous acid (HOBr) and BrO− as follows [15]:
BrO− + H2O2 −→ Br− + H2O + O2
k = 1.3× 10⁶ M−1 s−1,
HOBr + HO2− −→ Br− + H2O + O2
k = 7.6× 10⁸ M−1 s−1,
HOBr + H2O2 −→ Br− + H+ + H2O + O2
k = 1.5× 10⁴ M−1s−1.
(2)
Therefore, the accumulation of H2O2 was inferred to con-tribute partly to the prevention of BrO3
− formation in UVirradiation and UV/H2O2. Phillip et al. [30] reported thatlow-pressure mercury vapor lamps decayed free bromineinto Br− (major) and BrO3
− (minor). Thus, the photo-deg-radation of HOBr/BrO− might conduce to the prevention ofBrO3
− formation too.
3.2. Ozonation. In ozonation, BrO3− formation was corre-
spondent to a decrement in Br− at neutral pH without 4-CBA. However, the BrO3
− formation was much lower thanBr− removal at acidic pH or coexistence of 4-CBA (Figure 4).Although both ozone and •OH promote the oxidation of Br−
to BrO3− via BrO− and BrO2
− (Figure 3), our experimentalresults shown in Figure 4 indicated that contribution of •OHto BrO3
− evolution was relatively large. Because acidic pHrestrains •OH generation via self-decomposition of ozone[31], and 4-CBA is a •OH radical scavenger with low reac-tivity with ozone [21]. Since HOBr has a pKa of 8.8–9.0 [32],

4 International Journal of Photoenergy
2
1.5
1
0.5
0
Con
cen
trat
ion
(μM
)
0 5 10 15 20 25 30
Time (min)
Br− (UV)Br− (UV/H2O2)
BrO3− (UV)
BrO3− (UV/H2O2)
(a)
0 5 10 15 20 25 30
Time (min)H
2O
2co
nce
ntr
atio
n (μM
)
30
25
20
15
10
5
0
7
6
5
4
3
2
1
0
4-C
BA
con
cen
trat
ion
(μM
)
H2O2 (UV)H2O2 (UV/H2O2)
4-CBA (UV)4-CBA (UV/H2O2)
(b)
Figure 2: Changes in concentrations of Br−, BrO3−, H2O2, and 4-CBA during UV irradiation (UV) and UV/H2O2 treatment at neutral pH.
The initial H2O2 concentration for UV/H2O2 was 10 μM.
BrO−+O3
+O3
+O3
Br−
+•OH
+•OH +•OH+•OH
BrOH−
+Br−
Br•−OH−
−Br−
+BrO−
+BrO2
Br2
+H2O
+Br−
Br2O4
+BrO•
BrO•
+
+BrO2
+OH−
O3 reaction•OH reaction
BrO2−
BrO2−
BrO3−
Br2−
Br3−
Br2−
Figure 3: BrO3− formation pathways illustrated on the basis of Von Gunten and Oliveras [8].
acidification decreases the percentage of BrO−. The decreasein BrO− at acidic pH also contributed to the decrease inBrO3
− formation [33]. In addition, the discordance of a dec-rement in Br− and an increment in BrO3
− at acidic pH inFigure 4 suggested the accumulation of HOBr.
3.3. O3/H2O2. Figure 5 shows the changes in concentrationsof Br−, BrO3
−, and 4-CBA during O3/H2O2 at various H2O2
doses and pHs. The O3/H2O2 processes showed additionaleffect on lowering BrO3
− formation, especially at higherH2O2 dose. Bromate ion was not detected in O3/H2O2 atthe H2O2 dose of 1,000 μM. When the H2O2 dose was
lowered to 100 or 10 μM, rapid BrO3− formation was
observed (Figure 5). As H2O2 can reduce HOBr/BrO− intoBr−, the excess H2O2 was believed to restrain BrO3
− for-mation. The behavior of BrO3
− formation in O3/H2O2 at theH2O2 dose of 10 μM (Figure 5) was similar to that in ozona-tion (Figure 4), since H2O2 concentration in ozonationincreased to around 10 μM, which was nearly equal toH2O2 concentration in O3/H2O2 at the H2O2 dose of 10 μM(Figure 6). Thus, the initial H2O2 dose of 10 μM was too lowto restrain the BrO3
− formation in this study.When acidification was applied, BrO3
− was not detectedin O3/H2O2 at the H2O2 dose of 100 μM or higher. This effectwas caused by both the HOBr/BrO− reduction by H2O2

International Journal of Photoenergy 5
2
1.5
1
0.5
0
8
6
4
2
0 4-C
BA
con
cen
trat
ion
(μM
)
Time (min) Time (min)0 5 10 0 5 10 15 20 25 30
4-CBA
Br−
Br
or
con
cen
trat
ion
(μM
)
(N-1) (N-2)
(A-1) (A-2)
Time (min) Time (min)0 5 10 0 5 10 15 20 25 30
8
6
4
2
0 4-C
BA
con
cen
trat
ion
(μM
)
4-CBA
Br−
2
1.5
1
0.5
0
BrO3−
BrO
3−
Br
or
con
cen
trat
ion
(μM
)B
rO3−
BrO3−
Figure 4: Changes in concentrations of Br−, BrO3−, and 4-CBA during ozonation at neutral pH without 4-CBA (N-1), ozonation at neutral
pH with 4-CBA (N-2), ozonation at acidic pH without 4-CBA (A-1), and ozonation at acidic pH with 4-CBA (A-2).
and inhibition of •OH generation in O3/H2O2. Because•OH generation in O3/H2O2 is expressed by the followingreactions [16] and the acidification inhibits the dissociationof H2O2 and HO2 (reactions (3) and (5)) as follows:
H2O2 ←→ H+ + HO2− (3)
O3 + HO2− −→ •O3
− + HO2• (4)
HO2• ←→ H+ + •O2
− (5)
O3 + •O2− −→ •O3
− + O2 (6)
•O3− + H+ ←→ HO3 → O2 +•OH (7)
The inhibition of •OH generation in O3/H2O2 was also con-firmed by a slow decrease in 4-CBA at acidic pH (Figure 5).
3.4. O3/UV. Figure 7 shows changes in Br−, BrO3−, and 4-
CBA concentrations during O3/UV. The O3/UV increasedBrO3
− concentration rapidly, even at the acidic pH. However,the addition of 4-CBA successfully decreased the BrO3
−
formation regardless of the pH condition. Collivignarelli andSorlini [19] also observed lower BrO3
− formation in O3/UV than that in ozonation. As mentioned in the Section 3.2,the acidification decreases BrO3
− formation by the inhibitionof •OH generation via the self-decomposition of ozone.Accordingly, it was thought that •OH generated by the
self-decomposition of ozone did not contribute to BrO3−
formation very much in O3/UV. This discussion was sup-ported by the lower concentration of dissolved ozone in O3/UV (Figure 8). The low dissolved ozone concentration alsobrought the negligible contribution of molecular ozone toBrO3
− formation. The decrease in BrO3− formation by the
addition of 4-CBA indicated the contribution of •OH toBrO3
− formation. Accordingly, it is suggested that the mainoxidant in O3/UV was •OH, which mainly generated via UVphotolysis of ozone [16]. The first step of •OH generationin O3/UV is the production of H2O2 [16]. Then the H2O2
generates •OH through UV photolysis [16] and the samereactions as O3/H2O2 (reactions (3)–(7)). As the coexistenceof dissolved ozone and •OH favors BrO3
− formation [13, 17],low dissolved ozone concentration in O3/UV was thoughtto be advantageous to the depression of BrO3
− formation.Moreover, strong H2O2 accumulation was observed duringO3/UV (Figure 9). Therefore, the reduction of intermediatesby H2O2 [15] and UV photolysis [30] was also inferred tocontribute to the decline in the BrO3
− formation potential.
3.5. Strategy for Organic Contaminants Removal with Prevent-ing BrO3
− Formation. The aim of advanced oxidation pro-cesses is organic contaminants removal from a water stream.Therefore, it is important to remove organic contaminantswithout BrO3
− formation. In this context, H2O2 addition

6 International Journal of Photoenergy
Time (min) Time (min)
0 5 10 0 5 10 15 20 25 30
8
6
4
2
0 4-C
BA
con
cen
trat
ion
(μM
)2
1.5
1
0.5
0
Br− (10μM)Br− (100μM)Br− (1000μM)
4-CBA (10 μM)4-CBA (100 μM)4-CBA (1000 μM)
Time (min) Time (min)
0 5 10 0 5 10 15 20 25 30
8
6
4
2
0 4-C
BA
con
cen
trat
ion
(μM
)2
1.5
1
0.5
0
Br− (10μM)Br− (100μM)Br− (1000μM)
(10μM)(100μM)
(1000μM)4-CBA (10 μM)4-CBA (100 μM)4-CBA (1000 μM)
(μM
)(μ
M)
(N-1) (N-2)
(A-1) (A-2)
(100μM)(10μM)
(1000μM)
BrO3−
BrO3−
BrO3−
BrO3−
BrO3−
BrO3−
or
con
cen
trat
ion
BrO
3−
Br−
or
con
cen
trat
ion
BrO
3−
Br−
Figure 5: Changes in concentrations of Br−, BrO3−, and 4-CBA during O3/H2O2 at various H2O2 doses. The concentrations in the legend
mean the H2O2 dose. The symbols in the bracket mean O3/H2O2 at neutral pH without 4-CBA (N-1), O3/H2O2 at neutral pH with 4-CBA(N-2), O3/H2O2 at acidic pH without 4-CBA (A-1), and O3/H2O2 at acidic pH with 4-CBA (A-2).
is inapplicable to advanced water treatment, because it isnot effective to degrade refractory organic matters like 4-CBA. Ozonation is also difficult to apply to the organic con-taminants removal, because it has higher BrO3
− formationpotential at the neutral pH than at the acidic pH as shownin Figure 4. Although the acidification successfully decreasesthe BrO3
− formation potential of ozonation, it decreases theremoval rate of organic contaminants too.
Contrary to H2O2 addition and ozonation, UV-basedprocesses and O3/H2O2 are potentially applicable toadvanced water treatment with inhibiting BrO3
− formation.The UV irradiation and UV/H2O2 successfully decomposeorganic contaminants without BrO3
− formation. But theirdegradation rate of organic contaminants is not high, andH2O2 dose of 10 μM is too low to enhance the degradationrate of UV irradiation. The O3/H2O2 is characterized byrapid degradation of organic contaminants and low BrO3
−
formation rate at high H2O2 dose. Although the acidificationeffectuates further decrease in BrO3
− formation, it spoilsthe degradation of organic contaminants. Therefore, theacidification should not apply to O3/H2O2. The feature of
O3/UV is rapid degradation of organic contaminants, lowdissolved ozone concentration, and much H2O2 accumula-tion. As the BrO3
− formation in O3/UV is restrained underthe coexistence of organic contaminants, the O3/UV isapplicable, if water contains sufficient quantity of organiccontaminants. Figure 10 shows the relationship betweenBrO3
− concentration and cumulative ozone consumption.Figure 10 demonstrates that O3/UV and O3/H2O2 at theH2O2 doses of 100 and 1,000 μM were significantly decreasedBrO3
− formation per ozone consumption in comparisonwith ozonation and O3/H2O2 at the H2O2 dose of 10 μM.Kim et al. [17] reported that BrO3
− concentration in O3/H2O2 remained less than 10 μg/L, when the molar ratio ofH2O2 to ozone was above 0.5. In our study of O3/H2O2
at the H2O2 dose of 100 μM, BrO3− was not produced
at ozone consumption less than 250 μM. Thus, our resultapproximately accorded with the research by Kim et al. [17].
Consequently, if the concentration of organic contam-inants is low, the UV irradiation and/or UV/H2O2 areapplicable to organic contaminants removal without BrO3
−
formation, though it is necessary to beware nitrite formation

International Journal of Photoenergy 7
120
100
80
60
40
20
0
0 2 4 6 8 10
Time (min)
H2O
2co
nce
ntr
atio
n (μM
)
100μM (pH 7)100μM (pH 2.5)10μM (pH 7)
10μM (pH 2.5)O3 (pH 7)O3 (pH 2.5)
(a)
0 2 4 6 8 10
Time (min)
H2O
2co
nce
ntr
atio
n (μM
)
1200
1000
800
600
400
200
0
1000μM (pH 7)1000μM (pH 2.5)
(b)
Figure 6: Changes in H2O2 concentrations during O3/H2O2 and ozonation without 4-CBA. The concentrations in the legend mean theH2O2 dose in O3/H2O2.
2
1.5
1
0.5
0
Time (min) Time (min)
0 5 10 0 5 10 15 20 25 30
8
6
4
2
0 4-C
BA
con
cen
trat
ion
(μM
)
4-CBA
Br−
Time (min) Time (min)
0 5 10 0 5 10 15 20 25 30
4-CBA
8
6
4
2
0 4-C
BA
con
cen
trat
ion
(μM
)
Br−
2
1.5
1
0.5
0
(μM
)(μ
M)
(N-1) (N-2)
(A-1) (A-2)
BrO3−
BrO3−
or
con
cen
trat
ion
BrO
3−
Br−
or
con
cen
trat
ion
BrO
3−
Br−
Figure 7: Changes in concentrations of Br−, BrO3−, and 4-CBA during O3/UV at neutral pH without 4-CBA (N-1), O3/UV at neutral pH
with 4-CBA (N-2), O3/UV at acidic pH without 4-CBA (A-1), and O3/UV at acidic pH with 4-CBA (A-2).

8 International Journal of Photoenergy
O3 (pH 7)O3 (pH 2.5)O3/H2O2 (pH 7)
O3/UV (pH 7)O3/UV (pH 2.5)
O3/H2O2 (pH 2.5)
90
80
70
60
50
40
30
20
10
00 5 10 15 20 25 30
Time (min)
Dis
solv
ed O
3(μ
M)
Figure 8: Changes in dissolved ozone concentrations during ozona-tion, O3/H2O2 (the H2O2 dose of 100 μM), and O3/UV with theaddition of 4-CBA.
pH 7, 4-CBA
pH 2.5, 4-CBA
600
500
400
300
200
100
00 5 10 15 20 25 30
Time (min)
H2O
2co
nce
ntr
atio
n (μM
)
Figure 9: Changes in H2O2 concentrations during O3/UV with 4-CBA.
during the treatment [34]. However, if the concentration oforganic contaminants is high, O3/H2O2 and O3/UV shouldbe discussed as advanced oxidation processes. When O3/H2O2 is applied, the H2O2 dose should be more than the halfof ozone consumption, because low H2O2 dose is ineffectivefor BrO3
− control. When O3/UV is applied, the reactiontime should be optimized, because extended reaction timeincreases the BrO3
− formation potential. The real-timemonitoring of UV absorbance of organic contaminants inwater [35] may be effective in the optimum control of thereaction time of O3/UV without BrO3
− formation.
4. Conclusion
In this research, BrO3− formation potential of UV irradia-
tion, H2O2 addition, ozonation, UV/H2O2, O3/H2O2, andO3/UV treatment were discussed for organic contaminants
O3
3O /UV
O3/H2O2 (10μM)
O3/H2O2 (100μM)O3/H2O2 (1000μM)
0.6
0.5
0.4
0.3
0.2
0.1
0
0 200 400 600 800 1000 1200 1400 1600 1800 2000
Cumulative ozone consumption (μM)
BrO
−3
accu
mu
lati
on (μM
)
Figure 10: Relationship between cumulative ozone consumptionand BrO3
− accumulation during each treatment with 4-CBA addi-tion at neutral pH. Each treatment continued 30 minutes.
removal with restraining BrO3− formation using KBr solu-
tion with 4-CBA as a model refractory organic contami-nant.
The UV irradiation, H2O2 addition, and UV/H2O2 pre-vented BrO3
− formation completely. However, H2O2 addi-tion was inapplicable as advanced water treatment becauseof its weak oxidation ability. The UV irradiation and UV/H2O2 could decompose the organic contaminant moder-ately. Ozonation produced the most BrO3
− at neutral pH.Although acidification could decrease the BrO3
− formation,it also deteriorated the oxidation ability of ozonation. There-fore, it was thought to be difficult to apply ozonation toorganic contaminants removal with restraining BrO3
− for-mation. The O3/H2O2 successfully decreased BrO3
− forma-tion at the H2O2 doses of 100 μM or higher. The degradationrate of 4-CBA was larger than the UV irradiation andUV/H2O2. However, the behavior of BrO3
− formation inthe O3/H2O2 at the H2O2 dose of 10 μM was similar tothat in ozonation because of a deficiency of H2O2. The O3/UV also showed rapid degradation of 4-CBA. Although itproduced much BrO3
− under the absence of 4-CBA, theBrO3
− formation was strongly inhibited by the coexistenceof 4-CBA. Consequently, if the concentration of organiccontaminants is low, the UV irradiation and/or UV/H2O2 areapplicable to organic contaminants removal without BrO3
−
formation. However, if the concentration of organic contam-inants is high, O3/H2O2 and O3/UV should be discussed asadvanced oxidation processes because of their higher organicremoval efficiency.
International Journal of Photoenergy 9
References
[1] C. Wu, C. Maurer, Y. Wang, S. Xue, and D. L. Davis, “Waterpollution and human health in China,” Environmental HealthPerspectives, vol. 107, no. 4, pp. 251–256, 1999.
[2] A. Gadgil, “Drinking water in developing countries,” AnnualReview of Energy and the Environment, vol. 23, no. 1, pp. 253–286, 1998.
[3] O. A. Jones, J. N. Lester, and N. Voulvoulis, “Pharmaceuticals:a threat to drinking water?” Trends in Biotechnology, vol. 23,no. 4, pp. 163–167, 2005.
[4] R. Takanami, H. Ozaki, R. R. Giri, S. Taniguchi, and S.Hayashi, “Antiviral drugs zanamivir and oseltamivir found inwastewater and surface water in Osaka, Japan,” Journal ofWater and Environment Technology, vol. 10, pp. 57–68, 2012.
[5] D. Dotson, C. E. Rodoriquez, and K. G. Linden, “UV disin-fection implementation status in US water treatment plants,”Journal AWWA, vol. 104, pp. 77–78, 2012.
[6] B. L. Loeb, C. M. Thompson, J. Drago, H. Takahara, and S.Baig, “Worldwide ozone capacity for treatment of drinkingwater and wastewater: a review,” Ozone: Science & Engineering,vol. 34, pp. 64–77, 2012.
[7] I. Ali and V. K. Gupta, “Advances in water treatment by adsorp-tion technology,” Nature Protocols, vol. 1, no. 6, pp. 2661–2667,2007.
[8] U. Von Gunten and Y. Oliveras, “Advanced oxidation ofbromide-containig waters: bromate formation mechanisms,”Environmental Science and Technology, vol. 32, no. 1, pp. 63–70, 1998.
[9] D. Gerrity and S. Snyder, “Review of ozone for water reuseapplications: toxicity, regulations, and trace organic contam-inant oxidation,” Ozone: Science and Engineering, vol. 33, no.4, pp. 253–266, 2011.
[10] B. A. Wols and C. H. M. Hofman-Caris, “Review of photo-chemical reaction constants of organic micropollutants requi-red for UV advanced oxidation processes in water,” WaterResearch, vol. 46, pp. 2815–2827, 2012.
[11] IARC Monographs on the Evaluation of Carcinogenic Risks toHumans, vol. 73, International Agency for Research on Cancer,Lyon, France, 1999.
[12] M. S. Siddiqui and G. L. Amy, “Factors affecting DBP for-mation during ozone-bromide reactions,” Journal of AmericanWater Works Association, vol. 85, no. 1, pp. 63–72, 1993.
[13] K. Ozekin, P. Westerhoff, G. L. Amy, and M. Siddiqui, “Mole-cular ozone and radical pathways of bromate formation dur-ing ozonation,” Journal of Environmental Engineering, vol. 124,no. 5, pp. 456–462, 1998.
[14] U. Pinkernell and U. von Gunten, “Bromate minimizationduring ozonation: mechanistic considerations,” Environmen-tal Science and Technology, vol. 35, no. 12, pp. 2525–2531,2001.
[15] U. Von Gunten and Y. Oliveras, “Kinetics of the reactionbetween hydrogen peroxide and hypobromous acid: implica-tion on water treatment and natural systems,” Water Research,vol. 31, no. 4, pp. 900–906, 1997.
[16] W. H. Glaze, J. Kang, and D. H. Chapin, “The chemistry ofwater treatment processes involving ozone, hydrogen peroxideand ultraviolet radiation,” Ozone: Science & Engineering, vol. 9,pp. 335–352, 1987.
[17] H. S. Kim, H. Yamada, and H. Tsuno, “The control of bromi-nated by-products and the removal of organic pollutantsduring the ozone/hydrogen peroxide treatment of secondaryeffluent,” Ozone: Science and Engineering, vol. 29, no. 1, pp.23–30, 2007.
[18] M. S. Siddiqui, G. L. Amy, and L. J. McCollum, “Bromate des-truction by UV irradiation and electric arc discharge,” Ozone:Science and Engineering, vol. 18, no. 3, pp. 271–290, 1996.
[19] C. Collivignarelli and S. Sorlini, “AOPs with ozone and UVradiation in drinking water: contaminants removal and effectson disinfection byproducts formation,” Water Science andTechnology, vol. 49, no. 4, pp. 51–56, 2004.
[20] T. Ratpukdi, F. Casey, T. Desutter, and E. Khan, “Bromateformation by ozone-VUV in comparison with ozone andozone-UV: effects of pH, ozone dose, and VUV power,” Journalof Environmental Engineering, vol. 137, no. 3, pp. 187–195,2011.
[21] N. Kishimoto, Y. Morita, H. Tsuno, T. Oomura, and H.Mizutani, “Advanced oxidation effect of ozonation combinedwith electrolysis,” Water Research, vol. 39, no. 19, pp. 4661–4672, 2005.
[22] N. Kishimoto, A. Kishimoto, and A. Nakayama, “Rapid remo-val of bromate ion from water streams with an electrolytic flowcell,” Journal of Water Supply: Research and Technology-AQUA,vol. 61, pp. 103–110, 2012.
[23] Standard Methods for the Examination of Water & Wastewater,American Public Health Association, Washington, DC, USA,22nd edition, 2012.
[24] A. N. Baga, G. R. A. Johnson, N. B. Nazhat, and R. A. Saadalla-Nazhat, “A simple spectrophotometric determination of hyd-rogen peroxide at low concentrations in aqueous solution,”Analytica Chimica Acta, vol. 204, pp. 349–353, 1988.
[25] J. P. Hoare, “4. Oxygen,” in Standard Potentials in AqueousSolution, A. J. Bard, R. Parsons, and J. Jordan, Eds., pp. 49–66,Mercel Dekker, New York, NY, USA, 1985.
[26] D. D. Dionysiou, M. T. Suidan, E. Bekou, I. Baudin, and J. M.Laıne, “Effect of ionic strength and hydrogen peroxide on thephotocatalytic degradation of 4-chlorobenzoic acid in water,”Applied Catalysis B, vol. 26, no. 3, pp. 153–171, 2000.
[27] N. Kishimoto, I. Somiya, and Y. Morita, “Dependence of hyd-roxyl radical production in UV/H2O2 photo-oxidation on UVenergy absorbed by aqueous solution,” Advances in Asian Envi-ronmental Engineering, vol. 2, no. 2, pp. 8–17, 2002.
[28] J. Staehelin, R. E. Buhler, and J. Hoigne, “Ozone decomposi-tion in water studied by pulse radiolysis. OH and HO4 as chainintermediates,” Journal of Physical Chemistry, vol. 88, no. 24,pp. 5999–6004, 1984.
[29] J. C. Kruithof, P. C. Kamp, and M. Belosevic, “UV/H2O2-treatment: the ultimate solution for pesticide control and dis-infection,” Water Science and Technology: Water Supply, vol. 2,no. 1, pp. 113–122, 2002.
[30] N. H. Phillip, E. Gurten, and V. Diyamandoglu, “Transfor-mation of bromine species during decomposition of bromateunder UV light from low pressure mercury vapor lamps,”Ozone: Science and Engineering, vol. 28, no. 4, pp. 217–228,2006.
[31] M. S. Elovitz, U. Von Gunten, and H. P. Kaiser, “Hydroxylradical/ozone ratios during ozonation processes. II. The effectof temperature, pH, alkalinity, and DOM properties,” Ozone:Science and Engineering, vol. 22, no. 2, pp. 123–150, 2000.
[32] W. R. Haag and J. Holgne, “Ozonation of bromide-containingwaters: kinetics of formation of hypobromous acid and bro-mate,” Environmental Science and Technology, vol. 17, no. 5,pp. 261–267, 1983.
[33] L. Xie and C. Shang, “A review on bromate occurrence andremoval strategies in water supply,” Water Science and Tech-nology: Water Supply, vol. 6, no. 6, pp. 131–136, 2006.

10 International Journal of Photoenergy
[34] A. J. Martijn and J. C. Kruithof, “UV and UV/H2O2 treatment:the silver bullet for by-product and genotoxicity formation inwater production,” Ozone: Science & Engineering, vol. 34, pp.92–100, 2012.
[35] R. A. Dobbs, R. H. Wise, and R. B. Dean, “The use of ultra-violet absorbance for monitoring the total organic carboncontent of water and wastewater,” Water Research, vol. 6, no.10, pp. 1173–1180, 1972.

Hindawi Publishing CorporationInternational Journal of PhotoenergyVolume 2012, Article ID 520123, 10 pagesdoi:10.1155/2012/520123
Research Article
Simultaneous Photocatalytic Reduction of Cr(VI) andOxidation of Benzoic Acid in Aqueous N-F-Codoped TiO2
Suspensions: Optimization and Modeling Using theResponse Surface Methodology
Maria Antonopoulou, Aris Giannakas, and Ioannis Konstantinou
Department of Environmental and Natural Resources Management, University of Western Greece, 30100 Agrinio, Greece
Correspondence should be addressed to Ioannis Konstantinou, [email protected]
Received 1 June 2012; Accepted 29 July 2012
Academic Editor: Manickavachagam Muruganandham
Copyright © 2012 Maria Antonopoulou et al. This is an open access article distributed under the Creative Commons AttributionLicense, which permits unrestricted use, distribution, and reproduction in any medium, provided the original work is properlycited.
The simultaneous photocatalytic reduction of Cr(VI) and oxidation of benzoic acid (BA) in aqueous suspensions using N-F-codoped TiO2 and simulated solar irradiation were investigated in the present study. Chemometric optimization tools such asresponse surface methodology (RSM) and experimental design were used to model and optimize selected operational parametersof the simultaneous photocatalytic reduction of Cr(VI) and oxidation of BA. RSM was developed by considering a centralcomposite design with three input variables, that are, N-F-codoped TiO2 mass, ratio of Cr/BA, and pH. The removal of Cr(VI) andBA in binary systems, containing both Cr(VI) and BA, showed a synergistic photocatalytic decontamination as BA significantlyfacilitated Cr(VI) reduction, whereas Cr(VI) accelerated also BA degradation. Due to the anionic-type adsorption onto TiO2 andits acid-catalyzed photocatalytic reduction, the removal of Cr(VI) decreased with increasing pH, while the degradation of BAfollowed also the same trend. Under the optimum conditions (N-F-TiO2) = 600 mg L−1, ratio of Cr(VI)/BA = 5, pH = 4, theremoval for both Cr and BA followed a pseudo first-order kinetic model. It was found that the selected variables have significanteffect both on Cr(VI) removal and BA degradation efficiency. The results revealed the feasibility and the effectiveness of usingN-F-codoped TiO2 as photocatalyst for simultaneous decontamination of Cr(VI) and organic pollutants such as BA due to theappropriate oxidation and reduction ability of the photogenerated h+
VB-e−CB pairs.
1. Introduction
The increasing level of global industrialization and urban-ization has led to the transport and introduction of variouscontaminants in aquatic environment. The water pollu-tion caused by organic pollutants and heavy metal ionsrepresents an important ecological and health hazard andhad gradually gained great scientific interest. Heavy metalsenter aquatic environment through the discharge of treatedor untreated industrial wastewater and municipal sewage,storm water runoff, acid mine drainage, and other diffusesources [1]. On the other hand, a wide range of organicmicropollutants are derived from a variety of agricultural,municipal, and industrial sources and pathways [2, 3].
Although, the co-existence of organic compounds and metalions in wastewater is common [4], in conventional methodsit is often indispensable to be treated separately, that meanscomplicated process with the requirement of higher cost andmore man power [5]. Hence, simultaneous decontaminationof heavy metals and organic contaminants constitutes avery interesting and important aspect. In last decades,water pollution had resulted in the development of the so-called advanced oxidation processes (AOPs) as alternativeto the conventional water and wastewater treatment meth-ods. These enhanced processes aim to degrade the nonbiodegradable contaminants of water into harmless species[6]. Among AOPs, heterogeneous photocatalysis employingsemiconductor solids has been applied with success for

2 International Journal of Photoenergy
the oxidation of a variety of organic compounds [7] aswell as for the removal/reduction of toxic metals fromaqueous solutions [8–10]. Photocatalysis is a well-knownand particularly promising method based on the activationof a semiconductor and utilizes the photogenerated positiveholes and various oxygen radical species for the oxidation oforganic compounds as well as the photogenerated electronsfor the reduction of heavy metal ions [11]. Moreover,photoreduction of a metal ion is promoted significantly ifit is accompanied by simultaneous oxidation of an organiccompound able to act as ligand or as “sacrificial electrondonor” [12], because of the enhanced charge separationof photo-induced hole/electron pairs by the simultaneousreduction/oxidation reactions [11].
The application of experimental design methodologiesin the development of photocatalytic processes can result inimproved remediation efficiency with the lesser number ofexperiments. Response surface methodology is a powerfuland widely used mathematical method suitable for modelingand optimizing chemical reactions and or industrial pro-cesses [13].
In the present study, the simultaneous photocatalyticreduction of Cr(VI) and oxidation of benzoic acid (BA) usingN-F-codoped TiO2 under simulated solar irradiation wasstudied. Cr(VI) and BA were selected as target compoundssince they may be present in a great variety of industrialwaste effluents and their simultaneous treatment will showboth economical and technological profits. Benzoic acid, thesimplest aromatic carboxylic acid, is a model compoundrepresentative of the aromatic content typically found invarious industrial wastewaters. It also constitutes the parentmolecule of various phenolic compounds which are usuallylow biodegradable and high ecotoxic and are commonlyfound in agro-industrial effluents [14]. BA is used to producea broad range of organic chemicals [15]. Furthermore, ithas a wide usage as preservative in the cosmetic, drug, andfood industry because of its antibacterial and antifungalproperties at a pH 4 or lower [16]. Among heavy metals,Cr(VI) is one of the most frequent and toxic contaminants inwastewaters arising from various industrial processes such aselectroplating, pigment production, leather tanning, textiledying, wood preservation, as well as finishing of metals andplastics [17, 18]. Due to its carcinogenic and mutagenicproperties as well as its high mobility, its concentrationin drinking water has been regulated in many countries[17]. It is considered to be highly toxic to most of theliving organisms when the Cr(VI) concentration level ishigher than 0.05 mg L−1 [19]. As a result, the removalof Cr(VI) or its reduction to less harmful and immobileCr(III) is of great importance. Several studies have reportedthe simultaneous decontamination of Cr(VI) and organiccontaminants such as carboxylic acids, phenols, phthalates,and dyes [11, 20–25]. However, in the above-mentionedresearches commercial forms of TiO2 (anatase, Degussa P25)were used. On the contrary, this study investigates the appli-cation of N-F-codoped TiO2, a photocatalyst with improvedphoto efficiency and visible light response compared toTiO2 catalysts [26], for the simultaneous decontaminationof organic pollutants and heavy metals. In addition, the
assessment of the beneficial role of N-F-doping for thesynergistic removal of Cr(VI) and organic pollutants inaqueous substrates has not been performed so far. The mainobjectives of this research were (a) to assess the simultaneousremoval of an organic micropollutant, benzoic acid, and atoxic heavy metal Cr(VI); (b) to investigate the effect of threeparameters (initial ratio Cr/Benzoic acid concentration, pH,catalyst concentration) on the total process efficiency; (c)to model and optimize the photocatalytic procedure bymeans of a central composite design and response surfacemethodology.
2. Experimental
2.1. Materials and Reagents. Benzoic acid was residue analy-sis grade, purchased from Sigma-Aldrich (USA), and Cr(VI)in the form of potassium dichromate was purchased fromFluka and used without further purification. N-F-TiO2
(Ti : N,F molar ratio 1 : 1, named as TNF) was prepared basedon a simple sol-gel impregnation method [26]. Titaniumn-butoxide [Ti(OC4H9)4] was used as inorganic precursorand ammonium fluoride (NH4F) as the source of N andF dopant atoms. X-ray diffraction analysis showed that thephotocatalyst crystal phase is anatase with a crystallite sizeof ≈1.8 A. A band-gap energy of 2.96 eV was determinedusing diffuse reflectance UV-Vis spectroscopy, while electronpair resonance revealed the presence of Nb
• and Ti+3
photoactive centers. The point-of-zero charge (PZC) wasdetermined at pH = 5.7 using the mass titration method[27]. All solvents used (acetonitrile, methanol and LC-grade water) were pesticide residue analysis grade fromMerck (Darmstadt, Germany). HVLP 0.45 μm filters weresupplied by Millipore (Bedford, USA). Ultrapure water wasobtained from a Millipore Waters Milli-Q water purificationsystem.
2.2. Irradiation Procedure. Photocatalytic experiments werecarried out in a Suntest XLS+ solar simulator (Atlas,Germany) equipped with a vapor xenon lamp (2.2 kW). Thelight source was jacked with special glass filters restricting thetransmission of wavelengths below 290 nm. The temperatureof the samples was maintained at 25◦C using a tap watercooling circuit preventing any heating of the suspension. Theirradiation intensity was measured by internal radiometersupplied by the manufacturer. Irradiation experiments wereperformed using a 250 mL Pyrex glass UV-reactor containing250 mL of aqueous solutions at different pH. The pHof solutions was adjusted by H2SO4 or NaOH aqueoussolutions. The solutions were mixed with the appropriateamount of catalyst and were magnetically stirred before andduring the illumination. The suspensions were kept in thedark for 30 minutes, prior to illumination in order to reachadsorption equilibrium onto semiconductor surface. As thereaction progressed, aliquots of 5 ml were withdrawn fromthe reactor at specific time intervals for further analysis. Inorder to remove the N-F-TiO2 particles the solution sampleswere filtered through a 0.45 μm filter. Performance of theprocess was evaluated by analyzing the responses of Cr(VI)

International Journal of Photoenergy 3
removal and BA degradation percentages after a fixed time of30 min according to the equation:
Y1(%) =[
(C0 − Ct)C0
]∗ 100, (1)
where C0 is the initial Cr(VI) or BA concentration and Ct
the concentration of Cr(VI) or BA after the photocatalytictreatment.
2.3. Kinetic Studies: Determination of Benzoic Acid andCr(VI). Benzoic acid concentrations were determined bya Dionex P680 HPLC equipped with a Dionex PDA-100Photodiode Array Detector using a Discovery C18, (250 mmlength × 4.6 mm ID: 5 μm particle size) analytical columnfrom Supelco (Bellefonte, PA, USA). The mobile phase wasa mixture of LC-grade water H2O (70%) at pH 3 (adjustedwith formic acid) and acetonitrile (30%) with a flow rateof 1 ml/min. Column temperature was set at 40◦C. Thedetection of BA was realized at 228 nm. The concentration ofCr(VI) was determined by the diphenylcarbazide colorimet-ric method [11] at a wavelength of 540 nm using a UV-Visspectrophotometer (Hitachi, U-2000).
2.4. Experimental Design: Data Analysis. A central compositedesign was employed for the optimization of photocatalyticprocess in the present study. In order to evaluate the influenceof operating parameters on the simultaneous photocatalyticefficiency of BA and Cr(VI), three main factors were chosen:catalyst concentration (mg L−1) (x1), Cr(VI)/BA ratio (x2),and pH (x3). A total number of 17 experiments were deter-mined by the expression: 2n + 2n + 3 = 23 (8 factor points)+2∗3 (6 axial points) +3 central points, replications) =17, as shown in Table 1. The three selected experimentalparameters were optimized using RSM considering them asindependent variables and % Cr(VI) removal and % BAdegradation as response variables. The data set obtainedfrom CCD was used for the optimization of the responsesand RSM was used to fit the experimental data. A secondorder model was used to locate the optimum point and canbe expressed as follows:
Y = β0 +k∑i=1
βixi +k∑i=1
βiix2i +
k∑1≤i≤ j
βi jxix j + ε, (2)
where Y is the response variable of degradation efficiency,β0 is the constant term, βi represents the coefficients of thelinear parameters, xi represents the variables, βii representsthe coefficients of the quadratic parameters, βi j representsthe coefficients of the interaction parameters and ε isthe random error [13]. Experimental data were analyzedusing Design Expert V. 7.1.5 (Stat-Ease Inc. 2008, Mn,USA). Data were further estimated and evaluated by theanalysis of variance (ANOVA). Correlation coefficients (R2,R2 adj.) were used to evaluate the correlation between theexperimental data and the predicted responses and therebythe goodness of the fit for the polynomial models. Thestatistical significance was also checked by the F value (Fishervariation ratio), probability P value and adequate precision
Table 1: Central composite design matrix and experimental resultsfor benzoic acid (BA) and Cr(VI) photocatalytic degradation.
Exper. no. CTiO2-x1
(mg L−1)Cr/BA
ratio-x2pH-x3
(%)removalCr(VI)
(%)degradation
BA
1 200 5 10 32.36 2.5
2 600 15 4 55.22 49.47
3 400 1.59 7 100 17.5
4 400 18.41 7 36.41 32.78
5 600 5 10 54.95 5.1
6 600 5 4 100 36.61
7 400 10 1.95 58.9 47.84
8 400 10 7 45.96 9.49
9 200 5 4 76.16 23.07
10 200 15 10 4.58 6.56
11 400 10 12.05 4.85 2.79
12 200 15 4 24.06 30.34
13 400 10 7 45.57 8.18
14 63.64 10 7 18.85 2.7
15 736.36 10 7 65.82 17.24
16 400 10 7 47.44 8.66
17 600 15 10 32.92 12.08
in the same program. The significance of each model termwas evaluated based on P value with 95% confidence level(P > 0.05). Finally, three-dimensional response surfaceplots were developed in order to visualize the individualand the interaction effects of the independent variables ondegradation efficiency.
3. Results and Discussion
3.1. Preliminary Experiments. Preliminary experiments werecarried out, before the development of the experimentaldesign, in order to evaluate the possible synergistic effectof the simultaneous photooxidation-photoreduction of theselected pollutants, Cr(VI) and BA. For this reason, experi-ments were conducted in single and binary systems at pH =2, catalyst concentration 500 mg L−1 and UV intensity750 W m−2. The initial concentrations used were 0.1 mMCr(VI) and 0.01 mM BA. Figures 1 and 2 show the reductionof Cr(VI) and oxidation of BA under different conditions,respectively. The adsorbed percentages of Cr(VI) and BAin the binary system were 12.5% and 6%, respectively,while prolonged dark experiments in the presence of N-F-TiO2 led to neither BA degradation nor metal reductionafter 240 min. Direct photolysis in the single systems ofCr(VI) and BA resulted in low removals for both pollutants.Similarly, low removal was observed for both pollutantsin the binary system under photolytic treatment, implyingno severe interaction between Cr(VI) and BA under directphotolysis. As shown in Figures 1 and 2, in single systemsthe photocatalytic reduction of Cr(VI) was achieved after150 min irradiation, whereas the photocatalytic oxidation ofBA was much slower and almost complete degradation is

4 International Journal of Photoenergy
0
0.2
0.4
0.6
0.8
1
0 20 40 60 80 100 120 140 160 180 200 220 240
Time (min)
Cr/benzoic/TNF1/UVCr/TNF1/UVCr/UV
Cr/benzoic/TNF1Cr/benzoic/UV
C/C
0
Figure 1: Photocatalytic reduction of Cr(VI) in single and binarysystems. ([Cr(VI)]0 = 0.1 mM, [BA]0 = 0.01 mM, pH = 2, N-F-TiO2
= 500 mg L−1).
0
0.2
0.4
0.6
0.8
1
0 20 40 60 80 100 120 140 160 180 200 220 240
Time (min)
Benzoic/TNF1/UVBenzoic/UV1Cr/benzoic/TNF1
Cr/benzoic/UVCr/benzoic/TNF1/UV
C/C
0
Figure 2: Photocatalytic degradation of benzoic acid in single andbinary systems. ([Cr(VI)]0 = 0.1 mM, [BA]0 = 0.01 mM, pH = 2,N-F-TiO2 = 500 mg L−1).
accomplished after 240 min of irradiation time. On the otherhand, the simultaneous photocatalytic treatment of Cr(VI)and BA in the binary system significantly enhanced thereduction/oxidation of substrates each other. In the binarysystem, the coupled oxidation of the BA consumes photo-generated holes and/or •OH radicals efficiently, blockingthe electron-hole recombination and thus, increasing thetotal efficiency. Moreover, the enhancement of the ratesconfirmed that Cr(VI) acted as an efficient scavenger of thephotogenerated electrons. The results obtained, revealed notonly the simultaneous decontamination of two pollutantsbut also the synergistic effect between the photocatalyticredox reactions .
3.2. RSM Modeling and Optimization for Cr(VI) Photo-catalytic Removal. The design matrix and experimental
results obtained for the Cr(VI) photocatalytic degradationare depicted in Table 1. The step-wise model fitting wasemployed in order to find the best model fitted. Thequadratic model was selected to describe the relationshipof operational parameters and photocatalytic removal basedon lack-of-fit analysis and model summary statistics. Thequadratic model obtained for the response of % Cr(VI)removal in terms of coded variables can be written as follows(4):
% Removal Cr (VI) = + 46.32 + 13.54x1 − 18.57x2
− 16.22 x3 + 1.63 x1x2 − 0.51 x1x3
+ 5.88 x2x3 − 1.41x21 + 7.73 x2
2
− 5.11x23 .
(3)
The model adequacy and significance were furtherchecked by ANOVA and the results are shown in Table 2. TheANOVA of the second order quadratic polynomial modelshowed that the model was highly significant, as the F valuefor the model was 1841.56 and the corresponding P valuewas <0.0001. This means that there was only a 0.01% chancefor such model F value due to noise. The non significantlack of fit relative to the pure error also confirmed goodpredictability of the model. The experimental values plottedagainst the predicted responses for the degradation efficiencyof Cr(VI) (Figure 3) showed good correlation R2 = 0.9996indicating that the model explained the experimental rangestudied very well. The high model regression coefficientimplied that 99.96% of the variations for % Cr(VI) removalwere explained by the model. As well, adjusted correlationcoefficient of 0.9990 was also very high to advocate for ahigh significance of the model. The adequacy of the modelwas also evaluated by the residuals. The normal probabilityplot of the residuals, shown in Figure 4, revealed that allthe points approximate a straight line proving no severeindication of non normality and a good fit of the model.This was also supported by the low value of the coefficientof variation (CV = 1.84%). The significance of each termin the predictive model was evaluated by P values using5% significance level. Independent variables of the quadraticmodel, N-F-TiO2 concentration (x1), Cr(VI)/BA ratio (x2),pH (x3), the second order effect of them, x2
1, x22, x2
3 as wellas the interaction between Cr(VI)/BA ratio (x2) and pH (x3)were highly significant parameters (P < 0.001). Moreover,the interaction between N-F-TiO2 concentration (x1) andCr(VI)/BA ratio (x2) was significant at P < 0.05. On thecontrary, Cr(VI) removal was not significantly affected bythe interaction between N-F-TiO2 concentration (x1) andpH (x3)(P = 0.1416). The effects of the three independentvariables and their interaction on the removal of Cr(VI)were graphically represented by three-dimensional responsesurface plots by means of response surface methodology. Theinteraction effect of N-F-TiO2 concentration and Cr(VI)/BAratio is shown in Figure 5(a). As can be seen there was anincrease in the removal percentage of Cr(VI) with an increaseof N-F-TiO2 concentration and a decrease of Cr(VI)/BA

International Journal of Photoenergy 5
ratio. The removal percentage increased proportionally bythe increase of N-F-TiO2 dosage due to the increase ofadsorption sites on the surface of catalyst as well as thegeneration of more electrons in the conduction band. Anincrease in the Cr (VI)/BA ratio by a consequently increaseof initial Cr (VI) concentration led to a decreased removal.As initial Cr(VI) concentrations increased, more metalions were adsorbed on the surface of the photocatalyst.Therefore, the photogenerated e−required for the removal ofCr(VI) also increased and hence, the available electrons wereinadequate for pollutant removal at higher concentrations.Moreover, with the increase in the Cr(VI) concentration,less photons reach the photocatalyst surface (light screeningeffect), resulting in slower production of the photogeneratedpair hole/electron. Consequently, the photocatalytic activitywas decreased, since fewer available e− were available toreduce more metallic ions. Moreover, an increase in pHled to a decrease in the rate of Cr (VI) removal asillustrated in Figure 5(b). This can be attributed to thesurface charge properties of the photocatalyst. Since, thepoint of zero charge of the NF-TiO2 catalysts has beendetermined to be 5.7, the N-F-TiO2 surface is negativelycharged at pH > 5.7, whereas is positively charged in moreacidic conditions (pH < 5.7). At pH values around 2.5 thepredominant species of chromium are the negative chargedHCrO4
− and Cr2O72− ions and at pH values around 6.5
Cr(VI) exists mainly as HCrO4− and CrO4
2− [24]. As thepH of the solutions increased, the negatively charged sitesof the catalyst increased, thus, the absorption of Cr(VI)anions was prevented due to electrostatic repulsion andconsequently their reduction on N-F-TiO2 surface. Theadsorbed percentage of Cr(VI) at pH = 10, Cr(VI)/BA ratio =5, and [TNF] = 600 mg L−1 was found to be 5%. Conversely,as pH decreased, the electrostatic attraction between thepositively charged surface and anionic Cr(VI) was enhanced,leading to increased removal. The adsorption percentage (%)of Cr(VI) at pH = 4 and using the same Cr(VI)/BA ratio andcatalyst concentration increased to about 21%. An increasein the Cr(VI) photocatalytic reduction with decreasing pHvalues has been also reported elsewhere [28, 29].
3.3. RSM Modeling and Optimization for Benzoic AcidPhotocatalytic Degradation. The experimental design matrixand experimental results obtained for the BA photocatalyticdegradation are given in Table 1. Similarly to % Cr(VI)removal, a quadratic model was suggested as the most appro-priate to approximate the % photocatalytic degradation ofBA. The model can be written in terms of coded variables asfollows:
%Degr. Benzoic acid= + 8.78 + 4.78x1 + 4.16x2 − 13.84x3
+ 1.06x1x2 − 3.07x1x3 − 1.14x2x3
+ 0.40 x21 + 5.76 x2
2 + 5.82x23
(4)
ANOVA results of the suggested quadratic model(Table 3) and the comparison of actual versus predictedvalues (Figure 6) indicated that the model could adequately
Actual
Pre
dict
ed
Predicted versus actual
3.96
28.13
52.29
76.46
100.63
4.58 28.44 52.29 76.14 100
Figure 3: Plot of predicted versus actual values for % Cr(VI)removal.
Internally studentized residuals
Nor
mal
(%
) pr
obab
ility
Normal plot of residuals
− 1.3 − 0.58 0.14 0.85 1.57
1
510
2030
50
7080
9095
99
Figure 4: The normal probability (%) plot of the experimentalresults for % Cr(VI) removal.
be used to describe the % benzoic acid degradation underthe experimental range studied. The model F value of 426.95and P value less than 0.0001 implied the high significance ofthe model. There was only a 0.01% chance that the “ModelF value” could occur due to noise. Moreover, lack of fitwas shown to be not significant relative to the pure error,indicating good response to the model. The high modelregression coefficient (R2) of 0.9982 implied that 99.82% ofthe variability can be revealed by the model and only 0.18%
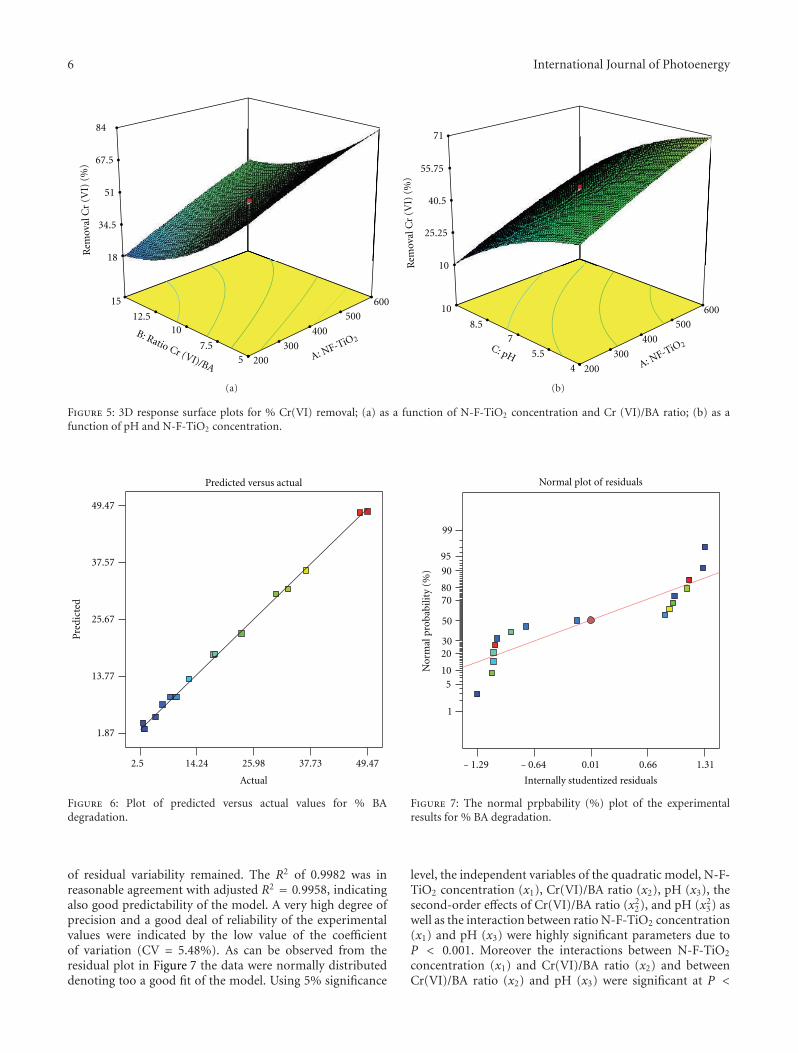
6 International Journal of Photoenergy
200
300
400
500
600
57.5
1012.5
15
18
34.5
51
67.5
84
Rem
oval
Cr
(VI)
(%
)
A: NF-TiO2B: Ratio Cr (VI)/BA
(a)
4
5.5
7
8.5
10
10
25.25
40.5
55.75
71
Rem
oval
Cr
(VI)
(%
)
A: NF-TiO2C: pH
200
300
400
500
600
(b)
Figure 5: 3D response surface plots for % Cr(VI) removal; (a) as a function of N-F-TiO2 concentration and Cr (VI)/BA ratio; (b) as afunction of pH and N-F-TiO2 concentration.
Actual
Pre
dict
ed
Predicted versus actual
1.87
13.77
25.67
37.57
49.47
2.5 14.24 25.98 37.73 49.47
Figure 6: Plot of predicted versus actual values for % BAdegradation.
of residual variability remained. The R2 of 0.9982 was inreasonable agreement with adjusted R2 = 0.9958, indicatingalso good predictability of the model. A very high degree ofprecision and a good deal of reliability of the experimentalvalues were indicated by the low value of the coefficientof variation (CV = 5.48%). As can be observed from theresidual plot in Figure 7 the data were normally distributeddenoting too a good fit of the model. Using 5% significance
Internally studentized residuals
Nor
mal
pro
babi
lity
(%)
Normal plot of residuals
− 1.29 − 0.64 0.01 0.66 1.31
1
510
2030
50
7080
90
95
99
Figure 7: The normal prpbability (%) plot of the experimentalresults for % BA degradation.
level, the independent variables of the quadratic model, N-F-TiO2 concentration (x1), Cr(VI)/BA ratio (x2), pH (x3), thesecond-order effects of Cr(VI)/BA ratio (x2
2), and pH (x23) as
well as the interaction between ratio N-F-TiO2 concentration(x1) and pH (x3) were highly significant parameters due toP < 0.001. Moreover the interactions between N-F-TiO2
concentration (x1) and Cr(VI)/BA ratio (x2) and betweenCr(VI)/BA ratio (x2) and pH (x3) were significant at P <

International Journal of Photoenergy 7
B: ratio Cr(VI)/BA 5
7.5
10
12.5
15
3
8.5
14
19.5
25
Deg
rada
tion
BA
(%
)
A: NF-T
iO2
200
300
400
500
600
(a)
200300
400
500
600
4
5.5
7
8.5
10
9.25
0
18.5
27.75
37
Deg
rada
tion
BA
(%
)
A: NF-TiO2C: pH
(b)
Figure 8: 3D response surface plots for the % BA degradation; (a) as a function of N-F-TiO2 concentration and Cr(VI)/BA ratio; (b) as afunction of pH and N-F-TiO2 concentration.
Table 2: Analysis of variance (ANOVA) for % removal of Cr(VI).
Source Sum ofsquares
df Meansquare
F value P valueProb > F
Model 12510.88 9 1390.10 1841.56 <0.0001
x1-TiO2 mg L−1 2504.00 1 2504.00 3317.23 <0.0001
x2-Cr/BA ratio 4710.52 1 4710.52 6240.35 <0.0001
x3-pH 3593.50 1 3593.50 4760.57 <0.0001
x1 x2 21.35 1 21.35 28.29 0.0011
x1 x3 2.07 1 2.07 2.74 0.1416
x2 x3 276.95 1 267.95 366.89 <0.0001
x21 22.49 1 22.49 29.79 0.0009
x22 674.33 1 674.33 893.34 <0.0001
x23 294.43 1 294.43 390.05 <0.0001
Residual 5.28 7 0.75
Lack of fit 3.34 5 0.67 0.69 0.6829
Pure error 1.95 2 0.97
0.05. On the contrary, the second-order effect of N-F-TiO2 concentration (x2
1) was the only insignificant term(P value of 0.2284). Three-dimensional response surfacescomputed for % BA degradation are depicted in Figure 8.As shown in Figures 8(a) and 8(b) the degradation percent-age increased proportionally to N-F-TiO2 concentration asexpected, confirming the positive influence of the increasednumber of N-F-TiO2 active sites/species (mainly holes and•OH) on the process kinetics. Several studies have indicatedthat photocatalytic degradation rate initially increased withcatalyst loading and above a certain level of concentration,the reaction rate remains constant or even decreases andbecomes independent of the catalyst concentration becauseof light scattering and screening effects as well as due to the
Table 3: Analysis of variance (ANOVA) for % degradation ofbenzoic acid.
Source Sum ofsquares
df Meansquare
F value P valueProb > F
Model 3908.5 9 434.28 426.95 <0.0001
x1-TiO2 mg L−1 311.69 1 311.69 306.43 <0.0001
x2-Cr/BA ratio 236.80 1 236.80 232.80 <0.0001
x3-pH 2616.02 1 2616.02 2571.86 <0.0001
x1 x2 9.05 1 9.05 8.90 0.0204
x1 x3 75.34 1 75.34 74.07 <0.0001
x2 x3 10.33 1 10.33 10.15 0.0153
x21 1.77 1 1.77 1.74 0.2284
x22 374.00 1 374.00 367.69 <0.0001
x23 382.08 1 382.08 375.63 <0.0001
Residual 7.12 7 1.02
Lack of fit 6.24 5 1.25 2.84 0.2805
Pure error 0.88 2 0.44
tendency towards agglomeration at high solids concentration[30, 31]. However, this study was based on the use ofmoderate catalyst concentrations, where this limit was stillfar away, and thereby the degradation rate increased withNF-TiO2 concentration within the selected range. From theresponse surface in Figure 8(b), it was clear that the BAdegradation percentage decreased as the pH values increasedfrom acidic to alkaline region. This is related to the ionizationstate of the surface of catalyst according to the determinedPZC (5.7) as well as to that of the parent compound. The pKaof benzoic acid is 4.2 [32] thus, at a pH greater than this valuethe molecule bears a negative charge. As mentioned above,N-F-TiO2 surface will be positively charged at pH values

8 International Journal of Photoenergy
0
0.2
0.4
0.6
0.8
1
0 20 40 60 80 100 120 140 160 180
Irradiation time (min)
Cr (VI)
BA
C/C
0
Figure 9: Kinetics of reduction of Cr(VI) and degradation of BAversus irradiation time under optimized conditions ([N-F TiO2]0 =600 mg L−1, Cr(VI)/BA ratio = 5, pH = 4).
Table 4: Photocatalytic kinetic parameters (rate constants, half-lives, correlation coefficients) of Cr(VI) and BA under optimizedconditions ([N-F-TiO2]0 = 600 mg L−1, Cr/BA ratio = 5, pH = 4).
k (min−1) t1/2 (min) R2
Cr(VI) 0.0960 7.219 0.9929
BA 0.0109 63.578 0.9623
lower than 5.7 and negatively charged at higher ones. Inconsequence, as the pH increased from slightly acidic (5.7–6)to alkaline values, Columbic repulsion between the negative-charged surface of the catalysts and anionic form of BAwas observed which led to decreased adsorption and conse-quently lower degradation. The adsorbed percentage of BA atpH = 10, Cr(VI)/BA ratio = 5, and [TNF] = 600 mg L−1 wasfound to be only 0.5%. An increase in the degradation rate ofBA was also observed with an increase in the Cr(VI)/BA ratio(Figure 8(a)). As the Cr(VI) concentration increased, therecombination of the photo-induced hole/electron pairs wasstrongly inhibited, as the electrons were scavenged by Cr(VI),enhancing the BA degradation. The numerical optimizationof the software using desirability approach was employed tofind the specific points that maximize the % removal for bothpollutants. Based on the models, the optimum conditionsfor simultaneous removal of Cr(VI) and BA were found asfollows: N-F-TiO2 concentration = 600 mg L−1, Cr(VI)/BAratio = 5, and pH = 4.
3.4. Model Validation and Confirmation—Evolution of Pho-tocatalytic Reduction of Cr(VI) and Oxidation of BenzoicAcid under Optimized Conditions. To confirm the adequacyof the models for predicting the maximum simultaneous% removal Cr and % degradation of BA, verificationexperiments were conducted using the optimum conditions.The removal and degradation rates from the validationexperiment are depicted in Figure 9. Under optimized condi-tions pseudo-first order kinetics were recorded for both thephotocatalytic reduction of Cr(VI) and degradation of BA.
Table 4 lists the values of apparent rate constants, kapp, thecorrelation coefficients and the corresponding half-lives ofCr(VI) and BA. Half of Cr(VI) concentration was consumedwithin 7.22 min of irradiation under optimal conditions,while BA exhibited a much slower rate than the removalof Cr(VI). Complete Cr (VI) removal was achieved after30 min of irradiation time. At the same time, the degradationof BA reached about 40%, and prolonged irradiation timewas needed before complete degradation was achieved. Asreported in the literature, the photocatalytic transformationproducts of BA using TiO2 included salicylic acid, p-hydroxybenzoic acid, and 2,3- and/or 2,5-dihydroxybenzoicacid and phenol. The photocatalytic degradation pathwayproceeds via •OH attack on the aromatic moiety on severalpositions to produce hydroxy and dihydroxy derivatives, viadecarboxylation (photo-Kolbe) reaction resulting from thedirect attack of the carboxylic group by h+
VB and finallyring opening to produce aliphatic acids [15, 32, 33]. Theformation of such by-products reacts also with h+
VB /•OHresulting in a more prolonged time for the degradation ofparent benzoic acid.
According to previous findings [26] N-F-codoping ofTiO2 enhances the oxidative power of the h+
VB but lessens thereduction ability of e−CB. This unveils the use of such photo-catalytic materials to control the photocatalytic reactions ofthe redox pair species, e−CB and h+
VB. Regarding the reductionprocess, the electrons of the N-F-TiO2, at states below theCB of TiO2, have weaker reduction ability, consequentlythey can reduce preferably strong oxidation agents suchas Cr(VI) enhancing the target reduction reaction withoutthe competence of other ineffective reactions for reduction,such as O2 reduction. As far as the oxidation pathway, theenhancement in the oxidation power of the h+
VB makes theoxidation of organic molecules and especially organic acidsand water (for the •OH production) more favourable andconsequently enables the reduction reaction to occur moreefficiently.
4. Conclusions
The simultaneous photocatalytic reduction of Cr(VI) andoxidation of benzoic acid in the presence of N-F-codopedTiO2 was investigated focusing on the influence of parame-ters such as catalyst concentration, Cr(VI)/BA ratio, and pHon the photocatalytic efficiency that was optimized and mod-eled by response surface methodology (RSM). A considerableenhancement of the photocatalytic efficiency was observedfor the binary system than in the single component systems,indicating a promoting synergistic effect. Also, it was notedthat the three parameters tested had significant effect onthe total efficiency. Under optimized conditions the removalfor both Cr(VI) and BA followed pseudo-first order kineticmodel. The results provide an efficient treatment method toremove organic and inorganic pollutants simultaneously incomplex systems which presents special significance to waterpollution control and remediation. Moreover, this studyproves that RSM constitutes a powerful tool for optimizingthe operational conditions of the simultaneous reduction
International Journal of Photoenergy 9
of Cr (VI) and oxidation of benzoic acid by photocatalyticprocesses.
Acknowledgments
This research has been cofinanced by the European Union(European Social Fund, ESF) and Greek national fundsthrough the Operational Program “Education and LifelongLearning” of the National Strategic Reference Framework(NSRF)—Research Funding Program: Heracleitus II. Invest-ing in knowledge society through the European SocialFund.
References
[1] S. C. Hsu, H. L. Hsieh, C. P. Chen et al., “Tungsten and otherheavy metal contamination in aquatic environments receivingwastewater from semiconductor manufacturing,” Journal ofHazardous Materials, vol. 189, no. 1-2, pp. 193–202, 2011.
[2] J. J. Pignatello, B. G. Katz, and H. Li, “Sources, interactions,and ecological impacts of organic contaminants in water, soil,and sediment: an introduction to the special series,” Journal ofEnvironmental Quality, vol. 39, no. 4, pp. 1133–1138, 2010.
[3] M. Stuart, D. Lapworth, E. Crane, and A. Hart, “Review of riskfrom potential emerging contaminants in UK groundwater,”Science of the Total Environment, vol. 416, pp. 1–21, 2012.
[4] R. Qiu, D. Zhang, Z. Diao et al., “Visible light induced pho-tocatalytic reduction of Cr(VI) over polymer-sensitized TiO2
and its synergism with phenol oxidation,” Water Research, vol.46, no. 7, pp. 2299–2306, 2012.
[5] X. Zhao, Q. Li, X. Zhang, H. Su, K. Lan, and A. Chen,“Simultaneous removal of metal ions and methyl orange bycombined selective adsorption and photocatalysis,” Environ-mental Progress and Sustainable Energy, vol. 30, no. 4, pp. 567–575, 2011.
[6] A. R. Khataee and M. B. Kasiri, “Artificial neural networksmodeling of contaminated water treatment processes byhomogeneous and heterogeneous nanocatalysis,” Journal ofMolecular Catalysis A, vol. 331, no. 1-2, pp. 86–100, 2010.
[7] I. K. Konstantinou and T. A. Albanis, “Photocatalytic transfor-mation of pesticides in aqueous titanium dioxide suspensionsusing artificial and solar light: intermediates and degradationpathways,” Applied Catalysis B, vol. 42, no. 4, pp. 319–335,2003.
[8] T. Mishra, J. Hait, N. Aman, R. K. Jana, and S. Chakravarty,“Effect of UV and visible light on photocatalytic reduction oflead and cadmium over titania based binary oxide materials,”Journal of Colloid and Interface Science, vol. 316, no. 1, pp. 80–84, 2007.
[9] M. I. Litter, “Treatment of chromium, mercury, lead, ura-nium, and arsenic in water by heterogeneous photocatalysis,”Advances in Chemical Engineering, vol. 36, pp. 37–67, 2009.
[10] N. Aman, T. Mishra, J. Hait, and R. K. Jana, “Simultaneousphotoreductive removal of copper (II) and selenium (IV)under visible light over spherical binary oxide photocatalyst,”Journal of Hazardous Materials, vol. 186, no. 1, pp. 360–366,2011.
[11] N. Wang, Y. Xu, L. Zhu, X. Shen, and H. Tang, “Reconsidera-tion to the deactivation of TiO2 catalyst during simultaneousphotocatalytic reduction of Cr(VI) and oxidation of salicylicacid,” Journal of Photochemistry and Photobiology A, vol. 201,no. 2-3, pp. 121–127, 2009.
[12] P. Banerjee, S. Chakrabarti, S. Maitra, and B. K. Dutta, “Zincoxide nano-particles—sonochemical synthesis, characteriza-tion and application for photo-remediation of heavy metal,”Ultrasonics Sonochemistry, vol. 19, no. 1, pp. 85–93, 2012.
[13] M. Antonopoulou, V. Papadopoulos, and I. Konstantinou,“Photocatalytic oxidation of treated municipal wastewaters forthe removal of phenolic compounds: optimization and model-ing using response surface methodology (RSM) and artificialneural networks (ANNs),” Journal of Chemical Technology &Biotechnology. In press.
[14] T. Velegraki and D. Mantzavinos, “Conversion of benzoic acidduring TiO2-mediated photocatalytic degradation in water,”Chemical Engineering Journal, vol. 140, no. 1–3, pp. 15–21,2008.
[15] A. A. Ajmera, S. B. Sawant, V. G. Pangarkar, and A. A.C. M. Beenackers, “Solar-assisted photocatalytic degradationof benzoic acid using titanium dioxide as a photocatalyst,”Chemical Engineering and Technology, vol. 25, no. 2, pp. 173–180, 2002.
[16] E. I. Korotkova, O. A. Avramchik, T. M. Angelov, andY. A. Karbainov, “Investigation of antioxidant activity andlipophilicity parameters of some preservatives,” ElectrochimicaActa, vol. 51, no. 2, pp. 324–332, 2005.
[17] N. Wang, L. Zhu, K. Deng, Y. She, Y. Yu, and H. Tang,“Visible light photocatalytic reduction of Cr(VI) on TiO2 insitu modified with small molecular weight organic acids,”Applied Catalysis B, vol. 95, no. 3-4, pp. 400–407, 2010.
[18] V. Prigione, M. Zerlottin, D. Refosco, V. Tigini, A. Anastasi,and G. C. Varese, “Chromium removal from a real tanningeffluent by autochthonous and allochthonous fungi,” Biore-source Technology, vol. 100, no. 11, pp. 2770–2776, 2009.
[19] A. Pandikumar and R. Ramaraj, “Titanium dioxide-goldnanocomposite materials embedded in silicate sol-gel filmcatalyst for simultaneous photodegradation of hexavalentchromium and methylene blue,” Journal of Hazardous Mate-rials, vol. 203-204, pp. 244–250, 2012.
[20] B. Sun, E. P. Reddy, and P. G. Smirniotis, “Visible lightCr(VI) reduction and organic chemical oxidation by TiO2
photocatalysis,” Environmental Science and Technology, vol. 39,no. 16, pp. 6251–6259, 2005.
[21] X. R. Xu, H. B. Li, and J. D. Gu, “Photocatalytic reductionof hexavalent chromium and degradation of di-N-Butylphthalate in aqueous TiO2 suspensions under ultraviolet lightirradiation,” Environmental Technology, vol. 28, no. 9, pp.1055–1061, 2007.
[22] G. Colon, M. C. Hidalgo, and J. A. Navıo, “Photocatalyticdeactivation of commercial TiO2 samples during simultane-ous photoreduction of Cr(VI) and photooxidation of salicylicacid,” Journal of Photochemistry and Photobiology A, vol. 138,no. 1, pp. 79–85, 2001.
[23] S. G. Schrank, H. J. Jose, and R. F. P. M. Moreira, “Simul-taneous photocatalytic Cr(VI) reduction and dye oxidationin a TiO2 slurry reactor,” Journal of Photochemistry andPhotobiology A, vol. 147, no. 1, pp. 71–76, 2002.
[24] T. Papadam, N. P. Xekoukoulotakis, I. Poulios, and D.Mantzavinos, “Photocatalytic transformation of acid orange20 and Cr(VI) in aqueous TiO2 suspensions,” Journal ofPhotochemistry and Photobiology A, vol. 186, no. 2-3, pp. 308–315, 2007.
[25] H. Kyung, J. Lee, and W. Choi, “Simultaneous and synergisticconversion of dyes and heavy metal ions in aqueous TiO2
suspensions under visible-light illumination,” EnvironmentalScience and Technology, vol. 39, no. 7, pp. 2376–2382, 2005.
10 International Journal of Photoenergy
[26] Q. Wang, C. Chen, W. Ma, H. Zhu, and J. Zhao, “Pivotalrole of fluorine in tuning band structure and visible-lightphotocatalytic activity of nitrogen-doped TiO2,” Chemistry—A European Journal, vol. 15, no. 19, pp. 4765–4769, 2009.
[27] K. Bourikas, J. Vakros, C. Kordulis, and A. Lycourghiotis,“Potentiometric mass titrations: experimental and theoreticalestablishment of a new technique for determining the point ofzero charge (PZC) of metal (hydr)oxides,” Journal of PhysicalChemistry B, vol. 107, no. 35, pp. 9441–9451, 2003.
[28] L. B. Khalil, W. E. Mourad, and M. W. Rophael, “Photocat-alytic reduction of environmental pollutant Cr(VI) over somesemiconductors under UV/visible light illumination,” AppliedCatalysis B, vol. 17, no. 3, pp. 267–273, 1998.
[29] Y. Ku and I. L. Jung, “Photocatalytic reduction of Cr(VI) inaqueous solutions by UV irradiation with the presence oftitanium dioxide,” Water Research, vol. 35, no. 1, pp. 135–142,2001.
[30] I. K. Konstantinou and T. A. Albanis, “TiO2-assisted photocat-alytic degradation of azo dyes in aqueous solution: kinetic andmechanistic investigations: a review,” Applied Catalysis B, vol.49, no. 1, pp. 1–14, 2004.
[31] V. A. Sakkas, P. Calza, A. D. Vlachou, C. Medana, C.Minero, and T. Albanis, “Photocatalytic transformation offlufenacet over TiO2 aqueous suspensions: Identification ofintermediates and the mechanism involved,” Applied CatalysisB, vol. 110, pp. 238–250, 2011.
[32] V. G. Gandhi, M. K. Mishra, M. S. Rao, A. Kumar, P. A.Joshi, and D. O. Shah, “Comparative study on nano-crystallinetitanium dioxide catalyzed photocatalytic degradation ofaromatic carboxylic acids in aqueous medium,” Journal ofIndustrial and Engineering Chemistry, vol. 17, no. 2, pp. 331–339, 2011.
[33] A. Assabane, Y. Ait Ichou, H. Tahiri, C. Guillard, and J.M. Herrmann, “Photocatalytic degradation of polycarboxylicbenzoic acids in UV-irradiated aqueous suspensions of titania.Identification of intermediates and reaction pathway of thephotomineralization of trimellitic acid (1,2,4-benzene tricar-boxylic acid),” Applied Catalysis B, vol. 24, no. 2, pp. 71–87,2000.

Hindawi Publishing CorporationInternational Journal of PhotoenergyVolume 2012, Article ID 270320, 9 pagesdoi:10.1155/2012/270320
Research Article
Energy Effectiveness of Direct UV and UV/H2O2 Treatment ofEstrogenic Chemicals in Biologically Treated Sewage
Kamilla M. S. Hansen and Henrik R. Andersen
Department of Environmental Engineering, Technical University of Denmark, Building 133, Miljoevej, 2800 Lyngby, Denmark
Correspondence should be addressed to Kamilla M. S. Hansen, [email protected]
Received 1 June 2012; Accepted 23 July 2012
Academic Editor: Mika Sillanpaa
Copyright © 2012 K. M. S. Hansen and H. R. Andersen. This is an open access article distributed under the Creative CommonsAttribution License, which permits unrestricted use, distribution, and reproduction in any medium, provided the original work isproperly cited.
Continuous exposure of aquatic life to estrogenic chemicals via wastewater treatment plant effluents has in recent years receivedconsiderable attention due to the high sensitivity of oviparous animals to disturbances of estrogen-controlled physiology. Theremoval efficiency by direct UV and the UV/H2O2 treatment was investigated in biologically treated sewage for most of theestrogenic compounds reported in wastewater. The investigated compounds included parabens, industrial phenols, sunscreenchemicals, and steroid estrogens. Treatment experiments were performed in a flow through setup. The effect of differentconcentrations of H2O2 and different UV doses was investigated for all compounds in an effluent from a biological wastewatertreatment plant. Removal effectiveness increased with H2O2 concentration until 60 mg/L. The treatment effectiveness was reportedas the electrical energy consumed per unit volume of water treated required for 90% removal of the investigated compound. It wasfound that the removal of all the compounds was dependent on the UV dose for both treatment methods. The required energyfor 90% removal of the compounds was between 28 kWh/m3 (butylparaben) and 1.2 kWh/m3 (estrone) for the UV treatment. Incomparison, the UV/H2O2 treatment required between 8.7 kWh/m3 for bisphenol A and benzophenone-7 and 1.8 kWh/m3 forethinylestradiol.
1. Introduction
The present of estrogenic compounds in the environmentand particularly the continuous exposure via wastewatertreatment plant (WWTP) effluents have in recent yearsreceived considerable attention due to their damagingeffects on the aquatic life [1–3]. The estrogenic compoundsinfluence on the endocrine system, resulting in behaviouralchanges, changes in mating behaviour, and feminizationof fish, and have even been linked to reduced spermproductivity in humans [4].
The synthetic steroid estrogen ethinylestradiol (EE2) isoften found in low ng/L concentrations in WWTP effluents,and available data suggest that it is an important contributorto the estrogenic activity of WWTP effluents [2, 5–7]. Thenatural steroid estrogens, 17β-estradiol (E2), and estrone(E1) are also considered important contributors to theestrogenic activity of WWTP effluents. They are less potentthan EE2 but are typically found in slightly higher concentra-tions. Other known contributors to the estrogenic effect are
industrial phenols such as nonylphenol (NP), octylphenol(OP), bisphenol A (BPA), and compounds used in personalcare products such as parabens and benzophenones. Theseare typically found in the μg/L concentration range [7–11]. However, these compounds have considerably lowerestrogenic activity compared to steroidal estrogens [11, 12].
Degradation of some of these estrogenic compounds byUV photolysis and the advanced oxidation process UV/H2O2
in laboratory setups has been reported in the literature [13–17].
Degradation by photolysis and radical oxidation initiatedby the UV/H2O2 treatment are thus known processes forsome estrogens in wastewater. However, the present literaturedoes not give the data needed for estimating the treatmentintensity required for treatment of real wastewater since theydo not consider realistic flow through conditions, radicalscavengers, and the shadow effect seen in real wastewater.Thus, the size of the treatment system and the expectedrunning cost of the treatment if the techniques were appliedas a real treatment cannot be found in the literature.

2 International Journal of Photoenergy
Therefore, this work has used an experimental setup withrealistic dimensions from a UV treatment plant intendedfor disinfection of a wastewater treatment plant effluent bymedium pressure UV lamps. With this setup, the removalefficiency by direct UV and the advanced oxidation processUV/H2O2 of estrogenic compounds were investigated in tapwater and biologically treated sewage. The results of theexperiments are reported in units of energy applied for thetreatment as recommended by IUPAC [18].
2. Method
2.1. Regents and Materials. All the investigated estrogeniccompounds (see Table 1) were purchased from Sigma-Aldrich. Methanol, acetone, and heptane together with 35%hydrogen peroxide, potassium titanium oxide oxalate dihy-drate, sodium phosphate monobasic dehydrate, and 85%orthophosphoric acid were obtained from Sigma-Aldrich aswell. The chemicals for derivatisation of the steroid estrogens(dithioerythritol, trimethylsilyl imidazole, and N-methyl-N-(trimethylsilyl)-trifluoroacetamide) were purchased fromSigma-Aldrich. All chemicals were of analytical grade exceptpotassium titanium oxide oxalate dihydrate which was oftechnical grade.
The water used for experiments was wastewater efflu-ent from Usserød Wastewater treatment plant (Hørsholm,Denmark). The water was stored in the dark at 10◦C untilexperiments were performed. The effluent was used forexperiment within 3 days after the collection, however onceafter 12 days as an exception. The water was poured into three25 L plastic containers and spiked with the mixed solutionsso the concentrations of xenoestrogens and steroid estrogenswere 1 μg/L and 400 ng/L, respectively. In the experimentwith UV/H2O2, the hydrogen peroxide (35% solution) wasadded, so the desired concentration was achieved.
Tap water used in experiments to investigate the matrixeffect in comparison with wastewater was from the DTU-Lyngby Campus. This water is not chlorinated, and it has acontent of mayor ions similar to the wastewater, but a lowconcentration of organic matter since it is taken from a deepwell (more than 50 years old groundwater).
2.2. Bench-Scale Reactor. The treatments were carried out ina bench-scale, flow-through photoreactor (see Figure 1). Thelamp (700 W, Bau47, Scan Research A/S, Herning, Denmark)is located coaxial in the centre of the reactor. The UV lampwas placed inside a quarts sleeve which is pumped with aninert gas to avoid ozone production. The distance from thelamp to the inner side of the reactor is 5.7 cm. A spectrum ofthe output of the lamp is shown in supporting informationof a previous paper [19].
Figure 1 shows a schematically drawing of the exper-imental setup. The water was pumped from the plasticcontainers through a flowmeter and into the reactor atthe bottom. A valve was used to adjust the flow rate. Thesamples for analysis were taken from the outlet after oneretention time and from the containers (inlet concentration).The blind sample was taken before spiking and addition
Container
Pump
Flow meter
UV lamp
InletReactor
Outlet
Figure 1: Diagram of the experimental setup.
of hydrogen peroxide. The samples were acidified withphosphate buffer (pH = 3) as preservative except samples formeasurement of hydrogen peroxide concentration.
2.3. Sample Preparation for Chemical Analysis and YES Assay.For each experiment, three samples of 500 mL each wereanalysed. Surrogate standard was added to every samplebefore solid-phase extraction (SPE) to compensate forpossible losses during sample preparation and analysis. Theextractions were performed at commercial packed cartridges(500 mg C18 adsorbent/6 mL cartridge, Supelco), whichwere conditioned with 2 × 1.5 mL heptane, 1 × 1.5 mLacetone, 2 × 1.5 mL methanol, and 2 × 1.5 mL acidifiedwater (phosphate buffer, pH = 3) before the extractionbegins. The water was transmitted to the SPE column bymeans of vacuum with a flow rate at maximum 5 mL perminute. Afterwards, the column is dried for approximately1 hour until complete dryness. The samples were elutedwith acetone until 5 mL eluent was collected in a test tube.Then the eluent was dried under a stream of nitrogen ina thermostat-controlled heating block to almost completelydryness.
The samples for YES assay, to which no surrogate stan-dard was added, were dissolved in ethanol, while the samplesfor chemical analysis were further purified as described inthe following. One gram of 1% deactivated silica gel (silicagel 60, 0.063–0.200 mm (70–230 mesh ASTM) Merck) wassuspended in 3 mL heptane-acetone mixture (65 : 35) andpoured into 3 mL glass cartridge. The almost dried sampleswere resolved in approximately 0.3 mL heptane acetonemixture (65 : 35) and transferred to the top of the silica gel.The test tube was washed with little more of the solventmixture to minimize the loss of sample. Then glass cartridgecontaining silica gel and sample was eluted with heptaneacetone mixture (65 : 35) until approximately 5 mL eluentwas collected. Once again the solvent was evaporated undera stream of nitrogen, but this time to complete dryness. Thesamples were dissolved in 250 μL heptane acetone mixtureand transferred to a GC vial (300 μL, Chromacol) [8, 11, 20].
2.4. Quantification of Xenoestrogens. The analysis of theestrogens was performed by gas chromatography using a

International Journal of Photoenergy 3
Table 1: The electrical energy per order, EEO, (kWh/m3) for UV and UV/H2O2 treatments of the investigated compounds in treatedwastewater from Usserød WWTP. 95% confidence intervals are indicated.
UV UV/H2O2
Parabens
Methylparaben (MP) 13.9 ± 0.2 8.1 ± 0.6
Ethylparaben (EP) 15.9 ± 0.7 5.3 ± 0.3
Propylparaben (PP) 19.1 ± 1.1 6.4 ± 0.4
isoButylparaben (isoBP) 14.2 ± 1.6 7.0 ± 0.4
Butylparaben (BP) 28.0 ± 2.9 7.9 ± 0.4
Industrial phenols
Bisphenol A (BPA) 16.1 ± 1.9 8.7 ± 1.2
isoNonylphenol (isoNP) 11.5 ± 2.6 7.6 ± 1.2
Octylphenol (OP) 8.1 ± 1.6 2.6 ± 0.1
Sunscreen chemicals
Benzophenone-3 (BP-3) 25.4 ± 1.3 8.5 ± 0.6
Benzophenone-7 (BP-7) 21.1 ± 1.4 8.7 ± 0.5
Octyl methoxycinnamate (OMC) 19.8 ± 2.2 7.1 ± 1.2
Homosalate (HMS) 15.0 ± 1.6 7.7 ± 0.6
3-(4-Methylbenzyliden)camphor (4-MBC) 17.3 ± 2.2 5.0 ± 0.1
Octyl dimethylaminobenzoate (OD-PABA) 4.2 ± 0.7 4.1 ± 0.1
Steroid estrogens
Estrone (E1) 1.2a N.D.
17β-estradiol (β-E2) 4.9 ± 0.8 2.2 ± 0.2
Ethinylestradiol (EE2) 6.1 ± 0.7 1.8 ± 0.03
Estrogenic potency
Estradiol equivalent concentration (EEC) according to YES assay 4.9 ± 1.0 N.D.
N.D.: no data. aRegression with only two points.
Varian 3800 GC coupled to Varian Saturn 2000 Ion trap (MS-MS). The column used was a Varian, FactorFour capillarycolumn (VF-5 ms, 30 m × 0.25 mm ID DF = 0.25) with agas flow of 1 mL/min. Seven and half μL sample was injectedusing Varian 8200 Autosampler in split/splitless injectionmode with the Varian 1079 injection gate.
The GC oven temperature was maintained at 100◦C for1 min and then programmed at 20◦C/min to 110◦C, then at10◦C/min to 250◦C, followed by 25◦C/min to 285◦C, andfinally 35◦C/min to 320◦C, which was held for 7.1 min toensure that most of other organic compounds also cameout. Each compound was quantified based on a characteristicdaughter ion of MS-MS spectroscopy, and the other daughterions were used for confirmation of the identity of thedetected chemicals [8, 11, 20].
2.5. Quantification of Steroid Estrogens. After the analysisof parabens, and so forth, the remaining extract of thesamples was transferred to 3 mL reactival, and the GC-vials were washed one or two times with acetone toensure complete transferring of the sample. The sampleswere dried under nitrogen to complete dryness. Derivati-sation mixture was made by mixing 2 mg dithioerythritol(DTE), 2 μL trimethylsilylimidazole (TMSI), and 1000 μL N-methyl-N-(trimethylsilyl)-trifluoroacetamide (MSTFA). Tothe derivatisation vials, 50 μL of that mixture was added andcaped in order to be shaken. The vials were placed in an
oven at 60◦C for 60 min. Afterwards, the vials were placedat the thermostat-controlled heating block and evaporatedto dryness under stream of nitrogen. The samples weredissolved in 250 μL heptane and transferred to GC vialsagain. The GC oven temperature was maintained at 80◦C for1 min and then programmed at 25◦C/min to 230◦C, followedby 1◦C/min to 248◦C, and finally 45◦C/min to 320◦C, whichwas held for 3 min to ensure that all interfering compoundswere eluted from the column. The method used specificMS/MS parameters and was based on a method evaluationdescribed by Andersen et al. [21].
The range of quantification was for xenoestrogen ingeneral between 0.005 and 1.0 μg/L and typically between2 and 500 ng/L for the steroid estrogens. The samplepreparation and method performance were evaluated in theinterlaboratory comparison described by Heath et al. [22].
2.6. YES Assay. The extracts were serially diluted in a growthmedia for yeast cells. The dilutions were incubated with anestrogen-responsive yeast cell for 72 h. The estrogenic effectwas quantified by measuring the development of a red dyewhich is produced by the yeast cells with an enzyme andis produced proportionally to the estrogenic concentrationin the cells. For quantification of the estrogenic effect, astandard curve was made from a stock solution of 17β-estradiol (E2). The method for quantifying the estrogenicpotency of the extracts is generally based on the method

4 International Journal of Photoenergy
MP
WastewaterTap water
EP
PP
isoB
P
BP
BPA
isoN
P
OP
BP-
3
BP-
7
OM
C
HM
S
4-M
BC
OD
-PA
BA E1
-E2
EE
2
100
75
50
25
0
Rem
oval
(%
)
Figure 2: The removal of estrogenic compounds from tap water and wastewater effluent by UV/H2O2. The electrical energy dose was1.8 kWh/m3, and the initial concentration of hydrogen peroxide was 60 mg/L. The error bars present the 95% confidence interval.
introduced by Routledge and Sumpter [23]. Details of themethod variation are described in Hansen et al. [20] andKusk et al. [11].
2.7. Experiments. Three different types of experiments wereperformed. First, the effect of concentration of hydrogenperoxide in wastewater on removal of estrogens with anUV dose equivalent to an energy use of 1.8 kWh/m3 wasinvestigated. Second, the influence of the high concen-tration of different matrix components was investigatedby comparing the removal of estrogens in experimentswith either the wastewater effluent or tap water with theoptimized hydrogen peroxide dose of 60 mg/L and an UVdose equivalent to an energy use of 1.8 kWh/m3. Finally,experiments were performed in wastewater with or withoutaddition of 60 mg/L hydrogen peroxide using different UVdoses equivalent to an energy use ranging from 1.75 to10.9 kWh/m3 or from 2.3 to 16.3 kWh/m3, respectively.
2.8. Data Treatment. The treatment effectiveness was eval-uated based on the electrical energy per order (EEO; unitkWh/m3), which is defined as the electrical energy consumedper unit volume of water treated required for 90% removal ofthe investigated compound [18]
log(C
Ci
)= −1
EEO· EED, (1)
where Ci and C are the initial and the final concentrations,respectively, EED is the electrical energy dose in kWh/m3,and EEO is the electrical energy per order. The normalisedconcentration of the investigated chemicals was plottedagainst the electrical energy dose. Constructed plots wereused for determination of the EEO by least square fitaccording to (1). In some cases, concentration below thelimit of quantification was used in the estimation of EEO if agood analytical signal was found with correct ratios betweenthe daughter ions in the mass spectra.
3. Results and Discussion
The UV treatment intensity was characterised by the electricenergy consumption. This was done according to recom-mendation by IUPAC [18]. Since the lamp was completelysubmerged, all irradiation emitted by the lamp was absorbedby the water, and thus, the electrical energy dose (EED) ateach treatment level was calculated as the energy consump-tion of the lamp divided by the flow rate of the wastewater.
The absorbance of the spiked tap and wastewater wasmeasured on UV-vis spectrophotometer (Cary 50 Bio,Varian), and the spiking of the water did not change theabsorbance of the water in the UV and visible range (800–190 nm), even though the water was spiked with 17 differentchemicals. The UV dose, each compound was exposedto, is therefore considered as independent of the othercompounds.
3.1. The Effect of Water Matrix on the Removal by UV/H2O2.A single experiment was done in tap water to compare theefficiency of UV/H2O2 treatment in different water matrix.Figure 2 shows the removal of the compound in tap waterand wastewater effluent with an initial concentration ofhydrogen peroxide of 60 mg/L and UV dose equivalent toan energy use of 1.8 kWh/m3. The removal of estrogenicchemicals is higher in tap water than in wastewater effluent.This is due to higher concentrations of other organicmaterials than the spiked compound in the wastewatereffluent compared to tap water. These can act as scavengersof •OH radicals and result in a shadowing effect, where thecompound either blocks the pathway of the light or adsorbsthe light.
Furthermore, more of the hydrogen peroxide was acti-vated in the tap water (21%) than in the wastewater (11%),which may be a result of less shadowing effect in the tapwater resulting in a larger amount of the light being used forphotolysis of hydrogen peroxide. Neamtu and Frimmel [15]found the same tendency when they investigated the removalof BPA.

International Journal of Photoenergy 5
MP
EP
PP
isoB
P
BP
BPA
isoN
P
OP
BP-
3
BP-
7
OM
C
HM
S
4-M
BC
OD
-PA
BA E1
-E2
EE
2
10 mg H2O2/L30 mg H2O2/L
60 mg H2O2/L
100 mg H2O2/L
0
50
100
Rem
oval
(%
)
Figure 3: The removal of estrogens in wastewater effluent at varying concentrations of hydrogen peroxide at constant energy dose(1.8 kWh/m3). The error bars present the 95% confidence interval.
3.2. The Effect of H2O2 Concentration on the Removal ofChemicals. The removal of the investigated compoundsincreased with increasing hydrogen peroxide concentrationuntil 100 mg/L where the removal of most of the com-pound decreased again (Figure 3). The removal was expectedto decrease again at higher concentration due to largerpossibility for the hydroxyl radical to react with hydrogenperoxide and form the less reactive HO2
•. An inhibitionof the degradation of chemicals at high concentration ofhydrogen peroxide was found during the study of Neamtuand Frimmel [15] as well.
3.3. Removal. The obtained removal of all investigatedcompounds is shown in Figures 4 and 5. The more UVirradiation the water was exposed to (higher EED), thehigher the removal of the compounds was. When the resultsfrom UV and UV/H2O2 treatment with an electrical energydose of 2.3 kWh/m3 are compared, it is seen that a higherremoval was obtained at UV/H2O2 treatment than only UVirradiation.
In the case of UV/H2O2 treatment, the removal seemsmore similar than in treatments with UV. With an EED of2.3 kWh/m3, the removal was within the range of 51% to95% (51 to 86 without steroid estrogens), while the rangeis from 20% to 99% for UV treatment. This may be dueto that the mechanism of the removal with •OH radicalsis nonselective, while the UV treatment depends upon theabsorbance and quantum yield, which varies is a discreteproperty of each compound. The results of estrone (E1) aremissing in Figure 4 due to analytical error. The increasedremoval when hydrogen peroxide was added is consistentwith results obtained by Neamtu and Frimmel [15] and Chenet al. [14].
The estrogenic activity of the wastewater effluent treatedby UV was measured by YES assay and was found to be380 ng/L 17β-estradiol equivalents for the spiked wastewaterand 15 ng/L 17β-estradiol equivalents for the lowest treat-ment intensity (2.3 kWh/m3). Thus, even after the lowest
treatment, almost all of the estrogenic activity was removed,and for the following treatments, some estrogenic activitywas detected but below the quantification limit.
3.4. Electrical Energy Efficiency. As described in Section 2.8,the normalised concentration of the investigated chemicalswas plotted against the electrical energy dose (Figure 6).The values of the EEO for the UV treatment were inthe range 1.2–28.0 kWh/m3 (Table 1). The compounds withlower values of EEO are easier to degrade than the one withhigher value. The estrone (E1) was very sensitive towards UVlight and has an EEO at 1.2 kWh/m3. At the lowest treatmentlevel (2.3 kWh/m3), 99% of estrone was removed, and thus,the regression was made with only two points.
As mentioned, the addition of hydrogen peroxide tothe UV treatment resulted in increased removal of theinvestigated compounds and thus lower energy consumptionand lower EEO values (Table 1). Another benefit fromaddition of hydrogen peroxide was more uniform values ofEEO for the investigated compounds. So the compoundswith EEO values between 11.5 and 28 kWh/m3 for UVtreatment had a reduction of EEO to approximately 7-8 kWh/m3 when adding 60 mg/L hydrogen peroxide.
For UV treatment, butylparaben (BP) was the chem-ical which was most difficult to be removed (EEO =28.0 kWh/m3), while for UV/H2O2, it was BPA and BP-7(EEO = 8.7 kWh/m3). Estrone (E1) would probably be theone that required the smallest amount of energy accordingto the tendency, but data is missing due to problem withthe analysis. The lowest EEO obtained for the UV/H2O2
treatment was 1.8 kWh/m3 (EE2).The EEO for removal of estrogenic activity was estimated
for UV treatment only and was in the same range as the EEOsobtained for 17β-estradiol and ethinyl estradiol. Thus, themeasured estrogenic activity is mainly due to the two estro-gens E2 and EE2. A previous study with Milli-Q water andapproximately 5000-fold higher EE2 concentration removedthe estrogenic activity (by YES assay) with the same rate as
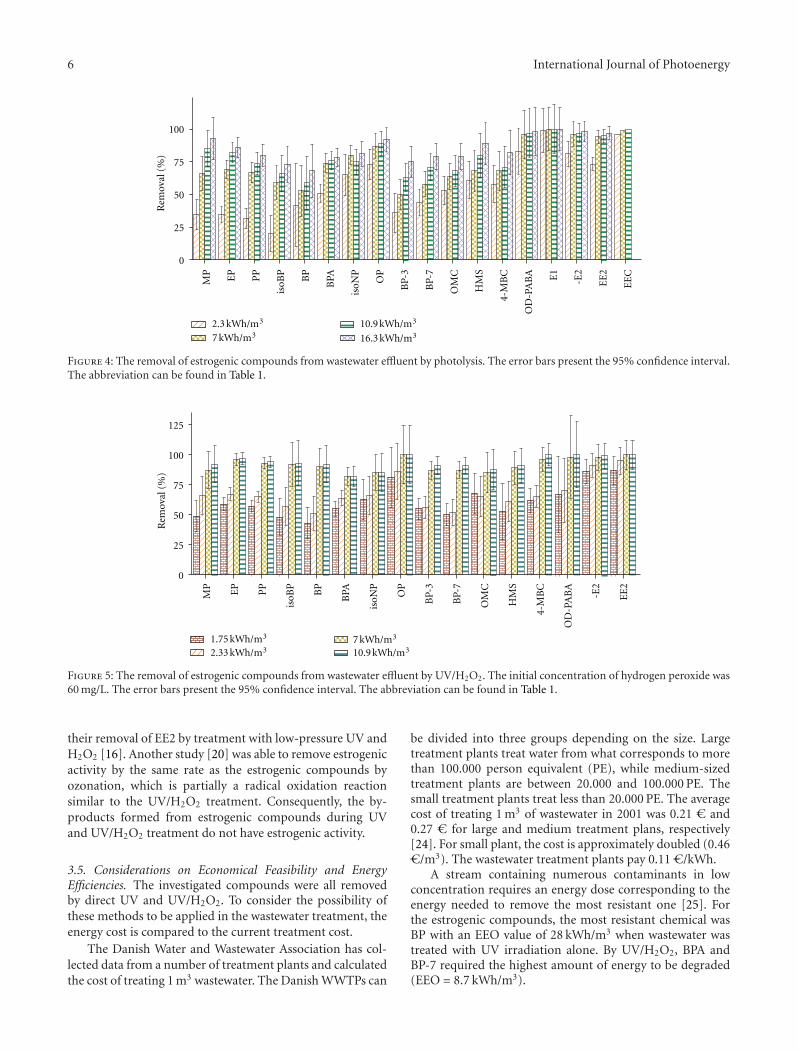
6 International Journal of Photoenergy
MP
EP
PP
isoB
P
BP
BPA
isoN
P
OP
BP-
3
BP-
7
OM
C
HM
S
4-M
BC
OD
-PA
BA E1
-E2
EE
2
EE
C
0
25
75
50
100
Rem
oval
(%
)
2.3 kWh/m3
7 kWh/m310.9 kWh/m3
16.3 kWh/m3
Figure 4: The removal of estrogenic compounds from wastewater effluent by photolysis. The error bars present the 95% confidence interval.The abbreviation can be found in Table 1.
MP
EP
PP
isoB
P
BP
BPA
isoN
P
OP
BP-
3
BP-
7
OM
C
HM
S
4-M
BC
OD
-PA
BA
-E2
EE
2
0
25
75
50
125
100
Rem
oval
(%
)
1.75 kWh/m3
2.33 kWh/m37 kWh/m3
10.9 kWh/m3
Figure 5: The removal of estrogenic compounds from wastewater effluent by UV/H2O2. The initial concentration of hydrogen peroxide was60 mg/L. The error bars present the 95% confidence interval. The abbreviation can be found in Table 1.
their removal of EE2 by treatment with low-pressure UV andH2O2 [16]. Another study [20] was able to remove estrogenicactivity by the same rate as the estrogenic compounds byozonation, which is partially a radical oxidation reactionsimilar to the UV/H2O2 treatment. Consequently, the by-products formed from estrogenic compounds during UVand UV/H2O2 treatment do not have estrogenic activity.
3.5. Considerations on Economical Feasibility and EnergyEfficiencies. The investigated compounds were all removedby direct UV and UV/H2O2. To consider the possibility ofthese methods to be applied in the wastewater treatment, theenergy cost is compared to the current treatment cost.
The Danish Water and Wastewater Association has col-lected data from a number of treatment plants and calculatedthe cost of treating 1 m3 wastewater. The Danish WWTPs can
be divided into three groups depending on the size. Largetreatment plants treat water from what corresponds to morethan 100.000 person equivalent (PE), while medium-sizedtreatment plants are between 20.000 and 100.000 PE. Thesmall treatment plants treat less than 20.000 PE. The averagecost of treating 1 m3 of wastewater in 2001 was 0.21 C and0.27 C for large and medium treatment plans, respectively[24]. For small plant, the cost is approximately doubled (0.46C/m3). The wastewater treatment plants pay 0.11 C/kWh.
A stream containing numerous contaminants in lowconcentration requires an energy dose corresponding to theenergy needed to remove the most resistant one [25]. Forthe estrogenic compounds, the most resistant chemical wasBP with an EEO value of 28 kWh/m3 when wastewater wastreated with UV irradiation alone. By UV/H2O2, BPA andBP-7 required the highest amount of energy to be degraded(EEO = 8.7 kWh/m3).

International Journal of Photoenergy 7
1
0.32
0.1
0.03
0.01
0 5 10 15 20
EED (kWh/m3)
C/C
i
1
0.32
0.1
0.03
0.01
0 5 10 15 20
EED (kWh/m3)
C/C
i
Bisphenol A (BPA)isoNonylphenol (isoNP)Octylphenol (OP)
Estrone (E1)17 -estradiol ( -E2)
Ethinylestradiol (EE2)
0 5 10 15 20
EED (kWh/m3)
1
0.32
0.1
0.03
0.01
1
0.32
0.1
0.03
0.01
0 5 10 15 20
EED (kWh/m3)
Bisphenol A (BPA)isoNonylphenol (isoNP)Octylphenol (OP)
17 -estradiol ( -E2)Ethinylestradiol (EE2)
Figure 6: Degradation of selected estrogenic chemicals. Left: direct UV treatment. Right: UV/H2O2 treatment with a hydrogen peroxideconcentration of 60 mg/L.
Addition of hydrogen peroxide reduced the energy con-sumption by approximately a factor of three which would beeconomically advantageous considering the price of electricenergy and hydrogen peroxide in Denmark. A treatmentwith an electrical energy dose of 8.7 kWh/m3 would remove90% of the most resistant chemicals, whereas it will require17.4 kWh/m3 if the chemicals need to be removed by 99%.
Steroid estrogens are generally considered to be respon-sible for the majority of estrogenicity in WWTP effluents[6, 7]. Supposing only 90% removal of the steroid estrogensis required in order to achieve an acceptable water quality, aconsiderable energy reduction would be possible, since thesteroid estrogens require less treatment. By the UV/H2O2
treatment, the most resistant of the steroid estrogens (E2)requires 2.2 kWh/m3 to obtain 90% removal. At this level of
treatment, the removal of the other compound with EEOin the range of 7-8 kWh/m3 will be approximately 50%(calculated using (1)).
The cost of a treatment can be found by multiplying thecost of electricity with the value of EEO. Thus, the treatmentwith high energy consumption would cost 0.93 C/m3, andif only the steroid estrogens should be removed, the cost ofthe electrical energy would be 0.24 C/m3. Beside the cost ofelectricity, there will also be expenses for hydrogen peroxideand maintenance of equipment.
Comparing with alternative treatment solutions, thecurrent best option for polishing wastewater for estrogenicchemicals is ozonation [20, 26–28]. The EEO for the sameestrogenic chemicals, as are the subject of this paper, intreated wastewater from the same source, was described by

8 International Journal of Photoenergy
Hansen et al. [20]. In that study, the energy required toremove each estrogen by 90% with ozonation, when theenergy to produce ozone and the energy required to producethe pure oxygen that is used by the ozone generator wasalso considered, was 0.14–0.90 kWh/m3. In the same study,an effluent from another source that had a higher CODand UV-absorbance required energy in the range of 0.22–1.09 kWh/m3 for removing the estrogens [20].
4. Conclusions
It was found that the water matrix influenced the removalof the investigated compounds. The organic and inorganicsubstances in wastewater acted as scavenger compound forthe •OH radicals and blocked the pathway of the UVlight. Furthermore, it was found that it is important tooptimize the concentration of hydrogen peroxide, sincea too low concentration of hydrogen peroxide results indecreased removal of the estrogenic chemicals, while a highhydrogen peroxide concentration may result in a decreasingdegradation due to the formation of the less reactive HO2
•
radical.Moreover, it was found that all estrogenic chemicals
could be removed by photolysis with varied energy effec-tiveness and that UV/H2O2 reduced the spread betweenthe energy effectiveness of removing the chemicals andlowered the electrical energy dose. Addition of an optimizedconcentration of hydrogen peroxide reduced the energyconsumption by 2-3-fold, which would be economical con-sidering the price of energy and the chemical in Denmark.
In general, it was found that the parabens, the industrialphenols, and the sunscreen chemicals required much higherUV dose than the steroid estrogens. BP was the estrogeniccompound that required the highest UV dose to be degradedby direct photolysis, while by UV/H2O2, it was BPA and BP-7. Steroid estrogens, which are generally considered to beresponsible for the bulk of estrogenicity in WWTP effluents,required the least amount of treatment for removal.
Considering only the energy consumption for the treat-ment, both UV and UV/H2O2 are considerable less effectivesolutions for removal of estrogenic chemicals in biologicallytreated wastewater compared to ozonation.
Acknowledgments
The Siemens Foundation, the EU Life Project, APOP, andthe Danish Research Council Project, DanEd, are gratefullyacknowledged for economic support to this work. Further,technical assistance with analysis by Karina Bomholt Hen-riksen is recognized. The lamp and photoreactor were a kindgift of Scan Research A/S, Herning, Denmark.
References
[1] C. E. Purdom, P. A. Hardiman, V. J. Bye, N. C. Eno, C. R.Tyler, and J. P. Sumpter, “Estrogenic effects of effluents fromsewage treatment works,” Chemistry and Ecology, vol. 8, no. 4,pp. 275–285, 1994.
[2] E. J. Routledge, D. Sheahan, C. Desbrow, G. C. Brighty,M. Waldock, and J. P. Sumpter, “Identification of estrogenicchemicals in STW effluent. 2. In vivo responses in trout androach,” Environmental Science & Technology, vol. 32, no. 11,pp. 1559–1565, 1998.
[3] P. Falas, H. R. Andersen, A. Ledin, and J. L. C. Jansen,“Occurrence and reduction of pharmaceuticals in thewaterphase at Swedish wastewater treatment plants,” Water Scienceand Technology, vol. 66, no. 4, pp. 783–791, 2012.
[4] H. Segner, K. Caroll, M. Fenske et al., “Identification ofendocrine-disrupting effects in aquatic vertebrates and inver-tebrates: report from the European IDEA project,” Ecotoxicol-ogy & Environmental Safety, vol. 54, no. 3, pp. 302–314, 2003.
[5] C. Desbrow, E. J. Routledge, G. C. Brighty, J. P. Sumpter,and M. Waldock, “Identification of estrogenic chemicals inSTW effluent. 1. Chemical fractionation and in vitro biologicalscreening,” Environmental Science & Technology, vol. 32, no.11, pp. 1549–1558, 1998.
[6] W. Korner, P. Spengler, U. Bolz, W. Schuller, V. Hanf, and J.W. Metzger, “Substances with estrogenic activity in effluentsof sewage treatment plants in southwestern Germany. 2.Biological analysis,” Environmental Toxicology and Chemistry,vol. 20, no. 10, pp. 2142–2151, 2001.
[7] P. Spengler, J. W. Metzger, and W. Korner, “Substances withestrogenic activity in effluents of sewage treatment plants insouthwestern Germany. 1. Chemical analysis,” EnvironmentalToxicology and Chemistry, vol. 20, no. 10, pp. 2133–2141, 2001.
[8] H. R. Andersen, M. Lundsbye, H. V. Wedel, E. Eriksson, and A.Ledin, “Estrogenic personal care products in a greywater reusesystem,” Water Science and Technology, vol. 56, no. 12, pp. 45–49, 2007.
[9] E. Eriksson, H. R. Andersen, and A. Ledin, “Substance flowanalysis of parabens in Denmark complemented with a surveyof presence and frequency in various commodities,” Journal ofHazardous Materials, vol. 156, no. 1–3, pp. 240–259, 2008.
[10] E. Eriksson, H. R. Andersen, and A. Ledin, “Substance flowanalysis and source mapping of chemical UV-filters,” Water,Air, and Soil Pollution, vol. 8, no. 5-6, pp. 473–484, 2008b.
[11] K. O. Kusk, T. Kruger, M. Long et al., “Endocrine potency ofwastewater: contents of endocrine disrupting chemicals andeffects measured by in vivo and in vitro assays,” EnvironmentalToxicology and Chemistry, vol. 30, no. 2, pp. 413–426, 2011.
[12] J. V. Brian, C. A. Harris, M. Scholze et al., “Accurate predictionof the response of freshwater fish to a mixture of estrogenicchemicals,” Environmental Health Perspectives, vol. 113, no. 6,pp. 721–728, 2005.
[13] E. J. Rosenfeldt and K. G. Linden, “Degradation of endocrinedisrupting chemicals bisphenol A, ethinyl estradiol, and estra-diol during UV photolysis and advanced oxidation processes,”Environmental Science & Technology, vol. 38, no. 20, pp. 5476–5483, 2004.
[14] P. J. Chen, K. G. Linden, D. E. Hinton, S. Kashiwada, E.J. Rosenfeldt, and S. W. Kullman, “Biological assessment ofbisphenol A degradation in water following direct photolysisand UV advanced oxidation,” Chemosphere, vol. 65, no. 7, pp.1094–1102, 2006.
[15] M. Neamtu and F. H. Frimmel, “Degradation of endocrinedisrupting bisphenol A by 254 nm irradiation in differentwater matrices and effect on yeast cells,” Water Research, vol.40, no. 20, pp. 3745–3750, 2006.
[16] Z. Zhang, Y. Feng, Y. Liu, Q. Sun, P. Gao, and N. Ren, “Kineticdegradation model and estrogenicity changes of EE2 (17α-ethinylestradiol) in aqueous solution by UV and UV/H2O2

International Journal of Photoenergy 9
technology,” Journal of Hazardous Materials, vol. 181, no. 1–3, pp. 1127–1133, 2010.
[17] D. BŁedzka, D. Gryglik, M. Olak, J. L. Gebicki, and J. S. Miller,“Degradation of n-butylparaben and 4-tert-octylphenol inH2O2/UV system,” Radiation Physics and Chemistry, vol. 79,no. 4, pp. 409–416, 2010.
[18] J. R. Bolton, K. G. Bircher, W. Tumas, and C. A. Tolman,“Figures-of-merit for the technical development and applica-tion of advanced oxidation technologies for both electric- andsolar-driven systems,” Pure and Applied Chemistry, vol. 73, no.4, pp. 627–637, 2001.
[19] T. Kosjek, H. R. Andersen, A. Ledin, E. Heath, and B.Kompare, “Fate of carbamazepine during water treatment,”Environmental Science & Technology, vol. 43, no. 16, pp. 6256–6261, 2009.
[20] K. M. S. Hansen, H. R. Andersen, and A. Ledin, “Ozonationof estrogenic chemicals in biologically treated sewage,” WaterScience and Technology, vol. 62, no. 3, pp. 649–657, 2010.
[21] H. Andersen, H. Siegrist, B. Halling-Sørensen, and T. A.Ternes, “Fate of estrogens in a municipal sewage treatmentplant,” Environmental Science & Technology, vol. 37, no. 18, pp.4021–4026, 2003.
[22] E. Heath, T. Kosjek, H. R. Andersen et al., “Inter-laboratoryexercise on steroid estrogens in aqueous samples,” Environ-mental Pollution, vol. 158, no. 3, pp. 658–662, 2010.
[23] E. J. Routledge and J. P. Sumpter, “Estrogenic activity ofsurfactants and some of their degradation products assessedusing a recombinant yeast screen,” Environmental Toxicologyand Chemistry, vol. 15, no. 3, pp. 241–248, 1996.
[24] Danish Water and Wastewater Association, “Driftsforhold ognøgletal for spildevandsrenseanlæg 2001 (Translate to: Perfor-mance parameters and key numbers for wastewater treatment2001),” A report in Danish, 2012, http://www.danva.dk/.
[25] Calgon Carbon Oxidation Technologies, The AOT Handbook,Calgon Carbon Corporation, Pittsburgh, Pa, USA, 2001.
[26] T. A. Ternes, J. Stuber, N. Herrmann et al., “Ozonation: atool for removal of pharmaceuticals, contrast media and muskfragrances from wastewater?” Water Research, vol. 37, no. 8,pp. 1976–1982, 2003.
[27] M. M. Huber, A. Gobel, A. Joss et al., “Oxidation ofpharmaceuticals during ozonation of municipal wastewatereffluents: a pilot study,” Environmental Science & Technology,vol. 39, no. 11, pp. 4290–4299, 2005.
[28] A. Joss, H. Siegrist, and T. A. Ternes, “Are we about to upgradewastewater treatment for removing organic micropollutants?”Water Science and Technology, vol. 57, no. 2, pp. 251–255, 2008.

Hindawi Publishing CorporationInternational Journal of PhotoenergyVolume 2012, Article ID 681875, 6 pagesdoi:10.1155/2012/681875
Research Article
Electrochemical Incineration of Phenolic Compounds from theHydrocarbon Industry Using Boron-Doped Diamond Electrodes
Alejandro Medel,1 Erika Bustos,1 Karen Esquivel,1, 2 Luis A. Godınez,1 and Yunny Meas1
1 Centro de Investigacion y Desarrollo Tecnologico en Electroquımica, S.C., Parque Tecnologico, Queretaro-Sanfandila,P.O. Box 064-76703, Pedro Escobedo, Queretaro, Mexico
2 Facultad de Ingenierıa, Universidad Autonoma de Queretaro, Cerro de las Campanas, C.P. 76000,Santiago de Queretaro, Queretaro, Mexico
Correspondence should be addressed to Yunny Meas, [email protected]
Received 18 May 2012; Revised 2 August 2012; Accepted 4 August 2012
Academic Editor: Manickavachagam Muruganandham
Copyright © 2012 Alejandro Medel et al. This is an open access article distributed under the Creative Commons AttributionLicense, which permits unrestricted use, distribution, and reproduction in any medium, provided the original work is properlycited.
Electrochemical incineration using boron-doped diamond electrodes was applied to samples obtained from a refinery andcompared to the photo-electro-Fenton process in order to selectively eliminate the phenol and phenolic compounds from acomplex matrix. Due to the complex chemical composition of the sample, a pretreatment to the sample in order to isolate thephenolic compounds was applied. The effects of the pretreatment and of pH on the degradation of the phenolic compoundswere evaluated. The results indicate that the use of a boron-doped diamond electrode in an electrochemical incineration processmineralizes 99.5% of the phenolic sample content. Working in acidic medium (pH = 1), and applying 2 A at 298 K under constantstirring for 2 hours, also results in the incineration of the reaction intermediates reflected by 97% removal of TOC. In contrast, thephoto-electro-Fenton process results in 99.9% oxidation of phenolic compounds with only a 25.69% removal of TOC.
1. Introduction
Residual discharges from refineries are complex matrices ofvaried chemical composition. Among the most dangerousorganic contaminants, phenol stands out as a highly toxiccompound, which is also biorefractory [1–8]. A typical phe-nol concentration in industrial discharges from refineriesoscillates within a range of 20–200 mg L−1 [3, 8, 9], althoughthe actual concentration value can vary depending on thenature of the process [8]. A concentration in the range of5–25 mg L−1 is as toxic for aquatic life as it is for humans[1, 2] and in response to this situation, the maximumpermitted limits of phenol residues found in industrialdischarges vary between 0.5 and 1.0 mg L−1 [2]. In the caseof potable drinking water, the European Union (EU), in its80/778/EC directive, assigned a maximum permitted limitof <0.0005 mg L−1 for phenol in all of its forms [1], giventhat the consumption of water containing these compoundscan induce cancer or death [10]. The elevated danger of thiscontaminant for aquatic life has marked phenol and some
phenolic compounds as priority contaminants, in agreementwith the criteria of the Environmental Protection Agency(EPA) of the United States [1, 2].
The methods used in the treatment of wastewater forthe elimination of phenol are separated into destructive[5, 10, 11] and nondestructive methods [1–4, 6, 12]. Amongthe destructive methods, biological processes are commonlyused; however, no phenol degradation is observed at concen-trations above 200 mg L−1, and the microorganisms are com-pletely deactivated at concentrations larger than 3000 mg L−1
[1]. Another disadvantage that is observed in some destruc-tive methods is that the successful degradation of phenolresults in the generation of subproducts that are harder todegrade [11]. Other processes with destructive character thathave been largely studied are the Fenton processes (Fenton,photo-Fenton, electro-Fenton, and photoelectro-Fenton)and the electrochemical oxidation technologies. Consideringthe last approach, the efficiency of the electrochemicalreaction depends highly on the identity of the anode, whichcan significantly influence the reaction mechanism [8, 13].

2 International Journal of Photoenergy
It has been demonstrated that electrochemical oxidationwith electrodes of high overpotential for oxygen such asTi/PbO2, Ti/SnO2-Sb, and Ti/BDD allows, with high currentefficiency, the complete elimination of organic contaminantsas well as their intermediate products. On the other hand,the application of the Fenton processes in the treatment ofrefinery water residues has also been evaluated [8]. Althoughthese processes permit the degradation of the contaminant,the degradation of the intermediates is not particularlyfeasible [8]. Recently, electrochemical oxidation using boron-doped diamond (BDD) has won widespread acceptance dueto the generation of hydroxyl radicals at high potentials,which are promoted in the interfacial zone through the wateroxidation process (1). This allows the efficient degradationof the contaminant and of the subproducts of the reactionto CO2 and H2O (2), a process known as electrochemicalincineration [13–16]
H2O −→ •OH + H+ + e− (1)
R + M(•OH) −→M + mCO2 + nH2O + H+ + e− (2)
Although both technologies show high efficiency in stud-ies with synthetic samples, few studies have been carriedout on samples obtained from actual refineries, where theefficiency of the reaction might be reduced due to thecomplex chemical composition of the effluent. This wasmade evident by Yavuz and Koparal [7] who evaluated theelectrochemical oxidation of phenol in a parallel plate reactorusing a ruthenium mixed metal oxide electrode, obtainingphenol removal efficiencies of 99.7% and 94.5% in syntheticand actual samples, respectively. In terms of chemical oxygendemand (COD), values of 88.9% and 70.1% were obtainedfor synthetic and actual samples, respectively, showing theeffects of the chemical composition of actual dischargeeffluents. In another study, the degradation of phenol withTi/TiO2-RuO2-IrO2 from refinery samples showed only74.75% and 48% removal of COD and TOC, respectively,although high quantities of chloride ions were employed [9].However, these results should not be surprising, consideringthe composition of the sample and the natural activity ofthe electrodes. On the other hand, the use of Ti/RuO2-TiO2-SnO2 in the treatment of hydrocarbon industry dischargeshas recently been evaluated, but the removal efficiencyunder the evaluated conditions was very low, 20%–47%[17]. Recently a comparative analysis was reported betweenTi/BDD and the electro-Fenton approach in actual samplesfrom refineries, indicating that the electro-Fenton processshowed a better degradation of phenol in comparison toBDD, although the better degradation of the reactionintermediates (in terms of COD) occurred using BDD [8].
Previous works have shown the complexity that involvesthe treatment of wastewater from an actual discharge. How-ever, they have also shown that the electrochemical oxidationwith BDD seems to be a superior method, ahead of othertechnologies, given its capacity to incinerate many organiccompounds as well as their reaction intermediates. In thiswork, we evaluate the selective degradation of phenolic com-pounds in actual samples from a refinery. The objective wasto evaluate and compare the efficiency of the degradation of
phenolic compounds with boron-doped diamond and withthe photoelectro-Fenton process, applying an adequate pre-treatment of the sample that allows the selective degradationof these contaminants.
2. Experimental Details
2.1. Characterization and Pretreatment of the Samples Ob-tained from the Refinery for Selective Degradation of PhenolicCompounds. Four different samples were obtained from arefinery and stored at 4◦C before analysis. The determinationof pH was performed with a Corning 450 potentiometer thatwas equipped with a Pinnacle glass electrode.
To avoid any interference that could reflect the presenceof other contaminants in the electrochemical degradation ofphenolic compounds, 4.5 L of each sample obtained fromthe refinery were treated with 10% NaOH in order tocompletely isolate the phenolic compounds from the originalmatrix. In this process, the selective isolation of phenoliccompounds is carried out by the chemical conversion ofphenols to phenolates. During this process 2 phases wereobtained, one high-density aqueous phase and anotherwith low density. Both samples were then stirred and afterdichloromethane extraction, analyzed by GC-MS to identifythe main components and to verify the effectiveness ofthe pretreatment. This analysis was performed using anAgilent 6890 Gas Chromatographer coupled to a 5973 NMass Spectrometer. A HP-5 MS column (dimensions 30 m×0.25 mm, 0.25 μm) was used with a stationary phase of 5%phenyl-methyl-siloxane. The carrier gas was helium grade 5(UAP). The injection of the sample was performed in splitmode 5 : 1, with a flow of 0.7 mL min−1. The temperature ofthe injector was 543K, with an initial oven temperature of323K (that was maintained for 4 minutes) and a ramp rate of282K per minute until reaching a stable temperature of 573Kfor 6 minutes, for a total time of 37.78 minutes. Quantitativeanalysis of phenolic compounds of the preprocessed sampleswas performed using the 4-aminoantipyrine method [18].Using this technique, the detection of phenolic compoundsis carried out in their total form.
2.2. Electrochemical Incineration Using Boron-Doped Dia-mond. After accomplishing the chemical conversion of phe-nols to phenolates (aqueous phase with high density), threerepresentative samples were taken to a specific pH valuefor their evaluation in alkaline, neutral, and acid conditionsusing HCl (Aldrich, analytical grade). These samples weresubjected to electrolysis under galvanostatic conditions in aone-compartment electrolytic cell, with a capacity of 100 mL.The anode was boron-doped diamond (6.2 cm2) and thecathode was Ti (12.5 cm2). The system was operated at roomtemperature, with continuous stirring using a magneticbar. All the experiments were carried out twice in orderto confirm reproducibility. The degradation of phenol wasmonitored using the 4-aminoantipyrine method [18], andthe degradation of the intermediates was evaluated throughthe analysis of total organic carbon (TOC), using a Shimadzupiece of equipment (Model TOC-VCSN). The removal

International Journal of Photoenergy 3
percentages of TOC and phenol were calculated accordingto (3), where Ci is the initial (mg L−1) and Cf is the finalconcentration (mg L−1) [19, 20]
% removal = Ci − Cf
Ci× 100. (3)
2.3. Electrolysis with A Photo-Electro-Fenton System. Theelectrochemical destruction of phenolic compounds with thephotoelectro-Fenton system was performed using a carbonfiber + TiO2 anode and a nonmodified carbon fiber ascathode. A current of 0.2 A was imposed to the system for2 hours, which contained 800 mL of waste water (aqueousphase with high density). The pH was fixed at 3 (adjustedwith H2SO4). The previously O2 saturated solution (30minutes) was radiated with UV ligth (λ = 365 nm) usinga lamp with a power output of 0.71 μw cm−2. In orderto promote the generation of the Fenton reagent, 0.05 MFe(SO4) was added to the system. The electrolysis wasperformed at room temperature (20◦C), with continuousagitation using a magnetic stirrer [21, 22].
3. Results and Discussion
3.1. Characterization and Pretreatment of the Samples Ob-tained from the Refinery for Selective Degradation of PhenolicCompounds. The pH of the samples (without any treatment)was 14. This pH value is related to the nature of the process,given that phenol is commonly used to synthesize chemicalproducts in basic solutions [5]. Therefore, it is expected thatthe discharge has an alkaline pH. In order to ensure completeconversion of phenolic compounds to sodium phenolates,we proceeded to treat the samples using 10% NaOH. TheGC-MS analysis of the pretreated samples showed that inthe low-density aqueous phase, the principal components(qualitative analysis) were of aliphatic types (4-methyl-decane, undecane, nonane, tridecane, tetradecane, decane,dodecane, pentacosane, and tricosane). In this analysis,the presence of phenolic compounds was not identified.The absence of phenolic compounds in the low densityaqueous phase showed the effectiveness of the pretreatment.This result was verified with the chromatographic analysisof the high-density aqueous phase, where the phenoliccompounds (2,4-dimethyl-phenol, 2-methyl-phenol, o-cresol, 3-methyl-phenol, m-cresol, 1-methyl-phenol, p-cresol, 3,5-dimethyl-phenol, 3-ethyl-5-methyl-phenol, 4-benzyl-pyridacine, dibenzothiophene, 4-methyl-phenol,2,4,6-trimethyl-phenol, 3-metoxy (methyltio)-phenol, 1-methyl-3-phenoxy-benzene) were found. These results wereexpected considering that the chemical conversion processof phenol to phenolate in strongly alkaline conditions beginsat pH 10 and reaches a maximum efficiency at pH 12 [23].
3.2. Electrolysis Using Boron-Doped Diamond. Before per-forming the degradation experiments, a preliminary analysisusing a synthetic solution with a phenol concentration of311 mg L−1 was carried out in an alkaline solution, with thegoal of identifying the current to be applied. The currents
0 0.1 0.2 0.3 0.4
0.4
0.5
0.6
0.7
0.8
0.9
1
0
10
20
30
40
50
60
Ph
enol
ic c
ompo
un
ds (
rem
oval
%)
C f/Ci(%)
j(mA cm− 2)
Ph
enol
ic c
ompo
un
ds (Cf/C
i)
Figure 1: Electro-oxidation of a synthetic solution containing311 mg L−1 of phenol in acid solution (pH 1) after the application ofdifferent current densities, using BDD and Ti as anode and cathode,respectively. The results are shown as normalized values (left) andpercentages of degradation (right).
evaluated were 0.5, 1.0, 1.5, 2.0, and 2.5 A, for a 2-hour period, under constant stirring. It was observed thatthe middle point of the removal was reached at 2 A ( j =0.32 A cm−2), as shown in Figure 1. Since in aqueous solutionphenols exist as phenolates (phenoxide anions) with thedegree of the dissociation increasing with the pH (pH above12), a pH adjustment to acidic conditions was performedin order to favor the inverse process. Considering that fullprotonation should take place in the range of pH 2–4 [23]and that the efficiency in the electrochemical oxidation ofphenolic compounds and phenol is better in the 0–3 pHrange [24, 25], three different values of pH (1, 7 y 14)were evaluated applying the current density selected with thesynthetic sample experiments (2 A). The concentrations ofphenolic compounds in each sample were 1411, 1976, and5928 mg L−1 for the pH values of 1, 7, and 14, respectively.The effect of the pH on the degradation process at 60minutes is shown in Figure 2. The results show that thebest degradation occurred at pH 1, followed by pH 7 andpH 14. The percentages of degradation were 40, 14, and12%, respectively. After 120 minutes at pH 1, the efficiencyof removal was greater than that of pH 7, with an initialconcentration of 1411 mg L−1 and a final concentration of6.5 mg L−1, representing a removal percentage of 99.5%, incomparison to 61.9% at pH 7. These results agree with thosereported in the literature, where the efficiency of degradationis favored in acidic condition [26]. Under basic conditionson the other hand, the removal of phenolic compounds wasnot efficient even with an increase in electrolysis time. Theinfluence of pH on the removal of TOC (Figure 3) was alsoconclusive, showing that at a pH of 1 the removal of TOCproceeded to 97%, with an initial value of 18200 mg L−1
and a final value of 553 mg L−1. This behavior was verifiedbefore the electrochemical treatment at different pH values,where it was observed that the sample changed its color

4 International Journal of Photoenergy
0 2 4 6 8 10 12 140
5
10
15
20
25
30
35
40
Ph
enol
ic c
ompo
un
ds (
rem
oval
%)
pH
Figure 2: Removal of phenolic compounds in pretreated industrialsamples at different pH values (1, 7, and 14), under constant stir-ring, using BDD and Ti as anode and cathode. 2 A ( j =0.32 A cm−2) for 60 minutes of electrolysis were applied.
with the progression of the reaction (with agitation at 298K)during 2 hours (Figure 4). While at pH 14, the color ofthe solution was practically the same, at pH 7 and pH1, the color in the solution disappeared. Similar resultson the effect of the pH were obtained by Wei et al. [27]who evaluated the use of electrochemical technology aspretreatment of heavy oil refinery wastewater. Their resultsshowed a similar effect of the pH, indicating that the betterremoval occurs under acidic medium, followed by neutraland alkaline conditions. The consistent pH effect observedin this work can be explained by considering that in anacidic environment oxygen evolution is inhibited, thus,improving the oxidation process [27]. The low efficiency ofthe process under alkaline conditions on the other hand,can be explained by considering that during the electrolysis,the creation of CO2 allows the formation of carbonates andbicarbonates (4), well known scavengers of hydroxyl radicals[28] as represented by (5) [29]
CO2 + NaOH −→ NaHCO3
NaHCO3 + NaOH −→ Na2CO3
(4)
•OH + CO32− −→ OH− + CO•−3
•OH + HCO3− −→ H2O + CO•−3
(5)
In addition, an alkaline environment can reduce the over-potential for oxygen evolution [30], thus resulting in a lowreaction efficiency.
3.3. Electrolysis with A Photoelectro-Fenton System. For thephotoelectro-Fenton system, an initial phenolic compoundsconcentration of 3471 mg L−1 became a final concentrationof 2.09 mg L−1, demonstrating the effectiveness of the phenoldegradation process with a removal of 99.9%. In this casethe TOC removal (Figure 5) was not as significant as in the
0
20
40
60
80
100
TO
C (
%)
0 2 4 6 8 10 12 14
pH
Figure 3: TOC values before and after the electrochemical oxi-dation process using BDD, at different pH values (1, 7, and 14),applying 2 A ( j = 0.32 A cm−2) of current over 2 hours in pretreatedindustrial samples.
case of the BDD approach, with only 25.7% removal after 120minutes.
These results are in agreement with literature reports,where it has been demonstrated that the application of aphotoelectro-Fenton process in water residues from refiner-ies can produce 98.7% removal of phenol and 75.7% removalof COD, taking into account that the efficiency of thereaction can be improved in the photoelectro-Fenton process[28], which can also have synergistic photolysis effects. Theresults obtained using BDD were also consistent with theliterature, where the removal of phenol has been reported tobe 99.53% with a 96.04% removal of COD [8]. The feasibilityof the use of the BDD in the treatment of complex wastewatereffluents has also been demonstrated by Rocha et al., whoobtained high efficiencies from the electrochemical oxidationprocess [31]. With these results, the electro-oxidation ofphenol using boron-doped diamond is proven to be moreeffective in removing both phenol and TOC, in contrast tothe photoelectron-Fenton system, where only a fourth of thetotal TOC content is removed. This study, therefore, supportsBDD as a viable solution for eliminating phenol and otherorganic compounds from refinery wastewater.
4. Conclusions
The selective degradation of phenolic compounds in samplesobtained from the hydrocarbon industry by electrochemicaloxidation with BDD was successfully achieved. The degra-dation of phenolic compounds proceeded with a 97% ofremoval of TOC by applying a 2 A ( j = 0.32 A cm−2) currentfor 2 hours at 297 K under constant stirring and acidicconditions. In addition, the use of BDD as an anode in theelectro-oxidation of phenol in acidic conditions was foundto be the best alternative for obtaining the highest removal ofintermediates, in contrast to the photoelectro-Fenton systemfor which, following literature conditions, only 25.7% ofTOC was removed. From these results, the use of BDD is

International Journal of Photoenergy 5
2 h 1.45 h 1.3 h 1.15 h 1 h 0.45 h 0.3 h 0.15 h 0 h
(a)
2 h 1.45 h 1.3 h 1.15 h 1 h 0.45 h 0.3 h 0.15 h 0 h
(b)
2 h 1.45 h 1.3 h 1.15 h 1 h 0.45 h 0.3 h 0.15 h 0 h
(c)
Figure 4: Images of industrial samples treated with BDD applying 2 A ( j = 0.32 A cm−2) of current over 2 hours, with constant stirring atpH (a) 1, (b) 7, and (c) 14.
Photoelectro-Fenton0
20
40
60
80
100
TO
C (
%)
Technology
Electrochemicaloxidation-BDD
Figure 5: TOC values after 120 minutes of reaction time employingthe photo-electron-Fenton process, using carbon fiber modifiedwith TiO2 in the presence of 120 mg L−1 of H2O2 and 0.5 mMFe(SO4)2 at pH 3, with an application of radiation at 365 nm with alamp of 0.71 μW cm−2. The solution was pre-saturated with oxygen.
confirmed as a viable approach for the elimination of recal-citrant organic contaminants in water effluents generated bythe refineries.
Acknowledgments
The authors thank the Mexican Council of Science andTechnology (CONACyT) for the financing granted for theimplementation of this study through the Sector ResearchFund for Education-Basic Science-84955 and the Joint Fundof the State Government of Veracruz Llave-96313. A. Medelthanks CONACyT for the fellowship granted.
References
[1] H. Jiang, Y. Fang, Y. Fu, and Q. X. Guo, “Studies on theextraction of phenol in wastewater,” Journal of HazardousMaterials, vol. 101, no. 2, pp. 179–190, 2003.
[2] Y. Han, X. Quan, S. Chen, H. Zhao, C. Cui, and Y. Zhao, “Elec-trochemically enhanced adsorption of phenol on activatedcarbon fibers in basic aqueous solution,” Journal of Colloid andInterface Science, vol. 299, no. 2, pp. 766–771, 2006.
[3] H. Polat, M. Molva, and M. Polat, “Capacity and mechanismof phenol adsorption on lignite,” International Journal ofMineral Processing, vol. 79, no. 4, pp. 264–273, 2006.
[4] A. Bodalo, J. L. Gomez, M. Gomez, G. Leon, A. M. Hidalgo,and M. A. Ruız, “Phenol removal from water by hybridprocesses: study of the membrane process step,” Desalination,vol. 223, no. 1–3, pp. 323–329, 2008.
[5] H. Ma, X. Zhang, Q. Ma, and B. Wang, “Electrochemical cat-alytic treatment of phenol wastewater,” Journal of HazardousMaterials, vol. 165, no. 1–3, pp. 475–480, 2009.
[6] X. Hao, M. Pritzker, and X. Feng, “Use of pervaporationfor the separation of phenol from dilute aqueous solutions,”Journal of Membrane Science, vol. 335, no. 1-2, pp. 96–102,2009.
[7] Y. Yavuz and A. S. Koparal, “Electrochemical oxidation ofphenol in a parallel plate reactor using ruthenium mixed metaloxide electrode,” Journal of Hazardous Materials, vol. 136, no.2, pp. 296–302, 2006.
[8] Y. Yavuz, A. S. Koparal, and U. B. Ogutveren, “Treatment ofpetroleum refinery wastewater by electrochemical methods,”Desalination, vol. 258, no. 1–3, pp. 201–205, 2010.
[9] D. Rajkumar and K. Palanivelu, “Electrochemical treatmentof industrial wastewater,” Journal of Hazardous Materials, vol.113, no. 1–3, pp. 123–129, 2004.
[10] A. Nuhoglu and B. Yalcin, “Modelling of phenol removal in abatch reactor,” Process Biochemistry, vol. 40, no. 3-4, pp. 1233–1239, 2005.
[11] Y. Liu, “Simultaneous oxidation of phenol and reduction ofCr(VI) induced by contact glow discharge electrolysis,” Journalof Hazardous Materials, vol. 168, no. 2-3, pp. 992–996, 2009.
[12] A. V. Radushev, A. V. Plotnikov, and V. N. Tyryshkina, “Regen-eration methods of decontamination of phenol-containingwaste waters,” Theoretical Foundations of Chemical Engineer-ing, vol. 42, no. 5, pp. 781–794, 2008.
[13] C. Comninellis, “Electrocatalysis in the electrochemical con-version/combustion of organic pollutants for waste watertreatment,” Electrochimica Acta, vol. 39, no. 11-12, pp. 1857–1862, 1994.
[14] P. A. Michaud, M. Panizza, L. Ouattara, T. Diaco, G. Foti,and C. Comninellis, “Electrochemical oxidation of water onsynthetic boron-doped diamond thin film anodes,” Journal ofApplied Electrochemistry, vol. 33, no. 2, pp. 151–154, 2003.
[15] G. Chen, “Electrochemical technologies in wastewater treat-ment,” Separation and Purification Technology, vol. 38, no. 1,pp. 11–41, 2004.
[16] B. Marselli, J. Garcia-Gomez, P. A. Michaud, M. A. Rodrigo,and C. Comninellis, “Electrogeneration of hydroxyl radicalson boron-doped diamond electrodes,” Journal of the Electro-chemical Society, vol. 150, no. 3, pp. D79–D83, 2003.
6 International Journal of Photoenergy
[17] A. M. Z. Ramalho, C. A. Martınez-Huitle, and D. R. D. Silva,“Application of electrochemical technology for removing pe-troleum hydrocarbons from produced water using a DSA-typeanode at different flow rates,” Fuel, vol. 89, no. 2, pp. 531–534,2010.
[18] Norma Mexicana NMX-AA-050-SCFI-2001, “Analisis deagua-Determinacion de fenoles Totales en aguas naturales,potables, residuales y residuales tratadas”.
[19] O. Abdelwahab, N. K. Amin, and E. S. Z. El-Ashtoukhy, “Elec-trochemical removal of phenol from oil refinery wastewater,”Journal of Hazardous Materials, vol. 163, no. 2-3, pp. 711–716,2009.
[20] A. Idris and K. Saed, “Degradation of phenol in wastewaterusing anolyte produced from electrochemical generation ofbrine solution,” Global Nest, vol. 4, pp. 139–144, 2002.
[21] J. M. Peralta-Hernandez, Y. Meas-Vong, F. J. Rodrıguez, T.W. Chapman, M. I. Maldonado, and L. A. Godınez, “In situelectrochemical and photo-electrochemical generation of thefenton reagent: a potentially important new water treatmenttechnology,” Water Research, vol. 40, no. 9, pp. 1754–1762,2006.
[22] J. M. Peralta-Hernandez, J. Manrıquez, Y. Meas-Vong et al.,“Photocatalytic properties of nano-structured TiO2-carbonfilms obtained by means of electrophoretic deposition,” Jour-nal of Hazardous Materials, vol. 147, no. 1-2, pp. 588–593,2007.
[23] T. Poznyak, R. Tapia, J. Vivero, and I. Chairez, “Effect of pHto the decomposition of aqueous phenols mixture by ozone,”Journal of the Mexican Chemical Society, vol. 50, pp. 28–35,2006.
[24] J. L. Nava, F. Nunez, and I. Gonzalez, “Electrochemical incin-eration of p-cresol and o-cresol in the filter-press-type FM01-LC electrochemical cell using BDD electrodes in sulfate mediaat pH 0,” Electrochimica Acta, vol. 52, no. 9, pp. 3229–3235,2007.
[25] L. Wei, S. Guo, G. Yan, C. Chen, and X. Jiang, “Electrochemicalpretreatment of heavy oil refinery wastewater using a three-dimensional electrode reactor,” Electrochimica Acta, vol. 55,no. 28, pp. 8615–8620, 2010.
[26] B. Boye, E. Brillas, B. Marselli et al., “Electrochemical incin-eration of chloromethylphenoxy herbicides in acid mediumby anodic oxidation with boron-doped diamond electrode,”Electrochimica Acta, vol. 51, no. 14, pp. 2872–2880, 2006.
[27] L. Wei, S. Guo, G. Yan, C. Chen, and X. Jiang, “Electrochemicalpretreatment of heavy oil refinery wastewater using a three-dimensional electrode reactor,” Electrochimica Acta, vol. 55,no. 28, pp. 8615–8620, 2010.
[28] A. L. N. Mota, L. F. Albuquerque, L. T. C. Beltrame, O.Chiavone-Filho, A. Machulek, and C. A. O. Nascimento, “Ad-vanced oxidation processes and their application in thepetroleum industry: a review,” Brazilian Journal of Petroleumand Gas, vol. 2, pp. 122–142, 2008.
[29] D. Wu, M. Liu, D. Dong, and X. Zhou, “Effects of some factorsduring electrochemical degradation of phenol by hydroxylradicals,” Microchemical Journal, vol. 85, no. 2, pp. 250–256,2007.
[30] D. Reyter, D. Belanger, and L. Roue, “Nitrate removal by apaired electrolysis on copper and Ti/IrO2 coupled electrodes—Influence of the anode/cathode surface area ratio,” WaterResearch, vol. 44, no. 6, pp. 1918–1926, 2010.
[31] J. H. B. Rocha, M. M. S. Gomes, N. S. Fernandes, D. R.Da Silva, and C. A. Martınez-Huitle, “Application of electro-chemical oxidation as alternative treatment of produced water
generated by Brazilian petrochemical industry,” Fuel, vol. 96,pp. 80–87, 2012.

Hindawi Publishing CorporationInternational Journal of PhotoenergyVolume 2012, Article ID 121239, 8 pagesdoi:10.1155/2012/121239
Research Article
Preparation of a Modified PTFE Fibrous Photo-Fenton Catalystand Its Optimization towards the Degradation of Organic Dye
Zhizhong Ding,1 Yongchun Dong,1, 2 and Bing Li1
1 Division of Textile Chemistry & Ecology, School of Textiles, Tianjin Polytechnic University, 399 Binshui Western Road,Xiqing District, Tianjin 300387, China
2 State Key Laboratory Breeding Base of Photocatalysis, Fuzhou University, Fuzhou 350002, China
Correspondence should be addressed to Yongchun Dong, [email protected]
Received 22 May 2012; Accepted 30 July 2012
Academic Editor: Meenakshisundaram Swaminathan
Copyright © 2012 Zhizhong Ding et al. This is an open access article distributed under the Creative Commons Attribution License,which permits unrestricted use, distribution, and reproduction in any medium, provided the original work is properly cited.
Polytetrafluoroethylene (PTFE) fiber was grafted with acrylic acid to impart the carboxyl groups onto the fiber surface, whichwere used to coordinate with both transition metal ions Fe(III) and Cu(II) and a rare metal ion Ce(III) to prepare the metalgrafted PTFE fiber complexes as the novel heterogeneous Fenton catalysts for the degradation of the azo dye in water under visibleirradiation. Some factors affecting the preparation process, such as nature and concentration of metal ions in the coordinationsolution, grafting degree of PTFE and reaction temperature were optimized with respect to the content and strength of metalfixation on the fiber and dye degradation efficiency. The results indicated that increasing metal ion concentrations in solution andgrafting degree of PTFE fiber as well as higher coordination temperature led to a significant increase in metal content, especiallyFe(III) and Cu(II) content of the complexes. Fe(III) ions fixed on the fiber showed the better catalytic performance than Cu(II) andCe(III) ions fixed when three different complexes with similar metal content being employed, respectively. Moreover, IncreasingFe content or incorporation of Cu(II) ions could significantly improve the catalytic activity of the complexes.
1. Introduction
Dye-containing wastewater from different industrial fieldsis a principal source of environmental contamination. Andthese dyes are known to be largely nonbiodegradable andtoxic to aquatic plants and animals. In recent years, het-erogeneous Fenton process has become a research focusin the treatment of these dyes in water because of itsapplication over a wide pH range and easy separationof the catalyst after the reaction. The modified polyacry-lonitrile (PAN) fiber Fe complexes have been regarded asthe attractive heterogeneous Fenton catalysts with low costand high effectiveness [1–5]. However, it was reported thatthe modifications, especially amidoximation can lead to asignificant decrease in the mechanical performance of PANfiber. Moreover, the tensile strength of the amidoximatedPAN fiber was found to be further lower after coordinatingwith Fe ions in our previous work [2, 6]. This may limitits commercial applications in the future because good
mechanical performance is necessary for effective using ofthe fibers as the catalysts for Fenton system.
Polytetrafluoroethylene (PTFE) fiber has received moreand more attention in the past decades because of theiroutstanding thermal, chemical stability, and mechanicalproperties even under very harsh conditions [7–9]. In recentyears, there have been many reports of using modifiedPTFE fibers and films containing functional groups for theconcentration and separation of metal ions from aqueousmedia [10–12]. However, little attention has been paid tothe heterogeneous Fenton catalyst produced by PTFE mod-ification and metal coordination and its catalytic propertyfor degradation of organic dye. Therefore, our investigationshave been directed to the preparation of a fibrous PTFEcatalyst with both good catalytic activity and mechanicalstrength. In this work, the influence of grafting degreeof PTFE fiber, nature, and concentration of metal ion inthe coordination solution and reaction temperature wasoptimized with respect to the content and strength of metal
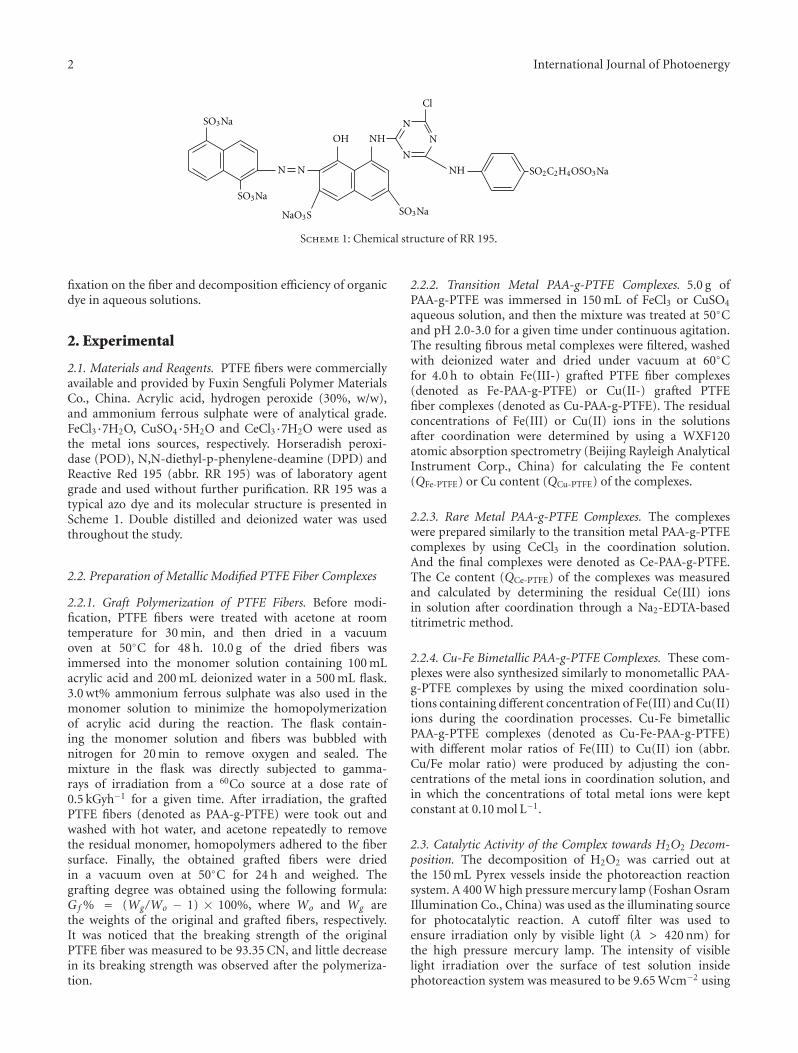
2 International Journal of Photoenergy
SO3Na
SO3Na
SO3Na
N
N
N
NN
OH
NH
NH
Cl
SO2C2H4OSO3Na
NaO3S
Scheme 1: Chemical structure of RR 195.
fixation on the fiber and decomposition efficiency of organicdye in aqueous solutions.
2. Experimental
2.1. Materials and Reagents. PTFE fibers were commerciallyavailable and provided by Fuxin Sengfuli Polymer MaterialsCo., China. Acrylic acid, hydrogen peroxide (30%, w/w),and ammonium ferrous sulphate were of analytical grade.FeCl3·7H2O, CuSO4·5H2O and CeCl3·7H2O were used asthe metal ions sources, respectively. Horseradish peroxi-dase (POD), N,N-diethyl-p-phenylene-deamine (DPD) andReactive Red 195 (abbr. RR 195) was of laboratory agentgrade and used without further purification. RR 195 was atypical azo dye and its molecular structure is presented inScheme 1. Double distilled and deionized water was usedthroughout the study.
2.2. Preparation of Metallic Modified PTFE Fiber Complexes
2.2.1. Graft Polymerization of PTFE Fibers. Before modi-fication, PTFE fibers were treated with acetone at roomtemperature for 30 min, and then dried in a vacuumoven at 50◦C for 48 h. 10.0 g of the dried fibers wasimmersed into the monomer solution containing 100 mLacrylic acid and 200 mL deionized water in a 500 mL flask.3.0 wt% ammonium ferrous sulphate was also used in themonomer solution to minimize the homopolymerizationof acrylic acid during the reaction. The flask contain-ing the monomer solution and fibers was bubbled withnitrogen for 20 min to remove oxygen and sealed. Themixture in the flask was directly subjected to gamma-rays of irradiation from a 60Co source at a dose rate of0.5 kGyh−1 for a given time. After irradiation, the graftedPTFE fibers (denoted as PAA-g-PTFE) were took out andwashed with hot water, and acetone repeatedly to removethe residual monomer, homopolymers adhered to the fibersurface. Finally, the obtained grafted fibers were driedin a vacuum oven at 50◦C for 24 h and weighed. Thegrafting degree was obtained using the following formula:Gf % = (Wg/Wo − 1) × 100%, where Wo and Wg arethe weights of the original and grafted fibers, respectively.It was noticed that the breaking strength of the originalPTFE fiber was measured to be 93.35 CN, and little decreasein its breaking strength was observed after the polymeriza-tion.
2.2.2. Transition Metal PAA-g-PTFE Complexes. 5.0 g ofPAA-g-PTFE was immersed in 150 mL of FeCl3 or CuSO4
aqueous solution, and then the mixture was treated at 50◦Cand pH 2.0-3.0 for a given time under continuous agitation.The resulting fibrous metal complexes were filtered, washedwith deionized water and dried under vacuum at 60◦Cfor 4.0 h to obtain Fe(III-) grafted PTFE fiber complexes(denoted as Fe-PAA-g-PTFE) or Cu(II-) grafted PTFEfiber complexes (denoted as Cu-PAA-g-PTFE). The residualconcentrations of Fe(III) or Cu(II) ions in the solutionsafter coordination were determined by using a WXF120atomic absorption spectrometry (Beijing Rayleigh AnalyticalInstrument Corp., China) for calculating the Fe content(QFe-PTFE) or Cu content (QCu-PTFE) of the complexes.
2.2.3. Rare Metal PAA-g-PTFE Complexes. The complexeswere prepared similarly to the transition metal PAA-g-PTFEcomplexes by using CeCl3 in the coordination solution.And the final complexes were denoted as Ce-PAA-g-PTFE.The Ce content (QCe-PTFE) of the complexes was measuredand calculated by determining the residual Ce(III) ionsin solution after coordination through a Na2-EDTA-basedtitrimetric method.
2.2.4. Cu-Fe Bimetallic PAA-g-PTFE Complexes. These com-plexes were also synthesized similarly to monometallic PAA-g-PTFE complexes by using the mixed coordination solu-tions containing different concentration of Fe(III) and Cu(II)ions during the coordination processes. Cu-Fe bimetallicPAA-g-PTFE complexes (denoted as Cu-Fe-PAA-g-PTFE)with different molar ratios of Fe(III) to Cu(II) ion (abbr.Cu/Fe molar ratio) were produced by adjusting the con-centrations of the metal ions in coordination solution, andin which the concentrations of total metal ions were keptconstant at 0.10 mol L−1.
2.3. Catalytic Activity of the Complex towards H2O2 Decom-position. The decomposition of H2O2 was carried out atthe 150 mL Pyrex vessels inside the photoreaction reactionsystem. A 400 W high pressure mercury lamp (Foshan OsramIllumination Co., China) was used as the illuminating sourcefor photocatalytic reaction. A cutoff filter was used toensure irradiation only by visible light (λ > 420 nm) forthe high pressure mercury lamp. The intensity of visiblelight irradiation over the surface of test solution insidephotoreaction system was measured to be 9.65 Wcm−2 using
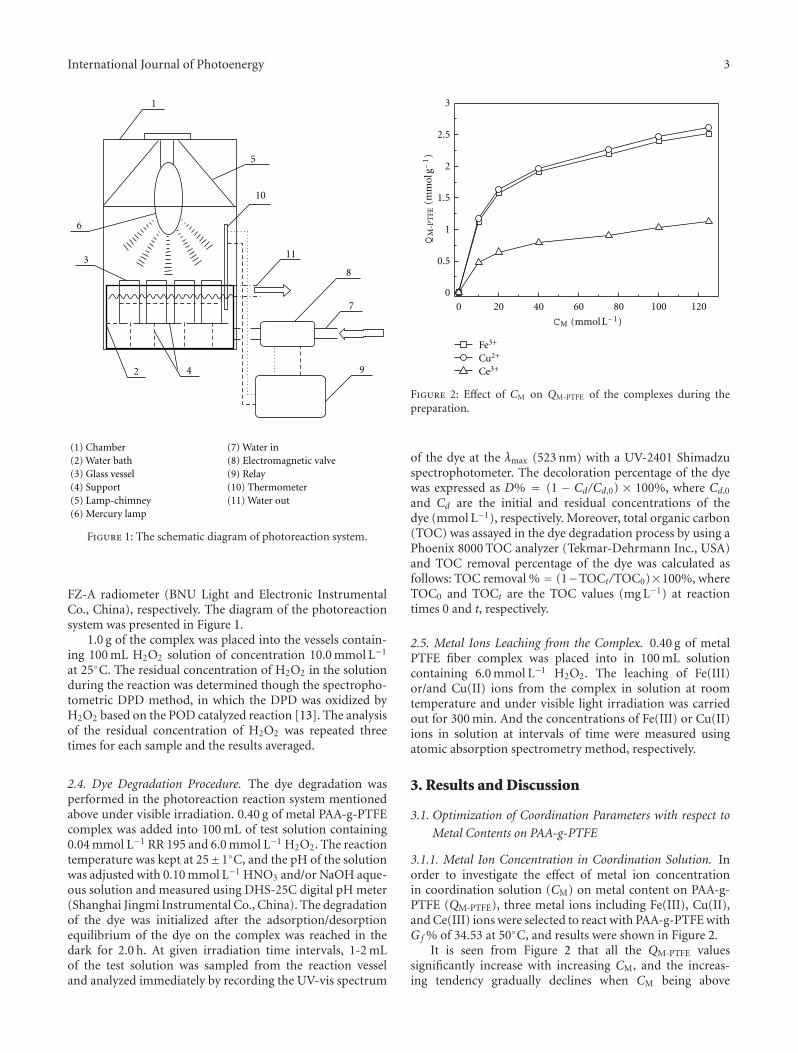
International Journal of Photoenergy 3
1
6
3
2 4
5
10
11
8
7
9
(1) Chamber(2) Water bath(3) Glass vessel(4) Support(5) Lamp-chimney(6) Mercury lamp
(7) Water in(8) Electromagnetic valve(9) Relay(10) Thermometer(11) Water out
Figure 1: The schematic diagram of photoreaction system.
FZ-A radiometer (BNU Light and Electronic InstrumentalCo., China), respectively. The diagram of the photoreactionsystem was presented in Figure 1.
1.0 g of the complex was placed into the vessels contain-ing 100 mL H2O2 solution of concentration 10.0 mmol L−1
at 25◦C. The residual concentration of H2O2 in the solutionduring the reaction was determined though the spectropho-tometric DPD method, in which the DPD was oxidized byH2O2 based on the POD catalyzed reaction [13]. The analysisof the residual concentration of H2O2 was repeated threetimes for each sample and the results averaged.
2.4. Dye Degradation Procedure. The dye degradation wasperformed in the photoreaction reaction system mentionedabove under visible irradiation. 0.40 g of metal PAA-g-PTFEcomplex was added into 100 mL of test solution containing0.04 mmol L−1 RR 195 and 6.0 mmol L−1 H2O2. The reactiontemperature was kept at 25±1◦C, and the pH of the solutionwas adjusted with 0.10 mmol L−1 HNO3 and/or NaOH aque-ous solution and measured using DHS-25C digital pH meter(Shanghai Jingmi Instrumental Co., China). The degradationof the dye was initialized after the adsorption/desorptionequilibrium of the dye on the complex was reached in thedark for 2.0 h. At given irradiation time intervals, 1-2 mLof the test solution was sampled from the reaction vesseland analyzed immediately by recording the UV-vis spectrum
Fe3+
Cu2+
Ce3+
3
2.5
2
1.5
1
0.5
00 20 40 60 80 100 120
QM
-PT
FE(m
mol
g−
1)
CM 1(mmol L− )
Figure 2: Effect of CM on QM-PTFE of the complexes during thepreparation.
of the dye at the λmax (523 nm) with a UV-2401 Shimadzuspectrophotometer. The decoloration percentage of the dyewas expressed as D% = (1 − Cd/Cd,0) × 100%, where Cd,0
and Cd are the initial and residual concentrations of thedye (mmol L−1), respectively. Moreover, total organic carbon(TOC) was assayed in the dye degradation process by using aPhoenix 8000 TOC analyzer (Tekmar-Dehrmann Inc., USA)and TOC removal percentage of the dye was calculated asfollows: TOC removal % = (1−TOCt/TOC0)×100%, whereTOC0 and TOCt are the TOC values (mg L−1) at reactiontimes 0 and t, respectively.
2.5. Metal Ions Leaching from the Complex. 0.40 g of metalPTFE fiber complex was placed into in 100 mL solutioncontaining 6.0 mmol L−1 H2O2. The leaching of Fe(III)or/and Cu(II) ions from the complex in solution at roomtemperature and under visible light irradiation was carriedout for 300 min. And the concentrations of Fe(III) or Cu(II)ions in solution at intervals of time were measured usingatomic absorption spectrometry method, respectively.
3. Results and Discussion
3.1. Optimization of Coordination Parameters with respect to
Metal Contents on PAA-g-PTFE
3.1.1. Metal Ion Concentration in Coordination Solution. Inorder to investigate the effect of metal ion concentrationin coordination solution (CM) on metal content on PAA-g-PTFE (QM-PTFE), three metal ions including Fe(III), Cu(II),and Ce(III) ions were selected to react with PAA-g-PTFE withGf % of 34.53 at 50◦C, and results were shown in Figure 2.
It is seen from Figure 2 that all the QM-PTFE valuessignificantly increase with increasing CM, and the increas-ing tendency gradually declines when CM being above

4 International Journal of Photoenergy
Fe3+
Cu2+
Ce3+
G f (%)
3
2.5
2
1.5
1
0.5
0
0 20 40 60 80
QM
-PT
FE(m
mol
g−
1)
Figure 3: QM-PTFE of the complexes as a function of graft degree ofPAA-g-PTFE.
40.0 mmol L−1, especially for Ce(III) ions. This suggests thathigher CM can enhance the coordination of PAA-g-PTFEwith metal ions, particularly two transition metal ions. Theprevious works [11, 12, 14] have found that the carboxylgroups on PAA-g-PTFE are the main coordinating sites withmetal ions. Furthermore, it has been proposed that theoxygen of the carboxyl group has a pair of electrons thatcan add themselves to a proton or a metal ion to form acomplex through a coordinated covalent bond. The metalions with empty orbitals act as a Lewis acid capable ofaccepting electron pairs. In contrast, the carboxyl groupsthat have nonshared electron pairs function as Lewis basesdonating their electrons pair [15, 16]. Moreover, transitionmetal contents (QFe-PTFE and QCu-PTFE) on the fiber are muchmore than Ce content (QCe-PTFE) on the fiber, especially athigher metal concentration in solution. This is because the4f electrons of rare earth metal ion are in the inner orbital ofthe atomic structure, so that the ligand field has less effecton them and the rare earth metal ions have much lowerLFSE values (4.18 kJ moL−1) than d-transition metal ions (≥418 kJ moL−1) [5, 17].
3.1.2. Graft Degree of PAA-g-PTFE. To determine the depen-dence of QM-PTFE value on graft degree of PAA-g-PTFE, thecomplexes were produced by the coordination of PAA-g-PTFE with different Gf % in 0.10 mol L−1 metal ion aqueoussolution at 50◦C, and relationship between Gf % and QM-PTFE
values was presented in Figure 3.Figure 3 shows that the QM-PTFE value of metal PAA-g-
PTFE complexes was greatly enhanced with Gf % of PAA-g-PTFE, particularly when Fe(III) and Cu(II) ion beingused. This indicates that increasing Gf % value can benefitthe fixation of three metal ions on the surface of PAA-g-PTFE and form the metal PAA-g-PTFE complexes with highQM-PTFE because PAA-g-PTFE with high Gf % values has
Fe3+
Cu2+
Ce3+
3.5
3
2.5
2
1.5
1
0.5
020 30 40 50 60 70
T ( C)
QM
-PT
FE(m
mol
g−
1)
Figure 4: QM-PTFE of the complexes at different reaction tempera-tures.
much more carboxyl groups on their surface than those withlow Gf % values, thus more easily react with metal ions insolution.
3.1.3. Temperature. PAA-g-PTFE with Gf % of 34.53 wasemployed to coordinate with three metal ions, respectively,in the solution, for investigating the impact of reactiontemperature on QM-PTFE value of the resulting metal PAA-g-PTFE complexes, and results were shown in Figure 4.
Figure 4 shows that QM-PTFE value of the complexes isincreased with elevation of reaction temperature from 20 to70◦C. This obviously demonstrates that it is favorable for thecoordination with the temperature rising, which implies thatthe coordination process is an endothermic process [11]. Apossible reason is that higher temperature increases mobilityof the polymer chains and the swelling of the fiber in thereaction medium, thus improving the interactions betweenmetal ion and the fiber and resulting in more metal ions fixedon them.
3.2. Comparison of Metal Ions toward H2O2 Decomposition.The catalytic activity of three metal PAA-g-PTFE complexeswith similar QM-PTFE value (approximately 1.30 mmol L−1)was examined with respect to the decomposition of H2O2,respectively, and the decay ratios of H2O2 as the function ofirradiation time were shown in Figure 5.
It is observed from Figure 5 that the decay ratios of H2O2
gradually decline with the increasing irradiation time andvary with the nature of metal ions. The decay ratio of H2O2
is the lowest for Fe-PAA-g-PTFE, followed by Cu-PAA-g-PTFE, and the highest for Ce-PAA-g-PTFE. This indicatesthat Fe-PAA-g-PTFE has a stronger catalytic activity than theother complexes at the same conditions. Additionally, fromthe viewpoint of the toxicity and cost of three metal ions,

International Journal of Photoenergy 5
Fe-PAA-g-PTFECu-PAA-g-PTFECe-PAA-g-PTFE
C/C
0
t(min)
1
0.8
0.6
0.4
0.2
00 30 60 90 120 150 180
Figure 5: Decomposition of H2O2 in the presence of the differentcatalysts.
Fe-PAA-g-PTFECu-PAA-g-PTFECe-PAA-g-PTFE
D18
0(%
)
100
80
60
40
20
00 0.5 1 1.5 2 2.5
QM-PTFE (mmol L− 1)
Figure 6: Relationship between QM-PTFE and D180%.
Fe(III) ions should been selected to prepare the catalyst forthe majority of the future research and practical application.
3.3. Effect of Metal Ion on Dye Degradation. The dyedegradations were conducted in the presence of three metalPAA-g-PTFE complexes with different QM-PTFE values asthe heterogeneous Fenton catalysts, respectively, and theinfluence of QM-PTFE value on decoloration percentage of thedye within 180 min (D180%) was presented in Figure 6.
Figure 6 shows that increasing QM-PTFE value can remark-ably enhance the dye degradation for all the complexes,particularly Fe-PAA-g-PTFE. Moreover, comparing threemetal PAA-g-PTFE complexes with similar QM-PTFE values,the highest D180% is achieved when Fe-PAA-g-PTF is used.
This means that Fe-PAA-g-PTFE exhibits the strongestcatalytic activity for dye degradation, of three complexes. Themain reason is that Fe-PAA-g-PTFE leads to the enhanceddecomposition of H2O2 in solution indicated in Figure 5,thus possibly producing more hydroxyl radicals, which isresponsible for the dye degradation. This reaction processis described by (1) and (2). On the other hand, the formedFe(II) ions on Fe-PAA-g-PTFE may be oxidized to Fe(IV)ions in this work, which are regarded as another reactiveintermediate from the photo-Fenton reaction which candecompose dye molecules. A possible formation of Fe(IV)ions was expressed by (3)
Fe3+/PTFE + H2O2hv−→ Fe2+/PTFE + HO2
• + H⊕ (1)
Fe2+/PTFE + H2O2hv−→ Fe3+/PTFE + OH� + HO• (2)
Fe2+/PTFE + H2O2hv−→ Fe4+/PTFE
hv−→ Fe3+/PTFE (3)
Dye + Fe3+/PTFEhv−→ Dye∗ · · · Fe3+/PTFE −→ Dye+•
+ Fe2+/PTFE.(4)
Additionally, the photosensitization of the azo dyes canpromote a conversion of Fe(III) to Fe(II) ions during photo-assisted Fenton reaction [12]. In this work, it is believed thatRR 195 could act as the sensitizer of Fe-PAA-g-PTFE to leadto a charge transfer with the concomitant quenching of theexcited dye∗ and the formation of dye+. This process wassuggested by (4).
It is well known the hydroxyl radicals is a powerfuloxidant and can ultimately cause mineralization of textiledyes. Consequently, the mineralization of the dye wasexamined by measuring the TOC values of test solutionsduring the degradation when three complexes with thesimilar QM-PTFE values were employed, respectively.
Figure 7 shows that TOC removal % of the dye is as afunction of irradiation time. It is found that TOC removal% gradually increases with the prolongation of irradiationtime. Specifically, TOC removal % for Fe-PAA-g-PTF ismuch higher than those for the other complexes at thesame time. These results demonstrate that three metal PAA-g-PTFE complexes as the photocatalysts can result in adrastic breakdown of dye molecules, and then convert theminto water, carbon dioxide, and inorganic compounds. Itshould also be pointed out that TOC removal % is mainlydetermined by nature of metal ions, which is well consistentwith the impact of nature of metal ions on the degradationmentioned above.
In order to study the catalytic activity of the complexesin a wide pH range, the dye degradation was carried outat different solution pH within 180 min of reaction time.The catalytic activity of the complexes was determined withrespect to the dye degradation with the results presented inFigure 8.
Figure 8 shows that the dye degradation can be operatedin the presence of the complex over a wide pH 3–9 range,indicating that a significant breakdown of the dye occur,especially at acidic media. Moreover, the catalytic activity

6 International Journal of Photoenergy
TO
C r
emov
al (
%)
Fe-PAA-g-PTFECu-PAA-g-PTFECe-PAA-g-PTFE
t(min)
80
60
40
20
0
0 50 100 150 200 250
Figure 7: Mineralization of the dye with different catalysts.
D18
0(%
)
Fe-PAA-g-PTFECu-PAA-g-PTFECe-PAA-g-PTFE
100
80
60
40
20
0pH = 3 pH = 6 pH = 9
Figure 8: Dye degradation at different pH levels for three catalysts.
of three complexes at acid and neutral medium is rankedin this order: Fe-PAA-g-PTFE > Cu-PAA-g-PTFE > Ce-PAA-g-PTFE. However, higher pH range, especially alkalinepH medium dramatically decreases the catalytic activityof three complexes. It is worth noticing that Cu-PAA-g-PTFE shows a stronger activity than Fe-PAA-g-PTFE at pH9. This is similar to the performance of Cu/MCM-41 asa highly stable and pH-insensitive heterogeneous photo-Fenton-like Fenton catalyst [18]. Some researches [18, 19]suggested that an advantage of Cu2+ ion as a Fenton-likecatalyst is its characteristics of a wide-working pH rangecompared to the conventional Fenton catalyst. Therefore it isbelieved that Cu-PAA-g-PTFE behaves similarly to Fe-PAA-g-PTFE, and it has a higher catalytic activity over a wide pHrange.
3.4. Role of Cu(II) Ion as an Assisted Metal Ion. It has beensuggested that the performance of supported Fe catalysts isoften improved by adding certain metals. And copper ionhas a role as an assistant in photocatalysis [5]. Moreover,it has been presented that the outstanding catalytic activityof bimetal catalysts may be generally ascribed to synergisticeffects between copper and iron redox couples. In order tomeet the demands for rapid and stable dye degradation infuture commercial application, a series of Cu-Fe bimetalPAA-g-PTFE complexes with different Cu/Fe molar ratioswere prepared and used in the dye degradation at pH 9in this work. And Cu/Fe molar ratio of metal PAA-g-PTFEcomplexes was observed to have a significant impact on thedecomposition efficiency of the dye, and the results are givenin Table 1.
The data in Table 1 indicate that higher concentrationof Cu(II) ions in the solutions increased their Cu/Fe molarratio. When the molar concentration of Cu(II) ions equalsto that of Fe(III) ions in the solution, the Cu/Fe molarratio of Cu-Fe-PAA-g-PTF is 2.87, much more than 1.0,suggesting that PAA-g-PTF has much higher affinity forCu(II) ions than Fe(III) ions at the same conditions. Moreimportantly, D180% and TOC removal % of dye degradationin the presence of the bimetal PAA-g-PTFE complexes ismuch higher than those in the presence of the monometalPAA-g-PTE complexes, and the maximum D180% and TOCremoval % was achieved for Cu-Fe-PAA-g-PTFE (ii). Theseresults confirm that catalytic activity of metal PAA-g-PTFEcomplexes depends highly upon their Cu/Fe molar ratio,and Cu-Fe-PAA-g-PTFE (ii) with a Cu/Fe molar ratio of2.87 shows the best catalytic activity at alkaline pH medium.This demonstrates the existence of synergetic effect betweenloaded Fe(III) and Cu(II) ions in the bimetal PAA-g-PTFEcomplexes, which improved their catalytic activity to a greatextent. The main reason may be that the H2O2 moleculesabsorbed on the surface of Cu-Fe-PAA-g-PTFE can reduceFe(III) to Fe(II) ions through the Fenton-like process undervisible light irradiation, and the generated Fe(II) ionsare then oxidized by H2O2 to complete the Fe(III)/Fe(II)ions cycle and produce hydroxyl radicals. Meanwhile, theformed Fe(II) ions can also react with the loaded Cu(II)ions to form the Cu(I) and Fe(III) ions (5) to acceleratethe transformation of Fe(III)/Fe(II) ions and Cu(II)/Cu(I)ions in Cu-Fe-PAA-g-PTFE, thus giving rise to additionalhydroxyl radicals during the degradation:
Fe3+/PTFE + Cu+/PTFE Fe2+/PTFE + Cu2+/PTFE. (5)
3.5. Metal Ions Leaching from the Catalyst. One problem withthe heterogeneous photocatalysts is metal leaching from thecatalyst that causes secondary contamination to wastewaterin pilot-scale application. The leaching concentrations ofmetal ions from metal PAA-g-PTFE complexes in solutionwere measured. The results indicated that metal ions werecontinuously leached out from the complexes after thereaction started, and the final measured concentrations ofboth metal ions in the solution within 300 min at differentpH levels were shown in Tables 2 and 3.

International Journal of Photoenergy 7
Table 1: Effect of Cu/Fe molar ratio of the catalysts on dye decomposition.
SamplesCM (mol L−1) QM-PTFE (mmol L−1) Cu/Fe D180% TOC Removal %
Fe(III) Cu(II) Fe(III) Cu(II) Total
Fe-PAA-g-PTFE 0.100 0.000 1.89 0.00 1.89 0 47.3 37.3
Cu-Fe-PAA-g-PTFE (i) 0.075 0.025 1.13 0.75 1.88 0.66 61.2 54.6
Cu-Fe-PAA-g-PTFE (ii) 0.050 0.050 0.54 1.55 2.09 2.87 84.6 72.7
Cu-Fe-PAA-g-PTFE (iii) 0.025 0.075 0.31 1.75 2.06 5.65 78.4 56.7
Cu-PAA-g-PTFE 0.000 0.100 0.00 1.98 1.98 / 51.9 45.1
Table 2: Leaching of Fe ions from Fe-PAA-g-PTFE with differentQFe values.
Fe-PAA-g-PTFEFe(III) ions concentration in solution
(mg L−1)
pH = 3 pH = 7 pH = 9
QFe = 0.432 mmol L−1 0.49 0.37 0.07
QFe = 0.955 mmol L−1 0.72 0.57 0.15
QFe = 1.743 mmol L−1 0.95 0.73 0.22
QFe = 2.183 mmol L−1 1.22 0.94 0.43
QFe = 2.421 mmol L−1 1.53 1.23 0.57
Table 3: Impact of Cu/Fe molar ratio on leaching of metal ionsfrom Cu-Fe bimetallic PTFE fiber complexes.
SamplesMetal ions concentration in solution (mg L−1)
pH = 3 pH = 7 pH = 9
Fe(III) Cu(II) Fe(III) Cu(II) Fe(III) Cu(II)
Fe-PAA-g-PTFE 0.93 0.00 0.82 0.00 0.29 0.00
Cu-Fe-PAA-g-PTFE(i)
0.63 0.35 0.53 0.29 0.19 0.12
Cu-Fe-PAA-g-PTFE(ii)
0.21 0.76 0.13 0.49 0.06 0.24
Cu-Fe-PAA-g-PTFE(iii)
0.17 0.92 0.10 0.45 0.08 0.19
Cu-PAA-g-PTFE 0.00 1.25 0.00 0.89 0.00 0.31
It can be noticed from Table 2 that increasing QFe
value is accompanied by increasing Fe ion concentrationin solution at three investigated pH levels. This meansthat Fe-PAA-g-PTFE with higher QFe value can leach moreFe(III) ions than that with lower QFe value. It is obviousfrom the results shown in Table 3 that Fe(III) and Cu(II)ion concentrations in solution are much affected by Cu/Femolar ratio of the complexes. On the other hand, higherpH level caused a gradual decrease in leached Fe(III) orCu(II) ion concentration in solution, revealing that metalions leaching from the complexes is dependent on thesolution pH. Moreover, it should be pointed out that thefinal leached concentration of Fe(III) or Cu(II) ions is lowerthan 1.0 mg L−1 for both complexes, especially at pH 7 and 9.This result implies that both metal ions were attached on thesurface of the modified PTFE via the hydroxyl group. Thus,these complexes can be regarded as the effective and stableheterogeneous photocatalysts for the dye degradation over abroad pH range due to a minimal threshold concentration
of 3–15 mg L−1 Fe which allows the homogeneous Fentonreaction to proceed within a reasonable period of time.Additionally, it is well known that Cu ion is hazardous toboth marine animals and humans. The discharge standardwas suggested by the Environmental Protection Agency is1.0 mg L−1 [18], which is higher than the final leachedconcentration of Cu(II) ions for Cu-Fe bimetallic PTFE fibercomplexes except Cu-Fe-PAA-g-PTFE (iii) and Cu-PAA-g-PTFE.
4. Conclusions
The novel heterogeneous photo-Fenton catalysts were pro-duced by a modification of PTFE fibers through graftpolymerization of acrylic acid to introduce the carboxylgroups onto the fiber surface, which were used to coordinatewith transition metal ions (Fe(III) and Cu(II)) or raremetal ion (Ce(III)). Increasing metal ion concentrations insolution and grafting degree of PTFE fiber as well as highercoordination temperature could lead to a significant increasein metal content, especially Fe(III) and Cu(II) content of thecatalysts. Moreover, Fe(III) and Cu(II) ions reacted with themodified PTFE fibers more easily than Ce(III) ion at thesame conditions to form the complexes with higher metalcontent. Fe(III) ions fixed on the fiber showed a much power-ful catalytic performance for the decomposition of H2O2 andthe oxidative degradation of the dye than Cu(II) and Ce(III)ions fixed when three different complexes with similar metalcontent being employed as the catalysts, respectively. Also,taking into the toxicity of Cu (II) and Ce(III) ions and thecheapness of iron salt, thus, Fe(III) modified PTFE fibercomplex was proposed to act as an effective catalyst for thedye degradation under visible irradiation. And increasingFe content could remarkably improve the catalytic activityof the complex. Comparing with the three monometalliccomplexes, Cu-Fe bimetallic modified PTFE fiber complexesexhibited the excellent catalytic activity because of theexistence of synergetic effect between Fe(III) and Cu(II) ions.Their catalytic activity depended highly on Cu/Fe molarratio. 2.87 is the optimum Cu/Fe molar ratio to obtain thebest catalytic activity for the bimetallic complexes. However,increasing the amount of Fe(III) or/and Cu(II) ions fixed onthe fibers resulted in the relatively higher concentrations ofboth ions leaching from them, especially at low pH ranges.To sum up, the highest dye degradation efficiency and theaccepted concentrations of metal ions leaching from thecomplexes were found when it was prepared with a mixture
8 International Journal of Photoenergy
of 0.05 mol L−1 Fe(III) and 0.05 mol L−1 Cu(II) ions at 50◦Cby poly acrylic acid grafted PTFE fiber as the supportedmaterial using a simple exhausting method.
Acknowledgments
The authors thank the Tianjin Municipal Science and Tech-nology Committee for a Research Program of ApplicationFoundation and Advanced Technology (11JCZDJ24600).This research was also supported in part by a Grant from theNatural Science Foundation of China (20773093).
References
[1] V. V. Ishtchenko, K. D. Huddersman, and R. F. Vitkovskaya,“Part 1. Production of a modified PAN fibrous catalystand its optimisation towards the decomposition of hydrogenperoxide,” Applied Catalysis A, vol. 242, no. 1, pp. 123–137,2003.
[2] V. V. Ishtchenko, R. F. Vitkovskaya, and K. D. Huddersman,“Investigation of the mechanical and physico-chemical prop-erties of a modified PAN fibrous catalyst,” Applied Catalysis A,vol. 242, no. 2, pp. 221–231, 2003.
[3] R. F. Vitkovskaya, I. G. Rumynskaya, E. P. Romanova, and L. Y.Tereshchenko, “Fibre catalyst from modified polyacrylonitrilefibres,” Fibre Chemistry, vol. 35, no. 3, pp. 202–207, 2003.
[4] Z. Han, Y. Dong, and S. Dong, “Copper-iron bimetal modifiedPAN fiber complexes as novel heterogeneous Fenton catalystsfor degradation of organic dye under visible light irradiation,”Journal of Hazardous Materials, vol. 189, no. 1-2, pp. 241–248,2011.
[5] Y. Dong, Z. Han, S. Dong, J. Wu, and Z. Ding, “Enhanced cat-alytic activity of Fe bimetallic modified PAN fiber complexesprepared with different assisted metal ions for degradation oforganic dye,” Catalysis Today, vol. 175, no. 1, pp. 299–309,2011.
[6] Z. Han, Y. Dong, and S. Dong, “Comparative study on themechanical and thermal properties of two different modifiedPAN fibers and their Fe complexes,” Materials and Design, vol.31, no. 6, pp. 2784–2789, 2010.
[7] S. Parra, I. Guasaquillo, O. Enea et al., “Abatement of anazo dye on structured C-Nafion/Fe-ion surfaces by photo-Fenton reactions leading to carboxylate intermediates with aremarkable biodegradability increase of the treated solution,”The Journal of Physical Chemistry B, vol. 107, no. 29, pp. 7026–7035, 2003.
[8] S. Wu, E. T. Kang, K. G. Neoh, H. S. Han, and K. L.Tan, “Surface modification of poly(tetrafluoroethylene) filmsby graft copolymerization for adhesion improvement withevaporated copper,” Macromolecules, vol. 32, no. 1, pp. 186–193, 1999.
[9] M. C. Zhang, E. T. Kang, and K. G. Neoh, “Consecutivegraft copolymerization of glycidyl methacrylate and aniline onpoly(tetrafluoroethylene) films,” Langmuir, vol. 16, no. 24, pp.9666–9672, 2000.
[10] Q. Zhang, S. Zhang, S. Chen, P. Li, T. Qin, and S. Yuan,“Preparation and characterization of a strong basic anionexchanger by radiation-induced grafting of styrene ontopoly(tetrafluoroethylene) fiber,” Journal of Colloid and Inter-face Science, vol. 322, no. 2, pp. 421–428, 2008.
[11] C. Xiong and C. Yao, “Preparation and application of acrylicacid grafted polytetrafluoroethylene fiber as a weak acid cation
exchanger for adsorption of Er(III),” Journal of HazardousMaterials, vol. 170, no. 2-3, pp. 1125–1132, 2009.
[12] J. F. Wei, Z. P. Wang, J. Zhang, Y. Y. Wu, Z. P. Zhang,and C. H. Xiong, “The preparation and the application ofgrafted polytetrafluoroethylene fiber as a cation exchanger foradsorption of heavy metals,” Reactive and Functional Polymers,vol. 65, no. 1-2, pp. 127–134, 2005.
[13] M. Cheng, W. Song, W. Ma et al., “Catalytic activity of ironspecies in layered clays for photodegradation of organic dyesunder visible irradiation,” Applied Catalysis B, vol. 77, no. 3-4,pp. 355–363, 2008.
[14] N. M. El-Sawy and F. Al Sagheer, “Radiation-induced graftpolymerization of acrylic acid onto poly(tetrafluoroethylene-perfluorovinyl ether) copolymer films: complexation withsome transition metals and biological activity,” EuropeanPolymer Journal, vol. 37, no. 1, pp. 161–166, 2001.
[15] I. A. Sengil and M. Ozacar, “Biosorption of Cu(II) from aque-ous solutions by mimosa tannin gel,” Journal of HazardousMaterials, vol. 157, no. 2-3, pp. 277–285, 2008.
[16] C. Xiong, C. Yao, and X. Wu, “Adsorption of rhenium(VII) on4-amino-1,2,4-triazole resin,” Hydrometallurgy, vol. 90, no. 2–4, pp. 221–226, 2008.
[17] G. Henrici-Olive and S. Olive, Coordination and Catalysis,Chemie, Weinheim, Germany, 1977.
[18] F. L. Y. Lam, A. C. K. Yip, and X. Hu, “Copper/MCM-41as a highly stable and pH-insensitive heterogeneous photo-Fenton-like catalytic material for the abatement of organicwastewater,” Industrial and Engineering Chemistry Research,vol. 46, no. 10, pp. 3328–3333, 2007.
[19] M. Neamtu, A. Yediler, I. Siminiceanu, and A. Kettrup,“Oxidation of commercial reactive azo dye aqueous solutionsby the photo-Fenton and Fenton-like processes,” Journal ofPhotochemistry and Photobiology A, vol. 161, no. 1, pp. 87–93,2003.

Hindawi Publishing CorporationInternational Journal of PhotoenergyVolume 2012, Article ID 694721, 8 pagesdoi:10.1155/2012/694721
Research Article
Potential of Ceria-Based Catalysts for the Oxidation ofLandfill Leachate by Heterogeneous Fenton Process
E. Aneggi,1 V. Cabbai,1 A. Trovarelli,2 and D. Goi3
1 Department of Chemistry, Physics and Environment, University of Udine, Via del Cotonificio, 108-331100 Udine, Italy2 Catalysis Group, Department of Chemistry, Physics and Environment, University of Udine, Via del Cotonificio,108-331100 Udine, Italy
3 Civil Environmental Group, Department of Chemistry, Physics and Environment, University of Udine, Via del Cotonificio,108-331100 Udine, Italy
Correspondence should be addressed to D. Goi, [email protected]
Received 26 May 2012; Accepted 22 July 2012
Academic Editor: Meenakshisundaram Swaminathan
Copyright © 2012 E. Aneggi et al. This is an open access article distributed under the Creative Commons Attribution License,which permits unrestricted use, distribution, and reproduction in any medium, provided the original work is properly cited.
In this study, ceria and ceria-zirconia solid solutions were tested as catalyst for the treatment of landfill leachate with a Fenton-likeprocess. The catalysts considered in this work were pure ceria and ceria-zirconia solid solutions as well as iron-doped samples. Allthe catalysts were extensively characterized and applied in batch Fenton-like reactions by a close batch system, the COD (chemicaloxygen demand) and TOC (total organic carbon) parameters were carried out before and after the treatments in order to assayoxidative abatement. Results show a measurable improvement of the TOC and COD abatement using ceria-based catalysts inFenton-like process and the best result was achieved for iron-doped ceria-zirconia solid solution. Our outcomes point out thatheterogeneous Fenton technique could be effectively used for the treatment of landfill leachate and it is worth to be the object offurther investigations.
1. Introduction
Landfill leachate is a liquid waste of primary environmen-tal concern because of the quantity and quality of theharmful pollutants contained in it. There are a large num-ber of various types of organic and inorganic substances,depending on the age and type of solid wastes located in thelandfill. Leachate from sanitary landfills can be an importantsource of ground water contamination and for this reasonit is collected from the bottom of the landfill to be treated;further, this highly contaminated liquid waste accumulatesa great diversity of harmful pollutants. Some of them areparticularly refractory and for this reason traditional wastew-ater treatment plants are not efficient in their abatement.Inorganic and organic content of leachate is characteristicallyrelated to environmental risk because of scarce biodegrada-tion, severe bioaccumulation, and potential health damages[1, 2]. It is well known that conventional biological liquidwaste treatments alone are unable to achieved completeremoval of the leachate pollution over the life of the landfill.
In truth conventional biological processes are time consum-ing and low-efficiency methods to treat directly leachate,consequently physicochemical processes are frequently uti-lized to pretreat this liquid waste in order to reduce organicrefractory before biological action in treatment plants units[3].
The most employed and studied methods in landfillleachate pretreatment are chemical or electrochemical coag-ulation [4], precipitation [5], and oxidation [6, 7]. Amongthese, a particular attention is given to oxidation techniquesand especially to advanced oxidation processes (AOPs).
AOPs are methods able to convert nonbiodegradableorganic pollutants into nontoxic biodegradable forms [8, 9],by the production of highly oxidizing hydroxyl radical speciesthat promptly oxidize organic pollutants by a broad range ofactions.
As a matter of fact oxidation by hydroxyl radicals speciescan be activated starting from H2O2 by intervention oftransition metal salts (e.g., iron salts) [10], from ozone [11]or UV-light [12], leading to a more effective method to
2 International Journal of Photoenergy
decompose certain refractory contaminants of leachate. Inparticular, Fenton oxidation is a well-known AOP used aspretreatment of leachate worldwide [10].
The Fenton’s reagent works at mild temperature andpressure generating hydroxyl radicals following the generallyaccepted structure of reactions:
Fe2+ + H2O2 −→ Fe3+ + OH• + OH−
RH + OH• −→ H2O + R•
R• + Fe3+-oxidation −→ R+ + Fe2+
(1)
This reaction is followed by other very complex oxidationreactions in which a lot of radical forms are generated andtake part in the overall Fenton oxidation. The H2O2 can actboth as a scavenger or initiator, all organics in liquid wastecan participate in radical generation [10] and the ferric ironcatalyzes and decomposes H2O2 to additional radical formscontributing to the oxidation [13]. Moreover, the reaction offerrous iron forms ferric hydroxo complexes which can con-tribute to the coagulation capacity of the Fenton reagent [14].The reactions including hydrogen peroxide and ferric ions orother transition metal ions are also reported as Fenton-likereactions [15, 16]; moreover, some new wet peroxidations,in which various catalysts are added with hydrogen peroxideto remove organic compounds by low temperature reactions,are presented as heterogeneous Fenton-like systems [17–19].
The Fenton process is one of the most interesting AOPswhen it is used to treat or pretreat heavily contaminatedliquid wastes, and a lot of full-scale applications are installedover the world. The main advantage is to reach treatment ofliquid wastes at mild conditions of temperature and pressure,but the most important drawback is the production of asludge which needs to be treated as well. It is also a recognizedconcept that Fenton process, at reasonable reagents concen-tration, cannot lead to the complete mineralization of allorganic compounds and often only partial oxidation occurseven in assisted oxidations [20].
Leachate treatment by classic Fenton process was oftenstudied to assay potential increase of the biodegradabilityor reduction of toxicity or color removal [21–23]. Recently,photo-Fenton [24] and electro-Fenton [25] processes havebeen investigated for landfill leachate treatment and severalstudies have been dedicated to heterogeneous Fenton treat-ment of phenolic [19, 26, 27] or industrial wastewater [28–31]. Heterogeneous process could be a promising alternativedue to the more important drawback of classic Fenton, thelarge amount of iron required for the reaction that dra-matically exceeds the legally quantity permitted for effluentdischarge (<2 mg/L) and consequently requires a final wastemanagement. At present, at the best of our knowledge,only one experience is reported about leachate treatment byheterogeneous catalytic Fenton-like systems [32], which canpotentially be a promising way to activate radicals oxidizingspecies with minor sludge production. The experiencereported in this paper tries to give a contribution to thistheme.
The use of ceria-based materials in catalytic science iswell established [33, 34]. Ceria is presently used in a large
number of industrial processes and it accounts for a largepart of the rare earth oxide market. Undoubtedly, its majorcommercial application is in the treatment of emissions frominternal combustion engines where ceria-based materialshave been used in the past 30 years [35]. Its more importantaction in three-way catalysts (TWCs) is to take up and releaseoxygen following variations in the stoichiometric composi-tion of the feedstream; however, several other processes alsobenefit from the use of cerium and its derivates. Organosolu-ble compounds of cerium are used as fuel additives for dieselengines and industrial boilers to reduce carbon deposits aftercombustion. Cerium oxide is used also as a catalyticallyactive component to oxidize the liquid portion of particulatepresent in diesel engine exhaust. CeO2 is also used as anadditive or a promoter in commercial applications such asfluid catalytic cracking, ammoxidation and dehydrogenationprocesses [33–37]. Moreover, in the last years several ceria-based catalysts were investigated for CWAO (catalytic wetair oxidation) [38–40] and CWOP (catalytic wet peroxideoxidation) [41–44] techniques. The main purpose of thiswork is to investigate doped ceria materials in the treatmentof landfill leachate by a heterogeneous Fenton process.
2. Materials and Methods
2.1. Characterization and Sampling of Landfill Leachate. Theleachate used in this study was drawn from an aged landfillnear the city of Udine (northeast Italy); the landfill is notequipped with a recirculation system and it produces a stableleachate with high concentrations of COD and low BOD/COD ratio with a brown-green color. All the measures arecarried out following the Standard Methods for the Examina-tion of Water and Wastewater [45], COD was determined bycolorimetric method utilizing a Hach Lange-DR 5000 spec-trophotometer and quenching measurable residual H2O2
to prevent interference by addition of MnO2(s). ResidualH2O2 was checked and determined to be zero by using teststrips (Peroxide test sticks Quantofix, Sigma Aldrich). TheTOC analyses were performed by a TOC-VCPN, Shimadzuanalyzer.
2.2. Preparation and Characterization of the Catalysts.The catalysts, ceria (CeO2, CZ100), ceria-zirconia solidsolutions (Ce0.44Zr0.56O2, CZ44) and Fe-doped materials(Ce0.85Fe0.15O1.925, CF and Ce0.45Zr0.40Fe0.15O1.925, CZF) wereprepared by coprecipitation starting from nitrates. Precipi-tates were dried at 393 K and calcined at 773 K for 2 h. Fe-doped materials were also calcined at higher temperature(1073 K) to investigate the behavior of iron-phase in thesystem.Textural characteristics of all samples were measuredaccording to the BET method by nitrogen adsorption at 77 K,using a Tristar 3000 gas adsorption analyzer (Micromeritics).
Structural features of the catalysts were characterized byX-ray diffraction (XRD). XRD patterns were recorded on aPhilips X’Pert diffractometer operated at 40 kV and 40 mAusing nickel-filtered Cu-Kα·
radiation. Spectra were collected
using a step size of 0.02◦ and a counting time of 40 s perangular abscissa in the range 20◦–145◦. The Philips X’Pert

International Journal of Photoenergy 3
Water cooling
Pressure Gauge
Sampleoutlet
Heating
TemperaturecontrolCooling
Control panel
Outlet water cooling
StirringGas
Gas outlet V2
V1
V3
Figure 1: Schematic representation of the batch oxidation reactor used for tests.
HighScore software was used for phase identification. Themean crystalline size was estimated from the full width at thehalf maximum (FWHM) of the X-ray diffraction peak usingthe Scherrer equation [46] with a correction for instrumentline broadening. Rietveld refinement [47] of XRD patternwas performed by means of GSAS-EXPGUI program [48,49]. The accuracy of these values was estimated by checkingtheir agreement against the values of the lattice constant,assumed to comply with the Vegard’s law [50].
In order to evaluate the oxygen/storage capacity (OSC)of samples TGA, experiments in Ar/H2 (5%) flow (total flow100 mL/min) were carried out. Each sample was treated in N2
atmosphere for 1 h at 553 K. Then, it was heated at a constantrate (10 K/min) till 673 K and kept at this temperature for15 minutes, to eliminate the absorbed water. Finally, Ar/H2
mixture was introduced while keeping the temperature at673 K for 30 minutes. The observed weight loss is due tooxygen removal by H2 to form water, and it can be associatedto total oxygen storage capacity at that temperature [51, 52].
2.3. Catalytic Activity
2.3.1. Heterogeneous Fenton. A pressure vessel (Parr Instru-ments) equipped with a glass batch reactor with continuousstirring (400 rpm) (Figure 1) was used to carry out Fenton-like oxidative reactions. The experiments were conductedfor 120 minutes at 343 K stirring 100 mL of leachate with10 mg of catalysts and 5 mL of H2O2 (3%). At the end ofthe reaction (2 hours), samples were taken out and analyzed.Each experiment was repeated three times to obtain thereproducibility (error bars are included in figures).
3. Results and Discussion
3.1. Textural and Structural Characterization. The leachateselected to test oxidative Fenton-like process was character-ized by a small concentration of iron in the raw mixture,
Table 1: Characterization of the landfill leachate used in this study.
Parameter Unit of measurement Values
pH — 9
BOD5 mg O2/L 60
COD mg O2/L 2500
BOD5/COD — 0.024
TN mg N/L 1860
TOC mg C/L 575
AOS — −2.52
ΔOD mg O2/L 0.38
Ammonia mg NH4+/L 2150
Chloride mg Cl−/L —
Color PtCo unit 3600
Total iron mg Fe/L 1.2
Nitrate mg NO3/L —
Orthophosphate mg PO43−/L 60
Sulfate mg SO42−/L —
a high pH value, a slight high value of COD and TOC ifcompared to average values of other old landfill leachate [53].The main properties are described in Table 1.
Textural and structural characterization of all catalysts isreported in Table 2. Materials have surface area in the range55–135 m2/g. Ceria-zirconia solid solutions (CZ44 and CZF)show higher surface area with respect to ceria-based samples(CZ100 and CF) due to the stabilization effect of zirconia.
The introduction of ZrO2 significantly enhances texturalproperties, indeed, sintering in ceria-zirconia is less impor-tant in accordance with its better thermal resistance [54].
Doping ceria has a significant positive effect on thecatalytic, oxygen storage/redox and thermal properties ofcatalysts. The introduction of Zr4+ induces a structuralmodification and this factor plays a key role in the redox

4 International Journal of Photoenergy
Table 2: Characteristics of catalysts used in this study and crystallographic parameters of modified ceria samples as obtained from Rietveldrefinement and Vegard’s law.
Sample Composition BET surface area (m2/g) Crystallite size (nm)a PhaseCell parameter
a = b = c (A) From Vegard’s law
CZ100 CeO2 53 7 Cubic 5.411 (1) 5.411
CZ44 Ce0.44Zr0.56O2 90 4.7 Cubic 5.281 (1) 5.285
CF Ce0.85Fe0.15O1.925 77 7.5 Cubic 5.396 (1) 5.263
CF (1073 K) Ce0.85Fe0.15O1.925 22 31.1 Cubic 5.408 (1) 5.263
CZF Ce0.45Zr0.40Fe0.15O1.925 132 3.5 Cubic 5.295 (1) 5.163
CZF (1073 K) Ce0.45Zr0.40Fe0.15O1.925 22 8.9 Cubic 5.292 (1) 5.163aCalculated with Scherrer formula from X-ray diffraction patterns.
behaviour of ceria-zirconia solid solutions. The substitutionof Ce4+ with Zr4+ produces a contraction of the cell volumeand induces stress in the structure and consequently struc-tural defects that increase the oxygen mobility. It is importantto point out that the oxygen mobility is increased if no mod-ification in the structure of solid solution is observed. Fromthese considerations, we noted that better performances areachieved for solid solutions with cubic symmetry and with ahigh level of Zr4+. Alternatively, a higher amount of ZrO2
decreases the number of redox sites and consequently theactivity of the system. There is an inverse relationshipbetween the two effects; in order to obtain an active system itis important to balance the amount of structural defects andthe amount of ceria. Literature data suggest that better resultsare obtained for compositions between CZ50 and CZ90 [55–58].
The structural features of all samples were analyzed byXRD.
In CeO2-ZrO2 system, several phases could be formed,depending on preparation conditions and concentration ofsingle-oxide constituents [59]. In general, for a CeO2 con-tent <20 mol% a single-phase monoclinic cell is observed,while in CeO2-rich compositions (CeO2 > 70 mol%) solidsolutions of cubic symmetry are formed. At intermediatelevels, regions of tetragonal (t, t′, and t′′ phases) and cubicsymmetry coexist in the phase diagram, their formationdepending on the preparation method used. In our case, theRietveld analysis of the diffraction profile of the materials hasbeen carried out by opening the fitting to cubic, tetragonaland a mixture of the two.
As shown in Table 2, XRD measurements suggest that forbinary ceria-zirconia samples with cerium content greaterthan 40 mol% the formation of a cubic fluorite lattice isfavored, in accordance with the literature [60]. Thus, ourceria and ceria-zirconia solid solution crystallize in a cubicfluorite structure of Fm3m symmetry. In CZ44, no peaksplitting that would indicate the presence of two phases couldbe detected, and therefore, the diffraction patterns demon-strate the formation of a single solid solution-like ceria-zirconia phase. This cannot exclude the presence of differentarrangements of oxygen sublattice or the presence of a mul-tiphase system at a nanoscale level, not detected by XRD.In fresh samples doped with Fe, XRD features allow todetect only the CeO2 or Ce0.44Zr0.56O2 cubic phase Fm3m,while Fe2O3 or other iron oxide phases are not visible
(Figure 2(a)). XRD peaks are broad and the values ofcrystallite size obtained according to Scherrer equation areabout 7.5 nm for sample CF and 3.5 nm for sample CZF. Inorder to understand better the structural properties of Fe-doped system, CF and CZF catalysts were calcined at highertemperatures (1023 K).
After calcination, in the XRD profile of CF, peaksassigned to rhombohedral Fe2O3 (hematite) with R-3c sym-metry are visible (Figure 2(b)).
The lack of peak due to iron oxide in fresh CF samplescould indicate the formation of solid solution between Ceand Fe. However, a comparison between lattice parametersretrieved from Rietveld refinement and from Vegard law(values of cell parameter expected if all the iron containedwere dissolved in the lattice) indicates that only a smallpercentage of iron is dissolved in ceria (Table 2).
After aging, the increase of cell parameter indicates asegregation of the iron eventually dissolved in the lattice withformation of weak signal due to crystalline Fe2O3. It is knownthat lower valence ions such as Fe3+ are extremely difficultto dissolve into the ceria lattice, especially when treating athigh temperature [61]. Mutual dissolution of Ce and Fe intoFe2O3 and CeO2 has been reported to exist in Fe-rich Ce/Femixed oxides prepared by coprecipitation [62].
For CZF, the value of cell parameter retrieved by Rietveldrefinement is not in agreement with that computed fromVegard’s law: the adding of a cation (Fe3+) with ionic radiussmaller than Ce4+ and Zr4+ should produce a decrease incell volume in the case of a solid solution. Conversely, weobserve a value higher than expected indicating that Fe2O3
is probably deposited on the surface. Moreover, iron couldbe present as interstitial and/or extralattice or amorphousinterparticle iron. As in the case of pure ceria, we cannotexclude that a small fraction of Fe is dissolved within ceria-zirconia framework.
3.2. Catalytic Activity. We investigated the heterogeneousprocess on different ceria-based catalysts performing reac-tions at 343 K for 2 hours, without any pH correction of theleachate (pH 9). Preliminary tests were carried out in orderto verify the activity of catalyst and/or H2O2. In absence ofcatalyst and H2O2 (Figure 3), the abatement of COD andTOC, due only to the thermal treatment at 343 K, is small,respectively 1% and 14%.

International Journal of Photoenergy 5
20 30 40 50 60 70 80
Inte
nsi
ty (
a.u
.)
2 ( )
CF
CZF
(a)
Inte
nsi
ty (
a.u
.)
20 30 40 50 60 70 80
2 ( )
CF
CZF
(b)
Figure 2: XRD profile for fresh (a) and aged (b) iron-dopedsamples (�: CeO2 and CeZrO2; �: Fe2O3).
As shown in the plot, the advantage of the addition, forthe abatement of COD and TOC, of bare ceria is negligible.In absence of the catalyst, but with 5 mL of H2O2 (3%),a small improvement in the activity was observed dueto the oxidation capacity of the hydrogen peroxide alone.This activity could be explained considering that the smallamount of iron presented in the leachate (Table 1) can inter-act with H2O2 (Fe/H2O2 ratio was 1 : 687) catalyzing theformation of •OH radicals as in the homogeneous Fenton.When pure ceria and hydrogen peroxide were used in com-bination, the catalytic activity was further improved reachingan abatement of COD and TOC of 7% and 30%, respectively,confirming the positive synergic action of the two agents inthe heterogeneous Fenton-like process. From these prelimi-nary tests, we can conclude that ceria alone is not active and
Leachate H2O2 CZ100 CZ100 + H2O2
0
10
20
30
40
50
60
Aba
tem
ent
(%)
Figure 3: COD (light grey) and TOC (black) abatement for reactionwith and without catalyst and H2O2 (reaction conditions: 10 mg ofcatalyst, 5 mL of H2O2, pH = 9, T = 343 K).
CZ100 CF CZ44 CZF0
10
20
30
40
50
60
Aba
tem
ent
(%)
Sample
Figure 4: COD (light grey) and TOC (black) abatement for dif-ferent catalysts (reaction conditions: 10 mg of catalyst, 5 mL ofH2O2, pH = 9, T = 343 K).
a synergic action between catalyst and hydrogen peroxide isnecessary to obtain higher performance.
After blank tests, the activity of the four ceria-basedcatalysts (CZ100, CZ44, CF, and CZF) was investigated andthe results are shown in Figure 4.
Ceria and ceria-zirconia solid solutions show very similarresults. The catalytic activity of ceria-based systems could

6 International Journal of Photoenergy
be attributed to the capacity of cerium oxide to decomposeH2O2, as reported in a previous study in which the decom-position of hydrogen peroxide, with formation of radicalspecies, in an aqueous suspension of CeO2 was investigated[63]. The mechanism for H2O2 decomposition in the pres-ence of water-oxide interfaces is still not completely eluci-dated, but it was suggested that it occurs on the surface withOH or HO2 radicals production.
The catalytic activity of cerium oxide is correlated withits oxygen storage capacity. One of the most important rolesof CeO2 in catalytic redox reactions is to provide surfaceactive sites [64] and to act as an oxygen storage/transportmedium by its redox cycle between Ce4+ and Ce3+. That is,the presence of surface active oxygens from one side and theoxygen storage capacity from the other are among the mostimportant factors to be considered. These, in turn, arestrongly influenced by surface area and surface/bulk compo-sition.
As pointed out previously, doping ceria with Zr4+
increase, the oxygen mobility, but a higher amount of ZrO2
decreases the number of redox sites and consequently theactivity of the system. In order to explain the activity of thetwo systems, we need to take into account the right com-bination of surface area and composition.
For this reason, it is important to correlate overall activitywith total available surface active oxygens, TSAO (which arelinearly dependent on the amount of ceria) and total oxygenstorage capacity, OSC (which generally shows a volcano-type relation with composition). The number of total surfaceoxygens (TSO) has been estimated according to Madier et al.[65] starting from the structure and the molar compositionof the oxide considering the exposure of (100), (110), and(111) surfaces and assuming that Zr atoms do not participatein the redox process. The number of total surface availableoxygens (TSAO) represents a fraction of total surface oxygensconsidering that only one atom out of four is involved inthe Ce4+-Ce3+ redox process [65–67]. OSC data collectedaccording to the method described in the experimental.Results are reported in Table 3.
Even though CZ100 has a lower surface area, pure ceriaand CZ44 show almost the same value of TSAO (225 μmolO/g and 182 μmol O/g, resp.). A more pronounced differencewas found in OSC (1669 μg O2/g and 3721 μg O2/g forCZ100 and CZ44, resp.) that takes into account surface andbulk oxygens. In both catalysts, the surface area is quitehigh, consequently the abstraction of oxygen involves mainlysurface sites, with little or no participation of the bulk inthe reaction. Therefore, the more important factor is theavailability of surface oxygen. In our materials (CZ100 andCZ44), the availability of surface oxygen is almost the same;therefore the two systems, CZ100 and CZ44, exhibit a verysimilar catalytic activity in the treatment of landfill leachate.
For CZF, the simultaneously presence of iron andzirconia significantly increased the abatement of TOC (51%)but has no significant effect on COD.
CF sample is characterized by the formation of cubicceria-like solid solution where Fe cations are dissolved withinceria structure. In this case, the interaction takes place
Table 3: TSAO and OSC for CZ100 and CZ44.
Sample TSAO (μmol O/g) OSC (μg O2/g)
CZ100 225 1669
CZ44 182 3721
through the sharing of oxygen anion defined by the Fe–O–Ce bonds formed in the Fe-doped CeO2 lattice [62].
In CZF sample, the lack of these interactions due to thelower amount of ceria and consequently to the lower amountof Ce-Fe-O entities formed in the system, can explain thedifferent behavior of this catalyst. Indeed, in this case, ahigher amount of Fe (due to weaker interaction with Ce andto the amorphous Fe2O3 phase on the surface) is available forthe reaction with the leachate.
Our research pointed out the good activity of ceria-basedheterogeneous treatment and we can conclude that ceriabased catalyst is a very promising class of materials for thiskind of application.
Further studies will be dedicated to a better understand-ing of the mechanism of reaction of ceria-based catalyst andto the optimization of the reaction conditions and catalyticstability.
4. Conclusions
Our study shows that the heterogeneous Fenton processcould be successfully used in the treatment of landfill leachatesubstituting homogeneous treatment. Promising results wereobtained in leachate oxidation by a heterogeneous Fenton-like process over ceria-based catalysts with an abatement ofTOC higher than 50%.
This is just a first investigation into the potentiality ofheterogeneous reaction, but the results appear encouraging.In heterogeneous reactions, several variables are involved andneed to be completely understood for a good optimizationof the catalyst. Further studies will be dedicated to a betterunderstanding of the mechanism of reaction of ceria-basedcatalysts and the role of iron and zirconia in the reactionsand leaching. Moreover, we need to optimize the reactionconditions, such as pH, temperature, and catalyst/peroxideratio. Additional investigations should be performed inorder to deeply explore a promising technique such asheterogeneous Fenton. At the moment, several aspects needto be investigated in more detail, but the results open a newfield of research and point out a very interesting class ofcatalyst that could be used for landfill leachate treatment andworthy to be the subject of further investigations.
Acknowledgments
The authors thank financial support from AMGA Spa, Udineand Passavant Impianti Spa, Milan. They are also gratefulto Dott. Stefano Turco and Mr. Aldo Bertoni for laboratoryhelp.

International Journal of Photoenergy 7
References
[1] L. H. Keith and W. A. Teliard, “Priority pollutants: a perspec-tive view,” Environmental Science & Technology, vol. 13, pp.416–423, 1979.
[2] K. Knox and P. H. Jones, “Complexation characteristics ofsanitary landfill leachates,” Water Research, vol. 13, no. 9, pp.839–846, 1979.
[3] M. Hagman, E. Heander, and J. L. C. Jansen, “Advanced oxi-dation of refractory organics in leachate—potential methodsand evaluation of biodegradability of the remaining substrate,”Environmental Technology, vol. 29, no. 9, pp. 941–946, 2008.
[4] C. Papastavrou, D. Mantzavinos, and E. Diamadopoulos, “Acomparative treatment of stabilized landfill leachate: coagu-lation and activated carbon adsorption vs. electrochemicaloxidation,” Environmental Technology, vol. 30, no. 14, pp.1547–1553, 2009.
[5] N. Meunier, P. Drogui, C. Montane, R. Hausler, G. Mercier,and J. F. Blais, “Comparison between electrocoagulation andchemical precipitation for metals removal from acidic soilleachate,” Journal of Hazardous Materials, vol. 137, no. 1, pp.581–590, 2006.
[6] F. J. Rivas, F. Beltran, F. Carvalho, B. Acedo, and O. Gimeno,“Stabilized leachates: sequential coagulation-flocculation pluschemical oxidation process,” Journal of Hazardous Materials,vol. 116, no. 1-2, pp. 95–102, 2004.
[7] M. J. K. Bashir, M. H. Isa, S. R. M. Kutty et al., “Landfillleachate treatment by electrochemical oxidation,” Waste Man-agement, vol. 29, no. 9, pp. 2534–2541, 2009.
[8] E. Khan, R. W. Babcock, T. M. Hsu, and H. Lin, “Min-eralization and biodegradability enhancement of low levelp-nitrophenol in water using Fenton’s reagent,” Journal ofEnvironmental Engineering, vol. 131, no. 2, pp. 327–331, 2005.
[9] E. C. Catalkaya and F. Kargi, “Advanced oxidation of diuronby photo-fenton treatment as a function of operating param-eters,” Journal of Environmental Engineering, vol. 134, no. 12,pp. 1006–1013, 2008.
[10] E. Neyens and J. Baeyens, “A review of classic Fenton’speroxidation as an advanced oxidation technique,” Journal ofHazardous Materials, vol. 98, no. 1–3, pp. 33–50, 2003.
[11] P. Westerhoff, G. Aiken, G. Amy, and J. Debroux, “Relation-ships between the structure of natural organic matter andits reactivity towards molecular ozone and hydroxyl radicals,”Water Research, vol. 33, no. 10, pp. 2265–2276, 1999.
[12] S. Zhao, H. Ma, M. Wang et al., “Role of primary reactioninitiated by 254 nm UV light in the degradation of p-nitrophenol attacked by hydroxyl radicals,” Photochemical andPhotobiological Sciences, vol. 9, no. 5, pp. 710–715, 2010.
[13] J. De Laat and H. Gallard, “Catalytic decomposition of hydro-gen peroxide by Fe(III) in homogeneous aqueous solution:mechanism and kinetic modeling,” Environmental Science andTechnology, vol. 33, no. 16, pp. 2726–2732, 1999.
[14] S. H. Lin and C. C. Lo, “Fenton process for treatment ofdesizing wastewater,” Water Research, vol. 31, no. 8, pp. 2050–2056, 1997.
[15] S. Parsons, Advanced Oxidation Processes for Water and Waste-water Treatment, IWA publishing, Alliance House, London,UK, 2004.
[16] C. Jiang, S. Pang, F. Ouyang, J. Ma, and J. Jiang, “A new insightinto Fenton and Fenton-like processes for water treatment,”Journal of Hazardous Materials, vol. 174, no. 1–3, pp. 813–817,2010.
[17] M. D. Gurol and S. Lin, “Continuous catalytic oxidation pro-cesses,” US PATENT 5755977, 1998.
[18] S. Sabhi and J. Kiwi, “Degradation of 2,4-dichlorophenol byimmobilized iron catalysts,” Water Research, vol. 35, no. 8, pp.1994–2002, 2001.
[19] Y. F. Han, N. Phonthammachai, K. Ramesh, Z. Zhong, andT. I. M. White, “Removing organic compounds from aqueousmedium via wet peroxidation by gold catalysts,” Environmen-tal Science and Technology, vol. 42, no. 3, pp. 908–912, 2008.
[20] P. L. Huston and J. J. Pignatello, “Degradation of selectedpesticide active ingredients and commercial formulations inwater by the photo-assisted Fenton reaction,” Water Research,vol. 33, no. 5, pp. 1238–1246, 1999.
[21] Y. Deng and J. D. Englehardt, “Treatment of landfill leachate bythe Fenton process,” Water Research, vol. 40, no. 20, pp. 3683–3694, 2006.
[22] A. Goi, Y. Veressinina, and M. Trapido, “Fenton process forlandfill leachate treatment: evaluation of biodegradability andtoxicity,” Journal of Environmental Engineering, vol. 136, no. 1,pp. 46–53, 2010.
[23] T. Yilmaz, A. Aygun, A. Berktay, and B. Nas, “Removal of CODand colour from young municipal landfill leachate by Fentonprocess,” Environmental Technology, vol. 31, no. 14, pp. 1635–1640, 2010.
[24] E. M. R. Rocha, V. J. P. Vilar, A. Fonseca, I. Saraiva, and R.A. R. Boaventura, “Landfill leachate treatment by solar-drivenAOPs,” Solar Energy, vol. 85, no. 1, pp. 46–56, 2011.
[25] S. Mohajeri, H. A. Aziz, M. H. Isa, M. A. Zahed, and M.N. Adlan, “Statistical optimization of process parameters forlandfill leachate treatment using electro-Fenton technique,”Journal of Hazardous Materials, vol. 176, no. 1–3, pp. 749–758,2010.
[26] S. Navalon, R. Martin, M. Alvaro, and H. Garcia, “Gold ondiamond nanoparticles as a highly efficient fenton catalyst,”Angewandte Chemie—International Edition, vol. 49, no. 45, pp.8403–8407, 2010.
[27] R. Martın, S. Navalon, M. Alvaro, and H. Garcia, “Optimizedwater treatment by combining catalytic Fenton reaction usingdiamond supported gold and biological degradation,” AppliedCatalysis B, vol. 103, no. 1-2, pp. 246–252, 2011.
[28] A. G. Chakinala, P. R. Gogate, A. E. Burgess, and D. H. Brem-ner, “Industrial wastewater treatment using hydrodynamiccavitation and heterogeneous advanced Fenton processing,”Chemical Engineering Journal, vol. 152, no. 2-3, pp. 498–502,2009.
[29] I. Oller, S. Malato, and J. A. Sanchez-Perez, “Combination ofAdvanced Oxidation Processes and biological treatments forwastewater decontamination-A review,” Science of the TotalEnvironment, vol. 409, pp. 4141–4166, 2010.
[30] T. D. Nguyen, N. H. Phan, M. H. Do, and K. T. Ngo, “MagneticFe2MO4 (M:Fe, Mn) activated carbons: fabrication, char-acterization and heterogeneous Fenton oxidation of methylorange,” Journal of Hazardous Materials, vol. 185, no. 2-3, pp.653–661, 2011.
[31] N. Panda, H. Sahoo, and S. Mohapatra, “Decolourizationof Methyl Orange using Fenton-like mesoporous Fe2O3-SiO2
composite,” Journal of Hazardous Materials, vol. 185, no. 1, pp.359–365, 2011.
[32] L. A. Galeano, M. A. Vicente, and A. Gil, “Treatment of muni-cipal leachate of landfill by fenton-like heterogeneous catalyticwet peroxide oxidation using an Al/Fe-pillared montmoril-lonite as active catalyst,” Chemical Engineering Journal, vol.178, pp. 146–153, 2011.
[33] S. Bernal, J. Kaspar, and A. Trovarelli, “Recent progress incatalysis by ceria and related compounds—preface,” CatalToday, vol. 50, pp. 173–173, 1999.

8 International Journal of Photoenergy
[34] A. Trovarelli, Catalysis by Ceria and Related Materials, ImperialCollege Press, London, UK, 2002.
[35] A. Trovarelli, C. De Leitenburg, M. Boaro, and G. Dolcetti,“The utilization of ceria in industrial catalysis,” CatalysisToday, vol. 50, no. 2, pp. 353–367, 1999.
[36] A. Trovarelli, C. De Leitenburg, and G. Dolcetti, “Design bettercerium-based oxidation catalysts,” Chemtech, vol. 27, no. 6, pp.32–37, 1997.
[37] L. Vivier and D. Duprez, “Ceria-based solid catalysts fororganic chemistry,” ChemSusChem, vol. 3, no. 6, pp. 654–678,2010.
[38] N. D. Tran, M. Besson, C. Descorme, K. Fajerwerg, andC. Louis, “Influence of the pretreatment conditions on theperformances of CeO2-supported gold catalysts in the catalyticwet air oxidation of carboxylic acids,” Catalysis Communica-tions, vol. 16, no. 1, pp. 98–102, 2011.
[39] S. Yang, W. Zhu, Z. Jiang, Z. Chen, and J. Wang, “nfluenceof the structure of TiO2, CeO2, and CeO2-TiO2 supports onthe activity of Ru catalysts in the catalytic wet air oxidation ofacetic acid,” Rare Metals, vol. 30, pp. 488–495, 2011.
[40] J. J. Delgado, X. Chen, J. A. Perez-Omil, J. M. Rodrıguez-Izquierdo, and M. A. Cauqui, “The effect of reaction condi-tions on the apparent deactivation of Ce-Zr mixed oxides forthe catalytic wet oxidation of phenol,” Catalysis Today, vol.180, pp. 25–33, 2011.
[41] Y. Liu and D. Sun, “Effect of CeO2 doping on catalytic activityof Fe2O3/γ-Al2O3 catalyst for catalytic wet peroxide oxidationof azo dyes,” Journal of Hazardous Materials, vol. 143, no. 1-2,pp. 448–454, 2007.
[42] R. C. Martins, N. Amaral-Silva, and R. M. Quinta-Ferreira,“Ceria based solid catalysts for Fenton’s depuration of phe-nolic wastewaters, biodegradability enhancement and toxicityremoval,” Applied Catalysis B, vol. 99, no. 1-2, pp. 135–144,2010.
[43] S. Silva Martınez, J. Vergara Sanchez, J. R. Moreno Estrada,and R. Flores Velasquez, “FeIII supported on ceria as effectivecatalyst for the heterogeneous photo-oxidation of basic orange2 in aqueous solution with sunlight,” Solar Energy Materialsand Solar Cells, vol. 95, no. 8, pp. 2010–2017, 2011.
[44] P. A. Deshpande, D. Jain, and G. Madras, “Kinetics andmechanism for dye degradation with ionic Pd-substitutedceria,” Applied Catalysis A, vol. 395, no. 1-2, pp. 39–48, 2011.
[45] APHA, AWWA, and WEF, Standard Methods for the Exam-ination of Water and Wastewater, American Public HealthAssociation, American Water Works Association, Water Envi-ronment Federation, Washington, DC, USA, 20th edition,1999.
[46] R. Jenkins and R. Snyder, To X-Ray Powder Diffractometry,Wiley, New York, NY, USA, 1996.
[47] R. A. Young, The Rietveld Method IUCr, Oxford UniversityPress, New York, NY, USA, 1993.
[48] A. C. Larson and R. B. V. Dreele, General Structure AnalysisSystem ‘GSAS’, Los Alamos National Laboratory, 2000.
[49] B. H. Toby, “EXPGUI, a graphical user interface for GSAS,”Journal of Applied Crystallography, vol. 34, no. 2, pp. 210–213,2001.
[50] D. J. Kim, “Lattice-parameters, ionic conductivities, andsolubility limits in fluorite-structure MO2 Oxide [M = Hf4+,Zr4+, Ce4+, Th4+, U4+] Solid Solutions ,” Journal of theAmerican Ceramic Society, vol. 72, no. 8, pp. 1415–1421, 1989.
[51] E. Aneggi, M. Boaro, C. De Leitenburg, G. Dolcetti, and A.Trovarelli, “Insights into the redox properties of ceria-based
oxides and their implications in catalysis,” Journal of Alloys andCompounds, vol. 408-412, pp. 1096–1102, 2006.
[52] E. Mamontov, R. Brezny, M. Koranne, and T. Egami, “Nano-scale heterogeneities and oxygen storage capacity of Ce0.5Zr0.5O2,” Journal of Physical Chemistry B, vol. 107, no. 47,pp. 13007–13014, 2003.
[53] R. Q. Syed and W. Chiang, Sanitary Landfill Leachate, Gener-ation, Control and Treatment, Technomic, Basel, Switzerland,1994.
[54] J. Kaspar and P. Fornasiero, “Structural properties and thermalstability of ceria-zirconia and related materials,” in Catalysisby Ceria and Related Materials, A. Trovarelli, Ed., ImperialCollege Press, London, UK, 2002.
[55] A. Trovarelli, F. Zamar, J. Llorca, C. De Leitenburg, G. Dolcetti,and J. T. Kiss, “Nanophase fluorite-structured CeO2-ZrO2 cat-alysts prepared by high-energy mechanical milling: analysis oflow-temperature redox activity and oxygen storage capacity,”Journal of Catalysis, vol. 169, no. 2, pp. 490–502, 1997.
[56] S. Rossignol, F. Gerard, and D. Duprez, “Effect of the prepa-ration method on the properties of zirconia-ceria materials,”Journal of Materials Chemistry, vol. 9, no. 7, pp. 1615–1620,1999.
[57] H. Vidal, J. Kaspar, M. Pijolat et al., “Redox behavior of CeO2-ZrO2 mixed oxides. I. Influence of redox treatments on highsurface area catalysts,” Applied Catalysis B, vol. 27, no. 1, pp.49–63, 2000.
[58] H. Vidal, J. Kaspar, M. Pijolat et al., “Redox ehaviour of CeO2-ZrO2 mixed oxides II. Influence of redox treatments on lowsurface area catalysts,” Applied Catalysis B, vol. 30, no. 1-2, pp.75–85, 2001.
[59] J. Kaspar, P. Fornasiero, G. Balducci, R. Di Monte, N. Hickey,and V. Sergo, “Effect of ZrO2 content on textural andstructural properties of CeO2-ZrO2 solid solutions made bycitrate complexation route,” Inorganica Chimica Acta, vol. 349,pp. 217–226, 2003.
[60] P. Fornasiero, G. Balducci, R. Di Monte et al., “Modificationof the redox behaviour of CeO2 induced by structural dopingwith ZrO2,” Journal of Catalysis, vol. 164, no. 1, pp. 173–183,1996.
[61] Z. Tianshu, P. Hing, H. Huang, and J. Kilner, “Sintering anddensification behavior of Mn-doped CeO2,” Materials Scienceand Engineering B, vol. 83, no. 1–3, pp. 235–241, 2001.
[62] F. J. Perez-Alonso, M. L. Granados, M. Ojeda et al., “Chemicalstructures of coprecipitated Fe-Ce mixed oxides,” Chemistry ofMaterials, vol. 17, no. 9, pp. 2329–2339, 2005.
[63] A. Hiroki and J. A. LaVerne, “Decomposition of hydrogenperoxide at water-ceramic oxide interfaces,” Journal of PhysicalChemistry B, vol. 109, no. 8, pp. 3364–3370, 2005.
[64] A. Trovarelli, “Catalytic properties of ceria and CeO2-Containing materials,” Catalysis Reviews, vol. 38, no. 4, pp.439–520, 1996.
[65] Y. Madier, C. Descorme, A. M. Le Govic, and D. Duprez, “Oxy-gen mobility in CeO2 and CexZr(1−x)O2 compounds: studyby CO transient oxidation and 18O/16O isotopic exchange,”Journal of Physical Chemistry B, vol. 103, no. 50, pp. 10999–11006, 1999.
[66] M. Boaro, C. De Leitenburg, G. Dolcetti, and A. Trovarelli,“The dynamics of oxygen storage in ceria-zirconia modelcatalysts measured by CO oxidation under stationary andcycling feedstream compositions,” Journal of Catalysis, vol.193, no. 2, pp. 338–347, 2000.
[67] C. E. Hori, H. Permana, K. Y. S. Ng et al., “Thermal stabilityof oxygen storage properties in a mixed CeO2-ZrO2 system,”Applied Catalysis B, vol. 16, no. 2, pp. 105–117, 1998.

Hindawi Publishing CorporationInternational Journal of PhotoenergyVolume 2012, Article ID 914757, 7 pagesdoi:10.1155/2012/914757
Research Article
Investigation on the Adsorption and Photooxidation ofGlycerol at TiO2 Nanotubular Arrays
Simonetta Palmas,1 Anna Da Pozzo,1 Michele Mascia,1
Annalisa Vacca,1 and Roberto Matarrese2
1 Dipartimento di Ingegneria Meccanica, Chimica e Materiali, Universita degli Studi di Cagliari, Piazza d’Armi, 09123 Cagliari, Italy2 Dipartimento di Energia, Politecnico di Milano, Piazza L. Da Vinci 32, 20133 Milano, Italy
Correspondence should be addressed to Simonetta Palmas, [email protected]
Received 1 June 2012; Accepted 18 July 2012
Academic Editor: Manickavachagam Muruganandham
Copyright © 2012 Simonetta Palmas et al. This is an open access article distributed under the Creative Commons AttributionLicense, which permits unrestricted use, distribution, and reproduction in any medium, provided the original work is properlycited.
A study is presented on the adsorption of glycerol at TiO2 as well as on its oxidative process during the contemporary waterPhotoelectro-splitting for hydrogen production. A deepening in the understanding on the working mechanism of the TiO2
nanotubular photoanodes and on the interactions between glycerol and these structures has been gained through photocurrenttests, voltammetric scans, and EIS analysis. A range of wavelength of the incident radiation is investigated from 340 to 400 nm atwhich the effect of glycerol on the photocurrent is measured. Quantitative analysis of the EIS results is performed by the equivalentcircuit approach.
1. Introduction
The growing attention on innovative processes using glycerolas starting material for the obtainment of more valuableproducts such as other chemicals or energy is due to thegreat increase of its market availability as byproduct in thebiodiesel production [1]. Since the international legislation isaddressed to a greater production of bio- or renewable fuelsto be used for transportation, the crude glycerol productionfrom the biodiesel industry is increasing exponentially. Con-sequently, the commercial price of glycerol is greatly loweredand several perspectives of research for its use are of biginterest [2–5]. To face this issue, following the principles ofsustainable chemistry means to pay attention to avoid theuse and the generation of harmful substances, to reduce theenergy consumption, and to use renewable resources such assolar energy.
In this context, a very interesting way to use this chemicalis in the photo-electrocatalytic hydrogen production, con-ceiving a system which can couple, under a suitable combi-nation between irradiation and external potential bias, thecathodic hydrogen production and the oxidation of glycerol,used as sacrificial reagent at the photoanode. Actually, among
the possible ways to increase the efficiency of a photoelectro-chemical cell, the presence of a sacrificial agent into the solu-tion must be considered as effective to prevent the electron-hole recombination process.
For photocatalytic hydrogen generation, compoundssuch as alcohols, EDTA, or ions such as I−, IO3
− CN−, andFe3+, but also many other organic pollutants, such as oxalicacid, formic acid, and formaldehyde, can be used as sacrificialreagents ([6–8] and references therein).
As above reported, due to its wide market availability,glycerol has been proposed in the present paper as sacrificialagent; moreover, a further enhancement of the process couldconsider the possibility to make the oxidation of glycerolselective in order to address the process to obtain its morevaluable oxidation byproducts such as dihydroxyacetone,glyceric acid, or glyceraldehyde.
In the field of photo-electrocatalytic hydrogen produc-tion, the use of photoanodes based on nanotubular TiO2 hasbeen assessed by several studies that highlighted their opti-mal properties in terms of corrosion resistance, reactivity,photoactivity, low cost, and availability [9, 10]. In our labo-ratory, several studies have been carried out [11] that showedand proved the feasibility of using glycerol as hole scavenger
2 International Journal of Photoenergy
in the process. A recent study [12] also proposed some pos-sible mechanisms of adsorption of glycerol on nanostruc-tured titania, evidencing the importance of the defectivity ofthe oxide for its photoactivity and for its capacity to adsorbglycerol molecules. Glycerol resulted strongly adsorbable onthe oxygen vacancies of TiO2 greatly influencing the behav-iour of the structures during photocatalysis. The presentwork wants to give a contribution to the research in this field,widening the range of investigated wavelength of the incidentradiation, in view of a possible optimization of the pro-cess and its addressing to practical applications. Actually, itmust be considered that most of the investigations carriedout so far in our laboratory, as well as most of the works pre-sent in the literature concerning nanostructured titania, werefocused on the photo-activity of the samples in the UV range,where the TiO2 has its maximum performance.
For the purposes of possible practical applications thatcan exploit a larger percentage of the solar spectrum, it is use-ful to widen the field of investigation to different wavelengthsof incident radiation. The present study investigates inparticular a wavelength range from 340 to 400 nm to evaluatethe effect of glycerol in this wider spectrum of conditions.
2. Experimental
2.1. Preparation of the Electrode. The electrodes were pre-pared starting from Ti foils (0.25 mm thick, 99.7% metalbasis, Aldrich) and following the same procedure adoptedand described elsewhere [13]. After a preliminary degreasingtreatment, the Ti foil was electrochemically oxidised at 20 Vin 0.4 M NH4NO3 + 0.25 M NaF for three hours. Then, it wasannealed 3 h at 400◦C, in air.
2.2. The Electrochemical Cell. A three-electrode cell was usedfor the electrochemical runs, in which the TiO2 sample wasthe working electrode; for all the experiments, its surfacewas shielded so that a nominal area of 1 cm2 was exposedto the electrolyte. A platinum grid and a saturated calomelelectrode (SCE) constituted the counter and the referenceelectrodes, respectively; all the values of potential in the textare referred to SCE.
2.3. Experimental Runs. All the tests were performed inKOH 0.1 M solution with or without the presence of glyc-erol 0.1 M. Electrochemical impedance spectroscopy (EIS)measurements were performed at different bias potentialsin a frequency range from 100 kHz to 0.1 Hz. A frequencyresponse analyzer (FRA, Model 7200 AMEL) coupled witha potentiostat (AMEL 7050) have been employed for theseexperiments. EIS data were quantitatively interpreted by theequivalent circuit approach. Zassist and ZSimpWin softwarepackages were used to perform impedance experiments anddata manipulation, respectively.
Polarisation curves were obtained in the dark or underirradiation by imposing a potential ramp from the open cir-cuit voltage (OCV) to about 1 V with a scan rate of 5 mV s−1.Photocurrents were calculated by subtracting the valuesobtained in the dark from those measured under radia-tion.
The light source was a 300-W Xe lamp (Lot Oriel) thebehaviour of the sample was studied using four filters withcentre wavelength at 340, 365, 380, and 400 nm. The averagelight intensity striking on the surface of the electrode rangedfrom 1.5 to 11 mWcm−2 depending on the filter. To compareresults, photocurrents (I) have been normalized with respectto the incident light power (P).
Voltammetric scans were performed starting from theOCV towards the negative potential down to −1.5 V, witha scan rate of 200 mV s−1.
The effect of the adsorption of glycerol was particularlyinvestigated by performing different scans after that samplewas maintained in contact with 0.1 M glycerol solution forincreasing intervals of time. The effect of desorption wasinvestigated maintaining the sample in KOH 0.1 M solution.
For all the runs, chemicals were of reagent grade (sup-plied by Aldrich) and they were used as received.
3. Results and Discussion
In order to use glycerol as a sacrificial agent in the process ofhydrogen production by solar energy, a deep understandingon the working mechanism of the electrodes and on theinteractions between glycerol and nanotubular TiO2 has tobe gained. For some years, our work has been aimed tothis end; we found out that photo-catalytic response ofTiO2 nanotubular arrays depends on a wide number offactors related to the specific conditions of synthesis and tothe morphological and electronic properties of the samples[11–14]. Moreover, we also investigated the opportunity toenhance the photo-electrochemical yield through the useof glycerol as hole scavenger [11, 12]. Depending on theelectrodes, different percentage increases in the current yieldwere obtained: in some cases the addition of glycerol showedto be of scarce effect [11]; in other cases, we obtainedincreases of more than the 100% [12]. In the present workthe study has been focused to the behaviour of those samplesthat gave the best performance, by investigating in detailthe responses in photocurrent tests in an extended range ofwavelength. The results from these experiments, along withthose derived from voltammetric and EIS analysis are pre-sented in the following.
Figure 1 reports the results of the photo-electrochemicaltests performed at different wavelengths, in solutions withoutand with the presence of glycerol as hole scavenger. Resultsobtained at 365 nm are in agreement with those obtained fora sample synthesized under the same operative conditions[12]. In all the cases, curves always show an initial increasingtrend of photocurrent with the applied potential and asecond part less dependent on it. Moreover, potential valuebeing the same, photocurrents decrease with the wavelengthaccording to the absorption coefficient of the TiO2.
To evaluate quantitatively the enhancement of photocur-rent after the addition of glycerol, the ratio j between thephotocurrent responses in presence (IG) and in absenceof glycerol (IKOH) has been compared at two significantpotential values: the first (E1) where photocurrents are highlypotential dependent was fixed as 0.05 V higher than thecurrent onset, and the second (E2) in the range where

International Journal of Photoenergy 3
In absence of glycerol
0
0.02
0.04
0.06
0.08
0.1
0.12
0 0.2 0.4 0.6 0.8 1− 0.8 − 0.6 − 0.4 − 0.2
I/P
(A
/W)
E (V)
340 nm365 nm
380 nm400 nm
(a)
In the presence of glycerol
0
0.05
0.1
0.15
0.2
0.25
0.3
− 0.9 − 0.7 − 0.5 − 0.3 − 0.1 0.1 0.3 0.5 0.7 0.9
I/P
(A
/W)
E (V)
340 nm365 nm
380 nm400 nm
(b)
Figure 1: Trend of photocurrents (normalized to incident power light) versus potential, at different wavelengths, in absence and in presenceof glycerol.
currents have reached their steady state values was fixed at1 V from the current onset. Data are reported in Table 1. Asit can be seen, a positive effect of glycerol, indicated by thej values greater than unit, is achieved at all the wavelengths:higher j values are measured, in the range of 2–4, near theon set potential, confirming the positive effect of glycerol inreducing the high rate of recombination of photogeneratedcharges occurring at this potential. The effect of glycerolis less evident in the presence of a higher external appliedpotential: values of j go down around the value of 2 sohighlighting how the applied potential also contributed tothe lowering of the charge recombination process.
If the trend of j with the wavelength is considered, itis possible to note that while at the higher potential (E2),the ratio j remains more or less stable around 2 at all theconsidered wavelengths, and at the lower potential (E1), thebest performances are obtained in the range of visible light.This is a very remarkable result especially if we considerhow the applied potential affects the energetic yield of anelectrically driven photoprocess [15]:
ε =I(Erev
0 −∣∣∣Eapp
∣∣∣)P
, (1)
in which Erev0 = 1.23 V is the standard reversible potential
for water splitting, and P is the light power.As it can be observed, the yield takes into account the
net power output obtained in the process, being Eappl thedifference between the bias potential and the OCV under theirradiated power light. From this equation it is evident thatthe possibility to work at lower potential has to be preferredin this kind of processes.
In the present case, the results obtained indicate thatthe presence of glycerol particularly favours conditions oflower applied potential and higher wavelength that are the
best conditions to carry out the considered process in anecofriendly way.
To better understand the working mechanism of theelectrode and the interactions occurring between glyceroland nanotubular TiO2, EIS measurements were carried outat the irradiated sample; also in this case, two different rangesof potential were investigated, near to the OCV and at highervalues where the saturation current was achieved.
Figure 2 reports the spectra, in terms of Bode andNyquist plots, obtained in absence and in presence ofglycerol, at the potential of 0.5 V.
No significant differences are evident in Bode phase anglediagrams. As the Bode modulus versus frequency plot isconsidered, at the higher frequencies, where as it is knownthe solution resistance (RS) dominates the impedance,values overlapped, confirming the almost equal resistanceof the solution, whose conductivity is given mainly by thesupporting electrolyte. As the frequency decreases, the curvesstill remain overlapped; only at values lower than about1 Hz, a slight separation of the modulus appeared, whosemeaning can be better seen on the Nyquist plot, where, at thelower frequencies, the semicircle related to charge transferoccurring at the interface electrode-electrolyte appears.According to the higher photocurrents obtained in presenceof glycerol, the semicircle related to the reaction happening atthe electrode-electrolyte interfaces shows a smaller diameterwhen glycerol is present, indicating a more easy chargetransfer with the solution.
Other important information can be gathered from theEIS performed at the potential near the OCV, (Figure 3);under this potential the extent of the occurring reactions isvery low, and more interesting information can be obtainedon the capacitive behaviour of the sample.
Referring to Bode diagram of modulus, also at this poten-tial, the values overlapped at the higher frequencies, but
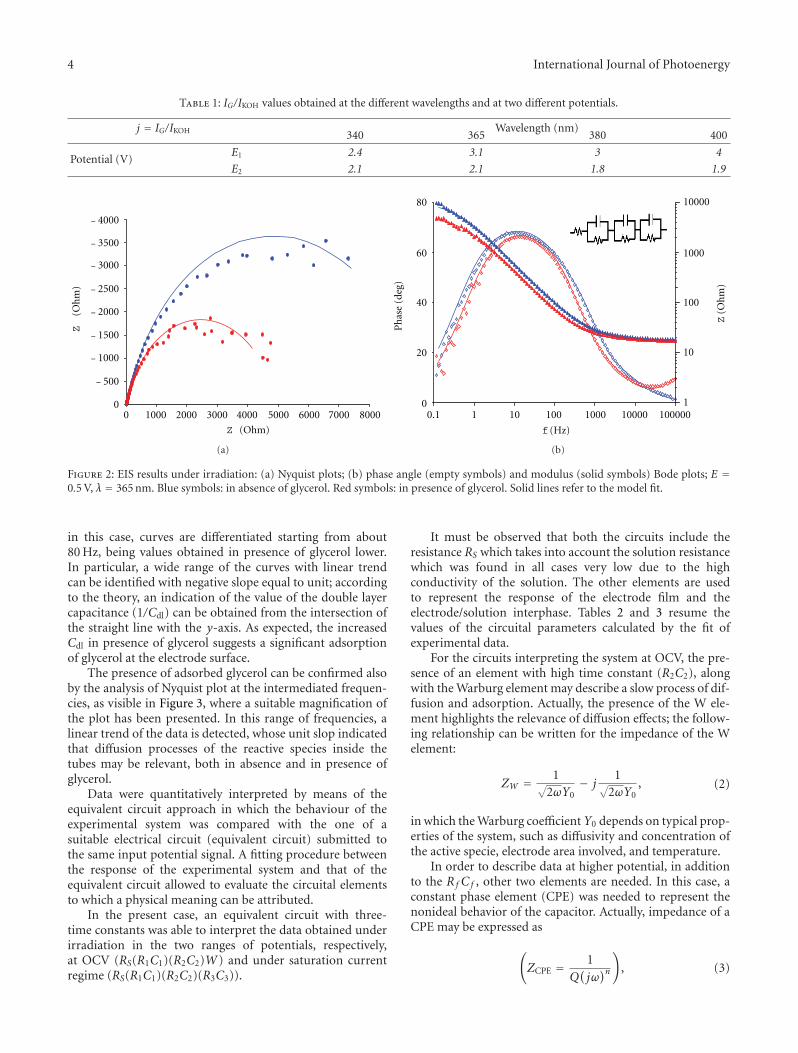
4 International Journal of Photoenergy
Table 1: IG/IKOH values obtained at the different wavelengths and at two different potentials.
j = IG/IKOH Wavelength (nm)340 365 380 400
Potential (V)E1 2.4 3.1 3 4
E2 2.1 2.1 1.8 1.9
− 4000
− 3500
− 3000
− 2500
− 2000
− 1500
− 1000
− 500
00 1000 2000 3000 4000 5000 6000 7000 8000
Z (Ohm)
Z(O
hm
)
(a)
0
20
40
60
80
0.1 1 10 100 1000 10000 1000001
10
100
1000
10000
f(Hz)
Ph
ase
(deg
)
Z (
Oh
m)
(b)
Figure 2: EIS results under irradiation: (a) Nyquist plots; (b) phase angle (empty symbols) and modulus (solid symbols) Bode plots; E =0.5 V, λ = 365 nm. Blue symbols: in absence of glycerol. Red symbols: in presence of glycerol. Solid lines refer to the model fit.
in this case, curves are differentiated starting from about80 Hz, being values obtained in presence of glycerol lower.In particular, a wide range of the curves with linear trendcan be identified with negative slope equal to unit; accordingto the theory, an indication of the value of the double layercapacitance (1/Cdl) can be obtained from the intersection ofthe straight line with the y-axis. As expected, the increasedCdl in presence of glycerol suggests a significant adsorptionof glycerol at the electrode surface.
The presence of adsorbed glycerol can be confirmed alsoby the analysis of Nyquist plot at the intermediated frequen-cies, as visible in Figure 3, where a suitable magnification ofthe plot has been presented. In this range of frequencies, alinear trend of the data is detected, whose unit slop indicatedthat diffusion processes of the reactive species inside thetubes may be relevant, both in absence and in presence ofglycerol.
Data were quantitatively interpreted by means of theequivalent circuit approach in which the behaviour of theexperimental system was compared with the one of asuitable electrical circuit (equivalent circuit) submitted tothe same input potential signal. A fitting procedure betweenthe response of the experimental system and that of theequivalent circuit allowed to evaluate the circuital elementsto which a physical meaning can be attributed.
In the present case, an equivalent circuit with three-time constants was able to interpret the data obtained underirradiation in the two ranges of potentials, respectively,at OCV (RS(R1C1)(R2C2)W) and under saturation currentregime (RS(R1C1)(R2C2)(R3C3)).
It must be observed that both the circuits include theresistance RS which takes into account the solution resistancewhich was found in all cases very low due to the highconductivity of the solution. The other elements are usedto represent the response of the electrode film and theelectrode/solution interphase. Tables 2 and 3 resume thevalues of the circuital parameters calculated by the fit ofexperimental data.
For the circuits interpreting the system at OCV, the pre-sence of an element with high time constant (R2C2), alongwith the Warburg element may describe a slow process of dif-fusion and adsorption. Actually, the presence of the W ele-ment highlights the relevance of diffusion effects; the follow-ing relationship can be written for the impedance of the Welement:
ZW = 1√2ωY0
− j1√
2ωY0, (2)
in which the Warburg coefficientY0 depends on typical prop-erties of the system, such as diffusivity and concentration ofthe active specie, electrode area involved, and temperature.
In order to describe data at higher potential, in additionto the Rf C f , other two elements are needed. In this case, aconstant phase element (CPE) was needed to represent thenonideal behavior of the capacitor. Actually, impedance of aCPE may be expressed as
(ZCPE = 1
Q(jω)n)
, (3)

International Journal of Photoenergy 5
− 50
− 45
− 40
− 35
− 30
− 25
− 20
− 15
− 10
− 5
00 5 10 15 20 25 30 35 40 45 50
13 Hz36 Hz
45
Z (Ohm)
Z(O
hm
)
(a)
− 1 slope
0.1 1 10 100 1000 10000 100000
f(Hz)
0
20
40
60
80
Ph
ase
(deg
)
1
10
100
1000
10000
Z (
Oh
m)
(b)
Figure 3: EIS results under irradiation: (a) Nyquist plots; (b) phase angle (empty symbols) and modulus (solid symbols) Bode plots; E =OCV, λ = 365 nm. Blu symbols: in absence of glycerol. Orange symbols: in presence of glycerol. Solid lines refer to the model fit.
− 6
− 4
− 2
0
2
4
− 1.5 − 0.5 0.5 1.5 2.5
i(m
A c
m−
2)
E (V)
Figure 4: Example of cyclic voltammetry carried out at 0.1 M gly-cerol solution at TiO2 electrode.
being n = 1 for a perfect capacitor. Its time constant(τ3 = (RQ)1/n) in the order of seconds, along with thatof the R2C2 (τ2 in the order of μs) indicate fast processesoccurring at the electrode at this potential value. Accordingly,a lower diameter is recorded in the loops of the Nyquist plotscompared to that recorded at the OCV and higher currentsare measured.
To deeply investigate adsorption process, voltammetricscans were carried out in KOH solutions containing glycerolin the range of negative potentials from the OCV to about−1.5 V. An example of these results is shown in Figure 4.Previous studies [12] showed that the height of the cathodicpeak observed at about −1 V may indicate the extent of theadsorption of glycerol on the surface of TiO2. In this case,CV runs were performed after the sample was contacted forincreasing times by glycerol solution. CV runs were thenrepeated after desorption in KOH solvent.
In Table 4, the height of the cathodic peak is reportedas a function of the adsorption and desorption times. Datasuggest a slow adsorption process occurring on the super-ficial state of TiO2 nanotubes, and a quite reversible, evenslower desorption process.
Also in this case, a series of EIS measurements have beencarried out, with and without glycerol in the dark, in orderto study the behaviour of the sample as a function of theadsorption time, and the results interpreted by suitable equi-valent circuits.
Figure 5 shows the Nyquist plots obtained at the samplemaintained in contact with glycerol alkaline solution forincreasing intervals of time. In the same figure, Nyquist plotobtained in a KOH solution is reported as comparison. Alsoin this case, a suitable magnification of the diagram has beenchosen to highlight the range of major changes caused by theabsorption process.
As well visible in Figure 5, only after 20 h, glyceroladsorption noticeably modifies the first semicircle of the plot.At the higher frequencies (data not reported), the trend ofimpedance values is not particularly meaningful showing, asexpected, a simply resistive behaviour, since reactions do notoccur in the system without illumination and near the opencircuit potential.
As shown in Figure 5(b), the data obtained after 20 and40 hours of desorption tend to merge with those obtainedbefore the glycerol adsorption; the adsorption process isreversible but the desorption process results to be quite slow.
A quantitative analysis of the kinetics of adsorptionis reported in Table 5, where the circuital parameters arecompared. In particular, as already outlined in the previousfigures, the sample resistance Rf increases with the adsorp-tion of glycerol and then it decreases after desorption. Thefact that the adsorption of glycerol leads to the increase inthe material resistance supports the hypothesis [12], that it ispreferentially adsorbed on the superficial states responsibleof the conductibility of the electrode.
Also in this case, the high value of the time constant τ2as well as the presence of a Warburg element indicate that,in these conditions, the adsorption represents the rate deter-mining step of the whole process. However, as the specificvalues of Y0 are compared, their variation is quite difficult tobe interpreted; in fact, as already pointed out, although thecoefficient Y0 could be related to the diffusion coefficient of

6 International Journal of Photoenergy
Table 2: Circuit parameters obtained by fitting the experimental impedance results with the selected equivalent circuit. Data obtained underirradiation (λ = 365 nm) in the presence and in absence of glycerol, E = OCV.
E = OCV
Cf (μF cm−2) Rf (Ω cm2) C2 (μF cm−2) R2 (Ω cm2) τ2 (s) Y0 (μS s0.5 cm−2)
KOH 10 17.2 1200 2544 3.04 4700
G 0.23 16.66 2460 1041 2.55 14500
Table 3: Circuit parameters obtained by fitting the experimental impedance results with the selected equivalent circuit. Data obtained underirradiation (λ = 365 nm) in the presence and in absence of glycerol, E = 0.5 V.
E = 0.5 V
Cf (μF cm−2) Rf (Ω cm2) C2 (μF cm−2) R2 (Ω cm2) τ2 (s) Q3 (μS sn cm−2) n3 R3 (Ω cm2) τ3 (s)
KOH 82.5 24.93 10.1 2.40 24 55.8 0.83 9619 0.47
G 0.13 17.63 22.1 2.45 54 78.8 0.82 4903 0.31
Table 4: Heights of the cathodic peak observed at −1 V as a function of the adsorption (tads) and desorption (tdes) times.
KOH 0.1 M KOH 0.1 M + glycerol 0.1 M KOH 0.1 M
tads = 0 tads = 4 h tads = 20 h tdes = 20 h tdes = 40 h
Height of the cathodic peak (V) −1.8 −3 −3.5 −4 −3 −2
Table 5: Circuit parameters obtained by fitting the experimental impedance results with the selected equivalent circuit. Data obtained in thedark at the OCV potential, as a function of the adsorption (tads) and desorption (tdes) times.
Cf (μF cm−2) Rf (Ω cm2) C2 (μF cm−2) R2 (Ω cm2) τ2 (s) Y0 (mS s0.5 cm−2)
KOH 0.031 11.83 940 6939 6.5 8.8
tads = 0 0.026 12.15 939 7349 6.90 6.5
tads = 4 h 0.19 12.5 1200 10600 12.74 14.6
tads = 20 h 0.021 16.11 900 4956 4.46 4.95
tdes = 40 h 0.02 12.36 206 13100 2.70 3.01
− 20
− 18
− 16
− 14
− 12
− 10
− 8
− 6
− 4
− 2
00 5 10 15 20 25 30
Z(O
hm
)
Z (Ohm)
KOH
tads = 0
tads = 4 h
tads = 20 h
(a)
0 5 10 15 20 25 30
− 20
− 18
− 16
− 14
− 12
− 10
− 8
− 6
− 4
− 2
0
Z(O
hm)
Z (Ohm)
KOH
tads = 0
tads = 4 h
tads = 20 h
tads = 20 h
tads = 40 h
(b)
Figure 5: (a) Effect of G adsorption on the Nyquist plots; each curve is obtained after the sample was maintained in contact with (G) = 0.1 Malkaline solution for increasing intervals of time t. Black symbols refer to test performed in the solvent without G. (b) Effect of G desorption.Solid lines refer to the model fit.

International Journal of Photoenergy 7
the species, other factors are included in its formula, such asthe area or concentration of the active species, which, in acomplex structure like this, are not easy to be identified.
4. Conclusions
This work deepened the study carried out in our laboratoryon photo catalytic hydrogen production enhanced by thepresence of glycerol as sacrificial agent. Results have beenpresented in order to better understand the working mech-anism of the electrodes and the interactions occurringbetween glycerol and nanotubular TiO2. Results obtainedhighlighted that adsorption process has to be considered andcorrelated to the morphology and the defectivity of the sam-ple. On the one hand greater defectivity increases the adsorp-tion capacity of the electrode, which is necessary to ensureincreased efficiencies of photocurrent, but on the otherhand an excessive reduction in conductivity must be pre-vented in order not to affect the sample performance. Furtherstudies are still on the way on different electrodes in orderto optimise morphology and defectivity of the sample to bedestined to the specific process.
References
[1] M. Pagliaro, R. Ciriminna, H. Kimura, M. Rossi, and C. DellaPina, “From glycerol to value-added products,” AngewandteChemie International, vol. 46, no. 24, pp. 4434–4440, 2007.
[2] M. G. Alvarez, A. M. Segarra, S. Contreras, J. E. Sueiras,F. Medina, and F. Figueras, “Enhanced use of renew-able resources: transesterification of glycerol catalyzed byhydrotalcite-like compounds,” Chemical Engineering Journal,vol. 161, no. 3, pp. 340–345, 2010.
[3] R. Rudie, “Corgill Dow sows seeds of future fibers; will build$300 million PLA polymer plant,” International Fiber Journal,vol. 15, no. 1, pp. 8–12, 2000.
[4] M. A. Dasari, P. P. Kiatsimkul, W. R. Sutterlin, and G. J. Suppes,“Low-pressure hydrogenolysis of glycerol to propylene glycol,”Applied Catalysis A, vol. 281, no. 1-2, pp. 225–231, 2005.
[5] V. Augugliaro, H. A. H. El Nazer, V. Loddo et al., “Partial pho-tocatalytic oxidation of glycerol in TiO2 water suspensions,”Catalysis Today, vol. 151, no. 1-2, pp. 21–28, 2010.
[6] H. Wu and Z. Zhang, “Photoelectrochemical water splittingand simultaneous photoelectrocatalytic degradation of org-anic pollutant on highly smooth and ordered TiO2 nanotubearrays,” Journal of Solid State Chemistry, vol. 184, no. 12, pp.3202–3207, 2011.
[7] M. Canterino, I. Di Somma, R. Marotta, R. Andreozzi, andV. Caprio, “Energy recovery in wastewater decontamination:simultaneous photocatalytic oxidation of an organic substrateand electricity generation,” Water Research, vol. 43, no. 10, pp.2710–2716, 2009.
[8] A. Galinska and J. Walendziewski, “Photocatalytic water split-ting over Pt-TiO2 in the presence of sacrificial reagents,” En-ergy and Fuels, vol. 19, no. 3, pp. 1143–1147, 2005.
[9] S. Rani, S. C. Roy, M. Paulose et al., “Synthesis and appli-cations of electrochemically self-assembled titania nanotubearrays,” Physical Chemistry Chemical Physics, vol. 12, no. 12,pp. 2780–2800, 2010.
[10] P. Roy, S. Berger, and P. Schmuki, “TiO2 nanotubes: synthesisand applications,” Angewandte Chemie International, vol. 50,no. 13, pp. 2904–2939, 2011.
[11] S. Palmas, A. M. Polcaro, J. R. Ruiz, A. Da Pozzo, M. Mascia,and A. Vacca, “TiO2 photoanodes for electrically enhancedwater splitting,” International Journal of Hydrogen Energy, vol.35, no. 13, pp. 6561–6570, 2010.
[12] S. Palmas, A. Da Pozzo, M. Mascia, A. Vacca, P. C. Ricci, and R.Matarrese, “On the redox behaviour of glycerol at TiO2 elec-trodes,” Journal of Solid State Electrochemistry, vol. 16, pp.2493–2502, 2012.
[13] S. Palmas, A. Da Pozzo, M. Mascia et al., “Effect of the pre-paration conditions on the performance of TiO2 nanotubearrays obtained by electrochemical oxidation,” InternationalJournal of Hydrogen Energy, vol. 36, no. 15, pp. 8894–8901,2011.
[14] S. Palmas, A. Da Pozzo, F. Delogu, M. Mascia, A. Vacca, and G.Guisbiers, “Characterization of TiO2 nanotubes obtained byelectrochemical anodization in organic electrolytes,” Journal ofPower Sources, vol. 204, pp. 265–272, 2012.
[15] O. K. Varghese and C. A. Grimes, “Appropriate strategies fordetermining the photoconversion efficiency of water photo-electrolysis cells: a review with examples using titania nan-otube array photoanodes,” Solar Energy Materials and SolarCells, vol. 92, no. 4, pp. 374–384, 2008.

Hindawi Publishing CorporationInternational Journal of PhotoenergyVolume 2012, Article ID 430638, 8 pagesdoi:10.1155/2012/430638
Research Article
Photocatalytic Degradation of Aniline Using TiO2 Nanoparticlesin a Vertical Circulating Photocatalytic Reactor
F. Shahrezaei,1 Y. Mansouri,2, 3 A. A. L. Zinatizadeh,4 and A. Akhbari4
1 Academic Center for Education, Culture, and Research (ACECR), Kermanshah 67145-1317, Iran2 Environmental Epidemiological Research Center, Kermanshah University of Medical Science, Kermanshah 67146-73159, Iran3 Department of Analytical Chemistry, Faculty of Chemistry, Razi University, Kermanshah 67149-67346, Iran4 Water and Wastewater Research Center (WWRC), Department of Applied Chemistry, Faculty of Chemistry, Razi University,Kermanshah 67149-67346, Iran
Correspondence should be addressed to Y. Mansouri, [email protected] A. A. L. Zinatizadeh, [email protected]
Received 16 April 2012; Accepted 29 June 2012
Academic Editor: Mika Sillanpaa
Copyright © 2012 F. Shahrezaei et al. This is an open access article distributed under the Creative Commons Attribution License,which permits unrestricted use, distribution, and reproduction in any medium, provided the original work is properly cited.
Photocatalytic degradation of aniline in the presence of titanium dioxide (TiO2) and ultraviolet (UV) illumination was performedin a vertical circulating photocatalytic reactor. The effects of catalyst concentration (0–80 mg/L), initial pH (2–12), temperature(293–323 K), and irradiation time (0–120 min) on aniline photodegradation were investigated in order to obtain the optimumoperational conditions. The results reveal that the aniline degradation efficiency can be effectively improved by increasingpH from 2 to 12 and temperature from 313 to 323 K. Besides, the effect of temperature on aniline photo degradation wasfound to be unremarkable in the range of 293–313 K. The optimum catalyst concentration was about 60 mg/L. The LangmuirHinshelwood kinetic model could successfully elucidate the effects of the catalyst concentration, pH, and temperature on the rate ofheterogeneous photooxidation of aniline. The data obtained by applying the Langmuir Hinshelwood treatment are consistent withthe available kinetic parameters. The activated energy for the photocatalytic degradation of aniline is 20.337 kj/mol. The possibilityof the reactor use in the treatment of a real petroleum refinery wastewater was also investigated. The results of the experimentsindicated that it can therefore be potentially applied for the treatment of wastewater contaminated by different organic pollutants.
1. Introduction
Aniline is one of the most toxic pollutants; it is releasedinto the environment after its use in the manufacturingof dyes, rubber, polymers, herbicides, pesticides, fungicides,and pharmaceuticals [1]. Aniline is also found in the effluentsof petroleum refinery plants. Because of its toxic and recalci-trant nature and the wide application of aniline containingchemicals, aniline is considered to be an increasing threat toboth the environment and human health. Therefore, anilinehas aroused great attention and is classified as a persistentorganic pollutant by the European Economic Communityand US Environmental Protection Agency [2]. So there is anurgent need to develop efficient and economical methods toremove this pollutant from wastewater.
Several solutions are proposed in this regard, includingadsorption [3], chemical oxidation [4, 5], biological [6], and
catalytic wet air oxidation (CWAO) [7]. Unfortunately, themain drawback of these techniques relates to the disposalof the spent contaminated activated sludges, the controlof the appropriate reaction conditions, low efficiencies andreaction rates, and operation only within a narrow pH range[8, 9].
During the past decade, great interest has been focusedon a promising technology based on the oxidation of thehazardous and refractory organic compounds, by the use ofadvanced oxidation processes (AOPs) [10]. Various combi-nations of hydrogen peroxide, ozone, and ultraviolet lightare used to generate hydroxyl radicals (HO•) in the AOPs.Hydroxyl radicals are the principal agents responsible for theoxidation of numerous aqueous organic contaminants andare quite energy intensive. One emerging technology, how-ever, utilizes illuminated semiconductors and is commonlyreferred to as the heterogeneous photocatalysis.

2 International Journal of Photoenergy
Circulating pump
Circulating pump
Water bath
TiO2
UV lamp
Quartz tube
Valve
Thermometer
Power supply
Flow meterAir pump
Figure 1: Experimental setup of photoreactor.
The heterogeneous photocatalysis oxidation (HPO) pro-cess employing TiO2 and UV light has emerged as a promis-ing new route for the degradation of persistent organic pol-lutants, and produces more biologically degradable and lesstoxic substances [11, 12]. This process is highly dependenton the insitu generation of hydroxyl radicals under ambientconditions which are capable of converting a wide spectrumof toxic organic compounds including the nonbiodegradableones into relatively innocuous end products such as CO2 andH2O.
In spite of the considerable success of TiO2/UV for thetreatment of various types of wastewater, its application asa possible technique for the degradation of aniline is ratherscarce in the literature. The main objective of the presentstudy, therefore, is to evaluate the reduction of aniline inaqueous solutions using UV/TiO2 at different operatingconditions.
Furthermore, most of the studies on aniline decompo-sition by AOPs up to date have not provided in depth onthe degradation kinetics which are also important scientificinformation; hence, this study also investigated into moredetails on kinetics of aniline degradation by UV/TiO2 inorder to develop the rate equations which can provide funda-mental knowledge for future use. Also, the removal efficiencywas studied using real petroleum refinery wastewater toexplore the applicability of the technique in industry.
2. Experimental
2.1. Chemicals. The chosen catalyst of titanium dioxide wasmainly anatase (80% anatase and 20% rutile, Degussa P25) with a particle size of 30 nm and a surface area of50 m2/g (purchased from Plasmachem Co.). This catalyst isthe best one which gives an optimal efficiency of catalysis,furthermore, good interparticle contacts are formed between
anatase and rutile particles in water [13]. Sulfuric acid andsodium hydroxide solutions were used to adjust the pH ofsamples [14].
2.2. Analytical Methods. The aniline concentrations in feedand permeate solutions were determined spectrophotomet-rically at 280 nm, after dilution with 1 M NaOH, using a UVspectrophotometer (DR 5000, Hach, Jenway, USA). TOC wasdetermined with a Shimadzu TOC-5000 total organic carbonanalyzer. The identification of the compounds in the realwastewater before and after the degradation was performedby means of the GC/MS system.
GC/MS analysis of the organic compounds was per-formed using an HP-6890 GC system coupled with a5973 network mass selective detector and equipped withan HP5-MS capillary fused silica column (60 m, 0.25 mmI.D.; 0.25 mL film thickness). Real wastewater (1 μL) inhexane (HPLC grade) was injected and analyzed with thecolumn held initially at 40◦C for 1 min and then increasedto 250◦C with a 3◦C/min heating ramp and subsequentlykept at 250◦C for 20 min. Other operating conditions wereas follows: carrier gas, He (99.999%); with a flow rate of1 mL/min; injector temperature, 250◦C; split ratio, 1 : 50.Mass spectra were taken at 70 eV. The pH meter modelHANNA-pH 211 was used to measure the pH. Turbidity wasmeasured by a turbidimeter model 2100 P (Hach Co.).
2.3. Photoreactor Configuration. Figure 1 shows the experi-mental setup of the photoreactor used for the degradationof aniline. Experiments were carried out in a vertical reactorwith the capacity of about 1200 mL and a conic shape inthe lower part of its body. The UV lamp 22 cm body lengthand 16 cm arc length) was a mercury 400 W (200–550 nm)lamp. The UV lamp was positioned inside a quartz tube andtotally immersed in the reactor. Therefore, the maximum

International Journal of Photoenergy 3
Table 1: Experimental design for photocatalytic degradation of aniline.
Factors Values Other conditions
Initial pH
2—Initial concentration of aniline: 50 mg/LTiO2 concentration: 60 mg/LTemperature: 293 K—
4
6
8
10
12
TiO2 concentration (mg/L)
20 Initial concentration of aniline: 50 mg/LInitial pH: 6Temperature: 293 K—
40
60
80
Temperature (K)
293 —Initial concentration of aniline: 50 mg/LInitial pH: 6TiO2 concentration: 60 mg/L
303
313
323
light utilization was achieved. A pump was located belowthe reactor and provided an adjustable circulating stream,feeding from top of the reactor and discharging from thebottom just below the lamp for the well mixing and fluidizingof nanoparticles of catalyst along the quartz tube. It wasnot expected that a single pass of polluted water through ashort reactor would give adequate degradation. If particlesin the water surrounding a lamp are well mixed then eachparticle on average achieves equal exposure for regulating thetemperature; the reactor vessel was equipped with a water-flow jacket, using an external circulating flow of a water bath.Air flow was supplied to the reactor at a constant flow rate(3 L/min) using a lab scale air compressor.
2.4. Experimental Design. Based on the literature, fouroperational and process factors, namely, pH (2–12), catalystconcentration (0–80 mg/L), temperature (293–323 K), andreaction time (30–120 min) were introduced with the mostsignificant impact on the photocatalytic degradation ofpollutants using TiO2 nanoparticles and UV illuminationwhich were considered as the system variables, and anilineremoval efficiency was calculated as the process response[15]. The experimental design is listed in Table 1.
2.5. Photoreactor Operation. In the first stage, to run theexperiments, 1200 mL of a sample, containing a known levelof aniline (50 mg/L) and with the appropriate amount ofadded catalyst, was transferred to the reactor. The solutionwas then exposed to continuous aerating and circulating.After adjustment of temperature and pH, the UV irradiationwas begun. In the second stage, the photoreactor was oper-ated under the experiments’ conditions (Table 1) to comparethe effects of various factors on aniline photodegradationefficiency.
2.6. Photodegradation Kinetic Parameters. The mechanismof aniline degradation catalyzed by TiO2 is proposed toconsist of the following three steps: (1) adsorption of organic
pollutant on the surface of TiO2 (2) surface photodegra-dation of organic pollutant, and (3) desorption of finalproducts from the surface of TiO2. The photodegradationof organic pollutants is the rate-predominant step whichinvolves the excitation of the titanium dioxide by a UV lightwavelength of λ ≤ 400 nm, electron-hole pairs (e−cb,h+
vb) aregenerated, and the hydroxyl radicals are generated by thehole which can degrade organic pollutants present in thewastewater. Oxygen, provided from the air (when the systemis stirred and aerated), dissolved in the solution scavengesthe electron generated, preventing the recombination ofelectrons and holes. UV illumination of TiO2 yields conduc-tion band electrons and valence band holes, which interactwith surface adsorbed molecular oxygen to yield superoxideradical anions, O2, and with water and hydroxyl to producethe highly reactive HO• radicals, respectively. The latterradical species are well known to oxidize a large numberof organic substrates [16–18]. Acknowledging the above-mentioned reaction steps for photocatalysis, the elementaryreaction equations are expressed as the following equations:
TiO2 + hv −→ e−cb + h+vb (1)
e−cb + O2(ads) −→ O−•2 (2)
h+vb + OH− −→ OH• (3)
h+vb + H2O −→ OH• + H+ (4)
OH• + aniline −→ oxidative intermediates −→ CO2 + H2O.(5)
In general, the kinetics of photocatalytic reactions of organicwater impurities, including aniline, phenol and its deriva-tives, follows the Langmuir-Hinshelwood (L-H) which isconsidered to follow pseudo first- order decay kinetics [19];
r = −dCdt= kKadC
1 + KadC, (6)

4 International Journal of Photoenergy
where r is the reaction rate, k is the aniline degradation rateconstant, Kad is the adsorption equilibrium constant, and Cis the concentration of substrate remaining in the solutionat time (t). In this study, aniline concentration C was lessthan 1 × 10⁻³ mol/L, which made KC � 1; hence, (6) canbe transformed to (7) as follows [20]:
r = −dCdt= kKad C. (7)
A linear form of (7) is
ln(C0
C
)= kKad C = Kapt, (8)
where Kap is the apparent reaction rate constant, which canbe calculated from the slope of the in plot, and C0 is theinitial substrate concentration. The effects of various reactionparameters on the photocatalytic performance of TiO2 wereexpressed in terms of Kap.
3. Results and Discussion
3.1. Influence of Catalyst Concentration. The effect of photo-catalyst (TiO2) concentration on the degradation of anilinein the photoreactor was investigated. The experiments wereconducted at various amounts of TiO2 concentration of 0(only UV), 20, 40, 60, and 80 mg/L while initial anilineconcentration, pH, and temperature of bulk liquid used were50 mg/L, 6, and 293 K, respectively. The effect of the amountof TiO2 on the removal of aniline was significant as shown inFigure 2, confirming the positive influence of the increasednumber of TiO2 active sites on the process kinetics. Itcould be seen from Figure 2 that photocatalytic degradationefficiency has increased up to 60 mg/L and then declined withincreasing catalyst loading. The changes of Kap versus catalystconcentration are illustrated in Figure 3 and Table 2. Thevalues of Kap increased with increasing catalyst concentrationup to 60 mg/L. Then, the apparent degradation rate constantKap decreased slightly, when catalyst concentration washigher than 60 mg/L.
The maximum values of the aniline removal efficiencyand Kap were obtained to be 62% and 0.265 (h−1) at irra-diation time and catalyst concentration, respectively, 2 h and60 mg/L, whereas the minimum values of the responses wereobtained under UV light power at 400 W without the use ofTiO2 nanoparticles. The removal efficiency and Kap of thephotodegradation of aniline under UV light were only 19%and 0.061 h−1, respectively. Thus, it is necessary to apply thephotocatalyst into the system to enhance the rate of reaction.
The increase of aniline removal efficiency and Kap withincreasing in catalyst concentration seems to be the resultsof an increase in the total surface area of TiO2, namely, anincrease of the active sites and an increase in the hydroxylradicals generation. However, when enough TiO2 is presentin the reactor for adsorbing aniline molecules, the extrahigher quantities of TiO2 nanoparticles would not have morepositive effect on the aniline degradation efficiency. On thecontrary, when TiO2 was overdosed, the number of activesites on the TiO2 particle surface, which was available for
0
10
20
30
40
50
60
70
80
90
100
0 0.5 1 1.5 2
Irradiation time (h)
UV
An
ilin
e re
mov
al (
%)
UV/TiO2 = 20 mg/LUV/TiO2 = 40 mg/L
UV/TiO2 = 60 mg/LUV/TiO2 = 80 mg/L
Figure 2: Effect of catalyst concentration on aniline removal (initialpH: 6, temperature (T): 293 K).
0
0.05
0.1
0.15
0.2
0.25
0.3
0 20 40 60 80 100
Catalyst concentration (mg/L)
k ap
(h−
1)
Figure 3: Changes of the apparent aniline photocatalytic reactionconstant Kap at different catalyst concentration (initial pH: 6,temperature (T): 293 K, and irradiation time: 2h).
Table 2: Effect of catalyst concentration on photocatalytic degra-dation of aniline under UV illumination in HCBR (experimentalconditions: initial aniline: 50 mg/L; initial pH: 6, temperature:293 K).
Catalyst concentration (mg/L) Equation Kap R2
0 (only UV) 0.061x + 0.178 0.061 0.97
20 0.066x + 0.178 0.066 0.897
40 0.132x + 0.311 0.132 0.988
60 0.265x + 0.397 0.265 0.939
80 0.210x + 0.330 0.21 0.957
the photocatalytic reaction, might approach constant or evendecrease slightly because of the decrease of light penetrationand the increase of UV light scattering. Therefore, there is anoptimum TiO2 dosage for aniline removal, in this case, theoptimal TiO2 dosage for aniline photodegradation was about60 mg/L. Similar phenomena have already been reported inother TiO2 suspension photocatalytic systems. For example,the optimum TiO2 dosage for the photocatalytic degradation

International Journal of Photoenergy 5
0
10
20
30
40
50
60
70
80
90
100
0 2 4 6 8 10 12
pH
An
ilin
e re
mov
al (
%)
Irradiation time = 1 hIrradiation time = 2 h
Figure 4: Effect of pH on aniline removal at two typical irradiationtimes (1 h and 2 h); (catalyst concentration: 60 mg/L and T =293 K.)
0
0.1
0.2
0.3
0.4
0.5
0 2 4 6 8 10 12 14
pH
Kap
(h−
1)
Figure 5: Changes of the apparent aniline photocatalytic reactionconstant Kap at different pH (catalyst concentration: 60 mg/L,temperature (T): 293 K, and irradiation time: 2h).
of fungicide carbendazim is about 70 mg/L [21]. This is dueto the increase of internal mass transfer resistance and lightshielding effect, which can further result in the decrease ofoverall reaction rate at very high TiO2 dosage [22].
3.2. Effect of pH. Changing electrolyte pH can vary the sur-face charge at the TiO2 surface and also shifts the potential ofsome redox reaction, thus, it affects the adsorption of organicsolutes, consequently, its reactivity and some reaction rate.The effect of pH on aniline degradation rate was investigatedin the range of 2–12 at aniline concentration 50 mg/L andTiO2 concentration of 60 mg/L. The comparison of anilineremoval rate at different pH values at two different timesof 60 and 120 min is shown in Figure 4. The changes of Kap
versus pH were illustrated in Figure 5.From Figure 4, it is observed that as the pH increases
from acidic to alkaline the rate of aniline removal efficiencyincreases and is maximum at pH 12. In case of initial pHvalues 2, 4, 6, 8, 10, and 12.0, the percentage removal ofaniline, was 27, 56, 62, 60, 66, and 76, and Kap was 0.128,0.189, 0.265, 0.266, 0.304, and 0.45, respectively, as shown inFigures 4 and 5 and Table 3. The increasing aniline removal
Table 3: Effect of pH on photocatalytic degradation of anilineunder UV illumination in HCBR (experimental conditions: initialaniline: 50 mg/L; catalyst concentration: 60 mg/L; temperature:293 K).
pH Equation Kap R2
2 0.128x + 0.058 0.128 0.991
4 0.189x + 0.451 0.189 0.989
6 0.265x + 0.397 0.265 0.94
8 0.266x + 0.304 0.266 0.91
10 0.304x + 0.502 0.304 0.951
12 0.450x + 0.504 0.450 0.991
efficiency and Kap with increasing pH can be attributed to theincrease in the number of OH− ions at the surface of TiO2,since OH− can be formed by trapping photo-produced holes.Also, the dissociation of aniline probably changes its reactiv-ity. Similarly, the decrease at the lowest pH can be explainedby the lack of OH− ions. Richard et al. [23] found that OH−
was the sole oxidant under the condition of pH 11 and its rolewas larger in this case than in neutral and acid medium. SoKap increases rapidly with the increasing of pH when greaterthan 10. In general, the results indicate that the efficiency ofthe process is not much affected over a wide range of pH,which is quite satisfactory in view of applications.
3.3. Effect of Temperature. In general, the activated energyof photocatalytic reaction is slightly affected by the tem-perature, but consecutive redox reaction may be largelyinfluenced by temperature which affects both collisionfrequency of molecules and adsorption equilibria [15]. Sothe overall effect on the photocatalytic performance willdepend on the relative importance of these phenomena.The effect of temperature on the aniline photodegradationin aqueous solution with the presence of TiO2 and UVwas investigated in the range of 293–323 K. The results aredemonstrated in Figure 6. As seen in the figure, increase intemperature from 293 to 323 K has reduced the requiredtime for the aniline removal. For the removal of around60%, for instance, the required time has been decreased frommore than 120 min to about 30 min. As noted in Figure 6,the maximum aniline removal was determined to be 82% atirradiation and temperature of 2 h and 323 K, respectively.
The reason of this observation is thought to be thefact that temperature is an important factor affecting theadsorption and photocatalysis. In the case of photocatalyticprocess, the photocatalytic degradation rate increases withincreasing temperature. However, the results indicate that thereaction rate plays a more important role than adsorptionrate in the degradation process of aniline. In other words,higher temperature provides higher TiO2 electron transfersin valance bond to higher energy levels and hence facilitatingthe electron-hole production that could be utilized ininitiating oxidation and reduction reactions, respectively[24]. The species photon-generated holes (h+
vb), and electrons(ecb), and hydroxyl radicals (OH•) can thus degrade organicpollutant to intermediates, and then the intermediates arefurther degraded to CO2 and H2O.

6 International Journal of Photoenergy
0
10
20
30
40
50
60
70
80
90
100
0 0.5 1 1.5 2 2.5
Irradiation time (h)
An
ilin
e re
mov
al (
%)
T = 293 KT = 323 KT = 313 K
T = 303 K
Figure 6: Effect of temperature on aniline removal (initial pH: 6,catalyst concentration: 60 mg/L).
T = 293 KT = 323 KT = 313 K
T = 303 K
0 0.5 1 1.5 2 2.5
Irradiation time (h)
2
1.8
1.6
1.4
1.2
1
0.8
0.6
0.4
0.2
0
ln(C
0/C
)
Figure 7: Linear fit of reactions at different temperature (initial pH:6, catalyst concentration: 60 mg/L).
In order to obtain activation energy (E) for photocat-alytic degradation of aniline, the rate data were modeled byfirst-order kinetics as in the following equation:
dC
dt= −kC, (9)
where t is reaction time, C is concentration of aniline, andk is the rate constant which has the following temperaturedependency:
k = A exp(−ERT
), (10)
where A is the preexponential factor, E is the activationenergy, R is the universal gas constant, and T is thetemperature in Kelvin. Integrating (9) gives
ln(C0
C
)= k · t. (11)
Figure 7 shows the correlation between the ln(C0/C) andthe reaction time (t) in the photoreactor drawn based on
Table 4: Effect of temperature on photocatalytic degradation ofaniline under UV illumination in HCBR (experimental conditions:initial aniline: 50 mg/L; catalyst concentration: 60 mg/L; pH: 6).
Temperature (K) Equation Kap R2
293 0.266x + 0.397 0.266 0.969
303 0.286x + 0.466 0.286 0.984
313 0.459x + 0.397 0.459 0.956
323 0.539x + 0.646 0.539 0.985
0
0.2
0.4
0.6
0.8
1
1.2
1.4
1.6
0.00
305
0.00
31
0.00
315
0.00
32
0.00
325
0.00
33
0.00
335
0.00
34
0.00
345
y= 2445.4x− 6.9568
R2 = 0.9195
−lnk
1/T (K− 1)
Figure 8: Effect of temperature on rate constants.
(11) under conditions (pH of 6, catalyst concentration of60 mg/L) at four different temperatures (293, 303, 313, and323).
The data fitted well with an R2 > 0.96. The high valuesof the determination coefficients (R2) clearly indicate thatfirst-order kinetics can be applied with a good degree ofprecision. The values of kinetic constant (k) were calculatedto be in the range of 0.266–0.539 (h−1) (Figure 7 andTable 4). As expected, the rate constant k increases withincreasing temperature, and k is very sensitive to the changeof temperature. To calculate the activated energy E andconstant A, (10) was transformed into a logarithmic form,which was plotted in Figure 8. From the slope and interceptof the best-fit line, the following values were found, A =1048.1 and E = 20.337 kJ/mol.
Finally, the reaction kinetic equation of photocatalyticdegradation of aniline is
−dCdt= 1048.1 exp
(20327RT
)COD. (12)
This indicates that the reaction has high activation energy.
3.4. Investigation on Mineralization of Aniline. Total organiccarbon (TOC) is the amount of carbon bound in anorganic compound and is often used as a nonspecificindicator of water quality. Using this criterion, the min-eralization of aniline was investigated under the processof photocatalytic degradation under optimum operatingconditions. For the initial concentration of 50 mg/L of anilineand under the optimum conditions, the TOC values were

International Journal of Photoenergy 7
4.14
9.14
14.14
19.14
24.14
5 10 15 20 25
mvo
lt
(a)
(b)
t(min)
− 0.86
nC5 Aniline
nC6
2.4 DM cyclopentane
i pentene
Toluene
iC8
nC8
iC9
Et-benzene
C10
Benzene
M cyclopentanenC7
Figure 9: Comparison of chromatograms for degradation of aniline and other compounds in real petroleum refinery wastewater (catalystconcentration: 100 mg/L, initial PH: 7, temperature (T): 293 K, and irradiation time: 2h).
measured at different times and the appropriate conversionwas calculated. Using the photocatalysis process and after120 min, TOC decreased from 39 mg/L to about 12.4 mg/L,equivalent of about 68.2% efficiency. The results indicatean effective mineralization of aniline a short time (about60 min).
3.5. Treatment of Petroleum Refinery Wastewater containingAniline in the Vertical Circulating Photocatalytic Reactor.In order to investigate the performance of this circulat-ing photocatalytic reactor in the removal of aniline fromreal wastewater, a laboratory test was performed usingthe pretreated petroleum refinery wastewater sample (afterelectrochemical methods). The sample was collected fromthe point that the wastewater is just leaving the dissolvedair flotation (DAF) and just into the biological treatmentunit in the Kermanshah refinery plant. Total chemicaloxygen demand (TCOD), measured at this point, was about220 mg/L. Other specifications were, pH: 7.1, turbidity: 85NTU, and total dissolved solids (TDS): 560 mg/L. In theline with this, the reactor was operated under conditions(pH of 7.1 (natural), catalyst concentration of 100 mg/L,and irradiation time of 120 min) at temperatures of 293 K.In order to identify the present organic compounds in thesamples and to compare the efficiency of degradation fordifferent compounds, 10 mL samples of wastewater weretaken before and after the degradation. The catalyst particleswere separated and analyzed by means of the GC/MS. InFigure 9, (a) and (b) present the chromatograms of theanalyzing wastewater before and after the degradation underoptimum conditions. The major peaks have been labeled byname according to the GC/MS identification. Comparison oftwo chromatograms in the figure proved that all pollutantswere degraded at relatively high efficiencies. The maximum
TCOD removal efficiency was found to be more than85%.
4. Conclusions
The influences of catalyst concentration, initial pH, temper-ature, and irradiation time on the degradation rate of anilinewere investigated in a vertical circulating photocatalyticreactor. The variation of pH has a pronounced effect ondegradation rate; alkaline condition promotes the rate con-siderably because of change of surface charge, whereas acidicenvironment casts a negative effect on degradation. Besides,the catalyst concentration also influences the degradationrate, and the rate constant reaches the peak when the TiO2
concentration is 60 mg/L and then decreases when increasingto 80 mg/L. The temperature (in the range of 293–313 K)did not show a strong effect on the process, as only asmall difference is observed in the results obtained withdifferent temperature (293, 303, and 313 K). However, theresults reveal that the aniline degradation efficiency canbe effectively improved by increasing pH from 2 to 12 orincreasing the temperature from 313 to 323 K. Conclusively,an optimum condition for vertical circulating photocat-alytic reactor operation with initial aniline concentration of50 mg/L was achieved as follows: initial pH at 12, catalystconcentration at 60 mg/L, and temperature at 323 K. Theactivation energy for the photocatalytic degradation ofanilines is 20.337 kJ/mol and Langmuir Hinshelwood canbe used to describe the photodegradation reaction. Thepossibility of vertical circulating photocatalytic reactor inthe treatment of petroleum refinery wastewater was alsoinvestigated. The results of the experiments indicated thatit can therefore be potentially applied for the treatment ofwastewater contaminated by different organic pollutants.

8 International Journal of Photoenergy
Acknowledgments
The financial supports provided by Kermanshah OilRefinery Company (KORC) is greatly acknowledged. Theauthors acknowledge the laboratory equipments providedby Academic Center for Education, Culture, and Research(ACECR), Razi University, Kermanshah, that have resultedin this paper.
References
[1] USEPA, United States Environmental Protection Agency,OPPT Chemical Fact Sheets, Aniline Fact Sheet, SupportDocument (CAS No. 62-53-3) December 1994.
[2] J. Li and Z. Jin, “Effect of hypersaline aniline-containingpharmaceutical wastewater on the structure of activatedsludge-derived bacterial community,” Journal of HazardousMaterials, vol. 172, no. 1, pp. 432–438, 2009.
[3] J. O’Brien, T. F. O’Dwyer, and T. Curtin, “A novel process forthe removal of aniline from wastewaters,” Journal of HazardousMaterials, vol. 159, no. 2-3, pp. 476–482, 2008.
[4] S. V. Kotelevtsev, O. O. P. Hanninen, P. A. Lindstrom-Seppa etal., “Mutagenicity of bleached and unbleached effluents fromBaikalsk pulp and paper mill at Lake Baikal, Russia,” AquaticEcosystem Health & Management, vol. 3, no. 1, pp. 95–104,2000.
[5] J. Sarasa, S. Cortes, P. Ormad, R. Gracia, and J. L. Ovelleiro,“Study of the aromatic by-products formed from ozonation ofanilines in aqueous solution,” Water Research, vol. 36, no. 12,pp. 3035–3044, 2002.
[6] N. Goonewardena, M. Nasu, A. Okuda, K. Tani, Y. Takubo,and M. Kondo, “Biodegradation of aniline and abundanceof potential degraders in river waters.,” Biomedical andEnvironmental Sciences, vol. 5, no. 1, pp. 25–32, 1992.
[7] G. Ersoaz and S. Atalay, “Kinetic modeling of the removalof aniline by low-pressure catalytic wet air oxidation over ananostructured Co3O4/CeO2 catalyst,” Industrial and Engi-neering Chemistry Research, vol. 50, no. 1, pp. 310–315, 2011.
[8] N. A. Laoufi, D. Tassalit, and F. Bentahar, “The degradationof phenol in water solution by TiO2 photocatalyst in a helicalreactor,” Global Nest Journal, vol. 10, pp. 404–418, 2008.
[9] M. S. Kuyukina, I. B. Ivshina, M. K. Serebrennikova et al.,“Petroleum-contaminated water treatment in a fluidized-bedbioreactor with immobilized Rhodococcus cells,” InternationalBiodeterioration and Biodegradation, vol. 63, no. 4, pp. 427–432, 2009.
[10] N. Azbar, T. Yonar, and K. Kestioglu, “Comparison ofvarious advanced oxidation processes and chemical treatmentmethods for COD and color removal from a polyester andacetate fiber dyeing effluent,” Chemosphere, vol. 55, no. 1, pp.35–43, 2004.
[11] I. Oller, W. Gernjak, M. I. Maldonado, L. A. Perez-Estrada,J. A. Sanchez-Perez, and S. Malato, “Solar photocatalyticdegradation of some hazardous water-soluble pesticides atpilot-plant scale,” Journal of Hazardous Materials, vol. 138, no.3, pp. 507–517, 2006.
[12] A. Garcıa-Ripoll, A. M. Amat, A. Arques et al., “Increasedbiodegradability of UltracidTM in aqueous solutions withsolar TiO2 photocatalysis,” Chemosphere, vol. 68, no. 2, pp.293–300, 2007.
[13] T. Ohno, K. Sarukawa, K. Tokieda, and M. Matsumura, “Mor-phology of a TiO2 photocatalyst (Degussa, P-25) consisting of
anatase and rutile crystalline phases,” Journal of Catalysis, vol.203, no. 1, pp. 82–86, 2001.
[14] APHA, Standard Methods for the Examination of Water andWastewater, American Public Health Association, Washing-ton, DC, USA, 19th edition, 1999.
[15] L. Wenhua, L. Hong, C. Sao’an, Z. Jianqing, and C. Chunan,“Kinetics of photocatalytic degradation of aniline in waterover TiO2 supported on porous nickel,” Journal of Photochem-istry and Photobiology A, vol. 131, no. 1–3, pp. 125–132, 2000.
[16] R. Wang, D. Ren, S. Xia, Y. Zhang, and J. Zhao, “Photocatalyticdegradation of Bisphenol A (BPA) using immobilized TiO2
and UV illumination in a horizontal circulating bed photocat-alytic reactor (HCBPR),” Journal of Hazardous Materials, vol.169, no. 1–3, pp. 926–932, 2009.
[17] S. Horikoshi, N. Watanabe, M. Mukae, H. Hidaka, and N. Ser-pone, “Mechanistic examination of the titania photocatalyzedoxidation of ethanolamines,” New Journal of Chemistry, vol.25, no. 8, pp. 999–1005, 2001.
[18] A. Emeline, A. Salinaro, V. K. Ryabchuk, and N. Serpone,“Photo-induced processes in heterogeneous nanosystems.From photoexcitation to interfacial chemical transforma-tions,” International Journal of Photoenergy, vol. 3, no. 1, pp.1–16, 2001.
[19] L. Sanchez, J. Peral, and X. Domenech, “Photocatalyzeddestruction of aniline in UV-illuminated aqueous TiO2 sus-pensions,” Electrochimica Acta, vol. 42, no. 12, pp. 1877–1882,1997.
[20] J. M. Herrmann, “Heterogeneous photocatalysis: fundamen-tals and applications to the removal of various types ofaqueous pollutants,” Catalysis Today, vol. 53, no. 1, pp. 115–129, 1999.
[21] J. Saien and S. Khezrianjoo, “Degradation of the fungicidecarbendazim in aqueous solutions with UV/TiO2 process:optimization, kinetics and toxicity studies,” Journal of Haz-ardous Materials, vol. 157, no. 2-3, pp. 269–276, 2008.
[22] K. Mehrotra, G. S. Yablonsky, and A. K. Ray, “Macro kineticstudies for photocatalytic degradation of benzoic acid inimmobilized systems,” Chemosphere, vol. 60, no. 10, pp. 1427–1436, 2005.
[23] C. Richard, P. Boule, and J. M. Aubry, “Oxidizing speciesinvolved in photocatalytic transformations on zinc oxide,”Journal of Photochemistry and Photobiology A, vol. 60, no. 2,pp. 235–243, 1991.
[24] J. Saien and H. Nejati, “Enhanced photocatalytic degradationof pollutants in petroleum refinery wastewater under mildconditions,” Journal of Hazardous Materials, vol. 148, no. 1-2,pp. 491–495, 2007.

Hindawi Publishing CorporationInternational Journal of PhotoenergyVolume 2012, Article ID 381971, 7 pagesdoi:10.1155/2012/381971
Research Article
Photoreduction of Cr(VI) Ions in Aqueous Solutionsby UV/TiO2 Photocatalytic Processes
Chih Ming Ma,1 Yung Shuen Shen,2 and Po Hsiang Lin3
1 Department of Cosmetic Application and Management, St. Mary’s Medicine Nursing and Management College, Yi-Lan 266, Taiwan2 Holistic Education Center, Mackay Medical College, Taipei 252, Taiwan3 Department of Environmental Engineering, Da-Yeh University, Changhwa 512, Taiwan
Correspondence should be addressed to Chih Ming Ma, [email protected]
Received 1 June 2012; Revised 19 July 2012; Accepted 31 July 2012
Academic Editor: Meenakshisundaram Swaminathan
Copyright © 2012 Chih Ming Ma et al. This is an open access article distributed under the Creative Commons Attribution License,which permits unrestricted use, distribution, and reproduction in any medium, provided the original work is properly cited.
This study discussed the photoreduction of Cr(VI) ions in aqueous solutions by UV/TiO2 photocatalytic processes under variousoperational factors. Experimental results showed that the removal rate of Cr(VI) increased with decreasing solution pH values andwith increasing dosages of organic compounds, indicating that the recombination rate of electrons and h+ can be retarded in thereaction systems by the addition of the scavenger, thus raising the reaction rate of Cr(VI). The relationship of the chemical reactionrate of Cr(VI), TiO2 dosage, and changes of Cr(VI) concentration was expressed by the pseudo-first-order kinetic equation.Comparing the experimental results of two different doping metals in modified TiO2 photoreduction systems, the removal rate ofCr(VI) by the Ag/TiO2 process is larger, possibly because the electron transferring ability of Ag is superior to that of Cu. However,the photoreduction rates of Cr(VI) by modified UV/TiO2 processes are worse than those by a nonmodified commercial UV/TiO2
process.
1. Introduction
Chromium is a common toxic pollutant present in industrialeffluents [1, 2]. Conventional methods used in the removalof Cr(VI) ions from wastewater include reducing followinghydroxide precipitation, ion exchange, adsorption, electro-chemical precipitation, foam separation, membrane separa-tion, solvent extraction, and bacterial reduction [2–4]. Inrecent years, different semiconductors have been intensivelystudied as the photocatalysts for photoreduction reactions, aselectron-hole pairs can be generated by the photoexcitationof the photoreduction process to remove and recycle heavymetals and to reduce heavy metal pollutants in aqueoussolution [5–8]. The photocatalysts which are often usedinclude TiO2, CdS, and ZnO. TiO2 has been extensivelystudied in regard to its application as the physical sunblock insunscreens or other cosmetic products and in environmentalremediation processes because of its high degree of photocat-alytic activity, chemical stability, and nontoxicity [5–10].
In the reaction process of UV/TiO2, an electron-hole pairis generated after TiO2 has been exposed to ultraviolet light(UV) with a wavelength (λ = 365 nm) in the near visible
spectrum. The electrons then reduce the heavy metals; this isthe reduction path. The hole generates the free radicalthrough a series of reactions, and then organic matters areoxidized into carbon dioxide; this is the oxidation path.However, a shortcoming of this process is that the electron-hole pair may be bound again, thus decreasing the efficiencyof the photoreduction. Hence, the addition of an organichole scavenger enhances the photoreduction effect. Gener-ally, organic holes scavengers comprise organic compoundssuch as methanol, ethanol, formic acid, and acetic acid [11].
Chromium is widely used in several industrial processessuch as metal plating and paint making. Due to its acutetoxicity and high mobility in water, Cr(VI) is in the list ofpriority pollutants of most countries [6]. On the other hand,Cr(III) is readily precipitated or adsorption onto solid phase.Cr(VI) has a toxicity one hundred times higher than thatof Cr(III). Advanced oxidation processes have demonstratedtheir usefulness in cleaning of industrial wastewater [12–14].After the photoreduction of Cr(VI), it can be separated fromthe suspension by several procedures. From the environmen-tal point of view knowledge of chromium, photoreductionmechanism is essential not only for tracing Cr(VI) fate in

2 International Journal of Photoenergy
environment, but also for understanding its role in remedia-tion of pollution by organic compounds [9].
The aim of this study was to use commercial TiO2 andan organic hole scavenger together. Previous work has sel-dom probed into the doping metals (Ag and Cu) used in theTiO2 photoreduction system; therefore, this study examinedthe impact of different calcination temperatures on the activ-ity of modified photocatalysts with Ag(NO3)- and CuCl2-doped commercial TiO2. Further, the Cr(VI) removal undervarious operational factors, such as solution pH values, TiO2
dosages, types, and dosages of organic compound, wasexplored, and a possible reaction kinetic equation has beenproposed to simulate the kinetic behaviors of various speciesin the reaction.
2. Materials and Method
The materials of this experiment comprised laboratorymethanol, ethanol, and isopropanol with different con-centrations (0.29 mM, 0.74 mM, 1.47 mM, 2.94 mM, and5.88 mM) to observe the dosage effect of organic holescavengers, potassium dichromate (Katayama Chemical) toprepare 20 mg L−1 of aqueous solution, and the photocatalystusing Degussa P-25 (Union Chemical Ind.).
2.1. Wastewater Preparation. 0.1130 g potassium dichromatewas weighed and then combined with 2 L RO water to pre-pare the aqueous solution with a Cr(VI) concentration of20 mg L−1.
2.2. Photocatalyst Modification. Via the incipient wetnessmethod, Cu and Ag were calcined in a modified TiO2 process.First, the critical moisture content of TiO2 was measured bysolvent, the fixed amount of metal precursor was dissolved inthe deionized water with the critical moisture content, TiO2
was slowly added to the metal-containing aqueous solutionand well stirred, TiO2 was calcined in a high-temperaturefurnace, and then the grains pulverized into powder once ithad cooled to room temperature. The crystallization levelmorphology and the specific BET surface area of the pho-tocatalyst were determined by a Siemens D-8 X-ray diffrac-tometer (XRD) and a Micromeritics ASAP 2000 analyzer,respectively. Field emission scanning electron microscopy(FESEM, JEOL, JSM-6500F) was operated at 15 kV and usedto measure the surface morphology of the prepared samples.
At the same Cr(VI) concentration, the samples were ana-lyzed every half hour under different pH values, organic holescavengers, dosages of organic hole scavenger, and dosages ofphotocatalyst over the four-hour reaction period. The opti-mum operational conditions thus attained were the opti-mum reaction conditions of modified TiO2. With differentdoping amounts of metal and at different calcination temper-atures under the optimum operational conditions obtained,an analysis of the variations of Cr(VI) concentration wasmade every half hour. The samples were filtered and analyzedby an HITACHI U-2000 Spectrophotometer.
Time (hr)
0 1 2 3 4
Cr6+
(C/C
0)
TiO2 = 0.2 gL− 1
TiO2 = 0.6 gL− 1
TiO2 = 1.2 gL− 1
TiO2 = 1.6 gL− 1
TiO2 = 1 gL− 1
1
0.8
0.6
0.4
0.2
0
Figure 1: Effect of the TiO2 dosage on the photocatalytic reduction.
0
0.1
0.2
0.3
0.4
0.5
0 0.5 1 1.5 2
TiO2 (gL− 1)
kC
r(h
r−1)
Figure 2: Relationship of the rate constant on the photocatalyticreduction.
3. Results and Discussion
This study utilized the UV/TiO2 process to treat Cr(VI) pol-lutants in aqueous solution. In this section, the experimentalresults of the photoreduction of Cr(VI) by a nonmodifiedTiO2 system and modified TiO2 are explained and discussed.In the experiment, the variations of Cr(VI) concentrationover time were as shown in Figure 1; the removal rate ofCr(VI) was 24.1% when the TiO2 dosage was 0.2 g L−1, and80% when the TiO2 dosage was 1.6 g L−1. Therefore, as theTiO2 dosage increased, the removal rate increased.
In a simulation of the Cr(VI) removal rate using thepseudo-first-order kinetic equation, the relationship of theremoval rate and time was obtained, as shown in Figure 2.The photoreduction reaction rate sped up as the TiO2
dosage increased, indicating that the increase of TiO2 dosagefacilitated the photocatalytic reaction. Similar results wereobtained in the presence of other studies [11, 15, 16].Therefore, it was estimated that before the optical screeningappeared, and the TiO2 dosage had a linear relationship withthe pseudo-first-order removal rate.

International Journal of Photoenergy 3
0 1 2 3 40
0.1
0.2
0.3
0.4
0.5
0.6
0.7
0.8
0.9
1
Time (hr)
pH = 3
pH = 5
pH = 9
pH = 11
pH = 7
C/C
0
Figure 3: Effect of the pH on the photocatalytic reduction.
pH
0 2 4 6 8 10 12 14
0.3
0.25
0.2
0.15
0.1
0.05
0
k (h
r−1)
Figure 4: Relationship of the rate constant under different pH.
In order to clarify the relationship of the pseudo-first-order Cr(VI) removal rate, TiO2 dosage, and changes ofCr(VI) concentration, it was assumed that three factors werepresent in the pseudo-first-order reaction kinetic equation asfollows:
−ra = d[C]dt
= k[C][TiO2]n = kCr[C], (1)
where kCr is k[TiO2]n, k is Cr(VI) reduction rate, kCr ispseudo-first-order rate, [C] is variations of Cr(VI) concen-tration over time, and [TiO2] is TiO2 dosage.
With the logarithm of the equation above, we then have
ln kCr = ln k + n ln[TiO2], (2)
by plotting ln kCr and ln[TiO2], intercepting to get ln k =−1.4058 and k = 0.2344; then from the slope we have n =0.87. Thus, for the relationship of the pseudo-first-order
0 0.5 1 1.5 2 2.5 3 3.5 40
0.1
0.2
0.3
0.4
0.5
0.6
0.7
0.8
0.9
1
Time (hr)
C/C
0
5.88 mM2.94 mM1.47 mM
0.74 mM0.29 mMNo ethanol
Figure 5: Effect of initial concentration on the photocatalyticreduction.
removal rate, TiO2 dosage and variations of Cr(VI) concen-tration over time, the following equation was derived fromthe three equations above:
−ra =d[
Cr6+]
dt
= 0.2344[
Cr6+]
[TiO2]0.87 (R2 = 0.9887
).
(3)
The Cr(VI) reduction rate was in an 0.87th power rela-tion with the TiO2 dosage. The initial Cr(VI) concentrationwas fixed at 20 mg L−1 for treatment of Cr(VI) in aqueoussolution by UV/TiO2. The changes of Cr(VI) over time underdifferent values are shown in Figure 3, from which we couldknow that with the increase of pH value, the Cr(VI) removalrate gradually declined. At pH = 3, the removal rate was63.5%, but, at pH = 11, the removal rate was just 5.1%.
As for the experimental results, the Cr(VI) removal ratewas simulated by the pseudo-first-order kinetic equation todetermine the removal rate and time, as shown in Figure 4.Similar results were obtained in the presence of other studies[11, 15, 16], who discussed the influence of different pHvalues of photocatalyst on the removal rate of Cr(VI) byphotoreduction processes. As pointed out by Chen and Cao(2005) [16], as pH value increased, the reduction rate ofdichromate ions gradually decreased because the increase ofpH value reduced the adsorption of dichromate ions on thesurface of the photocatalyst; also, at high pH value, Cr(OH)3
covered the surface active position of TiO2 so that thetrivalent chromium deposits on TiO2 depressed the photo-catalytic activity. Consequently, for the photoreduction ofCr(VI) in aqueous solution by UV/TiO2 process, a low pHvalue had the best reduction efficiency. The variations ofCr(VI) concentration over time in the experiment to discoverthe dosing effect of organic hole scavengers are shown inFigure 5. The Cr(VI) removal rate was the best, as high as74% for a dosage of 2.94 mM, in the ethanol system.
Ethanol was used as the hole scavenger and at theoptimum dosage of 2.94 mM, under different pH values and

4 International Journal of Photoenergy
No ethanol
Ethanol
pH
0 2 4 6 8 10 12 14
0.35
0.3
0.25
0.2
0.15
0.1
0.05
0
k (h
r−1)
(a)
No ethanol
Ethanol
0 0.4 0.8 1.2 1.6 2
0.6
0.5
0.4
0.3
0.2
0.1
0
k (h
r−1)
TiO2 dose (gL− 1)
(b)
Figure 6: Relationship of the rate constant under different pHvalues and different TiO2 dose.
different TiO2 dose, and the influence of adding ethanol asthe hole scavenger on the Cr(VI) removal rate was deter-mined. The results are presented in Figure 6.
Adding ethanol facilitated the photoreduction of Cr(VI),but, at high pH values, the addition of ethanol did notachieve this result; when TiO2 was added, ethanol promotedthe Cr(VI) removal rate. Plotting ln[TiO2] and ln k afteradding ethanol and using the pseudo-first-order removalrate, the relationship of TiO2 dosage and variations of Cr(VI)concentration could be determined as follows:
−rE = d[Cr6+
]dt
= 0.3132[Cr6+][TiO2]0.81 (
R2 = 0.9789).
(4)
When ethanol was added as the hole scavenger, thepseudo-first-order Cr(VI) removal rate was higher thanbefore the addition.
The Cr(VI) removal rate was examined under nonre-duced and reduced modified TiO2 systems at the fixed pH =3, with a 2.94 mM dose of ethanol as the organic hole
Table 1: The rate constant of reduction and nonreduction on theCr(VI) concentration after the doping of metallic ions.
Reduced Nonreduced
0.5% 2.0% 5.0% 0.5% 2.0% 5.0%
Cu 0.110 0.101 0.129 0.111 0.097 0.104
Ag 0.131 0.129 0.156 0.107 0.123 0.136
Table 2: Surface area of P-25 TiO2, 5% Ag/TiO2 and 5% Cu/TiO2.
Material Metals added (wt%) Surface area (m2 g−1)
TiO2 (P-25) — 53.61
0.5 57.82
Ag/TiO2 2.0 57.68
5.0 59.38
0.5 57.03
Cu/TiO2 2.0 58.42
5.0 58.79
scavenger; the Cr(VI) removal reaction behaviors undervarious operational factors were solved by the pseudo-first-order reaction kinetic equation.
This section discusses the effects of reduction and non-reduction on the Cr(VI) concentration after the doping ofmetallic ions. The experimental results were as shown inTable 1. The Cr(VI) removal rate of reduced 5 wt% Cu/TiO2
was 0.1298 hr−1, which was 1.24 times that of the nonre-duced. In the Ag-doped system, the Cr(VI) removal rates ofthe triple doping after reduction were higher than those ofthe nonreduced. The Cr(VI) removal rate of reduced 5 wt%Ag/TiO2 was 0.156 hr−1, 1.14 times higher than that ofnonreduced 5 wt% Ag/TiO2. Furthermore, the surface area ofAg/TiO2 and Cu/TiO2 from the BET surface area mea-surements was only slightly increased, as shown in Table 2.Figure 7 presents the surface structure and morphology of5% Ag/TiO2 before and after photocatalysis. It was clearlyobserved from SEM images that surface of catalyst was nodifference between them.
For the experiment results of the two kinds of modifiedTiO2, the removal rate simulated by the pseudo-first-orderkinetic equation and the doped percent were plotted, asshown in Figure 8, to explore the relationship of two kindsof modified TiO2 under the condition of reduced or nonre-duced. As the figure clearly shows, reduced or not, the Cr(VI)removal rate of Ag(NO)3-modified TiO2 was higher thanthat of CuCl2-modified TiO2. These results were consistentwith other studies [17, 18] discussion on the modified TiO2
and TiO2 reduction reaction. Ag had a higher electron cap-ture, and Ag ions doped on TiO2 played the role of an elec-tron storage system to improve photocatalytic activity so asto quickly transfer electrons.
The Cr(VI) removal rates in the two systems with the ini-tial Cr(VI) concentration of 20.0 mg L−1, pH = 3, [M/TiO2]= 1.0 g L−1, and ethanol concentration of 2.94 mM areshown in Figure 9. The modified photocatalyst had alower Cr(VI) removal rate than that of the nonmodifiedphotocatalyst, with 5 wt% Ag/TiO2 having the best Cr(VI)

International Journal of Photoenergy 5
(a)
(b)
Figure 7: SEM images of 5% Ag/TiO2 (a) before photoreductionand (b) after photoreduction.
reduction rate of the modified photocatalysts, but a removalrate of less than 50%; the Cr(VI) removal rate of thenonmodified photocatalyst reached 64%. The experimentalresults were consistent with the results of the modifiedTiO2 prepared by the other study [14, 15], and the Cr(VI)reduction rate after being modified was lower than that of thenonmodified.
The reduction of Cr(VI) by electrons in aqueous solutionbasically follows the following reactions:
Cr6+ + 3e− −→ Cr3+. (5)
Liu et al. [18] reported that Cr(VI) photocatalyticreduction by directly capturing photogenerated electrons ispossible, but is mainly realized indirectly by getting electronsfrom surface Ti3+ of TiO2 photocatalyst. The reactions wereas follows [18]:
Cr6+suspension −→ Cr6+
adsorbed, (6)
TiO2 −→ e− + h+, (7)
0 1 2 3 4 50
0.04
0.08
0.12
0.16
Ag(R)
Cu(R)
Ag(N)
Cu(N)
Doped (%)
k(h
r−1)
Figure 8: Relationship of the rate constant on the photocatalyticreduction by modified TiO2.
0 1 2 3 40
0.2
0.4
0.6
0.8
1
0.5% Ag
2% Ag
5% Ag
0.5% Cu
2% Cu
5% Cu
No doped
Time (hr)
C/C
0
Figure 9: Relationship of the Cr(VI) removal rates on thephotocatalytic reduction by modified TiO2.
Ti4+ + e− −→ Ti3+, (8)
Ti3+ + Cr6+adsorbed −→ Cr3+
adsorbed + Ti4+, (9)
Cr6+adsorbed + 3e− −→ Cr3+
adsorbed. (10)
During the photoreduction of Cr(VI) ions in aqueoussolutions by UV/TiO2 photocatalytic processes, the TiO2
surface changed from the original white to light yellowafter adsorption, and light green after the reaction. Thismeant that, after photoreduction, Cr(VI) deposited on theTiO2 surface in the form of Cr(III). Comparing with theexperimental results reported by previous researcher [11],chromium on the surface of TiO2 particles was identified tobe Cr(III), while no indication of the presence of Cr(VI) wasobserved.

6 International Journal of Photoenergy
400
300
200
100
00 20 40 60 80
(a)
400
300
200
100
00 20 40 60 80
(b)
400
300
200
100
00 20 40 60 80
(c)
Figure 10: X-ray diffraction patterns of catalysts: (a) TiO2 (P25),(b) 5% Ag/TiO2, and (c) 5% Cu/TiO2.
The impact of Cr(III) deposition on TiO2 surface prop-erties and structure after photoreduction was determined byXRD. The results are presented in Figure 10. For theXRD measurement, the crystal type analysis of doped 5%nonreduced Cu- and 5% nonreduced Ag-modified TiO2 afterreaction was made. The wave peaks appeared at the sameangle, so it was concluded that Cr(III) deposition afterreaction had no influence on the crystal type of TiO2.
4. Conclusions
The photoreduction reaction rate of Cr(VI) by UV/TiO2
photocatalytic process increased with the increasing TiO2
dosage in the solution; from the pseudo-first-order modeland Cr(VI) removal experiments, it was found that the
relationship of the pseudo-first-order Cr(VI) removal rate,TiO2 dosage, and variations of Cr(VI) concentration was
−ra = d[Cr6+
]dt
= 0.2344[Cr6+][TiO2]0.87. (11)
The Cr(VI) reduction rate was in a 0.87th power relationwith the TiO2 dosage. When ethanol was added as theorganic hole scavenger, the relationship of the pseudo-first-order Cr(VI) removal rate, TiO2 dosage, and variations ofCr(VI) concentration was
−rE = d[Cr6+
]dt
= 0.3132[Cr6+][TiO2]0.81. (12)
The added ethanol facilitated the Cr(VI) reduction rateand resulted in a better reduction effect than when ethanolwas not added. The photoreduction reaction rate of Cr(VI)by the UV/TiO2 photocatalytic process decreased with theincreasing pH values of the solution. We found from theCr(VI) removal experiment that as pH value increased, thereduction rate of dichromate ions gradually decreasedbecause the increase in pH value reduced the adsorption ofdichromate ions on the surface of the photocatalyst; also, athigh pH value, Cr(OH)3 covered the surface active positionof TiO2 so that the trivalent chromium deposited on TiO2
depressed the photocatalytic activity.With the solutions at pH = 3, methanol, ethanol,
and isopropanol were added as organic hole scavengers.Methanol and ethanol had the largest Cr(VI) removal rates of0.3029 and 0.3066 hr−1, respectively, at a concentration of2.94 mM. With the increasing isopropanol concentration, theCr(VI) removal rate gradually rose and reached 0.2848 hr−1
at 5.88 mM. In the photocatalytic reduction experiment ofCr(VI) by CuCl2 and Ag(NO3)-doped TiO2, the Ag(NO3)-doped TiO2 process had the better removal rate of Cr(VI),with the optimum removal rate of 38.1%, which was 1.04times the 36.6% removal rate of the CuCl2-doped TiO2
process. However, the removal rates of modified TiO2 werelower than those of nonmodified TiO2.
Acknowledgments
Financial support from the National Science Council,through Grant NSC-100-2622-E-562-002-CC3, is gratefullyacknowledged.
References
[1] E. Vaiopoulou and P. Gikas, “Effects of chromium on activatedsludge and on the performance of wastewater treatmentplants: a review,” Water Research, vol. 46, no. 3, pp. 549–570,2012.
[2] M. Owlad, M. K. Aroua, W. A. W. Daud, and S. Baroutian,“Removal of hexavalent chromium-contaminated water andwastewater: a review,” Water, Air, and Soil Pollution, vol. 200,no. 1–4, pp. 59–77, 2009.
[3] P. Religa, A. Kowalik, and P. Gierycz, “Application ofnanofiltration for chromium concentration in the tannerywastewater,” Journal of Hazardous Materials, vol. 186, no. 1,pp. 288–292, 2011.

International Journal of Photoenergy 7
[4] L. Altas, “Effects of chromium (VI) on the activities ofureolytic mixed culture,” Journal of Chemical Technology andBiotechnology, vol. 84, no. 2, pp. 229–235, 2009.
[5] M. V. Dozzi, A. Saccomanni, and E. Selli, “Cr(VI) photocat-alytic reduction: effects of simultaneous organics oxidationand of gold nanoparticles photodeposition on TiO2,” Journalof Hazardous Materials, vol. 211-212, pp. 188–195, 2012.
[6] G. Cappelletti, C. L. Bianchi, and S. Ardizzone, “Nano-titaniaassisted photoreduction of Cr(VI). The role of the differentTiO2 polymorphs,” Applied Catalysis B, vol. 78, no. 3-4, pp.193–201, 2008.
[7] S. G. Schrank, H. J. Jose, and R. F. P. M. Moreira, “Simul-taneous photocatalytic Cr(VI) reduction and dye oxidationin a TiO2 slurry reactor,” Journal of Photochemistry andPhotobiology A, vol. 147, no. 1, pp. 71–76, 2002.
[8] H. Lahmar, M. Kebir, N. Nasrallah, and M. Trari, “Pho-tocatalytic reduction of Cr(VI) on the new hetero-systemCuCr2O4/ZnO,” Journal of Molecular Catalysis A, vol. 353-354,pp. 74–79, 2012.
[9] P. Mytych, A. Karocki, and Z. Stasicka, “Mechanism ofphotochemical reduction of chromium(VI) by alcohols andits environmental aspects,” Journal of Photochemistry andPhotobiology A, vol. 160, no. 3, pp. 163–170, 2003.
[10] A. Idris, N. Hassan, R. Rashid, and A. F. Ngomsik, “Kineticand regeneration studies of photocatalytic magnetic separablebeads for chromium (VI) reduction under sunlight,” Journalof Hazardous Materials, vol. 186, no. 1, pp. 629–635, 2011.
[11] Y. Ku and I. L. Jung, “Photocatalytic reduction of Cr(VI) inaqueous solutions by UV irradiation with the presence oftitanium dioxide,” Water Research, vol. 35, no. 1, pp. 135–142,2001.
[12] R. Velmurugan, K. Selvam, B. Krishnakumar, and M. Swami-nathan, “An efficient reusable and antiphotocorrosive nanoZnO for the mineralization of Reactive Orange 4 under UV-A light,” Separation and Purification Technology, vol. 80, no. 1,pp. 119–124, 2011.
[13] C. M. Ma, G. B. Hong, H. W. Chen, N. T. Hang, and Y. S. Shen,“. Photooxidation contribution study on the decompositionof azo dyes in aqueous solutions by VUV-based AOPs,”International Journal of Photoenergy, vol. 2011, Article ID156456, 8 pages, 2011.
[14] R. Amadelli, L. Samiolo, A. Maldotti, A. Molinari, and D. Gaz-zoli, “Selective photooxidation and photoreduction processesat TiO2 surface-modified by grafted vanadyl,” InternationalJournal of Photoenergy, vol. 2011, Article ID 259453, 10 pages,2011.
[15] T. Aarthi and G. Madras, “Photocatalytic reduction of metalsin presence of combustion synthesized nano-TiO2,” CatalysisCommunications, vol. 9, no. 5, pp. 630–634, 2008.
[16] S. F. Chen and G. Y. Cao, “Study on the photocatalyticreduction of dichromate and photocatalytic oxidation ofdichlorvos,” Chemosphere, vol. 60, no. 9, pp. 1308–1315, 2005.
[17] G. Guan, T. Kida, and A. Yoshida, “Reduction of carbondioxide with water under concentrated sunlight using photo-catalyst combined with Fe-based catalyst,” Applied Catalysis B,vol. 41, no. 4, pp. 387–396, 2003.
[18] S. X. Liu, Z. P. Qu, X. W. Han, and C. L. Sun, “A mechanismfor enhanced photocatalytic activity of silver-loaded titaniumdioxide,” Catalysis Today, vol. 93, no. 5, pp. 877–884, 2004.

Hindawi Publishing CorporationInternational Journal of PhotoenergyVolume 2012, Article ID 578916, 7 pagesdoi:10.1155/2012/578916
Research Article
Photocatalytic Treatment of Shower Water Usinga Pilot Scale Reactor
Yash Boyjoo, Ming Ang, and Vishnu Pareek
Department of Chemical Engineering, Curtin University, Perth, WA 6102, Australia
Correspondence should be addressed to Vishnu Pareek, [email protected]
Received 27 April 2012; Revised 13 June 2012; Accepted 14 June 2012
Academic Editor: Mika Sillanpaa
Copyright © 2012 Yash Boyjoo et al. This is an open access article distributed under the Creative Commons Attribution License,which permits unrestricted use, distribution, and reproduction in any medium, provided the original work is properly cited.
Treatment of shower water deserves special consideration for reuse not only because of its low pollutant loading but also becauseit is produced in large quantities. In this study, a pilot scale study of photocatalytic degradation of impurities in real shower waterwas performed in a 31 L volume reactor using titanium dioxide as the photocatalyst. The reactor was operated in a continuousslurry recirculation mode. Several operational parameters were studied including the slurry initial pH, catalyst concentration,air flow rate, and slurry recirculation rate. Up to 57% of total organic carbon (TOC) elimination was obtained after 6 hours oftreatment (for 3.0 slurry initial pH, 0.07 gL−1 catalyst concentration, 1.8 Lmin−1 air flow rate, and 4.4 Lmin−1 slurry recirculationrate). This study showed that photocatalysis could be successfully transposed from bench scale to pilot scale. Furthermore, theease of operation and the potential to use solar energy make photocatalysis an attractive prospect with respect to treatment of greywater.
1. Introduction
Fresh water is getting scarcer. The number of people livingin water-stressed or water-scarce countries is estimated toincrease from half a billion now to three billion in 2025 [1].Water reuse has been dubbed as the greatest challenge of the21st century [2], and, as such, great emphasis is being putinto the development of new technologies for the treatmentof wastewater for reuse.
Since the discovery, in 1977, that titanium dioxide(TiO2) could decompose cyanide in water [3], the fieldof photocatalysis has been receiving increasing interest.Photocatalysis is an advanced oxidation process (AOP) thatuses a catalyst (often TiO2), UV light, and an electronacceptor (O2, O3, H2O2) to completely decompose organicpollutants found in liquids or gases. The basis of the processis the use of low energy UV-A photons (for which theenergy is greater or equal to the band gap energy of thecatalyst) to excite the semiconductor catalyst into chargeseparation and generate electron-hole pairs. The electronsand holes, on separation, assist in the production of thevery reactive hydroxyl radical in the aqueous phase whichcan destroy many toxic organic pollutants. This technology
however works best at low pollutant concentrations (mgL−1
or mmolL−1) and when the catalyst is finely dispersed withinthe medium. The overall process can be described by thefollowing reaction equation:
organic pollutants + O2
semiconductor + UVA light−−−−−−−−−−−−−−−→ CO2 + H2O + mineral acid.(1)
Shower water is part of grey water and is produced by everyhousehold at a substantial amount (15–55 L day−1) with apollutant loading up to 100 mgL−1 [4]. Existing technologiesfor the treatment of grey water include membrane filtration,coagulation, ion exchange, and membrane bioreactors [5,6]. However these techniques are either costly or merelytransfer the pollutants from one medium to another. As aresult, shower water is a good candidate for photocatalytictreatment. The treated water could be reused where potablewater is not required. Such applications include toiletflushing, landscape irrigation, and car washing.
Countless researches have been made on the photocat-alytic treatment of single or a few organic components inwater [7–9]. Real wastewaters on the other hand have a

2 International Journal of Photoenergy
Table 1: Shower water characterization.
TOC (mgL−1) 24.62 ± 0.44
pH 7.37 ± 0.14
Main constituents (as perthe products’ ingredientslist)
Anionic surfactants (sodium laurethsulphate, sodium cocoamphoacetate,sodium lauryl sulphate, ammoniumlaureth sulphate), cationic surfactants(cocamide MEA), nonionicsurfactants (lauryl glucoside, cetylalcohol), fragrance, antimicrobialagents.
multitude of pollutants and take longer to treat (typically afew hours) [10–14].
The photooxidation of surfactants, the main compo-nents of shower water, was extensively studied byHidaka and coworkers [15–19]. They found that photo-degradation decreases in the following order: anionic>nonionic> cationic surfactants, and postulated that photo-catalysis was mainly a surface reaction due to the shortlifetime of hydroxyl radicals. Sanchez et al. [20] successfullyobtained 65% dissolved organic carbon (DOC) removalwith hotel grey water at 29 mgL−1 initial DOC concentrationwhile Zhu et al. found [21] that photocatalysis can effectivelyremove carbonaceous and nitrogenous biochemical oxygendemand from synthetic grey waters. Photocatalysis has alsobeen reported to be efficient in the disinfection of E-coli[22], a microorganism bound to be present in wastewaterthat had had contact with humans. The vast majorityof photocatalytic research has been performed at benchscale. If it is desired to commercialise this technique, pilotscale experiments are required so as to obtain a betterunderstanding of the operational and hydrodynamic factorsinvolved with higher throughputs.
The objective of this research was to study pollutantdegradation in shower water in a pilot scale photocatalyticreactor (31 L volume) operating in a recirculation mode. Theeffect of several parameters such as the initial slurry pH, airflow rate, slurry recirculation rate, and catalyst dosage wasstudied. All experiments were carried out for a period of 6hours, which was deemed a reasonable treatment time.
2. Experimental
2.1. Shower Water Characterisation. Shower water was col-lected daily from the researcher’s home and stocked in thelaboratory prior to the experiments. The same cleaningproducts were used each time (shampoo, face wash, andbody soap) to maintain consistency. The characteristics ofthe collected shower water are presented in Table 1.
The TOC level of the shower water suggests that it is a lowstrength grey water. The main constituents of liquid soapsand shampoos are surfactants which can add up to 80% byweight of chemicals content [23]. Some other constituentsthat may be present in trace amounts in the shower waterinclude sebum, microorganisms, and dyes.
2.2. Reagents and Analytical Methods. Aeroxide P25 titaniumdioxide was purchased from Sigma Aldrich and was used asreceived. The catalyst had the following properties: 21 nmparticle size, 50 ± 15 m2 g−1 BET specific surface area,>99.5% TiO2 content [24], and a band gap energy of 3.2 eV,corresponding to photons with wavelengths less or equal to385 nm [25]. A 6 M hydrochloric acid was used to modifythe slurry pH prior to reaction. Compressed air was usedas feed gas to the reactor and for UV lamp cooling. Tapwater was used to dilute the shower water (if required).Slurry pH was measured with a TPS digital pH meter,which was calibrated periodically. Samples collected werefiltered with 0.45 microns syringe filters and analysed fortotal organic carbon (TOC) on a Shimadzu TOC-VCPH/CPN
analyser (Shimadzu Corporation, Japan).
2.3. Reactor Setup. Figure 1 shows the reactor setup used inthis study. The reactor volume was 31 L (30 cm diameter)and was operated in recirculation mode. Ambient air wassupplied by a compressor via a 10 cm distributor centred atthe bottom of the reactor. Part of the compressed air wasalso used as coolant for the UV lamp. The UV mercurylamp, purchased from Primarc Ltd. (PM 3426, 800 W, 20 cmlength medium pressure mercury lamp), was fitted into aquartz tube and suspended in the middle of the reactor. Adigital thermocouple provided the temperature within thereactor. The temperature was maintained between 26 and28◦C by varying the rate of cooling water which ran througha coiled heat exchanger located around walls at the bottomof the reactor. An Iwaki magnetic pump was used for slurrycirculation. Slurry flow rate was varied using valve V2 whileair flow rate was varied via valve V5.
2.4. Procedure. Shower water was diluted with tap water (ifrequired) and mixed with the titanium dioxide powder in a60 L tank. The pH was adjusted, and the slurry was allowed tomix for 30 minutes to allow for dark adsorption of pollutantsonto the catalyst surface. Compressed air as well as coolingwater was started, and the slurry was transferred to thereactor via the Iwaki magnetic pump. Once the reactor wasfilled, valve V1 was closed, valve V3 was opened to allowthe reactor to operate in recirculation mode, and, finally, thelamp was switched on. Samples were taken in 20 mL aliquotsvia sample valve V6 and were filtered prior to analysis.
3. Results and Discussion
Since the shower water consisted of a myriad of organiccomponents, a realistic way of reporting the pollutantconcentration was by measuring the total organic carbon(TOC in mgL−1) of the samples. The average reaction ratefor TOC elimination was calculated using the followingequation:
−RTOC = TOCinitial − TOCfinal
τ, (2)
where −RTOC is the average rate of degradation of TOC(molL−1min−1), TOCinitial and TOCfinal are the initial and

International Journal of Photoenergy 3
Photocatalytic reactor
InletAir distributor
Outlet
Quartz tube
Mixing tank
Compressed air
Mixer
UV Lamp
Ball valveButterfly valveNeedle valveSlurry pumpSlurry flowmeterAir flowmeter
To AC
V3
V1V2
P1F1
V6
V4
V5F5 F3
F1P1V5V2
F2, F3
V1, V3, V4, V6
Figure 1: Experimental setup for photocatalysis experiments. Shower water was mixed for 30 minutes with catalyst and acid in mixing tankinitially before mixture was sent to the photocatalytic reactor via pump P1. Reactor was operated in recirculation mode.
0.5 1.5 2.5 3.5 4.5 5.5 6.5− 0.5
t(hours)
0
0.05
0.1
0.15
0.2
0.25
TO
C (
mol
L−1)
Dark adsorption
Photocatalysis
× 10− 2
Figure 2: Temporal course for shower water photocatalysis atoptimum conditions (TOC initial concentration = 24.62 ±0.44 mgL−1, average reaction temperature= 27◦C, initial slurrypH = 3.00, 0.07 gL−1 catalyst loading, 1.8 Lmin−1 air flow rate and4.4 Lmin−1 slurry flow rate).
final TOC concentration (molL−1), and τ is the real contacttime (minutes) in the reactor which is 360 minutes.
3.1. Photocatalysis of Shower Water. The temporal courseat optimum conditions for the photocatalysis of showerwater in terms of TOC reduction is illustrated in Figure 2.Part of the TOC was adsorbed onto the catalyst surfaceduring the dark adsorption stage. Upon irradiation, the
TOC concentration increased to a maximum within the firsttwo hours of reaction that corresponded to the initial TOCconcentration prior to dark adsorption. This phenomenonhad been observed previously [17, 26, 27] for the pho-tocatalytic oxidation of anionic surfactants at low initialconcentrations. The initial increase in TOC can be attributedto the formation of intermediates on the catalyst surfacefollowed by photodesorption of the intermediates back intothe liquid medium. Several types of intermediates are formedvia the photooxidation of long chained hydrocarbons. Zhanget al. [27] reported the formation of aldehyde and peroxideintermediates during the photooxidation of surfactants.
A reduction in the TOC concentration was then observedafter 2 hours due to the onset of oxidation of organicpollutants. This reduction was only moderate from t = 2 hto t = 3 h probably due to a large quantity of long chainedorganics/intermediates still remaining in the solution. How-ever, as the photoreaction proceeded, the long chainedorganics/intermediates cleaved into smaller chained interme-diates for which mineralisation to carbon dioxide, water, andmineral acids took place at a faster rate, as observed aftert = 3 h. A maximum of 57% TOC degradation was obtainedwithin 6 hours of treatment at optimum conditions.
3.2. Effect of Slurry Initial pH. The initial pH of the slurryis an important parameter that needs to be considered asit influences the surface charge properties of the catalystparticles [9], hence the adsorption of charged pollutants.Figure 3 shows the effect of the slurry initial pH on theaverage rate of TOC degradation. There was a gradualincrease in the average reaction rate as the pH was decreasedfrom 7.4 (natural pH) to 5.0. The increase in reaction rate

4 International Journal of Photoenergy
2 3 4 5 6 7 8
Slurry pH
0.05
0.1
0.15
0.2
0.25
0.3
0.35× 10− 5
Ave
rage
rea
ctio
n r
ate
(mol
L−1m
in−
1)
Figure 3: Effect of slurry initial pH on average reaction rate(TOC initial concentration = 24.62± 0.44 mgL−1, average reactiontemperature= 27◦C, 0.07 gL−1 catalyst loading, 1.8 Lmin−1 air flowrate and 4.4 Lmin−1 slurry flow rate).
became steeper as the pH was further lowered and reached amaximum at pH = 3.0. Further lowering of the pH to 2.2 ledto a sharp decrease in the reaction rate.
Titanium dioxide is amphoteric by nature which meansthat past a certain pH, it can be either positively or negativelycharged. That pH, which is called the point of zero charge(ZPC), occurs at a value of 6.5 for Aeroxide P25 titaniumdioxide [28]. Hence when pH<ZPC, the TiO2 is positivelycharged while at pH>ZPC, it is negatively charged as shownas follows:
when pH < ZPC: TiOH + H+ ←→ TiOH+2 , (3)
when pH > ZPC: TiOH + OH− ←→ TiO− + H2O. (4)
This implies that at lower pH, the positively charged TiO2
surface can easily attract the negatively charged species fromthe solution, hence facilitating their photooxidation. Themain components of the shower water used were anionicsurfactants as presented in Table 1. As the pH of theslurry was decreased, the positive surface charge of theTiO2 increased, attracting more and more anionic groupsto its surface. This is further evident with the change in thedark adsorption with slurry pH in Figure 4, which showsthat pollutant species during the dark adsorption remainedconstant between pH of 7.4 and 5.0 but then increasedsharply to reach a maximum of 32.4% adsorption at pH3.0. Another research involving anionic surfactants has alsoshown preferential photooxidation at low pH [29, 30].
Being radical scavengers, carbonate anions present inthe wastewater can inhibit photooxidation [31]. However anacidic medium can remove these unwanted anions as per thefollowing equations:
HCO−3 + H+ −→ H2O + CO2, (5)
CO2−3 + 2H+ −→ H2O + CO2. (6)
Nonetheless, Figure 3 shows that a further reduction of pH to2.2 was in fact detrimental to the degradation of TOC. This
2 3 4 5 6 7 8
Slurry pH
0
5
10
15
20
25
30
35
TO
C d
ark
adso
rpti
on (
%)
Figure 4: Effect of slurry initial pH on amount of TOC adsorbed inthe dark.
was attributed to high levels of Cl− ions in the solution. Cl−
ions are scavengers of hydroxyl radicals as well as holes [32]and can therefore greatly reduce the photooxidation process.As the pH was decreased from 3.0 to 2.2, the concentration ofCl− increased exponentially from 1×10⁻³ M to 6.3×10⁻³ M,hence explaining the rapid decrease in the TOC removalrate. The optimum pH of 3.0 was maintained throughoutsubsequent experiments.
3.3. Effect of Catalyst Dosage. Most wastewater photocat-alytic treatment studies report an optimum catalyst concen-tration. Beyond that optimum, the rate of reaction eitherremains unchanged or decreases. Figure 5 shows the effect ofcatalyst loading on the average reaction rate with the rangeof catalyst loading investigated between 0.03 and 0.15 gL−1.It is clear that the optimum catalyst concentration was about0.07 gL−1.
Reported optimum catalyst loadings for wastewatertreatment are usually within a range of 0.1–1 gL−1 [7, 8, 33];however some studies have also reported lower optimumloadings (0.05 gL−1) [34]. However, in all cases, the optimumvalue strongly depends on the reactor design, pollutant type,and concentration [35].
In the current study, a relatively low value of optimumcatalyst loading could be attributed to low concentrationsof shower water as well as the large reactor diameter.Lower catalyst loadings provided sufficient sites for photo-reaction and allowed a maximum possible illumination ofthe reaction space. Beyond those loadings, the decrease inaverage reaction rate was probably due to the backscatteringof light by the catalyst particles, entailing a shielding effecton the remaining reaction space. Simulation studies arecurrently being carried out to verify these hypotheses.
The effect of catalyst concentration, Wcat (gcatL−1), onthe average reaction rate, −RTOC (molL−1 min−1), could bedescribed as:
−RTOC = A +B
(Wcat − C)2 + D, (7)

International Journal of Photoenergy 5
0.160.140.120.10.080.060.040.02
Catalyst loading (gL− 1 )
0.1
0.15
0.2
0.25
0.3
0.35× 10− 5
Ave
rage
rea
ctio
n r
ate
(mol
L−1m
in−
1)
Experimental data
Data fitting
Figure 5: Effect of catalyst loading on average reaction rate(TOC initial concentration= 24.62 ± 0.44 mgL−1, average reactiontemperature= 27◦C, initial slurry pH = 3.00, 1.8 Lmin−1 air flowrate and 4.4 Lmin−1 slurry flow rate).
54.543.532.521.5
Air flow rate (Lmin− 1)
0.1
0.15
0.2
0.25
0.3
× 10− 5
Ave
rage
rea
ctio
n r
ate
(mol
L−1m
in−
1)
Experimental data
Data fitting
Figure 6: Effect of air flow rate on average reaction rate (TOCinitial concentration= 24.62 ± 0.44 mgL−1, average reaction tem-perature= 27◦C, initial slurry pH = 3.00, 0.07 gL−1 catalyst loadingand 4.4 Lmin−1 slurry flow rate).
where the values for A, B, C, and D are 1.31× 10⁻⁶
molL−1 min−1, 4.66× 10⁻¹⁰ gcat2molL−3 min−1, 6.64× 10⁻²
gcatL−1, and 2.42× 10⁻⁴ gcat2L−2, respectively.
3.4. Effect of Air Flow Rate. Upon irradiation, the catalystparticles generate positive holes and electrons. The pho-tooxidation process requires an oxidising agent to removeelectrons from the catalyst surface and prevent them fromrecombining with positive holes which are responsible forthe creation of hydroxyl radicals. In this study, the oxidantwas oxygen in the air.
5.554.543.532.521.5
Slurry recirculation rate (Lmin− 1)
0.22
0.24
0.26
0.28
0.3
0.32
× 10− 5
Ave
rage
rea
ctio
n r
ate
(mol
L−1m
in−
1)
Experimental data
Data fitting
Figure 7: Effect of slurry recirculation rate on average reaction rate(TOC initial concentration= 24.62 ± 0.44 mgL−1, average reactiontemperature= 27◦C, initial slurry pH = 3.00, 0.07 gL−1 catalystloading and 1.8 Lmin−1 air flow rate).
The range of air flow rate investigated was between 1.5and 5.0 Lmin−1 as depicted in Figure 6. The average TOCdegradation rate was found to increase until an optimumwas reached at 1.8 Lmin−1 air flow rate after which asteep decrease in the reaction rate was observed. Visualobservations showed that fine bubbles were formed at thelower air flow rates. However, beyond the optimum air flowrate, larger bubbles of widespread sizes were observed. Largerbubbles meant reduced surface area for mass transfer ofoxygen from the gas to liquid phase, hence the reduction inthe average reaction rate. Agustina et al. [36] made a similarobservation in their study of winery wastewater treatmentwith the same reactor. On the other hand, at low air flowrates in the vicinity of 1.5 Lmin−1, air bubbles had a tendencyto penetrate the slurry outlet, leading to irregular liquidpumping, hence a reduced average reaction rate.
The effect of air flow rate, QAir (Lmin−1), on the averagereaction rate, −RTOC (molL−1 min−1), could be described as
−RTOC = A +B
(QAir − C)2 + D, (8)
where the values for A, B, C, and D are 7.06× 10⁻⁵
molL−1 min−1, 5.93× 10⁻⁵ molLmin−3, 1.62 Lmin−1, and0.47 L2 min−2, respectively.
3.5. Effect of Slurry Recirculation Rate. The recirculationrate of the slurry was varied to study the effect of theresidence time. The circulation rate was varied between 1.5and 5.7 Lmin−1, and its effect on the average reaction rate ispresented in Figure 7. Maximum degradation was obtainedat a recirculation rate of 4.4 Lmin−1. At higher recirculationrate, the slurry inlet momentum was high enough thatair bubbles had the tendency to be pushed towards theslurry outlet. Introducing air bubbles into the pipelinesmade pumping irregular and therefore reduced the average

6 International Journal of Photoenergy
Table 2: Breakdown of electrical cost for 1 run of photocatalytic shower water treatment at optimum conditions.
Equipment Power rating (kW) Power usage (%) Usage (h) Energy usage (kWh) Cost @ 0.35 US$kWh−1 (US$m−3)
Pump 0.135 70 6 0.57 6.5
UV lamp 0.8 80 6 3.84 42.9
Total 4.41 49.4
reaction rate. Pareek et al. [37] found maximum degradationat a recirculation rate of 0.2 Lmin−1 in an 18 L volume reactorfor the photodegradation of Bayer liquor. However in theirstudy, catalyst suspension was assisted by fine air bubbleshomogeneously distributed within the reactor. In this study,air bubbles were supplied from a 10 cm distributor centred atthe bottom of the reactor. These bubbles were not dispersedthroughout the reactor space, and, as a result, a relatively highvolumetric flow rate was necessary to suspend the catalystparticles.
The effect of slurry recirculation rate, QSlurry (Lmin−1),on the average reaction rate, −RTOC (molL−1 min−1), couldbe described as
−RTOC = k0 + k1QSlurry + k2QSlurry2 + k3QSlurry
3. (9)
The values of k0, k1, k2, and k3 are 3.66× 10⁻⁶ molL−1 min−1,−2.00× 10⁻⁶ molL−2, 8.75× 10⁻⁷ molminL−3, and −1.00 ×10⁻⁷ molmin2L−4, respectively.
3.6. Electricity Cost Analysis. Based on the current electricitycost in Perth, Australia (0.35 US$kWh−1), a cost analysis wasperformed as detailed in Table 2.
Therefore for a 31 L throughput, the treatment costfor shower water amounted to 49.4 US$m−3. This valuewas close to the price range obtained by Pareek et al.[37] (60–270 US$m−3) for the photocatalytic treatmentof industrial Bayer liquor but is much larger than thereported 3.75 Euros·m−3 for the photocatalytic treatment ofherbicides [38] most probably due to the size (bench scale)of the latter research. However, it is possible to operate thereactor with solar light; it is envisaged that operational costof a large-scale photoreactor for shower water purificationwill be much less.
4. Conclusions
A pilot scale study for the photocatalytic degradation of realshower water showed that photocatalysis can be an efficienttreatment process. At optimum conditions (3.0 slurry initialpH, 0.07 gL−1 catalyst concentration, 4.4 Lmin−1 slurryrecirculation rate, and 1.8 Lmin−1 air supply), a 57% ofTOC degradation was obtained after 6-hour treatmenttime, although higher TOC degradation is expected ifthe treatment time is increased. This study showed thatphotocatalysis could be successfully transposed from benchscale to pilot scale. Furthermore, the ease of operation of theprocess makes photocatalysis an attractive prospect in termsof grey water treatment.
References
[1] A. Stikker, “Water today and tomorrow: prospects for over-coming scarcity,” Futures, vol. 30, no. 1, pp. 43–62, 1998.
[2] T. Asano, “Water from (waste)water—the dependable waterresource,” Water Science and Technology, vol. 45, no. 8, pp. 24–33, 2002.
[3] A. Fujishima and X. Zhang, “Titanium dioxide photocatalysis:present situation and future approaches,” Comptes RendusChimie, vol. 9, no. 5-6, pp. 750–760, 2006.
[4] E. Eriksson, K. Auffarth, M. Henze, and A. Ledin, “Charac-teristics of grey wastewater,” Urban Water, vol. 4, no. 1, pp.85–104, 2002.
[5] F. Li, K. Wichmann, and R. Otterpohl, “Review of thetechnological approaches for grey water treatment and reuses,”Science of the Total Environment, vol. 407, no. 11, pp. 3439–3449, 2009.
[6] B. Jefferson, A. Laine, S. Parsons, T. Stephenson, and S. Judd,“Technologies for domestic wastewater recycling,” UrbanWater, vol. 1, no. 4, pp. 285–292, 2000.
[7] V. Belgiorno, L. Rizzo, D. Fatta et al., “Review on endocrinedisrupting-emerging compounds in urban wastewater: occur-rence and removal by photocatalysis and ultrasonic irradiationfor wastewater reuse,” Desalination, vol. 215, no. 1–3, pp. 166–176, 2007.
[8] M. Pera-Titus, V. Garcıa-Molina, M. A. Banos, J. Gimenez,and S. Esplugas, “Degradation of chlorophenols by meansof advanced oxidation processes: a general review,” AppliedCatalysis B, vol. 47, no. 4, pp. 219–256, 2004.
[9] U. I. Gaya and A. H. Abdullah, “Heterogeneous photocatalyticdegradation of organic contaminants over titanium dioxide:a review of fundamentals, progress and problems,” Journal ofPhotochemistry and Photobiology C, vol. 9, no. 1, pp. 1–12,2008.
[10] I. A. Balcioglu and I. Arslan, “Application of photocatalyticoxidation treatment to pretreated and raw effluents from theKraft bleaching process and textile industry,” EnvironmentalPollution, vol. 103, no. 2-3, pp. 261–268, 1998.
[11] A. C. Rodrigues, M. Boroski, N. S. Shimada, J. C. Garcia,J. Nozaki, and N. Hioka, “Treatment of paper pulp andpaper mill wastewater by coagulation-flocculation followed byheterogeneous photocatalysis,” Journal of Photochemistry andPhotobiology A, vol. 194, no. 1, pp. 1–10, 2008.
[12] P. A. Pekakis, N. P. Xekoukoulotakis, and D. Mantzavinos,“Treatment of textile dyehouse wastewater by TiO2 photo-catalysis,” Water Research, vol. 40, no. 6, pp. 1276–1286, 2006.
[13] H. El Hajjouji, F. Barje, E. Pinelli et al., “PhotochemicalUV/TiO2 treatment of olive mill wastewater (OMW),” Biore-source Technology, vol. 99, no. 15, pp. 7264–7269, 2008.
[14] C. Fotiadis, N. P. Xekoukoulotakis, and D. Mantzavinos,“Photocatalytic treatment of wastewater from cottonseedprocessing: effect of operating conditions, aerobic biodegrad-ability and ecotoxicity,” Catalysis Today, vol. 124, no. 3-4, pp.247–253, 2007.

International Journal of Photoenergy 7
[15] H. Hidaka, H. Kubota, M. Graatzel, E. Pelizzetti, and N.Serpone, “Photodegradation of surfactants II: degradationof sodium dodecylbenzene sulphonate catalysed by titaniumdioxide particles,” Journal of Photochemistry, vol. 35, no. 2, pp.219–230, 1986.
[16] H. Hidaka, K. Ihara, Y. Fujita, S. Yamada, E. Pelizzetti, andN. Serpone, “Photodegradation of surfactants IV: photodegra-dation of non-ionic surfactants in aqueous titanium dioxidesuspensions,” Journal of Photochemistry and Photobiology A,vol. 42, no. 2-3, pp. 375–381, 1988.
[17] H. Hidaka, T. Oyama, T. Horiuchi, T. Koike, and N. Serpone,“Photo-induced oxidative synergistic degradation of mixedanionic/cationic surfactant systems in aqueous dispersions. Adetailed study of the DBS/HTAB system,” Applied Catalysis B,vol. 99, no. 3-4, pp. 485–489, 2010.
[18] H. Hidaka and J. Zhao, “Photodegradation of surfactantscatalyzed by a TiO2 semiconductor,” Colloids and Surfaces, vol.67, pp. 165–182, 1992.
[19] J. Zhao, H. Oota, H. Hidaka, E. Pelizzetti, and N. Ser-pone, “Photodegradation of surfactants X. Comparison ofthe photo-oxidation of the aromatic moieties in sodiumdodecylbenzene sulphonate and in sodium phenyldodecylsulphonate at TiO2H2O interfaces,” Journal of Photochemistryand Photobiology A, vol. 69, no. 2, pp. 251–256, 1992.
[20] M. Sanchez, M. J. Rivero, and I. Ortiz, “Photocatalyticoxidation of grey water over titanium dioxide suspensions,”Desalination, vol. 262, no. 1–3, pp. 141–146, 2010.
[21] X. Zhu, M. A. Nanny, and E. C. Butler, “Photocatalyticoxidation of aqueous ammonia in model gray waters,” WaterResearch, vol. 42, no. 10-11, pp. 2736–2744, 2008.
[22] R. van Grieken, J. Marugan, C. Sordo, and C. Pablos,“Comparison of the photocatalytic disinfection of E. colisuspensions in slurry, wall and fixed-bed reactors,” CatalysisToday, vol. 144, no. 1-2, pp. 48–54, 2009.
[23] K. Y. Lai, Liquid Detergents, Taylor & Francis, 2005.[24] Inorganic materials for catalyst innovation, “AEROSIL,
AEROXIDE and SIPERNAT metal oxides and silica basedmaterials industry information 2242,” Evonik Industries,2011.
[25] M. I. Cabrera, O. M. Alfano, and A. E. Cassano, “Absorptionand scattering coefficients of titanium dioxide participatesuspensions in water,” Journal of Physical Chemistry, vol. 100,no. 51, pp. 20043–20050, 1996.
[26] Y. Y. Eng, V. K. Sharma, and A. K. Ray, “Photocatalyticdegradation of nonionic surfactant, Brij 35 in aqueous TiO2
suspensions,” Chemosphere, vol. 79, no. 2, pp. 205–209, 2010.[27] R. Zhang, L. Gao, and Q. Zhang, “Photodegradation of
surfactants on the nanosized TiO2 prepared by hydrolysis ofthe alkoxide titanium,” Chemosphere, vol. 54, no. 3, pp. 405–411, 2004.
[28] J. R. Regalbuto, Catalyst Preparation: Science and Engineering,CRC Press/Taylor & Francis, 2007.
[29] T. Oyama, A. Aoshima, S. Horikoshi, H. Hidaka, J. Zhao,and N. Serpone, “Solar photocatalysis, photodegradation ofa commercial detergent in aqueous TiO2 dispersions undersunlight irradiation,” Solar Energy, vol. 77, no. 5, pp. 525–532,2004.
[30] M. Sanchez, M. J. Rivero, and I. Ortiz, “Kinetics of dode-cylbenzenesulphonate mineralisation by TiO2 photocatalysis,”Applied Catalysis B, vol. 101, no. 3-4, pp. 515–521, 2011.
[31] R. Andreozzi, V. Caprio, A. Insola, and R. Marotta, “Advancedoxidation processes (AOP) for water purification and recov-ery,” Catalysis Today, vol. 53, no. 1, pp. 51–59, 1999.
[32] M. N. Chong, B. Jin, C. W. K. Chow, and C. Saint, “Recentdevelopments in photocatalytic water treatment technology: areview,” Water Research, vol. 44, no. 10, pp. 2997–3027, 2010.
[33] J. Lea and A. A. Adesina, “The photo-oxidative degradationof sodium dodecyl sulphate in aerated aqueous TiO2 suspen-sion,” Journal of Photochemistry and Photobiology A, vol. 118,no. 2, pp. 111–122, 1998.
[34] A. E. H. Machado, J. A. de Miranda, R. F. de Freitas et al.,“Destruction of the organic matter present in effluent froma cellulose and paper industry using photocatalysis,” Journal ofPhotochemistry and Photobiology A, vol. 155, no. 1–3, pp. 231–241, 2003.
[35] P. R. Gogate and A. B. Pandit, “A review of imperative tech-nologies for wastewater treatment I: oxidation technologies atambient conditions,” Advances in Environmental Research, vol.8, no. 3-4, pp. 501–551, 2004.
[36] T. E. Agustina, H. M. Ang, and V. K. Pareek, “Treatment ofwinery wastewater using a photocatalytic/photolytic reactor,”Chemical Engineering Journal, vol. 135, no. 1-2, pp. 151–156,2008.
[37] V. K. Pareek, M. P. Brungs, and A. A. Adesina, “Continuousprocess for photodegradation of industrial bayer liquor,”Industrial and Engineering Chemistry Research, vol. 40, no. 23,pp. 5120–5125, 2001.
[38] G. Li Puma, B. Toepfer, and A. Gora, “Photocatalytic oxidationof multicomponent systems of herbicides: scale-up of labora-tory kinetics rate data to plant scale,” Catalysis Today, vol. 124,no. 3-4, pp. 124–132, 2007.

Hindawi Publishing CorporationInternational Journal of PhotoenergyVolume 2012, Article ID 303961, 9 pagesdoi:10.1155/2012/303961
Research Article
A New Photocatalytic System Using Steel Mesh and Cold CathodeFluorescent Light for the Decolorization of Azo Dye Orange G
Ming-Chin Chang,1 Chin-Pao Huang,2 Hung-Yee Shu,1 and Yung-Chen Chang1
1 Institute of Environmental Engineering, Hungkuang University, 34 Chung-Chie Road, Shalu, Taichung 433, Taiwan2 Department of Civil and Environmental Engineering, University of Delaware, Newark, DE 19716, USA
Correspondence should be addressed to Hung-Yee Shu, [email protected]
Received 1 June 2012; Accepted 23 June 2012
Academic Editor: Mika Sillanpaa
Copyright © 2012 Ming-Chin Chang et al. This is an open access article distributed under the Creative Commons AttributionLicense, which permits unrestricted use, distribution, and reproduction in any medium, provided the original work is properlycited.
High color and organic composition, the effluents from the textile dyeing and finishing industry, can be treated by photocatalyticoxidation with UV/TiO2. The objective of this study was to prepare a new photocatalytic system by coating nanosized TiO2 particleson steel mesh support and using cold cathode fluorescent light (CCFL) irradiation at 365 nm in a closed reactor for the oxidation ofazo dye C.I. Orange G (OG). Various factors such as reaction time, coating temperature, TiO2 dosage, pH, initial dye concentration,and service duration were studied. Results showed efficient color removal of the OG azo dye by the photocatalytic system withTiO2-coated temperature at 150◦C. The optimal TiO2 dosage for color removal was 60 g m−2. An acidic pH of 2.0 was sufficientfor photocatalytic oxidation whereas basic condition was not. The rate of color removal decreased with increase in the initialdye concentration. The TiO2-coated steel mesh can be used repeatedly over 10 times without losing the photocatalytic efficiency.Results of FTIR and IC indicated the breakage of N=N bonds, with sulfate as the major and nitrite and nitrate as the minorproducts, which implied degradation of dye molecules.
1. Introduction
Most dyestuffs from the effluent of textile dyeing andfinishing industry are organic compounds with high colorintensity, recalcitrant to conventional biological wastewatertreatment, and thus of major environmental concerns [1–4].Furthermore, chemical coagulation integrated with activatedsludge process was not able to meet the increasingly stringentcriteria of color in dye wastewater treatment in Taiwan[5]. There is great demand of technology to decolorize thehighly colored dye wastewater more effectively. Azo dyeswith nitrogen double bond N=N are the largest class ofcommercial dyestuffs used in the textile industries. Therewere reports of successful color removal with final mineral-ization from azo dye wastewater using advanced oxidationprocesses (AOPs) such as UV/H2O2 [6–9], UV/O3 [10, 11],or Fenton reaction [12, 13]. Additionally, it has been reportedthat photocatalytic processes such as UV-TiO2 system canalso be effective in treating dye wastewaters [14–18] exceptthat when applied in suspension further separation of TiO2
particles is necessary. Therefore, fixing the TiO2 particlesonto supported materials such as silica gel and plates canavoid the particle separation step and enables the easyoperation of heterogeneous TiO2 photocatalysis [19–23].The objective of this study was to study the degradation ofazo dye C.I. Orange G (OG) using a batch photocatalyticreactor in which the photocatalytic TiO2 particles werecoated on steel mesh and cold cathode fluorescent lamp(CCFL) was used (wavelength of 365 nm) as the source ofirradiation. The CCFL lamp has thin and simple structure, isless temperature sensitive, and is easy to configure as well asit is brighter than the traditional mercury arc mercury lamp.It is more durable than other light sources. CCFL light istime-saving and less cost which is used broadly in computerproducts and applications such as liquid crystal display(LCD) backlight displays, PC case lights, and scanners,photocopy machines, industry machines such as appliancelighting, automotive fittings such as dashboard backlights,decoration light, advertisement such as signage board, exitlight, and light box, and decoration such as indoors light and

2 International Journal of Photoenergy
HO
N N
NaO3S
SO3Na
Figure 1: The chemical structure of monoazo dye Orange G.(C16H10N2Na2O7S2).
outdoors light. Factors such as coating temperature, TiO2
dosage, pH, initial dye concentration, and reaction time thatmay affect the degree of the dye degradation were studied.Changes in color intensity, pH, and ORP were monitored inaddition to the analysis of reaction products by FTIR and IC.
2. Materials and Methods
2.1. Materials and Apparatus. The monoazo dye, C.I. OrangeG (OG, C16H10N2Na2O7S2, 60%) with a molecular weight of452.38 and a characteristic wavelength (λmax) of 479 nm waspurchased from Sigma-Aldrich, Inc., and used as receivedwithout further purification. Figure 1 shows the chemicalstructure of OG. The commercial nanosized titanium diox-ide (TiO2), Degussa P-25, with a specific surface area of48.68 m2 g−1 from Aldrich was used as the catalyst. The steelmesh (mesh size number 140, 0.106 mm) was purchasedfrom a local hardware store and trimmed into pieces with agross area of 252 cm2 (36 × 7 cm). Initially, the steel meshwas trimmed, washed with distilled water, dried at roomtemperature (25◦C), weighed, and then stored in desiccatorfor further use. A given amount of Degussa P-25 TiO2
nanoparticle (e.g., 7.5–50.0 g) was mixed with 250 mL ofdistilled water to make suspension at concentrations of 30–200 g L−1. The pretreated steel mesh piece was dipped inthe TiO2 suspension then dried under certain temperaturefor one hour. The steel mesh piece was then washed withdistilled water to remove any loose TiO2 particles fromthe surface. The dipping, washing, and drying steps wererepeated three times to reach a certain weight of TiO2 on thesteel mesh surface. Table 1 shows the amount of TiO2 coatedon the steel mesh surface (gross area of 252 cm2) in therange of 0.3025–1.6855 g which yielded specific surface TiO2
concentration in the range of 12–67 g m−2. Based on imagesobtained with Field Emission Scanning Electron Microscope(FESEM), model JEOL 6330CF, of the TiO2-coated steelmesh, it is seen that TiO2 particles were uniformly coated onthe steel mesh surface as shown in Figure 2. The crystallinityof TiO2 particles was characterized by XRD (Thin-Film X-ray Diffractometer, X-RAY/TF) which yielded an anatase torutile ratio of 7 : 3 as expected. Table 2 shows the BET surfacearea and porosity of TiO2-coated steel mesh as a functionof drying temperature using Micromeritics Gemini V. The
(a)
(b)
Figure 2: The morphology of TiO2 powder coated on steel meshat 150◦C was identified by a JEOL 6330CF Field Emission ScanningElectron Microscope (FESEM). (a) 50 times enlargement and (b)100,000 times enlargement.
photocatalytic reactor was a closed rectangular black tank(length × width × height equal to 360 × 70 × 78 mm) madeof acrylic resin with a removable upper cover underneath ofwhich was six cold cathode fluorescent lamps (CCFL) eachof which has a diameter of 0.25 cm, length of 30 cm, lightintensity of 4 W, and irradiation wavelength of 365 nm. Thedye solution, 200 mL, was introduced to the photocatalyticreactor at which bottom was placed the TiO2-coated steelmesh with total gross surface area 252 cm2 (power per unitarea of one lamp of 0.35 mW cm−2); the depth of the dyesolution was 0.794 cm neglecting the thickness of the steelmesh. The CCFL lamps were located 6.0 cm above the surfaceof the dye solution which yielded a total light energy of2.1 mW cm−2 measured at the surface of the solution.
2.2. Photocatalytic Procedure. OG azo dye solution at variousconcentrations was prepared with deionized water. Theexperimental variables studied included reaction time, TiO2
dosage, initial dye concentration, and application durationof TiO2. At a predetermined reaction time, an aliquotof the solution was withdrawn and analyzed for residual

International Journal of Photoenergy 3
Table 1: The TiO2-coated weight on the steel meshes.
TiO2 weight (g) TiO2 solution concentration (g L−1) TiO2 weight on the coated steel meshes (g) TiO2 weight per unit area (g m−2)
(W1) (W1/V) (W2) (W2/A)
7.5 30 0.3025 12
12.5 50 0.5098 20
25.0 100 1.0149 40
37.5 150 1.5054 60
50.0 200 1.6855 67
V: the TiO2 solution of 250 mL, A: the steel net area of 252 cm2.
Table 2: The specific surface area and porosity of TiO2 by variousdrying temperature for samples with TiO2 load of 60 g m−2.
Drying temperature ◦C Specific surface area m2 g−1 Porosity A
100 39.41 9.4077
150 43.35 8.8541
200 49.76 8.4902
250 61.42 9.1983
300 55.35 8.3969
dye concentration, TOC, and color. Dye concentration wasdetermined by measuring the absorbance at wavelengthof 479 nm using Hitachi U-2000 spectrophotometer. TOCwas obtained with a Total Organic Carbon Analyzer fromO.I. Analytical Aurora, model 1030. Color intensity wasdetermined based on the American Dye ManufacturersInstitute (ADMI) standard color measurement by applyingthe Adams-Nickerson color difference formula followingmethod 2120E of the Standard Methods. The pH and redoxpotential (ORP) were monitored by a Eutech PH5500 dualchannel pH/ion meter with specific probes. Besides, thedegradation products were identified using Perkin ElmerFT-IR spectrophotometer model Spectrum One. Ions suchas sulfate, nitrate, and nitrite were identified with ionchromatography (IC), Dionex ICS-1000.
3. Results and Discussion
3.1. Effect of Combining CCFL UV 365 Irradiation and TiO2
Catalyst. The color removal was first compared for varioussystems, that is, CCFL/TiO2, CCFL alone, and TiO2 alone atthe initial OG concentration of 50 mg L−1, TiO2 dosage of60 g m−2 and 6 CCFL lamps with total light intensity of 24 Wat wavelength of 365 nm in 120 min of reaction in the closedreactor. Figure 3 shows results of color removal by varioussystems. Results indicated that the system of CCFL alone, andTiO2 alone could not remove color at any significant level.The CCFL/TiO2 system removed color and TOC effectivelywith almost 100 and 95% removal, respectively, in 2 h. Itwas also observed that the pH remained relatively constantfrom 5.5 to 5.0 with time. This was expected as TiO2 is aknown photocatalyst that upon radiation with light whichwavelength is shorter than that of its bandgap can generatehydroxyl radicals, strong oxidation agents that can oxidize awide group of organic compounds nonspecifically [14–18].
Time (min)0 10 20 30 40 50 60 70 80 90 100 110 120
Rem
oval
effi
cien
cy (
%)
0
10
20
30
40
50
60
70
80
90
100
CCFL alone-color
Catalyst alone-color Regression lines
CCFL/TiO2-color
CCFL-TiO2-TOC
Figure 3: Effect of combining CCFL UV 365 irradiation and TiO2
catalyst. The conditions were initial dye concentration of 50 mg L−1,TiO2 coated amounts of 60 g m−2, light intensity of 2.1 mW cm−2,and reaction time during 120 min.
3.2. Effect of Coating Temperature. The effect of TiO2-coatingtemperature on color removal was studied at the initial OGconcentration of 50 mg L−1, TiO2 load dosage of 40 g m−2
and 6 CCFL lamps in 120 min in the closed reactor. Figure 4shows insignificant color removal in the range of 100–300◦C. It was noted that pH remained unchanged at around5 to 6. The reaction kinetics of UV/TiO2 photocatalyticalsystem was proved to follow the Langmuir-Hinshelwood (L-H) reaction kinetics [24–27]. And in most of the designedreaction conditions, the L-H kinetic model of the UV/TiO2
system can be further simplified into pseudo-first-orderreaction kinetics. Therefore, the color removal of this studywas treated using pseudo first-order reaction as follows:
Cdye = Cdye0 × e−kt , (1)
where k denotes the observed first-order reaction rate con-stant (min−1), t is the reaction time (min), Cdye,0 designates

4 International Journal of Photoenergy
0 10 20 30 40 50 60 70 80 90 100 110 120
Col
or r
emov
al e
ffici
ency
(%
)
0
10
20
30
40
50
60
70
80
90
100
Regression lines
Time (min)
100 C150 C
200 C
250 C300 C
Figure 4: Effect of drying temperature. The conditions were initialdye concentration of 50 mg L−1, TiO2-coated amounts of 40 g m−2,light intensity of 2.1 mW cm−2, and reaction time during 120 min.
the initial concentration (mg L−1) of OG and Cdye,t is theconcentration (mg L−1) of OG at time t. The curve fitting ofexperimental results by (1) were shown in the figures as solidlines to present well-fit of kinetic model to the experimentaldata. The calculated rate constants (from curve fitting) were2.36, 2.62, 2.52, 2.27, and 2.23 10−2 min−1 at 100, 150, 200,250, and 300◦C, respectively, as shown in Table 3(a). Thebest rate occurred at a coating temperature of 150◦C. Notethat this temperature was chosen further as the workingcondition.
3.3. Effect of TiO2 Load Dosage. Figure 5 shows the removalof color as a function of surface dosage of TiO2. Resultsindicated that the color removal increased from 80 to 100%in 120 min when the surface loading of TiO2 particlesincreased from 12 to 60 g m−2. The color removal thendecreased from 100 to 90% when the surface loading ofTiO2 increased from 60 to 67 g m−2. An optimal TiO2
loading for color removal occurred at 60 g m−2. The rateconstants followed similar trend as percent color removal;the observed rate constants were 1.10, 1.41, 2.41, 3.23, and2.80 (10−2 min−1) at surface TiO2 loading dosage of 12, 20,40, 60, and 67 g m−2, respectively, as shown in Table 3(b).Note that the maximum rate constant also occurred at TiO2
loading of 60 g m−2.
3.4. Effect of pH. The effect of pH on the degradation of azodye was conducted by adjusting the initial pH value of 5.3 tothe range of 2 to 11 using HCl and/or NaOH with initial OGdye concentration of 50 mg L−1 and 60 g m−2 of TiO2 dosage.
Time (min)
0 10 20 30 40 50 60 70 80 90 100 110 120
Col
or r
emov
al e
ffici
ency
(%
)
0
10
20
30
40
50
60
70
80
90
100
Regression lines
12 g m− 2
20 g m− 2
40 g m− 2
60 g m− 2
67 g m− 2
Figure 5: Effect of surface loading of TiO2. The conditionswere initial dye concentration of 50 mg L−1, light intensity of2.1 mW cm−2, and reaction time during 120 min.
Figure 6 shows the change of dye concentration as a functionof time at various pH values. Results indicated that the colorremoval increased rapidly at acidic pH of 2 and 3 thenbecame slow as the pH increased. This could be attributedto loss of hydroxyl radicals as pH increased. The effectof pH on the photodegradation of acid dye can be betterdescribed by the interaction between the dye compound andthe photocatalyst. Better contact between the dye chemicaland TiO2 is necessary for the degradation reaction. As pHincreases, the surface of TiO2 becomes negatively charged.(note: the pHzpc of TiO2 is 5.5). Negatively charged TiO2
surface discourages the adsorption of the anion acid dye.The rate constants followed similar trend to that of colorremoval. The rate constants at pH 2 and 3 were 13.28 and16.6 (10−2 min−1), respectively, which were greater than 2.69(10−2 min−1) at pH 4 as shown in Table 3(c). At original pH5.3, the degradation of OG dye was sufficient fast and reached100% removal during 120 min reaction time. Furthermore,the effluent from acid dye bath dyeing processing (OG dyewas applied) usually presents acidic pH at about 3-4. Thus,it is not suggested that the wastewater treatment plan adjustpH to 2-3 for better treatment efficiency. But it is encouragedto use the advantage of acid dye bath at acidic pH to elevatethe reaction rate and removal efficiency.
3.5. Effect of Dye Initial Concentration. To present the validityof L-H model on our CCFL/TiO2 system, the effect of initialdye concentrations on the photodegradation of azo OGdye was studied at initial concentrations of 12.5–75 mg L−1,TiO2 dosage of 60 g m−2 and 6 CCFL lamps for a period of

International Journal of Photoenergy 5
Ta
ble
3:T
he
firs
t-or
der
reac
tion
rate
con
stan
tk
(102
min−1
).
(a)
Eff
ect
ofco
atin
gte
mpe
ratu
re(b
)E
ffec
tof
TiO
2lo
addo
sage
(c)
Eff
ect
ofin
itia
lcon
cen
trat
ion
(d)
Eff
ect
ofin
itia
lpH
(e)
Du
rati
onte
stTe
mp
erat
ure
,◦C
kLo
addo
sage
,gm−2
kC
once
ntr
atio
n,m
gL−
1k
pHk
Cyc
lek
100
2.36
121.
1012
.512
.54
213
.28
13.
4615
02.
6220
1.41
18.8
9.67
316
.60
22.
4120
02.
5240
2.41
257.
714
2.64
32.
1425
02.
2760
3.23
502.
835.
32.
694
2.06
300
2.23
672.
8075
2.0
92.
675
1.62
111.
536
1.80
71.
718
1.73
91.
6610
1.55
Tim
efo
r(a
)an
d(b
)at
60m
in;(
c)at
20m
in.
Tim
efo
r(d
)at
20m
in;(
e)at
30m
in.

6 International Journal of Photoenergy
Time (min)
0 10 20 30 40 50 60 70 80 90 100 110 120
Col
or r
emov
al e
ffici
ency
(%
)
0
10
20
30
40
50
60
70
80
90
100
pH 2pH 3pH 4pH 5.3
pH 9pH 11
Regression lines
Figure 6: Effect of initial pH. The conditions were TiO2-coatedamounts of 60 g m−2, light intensity of 2.1 mW cm−2, and reactiontime during 120 min.
120 min in the closed reactor. Figure 7 shows results of dyephotodegradation as a function of reaction time at variousinitial dye concentrations. Results indicated that the rateof dye removal decreased from 12.54 to 2.0 (10−2 min−1)when the initial dye concentration was increased from 12.5to 75 mg L−1 as shown in Table 3(d). The rate constant thenremained constant and independent of the dye concentrationas the initial dye concentration increased to greater than50 mg L−1. This is typical Langmuir-Hinshelwood (L-H)reaction kinetics which is generally capable for modelingUV/TiO2 photocatalytic oxidation process [24–27]. Accord-ing to the L-H reaction kinetics, the rate of dye degradationcan be described by the following equation:
r = dC
dt= kKAC
1 + KAC, (2)
where r is the degradation rate of dye (mg L−1 min−1), k,KA, and C are the rate constant (mg L−1 min−1), equilibriumadsorption constant (L mg−1), and residual dye concentra-tion (mg L−1), respectively. According to the above equation,at high dye concentration, that is, 1� KC, the rate equationis
r = k. (3)
Likewise, at low dye concentration, that is, 1 � KC, (2)becomes
r = kKAC. (4)
Time (min)
0 10 20 30 40 50 60 70 80 90 100 110 120
Col
or r
emov
al e
ffici
ency
(%
)
0
10
20
30
40
50
60
70
80
90
100
Regression lines
12.5 mg L− 1
18.8 mg L− 1
25 mg L− 1
50 mg L− 1
75 mg L− 1
Figure 7: Effect of initial concentration. The conditions were TiO2-coated amounts of 60 g m−2, light intensity of 2.1 mW cm−2, andreaction time during 0∼120 min.
That is, as the initial concentration increases, the reaction nolonger follows the first order expression; rather it becomesindependent of the dye concentration as shows in (3). Byrearranging (2), one has
1r0= 1
kKA× 1
C0+
1k
, (5)
where r0 and C0 are the initial rate (mg L−1 min−1) andinitial dye concentration (mg L−1), respectively. A plot ofthe reciprocals of initial rate and initial concentrationyields the rate constant, k, and the adsorption constant, K(Figure 8). The initial rate r0 was calculated by the first2 min of Figure 7 with TiO2 loading dosage at 12 and60 g m−2, respectively (Table 4). From the slope (1/kKA) andthe intercept (1/k) of Figure 8, the calculated k and KA
were 2.08 mg L−1 min−1 and 0.1257 L mg−1 for TiO2 loadingdosage at 12 g m−2 and 4.41 mg L−1 min−1 and 0.0346 L mg−1
at 60 g m−2, respectively. The rate constants (k) obtainedin this work of 2.08 and 4.41 mg L−1 min−1 were higherthan that of previous works [24–27] such as 1.66, 1.67,0.95, and 0.17 mg L−1 min−1 for various dyes direct red 16,remazol black 5, procion red MX-5B, and indigo carmine,respectively. Similarly, the equilibrium adsorption constants(KA) of 0.1257 and 0.0346 L mg−1 from this wok were inthe range of previous studies, such as 0.0093, 0.072, 0.071,and 0.78 L mg−1 for various dyes as above. The resultsindicate that the photocatalytic degradation of Orange Gby CCFL/TiO2 process followed the Langmuir-Hinshelwoodkinetic model.

International Journal of Photoenergy 7
0 0.02 0.04 0.06 0.08 0.10
0.1
0.2
0.3
0.4
0.5
0.6
0.7
0.8
0.9
1
Regression lines
1/r 0
1/C0
12 g m− 2
60 g m− 2
Figure 8: Langmuir-Hinshelwood kinetic model (comparison oftwo different TiO2 loading dosage of 12 and 60 g m−2 with lightintensity of 2.1 mW cm−2).
Table 4: The effect of dye concentration on initial rate r0
(mg L−1 min−1) with TiO2 loading dosage at 12 and 60 g m−2.
OG concentration,C0 (mg L−1)
12.5 18.8 25 50 75
r0-12 g m−2 1.30 1.43 1.58 1.72 2.00
r0-60 g m−2 1.32 1.69 2.25 2.62 3.19
3.6. The Product Analysis by FTIR and IC. The change offunctional groups of azo dye after photocatalytic treatmentwas surveyed. The initial dye concentration was 50 mg L−1
and was treated with a TiO2 dosage of 60 g m−2 and reactiontime of 120 min. The scan spectra for the functional groups isSO3Na of 1150∼1250 cm−1, N=N of 1400∼1500 cm−1, C=Oof 1690∼1760 cm−1, C–H, and N–H of 3300∼3500 cm−1.The residual color was 0 and the residual TOC was2.13 mg L−1. After the photocatalytic oxidation, a newdouble-bond C=O at 1637 cm−1 was produced. Meanwhilethe N=N from dye at 1426, 1463, and 1496 cm−1 disappeareddue to attack by the hydroxyl radicals that cleaved the double-bond N=N. Accordingly, the dye molecule was degraded anddecolorized. The ions such as sulfate, chloride, nitrite, andnitrate were determined. Figure 9 shows that the major ionconcentration of sulfate significantly increased to 11 mg L−1
over time. The nitrate ion concentration was about 0.4 to0.5 mg L−1 and nitrite concentration was low at 0.1 mg L−1.The chloride ion produced due to the impurity of OG dyewas low as 1.5 mg L−1.
Time (min)0 10 20 30 40 50 60 70 80 90 100 110 120
0
2
4
6
8
10
12
Time (min)
0 20 40 60 80 100 1200
0.2
0.4
0.6
0.8
1
Ion
con
cen
trat
ion
(m
g L−
1)
Ion
con
cen
trat
ion
(m
g L−
1)
NO3−
NO2−
SO4−2
Cl−
Figure 9: The product analysis by IC. The conditions were initialdye concentration of 50 mg L−1, TiO2-coated amounts of 60 g m−2,and light intensity of 2.1 mW cm−2 at 120 min.
3.7. Application Duration. The TiO2-coated steel mesh wasused repeatedly to treat the OG solution. Figure 10 showsthe system performance over 10 cycles. Results indicated thatalthough the rate of OG degradation decreased as the reusecycle of catalyst increased, the total amount of dye removalremained relatively unchanged at 100% in the treatment timerange of 100–120 min, however. In the meantime, there wasnearly no loss of TiO2 in each operation even after 10 cycles.The observed rate constants declined with more reuse cyclesas shown in Table 3(e), however. This can be attributed topotential surface poisoning of the photocatalyst, TiO2 due toadsorption of reaction products. Further investigation is inprogress to assess the reactivity of the TiO2 during the courseof photocatalytic reactions.
4. Conclusions
TiO2 supported on steel mesh and illuminated with coldcathode fluorescent light (CCFL) was effective in removalcolor and dye from the OG azo dye solution. Coating TiO2
at 150◦C yielded the fastest color removal rate. An optimalTiO2 surface loading or dosage of 60 g m−2 exhibited thehighest color removal as well as the fastest rate; increasein surface TiO2 loading had no benefit in increasing thecolor removal, however. An acidic pH of 2-3 had the bestphotocatalytic oxidation rate; the rate of color removaldecreased when pH was increased to greater than 4. The rateof color removal decreased with initial dye concentrationas was expected by the Langmuir-Hinshelwood kinetics.Based on FTIR analysis, there was decrease of N=N bondingwhich indicated chemical transformation of the dye OG

8 International Journal of Photoenergy
Time (min)
0 10 20 30 40 50 60 70 80 90 100 110 120
Col
or r
emov
al e
ffici
ency
(%
)
0
10
20
30
40
50
60
70
80
90
100
Run1Run2
Run3Run4Run5Run6
Run7 Run8 Run9 Run10 Regression lines
Figure 10: Duration test on color removal. The conditions wereinitial dye concentration of 50 mg L−1, TiO2-coated amounts of60 g m−2, light intensity of 2.1 mW cm−2, and reaction time during120 min.
compound. Results of analyzing the inorganic byproductsrevealed that sulfate production was predominant; nitriteand nitrate were produced at minor quantities. The TiO2-coated steel mesh can be repeatedly used over 10 cycleswithout significant loss of catalyst mass; the percent dyeremoval remained close to 100% in 10 cycles except slightdecrease in reaction rate constants apparently due to possiblesurface poisoning. In general, the new photocatalytic systemshowed great potential in ease of implementation and costfor the treatment of dye industrial wastewater for colorremoval.
Acknowledgments
The authors appreciate the partial research funding grantedby the Taiwan National Science Foundation (NSC 97-2918-I-241-001 and NSC 96-2221-E-241-005-MY2) as well as theanalysis by NSC instrumental center of National ChungHsing University and National Tsing Hua University.
References
[1] M. A. Brown and S. C. DeVito, “Predicting azo dye toxicity,”Critical Reviews in Environmental Science and Technology, vol.23, no. 3, pp. 249–324, 1993.
[2] H. Y. Shu, C. R. Huang, and M. C. Chang, “Decolorization ofmono-azo dyes in wastewater by advanced oxidation process:
a case study of acid red 1 and acid yellow 23,” Chemosphere,vol. 29, no. 12, pp. 2597–2607, 1994.
[3] B. Manu and S. Chaudhari, “Decolorization of indigo and azodyes in semicontinuous reactors with long hydraulic retentiontime,” Process Biochemistry, vol. 38, no. 8, pp. 1213–1221, 2003.
[4] J. Ge and J. Qu, “Ultrasonic irradiation enhanced degradationof azo dye on MnO2,” Applied Catalysis B, vol. 47, no. 2, pp.133–140, 2009.
[5] C. M. Kao, M. S. Chou, W. L. Fang, B. W. Liu, and B. R. Huang,“Regulating colored textile wastewater by 3/31 wavelengthadmi methods in Taiwan,” Chemosphere, vol. 44, no. 5, pp.1055–1063, 2001.
[6] H. Y. Shu, M. C. Chang, and H. J. Fan, “Decolorization of azodye acid black 1 by the UV/H2O2 process and optimizationof operating parameters,” Journal of Hazardous Materials, vol.113, no. 1-3, pp. 201–208, 2004.
[7] H. Y. Shu, M. C. Chang, and H. J. Fan, “Effects of gap size andUV dosage on decolorization of C.I. Acid Blue 113 wastewaterin the UV/H2O2 process,” Journal of Hazardous Materials, vol.118, no. 1–3, pp. 205–211, 2005.
[8] H. Y. Shu, M. C. Chang, and W. P. Hsieh, “Remedy of dyemanufacturing process effluent by UV/H2O2 process,” Journalof Hazardous Materials, vol. 128, no. 1, pp. 60–66, 2006.
[9] E. Rodrıguez, R. Peche, J. M. Merino, and L. M. Camarero,“Decoloring of aqueous solutions of indigocarmine dye in anacid medium by H2O2/UV advanced oxidation,” Environmen-tal Engineering Science, vol. 24, no. 3, pp. 363–371, 2007.
[10] H. Y. Shu and M. C. Chang, “Decolorization effects of sixazo dyes by O3, UV/O3 and UV/H2O2 processes,” Dyes andPigments, vol. 65, no. 1, pp. 25–31, 2005.
[11] C. H. Wu and H. Y. Ng, “Degradation of C.I. ReactiveRed 2 (RR2) using ozone-based systems: comparisons ofdecolorization efficiency and power consumption,” Journal ofHazardous Materials, vol. 152, no. 1, pp. 120–127, 2008.
[12] T. H. Kim, C. Park, J. Yang, and S. Kim, “Comparison ofdisperse and reactive dye removals by chemical coagulationand Fenton oxidation,” Journal of Hazardous Materials, vol.112, no. 1-2, pp. 95–103, 2004.
[13] F. Ay, E. C. Catalkaya, and F. Kargi, “Advanced oxidationof direct red (DR 28) by fenton treatment,” EnvironmentalEngineering Science, vol. 25, no. 10, pp. 1455–1462, 2008.
[14] A. T. Toor, A. Verma, C. K. Jotshi, P. K. Bajpai, and V. Singh,“Photocatalytic degradation of Direct Yellow 12 dye usingUV/TiO2 in a shallow pond slurry reactor,” Dyes and Pigments,vol. 68, no. 1, pp. 53–60, 2006.
[15] M. Muruganandham and M. Swaminathan, “Photocatalyticdecolourisation and degradation of Reactive Orange 4 byTiO2-UV process,” Dyes and Pigments, vol. 68, no. 2-3, pp.133–142, 2006.
[16] X. Yin, F. Xin, F. Zhang, S. Wang, and G. Zhang, “Kinetic studyon photocatalytic degradation of 4BS Azo dye over TiO2 inslurry,” Environmental Engineering Science, vol. 23, no. 6, pp.1000–1008, 2006.
[17] A. Akyol and M. Bayramoglu, “The degradation of an azo dyein a batch slurry photocatalytic reactor,” Chemical Engineeringand Processing, vol. 47, no. 12, pp. 2150–2156, 2008.
[18] R. B. M. Bergamini, E. B. Azevedo, and L. R. R. D. Araujo,“Heterogeneous photocatalytic degradation of reactive dyes inaqueous TiO2 suspensions: decolorization kinetics,” ChemicalEngineering Journal, vol. 149, no. 1–3, pp. 215–220, 2009.
[19] G. Mascolo, R. Comparelli, M. L. Curri, G. Lovecchio, A.Lopez, and A. Agostiano, “Photocatalytic degradation ofmethyl red by TiO2: comparison of the efficiency of immo-bilized nanoparticles versus conventional suspended catalyst,”

International Journal of Photoenergy 9
Journal of Hazardous Materials, vol. 142, no. 1-2, pp. 130–137,2007.
[20] B. Mounir, M. N. Pons, O. Zahraa, A. Yaacoubi, and A. Ben-hammou, “Discoloration of a red cationic dye by supportedTiO2 photocatalysis,” Journal of Hazardous Materials, vol. 148,no. 3, pp. 513–520, 2007.
[21] M. Nikazar, K. Gholivand, and K. Mahanpoor, “Photocatalyticdegradation of azo dye Acid Red 114 in water with TiO2
supported on clinoptilolite as a catalyst,” Desalination, vol.219, no. 1–3, pp. 293–300, 2008.
[22] A. R. Khataee, M. N. Pons, and O. Zahraa, “Photocatalyticdegradation of three azo dyes using immobilized TiO2
nanoparticles on glass plates activated by UV light irradiation:influence of dye molecular structure,” Journal of HazardousMaterials, vol. 168, no. 1, pp. 451–457, 2009.
[23] X. Wang, Y. Liu, Z. Hu, Y. Chen, W. Liu, and G. Zhao,“Degradation of methyl orange by composite photocatalystsnano-TiO2 immobilized on activated carbons of differentporosities,” Journal of Hazardous Materials, vol. 169, no. 1–3,pp. 1061–1067, 2009.
[24] T. Aarthi, P. Narahari, and G. Madras, “Photocatalytic degra-dation of Azure and Sudan dyes using nano TiO2,” Journal ofHazardous Materials, vol. 149, no. 3, pp. 725–734, 2007.
[25] K. Sahel, N. Perol, H. Chermette, C. Bordes, Z. Derriche, andC. Guillard, “Photocatalytic decolorization of Remazol Black5 (RB5) and Procion Red MX-5B-Isotherm of adsorption,kinetic of decolorization and mineralization,” Applied Catal-ysis B, vol. 77, no. 1-2, pp. 100–109, 2007.
[26] N. Barka, A. Assabbane, A. Nounah, and Y. A. Ichou, “Photo-catalytic degradation of indigo carmine in aqueous solutionby TiO2-coated non-woven fibres,” Journal of HazardousMaterials, vol. 152, no. 3, pp. 1054–1059, 2008.
[27] J. Saien, M. Asgari, A. R. Soleymani, and N. Taghavinia,“Photocatalytic decomposition of direct red 16 and kineticsanalysis in a conic body packed bed reactor with nanostructuretitania coated Raschig rings,” Chemical Engineering Journal,vol. 151, no. 1–3, pp. 295–301, 2009.

Hindawi Publishing CorporationInternational Journal of PhotoenergyVolume 2012, Article ID 640487, 7 pagesdoi:10.1155/2012/640487
Research Article
Synthesis and Bactericidal Ability of TiO2 and Ag-TiO2 Preparedby Coprecipitation Method
Robert Liu,1 H. S. Wu,1 Ruth Yeh,1 C. Y. Lee,1 and Yungtse Hung2
1 Department of Chemical and Materials Engineering, Minghsin University of Science and Technology, Hsinchu 30401, Taiwan2 Department of Civil and Environmental Engineering, Cleveland State University, Cleveland, OH 44115-2214, USA
Correspondence should be addressed to Ruth Yeh, [email protected]
Received 23 March 2012; Accepted 5 May 2012
Academic Editor: Meenakshisundaram Swaminathan
Copyright © 2012 Robert Liu et al. This is an open access article distributed under the Creative Commons Attribution License,which permits unrestricted use, distribution, and reproduction in any medium, provided the original work is properly cited.
Preparation of photocatalysts of TiO2 and Ag-TiO2 was carried out by coprecipitation method. The prepared photocatalysts werecharacterized by X-ray diffraction (XRD), SEM, EDX, and XRF analysis. The disinfection of E. coli, a model indicator organismfor the safe water supply, was investigated by using TiO2 and Ag-TiO2 under different light sources. The treatment efficacy forthe inactivation of E. coli would be UV/Ag-TiO2; visible/Ag-TiO2; dark/Ag-TiO2; UV (all 100%) > UV/TiO2 (99%) > visible/TiO2
(96%) > dark/TiO2 (87%) > visible (23%) > dark (19%). The order of disinfection efficiency by their corresponding kinetic initialapparent rate constants, kapp, (min−1) would be UV/Ag-TiO2; visible/Ag-TiO2 (both 6.67) > UV (6.6) > dark/Ag-TiO2 (6.56) >UV/TiO2 (1.62) > visible/TiO2 (1.08) > dark/TiO2 (0.7) > visible (0.28) > dark (0.03). The application of TiO2 doped with silverstrongly improved the ability of disinfection treatment. The study of mineralization of E. coli by measurement of TOC (totalorganic carbon) removal percentage showed that the visible light may effectively be applied for the disinfection unit of water andwastewater treatment system by using photocatalysts of Ag-TiO2.
1. Introduction
Increasing demand and shortage of satisfactory clean watersupplies due to the rapid development of industrialization,population growth, and serious droughts have become aglobal issue [1–3]. It is estimated that around 1.2 billionpeople lack access to safe drinking water, 2.6 billion havelittle or no sanitation, and millions of people died ofsevere waterborne diseases annually [3, 4]. Therefore, thequality of drinking water is becoming more and more of aconcern worldwide. For suppressing the worsening of cleanwater shortage, disinfection development of advanced watertreatment technologies with low cost and high efficiencyto treat wastewater is also desirable. Pathogens are disease-causing organisms that grow and multiply within the hostand excreted in human feces. Pathogens associated withwater include bacteria, viruses, protozoa, and helminthes[5]. The microbiological standards for water and wastewatertreatment system in their final disinfection treatment unituse coliform bacteria (typically Escherichia coli or E. coli)as indicator organisms whose presence suggestes that water
is fecal contaminated. The final disinfection step to kill anyremaining pathogenic organisms for water and wastewatertreatment system includes some commonly used technolo-gies, such as chlorination, ozonation, and UV irradiation.Chlorination has been the most commonly and widely useddisinfection process. The disinfected byproducts generatedfrom chlorination are mutagenic and carcinogenic to humanhealth [5–7], while ozonation, or UV radiation may be toocostly and can only be used as primary disinfectant becausethey cannot ensure a detectable residual [1, 8].
Heterogeneous photocatalysis has recently emerged asan alternative technology of advanced oxidation processes(AOP) for bacteria inactivation [9–16] and organic pollu-tants oxidation [17–29]. Out of the various semiconductorphotocatalysts used, TiO2 has been found to be the mostsuitable because of its nontoxic, insoluble, inexpensive,stable, ant its high production of oxidative hydroxyl radicals(•OH). But the rapid recombination of electron-hole pairlimits the efficiency of TiO2. It is experimentally foundthat Ag particles in Ag doped TiO2 increase the bactericidalefficiency of TiO2 by acting as electron traps [1, 30–34].

2 International Journal of Photoenergy
Figure 1: SEM micrograph of Ag-TiO2 sintering at 550◦C (×6.0k).
0 10 20 30 40 50 60 70 80 90
0
1000
2000
3000
4000
5000
6000
7000
8000
9000
10000
11000
12000
AA A
AA
A
A
AA
AA A
A
A
A
A
A
A
A
A
A-anatase phase
Inte
nsi
ty
2
AgNO3
300 C400 C
500 CTiO2
550 C
Figure 2: XRD pattern of prepared TiO2 and Ag-TiO2 with dif-ferent sintering temperature.
The aim of this work was the preparation of TiO2 andAg doped TiO2 (Ag-TiO2) by the simple coprecipitationmethod. The prepared photocatalysts were characterized byX-ray diffraction (XRD), SEM, EDX, and XRF analysis.The photocatalytic inactivation and disinfection of E. coli,one the most common gram-negative model bacteria, usingprepared TiO2 and Ag-TiO2 under irradiation of differentlight sources were studied and compared. The mineralizationof E. coli by the study of TOC (total organic carbon) removalpercentage was also investigated by different light sources.
2. Experimental
2.1. Materials. All chemicals used such as Ti(SO)2, urea,or silver nitrate were of reagent grade (SHOWA ChemicalCo., LTD., Japan or Ruenn-Jye Tech. Corp., Taiwan). Thephotocatalytic antibacterial activities of the samples wereevaluated using E. coli as an indicator bacterium. E. coli(BCRC10316) was obtained from FIRDI, Taiwan. Nutrient
OTi Au
AuAu
Au Au AuAu
AuAuAg
Ti
Ti
(keV)
0 2 4 6 8 10 12 14 16 18 20
Full scale = 3.06 k counts Cursor: 18.0875 keV
Figure 3: EDX of Ag-TiO2 sintering at 550◦C.
0 20 40 60 80 100 120 140 160 180 200
0
20
40
60
80
100
Visible + TiO2
Visible + Ag-TiO2
Visible
Irradiation time (min)
Inac
tiva
tion
(R
%)
Figure 4: R percentage versus irradiation time of visible light(dosage = 0.01 g/10 mL).
broth (NB, Pronadisa, Lab conda S.A.) and agar (Americanbacteriological agar; Pronadisa, Lab conda S.A.) were usedfor the liquid culture medium and solid culture medium ofbacteria, respectively.
2.2. Preparation of TiO2 and Ag-TiO2. For the preparationof Ag-TiO2 powder, 75 g of urea was first dissolved into400 mL DI-water. Then add 46 mL of Ti(SO4)2 and 0.169 gof AgNO3 into the bottle on the oil bath and uniformlymixed. Reactions were carried out for 24 h at 80◦C bycontinuously magnetic stirring and heating. After cooling toroom temperature, the separation of solid and solution wasobtained by centrifugal filtration. The solids were washed byDI-water until pH of the washing water reached neutral. Thesolids were filtered again and removed to the oven for dryingat 70◦C and 24 h. By grinding, the powder was then calcinedat 550◦C for 4 h. The Ag-TiO2 was obtained with Ag : Ti =1 : 99 (molar ratio). To prepare TiO2, the same procedure wasrepeated without the addition of silver nitrate.
2.3. Characterization of Prepared Photocatalysts. Structurecharacterization of as prepared photocatalysts was per-formed by means of XRD (XRD-6000, Shimadzu, Japan)

International Journal of Photoenergy 3
0 min
iii
15 min
iv
i ii
Figure 5: Inactivation effect of E. coli by visible light irradiation using TiO2 (i) (0 min.) and (ii) (15 min.) and Ag-TiO2 (iii) and (iv) asphotocatalysts.
0 20 40 60 80 100 120 140 160 180 200
0
20
40
60
80
100
Visible + TiO2
UVVisible
Dark + TiO2
DarkUV + TiO2
Irradiation time (min)
Inac
tiva
tion
(R
%)
Figure 6: R percentage versus irradiation time of different lightsources using TiO2 as photocatalysts.
with Cu Kα radiation. Morphology of Ag-TiO2 was inves-tigated by SEM (Scanning electron microscope, S-3000N,Hitachi, Japan). EDX (Energy dispersive X-ray spectroscopy)used indicates the presence of silver. The chemical com-positions of the particles were analyzed by XRF (X-rayfluorescence, XEPOS/XEP01, Spectro Co., Germany).
2.4. Inactivation of E. coli. The antibacterial properties of E.coli by using photocatalysts were studied under the following
0 20 40 60 80 100 120 140 160 180 200
0
20
40
60
80
100
UVVisibleDark
Irradiation time (min)
Inac
tiva
tion
(R
%)
UV + Ag-TiO2
Visible + Ag-TiO2 Dark + Ag-TiO2
Figure 7: R percentage versus irradiation time of different lightsources using Ag-TiO2 as photocatalysts.
process. (1) Preparation of liquid growth medium of nutrientbroth (NB): add 0.8 g of NB and 100 mL Di-water into250 mL of flask and sterilized under autoclave for 20 minutes.(2) Preparation of solid medium: mix 0.8 g NB, 1.5 g agar,and 100 mL DI-water and sterilized under autoclave at 121◦Cfor 20 minutes and then cool until 50◦C. Pour the contentsinto petri dishes to form solid medium. (3) Add E. coli fromFIRDI onto petri dishes and incubated at 37◦C for 2 days.(4) Remove E. coli from the surface of solid medium from

4 International Journal of Photoenergy
15 min
iv
0 min
iii
iii
0 min
v
15 min
vi
Figure 8: Inactivation effect of E. coli by irradiation of different light sources (UV (i) (0 min.) and (ii) (15 min.) and visible (iii) and (iv) anddark (v) and (vi)) using Ag-TiO2 as photocatalysts.
(3) when cooled and inoculate onto (1) by the same culturalprocedure as (3). (5) Dilution of E. coli from (4): add 1 mLof inoculated E. coli from liquid culture medium of NB andinto a clean test tube containing 9 mL of sterilized water. Add0.01 g of Ag-TiO2 into the prepared test tube. The test tubewas incubated for 24 h at 37◦C, and the numbers of viablecells of bacterial colonies (CFU/mL, colonies forming unitsper milliliter) were visually identified and counted. Repeatthe serial dilution by 101, 102, 103, 104, 105, and 106. The bestdilution for the E. coli bactericidal effect by photocatalystswould be 106 for all the following inactivation experiments.(6) The inactivation of E. coli bacteria: the bactericidalstudies by the photocatalysts were carried out under theirradiation of visible light (Philips, Poland, 9 watts), UV light(UV-C, Philips, Poland, 9 watts), and no light. The distancebetween the light and the top of test tube remains 30 cm andfully covered and protected on the outside. Then lay the setupinto the laminar flow cabinet and investigate the inactivationexperiments. The similar procedure was applied as (5) byusing the dosages of 0.01 g/10 mL of TiO2 or Ag-TiO2. Thedilution chosen would be 106, and sampling time for eachexperiment would be 0, 15, 45, 90, 135, and 180 minutes.Samples were all plated in triplicate, and the counts on thethree plates were averaged. Control experiments were alsoconducted in the absence of the photocatalysts.
The inactivation efficiency R(%) of E. coli as model bac-teria by the prepared photocatalysts of TiO2 and Ag-TiO2
were calculated by the following equation:
R(%) = (C0 − C)C0
× 100%, (1)
where R(%) is the inactivation efficiency or viable cellsinactivated or removed percentages. C0 is initial CFU/mL,and C is final CFU/mL.
3. Results and Discussion
3.1. Catalyst Characterization. Ag-TiO2 after 550◦C sinteringwas characterized by the SEM. The micrographs takenat 6000-times magnification are shown in Figure 1. It isfound that the dope of silver is not very obvious and theaggregation of tiny TiO2 particles occurred. The averageparticle size was found to be about 2.5 μm from the figure.The XRD patterns of TiO2 and Ag-TiO2 as shown in Figure 2almost coincide and thus suggest that the silver is welldispersed on the TiO2 surface. Anatase type structure isobtained for both prepared TiO2 and Ag-TiO2. Figure 2 alsoshows the XRD patterns of Ag-TiO2 annealed at differenttemperatures and all exhibited anatase without rutile. With

International Journal of Photoenergy 5
0 50 100 150 200 2500
10
20
30
40
50
60
70
80
90
100
Blank
Time (min)
TO
C r
emov
al (
%)
Ag-TiO2
TiO2
Figure 9: TOC removal percentage of E. coli versus visible light ir-radiation by using TiO2 and Ag-TiO2 as photocatalysts.
0 50 100 150 200 2500
10
20
30
40
50
60
70
80
90
100
Blank
Time (min)
TO
C r
emov
al (
%)
Ag-TiO2
TiO2
Figure 10: TOC removal percentage of E. coli versus UV light ir-radiation by using TiO2 and Ag-TiO2 as photocatalysts.
increasing temperature of calcination, the intensities of theTiO2 peaks are increased. Therefore, the photocatalysts ofAg-TiO2 used for the inactivation of E. coli will be preparedby 550◦C sintering. From Figure 2, there is only TiO2 inthe anatase form and no peaks of Ag were observed. Itcan be explained that the amount of Ag is too little to beappeared on the patterns. Figure 3 is the EDX diagram of Ag-TiO2 which indicates the presence of silver on the preparedphotocatalysts.
The compositions of the prepared Ag-TiO2 were deter-mined by the analysis of XRF. The result was shown inTable 1. It indicates that silver exists and composition was
0 50 100 150 200 2500
10
20
30
40
50
60
70
80
90
100
Time (min)
TO
C r
emov
al (
%)
BlankAg-TiO2
TiO2
Figure 11: TOC removal percentage of E. coli versus adsorptiontime under dark by using TiO2 and Ag-TiO2 as photocatalysts.
very close to the predetermined value, that is, Ag : Ti = 1 : 99(molar).
3.2. Inactivation of E. coli
3.2.1. Comparison between TiO2 and Ag-TiO2 under VisibleLight. Figures 4 and 5 show the inactivation of E. coli underthe irradiation of visible light by using photocatalysts of TiO2
or Ag-TiO2. It is quite clear that Ag doped TiO2 improvesvery obviously the antibacterial activities of E. coli on bothinactivation efficiency (R%) and rate of reaction. It takesabout 15 minutes to reach 99% inactivation for Ag-TiO2 and180 minutes of 90% for TiO2.
According to the kinetic Langmuir-Hinshelwood model[21]:
r = −dCdt= (krKC)
(1 + KC). (2)
During the initial stage of reaction, concentration of E. coli ishigh, the reaction becomes zero order, that is,
r = −dCdt= kr . (3)
Therefore,
(C − C0) = −krt or R% = (C0 − C)C0
= krC0
t = kappt,
(4)
where r is the rate of E. coli inactivation, C0 is the initialconcentration of E. coli, C is the concentration of E. coliduring the initial stage of reaction (straight-line region) attime t, kr is the reaction rate constant, k is the adsorptioncoefficient of E. coli onto particle, and kapp is the apparentrate constants (min−1).
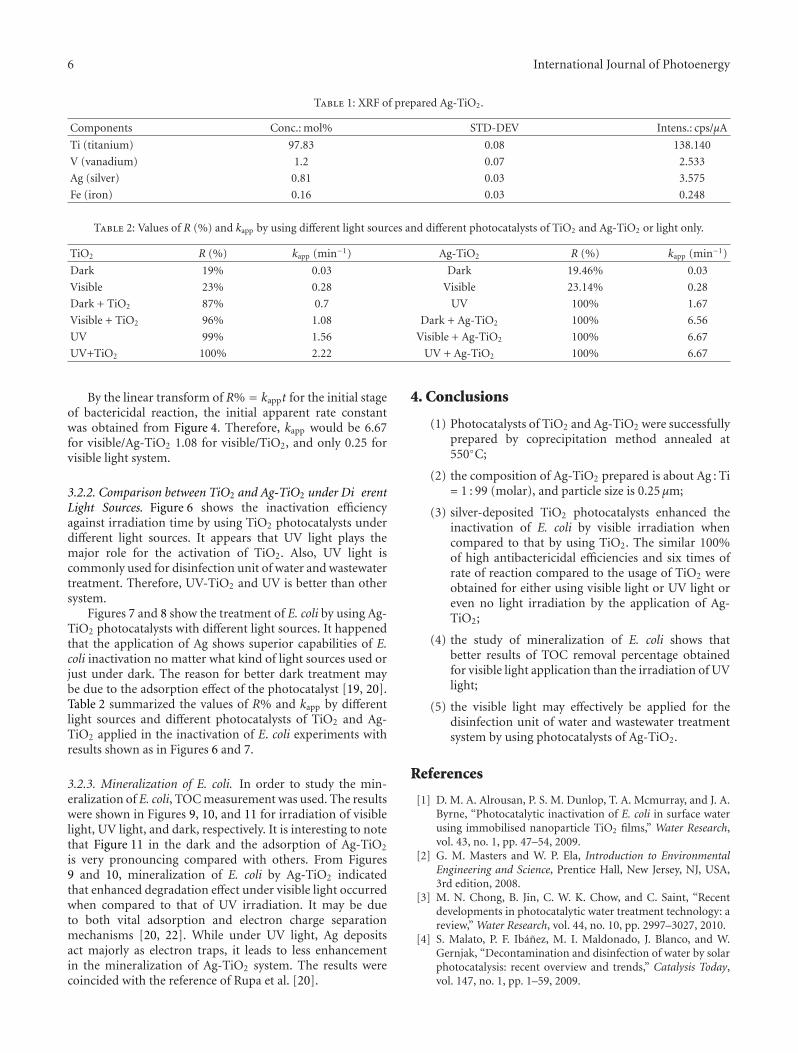
6 International Journal of Photoenergy
Table 1: XRF of prepared Ag-TiO2.
Components Conc.: mol% STD-DEV Intens.: cps/μA
Ti (titanium) 97.83 0.08 138.140
V (vanadium) 1.2 0.07 2.533
Ag (silver) 0.81 0.03 3.575
Fe (iron) 0.16 0.03 0.248
Table 2: Values of R (%) and kapp by using different light sources and different photocatalysts of TiO2 and Ag-TiO2 or light only.
TiO2 R (%) kapp (min−1) Ag-TiO2 R (%) kapp (min−1)
Dark 19% 0.03 Dark 19.46% 0.03
Visible 23% 0.28 Visible 23.14% 0.28
Dark + TiO2 87% 0.7 UV 100% 1.67
Visible + TiO2 96% 1.08 Dark + Ag-TiO2 100% 6.56
UV 99% 1.56 Visible + Ag-TiO2 100% 6.67
UV+TiO2 100% 2.22 UV + Ag-TiO2 100% 6.67
By the linear transform of R% = kappt for the initial stageof bactericidal reaction, the initial apparent rate constantwas obtained from Figure 4. Therefore, kapp would be 6.67for visible/Ag-TiO2 1.08 for visible/TiO2, and only 0.25 forvisible light system.
3.2.2. Comparison between TiO2 and Ag-TiO2 under Di erentLight Sources. Figure 6 shows the inactivation efficiencyagainst irradiation time by using TiO2 photocatalysts underdifferent light sources. It appears that UV light plays themajor role for the activation of TiO2. Also, UV light iscommonly used for disinfection unit of water and wastewatertreatment. Therefore, UV-TiO2 and UV is better than othersystem.
Figures 7 and 8 show the treatment of E. coli by using Ag-TiO2 photocatalysts with different light sources. It happenedthat the application of Ag shows superior capabilities of E.coli inactivation no matter what kind of light sources used orjust under dark. The reason for better dark treatment maybe due to the adsorption effect of the photocatalyst [19, 20].Table 2 summarized the values of R% and kapp by differentlight sources and different photocatalysts of TiO2 and Ag-TiO2 applied in the inactivation of E. coli experiments withresults shown as in Figures 6 and 7.
3.2.3. Mineralization of E. coli. In order to study the min-eralization of E. coli, TOC measurement was used. The resultswere shown in Figures 9, 10, and 11 for irradiation of visiblelight, UV light, and dark, respectively. It is interesting to notethat Figure 11 in the dark and the adsorption of Ag-TiO2
is very pronouncing compared with others. From Figures9 and 10, mineralization of E. coli by Ag-TiO2 indicatedthat enhanced degradation effect under visible light occurredwhen compared to that of UV irradiation. It may be dueto both vital adsorption and electron charge separationmechanisms [20, 22]. While under UV light, Ag depositsact majorly as electron traps, it leads to less enhancementin the mineralization of Ag-TiO2 system. The results werecoincided with the reference of Rupa et al. [20].
4. Conclusions
(1) Photocatalysts of TiO2 and Ag-TiO2 were successfullyprepared by coprecipitation method annealed at550◦C;
(2) the composition of Ag-TiO2 prepared is about Ag : Ti= 1 : 99 (molar), and particle size is 0.25 μm;
(3) silver-deposited TiO2 photocatalysts enhanced theinactivation of E. coli by visible irradiation whencompared to that by using TiO2. The similar 100%of high antibactericidal efficiencies and six times ofrate of reaction compared to the usage of TiO2 wereobtained for either using visible light or UV light oreven no light irradiation by the application of Ag-TiO2;
(4) the study of mineralization of E. coli shows thatbetter results of TOC removal percentage obtainedfor visible light application than the irradiation of UVlight;
(5) the visible light may effectively be applied for thedisinfection unit of water and wastewater treatmentsystem by using photocatalysts of Ag-TiO2.
References
[1] D. M. A. Alrousan, P. S. M. Dunlop, T. A. Mcmurray, and J. A.Byrne, “Photocatalytic inactivation of E. coli in surface waterusing immobilised nanoparticle TiO2 films,” Water Research,vol. 43, no. 1, pp. 47–54, 2009.
[2] G. M. Masters and W. P. Ela, Introduction to EnvironmentalEngineering and Science, Prentice Hall, New Jersey, NJ, USA,3rd edition, 2008.
[3] M. N. Chong, B. Jin, C. W. K. Chow, and C. Saint, “Recentdevelopments in photocatalytic water treatment technology: areview,” Water Research, vol. 44, no. 10, pp. 2997–3027, 2010.
[4] S. Malato, P. F. Ibanez, M. I. Maldonado, J. Blanco, and W.Gernjak, “Decontamination and disinfection of water by solarphotocatalysis: recent overview and trends,” Catalysis Today,vol. 147, no. 1, pp. 1–59, 2009.

International Journal of Photoenergy 7
[5] J. Coleman, C. P. Marquis, J. A. Scott, S. S. Chin, and R.Amal, “Bactericidal effects of titanium dioxide-based photo-catalysts,” Chemical Engineering Journal, vol. 113, no. 1, pp.55–63, 2005.
[6] J. Lu, T. Zhang, J. Ma, and Z. Chen, “Evaluation of disinfectionby-products formation during chlorination and chloramina-tion of dissolved natural organic matter fractions isolated froma filtered river water,” Journal of Hazardous Materials, vol. 162,no. 1, pp. 140–145, 2009.
[7] H. Yang and H. Cheng, “Controlling nitrite level in drinkingwater by chlorination and chloramination,” Separation andPurification Technology, vol. 56, no. 3, pp. 392–396, 2007.
[8] L. Rizzo, “Inactivation and injury of total coliform bacteriaafter primary disinfection of drinking water by TiO2 photo-catalysis,” Journal of Hazardous Materials, vol. 165, no. 1–3, pp.48–51, 2009.
[9] D. Gumy, A. G. Rincon, R. Hajdu, and C. Pulgarin, “Solarphotocatalysis for detoxification and disinfection of water:different types of suspended and fixed TiO2 catalysts study,”Solar Energy, vol. 80, no. 10, pp. 1376–1381, 2006.
[10] Z. Huang, P. C. Maness, D. M. Blake, E. J. Wolfrum,S. L. Smolinski, and W. A. Jacoby, “Bactericidal mode oftitanium dioxide photocatalysis,” Journal of Photochemistryand Photobiology A, vol. 130, no. 2-3, pp. 163–170, 2000.
[11] P. S. M. Dunlop, J. A. Byrne, N. Manga, and B. R. Eggins, “Thephotocatalytic removal of bacterial pollutants from drinkingwater,” Journal of Photochemistry and Photobiology A, vol. 148,no. 1–3, pp. 355–363, 2002.
[12] Y. Kikuchi, K. Sunada, T. Iyoda, K. Hashimoto, and A.Fujishima, “Photocatalytic bactericidal effect of TiO2 thinfilms: dynamic view of the active oxygen species responsiblefor the effect,” Journal of Photochemistry and Photobiology A,vol. 106, no. 1–3, pp. 51–56, 1997.
[13] K. Sunada, T. Watanabe, and K. Hashimoto, “Studies onphotokilling of bacteria on TiO2 thin film,” Journal of Photo-chemistry and Photobiology A, vol. 156, no. 1–3, pp. 227–233,2003.
[14] S. Gelover, L. A. Gomez, K. Reyes, and M. T. Leal, “A practicaldemonstration of water disinfection using TiO2 films andsunlight,” Water Research, vol. 40, no. 17, pp. 3274–3280, 2006.
[15] A. G. Rincon and C. Pulgarin, “Effect of pH, inorganicions, organic matter and H2O2 on E. coli K12 photocatalyticinactivation by TiO2: implications in solar water disinfection,”Applied Catalysis B, vol. 51, no. 4, pp. 283–302, 2004.
[16] J. A. Ibanez, M. I. Litter, and R. A. Pizarro, “Photocatalytic bac-tericidal effect of TiO2 on Enterobacter cloacae. Comparativestudy with other Gram (−) bacteria,” Journal of Photochemistryand Photobiology A, vol. 157, no. 1, pp. 81–85, 2003.
[17] N. Sobana, K. Selvam, and M. Swaminathan, “Optimizationof photocatalytic degradation conditions of direct red 23 usingnano-Ag doped TiO2,” Separation and Purification Technology,vol. 62, no. 3, pp. 648–653, 2008.
[18] N. Sobana, M. Muruganadham, and M. Swaminathan, “Nano-Ag particles doped TiO2 for efficient photodegradation ofdirect azo dyes,” Journal of Molecular Catalysis A, vol. 258, no.1-2, pp. 124–132, 2006.
[19] M. K. Seery, R. George, P. Floris, and S. C. Pillai, “Silver dopedtitanium dioxide nanomaterials for enhanced visible lightphotocatalysis,” Journal of Photochemistry and Photobiology A,vol. 189, no. 2-3, pp. 258–263, 2007.
[20] A. V. Rupa, D. Manikandan, D. Divakar, and T. Sivakumar,“Effect of deposition of Ag on TiO2 nanoparticles on thephotodegradation of reactive Yellow-17,” Journal of HazardousMaterials, vol. 147, no. 3, pp. 906–913, 2007.
[21] A. K. Gupta, A. Pal, and C. Sahoo, “Photocatalytic degradationof a mixture of crystal violet and methyl red dye in aqueoussuspensions using Ag+ doped TiO2,” Dyes and Pigments, vol.69, no. 3, pp. 224–232, 2006.
[22] L. Ren, Y. P. Zeng, and D. Jiang, “Preparation, characterizationand photocatalytic activities of Ag-deposited porous TiO2
sheets,” Catalysis Communications, vol. 10, no. 5, pp. 645–649,2009.
[23] Y. Liu, C. Y. Liu, Q. H. Rong, and Z. Zhang, “Characteristics ofthe silver-doped TiO2 nanoparticles,” Applied Surface Science,vol. 220, no. 1–4, pp. 7–11, 2003.
[24] V. Vamathevan, R. Amal, D. Beydoun, G. Low, and S. McEvoy,“Photocatalytic oxidation of organics in water using pureand silver-modified titanium dioxide particles,” Journal ofPhotochemistry and Photobiology A, vol. 148, no. 1–3, pp. 233–245, 2002.
[25] S. Rengaraj and X. Z. Li, “Enhanced photocatalytic activ-ity of TiO2 by doping with Ag for degradation of 2,4,6-trichlorophenol in aqueous suspension,” Journal of MolecularCatalysis A, vol. 243, no. 1, pp. 60–67, 2006.
[26] J. M. Herrmann, H. Tahiri, Y. Ait-Ichou, G. Lassaletta, A.R. Gonzalez-Elipe, and A. Fernandez, “Characterization andphotocatalytic activity in aqueous medium of TiO2 and Ag-TiO2 coatings on quartz,” Applied Catalysis B, vol. 13, no. 3-4,pp. 219–228, 1997.
[27] M. Bideau, B. Claudel, C. Dubien, L. Faure, and H. Kazouan,“On the “immobilization” of titanium dioxide in the photo-catalytic oxidation of spent waters,” Journal of Photochemistryand Photobiology A, vol. 91, no. 2, pp. 137–144, 1995.
[28] A. R. Malagutti, H. A. J. L. Mourao, J. R. Garbin, and C.Ribeiro, “Deposition of TiO2 and Ag:TiO2 thin films by thepolymeric precursor method and their application in thephotodegradation of textile dyes,” Applied Catalysis B, vol. 90,no. 1-2, pp. 205–212, 2009.
[29] M. S. Lee, S. S. Hong, and M. Mohseni, “Synthesis of photocat-alytic nanosized TiO2-Ag particles with sol-gel method usingreduction agent,” Journal of Molecular Catalysis A, vol. 242, no.1-2, pp. 135–140, 2005.
[30] J. Ma, Z. Xiong, T. D. Waite, W. J. Ng, and X. S. Zhao,“Enhanced inactivation of bacteria with silver-modified meso-porous TiO2 under weak ultraviolet irradiation,” Microporousand Mesoporous Materials, vol. 144, no. 1–3, pp. 97–104, 2011.
[31] L. Mai, D. Wang, S. Zhang, Y. J. Xie, C. M. Huang, andZ. Zhang, “Synthesis and bactericidal ability of Ag/TiO2
composite films deposited on titanium plate,” Applied SurfaceScience, vol. 257, no. 3, pp. 974–978, 2010.
[32] M. V. Liga, E. L. Bryant, V. L. Colvin, and Q. Li, “Virusinactivation by silver doped titanium dioxide nanoparticles fordrinking water treatment,” Water Research, vol. 45, no. 2, pp.535–544, 2011.
[33] W. Su, S. S. Wei, S. Q. Hu, and J. X. Tang, “Preparation ofTiO2/Ag colloids with ultraviolet resistance and antibacterialproperty using short chain polyethylene glycol,” Journal ofHazardous Materials, vol. 172, no. 2-3, pp. 716–720, 2009.
[34] D. Wu, H. You, D. Jin, and X. Li, “Enhanced inactivation ofEscherichia coli with Ag-coated TiO2 thin film under UV-Cirradiation,” Journal of Photochemistry and Photobiology A, vol.217, no. 1, pp. 177–183, 2011.

Hindawi Publishing CorporationInternational Journal of PhotoenergyVolume 2012, Article ID 103672, 8 pagesdoi:10.1155/2012/103672
Research Article
Enhancement of Photocatalytic Activity ofZnO/SiO2 by Nanosized Pt for Photocatalytic Degradation ofPhenol in Wastewater
R. M. Mohamed1, 2 and M. A. Barakat3, 4
1 Chemistry Department, Faculty of Science, King Abdulaziz University, P.O. Box. 80203, Jeddah 21589, Saudi Arabia2 Nanostructured Materials and Nanotechnology Division, Advanced Materials Department, Central MetallurgicalResearch & Development Institute (CMRDI), P.O. Box 87 Helwan, Cairo 11421, Egypt
3 Department of Environmental Sciences, Faculty of Meteorology, Environment, and Arid Land Agriculture, King Abdulaziz University,Jeddah 21589, Saudi Arabia
4 Minerals Technology Department, Central Metallurgical Research & Development Institute (CMRDI), Cairo 11421, Egypt
Correspondence should be addressed to M. A. Barakat, [email protected]
Received 20 March 2012; Revised 24 May 2012; Accepted 2 June 2012
Academic Editor: Manickavachagam Muruganandham
Copyright © 2012 R. M. Mohamed and M. A. Barakat. This is an open access article distributed under the Creative CommonsAttribution License, which permits unrestricted use, distribution, and reproduction in any medium, provided the original work isproperly cited.
ZnO-SiO2 nanoparticles were synthesized by a sol-gel technique from Zn(NO3)2 · 6H2O and tetraethyl orthosilicate (TEOS). Thesynthesized samples were further modified by nanosized Pt from H2PtCl6 solution through photoassisted deposition (PAD) andimpregnation (Img) routes. The obtained samples were characterized by a series of techniques including X-ray diffraction (XRD),UV-Vis diffuse reflectance spectroscopy, N2 adsorption, extended X-ray absorption fine structure (EXAFS), and transmissionelectron microscopy (TEM). The photocatalytic activity of the Pt-ZnO/SiO2 was evaluated by photocatalytic degradation of phenolin synthetic wastewater under UV-irradiation. Results obtained revealed that the surface area and the photocatalytic activity of theprepared samples were increased in the order ZnO/SiO2 < PAD: Pt-ZnO/SiO2 < img: Pt-ZnO/SiO2. The surface area decreasedfrom 480 to 460 and 450 m2/g, while the efficiency of the phenol degradation increased from 80 to 85 and 100%, with theZnO/SiO2, Img: Pt-ZnO-SiO2, and PAD: Pt-ZnO-SiO2 samples, respectively.
1. Introduction
Zinc oxide (ZnO) is an n-type semiconductor with a widedirect bandgap of 3.37 eV. Recently, much effort has beendevoted to study ZnO as a promising photocatalyst forphotocatalytic degradation of water pollutants, owing to itshigh activity, low cost, and environmentally friendly feature[1–4]. ZnO microcrystal showed also good photocatalyticactivity for dye wastewater treatment [5].
However, a major drawback of ZnO is the large bandgapof 3.37 eV; so, wavelengths below 400 nm are necessary forexcitation. Another disadvantage of ZnO is that chargecarrier recombination of photogenerated electron/hole pairsoccurs within nanoseconds and the photocatalytic activity islow [6–9]. Therefore, it is necessary to improve its visible-light activities by extending its absorption threshold from the
UV light region to the visible light region and also reduce therecombination of photogenerated electron/hole. Differentworks were performed recently to improve the activity ofZnO catalyst. Development of core/shell-structured mate-rials on a nanometer scale has been receiving extensiveattention [10, 11]. The shell can alter the charge, function-ality, and reactivity of surface or improve the stability anddispersive ability of the core material. Furthermore, catalytic,optical, or magnetic functions can be imparted to the coreparticles by the shell material. In general, the synthesis ofcore/shell-structured material has the goal of obtaining anew composite material having synergetic or complementarybehaviors between the core and shell materials. Many studieson the synthesis of composites such as NiO [12], V2O5 [13],TiO2 [14], Fe2O3 [15], Pt [16], and Ag [17, 18] coated withSiO2 shells have been reported. SiO2 is one of the most

2 International Journal of Photoenergy
studied shell candidates due to its relative ease in preparation,good environmental stability, and compatibility with othermaterials, which motivated us to prepare the core/shell-structured composite of ZnO and SiO2 and expected toachieve novel properties resulting from the synergic inter-action of these two chemical components. One of the mostpromising methods to increase the photocatalytic efficiencyis surface modification of ZnO, this can be achieved by metaldoping into the ZnO catalyst. Dopant can act as a sink tocollect photogenerated electrons from the conduction bandof the semiconductor. Thus, it hinders the recombinationof photogenerated electrons and holes through increasingthe charge separation [19–22]. The surface modification ofZnO nanoparticles by preparing charge-transfer catalystswith mixing multicomponent oxides can enhance the surfacechemical and physical properties and be considered as thekey for the successful photocatalytic applications of suchnanoparticles. Several metal ions such as Fe [23] and Ag[24, 25] have been used as dopants for ZnO to improveits photocatalytic activity. Photocatalytic degradation ofphenolic compounds with semiconducting oxides holdspromise for the purification and treatment of both drinkingand industrial wastewater [26–28]. The presence of suchorganic pollutants in aquatic environments has causedseveral environmental pollution problems.
In the present work, Pt/ZnO-SiO2 nanoparticles withlarge specific surface areas had been synthesized by the appli-cation of a photoassisted deposition (PAD) and impregna-tion (Img) methods, and the properties of the nanoparticleswere characterized by XRD, TEM, EXAFS, UV-Vis/DRS, andBET analysis. The photocatalytic activity of the synthesizednanoparticles was evaluated by the photodegradation ofphenol (as a model for pollutants in wastewater) under UVirradiation.
2. Experimental Methods
2.1. Chemicals. Zn(NO3)2·6H2O, H2PtCl6, and tetraethylorthosilicate (TEOS) were purchased from Aldrich andselected as the precursors of zinc, platinum, and silica,respectively. Standard grade phenol was purchased fromMerck with 99.5% purity. 1 M NaOH and 1 M HCl solutionswere used for pH adjustment. All chemicals used in this workwere of reagent-grade quality. The water used was deionizedwater.
2.2. Preparation of ZnO/SiO2. ZnO/SiO2 nanoparticles weresynthesized via a sol-gel technique and calcination. In a typ-ical procedure, 20 mL TEOS was mixed with ethyl alcohol(C2H5OH), ultrapure water (H2O), and nitric acid (HNO3)under vigorous stirring for 1 hr. The overall molar ratio ofTEOS : C2H5OH : H2O : HNO3was 1: 4 : 8 : 0.02. Subsequent-ly, after 60 min, an aqueous solution of Zn(NO3)2·6H2O wasadded in to the above solution under vigorous stirring for60 min. The reaction was performed at room temperature.The prepared samples were aged for 24 h. Finally, the sampleswere evaporated and dried at 80◦C, followed by calcinationat 550◦C for 3 h in air.
2.3. Preparation of Pt Loaded on ZnO/SiO2 Using PADMethod. Pt metal (3 wt%) was deposited on ZnO-SiO2 fromaqueous solution of H2PtCl6 under UV-light irradiation. Thesamples were dried at 100◦C and reduced by H2 (20 mL/min)at 350◦C for 4 h.
2.4. Preparation of Pt Loaded on ZnO/SiO2 Using Img Method.In a typical impregnation (Img) method, the 3 wt% of Ptmetal was deposited by a simple impregnation of ZnO-SiO2
in the absence of light with aqueous solution of H2PtCl6. Thesamples were dried at 100◦C and reduced by H2 (20 mL/min)at 350◦C for 4 h.
2.5. Characterization Techniques. To determine the crystallitesizes and identities of the Pt loaded on ZnO/SiO2 nanocom-posite photocatalyst, X-ray diffraction (XRD) analysis wascarried out at room temperature using Rigaku X-ray diffrac-tometer with Cu Kα radiation over a 2θ collection range of10–80◦. The shape of the samples was tested using Hitachi H-9500 transmission electron microscope (TEM), the preparedsamples were prepared by suspending the prepared samplesin ethanol, followed by ultrasonication for 30 min, then asmall amount of this solution onto a carbon-coated coppergrid and drying for TEM. Specific surface area was calculatedfrom measurements of N2-adsorption using Nova 2000 serieschromatech apparatus at 77 K. Prior to the measurements,all samples were treated under vacuum at 200◦C for 2 h. Theband gap of the samples was identified by UV-visible diffusereflectance spectra (UV-Vis-DRS) in air at room temperaturein the wavelength range of 200–800 nm using Shimadzu UV-2450 spectrophotometer. The extended X-ray absorption finestructure (EXAFS) is performed at BL-7C facility [29] ofthe Photon Factory at the National Laboratory for HighEnergy Physics, Tsukuba, Tokyo, Japan. A Si (1 1 1) double-crystal was used to monochromatize the X-rays from the2.5 GeV electron storage ring. The K-edge EXAFS spectraof Fe were measured in the fluorescence mode at 25◦C.The Fourier transformation was performed on K3-weightedEXAFS oscillations in effective range from 0–5 A.
2.6. Photocatalytic Activity Measurements. Photodegradationexperiments were performed with a photocatalytic reactorsystem at 25◦C. This bench-scale system consisted of acylindrical Pyrex-glass cell with 1 L. A 150-Watts mercurylamp was placed in a 5 cm diameter quartz tube with oneend tightly sealed by a Teflon stopper. The photoreactor wasfilled with 1 L of 100 mg/L aqueous phenol solution with1 g/L of each of the three prepared nanoparticles samples.The whole reactor was cooled with a water-cooled jacket onits outside to the temperature. Compressed air was purgedinto the solution by bubbling compressed air from thebottom to maintain an aerobic condition [30]. Magneticstirrer was also used to keep the solution chemically uniform.The pH of the solutions was adjusted and kept constantat 7 during the experiments by adding NaOH (1 M) andHCl (1 M) using an Orion Model 801 A pH meter. Theexperiments were carried out for 60 minutes. The liquidsamples were filtered for analysis through 0.2 μm syringe
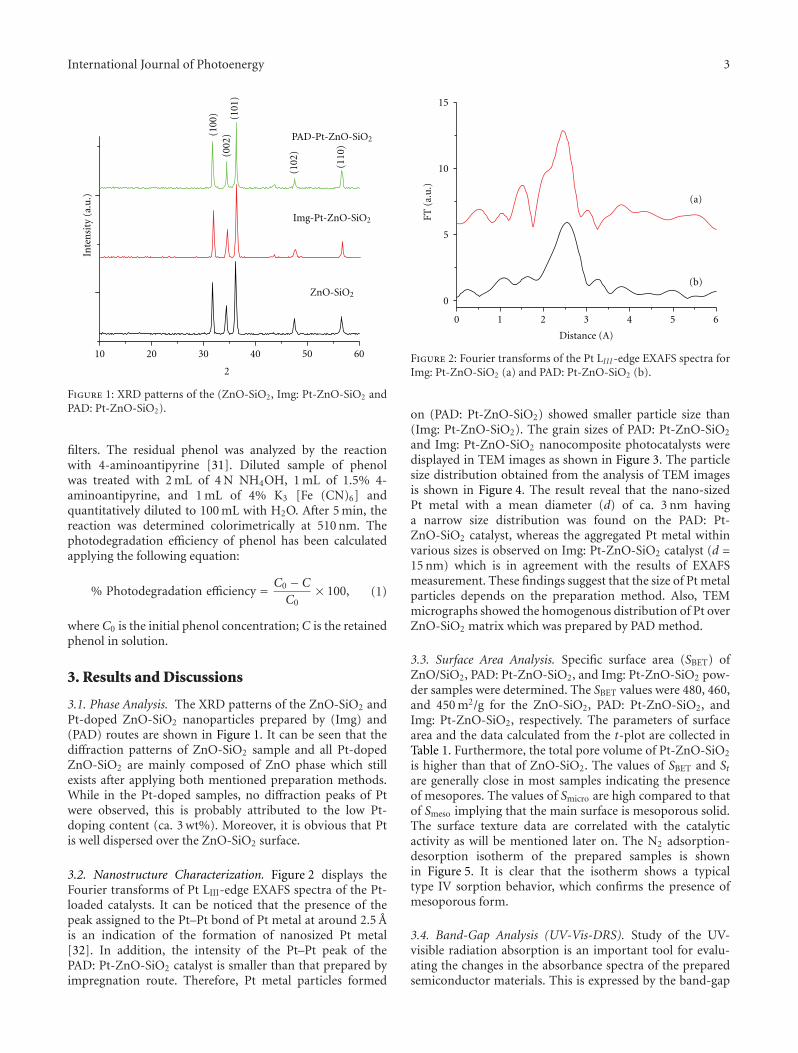
International Journal of Photoenergy 3
(100
)(0
02)
(101
)
(102
)
(110
)10 20 30 40 50 60
2
Inte
nsi
ty (
a.u
.)
PAD-Pt-ZnO-SiO2
Img-Pt-ZnO-SiO2
ZnO-SiO2
Figure 1: XRD patterns of the (ZnO-SiO2, Img: Pt-ZnO-SiO2 andPAD: Pt-ZnO-SiO2).
filters. The residual phenol was analyzed by the reactionwith 4-aminoantipyrine [31]. Diluted sample of phenolwas treated with 2 mL of 4 N NH4OH, 1 mL of 1.5% 4-aminoantipyrine, and 1 mL of 4% K3 [Fe (CN)6] andquantitatively diluted to 100 mL with H2O. After 5 min, thereaction was determined colorimetrically at 510 nm. Thephotodegradation efficiency of phenol has been calculatedapplying the following equation:
% Photodegradation efficiency = C0 − C
C0× 100, (1)
where C0 is the initial phenol concentration; C is the retainedphenol in solution.
3. Results and Discussions
3.1. Phase Analysis. The XRD patterns of the ZnO-SiO2 andPt-doped ZnO-SiO2 nanoparticles prepared by (Img) and(PAD) routes are shown in Figure 1. It can be seen that thediffraction patterns of ZnO-SiO2 sample and all Pt-dopedZnO-SiO2 are mainly composed of ZnO phase which stillexists after applying both mentioned preparation methods.While in the Pt-doped samples, no diffraction peaks of Ptwere observed, this is probably attributed to the low Pt-doping content (ca. 3 wt%). Moreover, it is obvious that Ptis well dispersed over the ZnO-SiO2 surface.
3.2. Nanostructure Characterization. Figure 2 displays theFourier transforms of Pt LIII-edge EXAFS spectra of the Pt-loaded catalysts. It can be noticed that the presence of thepeak assigned to the Pt–Pt bond of Pt metal at around 2.5 Ais an indication of the formation of nanosized Pt metal[32]. In addition, the intensity of the Pt–Pt peak of thePAD: Pt-ZnO-SiO2 catalyst is smaller than that prepared byimpregnation route. Therefore, Pt metal particles formed
0 1 2 3 4 5 6
0
5
10
15
Distance (A)
FT (
a.u
.)
(a)
(b)
Figure 2: Fourier transforms of the Pt LIII-edge EXAFS spectra forImg: Pt-ZnO-SiO2 (a) and PAD: Pt-ZnO-SiO2 (b).
on (PAD: Pt-ZnO-SiO2) showed smaller particle size than(Img: Pt-ZnO-SiO2). The grain sizes of PAD: Pt-ZnO-SiO2
and Img: Pt-ZnO-SiO2 nanocomposite photocatalysts weredisplayed in TEM images as shown in Figure 3. The particlesize distribution obtained from the analysis of TEM imagesis shown in Figure 4. The result reveal that the nano-sizedPt metal with a mean diameter (d) of ca. 3 nm havinga narrow size distribution was found on the PAD: Pt-ZnO-SiO2 catalyst, whereas the aggregated Pt metal withinvarious sizes is observed on Img: Pt-ZnO-SiO2 catalyst (d =15 nm) which is in agreement with the results of EXAFSmeasurement. These findings suggest that the size of Pt metalparticles depends on the preparation method. Also, TEMmicrographs showed the homogenous distribution of Pt overZnO-SiO2 matrix which was prepared by PAD method.
3.3. Surface Area Analysis. Specific surface area (SBET) ofZnO/SiO2, PAD: Pt-ZnO-SiO2, and Img: Pt-ZnO-SiO2 pow-der samples were determined. The SBET values were 480, 460,and 450 m2/g for the ZnO-SiO2, PAD: Pt-ZnO-SiO2, andImg: Pt-ZnO-SiO2, respectively. The parameters of surfacearea and the data calculated from the t-plot are collected inTable 1. Furthermore, the total pore volume of Pt-ZnO-SiO2
is higher than that of ZnO-SiO2. The values of SBET and Stare generally close in most samples indicating the presenceof mesopores. The values of Smicro are high compared to thatof Smeso implying that the main surface is mesoporous solid.The surface texture data are correlated with the catalyticactivity as will be mentioned later on. The N2 adsorption-desorption isotherm of the prepared samples is shownin Figure 5. It is clear that the isotherm shows a typicaltype IV sorption behavior, which confirms the presence ofmesoporous form.
3.4. Band-Gap Analysis (UV-Vis-DRS). Study of the UV-visible radiation absorption is an important tool for evalu-ating the changes in the absorbance spectra of the preparedsemiconductor materials. This is expressed by the band-gap

4 International Journal of Photoenergy
(a) (b)
Figure 3: The TEM images of the Img: Pt-ZnO-SiO2 (a) and PAD: Pt-ZnO-SiO2 (b) catalysts.
0
10
20
30
40
50
60
0 5 10 15 20 25 30
Dis
trib
uti
on (
%)
Particle size (nm)
(a)
0 2 4 6 8 100
10
20
30
40
50
60
Dis
trib
uti
on (
%)
Particle size (nm)
(b)
Figure 4: Size distribution diagrams of Pt metal obtained from the TEM images of the Img: Pt-ZnO-SiO2 (a) and PAD: Pt-ZnO-SiO2 (b)catalysts.
(Eg) measurement which can be altered by different param-eters. For instance, Eg value for pure ZnO phase is usuallyreported 3.37 [7]; however, these values are influenced bythe synthesis method, and also affected by the existenceof impurities doping the crystalline network and also theaverage crystal size of the semiconductor. In a previousstudy, different methods for calculating the Eg from theUV-Vis reflectance spectra were used. For example, someauthors calculated the Eg values by a direct extrapolation ofthe F(R) spectrum, whereas others reported the wavelengthcorresponding to the maximum absorption [33]. As a conse-quence, quite different Eg values for ZnO samples are foundin the literature. For instance, threshold wavelength valuesof 240 nm [34], 290 nm [35], and 360 nm [36] correspondto bandgaps 5.15, 4.28, and 3.45, respectively. Figure 6gives UV-Vis-DRS of (ZnO-SiO2, Img: Pt-ZnO-SiO2, and
PAD: Pt-ZnO-SiO2). The results showed an increase in theabsorbance in the visible light region with the Pt doping.The values of Eg for the synthesized semiconductors can be
derived from the spectra by plotting (F(R) · h )1/2 againsth [37, 38] as shown in Figure 7 and tabulated as shownin Table 2. The results revealed that the calculated values ofEg for (ZnO-SiO2, Img: Pt-ZnO-SiO2, and PAD: Pt-ZnO-SiO2) were 3.4, 3.25, and 3.05 eV, respectively. This indicatesshifting the spectra of the PAD: Pt-ZnO-SiO2 sample to thevisible light area.
3.5. Evaluation of Photocatalytic Activity. The photocatalyticactivity of the synthesized nanoparticles samples was eval-uated by degradation of phenol in solution under UVlight. Figure 8 displays the photocatalytic degradation of
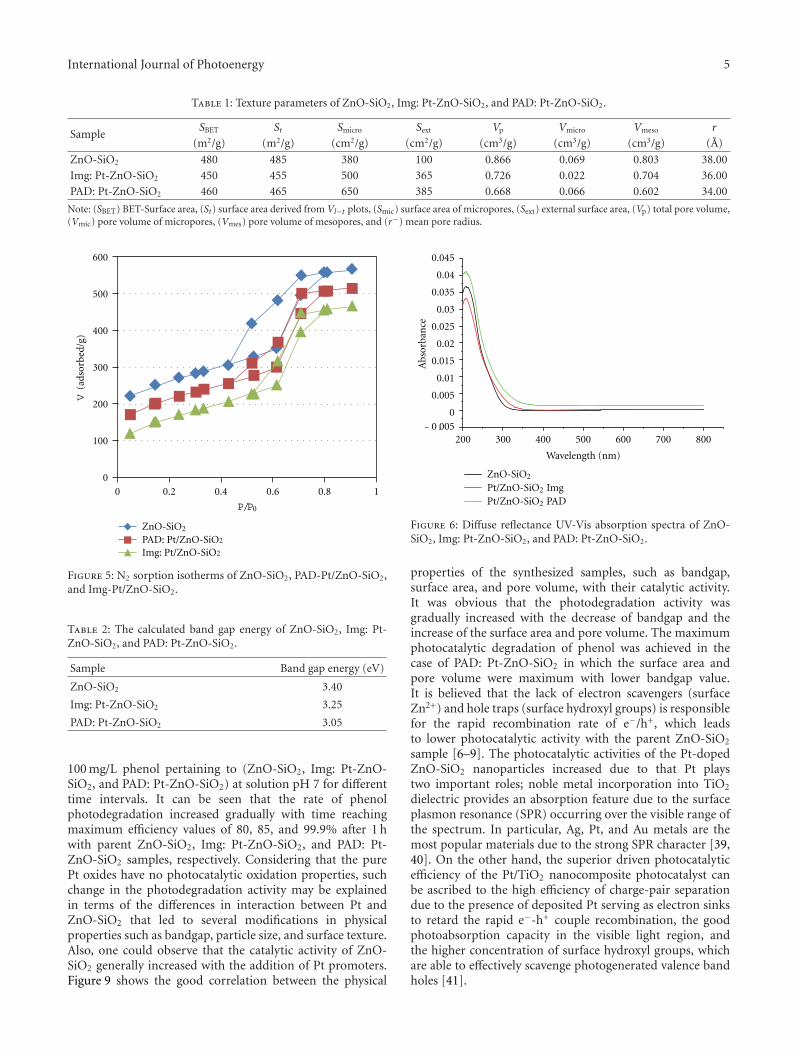
International Journal of Photoenergy 5
Table 1: Texture parameters of ZnO-SiO2, Img: Pt-ZnO-SiO2, and PAD: Pt-ZnO-SiO2.
SampleSBET St Smicro Sext Vp Vmicro Vmeso r
(m2/g) (m2/g) (cm2/g) (cm2/g) (cm3/g) (cm3/g) (cm3/g) (A)
ZnO-SiO2 480 485 380 100 0.866 0.069 0.803 38.00
Img: Pt-ZnO-SiO2 450 455 500 365 0.726 0.022 0.704 36.00
PAD: Pt-ZnO-SiO2 460 465 650 385 0.668 0.066 0.602 34.00
Note: (SBET) BET-Surface area, (St) surface area derived from Vl−t plots, (Smic) surface area of micropores, (Sext) external surface area, (Vp) total pore volume,(Vmic) pore volume of micropores, (Vmes) pore volume of mesopores, and (r−) mean pore radius.
0 0.2 0.4 0.6 0.8 1
P/P0
600
500
400
300
200
100
0
V(a
dsor
bed/
g)
ZnO-SiO2
PAD: Pt/ZnO-SiO2
Img: Pt/ZnO-SiO2
Figure 5: N2 sorption isotherms of ZnO-SiO2, PAD-Pt/ZnO-SiO2,and Img-Pt/ZnO-SiO2.
Table 2: The calculated band gap energy of ZnO-SiO2, Img: Pt-ZnO-SiO2, and PAD: Pt-ZnO-SiO2.
Sample Band gap energy (eV)
ZnO-SiO2 3.40
Img: Pt-ZnO-SiO2 3.25
PAD: Pt-ZnO-SiO2 3.05
100 mg/L phenol pertaining to (ZnO-SiO2, Img: Pt-ZnO-SiO2, and PAD: Pt-ZnO-SiO2) at solution pH 7 for differenttime intervals. It can be seen that the rate of phenolphotodegradation increased gradually with time reachingmaximum efficiency values of 80, 85, and 99.9% after 1 hwith parent ZnO-SiO2, Img: Pt-ZnO-SiO2, and PAD: Pt-ZnO-SiO2 samples, respectively. Considering that the purePt oxides have no photocatalytic oxidation properties, suchchange in the photodegradation activity may be explainedin terms of the differences in interaction between Pt andZnO-SiO2 that led to several modifications in physicalproperties such as bandgap, particle size, and surface texture.Also, one could observe that the catalytic activity of ZnO-SiO2 generally increased with the addition of Pt promoters.Figure 9 shows the good correlation between the physical
200 300 400 500 600 700 800
Wavelength (nm)
− 0.0050
0.005
0.01
0.015
0.02
0.025
0.03
0.035
0.04
0.045
Abs
orba
nce
ZnO-SiO2
Pt/ZnO-SiO2 ImgPt/ZnO-SiO2 PAD
Figure 6: Diffuse reflectance UV-Vis absorption spectra of ZnO-SiO2, Img: Pt-ZnO-SiO2, and PAD: Pt-ZnO-SiO2.
properties of the synthesized samples, such as bandgap,surface area, and pore volume, with their catalytic activity.It was obvious that the photodegradation activity wasgradually increased with the decrease of bandgap and theincrease of the surface area and pore volume. The maximumphotocatalytic degradation of phenol was achieved in thecase of PAD: Pt-ZnO-SiO2 in which the surface area andpore volume were maximum with lower bandgap value.It is believed that the lack of electron scavengers (surfaceZn2+) and hole traps (surface hydroxyl groups) is responsiblefor the rapid recombination rate of e−/h+, which leadsto lower photocatalytic activity with the parent ZnO-SiO2
sample [6–9]. The photocatalytic activities of the Pt-dopedZnO-SiO2 nanoparticles increased due to that Pt playstwo important roles; noble metal incorporation into TiO2
dielectric provides an absorption feature due to the surfaceplasmon resonance (SPR) occurring over the visible range ofthe spectrum. In particular, Ag, Pt, and Au metals are themost popular materials due to the strong SPR character [39,40]. On the other hand, the superior driven photocatalyticefficiency of the Pt/TiO2 nanocomposite photocatalyst canbe ascribed to the high efficiency of charge-pair separationdue to the presence of deposited Pt serving as electron sinksto retard the rapid e−-h+ couple recombination, the goodphotoabsorption capacity in the visible light region, andthe higher concentration of surface hydroxyl groups, whichare able to effectively scavenge photogenerated valence bandholes [41].

6 International Journal of PhotoenergyF
(RE
)1/2
6 5.5 5 4.5 4 3.5 3 2.5 2
Energy (eV)
0
0.02
0.04
0.06
0.08
0.10
0.12
0.14
ZnO-SiO2
Pt/ZnO-SiO2 ImgPt/ZnO-SiO2 PAD
Figure 7: Bandgap calculated from the DR-UV-Vis spectra of ZnO-SiO2, Img: Pt-ZnO-SiO2, and PAD: Pt-ZnO-SiO2.
ZnO-SiO2
Img Pt/ZnO-SiO2
PAD Pt/ZnO-SiO2
0 20 30 40 50 60 7010
Reaction time (min)
0
20
40
60
80
100
120
Ph
otoc
atal
ytic
deg
rada
tion
of
phen
ol (
%)
Figure 8: Photocatalytic degradation of phenol (%) for ZnO-SiO2,Img: Pt-ZnO-SiO2, and PAD: Pt-ZnO-SiO2. (a) PAD: Pt-ZnO-SiO2,(b) Img: Pt-ZnO-SiO2, and (c) ZnO-SiO2.
Accordingly, the highest activity was more clear in thePAD: Pt-ZnO-SiO2 sample in which the Pt diffuses in the lat-tice of the semiconductor. Thus, it lowered both the bandgap(as confirmed from the UV-Vis-DRS spectra analysis) andparticle size (as confirmed from the TEM analysis). Thisresulted in increase in the surface area and pore volume,and consequently showed the best photoactivity with phenoldegradation.
4. Conclusions
Pt doping, through photoassisted deposition (PAD) andimpregnation (Img) routes, can greatly enhance the per-formance of ZnO-SiO2 as a photocatalyst. The nano-sized
Pore
vol
um
e (c
m3/g
)
70 75 80 85 90 95 100 105 110
Photocatalytic degradation of phenol (%)
0
200
400
600
800Su
rfac
e ar
ea (
m2/g
)
70 75 80 85 90 95 100 105 110
Photocatalytic degradation of phenol (%)
70 75 80 85 90 95 100 105 110
Photocatalytic degradation of phenol (%)
0
0.2
0.4
0.6
0.8
1
0
1
2
3
4
Ban
dgap
(eV
)
C B A
CB
A
CB
A
Figure 9: Effect of physical parameters of the materials on theirphotocatalytic activity.
Pt metal with a mean diameter (d) of ca. 3 nm having anarrow size distribution was found on the PAD: Pt-ZnO-SiO2 catalyst, whereas the aggregated Pt metal with varioussizes is observed on Img: Pt-ZnO-SiO2 catalyst (d = 15 nm).The surface area of the synthesized samples was decreasedfrom 480 to 460 and 450 m2/g with ZnO-SiO2, PAD: Pt-ZnO-SiO2, and Img: Pt-ZnO-SiO2, respectively. The UV-Vis-DRS spectra analysis confirmed the lowest bandgab of PAD:Pt-ZnO-SiO2 with a value of 3.05, comparing to 3.25 and3.4 with Img: Pt-ZnO-SiO2 and ZnO-SiO2, respectively. Thephotocatalytic degradation of phenol in synthetic wastewatersolution was found to be much more effective in the PAD:Pt-ZnO-SiO2. The degradation efficiency increased from 80to 85 and 99.9%, with the ZnO/SiO2, Img: Pt-ZnO-SiO2,and PAD: Pt-ZnO-SiO2 samples, respectively. The smallestparticle size and lowest bandgab of the PAD: Pt-ZnO-SiO2
sample resulted in a high increase in the surface area and porevolume and consequently showed the best photoactivity withphenol degradation.
Acknowledgments
This paper was funded by the Deanship of ScientificResearch (DSR), King Abdulaziz University (KAU), Jeddah,under Grant no. (265/155/1431). The authors, therefore,

International Journal of Photoenergy 7
acknowledge with thanks DSR and KAU for technical andfinancial support.
References
[1] C. Hariharan, “Photocatalytic degradation of organic con-taminants in water by ZnO nanoparticles: revisited,” AppliedCatalysis A, vol. 304, no. 1-2, pp. 55–61, 2006.
[2] M. Mrowetz and E. Selli, “Photocatalytic degradation of for-mic and benzoic acids and hydrogen peroxide evolution inTiO2 and ZnO water suspensions,” Journal of Photochemistryand Photobiology A, vol. 180, no. 1-2, pp. 15–22, 2006.
[3] T. Pauporte and J. Rathousky, “Electrodeposited mesoporousZnO thin films as efficient photocatalysts for the degradationof dye pollutants,” Journal of Physical Chemistry C, vol. 111,no. 21, pp. 7639–7644, 2007.
[4] J. Yu and X. Yu, “Hydrothermal synthesis and photocatalyticactivity of zinc oxide hollow spheres,” Environmental Scienceand Technology, vol. 42, no. 13, pp. 4902–4907, 2008.
[5] J. H. Sun, S. Y. Dong, Y. K. Wang, and S. P. Sun, “Preparationand photocatalytic property of a novel dumbbell-shaped ZnOmicrocrystal photocatalyst,” Journal of Hazardous Materials,vol. 172, no. 2-3, pp. 1520–1526, 2009.
[6] M. Zhou, J. Yu, and B. Cheng, Journal of Hazardous Materials,vol. 137, 2006.
[7] C. F. Klingshirn, “ZnO: material, physics and applications,”ChemPhysChem, vol. 8, no. 6, pp. 782–803, 2007.
[8] A. Singhal, S. N. Achary, A. K. Tyagi, P. K. Manna, and S. M.Yusuf, “Colloidal Fe-doped ZnO nanocrystals: facile low tem-perature synthesis, characterization and properties,” MaterialsScience and Engineering B, vol. 153, no. 1–3, pp. 47–52, 2008.
[9] C. R. Estrellan, C. Salim, and H. Hinode, “Photocatalyticactivity of sol-gel derived TiO2 co-doped with iron and nio-bium,” Reaction Kinetics and Catalysis Letters, vol. 98, no. 1,pp. 187–192, 2009.
[10] J. J. Schneider, “Magnetic core/shell and quantum-confinedsemiconductor nanoparticles via chimie douce organometallicsynthesis,” Advanced Materials, vol. 13, no. 7, pp. 529–533,2001.
[11] H. B. Lee, Y. M. Yoo, and Y. H. Han, “Characteristic opticalproperties and synthesis of gold-silica core-shell colloids,”Scripta Materialia, vol. 55, no. 12, pp. 1127–1129, 2006.
[12] R. M. Mohamed and E. S. Aazam, “Photocatalytic oxidation ofcarbon monoxide over NiO/SnO2 nanocomposites under UVirradiation,” Journal of Nanotechnology, vol. 2012, Article ID794874, 9 pages, 2012.
[13] A. A. Ismail, I. A. Ibrahim, and R. M. Mohamed, “Sol-gelsynthesis of vanadia-silica for photocatalytic degradation ofcyanide,” Applied Catalysis B, vol. 45, no. 2, pp. 161–166, 2003.
[14] J. Zhang, Z. Liu, B. Han et al., “Preparation of silica and TiO2-SiO2 core-shell nanoparticles in water-in-oil microemulsionusing compressed CO2 as reactant and antisolvent,” Journal ofSupercritical Fluids, vol. 36, no. 3, pp. 194–201, 2006.
[15] V. Maurice, T. Georgelin, J. M. Siaugue, and V. Cabuil,“Synthesis and characterization of functionalized core-shellγFe2O3-SiO2 nanoparticles,” Journal of Magnetism and Mag-netic Materials, vol. 321, no. 10, pp. 1408–1413, 2009.
[16] R. M. Mohamed, “Characterization and catalytic propertiesof nano-sized Pt metal catalyst on TiO2-SiO2 synthesizedby photo-assisted deposition and impregnation methods,”Journal of Materials Processing Technology, vol. 209, no. 1, pp.577–583, 2009.
[17] K. S. Chou and C. C. Chen, “Fabrication and characterizationof silver core and porous silica shell nanocomposite particles,”Microporous and Mesoporous Materials, vol. 98, no. 1–3, pp.208–213, 2007.
[18] R. M. Mohamed and I. A. Mkhalid, “Characterization andcatalytic properties of nano-sized Ag metal catalyst on TiO2-SiO2 synthesized by photo-assisted deposition and impregna-tion methods,” Journal of Alloys and Compounds, vol. 501, no.2, pp. 301–306, 2010.
[19] M. J. Height, S. E. Pratsinis, O. Mekasuwandumrong, and P.Praserthdam, “Ag-ZnO catalysts for UV-photodegradation ofmethylene blue,” Applied Catalysis B, vol. 63, no. 3-4, pp. 305–312, 2006.
[20] T.-Y. Han, C.-F. Wu, and C.-T. Hsieh, “Hydrothermal syn-thesis and visible light photocatalysis of metal-doped titaniananoparticles,” Journal of Vacuum Science and Technology B,vol. 25, no. 2, article 430, 6 pages, 2007.
[21] R. Ullah and J. Dutta, “Photocatalytic degradation of organicdyes with manganese-doped ZnO nanoparticles,” Journal ofHazardous Materials, vol. 156, no. 1–3, pp. 194–200, 2008.
[22] R. Slama, F. Ghribi, A. Houas, C. Barthou, and L. El Mir, Inter-national Journal of Nanoelectronics and Materials, vol. 3, p. 133,2010.
[23] R. M. Mohamed, M. A. Al-Rayyani, E. S. Baeissa, and I. A.Mkhalid, “Nano-sized Fe-metal catalyst on ZnO-SiO2: (pho-to-assisted deposition and impregnation) Synthesis routes andnanostructure characterization,” Journal of Alloys and Com-pounds, vol. 509, no. 24, pp. 6824–6828, 2011.
[24] C. Ren, B. Yang, M. Wu et al., “Synthesis of Ag/ZnO nanorodsarray with enhanced photocatalytic performance,” Journal ofHazardous Materials, vol. 182, no. 1–3, pp. 123–129, 2010.
[25] Y. Lai, M. Meng, and Y. Yu, “One-step synthesis, character-izations and mechanistic study of nanosheets-constructedfluffy ZnO and Ag/ZnO spheres used for Rhodamine B pho-todegradation,” Applied Catalysis B, vol. 100, no. 3-4, pp. 491–501, 2010.
[26] M. A. Barakat, H. Schaeffer, G. Hayes, and S. Ismat-Shah,“Photocatalytic degradation of 2-chlorophenol by Co-dopedTiO2 nanoparticles,” Applied Catalysis B, vol. 57, no. 1, pp. 23–30, 2005.
[27] M. A. Barakat, J. M. Tseng, and C. P. Huang, “Hydrogen perox-ide-assisted photocatalytic oxidation of phenolic compounds,”Applied Catalysis B, vol. 59, no. 1-2, pp. 99–104, 2005.
[28] A. Abdel Aal, M. A. Barakat, and R. M. Mohamed, “Elec-trophoreted Zn-TiO2-ZnO nanocomposite coating films forphotocatalytic degradation of 2-chlorophenol,” Applied Sur-face Science, vol. 254, no. 15, pp. 4577–4583, 2008.
[29] M. Nomura and A. Koyama, “Design of an XAFS beamlineat the photon factory: possibilities of bent conical mirrors,”Journal of Synchrotron Radiation, vol. 6, no. 3, pp. 182–184,1999.
[30] M. A. Barakat, Y. T. Chen, and C. P. Huang, “Removal oftoxic cyanide and Cu(II) Ions from water by illuminated TiO2
catalyst,” Applied Catalysis B, vol. 53, no. 1, pp. 13–20, 2004.[31] J. R. Pemberton, “Retention of preservative levels of formalde-
hyde in desiccated biological products,” Journal of ClinicalMicrobiology, vol. 2, no. 2, pp. 144–146, 1975.
[32] A. Caballero, F. Villain, H. Dexpert, F. Lepeltier, B. Didillon,and J. Lynch, “In situ EXAFS studies of modifications to sup-ported metallic catalysts under reactive atmospheres,” Cataly-sis Letters, vol. 20, no. 1-2, pp. 1–13, 1993.
[33] R. J. Davis and Z. Liu, “Titania-silica: a model binary oxidecatalyst system,” Chemistry of Materials, vol. 9, no. 11, pp.2311–2324, 1997.

8 International Journal of Photoenergy
[34] H. Yoshida, T. Shimizu, C. Murata, and T. Hattori, “Highlydispersed zinc oxide species on silica as active sites for pho-toepoxidation of propene by molecular oxygen,” Journal ofCatalysis, vol. 220, no. 1, pp. 226–232, 2003.
[35] M. Huang, P. E. J. Rivera-Dıaz-Del-Castillo, O. Bouaziz, andS. Van Der Zwaag, “Irreversible thermodynamics modellingof plastic deformation of metals,” Materials Science and Tech-nology, vol. 24, no. 4, pp. 495–500, 2008.
[36] G. D. Mihai, V. Meynen, M. Mertens, N. Bilba, P. Cool, andE. F. Vansant, “ZnO nanoparticles supported on mesoporousMCM-41 and SBA-15: a comparative physicochemical andphotocatalytic study,” Journal of Materials Science, vol. 45, no.21, pp. 5786–5794, 2010.
[37] M. Anpo and M. Che, “Applications of photoluminescencetechniques to the characterization of solid surfaces in relationto adsorption, catalysis, and photocatalysis,” Advances in Ca-talysis, vol. 44, pp. 119–257, 1999.
[38] G. Lassaletta, A. Fernandez, J. P. Espinos, and A. R. Gonzalez-Elipe, “Spectroscopic characterization of quantum-sized TiO2
supported on silica: influence of size and TiO2-SiO2 interfacecomposition,” Journal of Physical Chemistry, vol. 99, no. 5, pp.1484–1490, 1995.
[39] J. F. Rivadulla, M. C. Vergara, M. C. Blanco, M. A. Lopez-Quintela, and J. Rivas, “Optical properties of platinum parti-cles synthesized in microemulsions,” Journal of Physical Chem-istry B, vol. 101, no. 44, pp. 8997–9004, 1997.
[40] N. A. M. Barakat, K. D. Woo, M. A. Kanjwal, K. E. Choi, M.S. Khil, and H. Y. Kim, “Surface plasmon resonances, opticalproperties, and electrical conductivity thermal hystersis ofsilver nanofibers produced by the electrospinning technique,”Langmuir, vol. 24, no. 20, pp. 11982–11987, 2008.
[41] D. Zhang, “Visible light-induced photocatalysis through sur-face plasmon excitation of platinum-metallized titania forphotocatalytic bleaching of rhodamine B,” Monatshefte furChemie, vol. 143, no. 5, pp. 729–738, 2012.

Hindawi Publishing CorporationInternational Journal of PhotoenergyVolume 2012, Article ID 624270, 7 pagesdoi:10.1155/2012/624270
Research Article
Degradation of Antibiotics in Wastewater duringSonolysis, Ozonation, and Their Simultaneous Application:Operating Conditions Effects and Processes Evaluation
Vincenzo Naddeo, Daniele Ricco, Davide Scannapieco, and Vincenzo Belgiorno
Department of Civil Engineering, University of Salerno, V. Ponte don Melillo, 84084 Fisciano, Italy
Correspondence should be addressed to Vincenzo Naddeo, [email protected]
Received 20 March 2012; Accepted 16 May 2012
Academic Editor: Manickavachagam Muruganandham
Copyright © 2012 Vincenzo Naddeo et al. This is an open access article distributed under the Creative Commons AttributionLicense, which permits unrestricted use, distribution, and reproduction in any medium, provided the original work is properlycited.
Pharmaceutical drugs frequently found in treated effluents, lakes and rivers, can exhibit adverse effects on aquatic organisms. Thepresent study focuses on the application of advanced oxidation processes as ozonation (O3), sonolysis (US), and their combinedapplication (US+O3) for the degradation of diclofenac in wastewater. Under the applied conditions, all three systems proved to beable to induce diclofenac oxidation, leading to 22% of mineralization for O3 and 36% for US process after 40 min of treatment.The synergy observed in the combined schemes, mainly due to the effects of US in enhancing the O3 decomposition, led to ahigher mineralization (about 40%) for 40-minute treatment and to a significantly higher mineralization level for shorter treatmentduration.
1. Introduction
The widespread occurrence of pharmaceuticals and personalcare products in the aquatic environment is a recognizedproblem of unknown consequences [1–3]. Different sourcesmay cause the appearance of pharmaceuticals in water andsoils. The main one is represented by wastewater treatmentplants (WWTPs) effluents [4, 5]. Other sources includedirect applications in aqua farming, manure run-off [1], viahospital effluent [6], or finally, via landfill leaching [7]. In theaquatic environment, diclofenac (DCF) is one of the mostfrequently detected pharmaceuticals [8]. Its presence inurban wastewater treatment plants (UWTPs) effluents hasbeen often documented [3, 9–12], with a usual concentrationranging from 2 to 10 μg/L [1, 3, 5, 6].
Recent studies revealed that conventional water treat-ment processes cannot completely remove DCF from sourcewaters [13–17], so the adoption of advanced oxidation pro-cesses (AOPs) in the tertiary treatment section of existingUWTPs can significantly represent a tool for this reduction[12, 17–21].
Several AOPs have been evaluated for the degradation ofdiclofenac. A number of studies indicated a high reactivity ofDCF towards ozonation [12, 13, 17, 21, 22]. In [22], Authorsalso noted a positive effect of hydrogen peroxide addition onthe diclofenac conversion by ozone.
In a different work [20], the H2O2/UV treatment of DCFhas been investigated, and the obtained results have beencompared with ozonation and direct photolysis. At an initialDCF concentration of 296 mg/L, direct photolysis ensured adrug removal up to 45% for a treatment time of 1.5 h using a17-W low-pressure Hg lamp that emitted UV light at 254 nmwith an intensity of 2.7·10−6 Einstein/s.
The DCF degradation was strongly enhanced by the addi-tion of hydrogen peroxide (170 mg/L; H2O2/UV AOP) tomore than 90% conversion. The Fenton-type process has hadan apparent disadvantage during the DCF degradationbecause the drug (pKa = 4.15) precipitated in an acidicmedium, which is required to keep iron dissolved [23, 24].Titanium dioxide photocatalysis induced by UV-A [25, 26]or artificial solar irradiation [24, 27] was also evaluated forthe DCF degradation.

2 International Journal of Photoenergy
Air
generator
Absorptioncolumn
Three-wayvalve
detection
US bath
Reactor
USgenerator
Absorptionbottle
Off gas
To O3 gas
O3
O3
Figure 1: Laboratory-scale experimental setup for the degradation of diclofenac through ozonation/sonolysis.
DCF sonochemical degradation in synthetic water hasbeen analyzed only in recent times [28–30].
Among the mentioned processes, sonolysis, ozonation,and their combined application have been investigated in thisstudy as suitable tools for pharmaceutical degradation fromUWTPs effluents.
The application of ultrasound technology to wastewatertreatment has been developed in recent times [28, 31–36].The sonolysis of aqueous solutions, based on cavitation withhigh temperatures and pressures, leads to the formation ofhighly reactive hydroxyl radicals (•OH).
The main objective was to investigate and compare theeffects of ultrasound (US), ozone (O3), and their combi-nation (US+O3) on DCF degradation, with the analysis ofoperating parameters such as pH, temperature, US powerdensity, and O3 dose.
2. Materials and Methods
2.1. Reagents. DCF (crystalline sodium salt of [2-(2,6-dichlorophenylamino)-phenyl]-acetic acid), characterizedby a solubility in water of 237 mg/L at 25◦C and a meltingpoint of 275–277◦C, was provided by Sigma-Aldrich.
Tests were performed on urban wastewater samples(Table 1), in which a known concentration of DCF wasspiked.
According to reported concentration levels in drugindustry wastewater, the spiked concentrations were consid-erably higher than DCF occurrence levels in the environ-ment, but these concentrations were intentionally selected soas to be able to better monitor the removal and mineraliza-tion potential with available analytical techniques [6, 17, 26,29, 34].
2.2. Experimental Setup. Ozone was generated onsite by anO3 supply system (Microlab, Aeraque, Italy) using ultrapureair. The air flow rate to the ozone generator was monitoredwith a rotameter. Ozone flow was controlled using an absorp-tion column containing deionised water. Surplus ozone
Table 1: Physicochemical characterization of sampled wastewater(WWTP effluent).
Parameter Average value
pH 8.10± 0.98
DO (mg/L) 5.30± 1.03
Electrical conductivity (μS/cm) 1696± 182
Turbidity (NTU) 0.827± 0.158
BOD5 (mg/L) 7± 2
COD (mg/L) 8.6± 3
TOC (mg/L) 4.51± 1.62
was passed into gas absorption bottles containing 2% (w/v)KI solution.
The US tests were carried out with a Sonics VibracellVCX-750 (Sonics & Materials Inc., USA) ultrasonic trans-ducer, equipped with a 20 kHz converter and a titanium hornwith a 1.3 cm in diameter tip. During the tests, the probe waspartially immersed in the liquid for about 4 cm, fixed at thecentre of the reactor, and plugged with a polyethylene capduring the operation. The ultrasonic process was performedinto an ultrasonic bath in order to keep the temperatureconstant over time. In Figure 1, a scheme of the experimentalsetup at laboratory scale is provided.
Combined US+O3 tests were carried out using a com-bined ozonation and sonolysis experimental setup as detailedin [29]. In all tested conditions, a spiked wastewater solution(150 mL), contained in a 250 mL cylindrical Pyrex glassreactor (Schott Duran, Germany), was used.
2.3. Experimental Conditions. The ozonation tests were con-ducted at different treatment duration (i.e., 5, 10, 20, and40 min), using two different ozone flows (2.4 and 31 g/h),which were able to keep dissolved ozone concentrationsin the 5–15 mg/L range, similar to those already used fordisinfection and other compounds removal [17, 37, 38].
Ozone was generated onsite by an O3 supply system(Microlab, Aeraque) using ultrapure air. The air flow-rate to
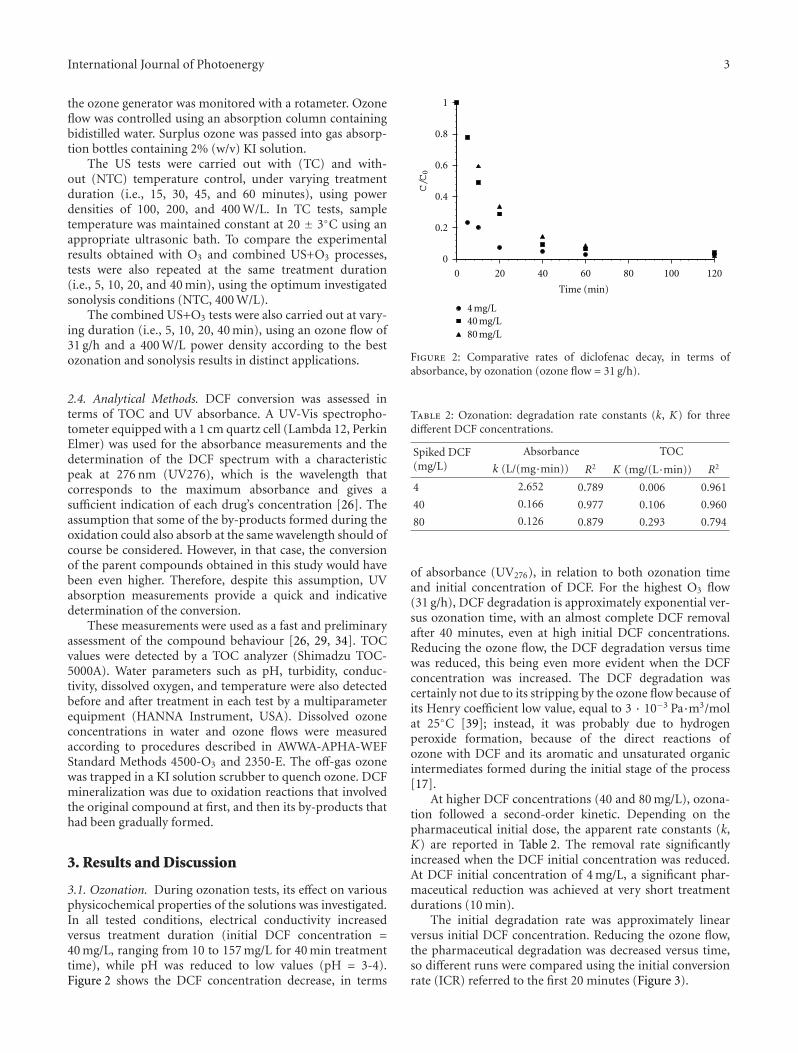
International Journal of Photoenergy 3
the ozone generator was monitored with a rotameter. Ozoneflow was controlled using an absorption column containingbidistilled water. Surplus ozone was passed into gas absorp-tion bottles containing 2% (w/v) KI solution.
The US tests were carried out with (TC) and with-out (NTC) temperature control, under varying treatmentduration (i.e., 15, 30, 45, and 60 minutes), using powerdensities of 100, 200, and 400 W/L. In TC tests, sampletemperature was maintained constant at 20 ± 3◦C using anappropriate ultrasonic bath. To compare the experimentalresults obtained with O3 and combined US+O3 processes,tests were also repeated at the same treatment duration(i.e., 5, 10, 20, and 40 min), using the optimum investigatedsonolysis conditions (NTC, 400 W/L).
The combined US+O3 tests were also carried out at vary-ing duration (i.e., 5, 10, 20, 40 min), using an ozone flow of31 g/h and a 400 W/L power density according to the bestozonation and sonolysis results in distinct applications.
2.4. Analytical Methods. DCF conversion was assessed interms of TOC and UV absorbance. A UV-Vis spectropho-tometer equipped with a 1 cm quartz cell (Lambda 12, PerkinElmer) was used for the absorbance measurements and thedetermination of the DCF spectrum with a characteristicpeak at 276 nm (UV276), which is the wavelength thatcorresponds to the maximum absorbance and gives asufficient indication of each drug’s concentration [26]. Theassumption that some of the by-products formed during theoxidation could also absorb at the same wavelength should ofcourse be considered. However, in that case, the conversionof the parent compounds obtained in this study would havebeen even higher. Therefore, despite this assumption, UVabsorption measurements provide a quick and indicativedetermination of the conversion.
These measurements were used as a fast and preliminaryassessment of the compound behaviour [26, 29, 34]. TOCvalues were detected by a TOC analyzer (Shimadzu TOC-5000A). Water parameters such as pH, turbidity, conduc-tivity, dissolved oxygen, and temperature were also detectedbefore and after treatment in each test by a multiparameterequipment (HANNA Instrument, USA). Dissolved ozoneconcentrations in water and ozone flows were measuredaccording to procedures described in AWWA-APHA-WEFStandard Methods 4500-O3 and 2350-E. The off-gas ozonewas trapped in a KI solution scrubber to quench ozone. DCFmineralization was due to oxidation reactions that involvedthe original compound at first, and then its by-products thathad been gradually formed.
3. Results and Discussion
3.1. Ozonation. During ozonation tests, its effect on variousphysicochemical properties of the solutions was investigated.In all tested conditions, electrical conductivity increasedversus treatment duration (initial DCF concentration =40 mg/L, ranging from 10 to 157 mg/L for 40 min treatmenttime), while pH was reduced to low values (pH = 3-4).Figure 2 shows the DCF concentration decrease, in terms
0
0.2
0.4
0.6
0.8
1
0 20 40 60 80 100 120
Time (min)
4 mg/L40 mg/L80 mg/L
C/C
0
Figure 2: Comparative rates of diclofenac decay, in terms ofabsorbance, by ozonation (ozone flow = 31 g/h).
Table 2: Ozonation: degradation rate constants (k, K) for threedifferent DCF concentrations.
Spiked DCF(mg/L)
Absorbance TOC
k (L/(mg·min)) R2 K (mg/(L·min)) R2
4 2.652 0.789 0.006 0.961
40 0.166 0.977 0.106 0.960
80 0.126 0.879 0.293 0.794
of absorbance (UV276), in relation to both ozonation timeand initial concentration of DCF. For the highest O3 flow(31 g/h), DCF degradation is approximately exponential ver-sus ozonation time, with an almost complete DCF removalafter 40 minutes, even at high initial DCF concentrations.Reducing the ozone flow, the DCF degradation versus timewas reduced, this being even more evident when the DCFconcentration was increased. The DCF degradation wascertainly not due to its stripping by the ozone flow because ofits Henry coefficient low value, equal to 3 · 10−3 Pa·m3/molat 25◦C [39]; instead, it was probably due to hydrogenperoxide formation, because of the direct reactions ofozone with DCF and its aromatic and unsaturated organicintermediates formed during the initial stage of the process[17].
At higher DCF concentrations (40 and 80 mg/L), ozona-tion followed a second-order kinetic. Depending on thepharmaceutical initial dose, the apparent rate constants (k,K) are reported in Table 2. The removal rate significantlyincreased when the DCF initial concentration was reduced.At DCF initial concentration of 4 mg/L, a significant phar-maceutical reduction was achieved at very short treatmentdurations (10 min).
The initial degradation rate was approximately linearversus initial DCF concentration. Reducing the ozone flow,the pharmaceutical degradation was decreased versus time,so different runs were compared using the initial conversionrate (ICR) referred to the first 20 minutes (Figure 3).

4 International Journal of Photoenergy
0
0.5
1
1.5
2
2.5
3
3.5
4
0 10 20 30 40 50 60 70 80
Initial DCF concentration (mg/L)
Max. ozone flowMin. ozone flow
Init
ial c
onve
rsio
n r
ate
(mg/
(L·m
in))
ICR = 0.033C0
R2 = 0.997
ICR = 0.007R2 = 0.682
C0
Figure 3: Initial DCF conversion rates, in terms of absorbance, byozonation (ozone flow = 31 g/h).
The fact that the compound reacts so fast with ozonemakes more necessary the process analysis in terms ofTOC reduction that represents in a better way the realcapacity of ozone to deal with DCF and its by-productsmineralization. TOC removal behaviour was linear in rela-tion to the ozonation duration and increased with initialDCF concentration (Figure 4). Although UV absorbancemeasurements indicated complete drug removal after 40minutes, the maximum TOC reduction achieved was only30% for an initial DCF concentration of 80 mg/L.
This result, as documented in the literature about organiccompound ozonation [17, 40, 41], can be probably attributedto the formation of secondary organic by-products (car-boxylic acids such as maleic, malonic, pyruvic, and oxalicacids), with some polar character, which did not react withozone and showed a different UV absorbance profile thanthat of the parent compound [29, 30, 34].
3.2. Sonolysis. During sonication tests, the effect on thetreatment efficiency of physicochemical properties of testedsolutions has been investigated. In all analyzed conditions,electrical conductivity was increased, while pH and redoxpotential were reduced by the sonication treatment duration.However, the behaviour of these parameters was stronglyinfluenced by the ultrasonic power dose [33].
The DCF concentration decline, in terms of TOC, isshown in relation to irradiation time and US density inFigure 5.
Since the DCF salt is considerably soluble in water andnonvolatile, degradation inside the cavitation bubble wasinsignificant, and therefore, hydroxyl radical-induced reac-tions were likely to be the main DCF degradation mech-anism. Hydroxyl radicals, formed through water sonolysis,can partly recombine yielding hydrogen peroxide which inturn reacts with hydrogen to regenerate hydroxyl radicals.Therefore, the showed results (Figure 5) are, perhaps, directlyconnected to the hydroxyl radicals action, which increasedwhen high ultrasound densities were applied. A higher
0.6
0.7
0.8
0.9
1
0 10 20 30 40
Time (min)
4 mg/L40 mg/L
TOC/TOC0 = − 0.003t+ 1R2 = 0.961
TO
C/T
OC
0 0TOC/TOC = − 0.005t+ 1R2 = 0.96
TOC/TOC0 = − 0.007t+ 1R2 = 0.794
Figure 4: Comparative rates of diclofenac organic carbon decay interms of TOC by ozonation (ozone flow = 31 g/h).
0.4
0.5
0.6
0.7
0.8
0.9
1
0 10 20 30 40 50 60
Time (min)
200 W/L (TC)200 W/L (NTC)
TOC/TOC0 = − 0.004t+ 1R2 = 0.952
TOC/TOC0 = − 0.005t+ 1R2 = 0.992
TOC/TOC0 = − 0.007t+ 1R2 = 0.957
TOC/TOC0 = − 0.008t+ 1R2 = 0.958
400 W/L (TC)400 W/L (NTC)
TO
C/T
OC
0
Figure 5: DCF degradation in terms of TOC in relation to ultra-sound power densities and bulk temperature conditions (20 kHz,C0 = 40 mg/L).
US density results in higher supply energy that leads toan enhanced formation of cavitation bubbles. Hence, thedegradation rate of DCF increased with the power density.
In NTC conditions, a gradual temperature increase of theliquid bulk solution was recorded due to heat dissipation.For the experiments performed at 400 W/L, temperatureincreased from 25◦C at t = 0 to 71◦C at 30 min and finallyto 76◦C at 60 min; the corresponding values at 200 W/L were66 and 71◦C. Consequently, increased temperatures favourDCF conversion: in NTC tests, more than 55% of DCFwas degraded by a 400 W/L power density within 60 min, atinitial concentration of 80 mg/L.
At 100 W/L, the DCF degradation rate was quite low,whereas only small differences between the degradation rateat 200 and 400 W/L were observed. Since the maximum tem-perature obtained during the bubble collapse is proportionalto the liquid bulk temperature, increased temperatures areexpected to enhance reaction rates. Nevertheless, this effect

International Journal of Photoenergy 5
1
0.9
0.8
0.7
0.6
0.5
TO
C/T
OC
0
0 10 20 30 40
Time (min)
O3
USUS + O3
TOC/TOC0 = − 0.005t+ 1R2 = 0.96
TOC/TOC0 = − 0.008t+ 1R2 = 0.984
TOC/TOC0 = − 0.01t+ 1R2 = 0.907
Figure 6: Comparative rates of diclofenac (C0 = 40 mg/L) organiccarbon decay in terms of TOC in 40 min by sonolysis (20 kHz,400 W/L, NTC), ozonation (31 g/h), and their simultaneous appli-cation (US+O3).
can be counterbalanced or even overcome by the fact thatbubbles contain more vapour, which moderates implosionand consequently reduces reaction rates. However, in NTCconditions, the increase in liquid bulk temperature resultedin an increase in DCF conversion; therefore, during TC tests,the pharmaceutical degradation was always lower.
3.3. Combined US+O3 Treatment. The US+O3 tests werecarried out through the combination of the sonolysis andozonation optimized removal conditions, which wereobtained through the former experimental runs (31 g/h O3
flow, at 400 W/L ultrasonic power density, without tem-perature control). During US+O3 tests, the initial solutiontemperature and electrical conductivity increased versustreatment time. As for sonolysis and ozonation, pH wasinstead reduced from a nearly neutral to acidic values(pH = 3-4).
In terms of absorbance, DCF degradation can bedescribed by a first order reaction kinetic. The removal rateincreased significantly when comparing the ozonation treat-ment efficiency to the combined US+O3 process. In terms ofabsorbance measurements, the final DCF concentration insolution is probably the same (about 3 mg/L) for 40 minutes,in both cases, but for 5 to 20 minutes the combined US+O3
action induced much higher degradation.TOC measurements showed linear trends (Table 3). For
40-minute treatment, DCF reduction was up to 39%, greaterthan the degradation attributable to ozonation (22%), andcomparable with those due to sonolysis (36%). During thefirst 20 minutes of the experiment, the combined US+O3
action induced significantly higher TOC removal (Figure 6).
4. Conclusions
The persistence in the environment of DCF and its oxidativedegradation by means of ozone, ultrasound, and their
Table 3: DCF degradation rate constants (K) in terms of TOCreferred to sonolysis (20 kHz, 400 W/L, NTC), ozonation (31 g/h),and their combination (US + O3) for an initial DCF concentrationof 40 mg/L.
Treatment processTOC
K (mg/(L·min)) R2
US 0.169 0.984
O3 0.106 0.960
US + O3 0.211 0.907
simultaneous application has been studied in the presentwork. The ozonation has been demonstrated to be a suitabletool for pharmaceuticals degradation in wastewater sampleseven at process conditions usually adopted in drinking waterfacilities. Sonolysis is more efficient than ozonation for themineralization of DCF. Results show that there is a synergisticeffect when sonolysis and ozonation are applied jointly, andthis is attributed to the enhanced O3 degradation by col-lapsing bubbles that may yield additional free radicals. Thedegradation pattern of high concentrations of DCF inwastewater is similar for all tested processes.
The results obtained through this research work can befurther enhanced through the investigation of the by-products formation by chromatographic techniques, in orderto better determine and assess the removal kinetics of theformed compounds. In addition, toxicity bioassays can helpin the evaluation of the potential impact that these by-products may exhibit. It is also necessary to implement thecombined processes at a pilot scale to better assess the phar-maceuticals degradation in real wastewater samples.
Acknowledgment
The authors wish to thank P. Napodano and M. Landi for thetechnical support provided. The study was partly funded bythe University of Salerno (FARB-ex 60%, 2009).
References
[1] B. Halling-Sørensen, S. Nors Nielsen, P. F. Lanzky, F. Ingerslev,H. C. Holten Lutzhøft, and S. E. Jørgensen, “Occurrence, fateand effects of pharmaceutical substances in the environment-A review,” Chemosphere, vol. 36, no. 2, pp. 357–393, 1998.
[2] D. W. Kolpin, E. T. Furlong, M. T. Meyer et al., “Pharmaceuti-cals, hormones, and other organic wastewater contaminants inU.S. streams, 1999-2000: a national reconnaissance,” Environ-mental Science and Technology, vol. 36, no. 6, pp. 1202–1211,2002.
[3] T. Heberer, “Occurrence, fate, and removal of pharmaceuticalresidues in the aquatic environment: a review of recentresearch data,” Toxicology Letters, vol. 131, no. 1-2, pp. 5–17,2002.
[4] C. G. Daughton and T. A. Ternes, “Pharmaceuticals and per-sonal care products in the environment: agents of subtlechange?” Environmental Health Perspectives, vol. 107, no. 6, pp.907–938, 1999.
[5] B. Kasprzyk-Hordern, R. M. Dinsdale, and A. J. Guwy, “Theoccurrence of pharmaceuticals, personal care products,
6 International Journal of Photoenergy
endocrine disruptors and illicit drugs in surface water in SouthWales, UK,” Water Research, vol. 42, no. 13, pp. 3498–3518,2008.
[6] K. Kummerer, “Drugs in the environment: emission of drugs,diagnostic aids and disinfectants into wastewater by hospitalsin relation to other sources—a review,” Chemosphere, vol. 45,no. 6-7, pp. 957–969, 2001.
[7] M. L. Richardson and J. M. Bowron, “The fate of pharma-ceutical chemicals in the aquatic environment,” Journal ofPharmacy and Pharmacology, vol. 37, no. 1, pp. 1–12, 1985.
[8] R. Triebskorn, H. Casper, A. Heyd, R. Eikemper, H. R.Kohler, and J. Schwaiger, “Toxic effects of the non-steroidalanti-inflammatory drug diclofenac: part II. Cytologicaleffects in liver, kidney, gills and intestine of rainbow trout(Oncorhynchus mykiss),” Aquatic Toxicology, vol. 68, no. 2, pp.151–166, 2004.
[9] B. Soulet, A. Tauxe, and J. Tarradellas, “Analysis of acidic drugsin Swiss wastewaters,” International Journal of EnvironmentalAnalytical Chemistry, vol. 82, no. 10, pp. 659–667, 2002.
[10] C. Tixier, H. P. Singer, S. Oellers, and S. R. Muller, “Occurrenceand fate of carbamazepine, clofibric acid, diclofenac, ibupro-fen, ketoprofen, and naproxen in surface waters,” Environmen-tal Science and Technology, vol. 37, no. 6, pp. 1061–1068, 2003.
[11] R. Andreozzi, V. Caprio, C. Ciniglia et al., “Antibiotics in theenvironment: occurrence in Italian STPs, fate, and preliminaryassessment on algal toxicity of amoxicillin,” EnvironmentalScience and Technology, vol. 38, no. 24, pp. 6832–6838, 2004.
[12] M. M. Sein, M. Zedda, J. Tuerk, T. C. Schmidt, A. Golloch,and C. Von Sonntag, “Oxidation of diclofenac with ozone inaqueous solution,” Environmental Science and Technology, vol.42, no. 17, pp. 6656–6662, 2008.
[13] T. A. Ternes, M. Meisenheimer, D. McDowell et al., “Removalof pharmaceuticals during drinking water treatment,” Envi-ronmental Science and Technology, vol. 36, no. 17, pp. 3855–3863, 2002.
[14] P. E. Stackelberg, E. T. Furlong, M. T. Meyer, S. D. Zaugg, A. K.Henderson, and D. B. Reissman, “Persistence of pharmaceuti-cal compounds and other organic wastewater contaminants ina conventional drinking-water-treatment plant,” Science of theTotal Environment, vol. 329, no. 1–3, pp. 99–113, 2004.
[15] O. A. Jones, J. N. Lester, and N. Voulvoulis, “Pharmaceuticals:a threat to drinking water?” Trends in Biotechnology, vol. 23,no. 4, pp. 163–167, 2005.
[16] O. A. H. Jones, N. Voulvoulis, and J. N. Lester, “Aquatic envi-ronmental assessment of the top 25 English prescriptionpharmaceuticals,” Water Research, vol. 36, no. 20, pp. 5013–5022, 2002.
[17] F. J. Beltran, P. Pocostales, P. Alvarez, and A. Oropesa, “Diclo-fenac removal from water with ozone and activated carbon,”Journal of Hazardous Materials, vol. 163, no. 2-3, pp. 768–776,2009.
[18] M. Ernst and M. Jekel, Advanced Treatment Combination forGroundwater Recharge of Municipal Wastewater by Nanofiltra-tion and Ozonation, Pergamon-Elsevier Science, 1999.
[19] A. Lopez, A. Bozzi, G. Mascolo, and J. Kiwi, “Kinetic investi-gation on UV and UV/H2O2 degradations of pharmaceuticalintermediates in aqueous solution,” Journal of Photochemistryand Photobiology A, vol. 156, no. 1–3, pp. 121–126, 2003.
[20] D. Vogna, R. Marotta, R. Andreozzi, A. Napolitano, and M.D’Ischia, “Kinetic and chemical assessment of the UV/H2O2
treatment of antiepileptic drug carbamazepine,” Chemosphere,vol. 54, no. 4, pp. 497–505, 2004.
[21] M. M. Huber, A. Gobel, A. Joss et al., “Oxidation of pharma-ceuticals during ozonation of municipal wastewater effluents:
a pilot study,” Environmental Science and Technology, vol. 39,no. 11, pp. 4290–4299, 2005.
[22] C. Zwiener and F. H. Frimmel, “Oxidative treatment ofpharmaceuticals in water,” Water Research, vol. 34, no. 6, pp.1881–1885, 2000.
[23] J. L. Packer, J. J. Werner, D. E. Latch, K. McNeill, and W. A.Arnold, “Photochemical fate of pharmaceuticals in the envi-ronment: naproxen, diclofenac, clofibric acid, and ibuprofen,”Aquatic Sciences, vol. 65, no. 4, pp. 342–351, 2003.
[24] L. A. Perez-Estrada, M. I. Maldonado, W. Gernjak et al.,“Decomposition of diclofenac by solar driven photocatalysisat pilot plant scale,” Catalysis Today, vol. 101, no. 3-4, pp. 219–226, 2005.
[25] A. A. Cavalheiro, J. C. Bruno, M. J. Saeki, J. P. S. Valente, andA. O. Florentino, “Photocatalytic decomposition of diclofenacpotassium using silver-modified TiO2 thin films,” Thin SolidFilms, vol. 516, no. 18, pp. 6240–6244, 2008.
[26] L. Rizzo, S. Meric, D. Kassinos, M. Guida, F. Russo, and V.Belgiorno, “Degradation of diclofenac by TiO2 photocatalysis:UV absorbance kinetics and process evaluation through a setof toxicity bioassays,” Water Research, vol. 43, no. 4, pp. 979–988, 2009.
[27] F. Mendez-Arriaga, S. Esplugas, and J. Gimenez, “Photocat-alytic degradation of non-steroidal anti-inflammatory drugswith TiO2 and simulated solar irradiation,” Water Research,vol. 42, no. 3, pp. 585–594, 2008.
[28] J. Hartmann, P. Bartels, U. Mau et al., “Degradation of thedrug diclofenac in water by sonolysis in presence of catalysts,”Chemosphere, vol. 70, no. 3, pp. 453–461, 2008.
[29] V. Naddeo, V. Belgiorno, D. Ricco, and D. Kassinos, “Degra-dation of diclofenac during sonolysis, ozonation and theirsimultaneous application,” Ultrasonics Sonochemistry, vol. 16,no. 6, pp. 790–794, 2009.
[30] V. Naddeo, V. Belgiorno, D. Kassinos, D. Mantzavinos, andS. Meric, “Ultrasonic degradation, mineralization and detox-ification of diclofenac in water: optimization of operatingparameters,” Ultrasonics Sonochemistry, vol. 17, no. 1, pp. 179–185, 2010.
[31] V. Belgiorno, L. Rizzo, D. Fatta et al., “Review on endocrinedisrupting-emerging compounds in urban wastewater: occur-rence and removal by photocatalysis and ultrasonic irradiationfor wastewater reuse,” Desalination, vol. 215, no. 1–3, pp. 166–176, 2007.
[32] A. Antoniadis, I. Poulios, E. Nikolakaki, and D. Mantzavinos,“Sonochemical disinfection of municipal wastewater,” Journalof Hazardous Materials, vol. 146, no. 3, pp. 492–495, 2007.
[33] V. Naddeo, V. Belgiorno, and R. M. A. Napoli, Behaviour ofnatural organic matter during ultrasonic irradiation, ElsevierScience, 2007.
[34] V. Naddeo, S. Meric, D. Kassinos, V. Belgiorno, and M. Guida,“Fate of pharmaceuticals in contaminated urban wastewatereffluent under ultrasonic irradiation,” Water Research, vol. 43,no. 16, pp. 4019–4027, 2009.
[35] V. Naddeo, M. Landi, V. Belgiorno, and R. M. A. Napoli,“Wastewater disinfection by combination of ultrasound andultraviolet irradiation,” Journal of Hazardous Materials, vol.168, no. 2-3, pp. 925–929, 2009.
[36] V. Naddeo, V. Belgiorno, M. Landi, T. Zarra, and R. M. A.Napoli, “Effect of sonolysis on waste activated sludge solubili-sation and anaerobic biodegradability,” Desalination, vol. 249,no. 2, pp. 762–767, 2009.
[37] P. Xu, M. L. Janex, P. Savoye, A. Cockx, and V. Lazarova,“Wastewater disinfection by ozone: main parameters for

International Journal of Photoenergy 7
process design,” Water Research, vol. 36, no. 4, pp. 1043–1055,2002.
[38] R. Chand, D. H. Bremner, K. C. Namkung, P. J. Collier, andP. R. Gogate, “Water disinfection using the novel approach ofozone and a liquid whistle reactor,” Biochemical EngineeringJournal, vol. 35, no. 3, pp. 357–364, 2007.
[39] Y. Zhang, S. U. Geißen, and C. Gal, “Carbamazepine anddiclofenac: removal in wastewater treatment plants and occur-rence in water bodies,” Chemosphere, vol. 73, no. 8, pp. 1151–1161, 2008.
[40] H. Hoigne and H. Bader, “Rate constants of reactions ofozone with organic and inorganic compounds in water. II.Dissociating organic compounds,” Water Research, vol. 17, no.2, pp. 185–194, 1983.
[41] D. Vogna, R. Marotta, A. Napolitano, R. Andreozzi, and M.D’Ischia, “Advanced oxidation of the pharmaceutical drugdiclofenac with UV/H2O2 and ozone,” Water Research, vol. 38,no. 2, pp. 414–422, 2004.

Hindawi Publishing CorporationInternational Journal of PhotoenergyVolume 2012, Article ID 305989, 6 pagesdoi:10.1155/2012/305989
Research Article
Contribution of Dissolved Oxygen to Methylene BlueDecomposition by Hybrid Advanced Oxidation Processes System
Heon Lee,1 Sung Hoon Park,1 Byung Hoon Kim,2 Sun-Jae Kim,3 Sang-Chai Kim,4
Seong-Gyu Seo,5 and Sang-Chul Jung1
1 Department of Environmental Engineering, Suncheon National University, Suncheon, Jeonnam 540-742, Republic of Korea2 Department of Dental Materials, School of Dentistry, Chosun University, Gwangju 501-759, Republic of Korea3 Faculty of Nanotechnology and Advanced Materials Engineering, Sejong University, Seoul 143-747, Republic of Korea4 Department of Environmental Education, Mokpo National University, Muan, Jeonnam 534-729, Republic of Korea5 Department of Civil & Environmental Engineering, Chonnam National University, Yeosu, Jeonnam 550-749, Republic of Korea
Correspondence should be addressed to Sang-Chul Jung, [email protected]
Received 1 March 2012; Revised 3 May 2012; Accepted 17 May 2012
Academic Editor: Manickavachagam Muruganandham
Copyright © 2012 Heon Lee et al. This is an open access article distributed under the Creative Commons Attribution License,which permits unrestricted use, distribution, and reproduction in any medium, provided the original work is properly cited.
Experimental results of photocatalysis under high dissolved oxygen (DO) concentration conditions are reported. Methyleneblue was used as the organic pollutant to be degraded by a novel microwave/UV/DO/TiO2 photocatalyst hybrid system. Thedegradation rate increased with TiO2 nanoparticle dosages and DO concentration. However, inhibition of photocatalysis due tobubbles produced by DO generator was also observed. When the DO generator was used to increase the DO concentration inthe pollutant solution treated by the microwave-assisted UV-TiO2 photocatalysis, the decomposition rate constant was highestamong all the experimental conditions tested in this study. This result demonstrated that high concentration of DO can enhancethe photocatalytic reaction rate by causing a synergistic effect of constituent techniques.
1. Introduction
Conventional wastewater treatment technologies have limi-tations hence demanding advanced research to tackle com-plex wastewater treatment. One of the promising technolo-gies could be the more effective destruction by the use ofadvanced oxidation processes (AOPs) [1]. Application ofphotocatalyst in AOP industry effluents treatment has beeninvestigated widely [2].
TiO2, a representative photocatalyst, has been success-fully applied to the various photocatalytic reactions in agas phase as well as in an aqueous phase [3]. Owingto its relatively high photocatalytic activity, biological andchemical stability, low cost, nontoxic nature, and long-termstability, TiO2 has been widely used as a photocatalyst [4–6].
Application of TiO2 photocatalyst in water treatmenthas recently been investigated widely [7]. There are stillmany problems yet to be solved, however, in application of
TiO2 photocatalyst in the treatment of non-biodegradablematerials. First, photocatalysis has usually been used in airpollutants treatment because it is suitable for treatmentof low-concentration pollutants. Concentrations of waterpollutants, however, are much higher than those of airpollutants. Thus, their treatment by photocatalysis is difficultcompared to that of air pollutants. Second, polluted wateroften contains mixture of hydrophilic and hydrophobicmaterials. Therefore, it is not easy for the pollutants tobe adsorbed on the photocatalyst surface. Third, pollutedwater has high turbidity, hence, low transparency, hinderingactivation of photocatalysts by ultraviolet (UV) rays. Fourth,some materials are not easily degraded by photocatalysisonly. Fifth, the amount of oxygen available for photocatalyticoxidation is very low in water compared to that in air.Due to these reasons, photocatalytic oxidation of waterpollutants has not received large attention thus far. Recently,researches have been conducted actively to improve oxidative

2 International Journal of Photoenergy
degradation performance by adding microwave irradiationas an effort to utilize TiO2 photocatalyst in water treatmentmore efficiently [8, 9].
On decomposition and mineralization, TiO2 photocatal-ysis consumes O2. In an earlier study on photocatalysis, thisO2 consumption was found to be “photo-adsorption” ofO2. The photoadsorption of O2 has been a general term ofthe consumption of O2 by photocatalytic reaction. Actually,photocatalytic reaction should proceed simultaneously byreduction and oxidation. In general photocatalysis, O2 inair is reduced to give O2
−, while organic compounds areoxidized to form organic radicals which consume O2 as wellfor further oxidation [10–12].
In this study, the effect of dissolved oxygen (DO) onphotocatalysis was investigated using a novel microwave/UV/DO/photocatalyst hybrid system. A microwave-assisted elec-trodeless lamp is used as the UV source. The effect ofmicrowave irradiation on photocatalytic reaction efficiency isinvestigated. To improve the pollutant removal rate, furtherO2 gas is added to the reaction and its effects on the reactionefficiency is investigated based on the experimental results.The role of each element technique and interaction amongthem are discussed.
2. Experimental Procedure
Figure 1 shows the schematic of the Microwave/UV-TiO2
experimental apparatus used in this study. Microwave radi-ation was emitted from a microwave system manufacturedby Korea microwave instrument Co. Ltd. It consisted of amicrowave generator (frequency, 2.45 GHz; maximal power,1 kW), a three-stub tuner, a power monitor, and a reactioncavity. Microwave radiation (actual power used, 200 ∼600 W) used to irradiate the organic dye aqueous solutioncontaining TiO2 particles was delivered through a waveguide.Microwave irradiation was continuous and its intensity wasadjusted by connection to a power monitor. Optimal lowreflection of the microwave radiation was achieved using thethree-stub tuner. A stirrer was installed on the back sidein the reaction cavity (Figure 1) to enhance the transfer ofmicrowave. As the microwave-irradiated reactant solution isheated steadily, it was not possible to carry out experimentsat constant temperature without a cooling system. In thisstudy, the reactant solution was stored in a stainless steelbeaker installed in a constant-temperature equipment. Apump in the DO generator was used to circulate the heatedreactant solution through a cooling system to keep thereaction temperature constant at 298 K.
In order to assess the effect of DO on TiO2 photocatalysis,DO concentration in the reaction solution was variedbetween 30 and 70 ppm using a DO generator (OxyLife Co.).O2 microbubbles were generated into the reaction solutioninflow using a helix-type bubble generator installed in theDO generator tank. The DO concentration in the solutionincreased further while the solution passed devices withinner diameters smaller than that of the circulation pipe inthe generator, due to increased flow velocity and frictioncoefficient. DO concentration was adjusted by using different
Table 1: Comparing the UV intensities radiated at different micro-wave intensities.
Microwave intensity (kW)UV intensity (W/m2)
UV-A UV-B UV-C
0.2 0.221 0.364 3.750
0.4 0.577 0.922 5.570
0.6 1.213 1.845 5.930
combinations of the devices through which the solutionpassed.
TiO2 photocatalysts are excited by UV light, produc-ing strong oxidants that can degrade organic compounds.Therefore, provision of UV is essential for a use of TiO2
photocatalysts. Typical UV lamps, however, have metalelectrodes, which prevent them from being used in themicrowave-irradiation equipment. Therefore, a double-tube-type microwave discharge electrodeless lamp (170 mmlength, 44 mm inner diameter, 60 mm outer diameter,hereafter MDEL) which emits UV upon the irradiation ofmicrowave was developed in this study. It was made ofquartz to maximize the reaction efficiency. Small amount ofmercury was doped between the tubes inside the double-tubeUV lamp that was kept vacuumed. The lamp used in thisstudy is UV-C-type lamp although little amount of UV-A andUV-B wavelength lights are emitted as well. Figure 2 showsthe MDEL emitting UV light upon microwave irradiationin the microwave cavity. Another measurement made in thisstudy was the irradiance (W/m2) measured at three differentUV wavelength ranges that are called UV-A, UV-B, and UV-C with the wavelength range of 315∼ 400 nm, 280∼ 315 nm,and 220 ∼ 280 nm, respectively. A UV radiometer (HD2102-2, Delta OHM) was used to measure the irradiance. Table 1summarizes the UV irradiance measured with three differentmicrowave intensities. The UV irradiances at all three wave-length ranges were shown to increase with the microwaveintensity.
The photocatalyst was Degussa P-25 TiO2 (specificsurface area 53 m2 g−1 measured by the BET method, particlesize 20 ∼ 30 nm by TEM, composition 83% anatase and17% rutile by X-ray diffraction). In this study, the photo-catalytic activity of TiO2 particle was investigated with thephotocatalytic decomposition of methylene blue (referredto as MB hereafter) in its aqueous solution. High-purity-grade MB was purchased from Jin Chem. Co. Ltd. Initialconcentration of MB was about 3.0 × 10⁻⁵ mol/liter, and3,000 mL of solution was circulated into the quartz reactortube (230 mm length, 40 mm diameter) with a flow rate of500 cc/min.
The solution contained in a stainless steel beaker locatedin a cooling bath was circulated through the reactor andDO generator for 60 minutes to maintain the initial reactantconcentration at constant. P25 (0.1 ∼ 0.3 g) was injected intothe beaker, and then the solution was circulated for another5 minutes to disperse P25 throughout the entire system.TiO2 photocatalysis was performed by irradiating microwaveand UV using the microwave generator (0.2/0.4/0.6 Kw). The

International Journal of Photoenergy 3
Microwave generator
KWReflection power
monitor
Aqueous reactantMicrowave cavity
Reactor
MWThermostat (cooling circulator)
DO generator
Spectrophotometer
Stirrer
O2
Double-tube electrodelessUV lamp (UV-C)
Three-stub tuner
Power moniter
Isolator(air cooling device)
(2.4 2.5 GHz)
Figure 1: Schematics of the microwave/UV/DO TiO2 photocatalytic degradation system.
(a) (b)
Figure 2: Snapshot of the double-tube-type MDEL (a) and microwave-discharged lamp set in the microwave oven (b).
solution samples taken at predefined time steps were cen-trifuged at 2,000 rpm for 30 minutes. Then, the absorbanceof supernatant was measured using a spectrophotometer(UV-1601, Shimadzu) at 665 nm to obtain the reaction rate.The solution samples used for absorbance measurementswere injected back into the reaction system.
3. Result and Discussion
3.1. Effect of TiO2 Particle Dosages. Figure 3 shows the resultsof decomposition experiments of MB obtained at differentTiO2 particle dosages. The microwave intensity was 0.4 kW,and the DO concentration was 70 ppm. Addition of a largeramount of TiO2 particle resulted in a higher decompositionrate. Certain amount of MB was shown to be decomposed byMDEL and high concentration of DO without the aid of TiO2
photocatalytic reaction. The plots for the four cases were allfitted well by linear line, which indicates that decompositionof MB in the presence of TiO2 catalyst can be approximatedby a pseudo-first-order reaction model:
C
C0= exp(−Kt), (1)
where C is the MB concentration at time t, C0 the initialconcentration, and K the overall rate constant. The overallrate constant K is determined as the slope of the line inFigure 3 by regression analysis. It is clearly shown in thisfigure that the degradation rate increases with the amountof TiO2 particle dosages.
3.2. Relationship between the Degradation Rate and DO Levels.The rates of MB degradation by TiO2 photocatalytic reaction

4 International Journal of Photoenergy
Reaction time (min)
0 10 20 30− 5
− 4
− 3
− 2
− 1
0
1
0 g0.1 g
0.2 g0.3 g
lnC/C
0
Figure 3: Effect of TiO2 particle dosages for decomposition ofmethylene blue in aqueous solutions.
measured at different DO concentration levels (5 ∼ 70 ppm)are shown in Figure 4. The average DO concentration of theas-prepared MB solution without using DO generator wasabout 5 ppm. All experiments were carried out under themicrowave intensity of 0.4 kW and the TiO2 particle dosageof 0.2 g. When the DO generator was used to adjust the DOconcentration between 30 and 70 ppm, the degradation ratewas shown to increase with DO concentration. However,the degradation rates measured at 30 ppm and 50 ppmwere lower than that measured without using the DOgenerator (at 5 ppm). This result may be attributed tothe inhibition effect of the bubbles. In this study, high-pressure oxygen gas was injected into the DO generatorin which the oxygen bubbles were produced by the helix-type bubble generator. In general, photocatalysis is a surfacereaction. Bubbles produced by the DO generator may beattached on the photocatalyst surface inhibiting the surfacereaction. Nevertheless, when DO concentration was highenough (70 ppm), the degradation rate was higher thanthat measured without using the DO generator. Moreover,a higher DO concentration resulted in a higher degradationrate among the experiments in which a DO generator wasused. This result indicates that dissolved oxygen promotesthe photocatalytic decomposition of MB.
The effect of dissolved oxygen can be explained asfollows. UV irradiated on TiO2 photocatalysts causes exci-tation, leading to movement of electrons in the valanceband towards the conduction band. If the reaction doesnot follow immediately, recombination occurs. By playinga role as electron capturers, oxygen molecules can slowdown the recombination rate and help produce peroxide andhydroperoxy radicals and therefore enhance the degradationreaction rate [13].
The results of this study showed that the use of aDO generator may result in inhibition of photocatalysisdue to attachment of bubbles on the catalyst surface.
Reaction time (min)
0 10 20 30− 4
− 3
− 2
− 1
0
1
5 ppm30 ppm
50 ppm
70 ppm
lnC/C
0
Figure 4: Degradation rate of methylene blue measured at variousdissolved oxygen levels.
Therefore, when a DO generator is applied for enhancingthe photocatalysis rate, high concentration of DO, enough tocompensate the side effect of bubble attachment, is required.
3.3. Microwave Effects in Photocatalytic Oxidation Reactions.MB decomposition experiments were carried out at differentmicrowave intensity levels to evaluate the effect of microwaveintensity on photocatalysis. The results are shown in Figure 5as a function of microwave intensity. The experimentswere carried out with the 0.2 g TiO2 particle at 70 ppmDO concentration. Three different microwave powers wereused: 0.2, 0.4, and 0.6 kW. It is clearly shown in thisfigure that the degradation rate increases with microwaveintensity. Microwave causes polar reactant molecules tovibrate million times a second. Microwave has thermaland nonthermal effects. The thermal effect denotes theincrease in the chemical reaction rate due to selective,fast, uniform increase of temperature by microwave radi-ation. The nonthermal effect represents the promotion ofthe chemical reaction resulting from increased molecularmovement and collision frequency. In this study, temper-ature was controlled at constant to exclude the thermaleffect. Therefore, the increase in the degradation rateby the microwave irradiation is believed to result fromthe resulting UV radiation and the non-thermal effect ofmicrowave.
In this study, a short wavelength electromagnetic waveUV is emitted by MDEL upon the irradiation of microwave.Therefore, the intensity of UV increases with the microwavepower. UV, which carries intense energy, is used for excitingphotocatalyst. It can also contribute to degrading MBdirectly. It was not possible to figure out the detailedmechanism how microwave took part in the degradation ofMB. Nevertheless, it can be inferred from the experimentalresult, which showed higher degradation efficiency at higher

International Journal of Photoenergy 5
0 10 20 30
Reaction time (min)
− 4
− 3
− 2
− 1
0
1
0.2 kW0.4 kW0.6 kW
lnC/C
0
Figure 5: Effect of microwave intensity for decomposition ofmethylene blue in aqueous solution.
microwave intensity, that microwave contributed to degrada-tion of MB indirectly by increasing UV intensity. The thermaland non-thermal effects of microwave are also presumed tohave contributed directly to the degradation reaction.
3.4. Comparison of the Effects of the Constituent Tech-niques. This study was aimed at enhancing the photocat-alytic degradation rate of MB by adding microwave andhigh-concentration DO. To evaluate the effect of eachconstituent technique, different sets of combinations ofmicrowave, DO, UV, and photocatalyst were used fordegradation of organic dye. Figure 6 shows the degra-dation rate constants obtained at different conditions ofthe microwave/UV/DO/photocatalyst hybrid process sys-tem. The amount of reaction solution of 3,000 mL, DOconcentration of 70 ppm, and the microwave intensity of0.4 kW were used for all experiments. The results of sixdifferent experiments are compared in Figure 6: microwaveirradiation only (M), DO generator only (D), microwaveirradiation on top of the use of MDEL (MU), additionof DO generator to MU (MUD), microwave-assisted UV-TiO2 photocatalysis by MDEL (MUP), and addition of DOgenerator to MUP (MUPD).
When only microwave was applied (M), MB was seldomdegraded because the thermal effect was excluded in thisstudy by maintaining the temperature of the solution at298 K. On the other hand, when only DO generator was used(D) to adjust the DO concentration at 70 ppm, certain levelof degradation reaction was detected. When microwave andMDEL were used together (MU), the degradation rate wassignificantly higher. As the DO generator was added to MU(MUD) to increase the DO concentration, the degradationrate was reduced. This result can be attributed to theinhibition effect of the bubbles produced by DO generatoras was explained above. For the microwave-assisted UV-TiO2 photocatalysis (MUP), the decomposition rate constant
Experimental conditions
MU MUPMUD MUPDM D0
0.02
0.04
0.06
0.08
0.1
0.12
K(m
in−
1)
Figure 6: Rate constants obtained under different experimentalconditions.
was very high. When the DO generator was added to MUP(MUPD), the rate constant was even higher. This resultdemonstrates that high concentration of DO can enhance thephotocatalytic reaction rate by causing a synergistic effect ofconstituent techniques.
The results of this study show that combining elementaltechniques, which are not very efficient when they areused exclusively, induce a synergistic effect. The objectiveof this study was to promote the photocatalytic reactionby adding microwave irradiation, which was expected toactivate pollutant and photocatalyst, and high-concentrationDO, as an auxiliary oxidant, to the conventional photo-catalysis system. According to the experimental results ofthis study, the influence of microwave on organic dye andphotocatalyst was minimal, whereas high-concentration DOwas shown to contribute to production of activation speciesthat participate in the degradation reaction. Inhibition ofphotocatalysis due to bubbles produced by DO generator wasalso observed, indicating that care should be taken to find anoptimal hybrid process for practical use.
The above-mentioned explanations, however, cannot beproven with the limited experimental data obtained inthis study. More precise and quantitative analyses on theelemental techniques tested in this study are required in thefuture for more reliable evaluation and application of them.
4. Conclusions
The following conclusions were inferred from the resultsof advanced oxidation of MB by novel microwave/UV/DO/TiO2 photocatalysts hybrid process system.
(1) The degradation rate increased with TiO2 particledosages, microwave intensity and DO concentration.
(2) When a DO generator was used to adjust the DO con-centration between 30 and 70 ppm, the degradation

6 International Journal of Photoenergy
rate was shown to increase with DO concentration.However, the degradation rates measured at 30 ppmand 50 ppm were lower than that measured withoutusing the DO generator (at 5 ppm).
(3) The result demonstrates that high concentration ofDO can enhance the photocatalytic reaction rate bycausing a synergistic effect of constituent techniques.
(4) The results of this study showed that the use of a DOgenerator may result in inhibition of photocatalysisdue to attachment of bubbles on the catalyst surface.Therefore, when a DO generator is applied for en-hancing the photocatalysis rate, high concentrationof DO, enough to compensate the side effect ofbubble attachment, is required.
Acknowledgment
This research was supported by the Basic Science ResearchProgram through the National Research Foundation of Korea(NRF) funded by the Ministry of Education, Science andTechnology (2010-0007412 and 2011-0016699).
References
[1] W. F. Jardim, S. G. Moraes, and M. M. K. Takiyama, “Photocat-alytic degradation of aromatic chlorinated compounds usingTiO2: toxicity of intermediates,” Water Research, vol. 31, no. 7,pp. 1728–1732, 1997.
[2] P. Saritha, C. Aparna, V. Himabindu, and Y. Anjaneyulu,“Comparison of various advanced oxidation processes for thedegradation of 4-chloro-2 nitrophenol,” Journal of HazardousMaterials, vol. 149, no. 3, pp. 609–614, 2007.
[3] R. W. Matthews, “Photo-oxidation of organic material inaqueous suspensions of titanium dioxide,” Water Research, vol.20, no. 5, pp. 569–578, 1986.
[4] A. Dixit, A. J. Tirpude, A. K. Mungray, and M. Chakraborty,“Degradation of 2, 4 DCP by sequential biological-advancedoxidation process using UASB and UV/TiO2/H2O2,” Desalina-tion, vol. 272, no. 1–3, pp. 265–269, 2011.
[5] S. C. Jung, S. J. Kim, N. Imaishi, and Y. I. Cho, “Effect of TiO2
thin film thickness and specific surface area by low-pressuremetal-organic chemical vapor deposition on photocatalyticactivities,” Applied Catalysis B, vol. 55, no. 4, pp. 253–257,2005.
[6] S. C. Jung, “Photocatalytic activities and specific surface areaof TiO2 films prepared by CVD and sol-gel method,” KoreanJournal of Chemical Engineering, vol. 25, no. 2, pp. 364–367,2008.
[7] M. Harir, A. Gaspar, B. Kanawati et al., “Photocatalytic reac-tions of imazamox at TiO2, H2O2 and TiO2/H2O2 in waterinterfaces: kinetic and photoproducts study,” Applied CatalysisB, vol. 84, no. 3-4, pp. 524–532, 2008.
[8] G. Zhanqi, Y. Shaogui, T. Na, and S. Cheng, “Microwaveassisted rapid and complete degradation of atrazine usingTiO2 nanotube photocatalyst suspensions,” Journal of Haz-ardous Materials, vol. 145, no. 3, pp. 424–430, 2007.
[9] S. C. Jung, “The microwave-assisted photo-catalytic degrada-tion of organic dyes,” Water Science and Technology, vol. 63,no. 7, pp. 1491–1498, 2011.
[10] T. Hirakawa, C. Koga, N. Negishi, K. Takeuchi, and S. Mat-suzawa, “An approach to elucidating photocatalytic reactionmechanisms by monitoring dissolved oxygen: effect of H2O2
on photocatalysis,” Applied Catalysis B, vol. 87, no. 1-2, pp. 46–55, 2009.
[11] H. C. Liang, X. Z. Li, Y. H. Yang, and K. H. Sze, “Effects ofdissolved oxygen, pH, and anions on the 2,3-dichlorophenoldegradation by photocatalytic reaction with anodic TiO2 nan-otube films,” Chemosphere, vol. 73, no. 5, pp. 805–812, 2008.
[12] C. C. Lo, C. W. Huang, C. H. Liao, and J. C. S. Wu, “Noveltwin reactor for separate evolution of hydrogen and oxygenin photocatalytic water splitting,” International Journal ofHydrogen Energy, vol. 35, no. 4, pp. 1523–1529, 2010.
[13] M. R. Hoffmann, S. T. Martin, W. Choi, and D. W. Bahne-mann, “Environmental applications of semiconductor photo-catalysis,” Chemical Reviews, vol. 95, no. 1, pp. 69–96, 1995.

Hindawi Publishing CorporationInternational Journal of PhotoenergyVolume 2012, Article ID 398787, 7 pagesdoi:10.1155/2012/398787
Research Article
Rapid Photocatalytic Degradation of Methylene Blueunder High Photon Flux UV Irradiation: Characteristicsand Comparison with Routine Low Photon Flux
Qian Zhang, Chaolin Li, and Ting Li
Environmental Science & Engineering Research Center, Shenzhen Graduate School, Harbin Institute of Technology,Shenzhen 518055, China
Correspondence should be addressed to Chaolin Li, [email protected]
Received 9 January 2012; Accepted 29 February 2012
Academic Editor: Manickavachagam Muruganandham
Copyright © 2012 Qian Zhang et al. This is an open access article distributed under the Creative Commons Attribution License,which permits unrestricted use, distribution, and reproduction in any medium, provided the original work is properly cited.
This study examined the photocatalytic degradation efficiency under high UV photon flux (intensity normalized by photonenergy) irradiation; the incident UV photon flux was 1.71 × 10⁻⁶–3.13 × 10⁻⁶ einstein cm−2 s−1 made by a super high-intensityUV apparatus. A comparative study between high photon flux photocatalytic process and routine low photon flux photocatalyticprocess for methylene blue degradation has been made in aqueous solution. The experimental results showed that under the bestconditions of high UV photocatalytic reaction 99% decolorization and 95% TOC removal of 20 mg L−1 methylene blue couldbe achieved in 30 s and 120 s of UV irradiation time, respectively. To the best of our knowledge, photocatalytic decolorizationand photocatalytic degradation of dyes in such a short time has not been reported. Aiming at the low photonic efficiency in highphoton flux photocatalytic process, we found that reducing the density of excited electron-hole appropriately could improve initialapparent photonic efficiency effectively. The TOC experiments under high UV photon flux showed a faster mineralization rate anda different mineralization process compared to that under low UV photon flux.
1. Introduction
Heterogeneous photocatalytic oxidation has potential appli-cations for the treatment of waste water with dilute concen-tration of organic compounds because it effectively oxidizesa large number of chemical pollutants [1]. Among the mostpopular semiconductors studied, TiO2 is one of the bestcandidates [2]. However, the commercial application of thismethod for the treatment of aqueous solutions is limitedby both the long time of the process and the low efficiencyin the use of the radiation [3]. If TiO2 photocatalysis is tohave a commercial future as a method for water purification,reaction time must compare favorably with those of itscompetitors (UV/H2O2, UV/O3, photo Fenton, etc.). On thisbasis, many studies have been conducted to improve thephotocatalytic reaction rate such as the doping of some ele-ments or compounds into TiO2 [4], increasing the externalsurface area [5], improving photocatalytic reactor design [6],and so forth. Light photon flux (intensity normalized by
photon energy) is one of the most parameters in photocat-alytic reaction, and high UV intensity could compensate forthe low photocatalytic efficiency of TiO2 itself [7]. Ollis et al.[8] observed that the relationship between UV intensity anddegradation rate changed from first order (K ∝ I) to halforder (K ∝ I0.5) when the UV intensity increased beyonda certain value (approximately 25 mW cm−2), and thenchanged from half order (K ∝ I0.5) to zero order (K ∝ I0)when the UV intensity reached a high level. Many similarstudies have confirmed this finding [9–11]. Because theefficiency of photocatalytic reaction declines under extremelyhigh UV intensity, the application of improving photocat-alytic reaction rate by increasing UV intensity is not fullydeveloped. However, the high photon flux UV irradiationcan effectively lessen the photocatalytic reaction time [12];therefore, it is important to improve the understanding ofthe high UV intensity photocatalytic reaction and to increaseUV light efficiency of the reaction.

2 International Journal of Photoenergy
The aim of this paper was to determine the effectivenessof photocatalytic processes based on high photon fluxirradiation ranging from 1.71 × 10⁻⁶ to 3.13 × 10⁻⁶ einsteincm−2 s−1 (approximately UV intensity from 550 to 1000mW cm−2) in the photocatalytic degradation of a typicalbasic dye, methylene blue (MB), from aqueous solution. Theoperating conditions were adjusted to permit a comparisonbetween high UV photon flux photocatalytic process (HUP)and routine low UV photon flux photocatalytic process(LUP) (photon flux ranging 0.667 × 10⁻⁹ to 3.07 × 10⁻⁹
einstein cm−2 s−1 approximately equal to UV intensity from0.4 to 2 mW cm−2). Three different criteria were used tocontrast both processes: (i) reaction rate and reaction time,(ii) the initial apparent photonic efficiency, and (iii) miner-alization rate and mineralization degree.
2. Material and Methods
2.1. Materials and Reagents. The photocatalyst was titaniaDegussa P-25 (anatase/rutile = 7/3, surface area = 50 m2 g−1,nonporous particles, mean size = 30 nm). MB was obtainedfrom Hongyan chemical Co., Ltd., (≥99%). Potassiumferrioxalate was obtained from Hefei Asialon chemical Co.,Ltd., (≥99%). Solutions were prepared using water from aMillipore Waters Milli-Q purification unit.
2.2. Light Source and Photoreactor. Two kinds of UV lampwere used: (a) a 250 W UV high pressure mercury lamp(Ushio Inc, Japan) with a quartz reflector were used as a highphoton flux light source. The incident photon flux enteringthe photoreactor was varied from 1.71 × 10⁻⁶ to 3.13 ×10⁻⁶ einstein cm−2 s−1. (b) An 8 W black light lamp (PhilipsTL 6W/08) was used as a low photon flux light source. Theincident photon flux entering the photoreactor was varyingfrom 0.667 × 10⁻⁹ to 3.07 × 10⁻⁹ einstein cm−2 s−1. Thespectral distributions of both lamps are shown in Figure 1.
The schematic diagram of the photoreactor apparatus isshown in Figure 2. All the irradiation experiments were con-ducted in a glass cylinder of 35.6 mm diameter and 45 mmheight. The top of the glass cylinder was open to the atmo-sphere. The lamp was placed at the focal axis of the quartzreflector and an optical filter was inserted to cut off the longwavelength components (λ > 425 nm) for avoiding heatingthe aqueous solution (no quartz reflector and optical filterfor the black light lamp). A sliding shutter with electronictime switch was used to determine exactly the moment atwhich the photocatalytic reaction started or ended. Betweenthe lamp and the reactor, there are neutral density filtersof different transmissions to change the photon flux of theincident irradiation on the reactor. Different photon fluxeswere measured inside the reactor cylinder using potassiumferrioxalate method [13]. A magnetic stirrer located atthe bottom of the glass cylinder kept the TiO2 particlessuspended during the irradiation. The photoreactor, thereflector, and the lamp were enclosed in a box to ensure safeoperation and to prevent the entrance of extraneous light.
2.3. Experiments Procedure. All experiments were in thefollowing range of the experimental variables: the incident
photon flux of the high photon flux light source was between1.71 × 10−6 and 3.13 × 10⁻⁶ einstein cm−2 s−1; the incidentphoton flux of the low photon flux light source was between0.667 × 10−9 and 3.07 × 10⁻⁹ einstein cm−2 s−1; tempera-ture 25◦C (room temperature); MB initial concentration20 mg L−1; TiO2 concentration between 0.25 g L−1 and1.5 g L−1.
Each run adhered to the following protocol: (i) the lampwas turned on, allowing for 40 min to stabilizing their opera-tion, and a suspension of TiO2 and MB was mixed well inthe dark at least 60 min for reaching an equilibrated adsorp-tion as steady-state concentrations. (ii) 10 mL of MB solutionwas injected in the photoreactor. (iii) The solution was thenirradiated by UV light and sample was collected at specifictime to measure the MB concentration. (iv) Simple suspen-sions were filtered by a 0.45 μm membrane filter to removethe TiO2 powder. Samples at different reaction time wereobtained by repeating steps (ii), (iii), and (iv). The decol-orization efficiency was tested in terms of the changes of theUV-vis absorbance of MB. The absorbance intensity of MBwas determined by an UV-vis spectrophotometer (UV-2450SHIMADZU) with a 1 cm path length spectrometric quartzcell. Total organic carbon (TOC) was analyzed with a totalorganic carbon analyzer (Analytik Jena multi-N/C 3100).
3. Results and Discussion
3.1. Preliminary Tests. Preliminary tests using different ex-perimental conditions were carried out to make sure thatthe dye degradation was mainly due to the photocatalyticreaction. The results are as follows. The MB concentrationdecreased about 4% in the darkness in the presence ofTiO2. This suggests a weak adsorption of the dye moleculeson TiO2. In the absence of TiO2, the MB concentrationdecreased about 1% under low photon flux irradiation (3.07× 10⁻⁹ einstein cm−2 s−1) after 1 h and the MB concentrationalmost remained unchanged at high photon flux irradiation(3.13 × 10⁻⁶ einstein cm−2 s−1) after 60 s. This indicatesthat the dye degradation by the direct photolysis only isunimportant. Therefore, the reduction of dye concentrationis primarily caused by the photocatalytic reaction.
3.2. UV Irradiation Intensity and Irradiation Time. In orderto compare different UV irradiation intensities and irradia-tion times on the rate of photocatalytic decolourization, a setof tests was carried out in both HUP and LUP, and the resultsare shown in Figures 3(a) and 3(b). In all cases, MB wasremoved rapidly from the beginning and as time elapsed thedecolorization rate decreased. The decolorization percentageof MB was >90% in reaction time 15 s and >99% in 30 s inHUP with a UV photon flux 3.13 × 10⁻⁶ einstein cm−2 s−1
(Figure 3(a)), whereas the decolorization percentage of MBwas >90% in 40 min and >96% in 60 min in LUP with a UVphoton flux 3.07 × 10⁻⁹ einstein cm−2 s−1 (Figure 3(b)). It isclear that increasing the UV photon flux enhances the rate ofdecolorization remarkably.
Figures 3(a) and 3(b) also show that the plots of ln(C/C0)versus irradiation time for HUP and LUP were linear, whichsuggest that both the photocatalytic processes approximately

International Journal of Photoenergy 3
200 300 400 500 600 700 800 900 1000 1100
0
20
40
60
80
100R
elat
ive
inte
nsi
ty (
%)
Wavelength (nm)
(a)
300 320 340 360 380 400 420
0
20
40
60
80
100
Rel
ativ
e in
ten
sity
(%
)
Wavelength (nm)
(b)
Figure 1: UV spectra of 250 W UV high pressure mercury lamp (a) and 8 W black light lamp (b).
High-pressuremercury lamp
Quartz reflector
Optical filter
Glass cylinder
Stirrer
Sliding shutter withelectronic time switch
Magnetic stirrer
Neutral density filters of different transmissions
Black light lamp
Figure 2: Schematic diagram of the photoreactor apparatus.
follow pseudo-first-order kinetics. Rate constants were esti-mated from the slopes of ln(C/C0) versus time. The pseudo-first-order constants for HUP with photon fluxes 1.71 ×10⁻⁶, 1.99× 10⁻⁶, 2.28× 10⁻⁶, 2.56× 10⁻⁶, 2.85× 10⁻⁶, and3.13 × 10−6 einstein cm−2 s−1 were 0.1103, 0.1182, 0.1245,0.1334, 0.1421, and 0.1513 s−1, and for LUP with photonfluxes 0.667 × 10⁻⁹, 1.03 × 10⁻⁹, 1.33 × 10⁻⁹, 1.71 × 10−9,2.28 × 10−9, 3.07 × 10⁻⁹ einstein cm−2 s−1 were 2.5 × 10−4,3.8× 10−4, 5.1× 10⁻⁴, 6.6× 10⁻⁴, 8.5× 10⁻⁴, 1.1× 10⁻³ s−1,respectively. We suggest that the significant improvementin MB decolorization is mainly due to the more hydroxylradicals that are produced by more radiations falling on thecatalyst surface [14].
There were two different reaction rate regimes as afunction of UV photon flux by different UV lamps. It is
found that the reaction rate depends on photon flux of UVlight I in a power law [8] such as
r = r′′Iα, (1)
where r′ is the reaction constant independent of photonflux. The exponent value (α) could be estimated from thereaction rates and photon fluxes. The value (α) is 0.512for HUP and 0.9813 for LUP. Both of the values (α) showgood fits with the data and the correlation coefficients areR2 = 0.9906 R2 = 0.9977, respectively. These results indicatethat in our experiment the photocatalytic decolorizationrate increases with the square root of photon flux underhigh photon flux in the range from 1.71 × 10⁻⁶ to 3.13× 10⁻⁶ einstein cm−2 s−1and the photocatalytic degradationrate increase linearly with photon flux under low photon

4 International Journal of Photoenergy
−5 105
5
0
0
15 20 25 30 35 40 45 50 55 60
0
20
40
60
80
100
10 15 20 25 30 35 400
1
2
3
4
5
3.13× 10⁻⁶ einstein/s cm 2
2.85× 10⁻⁶ einstein/s cm2
2.56× 10⁻⁶ einstein/s cm2
2.28× 10⁻⁶ einstein/s cm2
1.99× 10⁻⁶ einstein/s cm2
1.71× 10⁻⁶ einstein/s cm2
Irradiation time (s)
MB
dec
olor
izat
ion
(%
)
Irradiation time (s)
ln (
C0/C
)
(a)
0 1000 2000 3000 4000 5000 6000
0
20
40
60
80
100
0 1000 2000 3000 4000
0.50
1.51
22.5
33.5
MB
dec
olor
izat
ion
(%
)
Irradiation time (s)
Irradiation time (s)
ln (
C0/C
)
3.07× 10⁻⁹ −1
−1
−1
einstein/s cm2
2.28× 10⁻⁹ einstein/s cm2
1.71× 10⁻⁹ einstein/s cm2 −1einstein/s cm2
−1einstein/s cm2
−1einstein/s cm21.33× 10−9
1.03× 10⁻⁹
0.667× 10⁻⁹
(b)
Figure 3: Photocatalytic decolorization of MB versus irradiation time by (a) HUP and (b) LUP. (Experimental conditions: TiO2, 1 g L−1;MB initial concentration 20 mg L−1).
flux in the range from 0.667 × 10⁻⁹ to 3.07 × 10⁻⁹ einsteincm−2 s−1. The tendency of the effect by photon flux isin agreement with some studies, and in these reports theauthors attributed this to electron-hole recombination [9–11]. The rate of electron-hole formation exceeds the ratephotocatalytic oxidation under high photon flux, resultingin electron-hole recombination [9–11, 14].
3.3. Initial Apparent Photonic E ciency. The photonic effi-ciency (ξ) describing the effectiveness of light conversion toproduct in heterogeneous, light scattering systems, is directlyproportional to the quantum yield and may be considered tobe the lower limit of this more commonly used measure oflight [15].
In our case, the initial apparent photonic efficiency wascalculated from the ratio of the initial reaction rate ofphotooxidation (mol L−1 s−1) to the rate of incident photonsreaching the reactor as obtained by chemical actinometry(einstein L−1 s−1) [16].
Table 1 summarizes initial apparent photonic efficienciesof photocatalytic decolorization of MB for HUP and LUP.The initial apparent photonic efficiencies at high photonfluxes were lower than the case of low photon fluxes, whichillustrated that high photon fluxes photocatalytic processeshad lower light energy utilization efficiency. This resultsatisfies the law that the initial apparent photonic efficiencydecreases as the light intensity increases, and this is inagreement with other authors [17, 18].
The explanation of the lower initial apparent photonicefficiencies is that high photon flux causes lower effect onreaction rate (from first order (r ∝ I) to half order (r ∝ I0.5)in Section 3.2), and therefore decreases the initial apparent
Table 1: Relative photonic efficiencies of photocatalytic degrada-tion of MB under different photon fluxes.
High photon fluxphotocatalytic process
Low photon flux photocatalyticprocess
Photon flux(10−6 einsteincm−2 s−1)
Relative photonicefficiencies (%)
Photon flux(10−9 einstein
cm−2 s−1)
Relativephotonic
efficiencies (%)
3.13 0.302 3.07 2.23
2.85 0.311 2.28 2.33
2.56 0.325 1.71 2.41
2.28 0.341 1.33 2.40
1.99 0.371 1.03 2.37
1.71 0.403 0.667 2.43
photonic efficiency. At low light intensity reactions involvingelectron-hole separation were predominant and electron-hole recombination was negligible, whereas at increasedlight intensity electron-hole pair separation competed withrecombination, thereby causing lower influence on initialapparent photonic efficiency [9–11, 14]. Based on thistheory, we infer that the decreasing of the TiO2 concentra-tion properly may decrease the density of excited electron-hole pairs, and thereby ease the electron-hole recombinationin high photon flux photocatalytic reaction. As a testof the hypothesis, we examined the relationship betweenthe TiO2 concentration and the initial apparent photonicefficiency under both low and high photon flux. And we keptconstant the product of TiO2 concentration and the opticalpath length in different volume sample in order to modify

International Journal of Photoenergy 5
the TiO2 concentration without changing the total amountof TiO2.
Series of experiments were designed as follows: (i) sampleoptical path length 0.67 cm, sample volume 6.7 mL, TiO2
concentration 1.5 g L−1, MB concentration 20 mg L−1; (ii)sample optical path length 1 cm, sample volume 10 mL, TiO2
concentration 1 g L−1, MB concentration 20 mg L−1; (iii)sample optical path length 2 cm, sample volume 20 mL, TiO2
concentration 0.5 g L−1, MB concentration 20 mg L−1; (iv)sample optical path length 3 cm, sample volume 30 mL, TiO2
concentration 0.33 g L−1, MB concentration 20 mg L−1; (v)sample optical path length 4 cm, sample volume 40 mL, TiO2
concentration 0.25 g L−1, MB concentration 20 mg L−1; (vi)sample optical path length 5 cm, sample volume 50 mL, TiO2
concentration 0.20 g L−1, MB concentration 20 mg L−1; (vii)sample optical path length 6 cm, sample volume 60 mL, TiO2
concentration 0.17 g L−1, MB concentration 20 mg L−1; (viii)sample optical path length 7 cm, sample volume 70 mL, TiO2
concentration 0.14 g L−1, MB concentration 20 mg L−1. Asoptical path length changed, adjusted the height of photore-actor to keep a constant distance between light source and thesolution surface, which maintained a constant photon flux ineach experiment. Experiments were carried out under bothhigh and low photon flux. The initial apparent photonic effi-ciencies under these conditions are summarized in Table 2.It could be clearly observed that under low photon flux theinitial apparent photonic efficiency steadily decreased withoptical path length. On the contrary, under high photon flux,initial apparent photonic efficiency firstly increased with theincrease of optical path length from 0.67 to 3 cm. When theoptical path length increased further than 3 cm, the initialapparent photonic efficiency decreased. The results in lowphoton flux experiments are mainly due to the fact that longpath lengths will promote absorbance of light by MB andother solution chemicals, as the Lambert-Beer law states.And this is in agreement with other reports [19]. In highphoton flux experiments, as the optical path length increasedfrom 0.67 to 3 cm, the absorption of UV by MB and othersolution chemicals also increased with the optical lengthpath. However, instead of decreasing, the initial apparentphotonic efficiency increased. We deduce that the increaseof initial apparent photonic efficiency is probably due tothe decrease of electron-hole recombination. It means thatunder high photon flux decreasing TiO2 concentration coulddecrease the density of excited electron-hole pairs and reducethe electron-hole recombination. As optical path lengthabove 3 cm, the decline in initial apparent photonic efficiencywas due to the increased incident photons beings absorbedby a longer path length of the suspension in excess ofthe decrease of electron-hole recombination. The results inthis study clearly prove our hypothesis and indicate thatthe reduction in the density of excited electron-hole couldactually improve the photonic efficiency in high photon fluxphotocatalytic reaction.
3.4. Mineralization. It is well known that complete decol-orization of MB does not mean that the dye is completelymineralized into CO2 and H2O. Hence, it is necessary tosimultaneously investigate the mineralized process. TOC
Table 2: Relative photonic efficiencies of photocatalytic degrada-tion of MB with different optical path length and TiO2 concentra-tion.
Optical path length(cm)
Initial apparent photonic efficiency (%)
Photon flux3.13 × 10−6 einstein
cm−2 s−1
Photon flux3.07 × 10−9
einstein cm−2 s−1
(i) 0.67 0.235 2.25
(ii) 1 0.302 2.23
(iii) 2 0.329 2.01
(iv) 3 0.335 1.82
(v) 4 0.319 1.52
(vi) 5 0.298 1.36
(vii) 6 0.264 1.18
(viii) 7 0.242 1.09
values have been related to the total concentration of organicin the solution and the decrease of TOC reflects the degreeof mineralization at the end of the photocatalytic process.Mineralization of MB was studied by monitoring TOC lossin the dye solution.
The TOC removal and decolorization efficiencies withirradiation time are shown in Figure 5 the TOC removal anddecolorization efficiencies with irradiation time in LUP. Atthe beginning of the reaction, an initial period of constantor slowly decreasing TOC values occurred. The inflect pointcorresponded to a reaction time of 60 min, which wasequal to the decolorization time of MB. After the completedecolorization of the solution, the TOC values decreased, andthen reached a plateau at the reaction time of 300 min. Theresults demonstrate that in LUP mineralization step startsonly when decolorization is almost complete. The initialperiod of constant or slowly decreasing TOC values couldcorrespond to the fact that MB molecules are decomposed tolower-molecular-weight compounds and the intermediatesstill contribute to the TOC of solution. The emergence ofmineralization plateau indicates that the total oxidation isnearing completion, corresponding to the oxidation of moststable products. The tendency of the mineralization processis similar to the previous results [20].
However, the photocatalytic mineralization of MB solu-tion in HUP had a different mineralization procedure thanthe LUP. As shown in Figure 4(a), the TOC values decreasedapproximately exponentially with reaction time from thebeginning of the reaction. The continuous decay of TOCvalue confirmed the progressive mineralization of MB underhigh photon flux. This pattern meant that during the decol-orization step (irradiation time 0–30 s) there was obviousdecrease of the TOC value, which was due to the fact that MBmolecules were decomposed to intermediate product andfurther oxidized to the intermediate product simultaneously.
UV photon flux determines the amount of photonsinjected into the solution. Under high photon flux irradia-tion, the photocatalyst could absorb more photons, leadingto more electron-hole pairs on the photocatalyst surface. We
6 International Journal of Photoenergy
0
2
4
6
8
0
20
40
60
80
100
TO
C (
mg
L−1
)
TOC
MB
dec
olor
izat
ion
(%
)
MB decolorization
0 20 40 60 80 100 120
Irradiation time (s)
(a)
0 5000 10000 15000 20000 25000
2
4
6
8
0
20
40
60
80
100
TO
C (
mg
L−1
)
TOC
MB
dec
olor
izat
ion
(%
)
MB decolorization
Irradiation time (s)
(b)
Figure 4: The TOC removal and decolorization efficiencies versus irradiation time by (a) HUP and (b) LUP. (Experimental conditions:photon flux (a) 3.13 × 10⁻⁶ einstein cm−2 s−1 (b) 3.07 × 10⁻⁹ einstein cm−2 s−1; TiO2, 1 g L−1; MB initial concentration 20 mg L−1).
0 100 200 300 400 500
0
2
4
6
8
0
20
40
60
80
100
TO
C (
mg
L−1
)
TOC
MB
dec
olor
izat
ion
(%
)
MB decolorization
Irradiation time (s)
Figure 5: The TOC removal and decolorization efficiencies versusirradiation time. (Experimental conditions: photon flux 3.13 ×10⁻⁶ einstein cm−2 s−1; TiO2, 0.01 g L−1; MB initial concentration20 mg L−1).
infer that in HUP while MB molecules are being decom-posed to lower-molecular-weight compounds, there are stillenough electron-hole pairs and •OH radicals to mineralizethe intermediates of MB, which provides a higher efficiencyin photocatalytic mineralization. In addition, the mineral-ization plateau observed (about 0.6 mg L−1) near 100 s wasmuch lower than that in LUP (about 3 mg L−1), and the com-parison of the two constant level of TOC values suggestedthat the stable products could be oxidized more easily inHUP than in LUP. It indicates that large numbers of electron-hole pairs and •OH radicals can also increase the rate of
oxidation of stable products, dramatically enhancing thedegree of mineralization in the photocatalytic reaction.
To further investigate the effect of the amount of excitedelectron-hole pairs on the photocatalytic mineralization pro-cedure, we reduced excited electron-hole pairs by reducingthe TiO2 concentration by two orders of magnitude to0.01 g L−1 and maintaining the photon flux constant. TheTOC removal and decolorization efficiencies with irradiationtime are shown in Figure 5. During the decolorization time(0–120 s), there was only a small decrease of TOC. After thedecolorization of the solution, TOC decreased sharply, reach-ing a terminal value of about TOC 1.2 mg L−1. Obviously, themineralization procedure of this experiment is similar withLUP (Figure 4(b)). The two mineralization procedures haveboth been designed by two different methods of reducingexcited electron-hole pairs. These results confirm the spec-ulation, indicating that the amount of excited electron-holepairs is truly the main reason for the different photocatalyticmineralization procedures.
4. Conclusion
The photocatalytic degradation of MB was investigated inHUP and LUP. Three criteria have been selected to compareboth processes: (i) reaction rate and reaction time, (ii) theinitial apparent photonic efficiency, and (iii) mineralizationrate and mineralization degree. It was found that high UVphoton flux is effective for accelerating the photocatalysisrate. Under optimal operational conditions, 99% decoloriza-tion of MB solution could be achieved within 30 s of UVirradiation time or more than 90% decolorization within15 s, and 95% removal of 9.75 mg L−1 TOC could be achievedwithin 120 s. The analysis of initial apparent photonic effi-ciency shows the initial apparent photonic efficiency de-creases with the increase of photon flux. Furthermore, we

International Journal of Photoenergy 7
have established that a high density of electron-hole pairsis one of reasons that caused decline of initial apparentphotonic efficiency at high photon flux photocatalytic reac-tion, and the reduction in the density of excited electron-hole could actually improve the initial apparent photonicefficiency in high photon flux photocatalytic reaction. Theobtained results in mineralization processes showed thathigh photon flux could dramatically improve the mineral-ization rate and enhance the degree of mineralization inthe photocatalytic reaction, which is attributed to the largenumbers of electron-hole pairs and •OH radicals.
References
[1] C. A. Martınez-Huitle and E. Brillas, “Decontamination ofwastewaters containing synthetic organic dyes by electrochem-ical methods: a general review,” Applied Catalysis B, vol. 87, no.3-4, pp. 105–145, 2009.
[2] Z. Wang, W. Ma, C. Chen, H. Ji, and J. Zhao, “Probingparamagnetic species in titania-based heterogeneous photo-catalysis by electron spin resonance (ESR) spectroscopy—amini review,” Chemical Engineering Journal, vol. 170, no. 2-3,pp. 353–362, 2011.
[3] U. I. Gaya and A. H. Abdullah, “Heterogeneous photocatalyticdegradation of organic contaminants over titanium dioxide:a review of fundamentals, progress and problems,” Journal ofPhotochemistry and Photobiology C, vol. 9, no. 1, pp. 1–12,2008.
[4] C. Quinones, J. Ayala, and W. Vallejo, “Methylene blue photo-electrodegradation under UV irradiation on Au/Pd-modifiedTiO2 films,” Applied Surface Science, vol. 257, no. 2, pp. 367–371, 2010.
[5] A. L. Linsebigler, G. Lu, and J. T. Yates, “Photocatalysis onTiO2 surfaces: principles, mechanisms, and selected results,”Chemical Reviews, vol. 95, no. 3, pp. 735–758, 1995.
[6] S. M. Meunier, J. Gamage, Z. Duvnjak, and Z. Zhang, “Designand characterization of a novel rotating corrugated drumreactor for wastewater treatment,” International Journal ofPhotoenergy, vol. 2010, Article ID 146743, 10 pages, 2010.
[7] L. Elsellami, F. Vocanson, F. Dappozze et al., “Kinetic of ad-sorption and of photocatalytic degradation of phenylalanineeffect of pH and light intensity,” Applied Catalysis A, vol. 380,no. 1-2, pp. 142–148, 2010.
[8] D. F. Ollis, E. Pelizzetti, and N. Serpone, “Photocatalyzed de-struction of water contaminants,” Environmental Science andTechnology, vol. 25, no. 9, pp. 1522–1529, 1991.
[9] K. Okamoto, Y. Yamamoto, H. Tanaka, and A. Itaya, “Kineticsof heterogeneous photocatalytic decomposition of phenolover anatase TiO2 powder,” Bulletin of the Chemical Society ofJapan, vol. 58, no. 7, pp. 2023–2028, 1985.
[10] S. B. Kim and S. C. Hong, “Kinetic study for photocatalyticdegradation of volatile organic compounds in air using thinfilm TiO2 photocatalyst,” Applied Catalysis B, vol. 35, no. 4,pp. 305–315, 2002.
[11] J. T. Carneiro, R. Berger, J. A. Moulijn, and G. Mul, “Aninternally illuminated monolith reactor: pros and cons relativeto a slurry reactor,” Catalysis Today, vol. 147, pp. S324–S329,2009.
[12] S. Ahmed, M. G. Rasul, R. Brown, and M. A. Hashib, “Influ-ence of parameters on the heterogeneous photocatalytic de-gradation of pesticides and phenolic contaminants in waste-water: a short review,” Journal of Environmental Management,vol. 92, no. 3, pp. 311–330, 2011.
[13] C. G. Hatchard and C. A. Parker, “A new sensitive chemicalactinometer II potassium ferrioxalate as a standard chemicalactinometer,” Proceedings of the Royal Society of London. SeriesA, vol. 235, no. 1203, pp. 518–536, 1956.
[14] I. K. Konstantinou and T. A. Albanis, “TiO2-assisted photocat-alytic degradation of azo dyes in aqueous solution: kinetic andmechanistic investigations: a review,” Applied Catalysis B, vol.49, no. 1, pp. 1–14, 2004.
[15] A. Chatzitakis, C. Berberidou, I. Paspaltsis, G. Kyriakou, T.Sklaviadis, and I. Poulios, “Photocatalytic degradation anddrug activity reduction of chloramphenicol,” Water Research,vol. 42, no. 1-2, pp. 386–394, 2008.
[16] M. Muneer and D. Bahnemann, “Semiconductor-mediatedphotocatalyzed degradation of two selected pesticide deriva-tives, terbacil and 2,4,5-tribromoimidazole, in aqueous sus-pension,” Applied Catalysis B, vol. 36, no. 2, pp. 95–111, 2002.
[17] L. Zhang, W. A. Anderson, and Z. Zhang, “Development andmodeling of a rotating disc photocatalytic reactor for wastewa-ter treatment,” Chemical Engineering Journal, vol. 121, no. 2-3,pp. 125–134, 2006.
[18] O. K. Dalrymple, D. H. Yeh, and M. A. Trotz, “Removingpharmaceuticals and endocrine-disrupting compounds fromwastewater by photocatalysis,” Journal of Chemical Technologyand Biotechnology, vol. 82, no. 2, pp. 121–134, 2007.
[19] E. E. Coyle and M. Oelgemoller, “Micro-photochemistry:photochemistry in microstructured reactors. The new pho-tochemistry of the future?” Photochemical and PhotobiologicalSciences, vol. 7, no. 11, pp. 1313–1322, 2008.
[20] A. Houas, H. Lachheb, M. Ksibi, E. Elaloui, C. Guillard,and J. M. Herrmann, “Photocatalytic degradation pathway ofmethylene blue in water,” Applied Catalysis B, vol. 31, no. 2,pp. 145–157, 2001.