Embed Size (px)
Citation preview

ANNUAL REPORT 2014
ADVANCEDMATERIALS
ADVANCEDMATERIALSAD
VAN
CED
THIN
KING
ADVANCED INNOVATION
ADVANCED PERSPEC
TIVE
ADVANCED INNOVATION
ADVA
NC
ED T
HINKING ADVANCED
PERSPECTIVE

MORGAN ADVANCED MATERIALS IS COMMITTED TO BUILDING A SUSTAINABLE COMPETITIVE ADVANTAGE IN ATTRACTIVE MARKETS WITH TRULY DIFFERENTIATED PRODUCTS AND SERVICES UNDERPINNED BY WORLD-LEADING TECHNOLOGY.The Group produces a wide range of specialist, high-specification materials that have extraordinary attributes and properties.
Engineered into products, they deliver enhanced performance, often under extreme conditions.
The Group’s dynamic, highly skilled people are continuously engaged in finding solutions for complex and technologically demanding applications, which are used all over the world.
In short, the Group supplies innovative, differentiated products made from highly technical advanced materials which enable its customers’ products and processes to perform more efficiently, more reliably and for longer.
MORGAN ADVANCED MATERIALS

AnnuAl report 2014 MorgAn ADVAnCeD MAterIAlS
oVerVIeW02 At a glance04 Financial, regional and operational highlights06 Chairman’s statement
StrAtegIC report 08 Business review10 What Morgan does14 group business model16 group strategy17 Key performance indicators18 risk management22 Corporate responsibility34 review of operations42 Financial review
goVernAnCe46 Board of Directors48 executive Committee49 Corporate governance report58 report of the Audit Committee61 report of the nomination Committee63 remuneration report86 other disclosures90 Independent auditor’s report to the members
of Morgan Advanced Materials plc
FInAnCIAl StAteMentS93 Consolidated income statement94 Consolidated statement of comprehensive income95 Consolidated balance sheet96 Consolidated statement of changes in equity97 Consolidated statement of cash flows98 notes to the consolidated financial statements 145 Company balance sheet 146 notes to the Company balance sheet 155 group statistical information 156 Cautionary statement 157 glossary of terms 158 Shareholder information
oVe
rVIe
WSt
rAt
egIC
rep
ort
go
Vern
AnC
eFI
nAn
CIA
l St
AteM
entS
Overview 01

02
Morgan aDVanCED MaTErIaLS annuaL rEporT 2014
Overview
At A glAnCe
our MArKetS
HeAltHCAreMorgan Advanced Materials produces components used in medical monitoring and diagnostic instrumentation and tools for treatment and surgery.
petroCHeMICAlMorgan Advanced Materials makes critical components for tough assignments in the global petrochemical industry.
trAnSportAtIonMorgan Advanced Materials makes high-performance products to exacting standards for aerospace, automotive, marine and rail applications.
eleCtronICSMorgan Advanced Materials makes components that help the electronics industry in its drive towards higher performance and reliability in smaller, lighter, more robust products.
energyMorgan Advanced Materials develops products for power distribution and generation from renewable and traditional sources and insulation materials for heat management.
SeCurIty AnD DeFenCeMorgan Advanced Materials supplies precision-engineered materials, components and assemblies to meet the exacting standards of the international defence and security markets.
InDuStrIAlMorgan Advanced Materials designs and manufactures products for use in a broad range of challenging process and manufacturing environments.
WHAt DIFFerentIAteS uS?>> >Advanced material science and processing capabilities>> >our applications engineering experience>> >A strong history of innovation and reinvention>> >Consistent and reliable performance>> >A truly global footprint>> >>We find and invest in the best people

Overview 03
AnnuAl report 2014 MorgAn ADVAnCeD MAterIAlS
£921.7MtotAl gloBAl SAleS o
VerV
IeW
Str
Ateg
IC r
epo
rtg
oVe
rnAn
Ce
FIn
AnC
IAl
StAt
eMen
tS
our gloBAl FootprInt
prInCIpAl proDuCtS
InSulAtIng FIBre, BrICK AnD MonolItHICSextensive range of high-temperature insulation products used to reduce energy consumption in industrial processes.
eleCtrICAl CArBon, lIneAr AnD rotAry trAnSFer SySteMSused to transfer current and data between stationary and rotating or linear moving parts, in motor, generator, current collector and rotary signal applications within mining, power, transportation and industrial markets.
SeAlS AnD BeArIngSproviding improved performance, reliability and extended life to pumps and similar equipment used in petrochemical, aerospace and water applications.
CerAMIC CoreS For InVeStMent CAStIngConsumable products used to create intricate internal cooling cavities in aero engine and industrial gas turbine blades.
pIezoeleCtrIC SenSorS AnD trAnSDuCerSproducts for measurement duties including level, flow, vibration and pressure in aerospace, medical, industrial and defence applications.
CruCIBleS For MetAlS proCeSSIngComprehensive range for optimum performance in non-ferrous metal and alloy melting in foundries, die-casters and metal processing facilities.
perSonnel BAllIStIC proteCtIonlightweight armour systems combining advanced ceramics with high-technology composites to create high-performance products.
1 6
7
7
3
3
4
5
2
SAleS By regIon (£MIllIon) north America £353.1 europe £325.7 Asia/rest of World £242.9
1
25
4
6
>9,000eMployeeS
MAnuFACturIng In
>30CountrIeS
SellIng Into
>100CountrIeS

Morgan aDVanCED MaTErIaLS annuaL rEporT 2014
revenue at constant currency increased by 1.8% compared to 2013. revenue was 3.8% higher in the second half than the first on an organic and constant currency basis.
order intake for the full-year was encouraging. Book-to-bill ratio was 1.02 times with all geographies above 1.00 times and a year end order book at constant currency circa 9% above that at the end of 2013.
eBItA margin for the full year increased 40 basis points to 12.8% (2013: 12.4%). the eBItA margin in the second half of 2014 was 13.0%.
reported results were impacted by a strong sterling against most currencies during 2014. relative to 2013, the impact of foreign exchange translation was an adverse movement of £52.3 million on revenue and £7.9 million on eBItA.
net cash inflow from operating activities remained strong at £120.0 million (2013: £127.0 million). net debt at the year end was £207.0 million (2013: £186.5 million). net debt to eBItDA ratio at the year end was 1.4 times (2013: 1.3 times).
the group has booked a £51.9 million charge in the income statement (2013: £12.9 million) in respect of a number of specific adjusting items, details of which are provided in the Financial review on page 43. Due to the nature of these items they are excluded from the underlying profit figures. the cash cost of these items in 2014 was £5.3 million with a further cash cost of £6.6 million expected in 2015.
proposed final dividend increased to 7.0 pence per share (2013: Final 6.7 pence per share), which would result in a full-year dividend of 10.9 pence (2013: 10.5 pence), a 3.8% increase.
In north America the thermal Ceramics, electrical Carbon and Seals and Bearings businesses performed well, partially offset by a weaker performance in technical Ceramics, particularly in the ceramic cores business. At constant currency, revenue increased by 3.6% compared to 2013, delivering mid-teen margins of 14.9% (2013: 15.4%).
european markets remained challenging during the year with like-for-like revenue, excluding Composites and Defence Systems (C&DS), flat compared to 2013. C&DS was impacted by lower MoD demand and its revenue was £25.3 million lower than 2013. However, reported european eBItA margins continued to improve to 12.2% (2013: 11.8%) for the full year, reflecting the improvements made in the cost base from restructuring actions.
Asia/rest of World delivered strong revenue growth and margin progression in 2014, with 13.0% revenue growth on a continuing and constant currency basis, with all major geographies showing growth in the year, and eBItA margin at reported rates improved by 180 basis points to 12.8% (2013: 11.0%).
9%InCreASe In yeAr enD orDer BooK
£120MoperAtIng CASH FloW
13.0%group eBItA
MArgIn In H2 2014
FInAnCIAl AnD regIonAl HIgHlIgHtS
FInAnCIAl, regIonAl AnD operAtIonAl HIgHlIgHtS
04 Overview

oVe
rVIe
WSt
rAt
egIC
rep
ort
go
Vern
AnC
eFI
nAn
CIA
l St
AteM
entS
AnnuAl report 2014 MorgAn ADVAnCeD MAterIAlS
oVe
rVIe
W
operAtIonAl HIgHlIgHtS AnD otHer DeVelopMentS
r&D and capital investment: the group continues to make good progress on its strategy of investing in technology differentiation and profitable growth. research and development expenditure has increased to 2.3% of revenue (2013: 2.1%) and capital expenditure at £33.8 million is circa 1.2 times depreciation. the new global Materials Centre of excellence for Structural Ceramics will be operational in the first half of the year and new manufacturing facilities in Abu Dhabi, South Korea and China will all be operational in 2015. In December 2014 an agreement was signed with yongda group (China) to create a Morgan-majority 58:42 joint venture to manufacture ceramic cores for the investment casting of turbine blades for the Chinese market.
Acquisitions: the group acquired the porextherm business in germany in July 2014 for €26.0 million. this microporous insulating business is highly complementary to the group’s existing businesses in an area of differentiated technology serving highly demanding applications in aerospace, oil and gas, and industrial markets.
Disposals: the group has completed the portfolio reshaping it committed to in november 2013, exiting businesses with an annual revenue of £40-50 million that did not meet its growth, margin or technical differentiation requirements. A net £3.9 million charge for these sales and exits is shown in the income statement in the ‘Specific adjusting items’ column.
restructuring of businesses: Further good progress has been made in improving the profitability of the electrical Carbon and Seals and Bearings businesses, with margins up to 14.7% and 10.1% respectively for 2014. Further improvement will come from a rationalisation of the group’s carbon materials footprint, which started in the second half of 2014 and is expected to yield additional annualised benefits of circa £3 million (circa £1 million of benefit in 2015). this has resulted in a charge of £16.3 million in 2014, circa £2 million of this is a cash cost in 2014, with a further £5.1 million in 2015. the charge is shown in the income statement in the ‘Specific adjusting items’ column.
Composites and Defence Systems: revenue and eBItA margins for the full-year were £31.5 million and 3.8%, with the second half revenue increasing by 26.6% compared with the first half to £17.6 million and margins increasing to 10.8%. Following the reduction in uK MoD demand, the carrying value of the goodwill and intangibles of C&DS has been assessed and a £26.9 million non-cash charge for impairment has been made and reported in the ‘Specific adjusting items’ column. the business remains an important supplier to the uK MoD but continues to develop international defence and commercial opportunities outside of the traditional uK MoD contracts. this business is expected to have annual revenues in the £30-40 million range over the next two years.
refinancing: the group refinanced its previous £150 million rCF with a new five-year, £200 million facility on 17 october with significantly reduced interest costs. With this refinancing and the repayment of $100 million of uS private placement debt in December 2014, the group’s net bank interest charge on a continuing organic basis at constant currency and at present interest rates is expected to be reduced by circa £3 million in 2015 compared to 2014.
new Board appointment: the group announced on 30 January 2015 the appointment of pete raby as Chief executive officer, with effect from 1 August 2015, following the departure of Mark robertshaw at the end of 2014. pete joins the group from Cobham plc where he has been a member of Cobham plc’s executive committee since 2010. the Board is grateful to Kevin Dangerfield for agreeing to act as Interim Ceo until 1 August 2015.
Definitions of the financial measures used throughout this Annual report and Accounts can be found in the glossary of terms on page 157.
Overview 05
3.8%InCreASe In
Full yeAr DIVIDenD

06 Overview
Morgan aDVanCED MaTErIaLS annuaL rEporT 2014
CHAIrMAn’S StAteMent
Andrew ShilStOn CHAIrMAn
In A gloBAl eConoMy tHAt HAS reMAIneD CHAllengIng tHe group HAS MADe gooD progreSS AnD DelIVereD A Strong FInAnCIAl perForMAnCe In 2014. WHIlSt MACro ConDItIonS reMAIn unCertAIn, our InCreASeD InVeStMent In teCHnology leAVeS tHe group Well poSItIoneD to ContInue tHIS progreSS In 2015.

Overview 07
AnnuAl report 2014 MorgAn ADVAnCeD MAterIAlS
oVe
rVIe
WSt
rAt
egIC
rep
ort
go
Vern
AnC
eFI
nAn
CIA
l St
AteM
entS
It has been encouraging to see the benefits from the one Morgan model starting to be realised during 2014. the group achieved an improving level of revenue growth in the year and improving margins. revenue was 3.8% higher in the second half than the first on an organic and constant currency basis and our group eBItA margin was 13.0% in the second half compared to the first half at 12.6%. the project to get out of low-value businesses we had identified has been completed in January 2015, and we continued to invest in new activities.
Investment in the future was reflected in the acquisition and successful integration of the porextherm business in germany, capital expenditure on new facilities particularly for the thermal businesses and an increase in spending on r&D to 2.3% of revenue. We signed a new joint venture in China to manufacture ceramic cores where there is government commitment to foster domestic manufacture of gas turbines. there are other similar opportunities in China as the economy rapidly moves into higher value activities.
performance for the year was inevitably affected by sterling being strong throughout most of 2014, however underlying group epS improved from 21.5 pence in 2013 to 22.0 pence in 2014. our net debt at £207.0 million and net debt to eBItDA ratio of 1.4 times are low, providing the group with the ability to invest in the future growth of the business. It is proposed to pay a final dividend of 7.0 pence for 2014, an increase of 4.5% over 2013.
looking to 2015 we see a continuation of the benefits of positive action to grow both revenue and margins against the backdrop of continuing mixed market conditions. Morgan will continue to focus and invest in its key technology areas to drive differentiation, positive mix shift and sustainable growth potential.
During 2014 Mark robertshaw announced his intention to relinquish his position as Chief executive officer after serving in that role for eight years. the Board is very grateful to Mark for the efforts he made over this period to redefine what Morgan is, identify core capabilities and put in place the building blocks for a bright future.
the Board has announced the appointment of pete raby as Chief executive officer with effect from 1 August 2015. pete joins Morgan with an impressive track record in planning and executing business strategy across global manufacturing operations and has an extensive background in technology-led innovation. We are delighted to welcome him as Chief executive officer.
the Board is grateful to Kevin Dangerfield for agreeing to act as interim Chief executive officer until 1 August, and I am sure that, together with the great commitment of our staff, there will be a continuation of the positive developments in 2014.
there were further changes to the Board with welcomes to Douglas Caster and rob rowley joining the Board, and farewell to Andrew given having served seven years most recently as Chairman of the Audit Committee and Senior Independent Director. Andrew has made an invaluable contribution over this period of transformation of the group.
Andrew ShilStOnCHAIrMAn
Find out morewww.morganadvancedmaterials.com

Morgan aDVanCED MaTErIaLS annuaL rEporT 2014
Kevin dAnGerFieldInterIM CHIeF exeCutIVe oFFICer & CHIeF FInAnCIAl oFFICer
08 StrAteGiC rePOrt
2014 has been a year of continued improvement for Morgan, having implemented a new organisational structure in 2013. the benefits of this have driven an improving profit and margin profile through 2014 in trading conditions that have remained mixed across the world. our profits, margins and cash flows have been resilient in these difficult market conditions, in contrast to many of our direct competitors.
In 2014 the group achieved increasing eBItA margins from 12.6% in the first half to 13.0% in the second half of the year (2013: full year 12.4%) for a full year margin of 12.8%. these higher margins have been achieved through a combination of revenue growth, operational efficiency and portfolio change all of which have benefited from the one Morgan regional organisation that was put in place in 2013. the group achieved 3.8% revenue growth on an organic and constant currency basis in the second half of the year compared to the first half as the organisational changes to our business model provided an improving position to take advantage of profitable growth opportunities.
the portfolio reshaping that was announced in 2013 has been completed with the exit or sale of those businesses that that did not meet our growth, margin and technical differentiation expectations. net capital investment at £33.8 million is a healthy 1.2 times depreciation, with significant new manufacturing facilities being constructed in Abu Dhabi, South Korea and China, all of which are for further expansion and revenue growth in 2015 and beyond. At the same time there has been active investment in looking for synergistic bolt-on acquisitions and new ventures for profitable revenue growth.
the purchase of the porextherm business in July was very much in-line with our continued expansion in insulation products with high growth and return potential. In December 2014 the group signed an agreement with yongda group, China to create a Morgan-majority 58:42 joint venture to manufacture ceramic cores used in the investment casting of turbine blades primarily for the Chinese market. the group is well positioned to continue to improve the quality, resilience and returns of the business in 2015.
BuSIneSS reVIeW
We WIll ContInue to FoCuS on AnD InVeSt In Key teCHnology AreAS to DrIVe DIFFerentIAtIon, poSItIVe MIx SHIFt AnD SuStAInABle groWtH potentIAl.

oVe
rVIe
WSt
rAt
egIC
rep
ort
go
Vern
AnC
eFI
nAn
CIA
l St
AteM
entS
StrAteGiC rePOrt 09
AnnuAl report 2014 MorgAn ADVAnCeD MAterIAlS
technology and innovationpart of the changes the group made to its operating structure in 2013, into the one Morgan model, was to achieve a greater focus on, and acceleration of, our investment in our research and development and innovation pipeline to strengthen Morgan’s sustainable competitive advantage for both top-line growth and margin enhancement. our aim is to improve the leverage that our innovation and differentiation provide across the full breadth of our geographies and end-markets.
During 2014 the group increased again its r&D investment to 2.3% of revenue and established a new global Materials Centre of excellence for structural ceramics in Stourport, uK that will be operational in the first half of 2015. this new centre is the third of our global Materials Centre of excellence established over recent years. our long-term profitable growth depends on constantly refreshing our innovation pipeline to anticipate, or respond to, market trends. through the roll-out of more Centres of excellence, continued increase in our r&D spend, partnering and co-development with key world-leading universities and market-leading global customers the group continues to improve its innovation pipeline for profitable growth. this innovation pipeline is aimed at providing both short- and longer-term profitable growth opportunities. From a more medium-to longer-term perspective, the group announced a strategic collaboration with the nobel prize-winning team at the university of Manchester focused on developing potential new processes and end-market applications for graphene materials.
Group resultsgroup revenue for 2014 was £921.7 million, 3.8% below 2013 at reported exchange rates. on a constant currency basis the group revenues were higher by 1.8% year-on-year, with the second half of 2014 showing 3.8% revenue growth on an organic and constant currency basis compared to the first half. Despite mixed market conditions across the world through 2014, Morgan has achieved revenue growth in 2014. on a constant currency basis and adjusting for the impact of acquisitions and disposals/exits, there was strong revenue growth in the Asia/rest of World region of 13.0% compared to 2013, while north America achieved 3.6% and europe, excluding the uK Composites and Defence Systems business, was flat. eBItA margins increased significantly in Asia/rest of World to 12.8% (2013: 11.0%), europe improved to 12.2% (2013: 11.8%) and north America continued to achieve mid-teen margins at 14.9% (2013: 15.4%).
group underlying epS increased to 22.1 pence (2013: 21.5 pence).
Foreign exchange currency translation has had a material impact on both revenue and group eBItA in 2014 as sterling has been strong against the vast majority of currencies that the group trades in during much of the year. group eBItA at £118.0 million is down from £119.0 million in 2013, but at constant currency using 2014 exchange rates 2013 group eBItA was £111.1 million, hence an increase year-on-year in group eBItA of £6.9 million at constant exchange rates.
operating cash generation was good, with a net cash inflow from operating activities of £120.0 million (2013: £127.0 million). net debt at the year end, following more than £20 million of spend on the porextherm acquisition, was £207.0 million (2013: £186.5 million). net debt to eBItDA ratio at the year-end remained at a low 1.4 times (2013: 1.3 times).
looking forwardAgainst the backdrop of continuing mixed market conditions as we enter 2015, Morgan will continue to focus and invest on its key technology areas to drive differentiation, positive mix shift and sustainable growth potential. this investment in the business combined with a positive order book as we start 2015 underpins confidence that the group can make further progress in 2015.
Kevin dAnGerFieldInterIM CHIeF exeCutIVe oFFICer & CHIeF FInAnCIAl oFFICer

Morgan aDVanCED MaTErIaLS annuaL rEporT 2014
> piezoelectric sensors and transducers – 4% of group revenue in 2014 – products for measurement duties including level, flow, vibration and pressure in aerospace, medical, industrial and defence applications.
> Crucibles for metals processing – 4% of group revenue in 2014 – comprehensive range for optimum performance in non-ferrous metal and alloy melting in foundries, die-casters and metal processing facilities.
> High-technology composites – 2% of group revenue in 2014 – which are combined with the group’s advanced ceramics for lightweight armour systems, providing ballistic protection in the form of personnel body armour or vehicle armour.
In addition to these principal product ranges, there are also a high number of application-specific products made to customer requirements using a wide range of structural ceramics, electro ceramics and precious metals that are sold into the seven markets.
group ACtIVItIeS
Morgan Advanced Materials is a world-leader in advanced materials, focused on specialist ceramics, carbon and composites. Working at the forefront of materials science, the group supplies differentiated products to a range of attractive growth markets, satisfying technically demanding applications and enabling customers’ products to perform more efficiently, reliably and for longer in a wide range of markets.
BuSIneSS StruCture
operating from approximately 100 manufacturing sites, supported by a network of sales offices, and employing approximately 9,000 people, Morgan Advanced Materials has a significant operational presence in all the world’s major regions, serving customers in over 100 countries.
the group reports through three geographical regions, north America, europe and Asia/rest of World, and each of those regions offers the full range of Morgan’s product and services. the regional management teams work effectively together in terms of product and market development and providing service excellence to the customer base. the one Morgan model integrates the group under a cohesive brand identity which better reflects the business as a whole.
proDuCtS
Morgan Advanced Materials manufactures a large range of products, satisfying a variety of applications and for a number of end-markets.
the principal product ranges are: > Insulating fibre, brick and monolithics –
35% of group revenue in 2014 – an extensive range of high-temperature insulation products used to reduce energy consumption in industrial processes. A Morgan design team will often work with the customer to ensure an optimum solution.
> electrical carbon, linear and rotary transfer systems – 15% of group revenue in 2014 – primarily used for transferring electrical energy in motor and generator applications within mining, transportation and power generation markets.
> Seals and bearings – 8% of group revenue in 2014 – carbon/graphite and silicon carbide components that provide improved performance, reliability and extended life to pumps and similar equipment used in petrochemical, aerospace and water applications.
> Ceramic cores for investment casting – 4% of group revenue in 2014 – consumable products used to create intricate internal cooling cavities in aero-engine and industrial gas turbine blades.
WHAt MorgAn DoeS
10 StrAteGiC rePOrt

oVe
rVIe
WSt
rAt
egIC
rep
ort
go
Vern
AnC
eFI
nAn
CIA
l St
AteM
entS
AnnuAl report 2014 MorgAn ADVAnCeD MAterIAlS
MArKetS InDuStrIAl
Morgan Advanced Materials designs and manufactures products for use in a broad range of challenging processes and manufacturing environments.
the group’s advanced materials offer a wide range of performance characteristics, including superior insulating properties, dimensional stability, strength and stiffness.
With these materials the group engineers components that are highly resistant to chemical and physical wear, corrosion and extreme heat, for use in industrial processing and demanding manufacturing environments.
Many of the industrial projects the group is involved in exploit the properties of its advanced materials to contribute to improved process efficiency and productivity, and reduced waste and environmental impact.
the group’s innovative Blue lightning thermocouple sheath is delivering significant cost and time savings for India-based components manufacturer High technology transmission Systems, a global force in aluminium castings for the automotive sector, producing cast aluminium clutch assemblies and other cast components. the assembly, which continuously measures temperatures in its holding furnaces, lasts 15x longer, reducing downtime and risk of contamination.
rotary joints and rotary transfer systems developed by the group are used in food and beverage processing equipment such as fillers, rinsers and milking carousels, and in packaging and labelling equipment. the capability to customise components, and to engineer complete bespoke systems, allows Morgan to maximise performance and reliability according to the needs of individual projects.
trAnSportAtIon
Morgan Advanced Materials makes high-performance products to exacting standards for aerospace, automotive, marine and rail applications.
the group has long standing experience in the transport sector making components and sub-assemblies for many and varied applications, including carbon brushes and collectors for trains and high-temperature fibre products used for emission control in vehicles. the group combines its materials science and manufacturing capabilities to offer consistent and reliable products in flexible production quantities, from small, even one-off runs to high-volume.
over the years the group has applied its materials know-how to solve engineering challenges and enhance performance for air, sea and land transport systems. For example, the group has helped to improve reliability in high-speed rail and on long-haul freight trains that must operate consistently in widely varying climatic conditions. the group has developed precision parts used in the manufacture of aero-engine turbine blades and critical components for in-flight refuelling and satellite positioning systems.
engineers in the group have developed a groundbreaking new capability, enabling the brazing of carbon fibre, ceramics, composites, or other engineered materials directly to a titanium honeycomb. the strength of this lightweight material at high speeds means it has the capability for use in hypersonic aircraft, helping push the boundaries of modern aerospace endeavours.
With the huge increase in rail transportation of oil and gas products produced from shale in countries such as the uSA, the group’s FireMaster® tank Car Blanket has been developed to meet the specific fire and thermal management safety requirements, helping improve safety whilst transporting highly flammable liquids across the country from where they are sourced to where they are needed.
tHe group operAteS In A nuMBer oF SeleCteD MArKet SeCtorS; tHe perCentAge oF group reVenue FroM eACH oF tHeSe, togetHer WItH exAMpleS oF tHe proDuCtS MorgAn SupplIeS, IS proVIDeD on tHe FolloWIng pAgeS.
StrAteGiC rePOrt 11
45%of 2014 revenue
20%of 2014 revenue

Morgan aDVanCED MaTErIaLS annuaL rEporT 2014
petroCHeMICAl
Morgan Advanced Materials makes critical components for demanding applications in the global petrochemical industry.
the oil and gas industry presents some of the world’s harshest operational environments for equipment and people. the group’s products and materials are routinely chosen to fulfil critical applications on- and off-shore in exploration, drilling and downstream processing.
It is the resistance of the group’s materials to chemical and physical wear, corrosion and extreme heat that makes them ideally suited for use in these severe duty applications. For example, due to a unique microstructure, the group’s zirconia materials exhibit a property known as ‘transformational toughening’ that makes them exceptionally strong and resistant to corrosion and abrasion. the group uses them to engineer hardwearing parts for pumps, drilling machinery and specialist fluids handling equipment.
the integrity of the components the group manufactures are often fundamental to the safety and efficiency of high-value hydrocarbon extraction and processing operations. For example, the group’s precision machining of silicon carbide composite mechanical seals dramatically reduces interface leakage in demanding conditions, allowing operators to work at elevated contact pressures. the group’s tribology work on pumps and bearings is producing low-friction composites for longer life and better energy efficiency.
the group’s high-efficiency insulation products such as FireMaster® Marine plus blanket are used to provide complete fire protection systems for low critical temperature operations on- and off-shore, whilst also providing weight savings of 20-30% compared to conventional products. FireMaster® Cable tray Wrap from the group’s thermal Ceramics business is helping protect critical control equipment, allowing equipment to still be controlled in the event of a hydrocarbon fire so operations can be shut down.
SeCurIty AnD DeFenCe
Morgan Advanced Materials supplies precision-engineered materials, components and assemblies to meet the exacting standards of the international defence and security markets.
Materials technology and manufacturing capability are combined to produce solutions that deliver real performance benefits in security and defence applications, from military hardware to surveillance equipment.
reliability of products, materials and supply is a fundamental requirement in this market. the group’s new lightweight ergoteC™ 4025 explosive ordnance disposal (eoD) suit has developed specifically for the uS market and will be distributed exclusively to law enforcement customers. Integrating new technology, leading-edge materials and world class garment engineering it combines the highest levels of protection with the user mobility required for successful missions.
the group is working with major names including tata Motors, where it has helped develop a composite and ceramic ‘pod’ for a light Armoured Multipurpose Vehicle programme for the Indian Ministry of Defence. the innovative pod offers a weight saving in excess of 1,000kg, making it less than half the weight of a similarly protected steel structure.
eleCtronICS
Morgan Advanced Materials makes components for use in semiconductor fabrication and electronic products.
the group exploits the unique properties of its advanced materials to help electronics manufacturers achieve competing demands on size, functionality and cost.
the group works closely with its customers to design and manufacture small or intricate components, achieving explicit electrical and thermal properties within restricted size and shape constraints. the group is able to offer durable piezoceramics, high-quality dielectric materials and specialised metallisation techniques. the group’s products are found in mobile phones, laptops, high-definition televisions, lighting controls, laser instrumentation, microwave and high-voltage systems. the group’s advances in ceramic metallisation processes have played a major role in the commercialisation of modern communications, signalling and control technologies including ultra-high frequency signal transmission.
In semiconductor and leD substrate fabrication, the group’s high-purity materials and controlled microstructures have brought significant yield improvements in specialist processes for ion implantation, epitaxy and compound crystal growth.
the group’s Diamonex® ClearShield™ scratch- and wear-resistant window coating, developed to meet the electronics market’s rapid transition to optical image scanning and data capture is providing a wear-resistant solution for the scanning of inventory in warehouses, high-speed document scanning, blueprint reproduction, or scanning of financial documents.
High-grade ceramic components for the laser and opto-electronic market produced by the group provide dimensional stability, high reflectivity and vacuum integrity, ensuring an extended lifetime even when operating at temperatures in excess of 1,000°C.
WHAt MorgAn DoeScontinued
12 StrAteGiC rePOrt
7%of 2014 revenue
6%of 2014 revenue
10%of 2014 revenue

AnnuAl report 2014 MorgAn ADVAnCeD MAterIAlS
oVe
rVIe
WSt
rAt
egIC
rep
ort
go
Vern
AnC
eFI
nAn
CIA
l St
AteM
entS
HeAltHCAre
Morgan Advanced Materials makes components used in medical monitoring instrumentation and tools for treatment and surgery.
Medical engineering demands the highest standards of precision, accuracy, reliability and performance. equipment manufacturers and medical professionals choose the group’s materials for their exceptional physical characteristics.
experience over many years has given the group a good understanding of the uniquely demanding environment in which equipment for the global medical market is developed. the group’s capability in materials innovation and quality manufacturing allows it to produce parts that are optimised to meet precise complex physical and chemical specifications.
Morgan is continuing to push sensing technology and capability, developing a new ultrasonic sensing solution capable of detecting the level of liquids without needing to come into physical contact with them, eliminating the risk of contamination by maintaining a sterile environment.
the group boasts many long-term partnerships with leading names in a sector where repeatability and quality are crucial to success. For over 25 years Morgan has worked with Varian supplying more than 11,500 carbon fibre couch tops during this time, helping improve both the delivery of vital cancer treatment and quality of diagnostic scans.
energy
Morgan Advanced Materials develops products for power distribution and generation from renewable and traditional sources and insulation materials for heat management.
the group’s materials and products have a strong reputation for performance and reliability in the energy sector, built on years of experience supplying products across the electricity supply chain.
the group continues to work on diverse energy-related projects from piezoceramics for energy harvesting technologies to high-quality capacitance for high-voltage systems and specialist fire protection systems for offshore wind farms. the group offers the widest range of carbon brush grades currently available in the industry. each grade contains a different material composition, specifically designed to optimise the service life of the brushes and rings for the operating environment, helping reduce maintenance requirements and improve efficiency.
the group’s new p-59 ceramic core material is helping achieve greater energy efficiency for industrial gas turbine engines. In order to be more efficient, they must run at extremely high temperatures, which demands superior air cooling capabilities. p-59, with its fine particle size distribution, is able to achieve very thin air cooling channels.
StrAteGiC rePOrt 13
7%of 2014 revenue
5%of 2014 revenue

Morgan aDVanCED MaTErIaLS annuaL rEporT 2014
SuStAInIng VAlue generAtIon
group BuSIneSS MoDel
MorgAn proVIDeS ADVAnCeD MAterIAl SolutIonS to A VArIety oF enD-MArKetS, WorKIng CollABorAtIVely WItH CuStoMerS WorlDWIDe to proVIDe engIneereD proDuCtS tHAt SAtISFy teCHnICAlly CHAllengIng reQuIreMentS In DeMAnDIng enVIronMentS.
ADVANCEDMATERIALS
ADVANCED PERSPECTIVE
ADVANCED INNOVATION
ADVA
NC
ED T
HINKING
Customers: Partnerships and collaboration
Markets: High growth, high margin, non-economically cyclic
al
Materials science
Applications engineering Global f
ootpr
int
Ambition
Acco
unta
bilit
y
Integrity Responsibility
14 StrAteGiC rePOrt

oVe
rVIe
WSt
rAt
egIC
rep
ort
go
Vern
AnC
eFI
nAn
CIA
l St
AteM
entS
AnnuAl report 2014 MorgAn ADVAnCeD MAterIAlS
Morgan Advanced Materials’ business model is based on taking the full depth and breadth of its advanced materials capabilities to selected markets across the globe. the group fully leverages its global infrastructure and end-market positions to most effectively achieve this. the group reports as three geographical regions, north America, europe and Asia/rest of World. each serves its local markets with the full range of Morgan’s material capabilities. Where appropriate, cross-regional collaboration takes place to support, for example, key global customer accounts, operational benchmarking or new product development.
the group’s core values are based on a commitment to act with integrity when dealing with customers, employees, shareholders, suppliers and the wider community, so that it continues to maintain the trust and confidence of those with whom it deals. the group aims to be vigilant and proactive in respect of environmental, health and safety matters. this common culture is critical to the continued growth and development of Morgan Advanced Materials.
the group is organised and managed to ensure absolute clarity as to responsibility and accountability with a focus on pushing as much decision-making down to regions and local businesses as possible, within a well-understood strategic framework and schedule of authorities.
Customers and marketsAt the core of what Morgan does is the development of long-term relationships with customers, working collaboratively with them over time and on multiple initiatives to develop materials, components and sub-assemblies to address very specific customer needs. the parts that the group makes often play a critical role in its customers’ products, helping them to perform more efficiently, more reliably or for longer, sometimes in the most demanding environments. relationships are built at multiple levels between Morgan Advanced Materials and its customers, to ensure its materials science and its manufacturing know-how are utilised both at the start of its customers’ product life-cycle and through the ongoing refinement of products and solutions, positioning Morgan as the supplier of choice for current and next-generation products.
the group focuses on higher growth, higher margin, non-economically cyclical markets, where customers demand product and service excellence. these markets include energy generation, aerospace and healthcare.
the group enjoys a good spread of customers in terms of markets and geographies and while the loss of certain of these could affect the operations of a particular local business, none are considered financially essential to the group as a whole. notwithstanding this, the group devotes significant resources to ensuring these relationships continue to operate satisfactorily.
Additional information on the markets served by the group and on its products are included in What Morgan Does on pages 10 to 13.
research and developmentresearch and development is at the heart of what Morgan does. the group’s research and development (‘r&D’) capabilities are led by a Chief technology officer, who oversees the work of technical resource across the globe and ensures a co-ordinated and focused approach to the large and critical investment that the group makes in this area.
Due to the importance to Morgan of r&D and the global approach to it, a specific review is provided on pages 34 and 35 of this report.
OperationsAs noted above, the group has a truly global footprint that allows it to effectively serve its customer base. utilising that footprint in terms of providing the highest level of service excellence to its customers and maximising operational excellence and cost-efficiency is a critical element of the business model. the spread and number of sites allows the group to be close to its customers and to optimise its logistics, particularly for the fibre product range.
the group continues to increase the effective use of its low-cost manufacturing footprint, through sites in Hungary, Mexico, India and China. these sites act as points of supply to their immediate geographic regions and also as global points of supply where appropriate. operational benchmarking across sites with similar products/processes is also utilised alongside a suite of operational efficiency initiatives.
the quality and reliability of certain raw material inputs is critical, and just as the group has developed excellent relationships with customers, it also has long-term and effective relationships with its critical raw material suppliers. Wherever possible raw materials are dual-sourced, or there are actionable plans in place for alternative sources should the supply chain be disrupted.
role of centrethe group’s head office is based in Windsor, uK and is the location of the group’s central functions comprising approximately 35 people. the centre provides the strategic framework for the group, clarity on core values and ‘responsible business’ and the processes for appropriate business monitoring through the business planning and budget cycles. the centre is also responsible for external investor relations, funding and treasury management and other areas where it is appropriate for specialist expertise to be brought together in one place for the benefit of the group, such as pensions, insurance, tax, legal and environmental, health and safety. the corporate centre is small and the lines of communication with the businesses are short and responsive.
StrAteGiC rePOrt 15

Morgan aDVanCED MaTErIaLS annuaL rEporT 2014
group StrAtegy
tHe group’S StrAtegy IS BASeD on BuIlDIng A SuStAInABle BuSIneSS For tHe long terM, By FoCuSIng on ItS FIVe StrAtegIC prIorItIeS AnD reMAInIng CoMMItteD to DelIVerIng Strong FInAnCIAl returnS.
the group uses its strategic priorities to test new investment opportunities, to screen its existing businesses for fit with the group and to identify areas requiring strategic attention and action.
16 StrAteGiC rePOrt
StrAtegIC prIorItIeS IMpleMentAtIon
Be innovative, differentiated and high value-added to our customers
1 By helping to solve technically demanding challenges for its discerning customers, the group is able to secure the value that these skills and efforts justify, allowing it to build long-term relationships with customers who regard Morgan as a solutions provider rather than just another supplier.
to focus on higher growth, higher margin, non-economically cyclical markets
2 over time Morgan actively manages its portfolio and makes capital and people investments to maximise exposure to its chosen geographies and markets.
Be number one or number two in our chosen market segments
3 A significant majority of revenue comes from markets where the group has successfully established a leading position. through detailed ‘share of wallet’ assessments Morgan understands its position and actively targets where this can be improved. the group nurtures and maintains relationships with key customers at multiple levels in the organisation.From these strong positions the group is able to invest in long-term relationships with customers, providing technology leadership and delivering good, sustainable returns.
have a culture of operational excellence and cost efficiency
4 providing the group’s customers with product and service excellence secures Morgan’s revenue stream, and a focus on all elements of its cost base maximises the profits generated from that revenue. the group is focused on managing its operational footprint, using its low-cost operations as much as possible, sourcing decisions, manufacturing and back office efficiency and on minimising scrap and any other inefficiencies throughout its processes.
Find, keep and develop the right people
5 the ‘people process’ begins with a robust recruitment process, considering internal and external candidates, utilising a suite of assessment tools and interviews. there is a growing graduate recruitment programme, targeting the world’s best universities and providing a pipeline of talent. training and development is targeted to develop job-specific and wider management skills and a flexible remuneration package considers the external market and individual contribution. Site, regional and global communication is regular and environmental, health and safety is a key focus at all levels of the business.

oVe
rVIe
WSt
rAt
egIC
rep
ort
go
Vern
AnC
eFI
nAn
CIA
l St
AteM
entS
AnnuAl report 2014 MorgAn ADVAnCeD MAterIAlS
Key perForMAnCe InDICAtorS
to support the group’s strategy and to monitor performance, the Board of Directors and the executive Committee use a number of financial and non-financial key performance indicators (KpIs). these KpIs are selected as being important to the success of the group in delivering its strategic objectives. progress is assessed by comparison with the group’s strategy, its budget for the year and against
historic performance. regional and business management use a range of further benchmarks and other KpIs as part of their planning and performance review processes. In order to measure the underlying performance of the business, management further analyse the headline KpIs to exclude the impact of acquisitions and foreign exchange.
the list of KpIs selected is reviewed and updated to ensure they remain important to the success of the group. Financial and non-financial performance is reviewed in more detail in the Corporate responsibility, review of operations and Financial review sections of this report.
StrAteGiC rePOrt 17
Financial KPisrevenue growth (3.8)% (4.9)% > Creating consistent long-term
value for shareholders. > Focus on higher growth
markets.
> revenue at constant currency increased 1.8% compared to last year and revenue was 3.8% higher in the second half than the first on a continuing and constant currency basis.
group underlying operating profit* margin
12.2% 11.3% > Creating consistent long-term value for shareholders.
> Focus on higher growth markets. > to have a culture of operational
excellence and cost-efficiency.
> Margins benefited from the real increase in revenue and also from the continued improvements in sales mix and operational improvements, together with good overheads management.
Free cash flow before acquisitions and dividends
£40.1m £37.4m > Creating consistent long-term value for shareholders.
> An improvement on prior year due to good overall cash management providing funding for acquisition and increased dividend payments.
return on operating Capital employed*
27.7% 27.5% > Creating consistent long-term value for shareholders.
> limited improvement made in roCe in the year – improved eBItA but asset base also increased due to capital investments and a working capital increase. A key area of focus for the future, as reflected by the fact that this is a key element of ltIp plans.
underlying earnings per share*
22.1p 21.5p > Creating consistent long-term value for shareholders.
> the 2.7% increase in underlying epS reflects the growth in earnings that the group has delivered, diluted in part by the increase in the weighted average number of shares.
Dividend per share 10.9p 10.5p > Creating consistent long-term value for shareholders.
> A 3.8% increase in the dividend is driven by the improved results and reflects management’s confidence in the business.
non-financial KPis†
employee turnover 13.8% 13.8% > to find, keep and develop the right people.
> reflects continued proactive management of both the cost and the skills base across the group.
lost time accident frequency (per 100,000 hours worked)^
0.53 0.46 > to have a culture of operational excellence and cost-efficiency.
> to find, keep and develop the right people.
> Increase due to a small number of sites which reported a disproportionate number of ltAs. good progress in north America and at many sites in Asia.
tonnes Co2e per £m revenue^
434 427 > to have a culture of operational excellence and cost-efficiency.
> Many sites worldwide improved performance but this was offset by production transfer, technology projects and commissioning projects resulting in an overall 1% increase in emissions intensity.
* Definitions of the measures can be found in the glossary of terms.† non-financial KpIs are at constant currency and updated to reflect changes in reporting methodology.^ lost time Accident Frequency and Co2e information have been subject to assurance by pwC, see page 30 for further details.
KpI 2014 2013 WHy A KpI? perForMAnCe CoMMentAry

Morgan aDVanCED MaTErIaLS annuaL rEporT 2014
rISK MAnAgeMent
the group has an established risk management methodology in place which seeks to identify, quantify, manage and mitigate both existing and emerging risks, together with a comprehensive internal control framework and appropriate monitoring and assurance processes, details of which are set out in the Corporate governance report on pages 49 to 57. the Board considers that this is fundamental to achieving the group aim of creating long-term sustainable shareholder value.
risks are identified ‘top down’ by the Board and ‘site up’ though the group’s businesses and are quantified by assessing their inherent impact and mitigated probability to ensure that the true potential impact of any risk and its likelihood of materialising are appreciated throughout the group. the day-to-day management of risk sits within the group’s internal control framework at the level of the
group where the impact would materialise, with the effectiveness of the controls and mitigating actions being monitored and assessed through a group-wide review process which considers the controls, monitoring and assurance framework around these risks. Senior members of the management team are responsible for the strategic management of the respective key risks, including related policy, guidelines and process.
During 2014, the Board/Audit Committee reviewed all risks with an inherent potential eBItA impact of above £5 million within a 12-month period and the controls, monitoring and assurance processes that are in place to mitigate those risks. As a result of this review, a number of actions were identified to improve controls and the mitigation of risk. For example, the review of both the ‘top down’ and ‘site up’ technology obsolescence
risks identified the need for further proactive management of the technology tail, ie those older technologies which are now becoming obsolete. the Board/Audit Committee annual review of key risks will continue into 2015 and beyond with a focus on developing a means of further leveraging the significant volume of information gathered as part of the risk Management process. Also in 2015, the group’s risk management methodology and related processes will be reviewed to ensure that they align with the requirements under the revised uK Corporate governance Code.
the following risks feature in the group’s key risk register and are those that the Board feels could have the most serious effect on achieving the group’s strategy of building a sustainable business for the long term and delivering strong returns to the group’s stakeholders.
18 StrAteGiC rePOrt
rISK MItIgAtIon
Strategy and strategic planning risks
Technology obsolescenceone of the group’s strategic priorities is that it aims to ‘be innovative, differentiated and high value-added’. this is fundamental to achieving the goal of continuing to be one of the world’s very best advanced materials companies.
unforeseen/unmitigated technology obsolescence, the loss of control of proprietary technology or the loss of intellectual property/know-how would impact the group’s business and its ability to deliver on its strategic goals.
the group has a Chief technical officer and a dedicated technology team which monitors technology and business developments. Specifically, the team has developed technology roadmaps for its major technology families to ensure it is at the leading edge of technology development, but also to understand emerging and competing technologies.
the technology team proactively manages the group’s technology pipeline and r&D investment in new/improving technologies and is also focusing on productive management of the technology tail. this technology pipeline is regularly reviewed by the group executive and the Board.
Where group products are designed for a specific customer, they are developed in tandem with the customer to maintain leading-edge differentiated solutions. the group seeks to secure Ip protection, where appropriate, for its existing and emerging portfolio of products; external advisers manage this protection globally.

oVe
rVIe
WSt
rAt
egIC
rep
ort
go
Vern
AnC
eFI
nAn
CIA
l St
AteM
entS
AnnuAl report 2014 MorgAn ADVAnCeD MAterIAlS
StrAteGiC rePOrt 19
rISK MItIgAtIon
Strategy and strategic planning risks continued
Recruiting, maintaining and motivating high-quality staffAnother of the group’s strategic priorities is to ‘find, keep and develop the right people’.
the advanced technological nature of the group requires people with highly differentiated skillsets. Any inability to recruit, retain and develop the right people would impact the group achieving its strategic goals.
Making Morgan a safe, fulfilling and rewarding group to work for is the primary means of engaging the workforce and managing this risk. the group has an Hr Director and a network of Hr professionals within the business who, along with policies and processes, support Morgan’s managers to mitigate the risks relating to its people. the Hr function covers areas including reward and recognition, health and safety, talent management, skills assessment and development, performance management and employee consultation.
A global employee survey was carried out in 2014, the results of which will inform further actions going forward.
In 2012 the group launched a graduate leadership programme which continued to run in 2014. the group also launched in 2014 a global leadership programme in conjunction with Cranfield university to develop Morgan’s high potential commercial leaders.
Further detail on people is set out on pages 31 to 33.
Operational risks
Treasury risks the group’s global nature means that it is exposed to uncertainties in the financial markets and the banking sector which heighten the group’s foreign exchange, interest rate, credit and liquidity risks as well as the risk of bank failure impacting the group’s cash.
the group’s treasury function, treasury policy and guidelines provide strict controls on the selection of banks and cash management. the treasury team proactively manages and is ultimately responsible for all of the group’s funding, liquidity, cash management, interest rate risk, foreign exchange risk and other treasury business.
Further detail on treasury policies is set out in the Financial review on page 45.
Quality of contracts As a global advanced materials business supplying into critical applications, our quality of contracts must match our quality of products. Ineffective contract risk management could result in significant liabilities for the group and damage customer relationships.
the group has an in-house legal function supplemented by external lawyers.
the group legal policy requires in-house legal review of high-value or high-risk contracts to ensure that the contracts contain the appropriate protection for the group. Ceo approval is required before any part of the business can enter into an unlimited liability contract or one where the liability cap exceeds £5 million. In 2014, the Ceo approved 10 contracts or tenders with this liability profile, where the underlying risks were considered to be within the group’s risk appetite.
Contract risk management training remains part of the responsible Business programme (rBp) and will continue to mitigate the risk of ineffective contract management.
to the extent that risk has not been managed out of the contractual process, the group has insurance cover approved by the Board, including product liability insurance.

Morgan aDVanCED MaTErIaLS annuaL rEporT 2014
20 StrAteGiC rePOrt
rISK MAnAgeMentcontinued
rISK MItIgAtIon
Operational risks continued
IT risks and cyber risksIn order to meet the group’s strategic objectives the viability of its underlying It infrastructure is essential. If a critical business system was to fail or the group lost critical data or information through inadequate data management or security of It systems, the business would be impacted.
the group has an It policy and guidelines in place as well as group and business It teams to manage the group’s infrastructure technology roadmap and It risks.
During the course of 2014 there has been continued focus on testing the global infrastructure, including elements of It auditing in the internal audit process, reviewing data management and developing the group’s business continuity plans in relation to It risk.
A number of infrastructure improvements have been made in 2014 to mitigate the likelihood of a successful cyber-attack.
Product quality, safety and liability products used in applications for which they were not intended or inadequate quality control systems/overcommitting on specifications could result in products not meeting specifications, which could lead to significant liabilities and reputational damage.
Many of the group’s products are designed to customer specifications. over 90% of the group’s manufacturing output is accredited to ISo 9001 and the group’s quality management systems and training help ensure that Morgan’s products meet or exceed customer requirements and national/international standards.
Contracts relating to products used in potential high-risk applications are subject to mandatory legal review.
While there were a number of minor product quality issues identified in 2014, these had no material impact.
the group insurance programme includes product liability insurance; this group-level insurance is reviewed annually by the Board.
Single-point exposures the group has a number of potential single point exposure risks, these include:
> Single-point supplier – a significant interruption of a key internal or external supply could impact business continuity.
> Single-point customer – the unmitigated loss of a major customer could have an impact on group profit.
> Single-point profit – a key site exposed to a strike, a natural catastrophe or serious incident, such as fire, could impact business continuity.
the group executive is responsible for monitoring and managing these single-point exposures.
local and regional management of these risks involves monitoring and reviewing supply chains (internal and external), dual/multiple sourcing of materials or strategic stock, fire protection systems, creating and testing business continuity plans, and maintaining product quality and customer relationships.
the group insurance programme includes business interruption cover; this group-level insurance is reviewed annually by the Board.
the Composites and Defence Systems business has seen a reduction in business from the MoD during 2014; in response to this, the business has put increased emphasis on its product/customer diversification strategy.
Environment, health and safety (EHS) risksthe group operates a number of manufacturing facilities around the globe. A failure in the group’s eHS procedures could lead to environmental damage or to injury or death of employees or third parties, with a consequential impact on operations and raising the risk of regulatory or legal action being taken against the group. Any such action could result in both financial damages and damage to reputation.
the group has a well-developed eHS programme managed by the eHS Director, with site-based eHS officers to implement and monitor eHS adherence at site level.
During 2014 the group launched a global behavioural safety programme ‘thinkSAFe’.
Further detail of the eHS programme in place to manage these risks is available on pages 25 to 30.

oVe
rVIe
WSt
rAt
egIC
rep
ort
go
Vern
AnC
eFI
nAn
CIA
l St
AteM
entS
StrAteGiC rePOrt 21
AnnuAl report 2014 MorgAn ADVAnCeD MAterIAlS
rISK MItIgAtIon
Compliance and ethics risks
Changes to or non-compliance with laws and regulationthe group’s global operations must comply with a range of national and international laws and regulations including those related to bribery and corruption, human rights, exports and competition/anti-trust.
A failure to comply with any applicable laws/regulations could result in civil or criminal liabilities, individual or corporate fines and could also result in debarment from government-related contracts and reputational damage.
the group is committed to the highest standards of corporate and individual behaviour and this commitment is set out in the group’s Core Values Statement and ethics policy.
Due to the potential magnitude of corporate fines, compliance risks are identified as some of the most significant risks for a number of reasons:
> Morgan’s historic breach of anti-trust laws creates a greater sensitivity to anti-trust risk and means that the group could be subject to the greater potential liabilities which attach to repeat offenders.
> the location of a number of Morgan businesses and customers means they are exposed to greater bribery risk.
> Morgan exports from the uS and is therefore subject to the stringent uS export laws.
the group’s responsible Business programme and the uS export Director address these areas of risk through policies, training/education and monitoring/assurance processes. Full information is available on pages 22 to 24.
external risks
Changing political, economic and social environmentthe group operates in a range of markets and geographies around the world and can be affected by political, economic, social or regulatory developments or instability such as Chinese asset bubbles or the geopolitical issues in the Middle east, russia and ukraine.
the group’s broad market/geographic spread helps to mitigate the effects of political and economic crises.
Key risks and events are regularly tracked at a business and group level, with contingency plans in place to manage changing situations.
Financial and treasury controls limit exposure to foreign currency, interest rate, credit and liquidity risk. Also, the group maintains a carefully managed debt facility to ensure that its debt ratio is within acceptable market tolerances.
Pension fundings
the group participates in defined benefit pension arrangements which are exposed to fluctuating interest rates, investment values and inflation. this coupled with the increased longevity of members could result in funding burdens on the group in the future.
Active management of the pension scheme assets is the primary means of mitigation. this comprises management both internally within the group but also externally through corporate actuaries and professional advisers.
this is not an exhaustive list and there are many factors that could change. For this reason, the fundamental concept underpinning the group’s approach to risk is that beyond the regular review and assessment of controls and mitigation of risk, each business is required to have an up-to-date and tested business continuity plan and to foster a culture of ‘risk-readiness’. the case study below demonstrates the effectiveness of planning but even more so the application of a culture of risk-readiness which includes looking to capitalise on the upside of situations/risks.
Case studyIn July 2014, our tulisa park, Johannesburg business was affected by a national strike of the Metal Workers’ union. this month-long strike was anticipated and the business’s priority was to put in place contingency plans to allow manufacturing to continue; importantly, the plan covered employees and any intimidation or violence that they might face if they broke the picket lines. the decision was taken to relocate critical manufacturing equipment and a number of our tulisa park employees to our Welkom carbon brush site (260km from tulisa park). Significant planning and preparation went into the short-term relocation and on 2 July, full production was initiated and continued for the duration of the strike. the employees were provided transport (including weekend trips home to their families) and accommodation throughout this time as well as a bonus of uS$100 each for their support and efforts. this plan provided the structure for immediate reaction, and the risk-readiness culture of management and local teams within the affected business resulted in the preservation of sales to the value of £500,000, limited downtime in production, no lost contracts, and enhanced customer relationships through the commitment of the Morgan South African team.

Morgan aDVanCED MaTErIaLS annuaL rEporT 2014
Morgan valuesthe Core Values Statement is the guiding principle for the group’s global approach to corporate responsibility. this underpins the group’s commitment to doing business in the right way; limiting the impact of its operations on the environment; protecting and developing its people; and supporting the communities in which the group works.
Morgan strategythis firm commitment to doing business in the right way is integral to the group in continuing to be one of the world’s very best advanced materials companies, where corporate responsibility is a differentiator. the group’s responsible Business programme (rBp), environment, Health and Safety (eHS) programme and the approach to Morgan’s people, support the aim of creating long-term sustainable shareholder value.
tone from the topthe Board is ultimately accountable for corporate responsibility and receives regular reports on eHS, the rBp and global talent management.
the senior management team recognises the need to lead by example. the Chief executive officer takes the lead on doing business the ‘right’ way, whilst, the Chief Financial officer is responsible for the group’s approach to eHS. they are supported by the regional executive teams and functional heads with specific responsibility for environment, health and safety, legal compliance and human resources. An example of this tone from the top in 2014 was the Asia and South American executive teams building additional compliance training into their regional meetings; this ‘pull’ from the executives rather than ‘push’ from function heads is a testament to the value perceived in doing business in the right way.
CorporAte reSponSIBIlIty
VAlueS, StrAtegy AnD tone FroM tHe top
CorporAte reSponSIBIlIty IS IntegrAl to tHe MorgAn group; It MeAnS A CoMMItMent to BeHAVIng WItH IntegrIty AnD HAVIng A poSItIVe IMpACt on ItS eMployeeS, ItS StAKeHolDerS AnD tHe CoMMunItIeS In WHICH tHe group WorKS.
“We tAKe prIDe In our Culture oF IntegrIty AnD DoIng BuSIneSS In tHe rIgHt WAy. It IS FunDAMentAl to eVerytHIng We Do AnD our relAtIonSHIpS WItH eACH oF our CuStoMerS, SupplIerS, JoInt Venture pArtnerS AnD repreSentAtIVeS.”
Kevin dAnGerFieldInterIM CHIeF exeCutIVe oFFICer & CHIeF FInAnCIAl oFFICer
22 StrAteGiC rePOrt

oVe
rVIe
WSt
rAt
egIC
rep
ort
go
Vern
AnC
eFI
nAn
CIA
l St
AteM
entS
AnnuAl report 2014 MorgAn ADVAnCeD MAterIAlS
doing business in the right waythe rBp is the group-wide ethics and compliance programme, launched in 2010, providing a policy/compliance framework underpinning the group’s commitment, and ensuring a common approach, to doing business in the right way.
the responsible Business Programme the core elements of the rBp are policies/guidance, training/education, compliance risk assessments, monitoring and assurance through certifications, internal audit and site compliance visits.
Policiesthe rBp policies are the ethics, Competition/Anti-trust, export and Donations and Sponsorships policies.
these and related manuals and guidelines are each available in 13 languages and oblige employees to operate in accordance with applicable laws and regulations, to obtain Ceo approval before trading in certain countries, including Iran, Syria and Sudan; and to comply with rules and internal reporting requirements relating to donations and sponsorship.
these policies also apply, to the extent appropriate, to Morgan’s business partners including agents, joint ventures and representatives. In particular, the responsible Business guide for representatives summarises the ethical principles the group requires its representatives to adhere to in order to act on behalf of the group.
All policies, manuals and guidelines are subject to annual review.
trainingraising awareness of and educating employees on the group compliance policies and the applicable laws and regulations is a fundamental part of the rBp. there are a number of challenges in delivering a programme of this nature across more than 50 countries, including language, culture and logistics.
Feedback is sought from all attendees to ensure that the programme develops year on year and is relevant to each region and its employees rather than being a ‘one size fits all’ approach.
Since 2010, annual training has included: > elearning modules for human rights,
anti-bribery and ethics, anti-trust and contract risk management; each of which requires a 100% test score in order to pass.
> ‘train the facilitator’ training of local managers and site-based compliance officers and subsequent cascaded site-level training.
> Site level training by the group rBp team at higher risk sites.
this has been further supplemented by the provision of rBp training in group induction processes. this was reinforced in 2014 with additional guidance for Hr teams globally to ensure that this is standard practice around the group.
risk assessmentAnnual compliance risk assessments across the group help to identify those businesses which have a higher risk of a compliance breach, often associated with high-risk territories. these high-risk businesses receive additional focus and support including further training, guidance and site visits. During 2014, certain of the group’s businesses in China, Mexico and russia received such support.
implementationHow are the policies cascaded?the rBp policies and procedures are mandated across the group and apply to all employees.
the group intranet, Morganet, is the primary means of making each of the policies, manuals and guidelines available to employees. It is acknowledged that not all employees can access Morganet, so hard copies are also made available locally.
education on the rBp policies is also built into each of the rBp elearning modules and all face-to-face materials.
How is the training given? In 2014, the fourth year of the programme, focus was given to reviewing the programme and building the group’s compliance strategy going forward. rather than holding global face-to-face ‘train the facilitator’ sessions, as has been done since 2010, webinars were used as an alternative means to cascade updated training to these now experienced facilitators. these facilitators subsequently cascaded this refresher training on anti-bribery and competition locally, with the materials made available to them in 13 different languages. ultimately this training was delivered to more than 2,000 employees.
Beyond this group-wide cascade, a number of the group’s businesses in China and South America requested additional, more localised training.
CorporAte reSponSIBIlIty
StrAteGiC rePOrt 23

Morgan aDVanCED MaTErIaLS annuaL rEporT 2014
Compliance visitsIn 2014 the rBp team made compliance visits to higher risk businesses in Mexico, russia, China, South Africa, Italy and the uS, meeting with local management to discuss and assess compliance practices, processes and issues. these visits are a means of monitoring and obtaining assurance on the efficacy of the rBp at business level and provide an opportunity to support the business through local training and face-to-face dialogue. throughout 2014, 14 compliance visits were carried out and many common issues were identified; these included recommendations for more regular third-party agent reviews and how to include the rBp in recruitment and induction processes. no substantive issues were identified.
Internal AuditInternal Audit monitors adherence to key rBp processes including completion of site-level training, induction processes, compliance with key elements of the rBp policies and the filing of reporting forms. Internal Audit also ensures that the availability of the ethics Hotline is adequately promoted at site level.
During 2014, Internal Audit identified a number of immaterial breaches in gifts and entertainment approval processes, particularly in Asia. Further focus and support continues to be given to some of the Asia businesses where culture and local practices present more of a challenge to doing business in line with the rBp. this will include additional compliance visits and tailored face-to-face training in 2015.
Ethics Hotlinethe ethics Hotline, operated by expolink, was in place throughout the year. It enables employees who are aware of, or suspect, misconduct, illegal activities, fraud, abuse of group assets or violations of any group policy to report these confidentially without fear of retribution should they feel they cannot use a local channel. the Hotline includes local free-phone numbers in each of the countries in which the group operates with real-time translators available as necessary.
What have the risk assessments shown?the group-wide bribery risk assessments run in 2013 and again in 2014 took into account a number of factors including: location of business, location of customers, the market sector and whether third-party agents were used. the results of these assessments created internal bribery risk rankings that were used to focus additional support, monitoring and training delivered in 2014 to a number of the group’s businesses including those in China and South America. these risk assessments also help to inform the compliance visit schedule for the group. this risk assessment process will be reviewed and refreshed in 2015 to encompass other compliance risks such as competition/anti-trust and export.
effectivenessAnnual certificationregional presidents and all functional heads are required on an annual basis to certify that the businesses/functions they are responsible for have implemented and complied in full with the rBp policies or, declared any exceptions. the Interim Ceo/CFo and Coo then certify to the Board on a group-wide basis.
this certification forms an integral part of the group’s system of internal controls. no material exceptions were declared in respect of 2014.
this is further supplemented by annual site-level certification, where relevant employees certify that they understand and are compliant with the rBp and related policies and manuals.
During 2014, the group also introduced a new compliance questionnaire which is aimed at formalising the group-wide reporting of operational and compliance issues on a monthly basis.
Issues raised through the ethics Hotline or via other channels are followed up by the regional president or the Company Secretary as appropriate. Further investigation may be conducted through the Audit Committee as required. Where appropriate, disciplinary action up to and including dismissal is taken and/or additional guidance and training provided.
During 2014, 31 reports were received via the Hotline in respect of 14 matters (compared with seven reports in 2013) from the uK, the uS, germany, Mexico and South Africa. each of the calls related to local human resource grievances and the style/behaviour of local management. the reports were relayed to the relevant regional president and were subject to investigation and further actions. no material issues were discovered.
the Audit Committee annually monitors and reviews the effectiveness of the Hotline and of the follow-up investigation processes by considering the number of calls, which countries they came from and the results of the investigations; for 2014 it was satisfied that the Hotline and investigation processes were operating effectively, but requested that a review and refresh of this Hotline is carried out in 2015.
The RBP going forwardDuring 2015, the group plans to further develop the rBp in a number of ways including:
> Introducing new elearning modules. > global face-to-face training of general
Managers, Compliance officers and executives; with subsequent cascade to site level. training in 2015 will focus on anti-bribery, competition (with particular focus on further education on management of vertical competition risk), export and contract risk management.
> Introduction of new compliance software to reinforce Adequate procedures and reduce the administrative burden on the business.
> Continued testing of the embedding of the programme through focused business compliance visits.
> Further development of third-party agent risk management.
CorporAte reSponSIBIlItycontinued
24 StrAteGiC rePOrt

AnnuAl report 2014 MorgAn ADVAnCeD MAterIAlS
StrAteGiC rePOrt 25
A key component of thinkSAFe is the installation of a ‘safety corner’ at each group facility. the safety corners are used to build a greater awareness of health and safety and provide an interactive focus for safety information.
As part of the development of the thinkSAFe programme, the group created and trialled an internal online reporting system for the capture of health and safety incident data on a global basis. the system captures incidents in real-time and notifies individuals by email when an incident is logged. the system also drives a detailed incident investigation process that will help further increase understanding of accident root causes thereby helping the group to reduce the occurrence of accidents and the resulting lost time. the first phase of the system, covering lost time accidents, went live on 1 January 2015.
the group is also committed to minimising the impact of its business on the environment and maximising the positive environmental benefits of its products. examples of Morgan’s products which help enhance the environment-related performance and efficiency of the products and operations of the group’s customers are included in pages 2 to 3 and 10 to 13 of this report.
this report includes a summary of the group’s eHS policy and its effectiveness as demonstrated through its eHS KpIs and training and other programmes. Further detail will be included in the 2014 eHS report to be published on the group’s website in May 2015. the eHS report will also include case studies to help demonstrate the group’s approach to eHS performance improvement.
under the Companies Act 2006 (Strategic report and Directors’ report) regulations 2013 the group is required to report its annual greenhouse gas emissions for the year in its Directors report. this information is shown on page 87 and includes the Co2e
> due to energy use which is further analysed in this section, as well as other sources of greenhouse gases.
2014 highlights > launched Morgan ‘thinkSAFe’, the
group’s safety performance improvement programme. this is a top down behaviour- based safety programme led by the Chief executive officer and the executive team designed to reduce work related accidents, illness and lost time. the programme was formally launched in Asia in the final quarter of 2014 and will be implemented throughout the group during 2015.
> Adopted a new set of Health and Safety core values which have been communicated and adopted group-wide.
> participated in the Carbon Disclosure project 2014 and, for the third consecutive year, was awarded a position in the Carbon Disclosure leadership Index, recognising the depth and quality of the climate change data disclosed by the group.
> Developed a group-wide online incident tracking system to cover health and safety incidents.
enVIronMent, HeAltH AnD SAFety
MorgAn ADVAnCeD MAterIAlS’ enVIronMent, HeAltH AnD SAFety (eHS) polICy AnD IMpleMentAtIon progrAMMeS Support tHe group’S FIVe StrAtegIC prIorItIeS AnD Core VAlueS StAteMent. eHS perForMAnCe HAS A DIreCt AnD SIgnIFICAnt eFFeCt on operAtIng perForMAnCe AnD IS tHereFore A Key FoCuS For rISK ASSeSSMent AnD operAtIonAl MAnAgeMent ACroSS tHe group.
Morgan Advanced Materials is committed to conducting all of its activities in a manner which achieves high standards of health and safety for employees and others affected by its operations. this commitment is continuous and on-going as part of which the group has adopted the following core health and safety values:
> We are committed to creating a culture and environment that is ‘zero harm’ with no related accidents or illness due to our activities.
> We will encourage and expect our employees and contractors to be passionate about safety.
> We are dedicated to creating a positive safety culture based on openness, transparency and responsibility.
> We support a safe working culture through investment and training.
> We will engage with our people to continuously improve safety knowledge, reporting and performance through our commitment to our thinkSAFe programme.
these values have been adopted group-wide and are available in 17 of the working languages used across the group.
> Co2e. Carbon Dioxide equivalent – the amount of Carbon Dioxide or the amount of non-Co2 greenhouse gas with the equivalent global warming potential.
oVe
rVIe
WSt
rAt
egIC
rep
ort
go
Vern
AnC
eFI
nAn
CIA
l St
AteM
entS

Morgan aDVanCED MaTErIaLS annuaL rEporT 2014
ehS PolicyMorgan’s eHS policy applies to all group businesses worldwide; it forms the basis for executive and management oversight and implementation and has been communicated across all sites within the group. the policy is published on the group’s website and in the annual eHS report.
ehS Policy implementationMorgan’s eHS governance procedures are centred on its eHS policy which forms the basis of the group’s eHS management systems and processes. the policy requires high standards of eHS management at all sites. this is implemented through performance monitoring, risk assessment and the management and mitigation of identified risks to help provide continuous improvement in eHS performance in support of the group’s strategic priorities.
the group is committed to providing effective leadership in pursuit of an injury-free and environmentally responsible work place and the Chief operating officer and the operational management team are responsible for eHS performance, with each site having a point of accountability. there are eHS leaders in each region, with an additional leader recruited for South America during the year. this global network of specialists reports to the regional management teams and is responsible for improving the standards of eHS management and performance in the group’s businesses.
As described below, the group commissioned external assurance on selected eHS data from pricewaterhouseCoopers llp (pwC).
Morgan’s group-level eHS management processes include:
> the eHS Compliance Audit programme, which is carried out by external eHS consultants in all regions world-wide. this programme reviews the eHS management at each site and helps ensure compliance with local regulations and good management practice. the eHS Compliance Audit programme also covers the eHS management systems and the eHS KpIs reported by each site. All of the group’s manufacturing facilities are reviewed on a three-year rolling cycle. Accordingly, 26 sites were audited during 2014. the audit reports are reviewed by the Director, environment, Health and Safety and by the regional presidents. Action items are tracked through a formal follow-up process.
> Formal training as an integral part of the implementation of the group’s eHS policy. this is undertaken at a regional level according to business-specific risks and opportunities, with group-level support and oversight.
> Monthly performance reporting against the group KpIs by all group sites. the data is subject to bi-annual review and challenge at group level with reporting of performance to the executive Committee and the Board by the Chief Financial officer.
taking site openings and closures into account, in 2014 environmental management systems were in place at 94 sites worldwide, including 42 sites certified to ISo 14001. Additional certifications were achieved at sites in China and Canada in 2014. these new certifications are in addition to the ongoing programme of re-certifications. Worldwide, 99 sites have health and safety management systems in place, with 17 sites certified to or working towards oHSAS 18001.
ehS Policy effectivenessMorgan Advanced Materials monitors the effectiveness of its eHS policy through the eHS Compliance Audit programme, the review of performance against a series of group-wide KpIs, its external assurance programme and by participating in a number of external initiatives as further described below.
the summary charts on pages 27 to 29 represent the group’s eHS performance, covering all production sites during the year.
environmental intensity KpIs are reported at constant currency and, where necessary, historic eHS data is updated to reflect changes in reporting methodology and to ensure year-on-year consistency.
In 2014 the independent external assurance performed by pwC covered the group’s lost time accident frequency rate, Co2e intensity, energy intensity, waste intensity, water intensity and waste recycling rate. the assurance report from pwC is set out on page 30.
the group participates in a number of external initiatives which help to benchmark policy effectiveness and progress. these include participation in the Carbon Disclosure project in respect of the group’s climate change and water-related strategies, risks, management and performance. In 2014, for the third consecutive year CDp awarded Morgan a position in the Climate Disclosure leadership Index. this performance reflects the depth and quality of climate change data the group has disclosed to investors and the global marketplace through CDp. the group also participated in the CDp Water programme in 2014.
Morgan Advanced Materials has made filings in respect of the group’s uK facilities under the uK government’s Carbon reduction Commitment (energy efficiency) scheme. the group also has plans in place to comply with the requirements of Article 8 of the european union’s energy efficiency Directive which will apply to certain of the group’s businesses in europe. In the uK this is being implemented by the energy Savings opportunity Scheme (‘eSoS’) introduced by the uK government’s Department of energy and Climate Change.
CorporAte reSponSIBIlItycontinued
26 StrAteGiC rePOrt

oVe
rVIe
WSt
rAt
egIC
rep
ort
go
Vern
AnC
eFI
nAn
CIA
l St
AteM
entS
AnnuAl report 2014 MorgAn ADVAnCeD MAterIAlS
StrAteGiC rePOrt 27
In absolute terms total Co2e emissions due to energy use in 2014 were some 400,300 tonnes, up by 4% from 386,500 tonnes in 2013 and 1% higher than the 394,500 tonnes reported for 2012. energy use was some 1,333 gWh, up by 3% from 1,295 gWh in 2013 and 1% up against the 1,319 gWh reported for 2012.
taking into account the decline in the group’s sales at constant currency since the baseline year of 2012, Co2e intensity was up by 2% compared with 2013 and by 5% compared with 2012. thus the group did not achieve its target to reduce the Co2e emissions intensity due to energy use by 5% over the two-year period 2012-14. 2014 energy intensity was up by 1% compared with 2013 and by 4% compared with 2012.
energy and Co2e intensity has been reduced since 2010 and the group continues to have a number of production improvement projects which include energy efficiency programmes. these are planned to help reduce energy intensity in 2015 and beyond.
environmental performanceAs reported above, the group is committed to environmental responsibility and works to minimise the impact of its business on the environment and to maximise the positive environmental benefit of its products.
Morgan Advanced Materials monitors the impact of its operations on the environment, as measured by its Scope 1 Co2e and Scope 2 Co2 emissions, energy, waste and water intensity per £million of revenue.
the group sets two-year targets for the improvement in these environmental metrics and the group’s 2014 performance is a report against the targets for the two-year period 2012-14. Further details of the group’s eHS targets and objectives will be included in the group’s 2014 eHS report, which will be published on the group’s website in May 2015.
the group did not achieve its environmental targets for the period 2012-14. these intensity targets and KpIs relate environmental impacts to revenue and although revenues at constant currency were up on 2013, they were down compared to 2012, the baseline year for the group’s intensity targets. Whilst many sites worldwide achieved or exceeded their individual environmental targets this was not sufficient for the group as a whole to meet its targets. Various factors contributed to this during 2014, including a number of production transfer, technology change and commissioning projects, which led to a reduction in production and environmental efficiency over the target period.
2014
2013
2012
2011
2010
400,300
CO2e> DUE TO ENERGY USE^*
Tonnes†
386,500
394,500
436,700
426,600
2014
2013
2012
2011
2010
434
CO2e> INTENSITY DUE TO ENERGY USE^*
Tonnes CO2e/£m revenue†
427
414
427
456
2014
2013
2012
2011
2010
1,333
ENERGY USE^‡
GWh†
1,295
1,319
1,439
1,397
2014
2013
2012
2011
2010
1,446
ENERGY INTENSITY ‡
MWh/£m revenue†
1,430
1,386
1,406
1,492
^ the 2011-2014 Co2e intensity, energy intensity, water intensity and the 2012-2014 waste intensity and waste recycling rate information has been subject to assurance by pwC. For further details of the assurance provided see the Independent Assurance report on page 30. Further details of the 2013, 2012 and 2011 assurance provided are included in the Independent Assurance reports on page 31 of the 2013 Annual report, page 25 of the 2012 Annual report and page 41 of the 2011 Annual report.
* Scope 1 Co2e emissions from fossil fuel usage and Scope 2 Co2 using country-specific electricity factors as Co2e factors are not consistently available for electricity use in all countries.
† Constant currency basis and updated to reflect changes in reporting methodology.‡ energy from all sources.> Co2e. Carbon Dioxide equivalent – the amount of Carbon Dioxide or the amount of non-Co2 greenhouse gas
with the equivalent global warming potential.

Morgan aDVanCED MaTErIaLS annuaL rEporT 2014
total waste reported in 2014 was 49,400 tonnes, up by 11% from 44,600 tonnes in 2013 and 1% higher than the 48,700 tonnes reported for 2012. Waste intensity was up by 9% compared with 2013 and by 5% compared with 2012. thus the group did not achieve its target to reduce waste intensity by 5% over the two-year period 2012-14. the increased level of waste reported in 2014 includes the impact of the production and technology change projects mentioned above and the one-off disposal of historic waste at sites in Italy, India and elsewhere.
the proportion of total waste which was recycled was 28% in 2014, down by 3 percentage points from 31% in 2013 and down by 6 percentage points from the 34% reported for 2012. the recycling rate achieved in 2012, and to a lesser extent in 2013, was enhanced by a number of one-off disposals of recyclable material, including surplus materials and equipment across a number of sites worldwide, much of which was recycled. thus the group did not achieve its target to increase the proportion of total waste which is recycled over the two years 2012-14.
CorporAte reSponSIBIlItycontinued
28 StrAteGiC rePOrt
2014
2013
2012
2011
2010
49,400
WASTE^§
Tonnes†
44,600
48,700
48,400
46,200
2014
2013
2012
2011
2010
54
WASTE INTENSITY^§
Tonnes waste/£m revenue†
49
51
47
49
total water use in 2014 was 2.50 million m3, up 10% from 2.27 million m3 in 2013 but down 1% from 2.52 million m3 in 2012. Water use intensity increased by 8% compared with 2013 and by 3% compared with 2012. this was behind the target to reduce water intensity by 5% over the two years 2012-14. Despite a significant reduction in the water intensity at key sites in the Asia/rest of World region, where water is a limited resource, this improvement was not sufficient to offset the increased intensity at a number of sites which were not operating at optimum efficiency and by other sites as new processes were commissioned and optimised. Water use and intensity has been reduced significantly since 2010 and the group will seek to achieve further improvements in 2015-16.
2014
2013
2012
2011
2010
2.50
WATER USE^>
million m3†
2.27
2.52
2.77
2.92
2014
2013
2012
2011
2010
2,713
WATER INTENSITY^>
m3/£m revenue†
2,509
2,642
2,711
3,119
^ the 2011-2014 Co2e intensity, energy intensity, water intensity and the 2012-2014 waste intensity and waste recycling rate information has been subject to assurance by pwC. For further details of the assurance provided see the Independent Assurance report on page 30. Further details of the 2013, 2012 and 2011 assurance provided are included in the Independent Assurance reports on page 31 of the 2013 Annual report, page 25 of the 2012 Annual report and page 41 of the 2011 Annual report.
† Constant currency basis and updated to reflect changes in reporting methodology.§ Hazardous and non-hazardous waste, including recycled material.> Water from all sources, including process, irrigation and sanitary use.
2014
2013
2012
2011
2010
49,400
WASTE^§
Tonnes†
44,600
48,700
48,400
46,200
2014
2013
2012
2011
2010
54
WASTE INTENSITY^§
Tonnes waste/£m revenue†
49
51
47
49
2014
2013
2012
2011
2010
2.50
WATER USE^>
million m3†
2.27
2.52
2.77
2.92
2014
2013
2012
2011
2010
2,713
WATER INTENSITY^>
m3/£m revenue†
2,509
2,642
2,711
3,119

oVe
rVIe
WSt
rAt
egIC
rep
ort
go
Vern
AnC
eFI
nAn
CIA
l St
AteM
entS
AnnuAl report 2014 MorgAn ADVAnCeD MAterIAlS
StrAteGiC rePOrt 29
health and safety performanceMorgan Advanced Materials is committed to adopting and implementing its new health and safety core values with the long-term aim of an injury-free workplace and to conducting all its activities in a manner which achieves high standards of health and safety for all employees and others affected by its operations. the group’s long-term objective is ‘zero harm’ and it seeks to achieve year-on-year improvements in performance as it progresses towards this objective.
the group’s health and safety policy statements are clear and communicated throughout the group and health and safety metrics receive a high degree of focus at all levels of the business. the policy statements are supported by site-level assessment and monitoring of risks.
In 2014 the group’s accident prevention and training programmes were ongoing, with the objective of reducing accident numbers and the time lost per lost time accident. particular focus is placed on those sites with below-average performance, as measured by their health and safety KpIs and through the eHS Compliance Audit programme.
the group’s health and safety KpIs include accident frequencies, causes and related lost working time. these are used to monitor the effectiveness of the group’s Health and Safety policies and related systems on a monthly basis. In 2014 the independent external assurance performed by pwC covered the group’s lost time Accident (‘ltA’) frequency rate.
the group’s 2014 health and safety performance was behind that achieved in 2013 and so the group did not achieve its objective of improving on the performance achieved in the prior year. the group has over 130 sites worldwide and overall the majority performed well with no lost time Accidents reported during the year. However, a small number of sites reported a disproportionate number of lost time Accidents in the year, resulting in the overall decline in performance. the group is already taking action to address performance issues at these sites.
In 2014 the group’s ltA frequency was up 16% at 0.53 per 100,000 hours worked (2013: 0.46). the number of lost time accidents reported was 110 (2013: 97).
reported lost time due to accidents and work-related illnesses as a percentage of working time increased from increased from 0.10% in 2013 to 0.12% in 2014. the number of days lost during 2014 was up by 19% and the number of hours worked decreased by 2%.
the reported average number of days lost per ltA reported in the year increased by 5%. this reflected a small number of longer-term cases at certain sites, whilst the majority of sites improved performance through an increased focus on the management of ltAs and lost time.
the inquest into the employee fatality which occurred in December 2012 at the group’s site in ruabon, uK returned a formal verdict of ‘accidental death’. the Company has been informed that Morgan technical Ceramics ltd will be subject to a prosecution by the uK Health and Safety executive in relation to this incident.
2014
2013
2012
2011
2010
110
LOST TIME ACCIDENTS^Number of LTAs*
97
114
132
124
2014
2013
2012
2011
2010
0.53
LOST TIME ACCIDENT FREQUENCY*^LTAs/100K hours worked*
0.46
0.52
0.58
0.58
2014
2013
2012
2011
2010
0.12%
HEALTH AND SAFETY-RELATED LOST TIME% of total working time
0.10%
0.12%
0.10%
0.11%
2014
2013
2012
2011
2010
28.6
LOST TIME PER LTA*†
Days per LTA*
27.3
27.8
21.0
23.7
* lost time Accident (‘ltA’): accident or work-related illness which results in one or more days’ lost time.
^ the 2013 and 2014 lost time Accident Frequency information has been subject to assurance by pwC. For further details of the assurance provided see the Independent Assurance report on page 30. Further details of the 2013 assurance provided are included in the Independent Assurance report on page 31 of the 2013 Annual report.
† total time lost due to health and safety in the year divided by the number of lost time accidents reported in the year.
2014
2013
2012
2011
2010
110
LOST TIME ACCIDENTS^Number of LTAs*
97
114
132
124
2014
2013
2012
2011
2010
0.53
LOST TIME ACCIDENT FREQUENCY*^LTAs/100K hours worked*
0.46
0.52
0.58
0.58
2014
2013
2012
2011
2010
0.12%
HEALTH AND SAFETY-RELATED LOST TIME% of total working time
0.10%
0.12%
0.10%
0.11%
2014
2013
2012
2011
2010
28.6
LOST TIME PER LTA*†
Days per LTA*
27.3
27.8
21.0
23.7

Morgan aDVanCED MaTErIaLS annuaL rEporT 2014
Understanding reporting and measurement methodologiesthe Selected Information needs to be read and understood together with the reporting Criteria, which Morgan is solely responsible for selecting and applying. the absence of a significant body of established practice on which to draw to evaluate and measure non-financial information allows for different, but acceptable, measurement techniques and can affect comparability between entities and over time. the reporting Criteria used for the reporting of the Selected Information are as at 31 December 2014.
work doneWe are required to plan and perform our work in order to consider the risk of material misstatement of the Selected Information. In doing so, we:
> Made enquiries of Morgan’s management, including those with responsibility for eHS management and group eHS reporting;
> evaluated the design of the key structures, systems, processes and controls for managing, recording and reporting the Selected Information. this included analysing 13 sites, and visiting six of these, selected on the basis of their inherent risk and materiality to the group, to understand the key processes and controls for reporting site performance data to the group eHS team;
> performed limited substantive testing on a selective basis of the Selected Information at corporate Head office and in relation to the same 13 sites noted above to assure that data had been appropriately measured, recorded, collated and reported; and
> Considered the disclosure and presentation of the Selected Information.
Morgan responsibilities the Directors of Morgan are responsible for:
> the identification and reporting of Morgan’s material environmental and health and safety impacts which are included in the Selected Information;
> Designing, implementing and maintaining internal controls over information relevant to the preparation of the Selected Information that is free from material misstatement, whether due to fraud or error;
> establishing objective reporting Criteria for preparing the Selected Information;
> Measuring and reporting the Selected Information based on the reporting Criteria; and
> the content of the Annual report 2014.
Our responsibilitiesWe are responsible for:
> planning and performing the engagement to obtain limited assurance about whether the Selected Information is free from material misstatement, whether due to fraud or error;
> Forming an independent conclusion, based on the procedures we have performed and the evidence we have obtained; and
> reporting our conclusion to the Directors of Morgan.
this report, including our conclusions, has been prepared solely for the Directors of Morgan as a body in accordance with the agreement between us, to assist the Directors in reporting Morgan’s eHS performance and activities. We permit this report to be disclosed in the Annual report for the year ended 31 December 2014, to enable the Directors to show they have addressed their governance responsibilities by obtaining an independent assurance report in connection with the Selected Information. to the fullest extent permitted by law, we do not accept or assume responsibility to anyone other than the Directors as a body and Morgan for our work or this report except where terms are expressly agreed between us in writing.
PricewaterhouseCoopers LLP Chartered Accountantslondon12 February 2015
1 the maintenance and integrity of Morgan’s website is the responsibility of the Directors; the work carried out by us does not involve consideration of these matters and, accordingly, we accept no responsibility for any changes that may have occurred to the reported Selected Information or reporting Criteria when presented on Morgan’s website.
2 We have complied with International Standard on Assurance engagements 3000 ‘Assurance engagements other than Audits or reviews of Historical Financial Information’ and, in respect of the greenhouse gas emissions, in accordance with International Standard on Assurance engagements 3410 ‘Assurance engagements on greenhouse gas Statements’, issued by the International Auditing and Assurance Standards Board.
3 A limited assurance engagement is substantially less in scope than a reasonable assurance engagement in relation to both the risk assessment procedures, including an understanding of internal control, and the procedures performed in response to the assessed risks.
4 We applied the Institute of Chartered Accountants in england and Wales (ICAeW) Code of ethics which includes independence and other requirements founded on fundamental principles of integrity, objectivity, professional competence and due care, confidentiality and professional behaviour. We apply International Standard on Quality Control (uK & Ireland) 1 and accordingly maintain a comprehensive system of quality control including documented policies and procedures regarding compliance with ethical requirements, professional standards and applicable legal and regulatory requirements.
Our conclusionBased on the procedures we have performed and the evidence we have obtained, nothing has come to our attention that causes us to believe that the Selected information for the year ended 31 december 2014 has not been prepared, in all material respects, in accordance with the reporting Criteria.
this conclusion is to be read in the context of what we say in the remainder of our report.
Selected informationthe scope of our work was limited to assurance over the selected environment, health and safety (eHS) data (the ‘Selected Information’) marked with the symbol ^ in the Morgan Annual report for the year ended 31 December 2014.
the Selected Information and the reporting Criteria against which it was assessed are summarised below. our assurance does not extend to information in respect of earlier periods or to any other information included in the Morgan Annual report for the year ended 31 December 2014.
> Co2e and Co2e intensity (scope 1 and scope 2 emissions due to energy use);
> energy use and energy intensity; > Water use and water intensity; > Waste and waste intensity; > recycling rate; and > number of lost time accidents and lost time
accident frequency rate.
We assessed the Selected Information using Morgan’s reporting Criteria as set out at: http://www.morganadvancedmaterials.com/responsible-business/environment-health-safety/1
Professional standards applied2 and level of assurance3 We performed a limited assurance engagement in accordance with ISAe 3000 and, in respect of greenhouse gas emissions information, ISAe 3410.
Our independence and Quality ControlWe applied the Institute of Chartered Accountants in england and Wales (ICAeW) Code of ethics and the International Standard on Quality Control (uK & Ireland) 14.
our work was carried out by an independent team with experience in sustainability reporting and assurance.
InDepenDent ASSurAnCe report
independent limited Assurance report to the directors of Morgan Advanced Materials plc.the Directors of Morgan Advanced Materials plc (‘Morgan’) engaged us to provide limited assurance on the information described below and set out in Morgan’s Annual report for the year ended 31 December 2014.
30 StrAteGiC rePOrt

oVe
rVIe
WSt
rAt
egIC
rep
ort
go
Vern
AnC
eFI
nAn
CIA
l St
AteM
entS
AnnuAl report 2014 MorgAn ADVAnCeD MAterIAlS
StrAteGiC rePOrt 31
CorporAte reSponSIBIlItycontinued
recruitmentMorgan Advanced Materials recognises the benefits of external recruitment as well as building its own internal pipeline of talented people. this year Morgan has continued to use formal assessments at more senior levels to strengthen selection decision-making and support induction plans. Whether recruiting internally or externally, selection is based on many factors including relevant education, work experience, competencies, potential, and performance record. the group does not unfairly discriminate and it respects human rights. Should existing employees become disabled, the group’s policy is to provide continuing employment and training wherever practicable.
the group has operated its current graduate programme model for a third successive year. graduates initially join our businesses in Asia, europe and north America and take part in a common development programme that builds current and future capability and gives access to international assignments and opportunities. the Chief executive and other members of the group executive personally take part in the development programmes.
the group continues to strengthen existing relationships with leading universities working in materials science, providing information, materials and opportunities for existing Morgan staff as well as undergraduate and postgraduate students. this includes a joint development agreement with the university of Manchester, aimed at scaling up a new process for manufacturing graphene.
training and developmentoverall training hours per employee have reduced by 6% to 13.1 hours per person. this is expected to increase in 2015, with some of the new initiatives described below. reasons for reduced overall training hours in 2014 include fewer new recruits, and therefore less induction training and the completion of specific training projects on It implementation training. While there has been a reduction of external training this has been due to a refocus of training needs and some now being done internally.
People Policies and their implementationthe group supports the universal Declaration of Human rights, and the group’s Human rights policy commits the group to protect the rights of everyone who works for it and all those who have dealings with it. the principles of the policy cover child labour, forced labour, health and safety, freedom of association, discrimination, discipline, working hours and compensation and the policy is published on the group’s website. Morgan Advanced Materials does not unfairly discriminate and respects human rights. our employee policies are set locally to comply with local law within the overall group framework. the Morgan Advanced Materials ethics Hotline enables employees who are aware of or suspect issues under the group’s Human rights policy to report these confidentially.
talentthe group has continued to develop its talent strategy during 2014 following the implementation of the one Morgan restructure of 2013. Further key appointments have been made in the new business leadership teams and new external appointments have been made in key group roles, including It and eH&S. organisation structures continued to be refined and developed during the year.
Morgan believes in developing its people to grow its business and make the group more competitive. the current business structure enables effective talent interventions through internal promotions, development opportunities and targeted recruitment. this includes the continued prioritisation of the group’s global graduate programme. the bi-annual succession and talent review process continues to ensure that succession for key roles is planned, and that future strategic and individual needs are assessed. talent development and acquisition is positioned to emphasise capability in business development, sales, technology innovation, and commercial leadership.
people
Morgan Advanced Materials has circa 9,000 employees, working across the globe in all major markets and regions. the group recognises that its people are critical to its success, employing a workforce with highly unique skills and abilities. Set out below are the group’s people policies, how they have been implemented, together with a review of their effectiveness.
2014
2013
2012
2011
2010
2.4
TOTAL LOST TIME% of working time
3.1
2.7
2.9
2.6
2014
2013
2012
2011
2010
13.8%
EMPLOYEE TURNOVER% per year
13.8%
13.4%
13.7%
13.7%
2014
2013
2012
2011
2010
13.1
TRAININGHours per employee
13.9
15.1
13.3
12.9

Morgan aDVanCED MaTErIaLS annuaL rEporT 2014
the group has maintained training in critical skills such as management, commercial, technical, and health and safety training. In 2014 the group launched a global leadership development programme in conjunction with Cranfield university’s executive Development Department. this is a strategically focused programme working to develop the future of Morgan’s commercial leaders, and reinforcing the effective use of Morgan business tools and techniques.
In early 2015, the group will launch its updated Advanced Development programme, which aims to accelerate the development of future general managers, technical leaders and heads of functions.
the regional businesses have also increased their focus on strategic development. For example, in Asia, two programmes have been launched – Ascend and Velocity – which aim to build the capability of their management and executive teams. regional training in commercial skills, such as sales, that began in 2014 will continue during 2015.
the thinkSAFe programme, which was launched at the end of 2014, is designed to improve employees’ understanding of behavioural safety, and enhance the group’s Health and Safety approach through a consistent global approach to training, engagement and behaviours. this will be a significant undertaking in 2015 with 2,000 managers being trained in addition to train-the-trainer sessions and workshops for operations staff in the year. this programme is covered in further detail in the environment, Health and Safety section on pages 25 to 30.
the responsible Business programme (rBp) is the group-wide ethics and compliance programme, launched in 2010, with the core elements of policies, training, risk assessments, monitoring and assurance. the training covers human rights, anti-bribery and ethics, anti-trust and contract risk management and is refreshed on an annual basis. this programme is covered in further detail on pages 22 to 24.
reward, recognition and awardsthe group recognises the accomplishments of its people individually and as teams, and makes awards to acknowledge achievement, loyalty, and innovation. In 2014, recognition awards continued to be made across local businesses.
the principle of pay for performance is applied to the group’s compensation approach and the Company sets compensation levels using external benchmarking and relevant
commercial considerations that are both competitive in the countries in which they operate and affordable. Morgan Advanced Materials offers short-term performance incentives globally to managers, technical and functional experts. group executives and Senior Management also have long-term incentives tied to personal and commercial performance. At plant level, most sites offer incentives to their workforce that result in payments based on meeting locally-set performance targets.
Morgan Advanced Materials regularly reviews bonus arrangements and benefits to ensure they encourage and reward commercial and personal performance. CommunicationFollow-up actions against Morgan’s 2013 employee Survey results took place throughout 2014. In particular the regional businesses aimed to improve communication, ensure supervisors more frequently recognise good work and employees received appropriate support to learn new skills.
Across the group, there have been increased employee briefings and forums covering business results, business strategy, business improvement, safety and employee survey follow-up. Videos, poster campaigns and newsletters have also continued to be a strong feature of communication activity in 2014. In particular, there has been an increase in visibility of wellbeing campaigns.
the 2014 survey was launched at the end of 2014, and the results will be reported in next year’s Annual report. Morgan Advanced Materials continues to have formal and informal consultative arrangements globally, according to local requirements and regulations. the 18th annual european employee Forum was held in May 2014, which was attended by site employee representatives from France, germany, Hungary, Italy and the united Kingdom.
People Policy effectivenessAt the end of the year, Morgan Advanced Materials employed circa 9,000 people. the group additionally contracted with circa 1,000 people on short-term arrangements to provide the flexibility for the group’s businesses to react quickly to changes in market conditions. the group’s employee turnover was 13.8% in 2014, excluding disposals (13.8% in 2013). 1.7% of the workforce was made redundant during the year (2.1% in 2013).
the group’s geographical spread of people is as follows:
Geographical spread2014 2013
uSA 29% 28%uK 14% 16%China 15% 16%other europe 19% 17%other n.A. 7% 7%South America 5% 4%roW 11% 12%
Breakdown of staff by gender – at 31 december 2014
total workforce 9,022
Male6,63474%
Female2,38826%
Senior Managers – 22
Male21
95%
Female1
5%directors – 9
Male8
89%
Female1
11%
lost time as a proportion of total working time decreased to 2.4% (3.1% in 2013), with lost time due to accidents in the workplace at 0.1% of total working time (0.1% in 2013).
During the year, 25 employees around the world celebrated 40 years of loyal service with Morgan Advanced Materials, with 283 employees celebrating anniversaries of 20, 25 or 30 years’ service. Additionally, 1 person celebrated 50 years’ service with Morgan. the group is pleased with the number of employees who remain with the group for significant periods of their careers, and whose experience the group has retained.
32 StrAteGiC rePOrt
CorporAte reSponSIBIlItycontinued

oVe
rVIe
WSt
rAt
egIC
rep
ort
go
Vern
AnC
eFI
nAn
CIA
l St
AteM
entS
AnnuAl report 2014 MorgAn ADVAnCeD MAterIAlS
StrAteGiC rePOrt 33
our graduates are employed across the world in real jobs which are designed to build on the technical skills they developed at university and expose them to the opportunities to learn and grow and also deliver real business outcomes. Morgan’s graduate leadership programme accepts talented individuals from a range of academic disciplines, meeting a minimum standard of qualification, with either undergraduate, postgraduate or doctorate qualifications. In the european business, in addition to the postgraduate programme, Morgan also has a programme for placement students who work with the business for a year during their degree, gaining valuable experience and insight into commercial applications of the technologies they are studying. Also, to further encourage future generations into science, technology, engineering and maths (SteM) subjects, our graduates go out to uK schools as part of our Morgan Ambassadors Scheme and talk to young students about the benefits of working in engineering and science roles.
grADuAte leADerSHIp progrAMMe
An AWArD-WInnIng grADuAte SCHeMe, proVIDIng reAl opportunItIeS For young tAlent WItHIn tHe group
Morgan Advanced Materials’ award-winning programmes are designed to turn driven and talented young professionals into future leaders within the business. We provide students and graduates with the opportunity to develop and implement new ideas and unleash their potential whilst also benefiting from the mentorship of experienced professionals.

Morgan aDVanCED MaTErIaLS annuaL rEporT 2014
Centres of excellencethere has been a growing recognition of the benefits of consolidating research and development efforts and this is reflected in the move towards global Materials Centres of excellence. the intent is that these Centres will be the acknowledged leader in the materials science and product development of the group’s key technologies, maintaining Morgan as one of the very best advanced materials companies in the world. regional management, who are closest to their customers, interact with the Centres to ensure that their efforts and focus retain a very strong commercial direction. the demand placed on the Centres is that they will provide differentiated materials technology that is scalable across the Morgan group and that delivers quantifiable benefits and value for the group’s customers.
the largest global Materials Centre of excellence is for the Insulating Fibre business and this is based in Bromborough in the uK. In 2014 the group announced the formation of a new Centre for Structural Ceramics that is based at the Stourport facility in the uK and will be operational in the early part of 2015.
the Insulating Fibre Centre is a state-of-the-art facility employing 25 dedicated scientists focused on the continued development of Morgan’s fibre product range. Morgan’s market-leading low bio-persistent Superwool® fibre technology and product range continued to be developed with patented materials science. the group is now extending the operational temperature range, allowing it to provide customers with superior insulation performance, improved fire protection and weight-saving opportunities in more applications. there has been particular success in areas such as off-shore platforms, liquid natural gas terminals and fire protection in tunnels.
reVIeW oF operAtIonS
reSeArCH AnD DeVelopMent
MiKe MUrrAyCHIeF teCHnology oFFICer
34 StrAteGiC rePOrt
the long-term profitable strength of Morgan Advanced Materials plc depends on constantly refreshing the innovation pipeline to anticipate, or respond to, market needs. the group’s research and development activities are headed and co-ordinated by the Chief technology officer, Dr Mike Murray, with research and development resource deployed across the globe. Whilst some of the regions or businesses may pursue local technology initiatives, the focus is primarily on those things that can be rolled out across the whole ‘one Morgan’ infrastructure and so the group is presenting the technology review in a single place rather than on the region-by-region basis of prior years.
the group’s research and development strategy is governed by three underlying principles:
> establishing global Material Centres of excellence to build critical mass and focused expertise in our core technologies.
> using technology as key promoter of one Morgan for the group’s largest or largest potential customers.
> Driving innovation and sales growth and targeting our chosen markets through our new Business Development pipeline (nBDp) tool.
the group’s commitment to technology is demonstrated by the group’s total research and development spend in 2014 of £21.7 million, representing 2.3% of sales, an increase of just over 11% compared with 2013 on a like-for-like basis.

oVe
rVIe
WSt
rAt
egIC
rep
ort
go
Vern
AnC
eFI
nAn
CIA
l St
AteM
entS
AnnuAl report 2014 MorgAn ADVAnCeD MAterIAlS
the Stourport Centre for Structural Ceramics will similarly oversee the major materials science developments for the group, allowing greater global leverage on major scalable programmes. the facility will focus on leading-edge ceramic materials developments to support both current and new markets. the initial focus will be on major opportunities that have been identified in the medical and aerospace sectors, whilst a focus on new emerging markets and technologies will ensure that Morgan Advanced Materials stays at the forefront of materials science. this will include enhancing the group’s network of global technology partners to ensure it is positioned to work with the world’s best academics and research institutes.
the group’s strategy is to continue to assess the value creation in the formation of more global Materials Centres of excellence that will support the opportunities the group is seeing from the technology roadmaps for the group’s materials technologies and products. these centres are being underpinned by the formation of a Morgan technology Advisory Board, that is made up of some the world’s leading academics, to help ensure the group maintains and develops its leading edge in new and emerging materials science around the globe.
Supporting the One Morgan approachthe group’s materials technology is a unifying feature across its regional structure and is a key promoter of the one Morgan ideal for both the group’s own organisation and for its customers. During 2014, many meetings have been held with the group’s major existing and potential customers, where the group’s senior commercial and technology management have successfully presented the group’s product and technology portfolio in a single, consistent way, allowing the full range of the group’s capabilities to be demonstrated. there has been excellent engagement from a number of these customers and this initiative has now effectively been built in to the way the group does business and is expected to bring further benefits in 2015 and beyond.
driving innovation and growththe group uses a consistent, systematic process for managing new business development across the whole one Morgan group. this approach allows the group to identify the largest and most profitable growth opportunities and allows decisions to be effectively made in terms of deployment of resource on those opportunities.
As part of the increasing focus on technology and innovation, the group has created a Morgan technical Advisory Board. the group identified world-leading academics from around the globe who are recognised as subject-matter experts for a number of Morgan’s key technology families. this will provide a sounding board for Morgan’s plans for technical development of ceramic, carbon and polymer composite products and processes and will keep Morgan Advanced Materials abreast of the latest developments in materials science and it will advise on new areas where there may be opportunities for the group.
Some of the specific areas of technology-led success in the group in 2014 are:
> the group’s braze alloys have led the world in their ability to join dissimilar materials together in a way that is not affected by extreme temperatures or chemical attack. this allows applications like deep-hole drilling for oil and gas exploration to work in harsher and more hostile environments, or applications in the aerospace sector to work at higher temperatures for greater engine efficiency. During 2014 the group successfully developed a new, groundbreaking capability of brazing carbon fibre, ceramics, composites or other engineered materials directly to a titanium honeycomb. this technique brings together the best qualities of both components, ensuring a final material that is strong, lightweight, and both impact- and heat-resistant. these material combinations are ideal for aerospace applications, especially on lifting surfaces such as wings or flaps and the rear sections of engines, where combined high strength and thermal transfer is critical.
> the group has further developed its electro ceramics products including its piezoelectric and microwave ceramics, high-voltage and rF capacitors. A piezoelectric material has special properties that allows it to measure changes in pressure, acceleration, strain or force by converting them to an electrical charge which can be measured. Morgan’s continual development has allowed the launch of a new range of piezoelectric composites. these are designed for higher resolution medical imaging, liquid and gas flow measurement and sonar that have improved acoustic performance for higher transmit-and-receive efficiency. Morgan’s materials continue to be developed to work in harsh environments, such as ultrasonic level sensors for the medical, oil and gas, pharmaceutical, aerospace and automotive environments. For the medical market, these materials have enabled a technically advanced range of medical sensors to be produced, enhancing the development of new drug delivery, dialysis, infusions and enteral feeding solutions.
> the group’s carbon-based technologies have led the world for over 150 years and the group is still at the forefront of materials science knowhow which is enabling new and emerging market sectors. For example, during 2014 Morgan successfully developed and launched a new set of electrical brush and slip ring designs and materials that are increasing power generation life and uptime in wind power. Morgan’s materials technology is specifically tailored to its operating environment offering maximised performance in harsh environments.
An exciting area identified that offers more medium-to longer-term opportunities is graphene materials. the group have successfully entered into a strategic collaboration with the nobel prize-winning team at the university of Manchester focused on developing potential new processes and end-market applications for graphene materials. this demonstrates the group’s continuing commitment to invest in cutting-edge technology and to ensure Morgan remains at the forefront of advanced materials science.
teCHnologICAl exCellenCe IS At tHe HeArt oF MorgAn’S ABIlIty to DelIVer WorlD-leADIng, InnoVAtIVe proDuCtS. We HAVe A roBuSt AnD groWIng progrAMMe oF InVeStMent In reSeArCH AnD DeVelopMent, AnD ContInue to Set ourSelVeS ApArt By FoCuSIng on HIgH perForMAnCe proDuCtS AnD enSurIng tHAt We HAVe tHe BeSt people.
StrAteGiC rePOrt 35

Morgan aDVanCED MaTErIaLS annuaL rEporT 2014
FootprintAs at 31 December 2014 the north America region comprises 23 operating sites employing approximately 3,200 people. the principal manufacturing sites are in the uSA, Canada and Mexico. the Mexican operations are used to satisfy both the local market and, more importantly and increasingly, as an effective low-cost point of supply to the uSA and to other Morgan businesses across the world. the region also has a comprehensive network of sales offices allowing immediate access to and facilitating direct working with end-users. Some sales, particularly for the insulating fibre and crucibles product ranges, are made through a well-established distributor network.
Performancerevenue for the north America region for the year was £353.1 million, representing a decrease of 1.9% compared with £359.9 million in 2013. At constant currency the year-on-year increase was 3.6%. revenue in the second half of 2014 was 2.9% higher than the first half at constant currency.
eBItA for the region was £52.5 million (2013: £55.5 million) with the margin maintained in the mid-teen range at 14.9% (2013: 15.4%).
HIgHlIgHtS > the thermal Ceramics, electrical Carbon
and Seals and Bearings businesses performed well, partially offset by a weaker performance in technical Ceramics, particularly from the ceramic cores business.
> region continues to deliver group-leading mid-teen margins.
Business descriptionFor Morgan Advanced Materials, the north America region comprises the uSA, Canada and Mexico. the financials of the north America region comprise those of all the businesses that are located within those countries, including the sales made directly to and profits from third party customers outside of the region. Sales made to Morgan companies outside of the region are not included in north America’s reported revenue but the profit made on these inter-regional sales are included in north America’s results.
the north America region offers the full Morgan product range and the vast majority of revenue is from products made within the region. north America has a number of important primary processing sites that provide Morgan businesses across the world with base materials, semi-finished and sometimes finished products, particularly in the electrical brush and seals and bearings businesses.
As shown in the chart to the left, north America serves all of the group’s chosen end-markets. of the three regions, it currently has the greatest proportion of revenue from the higher margin end-markets such as aerospace, included in transportation, and healthcare.
reVIeW oF operAtIonScontinued
nortH AMerICA
36 StrAteGiC rePOrt
2014
2013
353.1
REVENUE£m
359.9
2014
2013
52.5
REGIONAL EBITA*
£m
55.5
NORTH AMERICA2014 % OF REVENUE
Energy 5%Transportation 30%Security and Defence 6%Healthcare 8%Electronics 12%Petrochemical 8%Industrial 31%
* Definitions of the measures can be found in the Glossary of terms.

AnnuAl report 2014 MorgAn ADVAnCeD MAterIAlS
Business reviewthe technical Ceramics Business has had a weaker 2014 compared to 2013, impacted by a reduction in revenue at the Certech business that provides ceramic cores used in the manufacture of turbine blades for aerospace and industrial gas turbines. In addition the Certech business also had a range of operational and yield issues during 2014 with a reduction in profit compared to 2013 of £4.6 million at constant currency. these yield issues have improved through the latter part of the year but still require more work in 2015.
thermal Ceramics, electrical Carbon and Seals and Bearings all delivered good revenue and profit margin. the thermal Ceramics Business continued to perform well through the year in niche automotive applications, fire protection, general industrial markets and an increased level of activity from large project orders. this business has continued to expand the manufacturing capacity for Superwool® low bio-persistent fibre in 2014 as the region looks to continue the technology change to this highly differentiated material. In the electrical Carbon business, increased demand across a number of end-markets and continued market share gains were the key drivers for growth. petrochemical and water applications continued to be the main driver for growth in Seals and Bearings.
Priorities and outlookthe priorities of the north American region are to continue to deliver the real revenue growth it has achieved in 2014 and to further improve the current mid-teen profit margins. Margin-enhancing growth will be achieved through the continued focus on positive mix shift towards higher tech, secular growth markets, such as aerospace, healthcare, energy and emission control. Benefits are also expected from the impact of the ongoing roll-out of market-leading, differentiated technology, for example the Superwool® range of high-temperature insulating fibre products. the region will also continue its focus on operational improvements, including expanding the use of low-cost Mexican operations for the benefit of the whole group.
the order intake in north America has remained positive through the year and this provides a good base for further progress as the region enters 2015.
StrAteGiC rePOrt 37
oVe
rVIe
WSt
rAt
egIC
rep
ort
go
Vern
AnC
eFI
nAn
CIA
l St
AteM
entS

38 StrAteGiC rePOrt StrAteGiC rePOrt 39
Morgan aDVanCED MaTErIaLS annuaL rEporT 2014
EUROPE2014 % OF REVENUE
Energy 5%Transportation 13%Security and Defence 13%Healthcare 7%Electronics 2%Petrochemical 7%Industrial 53%
* Definitions of the measures can be found in the Glossary of terms.
FootprintAs at 31 December 2014 the europe region comprises 25 operating sites and employs a total of approximately 2,900 people. the principal manufacturing sites are in the uK, France, germany, luxembourg, Italy, Hungary and russia.
the region also has a number of sales offices providing regional coverage and customer proximity, allowing the region’s people to work directly with end-users. Some use is also made of well-established distribution networks.
Performancerevenue for the europe region for the year was £325.7 million, representing a decrease of 8.8% compared to 2013 (£357.3 million). At constant currency the year-on-year decrease was 5.5%. C&DS was the major contributor to this decline and like-for-like revenue, at constant currency and adjusting for the impact of acquisitions and exits, for the rest of european business was flat.
eBItA for the region decreased to £39.8 million (2013: £42.0 million), while the full-year margin continued to improve to 12.2% (2013: 11.8%), despite lower revenue.
HIgHlIgHtS > eBItA margins continued to improve
to 12.2% (2013: 11.8%) for the full year reflecting the improvements made in the cost base from restructuring actions.
> good progress on portfolio reshaping with acquisition of porextherm and effective exit of low-margin businesses.
Business descriptionFor Morgan, the europe region is defined as the uK, Continental europe and russia, but excludes turkey, which is reported in Asia/rest of World. the financials of europe comprise all of the Morgan Advanced Materials’ businesses that are located within the europe region. It includes the sales made directly to and profits from third-party customers outside the region. Sales made to Morgan companies outside the region are not included in europe’s reported revenue but the profit made on these inter-regional sales are included in europe’s results.
the europe region offers the full Morgan product range and the vast majority of revenue is from products made within the region. Certain specific grades of material and some finished products are sourced from the north America and Asia/rest of World regions.
As shown in the chart to the left, europe serves all of the group’s chosen end-markets. the region has a broad spread of end-market exposure. the security and defence revenue is primarily from the Composites and Defence Systems (‘C&DS’) business.
reVIeW oF operAtIonScontinued
38 StrAteGiC rePOrt
europe
2014
2013
325.7
REVENUE£m
357.3
2014
2013
39.8
REGIONAL EBITA*
£m
42.0

38 StrAteGiC rePOrt StrAteGiC rePOrt 39
AnnuAl report 2014 MorgAn ADVAnCeD MAterIAlS
oVe
rVIe
WSt
rAt
egIC
rep
ort
go
Vern
AnC
eFI
nAn
CIA
l St
AteM
entS
Business reviewthe electrical Carbon and Seals and Bearings businesses have shown growth year-on-year offset by a generally weaker period of trading for technical Ceramics and a flat trading period for the thermal Ceramics business. the electrical Carbon and Seals and Bearings businesses both delivered improved eBItA margins in 2014 compared to 2013 and this margin improvement should continue into 2015. the significant rationalisation of the carbon materials footprint that was announced in the second half of 2014 is progressing well and will deliver the benefits forecast for these carbon businesses. the charge for this in 2014 is £16.3 million, circa £7.1 million of which is cash, £2.0 million in 2014 and £5.1 million in 2015, for an annualised benefit of circa £3 million (circa £1 million of benefit in 2015).
the C&DS business has continued its strategy and major change programme of focusing on defence and commercial business outside of the traditional uK MoD contracts. During 2014 the business continued to win some MoD contracts but was unsuccessful in others. With the significant reduction in MoD business compared to recent years, the group has impaired £26.9 million of goodwill and intangible assets which represent the majority of these intangibles created and relating to the uK MoD as part of the purchase of C&DS during the years 2007 to 2012. the business continues to create new business both in the uK and internationally. over the next two years this business is expected to have annual revenue in the £30-40 million range.
In July 2014 the group purchased the porextherm business in germany for an enterprise value of €26.0 million. this microporous insulating business complements the group’s existing businesses and technology in an area of differentiated and highly demanding insulating products supplied into oil and gas, aerospace and industrial end-markets. the integration and development of the technology across the group has been very successful with its existing north American and Asian businesses benefiting from the additional technology and products in their regional markets.
In terms of portfolio management, in addition to the acquisition and integration of porextherm, the region has successfully exited the uK fired shapes business and the thermal Ceramics business in Wissembourg, France.
Priorities and outlookthe region has made further progress in terms of profit margins, despite the challenge of a very low growth macro-environment and on a like-for-like basis sales for the europe region, excluding Composites and Defence Systems, have been flat. the order intake in europe has been mixed through the year but overall marginally positive entering 2015. However, macro-conditions remain uncertain in europe generally and the region’s focus will remain on creating real growth opportunities based on the markets targeted and the pipeline of new business that has been developed in recent years. Delivery of the benefits from the rationalisation of the carbon materials footprint will also be an important area of focus in 2015.
StrAteGiC rePOrt 39

Morgan aDVanCED MaTErIaLS annuaL rEporT 2014
FootprintAs at 31 December 2014 the Asia/rest of World region comprises 24 operating sites employing 2,800 people. the principal manufacturing sites are located in China, India, South Korea, Australia, Japan, Brazil and Argentina. these manufacturing sites are supported by a network of sales and application engineers to ensure that customers are well supported across this large region with the appropriate Morgan resource. Where appropriate, use is also made of third-party distributors.
Performancerevenue for the Asia/rest of World region for the year was £242.9 million, representing an increase of 1.0% compared with £240.6 million in 2013. However on a continuing and constant currency basis the region delivered strong revenue growth of 13.0% compared with 2013, with all major geographies contributing to this.
eBItA for the region was £31.2 million (2013: £26.4 million), a margin of 12.8% (2013: 11.0%) a significant improvement over 2013.
HIgHlIgHtS > Delivered revenue growth of 13% on
like-for-like basis and margin increased 180 basis points to 12.8%.
> good portfolio management with exit of loss-making lithium ion business in China.
> Significant investment made in capability and capacity with new manufacturing facilities in China, Middle east and South Korea.
Business descriptionFor Morgan Advanced Materials, the Asia/rest of World region comprises Asia, Australasia, India, Africa, the Middle east, including turkey, and South America. the financials of the region comprise those of all the businesses that are located within those countries, including the sales made directly to and profits from third-party customers outside the region. Sales made to Morgan companies outside the region are not included in Asia/rest of World’s reported revenue but the profit made on these inter-regional sales are included in Asia/rest of World’s results.
the Asia/rest of World region offers the full Morgan product range. the region has significant manufacturing capability and capacity for insulating fibre, including Superwool®, and firebrick and some capacity for electrical brush material, however it does source a large amount of material, semi-finished and finished products from Morgan businesses in north America and europe, either finishing locally or selling finished products to end customers.
As shown in the chart to the left, the Asia/rest of World region serves all the group’s chosen end-markets. the majority of revenue in the region is currently from industrial markets, but there is a significant opportunity to drive a positive mix shift through increased sales to markets such as aerospace and healthcare.
reVIeW oF operAtIonScontinued
40 StrAteGiC rePOrt
ASIA/reSt oF WorlD
2014
2013
242.9
REVENUE£m
240.6
2014
2013
31.2
REGIONAL EBITA*
£m
26.4
ASIA/REST OF WORLD2014 % OF REVENUE
Energy 13%Transportation 15%Security and Defence 1%Healthcare 1%Electronics 3%Petrochemical 14%Industrial 53%
* Definitions of the measures can be found in the Glossary of terms.

AnnuAl report 2014 MorgAn ADVAnCeD MAterIAlS
Business reviewtrading across the region has been strong in 2014 with all major geographies showing improvement, including China, India, Korea and the Middle east. the major end-markets in this region – energy, transportation, including marine and aerospace, and general industrial and petrochemical – have all grown. good progress has been made in the growth of western-sourced, technical Ceramics products for markets such as medical and aerospace and this growth is set to increase further in 2015. An example of this increasing presence of the region’s technical Ceramics businesses in Asia is the agreement signed in December 2014 with yongda group, China to create a Morgan-majority 58:42 joint venture to manufacture ceramic cores used in the investment casting of turbine blades primarily for the Chinese market. new manufacturing facilities are being built in Abu Dhabi, South Korea and China, all for growth opportunities across the full range of product and technology offerings.
In terms of portfolio management, the region has successfully exited the Chinese lithium ion business.
Priorities and outlookthe order intake for the region has been positive through the year providing confidence in the outlook as it enters 2015. the recent and ongoing investment in capability and capacity in the region positions the business well to take advantage of the growth opportunities that exist. Furthermore, the business is well placed to satisfy the expected growth in demand in more advanced markets, such as healthcare and aerospace. Some early successes have been achieved, but the increased delivery of the group’s full product and technology portfolio to the growth countries of the world is a key priority for 2015 and beyond.
StrAteGiC rePOrt 41
oVe
rVIe
WSt
rAt
egIC
rep
ort
go
Vern
AnC
eFI
nAn
CIA
l St
AteM
entS

42 StrAteGiC rePOrt StrAteGiC rePOrt 43
Morgan aDVanCED MaTErIaLS annuaL rEporT 2014
introductionthese results are produced under International Financial reporting Standards as adopted by the eu (adopted IFrSs). All the figures referred to below are extracted from the Financial Statements on pages 93 to 154 and comply with adopted IFrSs.
reference is made to ‘underlying operating profit’* and ‘underlying earnings per share (epS)’. epS is defined in note 9 on page 110. these measures of earnings are shown because the Directors consider that they give a better indication of underlying performance.
In the consolidated income statement the group presents specific adjusting items totalling £51.9 million and the associated tax credit of £5.5 million separately. In the section below results are shown before these specific adjusting items.
Group revenue and operating profitgroup revenue was £921.7 million (2013: £957.8 million), a decrease of 3.8% on a reported basis compared with 2013.
group eBItA* was £118.0 million (2013: £119.0 million) representing a margin of 12.8% (2013: 12.4%).
group underlying operating profit* was £112.4 million (2013: £108.5 million). underlying operating profit margin was 12.2%, compared to 11.3% for 2013.
group operating profit (after specific adjusting items) was £54.3 million (2013: £89.6 million). operating profit margin was 5.9%, compared to 9.4% for 2013.
FInAnCIAl reVIeW
tHe group HAS DelIVereD reAl reVenue groWtH AnD InCreASeD operAtIng MArgInS, WItH MoMentuM In tHe SeConD HAlF oF tHe yeAr. CASH generAtIon HAS Been gooD, SupportIng tHe ContInueD InVeStMent In CApACIty AnD teCHnology AnD tHe ContInueD InCreASe In DIVIDenD.
Revenue EBITA EBITA margin
Results before specific adjusting items*2014
£m2013
£m2014
£m2013
£m 2014 2013
north America 353.1 359.9 52.5 55.5 14.9% 15.4%europe 325.7 357.3 39.8 42.0 12.2% 11.8%Asia/rest of World 242.9 240.6 31.2 26.4 12.8% 11.0%Regional EBITA* 921.7 957.8 123.5 123.9unallocated central costs* (5.5) (4.9)Group EBITA* 118.0 119.0 12.8% 12.4%restructuring costs and other one-off items* (5.6) (10.5)Group underlying operating profit* 112.4 108.5 12.2% 11.3%
* Definitions of the measures can be found in the glossary of terms.
Kevin dAnGerFieldInterIM CHIeF exeCutIVe oFFICer & CHIeF FInAnCIAl oFFICer

42 StrAteGiC rePOrt StrAteGiC rePOrt 43
AnnuAl report 2014 MorgAn ADVAnCeD MAterIAlS
oVe
rVIe
WSt
rAt
egIC
rep
ort
go
Vern
AnC
eFI
nAn
CIA
l St
AteM
entS
restructuring costs and other one-off itemsthe restructuring costs and other one-off items of £5.6 million (2013: £10.5 million) relate to a number of rationalisation actions mainly in Asia and europe. this includes the transfer of business to the group’s new greenfield high-temperature ceramics manufacturing site in Dalian, China and further costs incurred in Asia as a consequence of moving to the one Morgan model.
Specific adjusting itemsIn the consolidated income statement the group presents specific adjusting items totalling £51.9 million and the associated tax credit of £5.5 million separately. In the judgment of the Directors, due to the nature and value of these items they should be disclosed separately from the underlying results of the group to allow the reader to obtain a proper understanding of the financial information and the best indication of underlying performance of the group. In the financial review below results are shown before these specific adjusting items.
2014£m
2013£m
Specific adjusting itemsrestructuring costs 16.3 –Business exit costs 1.9 7.3transaction-related costs 1.2 –Settlement of prior period
anti-trust litigation 3.6 –Impairment of intangible
assets 26.9 3.3net loss on disposal
of business 2.0 2.351.9 12.9
Income tax credit from specific adjusting items (5.5) (1.8)
46.4 11.1
Restructuring costsAs part of the strategic objective to drive the performance of the electrical and Seals and Bearings businesses to mid-teen margins and beyond the group is undertaking a significant rationalisation of the carbon material footprint. Specifically, the cessation of carbon material manufacturing and a number of other finishing operations at the Swansea, uK site. these operations are being consolidated into other group locations, mainly the uSA and Hungary. this has resulted in a charge of £16.3 million in 2014, which is predominantly in respect of property-related provisions, redundancy costs and asset write-offs. there has been a cash outflow of £2.0 million in 2014 and a further £5.1 million is expected to be settled in cash in 2015. An income tax credit of £1.2 million has been recognised in respect of these items.
Business exit costsIn January 2015 the group completed the sale of a thermal Ceramics business in Wissembourg, France. this business manufactures low-temperature fibre boards used mainly in the building industry. the group has incurred a £1.9 million loss on disposal of this business and has booked an impairment charge in 2014 to reflect this. An income tax credit of £0.2 million has been recognised in respect of this item.
Transaction-related coststransaction-related costs consist of £0.6 million of adviser costs incurred in relation to dealing with the proposal made by Vesuvius plc to acquire the group, £0.4 million of legal and due diligence fees on the purchase of porextherm Dämmstoffe gmbH and £0.2 million of legal fees relating to the establishment of a new joint venture in China. An income tax credit of £0.1 million has been recognised in respect of these items.
Settlement of prior period anti-trust litigationDuring the year the group has fully and finally settled a number of the european Anti-trust actions relating to pre-2000 cartel activity and has a provision adequate to cover the remaining claim and the related legal fees. the net charge to the Income Statement in the year in relation to this is £3.6 million.
Impairment of intangible assetsAs a result of the continued reduction in demand on C&DS from uK MoD, the review of the carrying value of the intangible assets and goodwill of C&DS has resulted in an impairment charge of £26.9 million. Following this impairment charge, the carrying value of the C&DS intangibles and goodwill is £17.2 million. this is supported by the current expectations of the future trading performance of the C&DS business. An income tax credit of £2.1 million has been recognised in respect of the impairment charge.
Loss on disposal of businessthe net loss on disposal of £2.0 million is a result of the disposal of two businesses in the period:
a) uK Fired Shapes businesson 3 April 2014 the group sold its uK Fired Shapes business to Jemmtec limited (trading as Magma Ceramics) in exchange for a 35% shareholding in Jemmtec limited, a fired ceramics shapes business. the profit recognised on disposal of the business was £1.3 million. Assets disposed of consisted of £0.9 million of property, plant and equipment, £0.8 million of inventory and £0.2 million of goodwill. Based on the management structure of Jemmtec limited the group has determined that it does not have control of Jemmtec limited and is therefore accounting for its 35% shareholding in Jemmtec as an associate.
b) Morgan AM&t Hairong Co. ltdon 20 June 2014 the group disposed of the whole of the share capital of Morgan AM&t Hairong Co. ltd (‘Hairong’) for £0.3 million consideration. the loss recognised on disposal of this shareholding was £3.3 million. prior to the acquisition the immediate parent company of Hairong was Morgan AM&t (Shanghai) Co., ltd, in which the group holds a 70% shareholding. the adjustment to the non-controlling interest component of equity due to this transaction was £1.2 million. An income tax credit of £1.9 million has been recognised in respect of this item.

44 StrAteGiC rePOrt StrAteGiC rePOrt 45
Morgan aDVanCED MaTErIaLS annuaL rEporT 2014
Foreign currency impactthe principal exchange rates used in the translation of the results of overseas subsidiaries were as follows:
Average rate year-end rate2014 2013 2014 2013
uSD 1.6476 1.5646 1.5593 1.6563€ 1.2413 1.1780 1.2886 1.2020
the potential impact of changes in foreign exchange rates is given in note 19 on page 125.
Amortisation of intangible assetsthe group amortisation charge was £8.2 million (2013: £8.3 million).
Finance coststhe net finance charge was £20.8 million (2013: £23.3 million), comprising the net bank interest and similar charges of £15.8 million (2013: £17.0 million), gain from financial instruments of £0.7 million (2013: nil) and the finance charge under IAS 19 (revised), being the interest charge on pension scheme net liabilities, which was £5.7 million (2013: £6.3 million). the impact of potential changes in interest rates on profit or loss is stated in note 19 on page 124.
taxationthe group taxation charge, excluding specific adjusting items, was £24.7 million (2013: £21.1 million). the effective tax rate, excluding specific adjusting items, was 29.6% (2013: 27.4%).
earnings per shareunderlying earnings per share was 22.1 pence (2013: 21.5 pence), and basic earnings per share was 2.7 pence (2013: 14.8 pence). Details of these calculations can be found in note 9 on page 110.
dividendthe Board is recommending a final dividend, subject to shareholder approval, of 7.0 pence per share on the ordinary share capital of the group, payable on 29 May 2015 to ordinary shareholders on the register at the close of business on 8 May 2015. together with the interim dividend of 3.9 pence per share paid on 28 november 2014, this final dividend, if approved by shareholders, brings the total distribution for the year to 10.9 pence per share (2013: 10.5 pence).
A five-year summary of the group’s financial results is set out on page 155 of this report.
Cash flowthe cash flow from operations was £120.0 million (2013: £127.0 million). Free cash flow before acquisitions and dividends was £40.1 million (2013: £37.4 million). the exchange movement largely results from the fact that that group has mainly uS dollar debt.
net debt* at the year end was £207.0 million (2013: £186.5 million), representing a net debt* to eBItDA* ratio of 1.4 times (2013: 1.3 times).
the group refinanced its previous £150 million rCF with a new five-year, £200 million facility on 17 october 2014 with significantly reduced interest costs. With this refinancing and the repayment of uSD100 million of uS private placement debt in December 2014, the group’s net bank interest charge on a continuing organic basis at constant currency and at present interest rates is expected to be reduced by circa £3 million in 2015 compared to 2014. At 31 December 2014 the group had drawn down on £53.4 million of this £200 million facility.
2014£m
2013£m
Cash flow from operations* 120.0 127.0
net capital expenditure (32.5) (33.7)restructuring costs and other
one-off items (12.1) (14.0)net interest paid (15.3) (17.0)tax paid (20.0) (24.9)Free cash flow
before acquisitions and dividends 40.1 37.4
Cash flows in respect of (acquisitions)/disposals (22.4) 1.7
purchase of own shares for share incentive schemes (30.2) (6.6)
Dividends paid (2.3) (24.7)exchange movement and
other items (5.7) (1.5)Movement in net debt*
in period (20.5) 6.3opening net debt (186.5) (192.8)Closing net debt (207.0) (186.5)
* Definitions of the measures can be found in the glossary of terms.
Commitments for property, plant and equipment and computer software for which no provision has been made are set out in note 24 on page 143.
Capital structureAt the year end total equity was £187.7 million (2013: £274.1 million) with closing net debt of £207.0 million (2013: £186.5 million).
non-current assets were £526.0 million (2013: £527.1 million) and total assets were £920.0 million (2013: £911.9 million).
Details of undiscounted contracted maturities of financial liabilities and capital management are set out in note 19 on page 123.
As noted above, on 30 January 2015 the group completed the sale of its thermal Ceramics business in Wissembourg, France. this business manufactures low-temperature fibre boards used mainly in the building industry. At the year end the assets and liabilities of the business were classified as ‘held for sale’ and the 2014 income statement included a charge of £1.9 million in respect of the loss on the sale of this business.
there have been no other significant post-balance sheet events.
Capital structure is further discussed in note 19 on page 126 under the heading Capital management.
Pensionsthe group operates a number of pension schemes throughout the world, the majority of which are of a funded defined benefit type. the largest of these are located in the uK and the uSA with the majority of others in Continental europe.
the IAS 19 (revised) Employee Benefits charges are summarised in the table below.
FY2014
£m
Fy2013
£m
operating costs:– Service cost (4.2) (4.5)– Administration costs (1.7) (1.4)Total operating costs (5.9) (5.9)Net finance charge (5.7) (6.3)Total IAS 19 charge (11.6) (12.2)
the group pension deficit has increased by £67.2 million since last year end to £211.8 million on an IAS 19 (revised) basis. the main movement was in the uK defined benefit pension schemes. the uK defined benefit pension schemes deficit increased by £43.8 million to £118.8 million (2013: £75.0 million) and the uS deficit increased by £19.5 million to £58.8 million (2013: £39.3 million). these increases were primarily due to lower discount rates, with the uK moving from 4.5% pa to 3.6% pa and the uS moving from 5.0% pa to 4.1% pa during 2014.
FInAnCIAl reVIeWcontinued

44 StrAteGiC rePOrt StrAteGiC rePOrt 45
AnnuAl report 2014 MorgAn ADVAnCeD MAterIAlS
oVe
rVIe
WSt
rAt
egIC
rep
ort
go
Vern
AnC
eFI
nAn
CIA
l St
AteM
entS
treasury policiesthe following policies were implemented and in place across the group throughout the year. the manager of each business unit is required to confirm compliance as part of the year end process.
Financial Risk Management and Treasury Policygroup treasury works within a framework of policies and procedures approved by the Audit Committee. It acts as a service to Morgan Advanced Materials’ businesses, not as a profit centre, and manages and controls risk in the treasury environment through the establishment of such procedures. group treasury seeks to align treasury goals, objectives and philosophy to those of the group. It is responsible for all of the group’s funding, liquidity, cash management, interest rate risk, foreign exchange risk and other treasury business. As part of the policies and procedures, there is strict control over the use of financial instruments to hedge foreign currencies and interest rates. Speculative trading in derivatives and other financial instruments is not permitted.
Foreign exchange risksDue to the international reach of the group, currency transaction exposures exist. the group has a policy in place to hedge all material firm commitments and highly probable forecast foreign currency exposures, and achieves this through the use of the forward foreign exchange markets. the group continues its practice of not hedging income statement translation exposure.
there are exchange control restrictions which affect the ability of a small number of the group’s subsidiaries to transfer funds to the group. the group does not believe such restrictions have had or will have any material adverse impact on the group as a whole or the ability of the group to meet its cash flow requirements.
Currency translation risks are controlled centrally. to defend against the impact of a permanent reduction in the value of its overseas net assets through currency depreciation, the group seeks to match the currency of financial liabilities with the currency in which the net assets are denominated. this is achieved by raising funds in different currencies and through the use of hedging instruments such as swaps, and is implemented only to the extent that the group’s gearing covenant under the terms of its loan documents, as well as its facility headroom, are likely to remain comfortably within limits. In this way, the structure of the group’s borrowings becomes more aligned to the trading cash flows that service them.
Interest rate riskthe group seeks to reduce the volatility in its interest charge caused by rate fluctuations. this is achieved through a combination of fixed rate debt and interest rate swaps. the proportions of fixed and floating rate debt are determined having regard to a number of factors, including prevailing market conditions, interest rate cycle, the group’s interest cover and leverage position and any perceived correlation between business performance and rates.
Credit riskCredit risk arises when a counterparty fails to perform its obligations. the group is exposed to credit risk on financial instruments such as liquid assets, derivative assets and trade receivables. Credit risk is managed by investing liquid assets and acquiring derivatives in a diversified way from high-credit-quality financial institutions. Counterparties are reviewed through the use of rating agencies, systemic risk considerations, and through regular review of the financial press. the group has a Credit policy in place in relation to trade receivables and exposure to credit risk is monitored on an ongoing basis. Credit evaluations are performed on all customers requiring credit over a certain amount. the nature of the group’s operations is such that the group has a significant number of low-value trade receivables. the risk is therefore considered minimal. Credit risk is further discussed in note 19 on pages 121 to 122.
Capital investmentthe group has well-established formal procedures for the approval of investment in new businesses and for capital expenditure to ensure appropriate senior management review and sign-off.
Tax risksthe group periodically assesses its liabilities and contingencies for all tax years open to audit based upon the latest information available. the group recorded its best estimate of these tax liabilities, including related interest charges. Inherent uncertainties exist in estimates of tax contingencies due to changes in tax laws. Whilst management believes it has adequately provided for the probable outcome of these matters, future results may include favourable or unfavourable adjustments to these estimated tax liabilities in the period the assessments are made, or resolved, or when the statute of limitation lapses. the final outcome of tax examinations may result in a materially different outcome than assumed in the tax liabilities.
Borrowing facilities and liquidityAll of the group’s borrowing facilities are arranged by group treasury and the funds raised are then lent to operating subsidiaries on an arm’s-length basis. In a few cases operating subsidiaries have external borrowings but these are supervised and controlled centrally. group treasury seeks to obtain certainty of access to funding in the amounts, diversity of maturities and diversity of counterparties as required to support the group’s medium-term financing requirements and to minimise the impact of poor credit market conditions.
the group’s debt and maturity profile is provided in notes 18 and 19 on pages 120 to 128.
Going concernthe group’s business activities, together with the factors likely to affect its future development, performance and position are set out in the Strategic report on pages 8 to 45. the financial position of the group, its cash flows, liquidity position and borrowing facilities, are described earlier in this Financial review. In addition, note 19 includes the group’s policies and processes for managing financial risk; details of its financial instruments and hedging activities; and its exposures to credit risk and liquidity risk.
the group meets its day-to-day working capital requirements through local banking arrangements underpinned by the group’s new £200 million unsecured multi-currency revolving credit facility maturing october 2019. the group’s forecasts and projections, taking account of reasonably possible changes in trading performance and exchange rates, show the group operating comfortably within its debt financial covenants for the next 12 months.
the current economic climate continues to have an impact on the group, its customers and suppliers. the Board fully recognises the challenges that lie ahead but, after making enquiries, the Directors have a reasonable expectation that the Company and the group have adequate resources to continue in operational existence for the foreseeable future. Accordingly, they continue to adopt the going concern basis in preparing the Annual report and Accounts.
Kevin dAnGerFieldInterIM CHIeF exeCutIVe oFFICer & CHIeF FInAnCIAl oFFICer
the Strategic report, as set out on pages 8 to 45, has been approved by the Board.on behalf of the Board
PAUl BOUltOnCoMpAny SeCretAry & generAl CounSel12 February 2015

46 GOvernAnCe GOvernAnCe 47
Morgan aDVanCED MaTErIaLS annuaL rEporT 2014
Andrew ShilStOnCHAIrMAn
dOUGlAS CASter CBeSenIor InDepenDent DIreCtor (AgeD 61)Appointed: February 2014.Career history: Bringing to the Board broad experience as an electronics systems engineer and company director, Douglas started his career with the racal electronics group in 1975, before moving to Schlumberger in 1986 and then to Dowty as engineering Director of Sonar & Communication Systems in 1988. In 1992, he became Managing Director of that business and, after participating in the management buy-out that formed ultra electronics, joined the Board in october 1993. In April 2000, he became Managing Director of ultra’s Information & power Systems division. In April 2004 he was appointed Chief operating officer and became Chief executive in April 2005. He was appointed deputy Chairman in April 2010 and became Chairman of ultra in April 2011. Additional appointments: Chairman of ultra electronics Holdings plc and Chairman of Metalysis limited.Committees: Audit, nomination and remuneration (Chair).
Andrew ShilStOnnon-exeCutIVe CHAIrMAn (AgeD 59)Appointed: May 2012 (Chairman Designate; August 2012, Chairman).Career history: Having joined rolls-royce Holdings plc in 2002, Andrew was Finance Director from 2003 until his retirement in 2011 and prior to this he was the Finance Director at enterprise oil plc. Andrew was previously a non-executive Director of Cairn energy plc, where he chaired the Audit Committee. Additional appointments: Senior Independent Director of Bp p.l.c.; non-executive Director of Circle Holdings plc.Committees: nomination (Chair) and remuneration.
Kevin dAnGerFieldInterIM CHIeF exeCutIVe oFFICer & CHIeF FInAnCIAl oFFICer (AgeD 48)Appointed: August 2006.Career history: Kevin joined Morgan Advanced Materials in July 2000 as Deputy group Financial Controller before being promoted to group Financial Controller. He was appointed to the Board on becoming Chief Financial officer in August 2006. Following the departure of Mark robertshaw, Kevin was appointed Interim Chief executive officer from January 2015. Before joining Morgan Advanced Materials, Kevin worked for london International group plc and Virgin retail europe limited. He qualified as a chartered accountant with pricewaterhouseCoopers.Additional appointments: non-executive Director of e2v technologies plc.
Andrew hOStyCHIeF operAtIng oFFICer (AgeD 50)Appointed: July 2010.Career history: prior to his appointment as Chief operating officer in February 2013, Andrew was Chief executive officer of Morgan Ceramics and joined the Board in July 2010. Before this appointment he held a number of senior positions within Morgan Advanced Materials. Andrew was a non-executive Director of Fiberweb plc from 2012 to 2013 and president of the British Ceramics Confederation from 2003 to 2005.Additional appointments: non-executive Director of Consort Medical plc and non-executive Director of British Ceramic research limited.
BoArD oF DIreCtorS
Andrew hOStyCHIeF operAtIng oFFICer
dOUGlAS CASterSenIor InDepenDent DIreCtor
Kevin dAnGerFieldInterIM Ceo & CFo

46 GOvernAnCe GOvernAnCe 47
AnnuAl report 2014 MorgAn ADVAnCeD MAterIAlS
oVe
rVIe
WSt
rAt
egIC
rep
ort
go
Vern
AnC
eFI
nAn
CIA
l St
AteM
entS
viCtOire de MArGerienon-exeCutIVe DIreCtor (AgeD 51)Appointed: May 2012.Career history: Victoire previously held non-executive positions at Ciments Français, norskHydro, outokumpu and Ipsos, and was a professor of Strategic Management at grenoble graduateSchool of Business. During her executive career she held senior management positions in germany, France and the uSA with Arkema, CarnaudMetalbox and péchiney. Victoire holds a phD in Strategic Management from université panthéon-Assas (paris II).Additional appointments: Chairperson of rondol Industrie SAS; Chairperson of the MaterialsCommittee, French Waste recycling Scheme; non-executive Director of Arkema; non-executiveDirector of eurazéo; non-executive Director of Italcementi group.Committees: Audit, nomination and remuneration.
Andrew reynOldS SMithnon-exeCutIVe DIreCtor (AgeD 48)Appointed: May 2013.Career history: Andrew joined gKn in 2002 and has held a number of senior positions across gKn’s Driveline, powder Metallurgy and off Highway businesses. prior to gKn, he held various general management and functional positions at Ingersoll rand, Siebe plc. (now Invensys plc.) and Delphi Automotive Systems. Andrew is a former Chairman of the CBI Manufacturing Council and a former member of the Ministerial Advisory group for Manufacturing.Additional appointments: Chief executive of Automotive and powder Metallurgy and an executive director of gKn plc; Vice president of ClepA (the european Association of Automotive Suppliers).Committees: Audit, nomination and remuneration.
rOB rOwleynon-exeCutIVe DIreCtor (AgeD 65)Appointed: February 2014.Career history: rob joined reuters in 1978 where he held various senior management positions, including Finance Director from 1990 to 2000. He retired as a director of reuters group plc inDecember 2001. rob was previously Deputy Chairman of Cable & Wireless plc, and a non-executive Director of Intu properties plc from 2004 to 2013, prudential plc and taylor nelson Sofres plc.Additional appointments: non-executive Director, Chairman of the Audit Committee and SeniorIndependent Director of taylor Wimpey plc; non-executive Director and Chairman of the AuditCommittee of Moneysupermarket.com group plC; non-executive Director of greene King plc.Committees: Audit (Chair), nomination and remuneration.
viCtOire de MArGerienon-exeCutIVe DIreCtor
Andrew reynOldS SMithnon-exeCutIVe DIreCtor
rOB rOwleynon-exeCutIVe DIreCtor

48 GOvernAnCe GOvernAnCe 49
Morgan aDVanCED MaTErIaLS annuaL rEporT 2014
Keith PArKerMArKetIng DIreCtor (AgeD 58)Appointed: February 2014.Career history: prior to his appointment as Marketing Director, Keith was the Marketing Director of Morgan Ceramics. He originally joined Morgan Advanced Materials in 1978 and before focusing on Marketing, held a number of senior positions in sales and general management in the technical Ceramics business. Keith is a member of lucideon CICS Advisory Board.
Andrew rileyDIreCtor oF FInAnCe (AgeD 47)Appointed: February 2014.Career history: Andrew qualified as a chartered accountant with Deloitte and came to MorganAdvanced Materials on secondment from pricewaterhouseCoopers in 1998, joining the group Financial planning department and working on a range of acquisitions. Andrew joined Morgan Advanced Materials in January 2000 and has since worked in a variety of finance roles in head office and in the operations across most of the Morgan Advanced Materials businesses. prior to his current role Andrew was Finance Director of the engineered Materials division from 2004 to 2010.
Kevin dAnGerFieldInterIM CHIeF exeCutIVe oFFICer & CHIeF FInAnCIAl oFFICer
Andrew hOStyCHIeF operAtIng oFFICer
PAUl BOUltOnCoMpAny SeCretAry & generAl CounSel (AgeD 47) Appointed: January 2007. Career history: paul joined Morgan Advanced Materials plc in July 2004 as general Counsel and Deputy Company Secretary before becoming Company Secretary in 2007. prior to joining Morgan Advanced Materials, paul spent nine years with IMI plc, his last role being Deputy Company Secretary and Senior legal Adviser. paul is a qualified solicitor.
Peter BlAUStengroup HuMAn reSourCeS DIreCtor (AgeD 55)Appointed: March 2011.Career history: prior to joining Morgan Advanced Materials, peter advised on private equity acquisitions and international leadership programmes as an independent consultant. He was formerly group Hr Director of BAA plc and held senior roles with Charles Schwab & Co, British Airways, and Ford Motor Co. He served as a member of the CBI employment policy Committee and was appointed a Commissioner for the uK Civil Service in 2010.
SiMOn hAllidAyDIreCtor oF StrAtegIC progrAMMeS (AgeD 51)Appointed: February 2014.Career history: Simon qualified as a Chartered Accountant with price Waterhouse. Before joining Morgan Advanced Materials he worked in venture capital, specialising in healthcare investments. He has over 20 years of experience with the Company in M&A and finance roles, including as CFo of the Morgan Ceramics global division from 2010 to 2013. During 2013 he directed the project to implement the one Morgan organisational structure and business model, before taking up his current strategy post in 2014.
MiKe MUrrAyCHIeF teCHnology oFFICer (AgeD 44)Appointed: February 2014.Career history: prior to his appointment as Chief technology officer, Mike held a number of seniorpositions within Morgan Advanced Materials across the ceramics, carbon and composites-basedtechnologies. Mike represents Morgan Advanced Materials as a member of a number of materialsadvisory boards to the uK technology Strategy Board and peer strategy reviews of the engineeringand physical Sciences research Council.
exeCutIVe CoMMIttee
PAUl BOUltOnCoMpAny SeCretAry & generAl CounSel
Peter BlAUStengroup HuMAn reSourCeS DIreCtor
MiKe MUrrAyCHIeF teCHnology oFFICer
Andrew rileyDIreCtor oF FInAnCe
SiMOn hAllidAyDIreCtor oF StrAtegIC progrAMMeS
Keith PArKerMArKetIng DIreCtor

48 GOvernAnCe GOvernAnCe 49
AnnuAl report 2014 MorgAn ADVAnCeD MAterIAlS
oVe
rVIe
WSt
rAt
egIC
rep
ort
go
Vern
AnC
eFI
nAn
CIA
l St
AteM
entS
CorporAte goVernAnCe
CHAIrMAn’S letter to SHAreHolDerS
dear ShareholderAs Chairman, I am pleased to comment on some of the significant governance matters that the Board has approved, discussed or overseen during the year as follows:
> Appointment and induction of Douglas Caster and rob rowley who were appointed as non-executive Directors in February 2014 to replace Simon Heale and Martin Flower, who both stepped down from the Board after having served nine years. Douglas Caster became Chairman of the remuneration Committee and was appointed Senior Independent Director following Andrew given’s departure from the Board at the end of 2014. rob rowley became Chairman of the Audit Committee during the year. With the refreshing of the Board over the last two years, ensuring continuity of knowledge and experience on the Board and working on the Board dynamic have been priorities during 2014.
> establishment and completion of the process to select a new Chief executive officer after Mark robertshaw announced his departure. As recently announced, the Board has appointed pete raby as Chief executive officer commencing in August 2015. I look forward to welcoming pete to the group.
> Stewardship of the group during the period following transition to the new regional one Morgan structure, including realignment of the portfolio of businesses within the new structure.
> talent and succession planning, an area of focus identified in the 2013 Board evaluation process. the way the Board implemented this recommendation is explained further below. the performance evaluation process enables the Board to monitor its effectiveness against a backdrop of changing circumstances and to move forward to ensure it is effective. the recommendations from the internal 2014 Board performance review are set out later in this report. As explained below, the Board has decided to defer external evaluation of the Board’s performance until 2015 to allow time for the new Board dynamics to settle.
> Board visits to different sites which afforded Directors a good, close insight into our businesses. In April 2014, the Board visited the technical Ceramics site at Stourport, uK. the meeting in September 2014 was held at the Composites and Defence Systems site in Coventry, uK and, in november 2014, the Board visited the recently-acquired porextherm Dämmstoffe gmbH business in Kempten, germany. these visits were organised around scheduled Board meetings and incorporated a meeting with the local management team as well as a tour of the operations.
I am looking forward to working together with the Directors during 2015 to further develop our effectiveness as a new Board.
Andrew ShilStOnCHAIrMAn
50 GOvernAnCe GOvernAnCe 51
Morgan aDVanCED MaTErIaLS annuaL rEporT 2014
Statement of compliance with the UK Corporate Governance Codethroughout the year ended 31 December 2014 the Company has been in compliance with the relevant provisions of the September 2012 version of the uK Corporate governance Code (the ‘Code’) which applies to the 2014 financial year, with one exception. With reference to provision B.6.2 of the Code, the Board did not conduct an externally facilitated Board performance evaluation during 2014, notwithstanding that the most recent externally facilitated evaluation was in 2011 and the Code requires an externally facilitated evaluation to be conducted every three years. given the significant Board changes during 2014, as described above and in more detail below, the Board decided to defer the external evaluation to 2015 when Board dynamics have settled and the new members of the Board will have had more time in post and more relevant knowledge and experience with the Company on which to base their contributions to allow a more meaningful evaluation.
As reported in the report of the Audit Committee on pages 58 to 60, the group has not put the external audit contract out to tender during the last 10 years in accordance with provision C.3.7 of the Code. the Board has decided to take advantage of the Financial reporting Council (FrC)’s guidance on transitional arrangements which allow the group to defer a formal third-party tender process until at the latest the end of the current external audit engagement partner’s tenure in 2018.
the main principles of the Code focus on leadership, effectiveness, Accountability, remuneration and relations with Shareholders. this statement describes how the Company has applied the main principles of the Code. It should be read in conjunction with the Strategic report on pages 8 to 45 and the other sections of the Directors’ report on pages 46 to 89.
the Code is published by the FrC and is available on its website www.frc.org.uk.
leadershipThe role of the Boardthe Board is collectively responsible to the Company’s shareholders for the long-term success of the Company. the Board is satisfied it has met the Code’s requirements for its effective operation. It has set the Company’s strategic aims, which were reviewed by the Board at its dedicated strategy meeting during the year, and has ensured that there is a framework of prudent and effective controls which enable risk to be assessed and managed. the Board sets the Company’s values and standards, which are contained in the Core Values Statement and ethics policy, both of which are referred to on pages 22 to 24 of the Strategic report.
Matters reservedthere is a schedule of matters specifically reserved for the Board including setting the group’s strategic aims and objectives, approving significant contractual commitments (including the acquisition or disposal of companies/businesses, and treasury and intellectual property transactions), the review of the effectiveness of risk management processes, major capital expenditure and corporate responsibility. one meeting each year is specifically focused on strategy and the longer term development of the group. the Board reviewed and updated the schedule of matters reserved during 2013 to ensure that it accurately reflected the work of the Board and the current version is available to view on the Company’s website. the Board also reviewed the limitations of authority in the group in 2013 following the transition to the one Morgan structure.
Delegation of authoritythe Board has delegated responsibility for certain matters to three committees, namely the Audit, nomination and remuneration Committees. the memberships, roles and activities of these committees are described in separate reports: the Audit Committee report is set out on pages 58 to 60; the nomination Committee report is set out on pages 61 and 62; and the remuneration Committee report is set out on pages 63 to 85. the full terms of reference of the Board committees are available upon request and are also available on the Company’s website.
the Board delegates the day-to-day management of the group and operational matters to the Chief executive officer and the other executive Directors (the Chief Financial officer and the Chief operating officer). the executive Directors together with the group Human resources Director, the Company Secretary & general Counsel, the Director of Strategic programmes, the Chief technology officer, the Marketing Director and the Director of Finance form the executive Committee. the biographies of the members of the executive Committee are set out on pages 46 and 48.
the Board has delegated authority for certain other matters including routine approvals to a general purposes Committee which meets as required and at which a non-executive Director must be present.
Board meetingsIn 2014, the Board met formally on nine occasions, of which eight were scheduled meetings. A summary of the matters dealt with at these meetings is set out below. the unscheduled meeting considered the approach from Vesuvius plc.
the June 2014 meeting included a dedicated session on group strategy. During this extended meeting, the Board assessed the group’s current portfolio of businesses, considered the key drivers of future organic growth, assessed the competitor landscape and held in-depth reviews on specific strategic topics.
CorporAte goVernAnCecontinued

50 GOvernAnCe GOvernAnCe 51
AnnuAl report 2014 MorgAn ADVAnCeD MAterIAlS
oVe
rVIe
WSt
rAt
egIC
rep
ort
go
Vern
AnC
eFI
nAn
CIA
l St
AteM
entS
Attendance at meetingsthe attendance of each Director at Board and Audit, remuneration and nomination Committee meetings is set out in the table below.
Should a Director have concerns about the running of the Company or a proposed action which are not resolved, their concerns would be recorded in the Board minutes. An appropriate Directors’ and officers’ liability insurance policy is in place.
Board Audit remuneration nomination
Directoreligible
to attend Attendedeligible
to attend Attendedeligible
to attend Attendedeligible
to attend Attended
Andrew Shilston* 9 9 – – 4 4 2 2Mark robertshaw† 9 9 – – – – 2 2Kevin Dangerfield 9 9 – – – – – –Andrew Hosty 9 9 – – – – – –Douglas Caster*‡ 8 8 4 4 3 3 1 1Victoire de Margerie* 9 9 5 5 4 4 2 2Martin Flower*§ 3 3 1 1 2 2 1 1Andrew given*† 9 9 5 5 4 4 2 2Simon Heale*> 1 1 1 1 1 1 1 1Andrew reynolds Smith*~ 9 8 5 5 4 4 2 2rob rowley*‡# 8 8 4 4 3 2 1 –
* Indicates a Director deemed by the Board to be independent or, in the case of the Chairman, independent on appointment.† Stepped down from the Board on 31 December 2014.‡ Appointed to the Board on 14 February 2014.§ Stepped down from the Board on 9 May 2014.> Stepped down from the Board on 31 March 2014.~ Andrew reynolds Smith was unable to attend the Board meeting in February 2014 due to prior commitments with gKn plc.# rob rowley was unable to attend the remuneration Committee and nomination Committee meetings in December 2014 due to prior commitments which were already in place
at the time he was appointed to the Board in February 2014.
Summary of the Board’s work during the year: > review of growth opportunities within the business against
a backdrop of low or no growth in the macro-economic environment
> review of strategic organic growth strategy and initiatives > review of bolt-on merger and acquisition opportunities and
approval of the acquisition of porextherm Dämmstoffe gmbH > review of the nil premium proposal from Vesuvius plc to acquire
the Company in exchange for shares in Vesuvius plc > review of technology and innovation within the business and
resulting business opportunities > In-depth briefings from the regional presidents > review and approval of the group’s half-year report, interim
management statement, trading statement and preliminary announcement of the final results
> Approval of the 2015 budget > Approval of major capital expenditure and review of major capital
investment projects > review of group and regional business plans > review of the group’s principal risks > review of environmental and health and safety performance and
plans including ‘thinkSAFe’, the behaviour-based safety programme launched in 2014
> Consideration of major shareholders’ views on the group’s performance and prospects
> review of the senior management talent pipeline > review of the group’s It strategy > Approval of the new £200 million revolving credit facility
agreement, entered into in october 2014.
Chairman and Chief executive Officerthe roles of Chairman and Chief executive officer are separate, clearly established, set out in writing and agreed by the Board.
the Chairman is responsible for the leadership and effectiveness of the Board, including setting the Board’s agenda and ensuring sufficient time is available for all agenda items, particularly regarding strategic issues, for promoting a culture of open debate and constructive challenge, facilitating effective contributions by the non-executive Directors and ensuring constructive relationships between the executive and non-executive Directors. the Chief executive officer is responsible for the management of the group, including the delivery of the group’s business plan, the formulation and implementation of strategy, chairing the executive Committee and ensuring the implementation of the group’s policies.
Following Mark robertshaw’s departure on 31 December 2014, the Board appointed Kevin Dangerfield, Chief Financial officer, as interim Chief executive officer from 1 January 2015. As recently announced, the Board has appointed pete raby as Chief executive officer and he will commence in the role in August 2015. Kevin Dangerfield will continue as Interim Chief executive officer until pete raby joins the group. Andrew Hosty continues as Chief operating officer with responsibility for the group’s operations supported by the regional presidents.
Chairmanon appointment as Chairman on 1 August 2012, Andrew Shilston met the independence criteria set out in the Code.

52 GOvernAnCe GOvernAnCe 53
Morgan aDVanCED MaTErIaLS annuaL rEporT 2014
Non-executive Directorsnon-executive Directors are appointed for a term of three years, subject to annual re-election in accordance with the Code. the independence, commitment and effectiveness of any non-executive Director who has served for two three-year terms is subject to rigorous review prior to reappointment for a further three-year term.
By the time of the 2014 AgM, Andrew given had served two three-year terms as a non-executive Director since first being elected to the Board by shareholders. the Chairman conducted a rigorous review prior to authorising Andrew given to seek re-election at the 2014 AgM. this review took into account the need to retain experience on the Board given the departure during 2014 of two long-serving non-executive Directors and the appointment of one non-executive Director in 2013 and two non-executive Directors in February 2014. Andrew given stepped down from the Board on 31 December 2014.
Martin Flower was the Senior Independent Director until his departure from the Board at the conclusion of the AgM in May 2014 when Andrew given became Senior Independent Director. on Andrew given’s departure on 31 December 2014, Douglas Caster became Senior Independent Director.
NON-EXECUTIVE DIRECTOR TENURE%As at 31 December 2014
Serving first three-year term 83%Serving second three-year term 0%Serving third three-year term 17%
NON-EXECUTIVE DIRECTOR TENURE%As at 31 December 2013
Serving first three-year term 50%Serving second three-year term 17%Serving third three-year term 33%
the Chairman and the non-executive Directors met without the executive Directors present on a number of occasions during the year. In addition, the Senior Independent Director and the other non-executive Directors met without the Chairman present.
effectivenessBoard balance and independencethe size, structure and composition of the Board were reviewed during the year, taking into account succession planning and the need to progressively refresh the membership of the Board. the Board was aware of the need to recruit two non-executive Directors who would have the requisite knowledge and experience to be able to take over from existing long-serving non-executive Directors as Chairmen of the Audit Committee and remuneration Committee respectively.
Douglas Caster and rob rowley were appointed to the Board as non-executive Directors on 14 February 2014. Further information on the process used to appoint the new non-executive Directors is included in the nomination Committee report on pages 61 and 62.
Simon Heale, non-executive Director, resigned from the Board on 31 March 2014. Martin Flower, non-executive Director, resigned from the Board on 9 May 2014. Mark robertshaw, Chief executive officer, and Andrew given, non-executive Director and Senior Independent Director, both resigned from the Board on 31 December 2014.
As at 12 February 2015, the Board comprises Andrew Shilston, Chairman; Kevin Dangerfield, Interim Chief executive officer and Chief Financial officer; Andrew Hosty, Chief operating officer, and four independent non-executive Directors: Douglas Caster, Victoire de Margerie, Andrew reynolds Smith and rob rowley. Biographies of the Directors, including details of their other main commitments, are set out on pages 46 and 47.
throughout the year the Company complied with the requirement of the Code that at least half the Board, excluding the Chairman, should comprise non-executive Directors determined by the Board to be independent. In addition to the factors set out in the Code, the Board’s assessment of a non-executive Director’s independence and effectiveness covers their total number of commitments and any relationships with major suppliers and with charities receiving material support from the Company.
CorporAte goVernAnCecontinued

52 GOvernAnCe GOvernAnCe 53
AnnuAl report 2014 MorgAn ADVAnCeD MAterIAlS
oVe
rVIe
WSt
rAt
egIC
rep
ort
go
Vern
AnC
eFI
nAn
CIA
l St
AteM
entS
BOARD BALANCE%As at 31 December 2014
Executive Directors 33%Independent non-executive Directors 56%Chairman 11%
BOARD BALANCE%As at 31 December 2013
Executive Directors 33%Independent non-executive Directors 56%Chairman 11%
Commitmentprior to undertaking an additional external role or appointment, the Chairman and the non-executive Directors are asked to confirm that they will continue to have sufficient time to fulfil their commitments to the Company. For example, during the year, rob rowley indicated that he wished to accept a non-executive Director role at greene King plc. prior to accepting the position, he confirmed that he would continue to have sufficient time to dedicate to his role at Morgan Advanced Materials and the Board concluded that acceptance would not compromise his independence or impede the time available to carry out his duties for Morgan Advanced Materials.
there was no change to the Chairman’s other significant commitments during the year.
Information and supportthe Company Secretary, with the Chairman, is responsible for ensuring the Board has full and timely access to all appropriate information to enable it to discharge its duties. Board papers are generally made available electronically five working days before each meeting. non-executive Directors also receive updates and information between formal Board meetings.
the Directors have access to the advice and services of the Company Secretary who, with the Chairman, is responsible for ensuring that Board procedures are followed and that applicable rules and regulations are observed. A procedure is in place to enable the Directors to seek independent professional advice at the Company’s expense in connection with their duties as Directors.
Induction and professional developmentnew Directors receive a full, formal and tailored induction on joining the Board. A new Director’s experience and background is taken into account in developing a tailored programme. Following their appointment to the Board on 14 February 2014, Douglas Caster and rob rowley received comprehensive briefings to supplement the information on the group’s business provided during recruitment. the briefing for Douglas Caster and rob rowley included further information on the business and its products and markets, brokers’ reports on the group, the Company’s corporate governance structure and processes and key group policies. the induction programme for Douglas Caster and rob rowley included meetings with executive management, briefings from functional heads on governance, responsible business, key risks, human resources and environment, health and safety, together with visits to a number of operational sites and meetings with regional and operational management.
the Chairman considers the individual training and development needs of each Director. the Company Secretary keeps the suitability of external courses under review and facilitates the ongoing training and development of all Directors as necessary.
non-executive Directors have access to management and employees at all levels and are encouraged to visit operating sites. In addition to visits by individual Directors and the Chairman, each year at least one Board meeting is held at an operating facility, and in 2014 Board visits were made to three sites including one outside the uK.

54 GOvernAnCe GOvernAnCe 55
Morgan aDVanCED MaTErIaLS annuaL rEporT 2014
Performance evaluationWith the aim of improving effectiveness, the Board undertakes a formal annual evaluation of its own performance and that of its Committees and individual Directors.
An externally facilitated performance evaluation was conducted in 2011 and an internal evaluation was conducted in 2012 and 2013. the 2014 process was also conducted internally notwithstanding the requirement in the Code to conduct an externally facilitated process every three years. As explained on page 50 of this report, given the changes to the Board’s membership during 2014, the Board decided to defer the externally facilitated evaluation to 2015. the 2014 process was led by the Chairman and carried out by the Company Secretary.
the process for the evaluation of the Board as a whole and its Committees was as follows:
> Development of tailored questionnaires, completed by all Directors, which took into account the output from the 2013 performance evaluation process, the current dynamic of the Board, the work of the Board during 2014 and its current areas of focus.
> Formulation of a report summarising the results of the questionnaires which was presented to the Board for discussion.
> Individual follow-up reviews between the Chairman and each Director to discuss the report ahead of a Board discussion on the results.
the main aspects of the Board’s work which the Board believes offer scope for further development include:
> external communication of strategy – the need to better articulate the group’s long-term strategy and sustainable growth drivers to the outside world, whilst using shareholder comments and external views to challenge Board views.
> Business leadership – Building on progress made in 2014, there should be a continuing and increasing focus from the Board on business leader succession/talent management as well as ensuring the continued development of leaders with the necessary skills to execute the group’s long-term strategy. A greater Board exposure to key regional executives is required to facilitate this.
> Management reporting – Further improvements are required in relation to the Board receiving the right balance of information from management, delivered in a clear and concise way.
Alongside the Board and Committee evaluation, each Director completed an individual questionnaire which invited them to reflect on their own performance and contribution to the Board. the questionnaires were reviewed by the Chairman, with any development needs being discussed with individual Directors.
CorporAte goVernAnCecontinued

54 GOvernAnCe GOvernAnCe 55
AnnuAl report 2014 MorgAn ADVAnCeD MAterIAlS
oVe
rVIe
WSt
rAt
egIC
rep
ort
go
Vern
AnC
eFI
nAn
CIA
l St
AteM
entS
the recommendations made following the 2013 Board performance review were implemented during the year.
reCoMMenDAtIonS FroM tHe 2013 BoArD perForMAnCe reVIeW AnD ACtIonS IMpleMenteD DurIng 2014
recommendations from 2013 Action taken/progress made during 2014there should be increased focus on executive succession planning and improving the current bench strength in the businesses as well as developing future leaders.
the Board considered an in-depth review of executive talent and succession planning at its meeting in July 2014 and reviewed progress that had been made against targeted improvement in the areas of senior succession strength, talent management and recruitment. the Board was satisfied that appropriate progress had been made and agreed priority actions to be undertaken over the course of the year.
there should be continuing focus on Board succession planning to ensure that in the medium term there is structured Board refreshment.
there has been particular emphasis during the year on short- and medium-term succession planning and, in light of this, Douglas Caster and rob rowley were appointed to the Board as non-executive Directors in February 2014.
Following the announcement of Mark robertshaw’s resignation as Chief executive officer and his departure on 31 December 2014, the Board focused on the recruitment of a new Chief executive officer.
Medium-term succession planning will continue to be an area of focus for 2015.
the Board should take account of diversity in planning Board and senior management succession.
the Board’s Diversity policy was published for the first time in the 2013 Annual report.
the search for new non-executive Directors which led to two appointments in February 2014 was broad, covered candidates from various backgrounds and included female candidates.
In respect of the search for a Chief executive officer, the Committee has sought candidates from a broad spectrum including candidates with an international background, reflecting the global nature of the business.
the prospect of recruiting candidates from a more diverse background has been considered by the nomination Committee as part of the medium-term success planning process.
there has been success in recruiting a diverse spectrum of candidates onto the graduate programme and graduates who have recently completed the programme have been promoted to positions within the business in locations outside of their home region.
Further consideration should be given to providing information to the Board in the most suitable format.
executive management have made changes to the formatting of certain meeting papers.

56 GOvernAnCe GOvernAnCe 57
Morgan aDVanCED MaTErIaLS annuaL rEporT 2014
Internal controlthe Board has overall responsibility for establishing and maintaining a sound system of internal control to safeguard shareholders’ investment and the group’s assets and for reviewing the effectiveness of this system. the group’s system of internal control has been in place for the year under review and up to the date of approval of the Annual report.
through the Audit Committee, the Board reviews the effectiveness of the internal control system annually and did so during the year. the system of internal control accords with the FrC’s guidance on the internal control requirements of the Code (formerly known as the ‘turnbull guidance’). this review covered all material controls, including financial, operational and compliance controls, and risk management systems. the Audit Committee and Board receive regular risk management reports covering the full range of risks faced by the group and together they ensure there are adequate systems in place and that they are effective.
the Directors believe that the group’s system of internal financial controls provides reasonable, but not absolute, assurance in the following areas: that the assets of the group are safeguarded; that transactions are authorised and recorded in a correct and timely manner; and that such controls would prevent and detect, within a timely period, material errors or irregularities. the system is designed to manage, rather than eliminate, risk and to address key business and financial risks. the internal control framework complements the group’s management structure.
the main features of the group’s systems for internal control and for assessing the potential risks to which the group is exposed are summarised as follows:
> Control environment the group’s management processes include delegated authorities and the segregation of duties with documented policies and manuals. these cover financial procedures, environmental, health and safety practice and other areas. In addition, there is a schedule of matters reserved for the Board. the group’s Core Values Statement, ethics policy and other supporting policies and procedures set out the group’s commitment to the highest standards of corporate and individual behaviour and provide guidance for employees. the group’s responsible Business programme includes relevant training and reporting and is part of the control framework. the ethics Hotline is available to employees in this regard. the regional presidents and other senior operational and functional management make an annual statement of compliance to the Board confirming that, for each of the businesses for which they are responsible, the Financial Statements are fairly presented in all material respects, appropriate systems of internal controls have been developed and maintained and the businesses comply with group policies and procedures. In addition, the Audit Committee receives an annual presentation on internal controls from each of the regional Finance Directors.
the non-executive Directors, led by Andrew given, the Senior Independent Director at the time, met without the Chairman present to evaluate the Chairman’s performance during the year, taking into account the views of the executive Directors.
Conflicts of interestthe Board has procedures in place to address the requirements of the Companies Act 2006 concerning the duty of the Directors to avoid conflicts of interest. Accordingly the Directors are required to:
> Disclose proposed outside interests before they are accepted in order to enable a prior assessment of any actual or potential conflict.
> Disclose without delay any situation which arises which gives rise to an actual or potential conflict.
the Board reviews the outside interests of the Directors and any conflicts disclosed and authorisations annually. Should an actual or potential conflict be identified, the Board considers whether to authorise the situation in accordance with the Company’s Articles of Association and, if so, the terms of any authorisation. In the event of an actual conflict arising, the Director concerned is to notify the Chairman (the Chairman would notify the Senior Independent Director) and the Director would be excluded from the relevant information, debate and decision.
AccountabilityFinancial reportingIn its reporting to shareholders, the Board is satisfied that the Annual report and Accounts, taken as a whole, is fair, balanced and understandable and provides the information necessary for shareholders to assess the group’s position and performance, business model and strategy as required by the Code.
A summary of the statement of Directors’ responsibilities in respect of the Annual report and the Financial Statements is set out on pages 88 and 89 and the ‘going concern’ statement is set out in the Strategic report on page 45.
Business model and strategyDetails of the group’s business model, how it is working to generate and sustain long-term value and details of the Board’s strategy for ensuring the group meets its objectives are set out in the Strategic report on pages 8 to 45.
CorporAte goVernAnCecontinued

56 GOvernAnCe GOvernAnCe 57
AnnuAl report 2014 MorgAn ADVAnCeD MAterIAlS
oVe
rVIe
WSt
rAt
egIC
rep
ort
go
Vern
AnC
eFI
nAn
CIA
l St
AteM
entS
relations with shareholdersDuring 2014, the Chairman and other non-executive Directors attended the annual and half-year results presentations and other investor events. this provided the opportunity to meet institutional shareholders and other attendees and to develop an understanding of their views.
Following the announcement of the group’s results and after other significant statements and presentations, investor opinion is canvassed and any feedback is made available to the Board. In addition, the Board is provided with brokers’ reports and feedback from any shareholder meetings on a regular basis.
to help facilitate dialogue with shareholders, the Investors section of the Company’s website includes details of london Stock exchange announcements, press releases, presentations, webcasts and other relevant Company and shareholder information.
Constructive use of the AGMthe AgM is normally attended by all members of the Board and by a representative of the external auditor. At the AgM held in May 2014, the Chief executive officer made a short business presentation. Shareholders are invited to ask questions during the meeting and have the opportunity to meet the Directors and other members of senior management before and after the formal meeting. the results of the proxy voting on all resolutions are provided for all attendees and are released to the london Stock exchange and published on the group’s website as soon as practicable after the meeting.
Information on share capital and other mattersthe information about share capital required to be included in this statement can be found on pages 87 and 88 in the other disclosures section.
> Financial reporting risk management systems and internal controls are in place in relation to the group’s financial reporting processes and the process for preparing consolidated accounts. these include policies and procedures which require the maintenance of records which accurately and fairly reflect transactions and dispositions of assets, provide reasonable assurance that transactions are recorded as necessary to allow the preparation of Financial Statements in accordance with International Financial reporting Standards (IFrS), and the review and reconciliation of reported data. As noted above, representatives of the business are required to certify that their reported information gives a true and fair view of the state of affairs of the business and its results for the period. the Audit Committee is responsible for monitoring these risk management systems and internal controls.
> performance monitoring there are regular meetings of the Board and of the executive Committee. A comparison of forecast and actual results is considered, including cash flows and comparisons against budget and the prior year. regional management teams also meet regularly to review performance. In addition, regular site visits are made by members of the executive Committee.
> risk management the identification of major business risks is an ongoing process carried out in conjunction with operating management. Steps are taken to mitigate or manage any material risks identified. the Board, either directly or through the Audit Committee, receives reports on financial, taxation, insurance, treasury, pension, legal, environmental and ethical risks from management. the regional presidents cover risk issues at their management meetings. Details of the group’s risk management system are set out in the risk management section on pages 18 to 21.
> risk factors the group’s businesses are affected by a number of factors, many of which are influenced by macro-economic trends and are therefore outside the Company’s immediate control, although, as described above and in the Strategic report, the identification and management of such risks is carried out systematically. these are further discussed in the risk management section on pages 18 to 21.
> Internal audit the group’s internal audit function reviews internal control and risk management processes. the Audit Committee approves the plans for internal audit reviews and receives reports accordingly. Actions resulting from internal audit reviews are agreed with management and the Audit Committee monitors progress against outstanding actions. the Internal Auditor has direct access to the Chairman of the Audit Committee.

58 GOvernAnCe GOvernAnCe 59
Morgan aDVanCED MaTErIaLS annuaL rEporT 2014
Chairman’s introductionI am delighted to have joined the Board and to have been appointed Chairman of the Audit Committee. I would like to thank Andrew given for his commitment during his tenure as Chairman of the Committee and for his guidance in handing the role over to me, as well as his continued contribution as a member of the Committee until his departure at the year end.
the global spread of the group inevitably presents challenges in terms of ensuring consistent and robust financial controls and a strong framework for effective compliance and governance. the existing management controls and review procedures, supported by Internal Audit, the responsible Business programme & risk Management function and the external auditor, provide mutually supportive resource to continually review, assess and develop this framework. I see the effective integration of these resources to be a continued area of focus for the Audit Committee.
the main purpose of the Audit Committee continues to be to assist the Board in effectively discharging its responsibilities for financial reporting and corporate control. I would like to highlight a number of key areas of focus for the Committee in 2014, as follows:
> During 2014, we continued to monitor our internal controls closely and received a series of presentations from the regions on their internal controls. the presentations were delivered by the regional Finance Directors, which gave the Committee the opportunity to ask questions face-to-face and gain a real insight into the internal control environment of each region.
> throughout 2014, the Committee monitored how the group’s approach to risk management was working. We received progress reports in person at each meeting from the responsible Business programme & risk Manager in relation to the implementation of risk management processes. Between the Audit Committee and the Board, during the course of the year we reviewed each individual key risk by receiving a report containing information on the risk, controls and the effectiveness of those controls and any recommended further actions.
> undertook a specific review of talent and succession planning in the finance function across the group’s regions and central functions. the review identified that work is required to effectively develop finance resource to ensure that there is a strong pool of internal candidates available to fill positions that are likely to become open in the short-to-medium term. Management are committed to making progress in this area in 2015 and this will be an important area of focus for the Audit Committee going forward.
> reviewed the key accounting judgments made by executive management, taking into account the views of the external auditor. Further details of the significant areas of judgment in relation to the 2014 Financial Statements are set out on page 60 of this report.
report oF tHe AuDIt CoMMIttee
tHIS report gIVeS An oVerVIeW oF tHe reSponSIBIlItIeS oF tHe AuDIt CoMMIttee AnD HoW It DISCHArgeD tHeSe DurIng 2014, togetHer WItH InForMAtIon on ItS MeMBerSHIp AnD goVernAnCe.
CoMMIttee MeMBerS
rob rowley* (Chairman) douglas Caster†
victoire de MargerieAndrew reynolds Smith
* Joined the Committee on his appointment as a Director on 14 February 2014 and appointed Chairman on 18 June 2014.
† Joined the Committee on his appointment as a Director on 14 February 2014.
Andrew given was Chairman of the Committee until 18 June 2014 and a member of the Committee until he stepped down from the Board on 31 December 2014.
Simon Heale and Martin Flower served as members of the Committee prior to stepping down from the Board on 31 March 2014 and 9 May 2014 respectively.
All members of the Committee are independent non-executive Directors and rob rowley, the Chairman of the Committee, has the requisite financial experience.
rOB rOwley CoMMIttee CHAIrMAn

58 GOvernAnCe GOvernAnCe 59
AnnuAl report 2014 MorgAn ADVAnCeD MAterIAlS
oVe
rVIe
WSt
rAt
egIC
rep
ort
go
Vern
AnC
eFI
nAn
CIA
l St
AteM
entS
> At the end of 2014, the Committee reviewed a report benchmarking its activities against those of the Audit Committees of a peer group of companies and as a result is considering a small number of actions to further enhance its performance.
> the Committee has begun to consider the changes required by provisions in the uK Corporate governance Code which apply to the 2015 financial year on the robust assessment of risk including solvency and liquidity, ongoing monitoring of systems, the new going concern and material uncertainties disclosure and the business viability statement.
I am pleased to present the Audit Committee’s report for 2014.
rOB rOwleyCoMMIttee CHAIrMAn
Meetingsthe Audit Committee met five times during the year. At the end of most meetings the non-executive Directors who are members of the Committee also meet the external auditor, the Head of Internal Audit and the responsible Business programme & risk Manager without the executive Directors or other members of management present. Between meetings the Chairman of the Audit Committee keeps in contact with the Chairman of the Board, the Chief executive officer, the Chief Financial officer, the external auditor and the Head of Internal Audit as necessary.
information and supportthe Committee may request the attendance at meetings of any Director or employee as may be considered appropriate by the Committee.
the Committee identifies and ensures that it receives the information it needs to enable it to fulfil its responsibilities. this is complemented by regular presentations made by the regional presidents and Finance Directors on the internal control environment within their respective regions. training and development information is made available to the members of the Audit Committee when appropriate.
Audit Committee terms of referencethe Audit Committee’s terms of reference were reviewed during the year and remain wholly compliant with the September 2012 version of the uK Corporate governance Code which applied to the 2014 financial year. they are available on the Company’s website and are summarised below:
> Monitoring and making appropriate recommendations to the Board with regard to the financial reporting process, the integrity of the Financial Statements of the group, preliminary announcements, half-year reports and any formal announcements relating to the group’s financial performance, and reviewing significant financial reporting judgments contained in them.
> reviewing accounting policies used by the group and their consistent application across the group.
> reviewing whether the group has followed appropriate accounting standards and made appropriate estimates and judgments, taking into account the views of the external auditor.
> reviewing and monitoring the effectiveness of the group’s internal financial controls and internal control, internal audit and risk management systems.
> reviewing and monitoring the group’s whistleblowing arrangements and systems and controls for the prevention of bribery.
> Making recommendations to the Board, for it to put to shareholders for their approval at the AgM, in relation to the appointment, reappointment and removal of the external auditor and to approve the remuneration and terms of engagement of the external auditor.
> reviewing and monitoring the external auditor’s independence and objectivity.
> reviewing the effectiveness of the process for the statutory audit of the annual consolidated accounts, taking into consideration relevant uK professional and regulatory requirements.
> Developing and implementing the policy on the engagement of the external auditor to supply non-audit services, taking into account relevant ethical guidance regarding the provision of non-audit services by the external auditor.
> reporting to the Board, identifying any matters in respect of which it considers that action or improvement is needed and making recommendations as to the steps to be taken.
the Committee has the authority to investigate any matters according to its terms of reference and may obtain external advice at the cost of the Company, but did not do so during the year. the Head of Internal Audit has access to the Chairman of the Committee and regularly meets with the Committee without other executives present, usually at the end of scheduled Audit Committee meetings.
Main areas of work in 2014During 2014, the Committee:
> reviewed the group’s 2014 half-year and full-year statements prior to Board approval.
> Made a recommendation to the Board that it is appropriate to prepare the accounts for the year on a going concern basis.
> reviewed the scope of the external audit, and confirmed the external auditor’s terms of engagement and fee structures.
> Assessed the effectiveness of the external audit process and all aspects of the service provided by the external auditor.
> reviewed the group’s key risks (other than those reviewed by the Board) and the controls and assurance processes that are in place to mitigate those risks.
> reviewed the effectiveness of, and received reports from management, on the group’s internal audit and risk management systems and updates to the group’s governance, risk and compliance plans.
> reviewed and approved the plans and work of the Internal Audit function and monitored its progress against the plan.
> reviewed the systems of internal controls of the regions. > Appraised the group’s whistleblowing process and related
procedures and policies. > reviewed material litigation. > Monitored the level of non-audit work of the auditor, which in 2014
included services amounting to £0.4 million, mainly in connection with tax services.

60 GOvernAnCe GOvernAnCe 61
Morgan aDVanCED MaTErIaLS annuaL rEporT 2014
Public reportingthe Committee, on behalf of the Board, considered the Code requirement to make a statement on whether the Annual report and Accounts is fair, balanced and understandable. the Committee approached this as follows:
> Considered the questions which need to be answered in order to evaluate whether the Annual report and Accounts meets the fair, balanced and understandable test.
> reviewed the methodology used to construct the narrative sections of the Annual report.
> reviewed the disclosure judgments made by the authors of each section and considered the balance of good and bad news in the Annual report.
> received confirmation from external advisers that all regulatory requirements are satisfied.
> received confirmation of verification of content from the authors of each section.
> received confirmation from the Chief Financial officer that the narrative reports and Financial Statements are consistent.
> reviewed an advance draft of the Annual report and Accounts prior to the financial year end.
the significant areas of judgment considered by the Committee in relation to the 2014 Financial Statements, and how these were addressed, were as follows:
> goodwill impairment testing Specific attention was given to the goodwill and intangible asset carrying value of the Composites and Defence Systems (C&DS) cash-generating unit. Based on the performance of the business during 2014 and latest expectations for the future, which were particularly informed by the reduced demand from the uK MoD, it was considered appropriate and prudent to record a significant impairment charge against the customer relationship intangible asset and goodwill, a total impairment charge of £26.9 million. the latest financial projections and other assumptions support the valuation of the remaining goodwill and intangible assets. Further information on the goodwill generally and the sensitivities associated with the impairment calculations are given in note 11.
> provisions and contingent liabilities the level of provisioning for known and contingent liabilities, including those arising from trading, environmental issues and litigation, is an issue where management and third-party judgments are important. these are addressed through the Committee and the main Board discussing with various members of senior management the key judgments made, supported, where appropriate, by relevant external advice. KpMg llp also reports regularly on all material provisions and contingent liabilities. the group recorded redundancy and restructuring provisions in the ordinary course of business totalling £5.9 million, which are charged against underlying earnings but are disclosed separately to provide investors with additional information to assist in their assessment of the group’s performance. the group also disclosed separately further significant redundancy and restructuring provisions associated with restructuring of the group’s activities and the rationalisation of its portfolio as Specific Adjusting Items. the Committee considered the timing of recognition and measurement of these items on the basis of reports presented by management and the external auditor, taking into account guidelines issued by the FrC and peer group disclosures of similar items of income and expenditure. Details of the nature and quantum of the amounts concerned are given in note 6.
> tax provisions Accounting for current and deferred tax involves a range of judgments. the Committee and the Board address these issues through reporting from the Chief Financial officer and the Director of group tax, supported as necessary by external professional advice, including from KpMg llp.
the Committee reviewed the content of the Annual report and Accounts and advised the Board on whether, taken as a whole, it is fair, balanced and understandable and provides the information necessary for shareholders to assess the group’s position and performance, business model and strategy.
Audit Committee and the external auditorthe Audit Committee has received confirmation from KpMg llp that its general procedures and practices support the auditor’s independence and objectivity in relation to non-audit services. After considering such procedures the opinion of the Audit Committee was that the auditor’s objectivity and independence were safeguarded despite the provision of non-audit services by KpMg llp.
to help ensure the objectivity and independence of the external auditor, the policy implemented by the Committee for the provision of non-audit services by the external auditor is in summary as follows:
> Certain non-audit services may not be provided by the external auditor, including the review of their own work; they may not make management decisions; their work must not create a mutuality of interest; and they may not put themselves in the position of advocate.
> Any permissible non-audit work proposed to be placed with the external auditor with a fee between £50,000 and £200,000 must be approved in advance by the Chairman of the Audit Committee. projects in excess of £200,000 must be approved in advance by the Audit Committee. Work which includes multiple phases is treated as a single project for approval purposes.
> the prior approval of the Audit Committee is required for any non-audit work which, when added to the fees paid for other non-audit work, would total more than 80% of the audit fee.
During the year the proportion of the auditor’s fees for non-audit work relative to the audit fee was 20% (2013: 13%).
the Committee’s policy is to undertake an annual review of the effectiveness of the audit process and of all aspects of the external auditor’s performance and independence before determining whether to undertake a formal review of the auditor including a re-tender presentation, or whether to put the group’s audit work out to full third-party tender.
the external auditor has processes in place to safeguard its independence and has written to the Committee confirming that, in its opinion, it is independent. the group last changed its auditor in late 2001. the external auditor rotated the partner responsible for the group’s audit work in 2008 and 2013. the Code requires that FtSe 350 companies should put the external audit contract out to tender at least every 10 years. the Company notes the guidance issued by the FrC by way of transitional arrangements on tendering which permit KpMg llp to continue in office until 2018 without an audit tender. Having reviewed the effectiveness of the audit process and all aspects of the service provided by the auditor, and taking account of the assurance given by the auditor as to its independence, the Committee recommended to the Board that the group’s external audit work should not be put out to third-party tender during 2014 and will further review the situation during 2015.
report oF tHe AuDIt CoMMItteecontinued

60 GOvernAnCe GOvernAnCe 61
AnnuAl report 2014 MorgAn ADVAnCeD MAterIAlS
oVe
rVIe
WSt
rAt
egIC
rep
ort
go
Vern
AnC
eFI
nAn
CIA
l St
AteM
entS
report oF tHe noMInAtIon CoMMIttee
Chairman’s introduction2014 was an important year for the Committee with a number of changes to the Board. the Committee has spent a great deal of its time evaluating the Board’s successional needs, working closely with executive search agents to evaluate the skills and experience required to balance the Board and reviewing long- and short-lists of candidates. three long-serving non-executive Directors stepped down from the Board during 2014, and when selecting non-executive Directors the Committee was mindful of the need to appoint individuals who would be able to take over as Committee Chairmen and Senior Independent Director. Douglas Caster and rob rowley were appointed as non-executive Directors in February 2014.
In September 2014, the Committee commenced the search for a new Chief executive officer following Mark robertshaw’s announcement that he would be stepping down from the Board. this process concluded shortly before finalisation of this report with the announcement that pete raby will be joining Morgan as Chief executive officer in August 2015. pete joins from Cobham plc where he is currently president of its Communications and Connectivity sector, the company’s largest sector with over 4,000 employees across 30 sites worldwide. pete has a strong technical background and an impressive track record in planning and executing business strategy across global manufacturing operations and I am delighted that he will be joining the group.
there is a formal, rigorous and transparent procedure for appointments to the Board which is described in more detail below. Appointments are made on merit and against objective criteria, having due regard for diversity, including gender.
Andrew ShilStOnCoMMIttee CHAIrMAn
Meetingsthe Committee met formally twice during 2014. In addition, a number of working groups of members of the Committee met frequently between scheduled meetings to progress the recruitment of two non-executive Directors and a Chief executive officer.
information and supportthe Committee has the power to request the attendance of any other Director or member of management, for all or part of any meeting, as may be considered appropriate by the Committee.
nomination Committee terms of referencethe Committee’s terms of reference were reviewed during the year. the terms of reference are available to view on the Company’s website.
tHe MAIn role oF tHe noMInAtIon CoMMIttee IS to leAD tHe proCeSS For BoArD AppoIntMentS AnD to MAKe reCoMMenDAtIonS to tHe BoArD on tHe AppoIntMent oF neW DIreCtorS.
CoMMIttee MeMBerS
Andrew Shilston (Chairman)douglas Caster*victoire de MargerieAndrew reynolds Smithrob rowley*
* Joined the Committee on appointment as a Director on 14 February 2014.
Andrew given and Mark robertshaw served on the Committee throughout the year until they stepped down from the Board on 31 December 2014.
A majority of members of the Committee are independent non-executive Directors.
Andrew ShilStOn CoMMIttee CHAIrMAn

62 GOvernAnCe GOvernAnCe 63
Morgan aDVanCED MaTErIaLS annuaL rEporT 2014
Main areas of work during 2014the nomination Committee reviews the balance of skills, knowledge and experience on the Board, succession planning and the leadership needs of the group. the work of the Committee in discharging those responsibilities in respect of 2014 included:
> led the search for new non-executive Directors, resulting in the selection and recommended appointment of rob rowley and Douglas Caster in February 2014.
> Commenced the selection process in relation to the appointment of a new Chief executive officer and recommended the appointment of Kevin Dangerfield as Interim Chief executive officer until pete raby joins.
> reviewed the composition of the Board and its Committees and succession planning.
> Selected a Senior Independent Director following Martin Flower’s and then Andrew given’s departure from the Board.
> Considered the reappointment of the non-executive Directors at the conclusion of their specified time in office and the Directors’ annual re-election at the 2014 AgM.
> reviewed, for recommendation to the Board, the Board’s policy on diversity.
Appointments to the Boardthe Board discussed the group’s approach to talent management and succession planning at senior levels within the business in July 2014. the Committee also discussed executive Director succession planning in the context of the process to recruit a new Chief executive officer following the announcement of Mark robertshaw’s resignation. In addition to the recruitment of a Chief executive officer, succession planning for appointments to the Board and for senior management will be an area of focus for the Committee in 2015.
the process for appointing Douglas Caster and rob rowley is described below:
> Following consideration of a number of leading firms, the Committee appointed egon zehnder as external search agent. egon zehnder has signed up to the voluntary code of conduct for executive search firms which includes provisions on diversity. In line with the Code, the Committee established that egon zehnder has no other connection with the Company.
> In the light of its discussions on the balance of skills, knowledge, experience and diversity on the Board, including the need to recruit a Senior Independent Director and Audit Committee and remuneration Committee Chairmen, the Committee considered and formulated a candidate specification for the roles.
> the external search agent produced a long-list of candidates for the roles.
> Interviews were held with a short-list of candidates and members of the nomination Committee participated in interviews with the preferred candidates.
> the Committee selected its preferred candidates based on objective criteria and recommended their appointment to the Board.
the terms and conditions of appointment of non-executive Directors are available for inspection. non-executive Directors, including the Chairman, are asked to undertake that they will have sufficient time to meet their commitments to the Company and their other significant commitments are disclosed to the Board before appointment, with an indication of the time involved. the Board is informed of any subsequent changes with additional commitments disclosed before they are accepted. the terms of appointment for non-executive Directors do not include a notice period.
the process to recruit the Chief executive officer is described below: > the skills and attributes required by an incoming Chief executive
officer were discussed and a job specification was agreed. > Following a selection exercise in which a number of external search
agents were considered and three firms were interviewed, Spencer Stuart were appointed and briefed. Spencer Stuart has no other connection with the Company other than conducting psychometric testing for senior executives in 2013.
> the Committee agreed that the Chairman of the Committee, the Senior Independent Director and Victoire de Margerie should continue to progress the search between formal meetings of the Committee.
> the search was conducted globally and a long-list of candidates was considered, including external and internal, international and female candidates. the search agent travelled to meet candidates outside the uK.
> Short-listed candidates were then interviewed by all members of the nomination Committee. Spencer Stuart then conducted an independent assessment and references were taken up before the decision was made and announced on 30 January 2015 to appoint pete raby as Chief executive officer commencing in August 2015.
Following Mark robertshaw’s departure on 31 December 2014, the Committee recommended the appointment of Kevin Dangerfield, Chief Financial officer, as Interim Chief executive officer with effect from 1 January 2015 until pete raby joins the group.
Board diversity Policy the Board firmly believes in the value of diversity of perspective, including background, nationality, experience and gender, at all levels of the Company as well as on the Board. As is not unusual in engineering or manufacturing businesses, diversity in gender is the hardest to achieve.
It is very gratifying, however, to see that at the graduate recruitment level the group is now having great success in attracting good candidates of both sexes and many nationalities. In 2014, 32% of the graduate intake (2013: 42%) were female. At the senior level, 5% of senior managers and one of the Board Directors are female.
new appointments to the Board are made on merit, with a focus on international and industrial experience, but diversity of perspective and the mix of skills around the Board table are also taken into account when selecting potential candidates. During the selection process for new non-executive Directors, the Committee has, and will, continue to use a search agent who has signed up to the voluntary code of conduct which ensures that diversity is considered when developing a candidate pool. the brief to the search agent is to put forward a long-list of candidates from a wide range of backgrounds to ensure that the best candidate is selected.
When monitoring the development of leadership and considering the succession planning for executive management, the Board will take into account the need for talented leaders who will have the skills needed to lead a global company with a growing presence in the key world economies.
the Board will continue to monitor whether it is taking diversity into account when planning executive succession and appointing new Board members, and the Board effectiveness evaluation process addresses diversity.
the Board has discussed whether a quota for female Directors should be introduced by a certain date, but feels this is unrealistic given the current gender composition of senior executives, the nature of the business and the competition for female non-executive Directors.
report oF tHe noMInAtIon CoMMItteecontinued

62 GOvernAnCe GOvernAnCe 63
AnnuAl report 2014 MorgAn ADVAnCeD MAterIAlS
oVe
rVIe
WSt
rAt
egIC
rep
ort
go
Vern
AnC
eFI
nAn
CIA
l St
AteM
entS
I am pleased to present the Directors’ report on remuneration for the year ended 31 December 2014. this is my first report to shareholders since I became Chairman of the remuneration Committee in April 2014. you will have seen earlier in this report the good progress achieved by management this year, which has been built on the strong leadership of the last few years. I have certainly seen the determination of management to build sustainable high performance and growth since I joined the Board, and sound results are being achieved despite testing global economic conditions.
I am keen to ensure the remuneration policy will be appropriate and relevant throughout the range of market conditions the group will face. I believe remuneration policy and performance targets must ensure proper incentivisation of management to achieve group strategies for growth whilst being aligned with short- and long-term interests of shareholders.
Against these considerations, the Board has reflected on the implications of a change of Chief executive officer as well as shareholder feedback questioning that despite strong performance compared with direct competitors, executive management incentives have not paid out in 2012 and 2013. the lack of prior-year bonus payouts has also precluded participation in the group’s Bonus Deferred Share Matching plan (BDSMp), a key retention tool for the Company.
Although some bonus will be paid for 2014 performance, none of the prior-year longer-term incentives will vest in 2014. the relative tSr component of the long-term Incentive plan (ltIp) has not vested for each of the last three cycles. this is despite Morgan’s strong absolute tSr performance over the past five years (circa 19% pa) and relative outperformance of the group’s closest listed competitors over the last one, three, and five years.
the record in the last two years of management not being rewarded for above-average performance relative to listed and non-listed sector peers in difficult market conditions has caused us to consider the motivational effectiveness of our suite of incentives and the ability to retain our key executive talent. In this context, we have reviewed the calibration of performance measures and incentive targets to ensure they more closely align with our strategic aims, motivate and reward management for delivering sustainable above-peer performance, and support retention.
I wrote to our major shareholders in January 2015 to explain that although we were maintaining the same structure of incentives within our policy, we would change the cash measure in the bonus to Cash generation, and give it a higher weighting (from 20% to 40%). For the ltIp there would be changes to the target ranges for the epS and roCe measures.
the epS range for the 2015 ltIp now has a threshold of 6% CAgr (previously 8%), with the top end of the range continuing to be set at 15% CAgr to ensure stretching targets and to demonstrate our expectation for management to be ambitious. However as this incentive has not been attained in the last three award cycles, owing to challenging market conditions, there is good reason to review its start point, which has been set taking into account Morgan’s strategic plan, as well as broker forecasts for Morgan and its peers.
We are not altering the existing epS range for the BDSMp, to reinforce our expectation that senior executives should have a mind-set of innovation and determination to do even better.
Since its introduction for the 2012 ltIp, the roCe measure has provided a useful focus within the business. to ensure that the roCe targets also support the sustainable long-term growth objectives of the group, the Committee concluded that a performance range of 27%-33% for the 2015 ltIp cycle will provide the best balance between growth and returns over the next three years, and continues to represent an appropriately demanding roCe target.
over the last 12 months, we have engaged with our shareholders, and we value the views and feedback we have received. We have again written to those with the largest shareholdings about our annual incentive arrangements.
During the year, the Committee met four times, and its activities included:
> A review of the group’s overall remuneration policy to support the group’s business strategy.
> A review of external benchmarking of executive remuneration packages.
> Determination of the remuneration packages for the executive Directors and other group executives.
> A review of whether the measures for the bonus and share incentive schemes remain appropriate.
> Determination of appropriate performance targets for bonus and share incentive schemes.
> Determination of whether targets for the bonus and share incentive schemes were achieved.
the remuneration Committee discussed and agreed to designate the outgoing Ceo, Mark robertshaw as a ‘good leaver’ with regard to his existing incentive awards. this was in recognition of his leadership and significant contribution to re-shaping Morgan over the past eight years, improving the resilience and quality of the group, and leaving a strong legacy for the future.
pete raby has now been announced as the group’s new Ceo, and he joins in August 2015. Full details of his remuneration and the buyout of his incentive awards forfeited on leaving his former employer are shown in this report within the section on implementation of remuneration policy for 2015.
this report is intended to be consistent with the current reporting regulations for executive remuneration. I hope we have been successful in achieving the clarity and transparency that will be of help to our shareholders.
dOUGlAS CASterCHAIrMAn oF tHe reMunerAtIon CoMMIttee
reMunerAtIon report
A StAteMent to SHAreHolDerS FroM tHe CHAIrMAn oF tHe reMunerAtIon CoMMIttee

64 GOvernAnCe GOvernAnCe 65
Morgan aDVanCED MaTErIaLS annuaL rEporT 2014
Compliance statementthis report covers the period 1 January 2014 to 31 December 2014 and provides details of the remuneration Committee and remuneration policy of Morgan Advanced Materials.
the Company has complied with the principles and provisions relating to Directors’ remuneration in the uK Corporate governance Code, and this remuneration report has been prepared in accordance with Schedule 8 of the large & Medium-sized Companies and groups (Accounts and reports) (Amendment) regulations 2013. the Directors’ remuneration policy remains unchanged from that approved by shareholders at the 2014 AgM and hence, in accordance with Section 439A of the Companies Act, only an advisory resolution to approve the Annual report on remuneration will be proposed at the AgM on 8 May 2015.
remuneration Committeethe remuneration Committee is responsible for developing group policy on executive remuneration and for determining, on behalf of the Board, specific remuneration packages for the executive Directors and the Chairman. the Committee’s terms of reference are available on the group’s website.
the remuneration Committee consults the Chief executive officer (Ceo) and invites him to attend meetings when appropriate. the Director of Human resources attends meetings of the Committee by invitation. the Committee also had access to advice from the Chief Financial officer. the Company Secretary acts as secretary to the Committee. no executive Director or other attendee is present when his own remuneration is being discussed.
Membership of the Committee is shown on page 71.
1. POliCy rePOrtKey principles of the executive directors’ remuneration policythe remuneration Committee aims to ensure that all the remuneration packages offered are competitive and designed to attract, retain and motivate executive Directors and senior executives of the right calibre in order to run the group successfully, and to create value for shareholders.
the policy of the Committee is to ensure that a significant proportion of the total remuneration opportunity is performance-related, with particular emphasis on long-term performance, and based on the achievement of measurable targets that are relevant to and support the business strategy.
the Committee believes that the current remuneration policy for executive Directors (which is set out over the following pages and is intended to apply for a period of three years, having been approved by shareholders at the 2014 AgM) remains appropriate for 2015. the remuneration Committee will keep remuneration policy under periodic review to ensure it remains aligned with the group’s strategy, and in line with the principles set out in the uK Corporate governance Code in relation to Directors’ remuneration, as well as the guidance of institutional investors and their representative bodies.
reMunerAtIon reportcontinued

64 GOvernAnCe GOvernAnCe 65
AnnuAl report 2014 MorgAn ADVAnCeD MAterIAlS
oVe
rVIe
WSt
rAt
egIC
rep
ort
go
Vern
AnC
eFI
nAn
CIA
l St
AteM
entS
purpoSe AnD lInK to StrAtegy operAtIon opportunIty
perForMAnCe MetrICS
Fixed payBase salaryprovides the fixed element of the remuneration package. Set at competitive levels against the market.
Base salaries are generally reviewed each January, with reference to the salary levels at companies of similar sector, size and complexity in the FtSe 350. the Committee also considers individual contribution and the range of salary increases applying across the group when determining increases.
Base salary increases are applied in line with the outcome of the annual review. Salaries in respect of the year under review (and for the following year) are disclosed in the Annual report on remuneration.
Salary increases for executive Directors will normally be within the range of increases for the general employee population over the period of this policy. Where increases are awarded in excess of those for the wider employee population, for example in instances of sustained strong individual performance, or if there is a material change in the responsibility, size or complexity of the role, the Committee will provide the rationale in the relevant year’s Annual report on remuneration.
not applicable.
Pensionprovides post-retirement benefits for participants in a cost-efficient manner.
Defined benefit scheme subject to a notional earnings cap with an above-the-cap allowance for current executive Directors.
Defined contribution scheme (and/or a cash allowance in lieu thereof) for future external hires.
opportunities vary depending on the scheme in which an executive participates. Details for the executive Directors are set out in the Annual report on remuneration on pages 73 and 74.
Above-the-cap pension allowances will be established in line with our principle to be broadly cost-neutral.
For future hires, defined contributions (or cash in lieu thereof) will be up to 20% of salary.
not applicable.
BenefitsDesigned to be competitive in the market in which the individual is employed.
Can include company car/car allowance, health insurance and, where appropriate, relocation allowances and other expenses.
Benefits values vary by role and are reviewed periodically relative to market.
It is not anticipated that the cost of benefits provided will change materially year-on-year over the period for which this policy will apply.
the Committee retains the discretion to approve a higher cost in exceptional circumstances (eg relocation expenses, expatriation allowances, etc) or in circumstances where factors outside the group’s control have changed materially (eg market increases in insurance costs).
Benefits in respect of the year under review are disclosed in the Annual report on remuneration.
not applicable.
Summary of Morgan Advanced Materials’ remuneration policy for executive directorsthis section of our report summarises the key components of remuneration for executive Directors. It remains unchanged from that published in last year’s remuneration report and approved by shareholders at the 2014 AgM, other than the following minor changes;
> pay scenario charts have been updated to reflect the 2015 packages for executive Directors. > rationale for the selection of annual bonus measures has been moved to the Annual report on remuneration. > page references have been updated.

66 GOvernAnCe GOvernAnCe 67
Morgan aDVanCED MaTErIaLS annuaL rEporT 2014
purpoSe AnD lInK to StrAtegy operAtIon opportunIty
perForMAnCe MetrICS
variable payAnnual bonusIncentivises the achievement of specific goals over the short-term that are also aligned to the long-term business strategy.
performance measures are set by the Committee at the start of the year and are weighted to reflect a balance of financial and strategic objectives.
At the end of the year, the remuneration Committee determines the extent to which these have been achieved.
Between 0% and 100% of salary, depending on performance.
the payout for threshold performance may vary year-on-year, but will not exceed 25% of the maximum opportunity.
Bonuses for the Ceo, CFo and Coo may be based on a combination of financial and non-financial measures. the weighting of non-financial performance will be capped at 20% of the maximum opportunity.
Further details are set out in the Annual report on remuneration on page 72.
Bonus deferral Share Matching Plan (BdSMP)Designed to encourage long-term profitable growth and to retain key individuals over this time period. provides an opportunity for individuals to invest in Company shares and receive matching shares based on group performance.
participants can elect to voluntarily defer a proportion of their annual bonus into shares for three years and receive a matching opportunity based on performance.
Award levels and performance conditions on which vesting depends, are reviewed prior to the start of each cycle to ensure they remain appropriate.
Dividend shares may accrue on the invested and matching shares during the performance period and are released to participants at the end of the vesting period depending on the level of performance.
up to 75% of the annual bonus may be voluntarily deferred into shares for three years.
Whilst the plan maximum is 75%, the policy is to make awards/allow deferral of 50%, unless exceptional circumstances apply.
A matching award of up to three shares for each deferred share may be earned based on group performance. At threshold levels of performance, no matching shares vest.
the vesting of awards is usually subject to:
> continued employment > the group’s performance
(currently epS growth) against stretching targets over a three-year performance period.
the Committee has discretion to adjust the measures, their weighting, and performance targets prior to the start of each cycle to ensure they continue to align with the group’s strategy.
Further details of the measures attached to the BDSMp in the year under review (and the coming year) are set out in the Annual report on remuneration on pages 75 and 76.
long-term incentive Plan (ltiP)Aligns the interests of executives and shareholders by delivering shares to executive Directors and other senior executives as a reward for outstanding long-term performance.
the remuneration Committee has the ability each year to grant an award under the ltIp.
the award levels and performance conditions on which vesting depends are reviewed prior to the start of each award cycle to ensure they remain appropriate.
the ltIp provides for a conditional award of shares up to an annual limit of 200% of salary.
30% of an award vests for achievement at threshold level of performance.
the vesting of awards is usually subject to:
> continued employment > the group’s performance over a
three-year performance period, currently a combination of total Shareholder return (tSr), earnings per Share (epS), and return on Capital employed (roCe).
the Committee has discretion to adjust the measures, their weighting, and performance targets prior to the start of each cycle to ensure they continue to align with the group’s strategy.
Further details of the measures attached to the ltIp awarded in the year under review (and the coming year) are set out in the Annual report on remuneration on pages 75 and 77.
SharesaveA voluntary scheme open to all uK employees which aligns the interests of participants with shareholders through any growth in the value of shares.
An HMrC approved scheme where employees may save up to a monthly savings limit out of their own pay towards options granted at up to a 20% discount. options may not be exercised for three years.
up to the savings limit as determined by HMrC from time to time, across all Sharesave schemes in which an individual has enrolled.
none.
reMunerAtIon reportcontinued

66 GOvernAnCe GOvernAnCe 67
AnnuAl report 2014 MorgAn ADVAnCeD MAterIAlS
oVe
rVIe
WSt
rAt
egIC
rep
ort
go
Vern
AnC
eFI
nAn
CIA
l St
AteM
entS
Payments under existing awardsthe Company will honour any commitment entered into, and Directors will be eligible to receive payment from any award granted, prior to the approval and implementation of the remuneration policy detailed in this report (ie before 9 May 2014), even if these commitments and/or awards fall outside the above policy. the Company will also honour any commitment entered into at a time prior to an individual becoming a Director if, in the opinion of the Committee, the payment was not in consideration for the individual becoming a Director of the Company. Details of these awards are, and will be, disclosed in the Annual report on remuneration.
difference in policy between executive directors and other employeesthe remuneration policy for other employees is based on broadly consistent principles as those described in this report for the executive Directors. Annual salary reviews across the group take into account business performance, local pay and market conditions, and salary levels for similar roles in comparable companies. All executives are eligible to participate in an annual bonus scheme. opportunities and performance measures vary by organisational level, geographical region and an individual’s role. other members of the executive Committee participate in the BDSMp and ltIp on similar terms to the executive Directors, although award sizes may vary according to each individual, and by organisational level. Below this level, executives are eligible to participate in the ltIp and other share-based incentives, by annual invitation.
Use of discretionto ensure fairness and align executive Director remuneration with underlying individual and group performance, the Committee may exercise its discretion to adjust, upwards or downwards, the outcome of any short- or long-term incentive plan payment (within the limits of the relevant plan rules) for corporate or exceptional events including, but not limited to: corporate transactions, changes in the group’s accounting policies, minor or administrative matters, internal promotions, external recruitment, terminations, etc. Any adjustments in light of corporate events will be made on a neutral basis, ie to not be to the benefit or detriment of participants.
Any use of discretion by the Committee during the financial year will be detailed in the relevant Annual report on remuneration.
Performance measure selectionthe Committee considers carefully the selection of performance measures at the start of each performance cycle, taking into consideration the macro-economic environment as well as specific group strategic objectives.
Annual bonus measures are selected to closely reinforce Morgan’s short-term KpIs. Because these can change from year-to-year (in line with the approved remuneration policy), rationale for the selection of bonus measures for each year has been moved to the Annual report on remuneration.
ltIp performance measures are reviewed periodically to ensure they continue to align with the Company’s strategy, as well as provide an appropriate balance between growth and returns, internal and external performance, and absolute and relative performance.
the tSr comparator group comprises the circa 110 constituents of the FtSe All-Share Industrials Index. this benchmark is robust to M&A activity and comprises companies that are subject to the same market influences as Morgan Advanced Materials. the vesting performance range is calibrated to be stretching and in line with common market practice for FtSe tSr-based long-term incentives.
epS targets are set taking account of multiple relevant reference points, including internal forecasts, external expectations for future epS performance at both Morgan Advanced Materials and its closest sector peers, and typical epS performance ranges at other FtSe 350 companies. ltIp epS performance ranges are set to represent demanding and challenging performance targets over the three-year performance period.
roCe targets are set using a similar approach referring to external reference points and reflecting the returns required to meet and exceed the group’s internal strategic plan.
For the BDSMp, the epS performance range is set at very demanding levels of stretch for full vesting in recognition of the maximum matching opportunity awarded on an executive Director’s own investment in the plan.
Share ownership guidelinesIn order to encourage alignment with shareholders, individual shareholding guidelines are operated for executive Directors. under such guidelines, executive Directors are encouraged to build and maintain over time a shareholding in the Company equivalent to at least 100% of basic salary. this policy is supported by the BDSMp under which participants are encouraged to invest their bonus in Company shares.
From 2013, the shareholding guideline for the Ceo was increased to at least 150% of basic salary.
Current executive Director shareholdings are set out in the Annual report on remuneration on page 80.
external appointmentsWith the approval of the Board in each case, and subject to the overriding requirements of the group, executive Directors may accept external appointments as non-executive Directors of other companies and retain any fees received. Details of external directorships held by executive Directors along with fees retained are provided on page 75.

68 GOvernAnCe GOvernAnCe 69
Morgan aDVanCED MaTErIaLS annuaL rEporT 2014
Pay-for-performance: scenario analysisthe graphs below provide detailed illustrations of the potential future reward opportunity for executive Directors, and the potential mix between the different elements of remuneration under three different performance scenarios; ‘Below threshold’, ‘target’ and ‘Stretch’. these have been updated to illustrate the potential opportunity under the 2015 packages agreed for our executive Directors, including the annualised, ongoing package agreed for our new Ceo on his joining Morgan Advanced Materials plc in 2015.
reMunerAtIon reportcontinued
Fixed Pay (base salary, pension and benefits)
Annual bonus BDSMP LTIP
potential reward opportunities illustrated above are based on the policy which will apply in the forthcoming financial year, applied to the annual base salary in force at 1 January 2015 (1 August 2015 for the new Ceo). note that, for the Chief Financial officer (CFo) and Chief operating officer (Coo), this excludes the temporary allowance being paid pro rata to reflect the additional responsibilities being assumed by each executive Director until such date as the new Ceo starts at Morgan. For the new Ceo, the potential reward opportunities exclude specific one-off arrangements made in connection with his recruitment. For the annual bonus, the amounts illustrated are those potentially receivable in respect of performance for 2015. For the BDSMp, the award opportunities assume full voluntary investment in Morgan Advanced Materials shares. the ltIp is based on the face value of awards to be granted in 2015. It should be noted that any awards granted under the BDSMp and ltIp in a year do not normally vest until the third anniversary of the date of grant. this illustration is intended to provide further information to shareholders on the relationship between executive pay and performance. the values of the BDSMp and ltIp assume no increase in the underlying value of the shares, and actual amounts delivered will be further influenced by changes in factors such as the Company’s share price and the value of dividends paid. Further, the BDSMp requires an investment from an individual’s annual bonus payment. In years where the bonus is zero, no BDSMp opportunity will be available for the subsequent three-year period. the following assumptions have been made in compiling the above charts:
Scenario Annual bonus BDSMp* ltIp Fixed pay
Stretch Maximum annual bonus. performance warrants full vesting (3x match).
performance warrants full vesting (100% of the award).
latest disclosed base salary, pension and benefits.
target on-target annual bonus. performance warrants threshold vesting (no match).
performance warrants threshold vesting (30%).
Below threshold no annual bonus payable. threshold not achieved (no match).
threshold not achieved (0%).
* normally up to 50% bonus deferral.
£578k
£954k
£2,223k
PETE RABY (CEO FROM 1 AUGUST 2015)
Stretch
Target
Belowthreshold
£’000 0 500 1000 1500 2000 2500
£427k
£683k
£1,549k
KEVIN DANGERFIELD (CFO)
Stretch
Target
Belowthreshold
£’000 0 500 1000 1500 2000
£461k
£733k
£1,661k
ANDREW HOSTY (COO)
Stretch
Target
Belowthreshold
£’000 0 500 1000 1500 2000

68 GOvernAnCe GOvernAnCe 69
AnnuAl report 2014 MorgAn ADVAnCeD MAterIAlS
oVe
rVIe
WSt
rAt
egIC
rep
ort
go
Vern
AnC
eFI
nAn
CIA
l St
AteM
entS
details of executive directors’ service contractsthe executive Directors are employed under contracts of employment with Morgan Advanced Materials plc. Contracts may be terminated on 12 months’ notice given by the Company or on six months’ notice given by the executive Director concerned. Contracts end on each executive Director’s anticipated normal retirement date. the following table shows the date of the contract for each executive Director who served during the year:
Date of service agreement
notice periodexecutive Director position Date of appointment From employer From employee
Mark robertshaw* Ceo 4 August 2006 15 August 2008 12 months 6 monthsKevin Dangerfield CFo 4 August 2006 15 August 2008 12 months 6 monthsAndrew Hosty Coo 28 July 2010 17 August 2010 12 months 6 months
* Mark robertshaw left the group on 31 December 2014.
exit payments policythe group’s policy is to limit severance payments on termination to pre-established contractual arrangements comprising base salary and benefits only. In the event that the employment of an executive Director is terminated, any compensation payable will be determined in accordance with the terms of the service contract between the Company and the employee, as well as the rules of any incentive plans.
the group may terminate the employment of executive Directors by making a payment in lieu of notice equal to base salary, together with the fair value of any other benefits to which the executive is contractually entitled under his service agreement, for the duration of the notice period.
the remuneration Committee will exercise discretion in making appropriate payments in the context of settling legal claims or potential legal claims by the departing executive Director, including any other amounts reasonably due to the executive Director, for example to meet the legal fees incurred by the executive Director in connection with the termination of employment, where the Company wishes to enter into a settlement agreement and the individual must seek independent legal advice.
on termination of an executive Director’s service contract, the remuneration Committee will consider the departing Director’s duty to mitigate his loss when determining the timing of when any payment in lieu of notice will be made. there is no automatic entitlement to bonus or the vesting of long-term incentives on termination. However, the table below summarises the policy on how awards under the annual bonus and ltIp will normally be treated in specific circumstances, with the final treatment remaining subject to Committee discretion:
treatment of awards on cessation of employment and a change of control
reason for cessation Calculation of vesting/payment time of vesting
Annual bonusAll reasons the Committee may determine that a bonus is payable on cessation of employment. the amount of bonus
payable will be determined in the context of the time served during the performance year, the performance of the group and of the individual over the relevant period, and the circumstances of the Director’s loss of office. If group or individual performance has been poor, or if the individual’s employment has been terminated in circumstances amounting to misconduct, no bonus will be payable.
LTIP awards and BDSMP matching awardsInjury, disability, death, redundancy, retirement, or other such event as the Committee determines
Awards will normally be pro-rated for time and will vest based on performance over the original performance period (unless the Committee decides to measure performance to the date of cessation).
At the normal vesting date, unless the Committee decides that awards should vest earlier (eg in the event of death).
Change of control ltIp awards made after 10 May 2013: will be pro-rated for time and will vest subject to performance over the performance period to the change of control.
ltIp awards made before 10 May 2013: the Committee has discretion on the extent to which awards vest, but will normally pro-rate awards for time and performance.
ltIp awards may alternatively be exchanged for equivalent replacement awards, where appropriate.
BDSMp matching awards will normally vest subject to performance over the performance period to the change of control and will be pro-rated for time.
on change of control.
All other reasons Awards normally lapse. n/a
the remuneration Committee retains discretion, where permitted by the scheme rules, to alter these default provisions on a case-by-case basis, following a review of circumstances and to ensure fairness for both shareholders and participants.

70 GOvernAnCe GOvernAnCe 71
Morgan aDVanCED MaTErIaLS annuaL rEporT 2014
Approach to recruitment remuneration External appointmentIn cases of hiring or appointing a new executive Director from outside the group, the Committee may make use of all existing components of remuneration, as follows:
pay element policy on recruitment Maximum
Salary Based on the size and nature of the responsibilities of the proposed role; current market pay levels for comparable roles; the candidate’s experience; implications for total remuneration; internal relativities; and the candidate’s current salary.
–
pension option to join the Defined Contribution Scheme, and/or to receive a cash allowance.
–
Benefits As described in the policy table and may include, but not limited to, car, medical insurance, and relocation expenses and/or allowances.
–
Sharesave new appointees will be eligible to participate on identical terms to all other uK employees.
In line with HMrC limits.
Annual bonus As described in the policy table and typically pro-rated for proportion of year served; performance measures may include strategic and operational objectives tailored to the individual in the financial year of joining.
100% of salary.
BDSMp As described in the policy table. 225% of salary*.ltIp new appointees may be granted awards under the ltIp on similar terms
to other executives.200% of salary.
other the remuneration Committee may make an award under a different structure under the relevant listing rule to replace incentive arrangements forfeited on leaving a previous employer. Any such award would have a fair value no higher than that of the awards forfeited, taking into account relevant factors including performance conditions, the likelihood of those conditions being met and the proportion of the vesting period remaining. Details of any such award will be disclosed in the first Annual report on remuneration following its grant.
–
* Assumes maximum bonus awarded and maximum deferral of 75% of bonus into shares, with a maximum match of 3x deferred shares.
Internal promotion to the BoardIn cases of appointing a new executive Director by way of internal promotion, the policy will be consistent with that for external appointees detailed above. Where an individual has contractual commitments made prior to their promotion to executive Director, the Company will continue to honour these arrangements even if there are instances where they would not otherwise be consistent with the prevailing executive Director remuneration policy at the time of promotion.
Chairman and non-executive directors’ remuneration policy
purpose and link to strategy operation opportunity performance metrics
Annual feeto attract and retain high-calibre non-executive Directors
Annual fees paid to the Chairman and non-executive Directors are reviewed periodically. An additional fee is payable for the Senior Independent Director, and also in respect of Committee chairmanship.
Currently paid 100% in cash.
Annual fees are applied in line with the outcome of the review.
none.
reMunerAtIon reportcontinued

70 GOvernAnCe GOvernAnCe 71
AnnuAl report 2014 MorgAn ADVAnCeD MAterIAlS
oVe
rVIe
WSt
rAt
egIC
rep
ort
go
Vern
AnC
eFI
nAn
CIA
l St
AteM
entS
none of the non-executive Directors has a service contract with the Company. they do have letters of appointment. the non-executive Directors do not participate in any of the incentive, share or share option plans. the dates relating to the Chairman’s and non-executive Directors’ appointments who served during the reporting period are as follows:
non-executive Director position Date of appointment Date of letter of appointment Date of election/re-election
Andrew Shilston Chairman 8 May 2012 30 March 2012 9 May 2014Douglas Caster non-executive Director 14 February 2014 15 January 2014 9 May 2014Martin Flower* non-executive Director 10 December 2004 16 november 2004 –Andrew given† non-executive Director 7 December 2007 20 november 2007 9 May 2014Simon Heale‡ non-executive Director 18 February 2005 1 February 2005 –Victoire de Margerie non-executive Director 8 May 2012 1 March 2012 9 May 2014Andrew reynolds Smith non-executive Director 10 May 2013 14 February 2013 9 May 2014rob rowley non-executive Director 14 February 2014 15 January 2014 9 May 2014
* Martin Flower retired from the Board on 9 May 2014.† Andrew given retired from the Board on 31 December 2014.‡ Simon Heale retired from the Board on 31 March 2014.
Consideration of employment conditionsthe group seeks to promote and maintain good relations with employee representative bodies – including trade unions and works councils – as part of its broader employee engagement strategy, and consults on matters affecting employees and business performance as required in each case by law and regulation in the jurisdictions in which the group operates. In making remuneration decisions, the remuneration Committee also considers the pay and employment conditions elsewhere in the group, but the Committee does not currently consult with employees specifically on executive remuneration policy and framework. prior to the annual salary review, the remuneration Committee is briefed by the Director of Human resources about pay increase data that individual business units will consider when deciding local pay awards for their specific businesses and countries. this also forms part of the considerations for determining executive Director remuneration.
Consideration of shareholder viewsthe Committee considers shareholder views received during the year and at the Annual general Meeting each year, as well as guidance from investor representative bodies more broadly, in shaping remuneration policy. the Committee keeps the remuneration policy under regular review, to ensure it continues to reinforce the group’s long-term strategy, and aligns executive Directors with shareholders’ interests. It is the remuneration Committee’s policy to consult with major shareholders prior to any major changes to its executive remuneration policy.
2. AnnUAl rePOrt On reMUnerAtiOnthe following section provides details of how the remuneration policy was implemented during the year.
remuneration Committee membership in 2014the remuneration Committee is currently composed of five non-executive Directors. each of the non-executive Directors is regarded by the Board as independent, except the Chairman of the Company who was considered independent upon appointment. Douglas Caster and rob rowley joined the Committee on appointment to the Board on 14 February 2014. the remuneration Committee met four times during the year. Attendance at meetings by individual members is detailed in the Corporate governance report on page 51.
Summary of shareholder voting at the 2014 AGMthe following table shows the results of the advisory vote on the 2013 remuneration report at the 2014 AgM.
resolution For Against Withheld*
remuneration policy 97.84% 2.16% 421,245remuneration report 99.62% 0.38% 406,586
* Votes ‘withheld’ are not votes in law and, therefore, have not been included in the calculation of the proportion of votes ‘for’ or ‘against’ the resolution.
Committee members:Douglas Caster (Chairman)*
Andrew Shilston rob rowley‡
Andrew given† Martin Flower§
Victoire de Margerie Simon Heale>
Andrew reynolds Smith * Committee member from 14 February 2014, Chairman of the remuneration Committee from 1 April 2014.† Andrew given retired from the Board on 31 December 2014.‡ Committee member from 14 February 2014.§ Martin Flower retired from the Board on 9 May 2014.> Simon Heale retired from the Board on 31 March 2014, Chairman of the remuneration Committee until 31 March 2014.

72 GOvernAnCe GOvernAnCe 73
Morgan aDVanCED MaTErIaLS annuaL rEporT 2014
Single total figure of remuneration for executive directorsThe auditors are required to report on the information in this table.
the table below sets out a single figure for the total remuneration received by each executive Director for the year ended 31 December 2014 and the prior year.
Mark robertshaw Kevin Dangerfield Andrew Hosty2014 2013 2014 2013 2014 2013
1. Salary £507,500 £492,500 £315,000 £297,500 £346,800 £335,5672. Benefits £13,462 £14,080 £12,562 £13,225 £12,562 £12,9253. Bonus £330,890 – £205,380 – £224,380 –4. BDSMp – – – – – –5. ltIp – – – – – –6. pension £149,596 £142,352 £92,220 £83,703 £94,883 £86,8967. other – – £1,800 – £1,440 –total £1,001,448 £648,932 £626,962 £394,428 £ 680,065 £435,388
the figures have been calculated as follows:1. Base salary: amount earned for the year.2. Benefits: the taxable value of benefits received in the year. Includes private medical insurance and a company car (or car allowance).3. Annual bonus: the total bonus earned on performance during the year. Includes the value of any bonus deferred into shares for three years
under the BDSMp. Deferred bonus shares are not forfeitable and are not subject to any further performance measures.4. BDSMp: the estimated value on 31 December 2014 of 2012 BDSMp matching shares (and dividend equivalents) vesting in 2015 subject
to performance over the three-year period ended 31 December 2014. the 2013 value represents the actual value (including dividend equivalents) of 2011 BDSMp matching shares at vesting (on 23 March 2014).
5. ltIp: the estimated value on 31 December 2014 of 2012 ltIp shares vesting in 2015 subject to performance over the three-year period ended 31 December 2014. the 2013 value represents the actual value of 2011 ltIp shares at vesting (on 23 March 2014).
6. pension: 20x the increase in the value of their accrued benefit (net of inflation) over the year, less Directors’ contributions, plus the value of any Company contribution.
7. other: comprises the value of Sharesave options granted in the year, based on the embedded value at grant (20% of the grant-date share price multiplied by the number of options granted). Full details of executive Director Sharesave options are available on page 81 to 83 of the Annual report on remuneration.
incentive outcomes for the year ended 31 december 2014Annual bonus in respect of 2014 performancetargets for the annual bonus are set by the remuneration Committee, taking into account the short- and long-term requirements of the group. Challenging goals are set, which must be met before any bonus is paid. this approach is intended to align executive reward with shareholder return by rewarding the achievement of ‘stretch’ targets.
For 2014, the bonus targets for the Ceo, CFo and Coo were split between group eBItA before restructuring (weighted 60%); third-party operating Working Capital to sales % (weighted 20%); individual Strategic personal objectives (weighted 20%). the targets were set to incentivise the executive Directors to deliver stretching profit and cash performance for the group.
In addition to the achievement of the targets set, in considering any awards to be made, the Committee also takes into account the quality of the overall performance of the group.
the table below sets out retrospectively the assessment of performance relative to the 2014 bonus targets for the Ceo, CFo and Coo. Actual bonus payments are shown in the single total figure of remuneration table, above.
Annual Bonus in respect of 2014 performance
group eBItA operating working capital/sales % personal objectives
DirectorMax bonus (% salary)
% maxbonus
% payout of element
% salary earned
% maxbonus
% payout of element
% salary earned
% max bonus
% payout of element
% salary earned
total payable
Mark robertshaw 100% 60.0% 61.5% 36.9% 20.0% 51.5% 10.3% 20.0% 90.0% 18.0% £330,890Kevin Dangerfield 100% 60.0% 61.5% 36.9% 20.0% 51.5% 10.3% 20.0% 90.0% 18.0% £205,380Andrew Hosty 100% 60.0% 61.5% 36.9% 20.0% 51.5% 10.3% 20.0% 87.5% 17.5% £224,380
note: the target for a maximum payout against the group profit (eBItA before restructuring) element was £131.4 million, with the threshold for any payment of that profit element set at £121.5 million, both calculated using 2014 budgeted exchange rates. For the operating Working Captial/Sales % element, the four quarterly targets for a maximum payout were 23.72%, 22.75%, 24.20% and 21.45% respectively with each quarter being measured independently.
reMunerAtIon reportcontinued

72 GOvernAnCe GOvernAnCe 73
AnnuAl report 2014 MorgAn ADVAnCeD MAterIAlS
oVe
rVIe
WSt
rAt
egIC
rep
ort
go
Vern
AnC
eFI
nAn
CIA
l St
AteM
entS
2012 BDSMP award vesting the performance period for the 2012 BDSMp awards ended on 31 December 2014. over the period Morgan Advanced Materials’ actual epS reduced by a compound annual amount of (8.4)%, compared to the threshold annual growth rate of 8% pa. this is below the threshold performance target and, accordingly, matching shares and matching dividend shares will lapse.
DirectorInvestment
shares*
Maximum potential matching
shares
Matching dividend
sharesMatch
earned
Matching shares
released
Matching dividend
shares released
Matching shares lapsed
Matching dividend
shares lapsed Date of vesting
Mark robertshaw 70,347 211,041 – – – – – – 21 March 2015Kevin Dangerfield 11,346 34,038 – – – – – – 21 March 2015Andrew Hosty 44,988 134,964 – – – – – – 21 March 2015
* Calculated using the award price of £3.305 (the market value of one Morgan Advanced Materials ordinary share on 20 March 2012, the dealing day immediately preceding the grant date). Shares in this table are stated on a pre-tax basis. Shares awarded on a pre-tax basis are subject to tax when sold.
2012 LTIP award vesting Awards granted to all executive Directors in 2012 were subject to relative tSr performance, epS growth and group average roCe over a three-year period ended 31 December 2014. the epS target (applying to one third of each award) required three-year epS growth of 8% pa for 30% of that element to vest, rising to full vesting for epS growth of 15% pa or higher. over the period Morgan Advanced Materials’ actual epS compound annual growth was (8.4)% pa, compared to the threshold annual growth rate of 8% pa. this was below the threshold performance target and accordingly none of the award will vest under this criterion.
the tSr target (applying to one third of each award) required Morgan Advanced Materials’ three-year tSr performance to rank at median against constituents of the FtSe All-share Industrials Index for 30% of that element to vest, rising to full vesting if Morgan Advanced Materials’ tSr ranked at or above the upper quartile against this Index. Morgan Advanced Materials’ tSr was 23.2%, which was below median versus the FtSe All-share Industrials Index. Accordingly, none of the award will vest under this criterion.
the group average roCe target (applying to the remaining one third of each award) required three-year group average roCe of 33% for 30% of that element to vest, rising to full vesting for group average roCe of 37% or higher. Morgan Advanced Materials’ group average roCe was 27%, which was below the 33% threshold for this part of the award, and therefore none of the award will vest under this criterion.
this combined performance resulted in none of the 2012 ltIp awards vesting.
Director
Maximum potential ltIp
award*
Maximum potential
ltIp-CSop award
ltIp award vested
ltIp-CSop award vested
ltIp-CSop award
exercised† Date of vesting
Mark robertshaw 134,907 – – – – 27 February 2015Kevin Dangerfield 80,101 – – – – 27 February 2015Andrew Hosty 87,830 – – – – 27 February 2015
* Calculated using the award price of £3.558 (the average share price over the five dealing days from 20 February 2012 to 24 February 2012).† From the vesting date, participants have seven years to exercise ltIp-CSop awards.
PensionsIn the year under review, the three executive Directors participated in the Morgan group Senior Staff pension and life Assurance Scheme which is a contributory, HMrC-registered, defined benefit, funded occupational pension scheme. With effect from 6 April 2006 the basis of the scheme switched from final salary to career average and the normal pension age increased by five years. Its main features are now:
> A normal pension age of 65. > pension at normal pension age based on two-thirds career average pensionable salary, for those with at least 20 years’ (26 years and eight
months for joiners since 2006) potential service to age 65 on joining. > life assurance of four times basic salary. > Dependants’ pension on death.
pensionable salary is the member’s basic salary restricted to an earnings cap of £117,375 for Kevin Dangerfield, £128,200 for Andrew Hosty and £88,350 for Mark robertshaw. prior to April 2014, the earnings caps were £140,400 for Kevin Dangerfield and Andrew Hosty and £110,437 for Mark robertshaw. the 20% reduction in April 2014 was for the 2014-15 tax year in response to the reduction in HMrC’s Annual Allowance from £50,000 to £40,000.

74 GOvernAnCe GOvernAnCe 75
Morgan aDVanCED MaTErIaLS annuaL rEporT 2014
The auditors are required to report on the information in this table.
Additional information
executive Director
2014 Value of increase
in scheme benefit less Directors’
contributions £000
2013 Value of increase
in scheme benefit less Directors’ contributions
£000
Accrued pension 31 December
2014 £000 pa
Accrued pension 31 December
2013 £000 pa
Mark robertshaw 39 39 37 33Kevin Dangerfield 41 41 46 42Andrew Hosty 39 36 59 55
note: the accrued benefit entitlement for Mark robertshaw, Kevin Dangerfield and Andrew Hosty is the pension which would be paid annually on retirement based on service at the end of the year.
the value of the increase in accrued pension in excess of inflation, less each Director’s own contributions, is included in the Directors’ single figure remuneration table on page 72 of this report.
Mark robertshaw, Kevin Dangerfield and Andrew Hosty also received a pension allowance derived from the employer contributions based notionally on the registered pension scheme pensionable salary in excess of the earnings cap. these pension allowances are calculated as a fixed percentage of basic salary. the percentages are 22.1% for Mark robertshaw, 16.8% for Kevin Dangerfield and 16.5% for Andrew Hosty. prior to April 2014 the percentages were 20.9% for Mark robertshaw, 14.5% for Kevin Dangerfield and 15.2% for Andrew Hosty. the change in April 2014 arose from the reduction in pensionable salary covered by the career average pension scheme in response to the reduction in HMrC’s Annual Allowance for the 2014-15 tax year.
total pension allowances paid in the year are set out in the Directors’ single figure remuneration table on page 72 of this report.
Single total figure of remuneration for non-executive DirectorsThe auditors are required to report on the information in this table.
the table below sets out a single figure for the total remuneration received by each non-executive Director for the year ended 31 December 2014 and the prior year.
A Shilston M Flower* A given† S Heale‡
2014 2013 2014 2013 2014 2013 2014 2013
1. Fee £175,000 £175,000 £19,494 £54,000 £55,141 £54,000 £13,500 £54,0002. Benefits – – – – – – – –3. pension – – – – – – – –4. Bonus – – – – – – – –5. BDSMp – – – – – – – –6. ltIp – – – – – – – –7. other – – – – – – – –total £175,000 £175,000 £19,494 £54,000 £55,141 £54,000 £13,500 £54,000
V de Margerie A reynolds Smith§ r rowley> D Caster~
2014 2013 2014 2013 2014 2013 2014 2013
1. Fee £46,000 £46,000 £48,715 £27,000 £44,681 – £46,333 –2. Benefits – – – – – – – –3. pension – – – – – – – –4. Bonus – – – – – – – –5. BDSMp – – – – – – – –6. ltIp – – – – – – – –7. other – – – – – – – –total £46,000 £46,000 £48,715 £27,000 £44,681 – £46,333 –
* retired from the Board on 9 May 2014.† Appointed Senior Independent Director in May 2014; retired as Audit Chair in June 2014; retired from the Board on 31 December 2014.‡ retired from the Board on 31 March 2014.§ Includes correction of underpayment from 2013.> Appointed on 14 February 2014; appointed Audit Chair in June 2014.~ Appointed on 14 February 2014; appointed remuneration Chair in April 2014.
reMunerAtIon reportcontinued

74 GOvernAnCe GOvernAnCe 75
AnnuAl report 2014 MorgAn ADVAnCeD MAterIAlS
oVe
rVIe
WSt
rAt
egIC
rep
ort
go
Vern
AnC
eFI
nAn
CIA
l St
AteM
entS
Scheme interests awarded in 20142014 BDSMP awards no BDSMp award was granted to the Ceo, CFo or Coo in 2014 as their bonuses for 2013 (based on group performance only) were nil.
2014 LTIP awards grantedIn February 2014 Mark robertshaw, Kevin Dangerfield and Andrew Hosty were granted awards as follows:.
number of ltIp shares granted
number of ltIp-CSop
shares granted
Value of awards at grant
earliest date of vestingexecutive Director £as % 2013
salary†
Mark robertshaw 166,697* 8,866* 594,000 120% 28 February 2017Kevin Dangerfield 81,436* 7,232* 300,000 100% 28 February 2017Andrew Hosty 93,101* – 315,000 92.6% 28 February 2017
* Calculated using the award price of £3.3834 (the average share price over the five dealing days from 21 February to 27 February 2014).† Based on the 2013 pay award.
the Committee discusses and reviews the performance criteria for new three-year ltIp awards before they are granted. For the awards granted in 2014, the Committee considered the balance of measures in light of the group’s business plan and shareholder feedback, and decided to maintain the equal (one-third) weighting of the three performance criteria introduced in 2012. performance targets for each measure were unchanged from those attached to 2013 ltIp awards, as follows:
tSr against FtSe All-Share Industrials Index% of award
that vests epS growth% of award
that vests group roCe% of award
that vests
upper quartile 33.33% 15% pa 33.33% 37% 33.33%Median 10% 8% pa 10% 33% 10%Below median nil < 8% pa nil < 33% nil
exit payments made in yearThe auditors are required to report on this information.
Mark robertshaw resigned from the group and left on 31 December 2014. other than his remuneration for 2014, which is set out fully in the single figure of remuneration table, Mark robertshaw will retain an interest in the 2013 and 2014 ltIp cycles. this approach is consistent with the default treatment of long-term incentive awards for ‘good leavers’, and recognises the significant contribution Mark robertshaw made to re-shaping Morgan over the past eight years, improving the resilience and quality of the group and leaving a strong legacy for the future. His award opportunities will be pro-rated for time served since the commencement of the three-year performance period and, to the extent warranted by the achievement of performance conditions attaching to the awards over the full performance period, these awards will vest on their normal vesting dates. Details of his retained interests are set out in the table on page 81.
these arrangements are in line with the remuneration policy approved by shareholders at the 2014 AgM and the rules of the incentive plans.
Payments to past directorsThe auditors are required to report on this information.
no payments were made to past Directors in the year.
external appointments Details of external appointments held by executive Directors and the fees retained in 2014 are provided in the table below:
executive Director Company role Fees retained
Mark robertshaw Segro plc non-executive Director £53,000Kevin Dangerfield e2v technologies plc non-executive Director £43,000Andrew Hosty Consort Medical plc* non-executive Director £18,100†
British Ceramic research ltd non-executive Director £8,000
* Appointed as a director on 14 July 2014.† Fees retained are for the period 14 July 2014 to 31 December 2014.

76 GOvernAnCe GOvernAnCe 77
Morgan aDVanCED MaTErIaLS annuaL rEporT 2014
implementation of remuneration policy for 2015Base salaryIn line with remuneration policy and the approach being taken across the organisation, executive Directors’ salaries will be increased in 2015, with effect from 1 January. In considering the level of increase, the Committee has been mindful of the range of increases to be awarded across the group of 2% on average, as well as the positioning of individual roles against the market. Increases for all employees take into account local business unit commercial and market considerations. the table below shows the salaries in 2014, and those which took effect from 1 January 2015:
Base salary at:executive Director position 1 January 2015 1 January 2014 Increase
Kevin Dangerfield CFo £322,500 £315,000 2.4%Andrew Hosty Coo £354,000 £346,800 2.1%
In view of the need to make interim arrangements during the completion of the search and appointment of a new Ceo, the Committee considered it appropriate to award temporary additional allowances to Kevin Dangerfield, as Interim Ceo, and Andrew Hosty, for the additional responsibilities they would each undertake. these payments (of £138,750 pa and £46,000 pa to Kevin Dangerfield and Andrew Hosty respectively) will be paid in monthly instalments from 1 January 2015, and will be paid until the new Ceo starts in the role. the additional payments made during the year will be taken into account when determining the reference salary for the 2015 annual bonus, but not for any other remuneration or contractual purposes.
Annual bonusFor 2015, Cash generation will replace third-party operating Working Capital/sales percentage and will be weighted 40% of the total bonus opportunity. Cash generation is defined as eBItA plus depreciation and adjusted for the impact of working capital movements. the eBItA measure will be weighted 40%, with the remaining 20% of the bonus opportunity continuing to be based on strategic personal objectives. the Committee believes that introducing the Cash generation target will more clearly incentivise management to maintain their focus on operating efficiency in difficult markets, as generating cash continues to be an important aspect of group performance. Down-weighting profit addresses previous shareholder feedback about the focus on earnings across Morgan’s incentives, and will also help reinforce the Board’s strategy of targeting sustainable, steady profit growth over the medium to long term.
the actual performance targets set at the beginning of the performance period are not disclosed as they are considered commercially sensitive at this time, given the close link between performance measures and the group’s longer-term strategy. this is particularly relevant in the context of some of the group’s close and unlisted competitors who are not required to disclose such information, and for whom the assumptions in our targets would provide valuable information in the current trading year. We will disclose these targets retrospectively, a practice we have implemented in both the 2014 and 2013 reports, at such time as these targets have become less commercially sensitive.
BDSMP award For the bonus earned in 2014, executive Directors will have the opportunity to participate in the BDSMp for 2015, and voluntarily defer up to 50% of their bonus. the targets and vesting are as follows:
epS performance (compound annual growth)
Vesting of matching shares (as a multiple of shares under a Deferred Award)
20% pa 3x match16% pa 2x match12% pa 1x match< 8% pa zero
Awards will vest on a straight line between these points
reMunerAtIon reportcontinued
3.0x
2.0x
1.0x
0.0x8% 12% 16% 20%
BDSMP matching shares
Mat
chin
g sh
ares
Three-year EPS growth (pa)

76 GOvernAnCe GOvernAnCe 77
AnnuAl report 2014 MorgAn ADVAnCeD MAterIAlS
oVe
rVIe
WSt
rAt
egIC
rep
ort
go
Vern
AnC
eFI
nAn
CIA
l St
AteM
entS
LTIP award In February 2015 Kevin Dangerfield and Andrew Hosty will be granted awards of shares under the 2015 ltIp with face values at grant as set out below. the three-year performance period over which performance will be measured began on 1 January 2015 and will end on 31 December 2017. Further details, eg. the number of shares awarded, will be disclosed in next year’s report.
the measures and their weightings will remain unchanged from those attached to the 2014 ltIp awards (see page 84). Awards will normally be eligible to vest on 27 February 2018.
the Committee has made changes to the epS and roCe performance target ranges, as explained in the introduction to this report, to better align with the group’s long-term strategic plan, analyst forecasts and external expectations for the performance of markets in which Morgan operates and competes. the epS performance range has been widened to 6%-15% pa (from 8%-15% pa). this range, set taking into account Morgan’s strategic plan as well as broker forecasts for Morgan and its peers, is considered by the Committee to be more appropriate, but still very stretching, in the prevailing macro-economic environment.
the roCe performance range has been set at 27-33% to support the group’s strategy for sustainable long-term growth over the next three years whilst continuing to represent an appropriately demanding target.
For both of these measures, awards will continue to vest on a straight line between the thresholds and maximum points.
Value of awards at grant
£as %
2014 salaryearliest date
of vesting
Kevin Dangerfield 315,000 100% 27 February 2018Andrew Hosty 315,000 91% 27 February 2018
Malus and clawbackthe Committee has been keeping abreast of recent developments in best practice, notably the revisions by the FrC to its uK Corporate governance Code, and has agreed the following refinements to the operation of our remuneration policy for 2015:
> Malus and clawback provisions will apply to ltIp awards from 2014, and to BDSMp awards from 2015. > Clawback provisions will apply for a period of at least two years post-vesting. > Circumstances in which malus and clawback may be applied will include:
– A material misstatement in the published results of the group. – Misconduct on the part of the participant concerned. – Where, as a result of an appropriate review of accountability, a participant has been deemed to have caused in full or in part a material loss
for the group as a result of reckless, negligent or wilful actions or inappropriate values or behaviour.
the Committee will continue to review developments in this area.
Pensionno changes to pension arrangements for 2015 are currently proposed. However, the Committee is mindful that the tax treatment of pension provision could change in 2015 as a result of the general election. Any changes to pension provision made as a consequence would be consistent with the principle that the impact of any changes should be broadly cost-neutral.
Chairman and non-executive Director feesthe Chairman’s and non-executive Directors’ fees were reviewed in December 2014. they were increased by 2% for the Chairman’s fee, and 2.2% for the non-executive Directors’ base fee (the non-executive Directors’ fees being reviewed and proposed by the Chairman and Ceo, and approved by the Board). other fees were not changed. Fees will be reviewed again in December 2015. the following fees will apply in 2015:
role Fee pa
Chairman’s fee £178,500non-executive Director base fee £47,000Committee chairman additional fee £8,000Senior Independent Director additional fee £8,000

78 GOvernAnCe GOvernAnCe 79
Morgan aDVanCED MaTErIaLS annuaL rEporT 2014
Remuneration of new CEOAs announced on 30 January, pete raby will join Morgan Advanced Materials plc as Ceo with effect from 1 August 2015. pete raby’s package on joining Morgan Advanced Materials, details of which are set out below, is consistent with our approved remuneration policy and the approach to recruitment remuneration outlined earlier in this report.
element Details
Base salary £470,000 per annumpension 20% of salary contribution (or cash allowance in lieu thereof)Benefits Car allowance (£12,000 per annum), health insurance, life cover and income protectionAnnual bonus up to 100% of salary (pro-rated in the first year), subject to the same terms as the 2015 annual bonus for other executive
DirectorsBDSMp eligibility to participate in the 2016-18 cycle on identical terms as other executive Directors, if a bonus is paid for 2015 performanceltIp An award with a face value of 100% of salary (i.e. £470,000) will be made on joining. this award may vest after three years
subject to the same performance conditions as are attached to the 2015 ltIp cycle for other executive Directors.
to reflect outstanding incentive awards forfeited on leaving his former employer, a one-off award of shares with a face value (on 3 August 2015) of £400,000 will be made to pete raby on his joining Morgan Advanced Materials. this award, the structure of which replicates that of the award forfeited, will vest 50% on 31 December 2016 and 50% on 31 December 2017, subject to pete raby not having resigned from Morgan Advanced Materials or having been dismissed in specified circumstances, including for serious misconduct. Vesting is not conditional on further performance conditions. In addition, he will be entitled on vesting to receive an amount equal to any dividends that would have been paid on the shares that vest, between the award date and the relevant date of vesting.
A one-off cash sum of £50,000 will be paid to pete raby on joining to reflect the fair value of the bonus opportunity forfeited on leaving his former employer and the cost of his relocation. no further relocation allowances will be payable.
Further details will be disclosed in next year’s remuneration report.
Percentage change in CeO remunerationthe table below shows the percentage change in Ceo remuneration (2014 on 2013) compared to the average percentage change in remuneration for other uK-based group employees. the uK employee workforce was chosen as a suitable comparator group as the Ceo is based in the uK (albeit with a global role and responsibilities) and pay changes across the group vary widely depending on local market conditions. Although similar remuneration principles apply across the wider group, pay decisions for this subset are impacted by similar external market forces (eg wage inflation, local practice with respect to the provision of benefits, etc).
Ceo % change in 2014 (vs 2013)
for other employeeselements of remuneration 2014 2013 % change
Base salary received during the year £507,500 £492,500 3.0%* 2.0%taxable benefits (excluding pension) £13,462 £14,080 -4.4% 2.5%Annual bonus £330,890 £nil † 79.3%
* the actual pay rate rise awarded was 2.5% but the higher figure of 3% shown above is as a result of a change in the date for the pay award, from 1 March 2013 to 1 January 2014, which resulted in the actual amount received shown for 2013, which is lower than the annual base pay rate.
† the increase cannot be expressed as a percentage as the figure for 2013 was nil.
relative importance of spend on paythe graphs below show shareholder distributions (ie dividends and share buybacks) and total employee pay expenditure for the financial years ended 31 December 2013 and 31 December 2014, and the percentage change.
reMunerAtIon reportcontinued
£35m
£30m
£25m
£20m
£15m
£10m
£5m
£0m
£29.9m1.0% change
£30.2m
2013 2014
SHAREHOLDER DISTRIBUTIONS
£350m
£300m
£250m
£200m
£150m
£100m
£50m
£0m
£294.3m0% change
£294.3m
2013 2014
TOTAL EMPLOYEE PAY EXPENDITURE

78 GOvernAnCe GOvernAnCe 79
AnnuAl report 2014 MorgAn ADVAnCeD MAterIAlS
oVe
rVIe
WSt
rAt
egIC
rep
ort
go
Vern
AnC
eFI
nAn
CIA
l St
AteM
entS
AdvisersKepler Associates was appointed by the Committee in 2010 as its executive remuneration adviser and was retained during the most recent financial year. In 2014 Kepler Associates provided independent advice on performance measurement, the setting of incentive targets, tSr analysis, the structure of long-term incentives, and provided market data in respect of senior executive remuneration and non-executive Director fees. Kepler Associates reports directly to the Chairman of the remuneration Committee and does not provide any other material services to the group, and is considered to be independent.
Kepler Associates is a signatory of the Code of Conduct for remuneration Consultants.
Fees paid during the year to our adviser for advice to the remuneration Committee, charged on a time and materials basis, were as follows:
Adviser nature of advice Fees (incl. expenses, excl. VAt)
Kepler Associates Appointed Committee adviser £44,100
Comparison of Company performancethe graph below shows the value, at 31 December 2014, of £100 invested in Morgan Advanced Materials plc’ shares on 31 December 2008 compared with the current value of the same amount invested in the FtSe All-Share Industrials Index. the FtSe All-Share Industrials Index is chosen because this is the current comparator group for tSr-based long-term incentives.
0
50
100
150
200
250
300
350
400
2014201320122011201020092008
Data source: Bloomberg
FTSE All-Share Industrials IndexMorgan Advanced Materials plc
£358
£198
the table below details the Ceo’s ‘single figure’ of remuneration over the same six-year period.
2009 2010 2011 2012 2013 2014
Ceo single figure (£) £676,512 £1,045,984 £3,371,302 £1,285,556 £648,932 £ 1,001,448Annual bonus (% max) 20% 100% 100% 0% 0% 65%BDSMp vesting (% max) n/a 0% 60% 100% 0% 0%ltIp vesting (% max) n/a 0% 100% 50% 0% 0%

80 GOvernAnCe GOvernAnCe 81
Morgan aDVanCED MaTErIaLS annuaL rEporT 2014
directors’ interests in sharesThe auditors are required to report on the information in this table.
the interests of each person who was a director of Morgan Advanced Materials plc as at 31 December 2014 (together with interests held by their connected persons) in the ordinary share capital of the Company:
As at 1 January 2014
As at 31 December 2014
As at 12 February 2015*
Executive DirectorsMark robertshaw† 770,037 879,173 879,173Kevin Dangerfield 254,366 273,306 273,306Andrew Hosty 154,488 144,988 144,988Non-executive Directors Andrew Shilston 30,000 30,000 30,000Douglas Caster‡ –~ –~ –~
Martin Flower§ 25,000 – –Andrew given† 10,000 10,000 10,000Simon Heale> 18,000 – –Victoire de Margerie 2,000 2,000 2,000Andrew reynolds Smith –~ 5,000 5,000rob rowley‡ –~ –~ –~
* the date of this report.† Mark robertshaw and Andrew given stepped down from the Board on 31 December 2014. ‡ Appointed to the Board on 14 February 2014.§ Martin Flower retired from the Board on 9 May 2014.> Simon Heale retired from the Board on 31 March 2014.~ Directors’ qualifying shareholding requirement removed when the Company’s current Articles of Association were approved by shareholders at the 2013 AgM.
As at 3 March 2015, the Directors’ interests in shares had not changed since the end of the period under review.
executive directors’ shareholding requirementsthe table below shows the shareholding of each executive Director against their respective shareholding requirement as at 31 December 2014.
Shareholding requirement
(% 2014 salary)
Shares owned
outright
Shares subject to
performance*
performance tested but
unvested shares†
Shares subject to BDSMp
deferral‡
options vested but
unexercised§
Current shareholding
(% 2014 salary)>guideline
met?
Mark robertshaw 150% 879,173 173,192 345,948 37,283 – 572% yesKevin Dangerfield 100% 273,306 190,796 114,139 6,013 3,515 281% yesAndrew Hosty 100% 144,988 227,506 222,794 27,804 7,031 158% yes
* 2013 and 2014 ltIp and ltIp-CSop awards and 2013 and 2014 BDSMp matching awards.† 2012 ltIp and ltIp-CSop awards and 2012 BDSMp matching shares for the three-year performance period that ended on 31 December 2014. the 2012 ltIp vests on 27 February
2015 and the 2012 BDSMp vests on 21 March 2015.‡ estimated net number of shares voluntarily deferred under the BDSMp.§ options granted under the Sharesave scheme.> Based on an executive Director’s 2014 salary and the share price at 31 December 2014, comprising shares owned outright and shares subject to deferral (estimated net number
of shares voluntarily deferred under the BDSMp).
reMunerAtIon reportcontinued

80 GOvernAnCe GOvernAnCe 81
AnnuAl report 2014 MorgAn ADVAnCeD MAterIAlS
oVe
rVIe
WSt
rAt
egIC
rep
ort
go
Vern
AnC
eFI
nAn
CIA
l St
AteM
entS
unless otherwise stated, figures given in the tables on pages 81 to 83 are for shares or interests in shares.
Mark robertshaw*
The auditors are required to report on the information in this table.
LTIP
Status plan
As at 1 January
2014
Allocations during
the year
released during
the year
lapsed during
the year
As at 31 December
2014
Market price at date of
allocation
Market price on date of
release performance period
no further performance conditions, lapsed 2011 171,068 – – 171,068 – 292.28p – 03.01.11 - 31.12.13
no further performance conditions, not yet released 2012 134,907 – – – 134,907 355.80p – 02.01.12 - 31.12.14
Subject to performance conditions
2013 172,006 – – 57,335 114,671§ 279.06p – 01.01.13 - 31.12.152014 – 166,697 – 111,131 55,566§ 338.34p 01.01.14 - 31.12.162014
Funding – 8,866 – – 8,866 338.34p – 01.01.14 - 31.12.16
Bonus Deferral Share Matching Plan
Status plan
As at 1 January
2014
Allocations during
the year
released during
the year
lapsed during
the year
As at 31 December
2014
Market price at date of
allocation
Market price on date of
release performance period
no further performance conditions, released/lapsed
2011 Investment 74,875 – 74,875 – – 300.50p 346.00p
03.01.11 - 31.12.132011 Matching 224,625 – – 224,625 – 300.50p –
2011 Dividend† – 7,397 7,397 – – Various‡ 346.00p
no further performance conditions, not yet released
2012 Investment 70,347 – – – 70,347 330.50p –
02.01.12 - 31.12.142012
Matching 211,041 – – – 211,041 330.50p –
Share options
Status plan
As at 1 January
2014
Allocations during
the year
released during
the year
lapsed during
the year
As at 31 December
2014
Market price at date of
allocation
Market price on date of
release performance period
exercisable eSoS 200,000 – 200,000 – – 145.27p 339.15p 01.01.04 - 31.12.06Subject to performance conditions
2014 ltIp CSop – 8,866 – 5,911 2,955§ 338.34p – 01.01.14 - 31.12.16
Total interests in share plansAs at 1 January 2014 As at 31 December 2014
1,258,869 598,353>
* Mark robertshaw left Morgan Advanced Materials plc on 31 December 2014.† Dividend shares received on 2011 Investment shares.‡ the price used for BDSMp dividend shares is the closing share price of one Morgan Advanced Materials ordinary share trading on the london Stock exchange on the dividend
payment date.§ the 2013 and 2014 ltIp awards and 2014 ltIp-CSop award outstanding as at 31 December 2014 have been pro-rated for time served up to the date of leaving as a proportion
of the performance period.> Includes a funding award that is not transferable to Mark robertshaw.

82 GOvernAnCe GOvernAnCe 83
Morgan aDVanCED MaTErIaLS annuaL rEporT 2014
Kevin dangerfieldThe auditors are required to report on the information in this table.
LTIP
Status plan
As at 1 January
2014
Allocations during
the year
released during
the year
lapsed during
the year
As at 31 December
2014
Market price at date of
allocation
Market price on date of
release performance period
no further performance conditions, released
2010 Funding 5,390 – 1,627 3,763 – 205.10p 339.94p 04.01.10 - 31.12.12
no further performance conditions, lapsed
2011 84,185 – – 84,185 – 292.28p – 03.01.11 - 31.12.132011
Funding 6,481 – – 6,481 – 292.28p – 03.01.11 - 31.12.13
no further performance conditions, not yet released
2012 80,101 – – – 80,101 355.80p – 02.01.12 - 31.12.14
Subject to performance conditions
2013 100,147 – – – 100,147 279.06p – 01.01.13 - 31.12.152013
Funding 1,981 – – – 1,981 279.06p – 01.01.13 - 31.12.15
2014 – 81,436 – – 81,436 338.34p – 01.01.14 - 31.12.162014
Funding – 7,232 – – 7,232 338.34p – 01.01.14 - 31.12.16
Bonus Deferral Share Matching Plan
Status plan
As at 1 January
2014
Allocations during
the year
released during
the year
lapsed during
the year
As at 31 December
2014
Market price at date of
allocation
Market price on date of
release performance period
no further performance conditions, released/lapsed
2011 Investment 22,046 – 22,046 – – 300.50p 357.20p
03.01.11 - 31.12.132011 Matching 66,138 – – 66,138 – 300.50p –
2011 Dividend† – 2,176 2,176 – – Various‡ 357.20p
no further performance conditions, not yet released
2012 Investment 11,346 – – – 11,346 330.50p –
02.01.12 - 31.12.142012
Matching 34,038 – – – 34,038 330.50p –
Share options
Status plan
As at 1 January
2014
Allocations during
the year
released during
the year
lapsed during
the year
As at 31 December
2014
Market price at date of
allocation
Market price on date of
release performance period
exercisable 2010 ltIp CSop 2,695 – 2,695 – – 205.10p 339.94p 04.01.10 - 31.12.12
no further performance conditions, lapsed
2011 ltIp CSop 6,481 – – 6,481 – 292.28p – 03.01.11 - 31.12.13
Subject to performance conditions
2013 ltIp CSop 1,981 – – – 1,981 279.06p – 01.01.13 - 31.12.15
2014 ltIp CSop – 7,232 – – 7,232 338.34p – 01.01.14 - 31.12.16
Subject to continued service only
2011 Sharesave 4,225 – 4,225 – – 213.00p 299.70p 01.12.11 - 30.11.14
2014 Sharesave – 3,515 – – 3,515 256.00p – 01.12.14 - 30.11.17
Total interests in share plans
As at 1 January 2014 As at 31 December 2014
427,235> 329,009>
† Dividend shares received on 2011 Investment shares.‡ the price used for BDSMp dividend shares is the closing share price of one Morgan Advanced Materials ordinary share trading on the london Stock exchange on the dividend
payment date.> Includes funding awards that are not transferable to Kevin Dangerfield.
reMunerAtIon reportcontinued

82 GOvernAnCe GOvernAnCe 83
AnnuAl report 2014 MorgAn ADVAnCeD MAterIAlS
oVe
rVIe
WSt
rAt
egIC
rep
ort
go
Vern
AnC
eFI
nAn
CIA
l St
AteM
entS
Andrew hostyThe auditors are required to report on the information in this table.
LTIP
Status plan
As at 1 January
2014
Allocations during
the year
released during
the year
lapsed during
the year
As at 31 December
2014
Market price at date of
allocation
Market price on date of
release performance period
no further performance conditions, lapsed 2011 102,641 – – 102,641 – 292.28p – 03.01.11 - 31.12.13
no further performance conditions, not yet released
2012 87,830 – – – 87,830 355.80p – 02.01.12 - 31.12.14
Subject to performance conditions
2013 101,233 – – 101,233 279.06p – 01.01.13 - 31.12.152013
Funding 10,750 – – 10,750 279.06p – 01.01.13 - 31.12.15
2014 – 93,101 – – 93,101 338.34p – 01.01.14 - 31.12.16
Bonus Deferral Share Matching Plan
Status plan
As at 1 January
2014
Allocations during
the year
released during
the year
lapsed during
the year
As at 31 December
2014
Market price at date of
allocation
Market price on date of
release performance period
no further performance conditions, released/lapsed
2011 Investment 39,933 – 39,933 – – 300.50p 357.25p
03.01.11 - 31.12.132011 Matching 119,799 – – 119,799 – 300.50p –
2011 Dividend† – 3,943 3,943 – – Various‡ 357.25p
no further performance conditions, not yet released
2012 Investment 44,988 – – – 44,988 330.50p –
02.01.12 - 31.12.142012
Matching 134,964 – – – 134,964 330.50p –
Subject to performance conditions
2013 Investment 7,474 – – – 7,474 286.40p –
01.01.13 - 31.12.152013
Matching 22,422 – – – 22,422 286.40p –
Share options
Status plan
As at 1 January
2014
Allocations during
the year
released during
the year
lapsed during
the year
As at 31 December
2014
Market price at date of
allocation
Market price on date of
release performance period
Subject to performance conditions
2013 ltIp CSop 10,750 – – – 10,750 279.06p – 01.01.13 - 31.12.15
Subject to continued service only
2011 Sharesave 3,380 – – – 3,380 213.00p – 01.12.11 - 30.11.14
2012 Sharesave 841 – – – 841 214.00p – 01.12.12 - 30.11.15
2014 Sharesave – 2,812 – – 2,812 256.00p – 01.12.14 - 30.11.17
Total interests in share plans
As at 1 January 2014 As at 31 December 2014
687,005 520,545>
† Dividend shares received on 2011 Investment shares.‡ the price used for BDSMp dividend shares is the closing share price of one Morgan Advanced Materials ordinary share trading on the london Stock exchange on the dividend
payment date. > Includes a funding award that is not transferable to Andrew Hosty.

84 GOvernAnCe GOvernAnCe 85
Morgan aDVanCED MaTErIaLS annuaL rEporT 2014
reMunerAtIon reportcontinued
details of plans
LTIP
plan Details
2012
Awards granted to the Ceo and CFo in 2012 are subject to relative tSr, epS and roCe. the epS target (applying to a third of each award) requires three-year epS growth above a threshold of 8% pa of that element to vest, commencing at 30% vesting for that element, rising to full vesting for epS growth of 15% pa or higher. the tSr target (applying to another third of each award) requires Morgan Advanced Materials’ three-year tSr performance to rank at median against the FtSe All-Share Industrials Index for 30% of that element to vest, rising to full vesting if Morgan Advanced Materials’ tSr ranks at or above the upper quartile against the companies in this Index. For the Ceo and CFo, the roCe element has been set for a 33-37% pa range, vesting on a straight line basis, with 30% of the measure vesting at the 33% threshold. roCe is measured as the average annual roCe over the three-year performance period.
For the Coo (who, at the time of the award was Ceo Morgan Ceramics), one third of the award was to vest on relative tSr, with the remaining two thirds to vest on a divisional eBItA/roCe matrix. For the eBItA/roCe element, there would have been no vesting unless eBItA growth in Morgan Ceramics was at least 6% pa and roCe was 41.0% in 2014; full vesting would have occurred for eBItA growth of 15% pa and roCe of 43.5%.
In May 2013, following the announced change in divisional structure, and following consultation with shareholders, it was decided to change these targets for Andrew Hosty to make them relevant to his new role as Coo. prior to the announcement of the reorganisation, just over one year of the three-year 2012 ltIp performance period had elapsed. to reflect the group-wide remit of his new role as Coo, and to help ensure his interests are aligned with those of the Ceo, CFo and shareholders, it was agreed that the Ceramics divisional targets attached to his 2012 ltIp be replaced by group targets aligned with those attached to the 2012 ltIp awards awarded to the Ceo and CFo, as detailed above. It was also agreed that for the purpose of alignment across the executive Directors, performance against these revised targets will be assessed over the full, original three-year performance period (ie 1 January 2012 to 31 December 2014).
2013 and 2014
Awards granted to executive Directors in 2013 and 2014 are subject to relative tSr, epS and roCe. the epS target (applying to a third of each award) requires three-year epS growth above a threshold of 8% pa of that element to vest, commencing at 30% vesting for that element, rising to full vesting for epS growth of 15% pa or higher. the tSr target (applying to another third of each award) requires Morgan Advanced Materials’ three-year tSr performance to rank at median against the FtSe All-Share Industrials Index for 30% of that element to vest, rising to full vesting if Morgan Advanced Materials’ tSr ranks at or above the upper quartile against the companies in this Index. the roCe element has been set for a 33-37% pa range, vesting on a straight-line basis, with 30% of the measure vesting at the 33% threshold. roCe is measured as the average annual roCe over the three-year performance period (for the 2013 cycle) and as the roCe in the final year of the performance period for the 2014 cycle.

84 GOvernAnCe GOvernAnCe 85
AnnuAl report 2014 MorgAn ADVAnCeD MAterIAlS
oVe
rVIe
WSt
rAt
egIC
rep
ort
go
Vern
AnC
eFI
nAn
CIA
l St
AteM
entS
details of plans continued
Bonus Deferral Matching Plan
plan Details
2012 Deferral of bonus on a gross basis. Matching awards granted to executive Directors in 2012, 2013 and 2014 are subject to three-year epS growth. the epS target requires three-year epS growth above a threshold of 8% pa before any matching, 12% pa for a 1x match, 16% pa for a 2x match, and 20% pa or higher for a 3x match. there is straight-line vesting between these points.
20132014
Share optionsplan Details
eSoS
the performance measure for the executive Share option Scheme awards was based on the Company’s tSr performance against the FtSe 350. 30% of the awards vested for median-ranked performance with full vesting for upper-quartile-ranked performance. For performance between median and upper quartile, awards vested on a straight-line pro-rata basis. Following the exercise of options under the eSoS by Mark robertshaw in 2014, there are no outstanding options held by the executive Directors.
2013 and 2014 ltIp – CSop
ltIp 2013: For the CFo and Coo awards were structured as an Approved performance Share plan (ApSp) and comprise three elements: (i) HM revenue & Customs (HMrC) approved options (CSop) over shares to the value of up to £30,000 with an exercise price of 279.06 pence per share; (ii) an ltIp award in the form of a conditional award of free shares to the value of the remainder of the award above this limit; and (iii) a funding award, also in the form of a conditional award of free shares, over such numbers of shares whose value at exercise at the approved option equals up to £30,000. For the Ceo, the 2013 award was structured as an ltIp award in the form of a conditional award of free shares.
the provisions of these CSop options, funding awards and ltIp awards was linked so that the maximum aggregate number of shares that could be acquired on exercise of ltIp and CSop awards (the funding award being used to pay the exercise price arising on exercise of the CSop) was limited to that number of shares that had a market value on the date of the awards equal to 100% of Kevin Dangerfield’s 2012 base salary and 100% of Andrew Hosty’s 2012 base salary. Vested funding awards were not transferable to the participant.
ltIp 2014: For the Ceo and CFo awards were structured as an Approved performance Share plan (ApSp) as described under the 2013 ltIp above. For the Coo, the 2013 award was structured as an ltIp award in the form of a conditional award of free shares.
2012 Sharesave HMrC approved all-employee Sharesave scheme. exercise price set at 20% discount to share price on date of grant. options vest after three years of continuous service and must be exercised within six months of vesting. Details of options held by Directors under Sharesave are outlined in the individual Director shareholding tables above.
2013 Sharesave2014 Sharesave
other transactions involving Directors are set out in note 26 (related parties) to the Financial Statements.
this report was approved by the Board on 12 February 2015.
Signed on behalf of the Board.
dOUGlAS CASterCHAIrMAn oF tHe reMunerAtIon CoMMIttee

86 GOvernAnCe GOvernAnCe 87
Morgan aDVanCED MaTErIaLS annuaL rEporT 2014
otHer DISCloSureS
the Directors’ report is required to be produced by law. the uKlA’s Disclosure and transparency rules (Dtrs) and listing rules (lrs) also require the Company to make certain disclosures.
pages 46 to 89 inclusive (together with the sections of the Annual report incorporated by reference) constitute a Directors’ report that has been drawn up and presented in accordance with applicable law, and the liabilities of the Directors in connection with that report are subject to the limitations and restrictions provided by that law.
the CompanyLegal form of the CompanyMorgan Advanced Materials plc is a company incorporated in england and Wales with company number 286773.
Name changethe Company changed its name to Morgan Advanced Materials plc (from the Morgan Crucible Company plc) on 27 March 2013.
Annual General Meetingthe Company’s 2015 AgM will be held on Friday 8 May 2015 at the lincoln Centre, 18 lincoln’s Inn Fields, london WC2A 3eD. A Circular incorporating the notice of AgM accompanies this Annual report.
Statutory disclosures Amendment of the Articles of Associationthe Company’s constitution, known as the Articles of Association (Articles), is essentially a contract between the Company and its shareholders, governing many aspects of the management of the Company. the Articles may be amended by special resolution of the Company’s shareholders and are available on the Company’s website at www.morganadvancedmaterials.com.
Appointment and replacement of Directorsthe Articles provide that the Company may by ordinary resolution at general meeting appoint any person to act as a Director, provided that notice is given of the resolution identifying the proposed person by name and that the Company receives written confirmation of that person’s willingness to act as Director if he has not been recommended by the Board. the Articles also empower the Board to appoint as a Director any person who is willing to act as such. the maximum possible number of Directors under the Articles is 15. the Articles provide that the Company may by special resolution, or by ordinary resolution of which special notice is given, remove any Director before the expiration of his period of office. the Articles also set out the circumstances in which a Director shall vacate office. the Articles require that at each annual general meeting any Director who was appointed after the previous annual general meeting must be proposed for election by the shareholders. Additionally, any other Director who has not been elected or re-elected at one of the previous two annual general meetings must be proposed for re-election by the shareholders. the Articles also allow the Board to select any other Director to be proposed for re-election. In each case, the rules apply to Directors who were acting as Directors on a specific date selected by the Board. this is a date not more than 14 days before, and no later than, the date of the notice of the annual general meeting.
notwithstanding the provisions of the Articles, all the Directors will stand for election or re-election on an annual basis in compliance with the provisions of the uK Corporate governance Code. Details of their career history and the Board Committees on which they serve can be found on pages 46 and 47.
Results and dividends the total profit (profit attributable to owners of the parent and non-controlling interests) for the year ended 31 December 2014 was £12.3 million (2013: £44.7 million). profit before taxation for the same period was £31.5 million (2013: £64.0 million). revenue was £921.7 million (2013: £957.8 million) and operating profit was £54.3 million (2013: £89.6 million). Basic earnings per share from continuing operations was 2.7 pence (2013: 14.8 pence). Capital and reserves at the end of the year were £187.7 million (2013: £274.1 million). the total profit of £12.3 million will be transferred to equity.
the Directors recommend the payment of a final dividend at the rate of 7.0 pence per share on the ordinary share capital of the Company, payable on 29 May 2015 to shareholders on the register at the close of business on 8 May 2015. together with the interim dividend of 3.9 pence per share paid on 28 november 2014, this final dividend, if approved by shareholders, brings the total distribution for the year to 10.9 pence per share (2013: 10.5 pence).
DirectorsAll those who served as Directors at any time during the year under review are listed on pages 46 and 47, with the exception of Simon Heale, who resigned from the Board on 31 March 2014, Martin Flower, who resigned from the Board on 9 May 2014, and Mark robertshaw and Andrew given who both resigned from the Board on 31 December 2014.
Powers of the DirectorsSubject to the Company’s Articles, uK legislation and any directions given by special resolution, the business of the Company is managed by the Board, which may exercise all the powers of the Company.
Directors’ interestsDetails of Directors’ interests (and their connected persons’ beneficial interests) in the share capital of the Company are listed on page 80.
Directors’ indemnitiesthe Company has entered into separate indemnity deeds with each Director containing qualifying indemnity provisions, as defined at section 236 of the Companies Act 2006, under which the Company has agreed to indemnify each Director in respect of certain liabilities which may attach to each of them as a Director or as a former Director of the Company or any of its subsidiaries. the indemnity deeds were in force during the financial year to which this Directors’ report relates and are in force as at the date of approval of the Directors’ report.
Information required by LR 9.8.4Rthere is no information required to be disclosed under lr 9.8.4r.
Human resources Details of the group’s human resources policies and employee involvement are set out on pages 31 and 32.
there are no agreements between the Company and its Directors or employees providing for compensation for loss of office or employment (whether through resignation, purported redundancy or otherwise) that occurs because of a takeover bid.

86 GOvernAnCe GOvernAnCe 87
AnnuAl report 2014 MorgAn ADVAnCeD MAterIAlS
oVe
rVIe
WSt
rAt
egIC
rep
ort
go
Vern
AnC
eFI
nAn
CIA
l St
AteM
entS
Research and developmentDuring the year the group invested £21.7 million (2013: £20.2 million) in research and development. the group did not capitalise any development costs in 2014 (2013: nil).
Details of the group’s research and development during the year are set out on pages 34 and 35.
Greenhouse gas emissionsunder the Companies Act 2006 (Strategic report and Directors’ report) regulations 2013 (the ‘regulations’) the group is required to report its annual greenhouse gas emissions in tonnes of carbon dioxide equivalent (Co2e) in its Directors’ report.
Morgan has published information on its emissions due to the combustion of fossil fuels and the electricity purchased by the Company for its own use in its annual eHS report since 2004 and in its Annual report since 2005. Since 2011 the group’s Co2e emissions due to energy consumption have been externally assured by pwC (see pwC’s 2014 Assurance report on page 30). the group has participated in the Carbon Disclosure project (CDp) since 2006 and in 2014, for the third consecutive year, was included in the Carbon Disclosure leadership Index. this reflects the depth and quality of climate change data Morgan has disclosed to investors and the global marketplace through CDp.
the regulations require the group to disclose its emissions due to the combustion of biomass and due to process and fugitive emissions which are in addition to the emissions due to energy use reported on page 27 in the Corporate responsibility section of this Annual report.
2014Tonnes CO2e
2013tonnes Co2e
Emissions from combustion of fuels and operation of facilities*
Combustion of fossil fuels 153,100 150,800operation of facilities, including process
emissions† 35,900 32,700Electricity, heat, steam and cooling
purchased for own consumption‡
purchased electricity^† 247,200 235,700Intensity measurement§
tonnes Co2e due to fossil fuels and purchased electricity per £m revenue 434 427
tonnes gHgs per £m revenue 477 466
Co2e is the amount of Co2 and the amount of non-Co2 greenhouse gas with the equivalent global warming potential.
Data is rounded to the nearest 100 tonnes of Co2e.
* excludes emissions from Company-owned and leased vehicles estimated at approx. 2,300 tonnes Co2e in 2014. (2013: 2,100)
^ the 2014 and 2013 information regarding Co2e due to energy use has been subject to assurance by pwC. See the Independent Assurance report on page 31 of this Annual report and on page 30 of the 2013 Annual report for further details.
† electricity from renewable sources at zero tonnes Co2 per kWh. emissions increase by 3,400 tonnes at grid-average rates.
‡ excludes steam supplied by third parties to two sites in China and one in europe.§ Constant currency basis and updated to reflect changes in reporting methodology.
As required under the regulations, the above report includes the material emission sources from the operations and activities covered by the group’s Financial Statements. As noted, the reports exclude emissions from Company-owned and leased vehicles and emissions relating to steam supplied by third parties to two sites in China and one in europe, which are in total estimated to account for less than 1% of total emissions. the Directors consider that these sources of emissions are not material to the total of the emissions.
the group’s reporting methodology is based on the greenhouse gas protocol with emission factors for standard grid electricity by country and year from the International energy Agency together with other factors as published by the uK Department of environment, Food and rural Affairs in order to calculate the Co2e emissions included in this report.
Political donationsno political donations have been made. Morgan Advanced Materials has a policy of not making donations to any political party, representative or candidate in any part of the world.
Financial instruments Details of the group’s use of financial instruments, together with information on policies and exposure to price, liquidity, cash flow, credit, interest rate and currency risks, can be found in note 19 on pages 121 to 128. All information detailed in this note is incorporated into the Directors’ report by reference and is deemed to form part of the Directors’ report.
Share capital and related mattersShare capitalthe Company’s share capital as at 31 December 2014 is set out in note 17 on pages 117 to 119. the Company’s ordinary shares represent 99.85% of the total issued share capital, with the 5.5% Cumulative First preference shares representing 0.04% and the 5.0% Cumulative Second preference shares representing 0.11%. the rights and obligations attaching to the Company’s ordinary shares, and restrictions on the transfer of shares in the Company, are set out in the Articles.
Shareholders’ rightsthe holders of ordinary shares are entitled: to receive dividends, when declared; to receive the Company’s reports and accounts; to attend and speak at general meetings of the Company; to appoint proxies; and to exercise voting rights.
Details of the structure of the Company’s preference share capital and the rights attached to the Company’s preference shares are set out in note 17 on page 119.
no person holds securities in the Company carrying special rights with regard to control of the Company. the Company is not aware of any agreements between holders of securities that may result in restrictions on the transfer of securities or on voting rights.
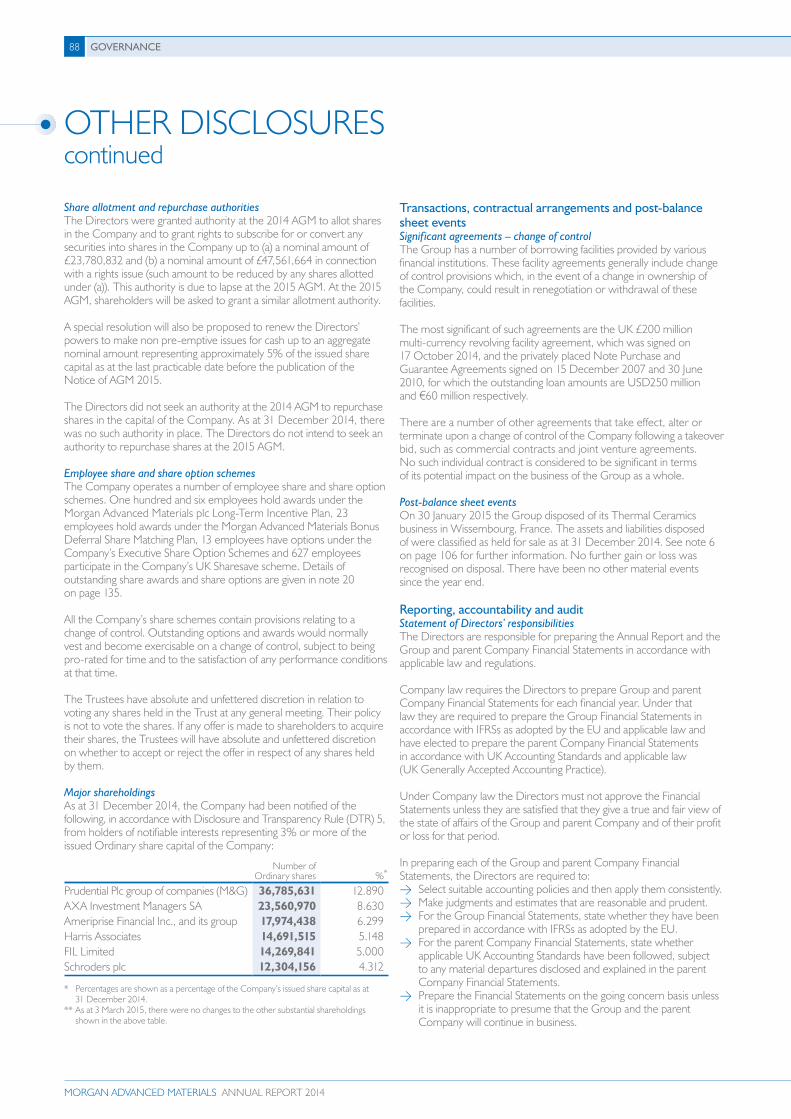
88 GOvernAnCe GOvernAnCe 89
Morgan aDVanCED MaTErIaLS annuaL rEporT 2014
Share allotment and repurchase authoritiesthe Directors were granted authority at the 2014 AgM to allot shares in the Company and to grant rights to subscribe for or convert any securities into shares in the Company up to (a) a nominal amount of £23,780,832 and (b) a nominal amount of £47,561,664 in connection with a rights issue (such amount to be reduced by any shares allotted under (a)). this authority is due to lapse at the 2015 AgM. At the 2015 AgM, shareholders will be asked to grant a similar allotment authority.
A special resolution will also be proposed to renew the Directors’ powers to make non pre-emptive issues for cash up to an aggregate nominal amount representing approximately 5% of the issued share capital as at the last practicable date before the publication of the notice of AgM 2015.
the Directors did not seek an authority at the 2014 AgM to repurchase shares in the capital of the Company. As at 31 December 2014, there was no such authority in place. the Directors do not intend to seek an authority to repurchase shares at the 2015 AgM.
Employee share and share option schemes the Company operates a number of employee share and share option schemes. one hundred and six employees hold awards under the Morgan Advanced Materials plc long-term Incentive plan, 23 employees hold awards under the Morgan Advanced Materials Bonus Deferral Share Matching plan, 13 employees have options under the Company’s executive Share option Schemes and 627 employees participate in the Company’s uK Sharesave scheme. Details of outstanding share awards and share options are given in note 20 on page 135.
All the Company’s share schemes contain provisions relating to a change of control. outstanding options and awards would normally vest and become exercisable on a change of control, subject to being pro-rated for time and to the satisfaction of any performance conditions at that time.
the trustees have absolute and unfettered discretion in relation to voting any shares held in the trust at any general meeting. their policy is not to vote the shares. If any offer is made to shareholders to acquire their shares, the trustees will have absolute and unfettered discretion on whether to accept or reject the offer in respect of any shares held by them.
Major shareholdingsAs at 31 December 2014, the Company had been notified of the following, in accordance with Disclosure and transparency rule (Dtr) 5, from holders of notifiable interests representing 3% or more of the issued ordinary share capital of the Company:
number ofordinary shares %*
prudential plc group of companies (M&g) 36,785,631 12.890AxA Investment Managers SA 23,560,970 8.630Ameriprise Financial Inc., and its group 17,974,438 6.299Harris Associates 14,691,515 5.148FIl limited 14,269,841 5.000Schroders plc 12,304,156 4.312
* percentages are shown as a percentage of the Company’s issued share capital as at 31 December 2014.
** As at 3 March 2015, there were no changes to the other substantial shareholdings shown in the above table.
transactions, contractual arrangements and post-balance sheet eventsSignificant agreements – change of controlthe group has a number of borrowing facilities provided by various financial institutions. these facility agreements generally include change of control provisions which, in the event of a change in ownership of the Company, could result in renegotiation or withdrawal of these facilities.
the most significant of such agreements are the uK £200 million multi-currency revolving facility agreement, which was signed on 17 october 2014, and the privately placed note purchase and guarantee Agreements signed on 15 December 2007 and 30 June 2010, for which the outstanding loan amounts are uSD250 million and €60 million respectively.
there are a number of other agreements that take effect, alter or terminate upon a change of control of the Company following a takeover bid, such as commercial contracts and joint venture agreements. no such individual contract is considered to be significant in terms of its potential impact on the business of the group as a whole.
Post-balance sheet eventson 30 January 2015 the group disposed of its thermal Ceramics business in Wissembourg, France. the assets and liabilities disposed of were classified as held for sale as at 31 December 2014. See note 6 on page 106 for further information. no further gain or loss was recognised on disposal. there have been no other material events since the year end.
reporting, accountability and auditStatement of Directors’ responsibilitiesthe Directors are responsible for preparing the Annual report and the group and parent Company Financial Statements in accordance with applicable law and regulations.
Company law requires the Directors to prepare group and parent Company Financial Statements for each financial year. under that law they are required to prepare the group Financial Statements in accordance with IFrSs as adopted by the eu and applicable law and have elected to prepare the parent Company Financial Statements in accordance with uK Accounting Standards and applicable law (uK generally Accepted Accounting practice).
under Company law the Directors must not approve the Financial Statements unless they are satisfied that they give a true and fair view of the state of affairs of the group and parent Company and of their profit or loss for that period.
In preparing each of the group and parent Company Financial Statements, the Directors are required to:
> Select suitable accounting policies and then apply them consistently. > Make judgments and estimates that are reasonable and prudent. > For the group Financial Statements, state whether they have been
prepared in accordance with IFrSs as adopted by the eu. > For the parent Company Financial Statements, state whether
applicable uK Accounting Standards have been followed, subject to any material departures disclosed and explained in the parent Company Financial Statements.
> prepare the Financial Statements on the going concern basis unless it is inappropriate to presume that the group and the parent Company will continue in business.
otHer DISCloSureScontinued

88 GOvernAnCe GOvernAnCe 89
AnnuAl report 2014 MorgAn ADVAnCeD MAterIAlS
oVe
rVIe
WSt
rAt
egIC
rep
ort
go
Vern
AnC
eFI
nAn
CIA
l St
AteM
entS
the Directors are responsible for keeping adequate accounting records that are sufficient to show and explain the parent Company’s transactions and disclose with reasonable accuracy at any time the financial position of the parent Company and enable them to ensure that its Financial Statements comply with the Companies Act 2006. they have general responsibility for taking such steps as are reasonably open to them to safeguard the assets of the group and to prevent and detect fraud and other irregularities.
under applicable law and regulations, the Directors are also responsible for preparing a Strategic report, Directors’ report, remuneration report and Corporate governance statement that comply with that law and those regulations.
the Directors are responsible for the maintenance and integrity of the corporate and financial information included on the Company’s website. legislation in the uK governing the preparation and dissemination of Financial Statements may differ from legislation in other jurisdictions.
the Directors as at the date of this report, whose names and functions are set out on pages 46 and 47, confirm that, to the best of their knowledge:
> the group’s Financial Statements, which have been prepared in accordance with IFrS as adopted by the eu, give a true and fair view of the assets, liabilities, financial position and profit of the group; and
> the management report (comprising the Directors’ report and the Strategic report) includes a fair review of the development and performance of the business and the position of the group, together with a description of the principal risks and uncertainties that it faces.
Scope of the reporting in this Annual Reportthe Board has prepared a Strategic report which provides an overview of the development and performance of the group’s business in the year ended 31 December 2014.
For the purposes of Dtr 4.1.5r(2) and Dtr 4.1.8, this Directors’ report and the Strategic report on pages 8 to 45 comprise the management report, including the sections of the Annual report and Financial Statements incorporated by reference.
each Director holding office at the date of approval of this Directors’ report confirms that, so far as he is aware, there is no relevant audit information of which the Company’s auditor is unaware, and that he has taken all steps that he ought to have taken as a Director to make himself aware of any relevant audit information and to establish that the Company’s auditor is aware of that information.
the Strategic report, the Directors’ report and the remuneration report were approved by the Board on 12 February 2015.
For and on behalf of the Board
PAUl BOUltOnCoMpAny SeCretAry & generAl CounSel12 February 2015
Morgan Advanced Materials plcQuadrant, 55-57 High Street, Windsor, Berkshire Sl4 1lp registered in england, no. 286773

90 GOvernAnCe GOvernAnCe 91
Morgan aDVanCED MaTErIaLS annuaL rEporT 2014
OPiniOnS And COnClUSiOnS AriSinG FrOM OUr AUdit
1. Our opinion on the financial statements is unmodifiedWe have audited the financial statements of Morgan Advanced Materials plc for the year ended 31 December 2014 which comprise the Consolidated Income Statement, the Consolidated Statement of Comprehensive Income, the Consolidated Statement of Changes in equity, the Consolidated Statement of Financial position, the Consolidated Statement of Cash Flows, the parent company Balance Sheet and the related notes. In our opinion:
> the financial statements give a true and fair view of the state of the group’s and of the parent company’s affairs as at 31 December 2014 and of the group’s profit for the year then ended;
> the group financial statements have been properly prepared in accordance with International Financial reporting Standards as adopted by the european union (IFrSs as adopted by the eu);
> the parent company financial statements have been properly prepared in accordance with uK Accounting Standards; and
> the financial statements have been prepared in accordance with the requirements of the Companies Act 2006 and, as regards the group financial statements, Article 4 of the IAS regulation.
2. Our assessment of risks of material misstatementIn arriving at our audit opinion above on the financial statements, the risks of material misstatement that had the greatest effect on our audit were:
> Carrying value of Composites and Defence Systems (C&DS) goodwill and intangible assets (£17.2 million)
Refer to page 60 (Audit Committee report), pages 111 and 112 (accounting policy note) and pages 112 and 113 (financial disclosures)
the risk: the group has generated significant goodwill and intangible assets on acquisitions whose recoverability is dependent on the ability of the businesses to which it relates to generate sufficient future economic benefits. there is a risk that this will not be the case which would result in an impairment being required. the most significant risk of impairment relates to the carrying value of goodwill and intangibles attributable to C&DS due to the reduction in demand from its traditional main customer, the uK Ministry of Defence.
Impairment reviews are performed annually by the group, or whenever there is an indication that the carrying values may not be supported. the impairment reviews are based on discounted cash flow projections reflecting a number of assumptions and estimates which require judgment and are inherently uncertain.
our response: our audit procedures included tests of the controls designed and applied to provide assurance that the projected future economic benefits are sufficient to support goodwill and intangible asset carrying values. our challenge of the key assumptions (relating to operating cashflows during the projection period, long term growth rates and discount rates) in the impairment calculations was based on our assessment of the historical accuracy of the group’s impairment calculations and a comparison of the group’s assumptions regarding key inputs such as projected economic growth, competition, cost inflation and discount rates to externally derived data as well as our own assessments. We tested the principles and mathematical integrity of the group’s discounted cash flow model and assessed the sensitivity of the impairment calculations to changes in the key assumptions. We also assessed the adequacy of the group’s disclosures relating to the goodwill and intangible asset including the impairment charge recognised in the period.
> Provisions and contingent liabilities (£22.8 million)Refer to page 60 (Audit Committee report), page 142 (accounting policy note) and page 142 (financial disclosures)
the risk: provisions are held in respect of closure and restructuring costs, environmental issues and other matters including the settlement of european class actions. the application of accounting standards to determine whether a provision should be recorded and, if so, the amount, is inherently subjective.
our response: our audit procedures included a critical assessment of the extent to which the group’s estimates are a balanced assessment of the latest available information and the accuracy and reliability of the sources of that information. We considered the appropriateness of the assumptions by reference to third party confirmations and legal advice, where available, and considered whether our understanding of the business gained throughout the audit process corroborated the provisions recorded, or indicated that further challenge was warranted. We considered the adequacy of the group’s disclosures in respect of provisions and contingent liabilities. We also assessed whether the group’s disclosures about provisions and the treatment of movements on provisions in the income statement for the year were appropriate.
> Tax liabilities (£20.6 million)Refer to page 60 (Audit Committee report), page 108 (accounting policy note) and pages 109, 115 and 143 (financial disclosures)
the risk: the group is subject to income taxes in a large number of jurisdictions. the level of current tax and deferred tax recognised requires judgments as to the likely outcome of decisions to be made by the tax authorities in the various tax jurisdictions around the world in which the group operates. there is a risk that the group’s judgments do not adequately reflect the latest available, reliable information or an appropriate application of relevant tax legislation, and are either under or overstated as a result.
our response: our audit procedures included challenging the appropriateness of the group’s assumptions and estimates in relation to tax assets and liabilities, by critically assessing the range of possible amounts that may be assessed under tax laws, likely settlements based on the latest correspondence with the relevant tax authorities and the complexity of the relevant tax legislation. We involved our tax specialists in analysing and challenging the assumptions used to determine tax provisions because they have relevant experience of the application of the international and local legislation by the relevant authorities and courts. We also assessed whether the group’s tax disclosures are appropriate and in accordance with relevant accounting standards.
InDepenDent AuDItor’S report to tHe MeMBerS oF MorgAn ADVAnCeD MAterIAlS plC only

90 GOvernAnCe GOvernAnCe 91
AnnuAl report 2014 MorgAn ADVAnCeD MAterIAlS
oVe
rVIe
WSt
rAt
egIC
rep
ort
go
Vern
AnC
eFI
nAn
CIA
l St
AteM
entS
3. Our application of materiality and an overview of the scope of our audit
the materiality for the group financial statements as a whole was set at £3.2 million, determined with reference to a benchmark of group profit before taxation, normalised to exclude this year’s impairment charge as disclosed in note 6 of £26.9 million, of which it represents 5%.
We report to the Audit Committee any corrected and uncorrected misstatements exceeding £0.16 million, in addition to other audit misstatements below that threshold that we believe warranted reporting on qualitative grounds.
of the group’s 92 reporting components, we subjected 40 to audits for group reporting purposes and 18 to specified risk-focused audit procedures. Audits for group reporting purposes were performed by component auditors at the key reporting components in the following countries: uK, uSA, China, germany, France, and Australia and by the group audit team in the uK. In addition, specified audit procedures were performed by component auditors in uSA and Brazil. these procedures covered 88% of total group revenue; 88% of group profit before taxation; and 86% of total group assets. the segment disclosures in note 3 set out the individual significance of a specific country.
the group audit team instructed component auditors as to the significant areas to be covered, including the relevant risks detailed above and the information to be reported back. the group audit team approved the component materialities, which ranged from £0.1 million to £3.2 million, having regard to the size and risk profile of each component. the work on 57 of the 58 components was performed by component auditors and the rest by the group audit team.
the group audit team visited the following locations: uK, uSA and Mexico. telephone meetings were also held with the auditors and local management at these locations and the majority of the other locations that were not physically visited. At these visits and meetings, the findings reported to the group audit team were discussed in more detail, and any further work required by the group audit team was then performed by the component auditor.
4. Our opinion on other matters prescribed by the Companies Act 2006
In our opinion: > the part of the Directors’ remuneration report to be audited has
been properly prepared in accordance with the Companies Act 2006; and
> the information given in the Strategic report and Directors’ report for the financial year for which the financial statements are prepared is consistent with the financial statements.
5. we have nothing to report in respect of the matters on which we are required to report by exception
under ISAs (uK and Ireland) we are required to report to you if, based on the knowledge we acquired during our audit, we have identified other information in the annual report that contains a material inconsistency with either that knowledge or the financial statements, a material misstatement of fact, or that is otherwise misleading. In particular, we are required to report to you if:
> we have identified material inconsistencies between the knowledge we acquired during our audit and the directors’ statement that they consider that the annual report and financial statements taken as a whole is fair, balanced and understandable and provides the information necessary for shareholders to assess the group’s performance, business model and strategy; or
> the report of the Audit Committee does not appropriately address matters communicated by us to the audit committee.
under the Companies Act 2006 we are required to report to you if, in our opinion:
> adequate accounting records have not been kept by the parent company, or returns adequate for our audit have not been received from branches not visited by us; or
> the parent company financial statements and the part of the Directors’ remuneration report to be audited are not in agreement with the accounting records and returns; or
> certain disclosures of directors’ remuneration specified by law are not made; or
> we have not received all the information and explanations we require for our audit.
under the listing rules we are required to review: > the directors’ statement, set out on page 45, in relation to going
concern; and > the part of the Corporate governance Statement on page 50
relating to the company’s compliance with the ten provisions of the 2012 uK Corporate governance Code specified for our review.
We have nothing to report in respect of the above responsibilities.
Scope and responsibilitiesAs explained more fully in the Directors’ responsibilities Statement set out on pages 88 and 89, the directors are responsible for the preparation of the financial statements and for being satisfied that they give a true and fair view. A description of the scope of an audit of accounts is provided on the Financial reporting Council’s website at www.frc.org.uk/auditscopeukprivate. this report is made solely to the Company’s members as a body and subject to important explanations and disclaimers regarding our responsibilities, published on our website at www.kpmg.com/uk/auditscopeukco2014a, which are incorporated into this report as if set out in full and should be read to provide an understanding of the purpose of this report, the work we have undertaken and the basis of our opinions. AnthOny SyKeS SenIor StAtutory AuDItor
for and on behalf of KpMg llp, Statutory Auditor Chartered Accountants 15 Canada Squarelondon, e14 5gl 12 February 2015

Morgan aDVanCED MaTErIaLS annuaL rEporT 2014
CONTENTS93 Consolidated income statement94 Consolidated statement of comprehensive income95 Consolidated balance sheet96 Consolidated statement of changes in equity97 Consolidated statement of cash flows98 Notes to the consolidated financial statements 145 Company balance sheet 146 Notes to the Company balance sheet 155 Group statistical information 156 Cautionary statement 157 Glossary of terms 158 Shareholder information
FINANCIAL STATEMENTS
92 FINANCIAL STATEMENTS

ANNuAL rEpOrT 2014 MOrGAN ADVANCED MATErIALS
OVE
rVIE
wST
rAT
EGIC
rEp
OrT
GO
VErN
ANC
EFI
NAN
CIA
L ST
ATEM
ENTS
FINANCIAL STATEMENTS 93
CONSOLIDATED INCOME STATEMENTfor the year ended 31 December 2014
Note
Resultsbefore specific
adjusting items
2014£m
Specificadjusting
items*
2014£m
Total2014
£m
resultsbefore specific
adjustingitems2013
£m
Specificadjusting
items*
2013£m
Total2013
£m
Revenue 3 921.7 – 921.7 957.8 – 957.8
Operating costs before restructuring costs, other one-off items and amortisation of intangible assets 4 (803.7) – (803.7) (838.8) – (838.8)
Profit from operations before restructuring costs, other one-off items and amortisation of intangible assets 118.0 – 118.0 119.0 – 119.0
restructuring costs and other one-off items: restructuring costs 4 & 6 (5.9) (16.3) (22.2) (11.3) – (11.3) Business exit costs 6 – (1.9) (1.9) – (7.3) (7.3) Transaction-related costs 6 – (1.2) (1.2) – – – Settlement of prior period anti-trust litigation 6 – (3.6) (3.6) – – – Gain on disposal of properties 0.3 – 0.3 0.8 – 0.8 Profit from operations before
amortisation of intangible assets 3 112.4 (23.0) 89.4 108.5 (7.3) 101.2
Amortisation of intangible assets 4 (8.2) – (8.2) (8.3) – (8.3)Impairment of intangible assets 6 – (26.9) (26.9) – (3.3) (3.3)Operating profit 3 104.2 (49.9) 54.3 100.2 (10.6) 89.6
Finance income 2.1 – 2.1 1.3 – 1.3 Finance expense (22.9) – (22.9) (24.6) – (24.6)Net financing costs 7 (20.8) – (20.8) (23.3) – (23.3)
Net loss on disposal of business 6 – (2.0) (2.0) – (2.3) (2.3)Profit before taxation 83.4 (51.9) 31.5 76.9 (12.9) 64.0
Income tax expense 8 (24.7) 5.5 (19.2) (21.1) 1.8 (19.3)Profit for the period 58.7 (46.4) 12.3 55.8 (11.1) 44.7
profit for period attributable to: Owners of the parent 54.8 (47.0) 7.8 52.4 (10.6) 41.8 Non-controlling interests 3.9 0.6 4.5 3.4 (0.5) 2.9
58.7 (46.4) 12.3 55.8 (11.1) 44.7
Basic earnings per share 9Continuing operations 2.7p 14.8pDiluted earnings per shareContinuing operations 2.7p 14.7p
Dividends Interim dividend – pence 3.90p 3.80p – £m 11.1 10.8 proposed final dividend – pence 7.00p 6.70p – £m 20.0 19.1
The proposed final dividend is based upon the number of shares outstanding at the balance sheet date.
* Details of ‘Specific adjusting items’ are given in note 6 to the Financial Statements.

Morgan aDVanCED MaTErIaLS annuaL rEporT 2014
CONSOLIDATED STATEMENT OF COMprEHENSIVE INCOMEfor the year ended 31 December 2014
Translationreserve
£m
Hedgingreserve
£m
Fairvalue
reserve£m
retainedearnings
£m
Totalparent
comprehensiveincome
£m
Non-controlling
interests£m
Totalcomprehensive
income£m
2013profit for the period – – – 41.8 41.8 2.9 44.7 Items that will not be reclassified
subsequently to profit or loss:remeasurement gain on defined
benefit plans – – – 12.2 12.2 – 12.2 Tax effect of components of other
comprehensive income not reclassified – – – (5.5) (5.5) – (5.5)– – – 6.7 6.7 – 6.7
Items that may be reclassified subsequently to profit or loss:
Foreign exchange translation differences (14.6) – – – (14.6) (2.8) (17.4)Net gain on hedge of net investment
in foreign subsidiaries 0.4 – – – 0.4 – 0.4 Cash flow hedges: Effective portion of changes
in fair value – (0.5) – – (0.5) – (0.5) Transferred to profit or loss – 0.4 – – 0.4 – 0.4 Change in fair value of equity securities
available-for-sale – – 0.3 – 0.3 – 0.3 (14.2) (0.1) 0.3 – (14.0) (2.8) (16.8)
Total comprehensive income, net of tax (14.2) (0.1) 0.3 48.5 34.5 0.1 34.6
2014profit for the period – – – 7.8 7.8 4.5 12.3 Items that will not be reclassified
subsequently to profit or loss:remeasurement loss on defined
benefit plans – – – (75.2) (75.2) – (75.2)Tax effect of components of other
comprehensive income not reclassified – – – 10.0 10.0 – 10.0 – – – (65.2) (65.2) – (65.2)
Items that may be reclassified subsequently to profit or loss:
Foreign exchange translation differences (6.6) – – – (6.6) (0.4) (7.0)Net gain on hedge of net investment
in foreign subsidiaries 7.9 – – – 7.9 – 7.9 Cash flow hedges: Transferred to profit or loss – (0.1) – – (0.1) – (0.1)
1.3 (0.1) – – 1.2 (0.4) 0.8
Total comprehensive income, net of tax 1.3 (0.1) – (57.4) (56.2) 4.1 (52.1)
94 FINANCIAL STATEMENTS

AnnuAl report 2014 MorgAn ADVAnCeD MAterIAlS
OVE
rVIE
wST
rAT
EGIC
rEp
OrT
GO
VErN
ANC
EFI
NAN
CIA
L ST
ATEM
ENTS
CONSOLIDATED BALANCE SHEETas at 31 December 2014
Note2014
£m2013
£m
Assetsproperty, plant and equipment 10 241.0 241.4 Intangible assets 11 235.3 249.5 Investments 12 6.2 3.7 Other receivables 4.0 4.3 Deferred tax assets 13 39.5 28.2 Total non-current assets 526.0 527.1
Inventories 14 126.6 118.9 Derivative financial assets 6.0 1.7 Trade and other receivables 15 193.9 188.2 Cash and cash equivalents 16 63.0 76.0 Assets classified as held for sale 6 4.5 – Total current assets 394.0 384.8 Total assets 920.0 911.9
LiabilitiesInterest-bearing loans and borrowings 18 232.9 201.5 Employee benefits 20 211.8 144.6 provisions 21 2.6 4.8 Non-trade payables 22 0.8 1.4 Deferred tax liabilities 13 33.4 33.5 Total non-current liabilities 481.5 385.8
Interest-bearing loans and borrowings and bank overdrafts 18 37.1 61.0 Trade and other payables 22 185.7 175.9 Current tax payable 5.7 1.3 provisions 21 20.2 12.9 Derivative financial liabilities 0.8 0.9 Liabilities classified as held for sale 6 1.3 – Total current liabilities 250.8 252.0 Total liabilities 732.3 637.8 Total net assets 187.7 274.1
EquityShare capital 17 71.8 71.8 Share premium 111.7 111.7 reserves 39.1 37.9 retained earnings (71.4) 16.7 Total equity attributable to equity owners of parent Company 151.2 238.1 Non-controlling interests 36.5 36.0 Total equity 187.7 274.1
The Financial Statements were approved by the Board of Directors on 12 February 2015 and were signed on its behalf by:
KEvIN DANgErFIELDINTErIM CHIEF ExECuTIVE OFFICEr & CHIEF FINANCIAL OFFICEr
FINANCIAL STATEMENTS 95

96 FINANCIAL STATEMENTS FINANCIAL STATEMENTS 97
Morgan aDVanCED MaTErIaLS annuaL rEporT 2014
CONSOLIDATED STATEMENT OF CHANGES IN EQuITYfor the year ended 31 December 2014
Sharecapital
£m
Sharepremium
£m
Translationreserve
£m
Hedgingreserve
£m
Fairvalue
reserve£m
Specialreserve
£m
Capitalredemption
reserve£m
Otherreserves
£m
retainedearnings
£m
Totalparentequity
£m
Non-controlling
interests£m
Totalequity
£m
Balance at 1 January 2013 70.4 99.0 (0.6) 0.7 (1.3) 6.0 35.7 11.1 12.8 233.8 37.8 271.6 profit for the year – – – – – – – – 41.8 41.8 2.9 44.7 Other comprehensive income – – (14.2) (0.1) 0.3 – – – 6.7 (7.3) (2.8) (10.1)Transactions with owners:Dividends 1.4 12.7 – – – – – – (38.8) (24.7) (1.6) (26.3)Equity-settled share-based
payment transactions – – – – – – – – 0.8 0.8 – 0.8 Own shares acquired for share
incentive schemes – – – – – – – – (6.6) (6.6) – (6.6)Adjustment arising from change
in non-controlling interest – – – – – – – 0.3 – 0.3 (0.3) – Balance at 31 December 2013 71.8 111.7 (14.8) 0.6 (1.0) 6.0 35.7 11.4 16.7 238.1 36.0 274.1
Balance at 1 January 2014 71.8 111.7 (14.8) 0.6 (1.0) 6.0 35.7 11.4 16.7 238.1 36.0 274.1 profit for the year – – – – – – – – 7.8 7.8 4.5 12.3 Other comprehensive income – – 1.3 (0.1) – – – – (65.2) (64.0) (0.4) (64.4)Transactions with owners:Dividends – – – – – – – – (30.2) (30.2) (4.8) (35.0)Equity-settled share-based
payment transactions – – – – – – – – 1.8 1.8 – 1.8 Own shares acquired for share
incentive schemes – – – – – – – – (2.3) (2.3) – (2.3)Adjustment arising from change
in non-controlling interest – – – – – – – – – – 1.2 1.2 Balance at 31 December 2014 71.8 111.7 (13.5) 0.5 (1.0) 6.0 35.7 11.4 (71.4) 151.2 36.5 187.7
Details of the reserves are provided in note 17.

96 FINANCIAL STATEMENTS FINANCIAL STATEMENTS 97
AnnuAl report 2014 MorgAn ADVAnCeD MAterIAlS
OVE
rVIE
wST
rAT
EGIC
rEp
OrT
GO
VErN
ANC
EFI
NAN
CIA
L ST
ATEM
ENTS
CONSOLIDATED STATEMENT OF CASH FLOwSfor the year ended 31 December 2014
Note2014
£m2013
£m
Operating activitiesprofit for the period 12.3 44.7 Adjustments for: Depreciation 4 27.8 29.3 Amortisation 4 8.2 8.3 Net financing costs 7 20.8 23.3 profit on sale of property, plant and equipment – (0.8) Income tax expense 8 19.2 19.3 Non-cash operating costs relating to restructuring 4 2.0 0.5 Non-cash specific adjusting items included in operating profit 6 38.0 10.6 Loss on disposal of business 6 2.0 2.3 Equity-settled share-based payment expenses 4 1.7 0.7 Cash generated from operations before changes in working capital and provisions 132.0 138.2
(Increase) in trade and other receivables (2.8) (10.8)(Increase)/decrease in inventories (9.5) 9.5 Increase/(decrease) in trade and other payables 3.1 (3.1)Decrease in provisions and employee benefits (15.0) (20.8)Cash generated from operations 107.8 113.0
Acquisition-related costs (0.3) – Interest paid (17.2) (18.3)Income tax paid (20.0) (24.9)Net cash from operating activities 70.3 69.8
Investing activitiespurchase of property, plant and equipment (33.8) (36.3)proceeds from sale of property, plant and equipment 1.3 2.6 Sale of investments 0.9 0.1 Interest received 1.9 1.3 Disposal of subsidiaries, net of cash disposed (0.6) 0.7 Acquisition of subsidiaries, net of cash acquired (20.7) – Loan made to associate (1.5) – Forward contracts used in net investment hedging 0.9 2.1 Deferred consideration received on disposal of subsidiary 0.7 1.0 Net cash from investing activities (50.9) (28.5)
Financing activitiespurchase of own shares for share incentive schemes (2.3) (6.6)repayment of borrowings 16 (1.2) (8.9)payment of finance lease liabilities 16 (0.1) (0.1)Finance leases acquired 16 1.2 – Dividends paid (30.2) (24.7)Net cash from financing activities (32.6) (40.3)
Net (decrease)/increase in cash and cash equivalents (13.2) 1.0 Cash and cash equivalents at start of period 76.0 80.0 Effect of exchange rate fluctuations on cash held 0.2 (5.0)Cash and cash equivalents at period end 16 63.0 76.0
A reconciliation of cash and cash equivalents to net borrowings is shown in note 16.

98 FINANCIAL STATEMENTS FINANCIAL STATEMENTS 99
Morgan aDVanCED MaTErIaLS annuaL rEporT 2014
NOTES TO THE CONSOLIDATED FINANCIAL STATEMENTS
1. ACCouNTINg poLICIES, ESTIMATES AND juDgEMENTSAccounting policiesMorgan Advanced Materials plc (the ‘Company’) is a company incorporated in the uK.
The Group Financial Statements consolidate those of the Company and its subsidiaries (together referred to as the ‘Group’), and include the Group’s interest in associates. The parent Company Financial Statements present information about the Company as a separate entity and not about its Group. These consolidated financial statements have been drawn up to 31 December 2014. The Group maintains a 12-month calendar fiscal year ending on 31 December.
The Group Financial Statements have been prepared and approved by the Directors in accordance with International Financial reporting Standards as adopted by the Eu (‘adopted IFrSs’). The Company has elected to prepare its parent Company Financial Statements in accordance with uK Generally Accepted Accounting practice; these are presented on pages 145 to 154.
where possible the Group has set out individual accounting policies in the note to the consolidated financial statements most relevant to that accounting policy.
Except for the changes set out in the ‘Adoption of new and revised standards’ section, the accounting policies set out below have been applied consistently to all periods presented in these Group Financial Statements.
(a) Measurement conventionThe Financial Statements are prepared on the historical cost basis except that the following assets and liabilities are stated at their fair value: derivative financial instruments and financial instruments available-for-sale.
(b) Functional and presentation currencyThe Group Financial Statements are presented in pounds sterling, which is the Company’s functional currency.
(c) Basis of consolidation(i) SubsidiariesSubsidiaries are entities controlled by the Group. The Group controls an entity when it is exposed to, or has rights to, variable returns from its involvement with the entity and has the ability to affect those returns through its power over the entity. The Financial Statements of subsidiaries are included in the consolidated financial statements from the date on which control commences until the date on which control ceases.
(ii) AcquisitionsBusiness combinations are accounted for using the acquisition method as at the acquisition date, which is the date on which control is transferred to the Group. The Group measures goodwill as the acquisition-date fair value of the consideration transferred, including the amount of any non-controlling interest in the acquiree, less the net of the acquisition-date fair values of the identifiable assets acquired and liabilities assumed, including contingent liabilities as required by IFrS 3. Consideration transferred includes the fair values of assets transferred, liabilities incurred by the Group to the previous owners of the acquiree, equity interests issued by the Group, contingent consideration, and share-based payment awards of the acquiree that are replaced in the business combination. Any contingent consideration payable is recognised at fair value at the acquisition date. Subsequent changes to the fair value of contingent consideration that is not classified as equity are recognised in the income statement. Transaction costs that the Group incurs in connection with a business combination, such as finder’s fees, legal fees, due diligence fees and other professional and consulting fees, are expensed as incurred.
(iii) AssociatesAssociates are those entities in which the Company has significant influence, but not control, over the financial and operating policies. Significant influence is presumed to exist when the Group holds between 20% and 50% of the voting power of another entity. Associates are accounted for using the equity method and are initially recognised at cost.
(iv) Transactions eliminated on consolidationIntra-group balances and any unrealised gains and losses or income and expenses arising from intra-group transactions are eliminated in preparing the consolidated financial statements. unrealised gains arising from transactions with associates are eliminated against the investment to the extent of the Group’s interest in the associate. unrealised losses are eliminated in the same way as unrealised gains, but only to the extent that there is no evidence of impairment.

98 FINANCIAL STATEMENTS FINANCIAL STATEMENTS 99
AnnuAl report 2014 MorgAn ADVAnCeD MAterIAlS
OVE
rVIE
wST
rAT
EGIC
rEp
OrT
GO
VErN
ANC
EFI
NAN
CIA
L ST
ATEM
ENTS
1. ACCouNTINg poLICIES, ESTIMATES AND juDgEMENTS continuedAccounting policies continued(d) Foreign currency (i) Foreign currency transactions Transactions in foreign currencies are translated at the foreign exchange rate ruling at the date of the transaction. Monetary assets and liabilities denominated in foreign currencies at the balance sheet date are translated to pounds sterling at the foreign exchange rate ruling at that date. Foreign exchange differences arising on translation are recognised in the income statement. Non-monetary assets and liabilities that are measured in terms of historical cost in a foreign currency are translated using the exchange rate at the date of the transaction. Non-monetary assets and liabilities denominated in foreign currencies that are stated at fair value are translated to pounds sterling at foreign exchange rates ruling at the dates the fair value was determined.
(ii) Financial statements of foreign operations The assets and liabilities of foreign operations, including goodwill and fair value adjustments arising on consolidation, are translated to pounds sterling at foreign exchange rates ruling at the balance sheet date. The revenues and expenses of foreign operations are translated to pounds sterling at an average rate for the period where this approximates to the foreign exchange rates ruling at the dates of the transactions. Foreign exchange differences arising on retranslation since the adoption of IFrS are recognised directly in Other Comprehensive Income (‘OCI’).
(e) Impairment The carrying amounts of the Group’s assets, other than deferred tax assets, are reviewed at each balance sheet date to determine whether there is any indication of impairment. If any such indication exists, the asset’s recoverable amount is estimated (see (i) below). An impairment loss is recognised whenever the carrying amount of an asset or its cash-generating unit exceeds its recoverable amount. Impairment losses are recognised in the income statement. Impairment losses recognised in respect of cash-generating units are allocated first to reduce the carrying amount of any goodwill allocated to cash-generating units (group of units) and then to reduce the carrying amount of the other assets in the unit (group of units) on a pro-rata basis. when a decline in the fair value of an available-for-sale financial asset has been recognised directly in OCI and there is objective evidence that the asset is permanently impaired, the cumulative loss that had been recognised directly in OCI is recognised in profit or loss. A significant or prolonged decline in an available-for-sale financial asset’s fair value below its cost is objective evidence of impairment. The amount of the cumulative loss that is recognised in profit or loss is the difference between the acquisition cost and current fair value, less any impairment loss on that financial asset previously recognised in profit or loss.
(i) Calculation of recoverable amount The recoverable amount of the Group’s investments in receivables carried at amortised cost is calculated as the present value of estimated future cash flows, discounted at the original effective interest rate (ie the effective interest rate computed at initial recognition of these financial assets). receivables with a short duration are not discounted. The recoverable amount of other assets is the greater of their fair value less costs to sell and value in use. In assessing value in use, the estimated future cash flows are discounted to their present value using a pre-tax discount rate that reflects current market assessments of the time value of money and the risks specific to the asset. For an asset that does not generate largely independent cash inflows, the recoverable amount is determined for the cash-generating unit to which the asset belongs.
(ii) Reversals of impairment An impairment loss in respect of a receivable carried at amortised cost and other assets not listed below is reversed if the subsequent increase in recoverable amount can be related objectively to an event occurring after the impairment loss was recognised. An impairment loss in respect of an investment in an equity instrument classified as available-for-sale is not reversed through profit or loss. If the fair value of a debt instrument classified as available-for-sale increases and the increase can be objectively related to an event occurring after the impairment loss was recognised in profit or loss, the impairment loss shall be reversed, with the amount of the reversal recognised in profit or loss. An impairment loss in respect of goodwill is not reversed. An impairment loss is reversed only to the extent that the asset’s carrying amount does not exceed the carrying amount that would have been determined, net of depreciation or amortisation, if no impairment loss had been recognised.
(f) Revenuerevenue from the sale of goods in the course of ordinary activities is measured at the fair value of the consideration received or receivable, net of returns, trade discounts and volume rebates. revenue is recognised when the significant risks and rewards of ownership have been transferred to the customer, recovery of the consideration is probable, the associated costs and possible return of goods can be estimated reliably, there is no continuing management involvement with the goods, and the amount of revenue can be measured reliably. If it is probable that discounts will be granted and the amount can be measured reliably, then the discount is recognised as a reduction of revenue as the sales are recognised.

100 FINANCIAL STATEMENTS FINANCIAL STATEMENTS 101
Morgan aDVanCED MaTErIaLS annuaL rEporT 2014
NOTES TO THE CONSOLIDATED FINANCIAL STATEMENTScontinued
1. ACCouNTINg poLICIES, ESTIMATES AND juDgEMENTS continuedAccounting policies continued(g) DividendsDividends payable are recognised as a liability in the period in which they are declared and approved.
Accounting estimates and judgementsJudgements made by the Directors in the application of these accounting policies that have a significant effect on the Financial Statements and estimates with a significant risk of material adjustment in the next year are discussed below.
Management discussed with the Audit Committee the development, selection and disclosure of the Group’s critical accounting policies and estimates and the application of these policies and estimates. The following accounting estimates are subject to significant uncertainty:
Recognition of identifiable intangible assets and goodwillNote 11 contains information about intangible assets recognised on acquisition. These primarily relate to technology and trademarks and customer relationships, which are supported by long-term relationships with key customers. The Group has estimated that the customer relationships have an economic life of 15-20 years.
Impairment of intangible assets and goodwillNote 11 contains information about the assumptions relating to goodwill impairment tests, including a sensitivity analysis.
Credit riskNote 19 contains information about the Group’s exposure to credit risk, including a sensitivity analysis. The Group establishes both specific and general allowances for impairment losses against receivables. The general loss allowance is estimated based on historical data of payment statistics for similar financial assets.
Pension assumptionsThe principal actuarial assumptions applied to pensions are shown in note 20, including a sensitivity analysis. The actuarial evaluation of pension assets and liabilities is based on assumptions in respect of inflation, future salary increases, discount rates, returns on investments and mortality rates. relatively small changes in the assumptions underlying the actuarial valuations of pension schemes can have a significant impact on the net pension liability included in the balance sheet.
ProvisionsNote 21 contains information about provisions. provisions for closure and restructuring costs, environmental issues and settlement of litigation are judgemental by their nature. Amounts provided are the Group’s best estimate of exposure based on currently available information.
TaxationThe level of current tax and deferred tax recognised is dependent on the tax rates in effect at the balance sheet date, and on subjective judgements as to the outcome of decisions to be made by the tax authorities in the various tax jurisdictions around the world in which the Group operates. Deferred tax assets are recognised based on management’s assessment of the extent to which they are recoverable.
Going concernThe Group’s business activities, together with the factors likely to affect its future development, performance and position are set out in the Strategic report on pages 8 to 45. The financial position of the Group, its cash flows, liquidity position and borrowing facilities, are described earlier in the Financial review. In addition, note 19 includes the Group’s policies and processes for managing financial risk; details of its financial instruments and hedging activities; and its exposures to credit risk and liquidity risk.
The Group meets its day-to-day working capital requirements through local banking arrangements underpinned by the Group’s new £200 million unsecured multi-currency revolving credit facility maturing October 2019. The Group’s forecasts and projections, taking account of reasonably possible changes in trading performance and exchange rates, show the Group operating comfortably within its debt financial covenants for the next 12 months.
The current economic climate continues to have an impact on the Group, its customers and suppliers. The Board fully recognises the challenges that lie ahead but, after making enquiries, the Directors have a reasonable expectation that the Company and the Group have adequate resources to continue in operational existence for the foreseeable future. Accordingly, they continue to adopt the going concern basis in preparing the Annual report and Accounts.
Adoption of new and revised StandardsDuring the period the Group has applied IFrS 10 Consolidated Financial Statements, IFrS 11 Joint Arrangements, IFrS 12 Disclosure of Interests in other Entities and IAS 28 Investments in Associates and Joint Ventures (2011). The adoption of these accounting standards did not have a material impact on the Group’s Financial Statements or the financial position of the Group.

100 FINANCIAL STATEMENTS FINANCIAL STATEMENTS 101
AnnuAl report 2014 MorgAn ADVAnCeD MAterIAlS
OVE
rVIE
wST
rAT
EGIC
rEp
OrT
GO
VErN
ANC
EFI
NAN
CIA
L ST
ATEM
ENTS
1. ACCouNTINg poLICIES, ESTIMATES AND juDgEMENTS continuedNew standards and interpretations A number of new standards, amendments to standards and interpretations have been issued but are not yet effective, and have not been applied in preparing the Group Financial Statements. Those which may be relevant to the Group are set out below. The Group has not applied these standards early and, with the exception of IFrS 15 Revenue from Contracts with Customers, does not expect the application of these standards to have a material impact on the Group’s Financial Statements. The impact of IFrS 15 Revenue from Contracts with Customers is not currently known or reasonably estimable.
IFrS 15 Revenue from Contracts with Customers is effective for periods beginning on or after 1 January 2017 and introduces a new revenue recognition model that recognises revenue either at a point in time or over time. The model features a contract-based five-step analysis of transactions to determine whether, how much and when revenue is recognised.
IFrS 9 Financial Instruments is effective for periods beginning on or after 1 January 2018 and reduces the number of primary measurement categories for financial assets to two: amortised cost and fair value.
These standards are effective for annual periods beginning on or after 1 January 2015.
2. ACquISITIoNS AND DISpoSALSAccounting policiesStep acquisitionsStep acquisitions arise when the Group acquires control of an entity through successive share purchases. The identifiable assets, liabilities and contingent liabilities acquired are recorded at fair value on the date that control is acquired. For step acquisitions occurring before 3 January 2010 the amount recognised as goodwill or negative goodwill is determined separately for each tranche acquired, calculated as the difference between the fair value of the consideration paid and the fair value of the identifiable assets, liabilities and contingent liabilities acquired, in accordance with IFrS 3 Business Combinations (2004). Any changes in the fair value of the identifiable assets and liabilities acquired between the acquisition date and the date that control is obtained are recorded in other reserves in equity to the extent that they have not previously been recognised in the income statement. Any future step acquisitions would be accounted for in accordance with IFrS 3 Business Combinations (2008).
Acquisitions and disposals: 2014Acquisition of Porextherm Dämmstoffe GmbHOn 14 July 2014 the Group acquired all of the shares in porextherm Dämmstoffe GmbH (‘porextherm’), a leading producer of microporous insulation materials, for an enterprise value of €26.0 million, comprising cash purchase consideration of €17.7 million and the assumption of €8.3 million of debt. There was no contingent consideration.
The addition of porextherm to the Morgan Group enhances the Group’s existing portfolio of high-performance insulating systems, and also gives the Group the chance to share knowledge and process which will lead to future product development. In line with the Group’s strategic priorities, the acquisition brings with it the opportunity to explore new markets and expand the Group’s range to benefit both new and existing customers.
The amounts recognised in respect of the identifiable assets acquired and liabilities assumed are as set out in the table below:
2014£m
Trade and other receivables 2.3 Inventory 3.3 property, plant and equipment 5.6 Identifiable intangible assets 6.9 Trade and other payables (2.5)Net deferred tax liability (1.7)Cash and cash equivalents 0.3 Interest-bearing loans and borrowings (6.9)Total identifable assets 7.3Goodwill 6.8Total consideration 14.1
Total consideration transferred was satisfied by cash.
Net cash outflow arising on acquisition2014
£m
Cash consideration 14.1 plus: interest-bearing loans and borrowings acquired 6.9 Less: cash and cash equivalents acquired (0.3)
20.7

102 FINANCIAL STATEMENTS FINANCIAL STATEMENTS 103
Morgan aDVanCED MaTErIaLS annuaL rEporT 2014
NOTES TO THE CONSOLIDATED FINANCIAL STATEMENTScontinued
2. ACquISITIoNS AND DISpoSALS continuedThe goodwill of £6.8 million arising from the acquisition consists of anticipated benefits from Morgan Group synergies. None of the goodwill is expected to be deductible for income tax purposes.
The Group incurred acquisition-related costs of £0.4 million relating to external legal fees and due diligence costs. These costs have been included in the ‘Transaction-related costs’ line of specific adjusting items, part of the ‘restructuring costs and other one-off items’ section of the consolidated income statement.
porextherm contributed £8.5 million third-party revenue and £nil profit after taxation to the Group for the period between the date of acquisition and the balance sheet date. The profit after taxation figure is stated after the deduction of adjustments as a result of applying IFrS 3 Business Combinations.
The Group estimates that porextherm achieved revenue of £20 million and profit after taxation of £1.1 million for the year ended 31 December 2013. If the acquisition had been completed on the first day of the financial year (1 January 2014) management estimates that porextherm would have increased Group consolidated revenue for the 12 months ended 31 December 2014 by a further £9.7 million and Group consolidated profit for the period by a further £0.6 million (before any adjustments to profit as a result of applying IFrS 3 Business Combinations).
other acquisitions and disposals: 2014On 3 April 2014 the Group sold its uK fired shapes business to Jemmtec Limited (trading as Magma Ceramics) in exchange for a 35% shareholding in Jemmtec Limited, a fired ceramics shapes business. Details of this disposal are given in note 6.
On 20 June 2014 the Group disposed of the whole of the share capital of Morgan AM&T Hairong Co. Limited for £0.3 million consideration. The adjustment to the non-controlling interest component of equity due to this transaction was £1.2 million. Details of this disposal are given in note 6.
Acquisitions and disposals: 2013On 1 February 2013 the Group purchased the remaining 25% of the share capital of Beijing Morgan Ceramics Co., Ltd (‘BMC’) not already held by the Group for £0.3 million. As a result the Group now owns 100% of the share capital of BMC. The adjustment to the non-controlling interest component of equity due to this transaction was £0.6 million.
On 28 December 2013 the Group disposed of 23.85% of the share capital of Assam Carbon products Ltd for nil consideration. The adjustment to the non-controlling interest component of equity due to this transaction was £0.6 million. Details of this disposal are given in note 6.
During 2013 the Group also made adjustments to goodwill/purchase consideration totalling £3.7 million relating to historic acquisitions, for which IFrS 3 Business Combinations (2004) applied.
3. SEgMENT rEporTINgAccounting policiesThe Group has identified three reportable operating segments. These have been identified on the basis of internal management reporting information that is regularly reviewed by the Group’s Board of Directors (the Chief Operating Decision Maker) in order to allocate resources and assess performance.
Segment results, assets and liabilities include items directly attributable to a segment as well as those that can be allocated on a reasonable basis. unallocated items comprise mainly investments and related income, loans and borrowings and related expenses, corporate assets and head office expenses, and income tax assets and liabilities.

102 FINANCIAL STATEMENTS FINANCIAL STATEMENTS 103
AnnuAl report 2014 MorgAn ADVAnCeD MAterIAlS
OVE
rVIE
wST
rAT
EGIC
rEp
OrT
GO
VErN
ANC
EFI
NAN
CIA
L ST
ATEM
ENTS
3. SEgMENT rEporTINg continuedThe Group comprises the following three reportable operating segments: North America, Europe and Asia/rest of world.
The information presented below represents the operating segments of the Group.
North America Europe Asia/rest of world Consolidated2014
£m2013
£m2014
£m2013
£m2014
£m2013
£m2014
£m2013
£m
Revenue from external customers 353.1 359.9 325.7 357.3 242.9 240.6 921.7 957.8
Regional EBITA1 52.5 55.5 39.8 42.0 31.2 26.4 123.5 123.9 unallocated costs (5.5) (4.9)Group EBITA2 118.0 119.0 restructuring costs and other one-off items (0.8) (2.5) (1.2) (2.6) (3.6) (3.3) (5.6) (8.4)unallocated restructuring costs and other one-off items – (2.1)Underlying operating profit3 112.4 108.5 Amortisation of intangible assets (3.4) (3.2) (3.8) (3.6) (1.0) (1.5) (8.2) (8.3)Operating profit before specific adjusting items 104.2 100.2 Specific adjusting items included in operating profit 4 (49.9) (10.6)Operating profit 54.3 89.6 Finance income 2.1 1.3 Finance expense (22.9) (24.6)Loss on disposal of business (2.0) (2.3)Profit before taxation 31.5 64.0
Segment assets 300.1 283.3 283.1 303.1 225.3 218.6 808.5 805.0 unallocated assets 111.5 106.9 Total assets 920.0 911.9
Segment liabilities 108.9 89.1 217.1 166.6 53.2 46.4 379.2 302.1 unallocated liabilities 353.1 335.7 Total liabilities 732.3 637.8
Segment capital expenditure 13.9 13.5 9.8 7.1 10.1 15.7 33.8 36.3 unallocated capital expenditure – – Total capital expenditure 33.8 36.3
Segment depreciation 11.2 12.0 9.3 9.8 7.3 7.4 27.8 29.2 unallocated depreciation – 0.1 Total depreciation 27.8 29.3
1. Segment profit is defined as regional EBITA, which is segment operating profit before restructuring costs, other one-off items and amortisation of intangible assets.2. Group EBITA is defined as operating profit before restructuring costs, other one-off items and amortisation of intangible assets.3. underlying operating profit is defined as operating profit before amortisation of intangible assets.4. Details of ‘specific adjusting items’ are given in note 6 to the Financial Statements.
The above measures of profit are shown because the Directors use them to measure the underlying performance of the business, as referred to in the Strategic report section of the Annual report.
During the year ended 31 December 2014 the Group recognised impairment losses totalling £28.6 million in the Europe reportable operating segment. Of this amount £26.9 million has been recognised in the ‘Impairment of intangible assets’ line of the income statement and £1.7 million has been recognised in the ‘Business exit costs’ line of the income statement (with a further £0.2 million of related disposal costs). During the year ended 31 December 2013 the Group recognised impairment losses totalling £3.3 million in the Asia/rest of world reportable operating segment. This was recognised in the ‘Impairment of intangibles assets’ line of the income statement. See note 6 for further details.

104 FINANCIAL STATEMENTS FINANCIAL STATEMENTS 105
Morgan aDVanCED MaTErIaLS annuaL rEporT 2014
NOTES TO THE CONSOLIDATED FINANCIAL STATEMENTScontinued
3. SEgMENT rEporTINg continuedDuring the year ended 31 December 2014 the Group incurred £16.3 million of restructuring costs in specific adjusting items in the Europe reportable operating segment (2013: nil). See note 6 for further details.
revenue from external customers
Non-current assets (excluding tax and financial instruments)
2014£m
2013£m
2014£m
2013£m
uSA 308.2 301.4 176.2 165.8 uK (the Group’s country of domicile) 72.3 108.6 130.5 159.4 China 83.8 82.6 53.2 55.1 Germany 68.6 63.5 47.6 31.6 France 36.2 39.6 13.1 19.8 Other Asia, Australasia, Middle East and Africa 155.9 156.1 30.9 30.8 Other Europe 133.2 131.0 20.4 21.5 Other North America 31.8 41.3 6.3 7.0 South America 31.7 33.7 8.3 7.9
921.7 957.8 486.5 498.9
revenue from external customers is based on geographic location of the end-customer. Segment assets are based on geographical location of the assets. No customer represents greater than 10% of revenue.
Segment revenue by product
2014£m
2013£m
Industrial 412.1 425.4 Transportation 184.9 180.4 petrochemical 89.4 76.1 Energy 65.5 61.7 Security and defence 64.8 94.4 Electronics 53.7 71.9 Healthcare 51.3 47.9
921.7 957.8
Intercompany sales to other segments
North America Europe Asia/rest of world2014
£m2013
£m2014
£m2013
£m2014
£m2013
£m
Intercompany sales to other segments 26.6 23.4 19.0 18.0 9.4 8.0

104 FINANCIAL STATEMENTS FINANCIAL STATEMENTS 105
AnnuAl report 2014 MorgAn ADVAnCeD MAterIAlS
OVE
rVIE
wST
rAT
EGIC
rEp
OrT
GO
VErN
ANC
EFI
NAN
CIA
L ST
ATEM
ENTS
4. opErATINg CoSTS bEForE SpECIFIC ADjuSTINg ITEMS
2014£m
2013£m
Change in stocks of finished goods and work in progress 2.7 4.9 raw materials and consumables 228.8 249.7 Other external charges 156.7 156.3 Total 388.2 410.9
Employee costs:– wages and salaries 235.4 235.6 – equity-settled share-based payments 1.7 0.6 – social security costs 44.3 45.4 – other pension costs 12.9 12.7 Total 294.3 294.3
Depreciation 27.8 29.3
rentals under operating leases:– hire of plant and machinery 2.8 3.2 – other operating leases 6.2 5.6 Total 9.0 8.8
Other operating charges and income:– net foreign exchange losses/(gains) 0.9 (1.3)– other operating income and charges 83.5 96.8 Total 84.4 95.5
Total operating costs before restructuring costs, other one-off items and amortisation of intangible assets 803.7 838.8
restructuring costs and other one-off items:– employment termination costs 3.5 7.2 – write-off of assets 2.0 0.5 – other reorganisation, rationalisation and closure costs 0.4 3.6 – profit on disposal of properties (0.3) (0.8)Total 5.6 10.5
Amortisation of intangible assets 8.2 8.3 Total operating costs before specific adjusting items 817.5 857.6
A further £3.9 million of employment termination costs are recognised in restructuring costs within specific adjusting items. See note 6 for further details.
The Group recognised £21.7 million in expense in respect of research and development (2013: £20.2 million).
A summary of the audit and non-audit fees in respect of services provided by the auditor (2014: KpMG LLp; 2013: KpMG Audit plc) charged to operating profit in the year ended 31 December 2014 is set out below:
2014£m
2013£m
Fees payable to the Company’s auditor for the audit of the Company’s annual accounts 0.4 0.4 Fees payable to the Company’s auditor and its associates for other services:– the auditing of accounts of any subsidiaries of the Company 1.6 1.7 – audit-related services – 0.1 – taxation compliance services 0.3 0.1 – other non-audit services 0.1 0.1
2.4 2.4

106 FINANCIAL STATEMENTS FINANCIAL STATEMENTS 107
Morgan aDVanCED MaTErIaLS annuaL rEporT 2014
NOTES TO THE CONSOLIDATED FINANCIAL STATEMENTScontinued
5. STAFF NuMbErSThe average number of persons employed by the Group (including Directors) during the year, analysed by geographical area and reporting segment, was as follows:
Number of employees
2014 2013
Reportable operating segmentsNorth America 3,209 3,167Europe 2,894 3,024Asia/rest of world 2,928 3,370Corporate 13 11
9,044 9,572
6. SpECIFIC ADjuSTINg ITEMS In the consolidated income statement the Group presents specific adjusting items separately. In the judgement of the Directors, due to the nature and value of these items they should be disclosed separately from the underlying results of the Group to allow the reader to obtain a proper understanding of the financial information and the best indication of underlying performance of the Group.
2014£m
2013£m
Specific adjusting items:– restructuring costs 16.3 – – Business exit costs 1.9 7.3 – Transaction-related costs 1.2 – – Settlement of prior period anti-trust litigation 3.6 – – Impairment of intangible assets 26.9 3.3 – Net loss on disposal of businesses 2.0 2.3 Total specific adjusting items before income tax credit 51.9 12.9 – Income tax credit from specific adjusting items (5.5) (1.8)Total specific adjusting items after income tax credit 46.4 11.1
2014 restructuring costs As part of the strategic objective to drive the performance of the Electrical Carbon and Seals and Bearings businesses to mid-teen margins and beyond the Group is undertaking a significant rationalisation of the carbon material footprint. Specifically, the cessation of carbon material manufacturing and a number of other finishing operations at the Swansea, uK site. These operations are being consolidated into other Group locations, mainly the uSA and Hungary. This has resulted in a charge of £16.3 million in 2014, which is predominantly in respect of property related provisions, redundancy costs and asset write-offs. There has been a cash outflow of £2.0 million in 2014 and a further £5.1 million is expected to be settled in cash in 2015. An income tax credit of £1.2 million has been recognised in respect of these items.
business exit costs In January 2015 the Group completed the sale of a Thermal Ceramics business in wissembourg, France. This business manufactures low-temperature fibre boards used mainly in the building industry. The Group has incurred a £1.9 million loss on disposal of this business and has booked an impairment charge in 2014 to reflect this. An income tax credit of £0.2 million has been recognised in respect of this item.
The assets and liabilities that are intended to be disposed of have been classified as held for sale and are as follows:
2014£m
property, plant and equipment 2.5 Intangible assets 0.1 Inventories 1.9Total assets classified as held for sale 4.5
Trade and other payables 0.6Employee benefits 0.7 Total liabilities classified as held for sale 1.3
Net assets of disposal group 3.2

106 FINANCIAL STATEMENTS FINANCIAL STATEMENTS 107
AnnuAl report 2014 MorgAn ADVAnCeD MAterIAlS
OVE
rVIE
wST
rAT
EGIC
rEp
OrT
GO
VErN
ANC
EFI
NAN
CIA
L ST
ATEM
ENTS
6. SpECIFIC ADjuSTINg ITEMS continuedTransaction-related costsTransaction-related costs consist of £0.6 million of adviser costs incurred in relation to dealing with the proposal made by Vesuvius plc to acquire the Group, £0.4 million of legal and due diligence fees on the purchase of porextherm Dämmstoffe GmbH and £0.2 million of legal fees relating to the establishment of a new joint venture in China. An income tax credit of £0.1 million has been recognised in respect of these items.
Settlement of prior period anti-trust litigationDuring the year the Group has fully and finally settled a number of the European Anti-Trust actions relating to pre-2000 cartel activity and has a provision adequate to cover the remaining claim and the related legal fees. The net charge to the income statement in the year in relation to this is £3.6 million.
Impairment of intangible assets As a result of the continued reduction in demand on C&DS from uK MoD, the review of the carrying value of the intangible assets and goodwill of C&DS has resulted in an impairment charge of £26.9 million. Following this impairment charge, the carrying value of the C&DS intangibles and goodwill is £17.2 million. This is supported by the current expectations of the future trading performance of the C&DS business. An income tax credit of £2.1 million has been recognised in respect of the impairment charge. refer to note 11 for more details of the impairment charge.
Net loss on disposal of businessesThe net loss on disposal of businesses for the year ended 31 December 2014 consists of two business disposals:
a) UK Fired Shapes business On 3 April 2014 the Group sold its uK Fired Shapes business to Jemmtec Limited in exchange for a 35% shareholding in Jemmtec Limited, a fired ceramics shapes business. The profit recognised on disposal of the business was £1.3 million. Assets disposed of consisted of £0.9 million of property, plant and equipment, £0.8 million of inventory and £0.2 million of goodwill. Based on the management structure of Jemmtec Limited the Group has determined that it does not have control of Jemmtec Limited and is therefore accounting for its 35% shareholding in Jemmtec as an associate.
b) Morgan AM&T Hairong Co. Limited On 20 June 2014 the Group disposed of the whole of the share capital of Morgan AM&T Hairong Co. Limited (‘Hairong’) for £0.3 million consideration. The loss recognised on disposal of this shareholding was £3.3 million. prior to the acquisition the immediate parent company of Hairong was Morgan AM&T (Shanghai) Co., Ltd, in which the Group holds a 70% shareholding. The adjustment to the non-controlling interest component of equity due to this transaction was £1.2 million. An income tax credit of £1.9 million has been recognised in respect of this item.
2013business exit costsBusiness exit costs relates to Composites and Defence Systems and is a result of the exit of the uK MoD vehicles logistics and spares contract and the completion of uK MoD urgent Operational requirements (uOr) for new vehicle builds. Specifically the charge comprises a £5.7 million provision against inventory and a £1.6 million provision for building exit costs and impairment of other assets. An income tax credit of £1.6 million has been recognised in respect of these items.
Impairment of intangible assetsThe impairment of intangible assets consists of a £3.3 million impairment of goodwill and intangible assets originally recognised on acquisition of Morgan AM&T Hairong Co. Limited (formerly Changsha Hairong New Materials Co. Limited) (‘Hairong’), based on the current view of the future financial performance of Hairong. An income tax credit of £0.2 million has been recognised in respect of this item.
Loss on disposal of businessOn 28 December 2013 the Group disposed of 23.85% of the share capital of Assam Carbon products Ltd (‘Assam’) for nil consideration. The Group retains a 28.8% shareholding. As a result of the transaction the Group no longer has control of Assam and has therefore deconsolidated the assets and liabilities of Assam in these consolidated financial statements. The loss recognised on the disposal of this shareholding was £2.3 million. Based on the Group’s remaining 28.8% shareholding the Group accounts for the shareholding as an associate. The fair value of the Group’s remaining investment has been measured at nil. The adjustment to the non-controlling interest component of equity due to this transaction was £0.6 million.

108 FINANCIAL STATEMENTS FINANCIAL STATEMENTS 109
Morgan aDVanCED MaTErIaLS annuaL rEporT 2014
NOTES TO THE CONSOLIDATED FINANCIAL STATEMENTScontinued
7. NET FINANCE INCoME AND ExpENSEAccounting policiesNet financing costs comprise interest payable on borrowings calculated using the effective interest rate method, interest receivable on funds invested, gains and losses on hedging instruments that are recognised in the income statement, net interest on IAS 19 pension assets and interest on IAS 19 obligations. Interest income is recognised in the income statement as it accrues, using the effective interest method.
Borrowing costs (interest and other costs) are capitalised when they are incurred on raising specific funds to finance a major capital project which will be a significant productive asset, or to the extent that funds borrowed generally are used for the purposes of obtaining a qualifying asset.
2014£m
2013£m
Recognised in profit or lossAmounts derived from financial instruments 0.7 – Interest income on bank deposits measured at amortised cost 1.4 1.3 Finance income 2.1 1.3
Interest expense on financial liabilities measured at amortised cost (17.2) (18.3)Net interest on IAS 19 obligations (5.7) (6.3)Finance expense (22.9) (24.6)Net financing costs recognised in profit or loss (20.8) (23.3)
Recognised directly in equityNet change in fair value of available-for-sale financial assets – 0.3 Cash flow hedges:– Effective portion of changes in fair value of cash flow hedges – (0.5)– Transferred to profit or loss (0.1) 0.4
Effective portion of change in fair value of net investment hedge 7.9 0.4 Foreign currency translation differences for foreign operations (6.6) (14.6)
1.2 (14.0)
8. TAxATIoN – INCoME TAx ExpENSEAccounting policiesIncome tax on the profit or loss for the year comprises current and deferred tax. Income tax is recognised in the income statement except to the extent that it relates to items recognised directly in OCI, in which case it is recognised in OCI.
Current tax is the expected tax payable on the taxable income for the year, using tax rates enacted or substantively enacted at the balance sheet date, and any adjustment to tax payable in respect of previous years.
Deferred tax is provided using the balance sheet liability method, providing for temporary differences between the carrying amounts of assets and liabilities for financial reporting purposes and the amounts used for taxation purposes. The following temporary differences are not provided for: the initial recognition of goodwill, the initial recognition of assets or liabilities that affect neither accounting nor taxable profit, and differences relating to investments in subsidiaries to the extent that they will probably not reverse in the foreseeable future. The amount of deferred tax provided is based on the expected manner of realisation or settlement of the carrying amount of assets and liabilities, using tax rates enacted or substantively enacted at the balance sheet date.
A deferred tax asset is recognised only to the extent that it is probable that future taxable profits will be available against which the asset can be utilised. Deferred tax assets are reduced to the extent that it is no longer probable that the related tax benefit will be realised.

108 FINANCIAL STATEMENTS FINANCIAL STATEMENTS 109
AnnuAl report 2014 MorgAn ADVAnCeD MAterIAlS
OVE
rVIE
wST
rAT
EGIC
rEp
OrT
GO
VErN
ANC
EFI
NAN
CIA
L ST
ATEM
ENTS
8. TAxATIoN – INCoME TAx ExpENSE continuedTaxation – income tax expenserecognised in the income statement
2014£m
2013£m
Current tax expenseCurrent year 23.6 23.5 Adjustments for prior years (1.3) (3.6)
22.3 19.9 Deferred tax expenseOrigination and reversal of temporary differences (3.1) (0.6) Total income tax expense in income statement 19.2 19.3
reconciliation of effective tax rate
2014£m
2014%
2013£m
2013%
profit before tax 31.5 64.0
Income tax using the domestic corporation tax rate 6.8 21.6 14.9 23.2 Non-deductible expenses 10.9 34.6 3.6 5.6 Temporary differences not equalised in deferred tax (0.3) (1.0) 1.0 1.6 Adjustments in respect of prior years (0.8) (2.5) (2.2) (3.4)recognition of previously unrecognised temporary differences 1.1 3.5 (5.0) (7.8)Other (including the impact of overseas tax rates) 1.5 4.8 7.0 10.9
19.2 61.0 19.3 30.1
Income tax recognised directly in equityTax effect on components of other comprehensive income:– Current tax associated with share schemes – (0.5)– Deferred tax associated with defined benefit schemes and share schemes (10.0) 6.0– Other – –Total income tax recognised directly in equity (10.0) 5.5
The effective rate of tax before specific adjusting items is 29.6% (2013: 27.4%).

110 FINANCIAL STATEMENTS FINANCIAL STATEMENTS 111
Morgan aDVanCED MaTErIaLS annuaL rEporT 2014
NOTES TO THE CONSOLIDATED FINANCIAL STATEMENTScontinued
9. EArNINgS pEr ShArE Earnings per share from continuing operationsThe calculation of basic/diluted earnings per share from continuing operations at 31 December 2014 was based on the following:
2014 2013Basic
£mDiluted
£mBasic
£mDiluted
£m
Profit attributable to equity holders of the Company from continuing operations 7.8 7.8 41.8 41.8
Weighted average number of Ordinary sharesIssued Ordinary shares at the beginning of the period (millions) 285.4 285.4 279.7 279.7 Effect of shares issued in period and shares held by
The Morgan General Employee Benefit Trust (millions) (0.3) (0.3) 3.2 3.2 Dilutive effect of share options/incentive schemes (millions) n/a 0.5 n/a 1.3 Basic/diluted weighted average number of Ordinary shares during the period (millions) 285.1 285.6 282.9 284.2 Earnings per share from continuing operations (pence) 2.7p 2.7p 14.8p 14.7p
underlying earnings per share The calculation of basic/diluted underlying earnings per share at 31 December 2014 was based on the following:
2014 2013Basic
£mDiluted
£mBasic
£mDiluted
£m
Underlying operating profit before specific adjusting items and amortisation, less net financing costs, income tax expense and non-controlling interests 63.0 63.0 60.7 60.7
Basic/diluted weighted average number of Ordinary shares during the period – calculated as above (millions) 285.1 285.6 282.9 284.2
Earnings per share before specific adjusting items and amortisation of intangible assets (pence) 22.1p 22.1p 21.5p 21.4p
10. propErTy, pLANT AND EquIpMENT Accounting policies (i) Owned assets Items of property, plant and equipment are stated at cost, or at deemed cost, less accumulated depreciation (see below) and impairment losses. The cost of self-constructed assets includes the cost of materials, direct labour, and an appropriate proportion of production overheads.
where parts of an item of property, plant and equipment have different useful lives, they are accounted for as separate items of property, plant and equipment.
Gains and losses on the disposal of property, plant and equipment are determined by comparing the proceeds from disposal with the carrying amount of the asset. Gains and losses on the disposal of property are recognised in ‘restructuring costs and other one-off items’ in the income statement. Gains and losses on the disposal of plant and equipment are recognised in ‘Operating costs before restructuring costs, other one-off items and amortisation of intangible assets’ in the income statement.
(ii) Leased assets Leases under the terms of which the Group assumes substantially all the risks and rewards of ownership are classified as finance leases. Leased assets acquired by way of a finance lease are stated at an amount equal to the lower of their fair value and the present value of the minimum lease payments at inception of the lease, less accumulated depreciation and impairment losses.
(iii) Depreciation Depreciation is charged to the income statement on a straight-line basis over the estimated useful lives of each part of an item of property, plant and equipment. Land is not depreciated. Depreciation methods, useful lives and residual values are reviewed at each balance sheet date. The estimated useful lives are as follows:
> Buildings 50 years > plant and equipment and fixtures 3-20 years

110 FINANCIAL STATEMENTS FINANCIAL STATEMENTS 111
AnnuAl report 2014 MorgAn ADVAnCeD MAterIAlS
OVE
rVIE
wST
rAT
EGIC
rEp
OrT
GO
VErN
ANC
EFI
NAN
CIA
L ST
ATEM
ENTS
10. propErTy, pLANT AND EquIpMENT continued property, plant and equipment
Land and buildings
£m
plant andequipment
and fixtures£m
Total£m
Cost Balance at 1 January 2013 153.1 530.1 683.2 Additions 7.4 25.7 33.1 Disposals (2.4) (18.4) (20.8)Effect of movement in foreign exchange (2.6) (9.8) (12.4)Balance at 31 December 2013 155.5 527.6 683.1
Balance at 1 January 2014 155.5 527.6 683.1 Additions 5.5 26.3 31.8 Acquisition of subsidiary 0.1 12.1 12.2 Disposals (0.4) (15.5) (15.9)Transfer to assets classified as held for sale (7.0) (11.3) (18.3)Effect of movement in foreign exchange 0.3 5.7 6.0 Balance at 31 December 2014 154.0 544.9 698.9
Depreciation and impairment losses Balance at 1 January 2013 54.2 383.5 437.7 Depreciation charge for the year 4.9 24.4 29.3 Disposals (0.5) (17.2) (17.7)Effect of movement in foreign exchange (1.0) (6.6) (7.6)Balance at 31 December 2013 57.6 384.1 441.7
Balance at 1 January 2014 57.6 384.1 441.7 Depreciation charge for the year 4.7 23.1 27.8 Acquisition of subsidiary – 6.5 6.5 Impairment loss 1.7 1.4 3.1 Disposals (0.5) (11.4) (11.9)Transfer to assets classified as held for sale (3.4) (10.7) (14.1)Effect of movement in foreign exchange 0.8 4.0 4.8 Balance at 31 December 2014 60.9 397.0 457.9
Carrying amounts At 1 January 2013 98.9 146.6 245.5 At 31 December 2013 97.9 143.5 241.4 At 31 December 2014 93.1 147.9 241.0
Assets pledged as security for liabilities At 31 December 2014 no assets (2013: £3.8 million) are subject to registered debentures to secure bank loans and other liabilities (see note 18). There were no borrowings drawn on these debentures (2013: £0.9 million).
11. INTANgIbLE ASSETSAccounting policies (i) GoodwillAll business combinations are accounted for by applying the purchase method. Goodwill represents the difference between the cost of the acquisition and the fair value of assets, liabilities and contingent liabilities acquired.
Goodwill is allocated to cash-generating units and is tested annually for impairment.
(ii) Research and development Expenditure on research activities, undertaken with the prospect of gaining new scientific or technical knowledge and understanding, is recognised in the income statement as an expense as incurred.

112 FINANCIAL STATEMENTS FINANCIAL STATEMENTS 113
Morgan aDVanCED MaTErIaLS annuaL rEporT 2014
NOTES TO THE CONSOLIDATED FINANCIAL STATEMENTScontinued
11. INTANgIbLE ASSETS continuedAccounting policies continuedExpenditure on development activities, whereby research findings are applied to a plan or design for the production of new or substantially improved products and processes, is capitalised if the product or process is technically and commercially feasible and the Group has sufficient resources to complete development, use and sale of products or processes. The expenditure capitalised includes the cost of materials, direct labour and an appropriate proportion of overheads. Capitalised development expenditure is stated at cost less accumulated amortisation (see below) and impairment losses. Other development expenditure is recognised in the income statement as an expense as incurred.
(iii) Other intangible assets Other intangible assets that are acquired by the Group are stated at cost less accumulated amortisation (see below) and impairment losses.
(iv) AmortisationAmortisation is charged to the income statement on a straight-line basis over the estimated useful lives of intangible assets unless such lives are indefinite. Goodwill and intangible assets with an indefinite useful life are systematically tested for impairment at each balance sheet date. Other intangible assets are amortised from the date they are available for use. The estimated useful lives are as follows:
> Capitalised development costs 3 years > Computer software 3-6 years > Customer relationships 15-20 years > Technology and trademarks 15-20 years > Order book Amortised over the period in which the associated orders are fulfilled
Intangible assets
Goodwill £m
Order book
£m
Customerrelationships
£m
Technologyand trademarks
£m
Capitalised development
costs£m
Computersoftware
£mTotal
£m
Cost Balance at 1 January 2013 191.1 – 75.2 22.6 0.6 14.0 303.5 Additions (externally purchased) – – – – – 2.4 2.4 Disposals – – – – – (0.2) (0.2)Impairment – – – – – – – remeasurement of goodwill (3.7) – – – – – (3.7)Effect of movement in foreign exchange (2.2) – (1.3) – – (0.2) (3.7)Balance at 31 December 2013 185.2 – 73.9 22.6 0.6 16.0 298.3 Balance at 1 January 2014 185.2 – 73.9 22.6 0.6 16.0 298.3 Additions (externally purchased) 6.8 0.2 3.2 3.5 – 4.2 17.9 Disposals (1.8) – (0.4) (3.0) – (4.1) (9.3)Effect of movement in foreign exchange 1.7 – 2.0 – – – 3.7 Balance at 31 December 2014 191.9 0.2 78.7 23.1 0.6 16.1 310.6
Amortisation and impairment losses Balance at 1 January 2013 – – 21.0 6.8 0.6 10.0 38.4 Amortisation charge for the year – – 4.4 1.8 – 2.1 8.3 Impairment losses for the year 1.6 – 0.3 1.4 – – 3.3 Disposals – – – – – (0.2) (0.2)Effect of movement in foreign exchange – – (0.7) (0.2) – (0.1) (1.0)Balance at 31 December 2013 1.6 – 25.0 9.8 0.6 11.8 48.8 Balance at 1 January 2014 1.6 – 25.0 9.8 0.6 11.8 48.8 Amortisation charge for the year – 0.2 4.2 1.4 – 2.4 8.2 Impairment losses for the year 16.4 – 10.5 – – – 26.9 Disposals (1.7) – (0.4) (3.0) – (4.2) (9.3)Effects of movement in foreign exchange 0.1 – 0.7 – – (0.1) 0.7 Balance at 31 December 2014 16.4 0.2 40.0 8.2 0.6 9.9 75.3 Carrying amounts At 1 January 2013 191.1 – 54.2 15.8 – 4.0 265.1 At 31 December 2013 183.6 – 48.9 12.8 – 4.2 249.5 At 31 December 2014 175.5 – 38.7 14.9 – 6.2 235.3

112 FINANCIAL STATEMENTS FINANCIAL STATEMENTS 113
AnnuAl report 2014 MorgAn ADVAnCeD MAterIAlS
OVE
rVIE
wST
rAT
EGIC
rEp
OrT
GO
VErN
ANC
EFI
NAN
CIA
L ST
ATEM
ENTS
11. INTANgIbLE ASSETS continuedImpairment test for cash-generating units containing goodwill In accordance with the requirements of IAS 36 Impairment of Assets, goodwill is allocated to the Group’s cash-generating units that are expected to benefit from the synergies of the business combination that gave rise to the goodwill. Goodwill is attributed to each cash-generating unit as follows:
2014 £m
2013£m
North America 77.3 77.5 Europe 53.7 45.8 Asia/rest of world 44.5 43.9 Composites and Defence Systems – 16.4
175.5 183.6
Each cash-generating unit is assessed for impairment annually and whenever there is an indication of impairment.
As part of the annual impairment test review the carrying value of goodwill has been assessed with reference to its value in use reflecting the projected discounted cash flows of each cash-generating unit to which goodwill has been allocated.
The key assumptions used in determining value in use relate to growth rates and discount rates.
The cash flow projections in year one are based on budgeted operating cash flow projections in year one. The key assumptions that underpin these cashflow projections relate to sales and operating margins, which are based on past experience, taking into account the effect of known or likely changes in market or operating conditions.
Growth rates for the period not covered by budgets are specific to each cash-generating unit, ranging from 1.5% to 5.5% (2013: 1.0% to 5.0%). The growth rates are also used to calculated a terminal value. These growth rates reflect the products, industries and countries in which the operating segments operate. These medium- to long-term growth rates have been reviewed by management during 2014 and are considered to be appropriate.
In 2014 the Group has used the following pre-tax discount rates for calculating the terminal value of each of the new cash-generating units: North America 15.0%, Europe: 12.0%, Asia/rest of world: 14.8%, Composites and Defence Systems: 14.0% (2013: 12.2%, 12.9%, 15.1%, 12.4%). These discount rates have been used as the Group believes they suitably approximate the rates used by end-market participants. The Directors have considered the following individual sensitivities and are confident that no impairment would arise for each of the North America, Europe and Asia/rest of world cash-generating units in any of the following three circumstances:
> if the pre-tax discount rate was increased to 30%; or > if no growth was assumed for years two to five and in the calculation of terminal value; or > if the cash flow projections of all businesses were reduced by 25% (2013: 25%).
During the year ended 31 December 2014 the Group recognised an impairment loss of £16.4 million on goodwill and £10.5 million on customer relationships in relation to Composites and Defence Systems cash-generating unit. Following this impairment charge, the carrying amount of Composites and Defence Systems is equal to its recoverable amount. The Group also disposed of £1.7 million of goodwill, £0.4 million of customer relationships and £3.0 million of technology and trademarks as part of the disposal of Morgan AM&T Hairong Ltd. All of these had nil net book value at the date of disposal. Further details are given in note 6. Additions to goodwill, order book, customer relationships, technology and trademarks are from the acquisition of porextherm Dämmstoffe GmbH. Further details of this acquisition are given in note 2. During the year ended 31 December 2013 the Group recognised an impairment loss of £1.6 million on goodwill in relation to Morgan AM&T Hairong Ltd, which was identified when undertaking the exercise to review the composition of the cash-generating units following the internal organisation changes. It also recognised an impairment loss of £0.3 million on customer relationships and £1.4 million of technology and trademarks in relation to Morgan AM&T Hairong Ltd. Morgan AM&T Hairong Ltd formed part of the Asia/rest of world cash-generating unit. Further details are given in note 6.

114 FINANCIAL STATEMENTS FINANCIAL STATEMENTS 115
Morgan aDVanCED MaTErIaLS annuaL rEporT 2014
NOTES TO THE CONSOLIDATED FINANCIAL STATEMENTScontinued
12. INvESTMENTSAccounting policiesInvestments in debt and equity securitiesInvestments in debt and equity securities held by the Group are classified as being available-for-sale and are stated at fair value, with any resultant gain or loss being recognised directly in OCI (in the fair value reserve), except for impairment losses and, in the case of monetary items such as debt securities, foreign exchange gains and losses. when these investments are derecognised, the cumulative gain or loss previously recognised directly in equity is recognised in profit or loss. where these investments are interest-bearing, interest calculated using the effective interest method is recognised in profit or loss.
2014£m
2013£m
Non-current investmentsEquity securities available-for-sale 1.6 2.7 Investment in associates 4.6 1.0
6.2 3.7
Equity securities available-for-sale The equity securities available-for-sale represent an investment in a mutual fund. A 10% increase in the unit price would increase the fair value of the investments by £0.1 million.
Investment in associates Details of the Group’s material associate at the end of the reporting period are as follows:
Name of associate principal activityplace of incorporation and principal place of business
proportion of ownership interest/voting rights held by the Group
2014 2013
Jemmtec Limited Manufacture of fired refractory shapes united Kingdom 35% nil
The above associate has been accounted for using the equity method in these consolidated financial statements.
The Group did not receive dividends from any of its associates during 2014 and 2013.
Summarised financial information in respect of each of the Group’s material associates is set out below. The summarised financial information below has been prepared in accordance with IFrSs (adjusted by the Group for equity accounting purposes).
Jemmtec Limited2014
£m2013
£m
Current assets 7.6 n/aNon-current assets 9.7 n/aCurrent liabilities 5.4 n/aNon-current liabilities 2.1 n/arevenue 10.5 n/aLoss from continuing operations (0.1) n/a
reconciliation of the above summarised financial information to the carrying amount of the interest recognised in the Group’s consolidated financial statements:
Jemmtec Limited2014
£m2013
£m
Net assets of associate 9.8 n/aproportion of the Group’s ownership interest in the associate 3.4 n/aGoodwill 0.2 n/aCarrying amount of the Group’s interest in the associate 3.6 n/a
The aggregate of the Group’s share of profit and total comprehensive income for associates that are not individually material was nil (2013: nil).
Details of changes in the Group’s ownership interests in associates are given in note 6.

114 FINANCIAL STATEMENTS FINANCIAL STATEMENTS 115
AnnuAl report 2014 MorgAn ADVAnCeD MAterIAlS
OVE
rVIE
wST
rAT
EGIC
rEp
OrT
GO
VErN
ANC
EFI
NAN
CIA
L ST
ATEM
ENTS
13. rECogNISED DEFErrED TAx ASSETS AND LIAbILITIESDeferred tax assets and liabilities are attributable to the following:
Assets2014
£m
Assets2013
£m
Liabilities2014
£m
Liabilities2013
£m
Net2014
£m
Net2013
£m
property, plant and equipment – – (17.6) (16.3) (17.6) (16.3)Intangible assets – – (15.8) (16.3) (15.8) (16.3)Employee benefits 29.4 22.5 – – 29.4 22.5 provisions 7.6 5.1 – – 7.6 5.1 Tax value of loss carried forward recognised 1.0 0.6 – – 1.0 0.6 Other items 1.5 – – (0.9) 1.5 (0.9)
39.5 28.2 (33.4) (33.5) 6.1 (5.3)
unrecognised deferred tax assetsDeferred tax assets have not been recognised in respect of the following items:
2014£m
2013£m
Deductible temporary differences 147.2 88.4 Tax losses 107.2 73.1
254.4 161.5
In addition to the above, there is an unrecognised deferred tax asset for capital losses in the uK of £82 million. This asset has not been recognised due to uncertainty surrounding its future utilisation.
Movements in temporary differences during the year
Balance31 December
2012£m
recognisedin income
£m
recogniseddirectly in
equity£m
Balance31 December
2013£m
On acquisition£m
Recognisedin income
£m
Recognised directly in
equity£m
Balance31 December
2014£m
property, plant and equipment (21.2) 4.9 – (16.3) – (1.3) – (17.6)
Intangible assets (18.3) 2.0 – (16.3) (1.7) 2.2 – (15.8)Employee benefits 33.4 (4.9) (6.0) 22.5 – (3.1) 10.0 29.4 provisions 5.7 (0.6) – 5.1 – 2.5 – 7.6 Tax value of loss carried
forward recognised 1.5 (0.9) – 0.6 – 0.4 – 1.0 Others (1.0) 0.1 – (0.9) – 2.4 – 1.5
0.1 0.6 (6.0) (5.3) (1.7) 3.1 10.0 6.1
Deferred income tax of £2.5 million is provided on the potential unremitted earnings of overseas subsidiary undertakings.

116 FINANCIAL STATEMENTS FINANCIAL STATEMENTS 117
Morgan aDVanCED MaTErIaLS annuaL rEporT 2014
NOTES TO THE CONSOLIDATED FINANCIAL STATEMENTScontinued
14. INvENTorIESAccounting policiesInventories are stated at the lower of cost and net realisable value. Net realisable value is the estimated selling price in the ordinary course of business, less the estimated costs of completion and selling expenses.
The cost of inventories is based on the first-in-first-out principle and includes expenditure incurred in acquiring the inventories and bringing them to their existing location and condition. In the case of manufactured inventories and work in progress, cost includes an appropriate share of overheads based on normal operating capacity.
Inventories2014
£m2013
£m
raw materials and consumables 35.0 34.1 work in progress 39.5 35.7 Finished goods 52.1 49.1
126.6 118.9
The Group holds consignment inventory amounting to £17.2 million (2013: £14.5 million) which is not reflected in the balance sheet. The majority of this balance is for precious metals, which are held on consignment by a subsidiary and for which it is invoiced only when the material is required.
During the year provisions of £3.2 million were made against inventories and recognised in operating costs (2013: £5.3 million) and £0.4 million (2013: £5.7 million) has been recognised in business exit costs within specific adjusting items (see note 6).
15. TrADE AND oThEr rECEIvAbLESAccounting policiesTrade and other receivables are initially stated at their fair value and subsequently measured at amortised cost less impairment losses.
Trade and other receivables
2014£m
2013£m
CurrentTrade receivables due from associate 2.1 13.0 Other trade receivables 168.4 154.5 Trade receivables 170.5 167.5 Loan made to associate 1.5 – Other non-trade receivables and prepayments 21.9 20.7
193.9 188.2
The Group’s exposure to credit and currency risks related to trade and other receivables is disclosed in note 19.
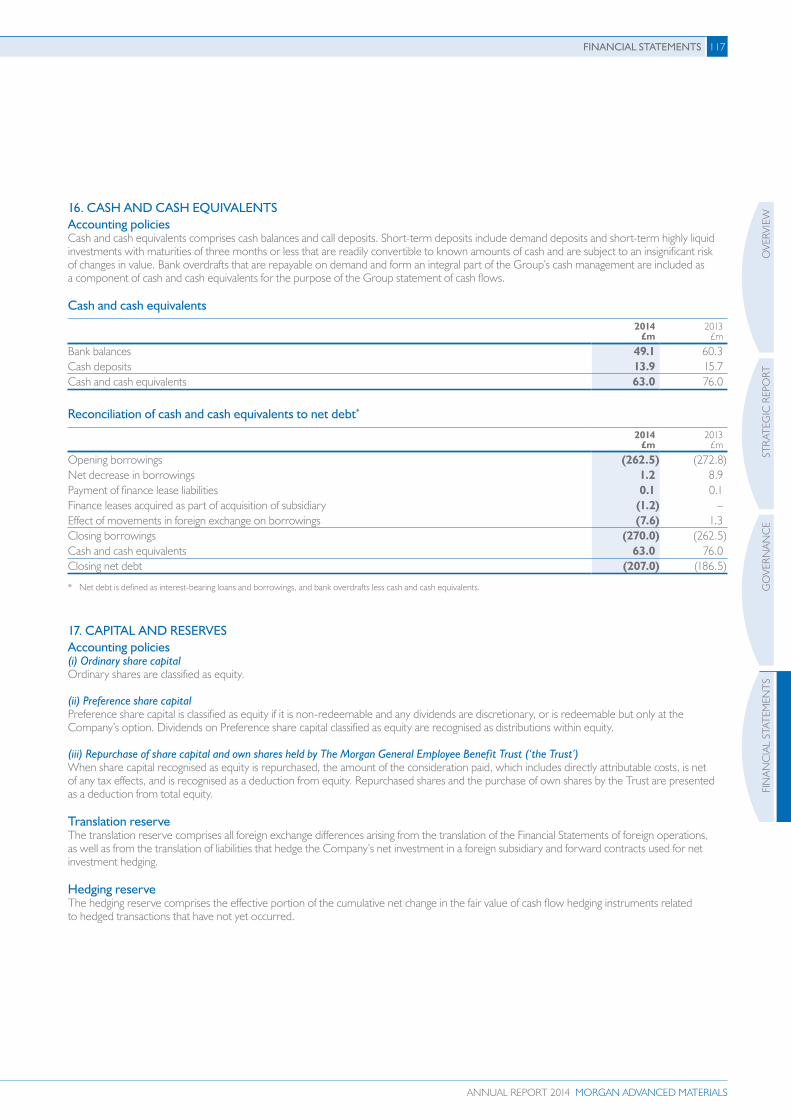
116 FINANCIAL STATEMENTS FINANCIAL STATEMENTS 117
AnnuAl report 2014 MorgAn ADVAnCeD MAterIAlS
OVE
rVIE
wST
rAT
EGIC
rEp
OrT
GO
VErN
ANC
EFI
NAN
CIA
L ST
ATEM
ENTS
16. CASh AND CASh EquIvALENTSAccounting policiesCash and cash equivalents comprises cash balances and call deposits. Short-term deposits include demand deposits and short-term highly liquid investments with maturities of three months or less that are readily convertible to known amounts of cash and are subject to an insignificant risk of changes in value. Bank overdrafts that are repayable on demand and form an integral part of the Group’s cash management are included as a component of cash and cash equivalents for the purpose of the Group statement of cash flows.
Cash and cash equivalents
2014£m
2013£m
Bank balances 49.1 60.3 Cash deposits 13.9 15.7 Cash and cash equivalents 63.0 76.0
reconciliation of cash and cash equivalents to net debt*
2014£m
2013£m
Opening borrowings (262.5) (272.8)Net decrease in borrowings 1.2 8.9 payment of finance lease liabilities 0.1 0.1 Finance leases acquired as part of acquisition of subsidiary (1.2) – Effect of movements in foreign exchange on borrowings (7.6) 1.3 Closing borrowings (270.0) (262.5)Cash and cash equivalents 63.0 76.0 Closing net debt (207.0) (186.5)
* Net debt is defined as interest-bearing loans and borrowings, and bank overdrafts less cash and cash equivalents.
17. CApITAL AND rESErvESAccounting policies(i) Ordinary share capitalOrdinary shares are classified as equity.
(ii) Preference share capital preference share capital is classified as equity if it is non-redeemable and any dividends are discretionary, or is redeemable but only at the Company’s option. Dividends on preference share capital classified as equity are recognised as distributions within equity.
(iii) Repurchase of share capital and own shares held by The Morgan General Employee Benefit Trust (‘the Trust’) when share capital recognised as equity is repurchased, the amount of the consideration paid, which includes directly attributable costs, is net of any tax effects, and is recognised as a deduction from equity. repurchased shares and the purchase of own shares by the Trust are presented as a deduction from total equity. Translation reserve The translation reserve comprises all foreign exchange differences arising from the translation of the Financial Statements of foreign operations, as well as from the translation of liabilities that hedge the Company’s net investment in a foreign subsidiary and forward contracts used for net investment hedging. hedging reserve The hedging reserve comprises the effective portion of the cumulative net change in the fair value of cash flow hedging instruments related to hedged transactions that have not yet occurred.

118 FINANCIAL STATEMENTS FINANCIAL STATEMENTS 119
Morgan aDVanCED MaTErIaLS annuaL rEporT 2014
NOTES TO THE CONSOLIDATED FINANCIAL STATEMENTScontinued
17. CApITAL AND rESErvES continuedFair value reserve The fair value reserve includes the cumulative net change in the fair value of available-for-sale investments until the investment is derecognised. Special reserve A Special resolution to cancel the Share premium Account was passed at the Annual General Meeting of the Company held on 11 June 1993. This cancellation was confirmed by an Order of the High Court of Justice, Chancery Division, on 14 July 1993. The amount of £88.9 million standing to the credit of the Share premium Account on 14 July 1993 was transferred to the special reserve against which goodwill on consolidation could be written off. This reserve, together with the amounts standing to the credit of the Share premium Account on 12 October 1990 of £71.5 million, on 19 June 1987 of £38.9 million and on 27 July 1989 of £12.3 million which were transferred following previous Orders of the High Court, becomes distributable to the extent of subsequent increases in issued share capital and share premium account. Capital redemption reserveThe capital redemption reserve arose when the Company redeemed preference shares wholly out of distributable profits.
other reservesThe other reserves includes the £10.8 million increase in the year ended 3 January 2010 in the fair value of the Group’s original 49% interest in Clearpower Limited from the date of its original acquisition to 5 January 2009 excluding goodwill and to the extent not previously recognised as the Group’s share of the results of Clearpower Limited.
retained earnings The Company has acquired own shares to satisfy the requirements of the various share option incentive schemes. At 31 December 2014 375,203 shares were held by The Morgan General Employee Benefit Trust and are treated as a deduction from equity (2013: 305,041). Nil treasury shares were held by the Company (2013: nil). All rights conferred by those shares are suspended until they are reissued.
DividendsThe following Ordinary dividends were declared and paid by the Company:
per share Total2014
Pence2013
pence2014
£m2013
£m
2012 interim – 3.60 – 10.1 2012 final – 6.40 – 17.9 2013 interim – 3.80 – 10.8 2013 final 6.70 – 19.1 –2014 interim 3.90 – 11.1 –Total 10.60 13.80 30.2 38.8
In addition to the above, the Company also declared and paid dividends on the 5.5% Cumulative First preference shares and 5.0% Cumulative Second preference shares. After 31 December 2014 the following dividends were proposed by the Directors for 2014. These dividends have not been provided for and there are no income tax consequences.
£m
7.0 pence per qualifying Ordinary share 20.0 5.5% Cumulative First preference shares (see note 30) –5.0% Cumulative Second preference shares (see note 30) –
20.0
The proposed 2014 final dividend is based upon the number of shares outstanding at the balance sheet date.

118 FINANCIAL STATEMENTS FINANCIAL STATEMENTS 119
AnnuAl report 2014 MorgAn ADVAnCeD MAterIAlS
OVE
rVIE
wST
rAT
EGIC
rEp
OrT
GO
VErN
ANC
EFI
NAN
CIA
L ST
ATEM
ENTS
17. CApITAL AND rESErvES continuedCalled-up share capital
2014£m
2013£m
Equity share capitalFully paid: 285,369,988 (2013: 285,369,988) issued Ordinary shares of 25 pence each 71.4 71.4
71.4 71.4 Preference share capital125,327 issued 5.5% Cumulative First preference shares of £1 each, fully paid 0.1 0.1 311,954 issued 5.0% Cumulative Second preference shares of £1 each, fully paid 0.3 0.3 Total preference share capital 0.4 0.4 Total share capital 71.8 71.8
Number of shares in issue
Ordinary shares preference shares2014 2013 2014 2013
In issue at beginning of period 285,369,988 279,741,415 437,281 437,281Scrip dividend – 5,628,573 – – In issue at end of period 285,369,988 285,369,988 437,281 437,281
As at the date of this report 285,369,988 Ordinary shares have been issued (2013: 285,369,988). The holders of Ordinary shares are entitled to receive dividends as declared from time to time and are entitled to one vote per share at meetings of the Company. Details of options outstanding in respect of Ordinary shares are given in note 20. The 5.5% Cumulative First preference shares of £1 each and the 5.0% Cumulative Second preference shares of £1 each confer on the holders thereof the right to receive a cumulative preferential dividend at the rate of 5.5% and 5.0% respectively, calculated up to 30 June and 31 December respectively in every year. The First and Second Cumulative preference shares shall not entitle the holders thereof to attend or vote at any general meeting unless either:
> the meeting is convened to consider any resolutions for reducing the capital, or authorising any issue of debentures or debenture stock, or increasing the borrowing powers of the Board under the Articles of Association of the Company, or winding up, or sanctioning a sale of the undertaking, or altering the Articles in any manner affecting their respective interests, or any other resolutions directly altering their respective rights and privileges; or
> at the date of the notice convening the general meeting the preference dividend is upwards of one month in arrears from the payment date of any half-yearly instalment.
On a return of capital on a winding-up the assets of the Company available for distribution shall be applied: > First, in payment to the holders of the First preference shares of the amounts paid up on such shares, together with interest at the rate
of 5.5% pa. > Second, in payment to the holders of the Second preference shares of the amounts paid up on such shares, together with interest at the rate
of 5.0% pa. > Third, in repaying the capital paid up or credited as paid up on the Ordinary shares. > Fourth, any surplus shall be distributed rateably amongst the holders of the Ordinary shares in proportion to the nominal amount paid up
on their respective holdings of shares in the Company.

120 FINANCIAL STATEMENTS FINANCIAL STATEMENTS 121
Morgan aDVanCED MaTErIaLS annuaL rEporT 2014
NOTES TO THE CONSOLIDATED FINANCIAL STATEMENTScontinued
18. INTErEST-bEArINg LoANS AND borrowINgSThis note provides information about the contractual terms of the Group’s interest-bearing loans and borrowings which are measured at amortised cost. For more information about the Group’s exposure to interest rate and foreign currency risk, see note 19. Accounting policiesInterest-bearing loans and borrowingsInterest-bearing loans and borrowings are recognised initially at fair value less attributable transaction costs. Subsequent to initial recognition, interest-bearing loans and borrowings are stated at amortised cost with any difference between cost and redemption value being recognised in the income statement over the period of the borrowings on an effective interest basis. Finance lease paymentsLeases where the Group assumes substantially all of the risks and rewards of ownership are classified as finance leases as if the asset had been purchased outright. Assets acquired under finance leases are recognised as assets of the Group and the capital elements of the leasing commitments are shown as obligations in creditors. Depreciation is charged on a basis consistent with similar owned assets or over the lease term if shorter. Minimum lease payments are apportioned between the finance charge and the reduction of the outstanding liability. The finance charge is allocated to each period during the lease term so as to produce a constant periodic rate of interest on the remaining balance of the liability. Interest-bearing loans, borrowings and overdrafts
2014£m
2013£m
Non-current liabilitiesSenior Notes 176.1 201.2 Bank and other loans 55.8 0.3 Obligations under finance leases 1.0 –
232.9 201.5
Current liabilitiesSenior Notes 31.3 60.4Bank and other loans 5.5 0.4Obligations under finance leases 0.3 0.2
37.1 61.0
Terms and debt repayment scheduleThe terms and conditions of outstanding loans are given in note 19 in the Liquidity risk section.
Finance lease liabilitiesFinance lease liabilities are payable as follows:
Minimumlease
payments2014
£m
Interest2014
£m
Principal2014
£m
Minimumlease
payments2013
£m
Interest2013
£m
principal2013
£m
Less than one year 0.3 – 0.3 0.2 – 0.2 Between one and five years 1.1 0.1 1.0 – – – More than five years – – – – – –
1.4 0.1 1.3 0.2 – 0.2
Bank and other loans did not include any loans secured on the assets of the Group (2013: £nil). As at 31 December 2014 the Group had available headroom under the bank syndication of £146.6 million (2013: £150.0 million).

120 FINANCIAL STATEMENTS FINANCIAL STATEMENTS 121
AnnuAl report 2014 MorgAn ADVAnCeD MAterIAlS
OVE
rVIE
wST
rAT
EGIC
rEp
OrT
GO
VErN
ANC
EFI
NAN
CIA
L ST
ATEM
ENTS
19. FINANCIAL rISK MANAgEMENTThis note presents information about the Group’s exposure to a variety of financial risks: credit risk, liquidity risk and market risk, and the Group’s management of capital. Further quantitative disclosures are included throughout these consolidated financial statements.
Accounting policiesClassification of financial instruments issued by the Group Financial instruments issued by the Group are treated as equity (ie forming part of shareholders’ funds) only to the extent that they meet the following two conditions:
> they include no contractual obligations upon the Group to deliver cash or other financial assets or to exchange financial assets or financial liabilities with another party under conditions that are potentially unfavourable to the Group; and
> where the instrument will or may be settled in the Company’s own equity instruments, it is either a non-derivative that includes no obligation to deliver a variable number of the Company’s own equity instruments or is a derivative that will be settled by the Company exchanging a fixed amount of cash or other financial assets for a fixed number of its own equity instruments.
To the extent that this definition is not met the proceeds of issue are classified as a financial liability. where the instrument so classified takes the legal form of the Company’s own shares, the amounts presented in these Financial Statements for called-up share capital and share premium account exclude amounts in relation to those shares.
Finance payments associated with financial liabilities are dealt with as part of finance expenses. Finance payments associated with financial instruments that are classified in equity are dividends and are recorded directly in equity.
Credit riskCredit risk is the risk of financial loss to the Group if a customer or counterparty to a financial instrument fails to meet its contractual obligations, and arises principally from the Group’s receivables from customers and investment securities.
The carrying amount of financial assets represents the maximum credit exposure. The maximum exposure to credit risk at the reporting date was:
Carrying amount2014
£m2013
£m
Available-for-sale financial assets 1.6 2.7 Trade and other receivables 170.5 167.5 Cash and cash equivalents 63.0 76.0
235.1 246.2
Available-for-sale financial assetsThe Group limits its exposure to credit risk by only investing in liquid securities and only with counterparties that have a sound credit rating. Given these high credit ratings, management does not expect any counterparty to fail to meet its obligations.

122 FINANCIAL STATEMENTS FINANCIAL STATEMENTS 123
Morgan aDVanCED MaTErIaLS annuaL rEporT 2014
NOTES TO THE CONSOLIDATED FINANCIAL STATEMENTScontinued
19. FINANCIAL rISK MANAgEMENT continuedTrade and other receivablesThe Group’s exposure to credit risk is influenced mainly by the individual characteristics of each customer. The demographics of the Group’s customer base, including the default risk of the industries and countries in which customers operate, has less influence on credit risk. Management has a credit policy in place and the exposure to credit risk is monitored on an ongoing basis. Credit evaluations are performed on all customers requiring credit over a certain amount. The Group does not require collateral in respect of financial assets. The Group serves thousands of customers. Many of these have purchased the same product for several years and in some cases decades. Others have modified and enhanced designs or adopted the same components into new products, extending the lifecycle of the components that the Group supplies. The Group’s level of customer retention is very high, particularly with its major accounts, and, although the top 20 ranking will alter from year to year, many of the names remain consistent over time. The Group establishes an allowance for impairment that represents its estimate of incurred losses in respect of trade and other receivables and investments.
The ageing of trade receivables at the reporting date was:
Gross 2014
£m
Impairment 2014
£m
Gross 2013
£m
Impairment 2013
£m
Not past due 134.6 (0.2) 121.7 (0.4)past due 0-30 days 19.5 (0.1) 27.0 (0.3)past due 31-60 days 6.7 (0.2) 9.2 (0.4)past due 61-90 days 12.0 (3.5) 11.5 (3.9)past due more than 90 days 9.9 (8.2) 11.2 (8.1)
182.7 (12.2) 180.6 (13.1)
The only movement in the allowance for impairment in respect of trade receivables was a decrease of £0.9 million (2013: increase of £0.5 million). A specific impairment allowance may be created in respect of an individual trade receivable for which full recovery is doubtful. As at 31 December 2014 and 31 December 2013 there were no specific impairment allowances that were significant to the Group.
The allowances in the accounts in respect of trade receivables are used to record impairment losses unless the Group is satisfied that no recovery of the amount owing is possible; at the point the amount is considered irrecoverable it is written off against the financial asset directly.
Cash and cash equivalentsCash balances held by companies representing over 75% of the Group’s revenue are managed centrally through a number of pooling arrangements. Cash balances throughout the Group are held with high-credit-quality financial institutions.
Liquidity riskLiquidity risk is the risk that the Group will encounter difficulty in meeting the obligations associated with its financial liabilities that are settled by cash. The Group’s approach to managing liquidity is to ensure, as far as possible, that it will always have sufficient liquidity to meet its liabilities when due, under both normal and stressed conditions.
The Group seeks a balance between certainty of funding and a flexible, cost-effective borrowing structure. The policy is to ensure that the Group has sufficient liquidity available to meet all foreseeable needs.

122 FINANCIAL STATEMENTS FINANCIAL STATEMENTS 123
AnnuAl report 2014 MorgAn ADVAnCeD MAterIAlS
OVE
rVIE
wST
rAT
EGIC
rEp
OrT
GO
VErN
ANC
EFI
NAN
CIA
L ST
ATEM
ENTS
19. FINANCIAL rISK MANAgEMENT continuedThe following are the undiscounted contracted maturities of financial liabilities, including interest payments:
2014
Effectiveinterest
rateYear of
maturity
Carryingamount
£m
Contractualcash
flows£m
Less than
1 year£m
1-2years
£m
2-5years
£m
More than
5 years£m
Non-derivative financial liabilities 3.65% Euro Senior Notes 2015 3.65% 2015 31.3 31.9 31.9 – – – 4.32% Euro Senior Notes 2017 4.32% 2017 15.7 17.4 0.7 0.7 16.0 – 6.12% uS Dollar Senior Notes 2017 6.12% 2017 112.3 132.9 6.9 6.9 119.1 – 6.26% uS Dollar Senior Notes 2019 6.26% 2019 48.1 63.1 3.0 3.0 57.1 – Bank and other loans 1.16% up to 2019 61.3 61.3 8.5 0.3 52.5 Obligations under finance leases 4.78% up to 2019 1.3 1.4 0.4 0.3 0.7 – Trade and other payables 93.0 93.0 93.0 – – –
Derivative financial liabilitiesForward exchange contracts
as cash flow hedges 0.7 0.7 0.7 – – – Forward exchange contracts
as fair value hedges 0.1 0.1 0.1 – – – Forward exchange contracts
as net investment hedges – – – – – – 363.8 401.8 145.2 11.2 245.4 –
2013
Effectiveinterest
rateYear of
maturity
Carryingamount
£m
Contractualcash
flows£m
Less than
1 year£m
1-2years
£m
2-5years
£m
More than
5 years£m
Non-derivative financial liabilities 5.70% uS Dollar Senior Notes 2014 5.70% 2014 60.4 63.8 63.8 – – – 3.65% Euro Senior Notes 2015 3.65% 2015 33.6 35.4 1.2 34.2 – – 4.32% Euro Senior Notes 2017 4.32% 2017 16.8 19.3 0.7 0.7 17.9 – 6.12% uS Dollar Senior Notes 2017 6.12% 2017 105.6 131.6 6.5 6.5 118.6 – 6.26% uS Dollar Senior Notes 2019 6.26% 2019 45.2 62.2 2.8 2.8 8.5 48.1 Bank and other loans 7.30% up to 2017 0.7 1.5 0.9 0.2 0.4 – Obligations under finance leases 6.00% up to 2014 0.2 0.2 0.2 – – – Trade and other payables 90.3 90.3 90.3 – – –
Derivative financial liabilitiesForward exchange contracts
as cash flow hedges 0.1 0.1 0.1 – – – Forward exchange contracts
as fair value hedges 0.6 0.6 0.6 – – – Forward exchange contracts
as net investment hedges 0.2 0.2 0.2 – – – 353.7 405.2 167.3 44.4 145.4 48.1
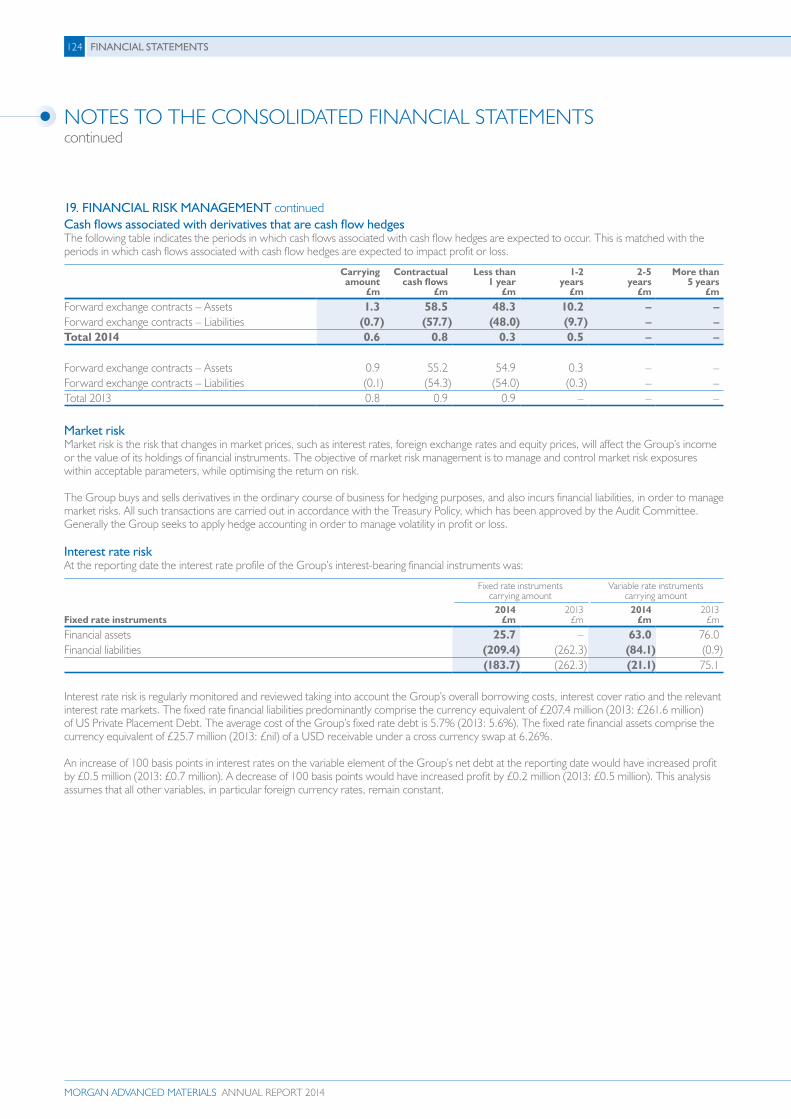
124 FINANCIAL STATEMENTS FINANCIAL STATEMENTS 125
Morgan aDVanCED MaTErIaLS annuaL rEporT 2014
NOTES TO THE CONSOLIDATED FINANCIAL STATEMENTScontinued
19. FINANCIAL rISK MANAgEMENT continuedCash flows associated with derivatives that are cash flow hedgesThe following table indicates the periods in which cash flows associated with cash flow hedges are expected to occur. This is matched with the periods in which cash flows associated with cash flow hedges are expected to impact profit or loss.
Carryingamount
£m
Contractualcash flows
£m
Less than1 year
£m
1-2years
£m
2-5years
£m
More than 5 years
£m
Forward exchange contracts – Assets 1.3 58.5 48.3 10.2 – – Forward exchange contracts – Liabilities (0.7) (57.7) (48.0) (9.7) – – Total 2014 0.6 0.8 0.3 0.5 – –
Forward exchange contracts – Assets 0.9 55.2 54.9 0.3 – – Forward exchange contracts – Liabilities (0.1) (54.3) (54.0) (0.3) – – Total 2013 0.8 0.9 0.9 – – –
Market riskMarket risk is the risk that changes in market prices, such as interest rates, foreign exchange rates and equity prices, will affect the Group’s income or the value of its holdings of financial instruments. The objective of market risk management is to manage and control market risk exposures within acceptable parameters, while optimising the return on risk.
The Group buys and sells derivatives in the ordinary course of business for hedging purposes, and also incurs financial liabilities, in order to manage market risks. All such transactions are carried out in accordance with the Treasury policy, which has been approved by the Audit Committee. Generally the Group seeks to apply hedge accounting in order to manage volatility in profit or loss.
Interest rate riskAt the reporting date the interest rate profile of the Group’s interest-bearing financial instruments was:
Fixed rate instruments carrying amount
Variable rate instruments carrying amount
Fixed rate instruments2014
£m2013
£m2014
£m2013
£m
Financial assets 25.7 – 63.0 76.0 Financial liabilities (209.4) (262.3) (84.1) (0.9)
(183.7) (262.3) (21.1) 75.1
Interest rate risk is regularly monitored and reviewed taking into account the Group’s overall borrowing costs, interest cover ratio and the relevant interest rate markets. The fixed rate financial liabilities predominantly comprise the currency equivalent of £207.4 million (2013: £261.6 million) of uS private placement Debt. The average cost of the Group’s fixed rate debt is 5.7% (2013: 5.6%). The fixed rate financial assets comprise the currency equivalent of £25.7 million (2013: £nil) of a uSD receivable under a cross currency swap at 6.26%.
An increase of 100 basis points in interest rates on the variable element of the Group’s net debt at the reporting date would have increased profit by £0.5 million (2013: £0.7 million). A decrease of 100 basis points would have increased profit by £0.2 million (2013: £0.5 million). This analysis assumes that all other variables, in particular foreign currency rates, remain constant.

124 FINANCIAL STATEMENTS FINANCIAL STATEMENTS 125
AnnuAl report 2014 MorgAn ADVAnCeD MAterIAlS
OVE
rVIE
wST
rAT
EGIC
rEp
OrT
GO
VErN
ANC
EFI
NAN
CIA
L ST
ATEM
ENTS
19. FINANCIAL rISK MANAgEMENT continuedForeign currency riskThe table below shows the Group’s currency exposures, being exposures on currency transactions that give rise to net currency gains and losses recognised in the income statement. Such exposures comprise the monetary assets and liabilities of the Group that are not denominated in the functional currency of the operating company involved, other than certain non-GBp borrowings treated as hedges of net investments in overseas entities.
2014 2013
Functional currency of Group operationsGBP
£mUSD
£m€
£mGBp£m
uSD£m
€£m
Trade receivables 2.2 4.5 21.1 1.0 11.4 4.7 Cash and cash equivalents 0.5 1.0 (5.9) 0.3 4.3 8.0 Trade payables (2.4) (9.2) (3.2) (1.1) (9.6) (4.3)Net balance sheet exposure 0.3 (3.7) 12.0 0.2 6.1 8.4
The amounts shown in the table take into account the effect of the forward contracts entered into to manage these currency exposures.
The Group aims to hedge all material trade receivables and trade payables denominated in a foreign currency. At any point in time the Group also hedges up to 75% of its estimated foreign currency exposure in respect of forecasted sales and purchases over the following 12 months. The Group uses forward exchange contracts to hedge its foreign currency risk. Almost all of the forward exchange contracts have maturities of less than one year after the balance sheet date.
In respect of other monetary assets and liabilities held in currencies other than the currency of the reporting unit, the Group ensures that the net exposure is kept to an acceptable level, by buying or selling foreign currencies at spot rates where necessary to address short-term imbalances.
The Group classifies its forward exchange contracts hedging forecasted transactions as cash flow hedges and states them at fair value. The fair value of forward exchange contracts used as hedges of forecasted transactions at 31 December 2014 was an asset of £0.6 million (2013: asset of £0.8 million).
The contractual cash flows associated with the forward exchange contracts that are designated as cash flow hedges are shown in the section on liquidity risk. The impact on profit or loss is expected to occur at the same time as the associated cash flows.
The Group maintains in-country local currency borrowings, and has designated certain forward foreign exchange contracts and other borrowings as hedges of the foreign exchange risk associated with investments in foreign operations. In this way, the Group seeks to manage the translation exposure of overseas net assets, but only to the extent that its gearing covenant under the terms of its loan documents, as well as its facility headroom, are likely to remain comfortably within limits, and provided the associated costs are not prohibitive.
The Group’s currency split of total borrowings after the impact of net investment hedges was as follows:
2014£m
2013£m
GBp 6.3 6.6 uSD 160.3 196.2 € 82.2 51.4 Japanese Yen 7.5 8.0 Other 5.8 0.3
262.1 262.5
The Group’s sensitivity to changes in foreign exchange rates on financial assets and liabilities as at 31 December 2014 is as follows: > Based upon the currency profile of the group’s net financial assets and liabilities, if GBp had strengthened by 10%, reported net financial
liabilities would have increased by £21.6 million (2013: £18.1 million). Conversely, if GBp had weakened by 10%, reported net financial liabilities would have reduced by £26.3 million (2013: £22.1 million). Assuming the change occurred on the balance sheet date, there would be no impact on reported profit.
> The impact of a weakening in GBp on the Group’s financial assets and liabilities would be more than offset in equity and income by its impact on the Group’s overseas net assets and earnings respectively.
> Based on the 2014 results, if in isolation the uSD average exchange rate for 2014 were 10% weaker, reported revenue and profit before tax would be £33.0 million (2013: £33.4 million) and £4.3 million (2013: £3.8 million) lower.
> Based on the 2014 results, if in isolation the Eur average exchange rate for 2014 were 10% weaker, reported revenue and profit before tax would be £21.3 million (2013: £21.2 million) and £2.7 million (2013: £2.7 million) lower.

126 FINANCIAL STATEMENTS FINANCIAL STATEMENTS 127
Morgan aDVanCED MaTErIaLS annuaL rEporT 2014
NOTES TO THE CONSOLIDATED FINANCIAL STATEMENTScontinued
19. FINANCIAL rISK MANAgEMENT continuedother market price riskEquity price risk arises from available-for-sale equity securities held for meeting partially the unfunded portion of the Group’s defined benefit pension obligations. The primary goal of the Group’s investment strategy is to maximise returns in order to meet partially the Group’s unfunded defined benefit obligations. Capital managementThe Board’s policy is to maintain a strong capital base (total equity) so as to maintain investor, creditor and market confidence and to sustain future development of the business. The Board uses a number of measures, identified as key performance indicators (KpIs), to ensure the continued success of the Group. The main KpI for the Group is the underlying operating profit margin. The aim is to achieve mid-teen margins in good times and double-digit margins when the environment is more challenging.
The Board encourages employees of the Group to hold the Company’s Ordinary shares. The Group operates a number of employee share and share option schemes. From time to time the Company purchases its own shares on the market; the timing of these purchases depends on market prices. primarily the shares are intended to be used for issuing shares under the Group’s various share option incentive schemes.
The Board seeks to maintain a balance between the advantages and security afforded by a sound capital position, and the higher returns that might be possible with higher levels of borrowings.
The Group monitors capital using the following indicators:
Debt to adjusted capital2014
£m2013
£m
Total interest-bearing loans and borrowings 265.5 262.5 Less: cash and cash equivalents and overdrafts (58.5) (76.0)Net debt* 207.0 186.5
Total equity 187.7 274.1 Less: amounts accumulated in equity relating to cash flow hedges (0.5) (0.6)Adjusted capital 187.2 273.5 Debt to adjusted capital ratio 1.1 0.7
Net debt* to EbITDA2014
£m2013
£m
Net debt* 207.0 186.5Operating profit before specific adjusting items, restructuring costs and other one-off items 109.8 110.7 Depreciation and amortisation 36.0 37.6 EBITDA 145.8 148.3 Net debt* to EBITDA ratio 1.4x 1.3x
Interest coverEBITDA 145.8 148.3 Net finance costs (excluding IAS 19 pension charge) 15.1 17.0 Interest cover 9.7x 8.7x
* Net debt is defined as interest-bearing loans and borrowings, and bank overdrafts less cash and cash equivalents.
There were no changes in the Group’s approach to capital management during the year.
Neither the Company nor any of its subsidiaries are subject to externally imposed capital requirements.

126 FINANCIAL STATEMENTS FINANCIAL STATEMENTS 127
AnnuAl report 2014 MorgAn ADVAnCeD MAterIAlS
OVE
rVIE
wST
rAT
EGIC
rEp
OrT
GO
VErN
ANC
EFI
NAN
CIA
L ST
ATEM
ENTS
19. FINANCIAL rISK MANAgEMENT continuedFair valuesThe fair values of financial assets and liabilities, together with the carrying amounts shown in the balance sheet, are as follows:
Carryingamount
2014£m
Fair value2014
£m
Carryingamount
2013£m
Fair value2013
£m
Financial assets and liabilities at amortised cost5.70% uS Dollar Senior Notes 2014 – – (60.4) (62.4)3.65% Euro Senior Notes 2015 (31.3) (31.6) (33.6) (34.3)4.32% Euro Senior Notes 2017 (15.7) (16.6) (16.8) (17.9)6.12% uS Dollar Senior Notes 2017 (112.3) (121.6) (105.6) (116.9)6.26% uS Dollar Senior Notes 2019 (48.1) (53.5) (45.2) (50.4)Bank and other loans (61.3) (61.3) (0.7) (0.7)Obligations under finance leases (1.3) (1.3) (0.2) (0.2)Trade and other payables (93.0) (93.0) (88.1) (88.1)Loans and receivables 170.5 170.5 167.5 167.5 Cash and cash equivalents 63.0 63.0 76.0 76.0
(129.5) (145.4) (107.1) (127.4)Available-for-sale financial instrumentsAvailable-for-sale financial assets 1.6 1.6 2.7 2.7
Derivatives and other items at fair valueForward exchange contracts used for hedging 1.4 1.4 0.8 0.8 Cross currency swaps used for hedging 3.8 3.8 – –
(122.7) (138.6) (103.6) (123.9)
The following summarises the major methods and assumptions used in estimating the fair values of financial instruments reflected in the preceding table. Equity securitiesFair value is based on quoted market prices at the balance sheet date. DerivativesForward exchange contracts are marked to market either using listed market prices or by discounting the contractual forward price and deducting the current spot rate. Interest-bearing loans and borrowingsFair value is calculated based on discounted expected future principal and interest cash flows. The interest rates used to determine the fair value of loans and borrowings are 1.8-3.8% (2013: 2.1-4.1%) and finance leases 4.78% (2013: 6.0%). Finance lease liabilitiesThe fair value is estimated as the present value of future cash flows, discounted at market interest rates for homogeneous lease agreements. The estimated fair values reflect changes in interest rates. Trade and other receivables/payablesFor receivables/payables with a remaining life of less than one year, the notional amount is deemed to reflect the fair value. All other receivables/payables are discounted to determine the fair value. Cash and cash equivalents, trade and other payables and loans and receivables The Group has disclosed the fair value of cash and cash equivalents, current loans and receivables and current payables at their carrying amount, given their notional amount is deemed to be their fair value.

128 FINANCIAL STATEMENTS FINANCIAL STATEMENTS 129
Morgan aDVanCED MaTErIaLS annuaL rEporT 2014
NOTES TO THE CONSOLIDATED FINANCIAL STATEMENTScontinued
19. FINANCIAL rISK MANAgEMENT continuedFair value hierarchyThe table below analyses financial instruments carried at fair value, by valuation method. The different levels have been defined as follows:Level 1: quoted prices (unadjusted) in active markets for identical assets or liabilities.Level 2: inputs other than quoted prices included within Level 1 that are observable for the asset or liability, either directly (ie as prices)
or indirectly (ie derived from prices).Level 3: inputs for the asset or liability that are not based on observable market data (unobservable inputs).
31 December 2014 31 December 2013Level 1
£mLevel 2
£mTotal
£mLevel 1
£mLevel 2
£mTotal
£m
Available-for-sale financial assets 1.6 – 1.6 2.7 – 2.7Derivative financial assets – 6.0 6.0 – 1.7 1.7
1.6 6.0 7.6 2.7 1.7 4.4 Derivative financial liabilities – (0.8) (0.8) – (0.9) (0.9)
The table below analyses financial instruments disclosed at fair value, by valuation method.
31 December 2014 31 December 2013Level 1
£mLevel 2
£mTotal
£mLevel 1
£mLevel 2
£mTotal
£m
5.70% uS Dollar Senior Notes 2014 – – – – (62.4) (62.4)3.65% Euro Senior Notes 2015 – (31.6) (31.6) – (34.3) (34.3)4.32% Euro Senior Notes 2017 – (16.6) (16.6) – (17.9) (17.9)6.12% uS Dollar Senior Notes 2017 – (121.6) (121.6) – (116.9) (116.9)6.26% uS Dollar Senior Notes 2019 – (53.5) (53.5) – (50.4) (50.4)Obligations under finance leases – (1.3) (1.3) – (0.2) (0.2)
– (224.6) (224.6) – (282.1) (282.1)
There have been no transfers between level 1 and level 2 during 2014 and 2013 and there were no level 3 financial instruments in either 2014 and 2013.

128 FINANCIAL STATEMENTS FINANCIAL STATEMENTS 129
AnnuAl report 2014 MorgAn ADVAnCeD MAterIAlS
OVE
rVIE
wST
rAT
EGIC
rEp
OrT
GO
VErN
ANC
EFI
NAN
CIA
L ST
ATEM
ENTS
20. EMpLoyEE bENEFITS Accounting policies (i) Defined contribution plans For defined contribution plans, the Group pays contributions to either publicly or privately administered pension insurance plans, and the Group has no further payment obligations once the contributions have been paid. Obligations for contributions to defined contribution pension plans are recognised as an expense in the income statement as incurred.
(ii) Defined benefit plans A defined benefit plan is any retirement plan which is not a defined contribution plan. Typically, defined benefit plans defined an amount of retirement benefit that an employee will receive, usually depending on one or more factors such as age, years of service and earnings. The Group’s net obligation in respect of defined benefit pension plans is calculated separately for each plan by estimating the amount of future benefit that employees have earned in return for their service in the current and prior periods; that benefit is discounted to determine its present value, and the fair value of any plan assets is deducted. The discount rate is the yield at the balance sheet date on AA-credit-rated bonds that have maturity dates approximating the terms of the Group’s obligations. The calculation is performed by a qualified actuary using the projected unit credit method. when the calculation results in a benefit to the Group, the recognised asset is limited to the total of any unrecognised past service costs and the present value of economic benefits available in the form of any future refunds from the plan or reductions in future contributions to the plan. An economic benefit is available to the Group if it is realisable during the life of the plan, or on settlement of the plan liabilities. remeasurement gains and losses, differences between the expected and actual returns, and the effect of changes in actuarial assumptions, are recognised in full in OCI in the year in which they arise.
(iii) Long-term service benefits The Group’s net obligation in respect of long-term service benefits, other than pension plans, is the amount of future benefit that employees have earned in return for their service in the current and prior periods. The obligation is calculated using the projected unit credit method, or similar approximation, and is discounted to its present value and the fair value of any related assets is deducted. The discount rate is the yield at the balance sheet date on AA-credit-rated bonds that have maturity dates approximating the terms of the Group’s obligations.
(iv) Share-based payment transactions The grant date fair value of share-based payment awards granted to employees is recognised as an expense, with a corresponding increase in equity, over the period that the employees become unconditionally entitled to the awards. The amount recognised as an expense is adjusted to reflect the actual number of awards for which the related service and non-market performance conditions are met, such that the amount ultimately recognised as an expense is based on the number of awards that meet the related service and non-market performance conditions at the vesting date. Employee benefits The Group operates a number of defined benefit arrangements as well as defined contribution plans. The defined benefit plans are primarily in the uK, uSA and Europe and predominantly provide pensions based on service and career-average pay. In addition post-retirement medical plans are operated in the uSA.

130 FINANCIAL STATEMENTS FINANCIAL STATEMENTS 131
Morgan aDVanCED MaTErIaLS annuaL rEporT 2014
NOTES TO THE CONSOLIDATED FINANCIAL STATEMENTScontinued
20. EMpLoyEE bENEFITS continuedUK schemes In the uK, the Group operates two defined benefit pension schemes, the Morgan pension Scheme, and the Morgan Group Senior Staff pension and Life Assurance Scheme (‘the uK Schemes’). The two uK Schemes provide a benefit based upon an employee’s total service, and their career average earnings (including allowance for Consumer price Inflation), although historically benefits were based upon an employee’s final salary. Once in payment, pensions receive increases as set out in the rules, at either a fixed level, or in line with the retail price Index. The overall duration of the uK Schemes is around 17 years. The uK Schemes’ assets are held in trustee-administered funds governed by uK regulations, as is the nature of the relationship between the Group and the Trustees. responsibility for the governance of the uK Schemes – including investment decisions and contribution schedules – lies with the Board of Trustees who must consult with the Company on such matters. The Board of Trustees must be composed of representatives of the Company, plan participants and an independent trustee in accordance with the uK Scheme’s governing documents. Funding legislation in the uK requires that schemes are fully funded on a scheme specific basis as measured, and this must be assessed at least every three years. To the extent that there is a deficit against this measure, a payment schedule must be agreed such that the deficit is removed over a period of time, typically around 10 years. The most recent full actuarial valuation of the uK Schemes were undertaken as at March 2013 and resulted in combined assessed deficits of £82 million. On the basis of these full valuations, the Trustees of the uK Schemes, having consulted with the Group, agreed past service deficit recovery payments totalling £7.1 million a year in 2014/15, increasing with 2.75% pa until 2023 and contributions in respect of future service as accrued. The uK Schemes were closed to new entrants on 1 August 2011, with any new employees receiving benefits through the Morgan Group personal pension plan, a defined contribution arrangement.
US schemes In the uSA, the Group operates a number of defined benefit pension schemes (‘the uS Schemes’). The majority of these are qualified arrangements for tax purposes, although the Group also operates a Supplemental Executive retirement plan (‘SErp’) which is not tax approved. with the exception of the SErp, the uS Schemes are all frozen, with employees accruing benefits within a 401k arrangement. The uS Schemes provide a benefit based upon an employee’s service and earnings. The benefits are level both prior to, and whilst in, payment. Overall, the uS Schemes’ duration is around 13 years. The qualified uS Schemes’ assets are held in a trust separately from the Group’s assets. For the SErp the Group holds an asset to meet the obligations, however due to its nature this is accounted for as a Group asset, rather than an asset of the SErp. responsibility for the governance of the uS Schemes, including investment decisions and contribution schedules, lies with a management committee, all of whose members are appointed by the Group. The funding requirements in the uSA, ErISA, require schemes to be fully funded at all times, and if not to target full funding within a period of seven years. The most recent full actuarial valuations of the funded uS Schemes were undertaken as at 1 January 2014 and resulted in a deficit of £14.2 million for one plan, and a surplus of £2.1 million in the smaller arrangement. On the basis of these valuations, the Group made a £6.8 million payment in 2014 and will make payments of at least £5.1 million in 2015, £2.5 million in 2016 and a total of at least £8.3 million over the following five years. As required, the amounts due will be revisited on an annual basis. European schemesIn Europe, the Group operates a number of retirement schemes, with the bulk of the obligations relating to arrangements for employees in Germany. In line with local practice these arrangements are not funded for in advance, with benefits being met by the Group as they fall due.

130 FINANCIAL STATEMENTS FINANCIAL STATEMENTS 131
AnnuAl report 2014 MorgAn ADVAnCeD MAterIAlS
OVE
rVIE
wST
rAT
EGIC
rEp
OrT
GO
VErN
ANC
EFI
NAN
CIA
L ST
ATEM
ENTS
20. EMpLoyEE bENEFITS continued
2014UK£m
2014USA
£m
2014Europe
£m
2014Rest of
the World£m
2014Total
£m
Pension plans and employee benefitspresent value of unfunded defined benefit obligations – (8.7) (30.5) (1.6) (40.8)present value of funded defined benefit obligations (512.4) (170.1) (1.6) (12.4) (696.5)Fair value of plan assets 393.6 120.0 0.5 11.4 525.5 Net obligations (118.8) (58.8) (31.6) (2.6) (211.8)
Movements in present value of defined benefit obligationAt 1 January 2014 (441.5) (141.9) (28.5) (13.1) (625.0)Current service cost (2.4) – (0.6) (1.2) (4.2)Interest cost (19.5) (6.7) (0.9) (0.4) (27.5)remeasurement losses Changes in financial assumptions (65.1) (16.6) (6.2) (0.1) (88.0) Changes in demographic assumptions – (13.1) – – (13.1) Experience adjustments on benefit obligations (0.9) 2.5 0.1 (0.3) 1.4 Benefits paid 18.1 7.4 1.4 1.1 28.0 Contributions by members (1.1) – – – (1.1)Transfer to liabilities classified as held for sale – – 0.7 – 0.7 Exchange adjustments – (10.4) 1.9 – (8.5)At 31 December 2014 (512.4) (178.8) (32.1) (14.0) (737.3)
Movements in fair value of plan assetsAt 1 January 2014 366.5 102.6 0.5 10.8 480.4 Interest on plan assets 16.4 5.1 – 0.3 21.8 remeasurement gains 19.4 5.1 – – 24.5 Contributions by employer 9.1 7.7 1.4 1.3 19.5 Contributions by members 1.1 – – – 1.1 Benefits paid (18.1) (7.4) (1.4) (1.1) (28.0)Administrative expenses (0.8) – – – (0.8)Exchange adjustments – 6.9 – 0.1 7.0 At 31 December 2014 393.6 120.0 0.5 11.4 525.5 Actual return on assets 35.8 10.2 – 0.3 46.3
2014UK£m
2014USA
£m
2014Europe
£m
2014Rest of
the World£m
2014Total
£m
Pension plans and employee benefitsExpense recognised in the consolidated income statementCurrent service cost and past service cost (2.4) – (0.6) (1.2) (4.2)Administrative expenses (0.8) – – – (0.8)Net interest on net defined benefit liability (3.1) (1.6) (0.9) (0.1) (5.7)Total expense (6.3) (1.6) (1.5) (1.3) (10.7)
In addition to the above the Group directly incurred £0.9 million of administrative expenses in relation to the uS schemes, which have been recognised in overheads outside of the pension liability.

132 FINANCIAL STATEMENTS FINANCIAL STATEMENTS 133
Morgan aDVanCED MaTErIaLS annuaL rEporT 2014
NOTES TO THE CONSOLIDATED FINANCIAL STATEMENTScontinued
20. EMpLoyEE bENEFITS continuedThe IAS 19 expense in relation to the Group’s defined benefit arrangements is recognised in the following line items in the consolidated income statement:
2014£m
2013£m
Operating costs (5.0) (5.3)Net finance expense (5.7) (6.3)Total expense (10.7) (11.6)
Statement of financial position reconciliation
2014£m
2013£m
At 1 January 2014 (144.6) (166.8)pension expense (10.7) (11.6)Contributions 19.5 21.9 Other comprehensive income (75.2) 12.2 Transfer to liabilities classified as held for sale 0.7 – Disposals – 0.3 Exchange adjustments (1.5) (0.6)At 31 December 2014 (211.8) (144.6)
The Group expects to contribute £19.2 million to these arrangements in 2015.
UK£m
USA£m
Europe£m
Rest of the World
£mTotal
£m
Estimate of employer contributions to be paid into the plans during the 12-month period beginning 1 January 2015 9.7 7.1 1.1 1.3 19.2
The fair values of the plan assets were as follows:
2014UK£m
2014USA
£m
2014Europe
£m
2014Rest of
the World£m
2014Total
£m
Equities and growth assets 158.4 41.9 – – 200.3 Bonds 32.2 64.0 – – 96.2 Matching insurance policies 192.5 – 0.4 3.6 196.5 Other 10.5 14.1 0.1 7.8 32.5 Total 393.6 120.0 0.5 11.4 525.5

132 FINANCIAL STATEMENTS FINANCIAL STATEMENTS 133
AnnuAl report 2014 MorgAn ADVAnCeD MAterIAlS
OVE
rVIE
wST
rAT
EGIC
rEp
OrT
GO
VErN
ANC
EFI
NAN
CIA
L ST
ATEM
ENTS
20. EMpLoyEE bENEFITS continuedThe assumptions used are best estimate assumptions chosen from a range of possible actuarial assumptions which may not be borne out in practice. The principal assumptions are the discount rate and inflation assumptions which are long term and measured on external factors, based upon each plan’s duration. In addition to these, the mortality assumption in the uK and uS is material to the cost of the promised benefits. In both the uK and Europe, the assumed increases in salaries and pensions in payment are derived from assumed future inflation.
Actuarial assumptions were:
2014UK%
2014USA
%
2014Europe
%
2014Rest of
the World%
Discount rate 3.60 4.10 1.90 4.60Inflation (uK: rpI/CpI) 3.00/1.80 n/a 1.70 n/aSalary increase n/a n/a 2.20 5.00pensions increase 2.90/3.10/3.70 n/a 1.70 n/aMortality – post-retirement:Life expectancy of a male retiring at age 60 in 2014 26.5 26.1 23.4 n/aLife expectancy of a male retiring at age 60 in 2034 28.1 27.9 26.2 n/a
The actual liability in respect of global employee benefits will not be known until the last payments have been made. In placing a current estimate on the Group’s past service benefit obligations, a number of assumptions about the future are required. For defined benefit schemes, the Directors make annual estimates and assumptions in respect of discount rates, future changes in salaries, employee turnover, inflation rates and life expectancy. In making these estimates and assumptions, the Directors consider advice provided by external advisers, such as actuaries. The accounting assumptions noted above are used to calculate the year-end net pension liability in accordance with the relevant accounting standard, IAS 19 (revised) Employee Benefits. Changes in these assumptions have no impact on the Group’s cash payments to their arrangements. The payments due are calculated based on local funding requirements, or in the case of the Group’s unfunded arrangements on the incidence of benefit payments falling due. The sensitivities of the Group’s net balance sheet to the principal assumptions are:
Change in assumption
2014Increase
effect£m
2013Increase
effect£m
Discount rate Decrease by 0.1% 9.9 7.8 Inflation Increase by 0.1% 5.1 3.8 Mortality – post-retirement pensioners live 1 year longer 16.2 15.1 Exchange rates GBp weakens against uSD by 10% 6.5 4.4
GBp weakens against Eur by 10% 3.6 3.1
These sensitivities have been calculated to show the movement in the net balance sheet in isolation, and assuming no other changes in market conditions at the accounting date. This is unlikely in practice – for example, a change in discount rate is unlikely to occur without any movement in the value of the assets held by the Group’s schemes.

134 FINANCIAL STATEMENTS FINANCIAL STATEMENTS 135
Morgan aDVanCED MaTErIaLS annuaL rEporT 2014
NOTES TO THE CONSOLIDATED FINANCIAL STATEMENTScontinued
20. EMpLoyEE bENEFITS continued
2013uK£m
2013uSA£m
2013Europe
£m
2013rest of
the world£m
2013Total
£m
Pension plans and employee benefitspresent value of unfunded defined benefit obligations – (7.7) (26.8) (1.5) (36.0)present value of funded defined benefit obligations (441.5) (134.2) (1.7) (11.6) (589.0)Fair value of plan assets 366.5 102.6 0.5 10.8 480.4 Net obligations (75.0) (39.3) (28.0) (2.3) (144.6)
Movements in present value of defined benefit obligationAt 1 January 2013 (427.0) (158.6) (29.6) (15.5) (630.7)Current service cost (2.5) (0.1) (0.7) (1.2) (4.5)Interest cost (18.4) (6.7) (0.9) (0.3) (26.3)remeasurement losses Changes in financial assumptions (0.6) 13.8 2.3 – 15.5 Changes in demographic assumptions (2.7) (0.4) – – (3.1) Experience adjustments on benefit obligations (6.2) 0.1 (0.3) 1.2 (5.2)Benefits paid 17.2 7.8 1.4 1.7 28.1 Contributions by members (1.3) – – – (1.3)Disposals – – – 0.7 0.7 Exchange adjustments – 2.2 (0.7) 0.3 1.8 At 31 December 2013 (441.5) (141.9) (28.5) (13.1) (625.0)
Movements in fair value of plan assetsAt 1 January 2013 355.7 95.9 0.5 11.8 463.9 Interest on plan assets 15.5 4.2 – 0.3 20.0 remeasurement gains 4.1 2.2 – (1.3) 5.0 Contributions by employer 7.9 10.5 1.4 2.1 21.9 Contributions by members 1.3 – – – 1.3 Benefits paid (17.2) (7.8) (1.4) (1.7) (28.1)Administrative expenses (0.8) – – – (0.8)Disposals – – – (0.4) (0.4)Exchange adjustments – (2.4) – – (2.4)At 31 December 2013 366.5 102.6 0.5 10.8 480.4 Actual return on assets 19.6 6.4 – (1.0) 25.0
2013uK£m
2013uSA£m
2013Europe
£m
2013rest of
the world£m
2013Total
£m
Pension plans and employee benefitsExpense recognised in the consolidated income statementCurrent service cost and past service cost (2.5) (0.1) (0.7) (1.2) (4.5)Administrative expenses (0.8) – – – (0.8)Net interest on net defined benefit liability (2.9) (2.5) (0.9) – (6.3)Total expense (6.2) (2.6) (1.6) (1.2) (11.6)

134 FINANCIAL STATEMENTS FINANCIAL STATEMENTS 135
AnnuAl report 2014 MorgAn ADVAnCeD MAterIAlS
OVE
rVIE
wST
rAT
EGIC
rEp
OrT
GO
VErN
ANC
EFI
NAN
CIA
L ST
ATEM
ENTS
20. EMpLoyEE bENEFITS continuedrisks Through its defined benefit pension plans, the Group is exposed to a number of risks, the most significant of which are detailed below. The balance sheet net pension liability is a snapshot view which can be significantly influenced by short-term market factors. The calculation of the surplus or deficit depends, therefore, on factors which are beyond the control of the Group – principally the value at the balance sheet date of equity shares in which the scheme has invested and long-term interest rates which are used to discount future liabilities. The funding of the scheme is based on long-term trends and assumptions relating to market growth, as advised by qualified actuaries and investment advisers. Investment returns: The Group’s net balance sheet, and contribution requirements are heavily dependent upon the return on the assets
invested in by the schemes.
Longevity: The cost to the Group of the pensions promised to members is dependent upon the expected term of these payments. To the extent that members live longer than expected this will increase the cost of these arrangements.
Inflation rate risk: In the uK, the pension promises are, in the main, linked to inflation, and higher inflation will lead to higher liabilities. The above risks have been mitigated for a large proportion of the uK Schemes’ population through the purchase of an insurance policy, the payments from which exactly match the promises made to employees. remaining investment risks have also been mitigated to some extent by diversification of the return seeking assets and backing uninsured pensioner liabilities by bonds and swaps. In addition, the IAS 19 defined benefit obligation is linked to yields on AA rated corporate bonds, however the majority of the Group’s arrangements invest in a number of other assets which will move in a different manner from these bonds. Therefore, changes in market conditions may lead to volatility in the net pension liability on the Group’s balance sheet and in other comprehensive income, and to a lesser extent in the IAS 19 pension expense in the Group’s income statement. Defined contribution plans The Group operates a number of defined contribution pension plans. The total expense relating to these plans in the current year was £7.0 million (2013: £6.8 million). The Group expects to contribute £7.1 million to these arrangements in 2015. Share-based payments The Group operates various share option programmes that allow Group employees to acquire shares in the Company. under the Morgan Advanced Materials plc Long-Term Incentive plan (‘LTIp’) and The Morgan Advanced Materials Bonus Deferral Share Matching plan (‘BDSMp’) awards of shares are made to various key executives. under the Executive Share Option Scheme 2004 (‘ESOS 2004’) share options were granted by the Company. The Company also maintains a uK all-employee Sharesave scheme (‘Employee Sharesave Scheme 2004’). The grant date fair value of options granted to employees is recognised as an employee expense, with a corresponding increase in equity, over the period that the employees become unconditionally entitled to the options. The amount recognised as an expense is adjusted to reflect the actual number of share options for which the related service and non-market vesting conditions are met. The fair value of the options and awards under each scheme have been measured using the following models:
LTIp, BDSMp, ESOS 2004 Monte Carlo modelEmployee Sharesave Scheme 2004 Black-Scholes Merton model
The following options and awards were outstanding at 31 December 2014 in respect of Ordinary shares:
Normal exercise dates rangingExercise/Award
price(s)Number of
shares outstanding from to
Employee Sharesave Scheme 2004 213.00p-256.00p 1,717,051 1 December 2014 31 May 2018ESOS 2004 171.90p 187,900 23 May 2008 23 May 2015BDSMp 0.00p-347.00p 2,027,934 21 March 2015 24 September 2017LTIp 0.00p 3,668,638 28 February 2014 28 February 2024

136 FINANCIAL STATEMENTS FINANCIAL STATEMENTS 137
Morgan aDVanCED MaTErIaLS annuaL rEporT 2014
NOTES TO THE CONSOLIDATED FINANCIAL STATEMENTScontinued
20. EMpLoyEE bENEFITS continuedperformance metrics for LTIp, bDSMp and ESoS 2004The key performance metrics used in the plans are:
> Total Shareholder return (‘TSr’) – the return (expressed as a percentage) on a notional investment in one share in the Company expressed as follows: (a) the average share price over the last 3 months of the performance period; plus (b) the net dividends per share paid during the performance period reinvested in company shares at the ex-dividend date; divided by (c) the average share price over the three months preceding the performance period.
> Earnings per Share (‘EpS’) – (for the LTIp and BDSMp) profit before taxation less the charge for non-controlling interests in any financial year of the Group, adjusted by the remuneration Committee to exclude the effect of amortisation of intangible assets, charges related to IAS 39 Financial Instruments: Recognition and Measurement and the effect of any other special items which the remuneration Committee does not, in its discretion, consider to reflect underlying operating performance, divided by the weighted average number of shares in issue during the relevant financial years (defined on a pre-taxation basis).
> Group Earnings Before Interest, Tax and Amortisation (‘EBITA’) – the Group’s revenue for any financial year less operating expenses, but measured before the impact of taxation, net financing costs and the effect of amortisation of intangible assets. The remuneration Committee may also make further adjustments to exclude items which it does not, in its discretion, consider to reflect the underlying operating performance of the Group during the relevant financial years.
> Group return on Capital Employed (‘rOCE’) – EBITA, divided by the capital employed at the end of the relevant financial year. > Group average return on Capital Employed (‘rOCE’) – EBITA, divided by the average of the capital employed at the end of the relevant
financial years. > Divisional EBITA for the LTIp & BDSMp calculations – Divisional revenue for the relevant financial years less operating costs (including
restructuring costs and other one-off items), but measured before the impact of taxation, net financing costs and the effect of amortisation of intangible assets at reported exchange rates. The remuneration Committee may also make further adjustments to exclude items which it does not, in its discretion, consider to reflect the underlying operating performance of the Division during the relevant financial years.
> Divisional average rOCE – Divisional Earnings before net financing costs, taxation and amortisation of intangible assets (EBITA), divided by the average of the Capital Employed by the Division at the end of the relevant financial years.
For the TSr elements of the plans, for performance between median and upper quartile, awards are made on a straight-line, pro-rata basis. Similarly for EpS, Group EBITA, Group average rOCE, Divisional EBITA and Divisional average rOCE metrics, for performance between the identified trigger points, awards are made on a straight-line, pro-rata basis. Share plans terms and conditions The terms and conditions of all awards and grants made that were outstanding on or after 1 January 2013:
Grant date/Employees entitledNumber of
instruments granted Vesting conditionsContractual life of option
Awards granted to senior employees in 2014 under the BDSMp 105,726 Three years of service plus
satisfaction of performance metrics 3 years
Awards granted to senior employees in 2014 under the LTIp 1,182,302 Three years of service plus
satisfaction of performance metrics 3 years
Awards granted to senior employees in 2013 under the BDSMp 194,944 Three years of service plus
satisfaction of performance metrics 3 years
Awards granted to senior employees in 2013 under the LTIp 1,332,099 Three years of service plus
satisfaction of performance metrics 3 years
Awards granted to senior employees in 2012 under the BDSMp 1,740,554 Three years of service plus
satisfaction of performance metrics 3 years
Awards granted to senior employees in 2012 under the LTIp 1,251,358 Three years of service plus
satisfaction of performance metrics 3 years
Awards granted to senior employees in 2011 under the BDSMp 1,484,633 Three years of service plus
satisfaction of performance metrics 3 years
Awards granted to senior employees in 2011 under the LTIp 1,500,775 Three years of service plus
satisfaction of performance metrics 3 years
Options granted to senior employees in 2005 under the ESOS 2004 2,097,000Three years of service plus
satisfaction of performance metrics 10 years
Options granted to senior employees in 2004 under the ESOS 2004 3,157,500Three years of service plus
satisfaction of performance metrics 10 years

136 FINANCIAL STATEMENTS FINANCIAL STATEMENTS 137
AnnuAl report 2014 MorgAn ADVAnCeD MAterIAlS
OVE
rVIE
wST
rAT
EGIC
rEp
OrT
GO
VErN
ANC
EFI
NAN
CIA
L ST
ATEM
ENTS
20. EMpLoyEE bENEFITS continuedperformance metrics for LTIp The performance metrics for LTIp awards are set annually. The Company has given an undertaking to shareholders that awards will only vest if there is also an improvement in underlying financial performance. Awards will only vest therefore if the remuneration Committee is satisfied that the Group’s and/or Division’s (pre-2012 LTIp awards only) underlying financial performance over the performance period justifies vesting. 2010 LTIp Awards For LTIp awards granted to all participants in 2010, the extent to which 50% of the awards vested depended on the Company’s TSr ranking against an appropriate comparator group over the period from 4 January 2010 to 31 December 2012. The extent to which the other 50% of these awards vested depended on the growth in the Group’s EpS compared with rpI between the 2009 base financial year and the 2012 financial year:
TSr Element EpS ElementTSr performance against the comparator group companies % of award that vests EpS growth % of award that vests
upper quartile 50% rpI+10% pa 50%Median 15% rpI+4% pa 15%Below median Nil rpI+< 4% pa Nil
In addition, the LTIp awards granted in 2010 were restructured to include an HMrC approved element as part of the overall LTIp awards.
2011 LTIp Awards For LTIp awards granted to the CEO, CFO and non-Divisional employees in 2011, the extent to which 50% of the awards vest depends on the Company’s TSr ranking against an appropriate comparator group over the period from 3 January 2011 to 31 December 2013. The extent to which the other 50% of these awards vest depends on the growth in the Group’s EpS compared with rpI between the 2010 base financial year and the 2013 financial year:
TSr Element EpS ElementTSr against FTSE All-Share Industrials Index % of award that vests EpS growth % of award that vests
upper quartile 50% 15% pa 50%Median 15% 8% pa 15%Below median Nil < 8% pa Nil
To support the two-Divisional structure introduced in July 2010, the 2011 LTIp awards for senior Divisional executives were tailored to the value creation of each Division. under these awards, the Divisional element is split into Divisional EBITA growth and Divisional average rOCE. Vesting under the Divisional element only occurs when Divisional performance exceeds the threshold performance metrics under both measures. Once the Divisional performance metrics exceed the threshold, the two elements are then measured independently. For the LTIp award granted to the COO (who, at the time of the award, was CEO Morgan Ceramics) in 2011, TSr ranking (as for CEO, CFO and non-Divisional employees) and Divisional performance between the 2010 base financial year and the 2013 financial year, were awarded on an equal basis:
TSr Element Divisional ElementTSr against FTSE All-Share Industrials Index % of award that vests Divisional EBITA growth % of award that vests Divisional average rOCE % of award that vests
upper quartile 50% 18% pa 25% 40.7% 25%Median 15% 12% pa 7.5% 35.7% 7.5%Below median Nil < 12% pa Nil < 35.7% Nil
For LTIp awards granted to other executives in the former Morgan Ceramics Division in 2011, 100% of awards are based on Morgan Ceramics Divisional performance, between the 2010 base financial year and the 2013 financial year:
Divisional EBITA growth % of award that vests Divisional average rOCE % of award that vests
18% pa 50% 40.7% 50%12% pa 15% 35.7% 15%< 12% pa Nil < 35.7% Nil

138 FINANCIAL STATEMENTS FINANCIAL STATEMENTS 139
Morgan aDVanCED MaTErIaLS annuaL rEporT 2014
NOTES TO THE CONSOLIDATED FINANCIAL STATEMENTScontinued
20. EMpLoyEE bENEFITS continued2011 LTIp Awards For the LTIp award granted to the former CEO Morgan Engineered Materials in 2011, TSr ranking (as for CEO, CFO and non-Divisional employees) and Divisional performance between the 2010 base financial year and the 2013 financial year, were awarded on an equal basis:
TSr Element Divisional ElementTSr against FTSE All-Share Industrials Index % of award that vests Divisional EBITA growth % of award that vests Divisional average rOCE % of award that vests
upper quartile 50% 15% pa 25% 36.1% 25%Median 15% 10% pa 7.5% 33.7% 7.5%Below median Nil < 10% pa Nil < 33.7% Nil
For LTIp awards granted to other executives in the former Morgan Engineered Materials Division in 2011, 100% of awards are based on Morgan Engineered Materials Divisional performance, between the 2010 base financial year and the 2013 financial year:
Divisional EBITA growth % of award that vests Divisional average rOCE % of award that vests
15% pa 50% 36.1% 50%10% pa 15% 33.7% 15%< 10% pa Nil < 33.7% Nil
2012 LTIp Awards To support the ‘One Morgan’ organisation structure, the performance metrics for the 2012 LTIp awards were reviewed during 2013. There were no changes to the performance conditions of the LTIp awards granted to the CEO, CFO and non-Divisional employees in 2012. The extent to which 33% of the awards vest depends on the Company’s TSr ranking against an appropriate comparator group over the period from 2 January 2012 to 31 December 2014. The extent to which 33% of these awards vest depends on the compound annual growth in the Group’s EpS between the 2011 base financial year and the 2014 financial year. The extent to which 33% vest depends on the Group’s average rOCE for the financial years ending 31 December 2012, 2013 and 2014:
TSr Element Group ElementTSr against FTSE All-Share Industrials Index % of award that vests EpS growth % of award that vests Group average rOCE % of award that vests
upper quartile 33.33% 15% pa 33.33% 37% 33.33%Median 10% 8% pa 10% 33% 10%Below median Nil < 8% pa Nil < 33% Nil
For the 2012 LTIp award made to the COO (who, at the time of the award, was CEO Morgan Ceramics), it was decided that the Morgan Ceramics Divisional performance metrics attached to his 2012 LTIp award be replaced by Group performance metrics, aligned with those attached to the 2012 LTIp awards awarded to the other executive Directors, as set out above.
For the 2012 LTIp awards granted to other executives in the former Morgan Ceramics and Morgan Engineered Materials Divisions in 2012, it was decided that a single set of Group performance metrics should apply to these participants. The single set of Group performance metrics blends the performance metrics originally set for the two Divisions over the performance period (as set out below). The Group performance metrics are split into compound annual growth EBITA and Group average rOCE. Vesting only occurs when Group performance exceeds the threshold performance metrics under both measures. Once the Group performance metrics exceed the threshold, the two elements are then measured independently:
Compound annual growth EBITA % of award that vests Group average rOCE % of award that vests
15% pa 50% 40.9% 50%5.6% pa 15% 38.5% 15%< 5.6% pa Nil < 38.5% Nil
The changes to the performance conditions attaching to the 2012 LTIp awards did not result in a change in the fair value at the measurement date.

138 FINANCIAL STATEMENTS FINANCIAL STATEMENTS 139
AnnuAl report 2014 MorgAn ADVAnCeD MAterIAlS
OVE
rVIE
wST
rAT
EGIC
rEp
OrT
GO
VErN
ANC
EFI
NAN
CIA
L ST
ATEM
ENTS
20. EMpLoyEE bENEFITS continued2012 LTIp Awards continuedDetails of the original 2012 LTIp performance metrics for other executives in the former Morgan Ceramics and Morgan Engineered Materials Divisions are set out below: For the COO (who, at the time of the award was CEO Morgan Ceramics), 1/3 of the award was to vest on relative TSr, with the remaining 2/3 to vest on a divisional EBITA/rOCE matrix. For the EBITA/rOCE element, there would have been no vesting unless EBITA growth in Morgan Ceramics was at least 6% pa and rOCE is 41% in 2014; full vesting would have occurred for EBITA growth of 15% pa and rOCE of 43.5%. For LTIp awards granted to executives in the former Morgan Ceramics Division in 2012, 100% of awards were based on Morgan Ceramics Divisional performance, between the 2011 base financial year and the 2014 financial year:
Divisional EBITA % of award that vests Divisional average rOCE % of award that vests
15% pa 50% 43.5% 50%6% pa 15% 41% 15%< 6% pa Nil < 41% Nil
For LTIp awards granted to executives in the former Morgan Engineered Materials Division in 2012, 100% of awards were based on Morgan Engineered Materials Divisional performance, between the 2011 base financial year and the 2014 financial year:
Divisional EBITA % of award that vests Divisional average rOCE % of award that vests
15% pa 50% 37.10% 50%5% pa 15% 34.70% 15%< 5% pa Nil < 34.7% Nil
2013 and 2014 LTIp Awards For LTIp awards granted to all participants in 2013, the extent to which 33% of the awards vest depends on the Company’s TSr ranking against an appropriate comparator group over the period from 1 January 2013 to 31 December 2015. The extent to which 33% of these awards vest depends on the growth in the Company’s EpS between the 2012 base financial year and the 2015 financial year. The extent to which 33% vest depends on the Group’s average rOCE for the financial years ending 31 December 2013, 2014 and 2015. For LTIp awards granted to all participants in 2014, the extent to which 33% of the awards vest depends on the Company’s TSr ranking against an appropriate comparator group over the period from 1 January 2014 to 31 December 2016. The extent to which 33% of these awards vest depends on the growth in the Company’s EpS between the 2013 base financial year and the 2016 financial year. The extent to which 33% vest depends on the Group’s rOCE for the financial year ending 31 December 2016:
TSr Element EpS Element rOCE ElementTSr against FTSE All-Share Industrials Index % of award that vests EpS Growth % of award that vests rOCE % of award that vests
upper quartile 33.33% 15% pa 33.33% 37% 33.33%Median 10% 8% pa 10% 33% 10%Below median Nil < 8% pa Nil < 33% Nil

140 FINANCIAL STATEMENTS FINANCIAL STATEMENTS 141
Morgan aDVanCED MaTErIaLS annuaL rEporT 2014
NOTES TO THE CONSOLIDATED FINANCIAL STATEMENTScontinued
20. EMpLoyEE bENEFITS continuedperformance metrics for the bDSMpThe BDSMp was introduced following shareholder approval in 2008.
under the plan rules, participants may be offered the opportunity to defer up to 75% of their annual bonus on a pre- or post-tax basis into Company shares. participants must hold the deferred shares for three years to be eligible for a matching award based on the pre-tax value of their deferred shares. Matching shares may be earned at the end of three years in the event that stretching performance metrics have been met. The performance metrics for the BDSMp are set annually.
under the 2010 grant participants were given the opportunity to defer up to 75% of their bonus under the BDSMp and the performance metrics were based on EpS growth targets relative to the 2009 base year:
EpS performance Vesting of Matching Shares (as multiple of the shares under the Deferred Award)
rpI+15% pa 3x matchrpI+10% pa 1.75x matchrpI+7.5% pa 1x matchrpI+5% pa 0.5x matchrpI+4% pa 0.25x match< rpI+4% pa Nil
under the 2011, 2012, 2013 and 2014 grants participants were given the opportunity to defer up to 50% of their bonus under the BDSMp and the performance metrics are based on EpS growth targets relative to the 2010, 2011, 2012 and 2013 base years respectively:
EpS performance Vesting of Matching Shares (as multiple of the shares under the Deferred Award)
20% pa 3x match16% pa 2x match12% pa 1x match8% pa Nil< 8% pa Nil
ESoS 2004There were no awards during 2014 (2013: nil).
Employee Sharesave Scheme 2004 terms and conditions The terms and conditions of awards/grants that were outstanding on or after 1 January 2013 that are not covered in the information above are as follows:
Grant date/Employees entitled
Number of instruments
granted Vesting conditionsContractual life of option
Options granted to uK employees in 2014 under the Employee Sharesave Scheme 2004 404,687 Three years of service 3 yearsOptions granted to uK employees in 2013 under the Employee Sharesave Scheme 2004 463,394 Three years of service 3 yearsOptions granted to uK employees in 2012 under the Employee Sharesave Scheme 2004 1,071,868 Three years of service 3 yearsOptions granted to uK employees in 2011 under the Employee Sharesave Scheme 2004 471,732 Three years of service 3 years

140 FINANCIAL STATEMENTS FINANCIAL STATEMENTS 141
AnnuAl report 2014 MorgAn ADVAnCeD MAterIAlS
OVE
rVIE
wST
rAT
EGIC
rEp
OrT
GO
VErN
ANC
EFI
NAN
CIA
L ST
ATEM
ENTS
20. EMpLoyEE bENEFITS continuedShare plans – further details
Awards made in 2014
LTIP 2004 BDSMPEmployee Sharesave
Schemes 2004
Fair value at measurement date 229.19-308.68p 347.00p 66.00pShare price 339.00p 347.00p 298.00pExercise price n/a n/a 256.00pExpected volatility (expressed as weighted average volatility used in the model) 50% n/a 45%Option life (expressed as weighted average life used in the model) 3 years 3 years 3 yearsExpected dividends 3.1% n/a 3.6%risk-free interest rate 1.1% n/a 1.4%
The expected volatility is based on the historic volatility (calculated based on the weighted average remaining life of the share options) adjusted for any expected changes to future volatility due to publicly available information. The number and weighted average exercise prices of share options are as follows:
Weighted averageexercise price
31 December 2014Number of options31 December 2014
weighted averageexercise price
31 December 2013Number of options31 December 2013
Outstanding at the beginning of the period 83.11p 9,100,894 66.20p 11,387,046 Granted during the period 79.45p 1,670,549 85.81p 1,973,749 Forfeited during the period 88.17p (620,040) 60.78p (676,768)Exercised during the period 217.56p (972,372) 49.45p (2,520,584)Lapsed during the period 1.12p (2,304,754) 0.99p (1,062,549)Outstanding at the end of the period 90.24p 6,874,277 83.11p 9,100,894 Exercisable at the end of the period 138.28p 390,085 126.38p 611,204
The weighted average share price at the date of share options exercised during the period was 329.82 pence (2013: 284.81 pence).
The options outstanding at the year end have an exercise price in the range nil to 347.00 pence and a weighted average contractual life of 0.3 years.
The fair value of services received in return for share options granted are measured by reference to the fair value of share options granted.
The weighted average fair value of options issued in the period was 233.92 pence (2013: 198.77 pence).
The IFrS 2 fair value charge expensed to the income statement was £1.7 million (2013: £0.7 million).

142 FINANCIAL STATEMENTS FINANCIAL STATEMENTS 143
Morgan aDVanCED MaTErIaLS annuaL rEporT 2014
NOTES TO THE CONSOLIDATED FINANCIAL STATEMENTScontinued
21. provISIoNSAccounting policiesA provision is recognised in the balance sheet when the Group has a present obligation (legal or constructive) as a result of a past event, it is probable that an outflow of economic benefits will be required to settle the obligation, and a reliable estimate can be made of the obligation. The best estimate of the expenditure required to settled the present obligation is the amount that an entity would rationally pay to settle the obligation at the end of the reporting period or to transfer it to a third party at that time. If the effect is material, provisions are determined by discounting the expected future cash flows at a pre-tax rate that reflects current market assessments of the time value of money and, where appropriate, the risks specific to the liability.
(i) RestructuringA provision for restructuring is recognised when the Group has approved a detailed and formal restructuring plan, and the restructuring has either commenced or has been announced publicly. Future operating costs are not provided for.
(ii) Onerous contracts A provision for onerous contracts is recognised when the expected benefits to be derived by the Group from a contract are lower than the unavoidable cost of meeting its obligations under the contract.
(iii) Environmental In accordance with the Group’s Environmental policy a provision is recognised for known environmental issues which the Group will rectify over the next few years. In a number of jurisdictions companies have a constructive obligation to remedy any known environmental problems.
provisions
Closure andrestructuring
provisions£m
Otherprovisions
£m
Environmentalprovisions
£mTotal
£m
Balance at 31 December 2013 7.0 7.5 3.2 17.7 provisions made during the year 17.2 1.2 – 18.4 provisions used during the year (8.2) (2.8) (1.5) (12.5)provisions reversed during the year (0.6) – – (0.6)Effect of movements in foreign exchange (0.2) – – (0.2)Balance at 31 December 2014 15.2 5.9 1.7 22.8
Current 14.6 4.2 1.4 20.2 Non-current 0.6 1.7 0.3 2.6
15.2 5.9 1.7 22.8
Closure and restructuring provisions are based on the Group’s restructuring programmes and represent committed expenditure at the balance sheet date. The amounts provided are based on the costs of terminating relevant contracts, under the contract terms, and management’s best estimate of other associated restructuring costs including professional fees, most of which are expected to be incurred over the next year. Other provisions relate to a range of items, including long-service costs and legal claims. The estimated costs are based on the Group’s assessment of the probable future costs of these activities. The Group expects to incur most of the liability in less than one year. Environmental provisions are for known environmental issues which the Group will rectify over the next few years. In a number of jurisdictions companies have a constructive obligation to remedy any known environmental problems. The estimated costs are based on management’s best estimate of the costs required to remedy these problems. The Group expects to incur most of the liability over the next five years.

142 FINANCIAL STATEMENTS FINANCIAL STATEMENTS 143
AnnuAl report 2014 MorgAn ADVAnCeD MAterIAlS
OVE
rVIE
wST
rAT
EGIC
rEp
OrT
GO
VErN
ANC
EFI
NAN
CIA
L ST
ATEM
ENTS
22. TrADE AND oThEr pAyAbLESAccounting policiesTrade and other payables are initially stated at their fair value and subsequently measured at amortised cost.
Trade and other payables
2014£m
2013£m
Non-currentTrade and non-trade payables 0.8 1.4 CurrentTrade payables due to associate 0.5 0.3 Other trade payables 92.5 90.0 Non-trade payables and accrued expenses 92.7 85.6
185.7 175.9
Included in current non-trade payables and accrued expenses is £20.6 million (2013: £22.9 million) of tax accruals.
23. opErATINg LEASES Accounting policies Operating lease paymentspayments made under operating leases are recognised in the income statement on a straight-line basis over the term of the lease. Lease incentives received are recognised in the income statement as an integral part of the total lease expense.
Leases as lessee Non-cancellable operating lease rentals are payable as follows:
2014£m
2013£m
Less than one year 8.5 8.9 Between one and five years 17.1 18.1 More than five years 28.1 18.6
53.7 45.6
The Group leases a number of properties under operating leases of varying duration. In some cases, during the life of the lease, the rental payable is reviewed after a fixed period to reflect market rentals.
Leases as lessor The total of future minimum sub-lease income under non-cancellable sub-leases is £nil million (2013: £1.8 million).
24. CApITAL CoMMITMENTS Commitments for property, plant and equipment and computer software expenditure for which no provision has been made in these accounts amount to £1.3 million (2013: £1.8 million) for the Group.
25. CoNTINgENCIES Subsidiary undertakings within the Group have given unsecured guarantees of £10.3 million (2013: £10.2 million) in the ordinary course of business.
In an international group of companies a variety of claims arise from time to time. provision has been made in these accounts against those claims which the Directors consider meet the requirements of IAS 37 Provisions, Contingent Liabilities and Contingent Assets and are likely to result in significant liabilities. The Group has been subject to legal claims in a number of countries. Settlements for the majority of these have been agreed. In some cases it will not be possible to form a view, either because the facts are unclear or because further time is needed to properly assess the merits of the case and no provisions are held against such cases. The Board, having taken legal advice, is of the opinion that the remainder of these actions will not have a material impact on the Group’s financial position.

144 FINANCIAL STATEMENTS FINANCIAL STATEMENTS 145
Morgan aDVanCED MaTErIaLS annuaL rEporT 2014
NOTES TO THE CONSOLIDATED FINANCIAL STATEMENTScontinued
26. rELATED pArTIESIdentification of related partiesThe Group has related party relationships with its subsidiaries (a list of principal subsidiary undertakings is shown in note 42), with its associates (see note 12) and with its Directors and executive officers.
Transactions with key management personnelThe Company has written service contracts or letters of appointment with each of its Directors, under which the Directors receive a salary or a fee and other emoluments.
The key management of the Group and parent Company consists of the Board of Directors (including non-executive Directors) and members of the Executive Committee.
The compensation for the 17 (2013: 11) executive and non-executive Directors and members of the Executive Committee charged in the year was:
2014£m
2013£m
Short-term employee benefits 3.6 1.5 Employer National Insurance Contributions 0.6 0.4 pension and other post-employment costs 0.6 0.4 Share-based payments 0.7 0.2 Non-executive Directors’ fees and benefits 0.4 0.4 Total compensation of key management personnel 5.9 2.9
Information on executive Directors’ remuneration is given in the remuneration report on pages 63 to 85. other related party transactions
2014£m
2013£m
Sales to associate 1.3 10.3 purchases from associate 1.5 – Loan made to associate 1.5 – Trade receivables due from associate 2.1 13.0 Trade payables due to associate 0.5 0.3
The balances with the Group’s associate are shown in note 15 and note 22. In addition, the Group has trade receivables owed by associates of £1.3 million (2013: £1.6 million) which have been fully provided for.
The Group entered into four fixed forward foreign exchange purchase contracts during late 2014 and early 2015 for the Chief Financial Officer (the CFO) with a total nominal value of €341,000 (£266,142 at the contracted exchange rates). The CFO provided the Group with £242,730 funds in advance to settle the contracts on 8 January 2015 and £23,412 a day after the fourth and final contract settled on 13 January 2015 when the Euros were passed to the CFO. No loss or expense was incurred by the Group and no gain or benefit was realised by the CFO.
27. SubSEquENT EvENTSOn 30 January 2015 the Group disposed of its Thermal Ceramics business in wissembourg, France. The assets and liabilities disposed of were classified as held for sale as at 31 December 2014 as described in note 6. No further gain or loss was recognised on disposal. There have been no other material events since the year end.

144 FINANCIAL STATEMENTS FINANCIAL STATEMENTS 145
AnnuAl report 2014 MorgAn ADVAnCeD MAterIAlS
OVE
rVIE
wST
rAT
EGIC
rEp
OrT
GO
VErN
ANC
EFI
NAN
CIA
L ST
ATEM
ENTS
COMpANY BALANCE SHEETas at 31 December 2014
Note2014
£m2013
£m
Fixed assetsTangible fixed assets 31 2.9 2.0 Investment in subsidiary undertakings 32 870.1 846.4
873.0 848.4 Current assetsDebtors – due within one year 33 49.4 37.7 Cash at bank and in hand 27.0 25.4
76.4 63.1 Creditors – amounts falling due within one year 34 121.0 59.2
Net current (liabilities)/assets (44.6) 3.9
Total assets less current liabilities 828.4 852.3
Creditors – amounts falling due after more than one yearAmounts payable to subsidiary undertakings 158.3 180.2 Other creditors 1.3 – Borrowings 35 68.1 49.7
227.7 229.9 Provisions for liabilities and charges 36 1.0 2.9
228.7 232.8 Net assets 599.7 619.5 Capital and reservesEquity shareholders’ funds Called-up share capital 17 71.4 71.4 Share premium account 37 111.7 111.7 Merger reserve 37 17.0 17.0 Capital redemption reserve 37 35.7 35.7 profit and loss account 37 363.5 383.3
599.3 619.1
Non-equity shareholders’ funds Called-up share capital 17 0.4 0.4 Shareholders’ funds 599.7 619.5
The Financial Statements were approved by the Board of Directors on 12 February 2015 and were signed on its behalf by:
KEvIN DANgErFIELDINTErIM CHIEF ExECuTIVE OFFICEr & CHIEF FINANCIAL OFFICEr
146 FINANCIAL STATEMENTS FINANCIAL STATEMENTS 147
Morgan aDVanCED MaTErIaLS annuaL rEporT 2014
NOTES TO THE COMpANY BALANCE SHEET
28. ACCouNTINg poLICIESThe following accounting policies have been applied consistently in dealing with items which are considered material in relation to the Financial Statements.
basis of preparationThe Company has elected to prepare its Financial Statements in accordance with uK Generally Accepted Accounting practice.
The Financial Statements have been prepared in accordance with applicable accounting standards, and under the historical cost accounting rules.
under Section 408(4) of the Companies Act 2006 the Company is exempt from the requirement to present its own profit and loss account.
under FrS 1 Cash Flow Statements the Company is exempt from the requirement to prepare a cash flow statement on the grounds that the cash flows of the Company are included within the published consolidated financial statement.
The Company has taken advantage of the exemption contained in FrS 8 Related Parties and has therefore not disclosed transactions or balances with wholly owned subsidiaries.
Tangible assets and depreciationDepreciation is provided to write off the cost less the estimated residual value of tangible fixed assets by equal instalments over their estimated useful economic lives as follows:
plant, equipment and fixtures – 3-20 years.
InvestmentsInvestments in subsidiary undertakings, associates and joint ventures are stated at cost less amounts written off unless they are designated as a hedged item in a fair value hedge of foreign currency risk under FrS 26 Financial Instruments: Recognition and Measurement. In this case they are accounted for at historical cost plus a hedging adjustment recognised in profit or loss for the changes in their fair value attributable to the foreign currency exposure from the date the hedge is designated.
Interest-bearing loans and borrowings Immediately after issue, debt is stated at the fair value of the consideration received. Immediately after issue capital instruments are stated after deduction of issue costs. The finance cost of the debt is allocated to periods over the term of the debt at a constant rate on the carrying amount.
Foreign currencyTransactions in foreign currencies are recorded using the rate of exchange ruling at the date of the transaction or, if hedged forward, at the rate of exchange under the related forward contract. Monetary assets and liabilities denominated in foreign currencies are translated using the contracted rate or the rate of exchange ruling at the balance sheet date and the gains or losses on translation are included in the profit and loss account.
Leasesrentals payable under operating leases are charged in the profit and loss account on a straight-line basis over the lease term.
post-retirement benefitsThe Company participates in a Group-wide pension scheme providing benefits based on career-average pensionable pay. The assets of the scheme are held separately from those of the Company. The Company is unable to identify its share of the underlying assets and liabilities of the scheme on a consistent and reasonable basis and therefore, as required by FrS 17 Retirement Benefits, accounts for the scheme as if it were a defined contribution scheme. As a result, the amount charged to the profit and loss account represents the contributions payable to the scheme in respect of the accounting period. refer to note 40 for the additional disclosures required by FrS 17.
TaxationThe charge for taxation is based on the result for the year and takes into account taxation deferred because of timing differences between the treatment of certain items for taxation and accounting purposes.
Deferred tax is recognised, without discounting, in respect of all timing differences between the treatment of certain items for taxation and accounting purposes which have arisen but not reversed by the balance sheet date, except as otherwise required by FrS 19 Deferred Tax.

146 FINANCIAL STATEMENTS FINANCIAL STATEMENTS 147
AnnuAl report 2014 MorgAn ADVAnCeD MAterIAlS
OVE
rVIE
wST
rAT
EGIC
rEp
OrT
GO
VErN
ANC
EFI
NAN
CIA
L ST
ATEM
ENTS
28. ACCouNTINg poLICIES continuedClassification of financial instruments issued by the CompanyFollowing the adoption of FrS 25 Financial Instruments: Disclosure and Presentation, financial instruments issued by the Company are treated as equity (ie forming part of shareholders’ funds) only to the extent that they meet the following two conditions:
> they include no contractual obligations upon the Company to deliver cash or other financial assets or to exchange financial assets or financial liabilities with another party under conditions that are potentially unfavourable to the Company; and
> where the instrument will or may be settled in the Company’s own equity instruments, it is either a non-derivative that includes no obligation to deliver a variable number of the Company’s own equity instruments or is a derivative that will be settled by the Company exchanging a fixed amount of cash or other financial assets for a fixed number of its own equity instruments.
To the extent that this definition is not met, the proceeds of issue are classified as a financial liability. where the instrument so classified takes the legal form of the Company’s own shares, the amounts presented in these Financial Statements for called-up share capital and share premium account exclude amounts in relation to those shares.
Finance payments associated with financial liabilities are dealt with as part of interest payable and similar charges. Finance payments associated with financial instruments that are classified as part of shareholders’ funds (see dividend policy) are dealt with as appropriations in the reconciliation of movements in shareholders’ funds.
Hedging instruments and hedged items are accounted for separately in the balance sheet. In fair value hedges, gains and losses from remeasuring the hedging instrument at fair value (for a derivative instrument) or the foreign currency component (for a non-derivative financial liability in a foreign currency hedge) are included in profit for the year when they arise. In cash flow hedges, gains and losses from remeasuring the hedging derivative instrument at fair value are initially recognised in other comprehensive income to the extent effective, and are later reclassified to profit or loss when the hedged transaction occurs or is no longer expected to occur.
Certain financial assets and liabilities have been designated as fair value through profit or loss and are recognised in the balance sheet at fair value.
own shares held by The Morgan general Employee benefit TrustTransactions of the Group-sponsored Morgan General Employee Benefit Trust are treated as being those of the Company and are therefore reflected in the Company’s Financial Statements. In particular, the Trust’s purchases and sales of shares in the Company are debited and credited to equity.
Share-based paymentsThe share option programme allows employees to acquire shares of the Company. The fair value of options granted after 7 November 2002 and those not yet vested as at 4 January 2005 is recognised as an employee expense with a corresponding increase in equity. The fair value is measured at grant date and spread over the period during which the employee becomes entitled to the options. The fair value of the options granted is measured using an option pricing model, taking into account the terms and conditions upon which the options were granted. The amount recognised as an expense is adjusted to reflect the actual number of share options that vest except where forfeiture is only due to share prices not achieving the threshold for vesting. For details of share-based payments made and the assumptions used in measuring the fair value see note 20.
Share-based payments recharged to subsidiary undertakings are recorded via the inter-company loan account.
Dividends on shares presented within shareholders’ fundsDividends unpaid at the balance sheet date are only recognised as a liability at that date to the extent that they are appropriately approved and are no longer at the discretion of the Company. unpaid dividends that do not meet these criteria are disclosed in the Notes to the financial statements.
Financial guarantee contractswhere the Company enters into financial guarantee contracts to guarantee the indebtedness of other companies within its group, the Company considers these to be insurance arrangements, and accounts for them as such. In this respect, the Company treats the guarantee contract as a contingent liability until such time as it becomes probable that the Company will be required to make a payment under the guarantee, at which point a liability would be recognised.

148 FINANCIAL STATEMENTS FINANCIAL STATEMENTS 149
Morgan aDVanCED MaTErIaLS annuaL rEporT 2014
NOTES TO THE COMpANY BALANCE SHEETcontinued
29. STAFF NuMbErS AND CoSTSThe average number of persons employed by the Company (including Directors) during the year, analysed by category, was as follows:
Number of employees
2014 2013
Directors and head office staff 37 33regional staff 7 10
44 43
The majority of the Directors and head office staff devote a proportion of their time to regional duties. Of the 37 Directors and head office staff, the average number who spent all or a proportion of their time on corporate duties was 13 (2013: 11) as shown in note 5.
Full details of the Directors’ remuneration for the period can be found in the remuneration report on pages 63 to 85.
Aggregate employee-related costs was as follows:
2014£m
2013£m
wages and salaries 8.2 5.3 Equity-settled share-based payments (see note 20) 1.7 0.7 Social security costs 0.9 0.2 Other pension costs 0.7 0.8
11.5 7.0
£1.2 million (2013: £0.6 million) of the equity-settled share-based payments amount was recharged to other Morgan Group companies.
30. DIvIDENDSDividends payable for the First and Second preference shares were £22,491 (2013: £22,491) of which £11,245 (2013: £11,245) was outstanding at the balance sheet date.
The 5.5% Cumulative First preference shares of £1 each and the 5.0% Cumulative Second preference shares of £1 each confer on the holders thereof the right to receive a cumulative preferential dividend at the rate of 5.5% and 5.0% respectively, calculated up to 30 June and 31 December respectively in every year.
For proposed Ordinary dividends see the consolidated income statement on page 93.
31. TANgIbLE FIxED ASSETS
Plant, equipmentand fixtures
£m
CostAt 1 January 2014 6.5Additions 3.0Disposals (3.6)At 31 December 2014 5.9
Accumulated depreciationAt 1 January 2014 4.5Amount provided for in the year 2.1Disposals (3.6)At 31 December 2014 3.0
Net book amounts at 31 December 2013 2.0Net book amounts at 31 December 2014 2.9

148 FINANCIAL STATEMENTS FINANCIAL STATEMENTS 149
AnnuAl report 2014 MorgAn ADVAnCeD MAterIAlS
OVE
rVIE
wST
rAT
EGIC
rEp
OrT
GO
VErN
ANC
EFI
NAN
CIA
L ST
ATEM
ENTS
32. INvESTMENT IN SubSIDIAry uNDErTAKINgS
Shares£m
Loans£m
Total£m
CostAt 1 January 2014 577.4 376.7 954.1 Additions 55.5 21.2 76.7 Fair value hedge of investments’ exposure to foreign currency risk (1.5) – (1.5)Less: disposals/loan repayments/liquidations/effect of movements in foreign exchange (11.2) (18.6) (29.8)At 31 December 2014 620.2 379.3 999.5
Amounts providedAt 1 January 2014 94.4 13.3 107.7 provided in the year 22.4 – 22.4 Less: disposals/loan repayments/liquidations/effect of movements in foreign exchange – (0.7) (0.7)At 31 December 2014 116.8 12.6 129.4
Net book amounts at 31 December 2013 483.0 363.4 846.4 Net book amounts at 31 December 2014 503.4 366.7 870.1
A list of principal subsidiary undertakings is shown in note 42.
Most of the movement in shares in 2014 related to a reorganisation of the Morgan Group’s entity holding structure. Share additions consist of investments in MNA Finance SArL, MCE Finance SArL and Morgan North America Holding Limited. Share disposals consist of a capital reduction in Morgan Mechanical Carbon Australasia pTY Ltd.
33. DEbTorS
2014£m
2013£m
Due within one year:Other debtors 6.2 8.3 Derivative financial assets 4.4 0.4 prepayments and accrued income 0.5 0.3 Amounts receivable from subsidiary undertakings 38.3 28.7
49.4 37.7
34. CrEDITorS2014
£m2013
£m
Due within one year:Bank overdrafts 72.0 44.4 Bank and other loans 31.3 – Trade creditors 1.8 1.1 Amounts payable to subsidiary undertakings 5.3 5.0 Other creditors, including deferred consideration 3.8 3.9 Accruals and deferred income 6.7 4.8 Derivative financial liabilities 0.1 –
121.0 59.2

150 FINANCIAL STATEMENTS FINANCIAL STATEMENTS 151
Morgan aDVanCED MaTErIaLS annuaL rEporT 2014
NOTES TO THE COMpANY BALANCE SHEETcontinued
35. borrowINgS
2014£m
2013£m
Bank and other loans 99.4 49.7 Bank overdrafts 72.0 44.4
171.4 94.1 Less: amount repayable within one year included within current liabilities (103.3) (44.4)Total repayable after more than one year 68.1 49.7
36. provISIoNS For LIAbILITIES AND ChArgES
Closure andrestructuring
provisions£m
Otherprovisions
£mTotal
£m
At 1 January 2014 1.5 1.4 2.9 provided in the year 0.2 0.8 1.0 utilised in the year (1.5) (1.4) (2.9)At 31 December 2014 0.2 0.8 1.0
At 31 December 2014 all provisions are expected to be utilised within one year.
37. ShArE prEMIuM AND rESErvES
Sharepremium
£m
Mergerreserve
£m
Capital redemption
reserve£m
Profitand lossaccount
£mAt 1 January 2014 111.7 17.0 35.7 383.3 Charges and transfers in relation to share-based payments for the year – – – 1.7 Dividends – – – (30.2)Own shares acquired for share incentive schemes – – – (2.3)retained profit for the year – – – 11.0 At 31 December 2014 111.7 17.0 35.7 363.5
Capita Trustees Limited administers a Trust in which shares are held to satisfy awards granted under the Company’s share plans. The shares are distributed via discretionary settlement governed by the rules of the Trust deed dated 1 March 1996 (as amended).
The total number of own shares held by the Trust at 31 December 2014 is 375,203 (2013: 305,041) and at that date had a market value of £1.2 million (2013: £1.0 million).
The amount of reserves of Morgan Advanced Materials plc that may not be distributed under Section 831(4) of the Companies Act 2006 is £301.2 million (2013: £300.2 million). This comprises the entire of share premium, merger reserve, capital redemption reserve and a portion of the profit and loss account.
Further details on share premium and reserves are given in note 17.

150 FINANCIAL STATEMENTS FINANCIAL STATEMENTS 151
AnnuAl report 2014 MorgAn ADVAnCeD MAterIAlS
OVE
rVIE
wST
rAT
EGIC
rEp
OrT
GO
VErN
ANC
EFI
NAN
CIA
L ST
ATEM
ENTS
38. LEASINg CoMMITMENTSLease payments for which no provision has been made in these accounts that the Company is committed to pay within twelve months of the balance sheet date, analysed by lease term expiry date, are as follows:
Land and buildings2014
£m2013
£m
Lease term expires within two to five years 0.2 0.2 0.2 0.2
39. pENSIoN CoSTSThe Morgan pension Scheme and The Morgan Senior Staff pension and Life Assurance SchemeThe Company participates in two defined benefit schemes in the uK. The assets of these schemes are held in separate trustee-administered funds, The Morgan pension Scheme (MpS) and The Morgan Group Senior Staff pension and Life Assurance Scheme (SSS). Due to the historical complexity of the schemes the Company is unable to identify its share of the scheme assets and liabilities on a consistent and reasonable basis, as permitted by FrS 17 Retirement Benefits, the schemes have been accounted for in these Financial Statements as if they were defined contribution schemes. These schemes were closed to new members on 1 August 2011 from which time membership of a defined contribution plan is available.
The latest actuarial valuations of the MpS and the SSS were carried out as at 31 March 2013, and updated for FrS 17 purposes to 31 December 2014 by a qualified independent actuary. The results for these schemes in respect of the Group are shown below:
2014 2013
Assumptions: % % Inflation (rpI & CpI) 3.00/1.80 3.30/2.10 Discount rate 3.60 4.50 pension increases in payment 2.90/3.10/3.70 3.20/3.10/3.80 General salary increases n/a n/a Mortality – post-retirement: Life expectancy of a male retiring at age 60 in 2014/2013 26.5 years 26.5 years Life expectancy of a male retiring at age 60 in 2034/2033 28.1 years 28.0 years
The assets in the scheme and the expected rates of return were:
2014£m
2013£m
Asset distribution and balance sheet reconciliation: Equities 158.4 146.2 Bonds 32.2 39.7 Matching insurance policies 192.5 179.2 Other 10.5 1.4 Total market value of assets 393.6 366.5 present value of liability (512.4) (441.5)Deficit in the scheme (118.8) (75.0)Employer contributions due in respect of accrual during the accounting period but not yet paid (0.2) (0.2)
Other assets include an insurance policy as described in note 20.
The employer’s contribution for the year was £9.1 million (2013: £7.9 million).
The Company is expecting to pay £9.7 million of contributions into the uK defined benefit plans in 2015.

152 FINANCIAL STATEMENTS FINANCIAL STATEMENTS 153
Morgan aDVanCED MaTErIaLS annuaL rEporT 2014
NOTES TO THE COMpANY BALANCE SHEETcontinued
40. CoNTINgENT LIAbILITIESwhere the Company enters into financial guarantee contracts to guarantee the indebtedness of other companies within its Group, the Company considers these to be insurance arrangements, and accounts for them as such. In this respect, the Company treats the guarantee contract as a contingent liability until such time as it becomes probable that the Company will be required to make a payment under the guarantee, at which point a liability would be recognised.
There are no other contingent liabilities in the Company as at 31 December 2014.
The Group has been subject to legal claims in a number of countries. Settlements for the majority of these have been agreed. In some cases it will not be possible to form a view, either because the facts are unclear or because further time is needed to properly assess the merits of the case and no provisions are held against such cases. The Board, having taken legal advice, is of the opinion that the remainder of these actions will not have a material impact on the Group’s financial position.
41. rELATED pArTIESThe Company’s transactions with non-wholly owned subsidiaries are as follows:
2014£m
2013£m
Amounts invoiced to non-wholly owned subsidiaries 2.0 4.4Amounts receivable from non-wholly owned subsidiaries 0.6 0.7Amounts invoiced from non-wholly owned subsidiaries – 0.2Amounts payable to non-wholly owned subsidiaries 5.7 6.0
During the year the Company made a £1.5 million loan to Jemmtec Limited, a company that a wholly owned subsidiary of the Company has a 35% shareholding in. The balance remains outstanding at the balance sheet date.
The Company entered into four fixed forward foreign exchange purchase contracts during late 2014 and early 2015 for the Chief Financial Officer (the CFO) with a total nominal value of €341,000 (£266,142 at the contracted exchange rates). The CFO provided the Company with £242,730 funds in advance to settle the contracts on 8 January 2015 and £23,412 a day after the fourth and final contract settled on 13 January 2015 when the Euros were passed to the CFO. No loss or expense was incurred by the Company and no gain or benefit was realised by the CFO.
The Directors have reviewed transactions with related parties (as defined in FrS 8 Related Party Disclosures) and have concluded that there are no other material transactions which require disclosure which have not been acknowledged elsewhere in the Annual report and Accounts.

152 FINANCIAL STATEMENTS FINANCIAL STATEMENTS 153
AnnuAl report 2014 MorgAn ADVAnCeD MAterIAlS
OVE
rVIE
wST
rAT
EGIC
rEp
OrT
GO
VErN
ANC
EFI
NAN
CIA
L ST
ATEM
ENTS
42. prINCIpAL SubSIDIAry uNDErTAKINgS
North America principal productsCountry of incorporation
and operation
* Morgan Advanced Materials Canada Inc. Electrical carbon CanadaGrupo Industrial Morgan S.A. de C.V. Insulating fibre, bricks and monolithics and
electrical carbon and seals and bearingsMexico
* Morgan Technical Ceramics S.A. de C.V. Ceramic cores Mexico* Certech Inc. Ceramic cores uSA* Graphite Die Mold Inc. Machined graphite uSA* Morganite Industries Inc. Holding company uSA* Morgan Advanced Ceramics Inc. Engineered, structural and piezoceramics uSA* Morgan Advanced Materials and Technology Inc. Seals and bearings uSA* Morganite Crucible Inc. Crucibles uSA* National Electrical Carbon products Inc. Electrical carbon uSA* Thermal Ceramics Inc. Insulating fibre, bricks and monolithics uSA
Europe principal productsCountry of incorporation
and operation
* Morgan Technical Ceramics Limited Engineered and piezoceramics and ceramic cores England* Morganite Electrical Carbon Limited Electrical carbon England* Np Aerospace Limited personnel and vehicle ballistic protection England* Thermal Ceramics uK Limited Insulating fibre, bricks and monolithics England* Thermal Ceramics de France S.A.S.u. Insulating fibre, bricks and monolithics France* Morgan Molten Metal Systems GmbH Crucibles Germany* Morgan rekofa GmbH Electrical carbon, linear and rotary transfer systems Germany* Morgan Thermal Ceramics Deutschland GmbH Insulating fibre, bricks and monolithics Germany* Morgan Advanced Materials Haldenwanger GmbH Engineered ceramics Germany* wesgo Ceramics GmbH Engineered ceramics Germany* porextherm Dämmstoffe GmbH Insulating fibre, bricks and monolithics Germany* Morgan Materials Hungary Kft. Electrical carbon Hungary* Morgan Carbon Italia s.r.l. Seals and bearings Italy* Thermal Ceramics Italiana s.r.l. Insulating fibre, bricks and monolithics Italy* Morganite Luxembourg S.A. Seals and bearings Luxembourg* Morgan AM&T B.V. Electrical carbon Netherlands* Thermal Ceramics Benelux B.V. Insulating fibre, bricks and monolithics Netherlands* Thermal Ceramics polska Sp Zoo Insulating fibre, bricks and monolithics poland* Limited Liability Company Morgan Thermal Ceramics Sukhoy Log Insulating fibre, bricks and monolithics russia* Thermal Ceramics Espana S.L. Insulating fibre, bricks and monolithics Spain

154 FINANCIAL STATEMENTS FINANCIAL STATEMENTS 155
Morgan aDVanCED MaTErIaLS annuaL rEporT 2014
NOTES TO THE COMpANY BALANCE SHEETcontinued
42. prINCIpAL SubSIDIAry uNDErTAKINgS continued
Asia/Rest of World principal productsCountry of incorporation
and operation
* Carbo San Luis S.A. Insulating fibre, bricks and monolithics Argentina* Morgan Technical Ceramics Australia pty. Ltd. Engineered ceramics Australia* Morganite Australia pty Ltd. Insulating fibre, bricks and monolithics and electrical
carbon and seals and bearingsAustralia
* Morganite Brasil Limitada Insulating fibre, bricks and monolithics BrazilDalian Morgan refractories Limited Insulating fibre, bricks and monolithics ChinaMorgan AM&T (Shanghai) Co., Ltd. Electrical carbon, linear and rotary transfer systems China
* Morgan AM&T Hairong Co. Limited Lithium ion ChinaMorgan Kailong (Jingmen) Thermal Ceramics Co. Ltd. Insulating fibre, bricks and monolithics ChinaMorgan Molten Metal Systems (Suzhou) Co. Ltd. Crucibles ChinaMorgan Thermal Ceramics International Trading (Shanghai) Co. Ltd. Insulating fibre, bricks and monolithics ChinaMorgan Thermal Ceramics Shanghai Ltd. Insulating fibre, bricks and monolithics China
* Yixing Haldenwanger Fine Ceramic Co. Ltd. Engineered ceramics ChinaYixing Morgan Thermal Ceramics Co. Ltd. Insulating fibre, bricks and monolithics Chinarefractorios Nacionales SA Insulating fibre, bricks and monolithics Guatemala
* Morganite Crucible (India) Limited Crucibles IndiaMurugappa Morgan Thermal Ceramics Limited Insulating fibre, bricks and monolithics India
* Morganite Carbon Kabushiki Kaisha Electrical carbon and seals and bearings JapanShin-Nippon Thermal Ceramics Corporation Insulating fibre, bricks and monolithics JapanMorgan Ceramics Asia pte. Ltd. Insulating fibre, bricks and monolithics Singapore
* Morganite South Africa pty. Limited Electrical carbon South Africa* Thermal Ceramics South Africa pty. Limited Insulating fibre, bricks and monolithics South Africa
Morgan Korea Company Limited Insulating fibre, bricks and monolithics and electrical carbon and seals and bearings
South Korea
* Morgan Karbon Grafit Sanayi A.S. Electrical carbon TurkeyMorgan Ceramics Middle East FZE Insulating fibre, bricks and monolithics uAE
* Denotes companies some or all of whose shares are owned by a subsidiary.
Morgan Advanced Materials plc’s principal subsidiary undertakings, unless otherwise stated, are directly held by the Company.
The Company has taken advantage of the exemption under Section 410 of the Companies Act 2006 by providing information only in relation to subsidiary undertakings whose results or financial position, in the opinion of the Directors, principally affected the Financial Statements. A full list of subsidiaries will be sent to Companies House with the next annual return.
43. CoMpANy rECoNCILIATIoN oF MovEMENTS IN ShArEhoLDErS’ FuNDS for the year ended 31 December 2014
2014£m
2013£m
Retained profit for the financial year 11.0 65.1 Dividends (30.2) (24.7)Own shares acquired for share incentive schemes (2.3) (6.6)Charges and transfers in relation to share-based payments for the year 1.7 0.8 Net increase in shareholders’ funds (19.8) 34.6 Opening shareholders’ funds 619.5 584.9 Closing shareholders’ funds 599.7 619.5

154 FINANCIAL STATEMENTS FINANCIAL STATEMENTS 155
AnnuAl report 2014 MorgAn ADVAnCeD MAterIAlS
OVE
rVIE
wST
rAT
EGIC
rEp
OrT
GO
VErN
ANC
EFI
NAN
CIA
L ST
ATEM
ENTS
GrOup STATISTICAL INFOrMATIONunder adopted IFrSs
2010£m
2011£m
2012restated*
£m
2013results before
specificadjusting
items£m
2014Results before
specificadjusting
items£m
Revenue 1,017.1 1,101.0 1,007.5 957.8 921.7
Profit from operations before restructuring costs, other one-off items and amortisation of intangible assets 109.5 143.4 120.9 119.0 118.0
Restructuring costs and other one-off items:restructuring costs (8.5) (5.6) (13.3) (11.3) (5.9)Gain on disposal of properties 0.6 2.4 0.1 0.8 0.3 Net pension credit – 1.3 – – – Profit from operations before amortisation of intangible assets 101.6 141.5 107.7 108.5 112.4
Amortisation of intangible assets (8.0) (8.3) (8.3) (8.3) (8.2)Operating profit 93.6 133.2 99.4 100.2 104.2 Net financing costs (25.9) (21.8) (22.7) (23.3) (20.8)Profit before taxation 67.7 111.4 76.7 76.9 83.4 Income tax expense (19.7) (32.6) (21.6) (21.1) (24.7)Profit after taxation before discontinued operations 48.0 78.8 55.1 55.8 58.7 Discontinued operations – – 21.0 – – Profit for the period 48.0 78.8 76.1 55.8 58.7
Assets employedproperty, plant and equipment 269.2 259.8 245.5 241.4 241.0 Intangible assets 285.0 283.3 265.1 249.5 235.3 Investments and other receivables 9.1 10.3 10.0 8.0 10.2 Deferred tax assets 38.5 41.1 40.6 28.2 39.5 Net current assets 131.0 160.1 194.4 132.8 143.2 Total assets less current liabilities 732.8 754.6 755.6 659.9 669.2 Employee benefits 103.9 135.1 166.8 144.6 211.8 provisions and other items 331.6 304.8 276.7 207.7 236.3 Deferred tax liabilities 45.2 44.5 40.5 33.5 33.4
252.1 270.2 271.6 274.1 187.7EquityTotal equity attributable to equity holders of the parent Company 215.0 229.4 233.8 238.1 151.2 Non-controlling interests 37.1 40.8 37.8 36.0 36.5 Total equity 252.1 270.2 271.6 274.1 187.7
Ordinary dividends per share 7.7p 9.3p 10.0p 10.5p 10.9p Earnings per shareBasic 15.8p 26.9p 18.7p 14.8p 2.7pDiluted 15.0p 25.7p 18.4p 14.7p 2.7punderlying 18.7p 29.9p 21.7p 21.5p 22.1pDiluted underlying 17.8p 28.6p 21.3p 21.4p 22.1p
* IAS 19 (revised) Employee Benefits has been adopted from 2013 onwards, with the 2012 comparatives restated accordingly. Figures for 2010-2011 have been prepared following the requirements of the previous IAS 19 Employee Benefits and have not been restated for the impact of the new IAS 19 (revised) Employee Benefits.

156 FINANCIAL STATEMENTS FINANCIAL STATEMENTS 157
Morgan aDVanCED MaTErIaLS annuaL rEporT 2014
CAuTIONArY STATEMENT
This document has been prepared for and only for the members of the Company as a body and no other persons. Its purpose is to assist members to assess how the Directors have performed their duties, the Company’s strategies and the potential for those strategies to succeed and for no other purpose. Save as would otherwise arise under English law, the Company, its Directors, employees, agents or advisers do not accept or assume responsibility or liability to any third parties to whom this document is shown or into whose hands it may come and any such responsibility or liability is expressly disclaimed.
This document contains forward-looking statements that are subject to risk factors associated with, amongst other things, the economic and business circumstances occurring from time to time in the countries, sectors and markets in which the Group operates. These and other factors could adversely affect the outcome and financial effects of the plans and events described. Forward-looking statements by their nature involve a number of risks, uncertainties and assumptions because they relate to events and/or depend on circumstances that may or may not occur in the future and could cause actual results and outcomes to differ materially from those expressed in or implied by the forward-looking statements.
It is believed that the expectations reflected in these statements are reasonable but they may be affected by a wide range of such variables. No assurances can be given that the forward-looking statements in this document will be realised. The forward-looking statements reflect the knowledge and information available at the date this document was prepared and will not be updated during the year but will be considered in the Annual report for next year. Nothing in this document should be construed as a profit forecast.

156 FINANCIAL STATEMENTS FINANCIAL STATEMENTS 157
AnnuAl report 2014 MorgAn ADVAnCeD MAterIAlS
OVE
rVIE
wST
rAT
EGIC
rEp
OrT
GO
VErN
ANC
EFI
NAN
CIA
L ST
ATEM
ENTS
Energy use Energy from all sourcesCash flow from operations Group EBITA (as defined below) of £118.0 million (2013: £119.0 million), plus
depreciation of £27.8 million (2013: £29.3 million) plus loss on sale of plant and machinery £0.3 million (2013: nil), less the increase in working capital of £10.4 million (2013: £4.4 million) less the decrease in provisions (excluding restructuring) and employee benefits of £15.7 million (2013: £16.9 million)
Group earnings before interest, tax, depreciation and amortisation (‘EBITDA’)
Operating profit before specific adjusting items, restructuring costs and other one-off items, depreciation and amortisation of intangible assets
Group EBITA Operating profit before specific adjusting items, restructuring costs and other one-off items, and amortisation of intangible assets
Group underlying operating profit Operating profit before specific adjusting items and amortisation of intangible assets
Lost time accident (‘LTA’) Accident which results in one or more days’ lost timeLost time per LTA Total time lost due to health and safety in the year divided by the number
of lost time accidents reported in the yearNet debt Interest-bearing loans and borrowings, bank overdrafts less cash and cash
equivalentsrestructuring costs and other one-off items Include the costs of restructuring activity and gain on disposal of propertyNon-financial KpIs These are at constant currency and updated to reflect changes in reporting
methodologyregional EBITA Segment operating profit before specific adjusting items, restructuring costs
and other one-off items, and amortisation of intangible assetsreturn on operating capital employed (‘rOCE’) Group underlying operating profit divided by the sum of working capital
(which excludes pension liability and provisions) and the net book value of tangible assets. Goodwill and other intangible assets are excluded
Segment profit Segment profit is defined as regional EBITA, which is segment operating profit before restructuring costs and other one-off items, and amortisation of intangible assets
Specific adjusting items See note 6 for further detailsunallocated central costs Includes plc costs (eg report & Accounts, AGM, Non-executive) and Group
management costs (eg Corporate head office rent, utilities, staff etc)underlying earnings per share (‘EpS’) Basic earnings per share adjusted to exclude specific adjusting items and
amortisation of intangible assetsunderlying profit before tax (‘pBT’) Operating profit before specific adjusting items and amortisation of intangible
assets, less net financing costswaste Hazardous and non-hazardous waste, including recycled materialwater use/intensity water from all sources, including process, irrigation and sanitary useworking capital (as used in the rOCE calculation) working capital as used in the calculation of rOCE is the sum of inventories,
£126.6 million (2013: £118.9 million), trade and other receivables, £193.9 million (2013: £188.2 million), net derivative financial assets/(liabilities) £5.2 million (2013: £0.8 million), net assets classified as held-for-sale £3.2 million (2013: nil), trade and other payables, £(185.7) million (2013: £(175.9) million) less tax accruals £(20.6) million (2013: £(22.9) million), plus the net of deferred consideration, third party dividends payable and other sundry items, £0.9 million (2013: £(1.9) million)
GLOSSArY OF TErMS

158 FINANCIAL STATEMENTS FINANCIAL STATEMENTS 159
Morgan aDVanCED MaTErIaLS annuaL rEporT 2014
SHArEHOLDEr INFOrMATION
Analysis of ordinary shareholdings as at 31 December 2014
Number of holdings % of total holdings Number of shares % of share capital
Size of holding 1-2,000 5,858 73.80 3,231,791 1.132,001-5,000 1,173 14.78 3,772,579 1.325,001-10,000 435 5.48 3,074,397 1.0810,001-50,000 272 3.42 6,016,547 2.1150,001-100,000 47 0.59 3,366,045 1.18100,001 and above 153 1.93 265,908,629 93.18
7,938 100.00 285,369,988 100.00Holding classification Individuals 6,544 82.44 12,657,702 4.44
Nominee companies 1,302 16.40 271,825,245 95.25Trusts (pension funds etc) 9 0.11 93,295 0.03Others 83 1.05 793,746 0.28
7,938 100.00 285,369,988 100.00
Key datesDividend payment dates28 November 2014 An interim cash dividend of 3.9 pence per Ordinary share of 25p each was paid to shareholders registered
at the close of business on 7 November 2014.29 May 2015 Subject to shareholders’ approval at the 2015 AGM, a final cash dividend of 7.0 pence per Ordinary share
of 25 pence each will be paid to shareholders registered at the close of business on 8 May 2015.1 April 2015 and 1 October 2015
Dividend payment dates in respect of 5.5% Cumulative First preference shares of £1 each and 5.0% Cumulative Second preference shares of £1 each.
8 May 2015 2015 Annual General Meeting.22 July 2015 Half-year results announced via rNS and on the Company’s website.
For some years the Company has continued to post to shareholders electing to receive printed documents a copy of the Half-Year reports. There is no requirement to do so and in the interests of reducing printing, paper and postage costs and the associated environmental impact, the half-year results will be available online only from 2015 onwards.
other information Capital gains tax The market values of quoted shares and stocks at 31 March 1982 were:
Ordinary shares of 25 pence each 122.5 pence 5.5% Cumulative First preference shares of £1 each 30.5 pence 5.0% Cumulative Second preference shares of £1 each 28.5 penceFor capital gains tax purposes, the cost of Ordinary shares is adjusted to take account of rights issues. Any capital gains arising on disposal will also be adjusted to take account of indexation allowances. Since the adjustments will depend on individual circumstances, shareholders are recommended to consult their professional advisers.
Share price The price can be obtained on the Company’s website: www.morganadvancedmaterials.com
ISIN Code GB0006027295
Ticker symbol MGAM

158 FINANCIAL STATEMENTS FINANCIAL STATEMENTS 159
AnnuAl report 2014 MorgAn ADVAnCeD MAterIAlS
OVE
rVIE
wST
rAT
EGIC
rEp
OrT
GO
VErN
ANC
EFI
NAN
CIA
L ST
ATEM
ENTS
Company details Company name change The Company changed its name to Morgan Advanced Materials plc (from The Morgan Crucible Company plc)
on 27 March 2013.Following this change, share certificates issued in the name ‘The Morgan Crucible Company plc’ remain valid (replacement share certificates in the name ‘Morgan Advanced Materials plc’ were not issued to existing shareholders).
registered office Quadrant, 55-57 High Street, windsor, Berkshire SL4 1Lp registered in England No. 286773Telephone: +44 (0) 1753 837000 Fax: +44 (0) 1753 850872website: www.morganadvancedmaterials.comThe Company’s website provides information about the Group including the markets in which it operates, its strategy and recent news from the Group. The Investors section is a key source of information for shareholders, containing details of our financial results, shareholder meetings and dividends, with a frequently asked questions section. Current and past Annual, Half-Year and EHS reports are also available to view and download.
Company registrars Capita Asset Services, The registry, 34 Beckenham road, Beckenham, Kent Br3 4TuTelephone (in the uK): 0871 664 0300 (calls cost 10p per minute plus network extras, lines are open Monday-Friday, 9.00am-5.30pm, excluding public holidays)Telephone (from outside the uK): +44 (0) 20 8639 3399Email: [email protected]: www.capitaassetservices.comShareholders with queries relating to their shareholding should contact Capita directly. Alternatively, shareholders may find the Investors section of our website useful for general enquiries.
Share portal The Share portal is a secure online site where you can manage your shareholding quickly and easily, reducing the need for paperwork and providing 24-hour access for your convenience. Through the Share portal you can view your holding and get an indicative valuation, change your address, arrange to have dividends paid into your bank account and view your dividend payment history. To register for the Share portal visit www.capitashareportal.com. All you need is your investor code, which can be found on your share certificate or your dividend tax voucher.
Dividend payments You can choose to receive your dividend in a number of ways. Dividends will automatically be paid to you by cheque and sent to your registered address unless you have chosen one of the options below:
Direct payment to your bank Cash dividends can be paid directly to a uK bank or building society account. This means that your dividend reaches your bank account on the payment date, it is more secure (cheques can sometimes get lost in the post), you don’t have the inconvenience of depositing a cheque and it helps reduce cheque fraud. If you have a uK bank account you can sign up for this service on the Share portal (by clicking on ‘your dividend options’ and following the onscreen instructions) or by contacting Capita.
International payments service
If you live outside the uK, Capita has partnered with Deutsche Bank to provide you with a service that will convert your sterling dividends into your local currency at a competitive rate. You can choose to receive payment directly into your local bank account or, alternatively, you can be sent a currency draft. You can sign up for this service on the Share portal (by clicking on ‘your dividend options’ and following the onscreen instructions) or by contacting Capita.For further information contact Capita by telephone in the uK on 0871 664 0385 (calls cost 10p per minute plus network extras; lines are open Monday-Friday, 9.00am-5.30pm, excluding public holidays) or from outside the uK on +44 (0) 20 8639 3405, or by email ([email protected]).
Multiple accounts on the shareholder register
If a shareholder receives two or more sets of AGM documents, this means that there is more than one account in their name on the shareholder register, perhaps because either the name or the address appears on each account in a slightly different way. If you have multiple accounts and would like them to be combined, please write to Capita at the address above, detailing your different investor codes and requesting that they be combined into one account.
Donate your shares to charity
If you have only a small number of shares which are uneconomical to sell, you may wish to consider donating them to charity, free of charge, through ShareGift (registered charity 1052686), a charity that specialises in the donation of small, unwanted shareholdings to good causes. You can find out more by visiting www.sharegift.org.uk or by telephoning +44 (0) 20 7930 3737.
Unsolicited telephone calls and mail
Shareholders in companies may receive unsolicited phone calls or correspondence concerning investment matters. If you are offered unsolicited investment advice, discounted shares, a premium price for shares you own, or free company or research reports, please check the company or person contacting you is properly authorised by the Financial Conduct Authority (FCA) before getting involved. Further information about what you should do is available on our website in the Shareholder Centre under Investors.

Morgan aDVanCED MaTErIaLS annuaL rEporT 2014
For more information about Morgan Advanced Materials, please visit our website.
www.morganadvancedmaterials.com
Find out more about Morgan Advanced Materials graduate recruitment on Facebook.
www.facebook.com/MorganAdvancedMaterials

This Report has been printed in the UK. Our printers are environmental management system ISO 14001-accredited and Forest Stewardship Council® (FSC®) chain of custody-certified. All inks used are vegetable-based. This paper is environmentally friendly ECF (elemental chlorine-free) and wood-free with a high content of selected pre-consumer recycled material. The mill is fully FSC®-certified. The paper is also completely bio-degradable and recyclable.
If you have finished reading this Report and no longer wish to retain it, please pass it on to other interested readers, return it to Morgan Advanced Materials or dispose of it in your recycled paper waste. Thank you.
This Annual Report is available at www.morganadvancedmaterials.com
Designed and produced by Instinctif Partners www.instinctif.com
6659_Morgan_Annual Report 2014_Cover_TP2.indd 6 19/03/2015 17:31

Morgan Advanced Materials plcQuadrant, 55-57 High Street Windsor, Berkshire SL4 1LPTel: +44 (0)1753 837000 Fax: +44 (0)1753 850872
www.morganadvancedmaterials.com