Embed Size (px)
Citation preview
1
ADVANCED MONITORING OFLARGE-SCALE POSTGRESQL DEPLOYMENT IN
TOMTOM
pgconf.eu 2017
Agenda
2
• About us
• TomTom – what do we do?
• Why monitoring is important?
• Who should monitor?
• What should we monitor?
• Metrics & Tools
• What changes when hundreds of databases are to be monitored?
• Conclusion
About Us
3
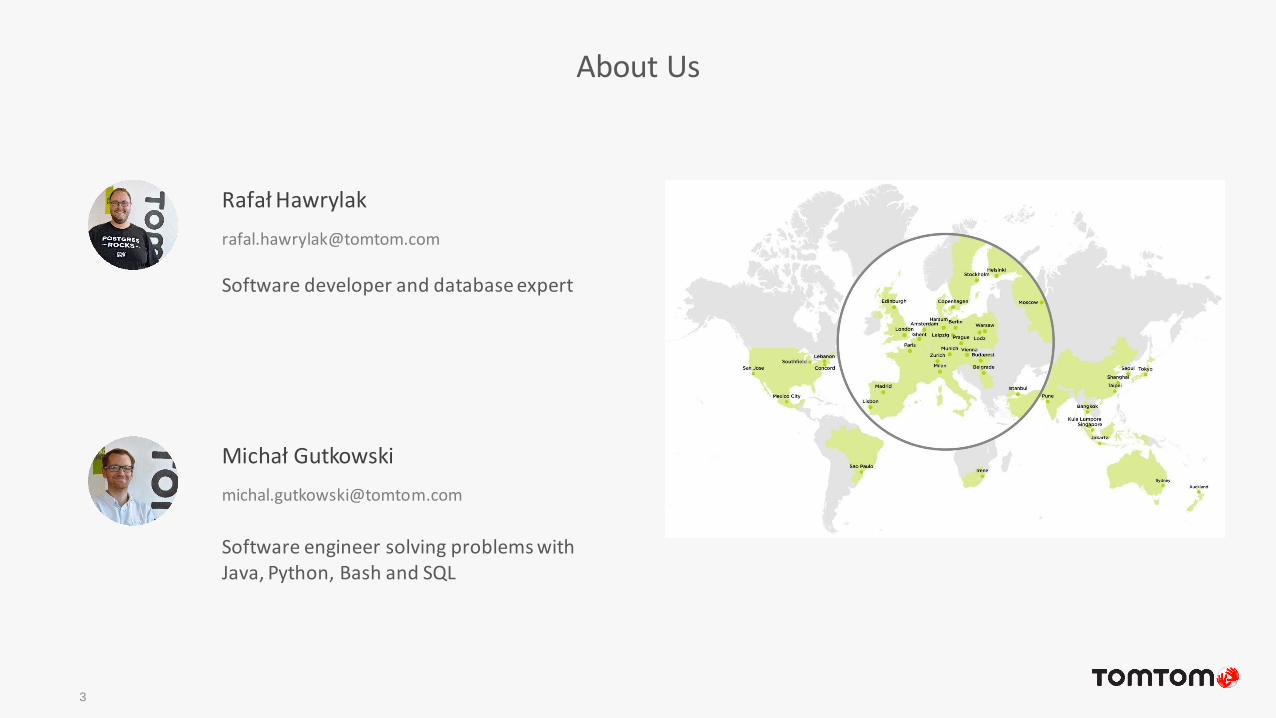
Michał Gutkowski
Software engineer solving problems with Java, Python, Bash and SQL
Rafał Hawrylak
Software developer and database expert
About Us – We Are From Łódź!
4
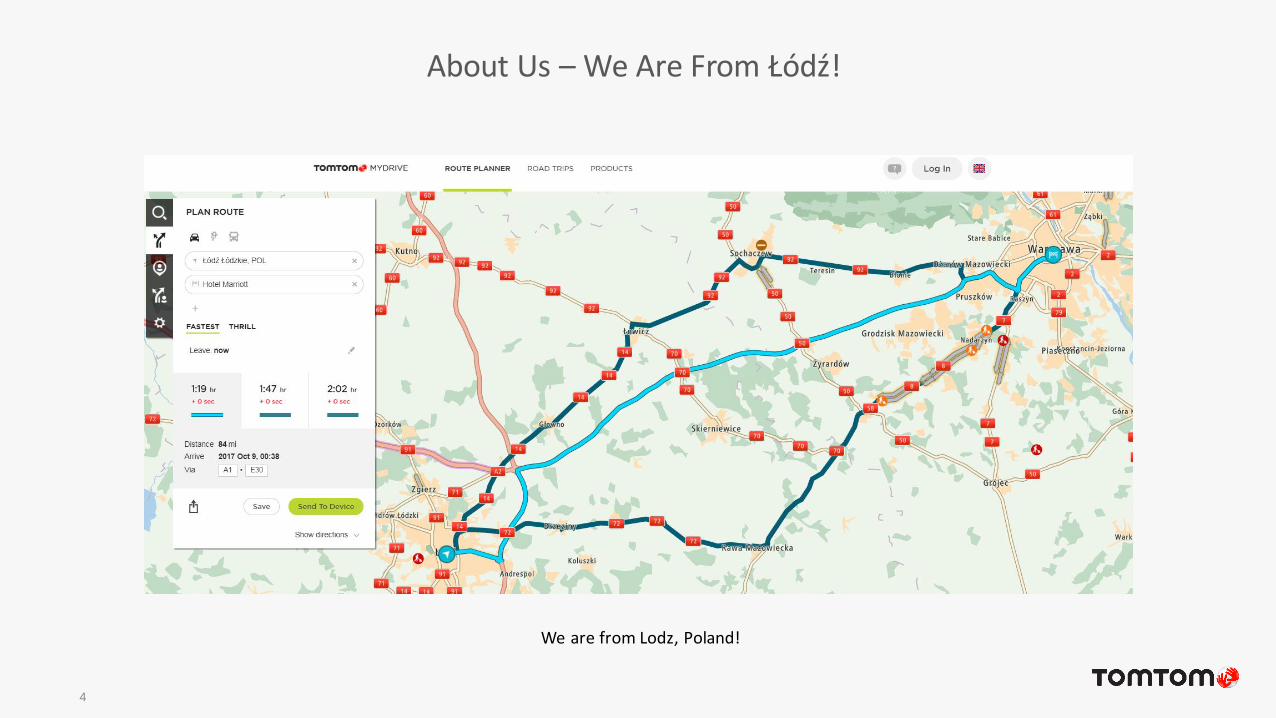
We are from Lodz, Poland!

TomTom – What do we do?
5
6
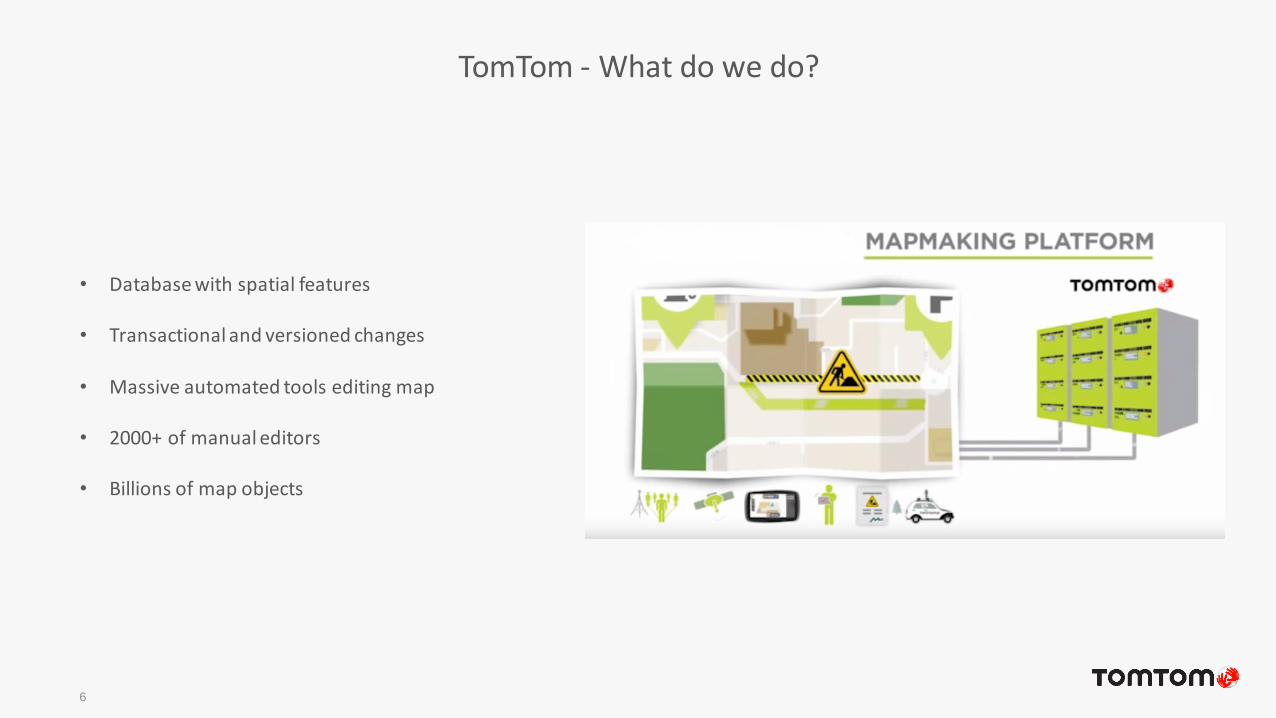
• Database with spatial features
• Transactional and versioned changes
• Massive automated tools editing map
• 2000+ of manual editors
• Billions of map objects
TomTom - What do we do?
MapMaking Platform in 2017
7
• PostgreSQL 9.5 + Postgis 2.2
• 150+ database machines – 32 cores, 256GB RAM, ssd drives in RAID
• Storage – 160TB
• Daily db size increase – 200GB
• Inserted rows count 15k per second
• Queries count – over 600k per second
Why monitoring is important?
8
• System health-check and maintenance
• Alerting and reliable notification system
• Detect performance regression – software, configuration, hardware changes
• Software optimisations: queries, batching
• Cost-efficiency – run it cheaper
• Business process improvements: scheduling, task queues, separate users with priorities
• Adjust business processes – self healing system
9
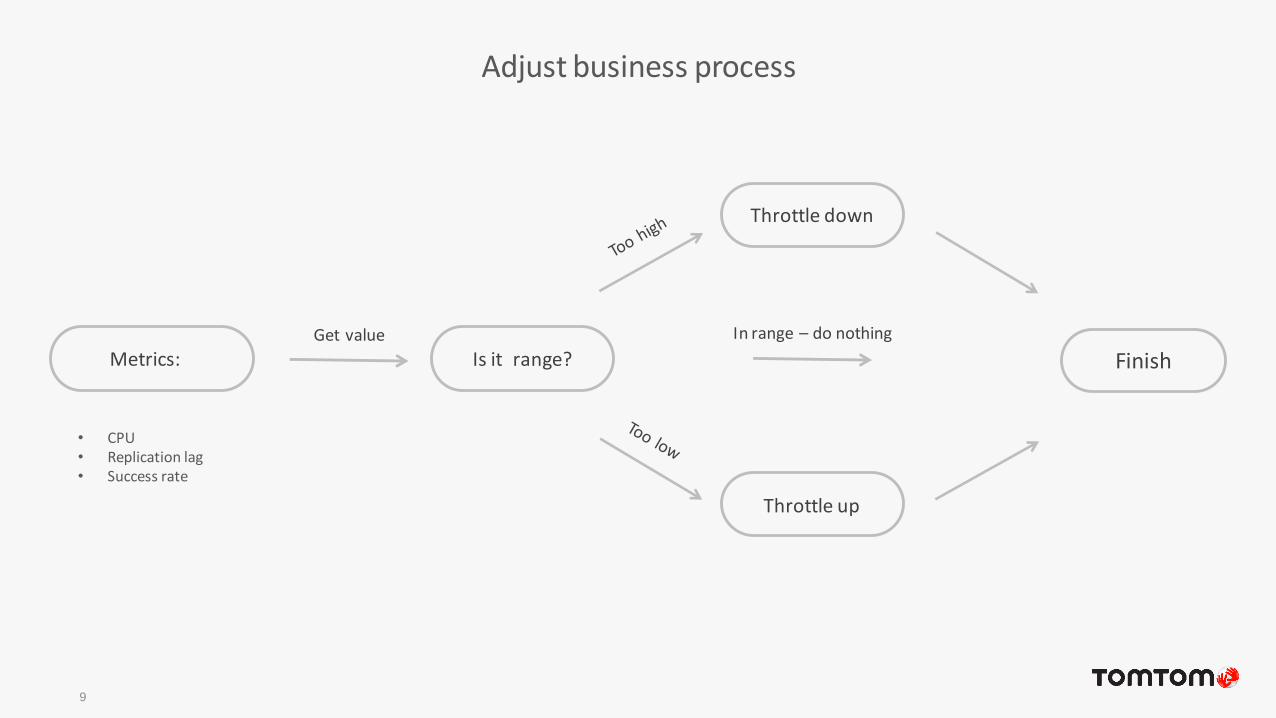
Adjust business process
Metrics:Get value
Is it range?
Throttle down
In range – do nothing
Throttle up
Finish
• CPU• Replication lag• Success rate
Who should monitor?
10
• Production monitoring team is responsible for catching incidents
• Database team is responsible for administration, maintenance and tuning
• Every developer or tester has access to metrics from production environment
• Teams are responsible for delivering changes in software and database
• Full development cycle: design, implementation, deployment and monitoring on production
• Top-down responsibility
What should we monitor?
11
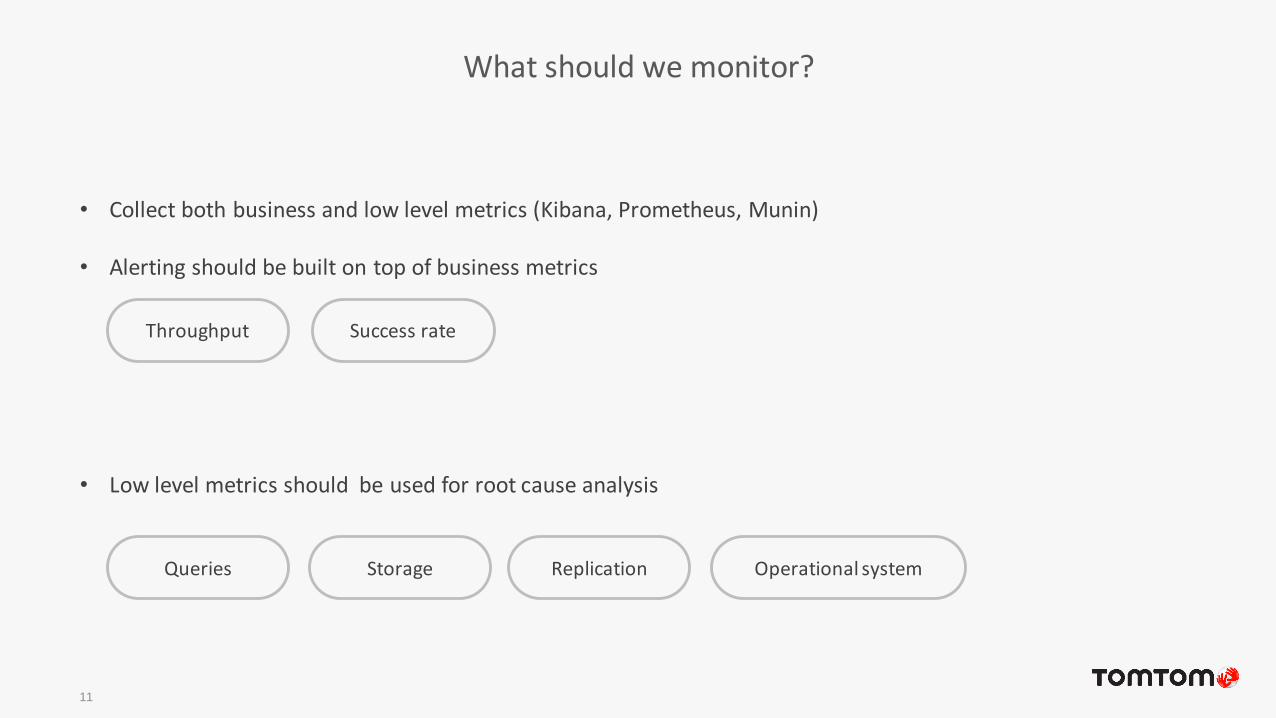
• Collect both business and low level metrics (Kibana, Prometheus, Munin)
• Alerting should be built on top of business metrics
• Low level metrics should be used for root cause analysis
Throughput Success rate
Queries Operational systemStorage Replication
Alerting
12
• Define rules and thresholds for metrics
• Remember – only business metrics for alerting!
• Use automated notification (e-mails, Slack or PagerDuty)
• Sample business metrics:• Health check:
• Success rate
• Performance• Application response times• Requests per second
Monitoring: which metrics are important
13
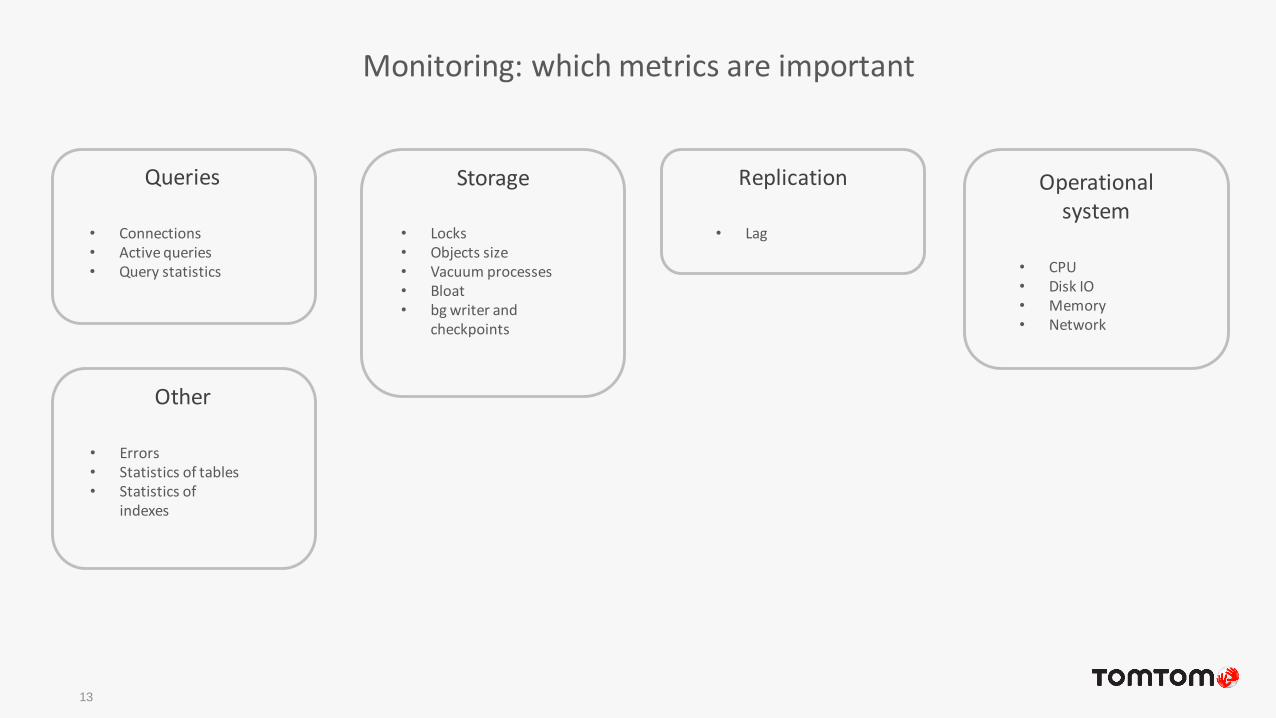
Storage ReplicationQueries
• Connections• Active queries• Query statistics
• Locks• Objects size• Vacuum processes• Bloat• bg writer and
checkpoints
Other
• Errors• Statistics of tables• Statistics of
indexes
• Lag
Operationalsystem
• CPU• Disk IO• Memory• Network
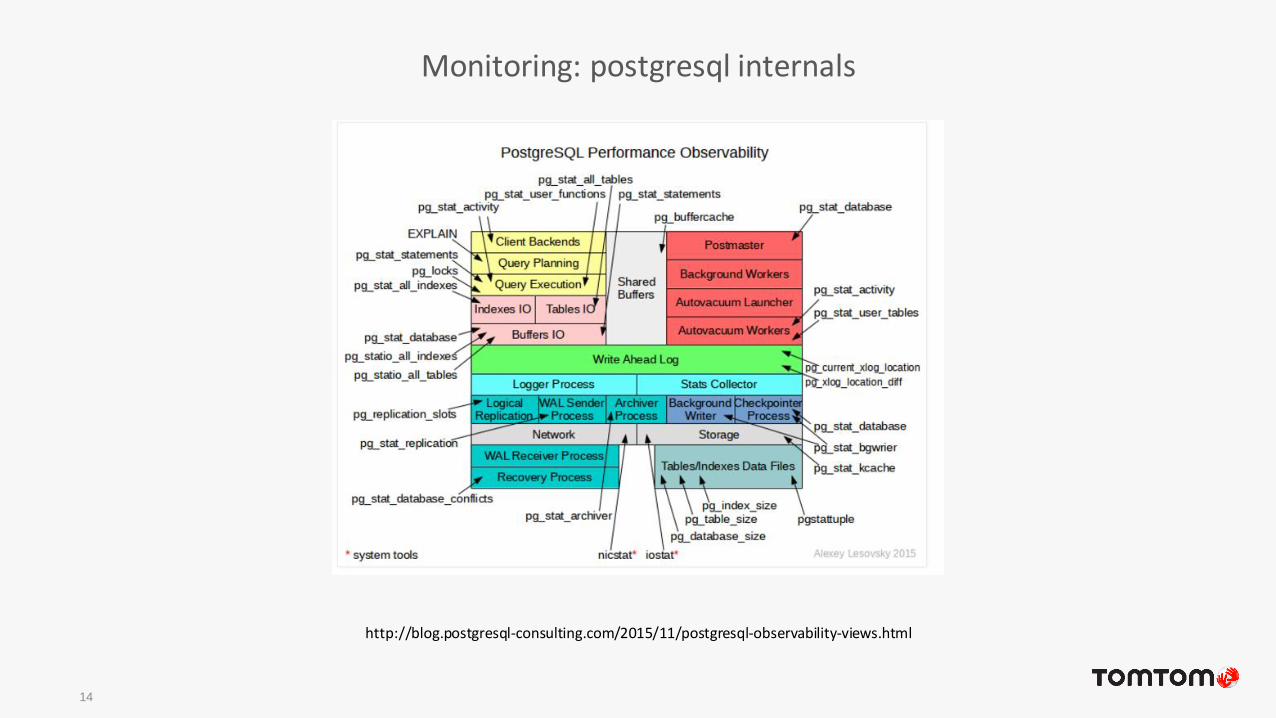
Monitoring: postgresql internals
14
http://blog.postgresql-consulting.com/2015/11/postgresql-observability-views.html
Monitoring: connections
15
Why?
• Indicate problems in higher tiers (application services are down, network problems)
• Changes in usage pattern of application layer (raised number of connections)
• More connections mean more resources utilized
How?
• SELECT usename, count(1) FROM pg_stat_activity WHERE state <> 'idle' GROUP BY 1 ORDER BY 2 desc;
• pg_view
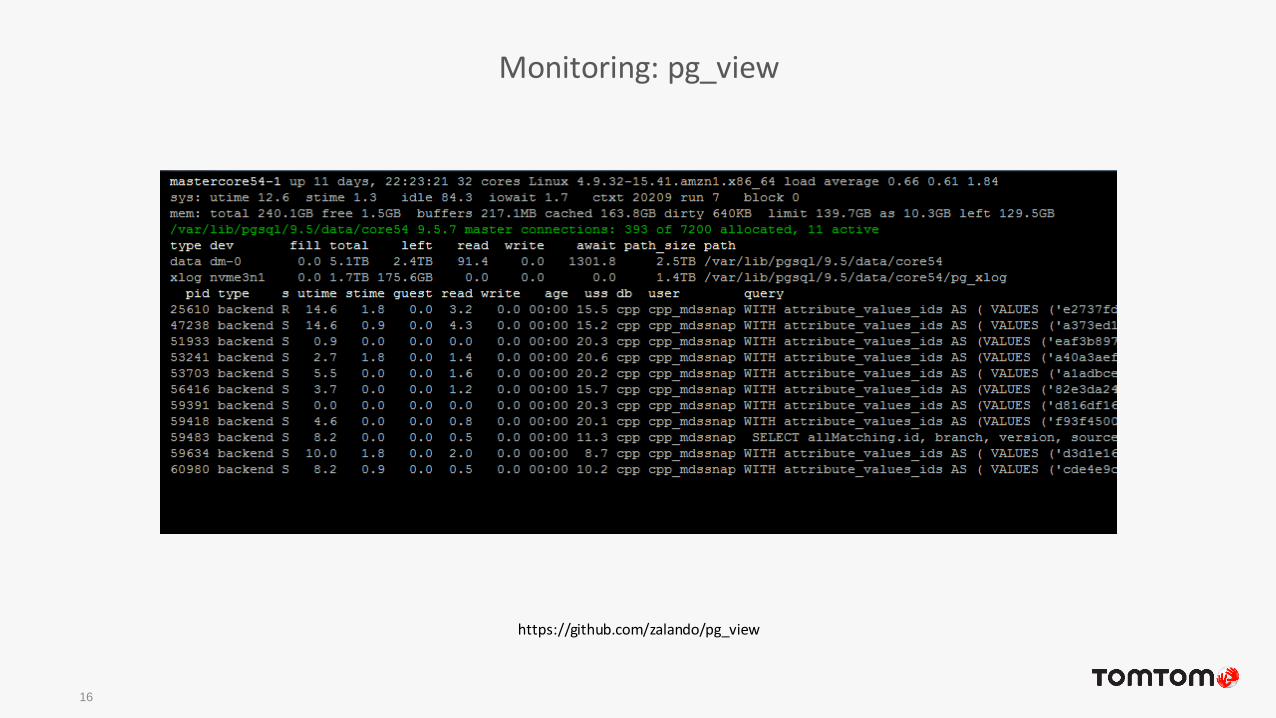
Monitoring: pg_view
16
https://github.com/zalando/pg_view
Monitoring: active queries
17
Why?
• Indicate currently long running queries
• Overview types of queries currently running
How?
• SELECT query, count(1) FROM pg_stat_activity WHEREstate <> 'idle' GROUP BY 1 ORDER BY 2 desc;
• pg_view
• pg_activity
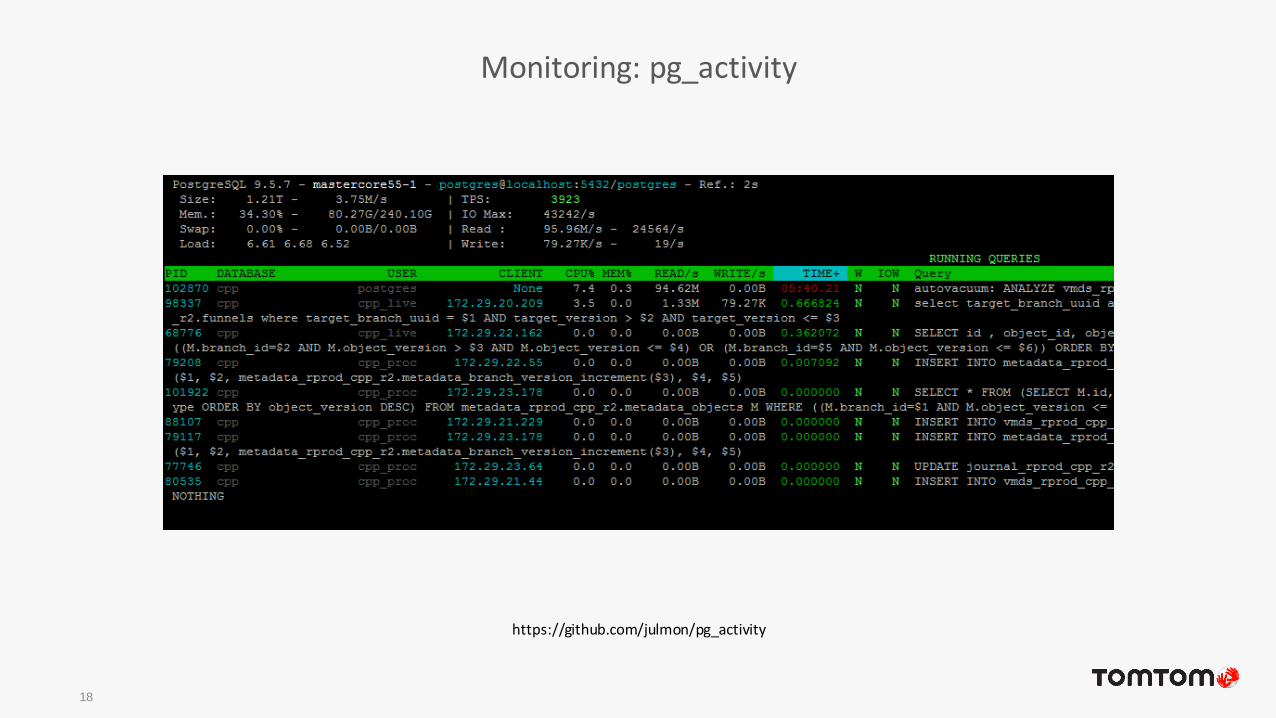
Monitoring: pg_activity
18
https://github.com/julmon/pg_activity
Monitoring: query statistics
19
Why?
• What queries are executed:
• Types of queries
• Top queries (number, total time)
• Parameters
• Find slow queries requiring optimization
• Check resource usage by particular queries
• Find queries causing timeouts
How?
• pg_stat_statements
• postgres logs
• munin
Monitoring: errors
20
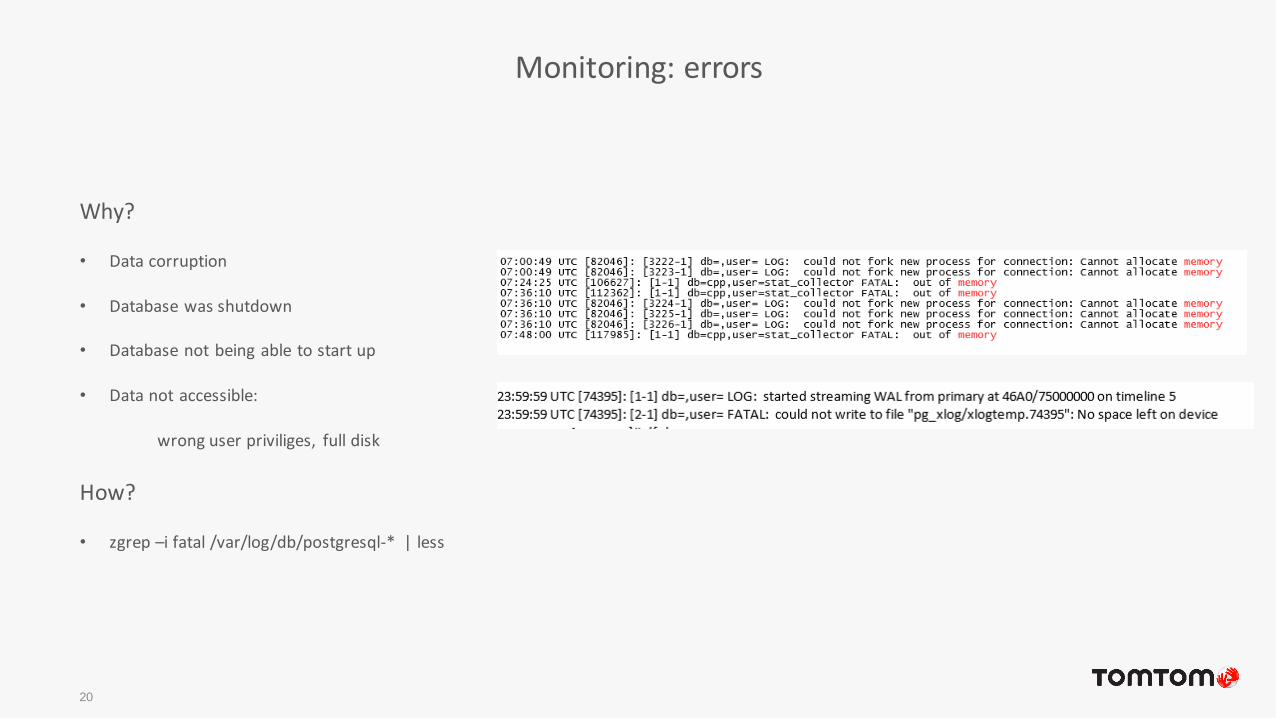
Why?
• Data corruption
• Database was shutdown
• Database not being able to start up
• Data not accessible:
wrong user priviliges, full disk
How?
• zgrep –i fatal /var/log/db/postgresql-* | less
Monitoring: locks
21
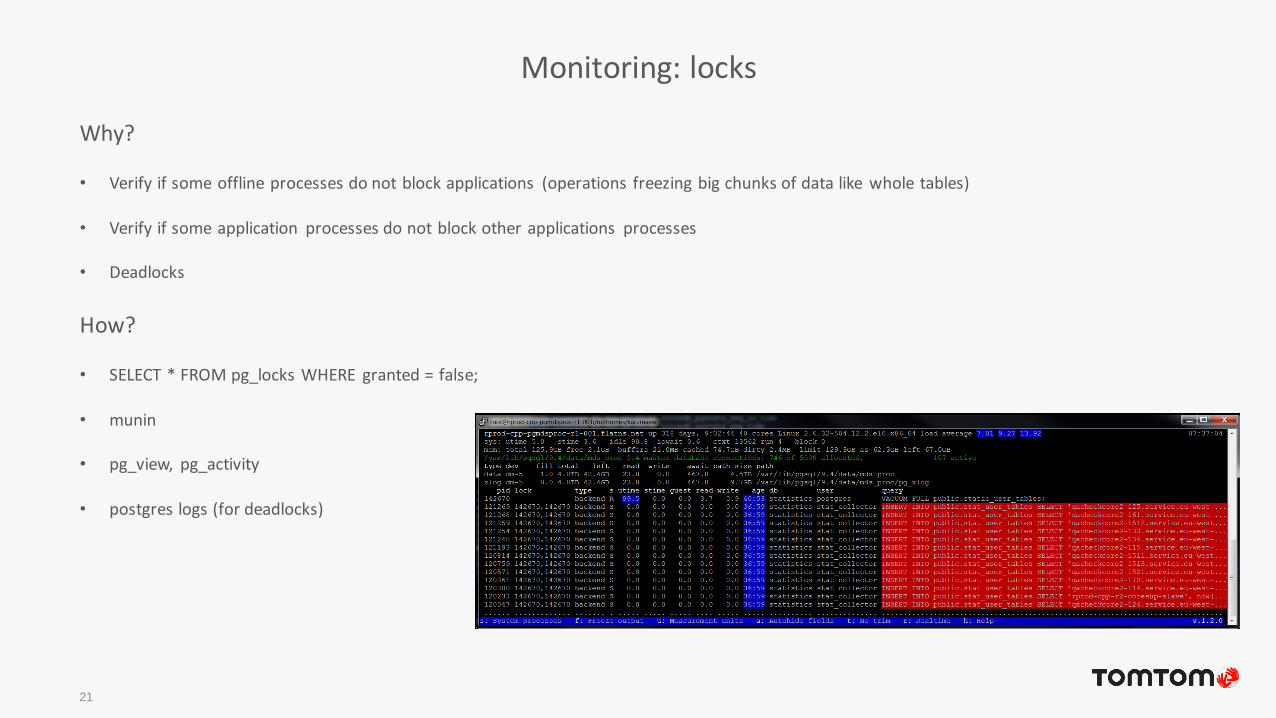
Why?
• Verify if some offline processes do not block applications (operations freezing big chunks of data like whole tables)
• Verify if some application processes do not block other applications processes
• Deadlocks
How?
• SELECT * FROM pg_locks WHERE granted = false;
• munin
• pg_view, pg_activity
• postgres logs (for deadlocks)
Monitoring: objects size
22
Why?
• Control diskspace
• Know the largest objects, control increase
• Changes in usage pattern of application layer (tuples count, average tuple size)
How?
• Munin to catch trend
• pg_total_relation_size(relid) – table + indexes size
• pg_relation_size(relid) – tables or index size
• pgstattuple(regclass) – for precise results
• pgstatindex(regclass) – for precise results
• SELECT reltuples AS approximate_row_count FROM pg_class WHERE relname = 'tbl';
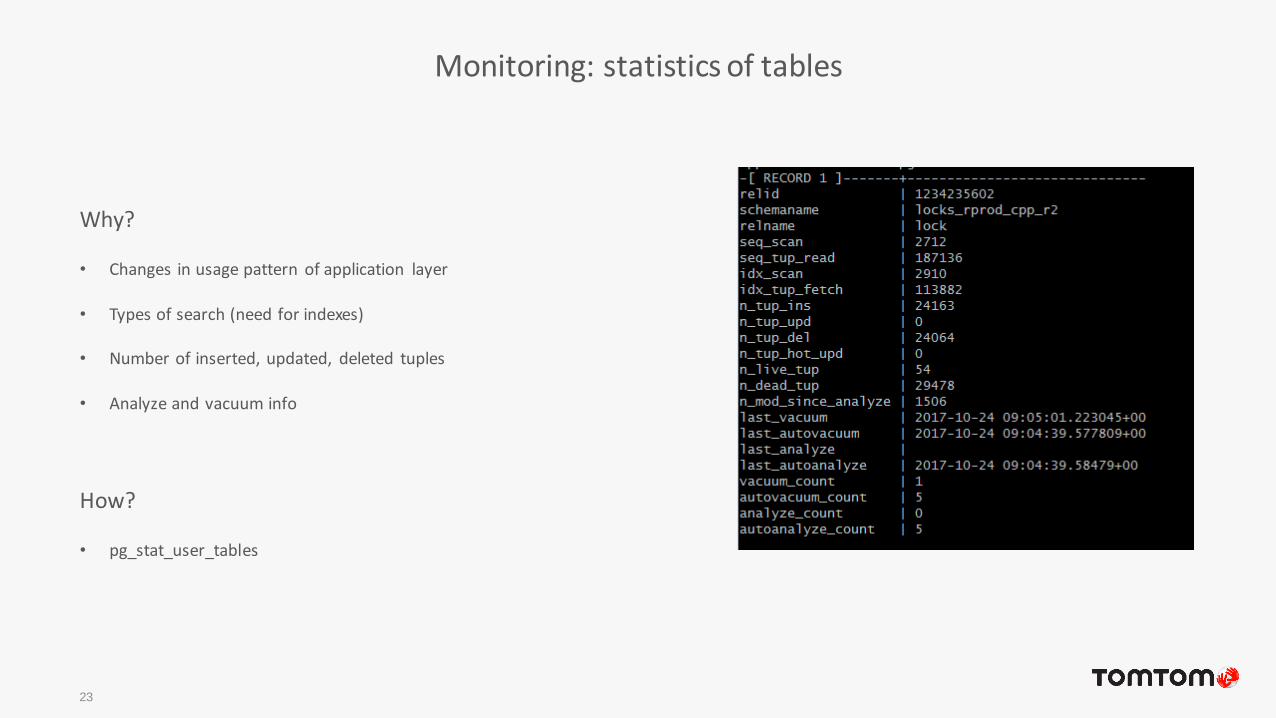
Monitoring: statistics of tables
23
Why?
• Changes in usage pattern of application layer
• Types of search (need for indexes)
• Number of inserted, updated, deleted tuples
• Analyze and vacuum info
How?
• pg_stat_user_tables
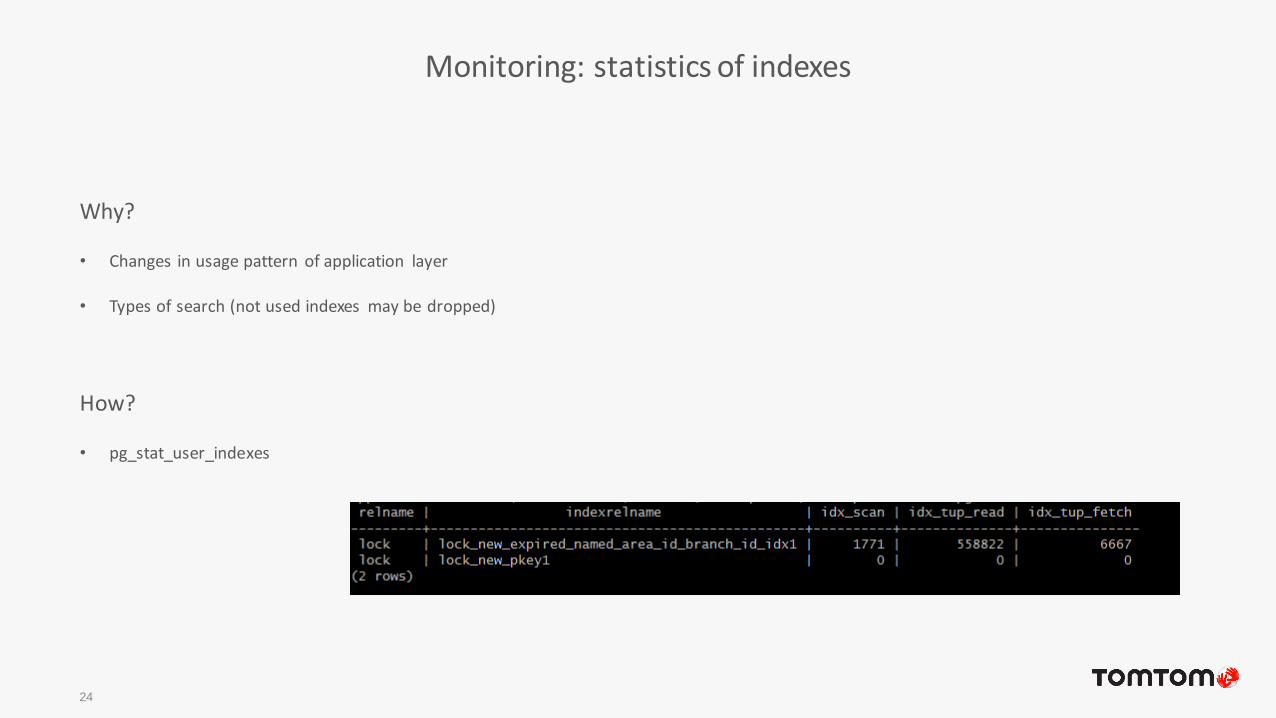
Monitoring: statistics of indexes
24
Why?
• Changes in usage pattern of application layer
• Types of search (not used indexes may be dropped)
How?
• pg_stat_user_indexes
Monitoring: vacuum process
25
Why?
• Vacuum effectiveness
• To know how much resources are used by vacuum process
How?
• pg_view
• htop
• iotop
• postgres logs
Monitoring: bloat
26
Why?
• If you do a lot of updates or deletes and readings at the same time your tables and indexes
get bloated
• Having bloated tables or indexes causes: uneffective space usage, slower reads and writes
How?
• pg_stats (estimated) – implemented also in check_postgres scripts
• pgstattuple extension (exact, but slow query) - includes pgstatindex
• pgstattuple_approx (quite exact, quite fast)
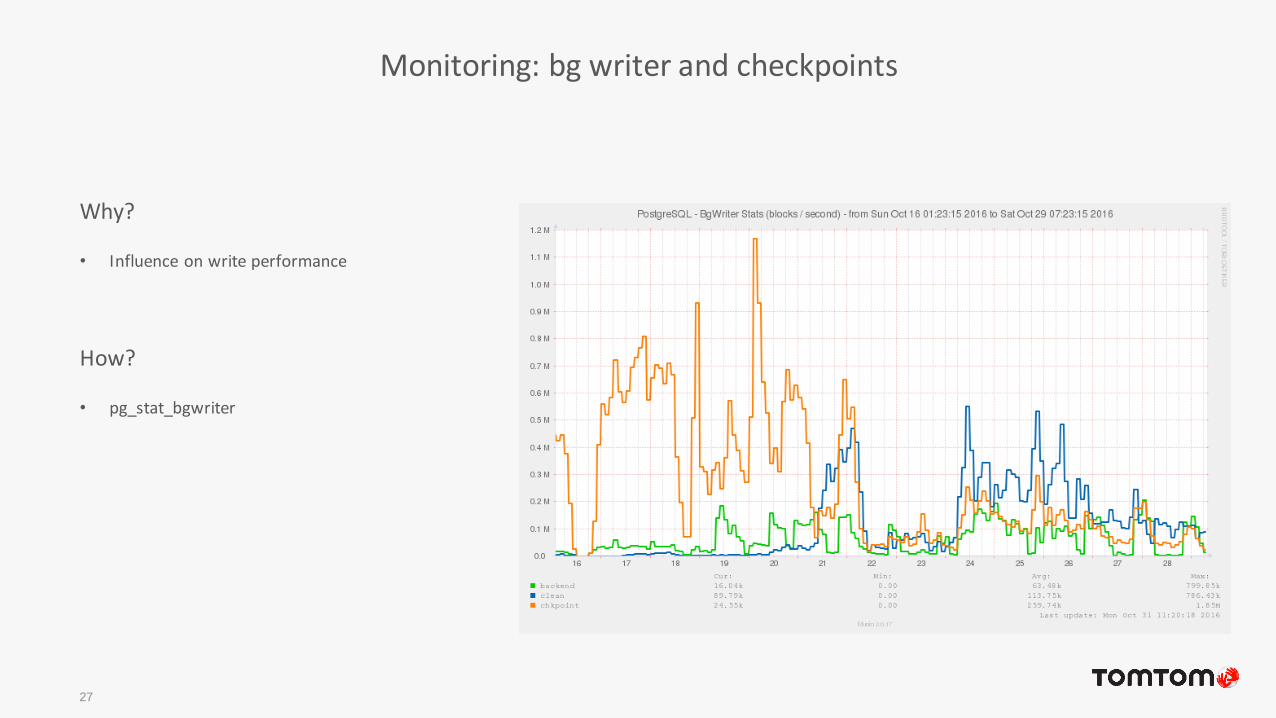
Monitoring: bg writer and checkpoints
27
Why?
• Influence on write performance
How?
• pg_stat_bgwriter
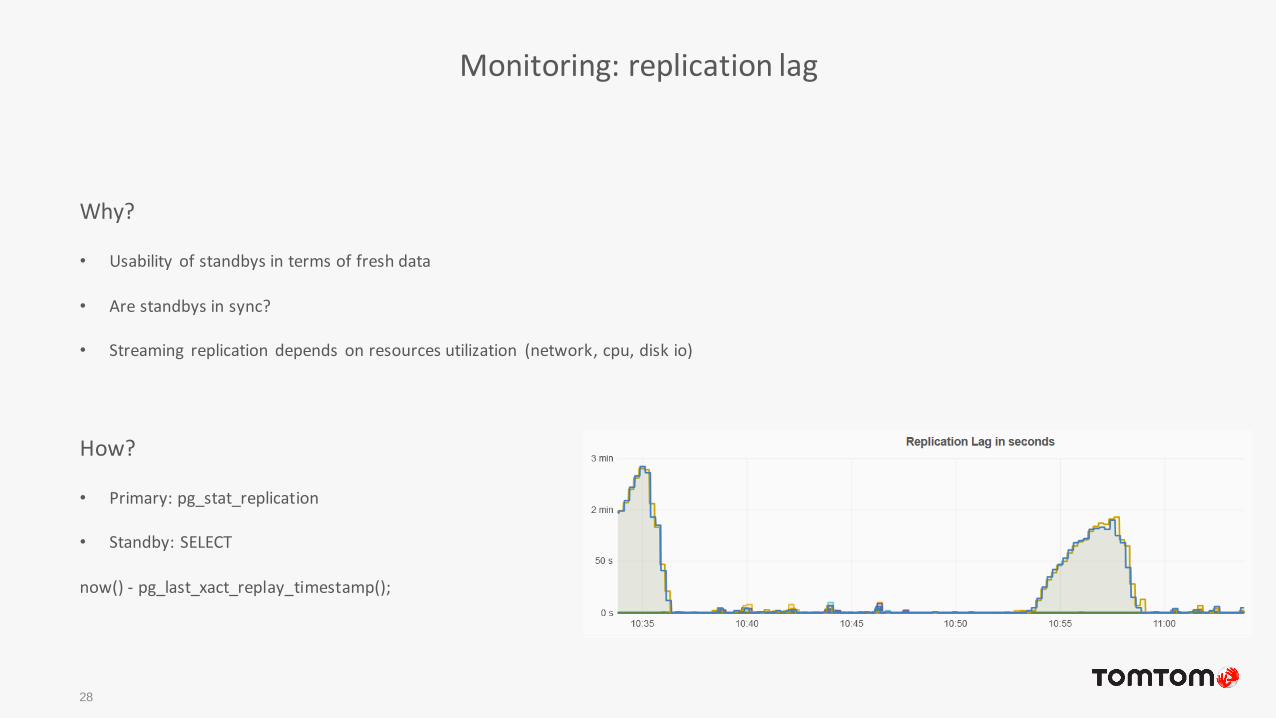
Monitoring: replication lag
28
Why?
• Usability of standbys in terms of fresh data
• Are standbys in sync?
• Streaming replication depends on resources utilization (network, cpu, disk io)
How?
• Primary: pg_stat_replication
• Standby: SELECT
now() - pg_last_xact_replay_timestamp();
Monitoring at system level: cpu
29
Why?
• To find processes consuming most cpu
• Having cpu utilization more than 60-70% usually leads to significant drop of performance due to cpu context switching
• To have knowledge what is usual consumption of cpu by specific processes (queries, autovacuum, replication)
• Find areas to optimize
How?
• top, htop
• munin
• pg_stat_statements
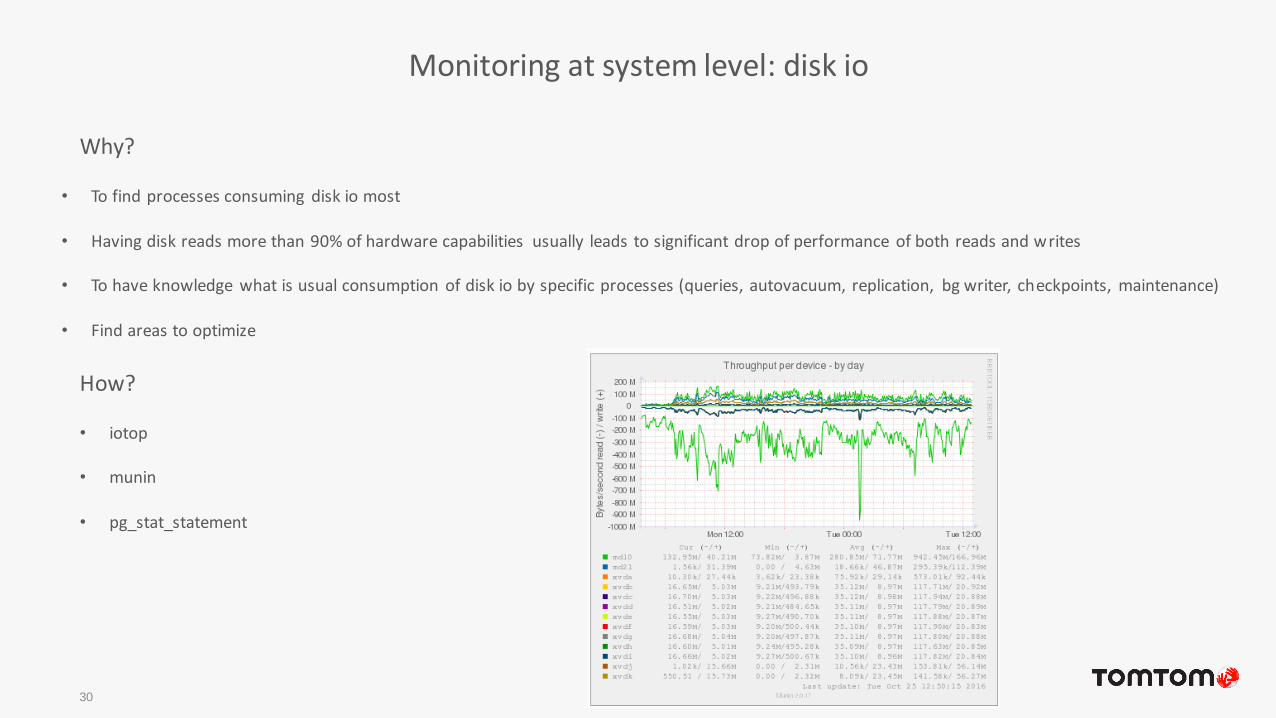
Monitoring at system level: disk io
30
Why?
• To find processes consuming disk io most
• Having disk reads more than 90% of hardware capabilities usually leads to significant drop of performance of both reads and writes
• To have knowledge what is usual consumption of disk io by specific processes (queries, autovacuum, replication, bg writer, checkpoints, maintenance)
• Find areas to optimize
How?
• iotop
• munin
• pg_stat_statement
Monitoring at system level: memory
31
Why?
• To find processes consuming most RAM
• Having memory utilization less than 60-70% usually is a waste (possibly cache hit ratio is low)
• To have knowledge what is usual consumption of ram by specific processes (queries mostly)
• Find areas to optimize
How?
• htop
• munin
• Unfortunately there are no statistics related to ram consumption inside PostgreSQL
Monitoring at system level: network
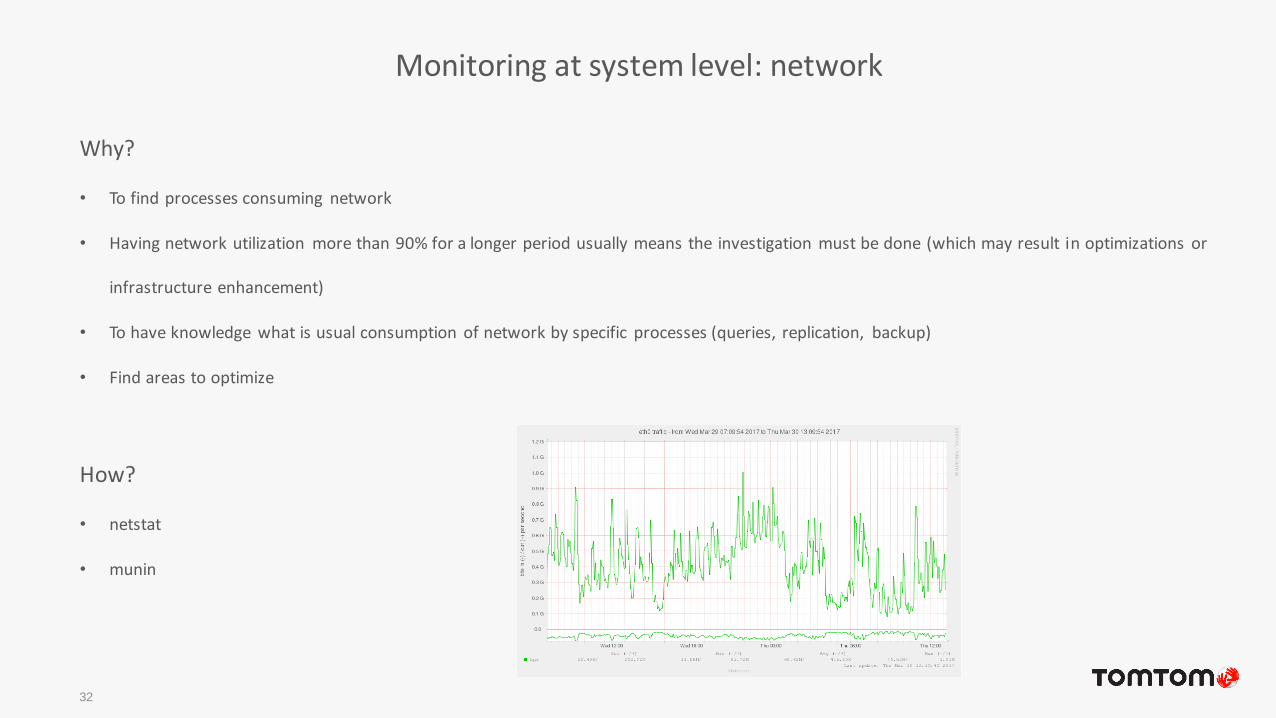
32
Why?
• To find processes consuming network
• Having network utilization more than 90% for a longer period usually means the investigation must be done (which may result in optimizations or
infrastructure enhancement)
• To have knowledge what is usual consumption of network by specific processes (queries, replication, backup)
• Find areas to optimize
How?
• netstat
• munin
What changes when hundreds of databases are to be monitored?
33
Metrics collectors
• Prometheus + exporter plugins
• Munin + plugins
• AppDynamics & Java agents
• custom collectors (queries statistics)
Metrics aggregators
• Elastic Search
• AppDynamics
Visualization
• Kibana, Grafana
• AppDynamics
• Munin
What changes when hundreds of databases are to be monitored?
34
• Don’t rely on manual setups!
• Git – configuration is versioned and kept in external storage
• Ansible – automated configuration management
• Defines which collectors / agents / plugins need to be installed
• Settings for database and system
• Jenkins – automate your job
What changes when hundreds of databases are to be monitored?
35
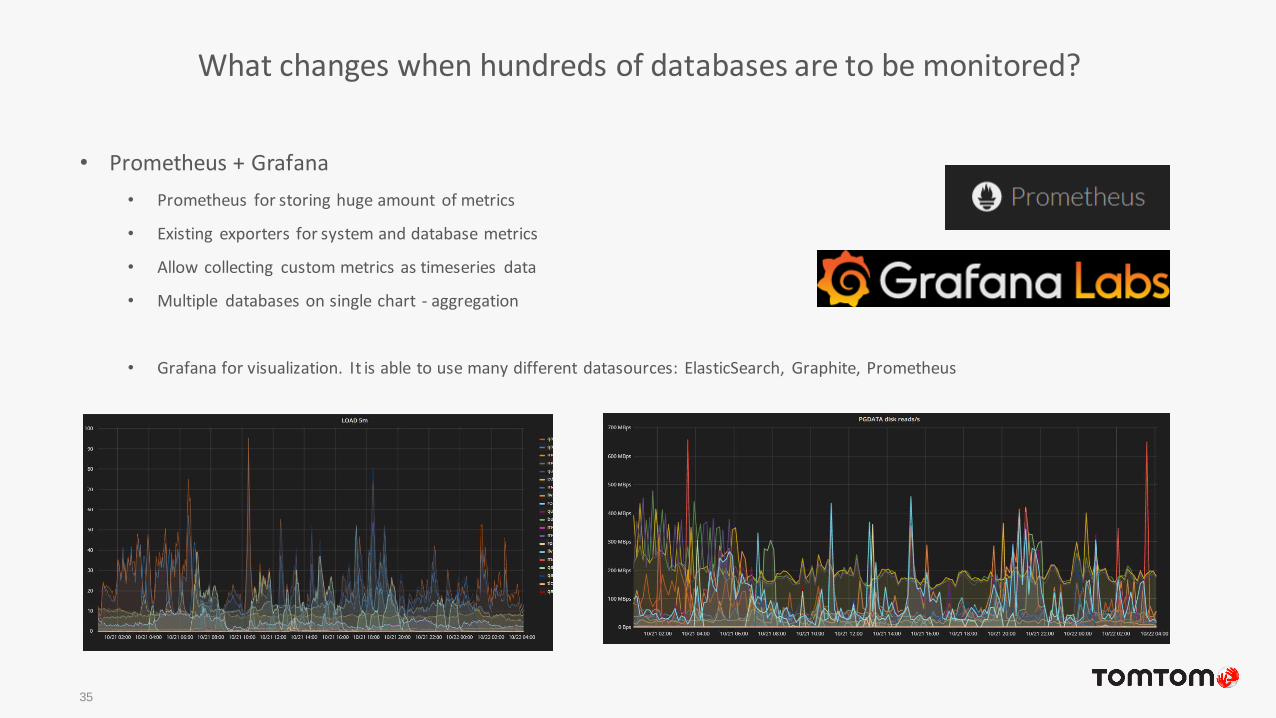
• Prometheus + Grafana
• Prometheus for storing huge amount of metrics
• Existing exporters for system and database metrics
• Allow collecting custom metrics as timeseries data
• Multiple databases on single chart - aggregation
• Grafana for visualization. It is able to use many different datasources: ElasticSearch, Graphite, Prometheus
What changes when hundreds of databases are to be monitored?
36
• Custom collectors + Elastic Search + Kibana
• Elastic Search for collecting metrics
• Kibana for Visualization
• Munin
• Plugins: built-in and external
• Does not aggregate metrics into single chart
• AppDynamics
• Collecting metrics on application level from many instances
• Dynamic instrumentation
• Alerts on incidents
• Track down the root cause https://prometheus.io/
https://grafana.com/https://www.elastic.co/products/kibana
http://munin-monitoring.org/
Monitoring: Multiple database instances vs pg_stat_statements
37
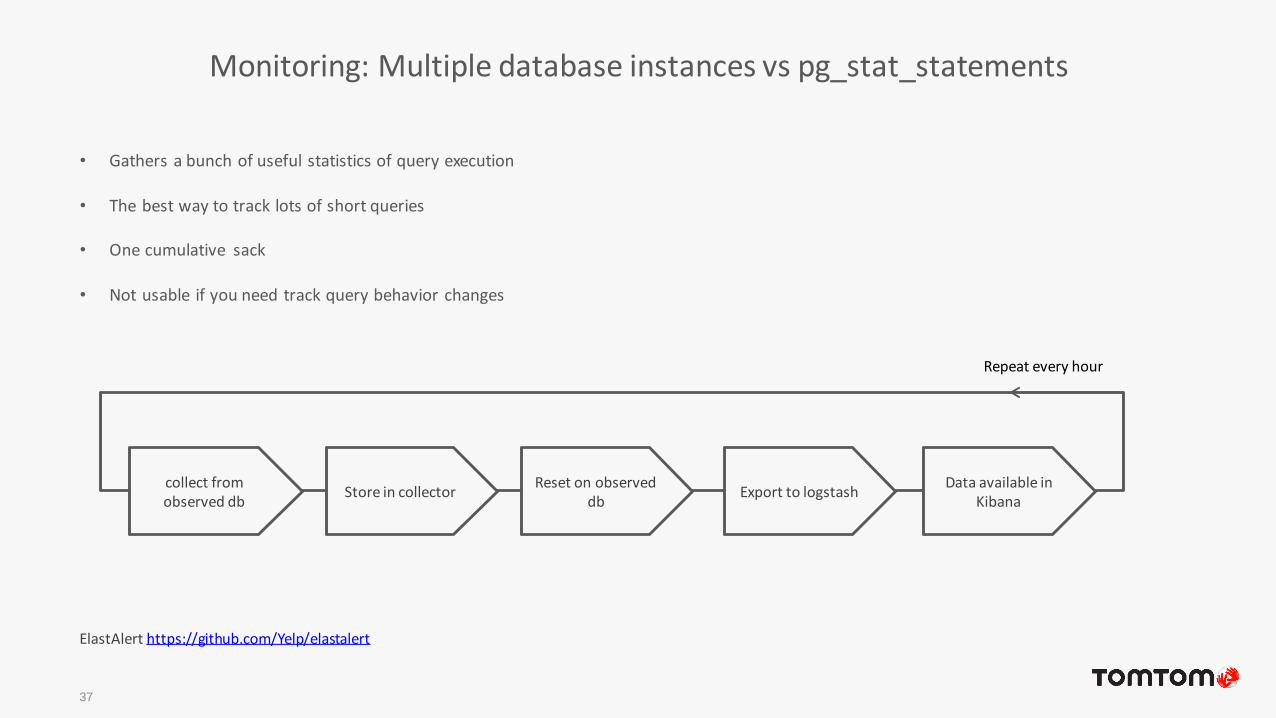
• Gathers a bunch of useful statistics of query execution
• The best way to track lots of short queries
• One cumulative sack
• Not usable if you need track query behavior changes
collect from observed db
Store in collectorReset on observed
dbExport to logstash
Data available in Kibana
Repeat every hour
ElastAlert https://github.com/Yelp/elastalert
Monitoring: stat_statements in Kibana
38
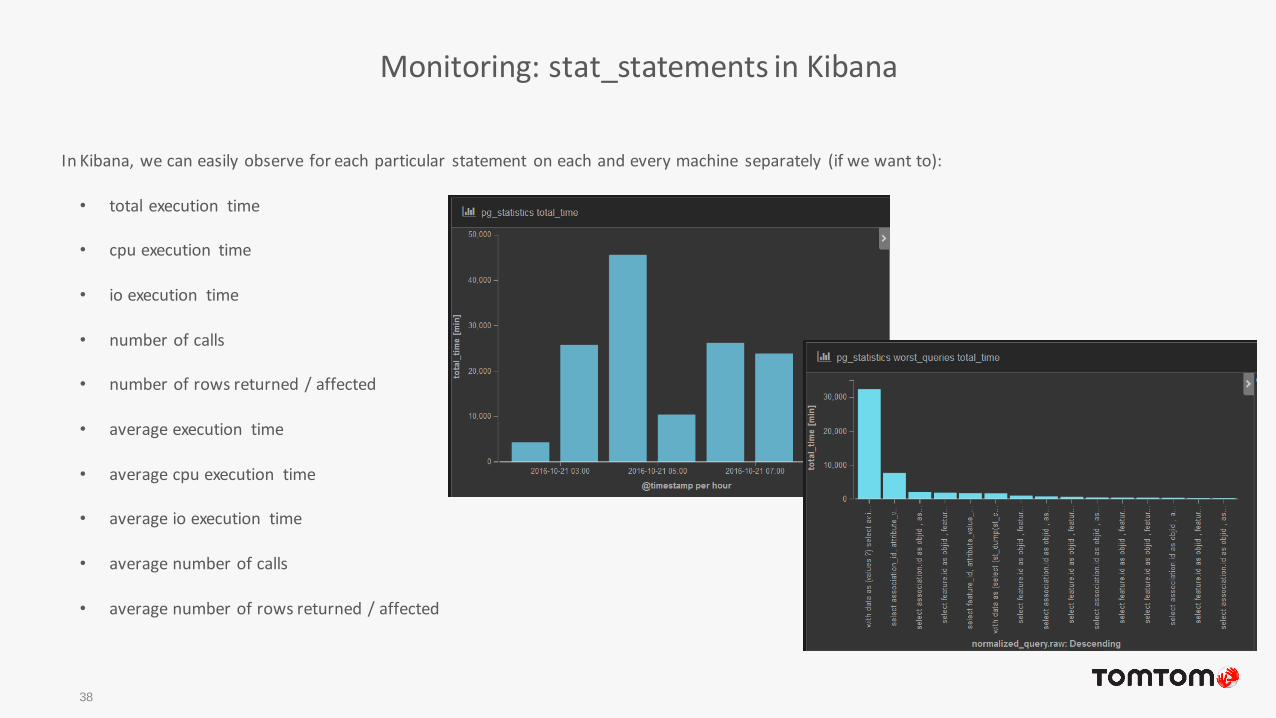
In Kibana, we can easily observe for each particular statement on each and every machine separately (if we want to):
• total execution time
• cpu execution time
• io execution time
• number of calls
• number of rows returned / affected
• average execution time
• average cpu execution time
• average io execution time
• average number of calls
• average number of rows returned / affected
Conclusion
39
• PostgreSQL is great database capable of reaching big goals
• It is scalable and provides good monitoring tools
But it is not enough
• Needs constant monitoring (metrics collection)
• Knowledge sharing: software developers should know how to read basic metrics
• For many instances:
• Aggregated overview on metrics
• Alerting on top of business metrics – not on low level instance metrics
Questions?
40
We are hiring! https://tomtom.com/careers/