Embed Size (px)
Citation preview

Advanced Methodologies in Outcomes & Insights Research
Study Design Measuring Knowledge vs. Impact vs. Performance vs. Quality of Care…and
Everything In Between
Karyn Ruiz-Cordell, MA, PhD Shunda Irons-Brown, PhD, MBA, CHCP
Tamar Sapir, PhD

DISCLOSURES

Educational Objectives
• Statistical Tools - Engaging in analytics from the start
• Statistical Planning - Hypothesis, research goals, and critical thinking
• Statistical Techniques - Knowing when to do what with your data
• Interpreting the Data – Applying your findings

What does ‘data’ mean, to you?

What we hear…
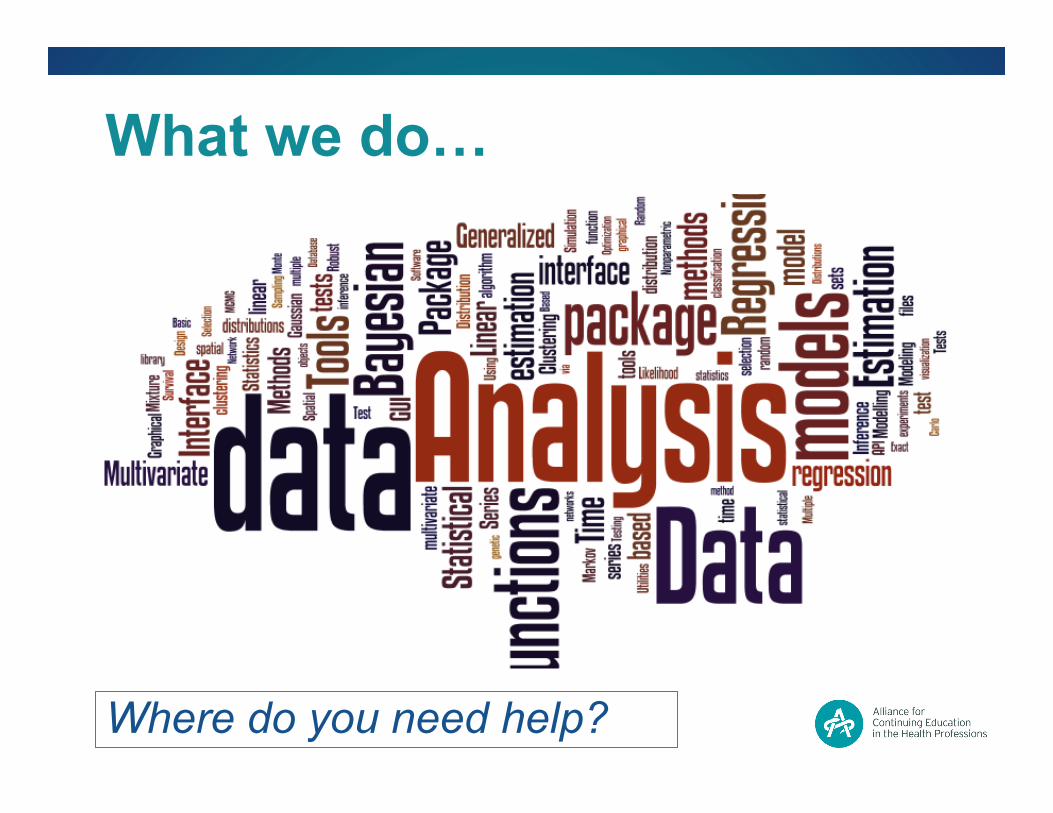
What we do…
Where do you need help?

The New Data-Driven World: A Quiet Revolution
• Then: Data used to answer discrete (predetermined) questions (hypotheses)
• Now: Data and data systems to drive change and achieve goals

What is Data Analysis? • Descriptive statistics
– Quantitatively defining describing the main features of a collection of information
• Confirmatory data analysis (Inferential)
– Confirming or falsifying existing hypothesis
• Exploratory data analysis (Inferential) – Discovering new features in the data

Considerations, Selection, & Interpretations of Appropriate Statistical Testing When Evaluating the Effectiveness of Education

Types of Variables – The Terms • Dependent – Outcome variable (test score) • Independent – Variable being manipulated in
order to observe the effect on the DV
• Continuous – Quantitative variables – Interval – Continuum, numeric – Ratio – Zero
• Categorical – Discrete variables – Nominal - ≥ 2, no order – Dichotomous – Ordinal - ≥ 2, ranked

Flow-chart: Test Selection

Decisions: Parametric vs. Non-Parametric
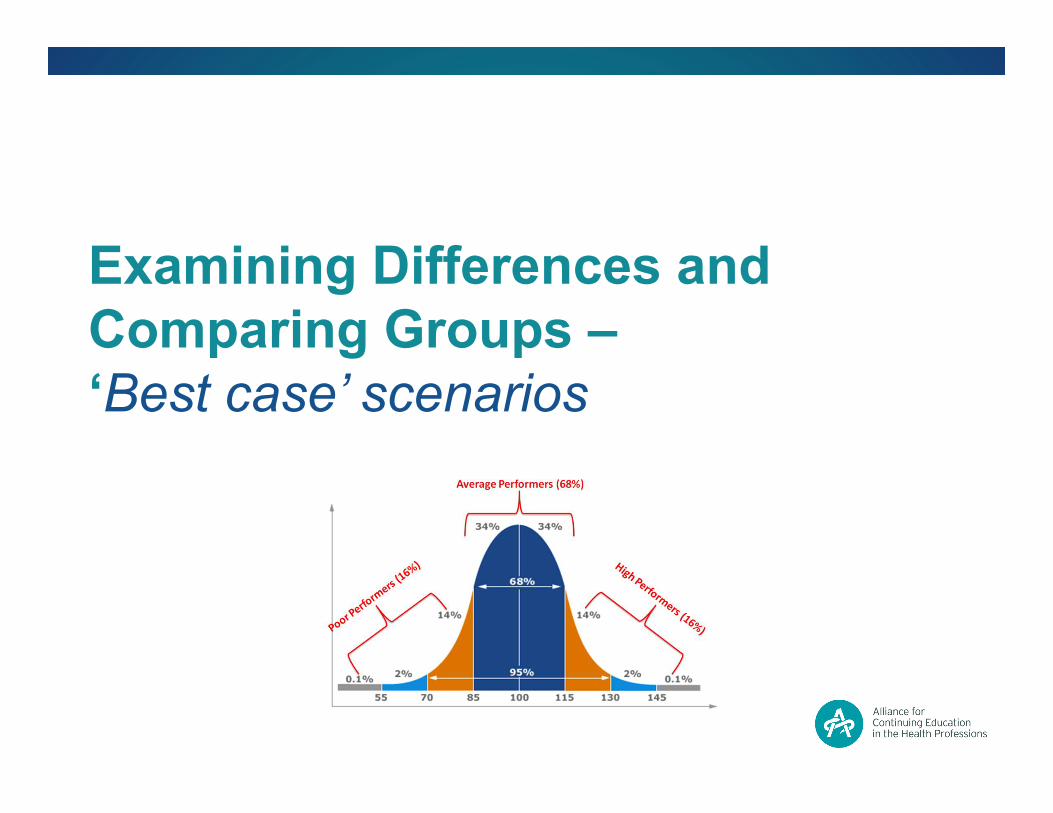
Examining Differences and Comparing Groups – ‘Best case’ scenarios

Case 1: Comparing impact of education among different groups within a cohort
• Considerations – Variable type:
• Continuous • Categorical
– Unpaired • Test
– Independent T-test
*Note – Percent change vs.
Percent difference
Which of the following patient populations with hypercholesterolemia are indicated for the new PCSK9 inhibitor therapies? (Select all that apply)
0% 9%
80%
24%
80%
3% 0%
149%
21%
77%
0%
20%
40%
60%
80%
100%
120%
140%
160%
Failed 1 statin Failed 2 statins
Max-tolerated statin
HeFH ASCVD
lipidologists % improvement (N = 152) PCP % improvement (N = 252)

Case 2: Comparing impact of educational formats
53%
83%
44%
69%
0%
20%
40%
60%
80%
100%
Pre Live (n= 135)
Post Live (n= 87)
Pre Online (N=589)
Post Online (N =468)
Correct answer
• Considerations – Variable type
• Continuous
• Test/s – Paired t-test comparing
pre/post – Independent t-test
comparing post-test of different formats
Average test score of participants

Non-Parametric Tests (or ) What to do when you don’t know what to do

Case 1
5%
5%
14%
57%
18%
5%
3%
14%
50%
28%
0% 20% 40% 60%
1
2
3
4
5
Pre-Education (N = 337) Post-Education (N = 243)
Please rate your confidence in using advanced methodologies in outcomes and research design? (1 = not all confident; 5 = completely confident)
• Considerations – Ordinal or categorical
variables? • Ordinal
– Sample size • >5
– Paired or unpaired variables?
• Unpaired
Ø What test can be used? • Mann-Whitney U
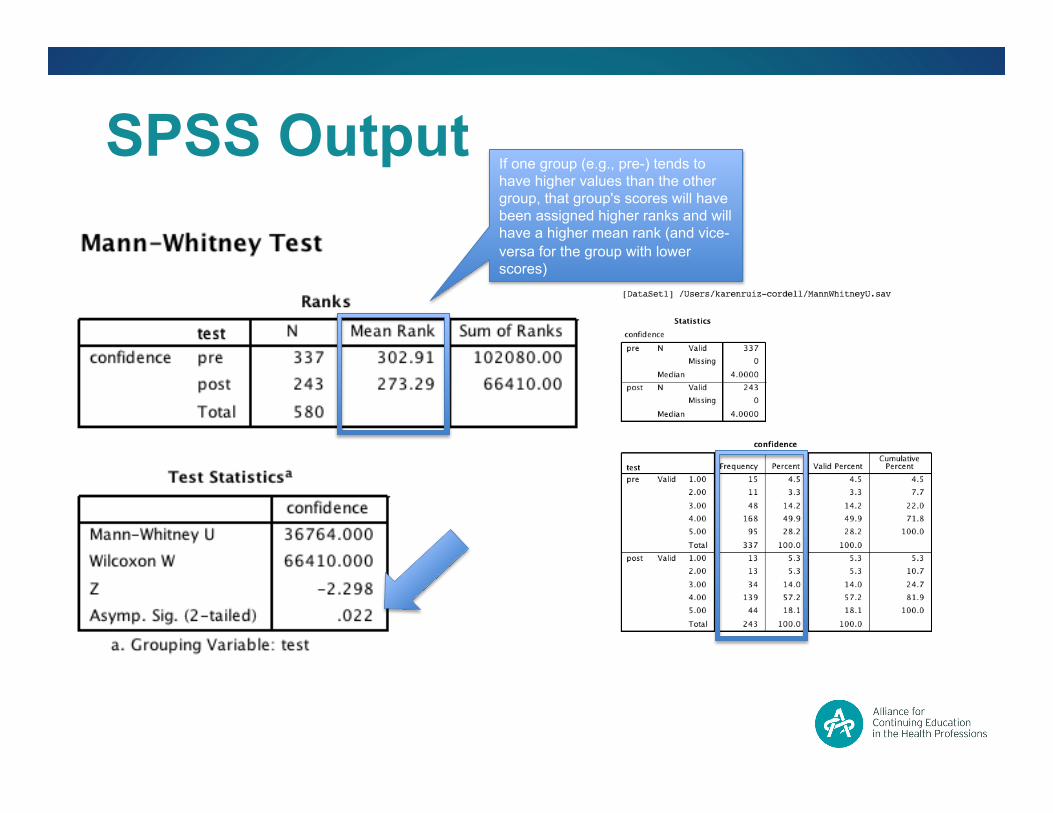
SPSS Output If one group (e.g., pre-) tends to have higher values than the other group, that group's scores will have been assigned higher ranks and will have a higher mean rank (and vice-versa for the group with lower scores)

Case 1 Cont’: Now with matched data
3%
4%
10%
34%
49%
22%
5%
21%
50%
2%
0% 20% 40% 60%
1
2
3
4
5
Pre-Education (N = 226)
Post-Education (N = 226)
Please rate your confidence in using advanced methodologies in outcomes and research design? (1 = not all confident; 5 = completely confident)
• Considerations – Ordinal or categorical
variables? • Ordinal
– Sample size • >5
– Paired or unpaired variables?
• Paired/matched
Ø What test can be used? • Wilcoxon signed-rank
test (or the non-parametric T)

SPSS Output
In other words, it allows you to see how many participants had improved their confidence by post compared to pre-, how
many remained the same, and how many had lesser
confidence.

Case 2 • Considerations
– Question type • Recoding: right/
wrong answers
– Unpaired – Sample size (>5)
Ø Appropriate test? – Chi square
(association)
“Which of the following patient populations with hypercholesterolemia are indicated for the new PCSK9 inhibitor therapies? (Select all that apply)”
64%
75%
40%
60%
80%
% Correct
Pre-Education (N = 567) Post-Education (N = 463)

SPSS Output
Is there a difference
between the actual and expected counts?

Case 2 Cont’d: Now with matched data
• Considerations – Categorical
(dichotomous) – Paired – Sample size
(>5) • Appropriate Test
– McNemar test (t-test)
Which of the following patient populations with hypercholesterolemia are indicated for the new PCSK9 inhibitor therapies? (Select all that apply)
75% 78%
76%
82% 80%
78%
87%
82%
87% 85%
60%
80%
100%
Failed 1 statin Failed 2 statins
Max-tolerated statin
HeFH ASCVD
Pre-Education (N = 418) Post-Education (N = 418)

SPSS Output
Of those who didn’t select this response at pre- 32 (only 31%)
selected it at post-

Advanced Analytics – Predictive modeling

What Does PM Look like?!
• A source is the raw data that you want to use to create a model. Each row represents an instance or field.
• A dataset is a structures version of a source where each field has been processed and serialized according to its type (numeric, categorical, text, date-time, etc.)
• A model represents a set of correlation patterns automatically inferred fro the statistical relationships across the field in your dataset.
• You can use your model to make predictions. That is, to find the category or expected value of the “target” (DV) for new instances.

The software to make it happen…
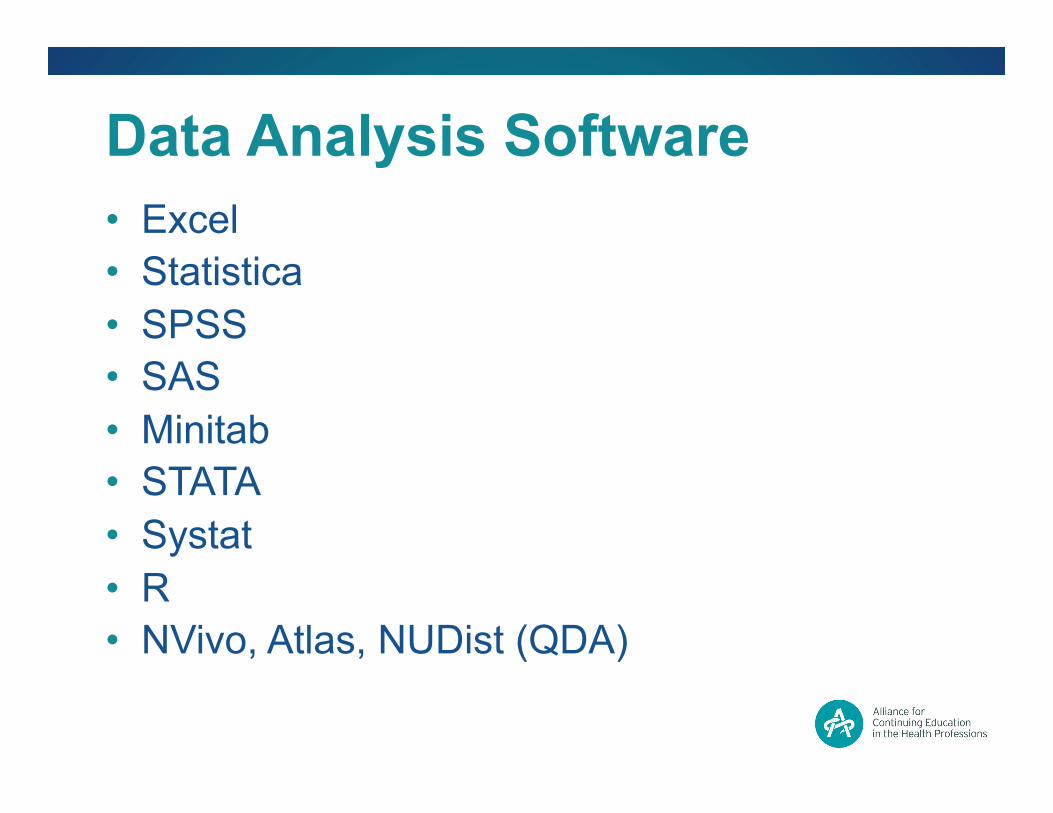
Data Analysis Software • Excel • Statistica • SPSS • SAS • Minitab • STATA • Systat • R • NVivo, Atlas, NUDist (QDA)

Considerations • Use • Type of data (dataset vs. database) • Skill (analyst, programmer, database
architect) • Cost (ranging from FREE to $$$$) • Visualization (graphing) • Programming • Language (R, python, etc.) • Modeling (algorithms)

Free (or almost) & Easy to Use • Graphpad • PSPP (SPSS)
– Download: http://ftp.gnu.org/gnu/pspp/ • BigML
– Data modeling • Infogram
– Simple data, infographics • Statwing
– Stats & visuals with plain language interpretations – Free trial then $50-$100 per/mo
• Tableau Public – Visualizer – Low-cost version ($1k per/yr.)
• QDA Miner lite (QDA) – http://provalisresearch.com/products/qualitative-data-analysis-
software/freeware/

Full List of Stat Packages Analytica - visual analytics and statistics package Angoss - products KnowledgeSEEKER and KnowledgeSTUDIO incorporate several data mining algorithms ASReml – for restricted maximum likelihood analyses BMDP – general statistics package Data Applied – for building statistical models DB Lytix - 800+ in-database models EViews – for econometric analysis FAME (database) – a system for managing time-series databases GAUSS – programming language for statistics Genedata – software solution for integration and interpretation of experimental data in the life science R&D GenStat – general statistics package GLIM (software) – early package for fitting generalized linear models GraphPad InStat – very simple with lots of guidance and explanations GraphPad Prism – biostatistics and nonlinear regression with clear explanations IMSL Numerical Libraries – software library with statistical algorithms JMP (application software) – visual analysis and statistics package LIMDEP – comprehensive statistics and econometrics package LISREL – statistics package used in structural equation modeling Maple – programming language with statistical features Mathematica – a software package with statistical features MATLAB – programming language with statistical features MedCalc – for biomedical sciences Minitab – general statistics package MLwiN – multilevel models (free to UK academics) NAG Numerical Library – comprehensive math and statistics library Neural Designer – commercial deep learning package NCSS – general statistics package NLOGIT – comprehensive statistics and econometrics package NMath Stats – statistical package for .NET Framework O-Matrix – programming language XploRe

Full List of Stat Packages OriginPro – statistics and graphing, programming access to NAG library PASS – power and sample size software from NCSS Partek – general statistics package with specific applications for genomic, HTS, and QSAR data Plotly – plotting library and styling interface for analyzing data and creating browser-based graphs. Available for R, Python, MATLAB, Julia, and Perl Primer-E Primer – environmental and ecological specific PV-WAVE – programming language comprehensive data analysis and visualization with IMSL statistical package Qlucore Omics Explorer - interactive and visual data analysis software Quantum Programming Language – part of the SPSS MR product line, mostly for data validation and tabulation in Marketing and Opinion Research RapidMiner – machine learning toolbox Regression Analysis of Time Series (RATS) – comprehensive econometric analysis package SAS (software) – comprehensive statistical package SHAZAM (Econometrics and Statistics Software) – comprehensive econometrics and statistics package Simul - econometric tool for multidimensional (multi-sectoral, multi-regional) modeling SigmaStat – package for group analysis SmartPLS - statistics package used in partial least squares path modeling (PLS) and PLS-based structural equation modeling SOCR – online tools for teaching statistics and probability theory Speakeasy (computational environment) – numerical computational environment and programming language with many statistical and econometric analysis features SPSS Modeler – comprehensive data mining and text analytics workbench SPSS Statistics – comprehensive statistics package that stands for "Statistical Package for the Social Sciences" Stata – comprehensive statistics package Statgraphics – general statistics package to include cloud computing and Six Sigma for use in business development, process improvement, data imaging and statistical analysis. STATISTICA – comprehensive statistics package StatsDirect – statistics package designed for biomedical, public health and general health science uses StatXact – package for exact nonparametric and parametric statistics Systat – general statistics package SuperCROSS - comprehensive statistics package with ad-hoc, cross tabulation analysis S-PLUS – general statistics package Unistat – general statistics package that can also work as Excel add-in The Unscrambler - free-to-try commercial multivariate analysis software for Windows Wolfram Language[2] - the computer language that evolved from the program Mathematica. It has similar statistical capabilities as Mathematica. World Programming System (WPS) – statistical package that supports the SAS language

Key Takeaways & Discussion