Embed Size (px)
Citation preview

Confidential. Not to be copied, distributed, or reproduced without prior approval.© 2017 Baker Hughes, a GE company, LLC
- All rights reserved.
Advanced methodologies for fluidcharacterization and saturationevaluation behind Casing
[email protected] Petrophysical Society – Resistivity Free Saturation Seminar13 December 2018

2
©20
15B
aker
Hug
hes
Inco
rpor
ated
.All
Rig
hts
Res
erve
d.
Agenda
■ Cased Hole Formation Evaluation
– Standard Conventional PN logging
– Sigma
– C/O
– Monte Carlo Emulation approach: Reservoir Characterization
– Advanced pulsed neutron technologies
– Gas quantification
– Variables in modelling
– Pressure depletion evaluation
– Oil quantification from PNC data (by pass C/O)
– Three-phases Saturation analysis
4
©20
15B
aker
Hug
hes
Inco
rpor
ated
.All
Rig
hts
Res
erve
d.
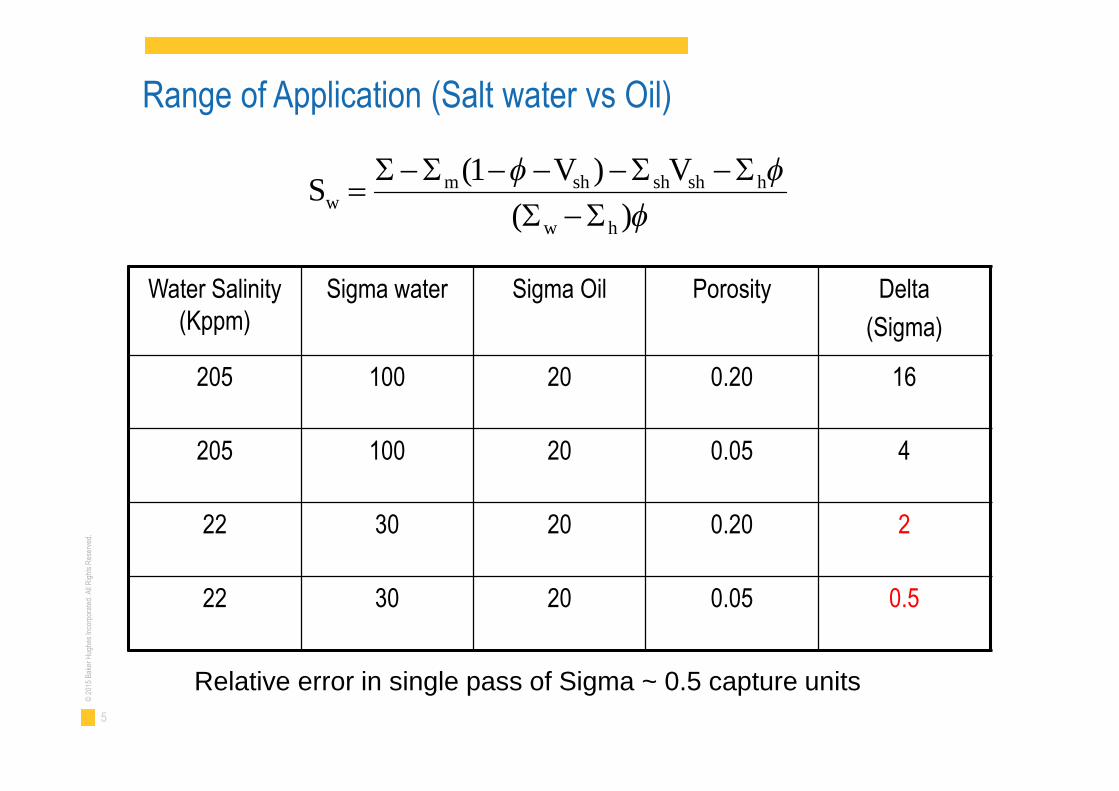
Application
Water saturation in wellswhere water salinity ishigh and known
PNC Sigma Logging
)(
)1(
hw
hshshshmw
VVS
5
©20
15B
aker
Hug
hes
Inco
rpor
ated
.All
Rig
hts
Res
erve
d.
Range of Application (Salt water vs Oil)
Water Salinity(Kppm)
Sigma water Sigma Oil Porosity Delta
(Sigma)
205 100 20 0.20 16
205 100 20 0.05 4
22 30 20 0.20 2
22 30 20 0.05 0.5
)(
)1(
hw
hshshshmw
VVS
Relative error in single pass of Sigma ~ 0.5 capture units
6
©20
15B
aker
Hug
hes
Inco
rpor
ated
.All
Rig
hts
Res
erve
d.
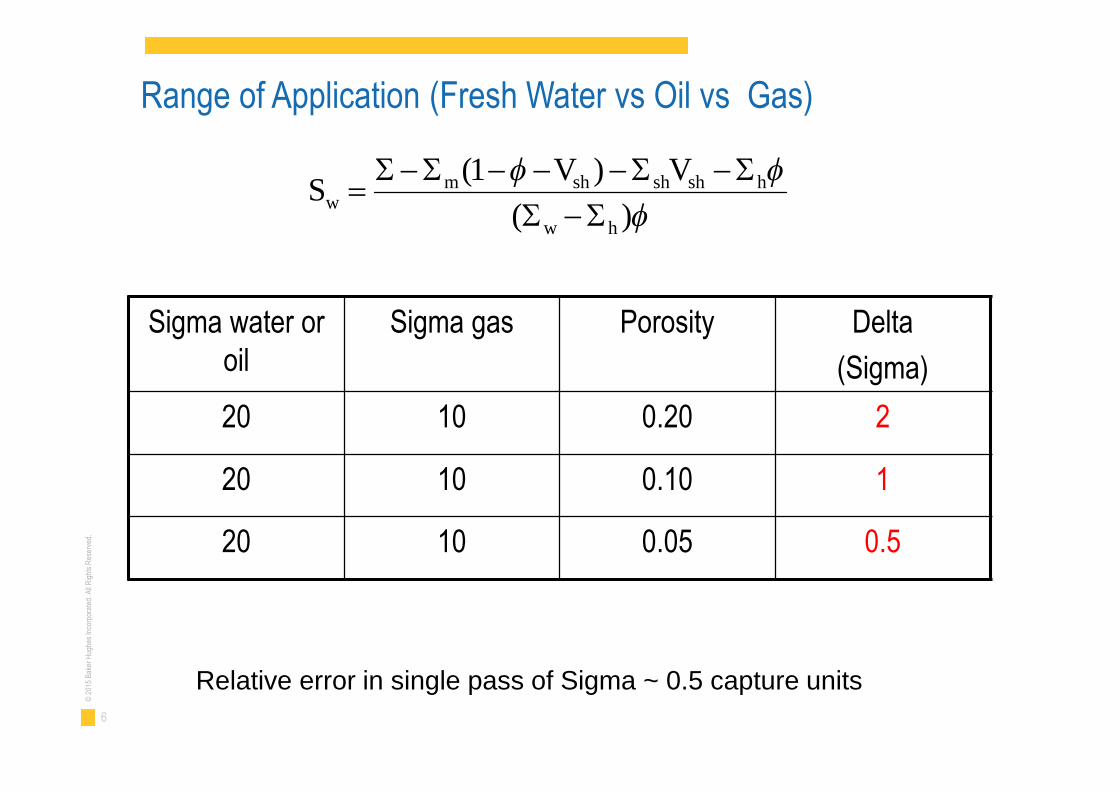
Range of Application (Fresh Water vs Oil vs Gas)
Sigma water oroil
Sigma gas Porosity Delta
(Sigma)
20 10 0.20 2
20 10 0.10 1
20 10 0.05 0.5
)(
)1(
hw
hshshshmw
VVS
Relative error in single pass of Sigma ~ 0.5 capture units
7
©20
15B
aker
Hug
hes
Inco
rpor
ated
.All
Rig
hts
Res
erve
d.
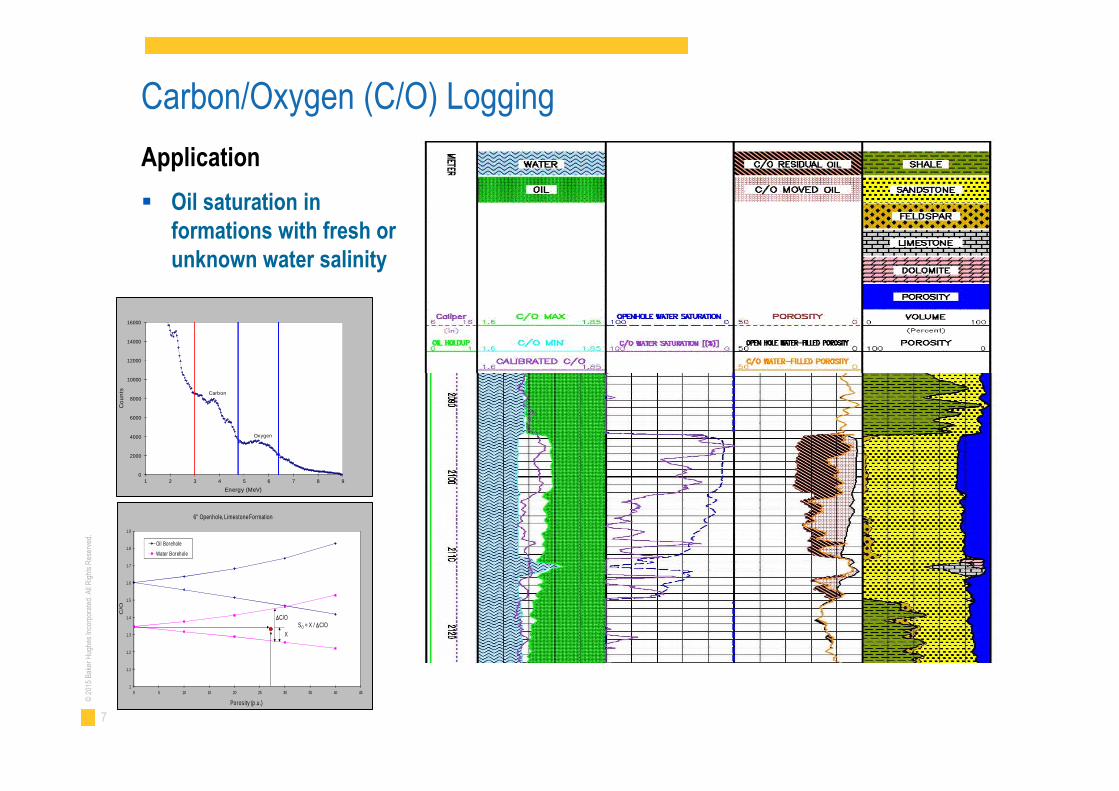
Application
Oil saturation informations with fresh orunknown water salinity
Carbon/Oxygen (C/O) Logging
0
2000
4000
6000
8000
10000
12000
14000
16000
1 2 3 4 5 6 7 8 9
Co
un
ts
Energy (MeV)
Carbon
Oxygen
1
1.1
1.2
1.3
1.4
1.5
1.6
1.7
1.8
1.9
0 5 10 15 20 25 30 35 40 45
C/O
Porosity (p.u.)
6" Openhole, LimestoneFormation
Oil Borehole
Water Borehole
X
DC/OSO = X / DC/O
8
©20
15B
aker
Hug
hes
Inco
rpor
ated
.All
Rig
hts
Res
erve
d.
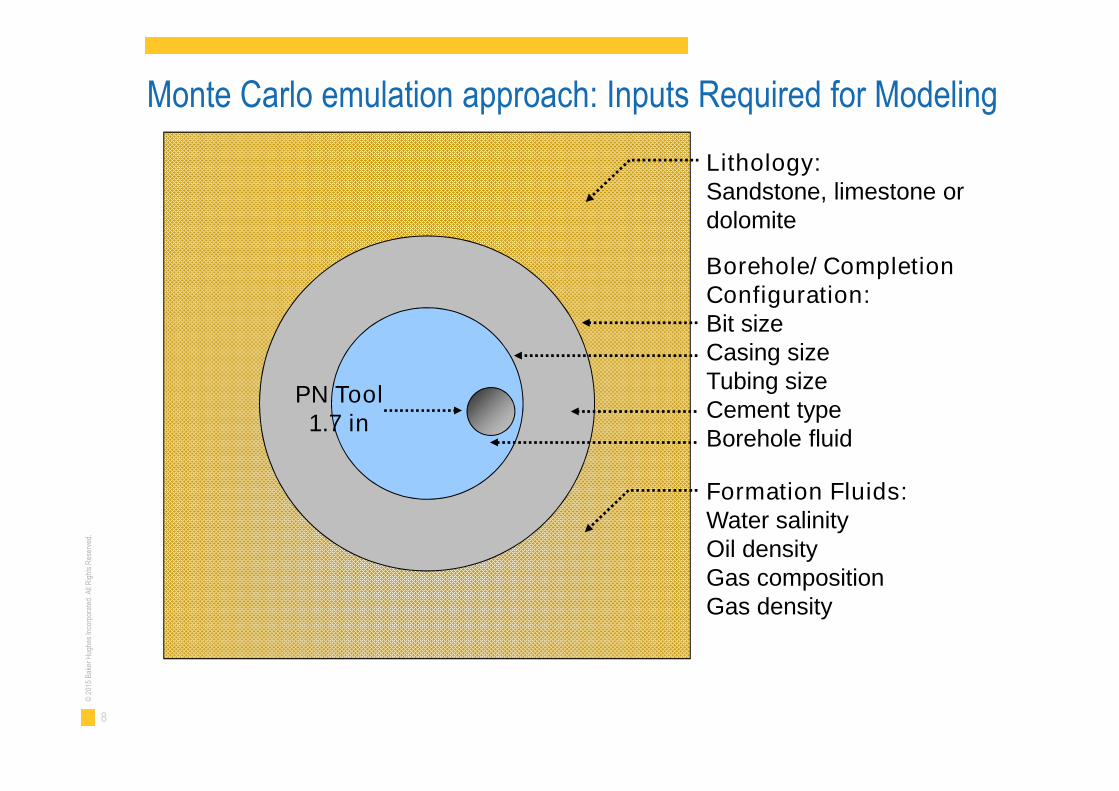
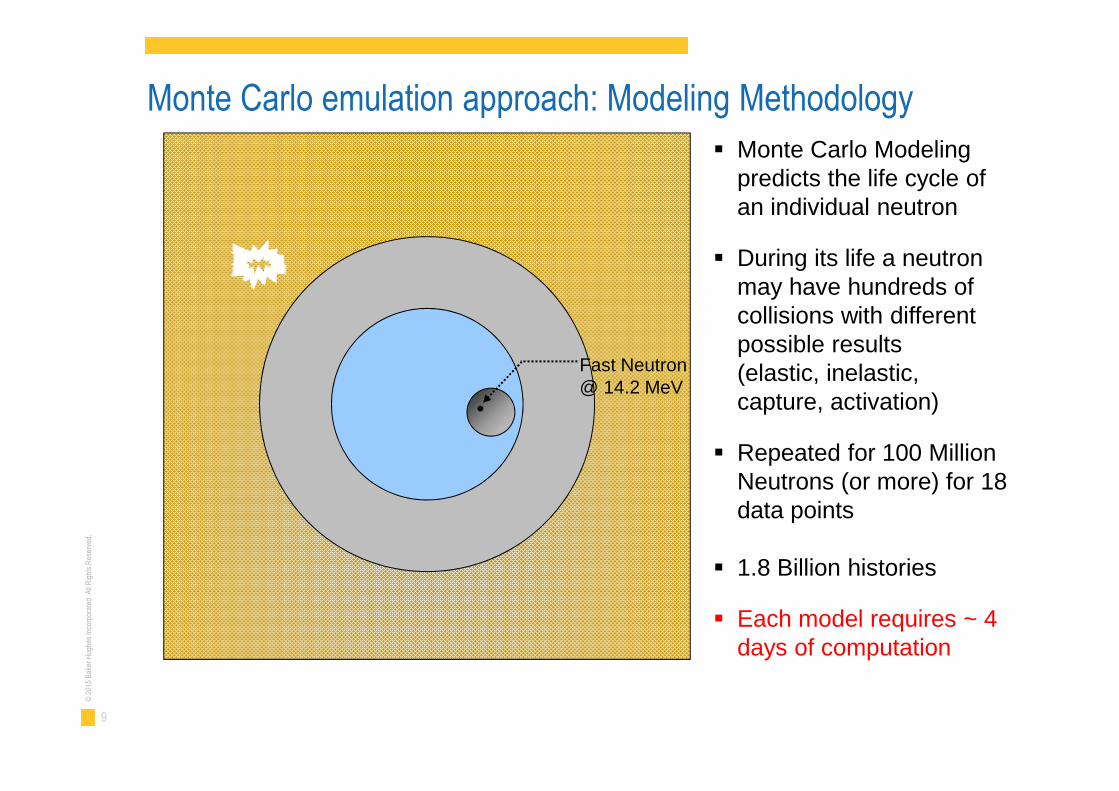
Monte Carlo emulation approach: Inputs Required for Modeling
Lithology:Sandstone, limestone ordolomite
Borehole/ CompletionConfiguration:Bit sizeCasing sizeTubing sizeCement typeBorehole fluid
Formation Fluids:Water salinityOil densityGas compositionGas density
PN Tool1.7 in
9
©20
15B
aker
Hug
hes
Inco
rpor
ated
.All
Rig
hts
Res
erve
d.
Fast Neutron@ 14.2 MeV
Monte Carlo Modelingpredicts the life cycle ofan individual neutron
During its life a neutronmay have hundreds ofcollisions with differentpossible results(elastic, inelastic,capture, activation)
Repeated for 100 MillionNeutrons (or more) for 18data points
1.8 Billion histories
Each model requires ~ 4days of computation
Monte Carlo emulation approach: Modeling Methodology
11
©20
15B
aker
Hug
hes
Inco
rpor
ated
.All
Rig
hts
Res
erve
d.
Agenda
■ Cased Hole Formation Evaluation
– Standard Conventional PN logging
– Sigma
– C/O
– Monte Carlo Emulation approach: Reservoir Characterization
– Advanced pulsed neutron technologies
– Gas quantification
– Variables in modelling
– Pressure depletion evaluation
– Oil quantification from PNC data (by pass C/O)
– Three-phases Saturation analysis
12
©20
15B
aker
Hug
hes
Inco
rpor
ated
.All
Rig
hts
Res
erve
d.
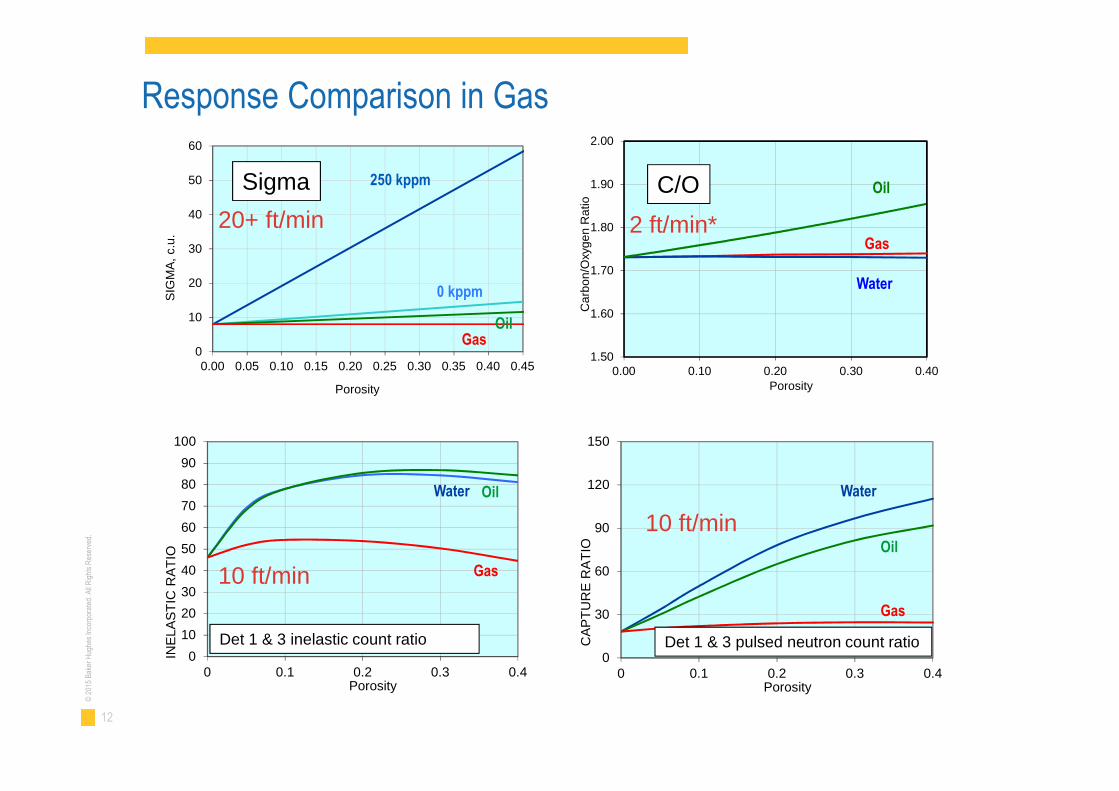
Response Comparison in Gas
0
10
20
30
40
50
60
0.00 0.05 0.10 0.15 0.20 0.25 0.30 0.35 0.40 0.45
SIG
MA
,c.u
.
Porosity
250 kppm
0 kppm
GasOil
0
10
20
30
40
50
60
70
80
90
100
0 0.1 0.2 0.3 0.4
INE
LA
ST
ICR
AT
IO
Porosity
0
30
60
90
120
150
0 0.1 0.2 0.3 0.4
CA
PT
UR
ER
AT
IO
Porosity
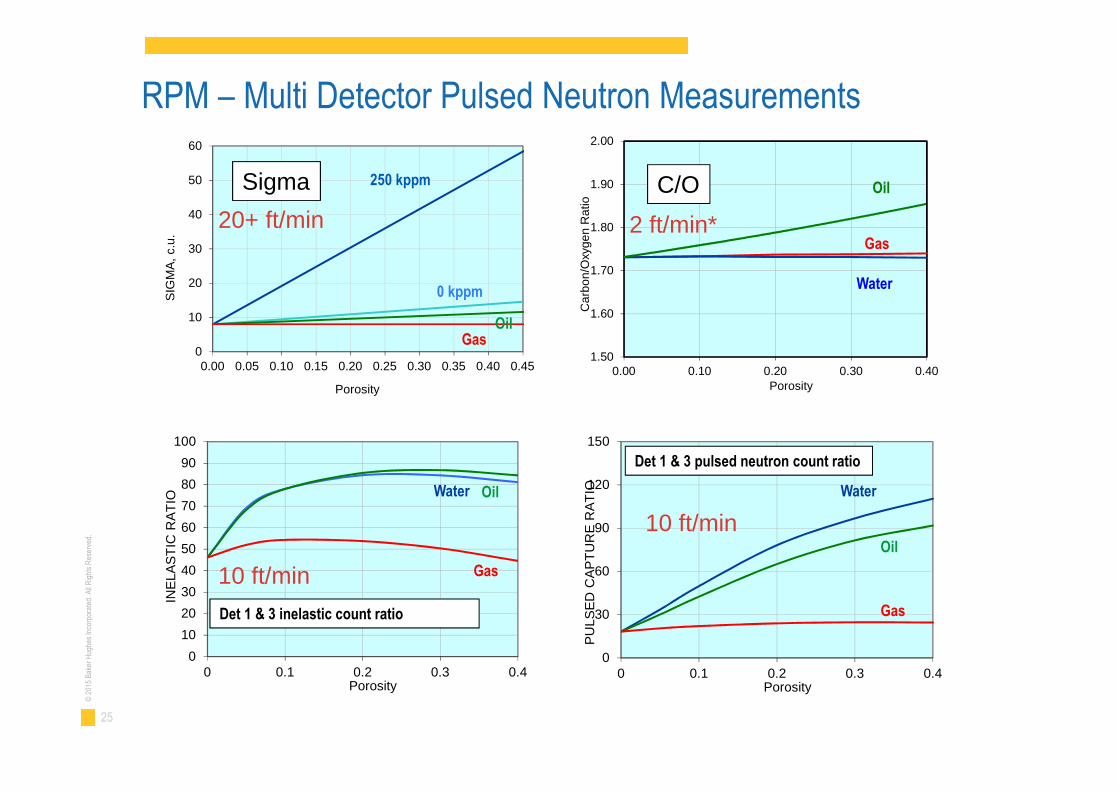
Sigma
Oil
Oil
Water Water
Gas
Gas
20+ ft/min
10 ft/min
10 ft/min
1.50
1.60
1.70
1.80
1.90
2.00
0.00 0.10 0.20 0.30 0.40
Ca
rbo
n/O
xyg
en
Ra
tio
Porosity
Gas
Oil
Water
C/O
2 ft/min*
Det 1 & 3 inelastic count ratio Det 1 & 3 pulsed neutron count ratio
13
©20
15B
aker
Hug
hes
Inco
rpor
ated
.All
Rig
hts
Res
erve
d.
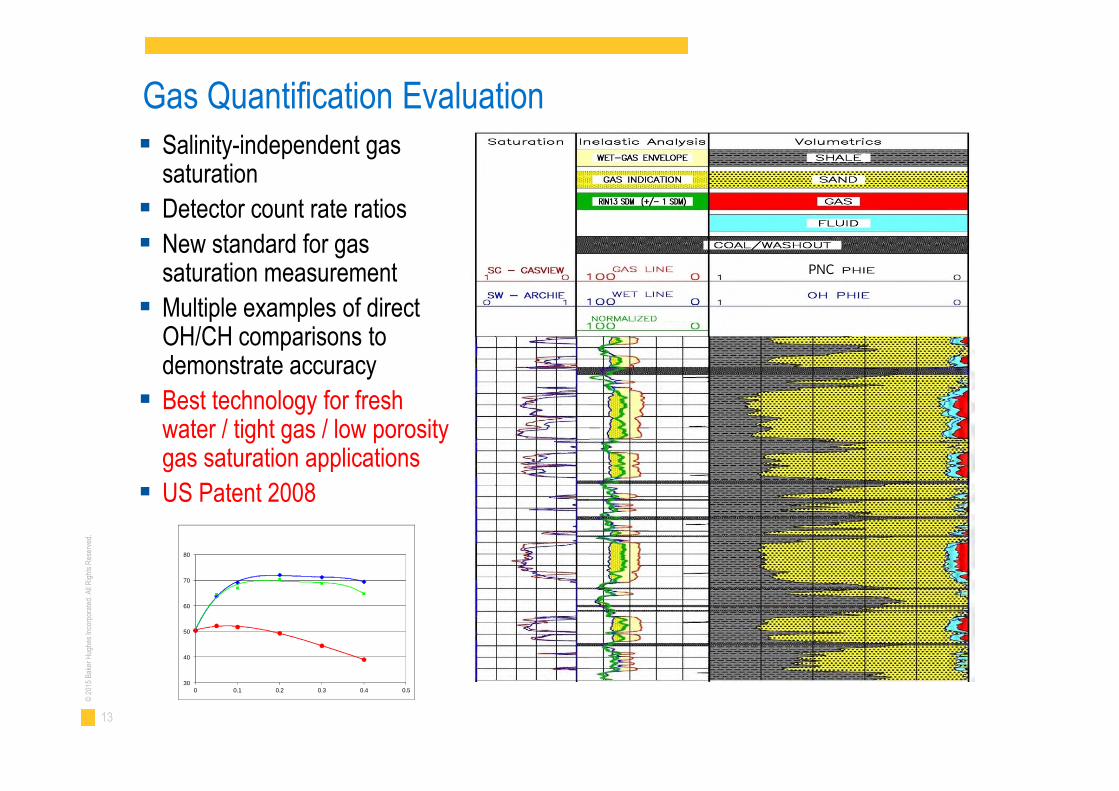
Salinity-independent gassaturation
Detector count rate ratios
New standard for gassaturation measurement
Multiple examples of directOH/CH comparisons todemonstrate accuracy
Best technology for freshwater / tight gas / low porositygas saturation applications
US Patent 2008
Gas Quantification Evaluation
30
40
50
60
70
80
0 0.1 0.2 0.3 0.4 0.5
RIN13 Response
PNC
14
©20
15B
aker
Hug
hes
Inco
rpor
ated
.All
Rig
hts
Res
erve
d.
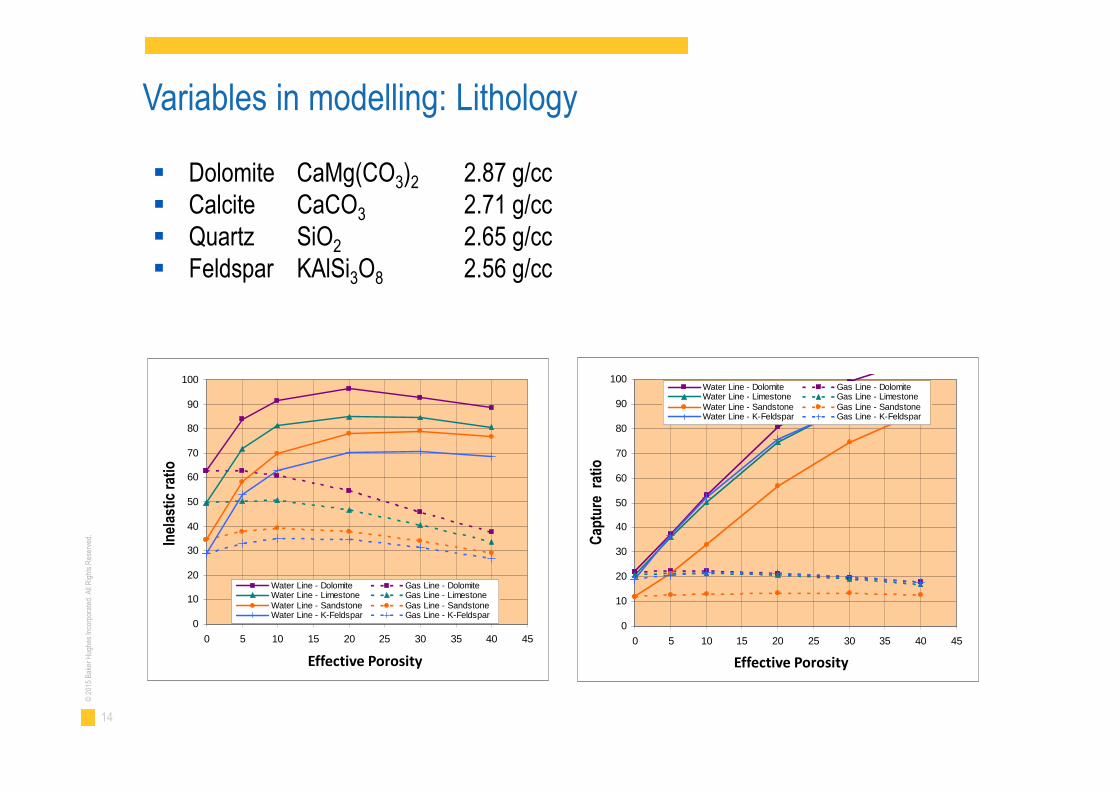
Variables in modelling: Lithology
0
10
20
30
40
50
60
70
80
90
100
0 5 10 15 20 25 30 35 40 45
Porosity
RIN
13
Water Line - Dolomite Gas Line - DolomiteWater Line - Limestone Gas Line - LimestoneWater Line - Sandstone Gas Line - SandstoneWater Line - K-Feldspar Gas Line - K-Feldspar
0
10
20
30
40
50
60
70
80
90
100
0 5 10 15 20 25 30 35 40 45
Porosity
RA
TO
13
Water Line - Dolomite Gas Line - DolomiteWater Line - Limestone Gas Line - LimestoneWater Line - Sandstone Gas Line - SandstoneWater Line - K-Feldspar Gas Line - K-Feldspar
Dolomite CaMg(CO3)2 2.87 g/cc Calcite CaCO3 2.71 g/cc Quartz SiO2 2.65 g/cc Feldspar KAlSi3O8 2.56 g/cc
Inel
astic
ratio
Cap
ture
ratio
Effective Porosity Effective Porosity
15
©20
15B
aker
Hug
hes
Inco
rpor
ated
.All
Rig
hts
Res
erve
d.
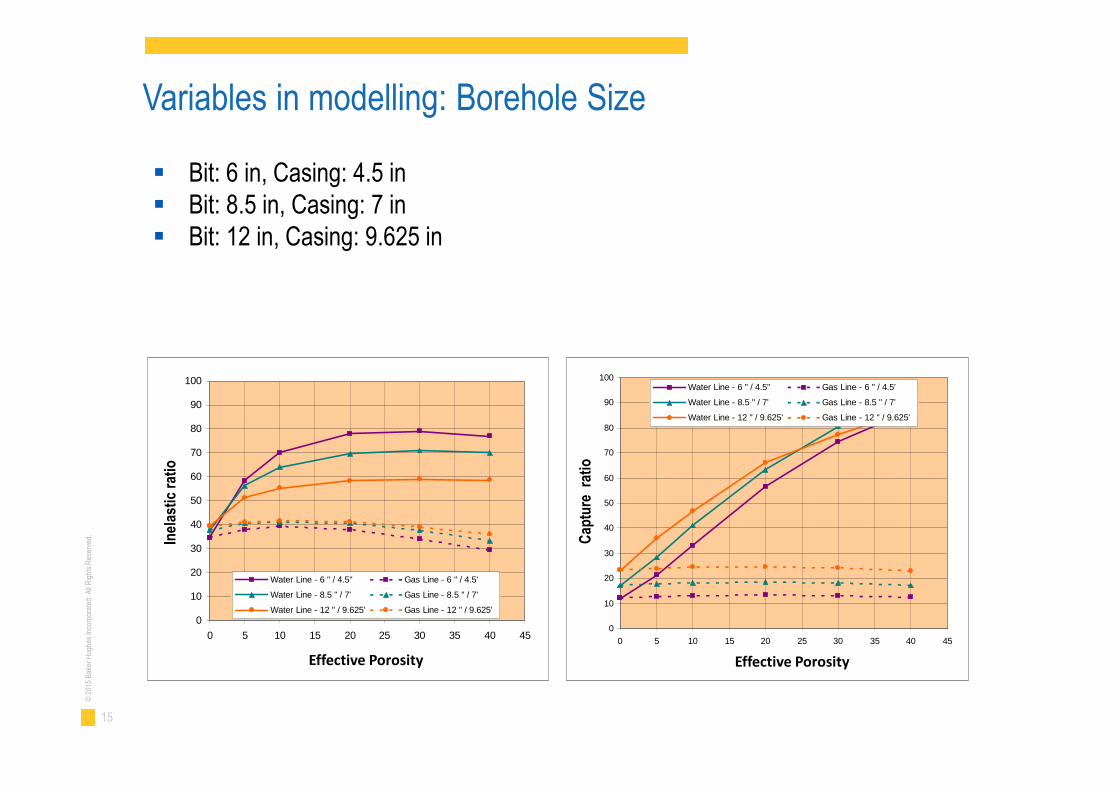
Variables in modelling: Borehole Size
0
10
20
30
40
50
60
70
80
90
100
0 5 10 15 20 25 30 35 40 45
Porosity
RIN
13
Water Line - 6 '' / 4.5'' Gas Line - 6 '' / 4.5'
Water Line - 8.5 '' / 7' Gas Line - 8.5 '' / 7'
Water Line - 12 '' / 9.625' Gas Line - 12 '' / 9.625'
0
10
20
30
40
50
60
70
80
90
100
0 5 10 15 20 25 30 35 40 45
Porosity
RA
TO
13
Water Line - 6 '' / 4.5'' Gas Line - 6 '' / 4.5'
Water Line - 8.5 '' / 7' Gas Line - 8.5 '' / 7'
Water Line - 12 '' / 9.625' Gas Line - 12 '' / 9.625'
Bit: 6 in, Casing: 4.5 in Bit: 8.5 in, Casing: 7 in Bit: 12 in, Casing: 9.625 in
Inel
astic
ratio
Cap
ture
ratio
Effective Porosity Effective Porosity
16
©20
15B
aker
Hug
hes
Inco
rpor
ated
.All
Rig
hts
Res
erve
d.
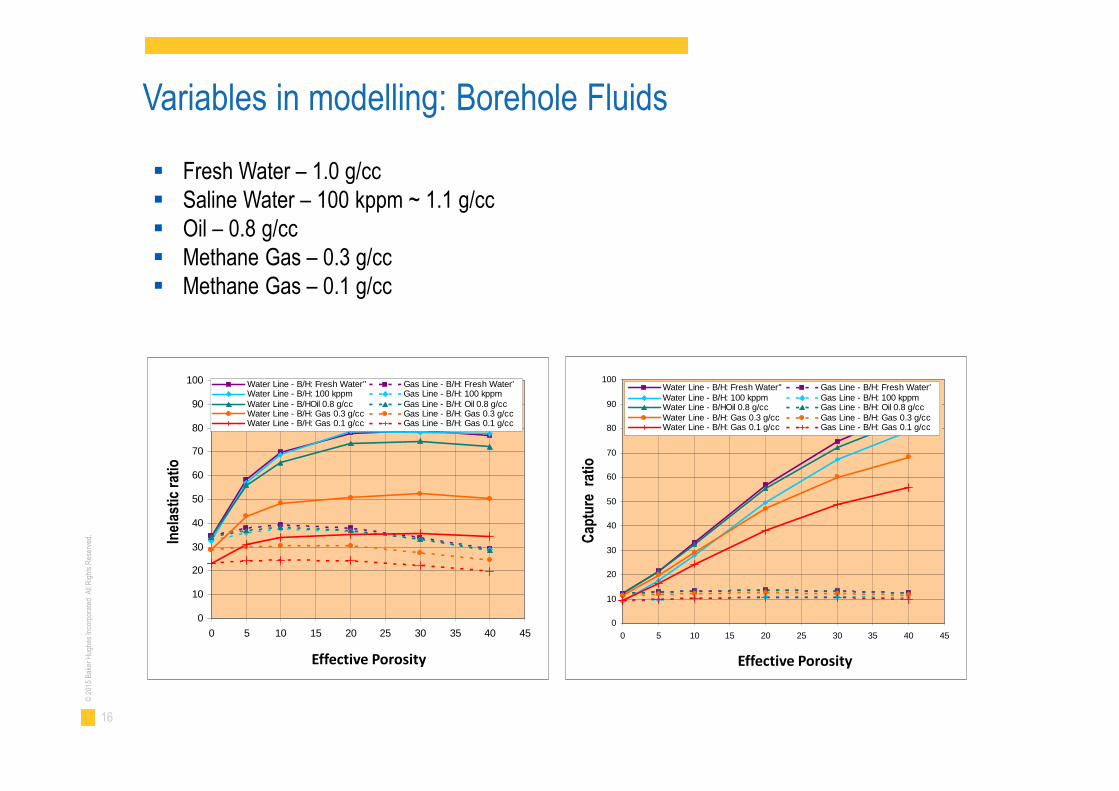
Variables in modelling: Borehole Fluids
0
10
20
30
40
50
60
70
80
90
100
0 5 10 15 20 25 30 35 40 45
Porosity
RIN
13
Water Line - B/H: Fresh Water'' Gas Line - B/H: Fresh Water'Water Line - B/H: 100 kppm Gas Line - B/H: 100 kppmWater Line - B/HOil 0.8 g/cc Gas Line - B/H: Oil 0.8 g/ccWater Line - B/H: Gas 0.3 g/cc Gas Line - B/H: Gas 0.3 g/ccWater Line - B/H: Gas 0.1 g/cc Gas Line - B/H: Gas 0.1 g/cc
0
10
20
30
40
50
60
70
80
90
100
0 5 10 15 20 25 30 35 40 45
Porosity
RA
TO
13
Water Line - B/H: Fresh Water'' Gas Line - B/H: Fresh Water'Water Line - B/H: 100 kppm Gas Line - B/H: 100 kppmWater Line - B/HOil 0.8 g/cc Gas Line - B/H: Oil 0.8 g/ccWater Line - B/H: Gas 0.3 g/cc Gas Line - B/H: Gas 0.3 g/ccWater Line - B/H: Gas 0.1 g/cc Gas Line - B/H: Gas 0.1 g/cc
Fresh Water – 1.0 g/cc Saline Water – 100 kppm ~ 1.1 g/cc Oil – 0.8 g/cc Methane Gas – 0.3 g/cc Methane Gas – 0.1 g/cc
Inel
astic
ratio
Cap
ture
ratio
Effective Porosity Effective Porosity
17
©20
15B
aker
Hug
hes
Inco
rpor
ated
.All
Rig
hts
Res
erve
d.
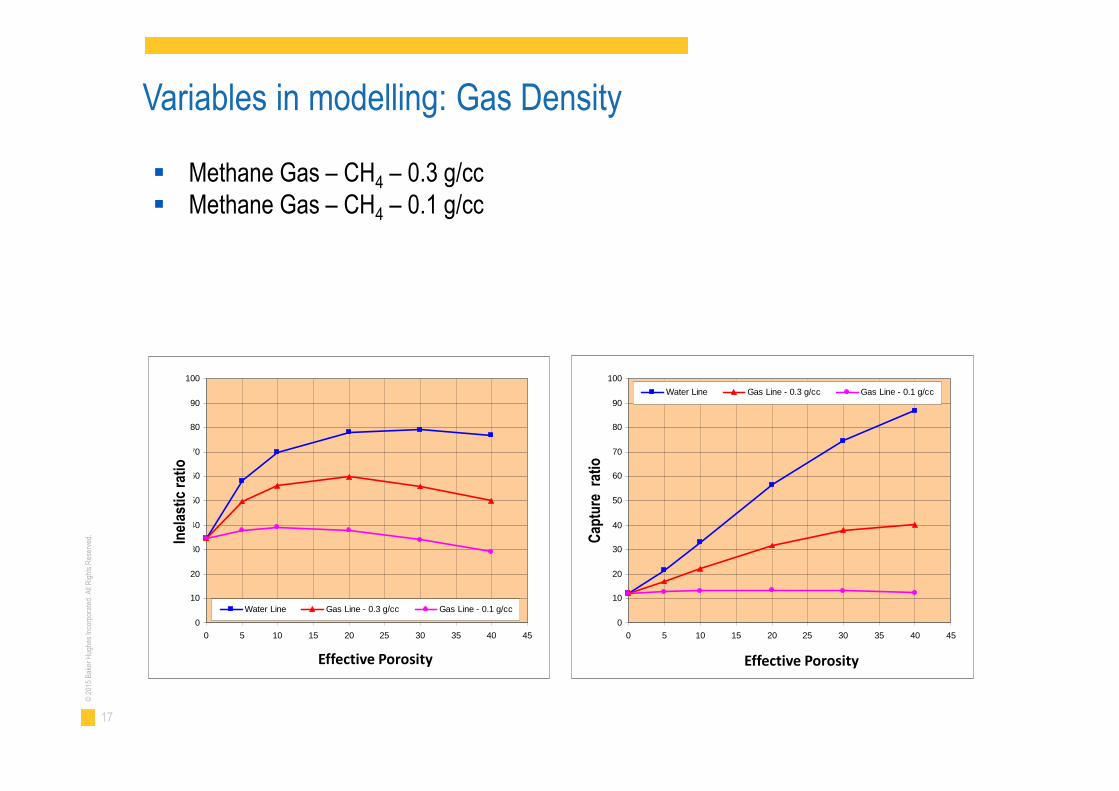
Variables in modelling: Gas Density
0
10
20
30
40
50
60
70
80
90
100
0 5 10 15 20 25 30 35 40 45
Porosity
RIN
13
Water Line Gas Line - 0.3 g/cc Gas Line - 0.1 g/cc
0
10
20
30
40
50
60
70
80
90
100
0 5 10 15 20 25 30 35 40 45
Porosity
RA
TO
13
Water Line Gas Line - 0.3 g/cc Gas Line - 0.1 g/cc
Methane Gas – CH4 – 0.3 g/cc Methane Gas – CH4 – 0.1 g/cc
Inel
astic
ratio
Cap
ture
ratio
Effective Porosity Effective Porosity
18
©20
15B
aker
Hug
hes
Inco
rpor
ated
.All
Rig
hts
Res
erve
d.
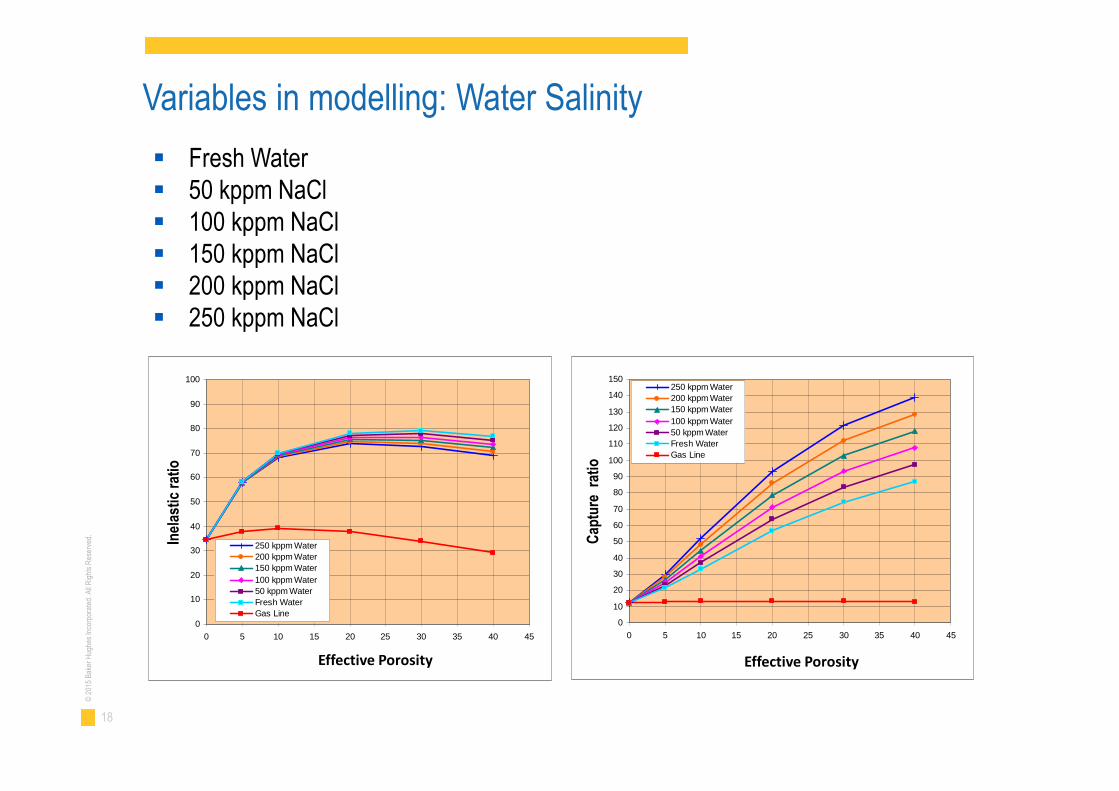
Variables in modelling: Water Salinity
0
10
20
30
40
50
60
70
80
90
100
110
120
130
140
150
0 5 10 15 20 25 30 35 40 45
Porosity
RA
TO
13
250 kppm Water
200 kppm Water
150 kppm Water
100 kppm Water
50 kppm Water
Fresh Water
Gas Line
0
10
20
30
40
50
60
70
80
90
100
0 5 10 15 20 25 30 35 40 45
Porosity
RIN
13
250 kppm Water
200 kppm Water
150 kppm Water
100 kppm Water
50 kppm Water
Fresh Water
Gas Line
Fresh Water 50 kppm NaCl 100 kppm NaCl 150 kppm NaCl 200 kppm NaCl 250 kppm NaCl
Effective Porosity Effective Porosity
Inel
astic
ratio
Cap
ture
ratio
19
©20
15B
aker
Hug
hes
Inco
rpor
ated
.All
Rig
hts
Res
erve
d.
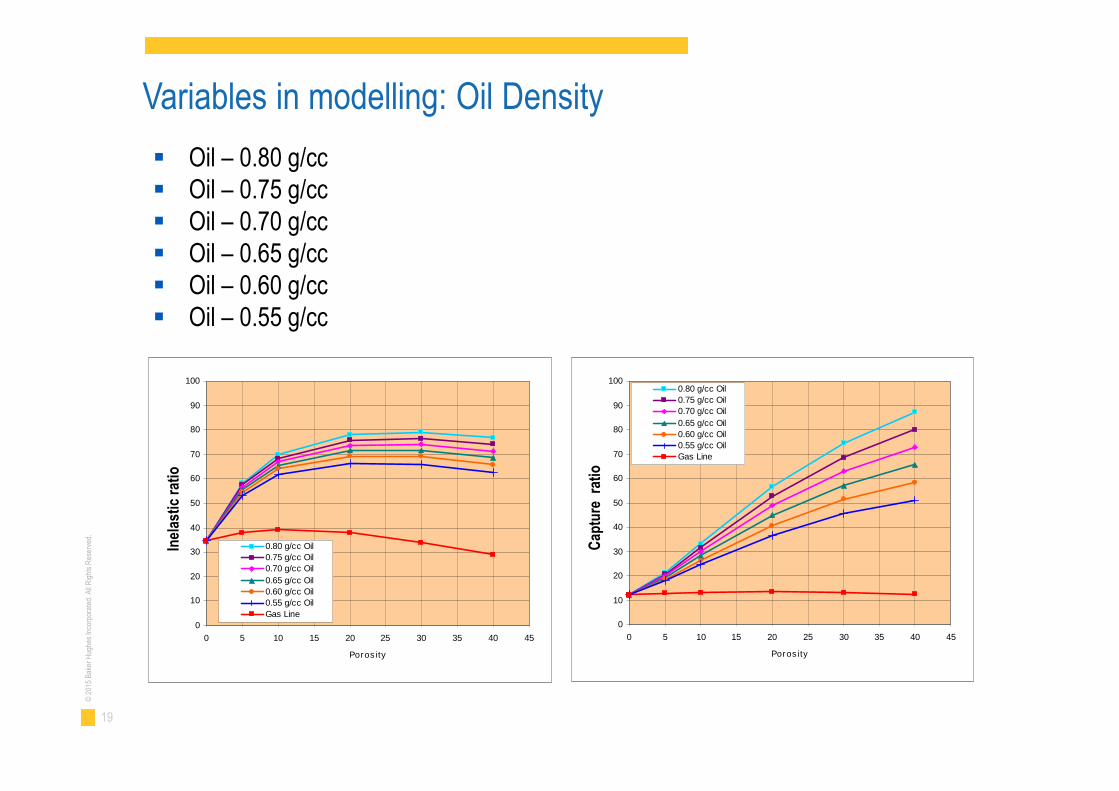
Variables in modelling: Oil Density
0
10
20
30
40
50
60
70
80
90
100
0 5 10 15 20 25 30 35 40 45
Porosity
RIN
13
0.80 g/cc Oil
0.75 g/cc Oil
0.70 g/cc Oil
0.65 g/cc Oil
0.60 g/cc Oil
0.55 g/cc Oil
Gas Line0
10
20
30
40
50
60
70
80
90
100
0 5 10 15 20 25 30 35 40 45
Porosity
RA
TO
13
0.80 g/cc Oil
0.75 g/cc Oil
0.70 g/cc Oil
0.65 g/cc Oil
0.60 g/cc Oil
0.55 g/cc Oil
Gas Line
Oil – 0.80 g/cc Oil – 0.75 g/cc Oil – 0.70 g/cc Oil – 0.65 g/cc Oil – 0.60 g/cc Oil – 0.55 g/cc
Inel
astic
ratio
Cap
ture
ratio
20
©20
15B
aker
Hug
hes
Inco
rpor
ated
.All
Rig
hts
Res
erve
d.
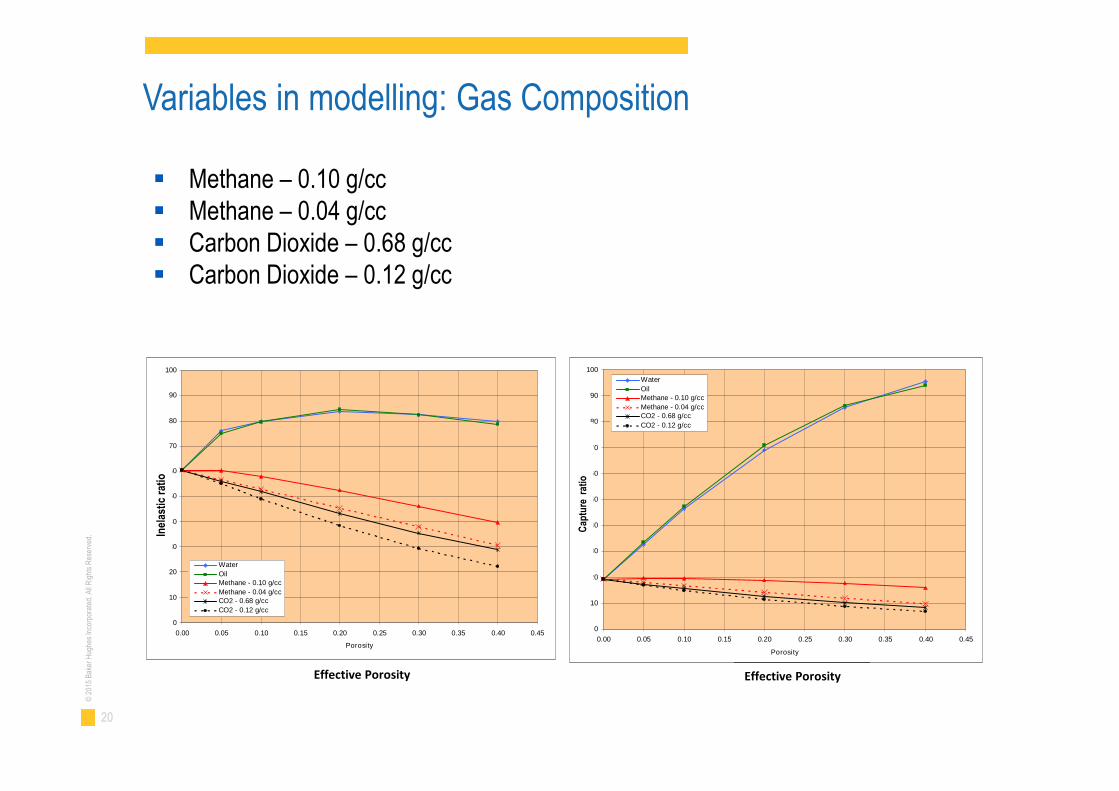
Variables in modelling: Gas Composition
0
10
20
30
40
50
60
70
80
90
100
0.00 0.05 0.10 0.15 0.20 0.25 0.30 0.35 0.40 0.45
Porosity
RA
TO
13
Water
OilMethane - 0.10 g/cc
Methane - 0.04 g/ccCO2 - 0.68 g/cc
CO2 - 0.12 g/cc
0
10
20
30
40
50
60
70
80
90
100
0.00 0.05 0.10 0.15 0.20 0.25 0.30 0.35 0.40 0.45
Porosity
RIN
13
Water
OilMethane - 0.10 g/cc
Methane - 0.04 g/ccCO2 - 0.68 g/cc
CO2 - 0.12 g/cc
Methane – 0.10 g/cc Methane – 0.04 g/cc Carbon Dioxide – 0.68 g/cc Carbon Dioxide – 0.12 g/cc
Effective Porosity Effective Porosity
Inel
astic
ratio
Cap
ture
ratio
21
©20
15B
aker
Hug
hes
Inco
rpor
ated
.All
Rig
hts
Res
erve
d.
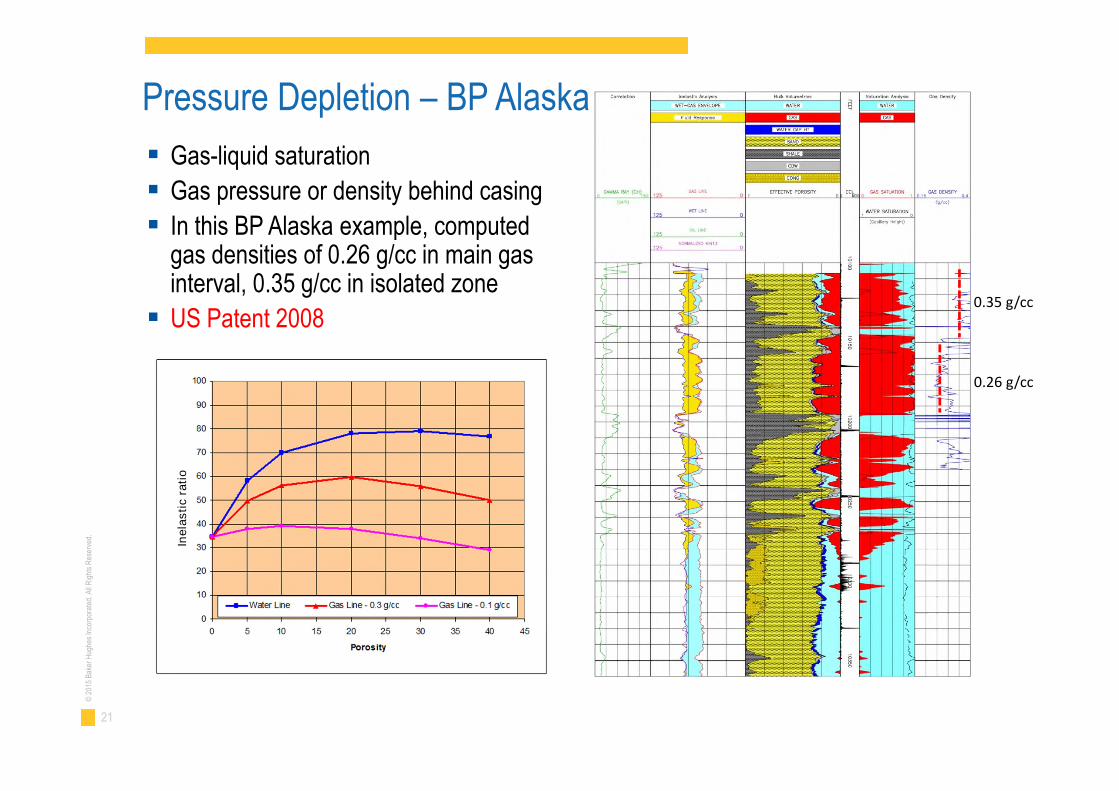
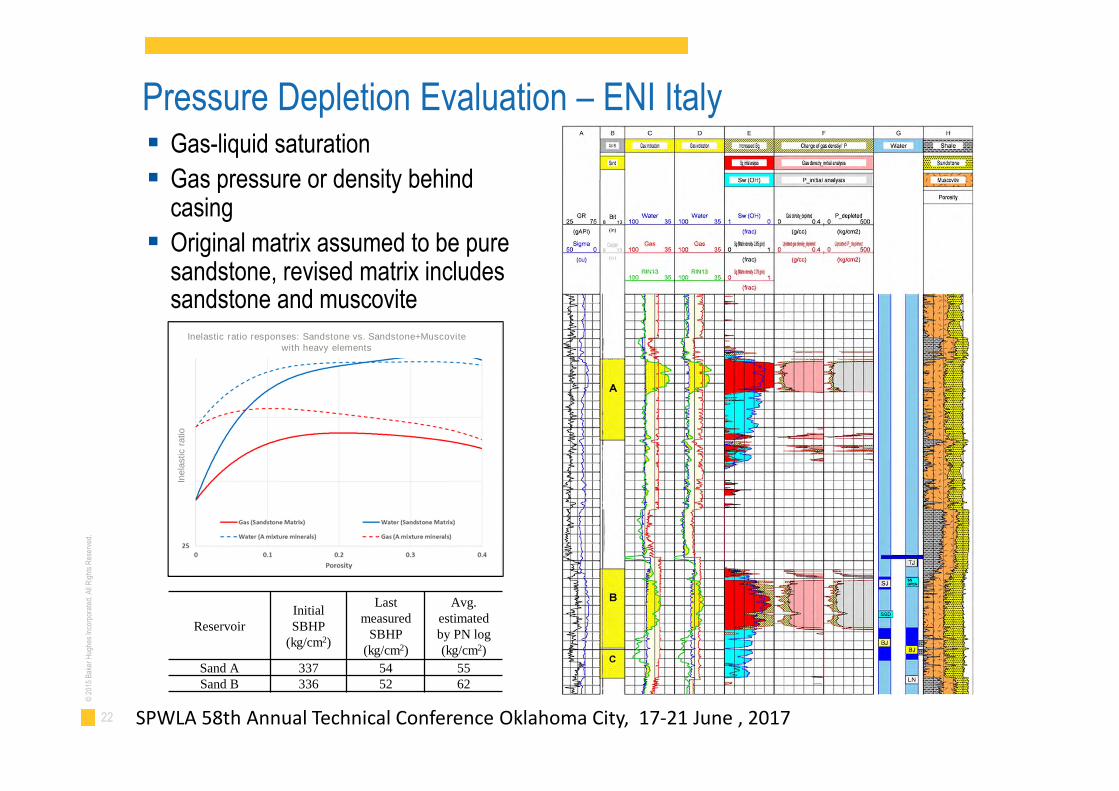
Pressure Depletion – BP Alaska
Gas-liquid saturation
Gas pressure or density behind casing
In this BP Alaska example, computedgas densities of 0.26 g/cc in main gasinterval, 0.35 g/cc in isolated zone
US Patent 20080.35 g/cc
0.26 g/cc
Ine
las
tic
rati
o
22
©20
15B
aker
Hug
hes
Inco
rpor
ated
.All
Rig
hts
Res
erve
d.
ReservoirInitialSBHP
(kg/cm2)
Lastmeasured
SBHP(kg/cm2)
Avg.estimatedby PN log(kg/cm2)
Sand A 337 54 55Sand B 336 52 62
Gas-liquid saturation
Gas pressure or density behindcasing
Original matrix assumed to be puresandstone, revised matrix includessandstone and muscovite
Pressure Depletion Evaluation – ENI Italy
SPWLA 58th Annual Technical Conference Oklahoma City, 17-21 June , 2017
Inela
stic
ratio
Inelastic ratio responses: Sandstone vs. Sandstone+Muscovitewith heavy elements
23
©20
15B
aker
Hug
hes
Inco
rpor
ated
.All
Rig
hts
Res
erve
d.
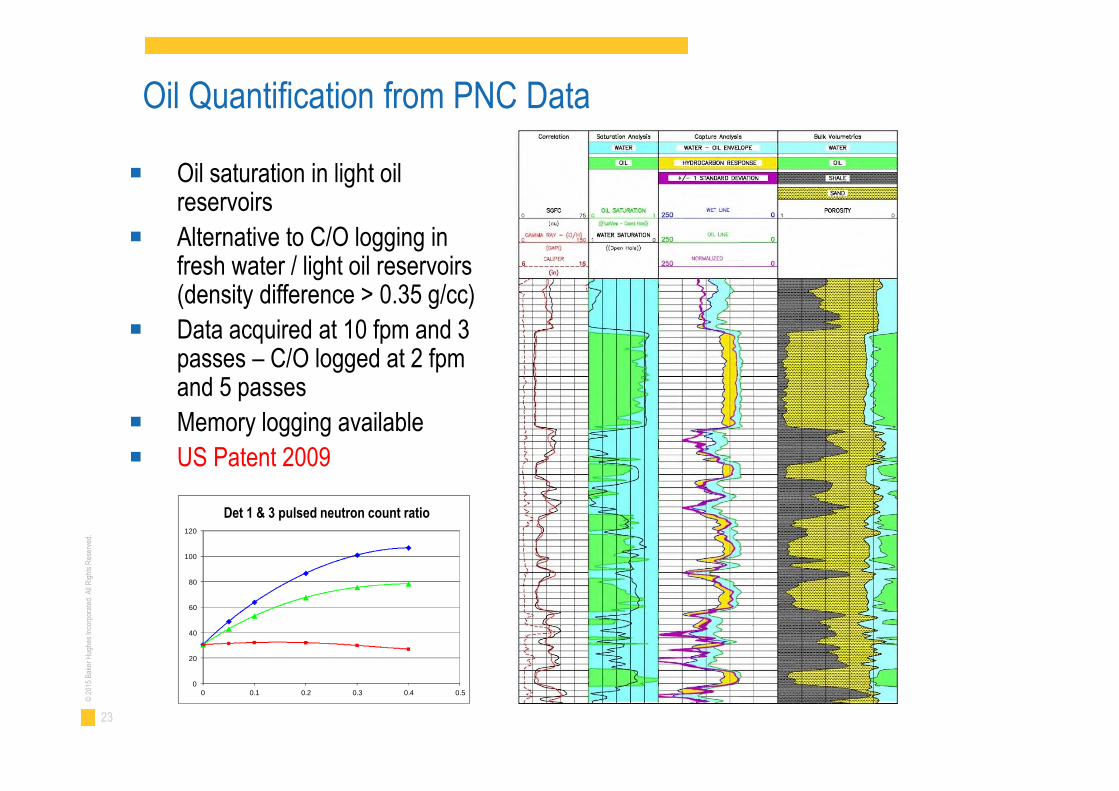
Oil Quantification from PNC Data
■ Oil saturation in light oilreservoirs
■ Alternative to C/O logging infresh water / light oil reservoirs(density difference > 0.35 g/cc)
■ Data acquired at 10 fpm and 3passes – C/O logged at 2 fpmand 5 passes
■ Memory logging available
■ US Patent 2009
0
20
40
60
80
100
120
0 0.1 0.2 0.3 0.4 0.5
RATO13 responseDet 1 & 3 pulsed neutron count ratio
24
©20
15B
aker
Hug
hes
Inco
rpor
ated
.All
Rig
hts
Res
erve
d.
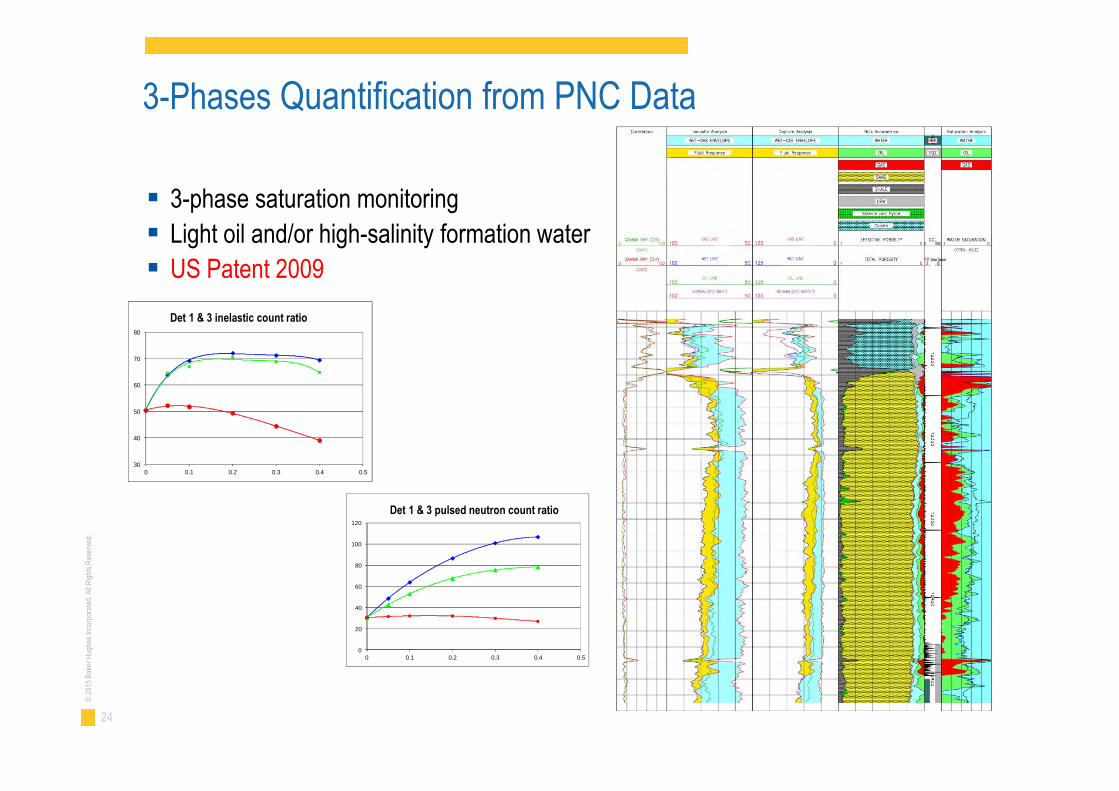
3-phase saturation monitoring
Light oil and/or high-salinity formation water
US Patent 2009
30
40
50
60
70
80
0 0.1 0.2 0.3 0.4 0.5
RIN13 Response
0
20
40
60
80
100
120
0 0.1 0.2 0.3 0.4 0.5
RATO13 responseDet 1 & 3 pulsed neutron count ratio
Det 1 & 3 inelastic count ratio
3-Phases Quantification from PNC Data
25
©20
15B
aker
Hug
hes
Inco
rpor
ated
.All
Rig
hts
Res
erve
d.
RPM – Multi Detector Pulsed Neutron Measurements
1.50
1.60
1.70
1.80
1.90
2.00
0.00 0.10 0.20 0.30 0.40
Ca
rbo
n/O
xyg
en
Ra
tio
Porosity
Gas
Oil
Water
0
10
20
30
40
50
60
0.00 0.05 0.10 0.15 0.20 0.25 0.30 0.35 0.40 0.45
SIG
MA
,c.u
.
Porosity
250 kppm
0 kppm
GasOil
0
10
20
30
40
50
60
70
80
90
100
0 0.1 0.2 0.3 0.4
INE
LA
ST
ICR
AT
IO
Porosity
0
30
60
90
120
150
0 0.1 0.2 0.3 0.4
PU
LS
ED
CA
PT
UR
ER
AT
IO
Porosity
C/OSigma
Oil
Oil
Water Water
Gas
Gas
20+ ft/min 2 ft/min*
10 ft/min
10 ft/min
Det 1 & 3 inelastic count ratio
Det 1 & 3 pulsed neutron count ratio
26
©20
15B
aker
Hug
hes
Inco
rpor
ated
.All
Rig
hts
Res
erve
d.
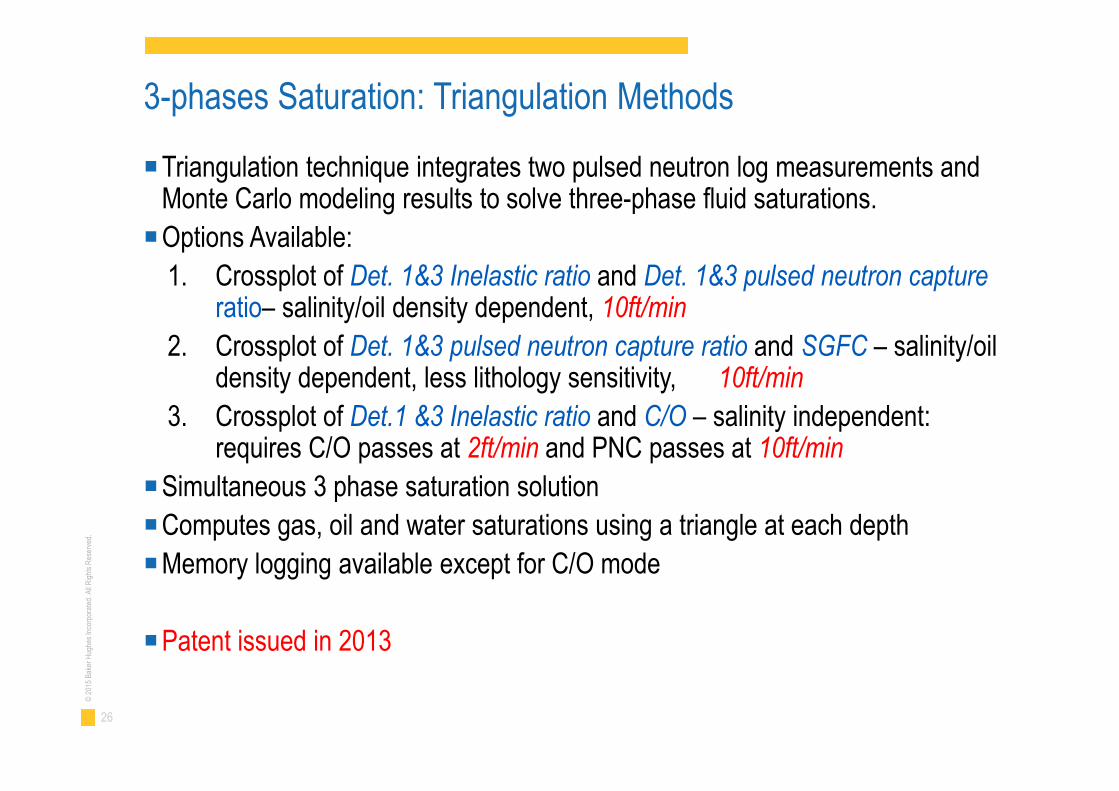
3-phases Saturation: Triangulation Methods
■Triangulation technique integrates two pulsed neutron log measurements andMonte Carlo modeling results to solve three-phase fluid saturations.
■Options Available:
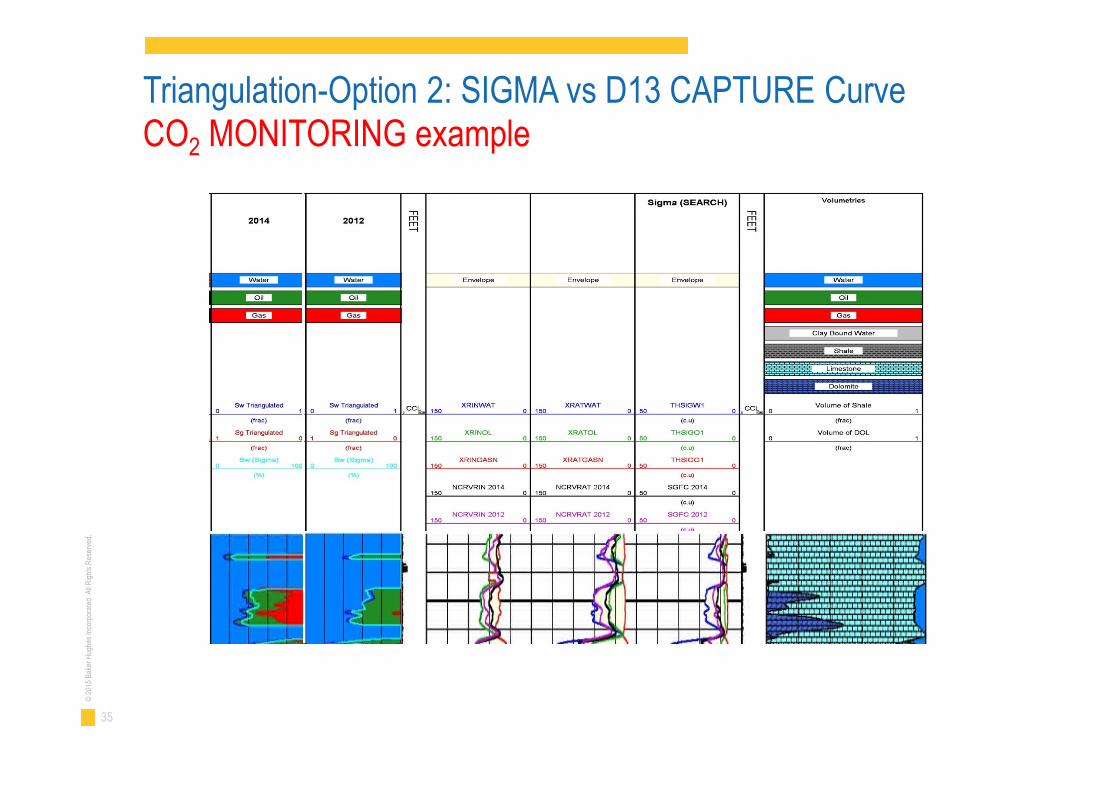
1. Crossplot of Det. 1&3 Inelastic ratio and Det. 1&3 pulsed neutron captureratio– salinity/oil density dependent, 10ft/min
2. Crossplot of Det. 1&3 pulsed neutron capture ratio and SGFC – salinity/oildensity dependent, less lithology sensitivity, 10ft/min
3. Crossplot of Det.1 &3 Inelastic ratio and C/O – salinity independent:requires C/O passes at 2ft/min and PNC passes at 10ft/min
■Simultaneous 3 phase saturation solution
■Computes gas, oil and water saturations using a triangle at each depth
■Memory logging available except for C/O mode
■Patent issued in 2013
27
©20
15B
aker
Hug
hes
Inco
rpor
ated
.All
Rig
hts
Res
erve
d.
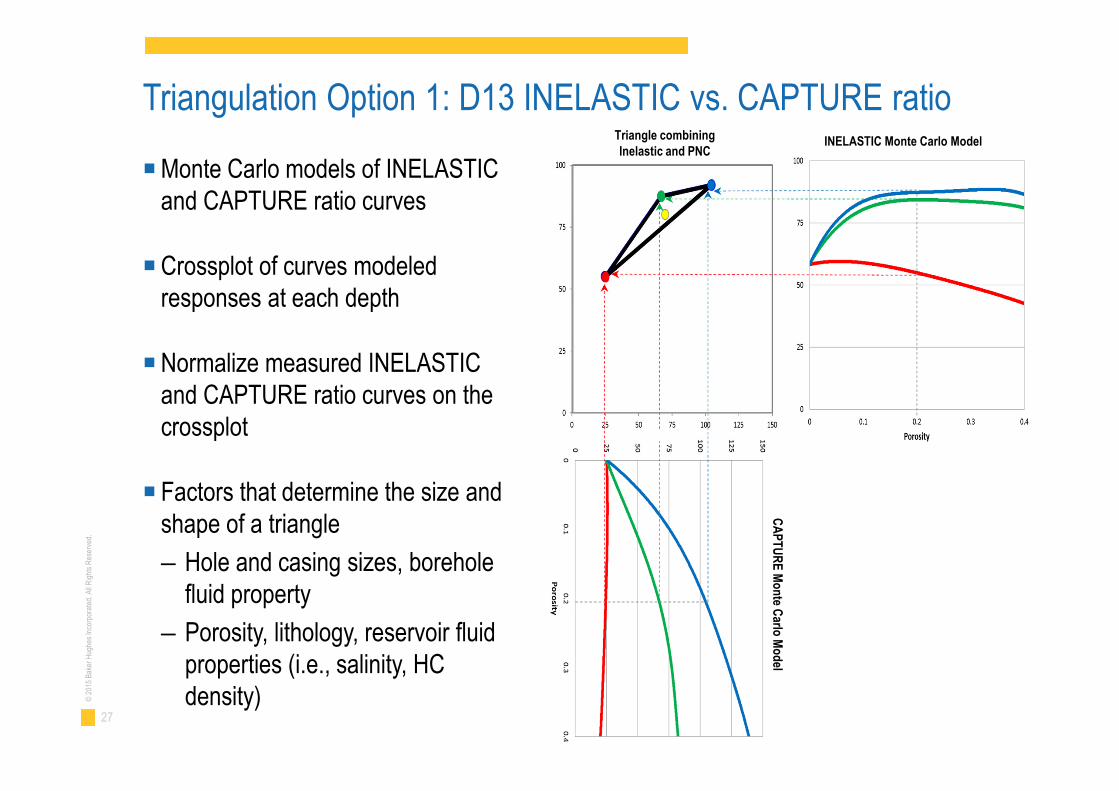
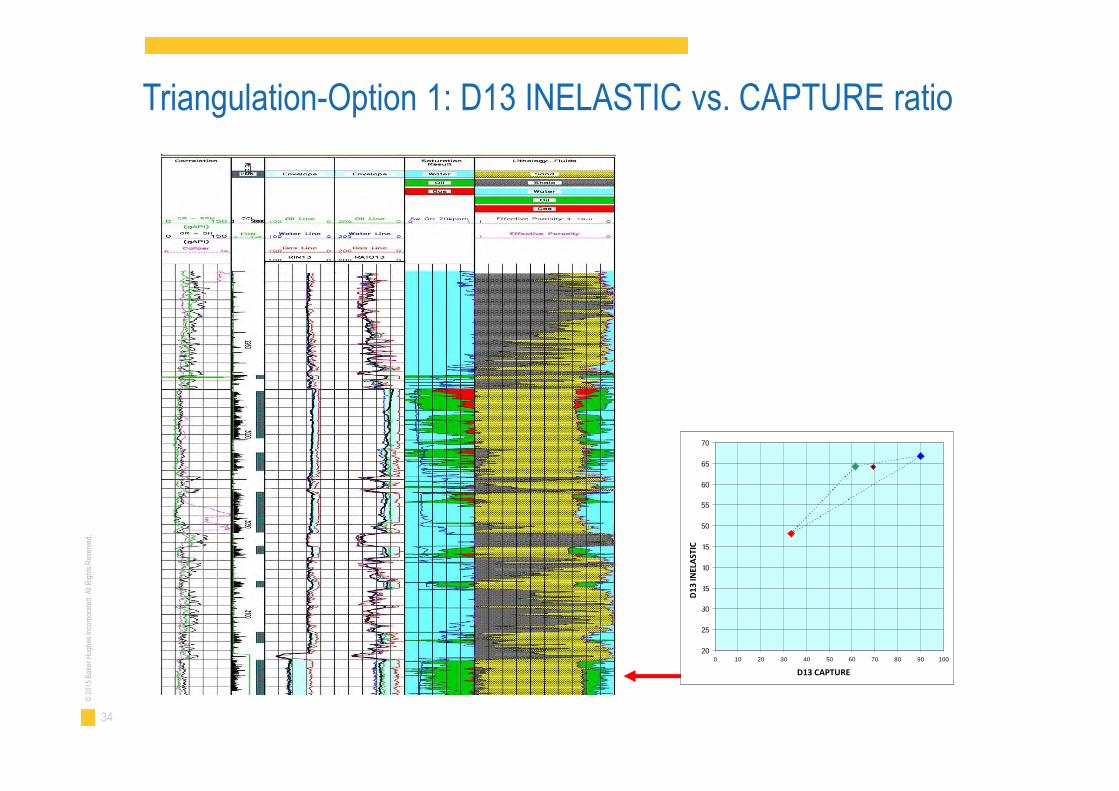
Triangulation Option 1: D13 INELASTIC vs. CAPTURE ratio
■Monte Carlo models of INELASTICand CAPTURE ratio curves
■Crossplot of curves modeledresponses at each depth
■Normalize measured INELASTICand CAPTURE ratio curves on thecrossplot
■ Factors that determine the size andshape of a triangle
– Hole and casing sizes, boreholefluid property
– Porosity, lithology, reservoir fluidproperties (i.e., salinity, HCdensity)
Triangle combiningInelastic and PNC
INELASTIC Monte Carlo Model
CA
PT
UR
EM
on
teC
arloM
od
el
28
©20
15B
aker
Hug
hes
Inco
rpor
ated
.All
Rig
hts
Res
erve
d.
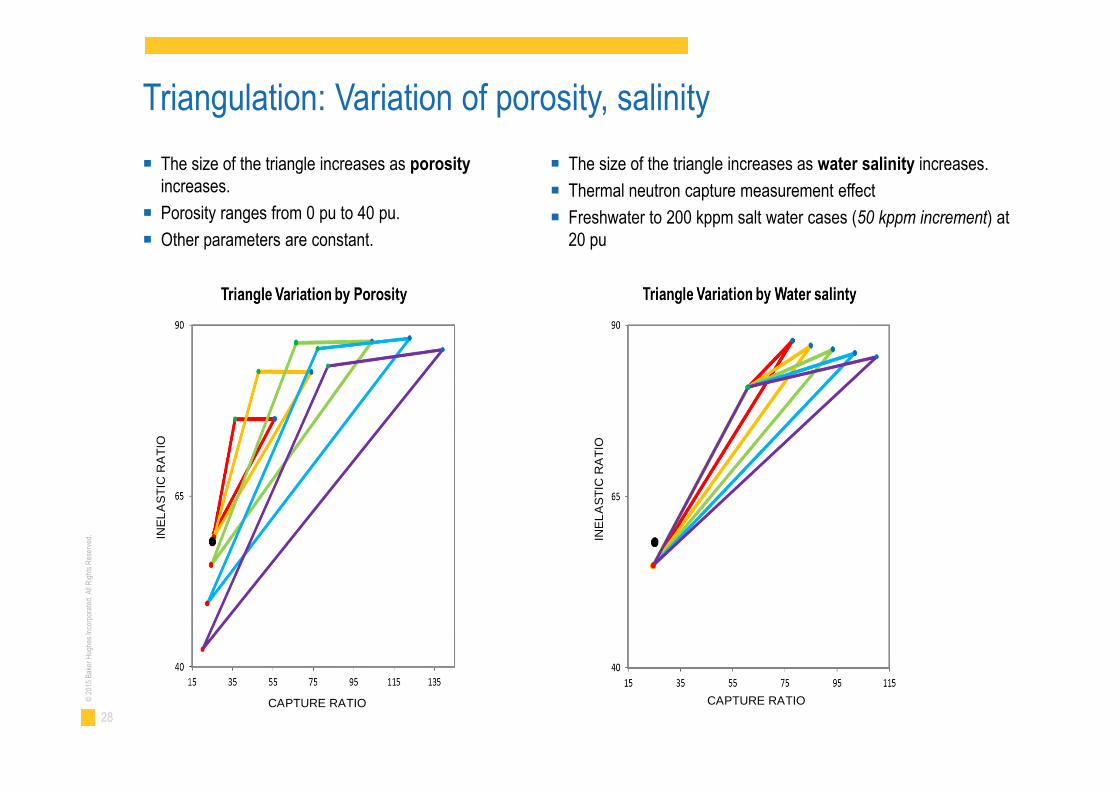
Triangulation: Variation of porosity, salinity
■ The size of the triangle increases as porosityincreases.
■ Porosity ranges from 0 pu to 40 pu.
■ Other parameters are constant.
■ The size of the triangle increases as water salinity increases.
■ Thermal neutron capture measurement effect
■ Freshwater to 200 kppm salt water cases (50 kppm increment) at20 pu
INE
LA
ST
ICR
AT
IO
INE
LA
ST
ICR
AT
IO
CAPTURE RATIO CAPTURE RATIO
29
©20
15B
aker
Hug
hes
Inco
rpor
ated
.All
Rig
hts
Res
erve
d.
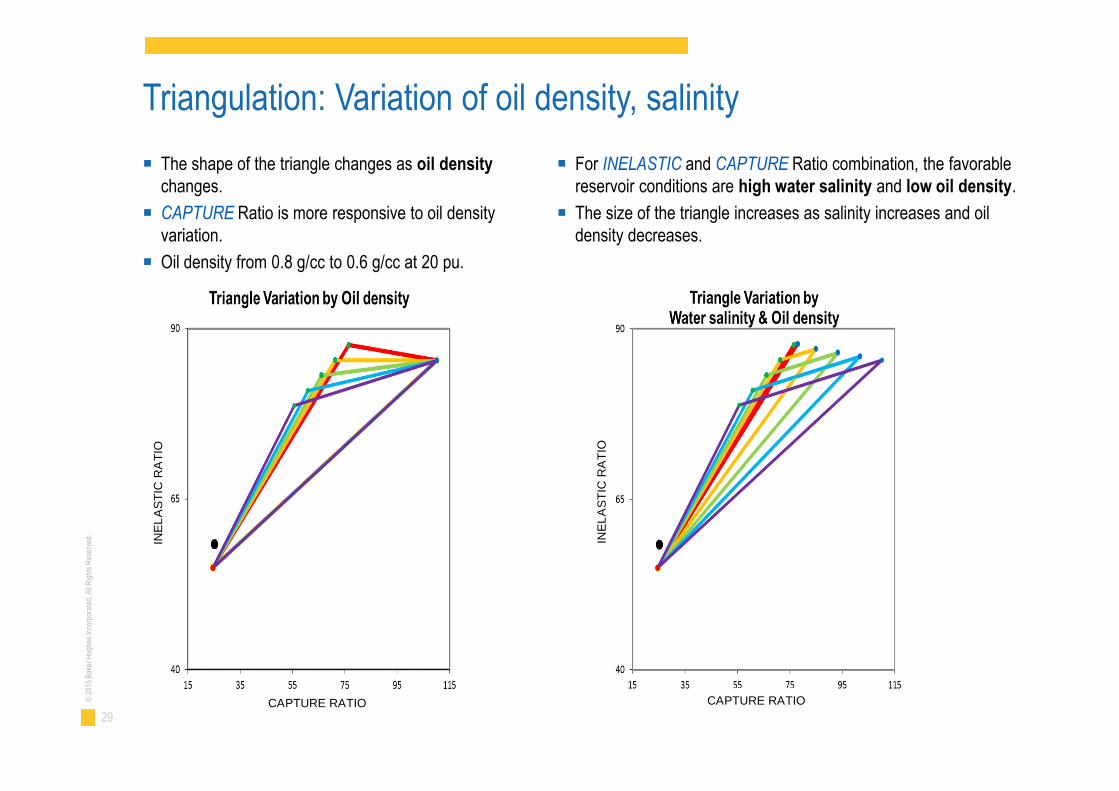
Triangulation: Variation of oil density, salinity
■ The shape of the triangle changes as oil densitychanges.
■ CAPTURE Ratio is more responsive to oil densityvariation.
■ Oil density from 0.8 g/cc to 0.6 g/cc at 20 pu.
■ For INELASTIC and CAPTURE Ratio combination, the favorablereservoir conditions are high water salinity and low oil density.
■ The size of the triangle increases as salinity increases and oildensity decreases.
INE
LA
ST
ICR
AT
IO
INE
LA
ST
ICR
AT
IO
CAPTURE RATIO CAPTURE RATIO
30
©20
15B
aker
Hug
hes
Inco
rpor
ated
.All
Rig
hts
Res
erve
d.
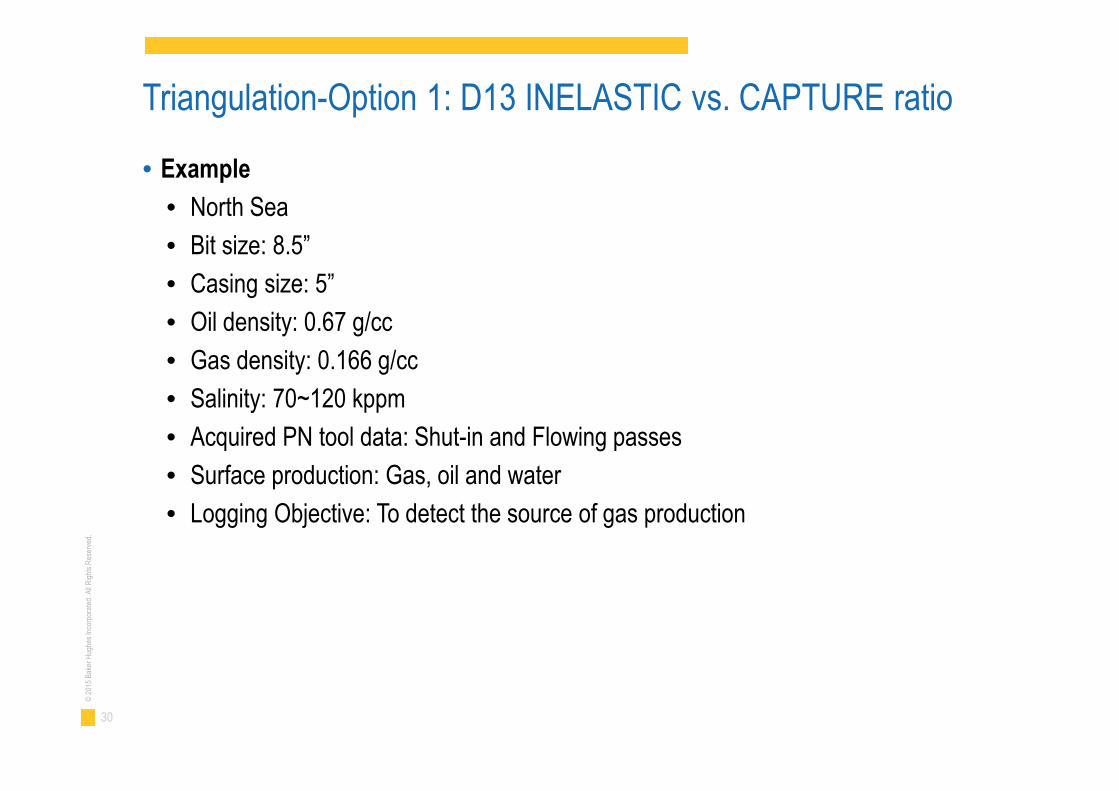
• Example
• North Sea
• Bit size: 8.5”
• Casing size: 5”
• Oil density: 0.67 g/cc
• Gas density: 0.166 g/cc
• Salinity: 70~120 kppm
• Acquired PN tool data: Shut-in and Flowing passes
• Surface production: Gas, oil and water
• Logging Objective: To detect the source of gas production
Triangulation-Option 1: D13 INELASTIC vs. CAPTURE ratio
31
©20
15B
aker
Hug
hes
Inco
rpor
ated
.All
Rig
hts
Res
erve
d.
20
25
30
35
40
45
0 15 30 45 60 75
RATO13
RIN
13
D13
INEL
AST
IC
D13 CAPTURE
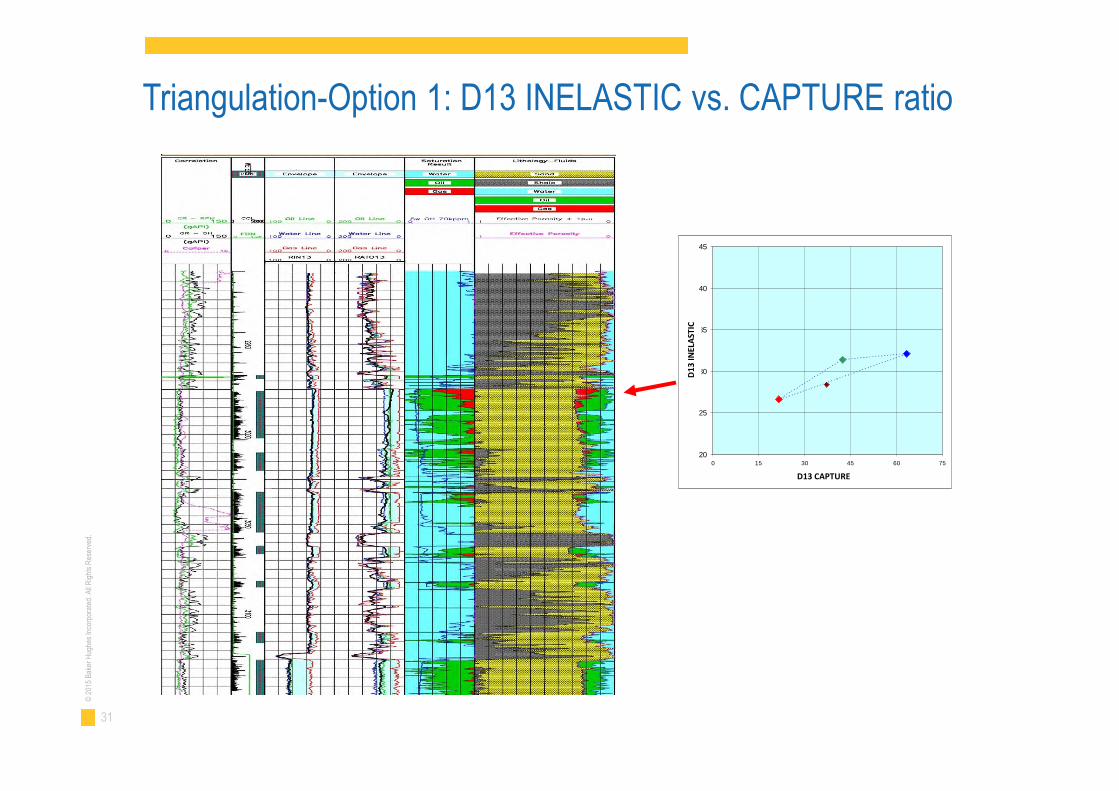
Triangulation-Option 1: D13 INELASTIC vs. CAPTURE ratio
32
©20
15B
aker
Hug
hes
Inco
rpor
ated
.All
Rig
hts
Res
erve
d.
20
25
30
35
40
45
0 15 30 45 60 75
RATO13
RIN
13
D13
INEL
AST
IC
D13 CAPTURE
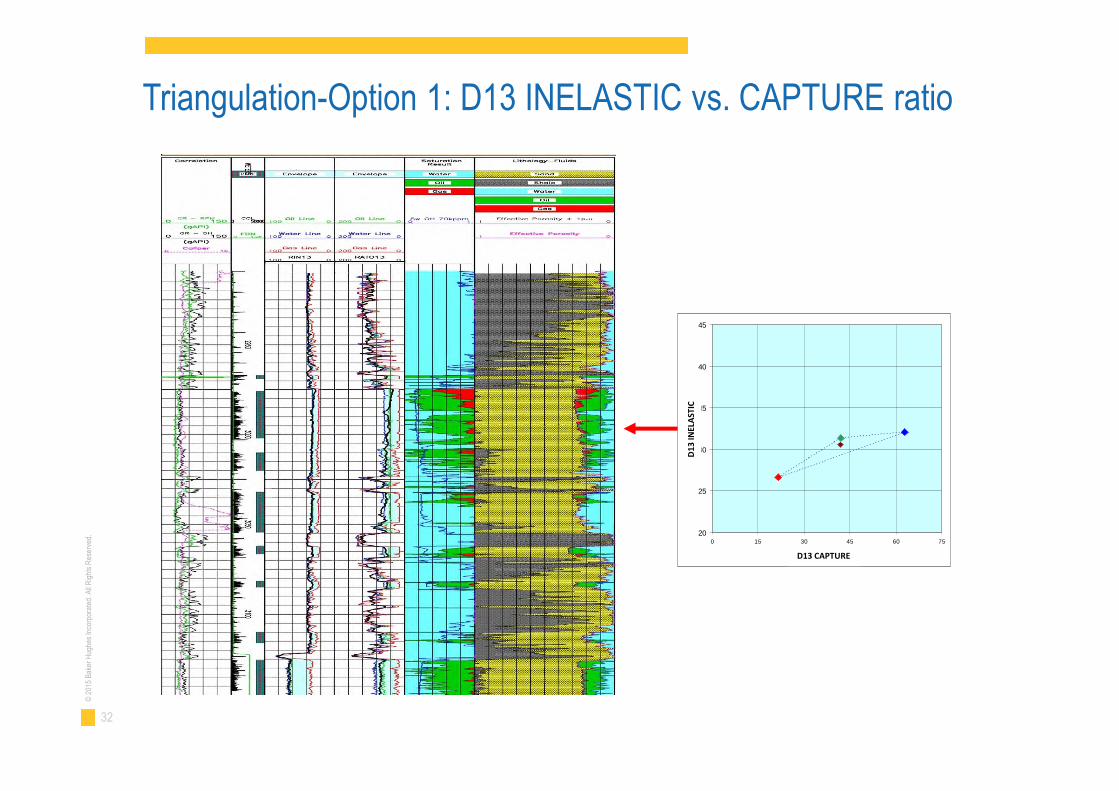
Triangulation-Option 1: D13 INELASTIC vs. CAPTURE ratio
33
©20
15B
aker
Hug
hes
Inco
rpor
ated
.All
Rig
hts
Res
erve
d.
20
25
30
35
40
45
0 15 30 45 60 75
RATO13
RIN
13
D13
INEL
AST
IC
D13 CAPTURE
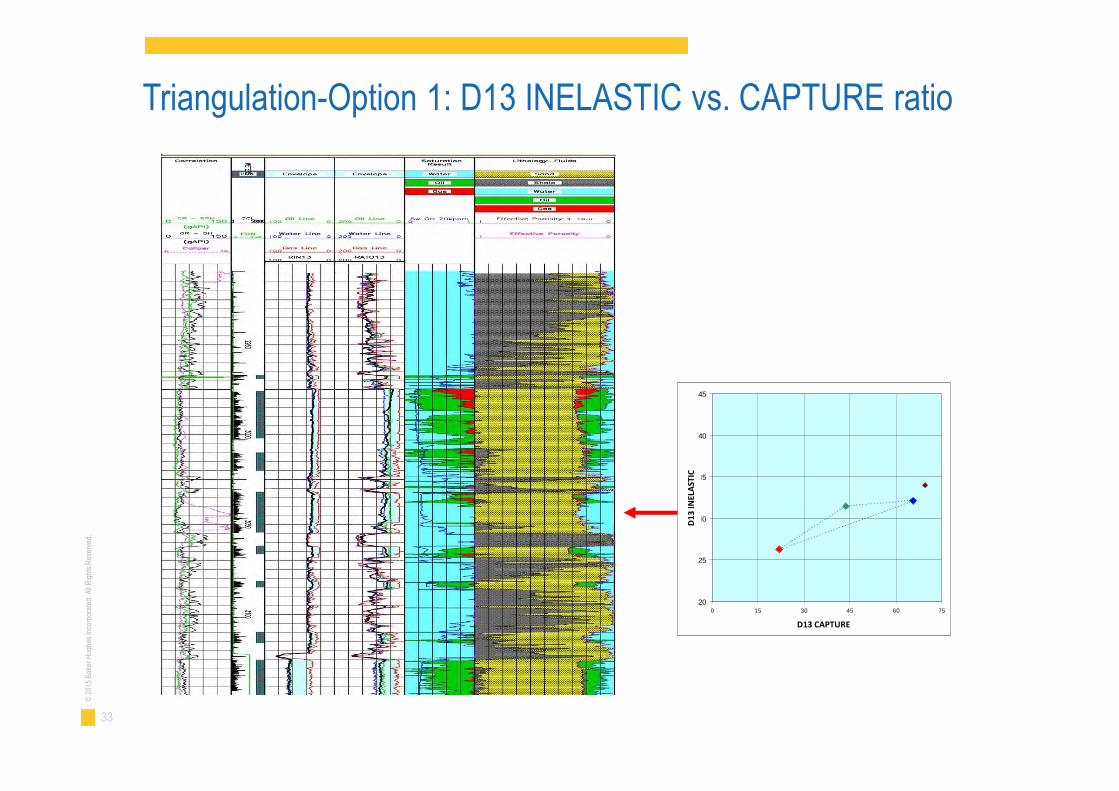
Triangulation-Option 1: D13 INELASTIC vs. CAPTURE ratio
34
©20
15B
aker
Hug
hes
Inco
rpor
ated
.All
Rig
hts
Res
erve
d.
20
25
30
35
40
45
50
55
60
65
70
0 10 20 30 40 50 60 70 80 90 100
RATO13
RIN
13
D13
INEL
AST
IC
D13 CAPTURE
Triangulation-Option 1: D13 INELASTIC vs. CAPTURE ratio
35
©20
15B
aker
Hug
hes
Inco
rpor
ated
.All
Rig
hts
Res
erve
d.
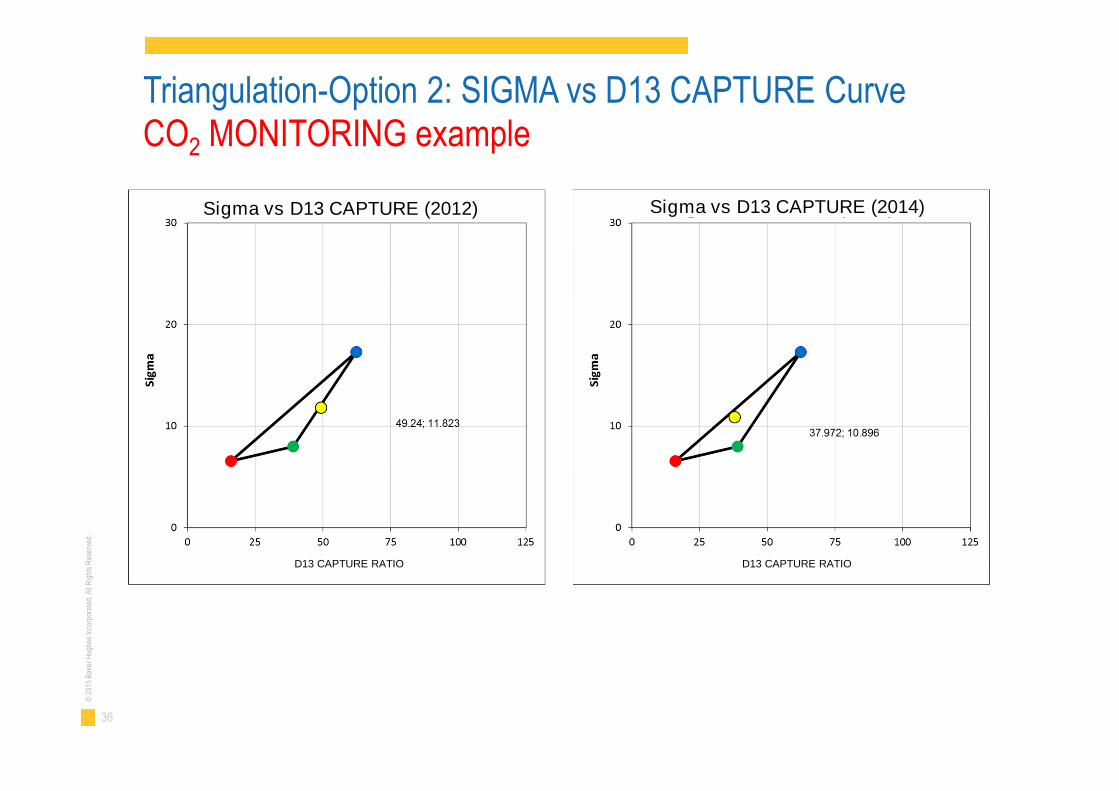
Triangulation-Option 2: SIGMA vs D13 CAPTURE CurveCO2 MONITORING example
36
©20
15B
aker
Hug
hes
Inco
rpor
ated
.All
Rig
hts
Res
erve
d.
Sigma vs D13 CAPTURE (2012)
D13 CAPTURE RATIO D13 CAPTURE RATIO
Sigma vs D13 CAPTURE (2014)
Triangulation-Option 2: SIGMA vs D13 CAPTURE CurveCO2 MONITORING example
37
©20
15B
aker
Hug
hes
Inco
rpor
ated
.All
Rig
hts
Res
erve
d.
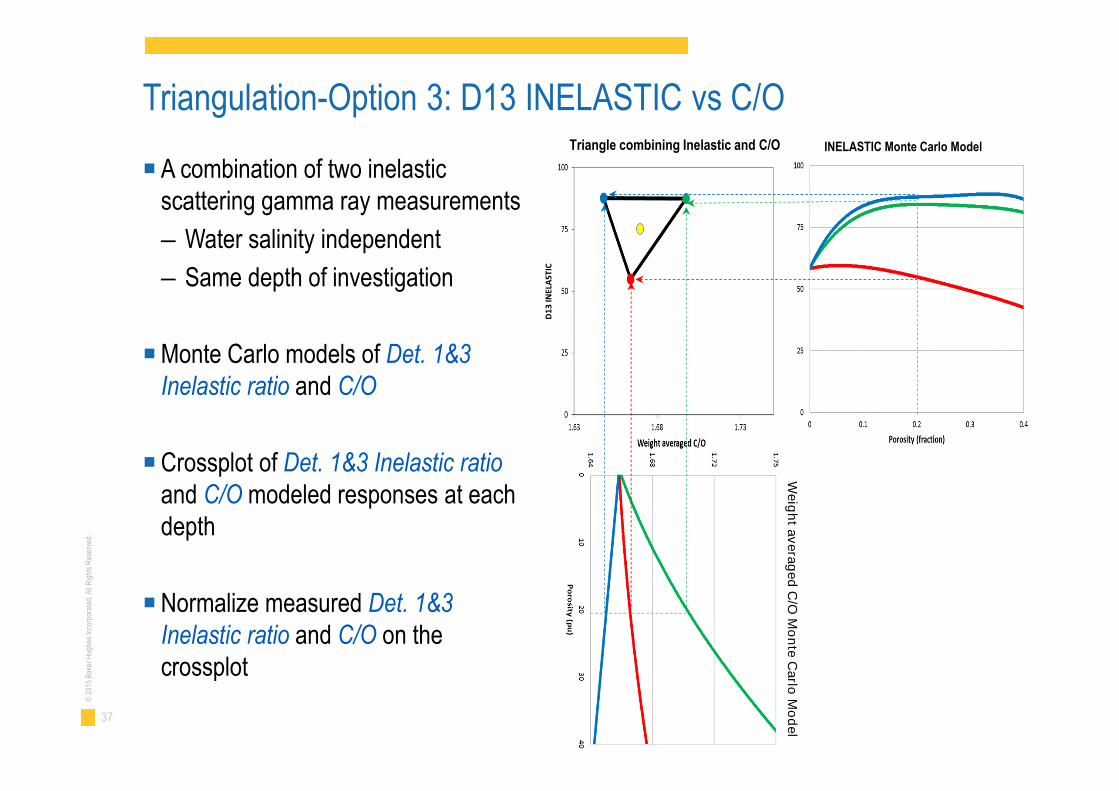
Triangulation-Option 3: D13 INELASTIC vs C/O
■ A combination of two inelasticscattering gamma ray measurements
– Water salinity independent
– Same depth of investigation
■Monte Carlo models of Det. 1&3Inelastic ratio and C/O
■Crossplot of Det. 1&3 Inelastic ratioand C/O modeled responses at eachdepth
■Normalize measured Det. 1&3Inelastic ratio and C/O on thecrossplot
Triangle combining Inelastic and C/O INELASTIC Monte Carlo Model
Weig
ht
av
era
ged
C/O
Mo
nte
Carlo
Mo
del
D1
3IN
ELA
STIC
38
©20
15B
aker
Hug
hes
Inco
rpor
ated
.All
Rig
hts
Res
erve
d.
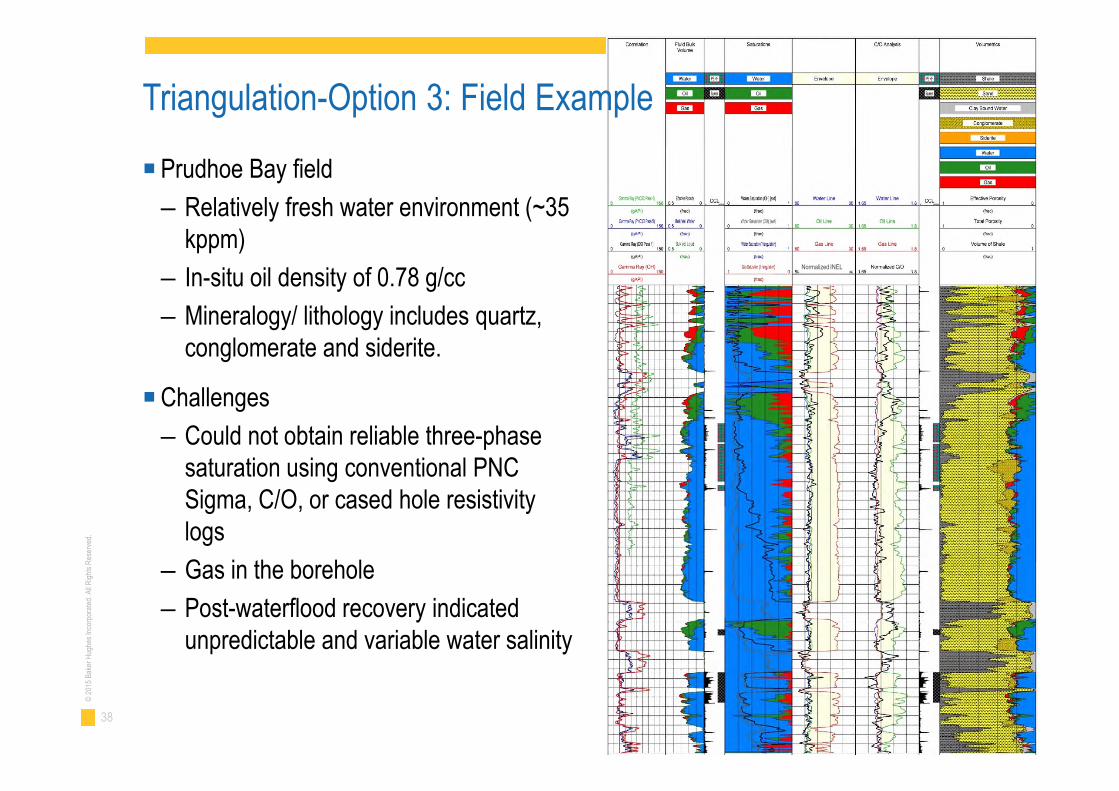
■ Prudhoe Bay field
– Relatively fresh water environment (~35kppm)
– In-situ oil density of 0.78 g/cc
– Mineralogy/ lithology includes quartz,conglomerate and siderite.
■Challenges
– Could not obtain reliable three-phasesaturation using conventional PNCSigma, C/O, or cased hole resistivitylogs
– Gas in the borehole
– Post-waterflood recovery indicatedunpredictable and variable water salinity
Triangulation-Option 3: Field Example
Normalized INEL
39
©20
15B
aker
Hug
hes
Inco
rpor
ated
.All
Rig
hts
Res
erve
d.
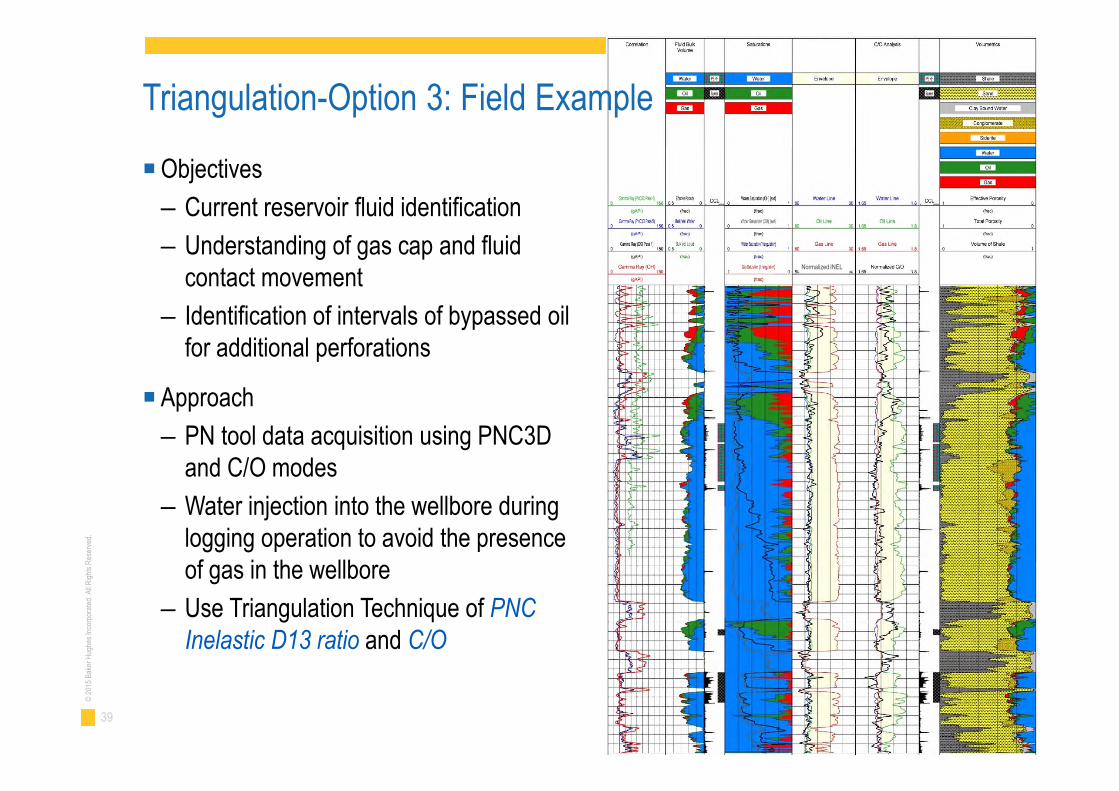
■Objectives
– Current reservoir fluid identification
– Understanding of gas cap and fluidcontact movement
– Identification of intervals of bypassed oilfor additional perforations
■ Approach
– PN tool data acquisition using PNC3Dand C/O modes
– Water injection into the wellbore duringlogging operation to avoid the presenceof gas in the wellbore
– Use Triangulation Technique of PNCInelastic D13 ratio and C/O
Normalized INEL
Triangulation-Option 3: Field Example
40
©20
15B
aker
Hug
hes
Inco
rpor
ated
.All
Rig
hts
Res
erve
d.
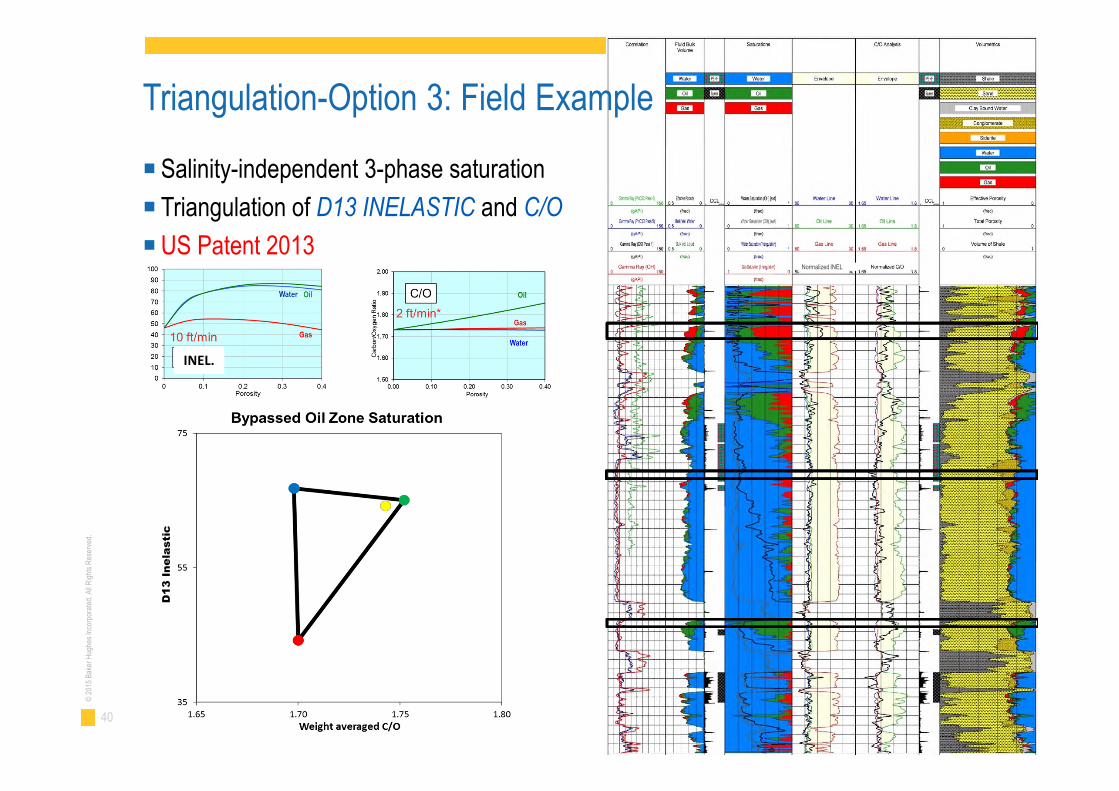
■ Salinity-independent 3-phase saturation
■ Triangulation of D13 INELASTIC and C/O
■US Patent 2013
INEL.
D1
3In
ela
sti
c
Normalized INEL
Triangulation-Option 3: Field Example
41
©20
15B
aker
Hug
hes
Inco
rpor
ated
.All
Rig
hts
Res
erve
d.
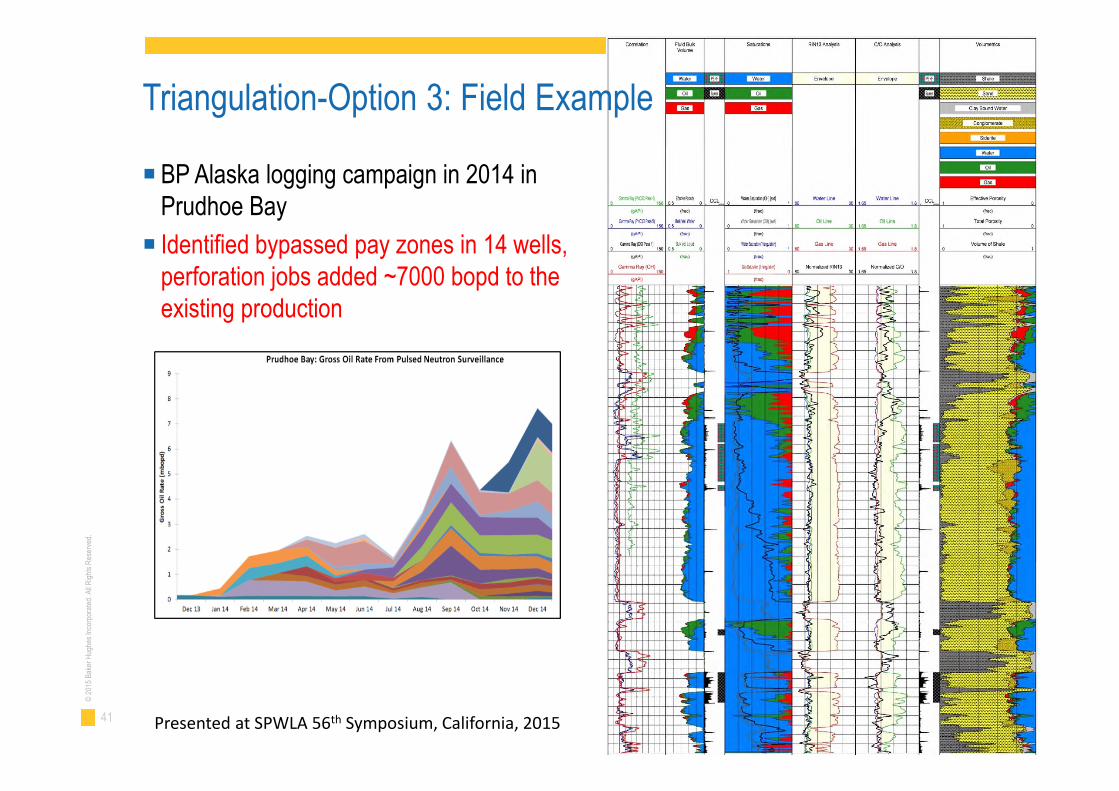
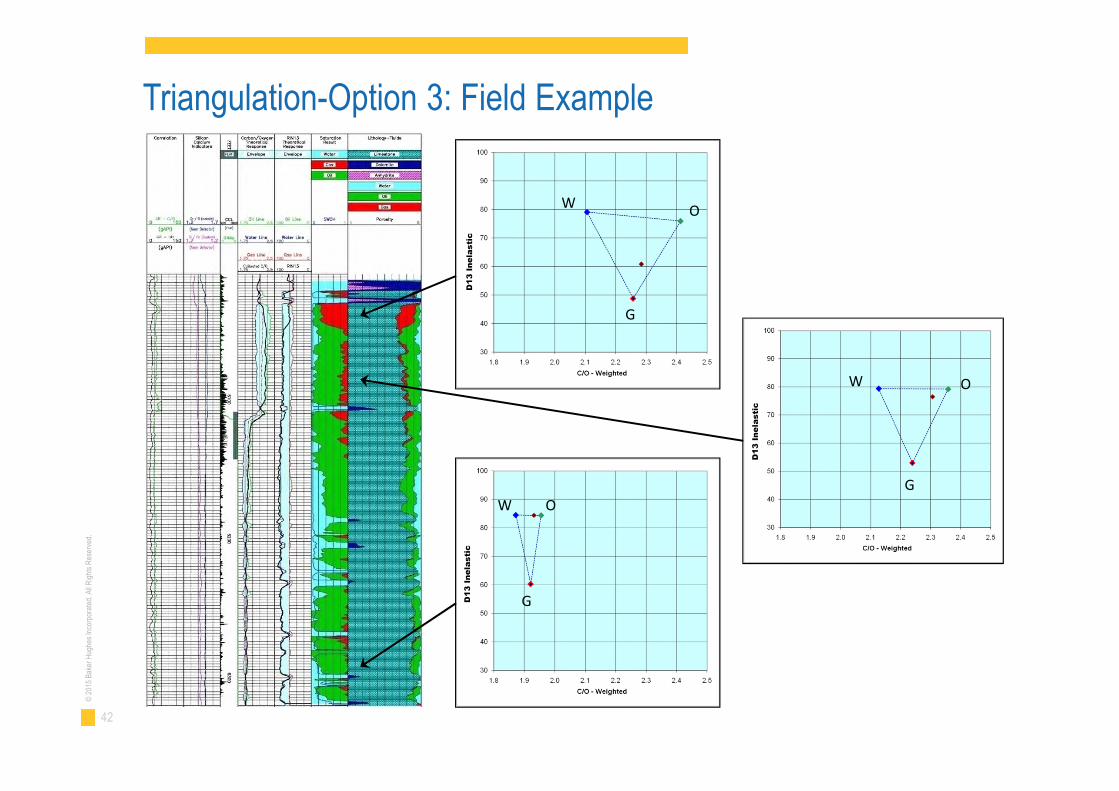
■ BP Alaska logging campaign in 2014 inPrudhoe Bay
■ Identified bypassed pay zones in 14 wells,perforation jobs added ~7000 bopd to theexisting production
Presented at SPWLA 56th Symposium, California, 2015
Triangulation-Option 3: Field Example
42
©20
15B
aker
Hug
hes
Inco
rpor
ated
.All
Rig
hts
Res
erve
d.
W O
G
W O
G
W O
GD
13
Inela
sti
cD
13
Inela
sti
c
D13
Inela
sti
c
Triangulation-Option 3: Field Example

43
©20
15B
aker
Hug
hes
Inco
rpor
ated
.All
Rig
hts
Res
erve
d.
■ Cased Hole Formation Evaluation
– Standard Conventional PN logging
– Sigma
– C/O
– Monte Carlo Emulation approach: Reservoir Characterization
– Advanced pulsed neutron technologies
– Gas quantification
– Variables in modelling
– Pressure depletion evaluation
– Oil quantification from PNC data (by pass C/O)
– Three-phases Saturation analysis
Summary

Confidential. Not to be copied, distributed, or reproduced without prior approval.© 2017 Baker Hughes, a GE company, LLC
- All rights reserved.
Advanced methodologies for fluidcharacterization and saturationevaluation behind Casing
London Petrophysical Society – Resistivity Free Saturation Seminar13 December 2018