Embed Size (px)
Citation preview
1
Advanced Marketing
2
Introduction
1. Main topic : Relationship marketing
There are 2 types of marketing:
- Strategic marketing : segmentation, positioning, targeting
- Operational marketing: 5 P: How to sell your product? Place – promotion – product –price- positioning =
transactional marketing. Try to generate more transactions than in the past, try to adapt the product to the
different P’s to motivate people to buy the product. It focuses on the consumers with a risk to lose them,
focus on the retention.
Relationship marketing (company perspective): generating loyal customers, how to motivate people to stay?
Type of strategy, how to collect information about the customers: how companies try to adapt the strategy
to different segments of customers to make them loyal. What type of information do they need therefore?
How to motivate the clients?
Relational chain (Consumer perspective): which type of relationship does the customer want to keep with a
brand? It’s a matter of trust in the brand.
We will focus on this second type of marketing.
Ex: retailing sector - offer a lot of loyalty cards. This will generate more benefits if it succeeds to keep them.
Ex: banks try to keep clients for a long time, this will lead to more loans, more bank accounts. The students seem
not very interesting for a bank since they don’t have a lot of money but the bank knows that in the future they will
earn money.
Commitment in the relationship: how much the customer is inclined to pay a little more for the product because
they value the relationship? How to measure the trust, the commitment, and the loyalty? The company needs to
know if it’s important to keep the loyalty or not?
What is transactional marketing ?
Transactional Marketing is a form of marketing that concentrates on individual transactions and not much else. her
than developing a relationship with the buyer.
The transactional approach is based on the four traditional elements of marketing, sometimes referred to as the four
P's:
Product -- Creating a product that meets consumer needs.
Pricing -- Establishing a product price that will be profitable while still attractive to consumers.
Placement -- Establishing an efficient distribution chain for the product.
Promotion -- Creating a visible profile for the product that makes it appealing to customers.
- Strategic marketing (S-T-P) Segmentation, Targeting and Positioning: En s’appuyant sur les résultats d’études
et d’analyses, le marketing stratégique permet de fixer des objectifs marketing (produits, marchés,..) pour le
développement des marchés de l’entreprise.
3
- Operational marketing (4P): Déclinaison du marketing qui consiste à mettre en application les conclusions du
marketing stratégique. Il regroupe l'ensemble des décisions qui sont prises sur le terrain à propos des
différents éléments du marketing mix.
What is a relationship?
A relationship is a series of interactive episodes between parties over time… but it is also a social and emotional
construct
What is customer relationship management /relationship marketing?
CRM is the process of continuously developing relations with individual clients in order to identify and create mutual
benefits
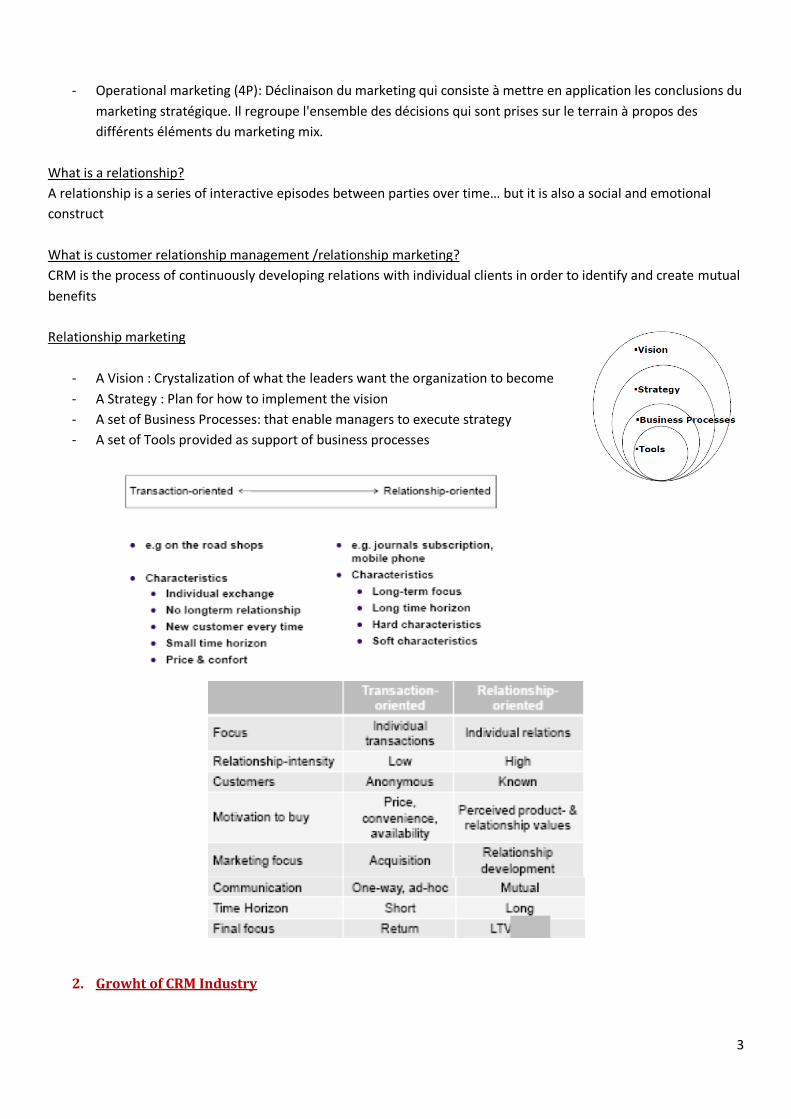
Relationship marketing
- A Vision : Crystalization of what the leaders want the organization to become
- A Strategy : Plan for how to implement the vision
- A set of Business Processes: that enable managers to execute strategy
- A set of Tools provided as support of business processes
2. Growht of CRM Industry

4
Customer relationship management is a broadly recognized, widely-implemented strategy for managing and
nurturing a company’s interactions with clients and sales prospects. It involves using technology to organize,
automate, and synchronize business processes—principally sales activities, but also those for marketing, customer
service, and technical support.
2.1 Why this growth?
1. Growing consumer diversity due to demographic and behavioral trends
- Ageing of the population in developed countries
- Increased ethnic diversity
- Increasing individualization
2. Time Scarcity
- Average waiting time (in seconds) after which calls are abandoned by customers
3. Value consciousness and intolerance for low service levels
4. Information availability and technological aptitude
- Customers more knowledgeable in making purchase decisions
- More comparisons across providers and transactions
5. More intense competition between firms
6. Diminishing product-quality differentiation
7. Better technology, cheaper and larger storage units
8. Increased popularity of data warehouses
9. Multiplication of communication channels focused on the customer

5
2.2 Consequences
- Marketers should be wary of placing heavy time demands on consumers
o The major challenge facing companies has become meeting consumer demands rather than cost
reduction
- Value added to customers by offering customized product and service propositions
o Need for better information about customer behavior and attitudes
3. Objectives of CRM
- We want to thoroughly understand our customers needs even before they know them themselves.
- Decreasing customer churn by increasing customer satisfaction
- Motivating customers to initiate revenue-generating contacts with us
- Increasing the likelihood of the “right response” by a given customer or customer segment
- To use technology to improve customer service and enable a greater degree of customer differentiation in
order to deliver unique customer interactions.
- We want to attract customers both old and new through more personalized communications
The relationship strategy (company perspective)
Definitions, misunderstandings and models
1. Definitions
CRM is the process of continuously developing relations with individual clients in order to identify and create mutual
benefits
CRM is the core business strategy that integrates internal processes and functions, and external networks, to create
and deliver value to targeted customers at a profit
CRM is a business strategy that maximizes profitability, revenue and customer satisfaction by organizing around
customer segments, fostering behaviour that satisfies customers, and implementing customercentric processes
2. Misunderstandings
- CRM is database marketing
- CRM is a marketing process
- CRM is an IT issue
- CRM is about loyalty schemes
- CRM can be implemented by any company
3. CRM Models
1. The IDIC
- Identify who your customers are and build a deep understanding of them
- Differentiate your customers to identify which customers have most value now and which offer
most for the future
- Interact with customers to ensure that you understand customer expectations and their
relationships with other suppliers or brands

6
- Customize the offer and communication to ensure that the expectations of customers are met
2. The Gartner’s competency model
The model suggests that companies need competencies in eight areas for CRM to be successful. These include
building a CRM vision, developing CRM strategies, designing valued customer experiences, intra and extra-
organizational collaboration, managing customer lifecycle processes, information management, technology
implementation and developing measures indicative of CRM success or failure.
Business case
1. Potential Revenues:
- Conversion of more leads
- More cross-selling and up-selling: they want added value to what you already offer to your consumers
- More accurate product pricing
- Higher levels of customer satisfaction and retention: final objective to succeed in the increase of satisfaction
and loyalty
- Higher levels of word-of-mouth influence: If someone is satisfied about the product, he will be able to talk of
the brand to new people (opportunity to attract people for free).
- More leads and/or sales from marketing campaigns: not focusing on ST benefit but LT benefit, the consumer
will buy the product again and again, more and for longer
1. Cross selling
Le cross selling, ou ventes croisées, désigne une technique commerciale, particulièrement adaptée à Internet,
permettant de proposer au client d'un site, intéressé par un produit, un ensemble d'autres produits
complémentaires.
Act of selling product or service to customer as result of another purchase.
- Increase revenue
- Less costs than acquiring a new one
- Example: Amazone

7
2. Up selling
L'Up-selling est une technique de vente permettant au vendeur d'amener le consommateur à monter en gamme par
l'achat d'un produit plus cher que celui qu'il avait prévu auparavant.
- Par exemple, le consommateur qui avait initialement prévu d'acheter un réfrigérateur moyen de gamme,
sortira du magasin avec le même produit mais de gamme supérieure à un prix plus élevé.
Motivating existing customers to trade up to more profitable products
2. Intangible benefits
- Better customer experience
- Better understanding of customer requirements
- Improved responsiveness to changes in the market or competitive environments
Improved customer service
- More harmonious relationships with customer
3. Reduction of costs
- Lower costs of customer acquisition
- Reduced marketing costs to replace defected customers
- Less waste in marketing campaigns
- Reduced customer service costs
- More efficient front-office processes
4. Costs
- CRM software licence fees and software configuration
- Software upgrades
- Infrastructure costs, new desktop, laptop or handheld devices
- Data modelling
- Helpdesk support
- Change management
- Training
Critical success factors

8
1. Importance of people
- People design and implement the CRM strategy
- People use CRM software run to help them run campaigns and events, and to sell to and service customers
- Basic human skills such as showing empathy and responding are vital to delivering excellent experience in
interaction with customers
Internal marketing
Internal marketing is a planned effort to overcome organizational resistance to change and to align, motivate and
integrate employees towards the effective implementation of corporate and functional strategies. 7P’s:
- Product
- Price
- Promotion (internal communications)
- Place
- Physical evidence
- Process
- Participants
2. Segment employees, f.i.:
Contactors: employees who have direct frequent or periodic customer contact
Modifiers: employees who have less direct frequent or periodic customer contact which is usually not face to face
Influencers: employees who traditionally have no direct contact with the customers although they may make many
decisions in relation to customers
Isolated’s: employees who have no customer contact at all
Risks
- « Relationship marketing as it is currently practiced has not brought us closer to customers. It has sent us
farther afield » (Fournier, Dobscha and Mick, 1998, p. 50)
- In a study of 100 large companies, only 52% reported achieving their CRM business goals and only 37% could
point to a tangible financial impact for technology solutions (Boston Consulting Group)
- Lack of customer understanding
- Limited input from the customers
- Poor-quality customer data and information
- Thinking that technology is the solution
- Technological elements dominate strategic thinking
- Not enough organizational support – no real reorganization of the company
- Little coordination between departmental initiatives and projects
- No measures or monitoring of benefits and lack of testing
- CRM activities are more appropriate in some contexts than others depending on
o Customers’ needs and values
9
o Degree of competition, number of opportunities and market growth rate (environmental
appropriateness)
o Strategic choices (ex. desire to target new niches)
- All consumers are not ready to participate and to establish a relation with all types of firms
- Balance between “given and received” in a good relation
- Intrusion in the private life of customers
- Several times loyal customers feel disadvantaged in spite of their loyalty
- Preferential treatment for the "best" customers can leave the other customers, who also generate some
profit, feel excluded and\or less appreciated by the firm
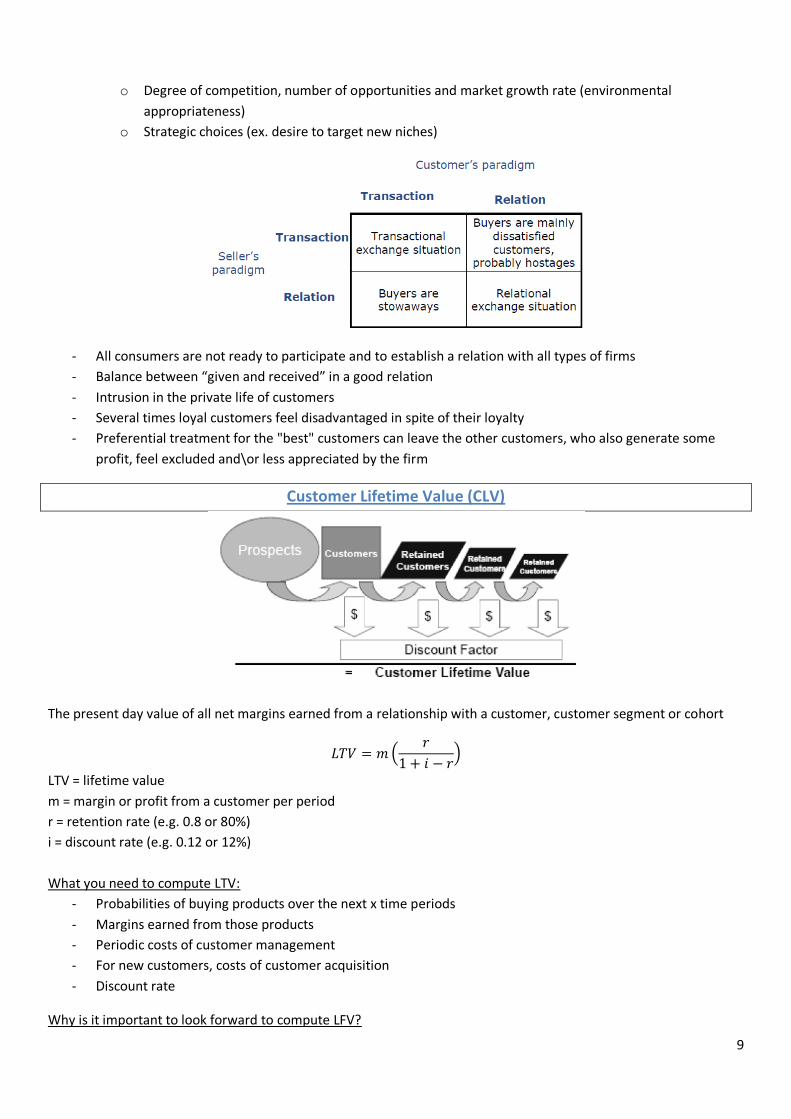
Customer Lifetime Value (CLV)
The present day value of all net margins earned from a relationship with a customer, customer segment or cohort
(
)
LTV = lifetime value
m = margin or profit from a customer per period
r = retention rate (e.g. 0.8 or 80%)
i = discount rate (e.g. 0.12 or 12%)
What you need to compute LTV:
- Probabilities of buying products over the next x time periods
- Margins earned from those products
- Periodic costs of customer management
- For new customers, costs of customer acquisition
- Discount rate
Why is it important to look forward to compute LFV?
10
- Revenues grow over time, as customers buy more
- Cost-to-serve is lower for existing customers, because both supplier and customer understand the other
- Referrals are generated by existing, satisfied customers through their unpaid advocacy
- Higher prices are paid by existing customers than new customers
Calculating profitability is difficult
- High quality data infrastructure
o Historical customer behavior
o Production costs
o Support costs
o Customer profitability
o Channel usage
- High cost specialized software products
- How to incorporate word-of-mouth
- Use CLV in communicaton
Core strategies to improve profitability
- Improve customer retention rate in the early years of the relationship
- Increase the profit earned per customer by
o Reducing cost-to-serve
o Cross-selling additional products and services
- Become better at customer acquisition by
o Using more cost effective recruitment channels
o Better qualification of prospects
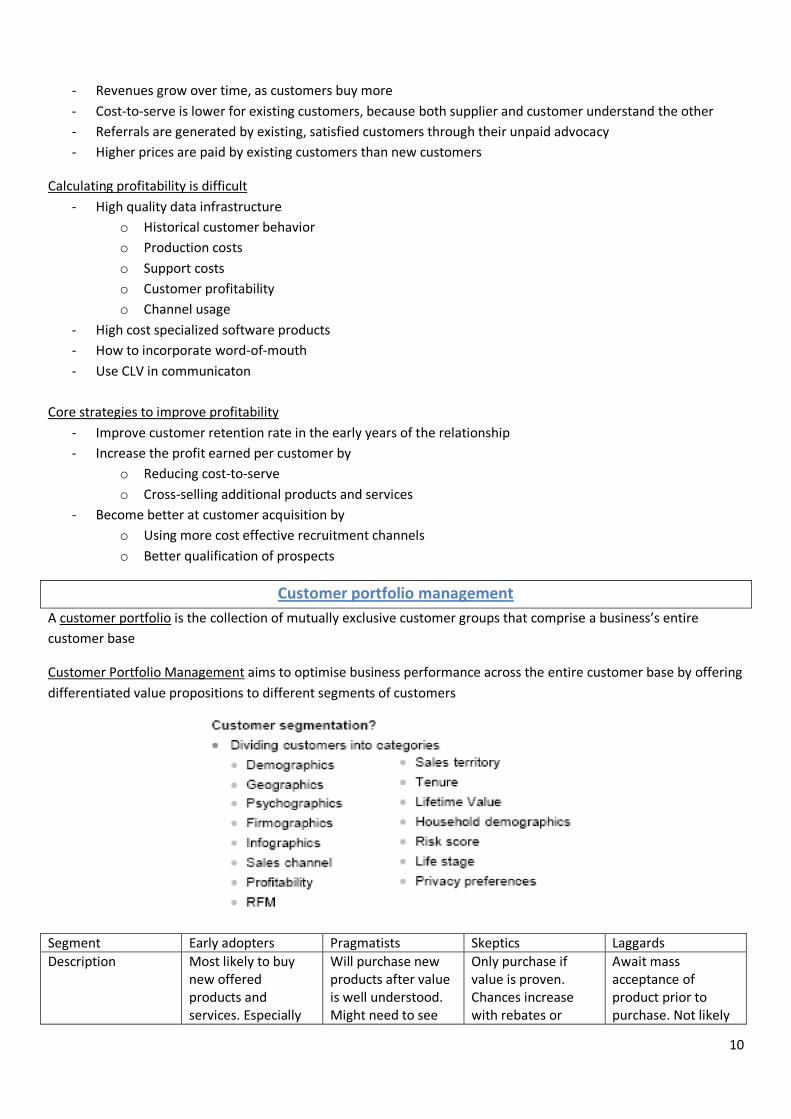
Customer portfolio management
A customer portfolio is the collection of mutually exclusive customer groups that comprise a business’s entire
customer base
Customer Portfolio Management aims to optimise business performance across the entire customer base by offering
differentiated value propositions to different segments of customers
Segment Early adopters Pragmatists Skeptics Laggards
Description Most likely to buy new offered products and services. Especially
Will purchase new products after value is well understood. Might need to see
Only purchase if value is proven. Chances increase with rebates or
Await mass acceptance of product prior to purchase. Not likely

11
attracted to technology innovation
the product in action money back guarantees
to respond to new promotions
11 45 28 15
The 80:20 rule or Pareto principle states that, roughly 80% of the effects come from 20% of the causes
Pareto law: 80% of profit comes from 20% of big customers.
It’s based on the idea of volume. In fact, it’s not the case because big clients need more attention and have higher
attempts.
You need to understand correctly who your customers are, the type of information you need to know about them to
determine the specific costs by segments and the benefits by segments.
One thing missing in the table: the engagement of all stakeholders (involvement of suppliers, customers and people
inside the organization, partnership)
Customer profitability by sales volume quintile
Shapiro et al’s customer classification matrix In this model customers are classified according to the price they pay and the costs incurred by the company to acquire and serve them. Four classes of customer are identified:

12
- Carriage trade: often newly acquired customers who are costly to serve but pay a relatively high price. high
on both dimensions. Ask a lot but are ready to pay a lot for it.
- Ex: newly acquired customer
- Passive customers: not asking a lot of services, not calling to ask information, they don’t cost a lot and they
pay the price asked. It could be interesting to focus on these.
- Aggressive customers: always asking for price reduction, more services, they cost a lot and pay a low price.
- Bargain basement customers: Not asking a lot of efforts but they want you to reduce the price. The volume, high-value customers could be there. They could take the standardized services.
The important contribution of this model is that it recognizes that costs are not evenly distributed across the customer base. Some customers are more costly to win and serve and, if this is accompanied by a relatively low received price, the customer
Strategically significant customers
1. High future life-time value customers. These customers will contribute significantly to the company’s profitability in the future 2. High volume customers. Also interested to be in your database. - These customers might not generate much profit, but they are strategically significant because of their absorption of fixed costs, and the economies of scale they generate to keep unit costs low 3. Benchmark customers. - These are customers that other customers follow (opinion leaders). - For example (in the B to B), Nippon Conlux supplies the hardware and software for Coca Cola’s vending operation. Whilst they might not make much margin from that relationship, it has allowed them to gain access to many other markets. ‘If we are good enough for Coke, we are good enough for you’, is the implied promise. - Some IT companies create ‘reference sites’ at some of their more demanding customers. You want to have them in your database because they can influence other customers. 4. Inspirations. These are customers who bring about improvement in the supplier’s business. They may identify new applications for a product, product improvements, or opportunities for cost reductions. They may complain loudly and make unreasonable demands, but in doing so, force change for the better.

13
Ex: in the chemical sector, customers are invited in some debates to target their needs 5. Door openers. These are customers that allow the supplier to gain access to a new market. This may be done for no initial profit, but with a view to proving credentials for further expansion. This may be particularly important if crossing cultural boundaries, say between west and east. Find one client in China, one in India,… because you will be there, you will be able to target other customers afterwards.
The relational chain (consumer perspective)
Perceived quality
1. Customer value
Value is the customer’s perception of the balance between benefits received from a product or service and the sacrifices made to experience those benefits
A value proposition is the explicit or implicit promise made by a company to its customers that it will deliver a particular bundle of value-creating benefits
- Sacrifices o Money o Search costs o Psychic costs
Perceived risks
Performance
Physical
Financial
Social
Psychological
1. How do customers reduce perceived risk?
- Delay purchase - Seek word-of-mouth endorsement - Negotiate service contracts - Seek additional information from advertising copy - Buy known brands - Deal with reputable suppliers - Seek performance guarantees - Buy with credit card (protection if product fails) - Negotiate discounts - Take out insurance - Demand pre-purchase trial
14
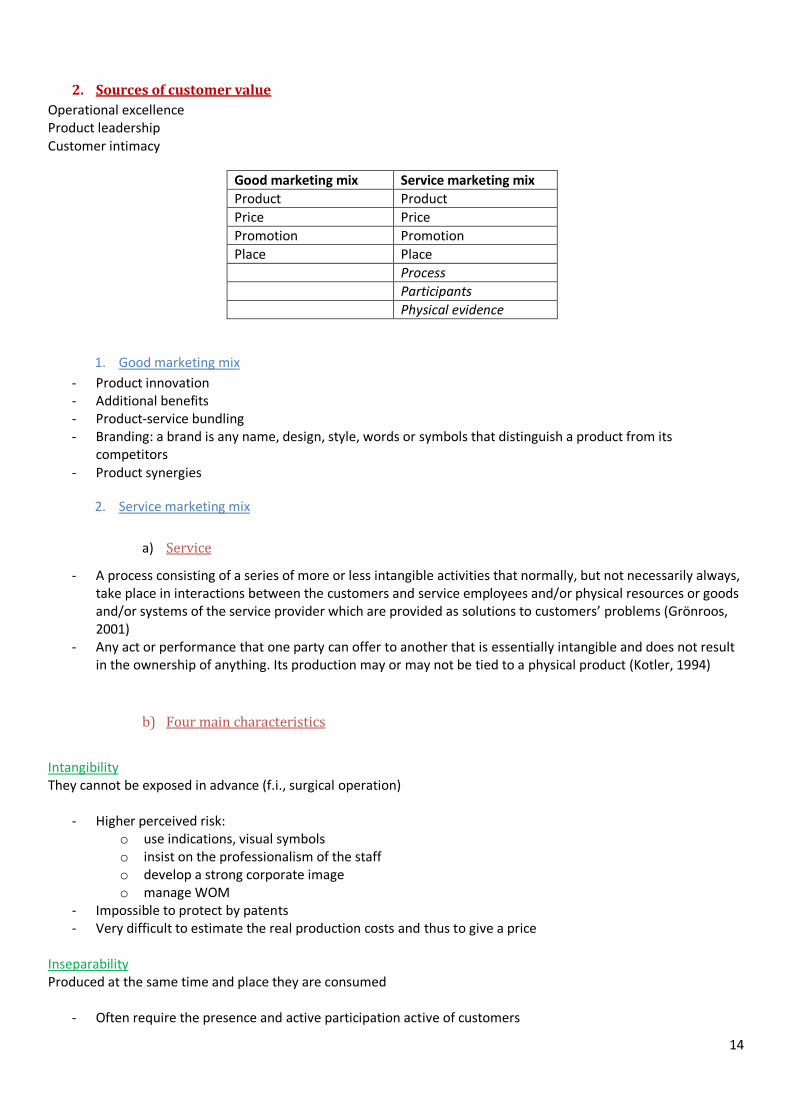
2. Sources of customer value
Operational excellence Product leadership Customer intimacy
Good marketing mix Service marketing mix
Product Product
Price Price
Promotion Promotion
Place Place
Process
Participants
Physical evidence
1. Good marketing mix
- Product innovation - Additional benefits - Product-service bundling - Branding: a brand is any name, design, style, words or symbols that distinguish a product from its
competitors - Product synergies
2. Service marketing mix
a) Service
- A process consisting of a series of more or less intangible activities that normally, but not necessarily always, take place in interactions between the customers and service employees and/or physical resources or goods and/or systems of the service provider which are provided as solutions to customers’ problems (Grönroos, 2001)
- Any act or performance that one party can offer to another that is essentially intangible and does not result in the ownership of anything. Its production may or may not be tied to a physical product (Kotler, 1994)
b) Four main characteristics
Intangibility They cannot be exposed in advance (f.i., surgical operation)
- Higher perceived risk: o use indications, visual symbols o insist on the professionalism of the staff o develop a strong corporate image o manage WOM
- Impossible to protect by patents - Very difficult to estimate the real production costs and thus to give a price
Inseparability Produced at the same time and place they are consumed
- Often require the presence and active participation active of customers

15
- Capacity problems - Importance of the relational skills of employees _ employees’ recruitment, training and motivation - Train consumers to make them more competent and more productive - Management of the various segments of customers
Heterogeneity Service of variable quality
- Hard to standardize and control service quality - Important to reduce perceived risk
o Train staff to follow very specific procedures (risks?) o Automate most aspects of the service (risks?) o Supply guarantees of satisfaction or other insurances to the consumers in case of bad results o Discuss with the consumers to understand their needs o Look at the image projected by the tangible elements (eg, sympathy, vocabulary)
Perishability
The service cannot be stored, because it is real time produced
- When the demand exceeds the production capacity, the consumers can be disappointed unless they agree to wait
- Find the means to smooth the demand o Play on prices, promotions o Play on the number of employees, the physical space and the equipments
c) Process
- Importance of the whole experience of service o Restaurant; speed of the process, the skills of the supplier, the quality of the interaction
- The marketing and the operations management are thus connected and have to work together
d) Participants
- Interaction between the consumers and the employees o Strategic importance of HRM (recruitment, training, motivation, internal marketing to establish a
customer-oriented culture) - Influence of the other consumers present at the time of the service
o Segment the market in compatible groups o Manage arrival of consumers to avoid conflicts
e) Physical evidence
= tangible facilities, equipment and materials that companies use to communicate value to customers - Company premises, internal and external environments, print materials, websites, corporate uniforms,
vehicle… - Influence customers’ impressions about the quality, their satisfaction and risk perceptions - reate a physical environment in coherence with the personality whom the firm wants to project on the
market

16
3. Relational chain
Important remark: The relational chain can be considered as a relatively simplistic representation of the reality - For instance, some components of service quality (cleanliness in a hotel room) could have an impact only on
customer dissatisfaction when the company is not performing well on these components, but no impact at all on customer satisfaction when the company is performing well
3. The service/satisfaction chain
The service-profit chain establishes relationships between profitability, customer loyalty, and employee satisfaction, loyalty, and productivity. The links in the chain (which should be regarded as propositions) are as follows: Profit and growth are stimulated primarily by customer loyalty. Loyalty is a direct result of customer satisfaction. Satisfaction is largely influenced by the value of services provided to customers. Value is created by satisfied, loyal, and productive employees. Employee satisfaction, in turn, results primarily from high-quality support services and policies that enable employees to deliver results to customers.
4. Perceived quality
- Only perceived quality matters
- Perceived quality is a global evaluative judgment towards a product or a service concerning the relative superiority of this product / service

17
- A product / service can be considered as a set of attributes which brings the basic service (the functional
value) but also other supplementary services
- Attributes of product/service can be classified in three categories
o Search attributes : are ones that can be verified prior to purchase through direct inspection or
readily available sources.
o Experience attributes : are ones that can be verified only after use of the product
o Credence attributes : are ones that are difficult to verify even after use
- A bad quality places any company in position of competitive disadvantage
Positive impact on:
- Consumer satisfaction - Consumer trust - Consumer willingness to recommend the company and their intentions to buy the products / services of this
company - Loyalty intentions (> in service industries like automobile and life insurances than in good industries)
o Essential ingredient in the survival and in the success of companies, especially in a very competitive
environment… but the link between SQ and profits is neither direct, nor simple

18
o SQ seems to influence profits via an increase of market shares and prices accepted by the customers o Improvements of SQ could increase favorable BI and decrease unfavorable intentions, but take into account
the level of SQ and the costs of SQ improvements
1. Perceived product quality
- Conformity to specifications - Possible to check conformity to quality standard before selling to consumers
Intrinsic quality indicators: appearance, color, shape, size, structure Extrinsic quality indicators: price, place of sale, brand, country of origin, nutritional information, information about the manufacturing Tangible quality characteristics: taste, freshness, convenience Intangible quality characteristics: natural character, BIO character , respect for animals and for environment Garvin (1987)
- Functional performance - Additional functions - Reliability - Conformity to specifications - Longevity - ‘Helpfulness' - Aesthetics - Corporate / brand associations
2. Perceived service quality
- Conformance to specification o producing error-free invoices o delivering on-time o acknowledging a customer complaint within 24 hours…
- Fitness for purpose o creating products well suited to customer requirements o allowing customer to select a preferred communication channel o recruiting empathic and responsive customer contact staff o customizing service delivery for customers…
19
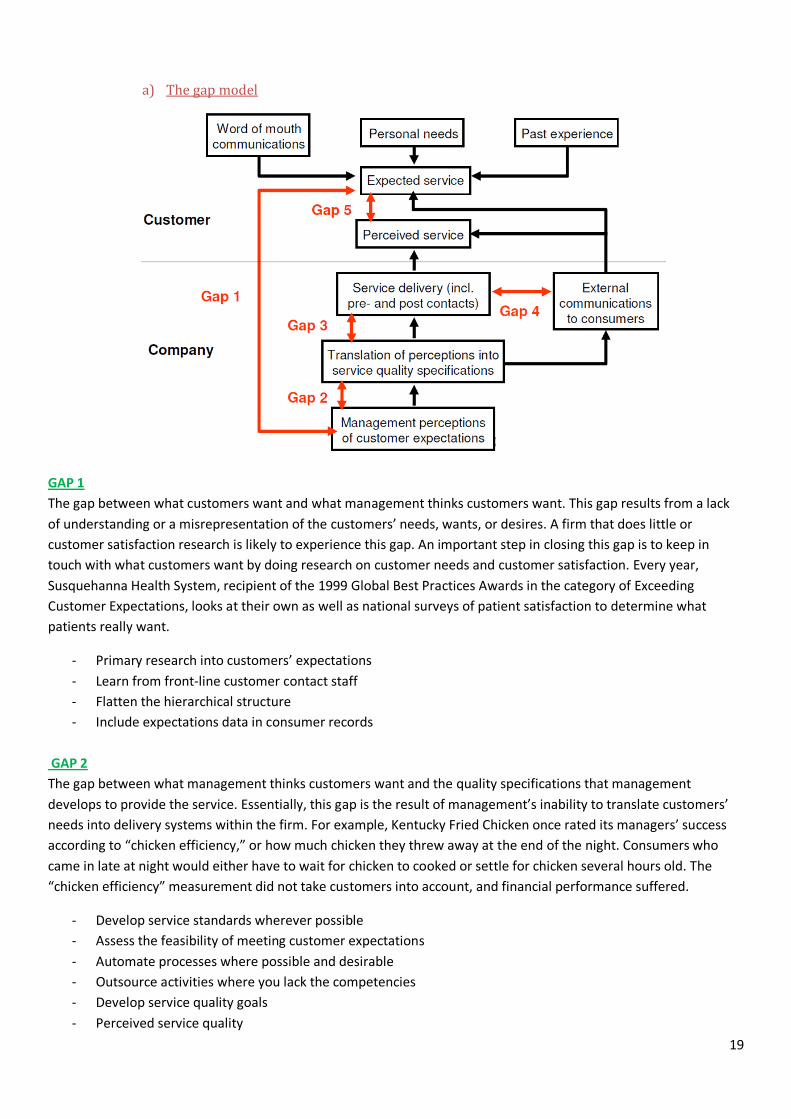
a) The gap model
GAP 1
The gap between what customers want and what management thinks customers want. This gap results from a lack
of understanding or a misrepresentation of the customers’ needs, wants, or desires. A firm that does little or
customer satisfaction research is likely to experience this gap. An important step in closing this gap is to keep in
touch with what customers want by doing research on customer needs and customer satisfaction. Every year,
Susquehanna Health System, recipient of the 1999 Global Best Practices Awards in the category of Exceeding
Customer Expectations, looks at their own as well as national surveys of patient satisfaction to determine what
patients really want.
- Primary research into customers’ expectations
- Learn from front-line customer contact staff
- Flatten the hierarchical structure
- Include expectations data in consumer records
GAP 2
The gap between what management thinks customers want and the quality specifications that management
develops to provide the service. Essentially, this gap is the result of management’s inability to translate customers’
needs into delivery systems within the firm. For example, Kentucky Fried Chicken once rated its managers’ success
according to “chicken efficiency,” or how much chicken they threw away at the end of the night. Consumers who
came in late at night would either have to wait for chicken to cooked or settle for chicken several hours old. The
“chicken efficiency” measurement did not take customers into account, and financial performance suffered.
- Develop service standards wherever possible
- Assess the feasibility of meeting customer expectations
- Automate processes where possible and desirable
- Outsource activities where you lack the competencies
- Develop service quality goals
- Perceived service quality

20
GAP 3
The gap between the service quality specifications and the service that is actually provided. If both gaps 1 and 2 have
been closed, then gap 3 is due to the inability of management and employees to do what should be done. Poorly
trained or poorly motivated workers can cause this gap. Management needs to ensure that employees have the skills
and the proper tools to perform their jobs. Other techniques that help to close gap 3 are training employees so they
know what management expects and encouraging teamwork.
- Invest in people
- Invest in technology
- Redesign workflow
- Improve internal communication
- Write clear job specifications
- Reward service excellence
GAP 4:
The gap between what the company provides and what the customer is told it provides. This is clearly a
communication gap. It may include misleading or deceptive advertising campaigns promising more than the firm can
deliver or doing “what it takes” to get the business. To close this gap, companies need to create realistic customer
expectations through honest, accurate communication about what firms can provide.
- Brief advertising agency on customer service expectations
- Train employees not to overpromise
- Penalize employees who overpromise
- Excel at service recovery
- Encourage and manage customer complaints
GAP 5:
The gap between the service that customers receive and the services they want. This gap can be positive or negative. For example, if a patient expects to wait twenty minutes in the physician’s office before seeing the physician but waits only ten minutes, the patient’s evaluation of service quality will be high. However, a forty-minute wait would result in a lower evaluation.
When any one or more of these gaps are large, service quality is perceived as low. As the gaps shrink, service
quality improves.
Hard measures: characteristics or activities which can be quantified in time or measured by means of audits: number
of lost phone calls, time required to perform a specific task
Soft measures: not easily observable / collected by discussing with customers and employees
- Identification of service quality dimensions by an observation and a verbalization of the customer process
blueprint of the service
- Identify all key activities
- Specify all the links between these activities
- Group together these activities to have a global image of the totality of the process

21
- Further decompose into several sub-activities (For example, for an airline company, embarking in a plane
can be decomposed into several stages: waiting for the call of its row of seat, presenting its card of access
crossing the footbridge, entering the plane, presenting again its card of access, finding his(her) seat, storing
luggage, sitting down)
- Make the distinction between what the customers experiment (front stage) and the activities which they do
not see (backstage) but which participate to the quality of the offered service
- Recognize the variability in the process (Ex: when going to the hairdresser, it can take just 10min or more if
you ask for a color,…)
Have a global idea of your services, to identify the different kind of activities and identify if there’s a problem, where it’s located
22
Blueprint advantages
- Give a vision of the totality of the process of delivery - Define the moments when the customer uses the main service - Identify the supplementary services which compose the service - Identify the types of problems and take precautionary measures - Stimulate the creativity to develop the service
a) Measurement models
- North American Model of SERVQUAL (Parasuraman, Zeithaml et Berry, 1988, 1990) o SERVPERF: Cronin and Taylor (1992, 1994)’s adaptation
- Nordic model of service quality (Grönroos, 1984) o Rust and Oliver (1994)’s adaptation
- Integration of North American and Nordic models in a hierarchical perspective (Brady and Cronin, 2001)
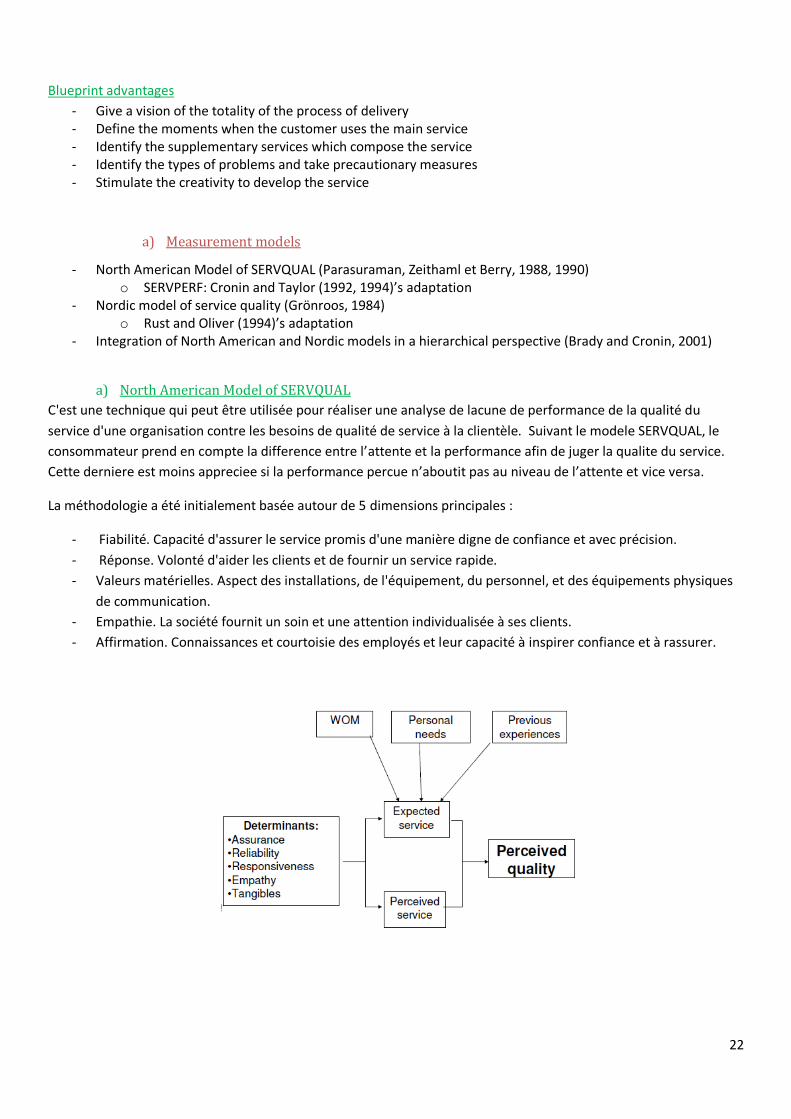
a) North American Model of SERVQUAL
C'est une technique qui peut être utilisée pour réaliser une analyse de lacune de performance de la qualité du
service d'une organisation contre les besoins de qualité de service à la clientèle. Suivant le modele SERVQUAL, le
consommateur prend en compte la difference entre l’attente et la performance afin de juger la qualite du service.
Cette derniere est moins appreciee si la performance percue n’aboutit pas au niveau de l’attente et vice versa.
La méthodologie a été initialement basée autour de 5 dimensions principales :
- Fiabilité. Capacité d'assurer le service promis d'une manière digne de confiance et avec précision.
- Réponse. Volonté d'aider les clients et de fournir un service rapide.
- Valeurs matérielles. Aspect des installations, de l'équipement, du personnel, et des équipements physiques
de communication.
- Empathie. La société fournit un soin et une attention individualisée à ses clients.
- Affirmation. Connaissances et courtoisie des employés et leur capacité à inspirer confiance et à rassurer.

23
Reliability Ability to perform the promised service dependably and accurately
Assurance Knowledge and courtesy of employees and their ability to convey trust and confidence
Tangibles Appearance of physical facilities, equipment, personnel and communication materials
Empathy Provision of caring, individualised attention to customers
Responsiveseness Willingness to help customers and to provide prompt service
SERVQUAL CONTRIBUTIONS
- Determine the relative importance of the five dimensions in quality perceptions
- Categorize customers into various segments according to their respective expectations
- Improvement ideas
- Benchmark between various units of the company or between the competitors offering the same type of
service
- Used in a repeated way, measure the evolution of the expectations and the perceptions of the customers
over time
SERVQUAL CRITICISMS
- Particular properties of the industries?
- Timing of the measure
- Customers do not have clearly formed expectations: the disconfirmation approach is inappropriate
b) SERVPERF Cronin and Taylor adaptation
Cronin et Taylor (1992) critiquent aussi le modele SERVQUAL. Il manque de pertinence au niveau conceptuel. Donc,
ils developpent et testent le modele SERVPERF, non le modele SERVQUAL de PZB, qui n’evalue la qualite percue que
sur la base de la performance. Ils veulent objectiviser, a travers une analyse empirique, la causalite entre la qualite
du service et la satisfaction du consommateur. Ils tentent egalement de constater l’effet de la qualite et
de la satisfaction sur le rachat de consommateur.
Le point fort du modele SERVPERF est que le chercheur peut reduire le nombre de questions de l’enquete jusqu’a
50% par rapport au modele SERVQUAL. Ce modele conduit le fournisseur de service a une meilleure concentration
sur la satisfaction du consommateur qu’a la qualite du service. Les auteurs mettent l’accent sur le fait que
l’entreprise doit se centrer sur la satisfaction du consommateur plutot que sur la qualite si son objectif est
d’ameliorer l’intention de rachat au moyen de ressources limitees.
- The performance ONLY seems to predict purchase intentions as well as the complete model including
expectations
- The consumers modify their perceptions about performances according to the distance which exists
between expected and perceived performances _Redundancy (Woodruff, Cadotte and Jenkins, 1983)
- Managers often measure the determinants of global satisfaction and perceived quality by asking to assess
the performance of the firm

24
SERVPERF CONTRIBUTIONS
- Measure of twice fewer items
- Easier for consumers - it is difficult to estimate separately expectations and perceived performances
particularly when the survey is carried out after purchase
- Easier for analysts - it does not belong to the analyst to do the confrontation between customers’
expectations and perceived performance
c) Nordic model of service quality (Grönroos, 1984) Rust and Oliver (1994)’s adaptation
Grönroos (1990) identifie en se basant sur les travaux de Swan et Combs (1976), deux dimensions de la qualité de
service à savoir la qualité technique et la qualité fonctionnelle :
La qualité technique : c'est ce que le client reçoit « the what » (le pourquoi). Elle est directement liée au contenu et
renvoie au résultat.
La qualité fonctionnelle : c'est le processus de service, ce que le client perçoit « the how » (le comment du service).
Elle est fondée sur le jugement du consommateur sur la manière dont le contenu de service lui est transféré par le
prestataire.
Il ajoute un troisième élément qui, dans certains cas, peut être une variable du modèle, « la corporate image »
(l'image de l'entreprise).
On peut retenir à titre d'exemple que les tâches effectuées par l'employé au cours de la prestation de service
relèvent de la qualité technique. Tandis que son comportement devant le client constitue la qualité fonctionnelle.
La qualité fonctionnelle est prépondérante dans le processus de perception de la qualité globale. Autrement dit la
qualité fonctionnelle est souvent plus importante que la qualité technique dans la détermination de la qualité
perçue. Cependant, ces deux qualités ne sont pas indépendantes, une bonne qualité fonctionnelle peut faire oublier
dans certains cas les problèmes temporaires de la qualité technique.

25
Technical The quality of the outcome of a service performance
Functional The quality of the performance of a service
Reputation The quality of the service organisation’s image
NORDIC MODEL CONTRIBUTIONS
- brings to light the importance to improve the interactions between customers and employees (functional
quality which can be more important than technical quality)
o explanatory power much bigger than the SERVQUAL in contexts where the functional dimension of
the services is more pronounced
- Much more economic, easier to administer that the SERVQUAL
d) Rust and Oliver’s adaptation
Ces auteurs ont déterminé trois composantes de la qualité : le service produit (la qualité technique), le service
délivré (la qualité fonctionnelle) et l'environnement de service. En plus des dimensions de Grönroos, Rust et Oliver
proposent de prendre en compte l'environnement dans lequel se déroule le service.
e) Integration of North American and Nordic models in a hierarchical perspective (Brady and Cronin,
2001)
Brady et Cronin, ont identifié et testé une conceptualisation hiérarchique de la qualité de service qui propose trois
niveaux : une perception globale de la qualité de service ; des dimensions primaires et des sous dimensions. Ces
modèles présentent la qualité comme un construit multidimensionnel et hiérarchique, ils reconnaissent la pluralité
des facettes et dimensions de la qualité perçue.
26
BRADY AND CRONIN MODEL’S CONTRIBUTIONS
- Adapt the questions asked according to survey objectives - Identify improvements - Identify customers' segments - Benchmarking
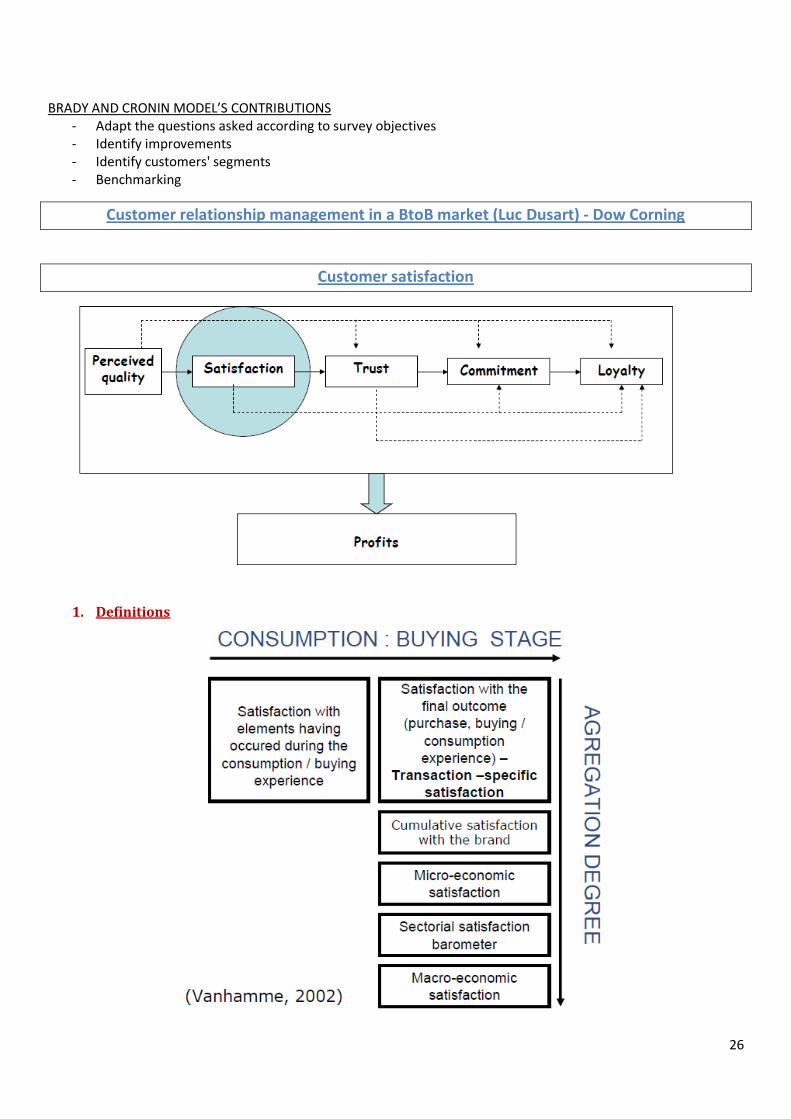
Customer relationship management in a BtoB market (Luc Dusart) - Dow Corning
Customer satisfaction
1. Definitions

27
- Micro-economic satisfaction: put together the degree of satisfaction of all consumers, idea of the global
evaluation of all consumers
- Sectorial satisfaction barometer: not for one cie but for one sector
- Macro-economic satisfaction: satisfaction of all consumers (well-being of Belgian people) Information in the
newspaper
3. Transaction-specific satisfaction
A summary psychological state resulting when the emotion surrounding disconfirmed expectations is coupled with
the consumer’s priori feeling about the consumption experience (Oliver, 1981)
Psychological state resulting from buying and/or consumption experience (posterior to this experience) and relative
(Vanhamme, 2002)
« Psychological state… »
- Not directly visible
- Different from behavioral consequences (WOM, repurchase, complaints…)
- Affective – cognitive duality
« … resulting from buying and/or consumption experience …»
- Subject of evaluation
Buying experience
Consumption experience
Both
« … relative »
- Comparaison between subjective experience and reference base
- Expectancy-performance disconfirmation paradigm
b) Expectations based on promises
“I expect to have my car serviced within 2 days of calling the garage”
c) Expectations based on desires
“I want my car serviced the day I call the garage”
d) Expectations based on experience
“Most folks normally have to wait 3 days to have their car serviced”
e) Expectations based on ideals
“My car should be serviced overnight and delivered to my home the next morning”

28
- Norm based on the best product in the category
- Norm based on the preferred brand in the category
- Taking into account the type of product to choose a reference standard
- Consumer could simultaneously use different standards
4. Cumulative satisfaction
Overall evaluation based on the total purchase and consumption experience with a good or a service over time
(Anderson, Fornell and Lehmann, 1994)
5. Customer satisfaction in B2B
Exchanges between buyers and sellers as the result of relationships instead of discrete transactions (Anderson and
Narus, 1990 ; Dwyer, Schurr and Oh, 1987 ; Frazier, Spekman and O’Neil, 1988 ; Heide and John, 1992)
- Buying process: several weeks or months
- Frequent interaction
In B2B, hard to measure transaction-specific satisfaction, without taking into account the different previous
experiences
- Group decision-making by the buying center
In B2B, essential to consider the evaluation of all people in contact with the supplier
- Satisfaction based on a global judgement of experience with the seller (products + services + relationships)
In B2B, essential to take into account cognitive as well as affective aspects
« A psychological state resulting from the comparison between expectations and performances perceived by the
different members of the buying center ; this comparison being a global evaluation based on the total amount of
purchases, consumption and relationship experiences with the supplier of products/services over time » (Chumpitaz
and Swaen, 2004)
2. Satisfaction / Dissatisfation
- Satisfaction as a uni-dimensional continuum (from very satisfied to very disatisfied)
- However, some authors consider satisfaction as a different construct as dissatisfaction (Maddox, 1981 ;
Mackoy and Spreng, 1995)
- On the basis of the two-factors approach (Herzberg, Mausner and Snyderman, 1959)
Motivating factors (only contribute to satisfaction or absence of satisfaction)
Hygienic factors (only contribute to dissatisfaction or absence of dissatisfaction)
29
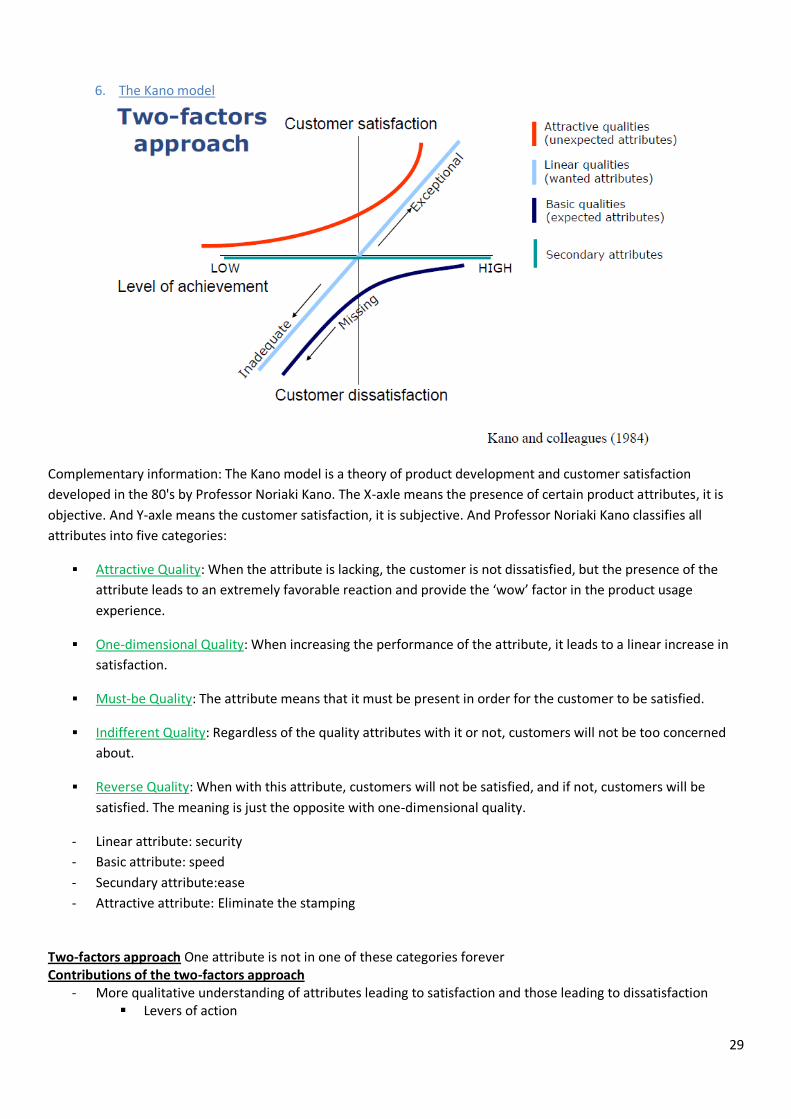
6. The Kano model
Complementary information: The Kano model is a theory of product development and customer satisfaction
developed in the 80's by Professor Noriaki Kano. The X-axle means the presence of certain product attributes, it is
objective. And Y-axle means the customer satisfaction, it is subjective. And Professor Noriaki Kano classifies all
attributes into five categories:
Attractive Quality: When the attribute is lacking, the customer is not dissatisfied, but the presence of the
attribute leads to an extremely favorable reaction and provide the ‘wow’ factor in the product usage
experience.
One-dimensional Quality: When increasing the performance of the attribute, it leads to a linear increase in
satisfaction.
Must-be Quality: The attribute means that it must be present in order for the customer to be satisfied.
Indifferent Quality: Regardless of the quality attributes with it or not, customers will not be too concerned
about.
Reverse Quality: When with this attribute, customers will not be satisfied, and if not, customers will be
satisfied. The meaning is just the opposite with one-dimensional quality.
- Linear attribute: security
- Basic attribute: speed
- Secundary attribute:ease
- Attractive attribute: Eliminate the stamping
Two-factors approach One attribute is not in one of these categories forever Contributions of the two-factors approach
- More qualitative understanding of attributes leading to satisfaction and those leading to dissatisfaction Levers of action

30
Minimum level on basic attributes o Essential to prevent customer dissatisfaction o Do not create satisfaction (not overinvesting)
High performance on linear attributes that translate customer requirements High performance on attractive attributes because of their strong contribution to satisfaction
3. Antecedents of consumer satisfaction
1. Consumer attributions:
what people perceive as being the cause of their behavior, the behavior of the others or the events which they
observe (Bitner, on 1990)
- Locus: internal / external
- Controllability: low / high
2. Equity:
Evaluation of the justice in the exchange which is based on the comparison between the ratios
of costs and of benefits of seller and buyers or between one buyer and the other buyers (Oliver et Swan, 1989a/b)
3. Affective reactions
4. Perceived quality
Three main differences between perceived quality and customer satisfaction (Rust and Oliver, 1994 ; Oliver, 1997 ; Vanhamme, 2002)
- Necessary to have experiment the product/service to express satisfaction - Quality judged in reference to a standard of excellence - Quality essentially a cognitive concept / Satisfaction: cognitive and affective
Accumulation of evaluations specific to a transaction leads to a global evaluation of perceived quality (Bitner, 1990; Bitner and Hubbert, 1994; Bolton and Drew, 1991)
- Quality as an antecedent of satisfaction (Majority of research; Brown and Swartz, 1989 MacKenzie and Hardy, 1996 ; Schellhase, Hardock and Ohlwein, 1999)
- According to the product/service, consumer features and consumer mood in the buying / consumption situation, order of influence can vary (Ngobo, 1997)
31
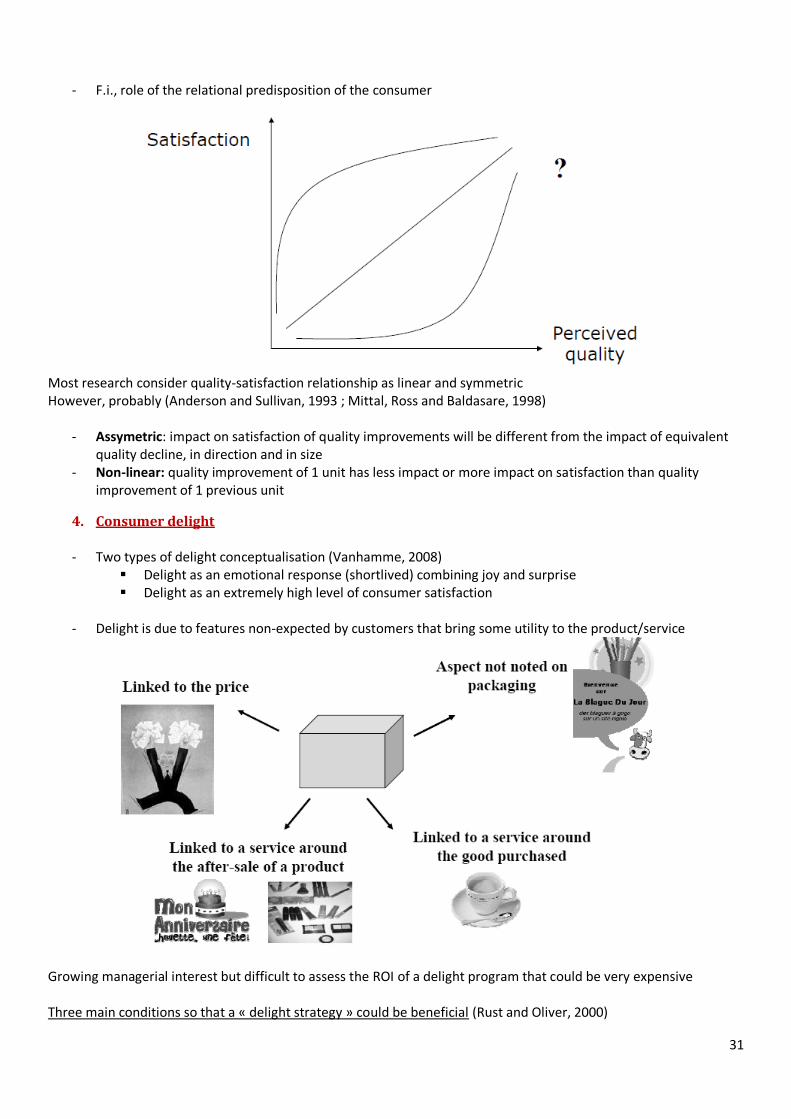
- F.i., role of the relational predisposition of the consumer
Most research consider quality-satisfaction relationship as linear and symmetric However, probably (Anderson and Sullivan, 1993 ; Mittal, Ross and Baldasare, 1998)
- Assymetric: impact on satisfaction of quality improvements will be different from the impact of equivalent quality decline, in direction and in size
- Non-linear: quality improvement of 1 unit has less impact or more impact on satisfaction than quality improvement of 1 previous unit
4. Consumer delight
- Two types of delight conceptualisation (Vanhamme, 2008) Delight as an emotional response (shortlived) combining joy and surprise Delight as an extremely high level of consumer satisfaction
- Delight is due to features non-expected by customers that bring some utility to the product/service
Growing managerial interest but difficult to assess the ROI of a delight program that could be very expensive Three main conditions so that a « delight strategy » could be beneficial (Rust and Oliver, 2000)

32
- All the causes of dissatisfaction must be resolved first - Consumer satisfaction must be linked to consumer behaviors with respect to the company - The delight program should be focused on one aspect of quality that can not be easily imitated by
competitors or when competitors are temporarily unable to react
5. Measurement of consumer satisfaction
5. Objective measures
- Number of breakdowns, of complaints, degree of use of guarantees or number of calls to the after-sale service
- Measures mostly used to measure dissatisfaction
6. Subjective measures
- Ask questions to consumers
f) Transaction-specific satisfaction (Oliver, 1980): Measurement
Indicate your degree of agreement with the following statements (from 1 ‘totally disagree’ to 5 ‘totally agree’)
- I am satisfied with my decision to buy this product - My choice to buy or not to buy this product was a wise one - If I had it to do all over again, I would feel differently about the product I bought (r) - I feel bad about my decision concerning this product (r) - I am not happy that I did what I did about this product (r) - I think that I did the right thing when I decided to buy this product
g) Transaction-specific satisfaction (Oliver, 1997)
Indicate your degree of agreement with the following statements, from 1 ‘totally disagree’ to 10 ‘totally agree’
- This is one of the best product I could have bought - This product is exactly what I need - This product was not as good as I thought it would (r) - I am satisfied with this product - Sometimes I have mixed feelings about keeping this product (r) - My choice to buy this product was a wise one - If I could do it over again, I’d buy a different product (r) - I have truly enjoyed this product - I feel bad about my decision to buy this product (r) - I am not happy that I bought this product (r) - Owning this product has been a good experience - I am sure it was the right thing to buy this product
33
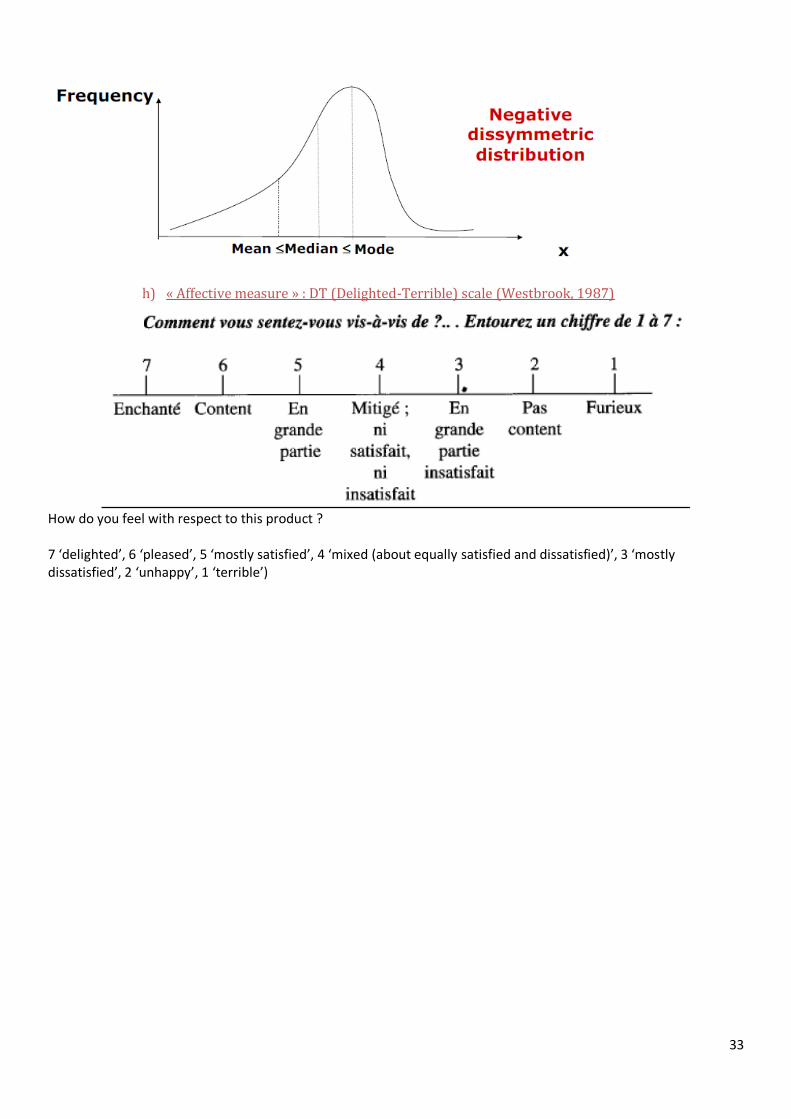
h) « Affective measure » : DT (Delighted-Terrible) scale (Westbrook, 1987)
How do you feel with respect to this product ? 7 ‘delighted’, 6 ‘pleased’, 5 ‘mostly satisfied’, 4 ‘mixed (about equally satisfied and dissatisfied)’, 3 ‘mostly dissatisfied’, 2 ‘unhappy’, 1 ‘terrible’)

34
i) Cumulative satisfaction (Olsen and Johnson, 2003)
- Think about an ideal bank. Looking back at your experiences so far with the bank, how far from or close to do
you think Bank X is to the ideal bank? (scale from 1 ‘very far’ to 10 ‘very close’)
- To what degree does the bank fall short of or exceed your expectations overall? (scale from 1 ‘falls short of
expectations’ to 10 ‘exceeds expectations’)
- How satisfied or dissatisfied are you overall with the bank? (scale from 1 ‘very dissatisfied’ to 10 ‘very
satisfied’)
j) Measures by sub-process or attribute
7. Importance / performance grid
Complementary information: An attribute can be considered as very important by a buyer and not be perceived as present in a particular brand. The problem then is whether to reinforce the attribute's presence in the product or to use better communication to increase awareness and/or conviction about the attribute's presence. To confront importance and performance scores, it is convenient to use a matrix similar to the one presented in Figure Web 4.1 (overleaf), where the attributes of a brand are situated along two dimensions (Martilla and James, 1977).
35
The horizontal axis indicates the importance of the attributes (from low to high) and the vertical axis represents their perceived performance (from low to high). The placement of attributes on this two-dimensional grid suggest the suitable strategy for each.
- Strengths are located in the upper-right quadrant. These are the attributes evaluated high both in importance and performance. The brand has a strong image for these criteria, which must be highlighted in the communication.
- Weaknesses are located in the quadrant just below. These attributes are high in importance but rated low in performance. In this case the firm has to act and make efforts to improve its performance.
- False sense of security attributes are located in the upper left quadrant. These are the attributes rated high
in performance but low in importance. This implies that an overkill has occurred. Perhaps the resources committed to these attributes should be reallocated.
- False strengths are located in the quadrant just below. These attributes are rated low both in importance and performance. They are considered low priority and hence require no additional action.
In a B2B context, use multiple informants - All informants could complete the entire questionnaire
o Ability to judge supplier’s quality on all dimensions? o How to integrate the answers of those different informants?
- Each informant fill in different parts of the questionnaire according to their skills and roles in the buying center
o Create a double variance in the data (firm/individual)
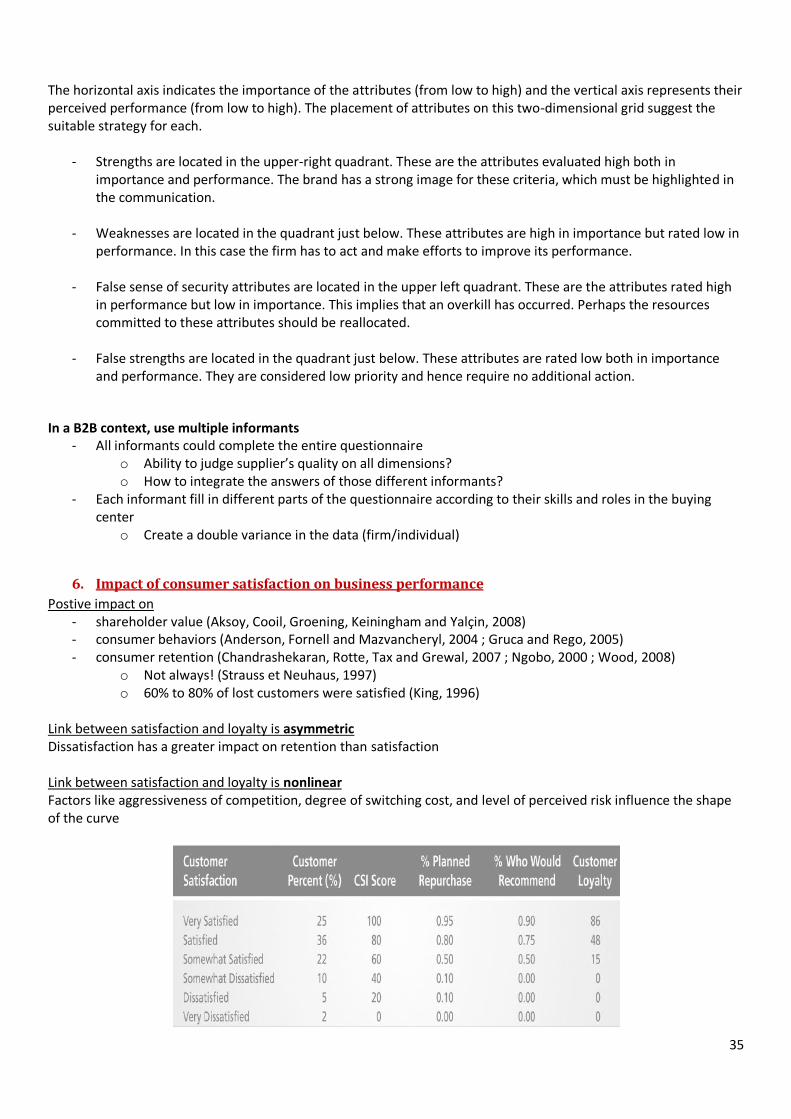
6. Impact of consumer satisfaction on business performance
Postive impact on - shareholder value (Aksoy, Cooil, Groening, Keiningham and Yalçin, 2008) - consumer behaviors (Anderson, Fornell and Mazvancheryl, 2004 ; Gruca and Rego, 2005) - consumer retention (Chandrashekaran, Rotte, Tax and Grewal, 2007 ; Ngobo, 2000 ; Wood, 2008)
o Not always! (Strauss et Neuhaus, 1997) o 60% to 80% of lost customers were satisfied (King, 1996)
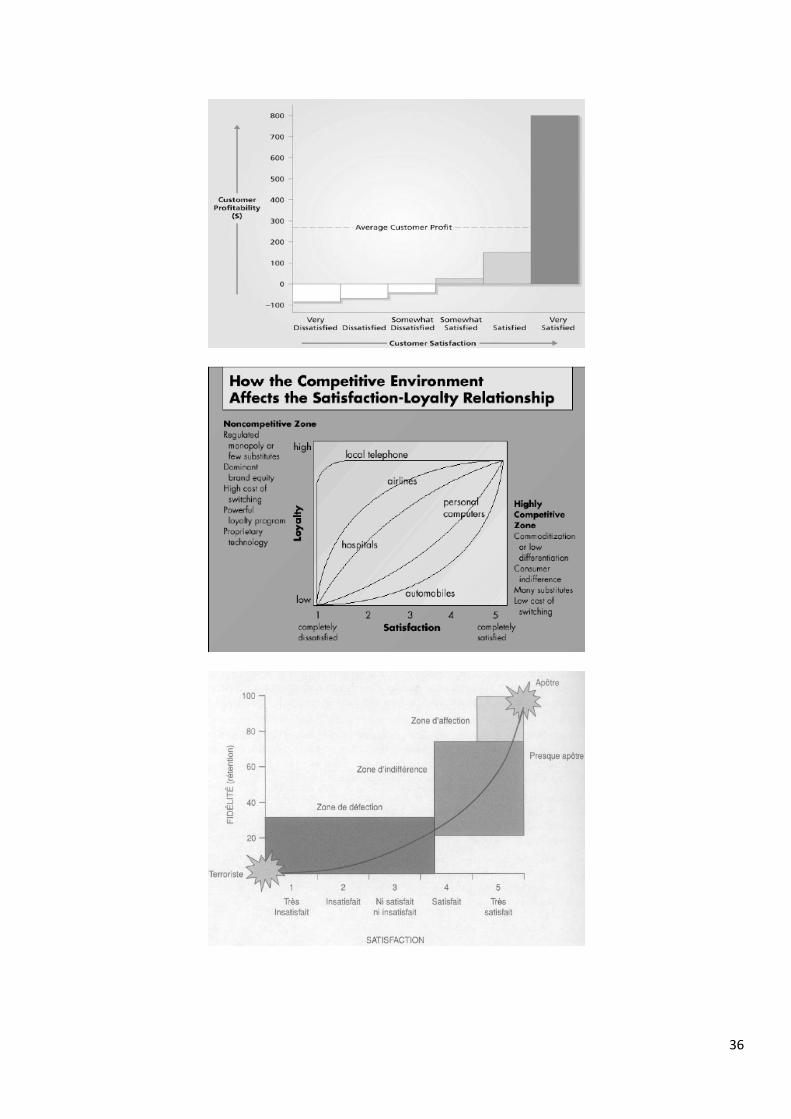
Link between satisfaction and loyalty is asymmetric Dissatisfaction has a greater impact on retention than satisfaction Link between satisfaction and loyalty is nonlinear Factors like aggressiveness of competition, degree of switching cost, and level of perceived risk influence the shape of the curve
36

37
- Terrorist: they don’t like your product and are likely to talk badly about the brand to other people - Apostel: so happy, opinion leader, motivate people to buy your brand - Defection zone: really dissatisfied people, not remain with you (if they have the opportunity to change to
something else) - Indifference zone: people just consider you as good enough, maybe they will stay (depend on the switching
costs,…) - Affection zone: they do not want to search for alternatives (ideal case for the company)
Moderating variables in the relationship between satisfaction and loyalty For instance, variety seeking
1. Most frequent constraint:
- The product you want to buy is not there: you’re sometimes ready to wait for another time (I’ll find it because it will appear in the shelves a few hours after, I will come back for it).
- The location (not near your home) - Price
Problem: if you are forced to test another product and you like it, you’re likely to switch from brand (change the degree of loyalty to a brand).
2. Environmental pressure: - New product that arrives on the market (trend)
3. Preference changes:
- You have health problems and have to change your way of eating (ex: to much cholesterol)
4. Need for stimulation: - You get bored of a brand and want to test something else
Ex: Nestlé, they offer a large panel of desert to stimulate the need for stimulation, the curiosity of people, develop this to keep consumers that want variety (instead of buying another brand)
38
7. Concluding issues
- Is it always relevant to measure customer satisfaction?
« I wanted to buy that product or that service, I have it, that’s it »
- Negative consequences linked to the growing number of satisfaction surveys
One-to-one marketing : a dream or a reality ? (Philippe Wallez - ING)
Customer satisfaction and loyalty (Jean-Pierre Goderis - Business Advice)
Customer trust
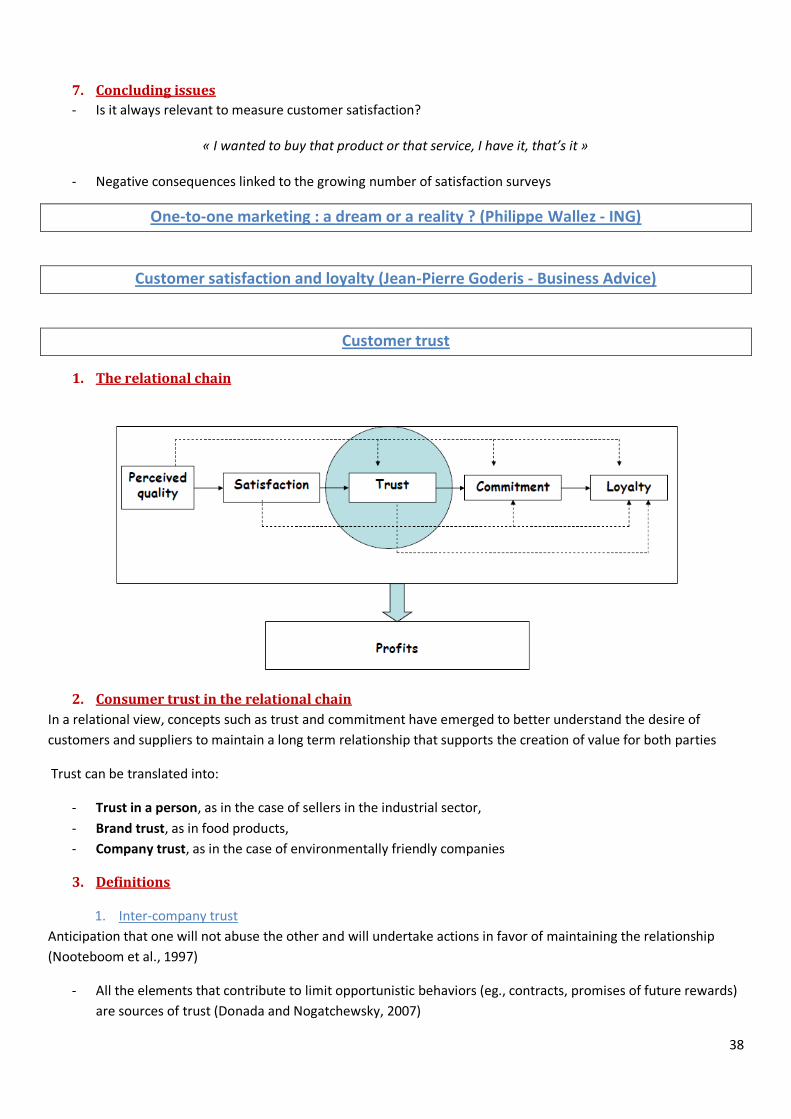
1. The relational chain
2. Consumer trust in the relational chain
In a relational view, concepts such as trust and commitment have emerged to better understand the desire of
customers and suppliers to maintain a long term relationship that supports the creation of value for both parties
Trust can be translated into:
- Trust in a person, as in the case of sellers in the industrial sector,
- Brand trust, as in food products,
- Company trust, as in the case of environmentally friendly companies
3. Definitions
1. Inter-company trust
Anticipation that one will not abuse the other and will undertake actions in favor of maintaining the relationship
(Nooteboom et al., 1997)
- All the elements that contribute to limit opportunistic behaviors (eg., contracts, promises of future rewards)
are sources of trust (Donada and Nogatchewsky, 2007)

39
Trusting a partner is believing that it can and will act in a positive way (Donada and Nogatchewsky, 2007)
- Attributions of characteristics, motives and intentions to assess the predictability of partner’s behaviors
Inter-company trust dimensions - Benevolence. A belief that one party acts in the interests of the other - Honesty. A belief that the other party’s word is reliable or credible - Competence. A belief that the other party has the necessary expertise to perform as required
2. Final consumer trust
k) Institutional trust (eg, brand trust, retail store trust)
- A set of beliefs about the fact that the intentions and behaviors of its partner will produce the expected results (Frisou, 2000)
- A willingness to rely on the ability of the company / brand to fulfill its expected function (Chaudhuri and Holbrook, 2001)
- A set of accumulated presumptions about the credibility, integrity and benevolence that the consumer
attributes to the brand (Gurviez, 1999; Gurviez and Korchia, 2002)
Brand trust reflects the belief that the brand will take care of its consumers even in difficult situations (Delgado-Ballester, 2002)
Institutional trust dimensions Depending on the context (eg., sector of activity), these three facets of trust can be summarized in one or two
o One dimension o Two dimensions
o Credibility o Benevolence
o Three dimensions o Competence o Honesty o Benevolence
l) Interpersonal trust (eg, trust in a salesman)
The seller may be considered as reliable; as acting in a manner that serves the long-term interests of consumers
"Is he going to keep its promises?“ “Will he give us reliable information about the product/service?“
Even early in the relationship => Importance of the first impression
o An affective side which covers the feeling of security or insecurity felt by the client who relies on a seller o A cognitive side that concerns the beliefs of customers regarding the skills and motivations of the seller to
serve them effectively
Difficult to differentiate institutional trust from interpersonal trust

40
o Characteristics of the selling company - such as the degree of customer focus and its ethics policies - can influence customer trust in the company but also the trust of customers in the sellers of this company (Kennedy, Ferrell and Thorne LeClair, 2001)
o Holden (1990) proposes that all the factors that contribute to customer trust in the seller also positively influence customer trust in the company by a halo effect
Interpersonal trust is an issue often badly managed bycompanies Trust emerges as parties share experiences, and interpret and assess each other’s motives Trust evolves over time Calculus-Based Trust in the early stages of a relationship Quite calculative: “I trust you because of what I am gaining or expect to gain from the relationship” Knowledge-Based Trust relies on the parties’ interactive history and knowledge of each other, allowing each to make accurate predictions about the how the other will act Identification-Based Trust when mutual understanding is so deep that each can act as substitute for the other in interpersonal interaction
4. Trust and distrust
5. Factors contributing to consumer trust
1. Inter-company trust
intrinsic characteristics of partners (size, expertise) in their environment (reputation, performance, market orientation) characteristics of the dyad (interdependence of the partners, power balance, specific investments, shared values, objectives convergence and duration of their relationship) characteristics of the exchange - process of cooperation (cooperative behavior, opportunism, conflicts), quality of interactions (communication, frequency of contact) and affinities between individuals involved in the exchange (friendliness, similarity and satisfaction)
41
2. Interpersonal trust
characteristics of the seller (friendliness, benevolence and competence of the seller, similarity between the seller and the customer) characteristics of the selling company (corporate reputation, customer focus, quality of products offered)
6. Measurement of consumer trust
7. Impact of consumer trust on business performance
Trust is considered as an essential factor of stability in:
- Human and personal relationships (Johnson-George and Swap, 1982 ; Rotter, 1980)
- Intercompany relationships (Hosmer, 1995 ; Mayer, Davis and Schoorman, 1995)
- Relationships between companies and customers (Chaudhuri and Holbrook, 2001 ; Gurviez and Korchia,
2002)
Intercompany trust:
- Motivates companies to cooperate (Mayer, Davis and Schoorman, 1995 ; Morgan and Hunt, 1994)
- Reduces transaction costs by exploiting the complementary skills of partners (Jones, 1995)
- Improves the ability of the firm to adapt to the complexity and market changes (McAllister, 1995)
Too much trust can also be harmful when the partners decide not to put into place monitoring and protecting
mechanisms (Sheppard and Sherman, 1998)
- Partners, too confident, do not worry enough to check if the partner behaves as expected
- Example : Danone made too much trust in the waaa group so it lose a lot of money.
The loss of trust or distrust of the partners can be very damaging
After the scandals involving companies such as Enron, WorldCom and Arthur Andersen, the managers were able to
realize how much suspicion, cynicism, distrust and disappointment of the Stakeholders could pull down the share
price, weaken the recruitment of employees, and cause the departure of customers to competition (Golin, 2003)
42
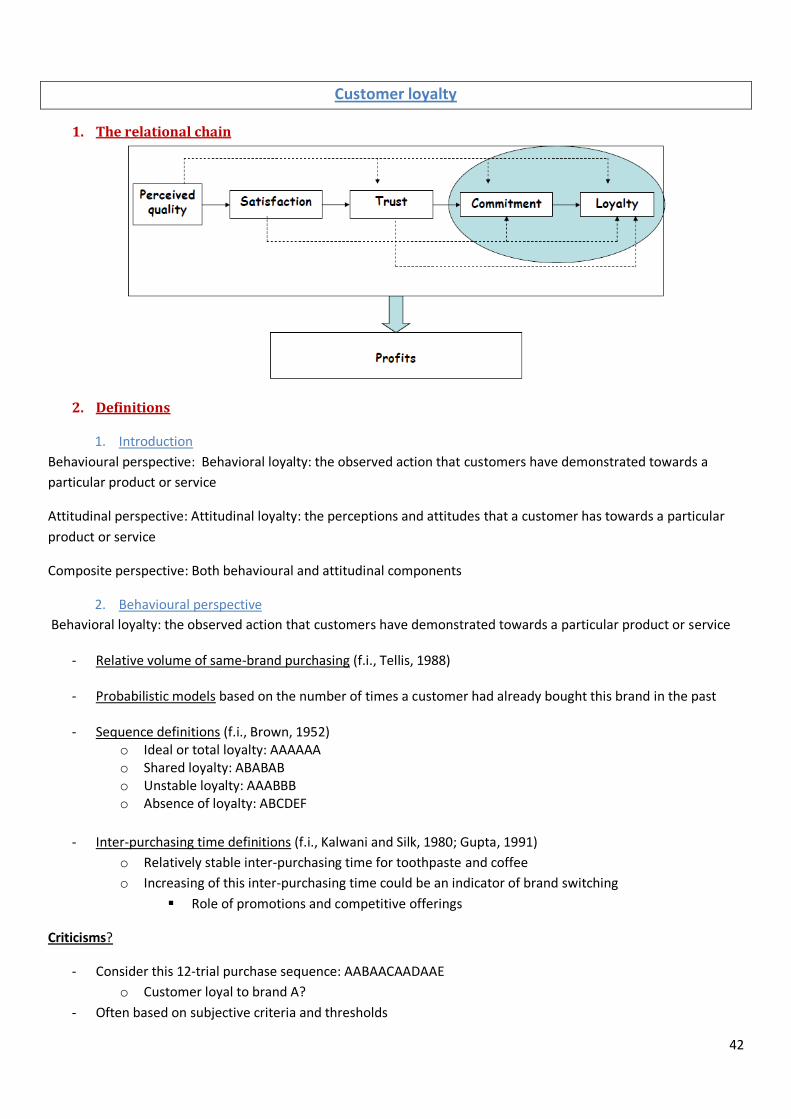
Customer loyalty
1. The relational chain
2. Definitions
1. Introduction
Behavioural perspective: Behavioral loyalty: the observed action that customers have demonstrated towards a
particular product or service
Attitudinal perspective: Attitudinal loyalty: the perceptions and attitudes that a customer has towards a particular
product or service
Composite perspective: Both behavioural and attitudinal components
2. Behavioural perspective
Behavioral loyalty: the observed action that customers have demonstrated towards a particular product or service
- Relative volume of same-brand purchasing (f.i., Tellis, 1988)
- Probabilistic models based on the number of times a customer had already bought this brand in the past
- Sequence definitions (f.i., Brown, 1952) o Ideal or total loyalty: AAAAAA o Shared loyalty: ABABAB o Unstable loyalty: AAABBB o Absence of loyalty: ABCDEF
- Inter-purchasing time definitions (f.i., Kalwani and Silk, 1980; Gupta, 1991)
o Relatively stable inter-purchasing time for toothpaste and coffee
o Increasing of this inter-purchasing time could be an indicator of brand switching
Role of promotions and competitive offerings
Criticisms?
- Consider this 12-trial purchase sequence: AABAACAADAAE
o Customer loyal to brand A?
- Often based on subjective criteria and thresholds
43
- Why this repeat behaviour?
- A single uni-dimensional measure is insufficient for measuring such a complex multi-dimensional
phenomenon
3. Attitudinal perspective
Attitudinal loyalty: the perceptions and attitudes that a customer has towards a particular product or service
- Important to consider the reason underlying such behaviour - Analysis of consumer beliefs, attitudes, preferences, and intentions to behave - But verbal reports of bias (e.g., statements of preference or intention to buy) are insufficient for defining BL
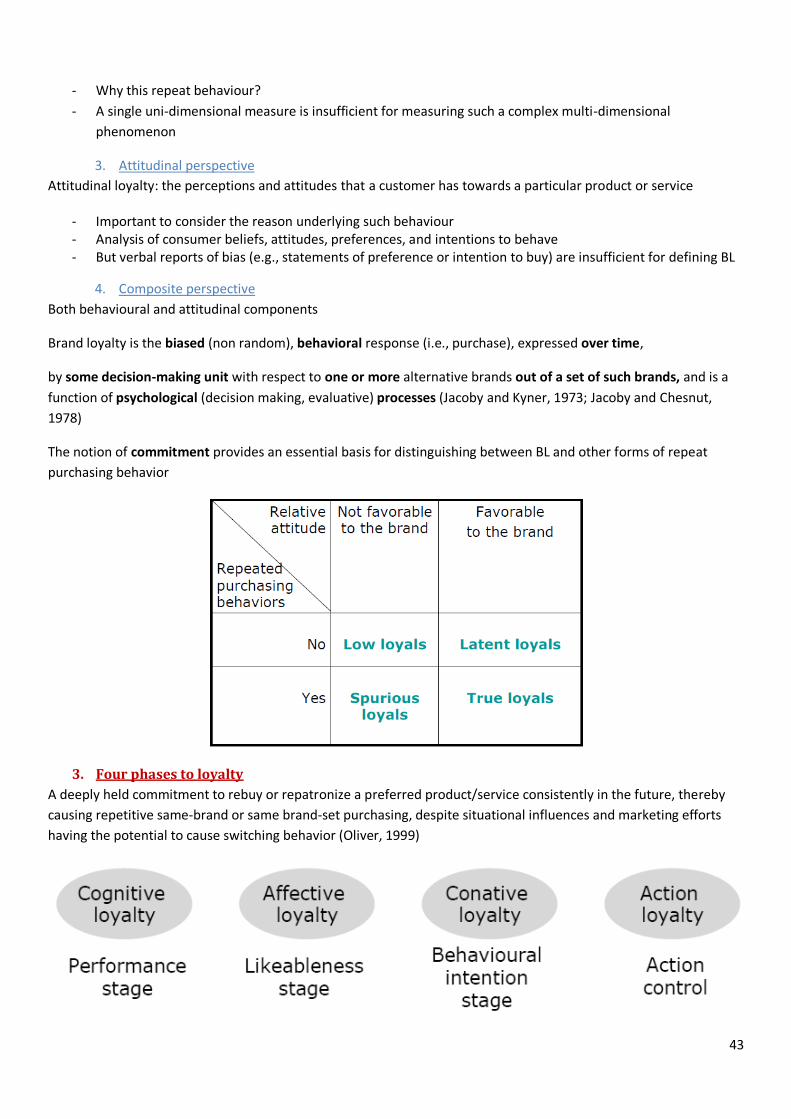
4. Composite perspective
Both behavioural and attitudinal components
Brand loyalty is the biased (non random), behavioral response (i.e., purchase), expressed over time,
by some decision-making unit with respect to one or more alternative brands out of a set of such brands, and is a
function of psychological (decision making, evaluative) processes (Jacoby and Kyner, 1973; Jacoby and Chesnut,
1978)
The notion of commitment provides an essential basis for distinguishing between BL and other forms of repeat
purchasing behavior
3. Four phases to loyalty
A deeply held commitment to rebuy or repatronize a preferred product/service consistently in the future, thereby
causing repetitive same-brand or same brand-set purchasing, despite situational influences and marketing efforts
having the potential to cause switching behavior (Oliver, 1999)

44
Cognitive: Because it’s the best deal, the customer buys the product.
Affective: I like this brand, link to the satisfaction, harder for the competitors
Conative: Loyalty based on a good satisfaction, affective, behave over time
Action: All the previous stages+action
- Probability of switching depends on the phase of loyalty
- Not always possible to attain the final phase
- Could be useful to segment consumers
- But not easy to identify in which phase consumers are
It’s not easy to use because hard to measure where the customers are.
- Different degrees of loyalty
- Useful to segment consumers: if you know where they are, the cie can develop the brand personality. If
affective stage, how to make them buy the product?
- Probability of switching depends on the phase of loyalty
- It is not always possible to attain the final phase › Less involving products as detergent
- But not easy to identify in which phase consumers are
Example: Kodak: this attachment is there only for cognitive reasons, not a real attachment, the reason is just
because that was the best deal.
Example: Carte Noire: play on sensibility, affective link with the customers; create a very strong attachment, highest
rate of purchase
4. Commitment and loyalty
Commitment as the distinctive element between true loyalty and spurious loyalty (Bloemer and Kasper, 1995) - Organizational commitment (f.i., Allen and Meyer, 1990)
- Inter-company commitment (f.i., Morgan and Hunt, 1994; Anderson and Weitz, 1992)
- Brand commitment: « an implicit or explicit intention to maintain a durable relationship with a brand,
leading to an affective attachment to this brand and having positive consequences on consumer loyalty » (Gurviez, 1999)
- Affective commitment (“affective attachment to brand values and objectives”)
- Calculative commitment (“instrumental utility linked to keeping this brand in comparison to switching”)
- Normative commitment (“moral obligation”)
Three main consequences of consumer commitment:
- Repurchase (Amine, 1999) - Resistance to competition changes (Debling, 1998 ; Terrasse, 2003) - Resistance to punctual dissatisfaction (Gurviez, 1999)
5. Multi-loyalty

45
Loyalty is not exclusivity!
Multi-loyalty (Dufer and Moulins, 1989)
6. Measurement of commitment and loyalty
1. Measurement of commitment
a) Bloemer and Kasper (1995)
- I consider myself to be highly loyal to one brand of blank audio cassettes - When another brand is on sale, I will generally purchase it, rather than my usual brand of blank audio
cassettes(r) - If my preferred brand of blank audio cassettes was not available at the store, it would make little difference
to me if I had to choose another brand (r) - If my preferred brand of blank audio cassettes were not available at the store, I will buy another favourite
brand (r) - If my preferred brand of blank audio cassettes were not available at the store, I will go to another store - If I had made a brand choice for blank audio cassettes before actually making the purchase, I might easily
change my intended choice upon receiving discrepant information (r)
b) Garbarino and Johnson (1999)
- I am proud to belong to this theatre - I feel a sense of belonging to this theatre - I care about the long-term success of this theatre - I am a loyal patron of this theatre
c) Terrasse (2002)
- If XYZ brand was no longer available, it would not bother me (r) - I am prepared to pay slightly more for products of XYZ brand - If XYZ brand decided to strongly increase its price ( by approximately 10%), I would switch brands
immediately (r) - If I could not find the products of XYZ brand in the store, I would prefer to wait rather than buy a product of
another brand - It is important to know that one will always be able to buy the products of XYZ brand
d) Fullerton (2005)
- Affective commitment - I feel emotionally attached to Gap - Gap has a great deal of personal meaning for me - I feel a strong sense of identification with Gap
- Calculative commitment - It would be very hard for me to switch away from Gap right now even if I wanted to - My life would be disrupted if I switched away from Gap - It would be too costly for me to switch from Gap right now
46
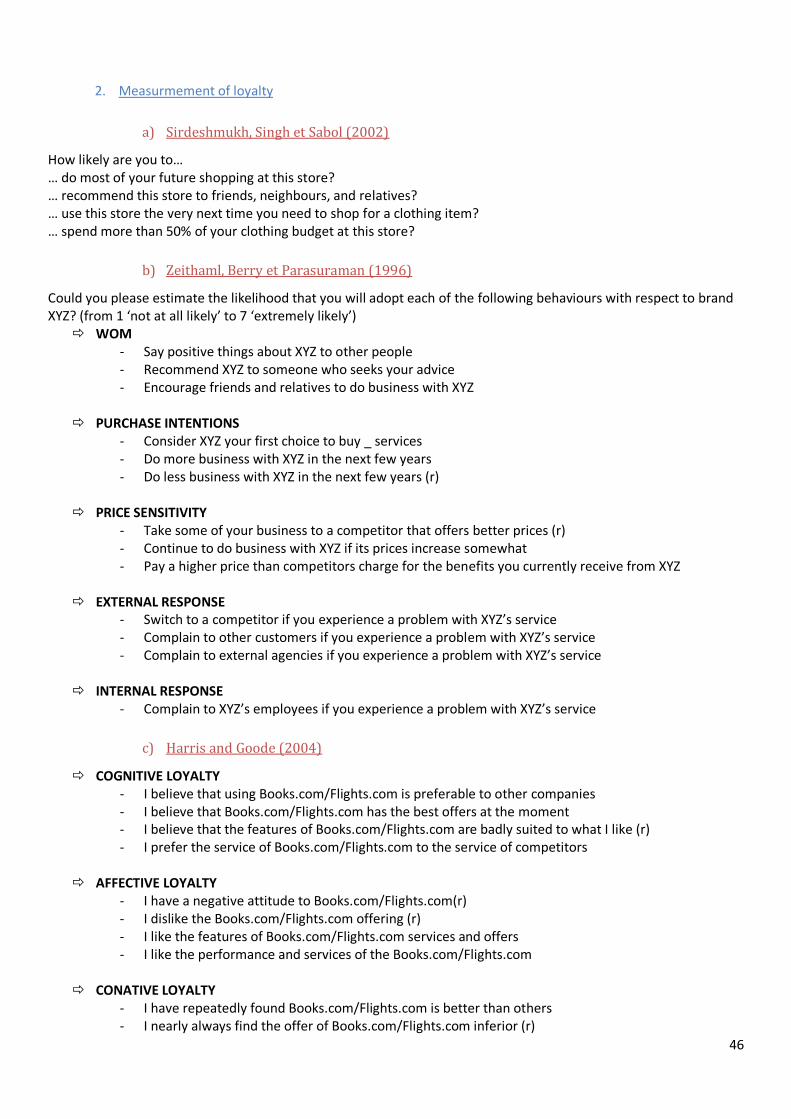
2. Measurmement of loyalty
a) Sirdeshmukh, Singh et Sabol (2002)
How likely are you to… … do most of your future shopping at this store? … recommend this store to friends, neighbours, and relatives? … use this store the very next time you need to shop for a clothing item? … spend more than 50% of your clothing budget at this store?
b) Zeithaml, Berry et Parasuraman (1996)
Could you please estimate the likelihood that you will adopt each of the following behaviours with respect to brand XYZ? (from 1 ‘not at all likely’ to 7 ‘extremely likely’)
WOM - Say positive things about XYZ to other people - Recommend XYZ to someone who seeks your advice - Encourage friends and relatives to do business with XYZ
PURCHASE INTENTIONS
- Consider XYZ your first choice to buy _ services - Do more business with XYZ in the next few years - Do less business with XYZ in the next few years (r)
PRICE SENSITIVITY
- Take some of your business to a competitor that offers better prices (r) - Continue to do business with XYZ if its prices increase somewhat - Pay a higher price than competitors charge for the benefits you currently receive from XYZ
EXTERNAL RESPONSE
- Switch to a competitor if you experience a problem with XYZ’s service - Complain to other customers if you experience a problem with XYZ’s service - Complain to external agencies if you experience a problem with XYZ’s service
INTERNAL RESPONSE
- Complain to XYZ’s employees if you experience a problem with XYZ’s service
c) Harris and Goode (2004)
COGNITIVE LOYALTY - I believe that using Books.com/Flights.com is preferable to other companies - I believe that Books.com/Flights.com has the best offers at the moment - I believe that the features of Books.com/Flights.com are badly suited to what I like (r) - I prefer the service of Books.com/Flights.com to the service of competitors
AFFECTIVE LOYALTY
- I have a negative attitude to Books.com/Flights.com(r) - I dislike the Books.com/Flights.com offering (r) - I like the features of Books.com/Flights.com services and offers - I like the performance and services of the Books.com/Flights.com
CONATIVE LOYALTY
- I have repeatedly found Books.com/Flights.com is better than others - I nearly always find the offer of Books.com/Flights.com inferior (r)

47
- I have repeatedly found the features of Books.com/Flights.com inferior (r) - Repeatedly, the performance of Books.com/Flights.com is superior to that of competitor firms
ACTION LOYALTY
- I would always continue to choose Books.com/Flights.com before others - I will always continue to choose the features of Books.com/Flights.com before others - I would always continue to favour the offerings of Books.com/Flights.com before others - I will always choose to use Books.com/Flights.com in preference to competitor firms
7. Impact of consumer loyalty on business performance
o Mature Industry
- increasing competition between firms for customers
- diminishing product-quality differentiation
o Competitive advantage
- Reduction of 5% of defective customers may result in 80% increase in profitability (Reichheld and
Sasser, 1990)
- Increase of 5% in customer retention may result in 25 to 95% increase in profitability depending on
the industry considered (Oliver, 1999)
- 10 times more expensive to attract a new customer than to retain an existing one (Lindgreen, 2000)
o Loyal customers
- Come back frequently
- Buy most expensive products, are less price sensitive
- Recommend provider to friends (WOM)
- Give important suggestions
- Are attached to the provider/staff
- Trust the provider
- Resist changing despite competitors’ persuasion
- Willing to forgive mistakes
- Cost less to serve per period over time
Conclusion
How to measure loyalty quality,…
Be able to know the theory (theorical question)
Be able to be critical in your answers
- 1 bloc of question about theory (also be critical) (8 points)
- Conferences (4 points) One question for each conferences and choose wich you want to answer
- Case study (8 points) (short, so maybe do some hypothesis) Make link with the course!
48
Customer relationship management in a BtoB market (Luc Dusart) - Dow Corning
s
49
One-to-one marketing : a dream or a reality ? (Philippe Wallez - ING)
l

50
Customer satisfaction and loyalty (Jean-Pierre Goderis - Business Advice)
n


![[Fr] le marketing communautaire : nouvelle tendance du marketing ?](https://img.pdfslide.us/doc/110x75/546e1742af79595e068b5aba/fr-le-marketing-communautaire-nouvelle-tendance-du-marketing-.jpg)