Embed Size (px)
Citation preview
ADVANCED INTEGRATED TPS AND NON EQUILIBRIUM CHEMISTRY INSTRUMENTATION
Monika Auweter-Kurtz, Markus Fertig, Georg Herdrich, Michael Winter Institute of Space Systems (IRS), University of Stuttgart,
Pfaffenwaldring 31, 70550 Stuttgart, Germany
1 INTRODUCTION
Upon entering the atmosphere of celestial bodies, spacecraft encounter gases at velocities of more than 10 km/s, thereby being subjected to great heat loads. This makes it necessary to use high temperature thermal protection systems (TPS) to prevent the destruction of the space vehicle. The TPSs as well as the plasma environment during the entry have to be investigated by means of computational and ground facility simulations. The four plasma wind tunnels PWK 1-4 which are in operation at IRS reproduce thermal, aerodynamic and chemical load on the surface of a space vehicle entering a celestial body’s atmosphere. Various plasma generators have been developed: Magnetoplasmadynamic plasma generators are used to produce high enthalpy plasma flows. Thermal plasma generators produce moderate enthalpies at higher stagnation pressures to simulate the follow-on flight path. In addition, inductively heated plasma generators for basic material investigations (catalytic efficiency / plasma wall reaction processes) and the simulation of entry scenarios for celestial bodies such as Mars or Venus have been developed [1]. Numerous material test diagnostic tools e.g. mechanical probes for heat flux and Pitot pressure measurements and TPS material tests have been developed and qualified. Parallel to these methods, further intrusive probes like electrostatic probes and non-intrusive diagnostics were applied for detailed investigation of high enthalpy plasma flows and material behavior during the tests [2, 3]. These tools provide an excellent opportunity to develop and qualify radiation-cooled materials for reuseable spacecraft and ablative material systems to be used for capsules and interplanetary probes. Additionally, they are much less expensive than space flights. Atmos-pheric entry mission phases encounter challenging problems, such as hypersonic aerothermo-dynamics and TPS performance of the spacecraft. Goals include managing the guidance navi-gation, control, landing technology and inflatable technologies such as ballutes that aim to keep vehicles in the atmosphere without landing [4]. The requirement to save mass and energy for planned interplanetary missions such as the Mars Society Archimedes Balloon Mission, the Mars Sample Return Mission, Mars Express or Venus Sample Return mission led to the need for new atmospheric manoeuvres like aerocapture, aero-breaking and hyper-bolic entries e.g. for sample return missions [5-7]. All three of the mission phases are characterized by very high kinetic vehicle energies to be dissipated by the atmospheric manoeuvre. Actually, in this field no flight has been performed yet. But the importance of these manoeuvres and the need to increase the knowledge of the required TPS designs and the TPS behavior during such mission phases point out the need for ground testing facilities [8, 9], numerical codes and, in particular, flight experiments as the aerothermodynamic and aero-chemical problems can not be completely solved by ground tests and the supplementary computer simulations. The high-temperature nonequilibrium, the gaskinetic gas-wall interactions (catalytic efficiency, rarefaction effects, turbulent flow) and gap flows between flaps and TPS components in the TPS structure are fields where ground testing and CFD
RTO-EN-AVT-130 15 - 1
Auweter-Kurtz, M.; Fertig, M.; Herdrich, G.; Winter, M. (2007) Advanced Integrated TPS and Non Equilibrium Chemistry Instrumentation. In Flight Experiments for Hypersonic Vehicle Development (pp. 15-1 – 15-50). Educational Notes RTO-EN-AVT-130, Paper 15. Neuilly-sur-Seine, France: RTO. Available from: http://www.rto.nato.int/abstracts.asp.
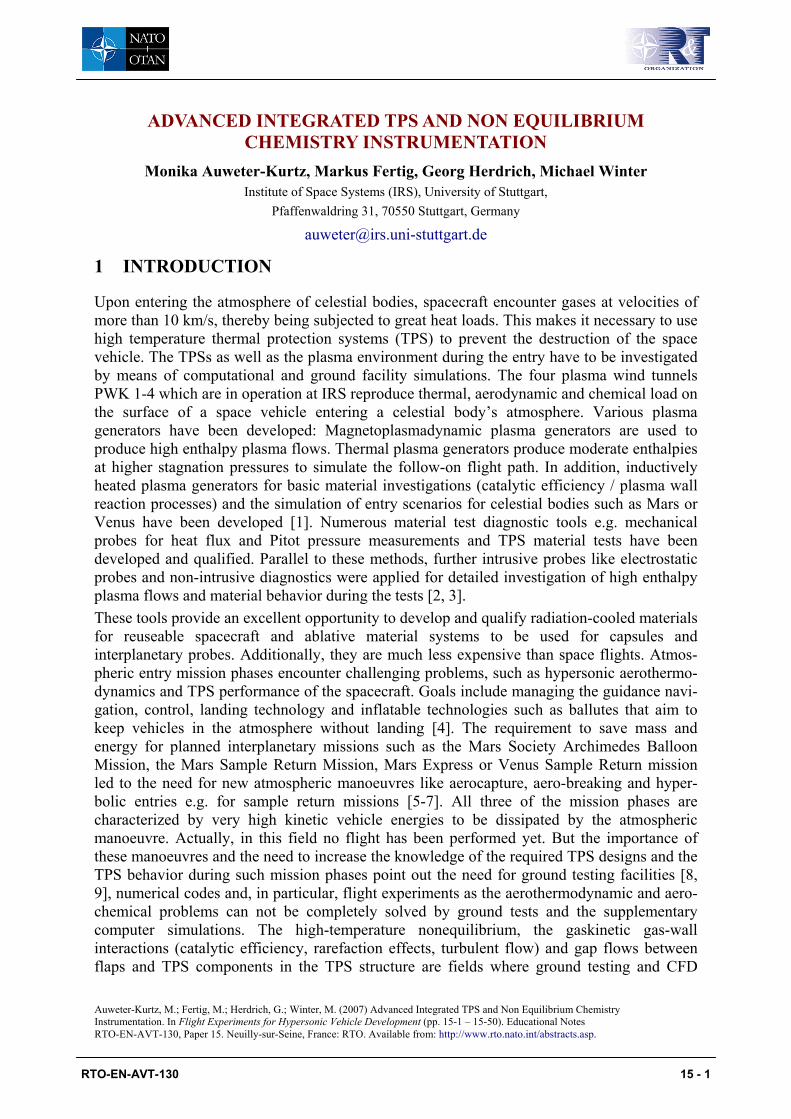
calculations cannot fully replace flight experiments. Concepts of such flight experiments require experience and the ability of feasibility analysis using both analytical tools, which can often be used in simplified versions, and testing facilities to come up with overall information on the abilities and design steps needed for the successful experiment. As a result of the ex-perience within the plasma diagnostic tool development and the plasma wind tunnel data base acquired during the last 20 years, flight experiments like the PYrometric Entry EXperiment PYREX (capsules EXPRESS and MIRKA) and HEATIN (HEATshield INstrumentation) on MIRKA have been developed at IRS, qualified and successfully flown [10-13]. Flight experi-ments such as the spectrometer RESPECT (RE-entry SPECTrometer) [14] and PYREX on HOPE-X [15] are in the conceptual phase. The MIRKA mission profile is shown in Fig. 1; a scheme of the capsule’s instrumentation is depicted in Fig. 2.
Fig. 1 Diagram of MIRKA mission, flown in 1997
Fig. 2 View of the Sensors along the MIRKA countour
Advanced Integrated TPS and Non Equilibrium Chemistry Instrumentation
15 - 2 RTO-EN-AVT-130
600
700
800
900
1000
1100
1200
1300
1400
1500
1600
Tem
pera
t ure
TTP
S [°
C]
1250 1300 1350 1400
Time t [s]
PYREX Corrected Flight Data
TC-12
48°-Position
CorrectedTemperatureIncrease
Preflight Condition
Postflight Condition
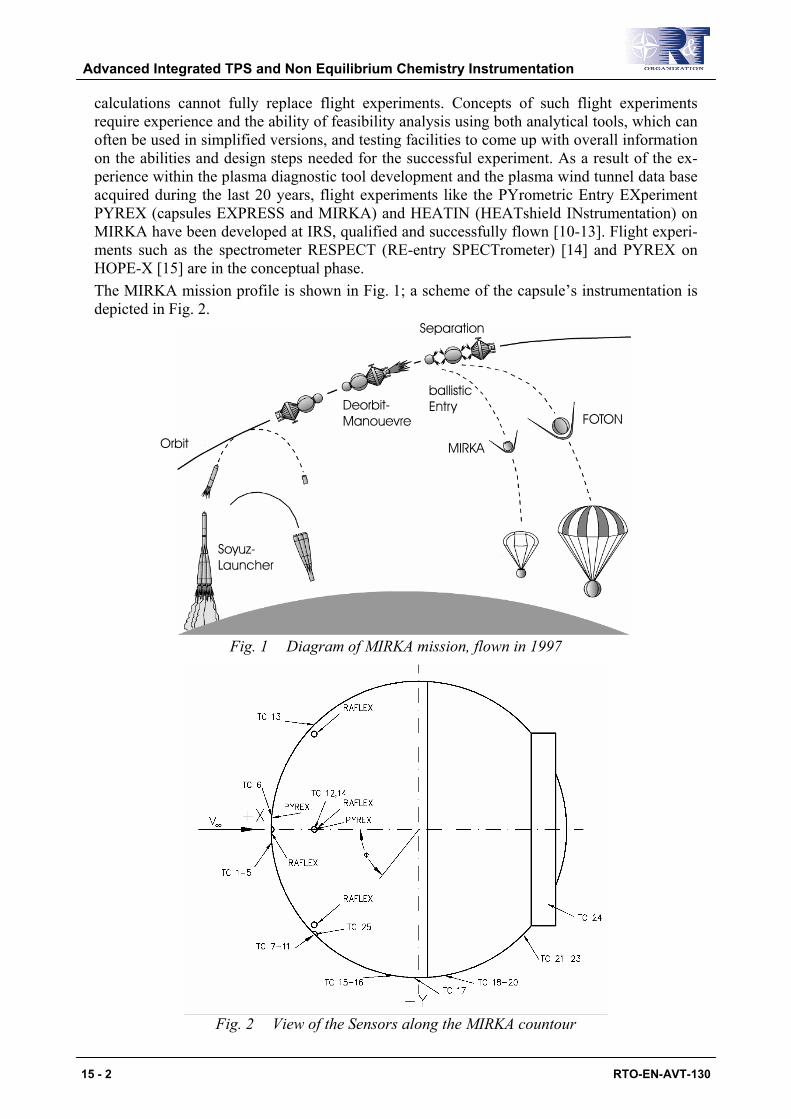
Fig. 3 Measured data of the PYREX-MIRKA 48° sensor and corresponding HEATIN TC 12.
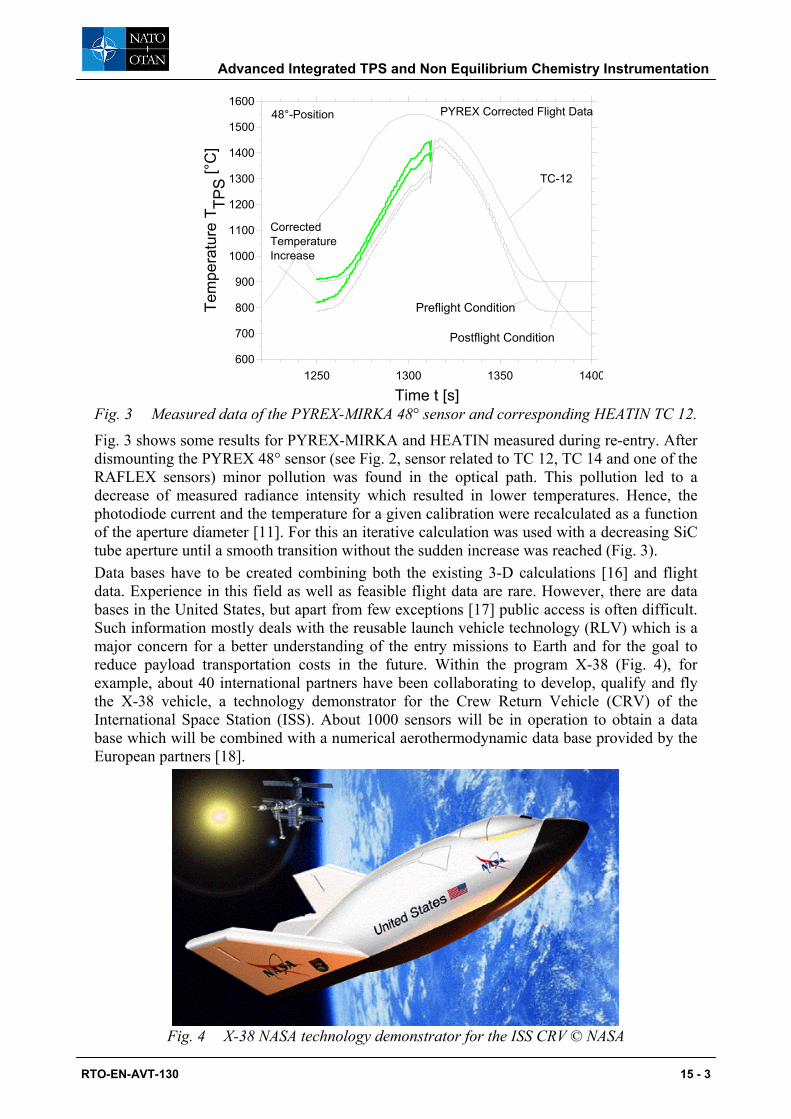
Fig. 3 shows some results for PYREX-MIRKA and HEATIN measured during re-entry. After dismounting the PYREX 48° sensor (see Fig. 2, sensor related to TC 12, TC 14 and one of the RAFLEX sensors) minor pollution was found in the optical path. This pollution led to a decrease of measured radiance intensity which resulted in lower temperatures. Hence, the photodiode current and the temperature for a given calibration were recalculated as a function of the aperture diameter [11]. For this an iterative calculation was used with a decreasing SiC tube aperture until a smooth transition without the sudden increase was reached (Fig. 3). Data bases have to be created combining both the existing 3-D calculations [16] and flight data. Experience in this field as well as feasible flight data are rare. However, there are data bases in the United States, but apart from few exceptions [17] public access is often difficult. Such information mostly deals with the reusable launch vehicle technology (RLV) which is a major concern for a better understanding of the entry missions to Earth and for the goal to reduce payload transportation costs in the future. Within the program X-38 (Fig. 4), for example, about 40 international partners have been collaborating to develop, qualify and fly the X-38 vehicle, a technology demonstrator for the Crew Return Vehicle (CRV) of the International Space Station (ISS). About 1000 sensors will be in operation to obtain a data base which will be combined with a numerical aerothermodynamic data base provided by the European partners [18].
Fig. 4 X-38 NASA technology demonstrator for the ISS CRV © NASA
Advanced Integrated TPS and Non Equilibrium Chemistry Instrumentation
RTO-EN-AVT-130 15 - 3
The temperature measurement system PYREX-KAT38 (PYrometric Entry EXperiment), measuring the temperature distribution in the X-38 nose structure, was contributed by the Space Transportation Division of IRS [19]. The information provided by the PYREX system is pertinent to several fields of interest, i.e. the temperature histories at five positons in the nose structure of X-38 during entry, information about the rotational degrees of freedom of the vehicle during re-enty, statements on the behavior of the TPS material and the heat flux distribution. Presently PYREX-based sensors for transient heat flux measurements using different materials to be exposed to the entry plasma are being developed at IRS. These sensors will be a first step towards wall temperature dependent heat flux measurements where heat fluxes faced by materials of different catalytic efficiency can be compared.
2 MEASUREMENT TECHNIQUES UNDER INVESTIGATION
PYREX, a pyrometric system measures temperatures and heat fluxes on TPS. It has been flown twice (EXPRESS, MIRKA). PYREX-KAT38 is a fully qualified six-channel system to be operated aboard the X-38. RESPECT, a spectrometer, measures spectral data in the flow field around a vehicle. Information about the plasma state can be obtained by the comparison with numerical simulations. HEATIN, a measurement system consisting of several thermocouples in the MIRKA heat shield, measured transient temperature data characterizing the overall heat shield performance. PHLUX (pyrometric sensor for catalytic heat flux measurements): A probe has been developed for ground tests to investigate the catalytic behavior of surfaces. The flight experiment aims to estimate the plasma composition using measured heat fluxes on different catalytic surfaces. Boundary Layer Probe: The retractable probe measures the pressure in the boundary layer. The pressure curve can be used to determine both position and thickness of the shock front. Radiometer Probe: With high enthalpy entries and many interplanetary missions (Mars, Venus), radiative heat fluxes to a vehicle cannot be neglected. A radiometer probe for plasma wind tunnels was qualified. It is planned to develop a flight version for interplanetary missions to be qualified in IRS plasma wind tunnels. COMPARE is a synopsis of principles such that stagnation point temperature, plasma radiation and pressure are measured simultaneously. A concept for the Archimedes Mars Mission has been made.
Advanced Integrated TPS and Non Equilibrium Chemistry Instrumentation
15 - 4 RTO-EN-AVT-130
2.1 PYREX (Pyrometric Entry Experiment) Two basic systems PYREX-E and PYREX-M have already been used for the EXPRESS and MIRKA missions. The success of these missions in terms of the high thermo-mechanical loads during the system tests and the flights, the functionality of both PYREX systems after the missions and the measured temperatures and rotational frequencies of MIRKA justify the statement that the PYREX-system is space qualified. The development of the 6-channel PYREX-KAT38 system to be used for the CRV technolo-gy demonstrator X-38 is explained here. Three measurement channels are used for tempera-ture measurements in the X-38 nose cap (NC) that was developed by the German Aerospace Center in Stuttgart (DLR-S). The two remaining sensors were installed in the two side panels of the nose skirt (NSK) behind the nose cap. These side panels were developed by Astrium GmbH. The sixth channel is a reference channel to survey the overall performance. The results will enable the validation of the applied numerical codes and statements on the be-havior of the TPS-materials during entry. Thermal effects resulting from X-38 manoeuvres e.g. roll manoeuvres during the entry phase will be seen. A post-flight numerical analysis will deliver heat flux profiles. Besides the temperature measurement, a comparative temperature and heat flux measurement using two of the sensors each measuring zones of different catalytic efficiency was intended. Here, information on atomic species concentrations in front of the heat shield were expected. The catalytic sensors are based on results of investigations of the catalytic behavior of high temperature material using plasma wind tunnel facilities. Unfortunately, no suitable material of sufficiently low catalytic efficiency could be found within the scheduled time. 2.1.1 Setup of the PYREX-KAT38 System
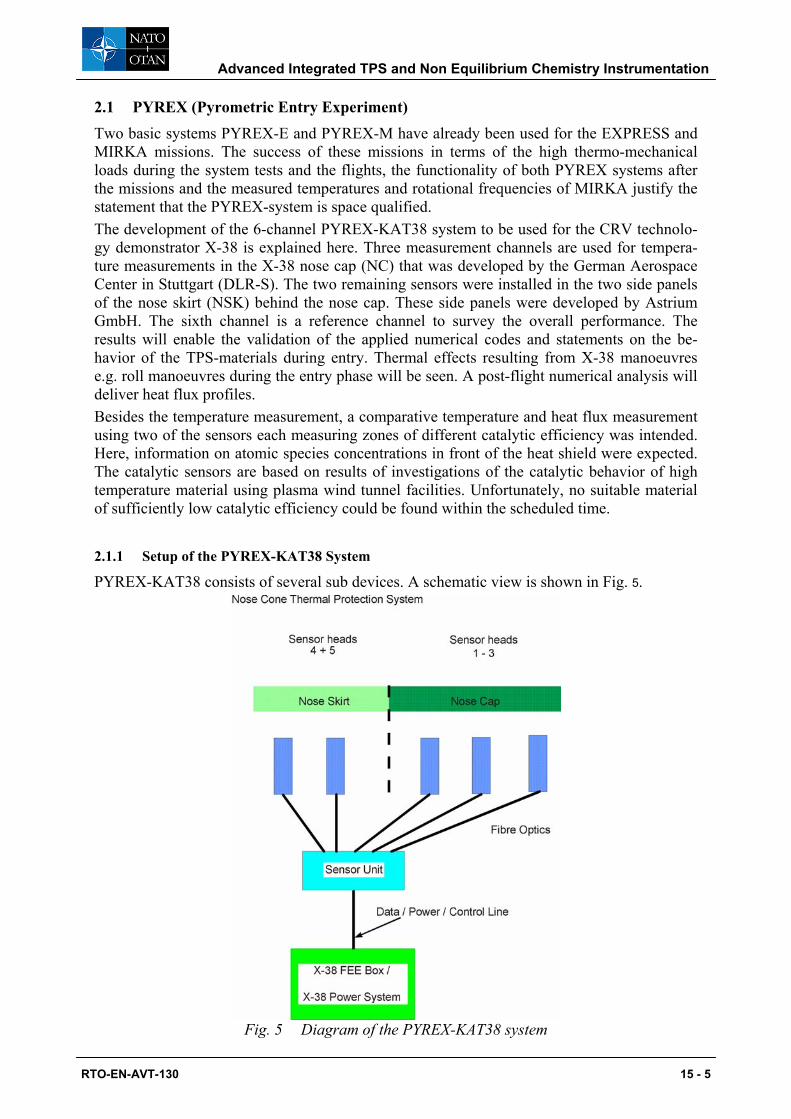
PYREX-KAT38 consists of several sub devices. A schematic view is shown in Fig. 5.
Fig. 5 Diagram of the PYREX-KAT38 system
Advanced Integrated TPS and Non Equilibrium Chemistry Instrumentation
RTO-EN-AVT-130 15 - 5
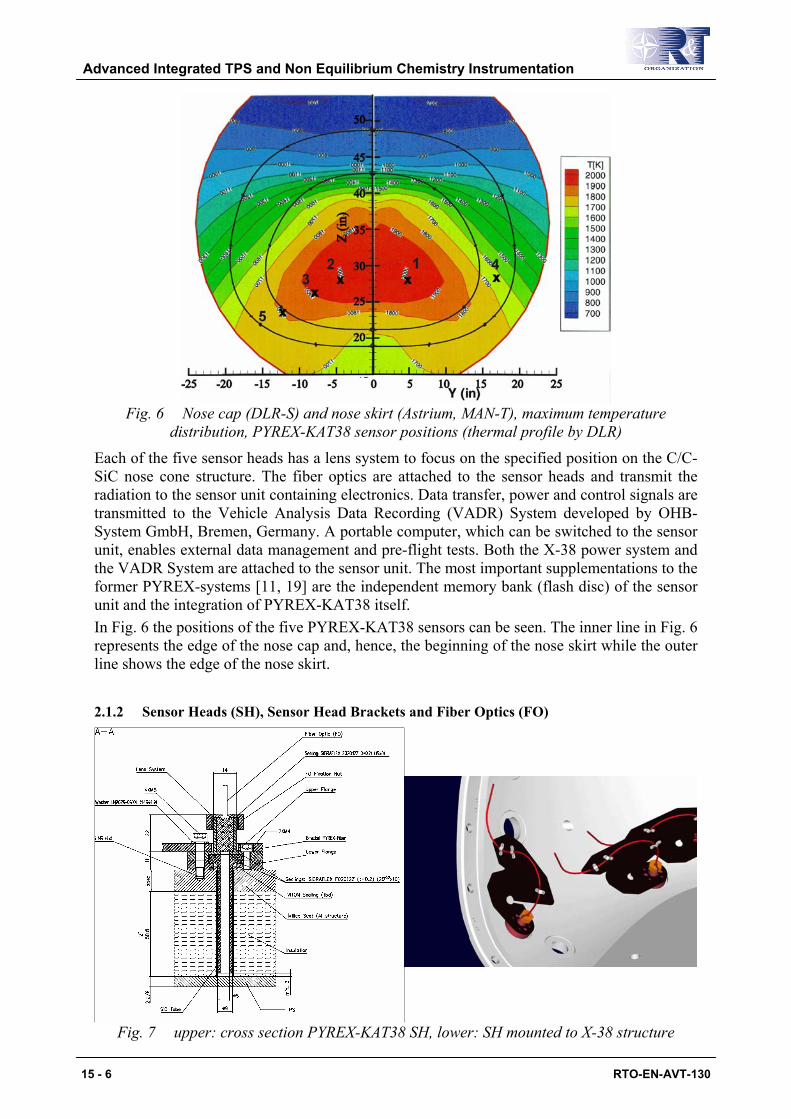
Fig. 6 Nose cap (DLR-S) and nose skirt (Astrium, MAN-T), maximum temperature
distribution, PYREX-KAT38 sensor positions (thermal profile by DLR)
Each of the five sensor heads has a lens system to focus on the specified position on the C/C-SiC nose cone structure. The fiber optics are attached to the sensor heads and transmit the radiation to the sensor unit containing electronics. Data transfer, power and control signals are transmitted to the Vehicle Analysis Data Recording (VADR) System developed by OHB-System GmbH, Bremen, Germany. A portable computer, which can be switched to the sensor unit, enables external data management and pre-flight tests. Both the X-38 power system and the VADR System are attached to the sensor unit. The most important supplementations to the former PYREX-systems [11, 19] are the independent memory bank (flash disc) of the sensor unit and the integration of PYREX-KAT38 itself. In Fig. 6 the positions of the five PYREX-KAT38 sensors can be seen. The inner line in Fig. 6 represents the edge of the nose cap and, hence, the beginning of the nose skirt while the outer line shows the edge of the nose skirt. 2.1.2 Sensor Heads (SH), Sensor Head Brackets and Fiber Optics (FO)
Fig. 7 upper: cross section PYREX-KAT38 SH, lower: SH mounted to X-38 structure
Advanced Integrated TPS and Non Equilibrium Chemistry Instrumentation
15 - 6 RTO-EN-AVT-130
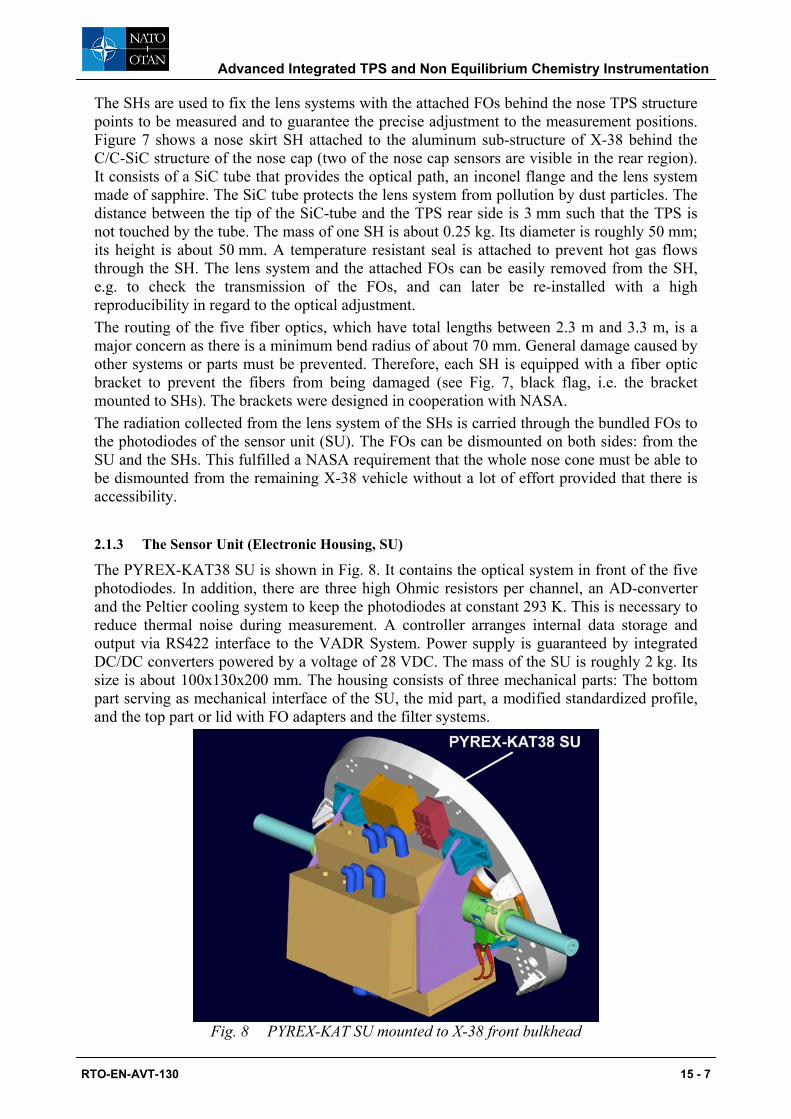
The SHs are used to fix the lens systems with the attached FOs behind the nose TPS structure points to be measured and to guarantee the precise adjustment to the measurement positions. Figure 7 shows a nose skirt SH attached to the aluminum sub-structure of X-38 behind the C/C-SiC structure of the nose cap (two of the nose cap sensors are visible in the rear region). It consists of a SiC tube that provides the optical path, an inconel flange and the lens system made of sapphire. The SiC tube protects the lens system from pollution by dust particles. The distance between the tip of the SiC-tube and the TPS rear side is 3 mm such that the TPS is not touched by the tube. The mass of one SH is about 0.25 kg. Its diameter is roughly 50 mm; its height is about 50 mm. A temperature resistant seal is attached to prevent hot gas flows through the SH. The lens system and the attached FOs can be easily removed from the SH, e.g. to check the transmission of the FOs, and can later be re-installed with a high reproducibility in regard to the optical adjustment. The routing of the five fiber optics, which have total lengths between 2.3 m and 3.3 m, is a major concern as there is a minimum bend radius of about 70 mm. General damage caused by other systems or parts must be prevented. Therefore, each SH is equipped with a fiber optic bracket to prevent the fibers from being damaged (see Fig. 7, black flag, i.e. the bracket mounted to SHs). The brackets were designed in cooperation with NASA. The radiation collected from the lens system of the SHs is carried through the bundled FOs to the photodiodes of the sensor unit (SU). The FOs can be dismounted on both sides: from the SU and the SHs. This fulfilled a NASA requirement that the whole nose cone must be able to be dismounted from the remaining X-38 vehicle without a lot of effort provided that there is accessibility. 2.1.3 The Sensor Unit (Electronic Housing, SU)
The PYREX-KAT38 SU is shown in Fig. 8. It contains the optical system in front of the five photodiodes. In addition, there are three high Ohmic resistors per channel, an AD-converter and the Peltier cooling system to keep the photodiodes at constant 293 K. This is necessary to reduce thermal noise during measurement. A controller arranges internal data storage and output via RS422 interface to the VADR System. Power supply is guaranteed by integrated DC/DC converters powered by a voltage of 28 VDC. The mass of the SU is roughly 2 kg. Its size is about 100x130x200 mm. The housing consists of three mechanical parts: The bottom part serving as mechanical interface of the SU, the mid part, a modified standardized profile, and the top part or lid with FO adapters and the filter systems.
Fig. 8 PYREX-KAT SU mounted to X-38 front bulkhead
Advanced Integrated TPS and Non Equilibrium Chemistry Instrumentation
RTO-EN-AVT-130 15 - 7
The filter system, selecting a wavelength of 630 nm is placed between the FOs and the photodiode. As the height of the signal increases with increasing wavelength on the one hand and the signal slope decreases on the other hand (Planck distribution), the used wavelength is a useful compromise between signal and sensitivity (signal slope) of the temperature measurement system [20]. Data corrections, if necessary, are simplified. Such corrections can be required due to a soiled optical system or damage to the FOs. The Peltier system requires most of the PYREX-KAT38 power, which goes up to 15 W. The SU includes a complete independent memory bank for data storage versus the PYREX-KAT38 system time which is related to the mission time after the flight. This memory is preserved even in the case of a power failure. 2.1.4 Calibration of PYREX
PYREX for X-38 was calibrated with the IRS black body source working between 600°C and 2600°C. The source consists of an electrically heated graphite radiator with a cylindrical cavity. To approximate the black body, the cavity has a large length-to-diameter ratio and the cavity walls should maintain an isothermal profile. This is achieved by a variable heat source distribution which is realized by varying the cavity wall thickness. The outline of the graphite rod was therefore calculated using a numerical procedure To approximate the black body, the cavity has a large length-to-diameter ratio and the cavity walls should maintain an isothermal profile. This is achieved by a variable heat source distribution which is realized by varying the cavity wall thickness. The outline of the graphite rod was therefore calculated using a numerical procedure. The black body's second radiation outlet is used for the PYREX calibration. The black body's temperature is varied using the control pyrometer; temperature and photo current are measured simultaneously. Hence, a photo current line versus the measured temperature is obtained. This photo current calibration curve is used to calculate the temperature data from the photo current values achieved during flight. 2.1.5 Qualification and Tests for PYREX-KAT38
The previously performed qualification procedures (EXPRESS, MIRKA) of PYREX [10, 11, 21-23] have partially been accepted for the PYREX-KAT38 qualification. Design changes regarding the mechanical and electrical design of the SU, changes in the design of the SHs (e.g. brackets) and the high FO lengths led to an individual qualification and test program.
2.1.5.1 Functional Qualification in PWK1 (Engineering Model - EM)
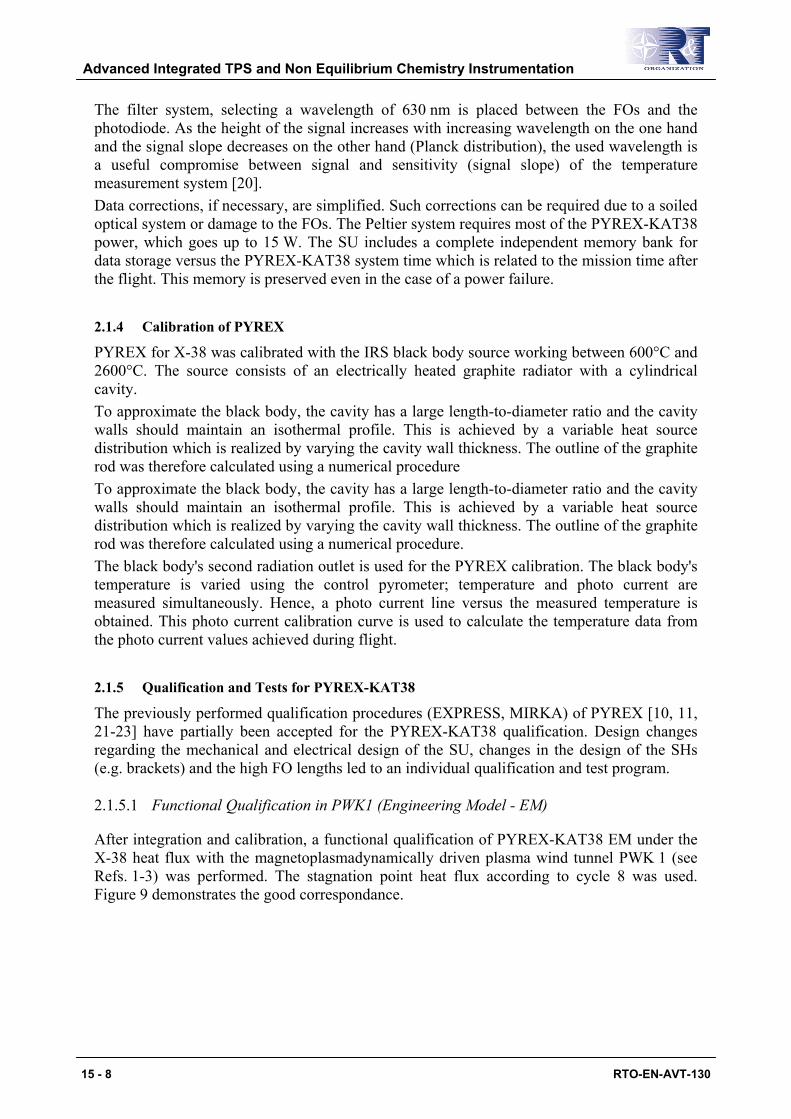
After integration and calibration, a functional qualification of PYREX-KAT38 EM under the X-38 heat flux with the magnetoplasmadynamically driven plasma wind tunnel PWK 1 (see Refs. 1-3) was performed. The stagnation point heat flux according to cycle 8 was used. Figure 9 demonstrates the good correspondance.
Advanced Integrated TPS and Non Equilibrium Chemistry Instrumentation
15 - 8 RTO-EN-AVT-130
250350450550650750850950
105011501250
0 500 1000
time [s]
heat
flux
[kW
/m2 ]
x-po
sitio
n [m
m]
PWK-simulated heat fluxHeat flux acc. to cycle 8Probe position
N2 =6.4 g/sO2=1.6 g/sAr=0.30 g/s
pa=490 PaI=1225 AV=96 V
Test parameters
4_572_1.xls / Heat Flux (real) (2)
Fig. 9 PWK-simulated X-38 heat flux profile (IRS-PWK1) and PWK-related test parameter
This was achieved by programming the sample holder position in PWK1 using a numerically controlled four-axis table. The sample support holder was developed for the previous PYREX qualification tests [24]. The qualification tests of PYREX-KAT38 system components in the plasma wind tunnel were done with similar sections as in the X-38 thermal protection structure.
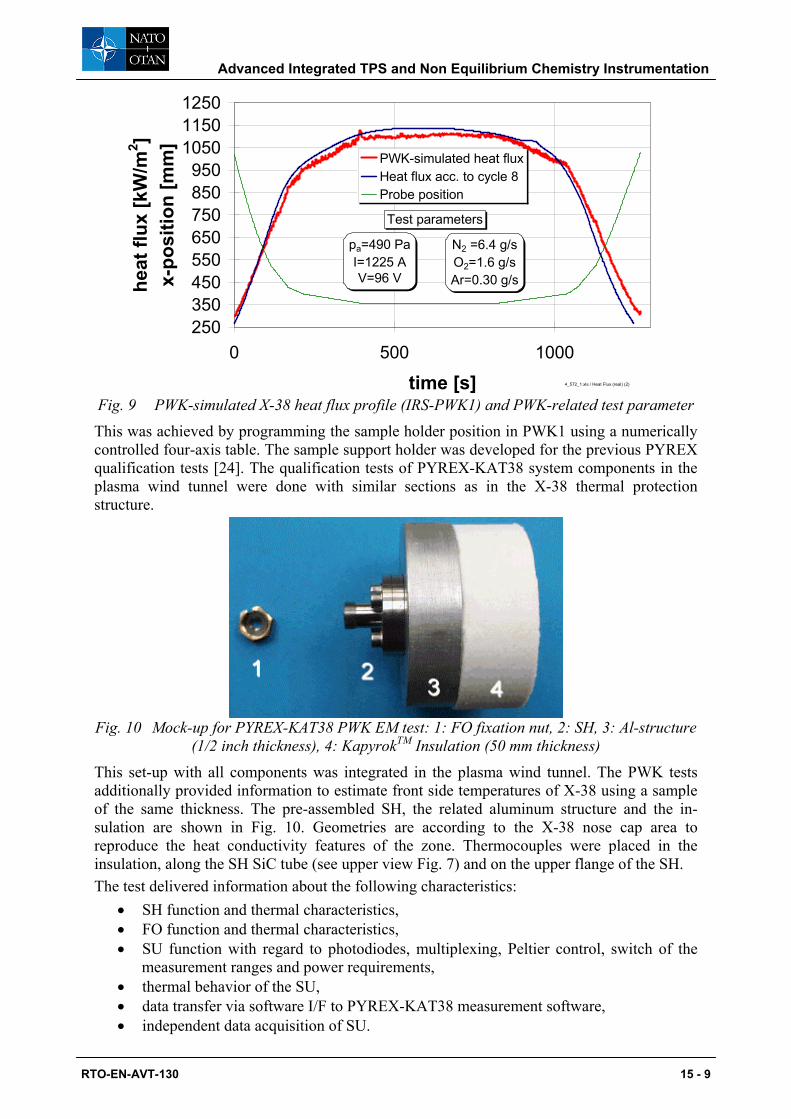
Fig. 10 Mock-up for PYREX-KAT38 PWK EM test: 1: FO fixation nut, 2: SH, 3: Al-structure
(1/2 inch thickness), 4: KapyrokTM Insulation (50 mm thickness)
This set-up with all components was integrated in the plasma wind tunnel. The PWK tests additionally provided information to estimate front side temperatures of X-38 using a sample of the same thickness. The pre-assembled SH, the related aluminum structure and the in-sulation are shown in Fig. 10. Geometries are according to the X-38 nose cap area to reproduce the heat conductivity features of the zone. Thermocouples were placed in the insulation, along the SH SiC tube (see upper view Fig. 7) and on the upper flange of the SH. The test delivered information about the following characteristics:
• SH function and thermal characteristics, • FO function and thermal characteristics, • SU function with regard to photodiodes, multiplexing, Peltier control, switch of the
measurement ranges and power requirements, • thermal behavior of the SU, • data transfer via software I/F to PYREX-KAT38 measurement software, • independent data acquisition of SU.
Advanced Integrated TPS and Non Equilibrium Chemistry Instrumentation
RTO-EN-AVT-130 15 - 9
All functional requirements were fulfilled very well.
2.1.5.2 Integration / qualification test of the X-38 nose structure: Assembly Test (EM)
The qualification procedure required the assembly of a qualification model of the X-38 nose structure including PYREX. Here, the EM SU, one EM nose cap SH and the EM FO were in-tegrated. Besides the DLR nose cap, the Astrium side panels, the MAN-T chin panel and ad-ditional tiles were mounted by NASA (behind nose skirt).
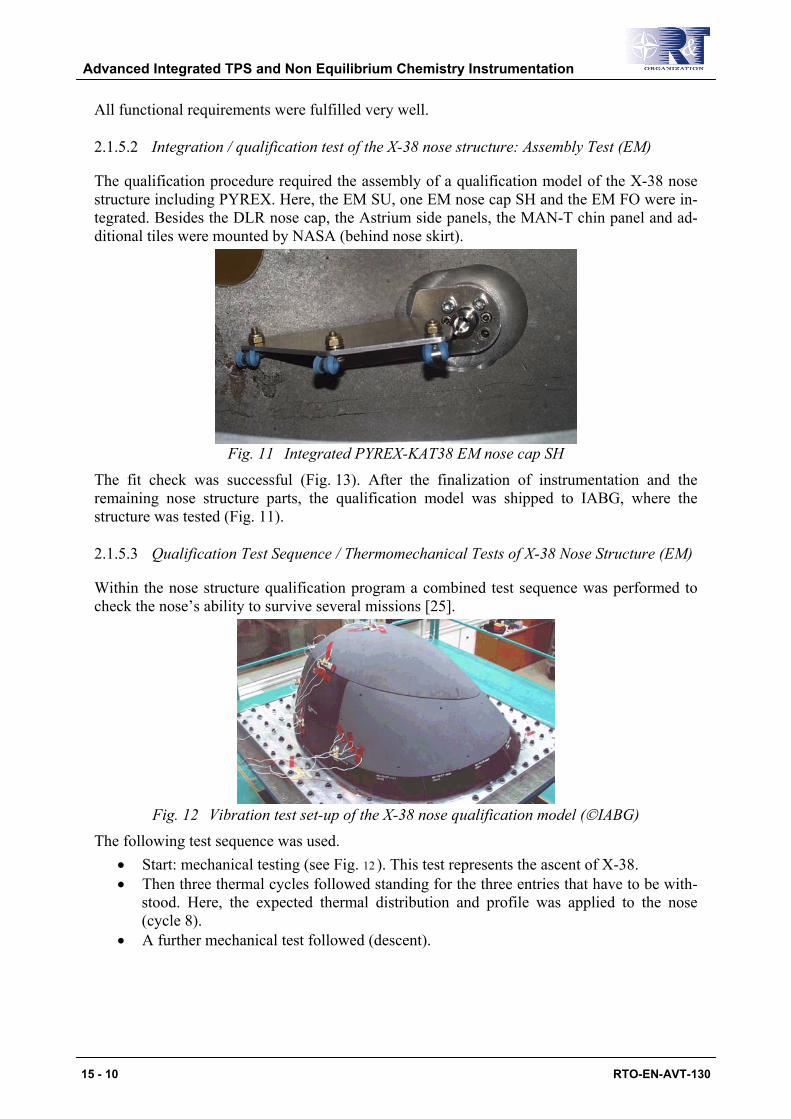
Fig. 11 Integrated PYREX-KAT38 EM nose cap SH
The fit check was successful (Fig. 13). After the finalization of instrumentation and the remaining nose structure parts, the qualification model was shipped to IABG, where the structure was tested (Fig. 11).
2.1.5.3 Qualification Test Sequence / Thermomechanical Tests of X-38 Nose Structure (EM)
Within the nose structure qualification program a combined test sequence was performed to check the nose’s ability to survive several missions [25].
Fig. 12 Vibration test set-up of the X-38 nose qualification model (IABG)
The following test sequence was used. • Start: mechanical testing (see Fig. 12 ). This test represents the ascent of X-38. • Then three thermal cycles followed standing for the three entries that have to be with-
stood. Here, the expected thermal distribution and profile was applied to the nose (cycle 8).
• A further mechanical test followed (descent).
Advanced Integrated TPS and Non Equilibrium Chemistry Instrumentation
15 - 10 RTO-EN-AVT-130
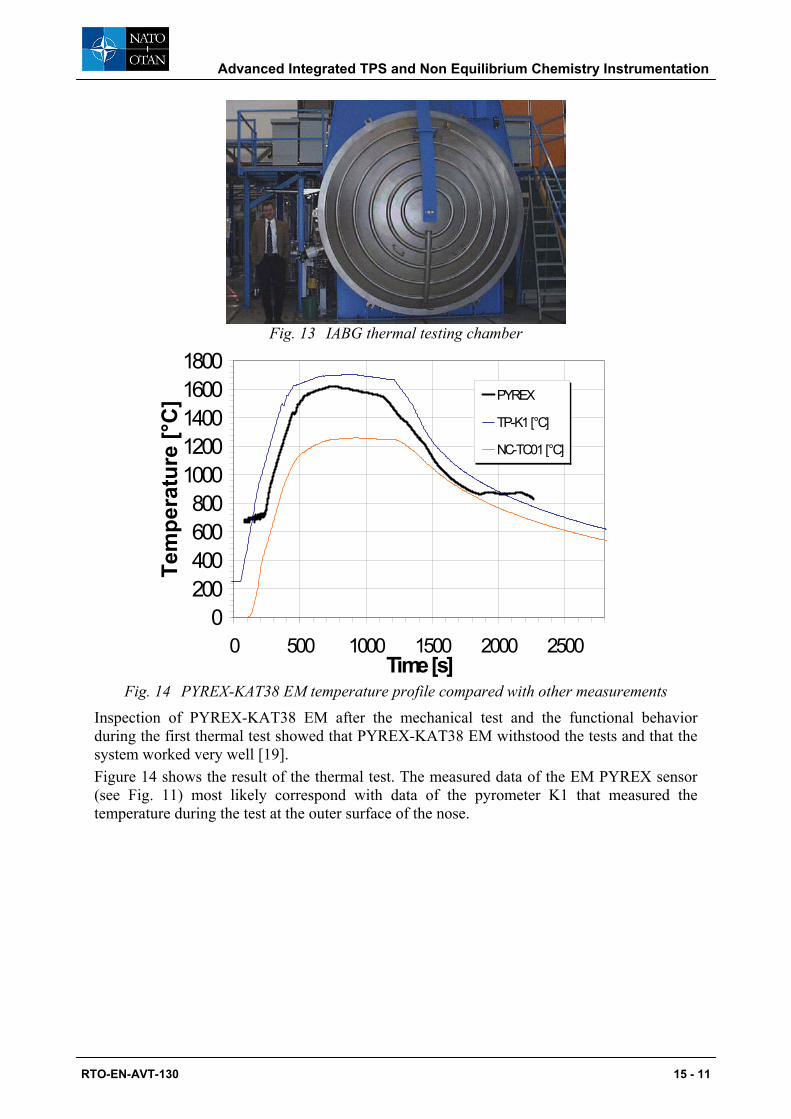
Fig. 13 IABG thermal testing chamber
0200400600800
10001200140016001800
0 500 1000 1500 2000 2500Time [s]
Tem
pera
ture
[°C
] PYREX
TP-K1 [°C]
NC-TC01 [°C]
Fig. 14 PYREX-KAT38 EM temperature profile compared with other measurements
Inspection of PYREX-KAT38 EM after the mechanical test and the functional behavior during the first thermal test showed that PYREX-KAT38 EM withstood the tests and that the system worked very well [19]. Figure 14 shows the result of the thermal test. The measured data of the EM PYREX sensor (see Fig. 11) most likely correspond with data of the pyrometer K1 that measured the temperature during the test at the outer surface of the nose.
Advanced Integrated TPS and Non Equilibrium Chemistry Instrumentation
RTO-EN-AVT-130 15 - 11
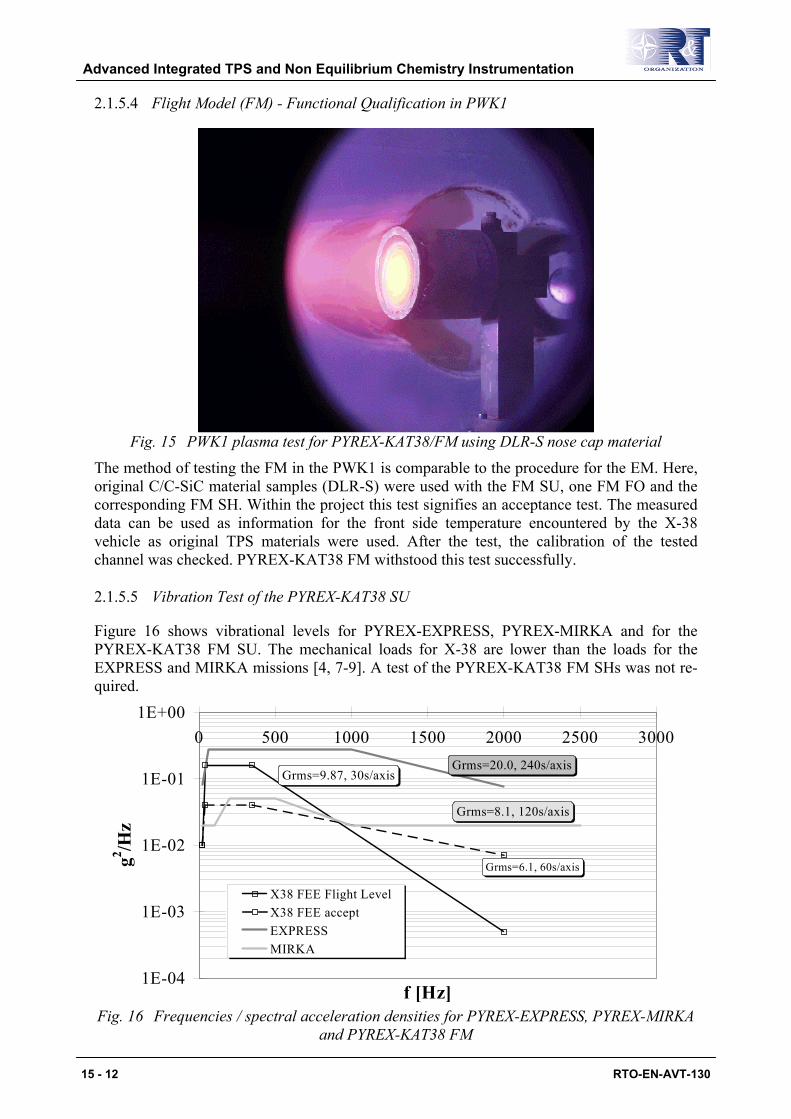
2.1.5.4 Flight Model (FM) - Functional Qualification in PWK1
Fig. 15 PWK1 plasma test for PYREX-KAT38/FM using DLR-S nose cap material
The method of testing the FM in the PWK1 is comparable to the procedure for the EM. Here, original C/C-SiC material samples (DLR-S) were used with the FM SU, one FM FO and the corresponding FM SH. Within the project this test signifies an acceptance test. The measured data can be used as information for the front side temperature encountered by the X-38 vehicle as original TPS materials were used. After the test, the calibration of the tested channel was checked. PYREX-KAT38 FM withstood this test successfully.
2.1.5.5 Vibration Test of the PYREX-KAT38 SU
Figure 16 shows vibrational levels for PYREX-EXPRESS, PYREX-MIRKA and for the PYREX-KAT38 FM SU. The mechanical loads for X-38 are lower than the loads for the EXPRESS and MIRKA missions [4, 7-9]. A test of the PYREX-KAT38 FM SHs was not re-quired.
1E-04
1E-03
1E-02
1E-01
1E+000 500 1000 1500 2000 2500 3000
f [Hz]
g2 /Hz
X38 FEE Flight LevelX38 FEE acceptEXPRESSMIRKA
Grms=9.87, 30s/axis
Grms=6.1, 60s/axis
Grms=20.0, 240s/axis
Grms=8.1, 120s/axis
Fig. 16 Frequencies / spectral acceleration densities for PYREX-EXPRESS, PYREX-MIRKA
and PYREX-KAT38 FM
Advanced Integrated TPS and Non Equilibrium Chemistry Instrumentation
15 - 12 RTO-EN-AVT-130
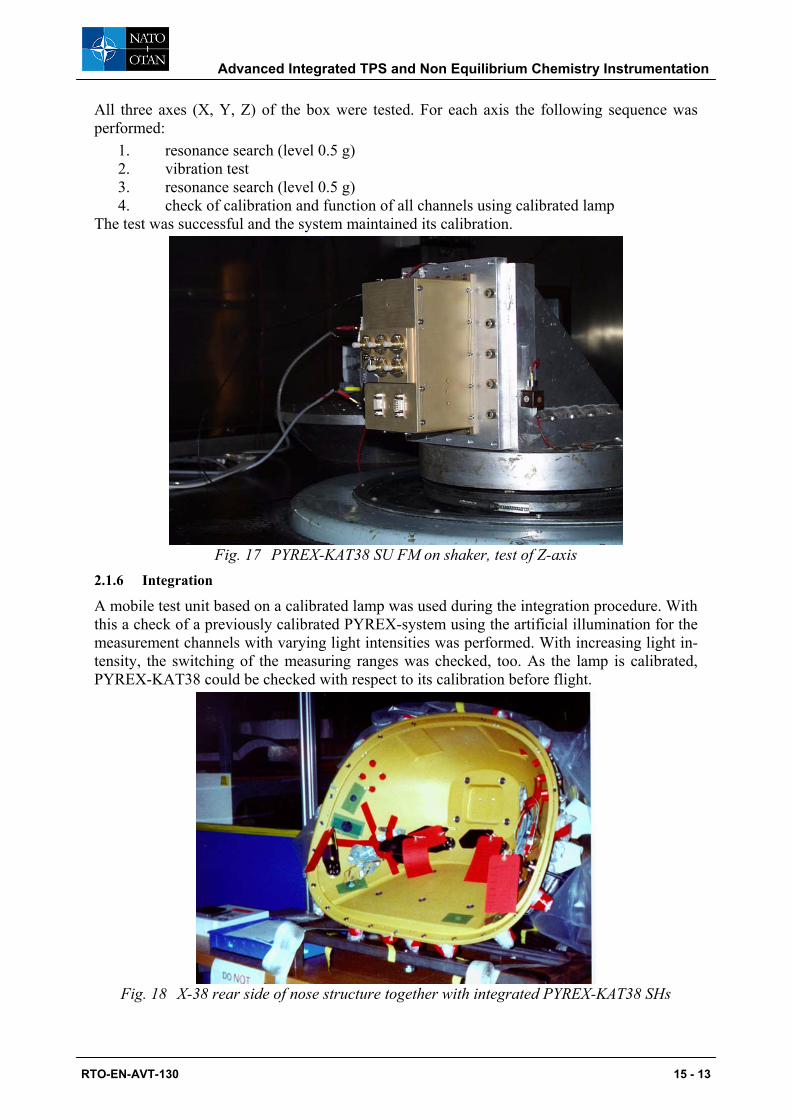
All three axes (X, Y, Z) of the box were tested. For each axis the following sequence was performed:
1. resonance search (level 0.5 g) 2. vibration test 3. resonance search (level 0.5 g) 4. check of calibration and function of all channels using calibrated lamp
The test was successful and the system maintained its calibration.
Fig. 17 PYREX-KAT38 SU FM on shaker, test of Z-axis
2.1.6 Integration
A mobile test unit based on a calibrated lamp was used during the integration procedure. With this a check of a previously calibrated PYREX-system using the artificial illumination for the measurement channels with varying light intensities was performed. With increasing light in-tensity, the switching of the measuring ranges was checked, too. As the lamp is calibrated, PYREX-KAT38 could be checked with respect to its calibration before flight.
Fig. 18 X-38 rear side of nose structure together with integrated PYREX-KAT38 SHs
Advanced Integrated TPS and Non Equilibrium Chemistry Instrumentation
RTO-EN-AVT-130 15 - 13
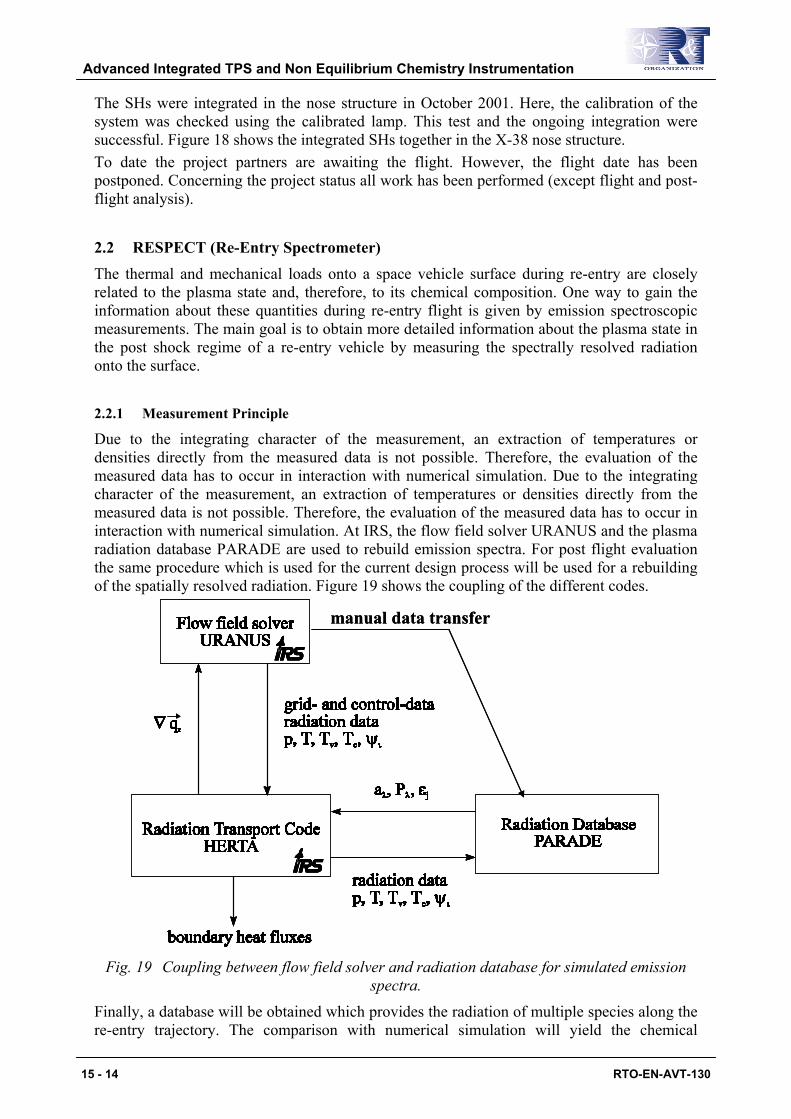
The SHs were integrated in the nose structure in October 2001. Here, the calibration of the system was checked using the calibrated lamp. This test and the ongoing integration were successful. Figure 18 shows the integrated SHs together in the X-38 nose structure. To date the project partners are awaiting the flight. However, the flight date has been postponed. Concerning the project status all work has been performed (except flight and post-flight analysis).
2.2 RESPECT (Re-Entry Spectrometer) The thermal and mechanical loads onto a space vehicle surface during re-entry are closely related to the plasma state and, therefore, to its chemical composition. One way to gain the information about these quantities during re-entry flight is given by emission spectroscopic measurements. The main goal is to obtain more detailed information about the plasma state in the post shock regime of a re-entry vehicle by measuring the spectrally resolved radiation onto the surface. 2.2.1 Measurement Principle
Due to the integrating character of the measurement, an extraction of temperatures or densities directly from the measured data is not possible. Therefore, the evaluation of the measured data has to occur in interaction with numerical simulation. Due to the integrating character of the measurement, an extraction of temperatures or densities directly from the measured data is not possible. Therefore, the evaluation of the measured data has to occur in interaction with numerical simulation. At IRS, the flow field solver URANUS and the plasma radiation database PARADE are used to rebuild emission spectra. For post flight evaluation the same procedure which is used for the current design process will be used for a rebuilding of the spatially resolved radiation. Figure 19 shows the coupling of the different codes.
manual data transfermanual data transfer
Fig. 19 Coupling between flow field solver and radiation database for simulated emission
spectra.
Finally, a database will be obtained which provides the radiation of multiple species along the re-entry trajectory. The comparison with numerical simulation will yield the chemical
Advanced Integrated TPS and Non Equilibrium Chemistry Instrumentation
15 - 14 RTO-EN-AVT-130
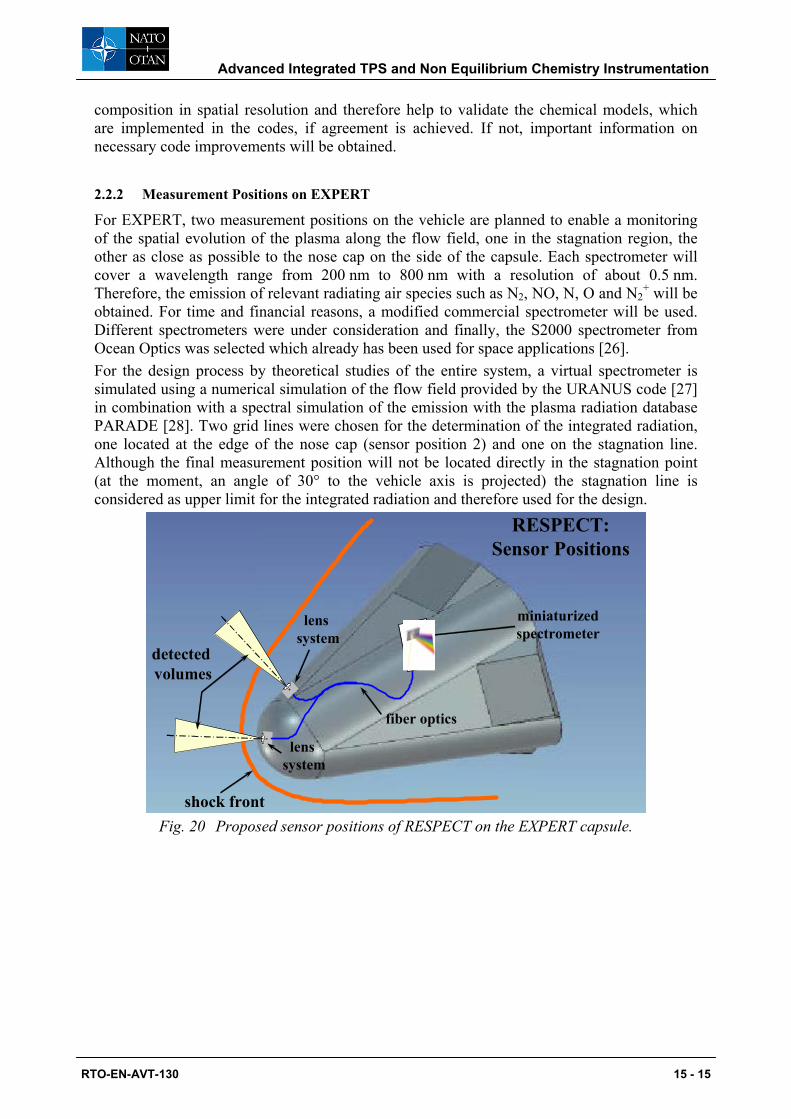
composition in spatial resolution and therefore help to validate the chemical models, which are implemented in the codes, if agreement is achieved. If not, important information on necessary code improvements will be obtained. 2.2.2 Measurement Positions on EXPERT
For EXPERT, two measurement positions on the vehicle are planned to enable a monitoring of the spatial evolution of the plasma along the flow field, one in the stagnation region, the other as close as possible to the nose cap on the side of the capsule. Each spectrometer will cover a wavelength range from 200 nm to 800 nm with a resolution of about 0.5 nm. Therefore, the emission of relevant radiating air species such as N2, NO, N, O and N2
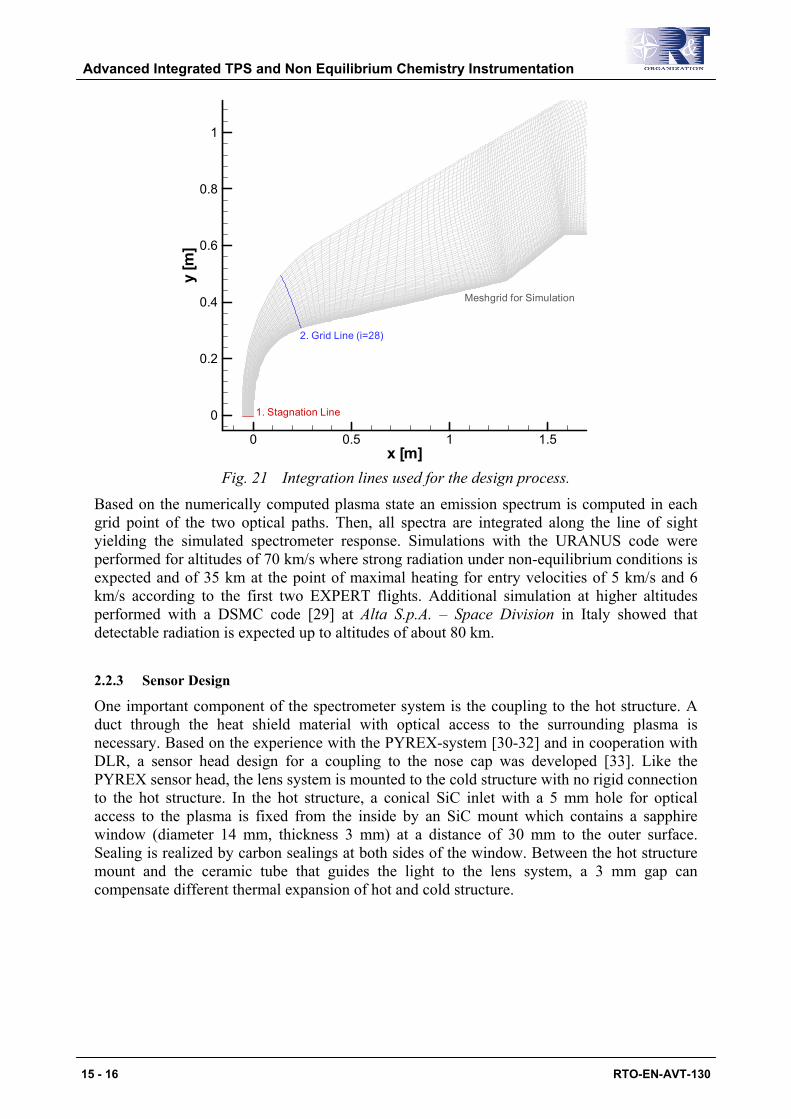
+ will be obtained. For time and financial reasons, a modified commercial spectrometer will be used. Different spectrometers were under consideration and finally, the S2000 spectrometer from Ocean Optics was selected which already has been used for space applications [26]. For the design process by theoretical studies of the entire system, a virtual spectrometer is simulated using a numerical simulation of the flow field provided by the URANUS code [27] in combination with a spectral simulation of the emission with the plasma radiation database PARADE [28]. Two grid lines were chosen for the determination of the integrated radiation, one located at the edge of the nose cap (sensor position 2) and one on the stagnation line. Although the final measurement position will not be located directly in the stagnation point (at the moment, an angle of 30° to the vehicle axis is projected) the stagnation line is considered as upper limit for the integrated radiation and therefore used for the design.
miniaturizedspectrometer
fiber optics
lens system
shock front
detected volumes
RESPECT:Sensor Positions
lens system
Fig. 20 Proposed sensor positions of RESPECT on the EXPERT capsule.
Advanced Integrated TPS and Non Equilibrium Chemistry Instrumentation
RTO-EN-AVT-130 15 - 15
x [m]
y[m
]
0 0.5 1 1.5
0
0.2
0.4
0.6
0.8
1
1. Stagnation Line
2. Grid Line (i=28)
Meshgrid for Simulation
Fig. 21 Integration lines used for the design process.
Based on the numerically computed plasma state an emission spectrum is computed in each grid point of the two optical paths. Then, all spectra are integrated along the line of sight yielding the simulated spectrometer response. Simulations with the URANUS code were performed for altitudes of 70 km/s where strong radiation under non-equilibrium conditions is expected and of 35 km at the point of maximal heating for entry velocities of 5 km/s and 6 km/s according to the first two EXPERT flights. Additional simulation at higher altitudes performed with a DSMC code [29] at Alta S.p.A. – Space Division in Italy showed that detectable radiation is expected up to altitudes of about 80 km. 2.2.3 Sensor Design
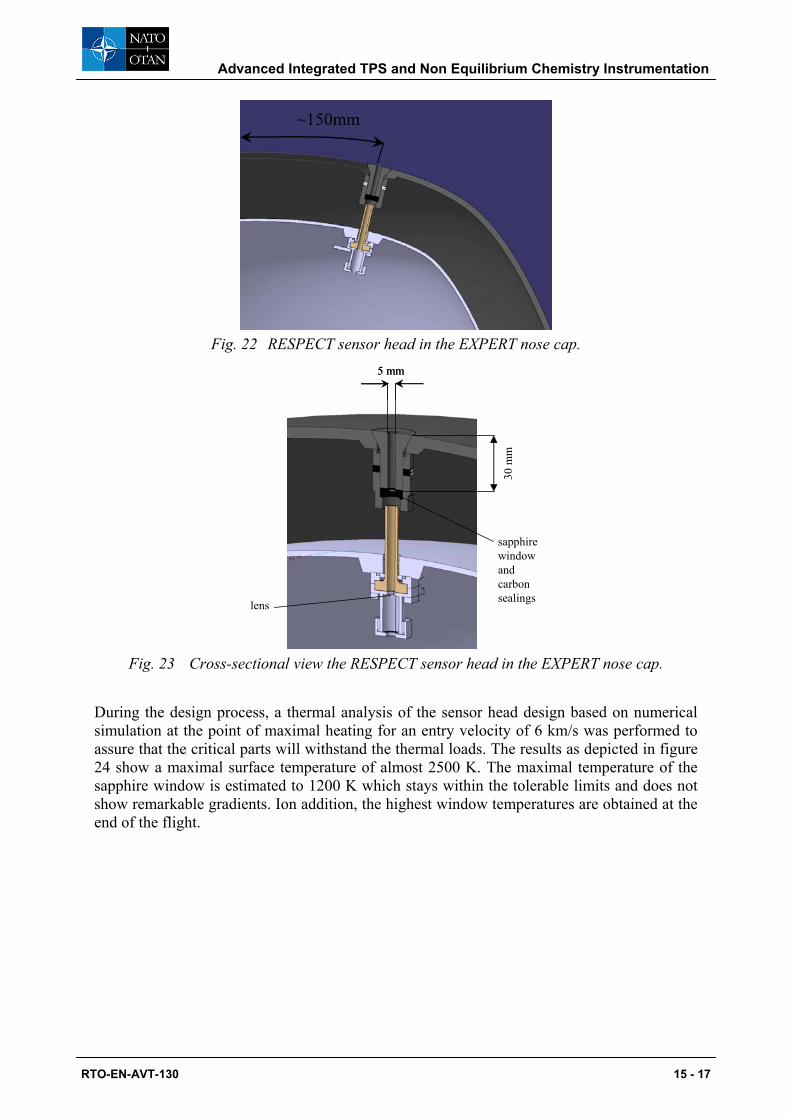
One important component of the spectrometer system is the coupling to the hot structure. A duct through the heat shield material with optical access to the surrounding plasma is necessary. Based on the experience with the PYREX-system [30-32] and in cooperation with DLR, a sensor head design for a coupling to the nose cap was developed [33]. Like the PYREX sensor head, the lens system is mounted to the cold structure with no rigid connection to the hot structure. In the hot structure, a conical SiC inlet with a 5 mm hole for optical access to the plasma is fixed from the inside by an SiC mount which contains a sapphire window (diameter 14 mm, thickness 3 mm) at a distance of 30 mm to the outer surface. Sealing is realized by carbon sealings at both sides of the window. Between the hot structure mount and the ceramic tube that guides the light to the lens system, a 3 mm gap can compensate different thermal expansion of hot and cold structure.
Advanced Integrated TPS and Non Equilibrium Chemistry Instrumentation
15 - 16 RTO-EN-AVT-130
~150mm
Fig. 22 RESPECT sensor head in the EXPERT nose cap.
5 mm5 mm
30 m
m
sapphirewindow andcarbonsealingslens
Fig. 23 Cross-sectional view the RESPECT sensor head in the EXPERT nose cap.
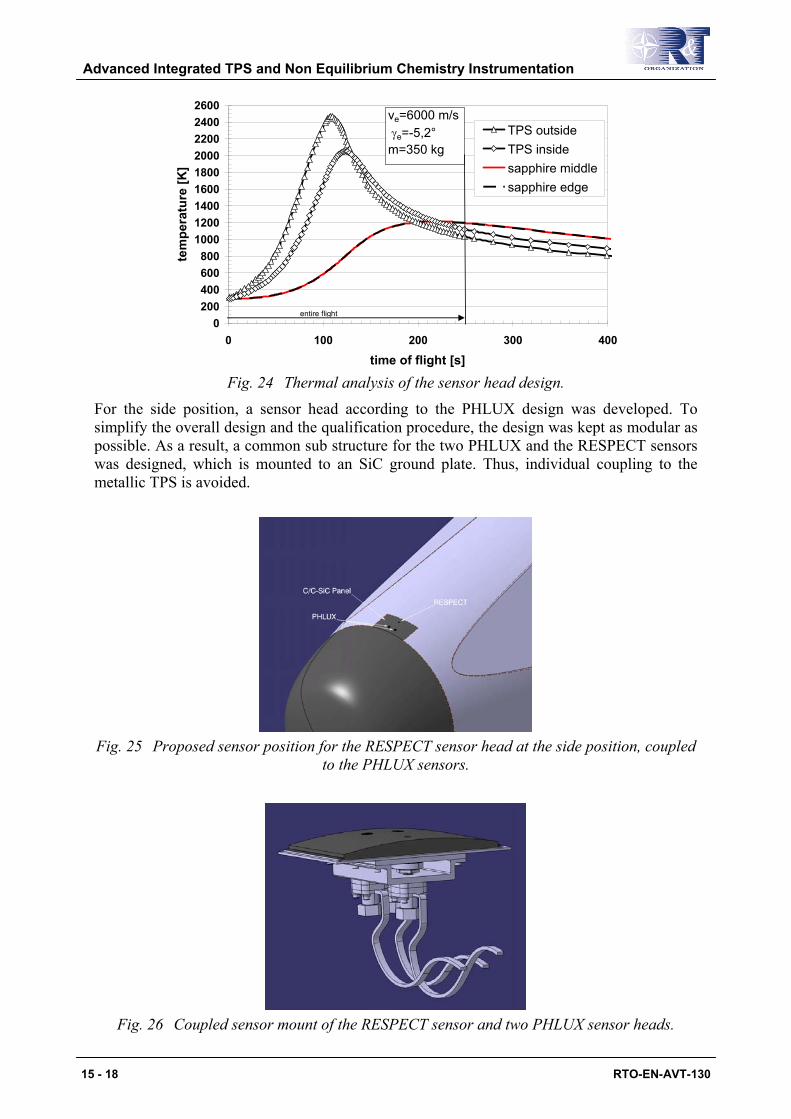
During the design process, a thermal analysis of the sensor head design based on numerical simulation at the point of maximal heating for an entry velocity of 6 km/s was performed to assure that the critical parts will withstand the thermal loads. The results as depicted in figure 24 show a maximal surface temperature of almost 2500 K. The maximal temperature of the sapphire window is estimated to 1200 K which stays within the tolerable limits and does not show remarkable gradients. Ion addition, the highest window temperatures are obtained at the end of the flight.
Advanced Integrated TPS and Non Equilibrium Chemistry Instrumentation
RTO-EN-AVT-130 15 - 17
0200400600800
100012001400160018002000220024002600
0 100 200 300 400
time of flight [s]
tem
pera
ture
[K]
TPS outsideTPS insidesapphire middlesapphire edge
ve=6000 m/s γe=-5,2°m=350 kg
entire flight
Fig. 24 Thermal analysis of the sensor head design.
For the side position, a sensor head according to the PHLUX design was developed. To simplify the overall design and the qualification procedure, the design was kept as modular as possible. As a result, a common sub structure for the two PHLUX and the RESPECT sensors was designed, which is mounted to an SiC ground plate. Thus, individual coupling to the metallic TPS is avoided.
Fig. 25 Proposed sensor position for the RESPECT sensor head at the side position, coupled
to the PHLUX sensors.
Fig. 26 Coupled sensor mount of the RESPECT sensor and two PHLUX sensor heads.
Advanced Integrated TPS and Non Equilibrium Chemistry Instrumentation
15 - 18 RTO-EN-AVT-130
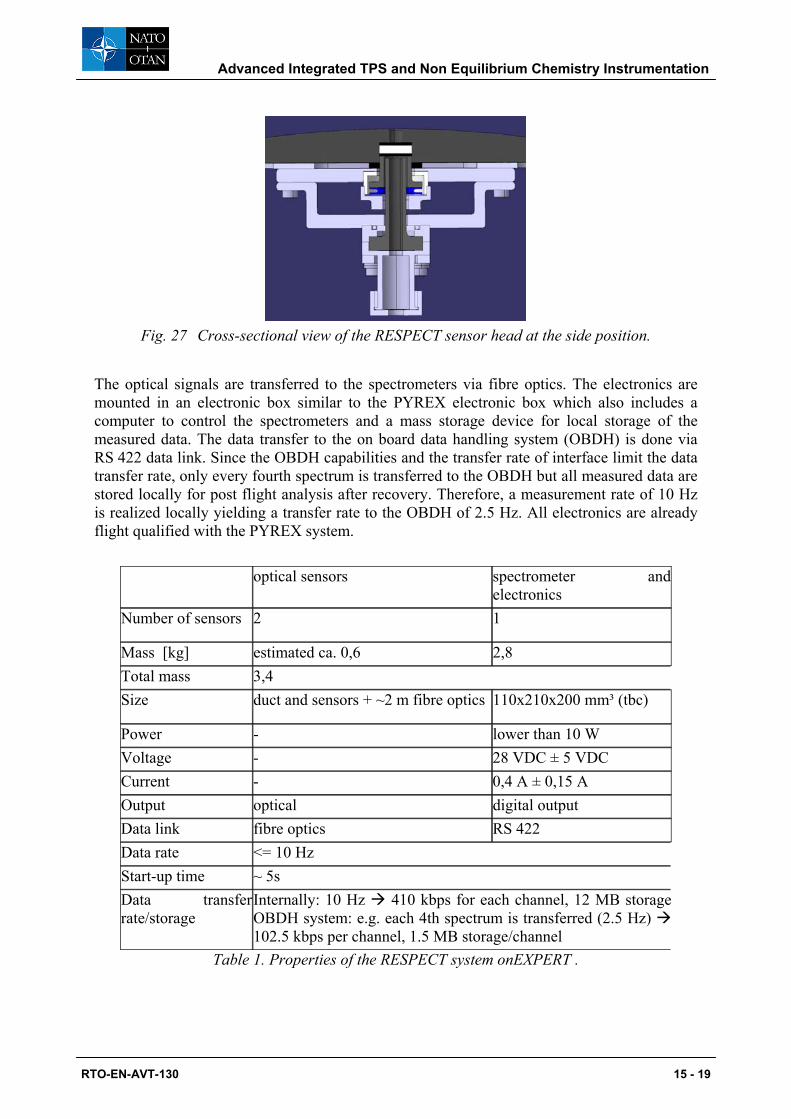
Fig. 27 Cross-sectional view of the RESPECT sensor head at the side position.
The optical signals are transferred to the spectrometers via fibre optics. The electronics are mounted in an electronic box similar to the PYREX electronic box which also includes a computer to control the spectrometers and a mass storage device for local storage of the measured data. The data transfer to the on board data handling system (OBDH) is done via RS 422 data link. Since the OBDH capabilities and the transfer rate of interface limit the data transfer rate, only every fourth spectrum is transferred to the OBDH but all measured data are stored locally for post flight analysis after recovery. Therefore, a measurement rate of 10 Hz is realized locally yielding a transfer rate to the OBDH of 2.5 Hz. All electronics are already flight qualified with the PYREX system.
optical sensors spectrometer and electronics
Number of sensors 2 1
Mass [kg] estimated ca. 0,6 2,8 Total mass 3,4 Size duct and sensors + ~2 m fibre optics 110x210x200 mm³ (tbc)
Power - lower than 10 W Voltage - 28 VDC ± 5 VDC Current - 0,4 A ± 0,15 A Output optical digital output Data link fibre optics RS 422 Data rate <= 10 Hz Start-up time ~ 5s Data transfer rate/storage
Internally: 10 Hz 410 kbps for each channel, 12 MB storageOBDH system: e.g. each 4th spectrum is transferred (2.5 Hz) 102.5 kbps per channel, 1.5 MB storage/channel
Table 1. Properties of the RESPECT system onEXPERT .
Advanced Integrated TPS and Non Equilibrium Chemistry Instrumentation
RTO-EN-AVT-130 15 - 19
2.2.4 Determination of absolute sensitivity
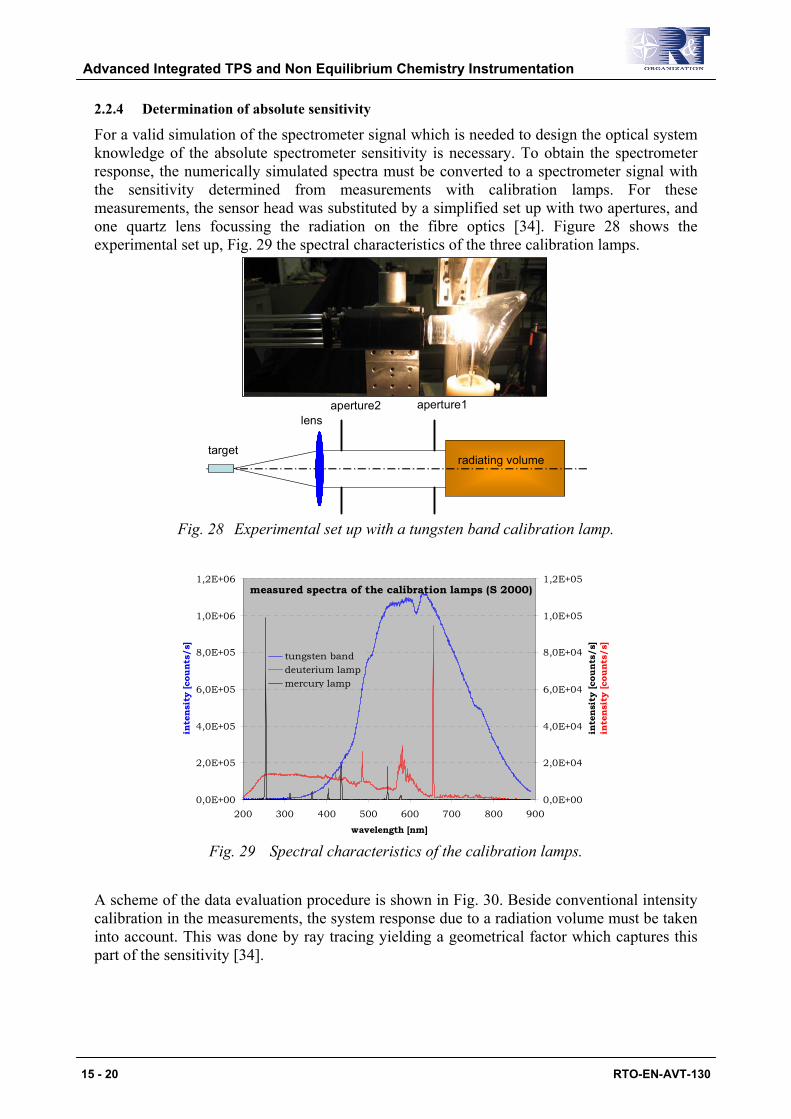
For a valid simulation of the spectrometer signal which is needed to design the optical system knowledge of the absolute spectrometer sensitivity is necessary. To obtain the spectrometer response, the numerically simulated spectra must be converted to a spectrometer signal with the sensitivity determined from measurements with calibration lamps. For these measurements, the sensor head was substituted by a simplified set up with two apertures, and one quartz lens focussing the radiation on the fibre optics [34]. Figure 28 shows the experimental set up, Fig. 29 the spectral characteristics of the three calibration lamps.
target
lensaperture2 aperture1
radiating volume
Fig. 28 Experimental set up with a tungsten band calibration lamp.
measured spectra of the calibration lamps (S 2000)
0,0E+00
2,0E+05
4,0E+05
6,0E+05
8,0E+05
1,0E+06
1,2E+06
200 300 400 500 600 700 800 900wavelength [nm]
inte
nsit
y [c
ount
s/s]
0,0E+00
2,0E+04
4,0E+04
6,0E+04
8,0E+04
1,0E+05
1,2E+05in
tens
ity
[cou
nts/
s]in
tens
ity
[cou
nts/
s]
tungsten banddeuterium lampmercury lamp
Fig. 29 Spectral characteristics of the calibration lamps.
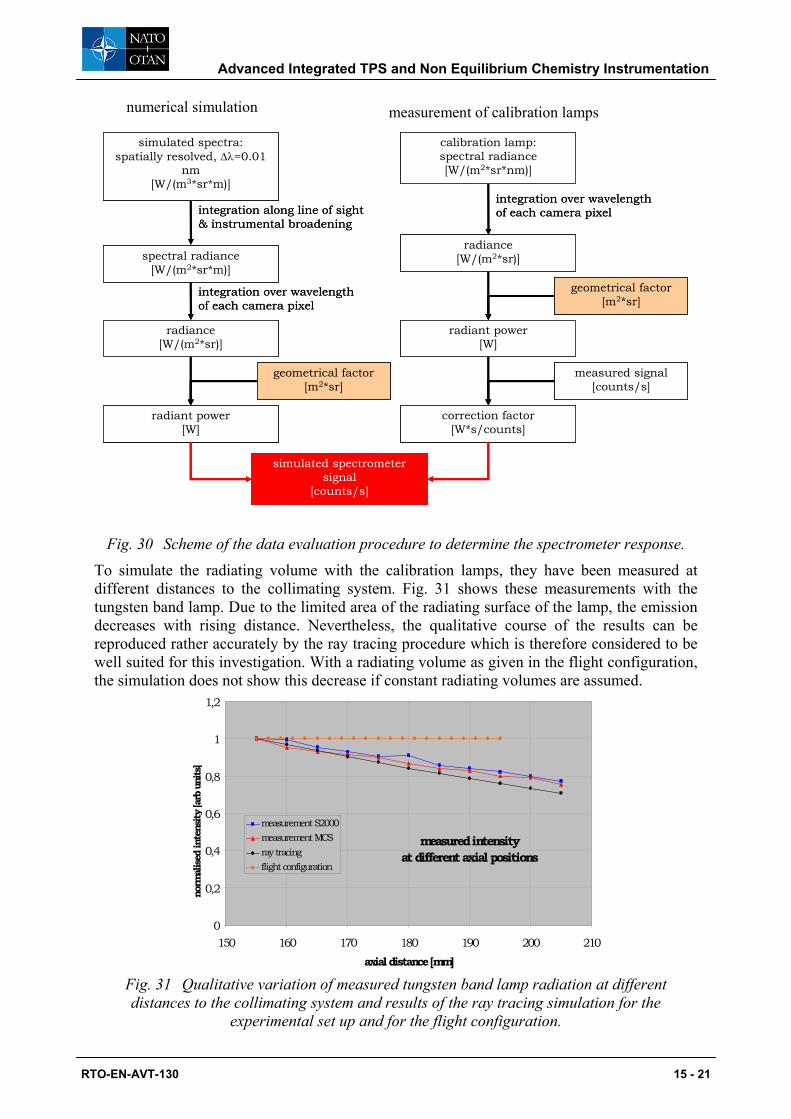
A scheme of the data evaluation procedure is shown in Fig. 30. Beside conventional intensity calibration in the measurements, the system response due to a radiation volume must be taken into account. This was done by ray tracing yielding a geometrical factor which captures this part of the sensitivity [34].
Advanced Integrated TPS and Non Equilibrium Chemistry Instrumentation
15 - 20 RTO-EN-AVT-130
spectral radiance[W/(m2*sr*m)]
integration along line of sight & instrumental broadening
radiance[W/(m2*sr)]
geometrical factor[m2*sr]
radiant power[W]
integration over wavelengthof each camera pixel
geometrical factor[m2*sr]
calibration lamp:spectral radiance[W/(m2*sr*nm)]
radiance[W/(m2*sr)]
integration over wavelengthof each camera pixel
radiant power[W]
measured signal[counts/s]
correction factor[W*s/counts]
simulated spectrometersignal
[counts/s]
simulated spectra:spatially resolved, ∆λ=0.01
nm[W/(m3*sr*m)]
spectral radiance[W/(m2*sr*m)]
integration along line of sight & instrumental broadening
radiance[W/(m2*sr)]
geometrical factor[m2*sr]
radiant power[W]
integration over wavelengthof each camera pixel
geometrical factor[m2*sr]
calibration lamp:spectral radiance[W/(m2*sr*nm)]
radiance[W/(m2*sr)]
integration over wavelengthof each camera pixel
radiant power[W]
measured signal[counts/s]
correction factor[W*s/counts]
simulated spectrometersignal
[counts/s]
simulated spectrometersignal
[counts/s]
simulated spectra:spatially resolved, ∆λ=0.01
nm[W/(m3*sr*m)]
numerical simulation measurement of calibration lamps
Fig. 30 Scheme of the data evaluation procedure to determine the spectrometer response.
To simulate the radiating volume with the calibration lamps, they have been measured at different distances to the collimating system. Fig. 31 shows these measurements with the tungsten band lamp. Due to the limited area of the radiating surface of the lamp, the emission decreases with rising distance. Nevertheless, the qualitative course of the results can be reproduced rather accurately by the ray tracing procedure which is therefore considered to be well suited for this investigation. With a radiating volume as given in the flight configuration, the simulation does not show this decrease if constant radiating volumes are assumed.
measured intensity at different axial positions
0
0,2
0,4
0,6
0,8
1
1,2
150 160 170 180 190 200 210axial distance [mm]
norm
alise
d in
tens
ity [a
rb u
nits
]
measurement S2000measurement MCSray tracingflight configuration
Fig. 31 Qualitative variation of measured tungsten band lamp radiation at different distances to the collimating system and results of the ray tracing simulation for the
experimental set up and for the flight configuration.
Advanced Integrated TPS and Non Equilibrium Chemistry Instrumentation
RTO-EN-AVT-130 15 - 21
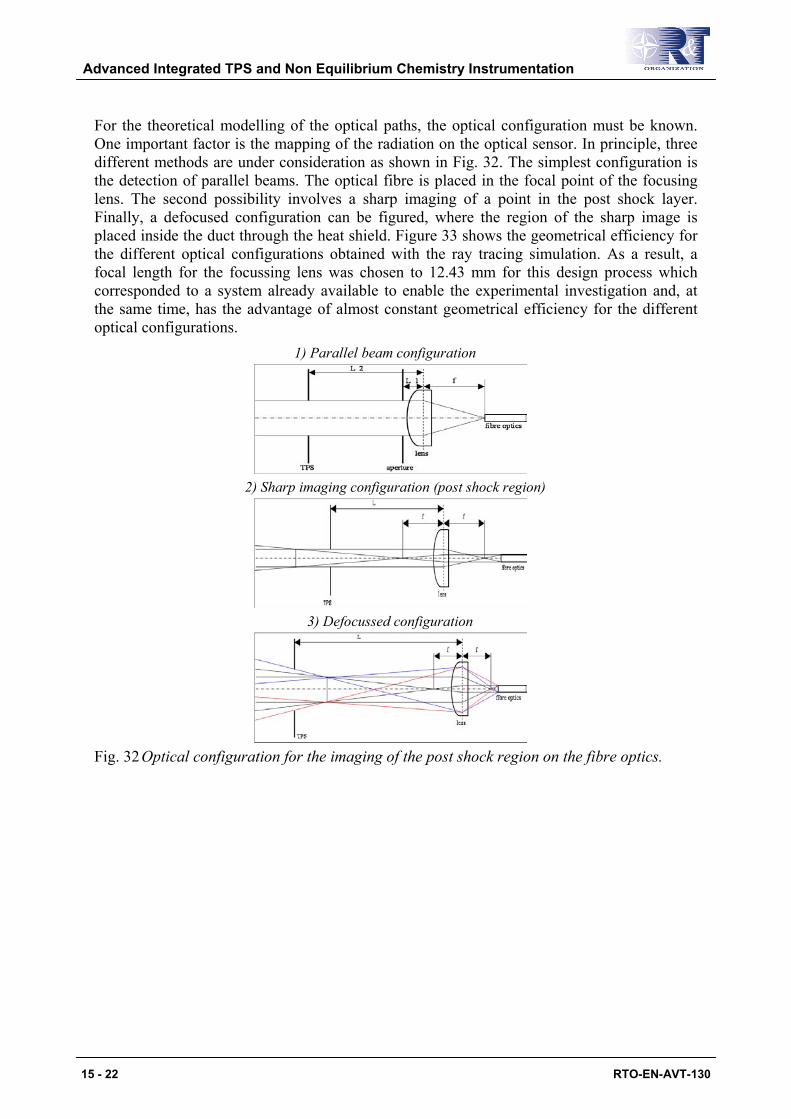
For the theoretical modelling of the optical paths, the optical configuration must be known. One important factor is the mapping of the radiation on the optical sensor. In principle, three different methods are under consideration as shown in Fig. 32. The simplest configuration is the detection of parallel beams. The optical fibre is placed in the focal point of the focusing lens. The second possibility involves a sharp imaging of a point in the post shock layer. Finally, a defocused configuration can be figured, where the region of the sharp image is placed inside the duct through the heat shield. Figure 33 shows the geometrical efficiency for the different optical configurations obtained with the ray tracing simulation. As a result, a focal length for the focussing lens was chosen to 12.43 mm for this design process which corresponded to a system already available to enable the experimental investigation and, at the same time, has the advantage of almost constant geometrical efficiency for the different optical configurations.
1) Parallel beam configuration
2) Sharp imaging configuration (post shock region)
3) Defocussed configuration
Fig. 32 Optical configuration for the imaging of the post shock region on the fibre optics.
Advanced Integrated TPS and Non Equilibrium Chemistry Instrumentation
15 - 22 RTO-EN-AVT-130
0,00
0,01
0,02
0,03
0,04
0,05
0,06
5 10 15 20focal length [mm]
geom
etri
cal f
acto
r [m
m2 *s
r] parallel beam conf.sharp image conf.defocussed conf.
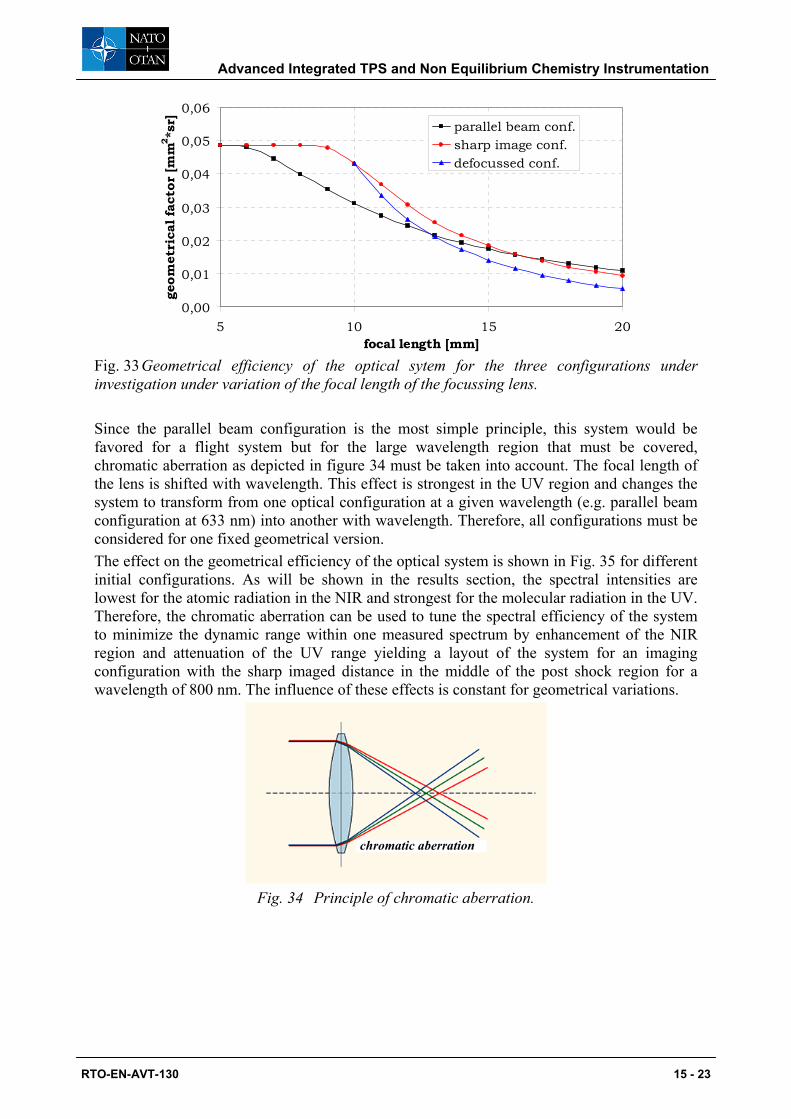
Fig. 33 Geometrical efficiency of the optical sytem for the three configurations under investigation under variation of the focal length of the focussing lens. Since the parallel beam configuration is the most simple principle, this system would be favored for a flight system but for the large wavelength region that must be covered, chromatic aberration as depicted in figure 34 must be taken into account. The focal length of the lens is shifted with wavelength. This effect is strongest in the UV region and changes the system to transform from one optical configuration at a given wavelength (e.g. parallel beam configuration at 633 nm) into another with wavelength. Therefore, all configurations must be considered for one fixed geometrical version. The effect on the geometrical efficiency of the optical system is shown in Fig. 35 for different initial configurations. As will be shown in the results section, the spectral intensities are lowest for the atomic radiation in the NIR and strongest for the molecular radiation in the UV. Therefore, the chromatic aberration can be used to tune the spectral efficiency of the system to minimize the dynamic range within one measured spectrum by enhancement of the NIR region and attenuation of the UV range yielding a layout of the system for an imaging configuration with the sharp imaged distance in the middle of the post shock region for a wavelength of 800 nm. The influence of these effects is constant for geometrical variations.
Fig. 34 Principle of chromatic aberration.
chromatic aberration
Advanced Integrated TPS and Non Equilibrium Chemistry Instrumentation
RTO-EN-AVT-130 15 - 23
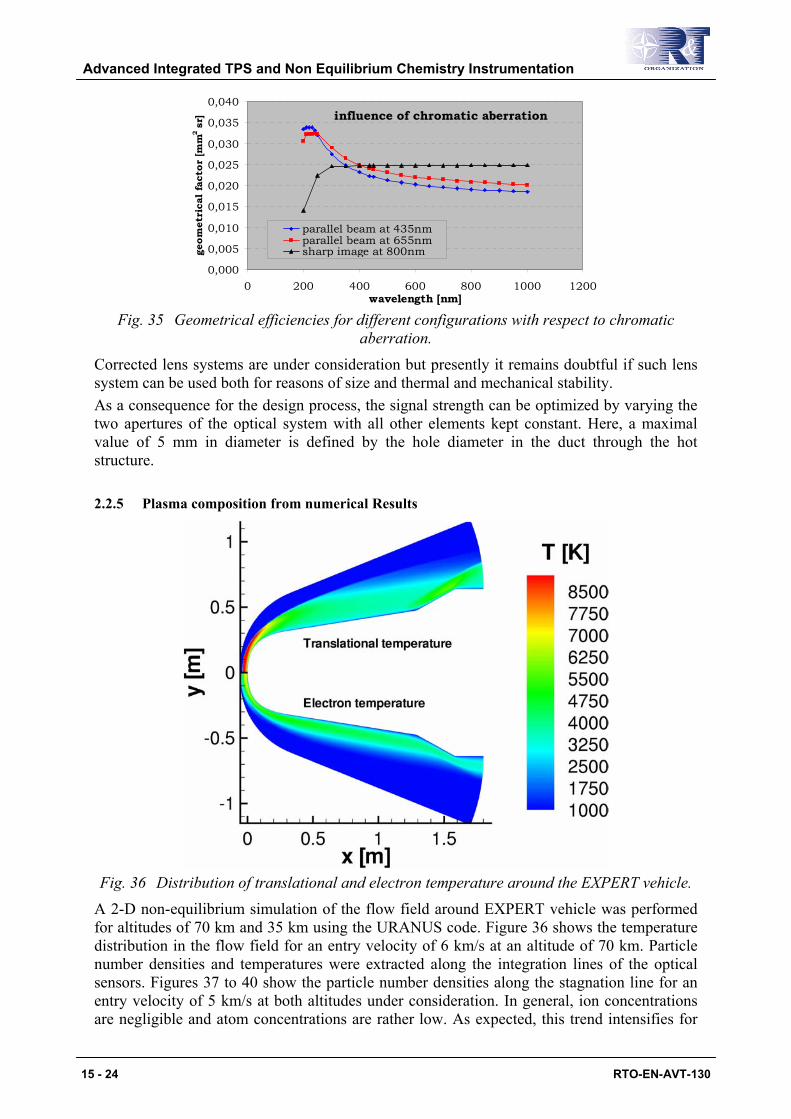
influence of chromatic aberration
0,000
0,005
0,010
0,015
0,020
0,025
0,030
0,035
0,040
0 200 400 600 800 1000 1200wavelength [nm]
geom
etri
cal f
acto
r [m
m2
sr]
parallel beam at 435nmparallel beam at 655nmsharp image at 800nm
Fig. 35 Geometrical efficiencies for different configurations with respect to chromatic
aberration.
Corrected lens systems are under consideration but presently it remains doubtful if such lens system can be used both for reasons of size and thermal and mechanical stability. As a consequence for the design process, the signal strength can be optimized by varying the two apertures of the optical system with all other elements kept constant. Here, a maximal value of 5 mm in diameter is defined by the hole diameter in the duct through the hot structure.
2.2.5 Plasma composition from numerical Results
Fig. 36 Distribution of translational and electron temperature around the EXPERT vehicle.
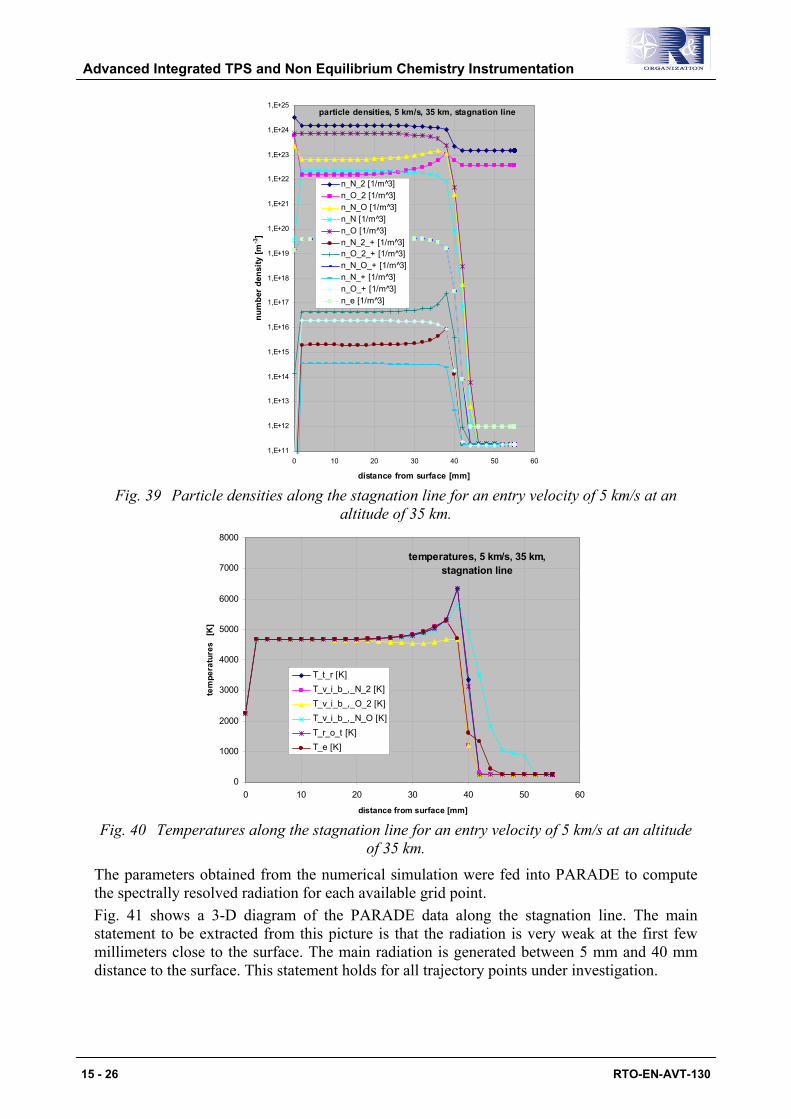
A 2-D non-equilibrium simulation of the flow field around EXPERT vehicle was performed for altitudes of 70 km and 35 km using the URANUS code. Figure 36 shows the temperature distribution in the flow field for an entry velocity of 6 km/s at an altitude of 70 km. Particle number densities and temperatures were extracted along the integration lines of the optical sensors. Figures 37 to 40 show the particle number densities along the stagnation line for an entry velocity of 5 km/s at both altitudes under consideration. In general, ion concentrations are negligible and atom concentrations are rather low. As expected, this trend intensifies for
Advanced Integrated TPS and Non Equilibrium Chemistry Instrumentation
15 - 24 RTO-EN-AVT-130
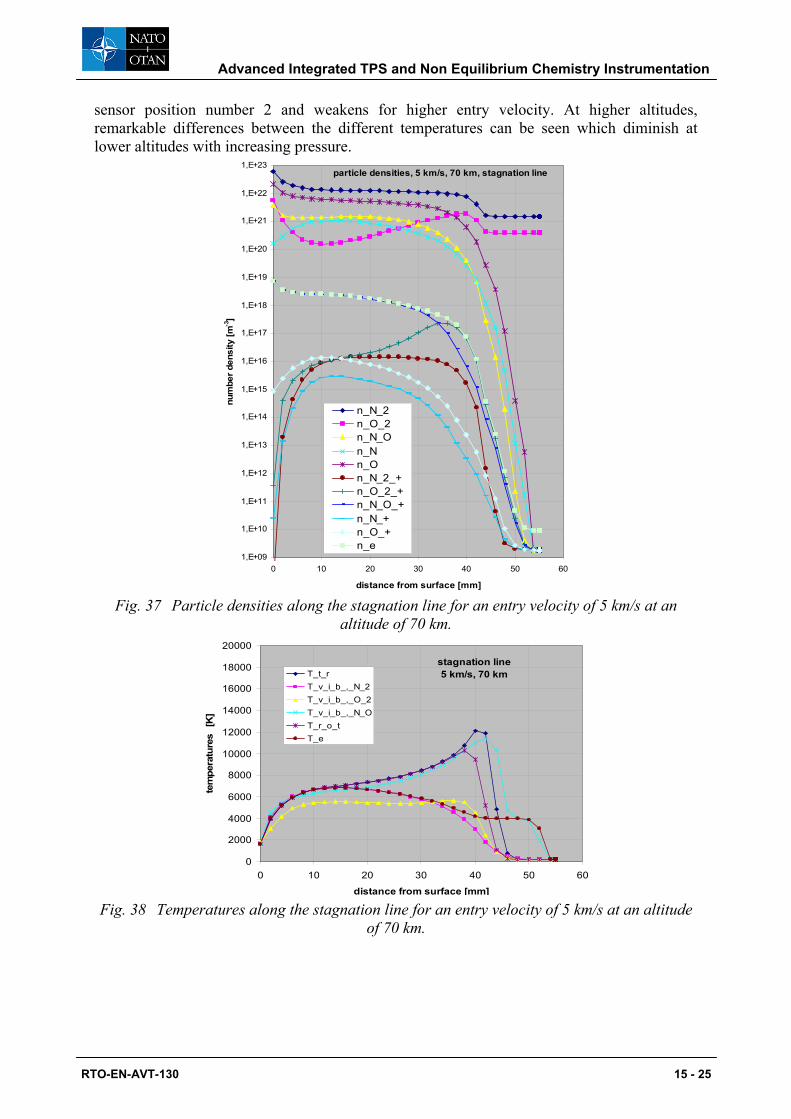
sensor position number 2 and weakens for higher entry velocity. At higher altitudes, remarkable differences between the different temperatures can be seen which diminish at lower altitudes with increasing pressure.
1,E+09
1,E+10
1,E+11
1,E+12
1,E+13
1,E+14
1,E+15
1,E+16
1,E+17
1,E+18
1,E+19
1,E+20
1,E+21
1,E+22
1,E+23
0 10 20 30 40 50 60
distance from surface [mm]
num
ber d
ensi
ty [m
-3]
n_N_2 n_O_2 n_N_O n_N n_O n_N_2_+ n_O_2_+ n_N_O_+ n_N_+ n_O_+ n_e
particle densities, 5 km/s, 70 km, stagnation line
Fig. 37 Particle densities along the stagnation line for an entry velocity of 5 km/s at an
altitude of 70 km.
0
2000
4000
6000
8000
10000
12000
14000
16000
18000
20000
0 10 20 30 40 50 60
distance from surface [mm]
tem
pera
ture
s [
K]
T_t_rT_v_i_b_,_N_2T_v_i_b_,_O_2T_v_i_b_,_N_OT_r_o_tT_e
stagnation line5 km/s, 70 km
Fig. 38 Temperatures along the stagnation line for an entry velocity of 5 km/s at an altitude
of 70 km.
Advanced Integrated TPS and Non Equilibrium Chemistry Instrumentation
RTO-EN-AVT-130 15 - 25
1,E+11
1,E+12
1,E+13
1,E+14
1,E+15
1,E+16
1,E+17
1,E+18
1,E+19
1,E+20
1,E+21
1,E+22
1,E+23
1,E+24
1,E+25
0 10 20 30 40 50 60
distance from surface [mm]
num
ber
dens
ity [m
-3]
n_N_2 [1/m^3]n_O_2 [1/m^3]n_N_O [1/m 3̂]n_N [1/m^3]n_O [1/m^3]n_N_2_+ [1/m^3]n_O_2_+ [1/m 3̂]n_N_O_+ [1/m^3]n_N_+ [1/m^3]n_O_+ [1/m^3]n_e [1/m 3̂]
particle densities, 5 km/s, 35 km, stagnation line
Fig. 39 Particle densities along the stagnation line for an entry velocity of 5 km/s at an
altitude of 35 km.
0
1000
2000
3000
4000
5000
6000
7000
8000
0 10 20 30 40 50 60
distance from surface [mm]
tem
pera
ture
s [
K]
T_t_r [K]T_v_i_b_,_N_2 [K]T_v_i_b_,_O_2 [K]T_v_i_b_,_N_O [K]T_r_o_t [K]T_e [K]
temperatures, 5 km/s, 35 km, stagnation line
Fig. 40 Temperatures along the stagnation line for an entry velocity of 5 km/s at an altitude
of 35 km.
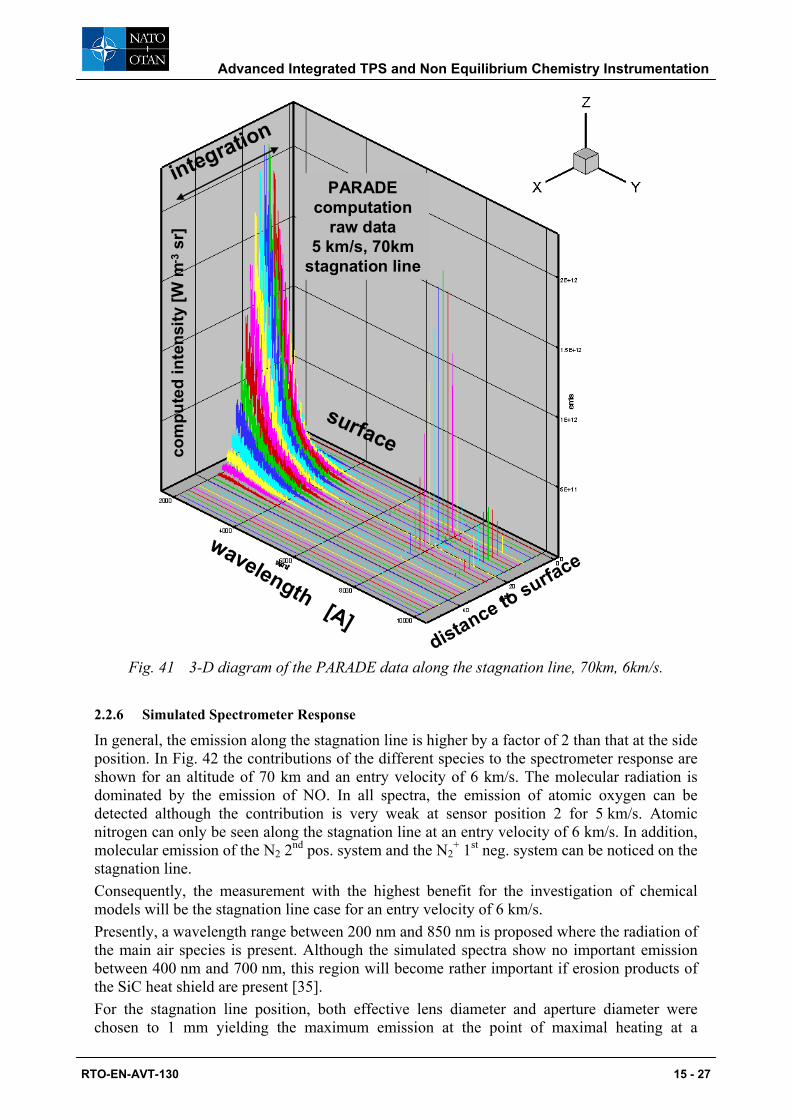
The parameters obtained from the numerical simulation were fed into PARADE to compute the spectrally resolved radiation for each available grid point. Fig. 41 shows a 3-D diagram of the PARADE data along the stagnation line. The main statement to be extracted from this picture is that the radiation is very weak at the first few millimeters close to the surface. The main radiation is generated between 5 mm and 40 mm distance to the surface. This statement holds for all trajectory points under investigation.
Advanced Integrated TPS and Non Equilibrium Chemistry Instrumentation
15 - 26 RTO-EN-AVT-130
surface
distance to surfacewavelength [A]
integration
PARADEcomputation
raw data5 km/s, 70km
stagnation line
com
pute
d in
tens
ity [W
m-3
sr]
Fig. 41 3-D diagram of the PARADE data along the stagnation line, 70km, 6km/s.
2.2.6 Simulated Spectrometer Response
In general, the emission along the stagnation line is higher by a factor of 2 than that at the side position. In Fig. 42 the contributions of the different species to the spectrometer response are shown for an altitude of 70 km and an entry velocity of 6 km/s. The molecular radiation is dominated by the emission of NO. In all spectra, the emission of atomic oxygen can be detected although the contribution is very weak at sensor position 2 for 5 km/s. Atomic nitrogen can only be seen along the stagnation line at an entry velocity of 6 km/s. In addition, molecular emission of the N2 2nd pos. system and the N2
+ 1st neg. system can be noticed on the stagnation line. Consequently, the measurement with the highest benefit for the investigation of chemical models will be the stagnation line case for an entry velocity of 6 km/s. Presently, a wavelength range between 200 nm and 850 nm is proposed where the radiation of the main air species is present. Although the simulated spectra show no important emission between 400 nm and 700 nm, this region will become rather important if erosion products of the SiC heat shield are present [35]. For the stagnation line position, both effective lens diameter and aperture diameter were chosen to 1 mm yielding the maximum emission at the point of maximal heating at a
Advanced Integrated TPS and Non Equilibrium Chemistry Instrumentation
RTO-EN-AVT-130 15 - 27
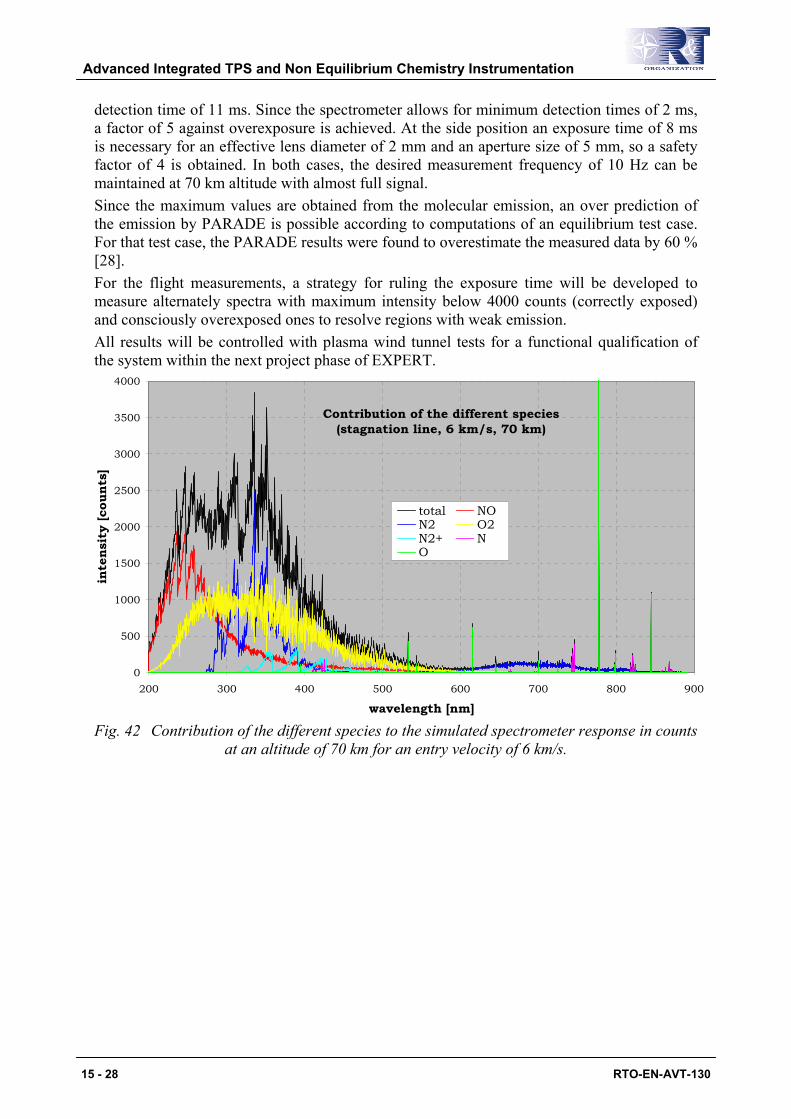
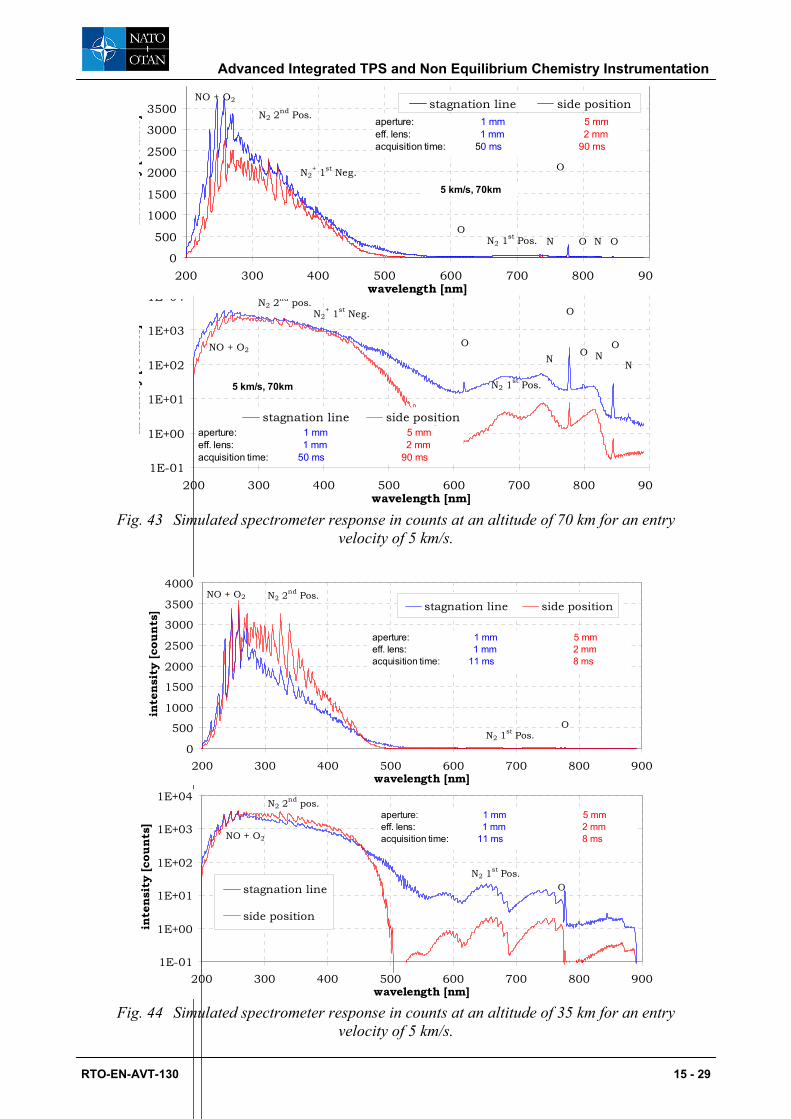
detection time of 11 ms. Since the spectrometer allows for minimum detection times of 2 ms, a factor of 5 against overexposure is achieved. At the side position an exposure time of 8 ms is necessary for an effective lens diameter of 2 mm and an aperture size of 5 mm, so a safety factor of 4 is obtained. In both cases, the desired measurement frequency of 10 Hz can be maintained at 70 km altitude with almost full signal. Since the maximum values are obtained from the molecular emission, an over prediction of the emission by PARADE is possible according to computations of an equilibrium test case. For that test case, the PARADE results were found to overestimate the measured data by 60 % [28]. For the flight measurements, a strategy for ruling the exposure time will be developed to measure alternately spectra with maximum intensity below 4000 counts (correctly exposed) and consciously overexposed ones to resolve regions with weak emission. All results will be controlled with plasma wind tunnel tests for a functional qualification of the system within the next project phase of EXPERT.
Contribution of the different species (stagnation line, 6 km/s, 70 km)
0
500
1000
1500
2000
2500
3000
3500
4000
200 300 400 500 600 700 800 900
wavelength [nm]
inte
nsit
y [c
ount
s]
total NON2 O2N2+ NO
Fig. 42 Contribution of the different species to the simulated spectrometer response in counts
at an altitude of 70 km for an entry velocity of 6 km/s.
Advanced Integrated TPS and Non Equilibrium Chemistry Instrumentation
15 - 28 RTO-EN-AVT-130
0
500
1000
1500
2000
2500
3000
3500
200 300 400 500 600 700 800 90wavelength [nm]
inte
nsit
y [c
ount
s]
stagnation line side positionNO + O2
N2 2nd Pos.
N2+ 1st Neg.
N ONO
N2 1st Pos. O
aperture: 1 mm 5 mm eff. lens: 1 mm 2 mmacquisition time: 50 ms 90 ms
O
5 km/s, 70km
1E-01
1E+00
1E+01
1E+02
1E+03
1E 04
200 300 400 500 600 700 800 90wavelength [nm]
inte
nsit
y [c
ount
s]
stagnation line side position
NO + O2
N2 2nd pos.
N2+ 1st Neg.
N
O
ON
O
N2 1st Pos.
ON
aperture: 1 mm 5 mm eff. lens: 1 mm 2 mmacquisition time: 50 ms 90 ms
5 km/s, 70km
Fig. 43 Simulated spectrometer response in counts at an altitude of 70 km for an entry
velocity of 5 km/s.
0
500
1000
1500
2000
2500
3000
3500
4000
200 300 400 500 600 700 800 900wavelength [nm]
inte
nsit
y [c
ount
s]
stagnation line side positionNO + O2 N2 2
nd Pos.
ON2 1
st Pos.
aperture: 1 mm 5 mm eff. lens: 1 mm 2 mmacquisition time: 11 ms 8 ms
1E-01
1E+00
1E+01
1E+02
1E+03
1E+04
200 300 400 500 600 700 800 900wavelength [nm]
inte
nsit
y [c
ount
s]
stagnation line
side position
NO + O2
N2 2nd pos.
ON2 1
st Pos.
aperture: 1 mm 5 mm eff. lens: 1 mm 2 mmacquisition time: 11 ms 8 ms
Fig. 44 Simulated spectrometer response in counts at an altitude of 35 km for an entry
velocity of 5 km/s.
Advanced Integrated TPS and Non Equilibrium Chemistry Instrumentation
RTO-EN-AVT-130 15 - 29
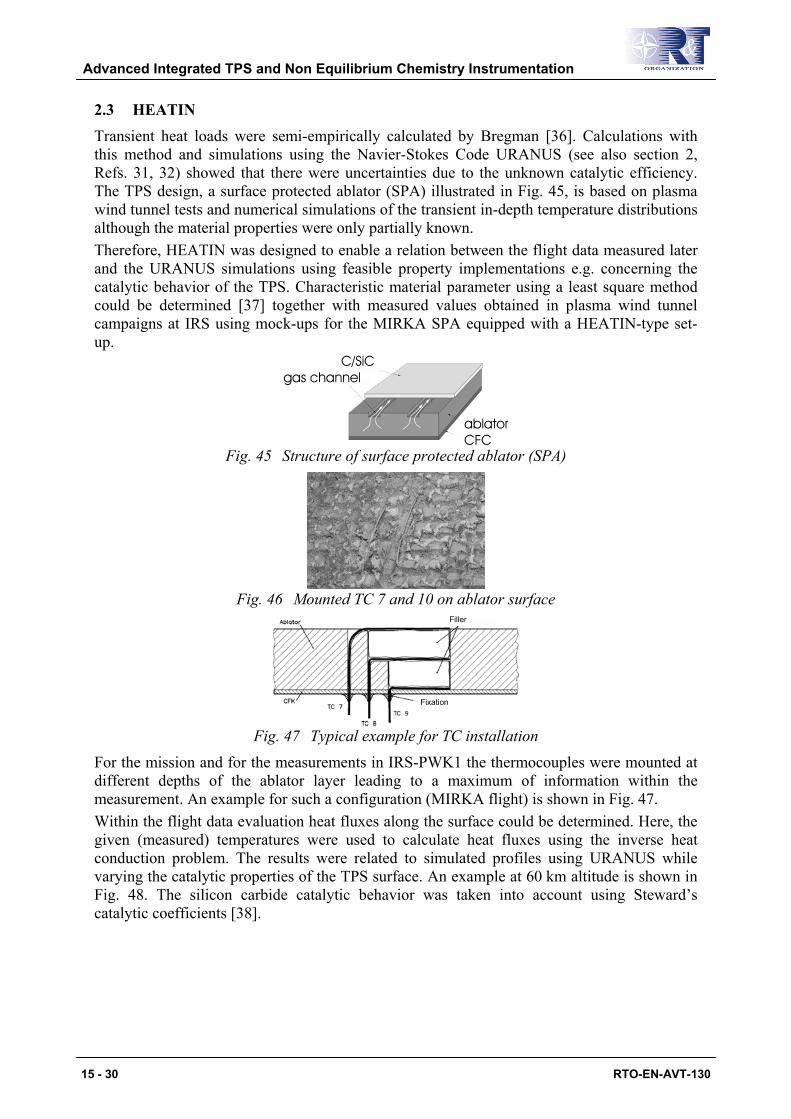
2.3 HEATIN Transient heat loads were semi-empirically calculated by Bregman [36]. Calculations with this method and simulations using the Navier-Stokes Code URANUS (see also section 2, Refs. 31, 32) showed that there were uncertainties due to the unknown catalytic efficiency. The TPS design, a surface protected ablator (SPA) illustrated in Fig. 45, is based on plasma wind tunnel tests and numerical simulations of the transient in-depth temperature distributions although the material properties were only partially known. Therefore, HEATIN was designed to enable a relation between the flight data measured later and the URANUS simulations using feasible property implementations e.g. concerning the catalytic behavior of the TPS. Characteristic material parameter using a least square method could be determined [37] together with measured values obtained in plasma wind tunnel campaigns at IRS using mock-ups for the MIRKA SPA equipped with a HEATIN-type set-up.
Fig. 45 Structure of surface protected ablator (SPA)
Fig. 46 Mounted TC 7 and 10 on ablator surface
Fig. 47 Typical example for TC installation
For the mission and for the measurements in IRS-PWK1 the thermocouples were mounted at different depths of the ablator layer leading to a maximum of information within the measurement. An example for such a configuration (MIRKA flight) is shown in Fig. 47. Within the flight data evaluation heat fluxes along the surface could be determined. Here, the given (measured) temperatures were used to calculate heat fluxes using the inverse heat conduction problem. The results were related to simulated profiles using URANUS while varying the catalytic properties of the TPS surface. An example at 60 km altitude is shown in Fig. 48. The silicon carbide catalytic behavior was taken into account using Steward’s catalytic coefficients [38].
Advanced Integrated TPS and Non Equilibrium Chemistry Instrumentation
15 - 30 RTO-EN-AVT-130
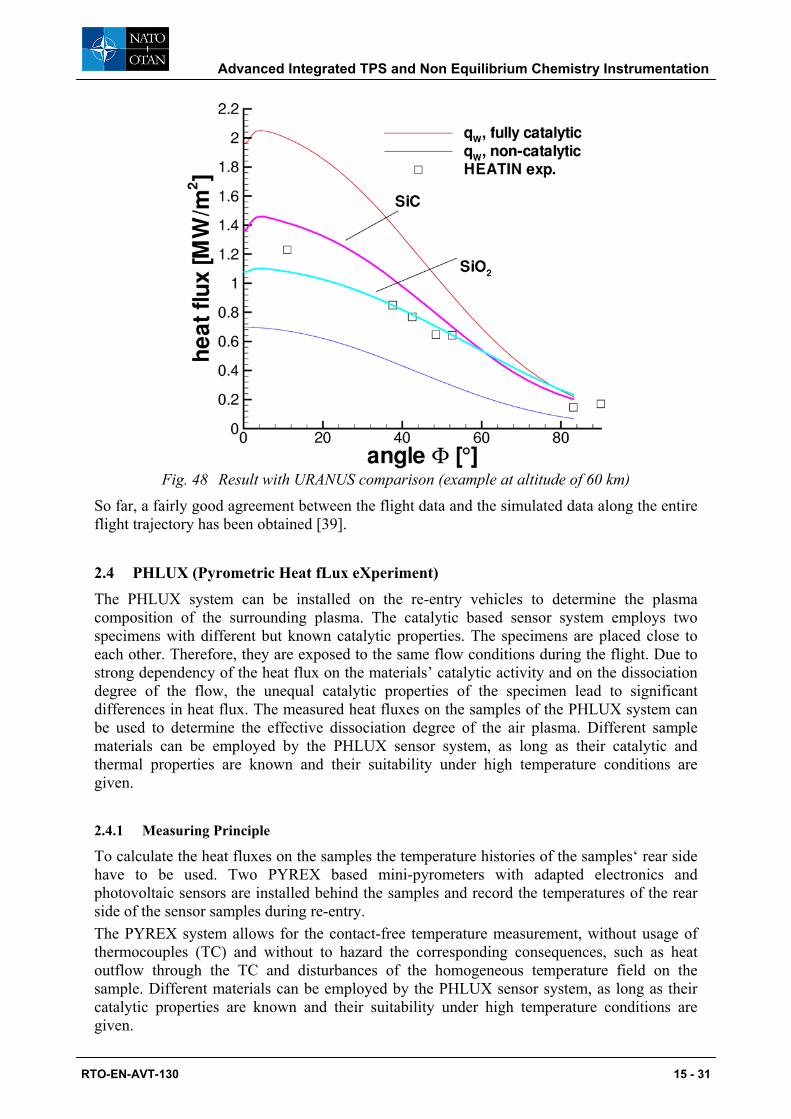
Fig. 48 Result with URANUS comparison (example at altitude of 60 km)
So far, a fairly good agreement between the flight data and the simulated data along the entire flight trajectory has been obtained [39].
2.4 PHLUX (Pyrometric Heat fLux eXperiment) The PHLUX system can be installed on the re-entry vehicles to determine the plasma composition of the surrounding plasma. The catalytic based sensor system employs two specimens with different but known catalytic properties. The specimens are placed close to each other. Therefore, they are exposed to the same flow conditions during the flight. Due to strong dependency of the heat flux on the materials’ catalytic activity and on the dissociation degree of the flow, the unequal catalytic properties of the specimen lead to significant differences in heat flux. The measured heat fluxes on the samples of the PHLUX system can be used to determine the effective dissociation degree of the air plasma. Different sample materials can be employed by the PHLUX sensor system, as long as their catalytic and thermal properties are known and their suitability under high temperature conditions are given. 2.4.1 Measuring Principle
To calculate the heat fluxes on the samples the temperature histories of the samples‘ rear side have to be used. Two PYREX based mini-pyrometers with adapted electronics and photovoltaic sensors are installed behind the samples and record the temperatures of the rear side of the sensor samples during re-entry. The PYREX system allows for the contact-free temperature measurement, without usage of thermocouples (TC) and without to hazard the corresponding consequences, such as heat outflow through the TC and disturbances of the homogeneous temperature field on the sample. Different materials can be employed by the PHLUX sensor system, as long as their catalytic properties are known and their suitability under high temperature conditions are given.
Advanced Integrated TPS and Non Equilibrium Chemistry Instrumentation
RTO-EN-AVT-130 15 - 31
Post flight analysis can be divided in the following steps: At first the structural heat losses due to thermal conductivity of the sample and the sub-structure have to be quantified. Therefore, a transient thermal analysis with the model of the experiment has to be performed. Temperature dependent material properties as well as boundary conditions and transient loads have to be taken into account. During the second step the corresponding heat flux is calculated by an inverse method with an specially developed code. 2.4.2 Setup of the Sensor system PHLUX-EXPERT
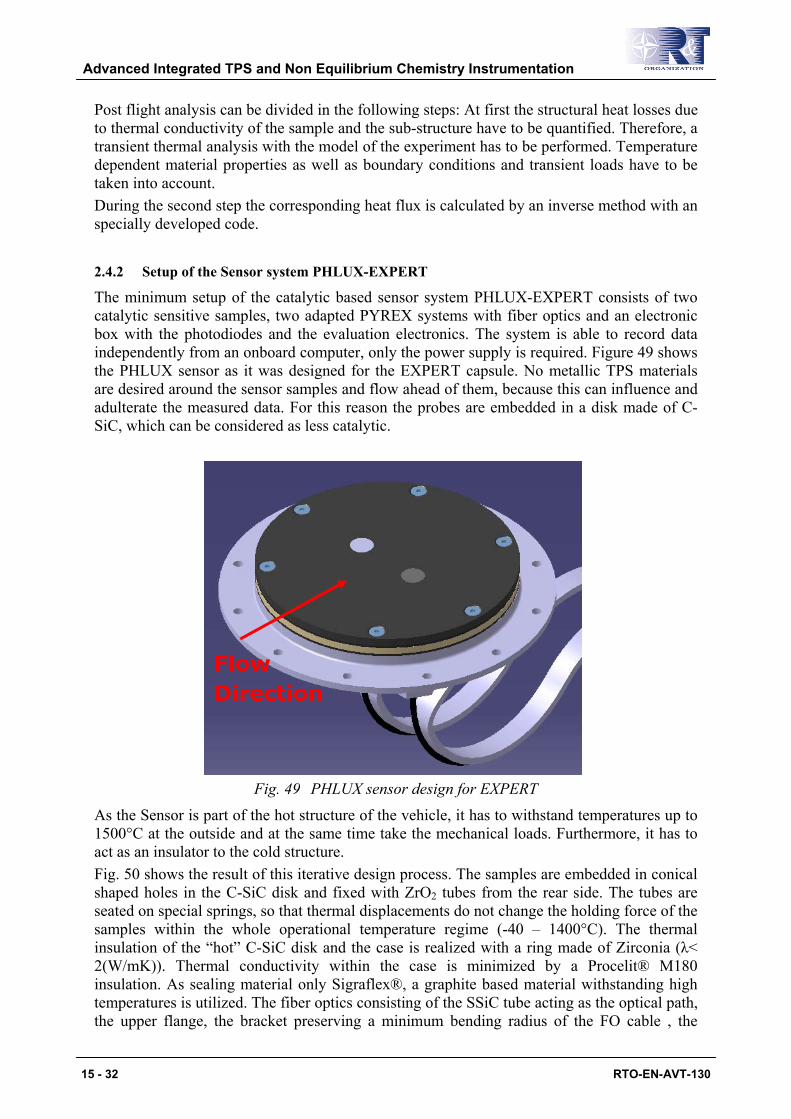
The minimum setup of the catalytic based sensor system PHLUX-EXPERT consists of two catalytic sensitive samples, two adapted PYREX systems with fiber optics and an electronic box with the photodiodes and the evaluation electronics. The system is able to record data independently from an onboard computer, only the power supply is required. Figure 49 shows the PHLUX sensor as it was designed for the EXPERT capsule. No metallic TPS materials are desired around the sensor samples and flow ahead of them, because this can influence and adulterate the measured data. For this reason the probes are embedded in a disk made of C-SiC, which can be considered as less catalytic.
Fig. 49 PHLUX sensor design for EXPERT
As the Sensor is part of the hot structure of the vehicle, it has to withstand temperatures up to 1500°C at the outside and at the same time take the mechanical loads. Furthermore, it has to act as an insulator to the cold structure. Fig. 50 shows the result of this iterative design process. The samples are embedded in conical shaped holes in the C-SiC disk and fixed with ZrO2 tubes from the rear side. The tubes are seated on special springs, so that thermal displacements do not change the holding force of the samples within the whole operational temperature regime (-40 – 1400°C). The thermal insulation of the “hot” C-SiC disk and the case is realized with a ring made of Zirconia (λ< 2(W/mK)). Thermal conductivity within the case is minimized by a Procelit® M180 insulation. As sealing material only Sigraflex®, a graphite based material withstanding high temperatures is utilized. The fiber optics consisting of the SSiC tube acting as the optical path, the upper flange, the bracket preserving a minimum bending radius of the FO cable , the
Flow Direction
Advanced Integrated TPS and Non Equilibrium Chemistry Instrumentation
15 - 32 RTO-EN-AVT-130
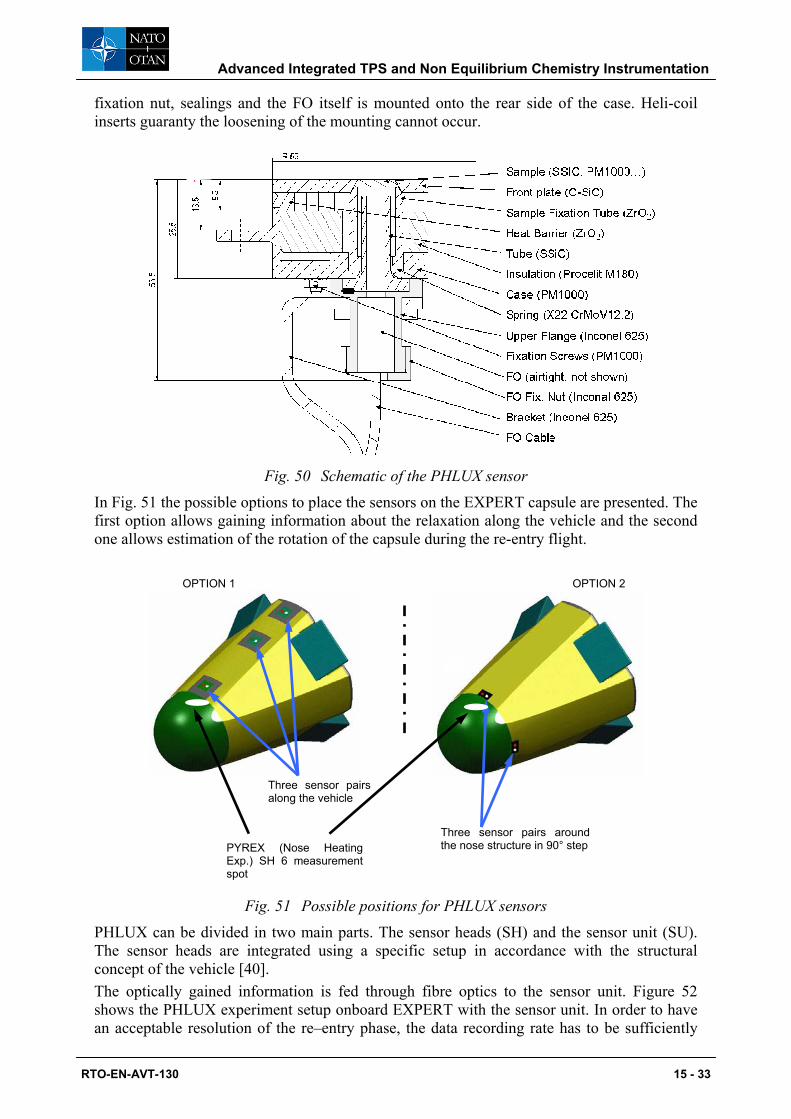
fixation nut, sealings and the FO itself is mounted onto the rear side of the case. Heli-coil inserts guaranty the loosening of the mounting cannot occur.
Fig. 50 Schematic of the PHLUX sensor
In Fig. 51 the possible options to place the sensors on the EXPERT capsule are presented. The first option allows gaining information about the relaxation along the vehicle and the second one allows estimation of the rotation of the capsule during the re-entry flight.
Fig. 51 Possible positions for PHLUX sensors
PHLUX can be divided in two main parts. The sensor heads (SH) and the sensor unit (SU). The sensor heads are integrated using a specific setup in accordance with the structural concept of the vehicle [40]. The optically gained information is fed through fibre optics to the sensor unit. Figure 52 shows the PHLUX experiment setup onboard EXPERT with the sensor unit. In order to have an acceptable resolution of the re–entry phase, the data recording rate has to be sufficiently
PYREX (Nose Heating Exp.) SH 6 measurement spot
Three sensor pairs around the nose structure in 90° step
OPTION 2 OPTION 1
Three sensor pairs along the vehicle
Advanced Integrated TPS and Non Equilibrium Chemistry Instrumentation
RTO-EN-AVT-130 15 - 33
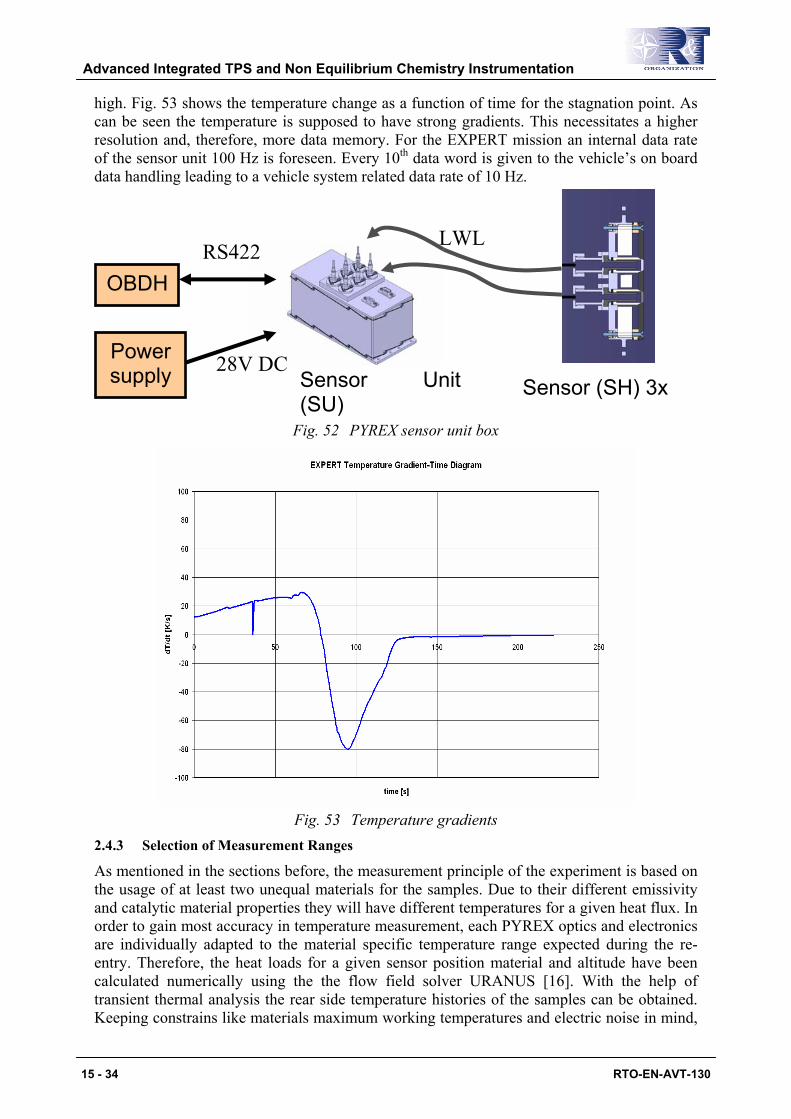
high. Fig. 53 shows the temperature change as a function of time for the stagnation point. As can be seen the temperature is supposed to have strong gradients. This necessitates a higher resolution and, therefore, more data memory. For the EXPERT mission an internal data rate of the sensor unit 100 Hz is foreseen. Every 10th data word is given to the vehicle’s on board data handling leading to a vehicle system related data rate of 10 Hz.
Fig. 52 PYREX sensor unit box
Fig. 53 Temperature gradients
2.4.3 Selection of Measurement Ranges
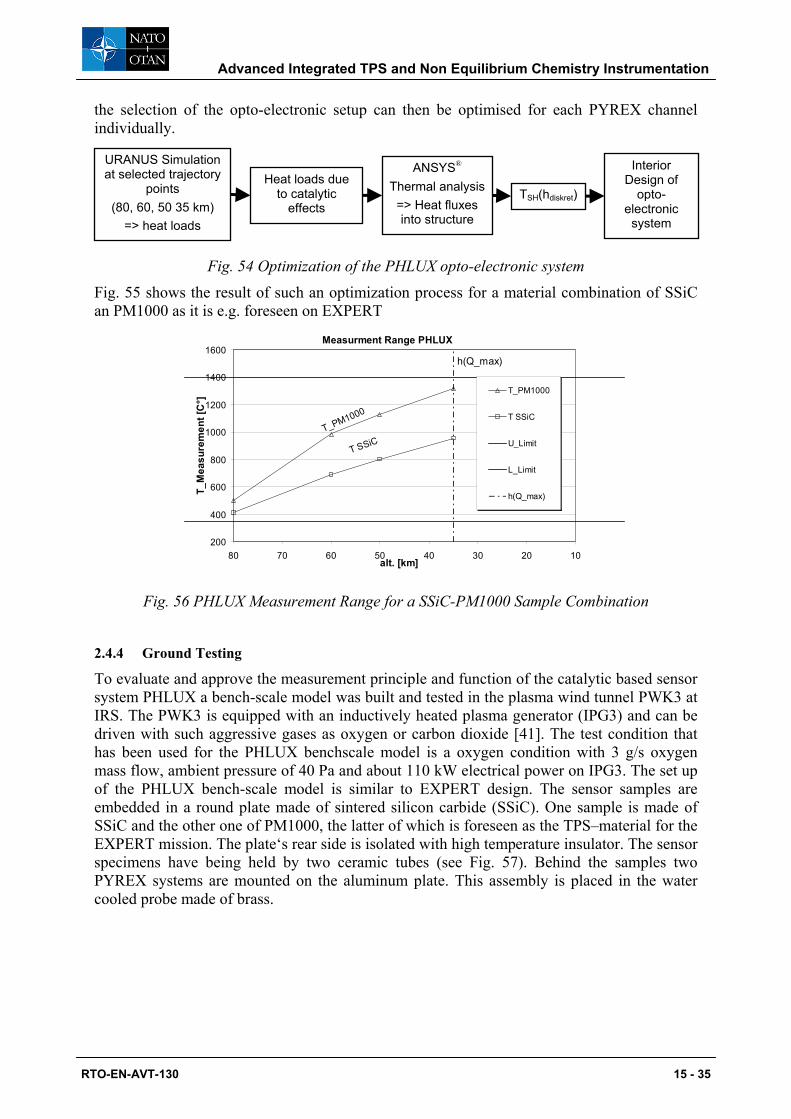
As mentioned in the sections before, the measurement principle of the experiment is based on the usage of at least two unequal materials for the samples. Due to their different emissivity and catalytic material properties they will have different temperatures for a given heat flux. In order to gain most accuracy in temperature measurement, each PYREX optics and electronics are individually adapted to the material specific temperature range expected during the re-entry. Therefore, the heat loads for a given sensor position material and altitude have been calculated numerically using the the flow field solver URANUS [16]. With the help of transient thermal analysis the rear side temperature histories of the samples can be obtained. Keeping constrains like materials maximum working temperatures and electric noise in mind,
OBDH
Sensor (SH) 3x
Power supply Sensor Unit
(SU)
LWLRS422
28V DC
Advanced Integrated TPS and Non Equilibrium Chemistry Instrumentation
15 - 34 RTO-EN-AVT-130
Measurment Range PHLUX
T_PM1000
T SSiC
h(Q_max)
200
400
600
800
1000
1200
1400
1600
1020304050607080alt. [km]
T_M
easu
rem
ent [
C°]
T_PM1000
T SSiC
U_Limit
L_Limit
h(Q_max)
the selection of the opto-electronic setup can then be optimised for each PYREX channel individually.
Fig. 54 Optimization of the PHLUX opto-electronic system
Fig. 55 shows the result of such an optimization process for a material combination of SSiC an PM1000 as it is e.g. foreseen on EXPERT
Fig. 56 PHLUX Measurement Range for a SSiC-PM1000 Sample Combination
2.4.4 Ground Testing
To evaluate and approve the measurement principle and function of the catalytic based sensor system PHLUX a bench-scale model was built and tested in the plasma wind tunnel PWK3 at IRS. The PWK3 is equipped with an inductively heated plasma generator (IPG3) and can be driven with such aggressive gases as oxygen or carbon dioxide [41]. The test condition that has been used for the PHLUX benchscale model is a oxygen condition with 3 g/s oxygen mass flow, ambient pressure of 40 Pa and about 110 kW electrical power on IPG3. The set up of the PHLUX bench-scale model is similar to EXPERT design. The sensor samples are embedded in a round plate made of sintered silicon carbide (SSiC). One sample is made of SSiC and the other one of PM1000, the latter of which is foreseen as the TPS–material for the EXPERT mission. The plate‘s rear side is isolated with high temperature insulator. The sensor specimens have being held by two ceramic tubes (see Fig. 57). Behind the samples two PYREX systems are mounted on the aluminum plate. This assembly is placed in the water cooled probe made of brass.
URANUS Simulation at selected trajectory
points (80, 60, 50 35 km)
=> heat loads
ANSYS®
Thermal analysis=> Heat fluxes into structure
TSH(hdiskret)
Interior Design of
opto- electronic
system
Heat loads due to catalytic
effects
Advanced Integrated TPS and Non Equilibrium Chemistry Instrumentation
RTO-EN-AVT-130 15 - 35
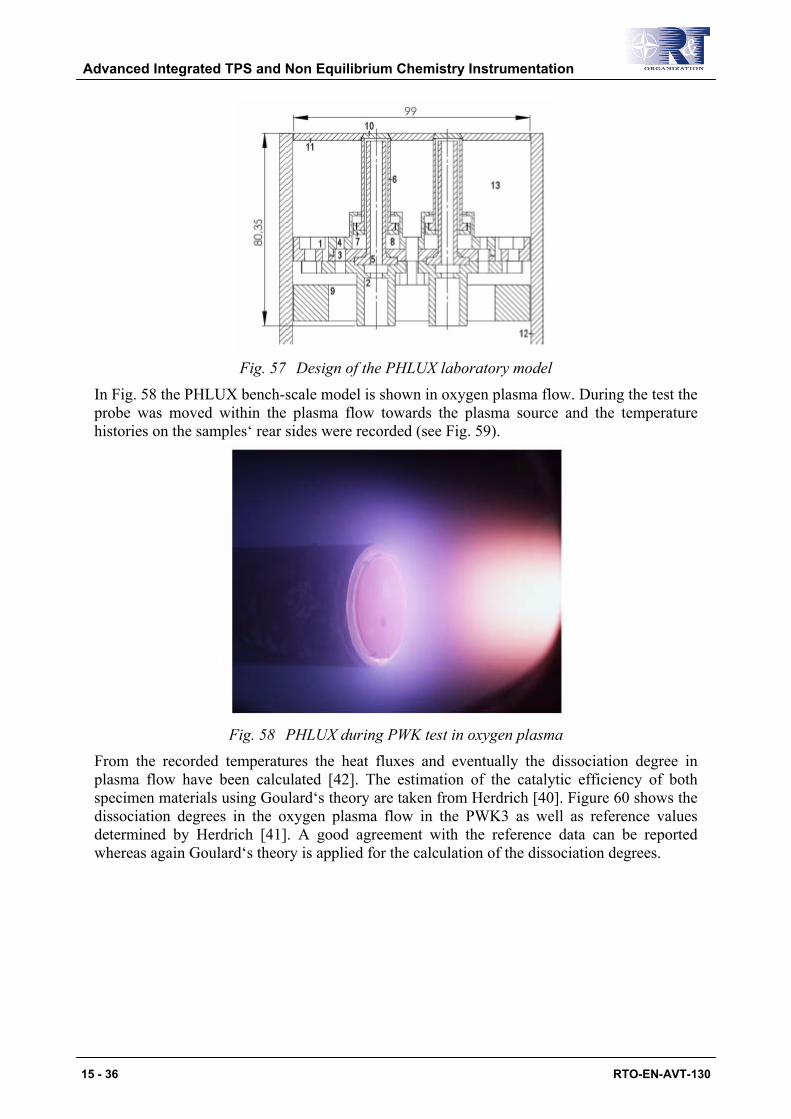
Fig. 57 Design of the PHLUX laboratory model
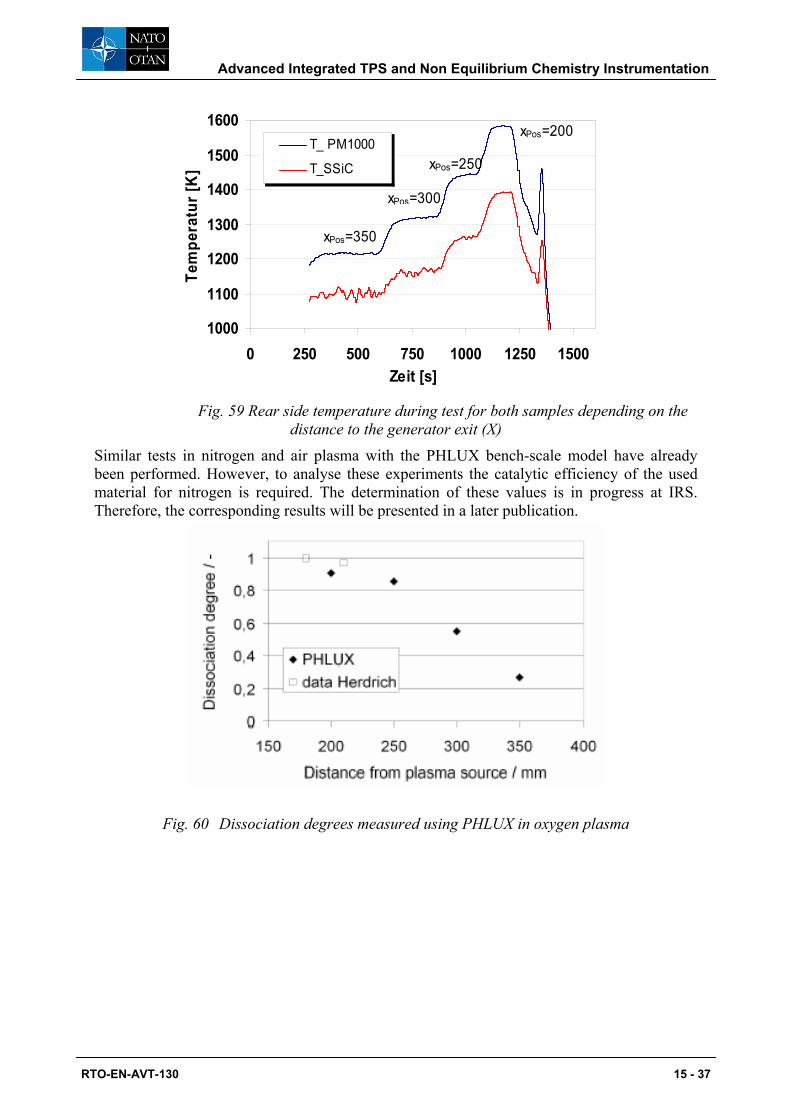
In Fig. 58 the PHLUX bench-scale model is shown in oxygen plasma flow. During the test the probe was moved within the plasma flow towards the plasma source and the temperature histories on the samples‘ rear sides were recorded (see Fig. 59).
Fig. 58 PHLUX during PWK test in oxygen plasma
From the recorded temperatures the heat fluxes and eventually the dissociation degree in plasma flow have been calculated [42]. The estimation of the catalytic efficiency of both specimen materials using Goulard‘s theory are taken from Herdrich [40]. Figure 60 shows the dissociation degrees in the oxygen plasma flow in the PWK3 as well as reference values determined by Herdrich [41]. A good agreement with the reference data can be reported whereas again Goulard‘s theory is applied for the calculation of the dissociation degrees.
Advanced Integrated TPS and Non Equilibrium Chemistry Instrumentation
15 - 36 RTO-EN-AVT-130
1000
1100
1200
1300
1400
1500
1600
0 250 500 750 1000 1250 1500Zeit [s]
Tem
pera
tur [
K]
T_ PM1000
T_SSiC
xPos=300
xPos=250
xPos=200
xPos=350
Fig. 59 Rear side temperature during test for both samples depending on the
distance to the generator exit (X)
Similar tests in nitrogen and air plasma with the PHLUX bench-scale model have already been performed. However, to analyse these experiments the catalytic efficiency of the used material for nitrogen is required. The determination of these values is in progress at IRS. Therefore, the corresponding results will be presented in a later publication.
Fig. 60 Dissociation degrees measured using PHLUX in oxygen plasma
Advanced Integrated TPS and Non Equilibrium Chemistry Instrumentation
RTO-EN-AVT-130 15 - 37
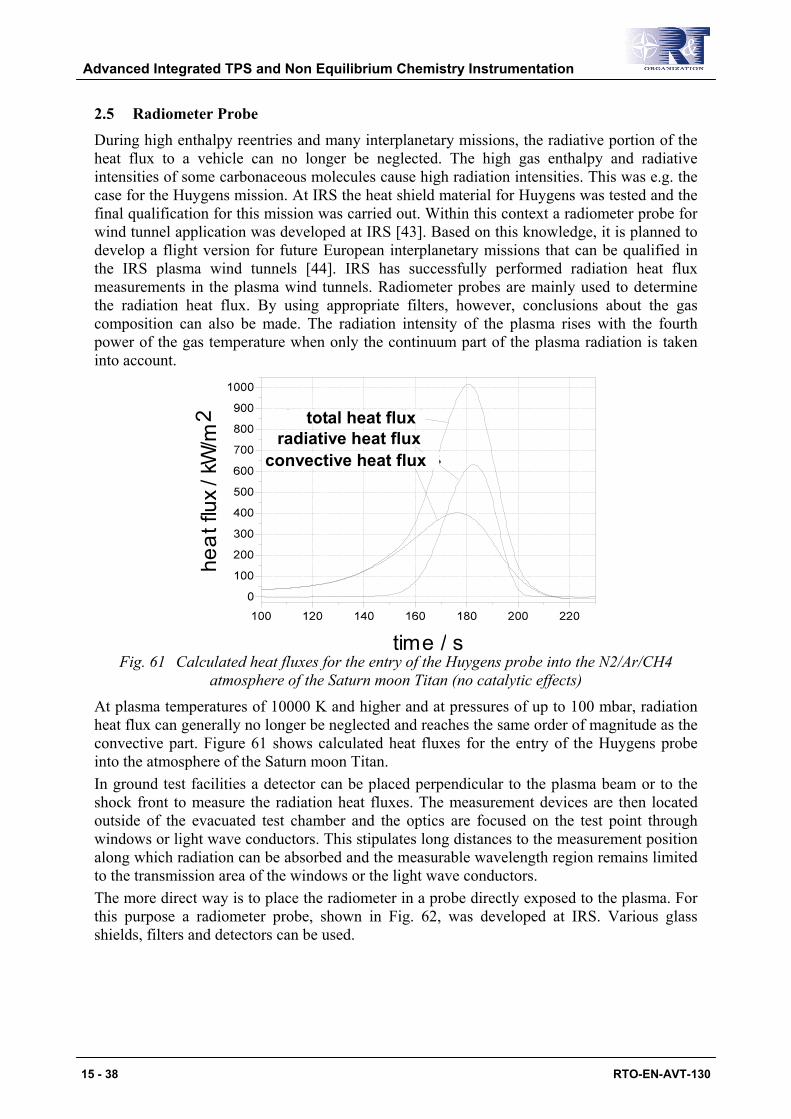
2.5 Radiometer Probe During high enthalpy reentries and many interplanetary missions, the radiative portion of the heat flux to a vehicle can no longer be neglected. The high gas enthalpy and radiative intensities of some carbonaceous molecules cause high radiation intensities. This was e.g. the case for the Huygens mission. At IRS the heat shield material for Huygens was tested and the final qualification for this mission was carried out. Within this context a radiometer probe for wind tunnel application was developed at IRS [43]. Based on this knowledge, it is planned to develop a flight version for future European interplanetary missions that can be qualified in the IRS plasma wind tunnels [44]. IRS has successfully performed radiation heat flux measurements in the plasma wind tunnels. Radiometer probes are mainly used to determine the radiation heat flux. By using appropriate filters, however, conclusions about the gas composition can also be made. The radiation intensity of the plasma rises with the fourth power of the gas temperature when only the continuum part of the plasma radiation is taken into account.
total heat fluxradiative heat flux
convective heat flux
heat
flux
/kW
/m2
time / s Fig. 61 Calculated heat fluxes for the entry of the Huygens probe into the N2/Ar/CH4
atmosphere of the Saturn moon Titan (no catalytic effects)
At plasma temperatures of 10000 K and higher and at pressures of up to 100 mbar, radiation heat flux can generally no longer be neglected and reaches the same order of magnitude as the convective part. Figure 61 shows calculated heat fluxes for the entry of the Huygens probe into the atmosphere of the Saturn moon Titan. In ground test facilities a detector can be placed perpendicular to the plasma beam or to the shock front to measure the radiation heat fluxes. The measurement devices are then located outside of the evacuated test chamber and the optics are focused on the test point through windows or light wave conductors. This stipulates long distances to the measurement position along which radiation can be absorbed and the measurable wavelength region remains limited to the transmission area of the windows or the light wave conductors. The more direct way is to place the radiometer in a probe directly exposed to the plasma. For this purpose a radiometer probe, shown in Fig. 62, was developed at IRS. Various glass shields, filters and detectors can be used.
Advanced Integrated TPS and Non Equilibrium Chemistry Instrumentation
15 - 38 RTO-EN-AVT-130
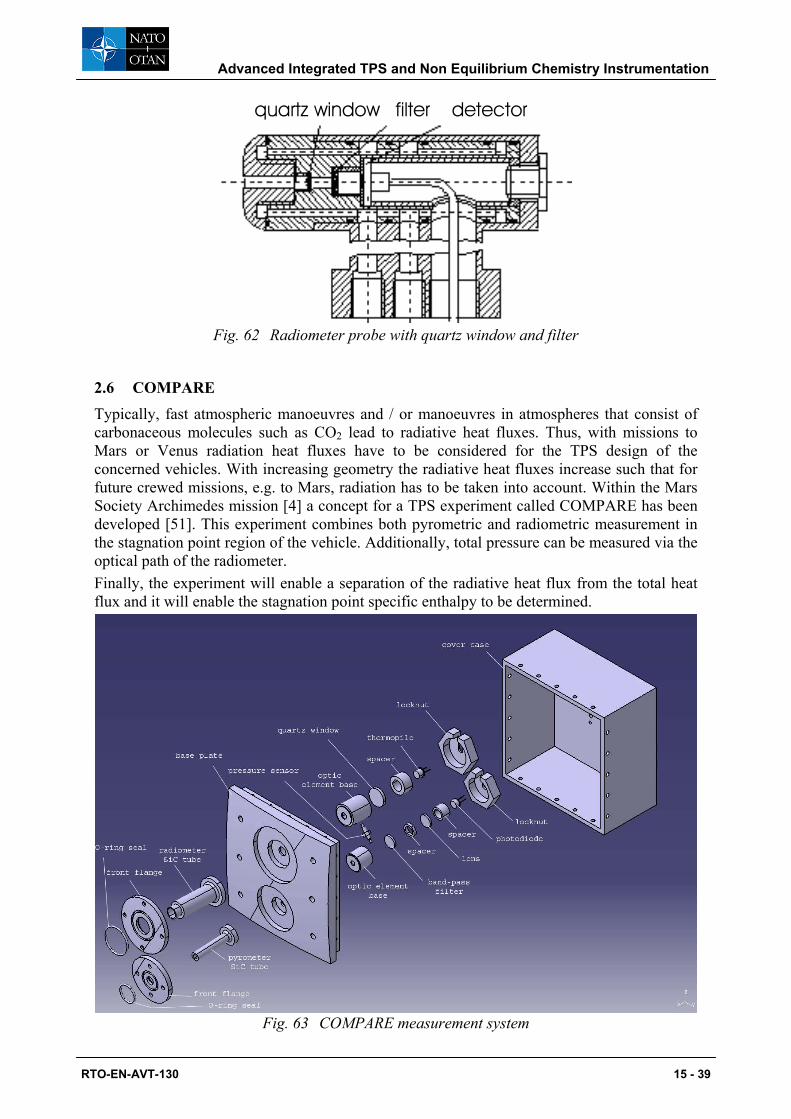
Fig. 62 Radiometer probe with quartz window and filter
2.6 COMPARE Typically, fast atmospheric manoeuvres and / or manoeuvres in atmospheres that consist of carbonaceous molecules such as CO2 lead to radiative heat fluxes. Thus, with missions to Mars or Venus radiation heat fluxes have to be considered for the TPS design of the concerned vehicles. With increasing geometry the radiative heat fluxes increase such that for future crewed missions, e.g. to Mars, radiation has to be taken into account. Within the Mars Society Archimedes mission [4] a concept for a TPS experiment called COMPARE has been developed [51]. This experiment combines both pyrometric and radiometric measurement in the stagnation point region of the vehicle. Additionally, total pressure can be measured via the optical path of the radiometer. Finally, the experiment will enable a separation of the radiative heat flux from the total heat flux and it will enable the stagnation point specific enthalpy to be determined.
Fig. 63 COMPARE measurement system
Advanced Integrated TPS and Non Equilibrium Chemistry Instrumentation
RTO-EN-AVT-130 15 - 39
In fact, one aspect of the design was the optimization with regard to the measurement system volume and power consumption. Here, the short entry period allows the Peltier cooling system to be disposed of such that power consumption goes below 5 W. In addition, the simulation of the calibration curves [20] enabled a reduction of the required measurement ranges of the pyrometric sensor (PYREX). The result is a combined measurement system measuring TPS temperature, radiative heat flux and total pressure. The system will enable the heat flux, the separation of the convective and radiative heat flux to be determined and it will deliver the total pressure during entry. This might lead to the determination of the plasma composition (depends on measured wavelength range of the radiometer). 2.6.1 Reference mission
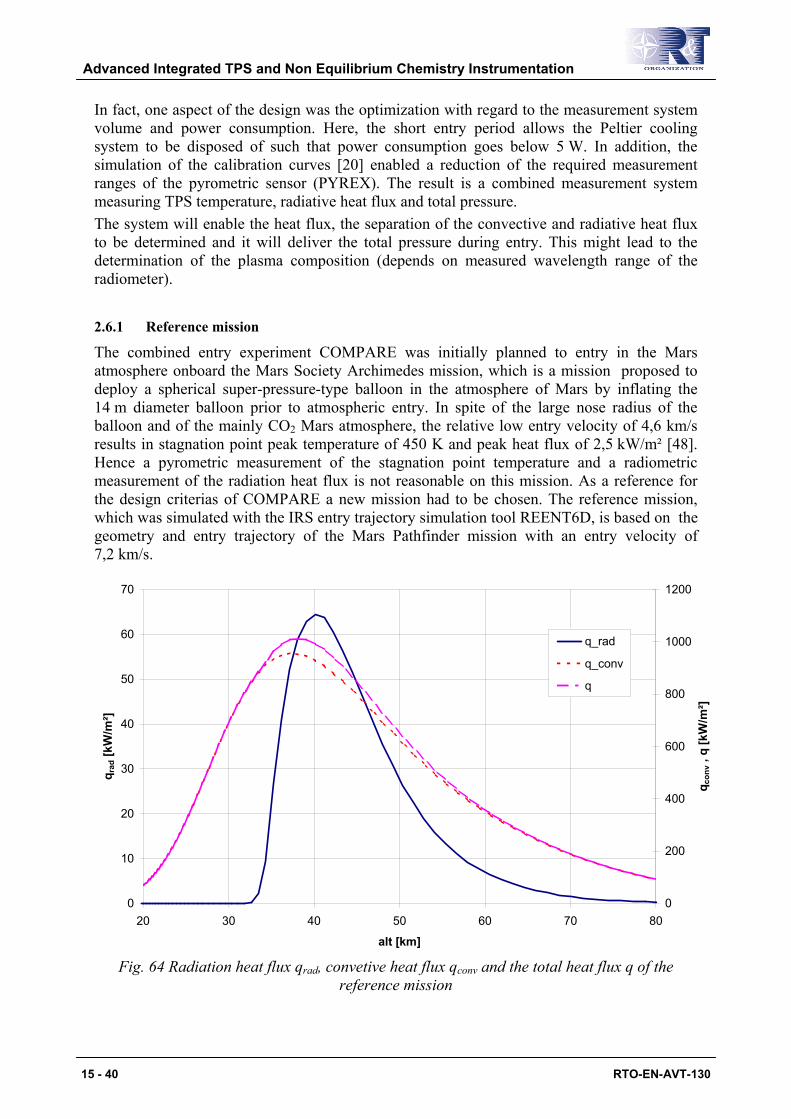
The combined entry experiment COMPARE was initially planned to entry in the Mars atmosphere onboard the Mars Society Archimedes mission, which is a mission proposed to deploy a spherical super-pressure-type balloon in the atmosphere of Mars by inflating the 14 m diameter balloon prior to atmospheric entry. In spite of the large nose radius of the balloon and of the mainly CO2 Mars atmosphere, the relative low entry velocity of 4,6 km/s results in stagnation point peak temperature of 450 K and peak heat flux of 2,5 kW/m² [48]. Hence a pyrometric measurement of the stagnation point temperature and a radiometric measurement of the radiation heat flux is not reasonable on this mission. As a reference for the design criterias of COMPARE a new mission had to be chosen. The reference mission, which was simulated with the IRS entry trajectory simulation tool REENT6D, is based on the geometry and entry trajectory of the Mars Pathfinder mission with an entry velocity of 7,2 km/s.
0
10
20
30
40
50
60
70
20 30 40 50 60 70 80
alt [km]
q rad
[kW
/m²]
0
200
400
600
800
1000
1200
q con
v , q
[kW
/m²]
q_rad
q_conv
q
Fig. 64 Radiation heat flux qrad, convetive heat flux qconv and the total heat flux q of the reference mission
Advanced Integrated TPS and Non Equilibrium Chemistry Instrumentation
15 - 40 RTO-EN-AVT-130
The soubroutine used to calculate the stagnation point radiation heat flux consists of the Tauber-Sutton correlation formula [49] at velocities higher than 6 km/s, while a modified Detra-Hidalgo correlation formula [50] is used to calculate the radiation heat flux at lower velocities. Modifications of the Detra-Hidalgo formula correlation factors are done on basis of measured radiation heat flux during Mars Pathfinder mission. 2.6.2 Pyrometric measurement of TPS temperature
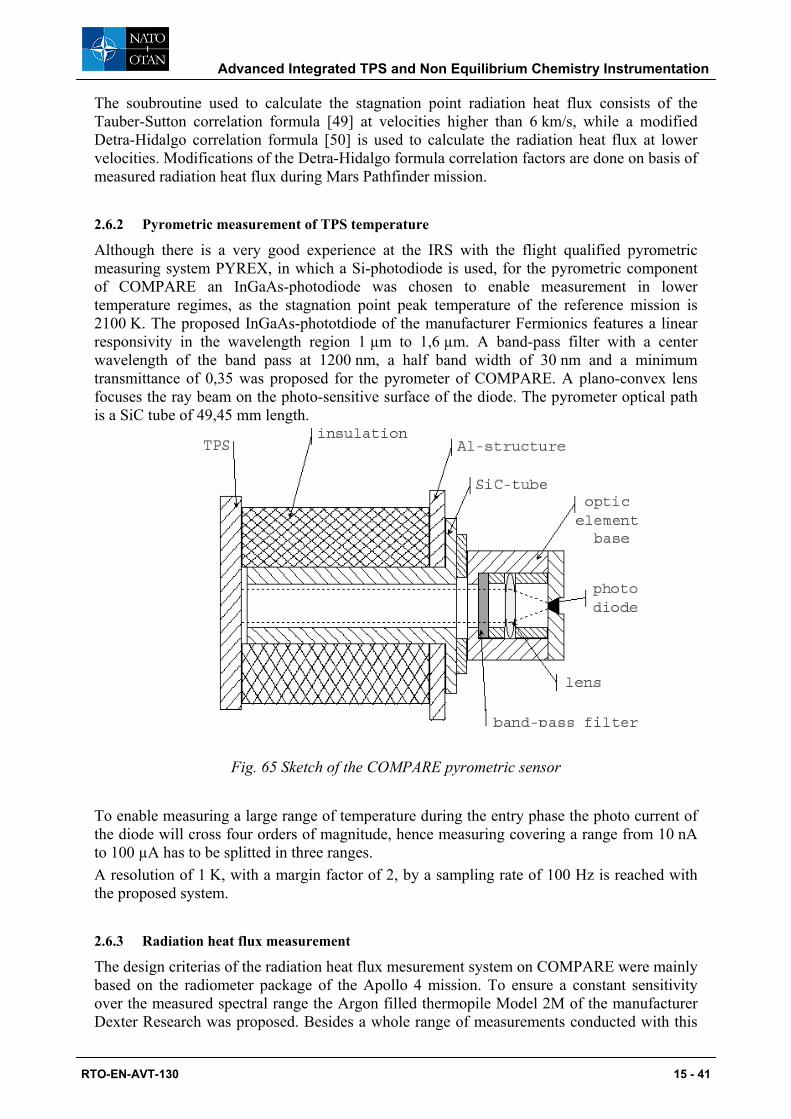
Although there is a very good experience at the IRS with the flight qualified pyrometric measuring system PYREX, in which a Si-photodiode is used, for the pyrometric component of COMPARE an InGaAs-photodiode was chosen to enable measurement in lower temperature regimes, as the stagnation point peak temperature of the reference mission is 2100 K. The proposed InGaAs-phototdiode of the manufacturer Fermionics features a linear responsivity in the wavelength region 1 µm to 1,6 µm. A band-pass filter with a center wavelength of the band pass at 1200 nm, a half band width of 30 nm and a minimum transmittance of 0,35 was proposed for the pyrometer of COMPARE. A plano-convex lens focuses the ray beam on the photo-sensitive surface of the diode. The pyrometer optical path is a SiC tube of 49,45 mm length.
Fig. 65 Sketch of the COMPARE pyrometric sensor
To enable measuring a large range of temperature during the entry phase the photo current of the diode will cross four orders of magnitude, hence measuring covering a range from 10 nA to 100 µA has to be splitted in three ranges. A resolution of 1 K, with a margin factor of 2, by a sampling rate of 100 Hz is reached with the proposed system. 2.6.3 Radiation heat flux measurement
The design criterias of the radiation heat flux mesurement system on COMPARE were mainly based on the radiometer package of the Apollo 4 mission. To ensure a constant sensitivity over the measured spectral range the Argon filled thermopile Model 2M of the manufacturer Dexter Research was proposed. Besides a whole range of measurements conducted with this
Advanced Integrated TPS and Non Equilibrium Chemistry Instrumentation
RTO-EN-AVT-130 15 - 41
model at the IRS, this sensor is already qualified for space missions. Due to the strong radiation characteristica of CN and CO4+, which radiate at wavelengths between 300-400 nm respectively 120-250 nm, these two species were picked as a reference for the COMPARE radiometer design. Low radiating wavelength of CO4+ requires a wavelength shift in regimes which the thermopile can detect. The shift from 120-250 nm to 350-550 nm is reached by a thin sodium salicylate coating on the quarz window which lies in front of the detector. The COMPARE radiometer is proposed to be mounted inside a deep cavity with a SiC casing, having a view angle of 9° and a 92,5 mm distance from the opening on the TPS to the active area of the detector. During the Apollo 4 mission no species due to the ablation of the TPS were detected in the cavity [52]. The thermopile time constant of 85 ms limits the sampling rate to 10 Hz allowing a resolution of 3,5 kW/m². 2.6.4 Pressure measurement
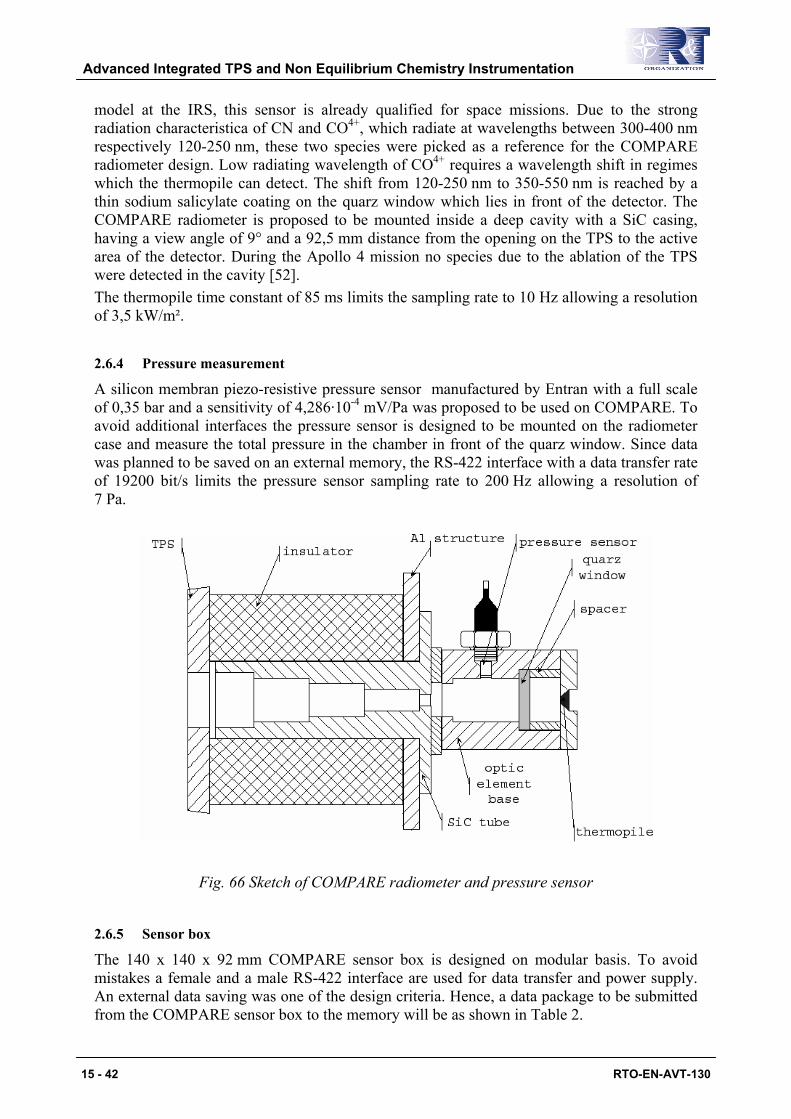
A silicon membran piezo-resistive pressure sensor manufactured by Entran with a full scale of 0,35 bar and a sensitivity of 4,286·10-4 mV/Pa was proposed to be used on COMPARE. To avoid additional interfaces the pressure sensor is designed to be mounted on the radiometer case and measure the total pressure in the chamber in front of the quarz window. Since data was planned to be saved on an external memory, the RS-422 interface with a data transfer rate of 19200 bit/s limits the pressure sensor sampling rate to 200 Hz allowing a resolution of 7 Pa.
Fig. 66 Sketch of COMPARE radiometer and pressure sensor
2.6.5 Sensor box
The 140 x 140 x 92 mm COMPARE sensor box is designed on modular basis. To avoid mistakes a female and a male RS-422 interface are used for data transfer and power supply. An external data saving was one of the design criteria. Hence, a data package to be submitted from the COMPARE sensor box to the memory will be as shown in Table 2.
Advanced Integrated TPS and Non Equilibrium Chemistry Instrumentation
15 - 42 RTO-EN-AVT-130
1 start byte
1 temperature range
2 temperature value
2 radiation heat flux value
2 pressure value
2 internal time
1 stop byte
11 bytes total
Table 2. COMPARE data package
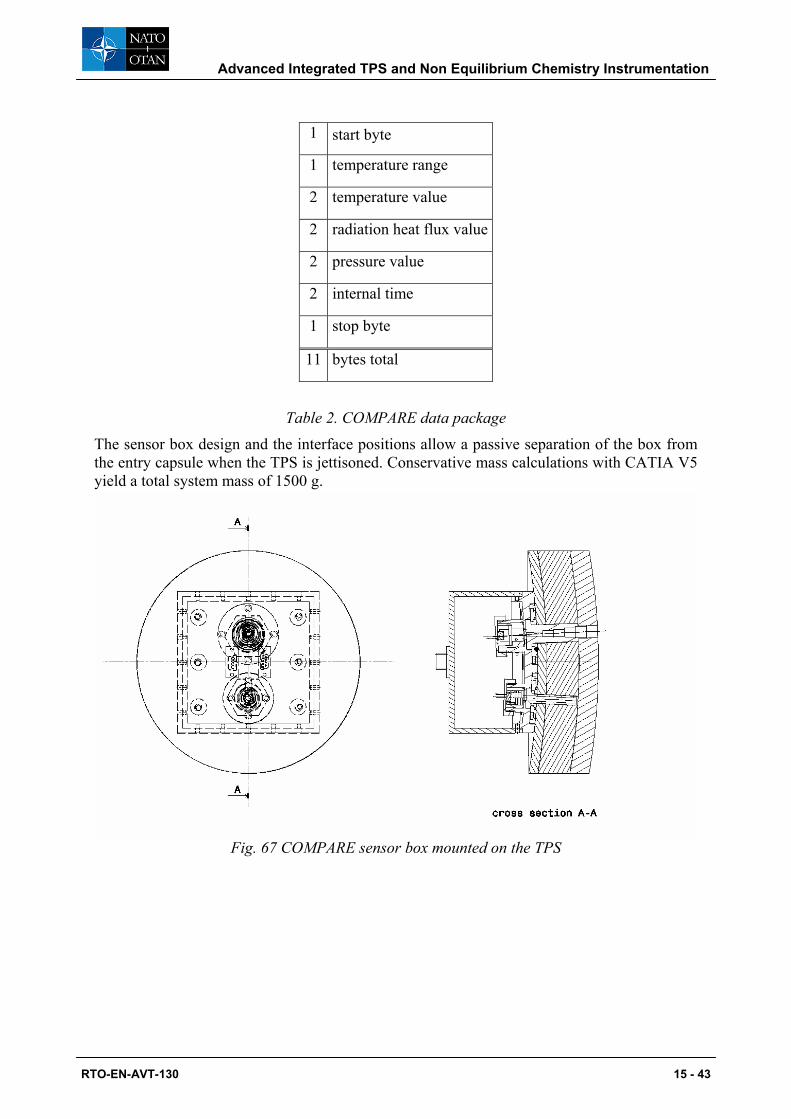
The sensor box design and the interface positions allow a passive separation of the box from the entry capsule when the TPS is jettisoned. Conservative mass calculations with CATIA V5 yield a total system mass of 1500 g.
Fig. 67 COMPARE sensor box mounted on the TPS
Advanced Integrated TPS and Non Equilibrium Chemistry Instrumentation
RTO-EN-AVT-130 15 - 43
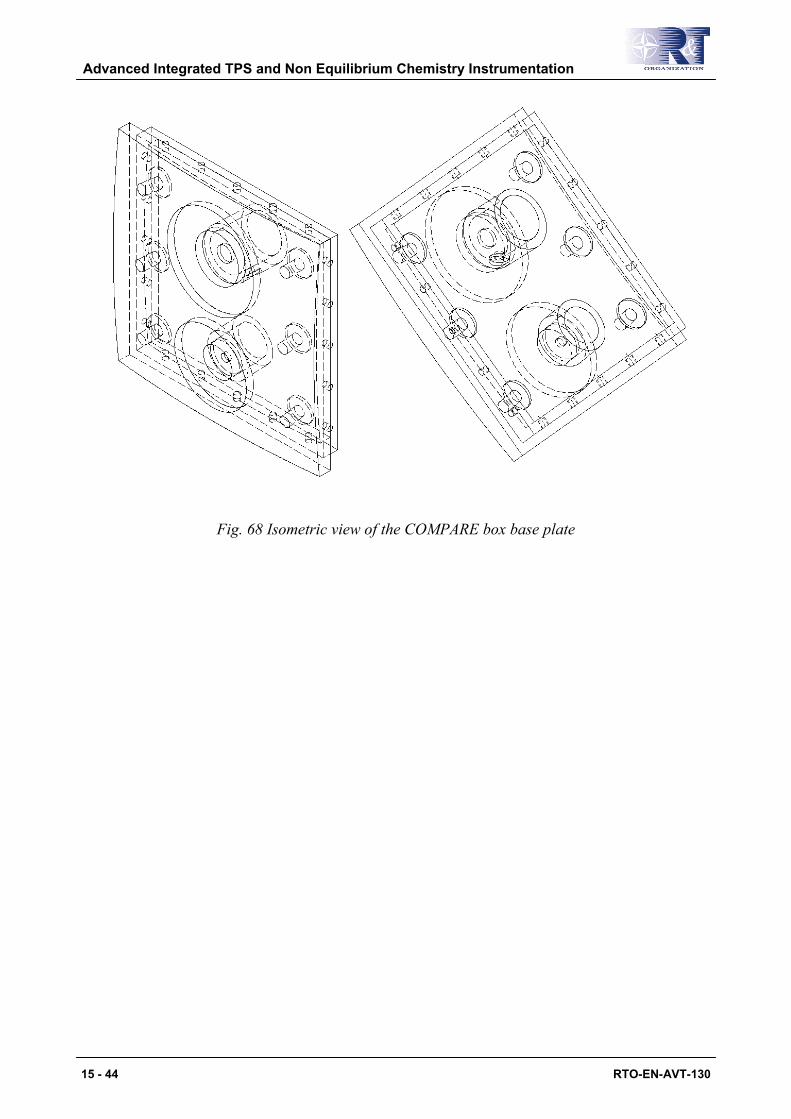
Fig. 68 Isometric view of the COMPARE box base plate
Advanced Integrated TPS and Non Equilibrium Chemistry Instrumentation
15 - 44 RTO-EN-AVT-130
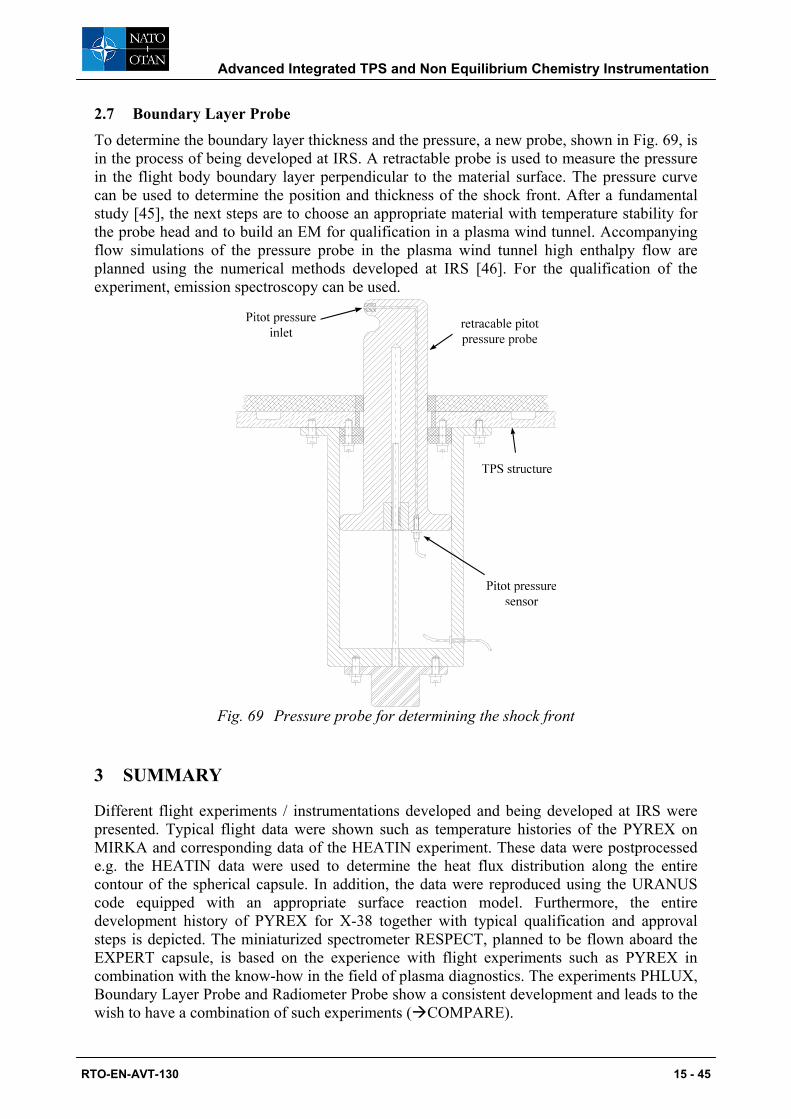
2.7 Boundary Layer Probe To determine the boundary layer thickness and the pressure, a new probe, shown in Fig. 69, is in the process of being developed at IRS. A retractable probe is used to measure the pressure in the flight body boundary layer perpendicular to the material surface. The pressure curve can be used to determine the position and thickness of the shock front. After a fundamental study [45], the next steps are to choose an appropriate material with temperature stability for the probe head and to build an EM for qualification in a plasma wind tunnel. Accompanying flow simulations of the pressure probe in the plasma wind tunnel high enthalpy flow are planned using the numerical methods developed at IRS [46]. For the qualification of the experiment, emission spectroscopy can be used.
Fig. 69 Pressure probe for determining the shock front
3 SUMMARY
Different flight experiments / instrumentations developed and being developed at IRS were presented. Typical flight data were shown such as temperature histories of the PYREX on MIRKA and corresponding data of the HEATIN experiment. These data were postprocessed e.g. the HEATIN data were used to determine the heat flux distribution along the entire contour of the spherical capsule. In addition, the data were reproduced using the URANUS code equipped with an appropriate surface reaction model. Furthermore, the entire development history of PYREX for X-38 together with typical qualification and approval steps is depicted. The miniaturized spectrometer RESPECT, planned to be flown aboard the EXPERT capsule, is based on the experience with flight experiments such as PYREX in combination with the know-how in the field of plasma diagnostics. The experiments PHLUX, Boundary Layer Probe and Radiometer Probe show a consistent development and leads to the wish to have a combination of such experiments ( COMPARE).
Advanced Integrated TPS and Non Equilibrium Chemistry Instrumentation
RTO-EN-AVT-130 15 - 45
Although plasma wind tunnels and computer simulation programs can not fully replace actual flights, the paper shows that they are required as support for the experiments. Here, the spectrometer RESPECT would provide an important contribution for the better understanding of the plasma-wall situation and is, therefore, an important contribution within the proposed experiments. So far, for RESPECT and the Radiometer Probe the next step has to be an engineering model, COMPARE, however, still needs to be functionally qualified and applied in the IRS plasma wind tunnels.
4 ACKNOWLEDGEMENTS
The authors wish to thank the German Space Agency (formerly DARA) for the support within the MIRKA project (PYREX-M, HEATIN) and for nurturing the development of the PYREX-KAT38 engineering model. Many thanks to the European Space Agency ESA for the support of the flight model development of PYREX-KAT38. In this context many thanks to the enterprises MAN ST, Augsburg, Astrium, ORSYS, OHB Systems, Kayser-Threde, all of them in Germany, and the United States space agency NASA (Johnson Space Centerre, Houston). The conceptual study for PYREX on HOPE-X was supported by Kawasaki Heavy Industries, Japan, and Mitsubishi Heavy Industries, Japan/Europe, with the promotion of the japanese Japanese spapce agency NASDA. Many thanks to Dipl-Ing. Gerd Jahn for his development activities and the post-flight analysis for HEATIN. In this context we want to thank the Special Research Centerre 259 “High Temperature Problems of Reuseable Space Vehicles” which enabled decisive parts of the work in the field of plasma diagnostics and the development of the URANUS code. We kindly thank Dipl.-Ing. Sergej Pidan and Dipl-Ing Markus Schüssler for their work on PHLUX, Dipl.-Ing. S. Lein for his work on RESPECT and Dipl.-Ing. A. Preci for his contributions in the field of numerical analysis. Thanks to Dr.-Ing. Wolfgang Röck who developed the Radiometer Probe within his Ph.D. thesis. Also thanks to Professor Chul Park for the time and effort invested for RESPECT, the Boundary Layer Probe and for the discussions concerning COMPARE. This work was supported by a grant from the Ministery of Science, Research and the Arts of Baden-Württemberg (AZ: 23-729.86-1/1) to Dipl.-Ing. M. Schüssler, Dipl.-Ing. S. Lein and Dipl.-Ing. A. Preci.
Advanced Integrated TPS and Non Equilibrium Chemistry Instrumentation
15 - 46 RTO-EN-AVT-130
References [1] M. Auweter-Kurtz, H.L. Kurtz, S. Laure: Plasma Generators for Re-Entry Simulation,
Journal of Propulsion and Power, Vol. 12, No. 6, p. 1053-1061, 1996. [2] M. Auweter-Kurtz, G. Bauer, K. Behringer, P. Dabalà, H. Habiger, K. Hirsch, H.
Jentschke, H. Kurtz, S. Laure, T. Stöckle, G. Volk: Plasmadiagnostics within the Plasma Wind Tunnel PWK, Zeitschrift für Flugwissenschaften und Weltraumforschung, Vol. 19, No. 3, p. 166-179, Springer Verlag, June 1995.
[3] M. Auweter-Kurtz, M. Feigl, M. Winter: Diagnostic Tools for Plasma Wind Tunnels and Re-entry Vehicles at the IRS, Paper presented on the RTO AVT Course on ”Measurement Techniques for High Enthalpy and Plasma Flows“, Rhode-Saint-Genèse, Belgium, published in RTO EN-8, October 1999.
[4] K. Pauly, M. Bosch, H. Schlingloff, H. Ruppe, M. Landgraf, R. Schleucher, F. Kalkum, H. Griebel, S. Knuth, M. Hettmer, W. Porges, H. Wierzschowski, C. Nussbaum: Die Mars Society Ballon Mission, Bericht zur Vorlage beim DLR, 2001.
[5] L. Maraffa, A. Smith, A. Santovincenzo, R. Rouméas, J.-P. Huot, G. Scoon, Aerothermodynamics Aspects of Venus Sample Return Mission, 3rd European Symposium on Aerothermodynamics for Space Vehicles, ESTEC, Noordwijk, The Netherlands, ESA-SP 426, November 1998.
[6] V. Rubio Garcia, L. Maraffa, G. Scoon, R. Rouméas, R. Seiler, Mars Mini-Probes. Elements of Aerothermodynamics and Entry Trajectories, 3rd European Symposium on Aerothermodynamics for Space Vehicles, ESTEC, Noordwijk, The Netherlands, ESA-SP 426, Nov. 1998.
[7] W. O’Neil, Ch. Cazeau: The Mars Sample Return Mission, IAF-99-Q.3.02, 50th Int. Astronautical Congress, Amsterdam, The Netherlands, Oct 1999.
[8] G. Herdrich, M. Auweter-Kurtz, H. Kurtz, T. Laux, M. Winter: Operational Behavior of the Inductively Heated Plasma Source IPG3 for Re-entry Simulations, AIAA-99-3497, 33rd Thermophysics Conference, Norfolk, VA, USA, June 1999.
[9] G. Herdrich, M. Auweter-Kurtz, H. Kurtz, T. Laux, E. Schreiber: Investigation of the Inductively Heated Plasmagenerator IPG3 using Injection Rings of different Geometries, 21st AIAA Advanced Measurement technology and Ground Testing Conference, Denver, CO, Paper AIAA-2000-2445, USA, June 2000.
[10] M. Auweter-Kurtz, H. Hald, G. Koppenwallner, H.-D. Speckmann: German Experiments Developed for Re-entry Missions, Acta Astronautica, Vol. 38, No. 1, p. 47-61, 1996.
[11] G. Herdrich, M. Auweter-Kurtz, H. Habiger: Pyrometric Temperature Measurements on Thermal Protection Systems, GAMM Conference 1998, Bremen, April 1998, edit. Zeitschrift f. angewandte Mathematik u. Mechanik (ZAMM) 79, Suppl. 3, pages S945-S946, 1999.
[12] S. Fasoulas: Experimentelle und theoretische Charakterisierung einer hochenthalpen Stickstoffströmung zur Wiedereintrittssimulation, Ph.D. thesis, Space Systems Institute, Stuttgart, Germany, 1995.
[13] C. Schrempp: Qualifikation von Festkörperelektrolytsonden zur Bestimmung des Sauerstoffpartialdrucks im Weltraum, PhD Thesis, Space Systems Institute, Stuttgart, Germany, 2000.
[14] M.W. Winter, S. Kanne , J. Lonschinski , M. Auweter-Kurtz, H.-H. Frühauf: Proposal for a Reentry Experiment Using a Newly Developed Spectrometer, 3rd European Symposium on Aerothermodynamics for Space Vehicles, ESTEC, Noordwijk, The Netherlands, November 1998.
Advanced Integrated TPS and Non Equilibrium Chemistry Instrumentation
RTO-EN-AVT-130 15 - 47

[15] G. Herdrich, M. Auweter-Kurtz, H. Habiger, M. Hartling: Multi-Channel Temperature Measurements on Ceramic Heat Shields, IAF-97-I.5.06, 48th Int. Astronautical Congress, Turin, Italy, October 1997.
[16] M. Fertig, H.-H. Frühauf: Reliable Prediction of Aerothermal Loads at TPS-Surfaces of Reuseable Space Vehicles, 12th European Aerospace Conference, Paris, France, Nov. 1999.
[17] D. Olynick, T. Tam: Trajectory based Validation of the Shuttle Heating Environment, Paper AIAA-1996-1891, 31st AIAA Thermophysics Conference, June 17-20, 1996, New Orleans, LA, 1996.
[18] T. Horvath, S. Berry, N. Merski, S. Fitzgerald: X-38 Experimental Aerothermodynamics, AIAA-2000-2685, 34th AIAA Thermophysics Conference, Denver, CO, June 2000.
[19] G. Herdrich, M. Auweter-Kurtz , M. Hartling, T. Laux: PYREX-KAT38: Temperature Measurement System for the X-38 Nose Structure TPS, 2nd Int. Symposium Atmospheric Reentry Vehicles and Systems, Arcachon, France, March 2001.
[20] G. Herdrich: Datenbankbasierte Berechnung der PYREX - Übertragungsfunktion, (in German) Internal Report IRS-98-IB9, Space Systems Institute, Stuttgart University, 1998.
[21] H. Früholz, M. Auweter-Kurtz, H. Habiger, M. Hartling, W. Röck: Nonintrusive Temperature Measurements at Ceramic Heatshields of Space Vehicles, AIAA 95-2037, 30th Thermophysics Conference, San Diego, CA, USA, June 1995.
[22] M. Auweter-Kurtz, M. Feigl, M. Winter: Overview of IRS Plasma Wind Tunnel Facilities, Paper presented on the RTO AVT Course on ”Measurement Techniques for High Enthalpy and Plasma Flows”, Rhode-Saint-Genèse, Belgium, published in RTO EN-8, October 1999.
[23] H. Habiger, M. Auweter-Kurtz, H. Früholz, G. Herdrich: PYREX - Pyrometric Temperature Measurement on the Ceramic TPS of the Re-Entry Capsule MIRKA, 3rd European Workshop on Thermal Protection Systems, ESTEC, Noordwijk, The Netherlands, March 1998.
[24] M. Auweter-Kurtz, G. Herdrich, H. Kurtz, T. Laux, E. Schreiber, Th. Wegmann: Ground test facilities for TPS qualification at Space Systems Institute, 12th European Aerospace Conference: 3rd European Conference on Space Transportation Systems, AAAF, Paris, France, 1999.
[25] G. Hilfer: Thermomechanical Ground Testing for X-38 Flight Qualification, 2nd Int. Symposium: Atmospheric Reentry Vehicles and Systems, Arcachon, France, March 2001.
[26] G. F. Karabadzhak et al.: Preliminary Analysis of Exhaust Plume Radiation during Soyuz-TM Retrofirings, AIAA 2000-2373, AIAA Thermophysics Conference, USA, 2000.
[27] Frühauf, H.-H., Fertig, M., Olawsky, F., Infed, F., Bönisch, T.: Upwind Relaxation Algorithm for Re-entry Nonequilibrium Flows, High Performance Computing in Science and Engineering 2000, Springer, Berlin, pp. 440-445, 2001.
[28] M. W. Winter, B. Pfeiffer, M. Fertig , M. Auweter-Kurtz, A. J. Smith: Recent Status of the Plasma Radiation Database PARADE, AIAA Thermophysics Conference, USA, Portland, Oregon, 2004.
[29] BIRD, G.A.: Molecular Gas Dynamics and the Direct Simulation of Gas Flows, Oxford,University Press, 1994.
[30] G. Herdrich, M. Auweter-Kurtz, H. Habiger: Pyrometric Temperature Measurements on Thermal Protection Systems, GAMM 98 (Gesellschaft für angewandte Mathematik und Mechanik) GAMM Tagung 1998 (Gesellschaft für angewandte Mathematik u.
Advanced Integrated TPS and Non Equilibrium Chemistry Instrumentation
15 - 48 RTO-EN-AVT-130
Mechanik), Bremen, April 1998, edit. Zeitschrift f. angewandte Mathematik u. Mechanik (ZAMM) 79, Suppl. 3, pages S945-S946, 1999.
[31] G. Herdrich, M. Auweter-Kurtz, M. Hartling, T. Laux: PYREX-KAT38, Temperature Measurement System for the X-38 Nose Structure TPS, 2nd Int. Symposium Atmospheric Re-entry Vehicles and Systems, Arcachon, France, March 2001.
[32] G. Herdrich, M. Auweter-Kurtz, H. Habiger, M. Hartling: Multi-Channel Temperature Measurements on Ceramic Heat Shields, IAF-97-I.5.06, 48th International Astronautical Congress, Turin, Italy, October, 1997.
[33] M. Dias Figueiredo: Auslegung eines variablen Systems für den Einbau von Sensoren in Thermalschutzsysteme, Studienarbeit IRS 04-S-24, Stuttgart, Okto-ber 2004.
[34] Schlutz, J.: Auslegung eines Miniaturspektrometers zum Einsatz auf einer Wiedereintrittsmission, Studienarbeit IRS-04 S 25, Institut für Raumfahrtsysteme, Stuttgart, 2004.
[35] P. Endlich, M. Auweter-Kurtz, G. Herdrich, S. Löhle, M. Winter: The Inductively Heated Plasma Wind Tunnel PWK3 as a Means for Emission Experiments to rebuild Radiation Test Cases, Proceedings of the International Workshop on Radiation of High Temperature Gases in Atmospheric Entry, Lisbon, Portugal, 8-10 October 2003.
[36] E.R. Bregman: Flugoptimierung von aerodynamisch gestützten Orbittransferfahrzeugen unter besonderer Berücksichtigung der aerothermodynamischen Lasten, Ph.D. Thesis, Space Systems Institute, Stuttgart University, Germany, 1994.
[37] G. Jahn, U. Schöttle: Heat Flux and Temperature Response Investigations of the MIRKA Reentry Capsule Heat Shield, Paper IAF-97-I.5.04, 48th Int. Astronautical Congress, Turin, Italy, Oct. 1997.
[38] D. Steward: Determination of Surface Catalytic Efficiency for Thermal Protection Materials, AIAA-Paper 96-1863, 31st Thermophysics Conference, New Orleans, LA, USA, 1996.
[39] M. Fertig, H.-H. Frühauf: Detailed Computation of the Aerothermodynamic Loads of the MIRKA Capsule, 3rd European Symposium on Aerothermodynamics for Space Vehicles, ESTEC, Noordwijk, The Netherlands, Nov. 1998.
[40] Herdrich, Georg ; Auweter-Kurtz, Monika; Fertig, Markus ; Löhle, Stefan ; Pidan, Sergej ; Winter, Michael: Present Design of the Flight Instrumentations PYREX, PHLUX and RESPECT for the Capsule EXPERT. In: 5th European Symposium on Aerothermodynamics for Space Vehicles. Cologne, Germany, 2004.
[41] Herdrich, Georg: Aufbau, Qualifikation und Charakterisierung einer induktiven Plasmawindkanalanlage zur Simulation atmosphärischer Eintrittsmanöver. Institut für Raumfahrtsysteme, Universität Stuttgart, Dissertation, 2004
[42] Schüßler Markus, Numerische und experimentelle Untersuchung des katalytischen Sensors PHLUX für die europäische Wiedereintrittskapsel EXPERT, Institut für Raumfahrtsysteme, Universität Stuttgart, IRS-05-S01, Diplomarbeit, 2005.
[43] W. Röck: Simulation des Eintritts einer Sonde in die Atmosphäre des Saturnmondes Titan in einem Plasmawindkanal, Ph.D. Thesis, Space Systems Institute, Stuttgart University, Germany, 1998.
[44] M. Auweter-Kurtz, M. Feigl, M. Winter: Overview of IRS Plasma Wind Tunnel Facilities, Paper presented on the RTO AVT Course on ”Measurement Techniques for High Enthalpy and Plasma Flows”, Rhode-Saint-Genèse, Belgium, published in RTO EN-8, October 1999.
[45] J. Alting: Entwurf eines Flugexperimentes zur Bestimmung der Stoßfrontposition beim Wiedereintritt (in German), IRS-97-S23, Space Systems Institute, Stuttgart University, Germany, 1997.
[46] P.C. Sleziona, M. Auweter-Kurtz, C. Boie, J. Heiermann, S. Lenzner: Numerical Code for Magneto -Plasma Flows, in: Hyperbolic Problems: Theory, Numerics, Applications,
Advanced Integrated TPS and Non Equilibrium Chemistry Instrumentation
RTO-EN-AVT-130 15 - 49
7th Int. Conference in Zürich, February 1998, Vol. II, Eds. M. Fey, R. Jeltsch, Intern. Series of Numerical Mathematics, Vol. 130, 1999, Birkhäuser Verlag, Basel, pp. 905-914.
[47] J.-M. Muylaert, G. Turmino, M. Caporicci: Preparing for Re-entry with EXPERT: the ESA in flight ATD Research Program, Paper IAC-03-V.5.09, 54th International Astronautical Congress, Bremen, Germany, Sept. 2003.
[48] B. Häusler, H. Rapp, C. Mundt: Project Archimedes: A novel approach to balloon deployment on Mars, IAC-04-Q.P.02, Nov. 2004
[49] M.E. Tauber, Sutton K.: Stagnation Point Radiative Heating Relations for Earth and Mars Entries, Journal of Spacecraft and Rockets, vol. 28, no. 1, pp. 40-42, Jan.-Feb. 1991
[50] R. W. Detra, H. Hidalgo: Generalized Heat Transfer Formulas and Graphs for Nose Cone Re-entry Into the Atmosphere, ARS Journal, vol. 31, pp. 318-321, March 1961
[51] A. Preci: Auslegung des atmosphärischen Eintrittsexperimentes COMPARE für eine Marseintrittsmission, Institut für Raumfahrtsysteme, Universität Stuttgart, Diplomarbeit, 2005
[52] C. Park: Stagnation-Point Radiation for Apollo 4 – A Review and Current Status, 35th AIAA Thermophysics Conference, Anaheim - CA, 11-14 June 2001
Advanced Integrated TPS and Non Equilibrium Chemistry Instrumentation
15 - 50 RTO-EN-AVT-130