Embed Size (px)
Citation preview
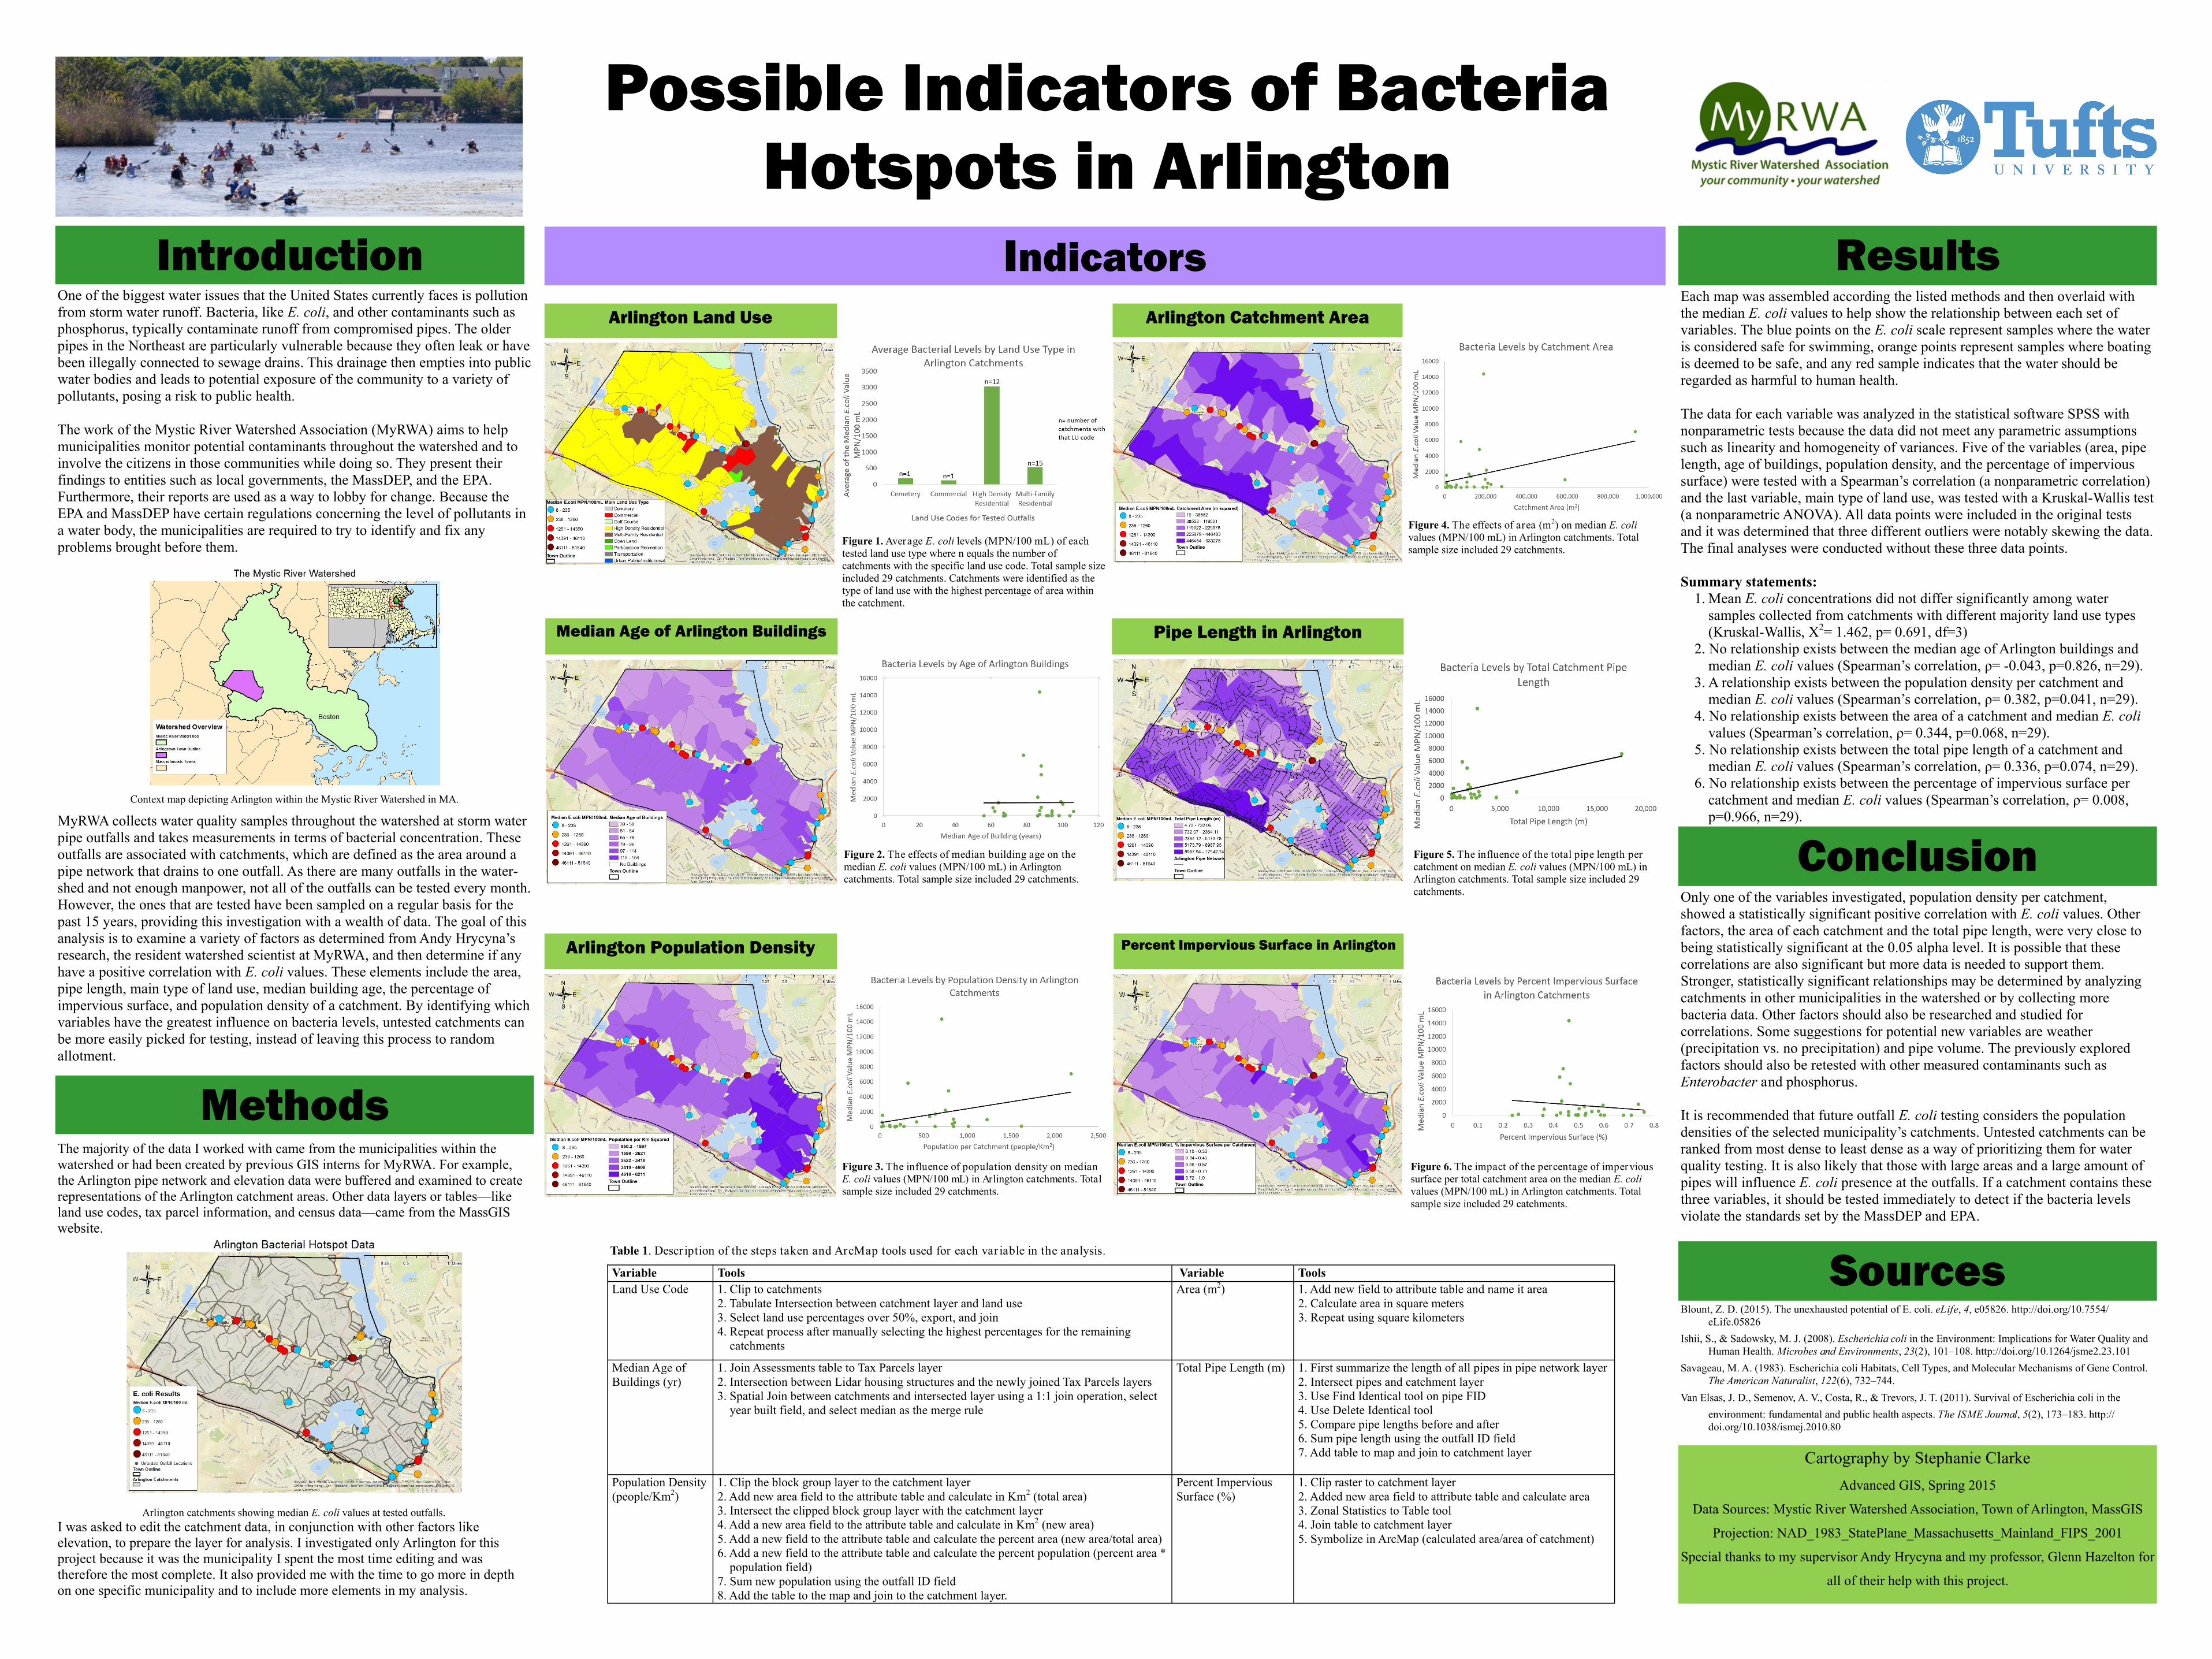
Possible Indicators of Bacteria Hotspots in Arlington
Introduction
Methods
Indicators
Pipe Length in Arlington
Arlington Catchment Area
Median Age of Arlington Buildings
Arlington Land Use
Percent Impervious Surface in Arlington Arlington Population Density
Cartography by Stephanie Clarke Advanced GIS, Spring 2015
Data Sources: Mystic River Watershed Association, Town of Arlington, MassGIS
Projection: NAD_1983_StatePlane_Massachusetts_Mainland_FIPS_2001
Special thanks to my supervisor Andy Hrycyna and my professor, Glenn Hazelton for
all of their help with this project.
Figure 1. Average E. coli levels (MPN/100 mL) of each tested land use type where n equals the number of catchments with the specific land use code. Total sample size included 29 catchments. Catchments were identified as the type of land use with the highest percentage of area within the catchment.
Figure 4. The effects of area (m2) on median E. coli values (MPN/100 mL) in Arlington catchments. Total sample size included 29 catchments.
Figure 2. The effects of median building age on the median E. coli values (MPN/100 mL) in Arlington catchments. Total sample size included 29 catchments.
Figure 5. The influence of the total pipe length per catchment on median E. coli values (MPN/100 mL) in Arlington catchments. Total sample size included 29 catchments.
Figure 3. The influence of population density on median E. coli values (MPN/100 mL) in Arlington catchments. Total sample size included 29 catchments.
Figure 6. The impact of the percentage of impervious surface per total catchment area on the median E. coli values (MPN/100 mL) in Arlington catchments. Total sample size included 29 catchments.
One of the biggest water issues that the United States currently faces is pollution from storm water runoff. Bacteria, like E. coli, and other contaminants such as phosphorus, typically contaminate runoff from compromised pipes. The older pipes in the Northeast are particularly vulnerable because they often leak or have been illegally connected to sewage drains. This drainage then empties into public water bodies and leads to potential exposure of the community to a variety of pollutants, posing a risk to public health. The work of the Mystic River Watershed Association (MyRWA) aims to help municipalities monitor potential contaminants throughout the watershed and to involve the citizens in those communities while doing so. They present their findings to entities such as local governments, the MassDEP, and the EPA. Furthermore, their reports are used as a way to lobby for change. Because the EPA and MassDEP have certain regulations concerning the level of pollutants in a water body, the municipalities are required to try to identify and fix any problems brought before them.
Context map depicting Arlington within the Mystic River Watershed in MA.
MyRWA collects water quality samples throughout the watershed at storm water pipe outfalls and takes measurements in terms of bacterial concentration. These outfalls are associated with catchments, which are defined as the area around a pipe network that drains to one outfall. As there are many outfalls in the watershed and not enough manpower, not all of the outfalls can be tested every month. However, the ones that are tested have been sampled on a regular basis for the past 15 years, providing this investigation with a wealth of data. The goal of this analysis is to examine a variety of factors as determined from Andy Hrycyna’s research, the resident watershed scientist at MyRWA, and then determine if any have a positive correlation with E. coli values. These elements include the area, pipe length, main type of land use, median building age, the percentage of impervious surface, and population density of a catchment. By identifying which variables have the greatest influence on bacteria levels, untested catchments can be more easily picked for testing, instead of leaving this process to random allotment.
Table 1. Descr iption of the steps taken and ArcMap tools used for each var iable in the analysis.
The majority of the data I worked with came from the municipalities within the watershed or had been created by previous GIS interns for MyRWA. For example, the Arlington pipe network and elevation data were buffered and examined to create representations of the Arlington catchment areas. Other data layers or tables—like land use codes, tax parcel information, and census data—came from the MassGIS website.
Arlington catchments showing median E. coli values at tested outfalls. I was asked to edit the catchment data, in conjunction with other factors like elevation, to prepare the layer for analysis. I investigated only Arlington for this project because it was the municipality I spent the most time editing and was therefore the most complete. It also provided me with the time to go more in depth on one specific municipality and to include more elements in my analysis.
Only one of the variables investigated, population density per catchment, showed a statistically significant positive correlation with E. coli values. Other factors, the area of each catchment and the total pipe length, were very close to being statistically significant at the 0.05 alpha level. It is possible that these correlations are also significant but more data is needed to support them. Stronger, statistically significant relationships may be determined by analyzing catchments in other municipalities in the watershed or by collecting more bacteria data. Other factors should also be researched and studied for correlations. Some suggestions for potential new variables are weather (precipitation vs. no precipitation) and pipe volume. The previously explored factors should also be retested with other measured contaminants such as Enterobacter and phosphorus. It is recommended that future outfall E. coli testing considers the population densities of the selected municipality’s catchments. Untested catchments can be ranked from most dense to least dense as a way of prioritizing them for water quality testing. It is also likely that those with large areas and a large amount of pipes will influence E. coli presence at the outfalls. If a catchment contains these three variables, it should be tested immediately to detect if the bacteria levels violate the standards set by the MassDEP and EPA.
Conclusion
Each map was assembled according the listed methods and then overlaid with the median E. coli values to help show the relationship between each set of variables. The blue points on the E. coli scale represent samples where the water is considered safe for swimming, orange points represent samples where boating is deemed to be safe, and any red sample indicates that the water should be regarded as harmful to human health. The data for each variable was analyzed in the statistical software SPSS with nonparametric tests because the data did not meet any parametric assumptions such as linearity and homogeneity of variances. Five of the variables (area, pipe length, age of buildings, population density, and the percentage of impervious surface) were tested with a Spearman’s correlation (a nonparametric correlation) and the last variable, main type of land use, was tested with a KruskalWallis test (a nonparametric ANOVA). All data points were included in the original tests and it was determined that three different outliers were notably skewing the data. The final analyses were conducted without these three data points. Summary statements: 1. Mean E. coli concentrations did not differ significantly among water samples collected from catchments with different majority land use types (KruskalWallis, Χ2= 1.462, p= 0.691, df=3)
2. No relationship exists between the median age of Arlington buildings and median E. coli values (Spearman’s correlation, ρ= 0.043, p=0.826, n=29). 3. A relationship exists between the population density per catchment and median E. coli values (Spearman’s correlation, ρ= 0.382, p=0.041, n=29). 4. No relationship exists between the area of a catchment and median E. coli values (Spearman’s correlation, ρ= 0.344, p=0.068, n=29). 5. No relationship exists between the total pipe length of a catchment and median E. coli values (Spearman’s correlation, ρ= 0.336, p=0.074, n=29). 6. No relationship exists between the percentage of impervious surface per catchment and median E. coli values (Spearman’s correlation, ρ= 0.008, p=0.966, n=29).
Results
Sources Variable Tools Variable Tools Land Use Code 1. Clip to catchments
2. Tabulate Intersection between catchment layer and land use 3. Select land use percentages over 50%, export, and join 4. Repeat process after manually selecting the highest percentages for the remaining catchments
Area (m2) 1. Add new field to attribute table and name it area 2. Calculate area in square meters 3. Repeat using square kilometers
Median Age of Buildings (yr)
1. Join Assessments table to Tax Parcels layer 2. Intersection between Lidar housing structures and the newly joined Tax Parcels layers 3. Spatial Join between catchments and intersected layer using a 1:1 join operation, select year built field, and select median as the merge rule
Total Pipe Length (m) 1. First summarize the length of all pipes in pipe network layer 2. Intersect pipes and catchment layer 3. Use Find Identical tool on pipe FID 4. Use Delete Identical tool 5. Compare pipe lengths before and after 6. Sum pipe length using the outfall ID field 7. Add table to map and join to catchment layer
Population Density (people/Km2)
1. Clip the block group layer to the catchment layer 2. Add new area field to the attribute table and calculate in Km2 (total area) 3. Intersect the clipped block group layer with the catchment layer 4. Add a new area field to the attribute table and calculate in Km2 (new area) 5. Add a new field to the attribute table and calculate the percent area (new area/total area) 6. Add a new field to the attribute table and calculate the percent population (percent area * population field) 7. Sum new population using the outfall ID field 8. Add the table to the map and join to the catchment layer.
Percent Impervious Surface (%)
1. Clip raster to catchment layer 2. Added new area field to attribute table and calculate area 3. Zonal Statistics to Table tool 4. Join table to catchment layer 5. Symbolize in ArcMap (calculated area/area of catchment)
Blount, Z. D. (2015). The unexhausted potential of E. coli. eLife, 4, e05826. http://doi.org/10.7554/ eLife.05826 Ishii, S., & Sadowsky, M. J. (2008). Escherichia coli in the Environment: Implications for Water Quality and Human Health. Microbes and Environments, 23(2), 101–108. http://doi.org/10.1264/jsme2.23.101 Savageau, M. A. (1983). Escherichia coli Habitats, Cell Types, and Molecular Mechanisms of Gene Control. The American Naturalist, 122(6), 732–744. Van Elsas, J. D., Semenov, A. V., Costa, R., & Trevors, J. T. (2011). Survival of Escherichia coli in the environment: fundamental and public health aspects. The ISME Journal, 5(2), 173–183. http:// doi.org/10.1038/ismej.2010.80