Embed Size (px)
Citation preview

ADVANCED DIAGNOSTIC SYSTEM FOR
UNDERGROUND COMMUNICATION NETWORKS
WITH VENTILATION ON DEMAND
By
Mohamed Daoud
Bachelor of Applied Science
Electronics and Electrical Communications Engineering
Cairo University, Cairo, Egypt, 2006
A thesis
presented to Ryerson University
in partial fulfillment of the
requirements for the degree of
Master of Applied Science
in the Program of
Electrical and Computer Engineering
Toronto, Onatrio, Canada, 2011
c© Mohamed Daoud, 2011

ii

AUTHOR DECLARATION
I hereby declare that I am the sole author of this thesis.
I authorize Ryerson University to lend this thesis to other institutions or individuals
for the purpose of scholarly research.
Signature
Mohamed Daoud
I further authorize Ryerson University to reproduce this thesis by photocopying or
by other means, in total or in part, at the request of other institutions or individuals
for the purpose of scholarly research.
Signature
Mohamed Daoud
iii

ACKNOWLEDGEMENTS
I feel deeply indebted to my supervisor, Professor Dr. Xavier Fernando, for his pa-
tience, guidance, constant supervision, creative advising and personal involvement
throughout the progression of this work. He has been, for me, not only a source of
inspiration and encouragement but also a model of ideal academic relations. Much
of what I have learned during the progress of this thesis I owe, in fact, to Professor
Fernando. Working under the supervision of a very great investigator of the highest
academic and human caliber like Professor Fernando has formed me and will continue
to be an unforgettable and a unique experience of my life.
I would like to express my great appreciation and gratitude to Mr. Wisam Farjow
for his guidance, advice and moral support. Wisam’s endless knowledge in mining
industry has helped make this work possible. For me he has been not only a mentor
but a caring brother as well.
My thanks go to all my Professors at Ryerson University who taught me during
my graduate study and to the Department of Electrical and Computer Engineering,
Ryerson University for offering all facilities, financial resources and the academic en-
vironment.
I would like to express my deepest appreciation to my parents and brothers for their
moral support, patience and unconditional love.
iv

DEDICATION
To Nancy for giving me the love and care
To Mahmoud for giving me the advice and support
v

ABSTRACT
ADVANCED DIAGNOSTIC SYSTEM FOR UNDERGROUND
COMMUNICATION NETWORKS WITH VENTILATION ON DEMAND
Mohamed Daoud, 2011
Masters of Applied Science (MASc)
Electrical and Computer Engineering Department
Ryerson University
In this thesis, a novel diagnostic system has been developed to increase the relia-
bility of leaky feeder communication systems in underground mines. The new system
is based on three main parts: 1) Diagnostic Receiver Unit (DRU) located in the con-
trol room above ground; 2) several Diagnostic Transponder Units (DTU) connected
to amplifiers, Power Supply Units (PSU), fans, and sensors; and 3) Communication
protocol that was designed for this specific system. The amplifiers, PSU, fans, and
sensors in the system cascade will be able to communicate freely with the control
room through the leaky cable to send information about their current conditions,
and receive configuration messages. A new concept is also presented that provides
energy saving in mines; Ventilation-on-Demand where the fans will operate according
to the current situation of each section in the mine. This is made possible through a
series of interrupt messages that is sent from the DTU attached to the fan/sensor to
the DRU in the control room.
vi

Table of Contents
Table of Contents vii
List of Tables ix
List of Figures x
Acronyms xii
1 The Underground Communication Network 1
1.1 Intoduction . . . . . . . . . . . . . . . . . . . . . . . . . . . . . . . . 1
1.2 Current System Challenges . . . . . . . . . . . . . . . . . . . . . . . . 3
1.3 Contribution of the Thesis . . . . . . . . . . . . . . . . . . . . . . . . 5
1.4 Outline of the Thesis . . . . . . . . . . . . . . . . . . . . . . . . . . . 9
2 Leaky Feeder Systems 11
2.1 Introduction to Leaky Feeders . . . . . . . . . . . . . . . . . . . . . . 11
2.2 Current Leaky Feeder System . . . . . . . . . . . . . . . . . . . . . . 15
2.3 Reliability Problem and Other Challenges . . . . . . . . . . . . . . . 18
2.4 Available Solutions for Current Leaky Feeder Networks . . . . . . . . 21
3 Diagnostic System Solution 25
3.1 Introduction to Diagnostic System . . . . . . . . . . . . . . . . . . . . 25
3.2 Hardware Architecture . . . . . . . . . . . . . . . . . . . . . . . . . . 27
3.2.1 Diagnostic Receiver Unit (DRU) . . . . . . . . . . . . . . . . . 27
3.2.2 Diagnostic Transponder Unit (DTU) . . . . . . . . . . . . . . 30
3.2.3 Diagnostic Software Package (DSP) . . . . . . . . . . . . . . . 32
3.3 Communication Protocol . . . . . . . . . . . . . . . . . . . . . . . . . 34
3.3.1 Self Configuration . . . . . . . . . . . . . . . . . . . . . . . . . 37
3.3.2 Normal Mode . . . . . . . . . . . . . . . . . . . . . . . . . . . 50
vii

3.3.3 Interrupt Mode . . . . . . . . . . . . . . . . . . . . . . . . . . 59
4 Ventilation-on-Demand 62
4.1 Introduction . . . . . . . . . . . . . . . . . . . . . . . . . . . . . . . 62
4.2 Ventilation on Demand Using Diagnostic System . . . . . . . . . . . . 63
4.3 Interrupt . . . . . . . . . . . . . . . . . . . . . . . . . . . . . . . . . . 64
5 Performance Evaluation 70
5.1 Introduction . . . . . . . . . . . . . . . . . . . . . . . . . . . . . . . 70
5.2 Wake up Time . . . . . . . . . . . . . . . . . . . . . . . . . . . . . . . 72
5.3 End-to-End Delay and Throughput . . . . . . . . . . . . . . . . . . . 78
5.4 Component Tolerance Error (CTE) . . . . . . . . . . . . . . . . . . . 80
5.5 Gain Estimation Error (GEE) . . . . . . . . . . . . . . . . . . . . . . 83
6 Conclusion and Future Work 85
6.1 Conclusion . . . . . . . . . . . . . . . . . . . . . . . . . . . . . . . . . 85
6.2 Future Work . . . . . . . . . . . . . . . . . . . . . . . . . . . . . . . . 87
Bibliography 90
Appendices 94
viii
List of Tables
2.1 Leaky Feeder System Frequency Plan . . . . . . . . . . . . . . . . . . 17
3.1 DRU Specifications . . . . . . . . . . . . . . . . . . . . . . . . . . . . 29
3.2 DTU Specifications . . . . . . . . . . . . . . . . . . . . . . . . . . . . 32
3.3 Communication Protocol Specifications . . . . . . . . . . . . . . . . . 35
3.4 Bits 2-4 of the Control Field . . . . . . . . . . . . . . . . . . . . . . . 36
3.5 Data Configured During the Write Cycle . . . . . . . . . . . . . . . . 53
3.6 Data Read During Read Cycle . . . . . . . . . . . . . . . . . . . . . . 58
4.1 Data Read During Interrupt Mode-Read Message . . . . . . . . . . . 67
4.2 Data Configured During the Write Cycle-Interrupt Mode . . . . . . . 69
5.1 System Configuration . . . . . . . . . . . . . . . . . . . . . . . . . . . 71
5.2 Measured Values vs. Simulation Results part 1/2 . . . . . . . . . . . 73
5.3 Measured Values vs. Simulation Results part 2/2 . . . . . . . . . . . 74
ix

List of Figures
1.1 Leaky Feeder Network with Diagnostic System Installed . . . . . . . 8
2.1 Leaky Cable Structure . . . . . . . . . . . . . . . . . . . . . . . . . . 12
2.2 Basic Operation of Leaky Feeder System . . . . . . . . . . . . . . . . 14
2.3 Typical System Arrangement . . . . . . . . . . . . . . . . . . . . . . 15
2.4 General Layout of Leaky Feeder Underground Network Providing Var-
ious Services . . . . . . . . . . . . . . . . . . . . . . . . . . . . . . . . 16
2.5 System Bands Orientation Layout . . . . . . . . . . . . . . . . . . . . 17
2.6 Multiple Upstream and Downstream Reference Pilot System with AGC 19
3.1 DTU Connected to BDA in Leaky Feeder Network . . . . . . . . . . 27
3.2 DRU Architecture . . . . . . . . . . . . . . . . . . . . . . . . . . . . . 28
3.3 DTU Architecture . . . . . . . . . . . . . . . . . . . . . . . . . . . . . 31
3.4 General Message Format . . . . . . . . . . . . . . . . . . . . . . . . . 35
3.5 Self Configuration Pilot Signal at DRU and the Attenuated Version at
DTU . . . . . . . . . . . . . . . . . . . . . . . . . . . . . . . . . . . . 38
3.6 RF killer in place on the downstream . . . . . . . . . . . . . . . . . . 39
3.7 Leaky Cable Longitudinal Loss Chart . . . . . . . . . . . . . . . . . . 41
3.8 Self Configuration Message Sequence . . . . . . . . . . . . . . . . . . 42
3.9 SET D Message Format . . . . . . . . . . . . . . . . . . . . . . . . . 43
3.10 RRES Message Format . . . . . . . . . . . . . . . . . . . . . . . . . . 44
3.11 ACK SET D Message Format . . . . . . . . . . . . . . . . . . . . . . 45
3.12 Self Configuration Operation Mode . . . . . . . . . . . . . . . . . . . 47
x

3.13 DRU Flowchart . . . . . . . . . . . . . . . . . . . . . . . . . . . . . . 48
3.14 DTU Flowchart . . . . . . . . . . . . . . . . . . . . . . . . . . . . . . 49
3.15 Normal Mode- Write Cycle Message Sequence . . . . . . . . . . . . . 51
3.16 Format of WRITE Message . . . . . . . . . . . . . . . . . . . . . . . 52
3.17 Format of ACK Message . . . . . . . . . . . . . . . . . . . . . . . . . 53
3.18 Normal Mode- Read Cycle Message Sequence . . . . . . . . . . . . . 55
3.19 Format of REQ Message . . . . . . . . . . . . . . . . . . . . . . . . . 55
3.20 Format of DATA READ Message . . . . . . . . . . . . . . . . . . . . 57
3.21 Write Mode Sequence . . . . . . . . . . . . . . . . . . . . . . . . . . . 60
3.22 Read Mode Sequence . . . . . . . . . . . . . . . . . . . . . . . . . . . 60
4.1 Interrupt Message Sequence . . . . . . . . . . . . . . . . . . . . . . . 65
4.2 Interrupt Message Format . . . . . . . . . . . . . . . . . . . . . . . . 66
4.3 Interrupt Mode Sequence . . . . . . . . . . . . . . . . . . . . . . . . . 69
5.1 Leaky Feeder System Setup . . . . . . . . . . . . . . . . . . . . . . . 72
5.2 Percentage of DTU Wake up Time to Total Time for Different System
Sizes- Self Configuration Mode . . . . . . . . . . . . . . . . . . . . . . 75
5.3 Percentage of DTU Wake up Time to Total Time for Different System
Sizes- Normal Mode- Write Cycle . . . . . . . . . . . . . . . . . . . . 76
5.4 Percentage of DTU Wake up Time to Total Time for Different System
Sizes- Normal Mode- Read Cycle . . . . . . . . . . . . . . . . . . . . 77
5.5 Extra Processing Time for Different System Sizes- Interrupt Mode . . 78
5.6 Average End-to-End Delay in the Network Over One Hour . . . . . . 79
5.7 Average Throughput in the Network over an Hour . . . . . . . . . . . 80
5.8 CTE Simulation Analysis . . . . . . . . . . . . . . . . . . . . . . . . . 82
5.9 GEE Simulation Analysis . . . . . . . . . . . . . . . . . . . . . . . . 84
xi

Acronyms
MINER Mine Improvement and New Emergency Response
WSN Wireless Sensor Networks
TTE Through The Earth
ELF Extremely Low Frequency
PSU Power Supply Unit
CMHS Coal Mine Health and Safety
DRU Diagnostic Receiver Unit
DTU Diagnostic Transponder Unit
MSHA Mine Safety and Health Administration
PTT Push To Talk
DOCSIS Data Over Cable Service Interface Specification
CMTS Cable Modem Termination System
BDA Bi-Directional Amplifier
RF Radio Frequency
AGC Automatic Gain Control
ASC Automatic Slope Control
LED Light Emitting Diode
DSP Diagnostic Software Program
GUI Graphical User Interface
MTW Maximum Time to Wait
CRC Cyclic Redundancy Check
ACK Acknowledge
xii

xiii
INT Interrupt
VNA Vector Network Analyzer
CTE Components Tolerance Error
GEE Gain Estimation Error

Chapter 1
The Underground CommunicationNetwork
1.1 Intoduction
After a series of recent world wide mine tragedies, ranging from collapsing mines in
China and Colombia to trapped miners in Chile, the importance of robust and reli-
able underground communication networks has become evident once again. A reliable
underground communication network in mines will not only facilitate the day to day
operations, but will also help save many lives. However; designing reliable and robust
underground network has always been a challenge due to the special nature of mines.
Mining industry is not only important for job creation but is also essential to
sustain humanity as well, by supplying minerals that the world of today could not
exist without. Mining industry contributes to the economies of different countries
and help build new communities. Mining is extremely important for Canadian econ-
omy. Canada is considered a major player in the mining industry worldwide. Canada
produces about 60 minerals. It ranks first among all mineral producing countries
1

2
in the number of minerals produced. In addition, Canada is the largest exporter of
minerals, with more than 20% of production shipped to world markets [9].
In a typical year, the mining industry is responsible for almost 20% of Canada’s
total export earnings. As for the employment rate, over 70% of the mines are owned
by Canadians and approximately 108,000 Canadians are directly employed in the
mining industry [9].
Products from mining industry power the automobiles and heat buildings, and
supply the manufacturing sector; the high tech industries and even the better known
resource industries are all dependent, in some way, on the mining industry. The
mining industry will continue to be an important support to the economy. Mining
is taking full advantage of the quick expansion of computers and microelectronics.
These technologies are found in nearly every aspect of mineral development activity
- from exploration methods, through production, mineral processing and even mar-
keting. Computers and related equipment now have a lot of different applications in
geophysical logging, geochemistry, geological mapping, surface contouring, and most
important communications.
Communication in mines is the intersection point for all of the aforementioned
concerns and considerations, since it is used at every stage of mining operations.
Day-to-day operations, extracting and moving the product are handled with the aid
of communications, which increases the productivity. Remote monitoring and control
operations depend completely on communications, too [21, 22].

3
1.2 Current System Challenges
Following tragic events in many underground mines such as those at the Darby,
Alma, Sago coal mines, and recently the big incident of Chile, the need for reli-
able communications systems in underground mines became evident. Such previous
incidents and many more triggered the Mine Improvement and New Emergency Re-
sponse (MINER) Act of 2006 in the United States. The most important aspect of the
MINER Act is providing reliable communication for miners before and after tragic
incidents. Reliable communication has always been a challenge in underground mines
due to changing topologies and the harsh environment. In addition, disasters disable
electricity and communications cables, block tunnels and cause fire. These may dam-
age the communication infrastructure which hampers rescue efforts and endangering
lives. Therefore, durable wireless solutions have been investigated and researched by
both the industry and the academic institutions to provide reliable communications
in underground mines.
There are various communication systems for underground mines ranging from
wired systems like paging phones to wireless systems like Wireless Sensor Networks
(WSN) and also hybrid systems like leaky feeders. Currently, three main systems are
widely used: leaky feeders, Through The Earth (TTE), and WSN. While TTE is used
in case of disaster recovery to locate trapped miners and wireless sensors networks
are used for sensing the mine conditions, the leaky feeder system can be considered

4
the most popular communication system used for day-to-day operations. Leaky feed-
ers have long successful history in mine communications [11]. Due to the ability of
leaky feeder networks to carry voice, video, and data in underground networks, it has
emerged to be the most popular communication system in mines since the early 90’s.
However; leaky feeder system is not reliable and its problems are hard to diagnose.
Starting with the TTE system; it is used to employ an effective and timely res-
cue operation when miners are trapped underground after a disaster. The rescue
team above ground use Extremely Low Frequency (ELF) waves to penetrate earth
and locate the trapped miners and also to establish communications with them. It
may be the best option for rescue operation, however; it requires huge transmitter
power and antenna size. Another disadvantage is the inaccuracy since the TTE de-
pends on the depth, frequency, and the characteristics of the ground. For WSN, it
consists of several repeater nodes which are able to store and forward information
to other nodes. WSN requires limited human intervention for system configuration
and is both self-healing and robust. Providing low data rate is a disadvantage that
limits it to specific applications. WSN shows different performance depending on
the mine gallery geometry for instance it shows poor performance around the cor-
ners and at pillar areas. Finally, when it comes to leaky feeders different companies
have developed different systems, but they all have the same basic idea; coaxial cable
runs all the way from a control room above the ground through different parts of the
mine. This cable radiates over its entire length allowing signals to be leaked out and
into the cable providing two-way communications and acting as both antenna and
transmission medium at the same time. Signal attenuates while traveling through

5
the cable which requires bi-directional amplifiers every 350 ∼ 400 meters. These
amplifiers are powered by DC voltage supplied through the cable’s center conductor
[14], which in most existing leaky feeder systems operates at 30-300 MHz. In addition
to amplifiers the leaky feeder cable is connected to Power Supply Units (PSU) as well.
Reliability, and robustness are two essential characteristics of underground com-
munications networks, however; they have not yet been fully explored. There are two
main reasons for that. The first is due to the complexity of communication networks
in mines as the environment is extremely harsh and the geometry of the mine gallery
keeps changing. The second reason is purely historical: which was the deregulation
of the industry; it was only major accidents that triggered the federal government
to introduce different acts. For example the famous mine accidents in the 1960’s
leading to the Coal Mine Health and Safety (CMHS) Act of 1969 [15], and the Mine
Improvement and New Emergency Response (MINER) Act of 2006.
1.3 Contribution of the Thesis
The advanced monitoring system presented here is an integrated novel solution for
monitoring underground communication networks. This is based on leaky feeder
system and is designed to utilize the leaky feeder’s infrastructure to monitor itself
while providing ventilation on demand. This system solves the reliability problem
in leaky feeders by providing accurate real time information about the leaky feeder
network underground to the operator in the control room above ground. More over,
this will assist them in taking decisions and troubleshooting the network problems.

6
Intelligence is introduced to the system by adding a Diagnostic Receiver Unit (DRU)
connected to the leaky feeder headend located in the control room above ground and
several Diagnostic Transponder Units (DTU) connected to every amplifier, PSU, fan,
and sensor in the system. The DTU is able to acquire specific information from the
node connected to it and sends it real time to the DRU. Using a software-friendly
interface the DRU will present real time data to the operator in the control room al-
lowing better trouble shooting and assistance in the decision making process. Losses
along the leaky feeder cable will be detected using a novel technique.
This Diagnostic System operates in three modes: self configuration mode, normal
mode, and interrupt mode. Self configuration mode detects network layout, number
and type of nodes, distance between nodes, and losses. Normal mode allows DRU
to read information from all nodes and change any parameters remotely from the
control room. Interrupt mode enables any DTU to interrupt the DRU and send to
it critical information about the node connected to it. This diagnostic system will
also provide ventilation on demand as it will switch the fans on or off according to
the information it receives from sensors through the DTU. It is up to the authors’
knowledge that such a complete system never been investigated before. Figure 1.1,
shows an overview of the system.
Ventilation on Demand concept is to control the amount of ventilation and power
to reduce the energy requirements as mining depth increases. Our protocol is based
on the ability to control the volume of air and thus power requirements of the specific
activities required for the mining process. To accomplish this the fan needs to be

7
informed of the current level of gases, temperature, and other air quality parameters
in each section of the mine. This is accomplished using various temperature and air
quality sensors.
Below is a summary of the main thesis contribution that will be presented in
details in the following chapters:
• Hardware design of DRU
• Hardware design of DTU
• Smart communication protocol with different modes
– Normal mode: enables polling all DTU’s and reading their data in addition
to configuring them remotely
– Self configuration mode: detects the layout of the underground network,
calculates losses, distance between nodes, number of splitters, and does
accurate trouble shooting
– Interrupt mode: for important alarms
• Ventilation on Demand is a feature built on the interrupt mode that will pro-
vide aggressive savings by cutting the power consumed in mines and helps in
introducing the concept of ”Green Mines.”

8
Figure 1.1: Leaky Feeder Network with Diagnostic System Installed

9
1.4 Outline of the Thesis
Chapter 1: The Underground Communication Networks
This chapter gives a general overview of the mining industry in Canada and commu-
nication networks currently deployed in the confined spaces of underground mines.
The challenges encountered with nowadays underground communication networks is
briefly described.
Chapter 2: Leaky Feeder System
This chapter gives an introduction to leaky feeder theory. Also, current network con-
figuration and the associated problems are discussed here.
Chapter 3: Diagnostic System Solution
In this chapter a new and novel solution is presented to monitor, control, and add
reliability to underground leaky feeder networks. The diagnostic system is described
here in terms of: hardware architecture of different nodes and the smart communica-
tion protocol along with its different modes.
Chapter 4: Performance Evaluation
Discussion of the diagnostic system performance is presented here. Evaluation of the
communication protocol under different types of errors is also shown in this chapter.
Chapter 5: Ventilation on Demand
This chapter introduces the concept of ventilation on demand and explains its effect
on mines. Our design of ventilation on demand mode is presented here. We show how

10
ventilation on demand can be built on top of the interrupt mode that we designed as
part of our communication protocol.
Chapter 6: Conclusion and Future Work
This chapter summarizes the results and conclusions of the thesis work. Some sug-
gested research activities are presented to carry on further work.

Chapter 2
Leaky Feeder Systems
2.1 Introduction to Leaky Feeders
Due to the fact that wireless and mobile communications in confined space environ-
ments, such as underground mines and tunnels, tend to have different philosophy to
that of the open space wireless communications, leaky feeder became the most used
communication solution in mines. The leaky feeder system has a long history of suc-
cess in tunnel applications [11], and it has been used in some coal mines for routine
communications since the 1980s [14].
VHF and UHF signals propagate very poorly in mines; thus, signal transmission
is confined to mine openings like entries and crosscuts. Therefore, a leaky feeder cable
must be strung throughout a mine wherever access to communications is required.
Leaky feeder cable also known as ”Radiating Cable,” functions as both antenna and
transmission line. RF energy is simultaneously transmitted down the radiating cable
and radiated from all points into the surrounding space. Slots cut into the outer
conductor of the coaxial cable allow controlled levels of electromagnetic energy to be
11

12
radiated both out of and into the cable.
The amount of radiation is quantified by the coupling loss. The coupling loss is
defined as the difference between the power transmitted into the cable and the power
received by a λ2
dipole antenna located at a distance 2 meters from the cable [7]. The
structure of a typical leaky cable is that the inner conductor is covered by a layer
of insulation foam. This is then covered by a layer of outer conductor, and finally
insulated by a cable jacket. A typical leaky cable structure is shown in Figure 2.1.
Figure 2.1: Leaky Cable Structure
The leaky feeder network is a combination of leaky feeder cable and amplifiers.
Other components are added as well, like PSU, however; the backbone of the system
compromises leaky feeder cable and amplifiers only. The inherent loss of signal must
be compensated for and this is achieved by the insertion of line amplifiers. The am-
plifiers are designed to compensate for a certain length of cable. Correct installation
of the system will ensure that a consistent signal level is maintained throughout the
network, hence throughout the mine [4].

13
Different loss models can be used for mines, but the propagation loss model, the
most common model, is considered here. It will be easily noticed that the degree of
attenuation throughout the leaky cable is lower than that of free-space propagation in
the mine. This in turns means that the leaky feeder system increases the propagation
range [22, 18, 5].
The basic operation of leaky feeder networks is as shown in Figure 2.2, where the
headend of the feeder cable connects to the base station located in the control room
on the surface. The connection between the base station and the mine’s leaky feeder
at the mine entry is usually a non-radiating coaxial cable [14]. The base station is
responsible to coordinate the flow of communication within the mine in terms of as-
signing channels, paging, providing quality of service, and connecting circuits. Again,
in Figure 2.2, an example is provided where miner 1 and miner 2 are at two separate
physical locations while still talking to each other through the leaky feeder network.
It is a duplex communication mode where the call is carried on an uplink frequency
to the base station which then forwards it through a different downlink frequency to
the specified radio device.
When designing a leaky feeder communication network underground, there are
many parameters the designer has to pay attention to like the number of amplifiers,
PSU, distance between amplifiers, partitioning of cells, etc. As the shape of the leaky
feeder network is somehow complex and have few different arrangements. The general
arrangement of the leaky feeder network is that the system is sectioned off into cells
that are separated by barriers. A barrier is a device that allows radio signals to run

14
Figure 2.2: Basic Operation of Leaky Feeder System
through the feeder cable but blocks DC power from transferring between cells [13].
Thus, all amplifiers in a given cell are powered from a single power supply dedicated
to that cell. There are some injection points that allow DC voltage from the power
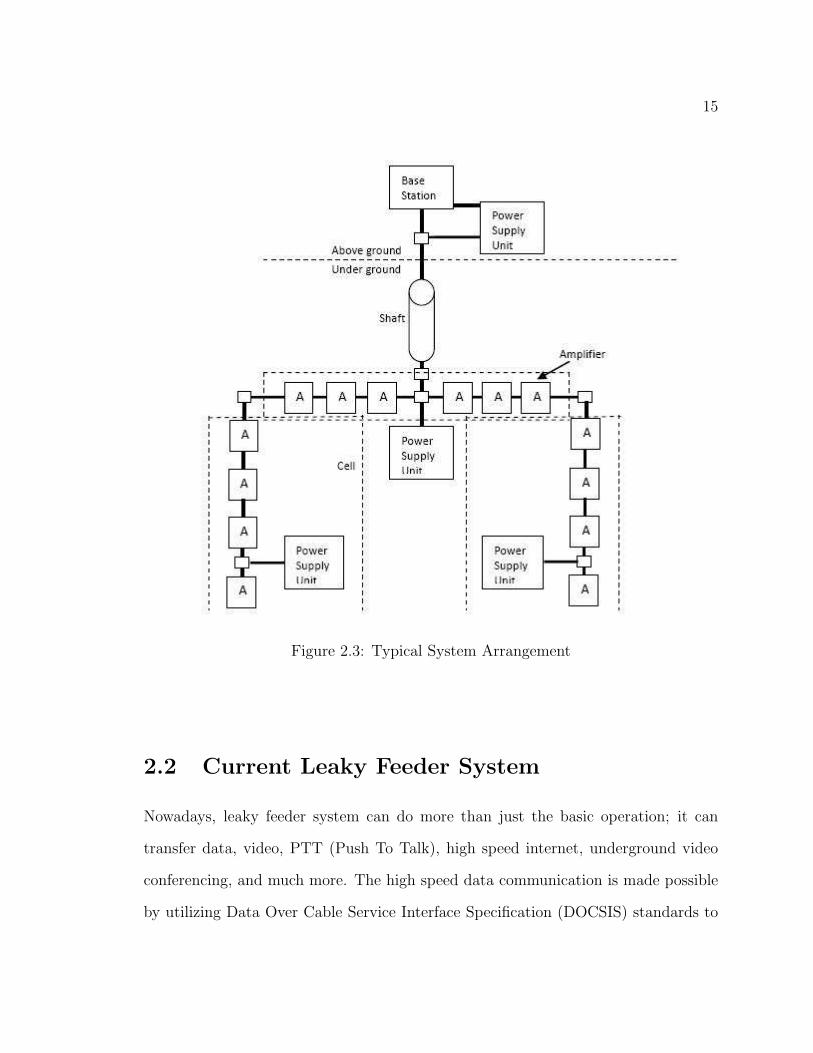
supply to be imposed on the center conductor of the leaky feeder cable. Figure 2.3,
shows a typical leaky feeder arrangement.
Since the system must operate after a catastrophic event, each power supply re-
quires a battery backup. Lead-acid batteries are used for this application. The
batteries and their associated charging equipment are housed in an Mine Safety and
Health Administration (MSHA) approved, explosion-proof enclosure within each cell
location. All other communications components are approved as intrinsically safe. A
typical spacing between adjacent power supplies is 1500 meters.
15
Figure 2.3: Typical System Arrangement
2.2 Current Leaky Feeder System
Nowadays, leaky feeder system can do more than just the basic operation; it can
transfer data, video, PTT (Push To Talk), high speed internet, underground video
conferencing, and much more. The high speed data communication is made possible
by utilizing Data Over Cable Service Interface Specification (DOCSIS) standards to

16
deliver Ethernet connectivity based on Cable Modem Termination System (CMTS) in
leaky feeder systems. Typically, there are four bands of amplifications in the system
amplifiers to compensate for the system losses. In the CMTS system, there are two
bands dedicated to provide full-duplex voice communications (upstream and down-
stream) and two bands to provide the CMTS high speed data communications in the
upstream and downstream directions. Figure 2.4, shows general layout of leaky feeder
underground network providing various services.
Figure 2.4: General Layout of Leaky Feeder Underground Network Providing VariousServices
The four distinct RF bands in the system are required to provide RF paths for
voice and data communications. Table 2.1, shows the system frequency plan, it lists
the frequency range for each band. While the upstream and downstream orientation
layout of these bands is shown in Figure 2.5.
The current systems achieve coverage by utilizing in-line Bi-Directional Amplifiers

17
Table 2.1: Leaky Feeder System Frequency PlanBand No. Band Name Frequency1 Upstream Data 5-42 MHz2 Downstream Voice 155-158 MHz3 Upstream Voice 172-175 MHz4 Downstream Data 220-232 MHz
Figure 2.5: System Bands Orientation Layout
(BDA) distributed along the underground tunnels and galleries in a multi- cascaded
topology. RF signals are amplified in both directions (upstream and downstream) to
maintain adequate signal levels to compensate for fixed or dynamic system losses.
Maintaining consistent RF levels in any system require methods of controlling the
gain and slopes of the amplifiers. These requirements led to the design of special
leaky feeder communication network circuits, where the primary ideal function is to
maintain a constant signal level at the output, regardless of the signal’s variations at
the input of the system. These circuits are known as Automatic Gain Control (AGC)
and Automatic Slope Control (ASC), AGC/ASC circuits and are currently used in
all leaky feeder communication systems.

18
2.3 Reliability Problem and Other Challenges
In leaky feeder cables the quality of radio communications vary with the level of the
signal travelling through the cable. Temperature variation can manipulate the signal
level by changing the longitudinal loss characteristics of the cable. Also external noise
caused by mine machineries can vary the signal level. Mines are very dynamic in the
way they grow; there are daily expansions which require more cables and branches
to be added to the system. This requires more amplifiers to compensate the losses
where AGC is used in the system. Many AGC and ASC circuits where introduced
in the leaky feeder systems to compensate for and overcome the variations in the
levels of the RF signals. The most common approach in deploying AGC/ASC is by
utilizing reference RF carriers normally referred as Pilots [16]. These reference pilots
with known value propagate through the entire system and are used by each amplifier
as measuring references to correct the gain and slopes of the amplifier’s pass bands.
Challenges exist in deploying AGC/ASC functions in the current leaky cable sys-
tems. From system level point of view, the reliance on the reference pilots within the
AGC/ASC circuits creates major problems, especially for multi-branched large leaky
cable systems, which is the case in most underground mines topology. In these types
of systems, it is required to install multiple reference pilot generators at the system
headend and at the end of each branch in the system. In case of upstream direction,
the problem occurs at the point of the system branching where the pilot carriers from
each branch superimpose. The accuracy of the reference pilots is affected. This affects

19
Figure 2.6: Multiple Upstream and Downstream Reference Pilot System with AGC
the operations of the AGC circuits in the subsequent amplifiers and result in instable
system operations [7]. Figure 2.6, shows an AGC multiple reference pilot system.
The other major problem in the current system is controlling these amplifiers and
changing their parameters remotely. Currently, these amplifiers are controlled locally.
Technician has to go underground to troubleshoot the problems with the upstream
pilot generator and change its parameters. The rate of sending the pilots has to be
changed by visiting underground as well. It often happens that collision occurs be-
tween pilots generated at different upstream pilot generators leaving the operator in
the control room with absolutely no information about the status of the amplifiers.
Therefore; the operator would not be able to set their gain from the control room.
The operator in the control room above ground will have no information about the
status of amplifiers and the network in general unless the pilot is received successfully.
Even in this case; the operator will have no control over the amplifiers.
In summary, the current system has been in use since the 90’s and therefore has many

20
prolonged problems. Almost all troubleshooting has to be done by sending a techni-
cian underground to the mine. Also, no real time information about the network is
available to the operator in the control room above the ground. Detecting the losses
in the network or the number of branches or number of nodes is almost impossible
without prior knowledge of the network. Any changes in the mine layout like expan-
sion or shutting down a certain area cannot be detected automatically. The current
pilot system is not reliable and sometimes pilots from different upstream generators
collide or superimpose at branching points. This leads to errors and wrong informa-
tion about some amplifiers.
Some efforts have been done to enhance the current system, but still they all are
based on the same idea of pilot signals which is the core problem. Surveying some of
the previous work done we can see that in [21], Craig A. Winkelmann et al. tackled
the reliability problem by implementing a self-testing algorithm for microprocessors
in mine monitoring systems; this technique assumed that problems occur at micro-
processor level only which is not always the case. In [2], Robert S. Chapman et al.
presented a methodology that could be used for measuring the performance of a mon-
itoring system, Again in [1], they continue their efforts to develop an underground
mine monitoring and control testing criteria. In [19], J. Sottile et al. surveyed a
number of available fault monitoring and diagnosis equipment at that time, where
they compared the model-based approach to the neural nets. Both approaches lack
reliability and most of the systems address one problem at a time. In [6], T. H.
Dubaniewicz et al. introduced a system based on fiber optics to monitor air quality
in mines, fiber optics are quite reliable, however; it is extra hardware which means
extra cost.

21
2.4 Available Solutions for Current Leaky Feeder
Networks
In this section, few interesting solutions that are already available are described.
Smart Com by Varis Mine Technology Ltd. is a hybrid system that incorporates
leaky feeder technology and Ethernet technology. The Ethernet network is used to
provide diagnostic capabilities to the amplifiers underground. Information regarding
the amplifiers is sent to another node in the control room above ground. However;
this system lacks the remote configuration capability as the operator in the control
room cannot change parameters of the amplifiers. Only read their information. An-
other drawback is that this system ignores the PSU and only focuses on amplifiers.
Contrary to our diagnostic system, this system does not provide self configuration or
support ventilation on demand.
Beckercom by Becker Mining Systems AG is a leaky feeder system that only pro-
vides local diagnostic. Operator has to go underground and connect their equipment
to diagnose each node. They have a set of LEDs and flash lights on each amplifier
that are clearly seen which makes high level diagnosing easy to anyone like regular
mine workers. These LEDs show the amplifier performance and can be seen from
passing vehicles. This system lacks all remote and troubleshooting capabilities that
results in huge maintaining and running cost.
22
SIAMnet by Cattron Group International Inc. is another leaky feeder product
that optimizes leaky feeder channels for best performance and supports RFID as well.
However; it still uses the old pilot system, thus; it provides no diagnostic capability
in addition to having no reliable amplifier that cause errors in the system.
Infinity Series is an amplifier developed by Mine Site Technologies Inc., to be
used in their leaky feeder system. They sell this as part of their leaky feeder solution
as a standalone product as well. It has a built-in diagnosing algorithm that can be
accessed locally by sending a technician underground. They claim this amplifier has
a longer than usual life time since it is covered by a special dielectric casing that
protects the amplifier from errors caused by temperature variation and harsh under-
ground environment.
MR90 by FHF Bergbautechnik GmbH & Co. KG is a complete leaky feeder sys-
tem with no diagnostic capability. It has a special technology that allows the spacing
between amplifiers to reach up to 1,000 meters compared to the current system that
support spacing up to 350 meters. It still depends on the pilot system.
Minecom Leaky Feeder System by Minecom Ltd is the normal classical leaky
feeder system that can provide voice and data services but with absolutely no moni-
toring or diagnosing. This is built on the old pilot system. Therefore; it suffers from
the same problems.

23
There are some other systems that provide different kinds of diagnosing by using
extra hardware, such as optical fiber that will boast the cost. Also, for underground
environment monitoring a separate network is needed which means extra cost and
more problems.
After we have done a survey for all commercially available solutions in the market
we have found that there is no complete solution for monitoring, and controlling the
communication network in mines along with providing ventilation on demand. Cur-
rently commercially available solutions lack the remote capability to not only read
the amplifiers status but also to configure them. Also available solutions focus only
on amplifiers and ignore the PSU which is an important part in the underground net-
works. No available solution provides ventilation on demand; usually it is a separate
product which means extra cost to mining companies.
Addressing the above mentioned problems we introduce a novel diagnostic system
which gives the operator in the control room full control over all network elements
like amplifiers, PSU, fans, and sensors. The system can not only read their informa-
tion but set their parameters as well. Therefore, no more upstream pilot generators
is required since gain control can be done through the control room above ground.
No more technicians are needed to go underground for trouble shooting and setting
the pilot generators. Ventilation on demand is introduced as part of the integrated
solution that will provide huge power savings. All this will happen using the same
infrastructure in place right now with minor changes. Therefore, the proposed system
uses the infrastructure to monitor itself.

24
The idea we introduce here is a revolutionary concept that will change the way
underground leaky feeder communication networks operate forever.

Chapter 3
Diagnostic System Solution
In this chapter we present the theory behind the diagnostic system. Details about
the hardware and firmware and the communication protocol are presented here. For
the communication protocol, which is our core work, we show different modes, cycles,
and discuss the packet format of each message.
3.1 Introduction to Diagnostic System
Diagnostic System is a monitoring sensor network which collects data from critical
nodes of leaky cable network for further processing and optimization of network pa-
rameters. This system is capable of monitoring, diagnosing and failure prediction
from a remote location such as a control room. The diagnostic system consists of
three main components:
1. Diagnostic Transponder Unit (DTU)
2. Diagnostic Receiver Unit (DRU)
3. Diagnostic Software Package (DSP)
25

26
The DTU is installed inside some units (critical nodes) such as the BDA and
PSU. The DTU collects data such as RF level, temperature, etc. and pass them to
the headend controller i.e. DRU. The DRU stores data in database for further pro-
cessing by operator through DSP. The DTU can further act as I/O device to control
the functionality of BDAs or PSUs remotely by DSP. Detailed diagram of the diag-
nostic system installed in a leaky feeder underground network can be seen in Figure
1.1.
Our diagnostic system was developed to provide advanced monitoring that enables
operator to acquire up-to-date information about amplifiers, PSU, fans, and sensors,
while keeping the network simple and maintaining the cost-effective nature of leaky
feeders.
The diagnostic system uses a special communication protocol that was also de-
veloped here. It provides self configuration capabilities in which the layout of the
network is automatically detected with all losses and number of splitters reported.
Furthermore, it enables troubleshooting, changing and reading parameters of any
nodes remotely, and ventilation on demand.
This has to happen while maintaining the same infrastructure, and only applying
minimal modifications. It has to be back-to-back compatible with current leaky feeder
networks while still being cost effective. Figure 3.1, shows the connection between
DTU and some BDA. For a detailed diagram, see Figure 1.1.

27
The Diagnostic System saves energy by providing ventilation on demand. This
is huge energy savings since ventilation is responsible for around 60% of power con-
sumption in mines.
Figure 3.1: DTU Connected to BDA in Leaky Feeder Network
3.2 Hardware Architecture
It starts in the control room where the DRU have to be added to the already existing
leaky feeder headend. The DTUs should be connected to the nodes to be monitored
underground. Communication between DRU and DTUs happens through the already
existing leaky cable in which some channels at specific frequencies are reserved for
communication.
3.2.1 Diagnostic Receiver Unit (DRU)
DRU is then seen as the headend control device handling the communication, ac-
quiring data, and exchanging commands with the DTU device. The acquired data

28
is safely stored in a database further processed and analyzed by the operator. The
DRU is controlled by computer in the control room run by the DSP.
DRU consists of four components:
• RF Modem: It is an RF transceiver interfacing the leaky cable responsible for
communication with DTU over the leaky cable.
• Microcontroller: The microprocessor oversees all DRU activities such as packet
handling and configuration.
• Memory: It is responsible for storing collected data.
• User interface: This is the interface between DRU and database/server.
DRU architecture is shown in Figure 3.2, and DRU specifications are stated in
Table 3.1.
Figure 3.2: DRU Architecture

29
Table 3.1: DRU Specifications
Physical
Construction Rack mount enclosureEnclosure Steel enclosure/ panelWeight < 5 KgConnectors RF Input/Output: BNC jack
connector Uplink/downlink Channel:BNC jack connector
EnvironmentalTemperature -40 to +60 C (-40 to +140 F)Humidity 10 ∼ 98%
ElectricalInput Voltage 12 VCurrent Consumption < 100 mAPower Consumption < 1.2 Watt
Receiver
Frequency 172-175 MHzModulation Type FSKData Format Asynchronous burst packet-NRZData Rate 19.2 KBaudImpedance 50 Ω
Transmitter
Frequency 155-158 MHzModulation Type FSKData Format Asynchronous burst packet-NRZData Rate 19.2 KBaudImpedance 50 Ω
DiagnosticGreen LED Power IndicatorRed LED General Fault
In transmit mode, the microcontroller receives the command from the database
/ server package through the user interface. It processes the received command and
generates the corresponding packet and passes it to RF modem to be transmitted
over leaky cable.
In receive mode, the microcontroller looks for valid RF-packets. When one is re-
ceived, the data contained within the RF-packet is extracted/decoded and forwarded
to user interface. The data is stored in the database to be accessed later by operator
for further analysis.

30
3.2.2 Diagnostic Transponder Unit (DTU)
DTU acts as a tunable end-of-line monitor, which measures and manipulates electrical
parameters of interest. It is controlled from the headend and serves as a troubleshoot-
ing tool for remote diagnostics. It assists the operator in pinpointing the location and
cause of problems in the system. DTU can also be programmed to change the op-
erating point of the attached devices or to perform automated tests on user-defined
schedules where the operator does not need to be present. It enables ventilation on
demand as well.
DTU consists of five major components:
• RF Modem: It is an RF transceiver responsible for communication with DRU
over the leaky cable.
• Microcontroller: The microcontroller oversees all DTU activities and is respon-
sible for all firmware in the node.
• Memory: It is responsible for storing collected data from the corresponding
device.
• Data interface: This is the communication interface between DTU and attached
device.
• Configuration interface: It is used for local access to DTU.
DRU architecture is shown in Figure 3.3, and DRU specifications are stated in
Table 3.2.

31
Figure 3.3: DTU Architecture
Via data bus, there is a two way communication between the micro-controller and
the attached device. The microcontroller acquire data from the device, and depend-
ing on the traffic, it may store it in memory (for transmission at later time) or pass
it to RF modem to be transmitted to DRU over the leaky cable. The DTU can also
accept a command from DRU to change parameters of attached device. As the inter-
face to leaky cable, the RF modem receives the command signal. The microcontroller
decodes the message and performs the task on corresponding device. The task could
be report/change of a parameter of corresponding device.
To aid in installation, the DTU have the connection for local access and configuration.
This allows the technicians to configure the DTU on site. Through this bus the DTU
can be reconfigured as well as through remote configuration using DRU.

32
Table 3.2: DTU Specifications
Physical
Construction Rack mount enclosureEnclosure Steel enclosure/ panelWeight < 5 KgConnectors RF Input/Output: BNC jack
connector Uplink/downlink Channel:BNC jack connector
EnvironmentalTemperature -40 to +60 C (-40 to +140 F)Humidity 10 ∼ 98%
ElectricalInput Voltage 12 VCurrent Consumption < 100 mAPower Consumption < 1.2 Watt
Receiver
Frequency 155-158 MHzModulation Type FSKData Format Asynchronous burst packet-NRZData Rate 19.2 KBaudImpedance 50 Ω
Transmitter
Frequency 172-175 MHzModulation Type FSKData Format Asynchronous burst packet-NRZData Rate 19.2 KBaudImpedance 50 Ω
DiagnosticGreen LED Power IndicatorRed LED General Fault
3.2.3 Diagnostic Software Package (DSP)
DSP is the point of connection between operator and the system. The diagnos-
tic network can be monitored and analyzed using this software. All command and
automated task are initiated by DSP. An automated task can be initiated to moni-
tor/modify some parameters in the leaky cable network. Operator can also perform
a spontaneous task such as monitoring a specific device or changing the operating
point of a device. In term of functionality, the DSP consists of three main parts:
1. Graphical user interface (GUI)

33
2. Analysis capability
3. Database management
In general, the DTU will acquire data periodically from the node connected to it,
whether it is amplifier, PSU, fan, or sensor through the data interface shown in Figure
3.3. The data will be stored in the DTU’s memory till it is requested by DRU. DRU
can also send configuration messages to any node through the DTU’s microprocessor.
Furthermore, DRU is able to change RF gain of any amplifier, switch PSU on and
off, increase or decrease fan speed all in its normal mode of operation.
Another operational mode is the self configuration which will be mostly used when
starting up the system or when changes occur to the system layout, i.e, expanding
the mine or shutting some sections in it. Two pilot signals with known values are sent
from the DRU to every DTU, and the other at the time of to estimate the distance
and losses between DRU and every node in the system. Interrupt is the third mode of
operation. In that mode DTU nodes are able to interrupt the DRU and transmit to
it important alarms, i.e, when sensors detect a high toxic gas level in the air it should
inform the DTU connected to it. The DTU, in turns, interrupts the DRU process
asking for immediate reaction. DRU orders DTU to switch the fans on in order to
overcome the gases level in the air.
Amplifiers, PSU, fans, and sensors can interrupt the DRU at any time but accord-
ing to priority. Due to the importance of ventilation, which is the mine’s breathing
system [20] and has a direct effect on miners’ health and safety, we assigned priority

34
levels. Interrupts coming from fans and sensors are given the highest priority. Follow-
ing this, signals coming from amplifiers have precedence over PSU interrupts. In our
protocol we use the interrupt mode and the priority levels to implement ventilation
on demand.
All of the above modes are fully accessible by the operator in the control room.
Via the simple DSP the operator can fully control the diagnostic system; poll nodes
to read their data, poll a specific node, change the configuration of some nodes, and
troubleshoot any network problems.
3.3 Communication Protocol
A similar protocol is the RFID communication protocol. There are several RFID
communication protocols that are already being used [17, 12, 10, 3]. Comparing be-
tween these protocols and building about their results we made our diagnostic system
communication protocol.
The diagnostic system protocol is based on point-to-point communications. There is
a single shared channel which is the leaky feeder. The communication will happen
between DRU and one DTU at a time. There are four distinct RF bands in the
leaky feeder system; these bands are required to provide RF paths for voice and data
communication [7].
In our protocol we consider the voice bands only. We use one voice channel for
the upstream and one voice channel for the downstream to carry the messages. Par-
ticulars for the band include: Downstream voice band of 155-158 MHz, upstream
voice band of 172-175 MHz, and the bandwidth of the channel is 25KHz. Frequency

35
Table 3.3: Communication Protocol SpecificationsData Rate 19.2 KbpsBandwidth 25 KHzDownstream Frequency 155-158 MHz (tunable)Upstream Frequency 172-175 MHz (tunable)Modulation FSK
Figure 3.4: General Message Format
modulation is preferred in the leaky feeders due to its continuous nature in the time
domain, therefore, we used FSK modulation technique.
This Diagnostic system doesn’t require a high data rate since it is not a time
sensitive application, so we used 19.2 Kbps. Table 3.3 shows the communication pro-
tocol specifications. The protocol runs in the following three different modes: self
configuration, normal mode (read-write), and interrupt. Self configuration and nor-
mal mode are initiated by the operator in the control room while the interrupt is
initiated automatically from any DTU. General message format is shown in Figure
3.4 and consists of the following fields.
• Preamble bits: indicates the start of the frame and used for synchronization
between transmitter and receiver. Formed of 16 bits of alternating ones and
zeros 1010101010.

36
• Source address: 8 bits indicating the address of the transmitter i.e. system can
have 256 nodes in total.
• Destination address: 8 bits indicating the address of the receiver i.e. total of
256 nodes can be supported.
• Control: 8 bits
– Bits 0-1: Device type: PSU=00, Amplifier=11, fan and sensor=10
– Bits 2-4: Represents the type of the message as shown in Table 3.4.
Table 3.4: Bits 2-4 of the Control FieldMessage ValueRRES 000ACK SET D 111SET D 100REQ 010WRITE DATA 001READ DATA 011ACK 101INT 110
– Bit 5-6: set RF killer/ current RF killer status, RF killer off= 00, RF killer
on =11.
– Bit 7: reserved
• Priority: 2 bits indicate the importance of the message.
– Low priority= 00
– Normal priority-PSU= 01
– Medium priority-amplifiers= 10

37
– High priority-fans and sensors=11
• Reserved: 8 bits reserved for future use
• Data: It is the payload.
For normal mode-read cycle: Data consists of nine bytes containing information
about amplifier, and in case of PSU it is eight bytes of information, and four
bytes of information in case of fans and sensor. For normal mode-write cycle:
Data represents the information required to program the node. Four bytes are
used in case of amplifier and three bytes for the case of PSU and fans and
sensors.
• CRC: 16 bits Cyclic Redundancy Check, Preamble bits are not used in the
calculation of the CRC bytes. Using the code word.
C(x) = x16 + x15 + x2 + 1 (3.3.1)
3.3.1 Self Configuration
This mode must be run after commissioning the network and whenever any changes
happen to the mine i.e. adding a new section or closing a current section in the mine.
This mode allows detecting the network layout in terms of number of nodes, their
type and location as well as detecting the losses between nodes. This is made possible
by sending pilot signals with known values from DRU to each DTU.
On the downstream the DRU will send two pilot signals which will suffer attenua-
tion by the time they reach the DTU node. From this attenuation and using complex

38
algorithm DTU can calculate the slope and estimate the distance between itself and
the DRU, losses in between, and the existence of any splitters between them as well.
Figure 3.5 shows pilot signals at DRU and DTU.
Figure 3.5: Self Configuration Pilot Signal at DRU and the Attenuated Version atDTU
RF killer should be added to the output of all downstream DTU’s as it will stop
the pilot signal from propagating further till the losses and distance between the DRU
and DTU communicating to it are calculated. Figure 3.6, shows the RF killer in the
downstream direction. DTU’s will have a flag ”D”
• D = 0 RF killer off. i.e. signals can pass
• D = 1 RF killer on. i.e. signals are blocked
Self configuration methodology:
• DRU broadcasts the message (SET D) to all nodes to set RF killer on.
• RF killer stops the propagation of signals to any further nodes.
• DRU start communicating with the first DTU by sending two pilot signal with
known values at frequency (f1) and frequency (f2).

39
Figure 3.6: RF killer in place on the downstream
• DTU records the values of the pilot signal received and sends them back to the
DRU along with the node type using the (RRES) message. Knowing the value
of the sent pilot signal and the received pilot at DTU, DRU will run algorithm
to estimate distance between the nodes and losses in the leaky. This information
is sent to the amplifier to set the gain.
• DRU sends a message to acknowledge and set the RF killer off in order to start
communicating with the next node using the message (ACK SET D).
• DRU updates its database by adding all information about this node.
• DRU repeats the same sequence with the following nodes till all nodes are done.
System loss in each cable section, Ln,m, can be calculated by
Ln,m = CLn,m(xn, fm) + ILn (3.3.2)
Ln,m: Total system loss in one section of cable, n, at frequency band m, this is
the value detected at DTU.
CLn,m: Longitudinal cable loss in one section, its function of cable length xn and

40
frequency fm.
ILn: Insertion loss installed on section n.
n: Number of cable section.
m: Band number in the system.
CLn,m: The cable loss per meter at certain frequency, which can be obtained from
the cable manufacturer’s data sheet or by sweep test.
Considering a section, n, of the leaky feeder cable where two pilot signals are sent
from DRU to DTU at frequencies f1, and f2, respectively. Losses in this section at
both frequencies are:
Ln,1 = Pilot1 −Rxn,1 = CLn,1(xn, f1) + ILn (3.3.3)
Ln,2 = Pilot2 −Rxn,2 = CLn,2(xn, f2) + ILn (3.3.4)
Rxn,m: Pilot value as received and recorded at DTU cable section, n, at frequency
m.
Obtaining cable loss CLn,m at f1 and f2 using data sheet or sweep test we can
develop a relation between them called Rd. Figure 3.7 shows the data sheet that we
used in our calculations.
Rd =CLn,1
CLn,2
(3.3.5)
From equation 3.3.3 and 3.3.5
IL = Ln,1 −Rd.CLn,2(xn, f2) (3.3.6)

41
Figure 3.7: Leaky Cable Longitudinal Loss Chart
using equations 3.3.4 and 3.3.6
Ln,2 = CLn,2(xn, f2) + Ln,1 −Rd.CLn,2(xn, f2) (3.3.7)
Ln,2 = CLn,2(xn, f2).[1−Rd] + Ln,1 (3.3.8)
CLn,2(xn, f2) =Ln,2 − Ln,1
[1−Rd](3.3.9)
and, from equation 3.3.4
IL = Ln,2 − CLn,2(xn, f2) (3.3.10)
Thus, using equations 3.3.8, 3.3.9, and 3.3.10
IL = Ln,2 − Ln,2 − Ln,1
[1−Rd](3.3.11)
Insertion loss (IL) is a result of splitters installed along the leaky feeder cable. These
splitters cause a fixed signal drop by 3.5 dB per splitter. Thus, number of splitters

42
Figure 3.8: Self Configuration Message Sequence
can be given by
numberofsplitters =IL
3.5(3.3.12)
Length of each section is calculated using
Cablelength(persection) =CLn,2(xn, f2)
CLn,2
(3.3.13)
Running this algorithm detects the number and type of nodes in each section of the
network, and also the length, number of splitters, and losses in each section of the
leaky feeder cable. Using this information it is easy to recognize the network layout
and visualize it in a GUI using the DSP at the control room above ground. Self
configuration message sequence is shown in Figure 3.8.

43
Figure 3.9: SET D Message Format
The messages sent and received in the self configuration mode are as follow:
SET D message
Purpose: broadcast message to all DTU’s setting their RF killer on. Stop pilot signal
from propagating until communication between DRU and that specific DTU is over.
Message format is shown in Figure 3.9
• Preamble: 16 bits for synchronization and indicating the start of the frame
• Control: 8 bits
– Bits 0-1: Not used
– Bits 2-4: Represents the type of the message as shown in Table 3.4. Here,
it is a SET D message with the value SET D=100
– Bit 5-6: RF killer setting, set flag D: (RF killer off D=0) = 00, (RF killer
on D=1) = 11. In this case it’s RF killer on =11
– Bit 7: reserved
• Reserved: 8 bits reserved for future use
• CRC: 16 bits check sum. Preamble bits are not included in the calculation
RRES: Route Response message

44
Purpose: sending the values of Pilot 1 and pilot 2 as received by DTU, also sending
status of air and fan sensors.
Figure 3.10: RRES Message Format
• Preamble: 16 bits for synchronization and indicating the start of the frame
• PILOT Reply: 2 bytes representing the recorded loss. byte 1: total loss at f1,
byte 2: total loss at f2
• Status: 4 bits represent sensor and fan status, 2 bits for each
– Bits 0-1: sensor status: Sensor off/ no sensor =00, normal air quality=
01, medium air quality (acceptable value of pollutants) =10, high level of
pollutants=11
– Bits 2-3: Fan status: Fan off/no fan=00, fan on, low speed=01, fan on
medium speed=10, fan on high speed=11
• Control: 8 bits
– Bits 0-1: device type: PSU = 00, Amplifier = 11, fan and sensor=10
– Bits 2-4: Represents the type of the message as shown in Table 3.4. Here,
it is a RRES message with the value RRES=000

45
– Bit 5-6: current RF killer status, (RF killer off D=0) = 00, (RF killer on
D=1) = 11. In this case it’s RF killer on =11
– Bit 7: reserved
• Reserved: 8 bits reserved for future use
• CRC: 16 bits check sum. Preamble bits are not included in the calculation
ACK SET D message
Purpose: DRU acknowledge the recipient of the data, and turning the RF killer off
to allow pilot signal propagate further and poll different DTU’s.
Figure 3.11: ACK SET D Message Format
• Preamble: 16 bits for synchronization and indicating the start of the frame.
• Control: 8 bits
– Bits 0-1: device type: PSU = 00, Amplifier = 11, fan and sensor=10
– Bits 2-4: Represents the type of the message as shown in Table 3.4. Here,
it is a ACK SET D message with the value ACK SET D=100
– Bit 5-6: RF killer setting, set flag D: (RF killer off D=0) = 00, (RF killer
on D=1) = 11. In this case it’s RF killer off =00
– Bit 7: reserved

46
• Reserved: 8 bits reserved for future use
• CRC: 16 bits check sum. Preamble bits are not included in the calculation
In order to overcome software problems like hanging, and malfunctioning we pro-
pose a watch-dog-like program at the microprocessor of each node. After the node
transmits a message it waits for a Maximum Time to Wait (MTW). If it does not
receive any response then the message is retransmitted and the node waits for MTW.
If a response is not received within this second MTW we assume a problem occurred
and an alarm is sent to the control room.
Figure 3.12, shows the self configuration operation mode. DRU and DTU subrou-
tines are shown at Figures 3.13 and 3.14, respectively.

47
Figure 3.12: Self Configuration Operation Mode

48
Figure 3.13: DRU Flowchart

49
Figure 3.14: DTU Flowchart

50
3.3.2 Normal Mode
This mode can do both read and write cycles. It enables DRU to send writing data
to any DTU to change parameters of attached amplifier, PSU, fans, and sensors. It
can also perform read cycle which enables DRU to poll all DTU’s in sequence and
read data stored into them which was extracted earlier from amplifier, PSU, fans,
and sensors attached.
This mode will not work unless the self configuration mode runs first because it
requires information about the number of nodes and their type.
The two cycles are:
Write Cycle
Write cycle occurs when the operator needs to program a node without sending a
technician underground. The commands are sent in the data field. For amplifiers the
DRU can program the amplifier gain for the upstream and downstream voice channels
as well as the amplifier gain for the data channel. In case of PSU the DRU can switch
the power on or off and switch between primary battery and pack up battery. For
fans and sensors the DRU is able to switch the fan on or off in addition to increasing
or decreasing fan speed.
As shown in Figure 3.15, the write cycle happens as follows:
• DRU identifies the DTU it wishes to program and starts communicating to
it by sending (WRITE) message, the data field carries the information to be

51
programmed.
• DTU receives the message, extracts the data, and using the micro processor
it will program the attached node. When done it will reply back with (ACK)
message to the DRU.
Figure 3.15: Normal Mode- Write Cycle Message Sequence
The messages sent and received in the Normal mode. Write cycle are as follow:
WRITE message
Purpose: write data to a specific DTU. i.e. change parameters of amplifier, PSU, Fan
and Sensor.
• Preamble: 16 bits for synchronization and indicating the start of the frame
• Source address: 8 bits indicating the message origin. Here it will be DRU
address. 8 bits means that the system supports maximum 256 nodes.

52
Figure 3.16: Format of WRITE Message
• Destination address: 8 bits indicating the receiver address. Here it will be the
intended DTU. 8 bits means that the system supports maximum 256 nodes.
• Control: 8 bits
– Bits 0-1: device type: PSU = 00, Amplifier = 11, fan and sensor=10
– Bits 2-4: Represents the type of the message as shown in Table 3.4. Here,
it is a WRITE DATA message with the value WRITE DATA=001
– Bit 5-7: reserved
• Priority: 2 bits indicate the importance of the message, if more than one message
sent they are held in sequence and the message with higher priority is handled
first.
– Low priority= 00
– Normal priority ”default” here we will set it for PSU= 01
– Medium priority, we will set it for amplifiers= 10
– High priority, we will set it for fans and sensors=11
• Data: 4 bytes as shown in Table 3.5
• Reserved: 8 bits reserved for future use

53
Table 3.5: Data Configured During the Write CycleWrite Cycle
Amplifier Battery Fan and sensorByte 1 Amplifier Gain #1 ON/OFF Fan ON/OFFByte 2 Amplifier Gain #2 Switch (Primary/ backup) Increase/ decrease fan speedByte 3 Amplifier Gain #3 Reserved ReservedByte 4 Reserved - -
• CRC: 16 bits check sum. Preamble bits are not included in the calculation
ACK: Acknowledge message
Purpose: DRU informs DTU that it received the message and terminates connection.
Figure 3.17: Format of ACK Message
• Preamble: 16 bits for synchronization and indicating the start of the frame.
• Source address: 8 bits indicating the message origin, here it will be DTU origi-
nator address. 8 bits means that the system supports maximum 256 nodes.
• Destination address: 8 bits indicating the receiver address, here it will be DRU.
8 bits means that the system supports maximum 256 nodes.
• Control: 8 bits
– Bits 0-1: device type: PSU = 00, Amplifier = 11, fan and sensor=10

54
– Bits 2-4: Represents the type of the message as shown in Table 3.4. Here,
it is a WRITE DATA message with the value ACK=101
– Bit 5-7: reserved
• Priority: 2 bits indicate the importance of the message. If more than one
message is sent they are held in sequence and the message with higher priority
is handled first.
– Low priority= 00
– Normal priority ”default” here we will set it for PSU= 01
– Medium priority, we will set it for amplifiers= 10
– High priority, we will set it for fans and sensors=11
• Reserved: 8 bits reserved for future use.
• CRC: 16 bits check sum. Preamble bits are not included in the calculation.
Read Cycle
Read cycle is when the DRU is reading information from DTU. For amplifiers it will
read the RF level and amplifier gain for the up and downstream voice channels and
the data channel as well as reading the amplifier DC voltage and current. For PSU
it will read DC and AC voltages, and DC current, temperature, hours of operation,
and backup battery status. In fans and sensors; air quality, status of fan in addition
to fan speed will be read. DRU will poll all DTU’s in order to read their information.
Figure 3.18, shows the reading operation.
• DRU contacts the first DTU by sending to it a request to read (REQ) message.
55
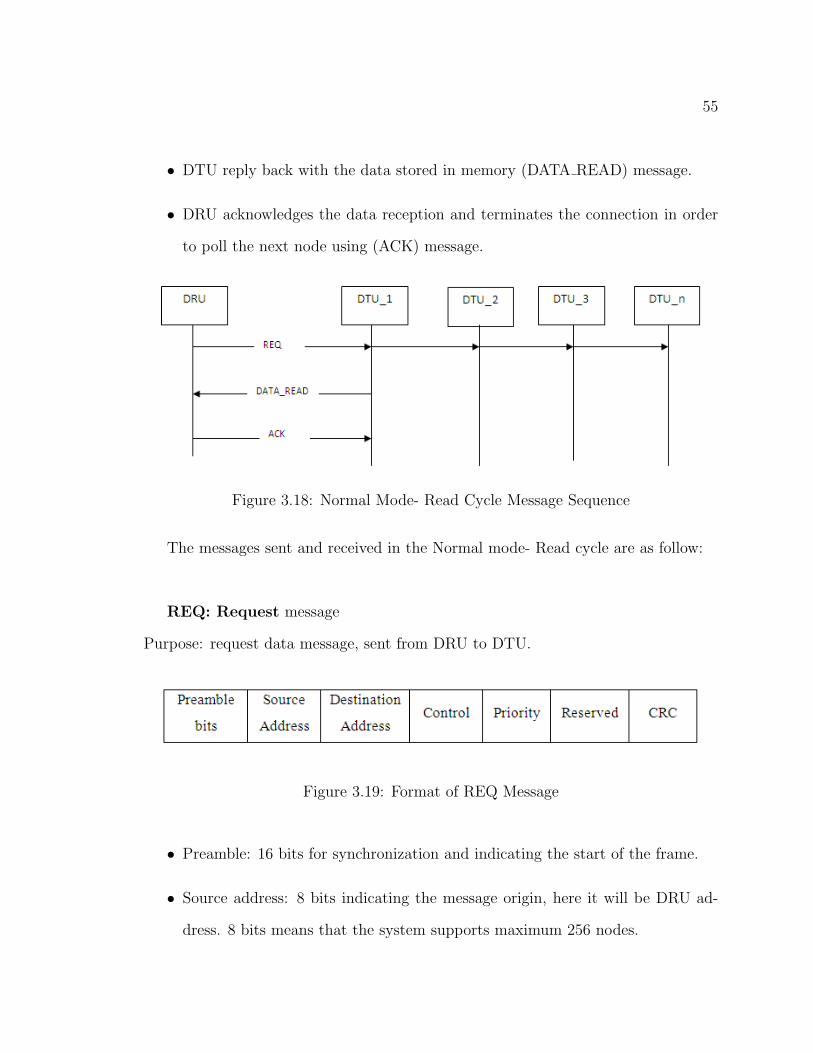
• DTU reply back with the data stored in memory (DATA READ) message.
• DRU acknowledges the data reception and terminates the connection in order
to poll the next node using (ACK) message.
Figure 3.18: Normal Mode- Read Cycle Message Sequence
The messages sent and received in the Normal mode- Read cycle are as follow:
REQ: Request message
Purpose: request data message, sent from DRU to DTU.
Figure 3.19: Format of REQ Message
• Preamble: 16 bits for synchronization and indicating the start of the frame.
• Source address: 8 bits indicating the message origin, here it will be DRU ad-
dress. 8 bits means that the system supports maximum 256 nodes.

56
• Destination address: 8 bits indicating the receiver address, here it will be DTU.
8 bits means that the system supports maximum 256 nodes.
• Control: 8 bits
– Bits 0-1: device type: PSU = 00, Amplifier = 11, fan and sensor=10
– Bits 2-4: Represents the type of the message as shown in Table 3.4. Here,
it is a REQ message with the value REQ=010
– Bit 5-7: reserved
• Priority: 2 bits indicate the importance of the message, if more than one message
sent they are held in sequence and the message with higher priority is handled
first.
– Low priority= 00
– Normal priority ”default” here we will set it for PSU= 01
– Medium priority, we will set it for amplifiers= 10
– High priority, we will set it for fans and sensors=11
• Reserved: 8 bits reserved for future use.
• CRC: 16 bits check sum. Preamble bits are not included in the calculation.
DATA READ message
Purpose: read data from specific DTU. i.e. change parameters of amplifier, PSU, fan
and sensor.
• Preamble: 16 bits for synchronization and indicating the start of the frame.

57
Figure 3.20: Format of DATA READ Message
• Source address: 8 bits indicating the message origin, here it will be DTU origi-
nator address. 8 bits means that the system supports maximum 256 nodes.
• Destination address: 8 bits indicating the receiver address, here it will be the
intended DRU. 8 bits means that the system supports maximum 256 nodes.
• Control: 8 bits
– Bits 0-1: device type: PSU = 00, Amplifier = 11, fan and sensor=10
– Bits 2-4: Represents the type of the message as shown in Table 3.4. Here,
it is a READ DATA message with the value READ DATA=011
– Bit 5-7: reserved
• Priority: 2 bits indicate the importance of the message, if more than one message
sent they are held in sequence and the message with higher priority is handled
first.
– Low priority= 00
– Normal priority ”default” here we will set it for PSU= 01
– Medium priority, we will set it for amplifiers= 10
– High priority, we will set it for fans and sensors=11

58
Table 3.6: Data Read During Read CycleRead Cycle
Amplifier Battery Fan and sensorByte 1 RF level #1 DC voltage Air quality (sensor)Byte 2 RF level #2 DC current ON/OFF (fan)Byte 3 RF level #3 AC voltage fan speedByte 4 Amplifier gain #1 Temperature ReservedByte 5 Amplifier gain #2 Hours of operation -Byte 6 Amplifier gain #3 Battery voltage -Byte 7 Amplifier DC voltage Battery backup status -Byte 8 Amplifier DC current Reserved -Byte 9 Reserved - -
• Data: 9 bytes as shown in Table 3.6
• Reserved: 8 bits reserved for future use
• CRC: 16 bits check sum. Preamble bits are not included in the calculation
ACK: Acknowledge message
Purpose: DRU informs DTU that it received the message and terminates connection.
It is the same ACK in Figure 3.17, with the below specifications.
• Preamble: 16 bits for synchronization and indicating the start of the frame.
• Source address: 8 bits indicating the message origin, here it will be DTU origi-
nator address. 8 bits means that the system supports maximum 256 nodes.
• Destination address: 8 bits indicating the receiver address, here it will be DRU.
8 bits means that the system supports maximum 256 nodes.
• Control: 8 bits
– Bits 0-1: device type: PSU = 00, Amplifier = 11, fan and sensor=10
59
– Bits 2-4: Represents the type of the message as shown in Table 3.4. Here,
it is a ACK message with the value ACK=101
– Bit 5-7: reserved
• Priority: 2 bits indicate the importance of the message, if more than one message
sent they are held in sequence and the message with higher priority is handled
first.
– Low priority= 00
– Normal priority ”default” here we will set it for PSU= 01
– Medium priority, we will set it for amplifiers= 10
– High priority, we will set it for fans and sensors=11
• Reserved: 8 bits reserved for future use.
• CRC: 16 bits check sum. Preamble bits are not included in the calculation.
Figures 3.21 and 3.22, shows the Write and Read mode sequence, respectively.
3.3.3 Interrupt Mode
There modes give the DTU more freedom and intelligence as of when to contact the
DRU. It often happens that the DTU have an important message to send to DRU
i.e. alarm, so it shouldn’t wait for its turn to be polled. Depending how important
this message is it can interrupt the DRU process and communicate this message.
If more than one DTU attempts to interrupt the DRU process, the DRU will han-
dle them according to the priorities which are pre-assigned to them. In our system we

60
Figure 3.21: Write Mode Sequence
Figure 3.22: Read Mode Sequence

61
assume the interrupts coming from fans and sensor have the highest priority. This is
mainly due to the fact that fans and sensors functionality directly affects the health
and safety of miners, as high pollutants in the mine environment may lead to cases
of severe illness and death among miners. The second priority level was assigned to
interrupts from amplifiers. Amplifier failure will cause an outage in the underground
network and will disrupt not only voice but all other services as well. Third priority
level was given to PSU since they are usually robust and has back-ups. Fourth pri-
ority level exists but it is reserved for future use.
More on Interrupt mode can be found in the next chapter (Chapter 4: Ventilation
on Demand). A the Interrupt mode is the foundation layer for the Ventilation-on-
Demand.

Chapter 4
Ventilation-on-Demand
4.1 Introduction
Ventilation is a very important aspect in mines as it directly affects the health and
safety of miners. Accumulation of poisonous gasses and particles in mines can cause
serious illness to mines and explosions underground. Trying to cut down their cost
in such economy and become more environmentally responsible, mining companies
found that ventilation counts for a huge portion of their energy consumption. Venti-
lation on demand is a hot topic that has been newly researched by mining companies
for the last few years.
Ventilation in mines happens by circulating air from above ground to underground.
This method keeps fresh air flowing into the mine from above ground and pushing
the air underground - which contain gases and dust- out of the mine. The mine
ventilation system is made of three main components:
1. Main ventilation system and fans
2. Level ventilation system and control
62

63
3. Auxiliary systems and fans
The main ventilation system and fans will bring the fresh air from above ground
to underground. It keeps working 24/7 non-stop to secure mine air needs. Then aux-
iliary systems and fans take air to serve specific areas in the mines. Each auxiliary
system and fans is responsible for a certain area i.e. a mine gallery at a certain level.
Switching off this auxiliary system doesn’t affect the main ventilation system and fans.
Currently, in all mines the fan’s auxiliary systems are always on. Either this mine
gallery has miners working in it or not. This results in huge energy waste as miners
are not working in all mine galleries at the same time, While energy is very limited
and expensive underground.
Our idea here is to switch the fans on/off and increase/decrease their speed ac-
cording to mine needs. No extra hardware is required since we are going to use the
diagnostic system explained earlier in Chapter 3, which makes use of the already
existing infrastructure of leaky feeders.
4.2 Ventilation on Demand Using Diagnostic Sys-
tem
It is the power saving feature that is built on top of interrupts. Ventilation network
in mines serve the critical task of maintaining a low concentration of explosives or
poisonous gases. It is such important equipment for safety that it will be a huge
threat to safe production if it does not meet the needs of mine production for some

64
reason [20]. Due to the objective of controlling fluid flow, mine ventilation networks
are high-order nonlinear systems [8]. Some models were developed for ventilation
networks, however; the idea of ventilation on demand was hardly tackled before.
It is a novel idea that will help cut the operation expenses and attain huge power
savings. In most mines the ventilation fans are kept on 24 hours a day in all sections
whether miners are working in these sections or not. Ventilation is responsible for
about 60% of power consumed in a mine which drains the limited resource of elec-
tricity.
This problem is solved by using the currently available sensors and fans in mines
and attaching to each of them a DTU. Sensors and fans will keep track of the pol-
lutant levels in air and temperature as well. Whenever temperature and/or level of
toxic gases in this section hits a predefined threshold DTU attached to this sensor
and fan will interrupt DRU resulting in the fans being turned on and/or in increasing
the fan speed. Then during the normal reading polling cycle if the DRU reads low or
normal pollutant level the fans can be turned off and/or their speed decreased.
4.3 Interrupt
At any time the DTU can interrupt the process of the DRU to send to it an important
message. Messages will have different priority levels depending on their source i.e.
amplifier, PSU, fan, and sensor. The interrupt process is shown in Figure 4.1 and is
described as follows:

65
• DTU sends out interrupt (INT) message containing information about the node,
• DRU pauses current process, and checks type of interrupt also check priority if
more than one interrupt,
• DRU replies with (WRITE) message, then goes back and resumes the current
process.
Figure 4.1: Interrupt Message Sequence
If more than one interrupt is received at the same time, the DTU handles the
highest priority first while all other priorities are being queued in sequence accord-
ing to their priority level. Furthermore, in case more than one interrupt is received
with the same priority level then the DRU handles the interrupt with lower penalty.
Penalty is defined as the time the DRU takes to stop communicating with the current
DTU and establish communication with the DTU that issued the interrupt. In our
protocol we assumed a correlation between the physical location of the DTU that is-
sued the interrupt and the location of the DTU currently communicating with DRU.
For example, if DRU is currently communicating with a DTU (DTU #1) and two
DTU’s issue interrupts (DTU #2 and DTU #3). If distance between DTU #2 and
DTU #1 is 300 meters while the distance between DTU #3 and DTU #1 is 1200

66
meters, then DTU #3 has higher penalty. Thus, interrupt coming from DTU #2
would be handled first.
The messages sent and received in the Interrupt mode are as follow:
INT: Interrupt message
Purpose: DTU initiates the interrupt message any time to send any important mes-
sage to the DRU. Generally, if there is an alarm DTU shouldn’t wait for its turn to
communicate rather it just interrupts and the DRU handles it.
Figure 4.2: Interrupt Message Format
• Preamble: 16 bits for synchronization and indicating the start of the frame.
• Source address: 8 bits indicating the message origin. Here it will be DTU
originator address. 8 bits means that the system supports maximum 256 nodes.
• Destination address: 8 bits indicating the receiver address. Here it will be the
intended DRU. 8 bits means that the system supports maximum 256 nodes.
• Control: 8 bits
– Bits 0-1: device type: PSU = 00, Amplifier = 11, fan and sensor=10
– Bits 2-4: Represents the type of the message as shown in Table 3.4. Here,
it is a INT message with the value INT=110

67
– Bit 5-7: reserved
• Priority: 2 bits indicate the importance of the message, if more than one message
sent they are held in sequence and the message with higher priority is handled
first.
– Low priority= 00
– Normal priority ”default” here we will set it for PSU= 01
– Medium priority, we will set it for amplifiers= 10
– High priority, we will set it for fans and sensors=11
• Data: 9 bytes as shown in 4.1
Table 4.1: Data Read During Interrupt Mode-Read MessageRead Cycle
Amplifier Battery Fan and sensorByte 1 RF level #1 DC voltage Air quality (sensor)Byte 2 RF level #2 DC current ON/OFF (fan)Byte 3 RF level #3 AC voltage fan speedByte 4 Amplifier gain #1 Temperature ReservedByte 5 Amplifier gain #2 Hours of operation -Byte 6 Amplifier gain #3 Battery voltage -Byte 7 Amplifier DC voltage Battery backup status -Byte 8 Amplifier DC current Reserved -Byte 9 Reserved - -
• Reserved: 8 bits reserved for future use
• CRC: 16 bits check sum. Preamble bits are not included in the calculation
WRITE message
Purpose: For DRU to write data to specific DTU. i.e. change parameters of amplifier,

68
PSU, fan, and sensor.
It is the same WRITE message in Figure 3.16, with the below specifications.
• Preamble: 16 bits for synchronization and indicating the start of the frame
• Source address: 8 bits indicating the message origin. Here it will be DRU
address. 8 bits means that the system supports maximum 256 nodes.
• Destination address: 8 bits indicating the receiver address. Here it will be the
intended DTU. 8 bits means that the system supports maximum 256 nodes.
• Control: 8 bits
– Bits 0-1: device type: PSU = 00, Amplifier = 11, fan and sensor=10
– Bits 2-4: Represents the type of the message as shown in Table 3.4. Here,
it is a WRITE DATA message with the value WRITE DATA=110
– Bit 5-7: reserved
• Priority: 2 bits indicate the importance of the message, if more than one message
sent they are held in sequence and the message with higher priority is handled
first.
– Low priority= 00
– Normal priority ”default” here we will set it for PSU= 01
– Medium priority, we will set it for amplifiers= 10
– High priority, we will set it for fans and sensors=11
• Data: 4 bytes as shown in Figure 4.2

69
Table 4.2: Data Configured During the Write Cycle-Interrupt ModeWrite Cycle
Amplifier Battery Fan and sensorByte 1 Amplifier Gain #1 ON/OFF Fan ON/OFFByte 2 Amplifier Gain #2 Switch (Primary/ backup) Increase/ decrease fan speedByte 3 Amplifier Gain #3 Reserved ReservedByte 4 Reserved - -
• Reserved: 8 bits reserved for future use
• CRC: 16 bits check sum. Preamble bits are not included in the calculation
Figure 4.3: Interrupt Mode Sequence

Chapter 5
Performance Evaluation
5.1 Introduction
Evaluation for the DS and its communication protocol is presented in this chapter.
Here, we use simulations to prove the high performance and efficiency of the system.
Under regular mine conditions we calculate SNR, delay, wake up time for each node,
and throughput. Also two distinguished types of errors that affect communications
in mines and may degrade the performance of the DS are investigated here: Compo-
nents Tolerance Error (CTE) and Gain Estimation Error (GEE).
For simulation purposes, we consider a typical leaky feeder channel which is mod-
eled as a coaxial cable with mine errors and distortion in addition to white noise. For
errors and noise we used pre-measured values from a standard mine gallery.
Propagation delay in leaky feeders depends on capacitance and inductance. These
can be obtained using Vector Network Analyzer (VNA) or from the manufacturer
data sheet. In our simulation we assumed a standard 7/8” low loss dielectric leaky
70

71
feeder cable with inductance L=0.185 µH/m and capacitance C=74 pF/m. This is a
standard leaky feeder cable widely used in current systems in mines. Using equation
5.1.1 delay in leaky cable is calculated. It is found that Delay=3.7 nsec/m.
Delay =√
L ∗ C (5.1.1)
System size (S), is defined as the number of active DTU’s in the mine. Active
DTU’s are those attached to amplifiers, PSU, fans, and sensors and are in working
condition. Considering the system configuration in Table 5.1, SNR = −22.
Table 5.1: System ConfigurationSystem Size (S) Amplifiers PSU Fans and sensors256 105 63 88
In our efforts to prove the ability of the self configuration mode to detect the
network layout and to calculate losses in the system we used the following system
setup in Figure 5.1.
In Figure 5.1, n represent section number. We experimentally measured actual values
and compared them with Matlab simulation output. The simulation results were
almost identical to the measured values as shown in Tables 5.2 and 5.3. It was found
that the self configuration mode algorithm was able to detect the network layout
correctly in terms of number of nodes, distance between nodes, number of splitters,
and losses.

72
Figure 5.1: Leaky Feeder System Setup
5.2 Wake up Time
Using simulations we calculate the percentage of wake up time to the total time of
each DTU. This show how long is the DTU in sleep mode compared to wake up mode
which gives a good indication of power consumption. Figure 5.2, shows the time each
node will stay awake compared to the total cycle time in case of self configuration
mode. We notice that when the system size S is around 100 nodes each node will be
awake for about 0.9% of the total cycle time. We also notice that DTU’s connected
to amplifiers, PSUs, fans, and sensors will exhibit similar behavior due to the nature
of self configuration mode that the DRU is sending the same messages of the same
length to all nodes in order to discover the network layout.
Wake up time to the total time for the Normal mode- writing cycle case is shown
in Figure 5.3. From that Figure it is noticed that the percentage of wake up time
for both PSU, and fans and sensors are almost identical but is higher for amplifiers.

73
Table 5.2: Measured Values vs. Simulation Results part 1/2Downstream upstream
Section, n parameter measured calculated measured calculated
n=1
Cable length (meters) 300 302 300 301Cable loss (dB) -13.71 -13.74 -13.97 -13.72Insertion loss (dB) -3.5 -3.51 -3.5 -3.501Number of splitters 1 1 1 1Total section loss (dB) -17.21 -17.25 -17.47 -17.201
n=2
Cable length (meters) 200 199.3 200 198.9Cable loss (dB) -9.14 -8.981 -9.31 -8.87Insertion loss (dB) -7 -7.1 -7 -7.03Number of splitters 2 2 2 2Total section loss (dB) -16.14 -16.081 -16.31 -15.9
n=3
Cable length (meters) 280 278.2 280 279.03Cable loss (dB) -12.8 -12.31 -13.04 -13.15Insertion loss (dB) -3.5 -3.5 -3.5 -3.5Number of splitters 1 1 1 1Total section loss (dB) -16.3 -15.81 -16.54 -16.2
n=4
Cable length (meters) 260 261 260 261.7Cable loss (dB) -11.8 -11.1 -12.11 -11.98Insertion loss (dB) -3.5 -3.52 -3.5 -3.4Number of splitters 1 1 1 1Total section loss (dB) -15.3 -14.62 -15.61 -15.18
n=5
Cable length (meters) 260 259.01 260 258.94Cable loss (dB) -11.8 -11.01 -12.11 -11.61Insertion loss (dB) 0 0 0 0Number of splitters 0 0 0 0Total section loss (dB) -11.88 -11.01 -12.11 -11.61
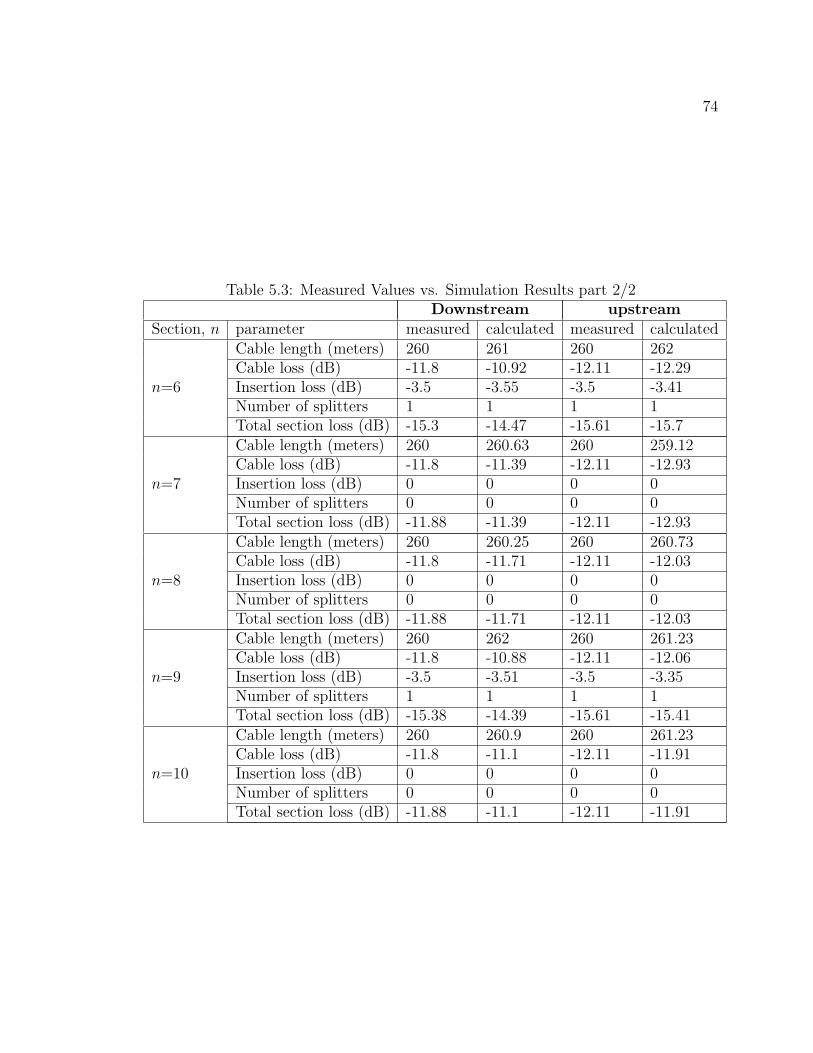
74
Table 5.3: Measured Values vs. Simulation Results part 2/2Downstream upstream
Section, n parameter measured calculated measured calculated
n=6
Cable length (meters) 260 261 260 262Cable loss (dB) -11.8 -10.92 -12.11 -12.29Insertion loss (dB) -3.5 -3.55 -3.5 -3.41Number of splitters 1 1 1 1Total section loss (dB) -15.3 -14.47 -15.61 -15.7
n=7
Cable length (meters) 260 260.63 260 259.12Cable loss (dB) -11.8 -11.39 -12.11 -12.93Insertion loss (dB) 0 0 0 0Number of splitters 0 0 0 0Total section loss (dB) -11.88 -11.39 -12.11 -12.93
n=8
Cable length (meters) 260 260.25 260 260.73Cable loss (dB) -11.8 -11.71 -12.11 -12.03Insertion loss (dB) 0 0 0 0Number of splitters 0 0 0 0Total section loss (dB) -11.88 -11.71 -12.11 -12.03
n=9
Cable length (meters) 260 262 260 261.23Cable loss (dB) -11.8 -10.88 -12.11 -12.06Insertion loss (dB) -3.5 -3.51 -3.5 -3.35Number of splitters 1 1 1 1Total section loss (dB) -15.38 -14.39 -15.61 -15.41
n=10
Cable length (meters) 260 260.9 260 261.23Cable loss (dB) -11.8 -11.1 -12.11 -11.91Insertion loss (dB) 0 0 0 0Number of splitters 0 0 0 0Total section loss (dB) -11.88 -11.1 -12.11 -11.91

75
Figure 5.2: Percentage of DTU Wake up Time to Total Time for Different SystemSizes- Self Configuration Mode

76
Figure 5.3: Percentage of DTU Wake up Time to Total Time for Different SystemSizes- Normal Mode- Write Cycle
The difference in percentages is due to amplifier messages being longer than the other
messages sent to PSU or fans and sensors.
Figure 5.4, shows the time each node will stay awake compared to the total time
of a complete reading cycle, when the DRU polls all DTUs. Again we notice that the
amplifiers wake up time is longer than other nodes due to the longer messages used
in case of amplifiers compared to PSU or fans and sensors.
For interrupt mode we show the penalty paid compared to the system size, S. In
Figure 5.5, the S = 256 and 82 random interrupts are coming from random nodes at
different times. As described earlier, penalty can be defined as extra time to handle

77
Figure 5.4: Percentage of DTU Wake up Time to Total Time for Different SystemSizes- Normal Mode- Read Cycle

78
Figure 5.5: Extra Processing Time for Different System Sizes- Interrupt Mode
the interrupt. From Figure 5.5, maximum penalty is 47% extra processing time.
Penalty= Total time- Cycle execution time with no interrupts
5.3 End-to-End Delay and Throughput
Another important parameter is end-to-end delay which is extremely important as
it indicates the overall response of the system. The operator does not want to wait
so long to collect some critical information. The end-to-end delay was calculated for
one hour period where we assumed that self configuration mode ran at the beginning
then the writing mode took place for 10 minutes where we kept writing to nodes in a
random manner, and for the rest of the hour DRU was polling DTU’s in sequence to

79
Figure 5.6: Average End-to-End Delay in the Network Over One Hour
read their data. Figure 5.6 shows that the average end-to-end delay is in the range
of tens of milliseconds which is acceptable for underground mine applications.
Under the same circumstances we calculated the average throughput in the system
and the results are shown in Figure 5.7. The average throughput was found to be in
the range of few hundred bits/sec which means that the bandwidth allocated is not
fully utilized and the system still has room for more messages.

80
Figure 5.7: Average Throughput in the Network over an Hour
5.4 Component Tolerance Error (CTE)
Components Tolerances Error (CTE) is when the accumulations of components
tolerances in electronics circuits cause part or all of the circuit to operate outside its
nominal operating range [7]. The errors related to tolerance of circuit components
can be reduced if the circuits are properly calibrated during manufacturing.
However, because of the extreme harsh conditions in mines and tunnels, the com-
ponents might change after system installation especially because of temperature.
This can affect the functionality of the DS and its communication protocol. CTE
mainly affects the self configuration mode where pilot signals are used. Ignoring CTE
may result in imprecise pilot signals being sent from DRU to DTUs. Therefore, the

81
operator will get wrong information about the network layout in terms of losses, dis-
tance between nodes, number of nodes and splitters.
CTE factor (ECTE) is defined as the percentage of errors in the gains of the amplifiers
caused by CTE.
EGm = Gm.(1 + ECTE) (5.4.1)
EGm: Errored gain of the amplifier
Gm: Nominal error-free gain of the amplifier
ECTE: Component tolerance error factor
CTE in mines is usually around 2.5% which is high. In order to solve this problem
we added an additional RF detector at the output stage of the downstream nodes.
The output of the RF detectors is fed into the DTU microprocessor for comparison
with the reference pilot signal. Difference between reference pilot signal and the one
detected by the extra RF detector is calculated and used to correct the amplifier gain.
CFm = PLReference,m − PLRFdetector,m (5.4.2)
CGm = EGm + CFm (5.4.3)
CFm: Correction factor
PLReference,m: Reference pilot level at frequency, m
PLRFdetector,m: Pilot level at RF detector at frequency, m
CGm: Corrected gain of the amplifier at frequency, m
By adding Correction Factor to the amplifier’s errors gain the correct gain can
be determined. Figure 5.8 shows in blue trace the amplifier output with uniformly

82
Figure 5.8: CTE Simulation Analysis
distributed random CTE ±2.5% i.e. 5% versus corrected gain amplifier output with
red trace, assuming self configuration mode is running where the pilot signal sent is
0 dBm. From Figure 5.8 it is clear that this technique provides 100% correction for
pilot amplifier output where the corrected output is self-healed and gives 0 dBm for
all amplifiers while the output in case of no CTE correction keeps varying between ±0.5 dBm.

83
5.5 Gain Estimation Error (GEE)
The gain of any amplifier is usually set to compensate the losses in its section. How-
ever, sometimes because of faulty cables or bad installation these losses increase.
Thus, error may occur when estimating the gain which is not expected to be signifi-
cant, usually about 5% in typical mine[7].
But for big systems with large number of amplifiers these errors add up and change
the behavior of the amplifier. This change is either the output of the amplifier exceed-
ing the rated maximum output power thus saturating the amplifiers or the amplifier
output is less than the receiver sensitivity thus no signal is detected.
Here, we show that our diagnostic system is GEE-proof where the maximum
output of amplifiers is -10 dBm and the minimum output is -80 dBm, assuming a
voice signal -24 dBm and 5% GEE over 100 amplifiers. Figure 5.8, shows acceptable
system operating conditions where the amplifier output keeps oscillating within the
safe range and never exceeds the maximum -10 dBm or hits the minimum -80 dBm.
Amplifier output is shown in blue trace while voice signal power is shown in red trace.

84
Figure 5.9: GEE Simulation Analysis

Chapter 6
Conclusion and Future Work
6.1 Conclusion
Theoretical analysis was conducted to evaluate and study a complete and integrated
monitoring system for underground leaky feeder communication networks. It was
concluded that by introducing our diagnostic system along with the communication
protocol we developed, we get a novel advanced mine monitoring solution that uses
the existing infrastructure to monitor itself.
This was made possible by adding master node DRU at the leaky feeder headend
in the control room above ground and few DTU nodes that are connected to the
amplifiers, PSU, fans, and sensors. This diagnostic system uses an intelligent com-
munication protocol. It is intelligent not only because of allowing DTUs to read all
information of attached nodes and send it to DRU upon request, but also because of
giving DRU the flexibility to program any node remotely through the DTU attached
to it.
85

86
This diagnostic system provides ventilation on demand through a system of inter-
rupts sent from the DTU to DRU which will provide huge power savings to decrease
the overall cost of running the mine.
The analyses of the system behavior have demonstrated its power efficiency, ac-
ceptable end-to-end delay, SNR, and throughput. From the throughput we also no-
ticed that the bandwidth is not fully utilized which gives room for more improvement
in our communication protocol later on. Performance analyses were done using Mat-
lab, and OPNET and based upon real data collected from a typical mine gallery.
Error analyses for the developed communication protocol considered two signifi-
cant types of errors that affect operation in mines.
CTE is the first type of error analyzed. It is an error in calculating the gain and
slopes of the amplifiers due to tolerance of the amplifier’s components [7]. It was
concluded that error correction 100% is possible by adding an extra RF detector at
the output stages of the amplifiers.
The second type of error is the GEE, it is the error in estimating the gain for up-
stream amplifiers band. From the simulation analyses in chapter 4, it was concluded
that our communication protocol can ensure reliable operation where the amplifiers
in the cascaded system will be operating in acceptable dynamic ranges of operation.

87
6.2 Future Work
The topic of mine monitoring is so rich in terms of research opportunities and funds
available; there is still so much to be done.
Hybrid Mine Monitoring Solution:
To enhance the environmental-factor monitoring capability a hybrid system should
be considered. The hybrid system maybe crucial due to the fact that the underground
mine can be divided into two major areas:
1. open area where the extraction activities happen.
2. tunnel areas, which includes passageways and shafts.
The proposed configuration is made of the current leaky feeder as the wired do-
main and WSN as the wireless domain. The WSN will enhance the coverage and
reach out for dead spots that cannot be covered using the wired system only.
The WSN can be integrated to the Leaky Feeder System via Gate Way sensor
nodes. In this scheme, clusters of nodes can be integrated into a large scale system
via Leaky Cable. In each cluster of nodes, the WSNs employ multi-hop routing to
implement data gathering. Each sensor node plays the role of data collector as well
as message forwarder in the network. The Gate Way nodes at each cluster will then
relay the information into the Leaky Cable network via the CMTS modems. Once
on the IP network of the Leaky Cable, the data can be transported a long distance
to a central processing facility, where data can be monitored, analyzed, and might be

88
processed further for automation actions.
Prototyping:
It will be advantageous for the developed system to be practically translated into
prototype. This will help ensuring the practicality of developing any further systems
based on our diagnostic system and communication protocol.
Redundancy:
Our diagnostic system depends mainly on the DRU located in the control to handle
almost all requests. So it will be beneficial to study adding another DRU, a backup-
like DRU, to serve as a redundant node in case of DRU failure.
Failure Analyses:
Failure analyses can further research possible scenarios of failures that can affect the
operations of the diagnostic system and the communication protocol. For example
DRU hardware failure can be considered. In that case we may want to research the
idea of adding redundant DRU in the control room. The communication protocol
must be further developed to react in such cases.
Ventilation-on-Demand using RF tagging:
Most mining companies have an RFID system where they add RF tags to miner’s
belts’ or helmets’ and also to all major equipments in mine. This allows tracking
of miners and knowing their location exactly. It is worth trying to enhance the
Ventilation on Demand system by combining it with the RFID tagging, for instance;

89
using RF tags we can determine real time where miners are working so ventilation
fans turns on automatically.

Bibliography
[1] Robert S. Chapman and Roy S. Nutter, ”System Operational Evaluation of
Mine Monitoring Systems”, IEEE Transactions on Industry Applications IA-21
(1985), no. 5, 1112 –1116.
[2] Robert S. Chapman, Roy S. Nutter, and William R. Voltz, ”Test Criteria and
Methodology for Evaluation of Coal Mine Monitoring and Control Systems”,
IEEE Transactions on Industry Applications IA-21 (1985), no. 5, 1117 –1120.
[3] Benessa Defend, Kevin Fu, and Ari Juels, ”Cryptanalysis of Two Lightweight
RFID Authentication Schemes”, Fifth Annual IEEE International Conference
on Pervasive Computing and Communications Workshops, 2007. PerCom Work-
shops ’07, march 2007, pp. 211 –216.
[4] G.Y. Delisle, ”Propagation Charactristics for Modern Wireless System Networks
in Underground Mine Galleries”, International Institute of Telecommunications,
Montreal, 2005 First International Workshop on Wireless Communications in
Underground and Confined Area (June 6-7, 2005), Val d’Or, QC, Canada.
[5] P. Delogne, ”EM propagation in tunnels”, IEEE Transactions on Antennas and
Propagation 39 (1991), no. 3, 401 –406.
90

91
[6] T.H. Dubaniewicz, J.E. Chilton, and Jr. Dobroski, H., ”Fiber optics for at-
mospheric mine monitoring”, IEEE Transactions on Industry Applications 29
(1993), no. 4, 749 –754.
[7] W. Farjow and Fernando X., Leaky feeder system optimization in underground
mines and tunnels, MASc Thesis Ryerson University 2009.
[8] Yunan Hu, O.I. Koroleva, and M. Krstic, ”Control design for mine ventilation
network systems”, Proceedings of the 41st IEEE Conference on Decision and
Control, 2002, vol. 1, December 2002, pp. 543 – 548 vol.1.
[9] Mining What it means to Canada, Ottawa: The Mining Association of Canada
(1988).
[10] Tieyan Li and Robert Deng, ”Vulnerability Analysis of EMAP-An Efficient
RFID Mutual Authentication Protocol”, The Second International Conference
on Availability, Reliability and Security, 2007. ARES 2007., april 2007, pp. 238
–245.
[11] D.J.R. Martin, ”Leaky-feeder radio communication: A historical review”, Vehic-
ular Technology Conference, 1984. 34th IEEE (1984), 25 –30.
[12] M.F. Mubarak, J.-l.A. Manan, and S. Yahya, ”Mutual Attestation Using TPM
for Trusted RFID Protocol”, Second International Conference on Network Ap-
plications Protocols and Services (NETAPPS), 2010, sept. 2010, pp. 153 –158.
[13] T. Novak, D. P. Snyder, and J. L. Kohler, ”Postaccident Mine Communications
and Tracking Systems”, IEEE Transactions on Industry Applications 46 (2010),
no. 2, 712 –719.
[14] T. Novak, D.P. Snyder, and J.L. Kohler, ”Post-Accident Mine Communications
and Tracking Systems”, Industry Applications Society Annual Meeting, 2009.
IAS 2009. IEEE (2009), 1 –8.

92
[15] Jr. Nutter, R.S. and M.D. Aldridge, ”Status of mine monitoring and commu-
nications”, IEEE Transactions on Industry Applications 24 (1988), no. 5, 820
–826.
[16] B. of Mines Staff, Underground mine communications, control and monitor-
ing, U. S. Department of the Interior, Bureau of Mines, Information Circular I
28.27:8955 (1985).
[17] K. Osaka, Shuang Chang, T. Takagi, K. Yamazaki, and O. Takahashi, ”A Secure
RFID Protocol based on Insubvertible Encryption Using Guardian Proxy”, Third
International Conference on Availability, Reliability and Security, 2008. ARES
08., march 2008, pp. 733 –740.
[18] W. H. Schiffbauer and J. F. Brune, ”Underground coal mine communications
for emergencies and everyday operation”, Symposium on the Capabilities and
Availability of Wireless Communication and Tracking Systems for Underground
Coal Mines (Feb. 13, 2006).
[19] Jr. Sottile, J. and L.E. Holloway, ”An overview of fault monitoring and diagnosis
in mining equipment”, IEEE Transactions on Industry Applications 30 (1994),
no. 5, 1326 –1332.
[20] Qingdong Wang, Deyong Shang, Zhiyong Yang, and Changjun Zhu, ”Design of
coal mine main fan performance optimization”, Computational Intelligence and
Industrial Applications, 2009. PACIIA 2009. Asia-Pacific Conference on, vol. 2,
Novomber 2009, pp. 58 –60.
[21] Craig A. Winkelmann, Andrew M. Kissel, and Roy S. Nutter, ”Microprocessor
Self-Testing for Mine Monitor Systems”, IEEE Transactions on Industry Appli-
cations IA-21 (1985), no. 1, 158 –161.

93
[22] S. Yarkan, S. Guzelgoz, H. Arslan, and R.R. Murphy, ”Underground Mine Com-
munications: A Survey”, IEEE Communications Surveys Tutorials 11 (2009),
no. 3, 125 –142.

94
Appendix
Publications
1. Daoud, M.; Maheeka, U.; Alam, T.; Fernando, X.; , ”Modulator bias optimiza-
tion of radio over fiber links considering noise figure and RF gain,” Commu-
nications (QBSC), 2010 25th Biennial Symposium on , vol., no., pp.234-237,
12-14 May 2010.
2. Daoud, M.; Fernando, X.; , ”On the communication requirements for the smart
grid,” Scientific Research Journal, Energy and Power Engineering, vol. 3, no.
1, pp.53-60, 25 February 2011.
3. Daoud, M.; Farjow, W.; Fernando, X.; , ”A Novel Diagnostic System for Adding
Reliability to Communication Networks in Underground Mines,” accepted for
the IEEE Canadian Conference on Electrical and Computer Engineering 2011
(CCECE 2011).
4. Daoud, M.; Farjow, W.; Fernando, X.; , ”Advanced diagnostic system with ven-
tilation on demand for underground mines,” accepted for IEEE Sarnoff sympo-
sium 2011.
5. Daoud, M.; Fernando, X.; ”On the Communications Requirements for the Smart
Grid,” accepted for the IEEE Canadian Review-Spring 2011.
6. Daoud, M.; Farjow, W.; Fernando, X.; , ”Advanced mine monitoring system
with ventilation on demand for underground mines and tunnels,” accepted for
the IEEE Industry Application Society (IAS) annual meeting 2011.