Embed Size (px)
Citation preview
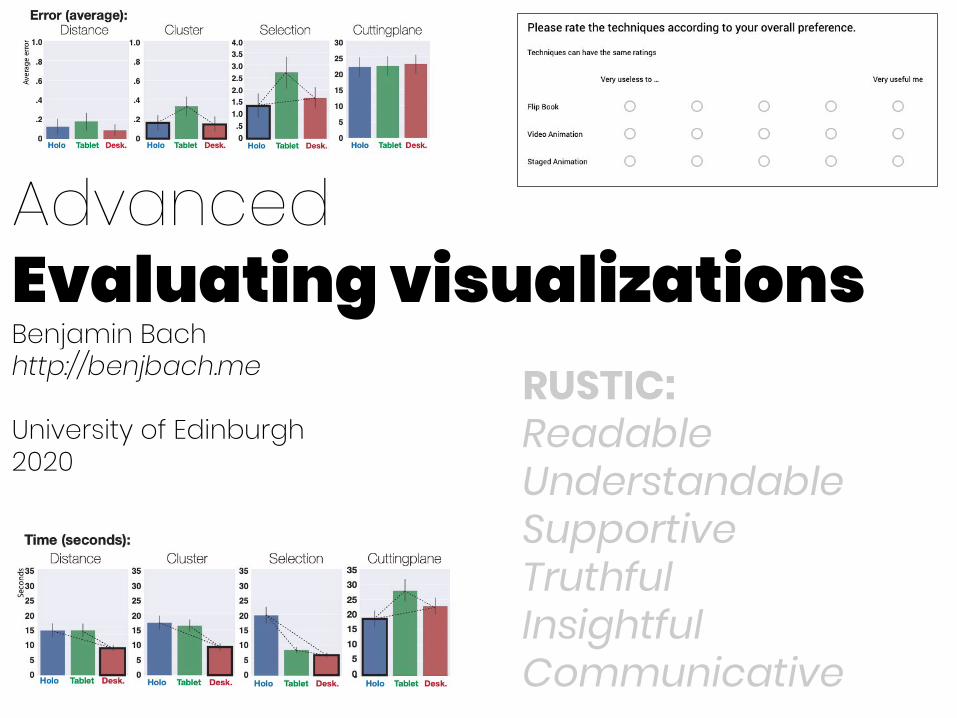
AdvancedEvaluating visualizationsBenjamin Bachhttp://benjbach.me
University of Edinburgh2020
RUSTIC:ReadableUnderstandableSupportiveTruthfulInsightfulCommunicative
How do we know if a visualization is successful?
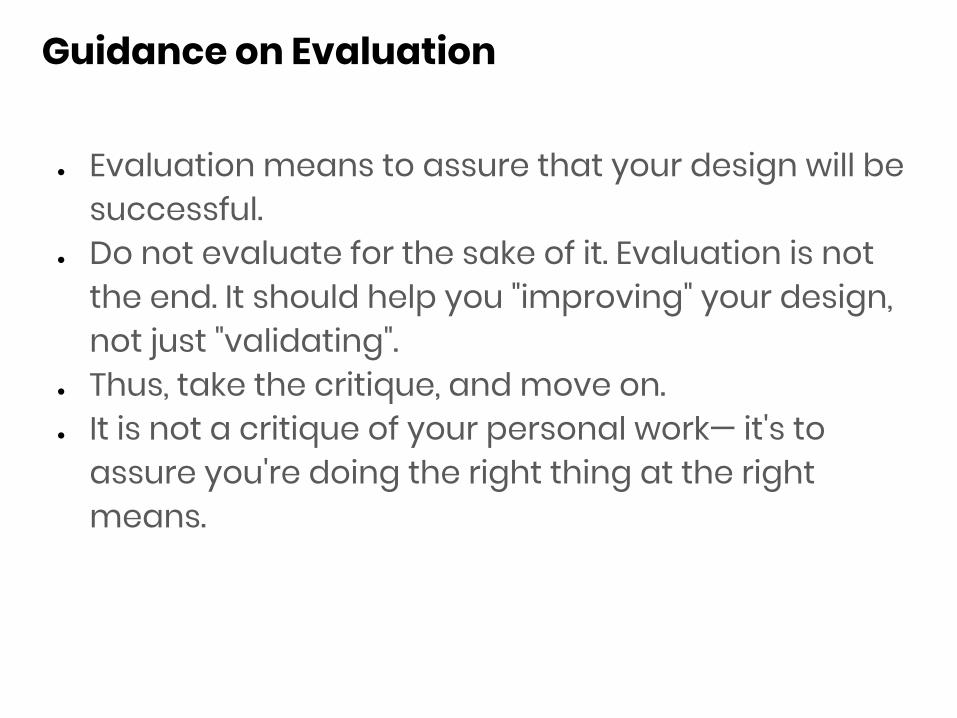
Guidance on Evaluation
● Evaluation means to assure that your design will be successful.
● Do not evaluate for the sake of it. Evaluation is not the end. It should help you "improving" your design, not just "validating".
● Thus, take the critique, and move on.● It is not a critique of your personal work— it's to
assure you're doing the right thing at the right means.
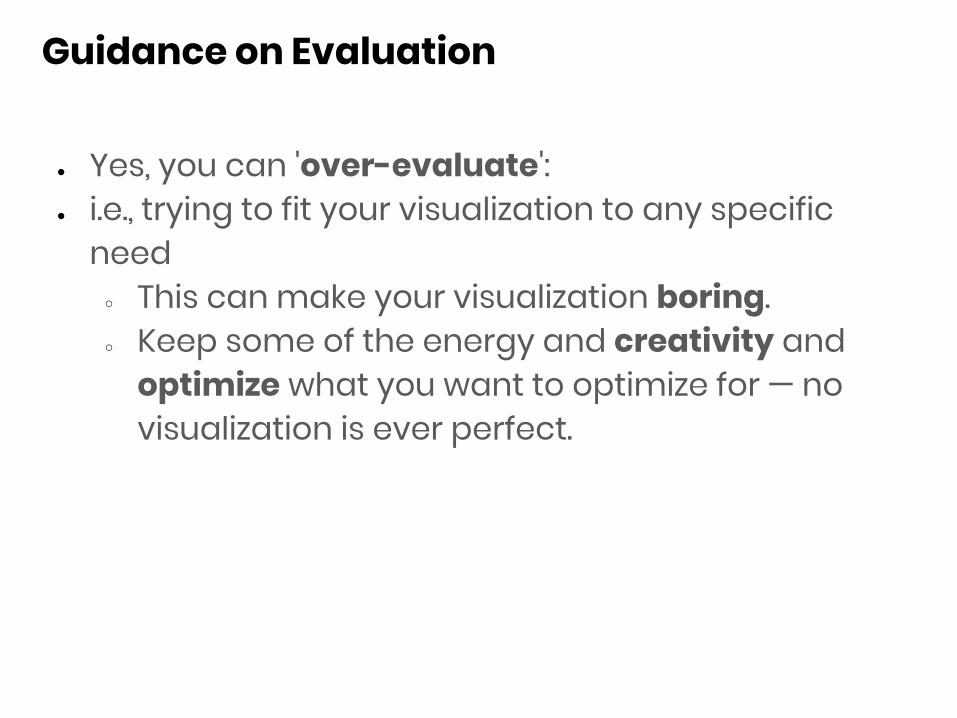
Guidance on Evaluation
● Yes, you can 'over-evaluate':● i.e., trying to fit your visualization to any specific
need○ This can make your visualization boring.○ Keep some of the energy and creativity and
optimize what you want to optimize for — no visualization is ever perfect.
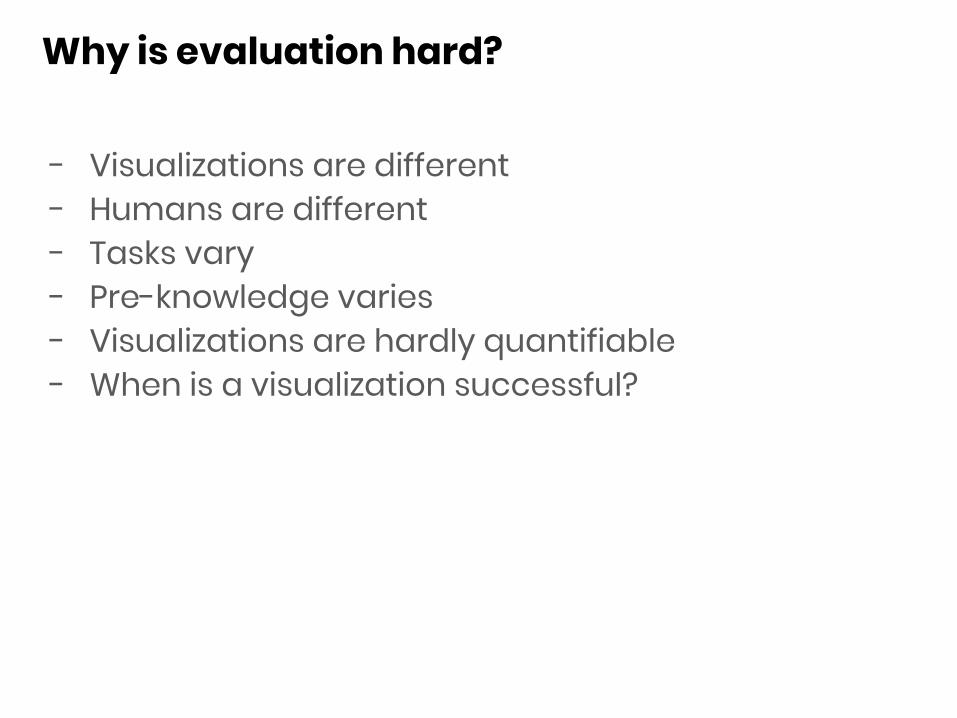
Why is evaluation hard?
- Visualizations are different- Humans are different - Tasks vary- Pre-knowledge varies- Visualizations are hardly quantifiable- When is a visualization successful?
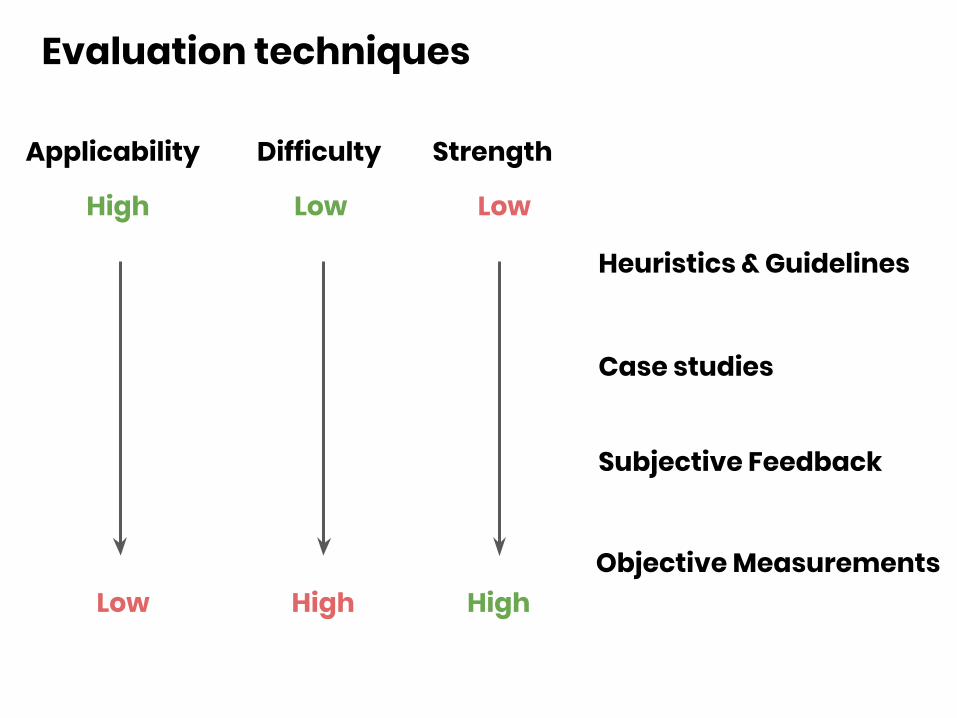
Evaluation techniques
Heuristics & Guidelines
Case studies
Subjective Feedback
Objective Measurements
Applicability
High
Low
Difficulty
High
Low
Strength
High
Low
1. Heuristics &
Guidelines
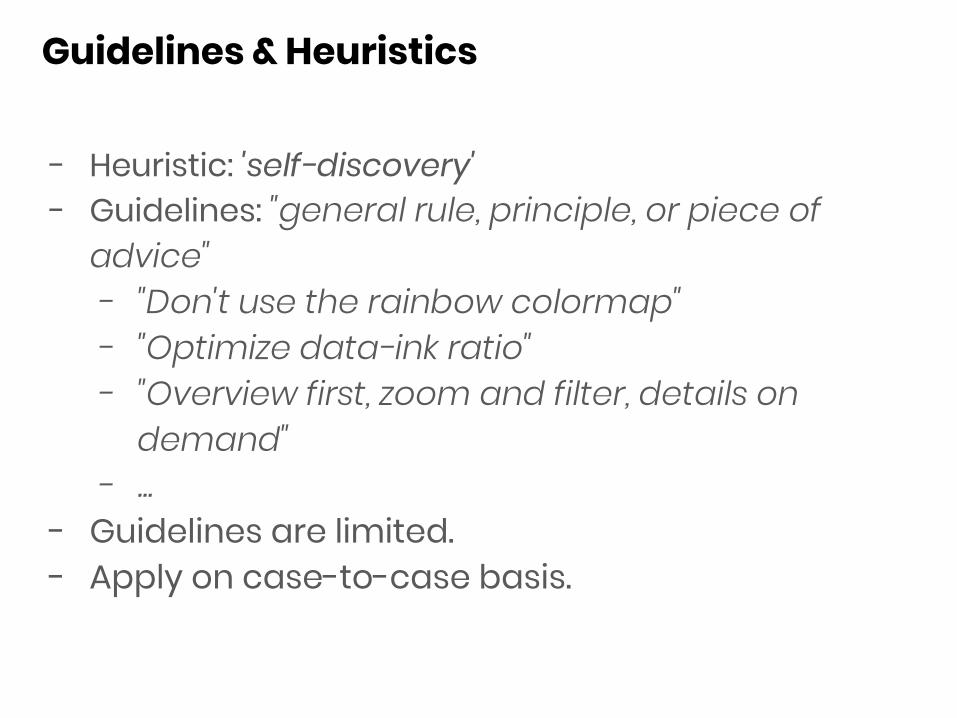
Guidelines & Heuristics
- Heuristic: 'self-discovery'- Guidelines: "general rule, principle, or piece of
advice"- "Don't use the rainbow colormap"- "Optimize data-ink ratio"- "Overview first, zoom and filter, details on
demand"- ...
- Guidelines are limited. - Apply on case-to-case basis.
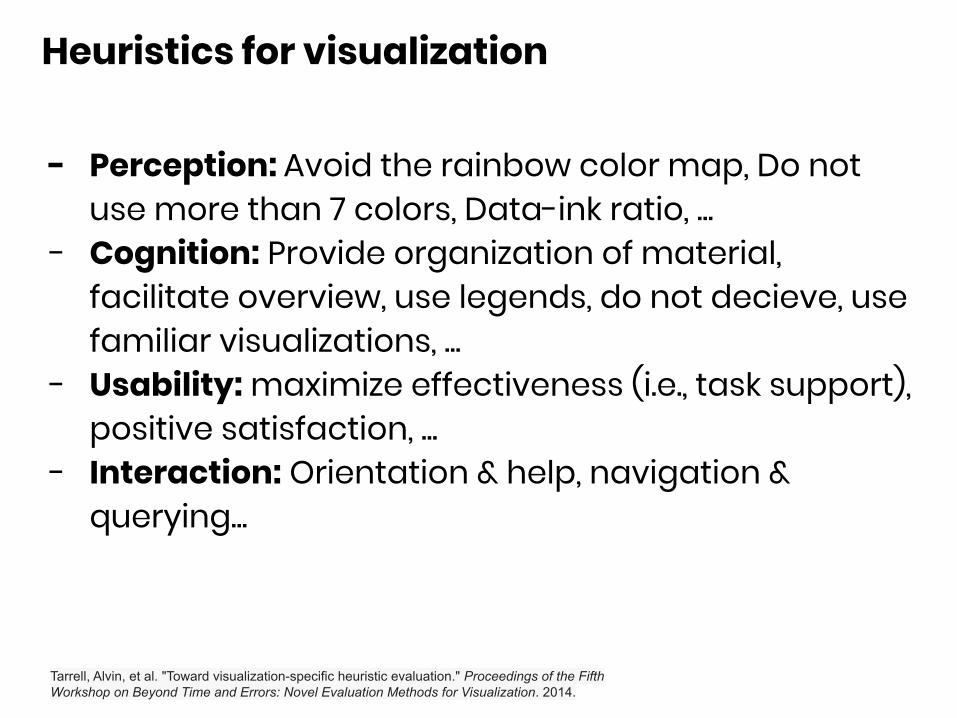
Heuristics for visualization
- Perception: Avoid the rainbow color map, Do not use more than 7 colors, Data-ink ratio, ...
- Cognition: Provide organization of material, facilitate overview, use legends, do not decieve, use familiar visualizations, ...
- Usability: maximize effectiveness (i.e., task support), positive satisfaction, ...
- Interaction: Orientation & help, navigation & querying...
Tarrell, Alvin, et al. "Toward visualization-specific heuristic evaluation." Proceedings of the Fifth Workshop on Beyond Time and Errors: Novel Evaluation Methods for Visualization. 2014.

The RUSTIC
principle

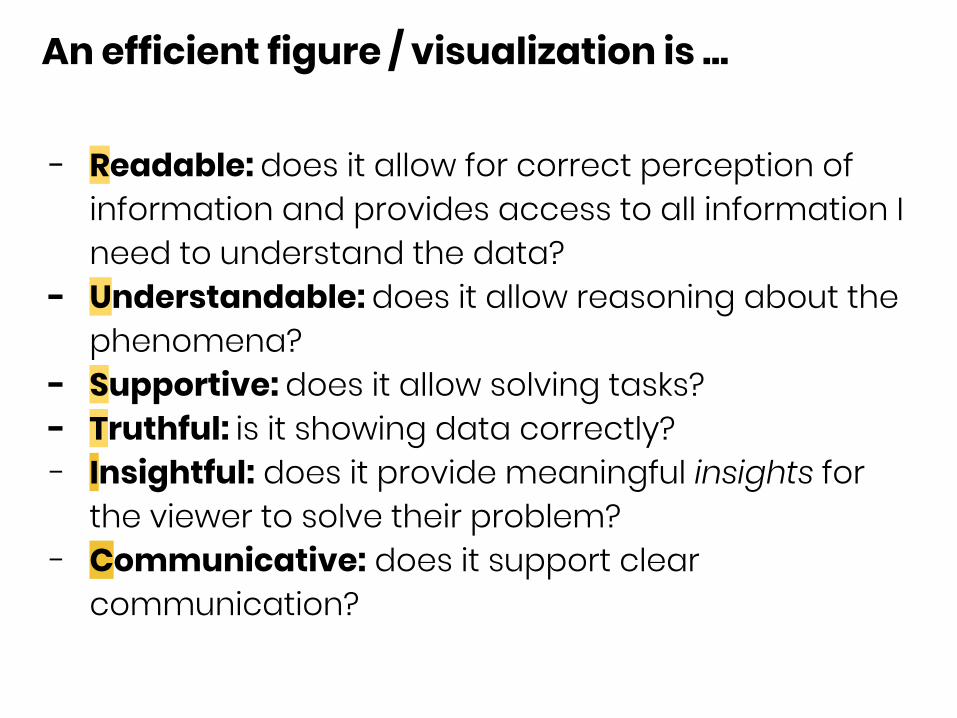
An efficient figure / visualization is ...
- Readable: does it allow for correct perception of information and provides access to all information I need to understand the data?
- Understandable: does it allow reasoning about the phenomena?
- Supportive: does it allow solving tasks?- Truthful: is it showing data correctly? - Insightful: does it provide meaningful insights for
the viewer to solve their problem?- Communicative: does it support clear
communication?
Lorem ipsum dolor sit amet, consectetur adipiscing elit. Pellentesque sollicitudin ipsum elit, et vestibulum nisl dictum et. Sed lobortis molestie felis. Praesent et ligula commodo magna fringilla egestas. Nam nec risus in magna facilisis sollicitudin nec et metus. Sed tincidunt dapibus lacus in viverra. Donec gravida finibus metus eget semper. In nec mauris blandit turpis pellentesque porta nec vel magna. Nunc feugiat rutrum leo, faucibus efficitur dolor facilisis nec.
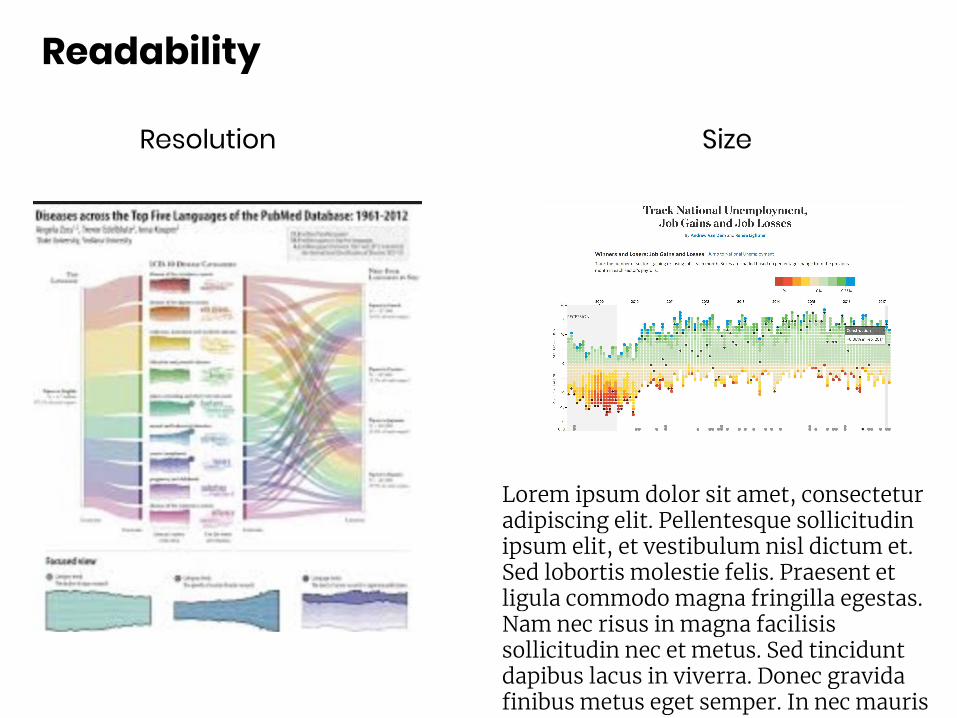
SizeResolution
Readability
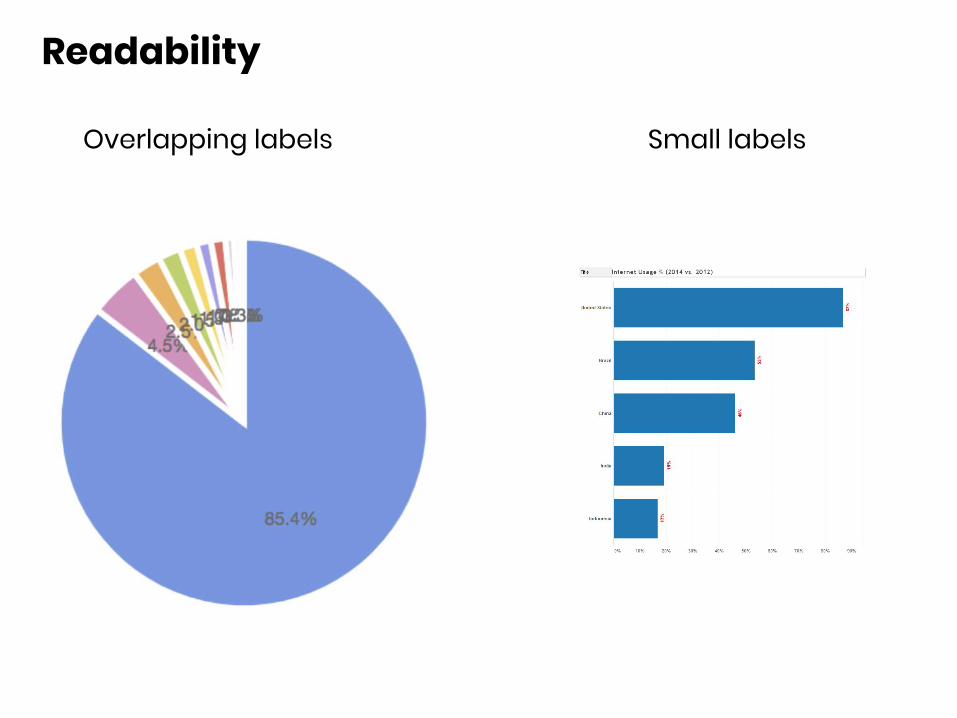
Small labelsOverlapping labels
Readability
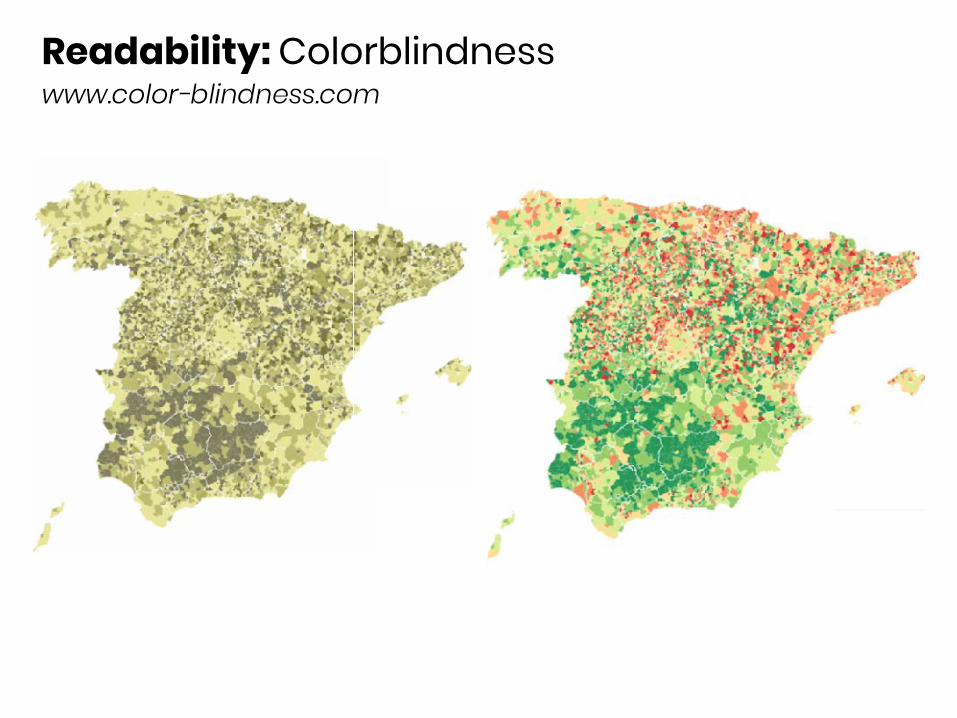
Readability: Colorblindnesswww.color-blindness.com
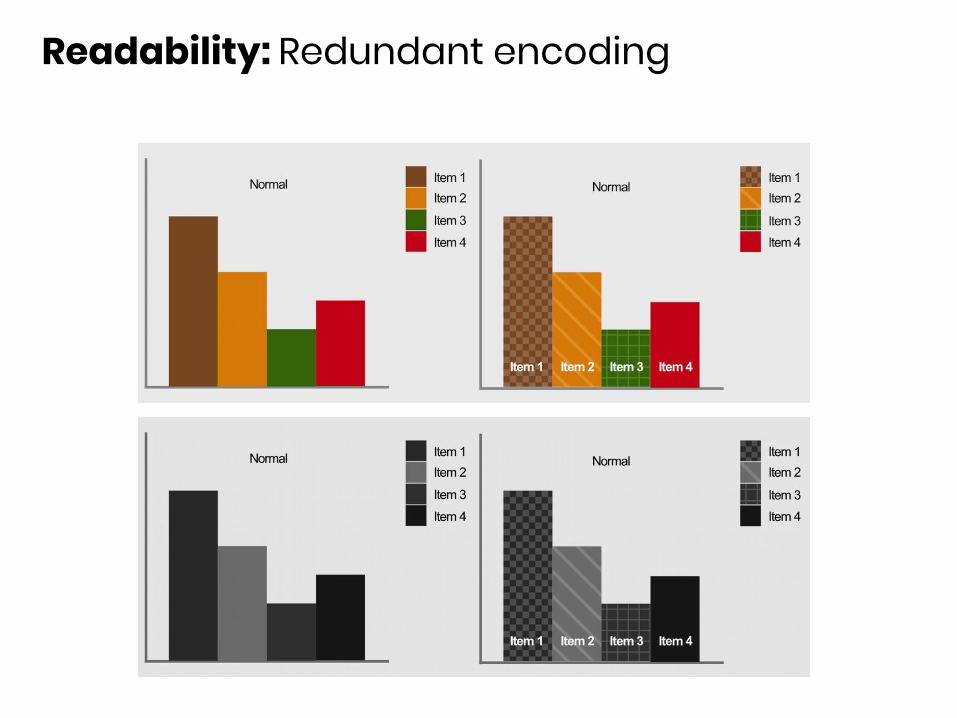
Readability: Redundant encoding
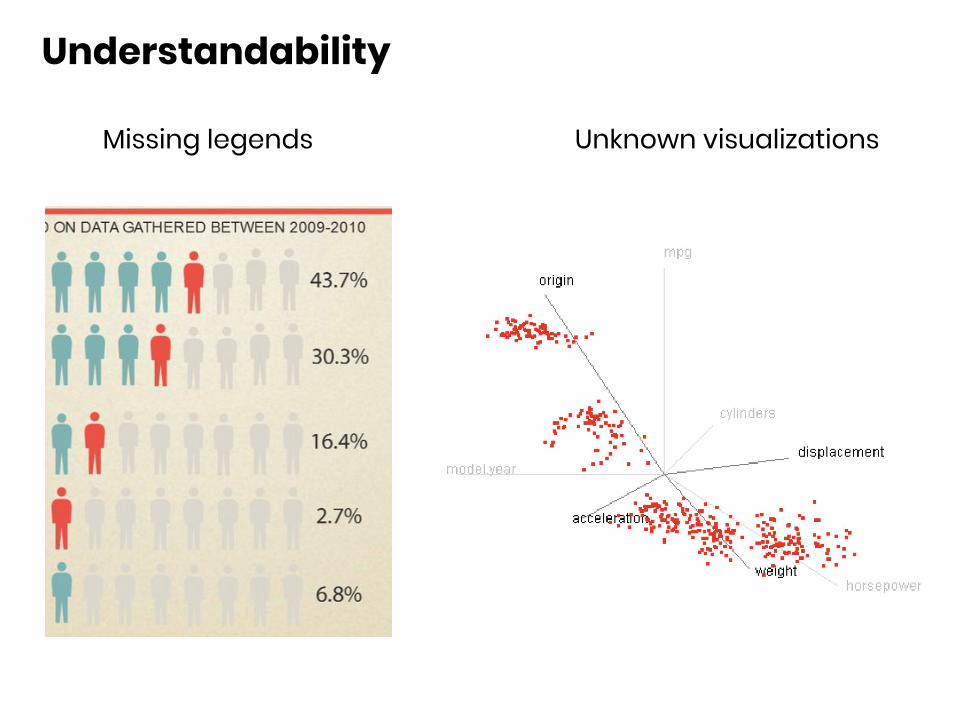
Understandability
Unknown visualizationsMissing legends
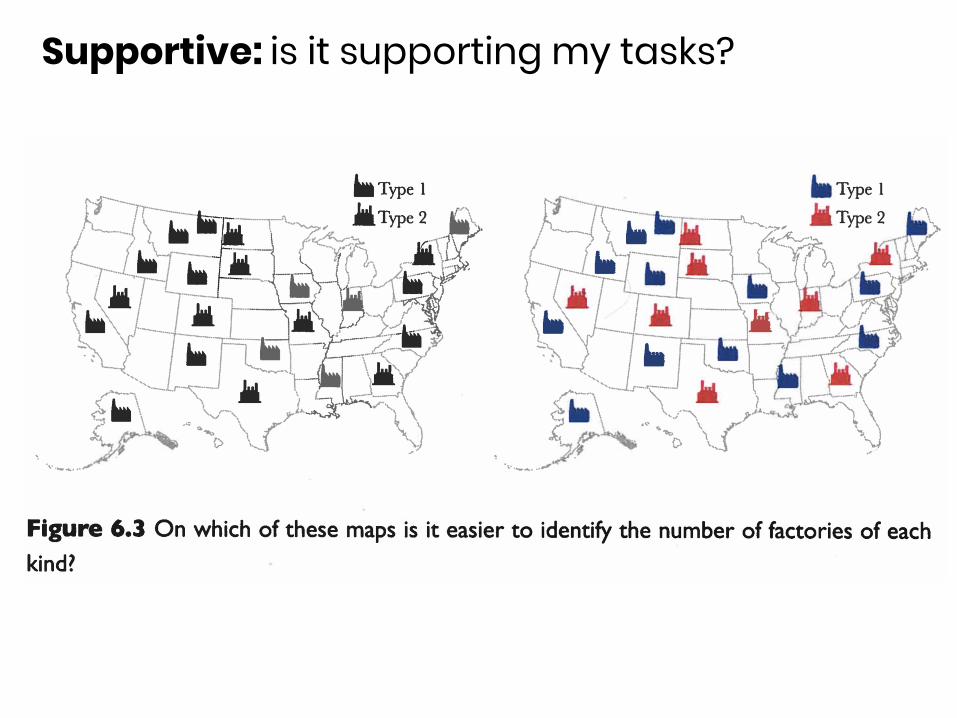
Supportive: is it supporting my tasks?
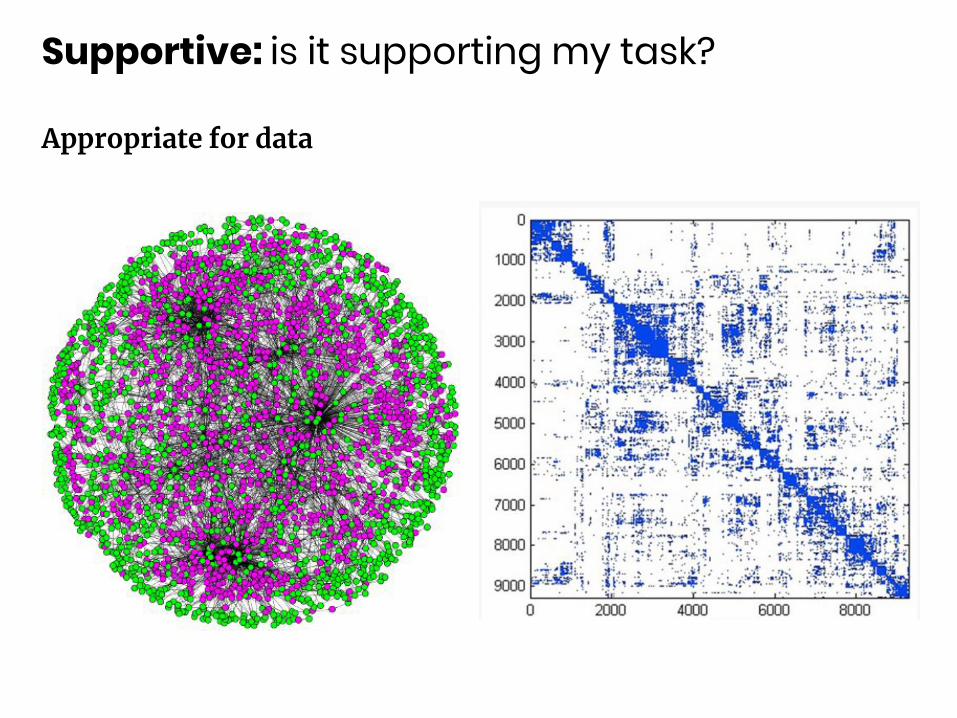
Supportive: is it supporting my task?
Appropriate for data
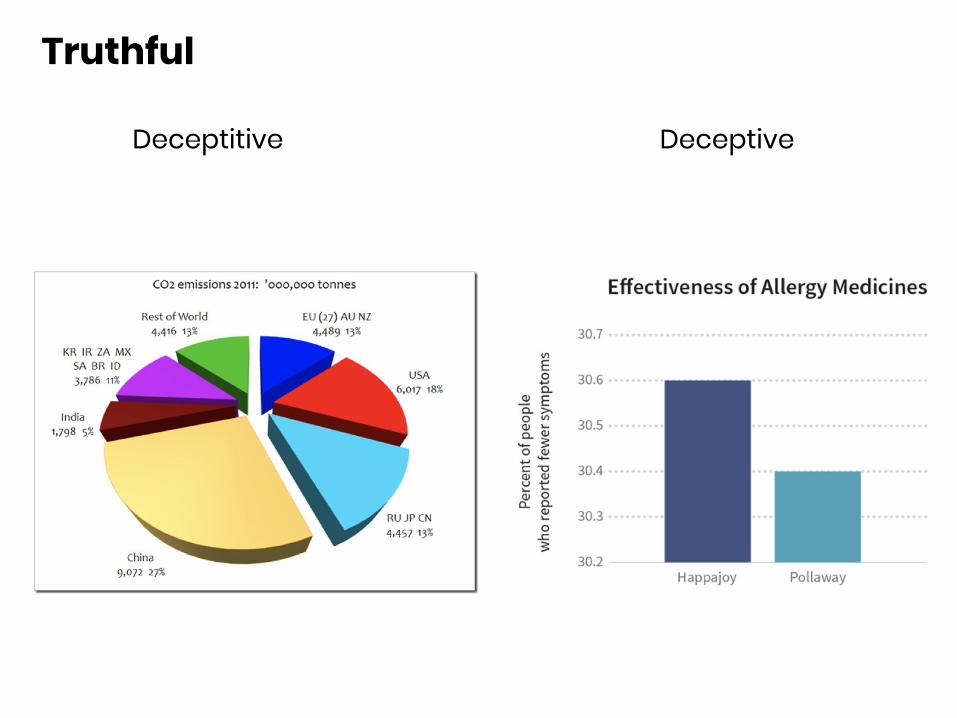
Truthful
DeceptiveDeceptitive
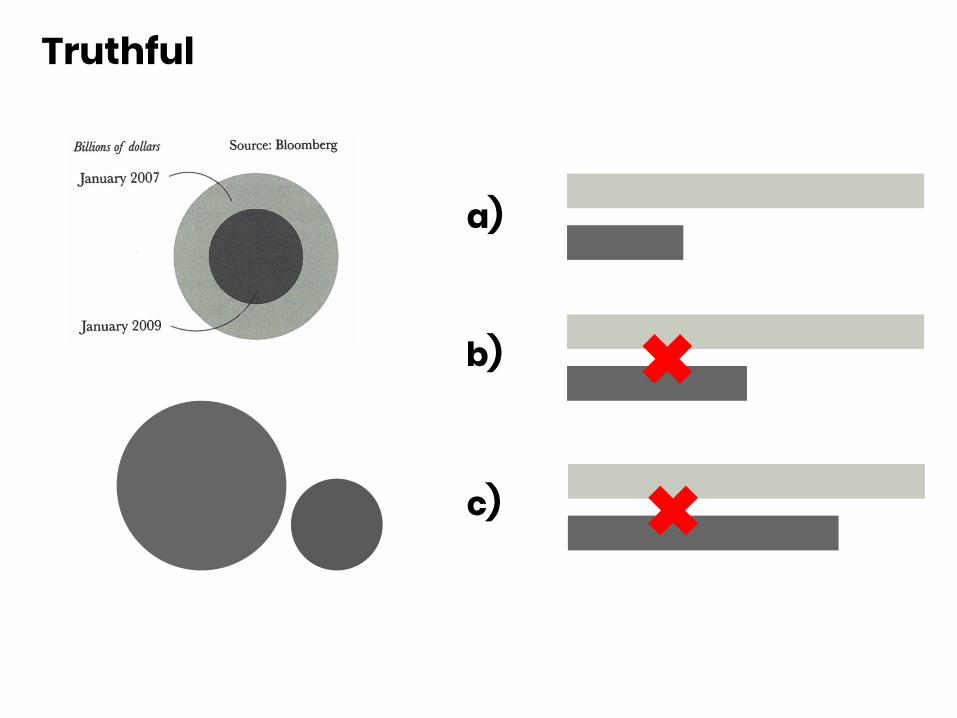
Truthful
a)
b)
c)
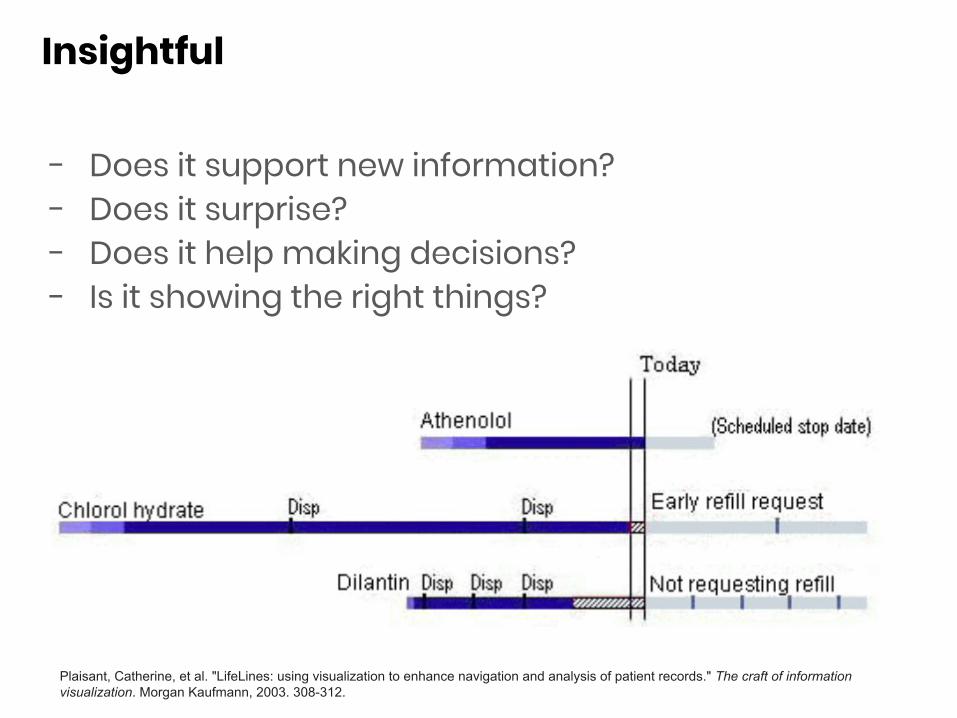
Insightful
- Does it support new information? - Does it surprise?- Does it help making decisions?- Is it showing the right things?
Plaisant, Catherine, et al. "LifeLines: using visualization to enhance navigation and analysis of patient records." The craft of information visualization. Morgan Kaufmann, 2003. 308-312.
Communicative
- Is the visualization ready for "first contact"?- Are visualizations and visual encodings explained?- Are key messages highlighted?- Is the visualization "attractive", e.g., does it invite to
observation?- Is the visualization clearly structured?- Is context and take-home message clear?
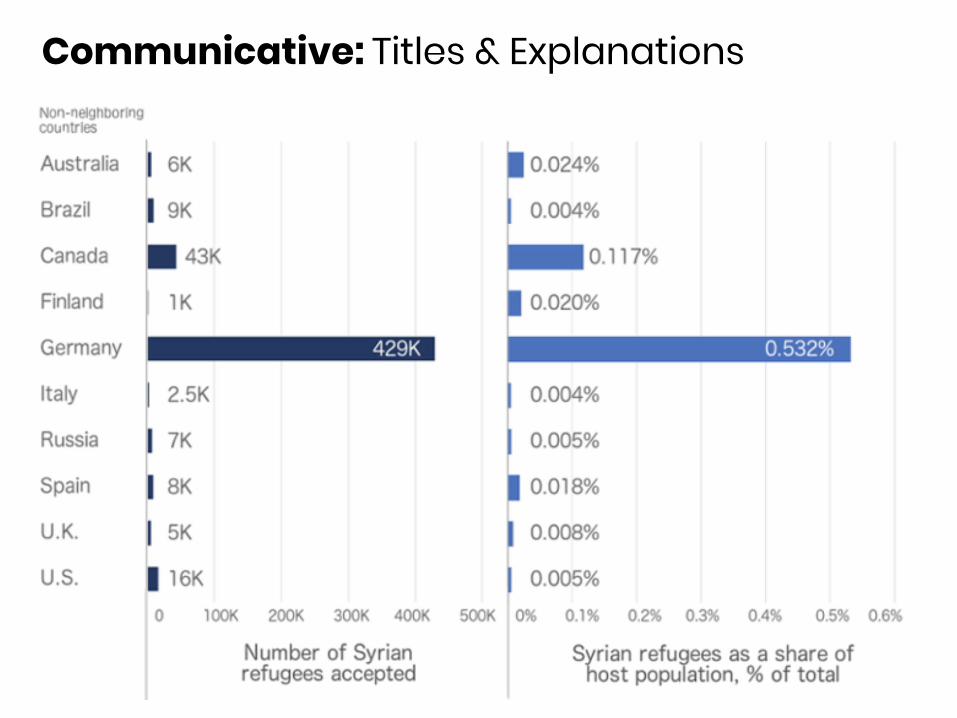
Communicative: Titles & Explanations
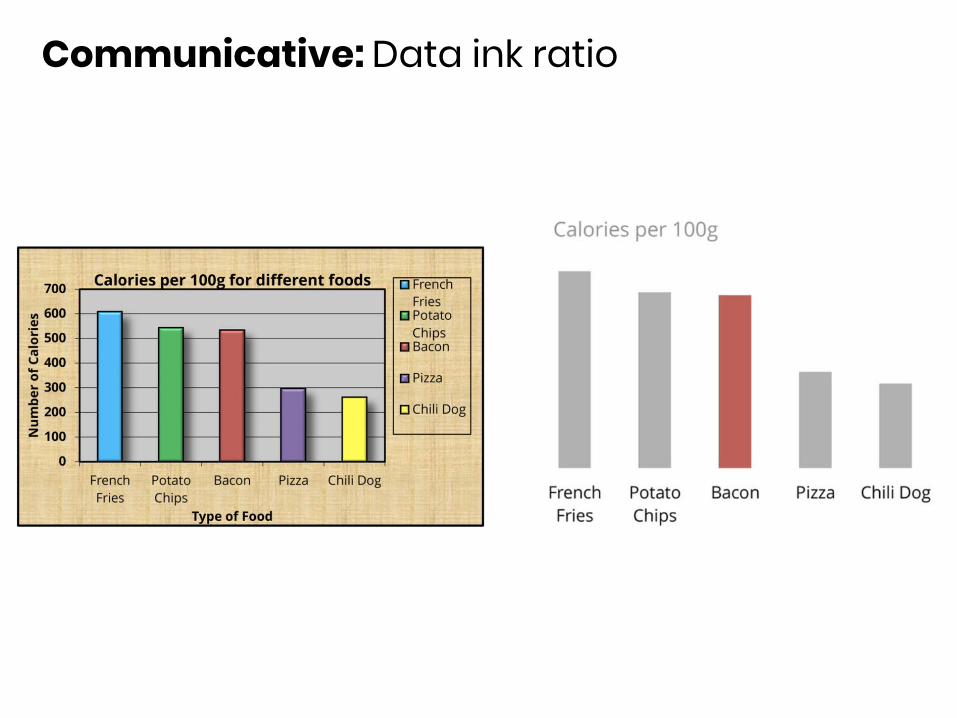
Communicative: Data ink ratio
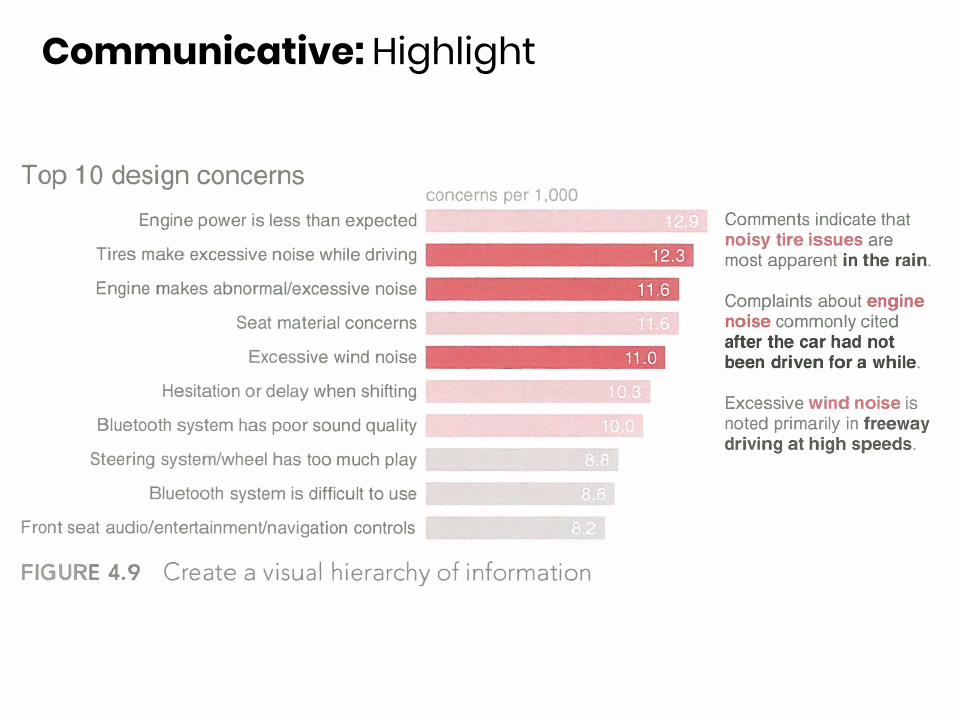
Communicative: Highlight
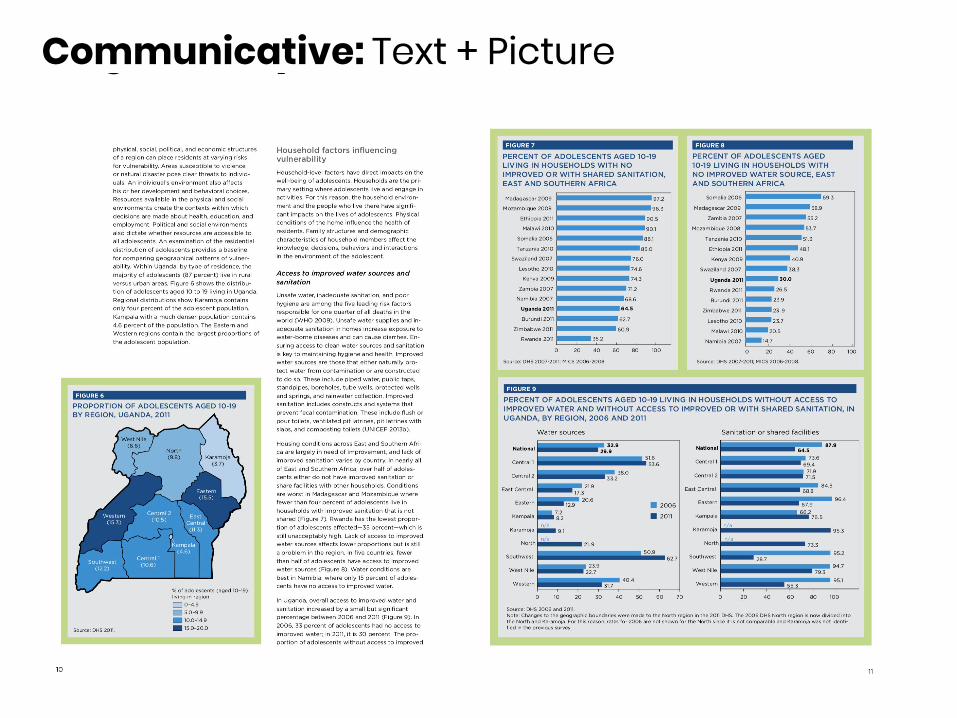
Magazine StyleCommunicative: Text + Picture
An efficient figure / visualization is ...
- Readable: does it allow for correct perception of information and provides access to all information I need to understand the data?
- Understandable: does it allow reasoning about the phenomena?
- Supportive: does it allow solving tasks?- Truthful: is it showing data correctly? - Insightful: does it provide meaningful insights for
the viewer to solve their problem?- Communicative: does it support clear
communication?

2. Case Studies
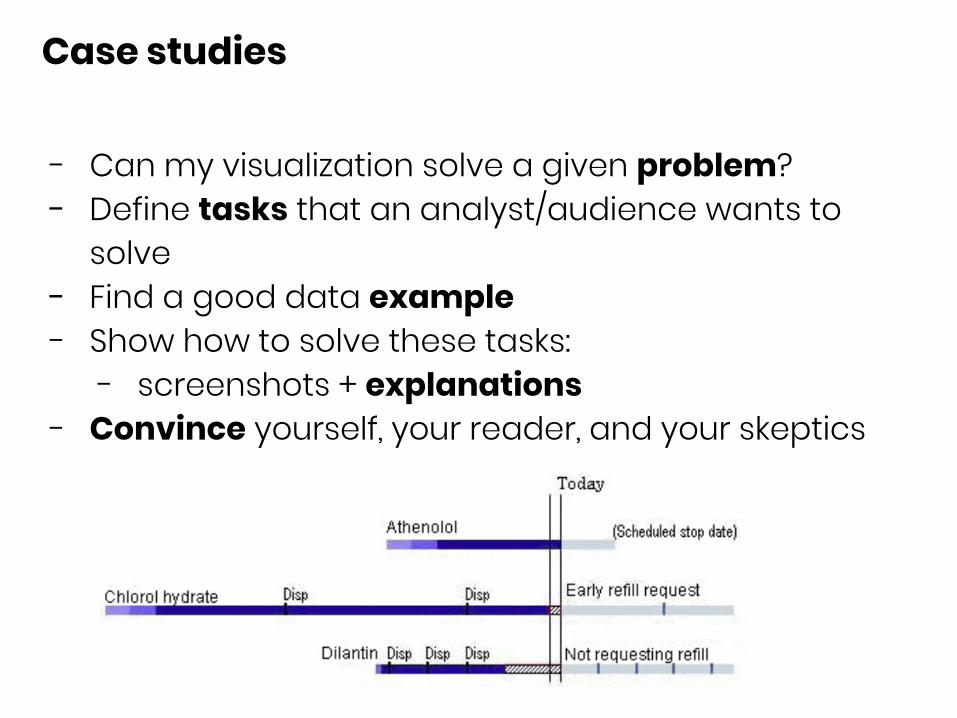
Case studies
- Can my visualization solve a given problem? - Define tasks that an analyst/audience wants to
solve- Find a good data example - Show how to solve these tasks:
- screenshots + explanations- Convince yourself, your reader, and your skeptics
3. Subjective User feedback
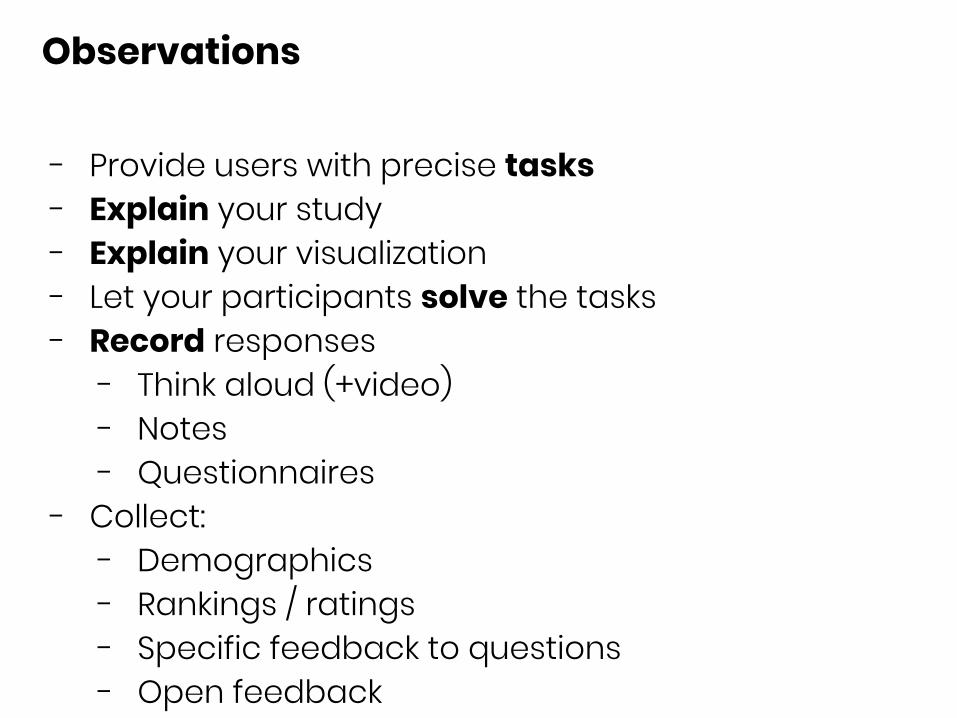
Observations
- Provide users with precise tasks- Explain your study- Explain your visualization - Let your participants solve the tasks- Record responses
- Think aloud (+video)- Notes- Questionnaires
- Collect: - Demographics- Rankings / ratings- Specific feedback to questions- Open feedback
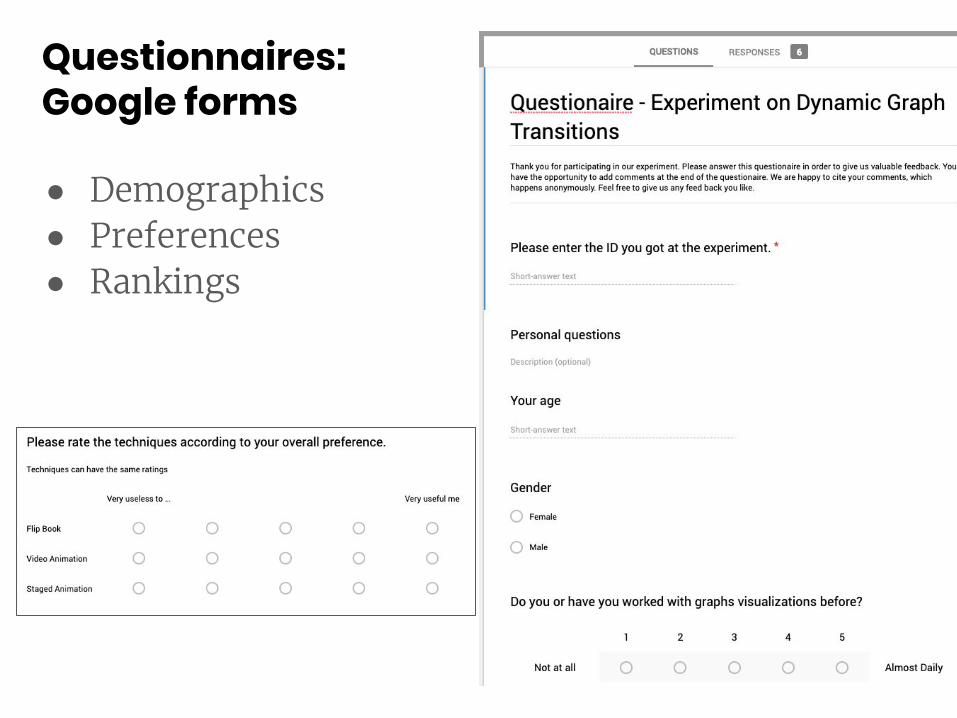
Questionnaires:Google forms
● Demographics● Preferences● Rankings
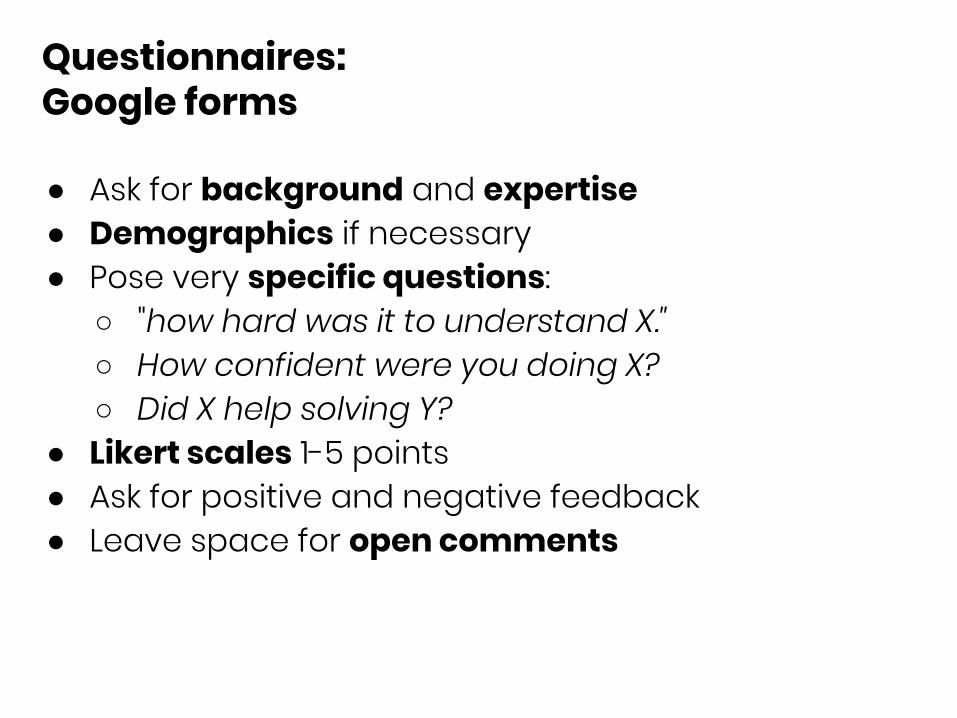
Questionnaires:Google forms
● Ask for background and expertise● Demographics if necessary ● Pose very specific questions:
○ "how hard was it to understand X."○ How confident were you doing X?○ Did X help solving Y?
● Likert scales 1-5 points● Ask for positive and negative feedback● Leave space for open comments
4. Objective Measurements
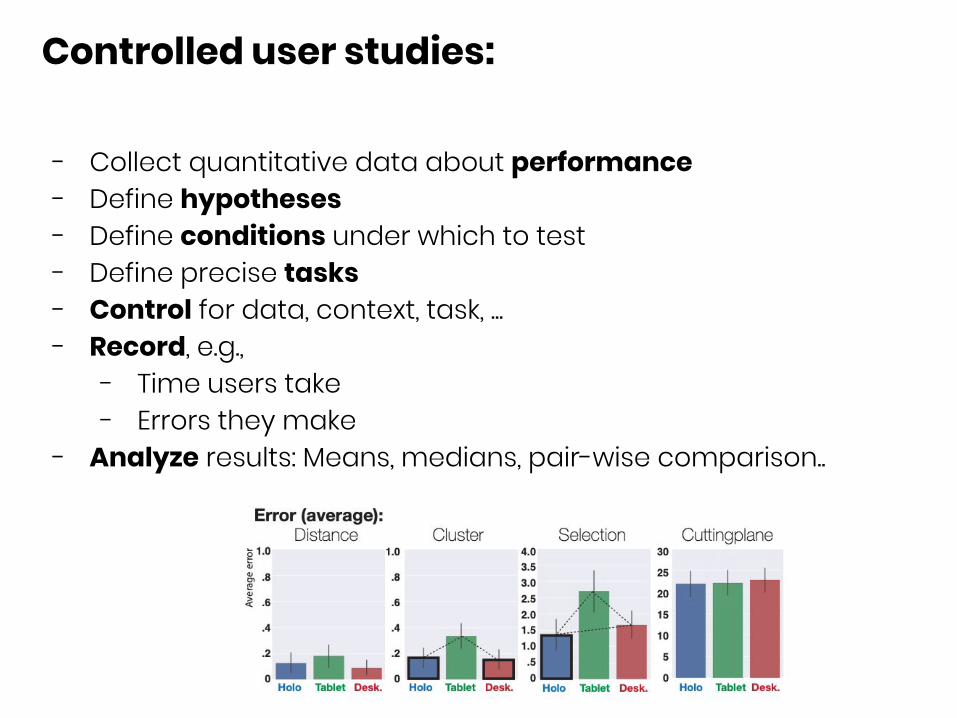
Controlled user studies:
- Collect quantitative data about performance- Define hypotheses- Define conditions under which to test- Define precise tasks- Control for data, context, task, ...- Record, e.g.,
- Time users take- Errors they make
- Analyze results: Means, medians, pair-wise comparison..
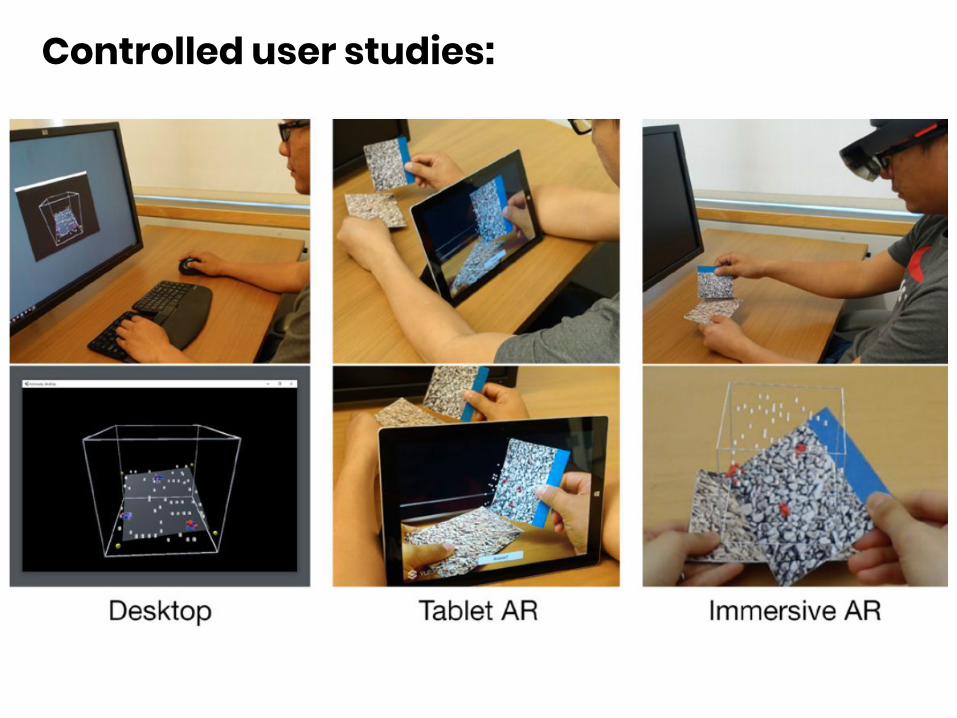
Controlled user studies:
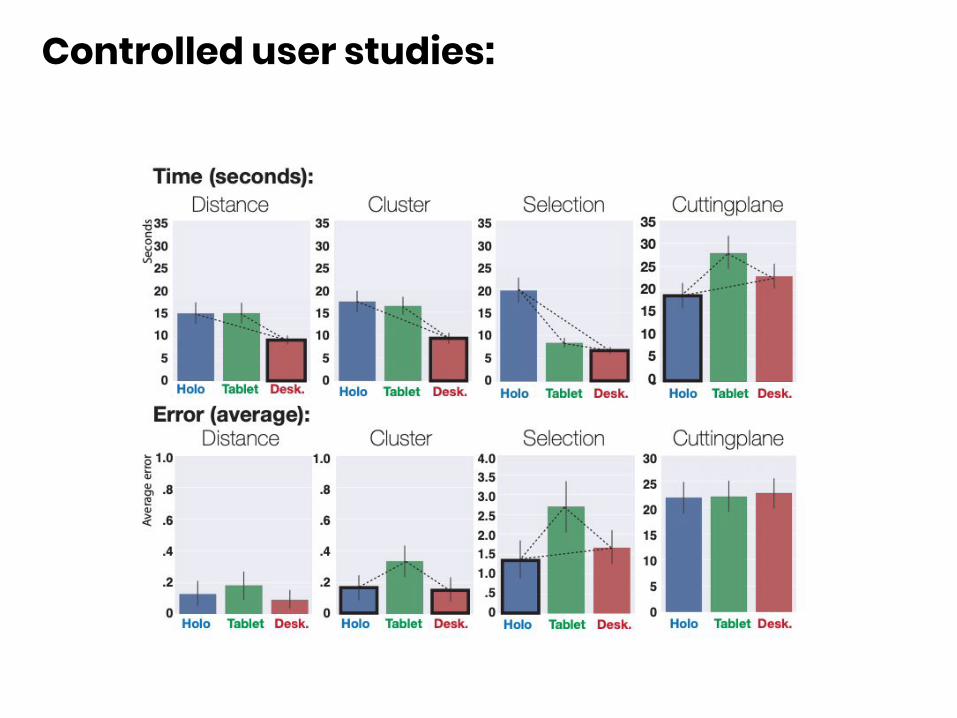
Controlled user studies:
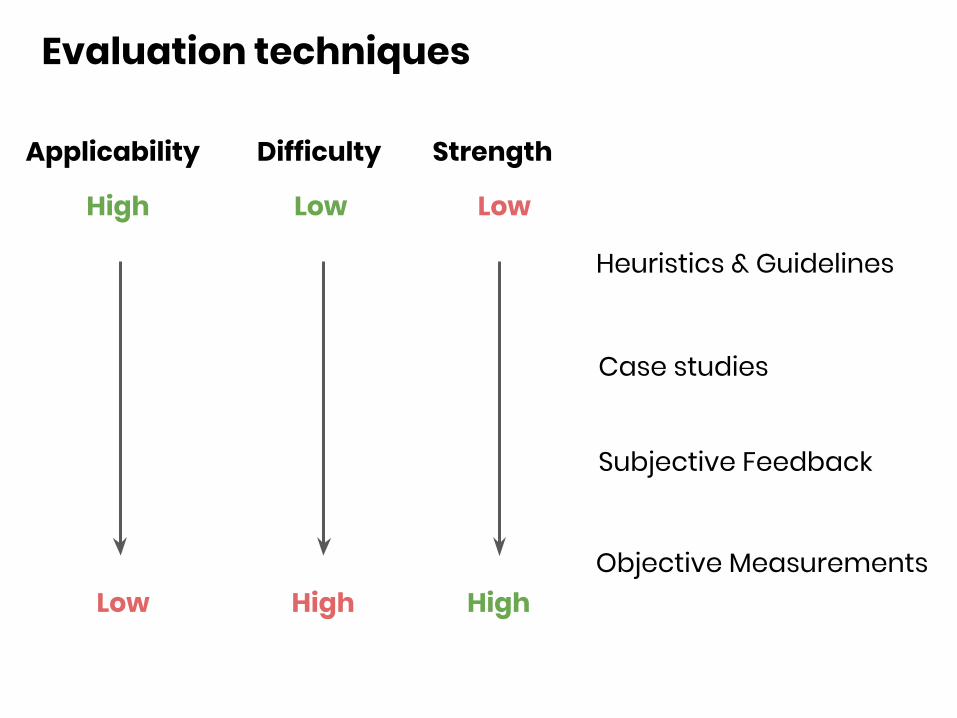
Evaluation techniques
Heuristics & Guidelines
Case studies
Subjective Feedback
Objective Measurements
Applicability
High
Low
Difficulty
High
Low
Strength
High
Low
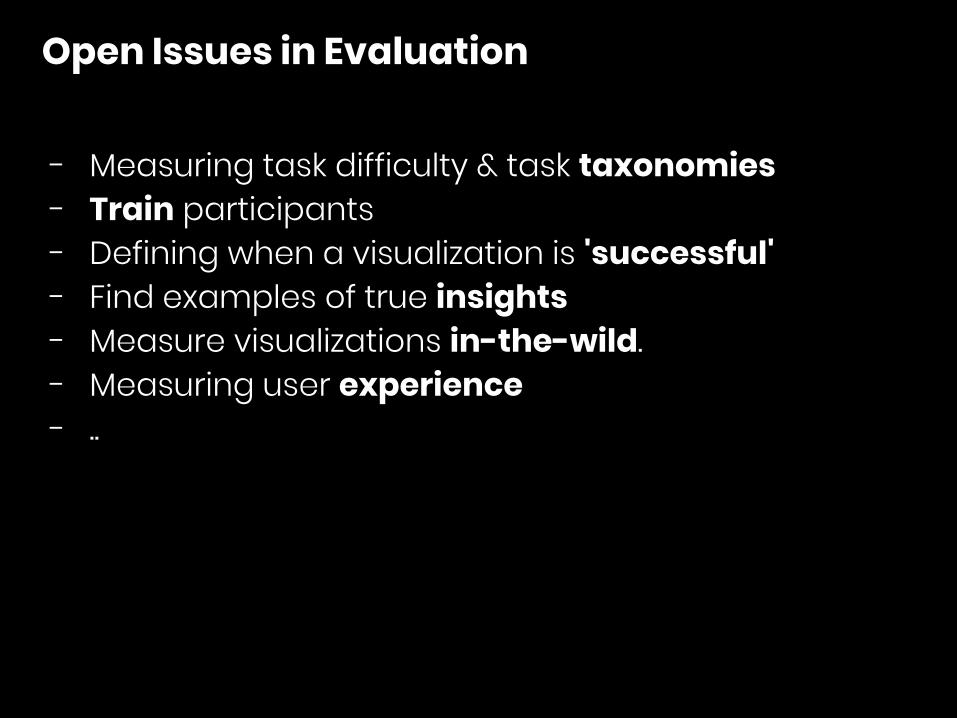
Open Issues in Evaluation
- Measuring task difficulty & task taxonomies- Train participants- Defining when a visualization is 'successful'- Find examples of true insights- Measure visualizations in-the-wild.- Measuring user experience- ..
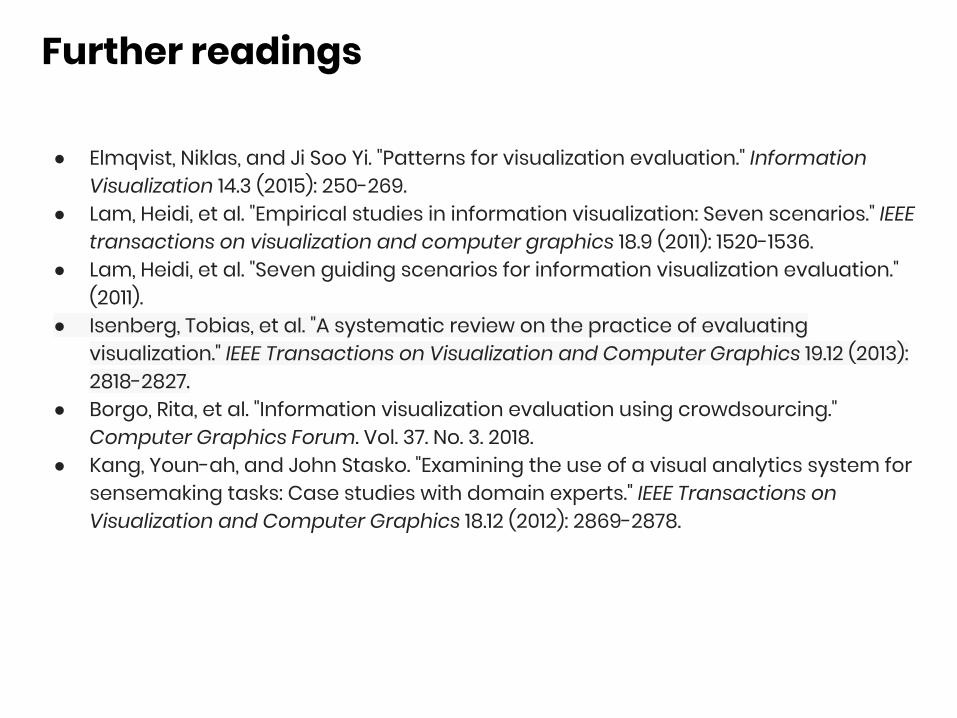
Further readings
● Elmqvist, Niklas, and Ji Soo Yi. "Patterns for visualization evaluation." Information Visualization 14.3 (2015): 250-269.
● Lam, Heidi, et al. "Empirical studies in information visualization: Seven scenarios." IEEE transactions on visualization and computer graphics 18.9 (2011): 1520-1536.
● Lam, Heidi, et al. "Seven guiding scenarios for information visualization evaluation." (2011).
● Isenberg, Tobias, et al. "A systematic review on the practice of evaluating visualization." IEEE Transactions on Visualization and Computer Graphics 19.12 (2013): 2818-2827.
● Borgo, Rita, et al. "Information visualization evaluation using crowdsourcing." Computer Graphics Forum. Vol. 37. No. 3. 2018.
● Kang, Youn-ah, and John Stasko. "Examining the use of a visual analytics system for sensemaking tasks: Case studies with domain experts." IEEE Transactions on Visualization and Computer Graphics 18.12 (2012): 2869-2878.