Embed Size (px)
Citation preview
Advanced Cyber-Physical Analysis for Smart Grid Distributed ICT and IED Resources at RTE France
Final Project Report
S-63G
Power Systems Engineering Research Center Empowering Minds to Engineer
the Future Electric Energy System
Advanced Cyber-Physical Analysis for Smart Grid Distributed ICT and IED Resources at RTE France
Final Project Report
Project Team Dave Bakken, Project Leader Washington State University
Anurag Srivastava
Washington State University
Vignesh V. G. Krishnan Washington State University
Graduate Students
Tanvi Ashwarya Alexander Askerman
Shyam Gopal Ren Liu
Arvind Mallikeswaran Shwetha Niddodi
Zhijie Nie Washington State University
PSERC Publication 18-04
July 2018

For information about this project, contact: Dave Bakken School of Electrical Engineering & Computer Science PO Box 642752, EME 102, Spokane Street Washington State University, Pullman, WA 99164-2752 Phone: (509) 335-2399 Email: [email protected] Anurag Srivastava School of Electrical Engineering & Computer Science PO Box 642752, EME 102, Spokane Street Washington State University, Pullman, WA 99164-2752 Phone: (509) 335-2348 Fax: (509) 335-3818 Email: [email protected] Power Systems Engineering Research Center The Power Systems Engineering Research Center (PSERC) is a multi-university Center conducting research on challenges facing the electric power industry and educating the next generation of power engineers. More information about PSERC can be found at the Center’s website: http://www.pserc.org. For additional information, contact: Power Systems Engineering Research Center Arizona State University 527 Engineering Research Center Tempe, Arizona 85287-5706 Phone: 480-965-1643 Fax: 480-727-2052 Notice Concerning Copyright Material PSERC members are given permission to copy without fee all or part of this publication for internal use if appropriate attribution is given to this document as the source material. This report is available for downloading from the PSERC website
2018 Washington State University. All rights reserved.
i
Acknowledgements We wish to thank for the support provided by PSERC’s industry members for this project: Patrick Panciatici (RTE France), Daniel Arjona (Idaho Power), and Juan Castaneda (SCE).
ii
Executive Summary
The availability of large amount of data in real time from Intelligent Electronic Devices (IEDs) at digital substations and distributed computational resources supported by Information and Communication Technology (ICT) offers opportunities and challenge for decentralized and distributed smart grid applications. However, the distributed computing infrastructures in utilities today are nowhere near adequate to exploit this potential, being decades behind those in other industries. This project will lead to several technologies and tools for distributed applications, and analyze others, to help utilities and vendors to develop next-generation cyber-physical infrastructure using distributed ICT and IED resources. The problems addressed by this project, as well as the software released, will be widely applicable to utilities, grid operators, and vendors. IEDs are being exploited for some possible applications but are far from possible potential to help improve the power grid operation. Many of the challenges to take a next step relate to ICT, where the state of the practice and adoption as offered by vendors are literally decades behind other industries. Lessons and best practices from other industries can be leveraged, but the electric sector is very unique in a number of ways. These include having ICT requirements — sometimes spanning many hundreds of miles, having legacy devices and protocols in the field having lifetime of several decades, and having to push for most economic solutions. The ICT infrastructure for power grids thus needs to make a quantum leap forward. The essence of this project is to provide cyber-physical analysis and tools to enable utilities and vendors to define its distributed ICT services that can better leverage IEDs to make the grid more reliable. New computing platforms can be tested and validated to perform specific tasks, specially distributed computing applications. The ability to stream data in real-time from hardware devices used in power grid is a huge plus for testing and validation of the specific computing platforms and software architecture. Being able to do so with a managed infrastructure between utility devices and the cloud via Cisco Fog is a great help in providing grid-appropriate ICT infrastructures, rather than adopting them from other industries with much weaker real-time requirements. One of the middleware tools Erkios, has been integrated into real time smart grid demonstration lab with real time digital simulator (RTDS), GridStat, relays, PMUs, and other hardware devices and software tools. Erkios can also include RAS logic directly into software tool, hence allowing initial testing without interfacing with actual hardware/software tool. DCBlocks are set of distributed coordination building blocks (DCBlocks) algorithms for enabling distributed fault tolerant computing for power grid applications. DCBlocks need customized hardware and software to implement distributed applications (e.g. RAS, distributed state estimation). Cisco Fog is used to connect applications at the network edge to the cloud in data centers. Fog uses a RESTful approach to describe and then manage this gap between the edges and the datacenter: network links, routers/switches, data, and computational nodes. This project successively evaluates Fog for suitability with advanced power infrastructures that can be very dynamic and include in-network processing (for example, in a Fog co-processor in a router). As
iii
part of this project we implemented distributed state estimation and RAS computational algorithm for proof of concept. Testing and implementing close-loop control applications have been accomplished by using distributed algorithms. Algorithms with higher complexity have been implemented using Cisco Fog and computational performance and ability to utilize streaming data have been explored. These algorithms may also require putting a database in a router. These activities have been done with regularly scheduled input from our Industrial Team Members: RTE, SCE, and Idaho Power. We are also thankful to other PSERC members that shaped this project and ensured that it has the broadest possible applicability. Additionally, this project resulted in following publications: Project Publications: [1] V. V. G. Krishnan, R. Liu, A. Askerman, A. Srivastava, D. Bakken, P. Panciatici,
“Resilient Cyber Infrastructure for the Minimum Wind Curtailment Remedial Control Scheme” in IEEE Industry Applications Society Annual Meeting, 2017, Oct 2017, Cincinatti, OH.
[2] Srivastava, V.V.G Krishnan, S. Gopal, R. Liu, Z. Nie, and D. Bakken, “Distributed and Resilient Control with Distributed Energy Resources”, book chapter in Intelligent Power Grid of Tomorrow: Modeling, Planning, Control, and Operation, Springer, 2018.
[3] V. V. G. Krishnan, S. Gopal, Z. Nie, and A. Srivastava, “Cyber-Power Testbed for Distributed Monitoring and Control” IEEE Cyher-Physical Systems Week, Porto, Portugal, April, 2018.
[4] R. Liu, A. Srivastava, D. Bakken, A. Askerman, and P. Panciatici, “Decentralized State Estimation and Remedial Control Action for Minimum Wind Curtailment Using Distributed Computing Platform,” IEEE Transactions on Industry Applications, 2017
[5] R. Liu, A. Srivastava, A. Askerman, D. Bakken, and P. Panciatici, “Decentralized state estimation and remedial control action for minimum wind curtailment using distributed computing platform,” in IEEE Industry Applications Society Annual Meeting, 2016, Oct 2016, pp. 1–9.
[6] V.V.G Krishnan, G. Shyam, R. Liu, Z. Nie, A. Srivastava, A. Askerman, D. Bakken, and P. Panciatici, “Resilient Information Architecture Platform for Distributed Linear State Estimation” IEEE Power Engineering Society General Meeting, 2018.
[7] Mallikeswaran, T. Ashwarya, S. Niddodi, A. Srivastava, D. E. Bakken and P. Panciatici, “Cyber Physical Simulation and Remote Testing of Remedial Action Schemes,” IEEE PES Transmission & Distribution Conference & Exposition, Dallas, USA, May 2-5, 2016.
[8] Malikeswaran, P. Banerjee, A Srivastava, D. Bakken and P. Panciatici, “In-field Testing and Validation of Synchrophasor-Based Remedial Action Scheme,” presentation at NASPI Work Group meeting, Chicago, USA, Oct 14-15, 2015.
[9] P. Banerjee, S. Niddodi, H. Lee, A. Srivastava, D. Bakken and Patrick Panciatici, “On the Need for Robust Decentralized Coordination to Support Emerging Decentralized Monitoring and Controls Applications in Electric Power Grid,” in Proc. of CIGRE 4th Grid of the Future Symposium, Chicago, USA, Oct 11-13, 2015.
iv
[10] Lee, Tushar, B. Cui, A. Mallikeswaran, P. Banerjee and A. Srivastava, “A review of synchrophasors applications in smart electric grid”, Wiley Interdisciplinary Reviews: Energy and Environment, July, 2016.
[11] D. Bakken, A. Askerman, A. Srivastava, P. Panciatici, M. Seewald, F. Columbus, and S. Jiang, “Towards Enhanced Power Grid Management via More Dynamic and Flexible Edge Computations”, Fog World Congress, Oct. 30-Nov. 1, 2017, Santa Clara, CA.
[12] Lee, S. Niddodi, A. Srivastava, and D. Bakken. “Decentralized Voltage Stability Control in the Smart Grid using Distributed Computing Architecture”, in Proceedings of the 2016 IEEE Industry Applications Society Annual Meeting (IAS), Portland, OR, 2-6 October, 2016.
[13] Askerman, D. Bakken, A. Hajbabaie and A. Srivastava, “DCBlocks for Secure Consensus within Autonomous Vehicle Formations”, CYBERSEC, Coeur D’Alene, ID, March, 2016.
Student Theses: [1] Mallikeswaran. Development and Testing of Synchrophasor Based Dynamic Remedial
Action Schemes. M.S., Washington State University, August 2015. [2] T. Ashwarya, Erkios 0.2: Integration of Real-time RAS with Erkios to Provide Real-Time
RAS Testing. M.S., Washington State University, December 2015. [3] S. Niddodi, Decentralized Coordination Building Blocks (Dcblocks) For Decentralized
Monitoring and Control of Smart Power Grids. M.S., Washington State University, December 2015.
[4] R. Liu, Cyber Physical Security Analysis for Wide Area Applications. Ph.D., September 2017.
v
Table of Contents
1. Introduction ............................................................................................................................. 1
1.1 Background .................................................................................................................... 1
1.2 Overview of the Problem ............................................................................................... 2
1.3 Report Organization ....................................................................................................... 2
2. Preliminary Study of Cisco Fog for Distributed Computing Based Power Grid Applications ............................................................................................................................. 3
2.1 Introduction and Motivation ........................................................................................... 3
2.2 Integration of RAS Logic into Erkios ............................................................................ 3
2.3 Real-Time Integration of Erkios into Smart Grid Demonstration Testbed .................... 4
2.4 Feasibility Evaluation of Cisco Fog ............................................................................... 6
2.4.1 DevNet Sandbox Access Available ................................................................... 6
2.4.2 Flexibility and Capability of Cisco Fog ............................................................ 7
3. Deployment of Cisco Fog with Power Grid Applications ...................................................... 9
3.1 Overview of Cisco Fog ................................................................................................... 9
3.1.1 Fog as a Platform ................................................................................................ 9
3.1.2 Fog in Hardware ................................................................................................. 9
3.2 RIAPS Software Platform ............................................................................................ 10
3.2.1 RIAPS on Cisco Fog Hardware........................................................................ 10
3.2.2 Differences ....................................................................................................... 10
3.2.3 Installation of RIAPS on Cisco Fog ................................................................ 11
3.2.4 Overlaps with WSU Projects ............................................................................ 12
3.2.5 Direct Comparison ........................................................................................... 12
3.3 Illustrative Application: Distributed Linear State Estimation ...................................... 13
3.4 Application Architecture .............................................................................................. 15
3.5 Testbed Setup and Simulation Results ......................................................................... 16
4. Implementation of the RTE France RAS Use Case with Wind for DCBlocks Using the Cyber-Physical Testbed ......................................................................................................... 18
4.1 Advanced Evaluation of Cisco Fog .............................................................................. 18
4.1.1 Flexibility of Cisco Fog .................................................................................... 18
4.1.2 Selective Information Pushing Based on Needs .............................................. 18
4.2 Implementation of RTE France RAS Use Case ........................................................... 18

vi
4.2.1 Mathematical Optimization Model of Wind Curtailment RAS ....................... 18
4.2.2 Testbed Setup ................................................................................................... 20
4.2.3 Simulation Results ............................................................................................ 21
4.2.4 Comparison of Online and Offline Simulation Results .................................... 23
4.3 Extended RAS Testing Cases Considering ICTs: Testing and Validations ................. 24
5. Conclusions ............................................................................................................................... 28

vii
List of Figures
Figure 2.1 Establishment of Cisco Fog Environment ..................................................................... 3
Figure 2.2 Architecture and Data Flows of End-to-End In-field RAS Testing .............................. 4
Figure 2.3 Real-time Cyber Physical Co-simulation using DeterLab ............................................ 6
Figure 2.4 Lack of Service Contract in Cisco Fog Ecosystem ....................................................... 7
Figure 2.5 Cisco DevNet Sandbox Cartridges ................................................................................ 7
Figure 2.6 Cisco IOx Local Manager Environment........................................................................ 8
Figure 3.1 RIAPS Architecture ..................................................................................................... 11
Figure 3.2 Groups for Distributed Linear State Estimation .......................................................... 13
Figure 3.3 Pi-Model of Transmission Lines ................................................................................. 13
Figure 3.4 Real-time Testbed Schematic Deployment of Cisco Fog Routers .............................. 16
Figure 3.5 Testbed Setup with BeagleBone Blacks ...................................................................... 17
Figure 3.6 Cisco Fog Routers Connected to RTDS ...................................................................... 17
Figure 4.1 Architecture of Cyber-Physical Testbed ..................................................................... 20
Figure 4.2 Single-Line Diagram of RTE-France 11-Bus System ................................................. 22
Figure 4.3 Software in the Loop Setup for Proposed RAS Architecture ...................................... 25
Figure 4.4 IEEE 14-Bus System Modelled in RTDS for Real-time RAS Validation .................. 26
viii
List of Tables
Table 1.1 Example of Wind Curtailment Issues ............................................................................. 1
Table 3.1 Comparison between RIAPS and Cisco Fog ................................................................ 12
Table 3.2 Performance Comparison between Centralized and Distributed Algorithm of LSE .... 17
Table 4.1 System Generation and Load during Normal Operating Condition ............................. 22
Table 4.2 Power Flow Comparing with Line Rating for Stressed Condition & Switching Mode Curtailment ................................................................................................................................... 23
Table 4.3 Contingency Scenario ................................................................................................... 23
Table 4.4 Simulation Results for Real-time and Offline Simulation for RTE System ................. 24
Table 4.5 Simulation Results of Wind Curtailment RAS ............................................................. 27

1
1. Introduction
1.1 Background The availability of data from Intelligent Electronic Device (IEDs) at substations and distributed computational resources offers great potential for enhancing the smart grid reliability and resiliency. However, the distributed computing infrastructures in utilities today are nowhere near adequate to exploit this potential, being decades behind those in other industries. This project aims to propose technologies and tools for distributed applications to help utilities and vendors to develop next generation cyber-physical infrastructure using distributed Information and Communication Technologies (ICT) and IED resources. In recent years, IEDs have been exploited for couple of application but far from their potential to help improve the smart grid monitoring and operation. Many of the issues here relates to ICT and the state of the practice as offered by vendors are literally decades behind other industries. The ICT infrastructure for power grids needs to make a quantum leap forward. The essence of this project is to provide cyber-physical analysis and tools to enable utilities and vendors to define its distributed ICT services that can better leverage IEDs to make the grid more reliable. Since the installation of wind farm is increasing rapidly, wind power has become an important renewable source of power generation in smart grids. Based on [1], the wind energy consumption is 19% of the total renewable energy consumption as in 2015, and the percentage is rapidly increasing. However, the wind generation highly depends on local weather condition. Intermittency and uncertainty in wind generation may cause exceeding the line ratings of the low voltage transmission lines, which requires wind generation curtailment to protect the transmission line from overload conditions.
Table 1.1 Example of Wind Curtailment Issues
Table 1.1 shows some of the wind curtailment conditions all over the world. In order to enhance the integration of wind renewable energy and maintain the reliability and stability of power system,
2
innovative automation and information technologies need to be deployed for the power system operation and control. Remedial Action Scheme (RAS) is an automatic control mechanism designed to detect the abnormal system conditions and take fast control action for maintaining the system reliability. A new RAS is developed to minimize the wind power curtailment and protect the transmission lines from overload/ congestion problems, which can be easily extended for voltage stability or other related problems. Distributing this RAS logic to multiple computers located near the edge improves the computational fault-tolerance, robustness and remedial action response times. To highlight this, how we run RAS logic in the testbed will evolve through a variety of configurations. Initially curtailment logic is run in a standard single, centralized style as a baseline for comparison. Distributed schemes have unique redundancy and fault-tolerance capabilities compared to a centralized system, often with measurable performance tradeoffs. 1.2 Overview of the Problem The major tasks of the research project are summarized as follows:
1) Deep analysis of CISCO Fog for distributed computing-based power grid applications 2) Integration of RAS logic into Erkios 3) Real-time Integration of Erkios into smart grid demonstration testbed 4) Use case analysis of RTE integrated with Erkios and smart grid demonstration testbed 5) Evaluate flexibility of Cisco Fog 6) Evaluate Cisco Fog for pushing selective information on demand based on dynamic
application needs for state estimation 7) Implement the RTE France RAS use case with wind for DCBlocks using the smart grid
demonstration cyber-physical testbed 8) Designing more testable RASs considering (and exploiting) ICT 9) Implement RTE specific complex applications to validate middleware using RTDS
Testbed 1.3 Report Organization The remaining chapters are organized as follows: Chapter 2 studies the requirements and feasibility of distributed computing platform by using Cisco Fog. Deployment of Cisco Fog and the software platform RIAPS and the cyber-physical architecture is detailed in Chapter 3. In addition, an illustrative application of distributed linear state estimation is presented. In Chapter 4, RTE France wind farm use case is implemented by applying the proposed architecture and wind curtailment RAS algorithm. Then, the conclusion of this report is presented in Chapter 5.
3
2. Preliminary Study of Cisco Fog for Distributed Computing Based Power Grid Applications
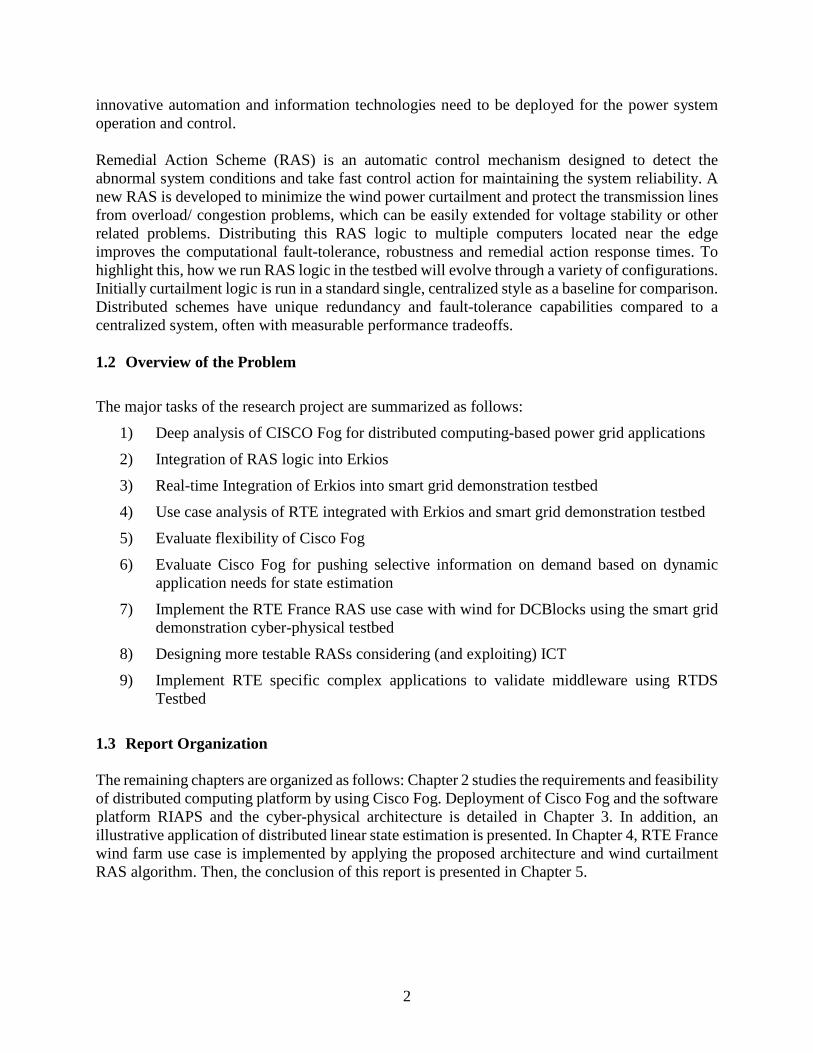
2.1 Introduction and Motivation This section will detail the increased access that WSU has had to Fog devices, largely in part due to the release of the Fog Director in the online developer sandbox. We’ve also received more access from the employees at Cisco, covering contact with industry advisors and a proposal for even further hardware access. The capabilities available to us now will be discussed in tandem with what will be evaluated and utilized upon complete access to the platform. How these capabilities can be harnessed for optimized data delivery with computations at the edge being the primary motivation for the evaluation and continual push to develop for the platform. Finally, implementing the RTE France wind farm use case, in a Fog environment is discussed.
Figure 2.1 Establishment of Cisco Fog Environment
2.2 Integration of RAS Logic into Erkios The first version of Erkios v0.1. The contributions were largely on the establishment of Erkios architecture, and what failure models and different components could be handled by Erkios [6]. To test this prototype, simple GUI menus are designed to insert some testing parameters. Erkios v0.2 has been developed as a successor of v0.1. The main contributions include replacing v0.1’s simple GUI logic for inserting values and enhancing the ability to code (in Java) actual RAS logics. This is being done in a way that allows for as much of reuse of code as possible. This is part of a 3-step buildup of capabilities:
1) Erkios v0.2 interfaced with RAS structure and logic emulation (actual structure of the RAS scheme, namely the substations involved and the order in which to invoke the local test device and the RAS logic on the given substation’s emulation)
2) Real-time integration of Erkios v0.2 (actual hardware in the lab replaces emulated
components above in 1).
3) Hardware in the lab in 2 replaced by actual substations in the field provide by RTE.

4
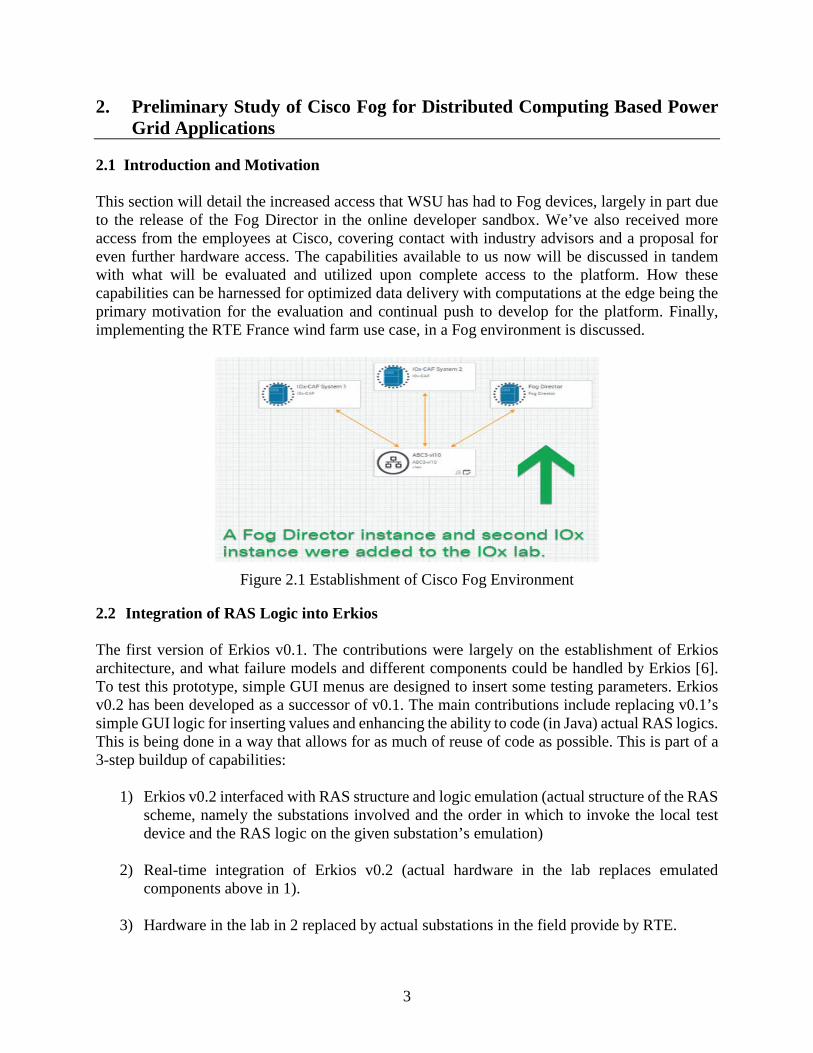
In future version or Erkios, when we have more use cases fully coded, we hope to create an object-oriented inheritance hierarchy of objects for use in a new Erkios RAS implementation. This will greatly increase potential reuse of various kinds of Erkios RAS code. 2.3 Real-Time Integration of Erkios into Smart Grid Demonstration Testbed In order to simulate the whole end-to-end in-field RAS testing architecture, RTDS is used as the power system simulator and analog signal generator available in Smart Grid Demonstration testbed. SEL-421 and SEL R-TAC are used as the sensor and the substation computer respectively. Irks modules are written in Java and utilize Remote Method Invocation (RMI) calls for communication between them. In order to simulate the Test WAN, DeterLab is used as the communication network emulator. DeterLab is a shared testbed facility designed for repeatable and controllable cyber-security experiment. In the DeterLab, hundreds of processors, several special hardware tools, and some software tools are integrated to create dynamically reconfigurable cyber security experiment. The architecture of end-to-end in-field testing of RAS by Erkios is shown in the Figure 2.2.
Figure 2.2 Architecture and Data Flows of End-to-End In-field RAS Testing
There are two different operation modes for this architecture:
1) Normal Operation 2) RAS Testing

5
In the Normal Operation mode, all the substations are connected to the rest of the power grid through the transmission lines. The sensors, which are Phasor Measurement Units in this case, measure the different parameters, such as voltage and current phasors, in all the substations. The measurements are delivered to the substation computer, which is implementing the RAS algorithm, based on C37.118 communication protocol. The substation computer runs the RAS algorithm and generates the appropriate control actions, which is sent to the respective relay, breaker, or actuator. The control actions are transmitted by a DNP 3.0 communication protocol. In the RAS testing mode, Erkios is involved as a middleware framework for RAS testing. The detailed data flow of the RAS testing mode is shown in the Figure 2.2. There are five main components for the RAS testing mode:
1. Erkios Master Computer: The Erkios Master Computer starts the testing processing. It generates the different parameters (voltage, current, breaker status, etc.) based on the user input, which selects the testing of RAS. The test signal comprises of the generated parameters and control bits (used to enable/disable components). The master computer also sends the test signal to LTS-Initiator in all the substations which are part of the RAS. The rest of the master computer functions are collecting the response signal from the LTS-Collector, creating the final test results, and logging into the Erkios database.
2. LTS-Initiator: LTS-Initiator is a part of the Erkios framework running on a computer in a substation. Based on the received test signal, LTS-Initiator enables the RAS testing mode by switching the sensor input to Input 2 (test input) and disables the actuator. It also encodes the received test parameter values into a digital signal and sends to an Analog Signal Generator.
3. Analog Signal Generator and Amplifier: The analog signal generator is a custom device which can receive the digital signal and generates a low power analog signal. In the RAS testing mode, it generates the analog signal based on the received digital signal from LTS-Initiator. The analog signal is delivered to an amplifier which will convert it into a high-power analog signal. This signal is fed into the sensor through wires.
4. Sensor and Substation Computer: Once the sensor receives the signal, the operations for the sensor and substation computer are the same with the normal operation.
5. LTS-Collector: LTS-Collector is another part of the Erkios framework, which runs on a computer in a substation. The function of LTS-Collector is to collect the control actions from the substation computer and send them back to Erkios Master Computer.
With the help of the DeterLab, the architecture of real-time cyber-physical co-simulation for RAS testing with Erkios is shown in the Figure 2.3.
6
Figure 2.3 Real-time Cyber Physical Co-simulation using DeterLab
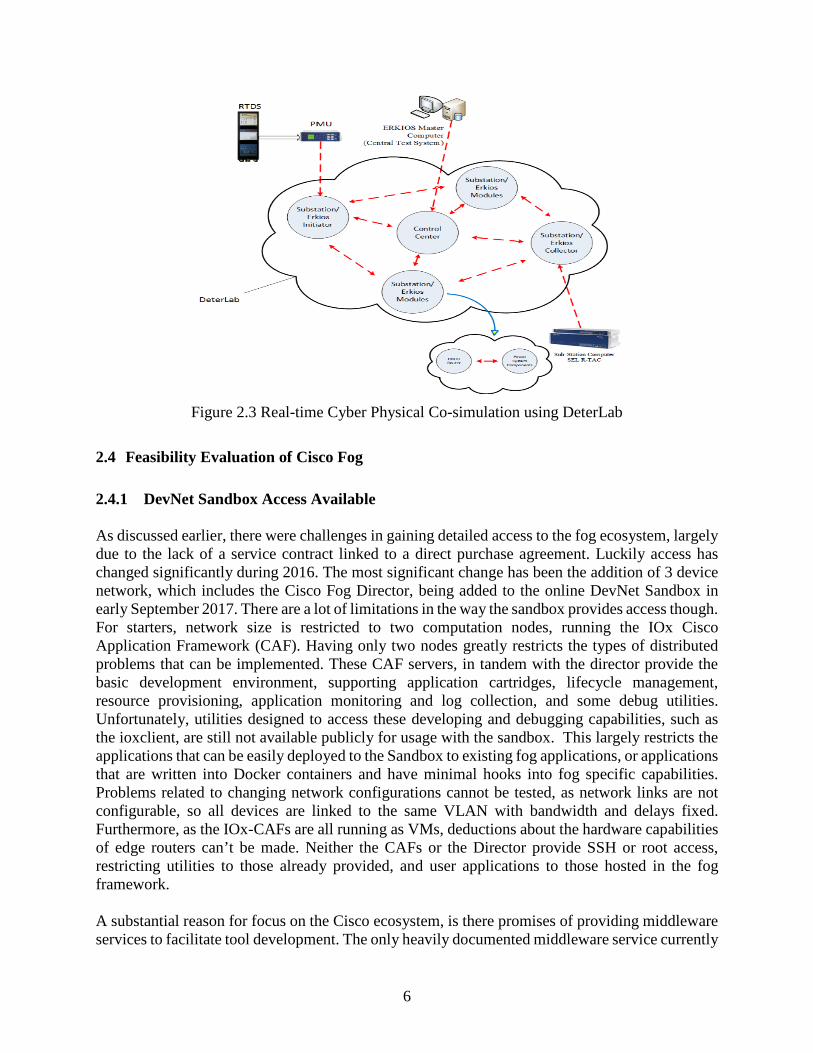
2.4 Feasibility Evaluation of Cisco Fog 2.4.1 DevNet Sandbox Access Available As discussed earlier, there were challenges in gaining detailed access to the fog ecosystem, largely due to the lack of a service contract linked to a direct purchase agreement. Luckily access has changed significantly during 2016. The most significant change has been the addition of 3 device network, which includes the Cisco Fog Director, being added to the online DevNet Sandbox in early September 2017. There are a lot of limitations in the way the sandbox provides access though. For starters, network size is restricted to two computation nodes, running the IOx Cisco Application Framework (CAF). Having only two nodes greatly restricts the types of distributed problems that can be implemented. These CAF servers, in tandem with the director provide the basic development environment, supporting application cartridges, lifecycle management, resource provisioning, application monitoring and log collection, and some debug utilities. Unfortunately, utilities designed to access these developing and debugging capabilities, such as the ioxclient, are still not available publicly for usage with the sandbox. This largely restricts the applications that can be easily deployed to the Sandbox to existing fog applications, or applications that are written into Docker containers and have minimal hooks into fog specific capabilities. Problems related to changing network configurations cannot be tested, as network links are not configurable, so all devices are linked to the same VLAN with bandwidth and delays fixed. Furthermore, as the IOx-CAFs are all running as VMs, deductions about the hardware capabilities of edge routers can’t be made. Neither the CAFs or the Director provide SSH or root access, restricting utilities to those already provided, and user applications to those hosted in the fog framework. A substantial reason for focus on the Cisco ecosystem, is there promises of providing middleware services to facilitate tool development. The only heavily documented middleware service currently

7
(or pending) implementation is the Cisco Data in Motion (DMo), self-described as mechanisms to capture data and control flows within the network and translate data into information for higher order applications, providing a restful API. But none of the middleware services are available or implemented in the sandbox. There does not appear to be any way to load your own middleware service, at least in the sandbox. Perhaps applications can be developed to appear as a middleware service, but it’s more likely that this category is reserved for Cisco development, and that any application that runs as a service for others must still be run as a packaged app. The platform is designed to load in multiple middleware services, akin to cartridges, into all the fog devices managed by the Director. Even though the software side continually is evolving, getting physical hardware will still sidestep some of the initial sandbox limitations and provide us with a service contract, so a proposal is pending to get access to multiple Cisco devices.
Figure 2.4 Lack of Service Contract in Cisco Fog Ecosystem
2.4.2 Flexibility and Capability of Cisco Fog Cisco DevNet sandbox allocates two instances of the IOx-CAF platform, running on Yocto Linux 1.7.2. The Fog Director runs in its own Ubuntu 14.04 VM. The platform uses a system they refer to as cartridges to load support for programming languages. The sandbox provides three major application environments, Python, Java and the binaries and libraries included in a standard Yocto Linux environment. As seen in the table, multiple of the same cartridges can be loaded in the Fog Director to support a variety of architectures, as some of the Cisco routers run PowerPC or ARM processors in addition to the desktop standard architecture of x86_64.
Figure 2.5 Cisco DevNet Sandbox Cartridges
Each IOx-CAF receives application packages or cartridges as they’re deployed by the Fog Director, which acts as the networks package management system. While app manifests can specify log locations and information to be reported back to the Director, each CAF also has a local manager in which in-depth information about the system is made available for monitoring
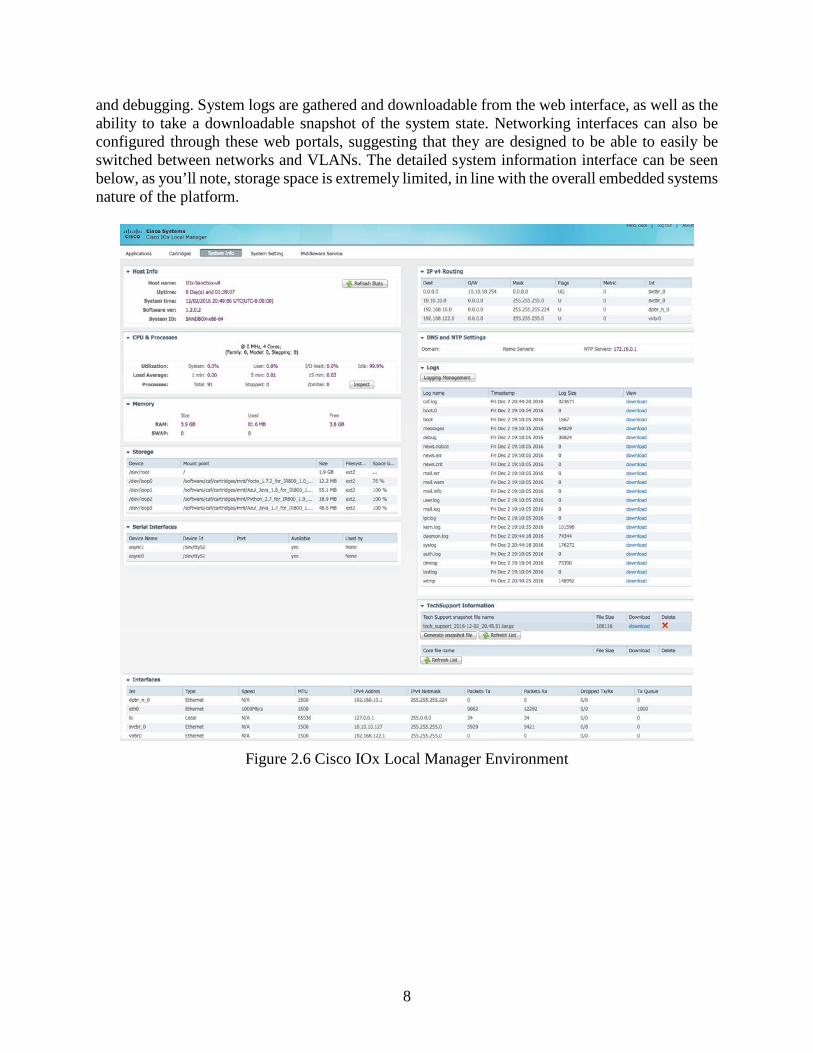
8
and debugging. System logs are gathered and downloadable from the web interface, as well as the ability to take a downloadable snapshot of the system state. Networking interfaces can also be configured through these web portals, suggesting that they are designed to be able to easily be switched between networks and VLANs. The detailed system information interface can be seen below, as you’ll note, storage space is extremely limited, in line with the overall embedded systems nature of the platform.
Figure 2.6 Cisco IOx Local Manager Environment

9
3. Deployment of Cisco Fog with Power Grid Applications
3.1 Overview of Cisco Fog This part of the report discusses the deployment of Cisco Fog routers at the Smart Grid Demonstration and Research Investigation Lab, Washington State University (WSU). Hardware and software capabilities of the Fog routers are outlined. Implementation of Resilient Information Architecture Platform for Smart Grids (RIAPS), a software framework for building distributed, fault tolerant, real-time smart grid applications on fog routers is discussed. Distributed Linear Estimation (DLSE) is implemented on the real-time testbed consisting of Real Time Digital Simulator (RTDS), hardware and software Phasor Measurement Units (PMUs) and Fog routers with RIAPS as distributed controllers. Finally, simulation results showing the performance of the DLSE algorithm on the testbed are given. 3.1.1 Fog as a Platform Fog computing is a term coined by Cisco to define a sort of network topology of endpoint devices, ostensibly internet of things components, and the requirements for utilities and programs to be deployed, managed and made accessible to services that depend on them. Its goal largely appears to define an ecosystem that addresses the problem of updating internet of things devices by forming a tighter connection between them and a managed cloud of services and additional devices. The idea is to define a set of programming and hardware principles that should be provided in a fog network to ensure that optimal operation of a program throughout its entire lifecycle. The fundamentals of Fog as an architecture are not directly specified by Cisco, but instead by the OpenFog Consortium, which have created the OpenFog Reference Architecture for Fog Computing (OpenFog Consortium Architecture Working Group, 2017). In their words, fog computing is “a horizontal, system-level architecture that distributes computing, storage, control and networking functions closer to the users along a cloud-to-thing continuum.” 3.1.2 Fog in Hardware Cisco has begun implementing their vision of fog through changes to the operating systems running up on their networking hardware. Their initial goal appears to be addressing the deployment of applications first and foremost, they accomplish this by deploying Docker boxes running alongside the core operating system. They’ve created a new management surface, the Fog Director, that gathers together information about all fog compatible devices in the network and allows deploying of boxes to deploy groups of them, as well as monitoring basic state information about the boxes. The overall hardware doesn’t undergo any fundamental changes, as the idea of Fog isn’t hardware dependent, and much more focuses on how the software is made and interacts with the network.
10
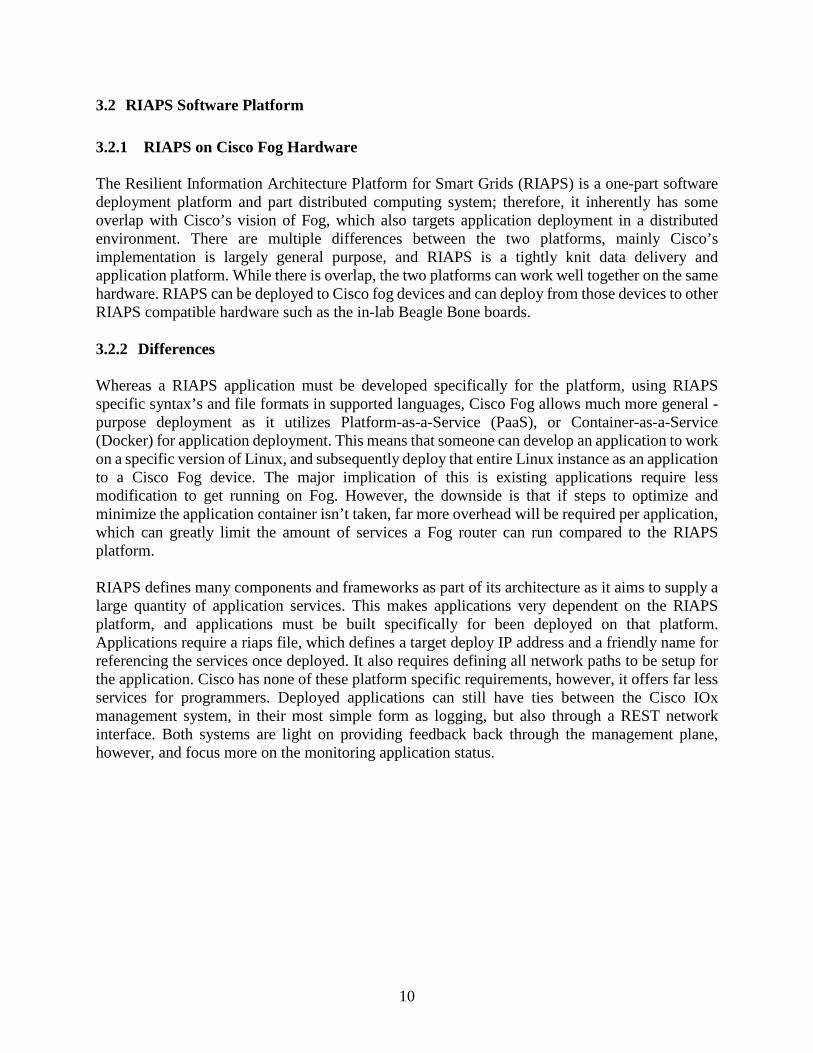
3.2 RIAPS Software Platform 3.2.1 RIAPS on Cisco Fog Hardware The Resilient Information Architecture Platform for Smart Grids (RIAPS) is a one-part software deployment platform and part distributed computing system; therefore, it inherently has some overlap with Cisco’s vision of Fog, which also targets application deployment in a distributed environment. There are multiple differences between the two platforms, mainly Cisco’s implementation is largely general purpose, and RIAPS is a tightly knit data delivery and application platform. While there is overlap, the two platforms can work well together on the same hardware. RIAPS can be deployed to Cisco fog devices and can deploy from those devices to other RIAPS compatible hardware such as the in-lab Beagle Bone boards. 3.2.2 Differences Whereas a RIAPS application must be developed specifically for the platform, using RIAPS specific syntax’s and file formats in supported languages, Cisco Fog allows much more general -purpose deployment as it utilizes Platform-as-a-Service (PaaS), or Container-as-a-Service (Docker) for application deployment. This means that someone can develop an application to work on a specific version of Linux, and subsequently deploy that entire Linux instance as an application to a Cisco Fog device. The major implication of this is existing applications require less modification to get running on Fog. However, the downside is that if steps to optimize and minimize the application container isn’t taken, far more overhead will be required per application, which can greatly limit the amount of services a Fog router can run compared to the RIAPS platform. RIAPS defines many components and frameworks as part of its architecture as it aims to supply a large quantity of application services. This makes applications very dependent on the RIAPS platform, and applications must be built specifically for been deployed on that platform. Applications require a riaps file, which defines a target deploy IP address and a friendly name for referencing the services once deployed. It also requires defining all network paths to be setup for the application. Cisco has none of these platform specific requirements, however, it offers far less services for programmers. Deployed applications can still have ties between the Cisco IOx management system, in their most simple form as logging, but also through a REST network interface. Both systems are light on providing feedback back through the management plane, however, and focus more on the monitoring application status.
11
Figure 3.1 RIAPS Architecture
3.2.3 Installation of RIAPS on Cisco Fog The RIAPS platform currently uses the Vagrant deploy system to create a virtual machine in VirtualBox. It does this by downloading a Linux image, Xubuntu, and then automatically modifying it to install all prerequisites as well as the RIAPS apps as well. RIAPS is dependent on Java and Python, but otherwise has minimal dependencies and can be installed directly from apt-get, though the Vagrant install process builds much of the components directly from the source. While someone could manually build a Docker image for RIAPS, and host it in the repository, it is better to utilize the existing Vagrant build tools to provide better future proofing and upgradability. Luckily, the Vagrant system can also start with a Docker image, and modify it to support the RIAPS platform. To start this process, a Jessie Debian Docker image is located, which was modified to be compatible with Vagrant. This large image is excessive, but simple to begin prototyping with, a smaller image could be made Vagrant compatible with a few simple additions, mainly having a default SSH user of Vagrant/vagrant. Before using Yuya Nishida’s Vagrant Debian Docker image, it need to be deployed directly from the Docker hub onto two IOx devices in the Cisco Sandbox to ensure compatibility. Even running a full Ubuntu desktop environment, the Docker image still clocked it at under 30% total CPU capacity, so it would work as a base point. Once this image had been setup with RIAPS installed, the Docker image can be deployed directly to the Fog devices, either from a Docker repository, or directly uploading the image. From this point only, networking must be configured to provide an IP address for the application image, upon SSH into the machine, the environment can be setup to accept deployed applications, or to deploy them. Unfortunately, the base Debian Docker image cannot be directly installed onto IOx, and configured, in place to run RIAPS, as the automatic container system does not allocate
12
sufficient space in the roots to support installing all the dependencies. As such, the Docker image must be sufficiently prepared beforehand, and then deployed to the Fog device. A more optimal install would be to utilize a PaaS installation. Thereby only installing the application logic and using a shared cartridge that contains all the dependencies of the RIAPS platform, namely Java and Python as well as the underlying file system. This keeps RIAPS fully separate from the operating system and dependencies, allowing both RIAPS and the underlying system to be updated independently from each other. This is significantly more time consuming as the existing deployment system for creating a RIAPS environment is not designed for this, and would require building the platform from source targeting a new platform, as well as developing a minimal filesystem cartridge of all its dependencies. 3.2.4 Overlaps with WSU Projects RIAPS is being developed in tandem with other smart grid utilities and applications at WSU. DcBlocks is a project that developed modular decentralized coordination components for the smart grid, parts of which have been adopted by the RIAPS platform, namely it’s phi accrual failure detector is planned to be used as part of its Fault Manager. Furthermore, applications developed on or for other platforms have or will be ported to it, currently windfarm line curtailment problems have been implemented to run on the platform, and it’s been setup to interface directly with physical lab Phasor Measurement Units (PMUs) as well as virtual RTDS PMUs and line meters. 3.2.5 Direct Comparison
Table 3.1 Comparison between RIAPS and Cisco Fog
Cisco Fog Director RIAPS
Deployment Summary
Uses Docker containers bundling applications with OS libraries. Alternative uses system cartridges and deploy an app that include a cartridge.
Deploys RIAPS programmed applications to RIAPS nodes.
Telemetry Logging, beyond liveness isn’t handled by the director. CLI to interact with clients and view logs.
CLI to view real-time printouts or logging.
Application Compatibility
Anything that can run in c1. micro lightweight Docker instances. No direct changes to applications required for simple deployment.
Any application written in C/C++ or python for the RIAPS platform. Application changes required to deploy
Data Framework & Flows
Not managed by the director. The application must contain hardcoded networking or utilize an additional deployed network service.
Hardcoded network links by IP or hostname. Early version of descriptive services and discovery is being implemented.
Time Synchronicity
No timing management services provided. Timing service could be deployed on each node in a separate container or bundled with applications.
1ms time synchronization support provided/in development. May require local GPS clocks at all nodes
13
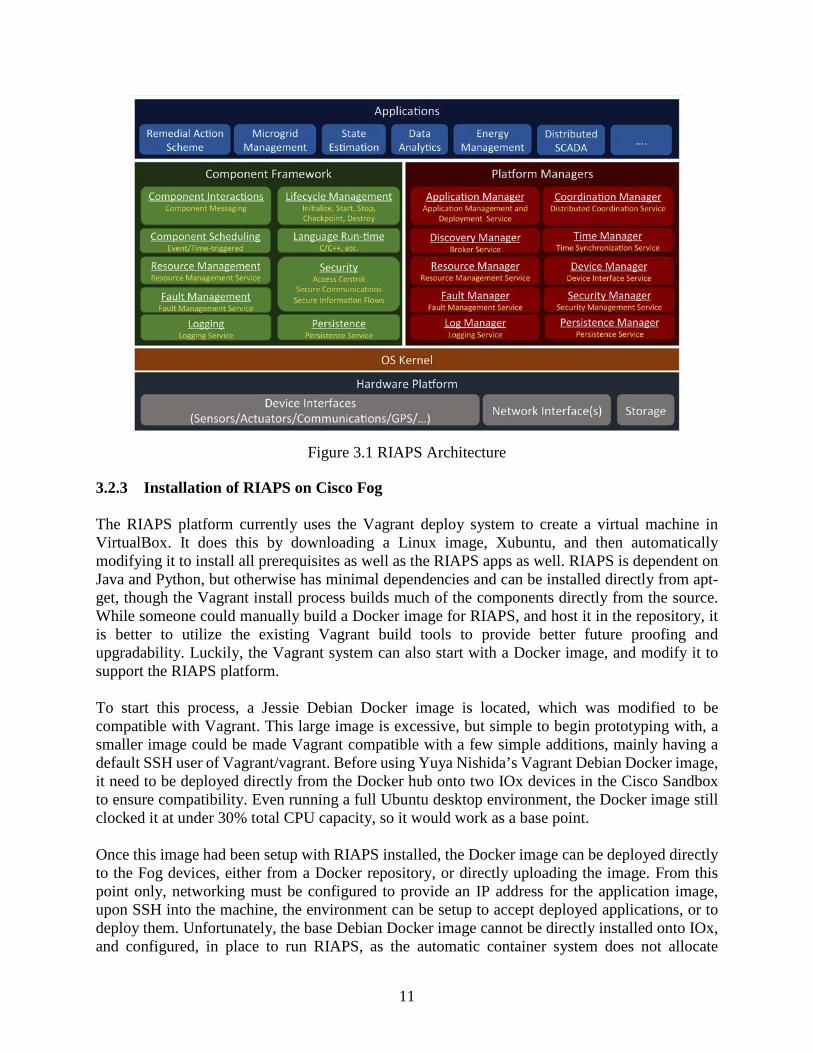
3.3 Illustrative Application: Distributed Linear State Estimation With the development of the smart grid technology, there is a significant increase in the deployments of the Phasor Measurement Units (PMU). Recent development in phasor technology makes high-speed time-synchronized phasor data available. These phasor values are utilized to run the state estimation. Traditional centralized state estimation (TCSE) runs only every 2-15 minutes. The operation speed of TCSE cannot meet the requirements of the Energy Management System (EMS) applications. New approach needs to be developed to provide the fast and accurate data to applications such as Remedial Action Schemes (RAS), voltage stability monitoring, etc. In order to solve this problem, Distributed Linear State Estimation (DLSE) is developed as an alternative solution. The main idea of DSE is to divide the power system computational data into a set of groups, and process in a distributed manner to reduce the computational burden.
Figure 3.2 Groups for Distributed Linear State Estimation
To start with, to initialize the DLSE algorithm, it is required to generate several groups. On the system. The grouping of system has some significant effects on the system considering the system requirements. An example of a system partition algorithm has been demonstrated in Figure 3.2. There are several critical factors affecting how the system is partitioned into different groups. Common factors used in partitioning can include the available computational resources, electrical distances, and the requirements of the applications, which would be applying the results of DLSE.
Figure 3.3 Pi-Model of Transmission Lines
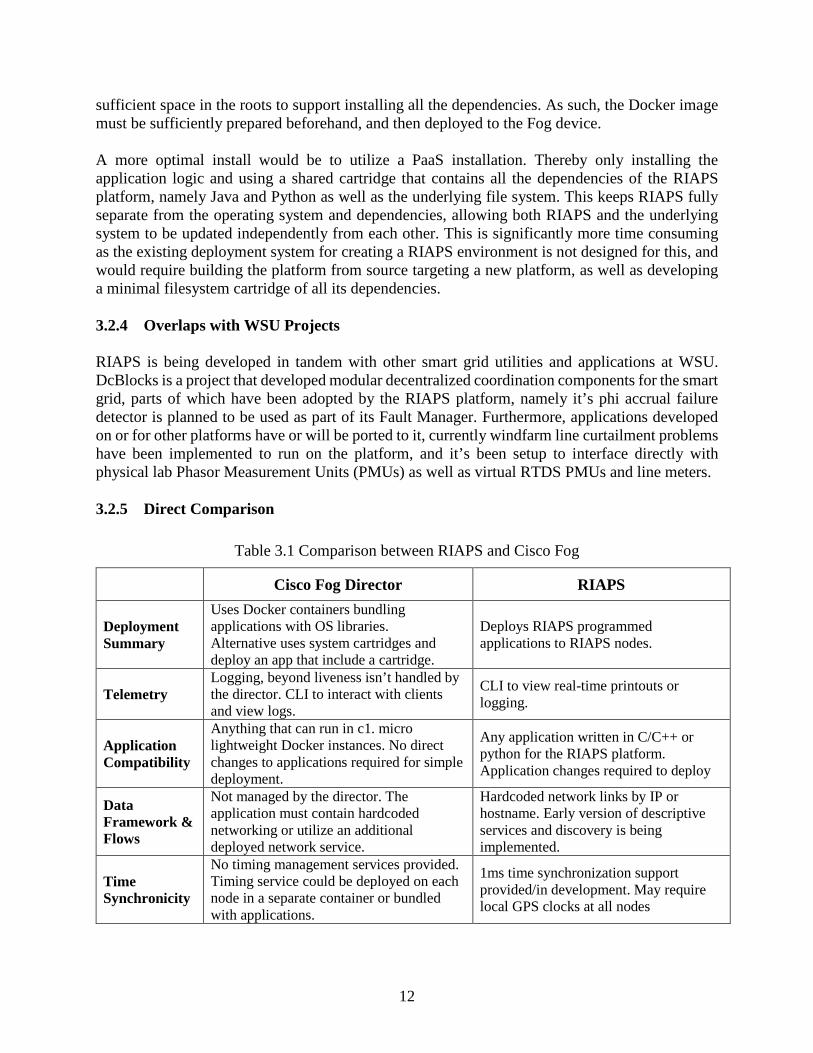
It is required to model the system network for developing a DLSE algorithm. Figure 3.3 shows the
Pi-model of a transmission line, where, and are the complex voltage value on bus i and j.
14
Yi0 and Yj0 are the transmission line charging admittance parameters. Yij is the transmission line admittance parameters between bus i and bus j. Based on the Kirchoff’s Current Law, the complex
current value from bus i to bus j can be calculate by using the following Eq. (3.1):
(3.1)
Where, Iij_R and Iij_I are the real and imaginary part of current Iij. Vi_R and Vi_I are the real and imaginary part of voltage value on the bus I. Vj_R and Vj_I are the real and imaginary part of voltage value on bus j. Since the PMUs can measure the voltage and current phasor values, the real part and imaginary part of current and voltage values can be converted from the phasor values. Therefore, the Eq. (3.1) can be rewritten in the complex format:
(3.2) Then the real part and imaginary part can be split using Eq. (3.2) as given in Eq. (3.3) and (3.4):
(3.3)
(3.4) Here, we assume N observable measurements of M substation buses in a particular initial group. And the measurements at some boundary buses are also observable in such a group. A general form of grouped measurements can be revealed in a compact form as:
(3.5) where, z denotes as the vector for the observable measurements. H is the Jacobian matrix used for linear state estimation. x is the vector of state, and here we introduce e as the noise vector with respect to the observable measurements in a specific group. In order to achieve the optimal solution for state estimation, weighted-least-squares (WLS) method is used to solve the linear state estimation model, where the objective function is to minimize the WLS of residuals:
(3.6) where, R is the covariance matrix of measurements, the values in this matrix depend on the accuracy of the corresponding measurements. The optimal solution of WLS problem is
(3.7)
where, is the optimal estimation of system state. In the application of DLSE, the proposed algorithm is also capable of estimating the voltage values at the boundary buses connected to its
15
adjacent groups. However, by using the DLSE algorithm, the estimated voltage values at the boundary buses are more accurate when computed within the group it belongs to. In this application, the optimal estimation at the boundary buses from adjacent groups are discarded, such that only the calculated values within its initialized group has been taken into consideration. By utilizing the GPS timing signals from all the PMUs, the phasor data inputs, which includes the real part and imaginary part in the complex form in all the groups are synchronized with the timestamps generated from the PMUs. 3.4 Application Architecture The application splits the DLSE calculation into 4 groups. Each group has access to some local measurements and performs part of the calculations required by the DLSE. The functions of each group are abstracted using into an actor called GroupActor. Each GroupActor consists of two components, a DataProvider and a StateEstimator. The DataProvider actor is responsible for reading data from some PMUs, parsing the data to extract the required measurements, and then sending this information to the nodes that require this data. The application has three DataProvider components, each of which belongs to a particular group and only accesses a subset of the sensors in the system. This component starts by connecting to the required PMUs using the IEEE C37.118 protocol. Each DataProvider component has a publisher-port which is used to publish data, and a timer-port that is used to specify how often this data should be sent out. The component continuously reads and caches data frames from all the PMUs it is connected to. When it receives a timer event, it parses its cached data frames to find the current and voltage phasors. These phasors along with a timestamp are packaged together as a PhasorData message and is sent out using the publisher-port, after which the message will be received by a StateEstimator component. The StateEstimator component is responsible for finding the results of state estimation. Each StateEstimator component has access to part of the readings of the power injection bus, which it uses to perform state estimation. The StateEstimator performs state estimation on the readings from the buses that are part of its group, but also requires some readings from other groups to fully perform the calculation. To get these readings, the StateEstimator component also subscribes to the PhasorData messages of the DataProvider components from which it requires readings. Since these messages may arrive at different times, the StateEstimator component uses the timestamp included in the messages to make sure all the data being used measured at the same time. After getting the required readings, the StateEstimator actor performs state estimation on the data, finds the estimated readings for all data, and calculates the root-mean-square error. This data may now be used for other applications. Resiliency is another important goal of this distributed application. The application is made to be fault tolerant by using a heartbeat mechanism. Each node in the system is assigned another node as a secondary node, or backup node. This backup node periodically monitors its primary node to make sure it is operational. When a backup node detects a failure, it takes over operation of the primary node along with its own operation. For example, consider node 2 as a primary node, and node 3 as its secondary backup. Node 2 continuously sends heartbeat messages to node 3 while it is operational. If node 2 loses power and fails, node 3 will not receive heartbeat messages from
16
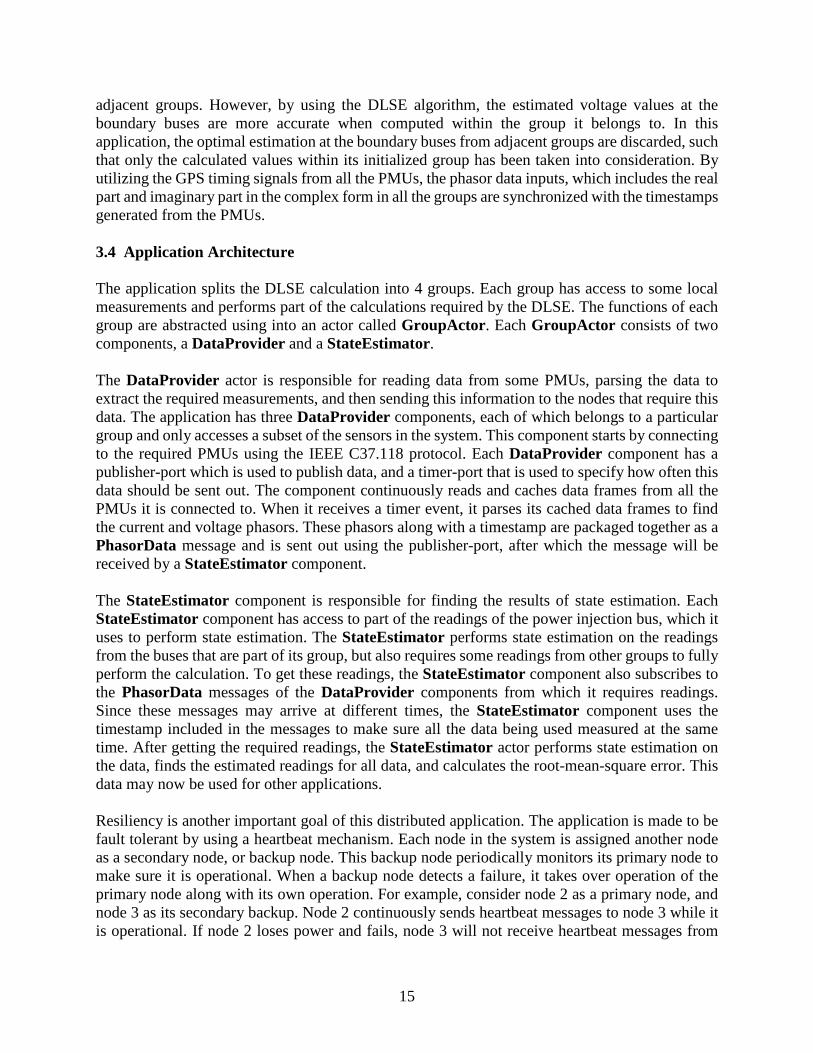
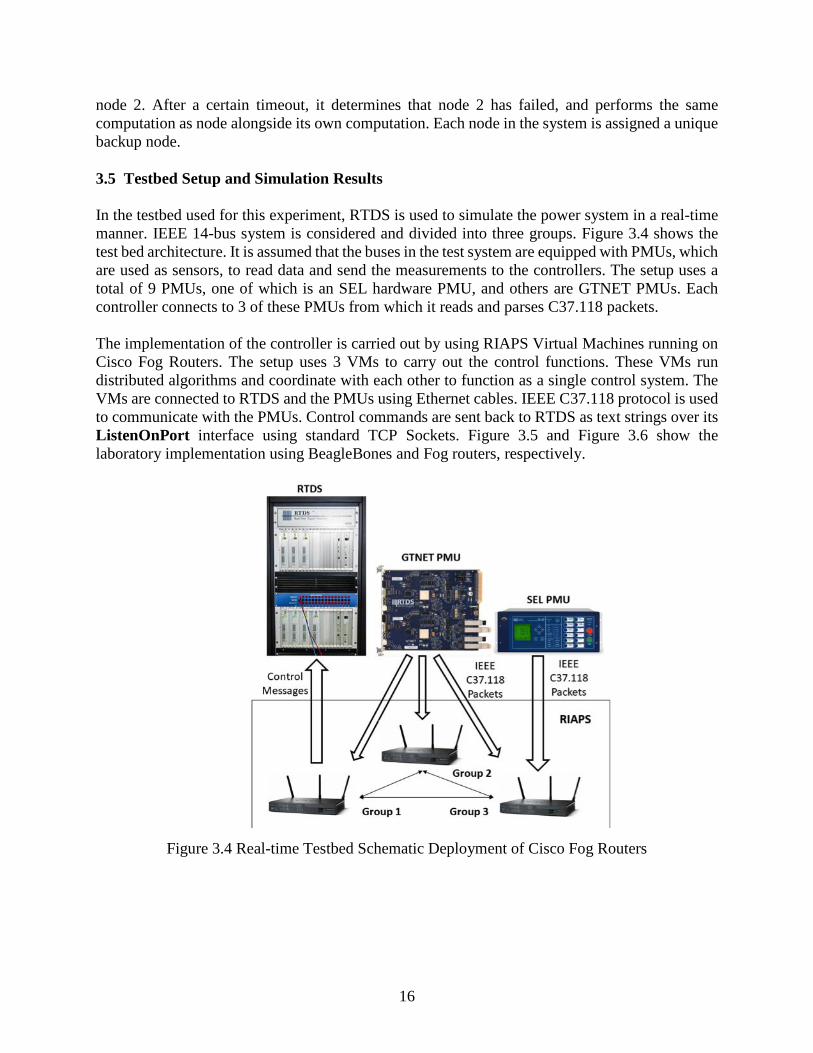
node 2. After a certain timeout, it determines that node 2 has failed, and performs the same computation as node alongside its own computation. Each node in the system is assigned a unique backup node. 3.5 Testbed Setup and Simulation Results In the testbed used for this experiment, RTDS is used to simulate the power system in a real-time manner. IEEE 14-bus system is considered and divided into three groups. Figure 3.4 shows the test bed architecture. It is assumed that the buses in the test system are equipped with PMUs, which are used as sensors, to read data and send the measurements to the controllers. The setup uses a total of 9 PMUs, one of which is an SEL hardware PMU, and others are GTNET PMUs. Each controller connects to 3 of these PMUs from which it reads and parses C37.118 packets. The implementation of the controller is carried out by using RIAPS Virtual Machines running on Cisco Fog Routers. The setup uses 3 VMs to carry out the control functions. These VMs run distributed algorithms and coordinate with each other to function as a single control system. The VMs are connected to RTDS and the PMUs using Ethernet cables. IEEE C37.118 protocol is used to communicate with the PMUs. Control commands are sent back to RTDS as text strings over its ListenOnPort interface using standard TCP Sockets. Figure 3.5 and Figure 3.6 show the laboratory implementation using BeagleBones and Fog routers, respectively.
Figure 3.4 Real-time Testbed Schematic Deployment of Cisco Fog Routers
17
Figure 3.5 Testbed Setup with BeagleBone Blacks
Figure 3.6 Cisco Fog Routers Connected to RTDS
The DLSE application was deployed on Cisco Fog routers, and its performance was compared to the centralized algorithm, which was also implemented in the same testing environment. The sum of errors of the three groups is compared to the error found using the centralized SE algorithm. The objective was to ensure that the error found using DLSE to be less than twice the error found using centralized LSE algorithm. Table 3.2 shows the results of implementation. It can be seen from the table that the sum of the errors of the DLSE groups is 0.11 + 0.17 + 0.12 = 0.40, which is less than twice the error found with a centralized state estimation.
Table 3.2 Performance Comparison between Centralized and Distributed Algorithm of LSE
DLSE CSE Group 1 Group 2 Group 3 Root Mean
Squared Error 0.11 0.17 0.12 0.21
18
4. Implementation of the RTE France RAS Use Case with Wind for DCBlocks Using the Cyber-Physical Testbed
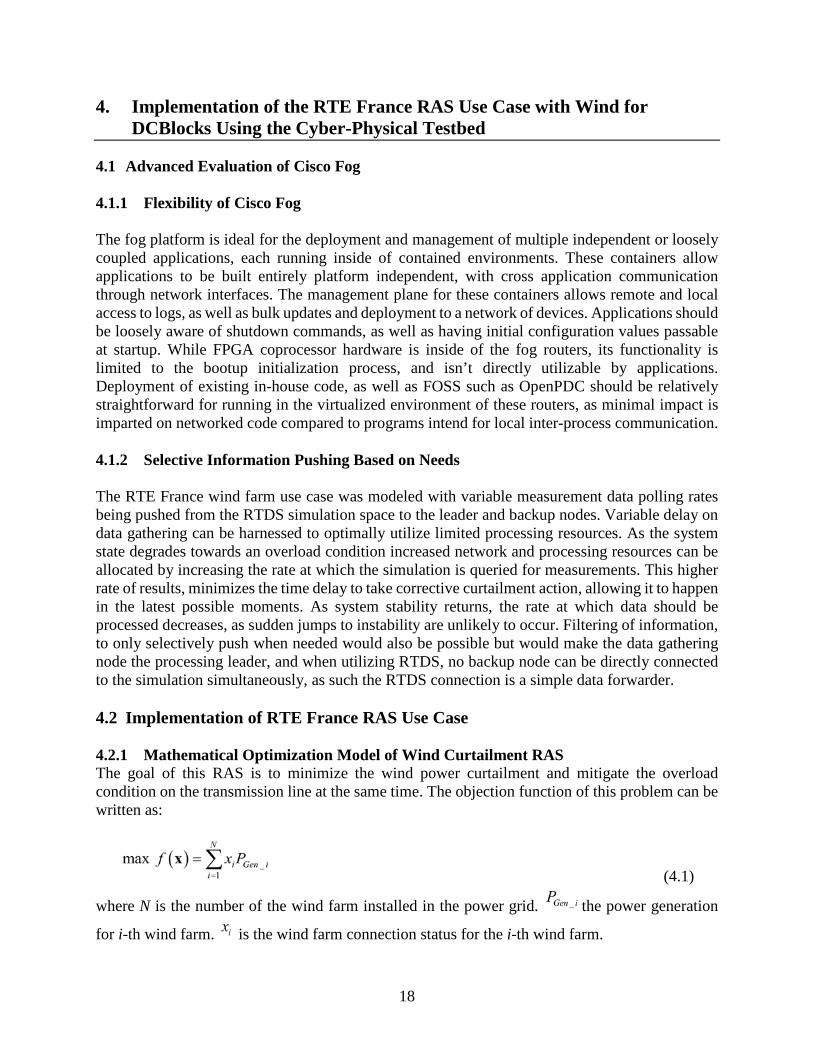
4.1 Advanced Evaluation of Cisco Fog 4.1.1 Flexibility of Cisco Fog The fog platform is ideal for the deployment and management of multiple independent or loosely coupled applications, each running inside of contained environments. These containers allow applications to be built entirely platform independent, with cross application communication through network interfaces. The management plane for these containers allows remote and local access to logs, as well as bulk updates and deployment to a network of devices. Applications should be loosely aware of shutdown commands, as well as having initial configuration values passable at startup. While FPGA coprocessor hardware is inside of the fog routers, its functionality is limited to the bootup initialization process, and isn’t directly utilizable by applications. Deployment of existing in-house code, as well as FOSS such as OpenPDC should be relatively straightforward for running in the virtualized environment of these routers, as minimal impact is imparted on networked code compared to programs intend for local inter-process communication. 4.1.2 Selective Information Pushing Based on Needs The RTE France wind farm use case was modeled with variable measurement data polling rates being pushed from the RTDS simulation space to the leader and backup nodes. Variable delay on data gathering can be harnessed to optimally utilize limited processing resources. As the system state degrades towards an overload condition increased network and processing resources can be allocated by increasing the rate at which the simulation is queried for measurements. This higher rate of results, minimizes the time delay to take corrective curtailment action, allowing it to happen in the latest possible moments. As system stability returns, the rate at which data should be processed decreases, as sudden jumps to instability are unlikely to occur. Filtering of information, to only selectively push when needed would also be possible but would make the data gathering node the processing leader, and when utilizing RTDS, no backup node can be directly connected to the simulation simultaneously, as such the RTDS connection is a simple data forwarder. 4.2 Implementation of RTE France RAS Use Case 4.2.1 Mathematical Optimization Model of Wind Curtailment RAS The goal of this RAS is to minimize the wind power curtailment and mitigate the overload condition on the transmission line at the same time. The objection function of this problem can be written as:
(4.1)
where N is the number of the wind farm installed in the power grid. the power generation
for i-th wind farm. is the wind farm connection status for the i-th wind farm.
19
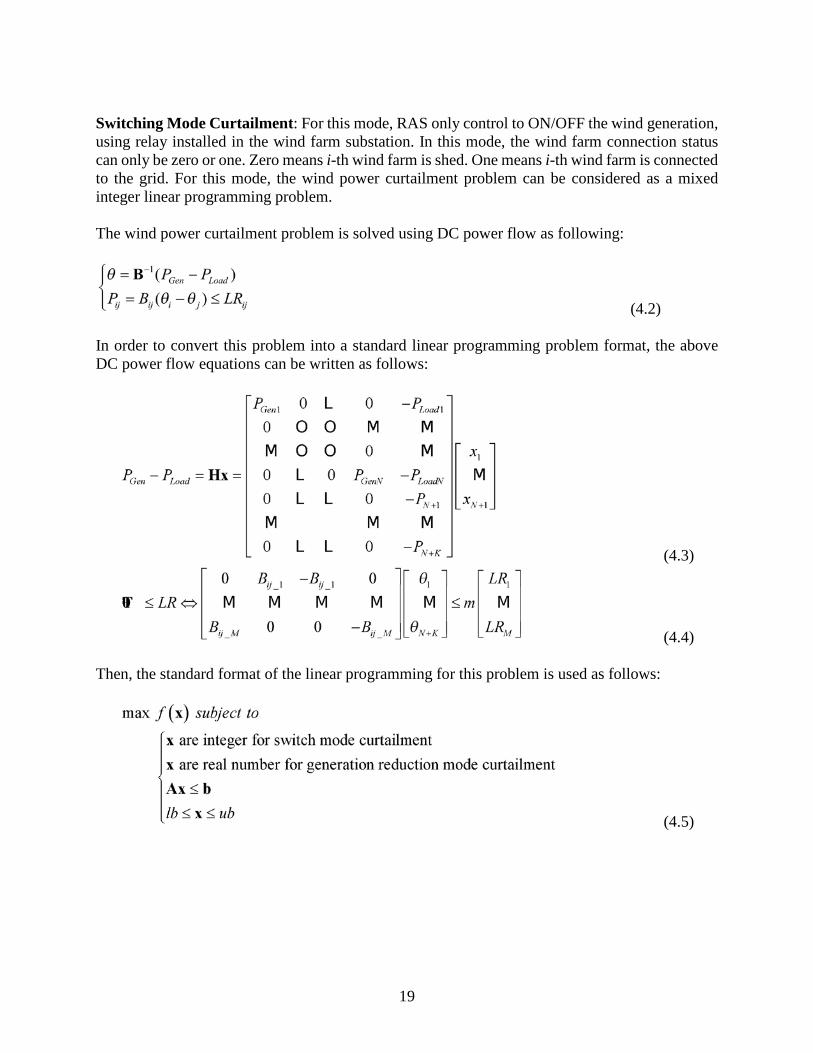
Switching Mode Curtailment: For this mode, RAS only control to ON/OFF the wind generation, using relay installed in the wind farm substation. In this mode, the wind farm connection status can only be zero or one. Zero means i-th wind farm is shed. One means i-th wind farm is connected to the grid. For this mode, the wind power curtailment problem can be considered as a mixed integer linear programming problem. The wind power curtailment problem is solved using DC power flow as following:
(4.2) In order to convert this problem into a standard linear programming problem format, the above DC power flow equations can be written as follows:
(4.3)
(4.4) Then, the standard format of the linear programming for this problem is used as follows:
(4.5)
20
where
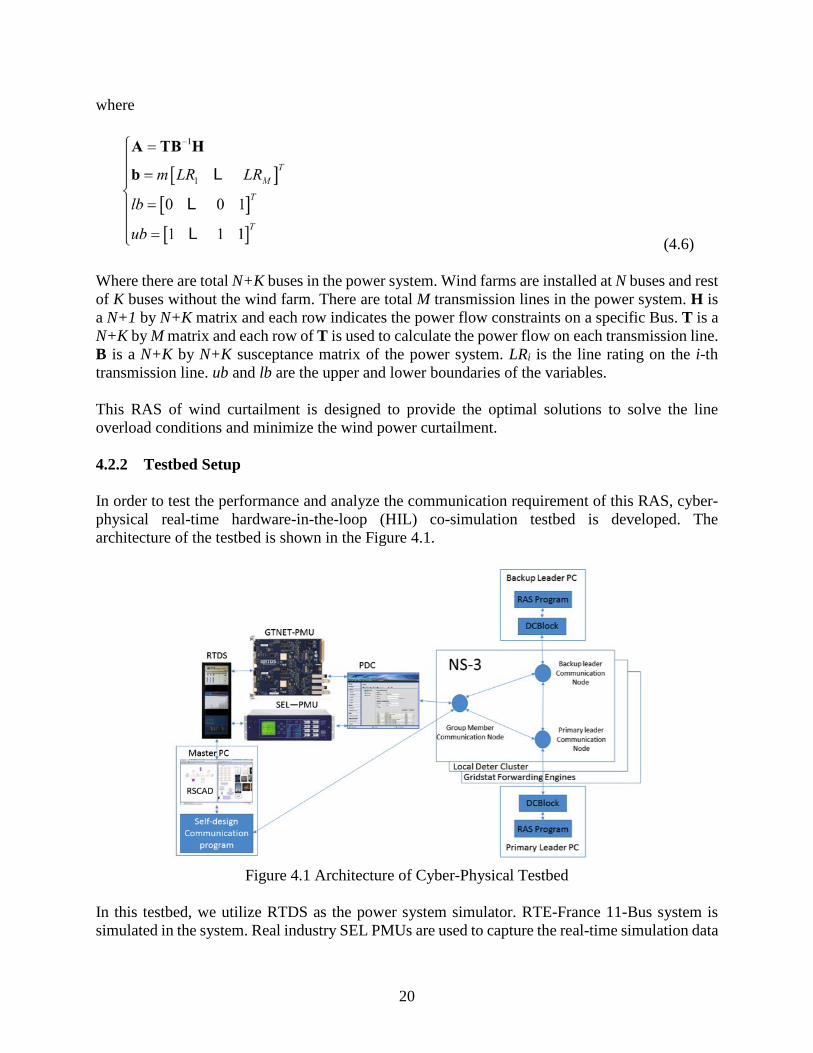
(4.6) Where there are total N+K buses in the power system. Wind farms are installed at N buses and rest of K buses without the wind farm. There are total M transmission lines in the power system. H is a N+1 by N+K matrix and each row indicates the power flow constraints on a specific Bus. T is a N+K by M matrix and each row of T is used to calculate the power flow on each transmission line. B is a N+K by N+K susceptance matrix of the power system. LRi is the line rating on the i-th transmission line. ub and lb are the upper and lower boundaries of the variables. This RAS of wind curtailment is designed to provide the optimal solutions to solve the line overload conditions and minimize the wind power curtailment. 4.2.2 Testbed Setup In order to test the performance and analyze the communication requirement of this RAS, cyber-physical real-time hardware-in-the-loop (HIL) co-simulation testbed is developed. The architecture of the testbed is shown in the Figure 4.1.
Figure 4.1 Architecture of Cyber-Physical Testbed
In this testbed, we utilize RTDS as the power system simulator. RTE-France 11-Bus system is simulated in the system. Real industry SEL PMUs are used to capture the real-time simulation data

21
from RTDS. The measured system phasor data are sent to SEL-PDC and PDC send the synchrophasor data based on C37.118 protocol on the NS-3 simulated communication network. Transitioning to DeterLab allows using the NS-3 network configuration with computation power available at each node, which is needed for testing certain faults, and utilizing multipath routing, such as what’s offered by GridStat, to provide further ICT traffic reliability. All data transfers along the group members, primary leaders, and backup leaders will pass through the emulated communication network in a real-time manner. The emulated communication network also needs to emulate the delays that occur in real world communication networks. NS-3 provides network processing delay, signal propagation delay, transmission delay, and queuing delay as a result of communication network emulation. Once the primary leader receives all the measurement data from data reporting members, DCBlock ensures replication of the data between itself and the backup leader. The RAS program uses this data to monitor the system status and calculates the appropriate control action if an overload problem is happening in the system. The control action will be sent through the NS-3 simulated communication network back to master PC. In the master PC, our self-designed communication program receives the control action and send it into RSCAD to control the breaker or wind farm output in the simulated power system. In a real-world implementation, these control actions would be routed directly to the appropriate wind farm given by the algorithm. Initial fault tolerance is provided through complete measurement data replication between the primary and backup leader. This allows near instantaneous rollover in the case that the primary computational node fails. Detecting a node failure is performed by heartbeat mechanics, in the simplest form ping can detect if a host is connectable, more advanced mechanisms provide even greater levels of confidence and more immediate fault recovery. DCBlocks utilizes the phi accrual failure detector equation that uses historical heartbeat inter-arrival times to report a suspicion level that a node has failed. 4.2.3 Simulation Results The RTE 11-Bus System is shown in the Figure 4.2. It includes 1 conventional generator, 8 loads, 6 wind farms, and 3 transformers. This system is developed based on input from IAB member RTE with high penetration of wind power and practical industrial scenarios. Linear and non-linear based advanced optimization algorithm have been developed for RAS for any overload conditions.

22
Figure 4.2 Single-Line Diagram of RTE-France 11-Bus System
In order to create the stressed system condition, we increase all the wind farm generation. The system3 generation and load condition are shown in the Table 4.1.
Table 4.1 System Generation and Load during Normal Operating Condition
Bus PGen (MW) QGen (MVAR) PLoad (MW) QLoad (MVAR)
1 25 -0.02 0 0
2 18 0.13 0 0
3 51 0.2 31 4.6
4 48 -0.08 0 0
5 11 -0.12 40 5.8
6 120 -0.05 0 0
7 0 0 25 4.5
8 0 0 55 11
9 0 0 51 11
10 0 0 25 7
11 0 0 46 -44
With the increasing of the wind speed, the power generation of wind farm in the Bus 6 is increased to 180 MW from 120 MW. During this stressed condition, the power flow comparing with line rating for each transmission line is shown in the Table 4.2. It is clear that the power flow on the transmission line from Bus 6 to Bus 7 goes over the line rating limit. Based on the traditional protection method, the whole wind farm generation, which is 180 MW, on Bus 6 will be shed in order to solve this overload problem. It can protect the transmission line from overload condition,
23
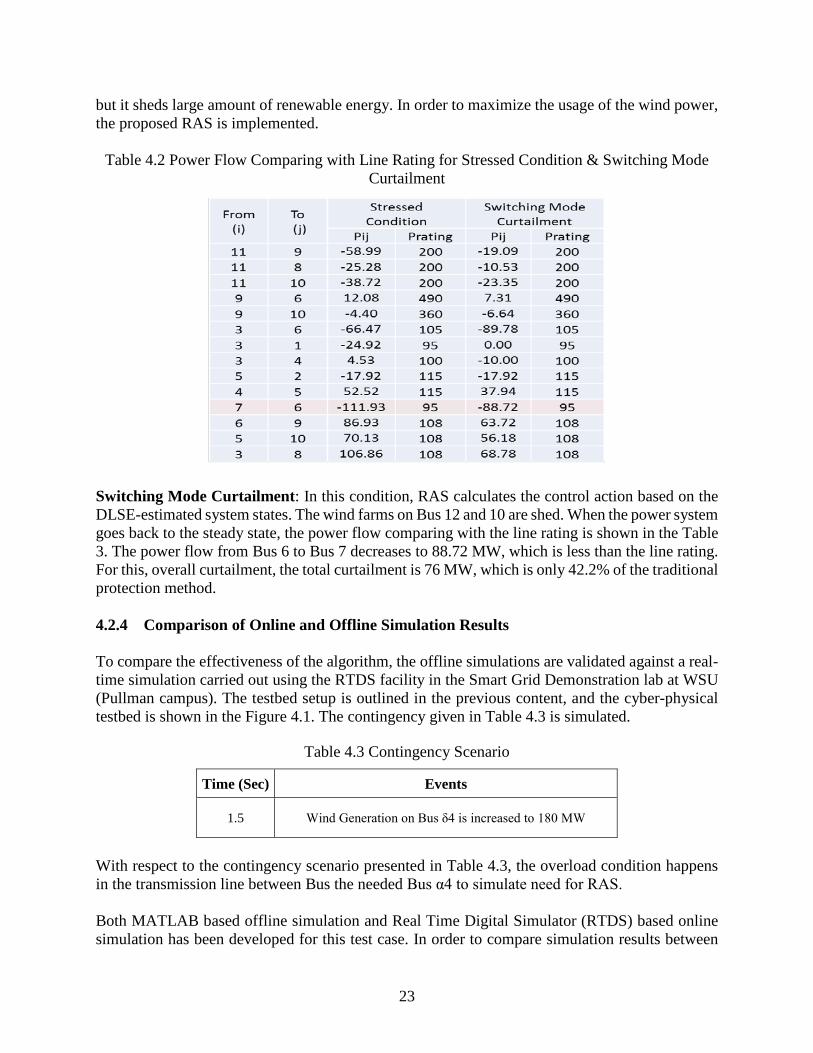
but it sheds large amount of renewable energy. In order to maximize the usage of the wind power, the proposed RAS is implemented.
Table 4.2 Power Flow Comparing with Line Rating for Stressed Condition & Switching Mode Curtailment
Switching Mode Curtailment: In this condition, RAS calculates the control action based on the DLSE-estimated system states. The wind farms on Bus 12 and 10 are shed. When the power system goes back to the steady state, the power flow comparing with the line rating is shown in the Table 3. The power flow from Bus 6 to Bus 7 decreases to 88.72 MW, which is less than the line rating. For this, overall curtailment, the total curtailment is 76 MW, which is only 42.2% of the traditional protection method. 4.2.4 Comparison of Online and Offline Simulation Results To compare the effectiveness of the algorithm, the offline simulations are validated against a real-time simulation carried out using the RTDS facility in the Smart Grid Demonstration lab at WSU (Pullman campus). The testbed setup is outlined in the previous content, and the cyber-physical testbed is shown in the Figure 4.1. The contingency given in Table 4.3 is simulated.
Table 4.3 Contingency Scenario
Time (Sec) Events
1.5 Wind Generation on Bus δ4 is increased to 180 MW
With respect to the contingency scenario presented in Table 4.3, the overload condition happens in the transmission line between Bus the needed Bus α4 to simulate need for RAS. Both MATLAB based offline simulation and Real Time Digital Simulator (RTDS) based online simulation has been developed for this test case. In order to compare simulation results between
24
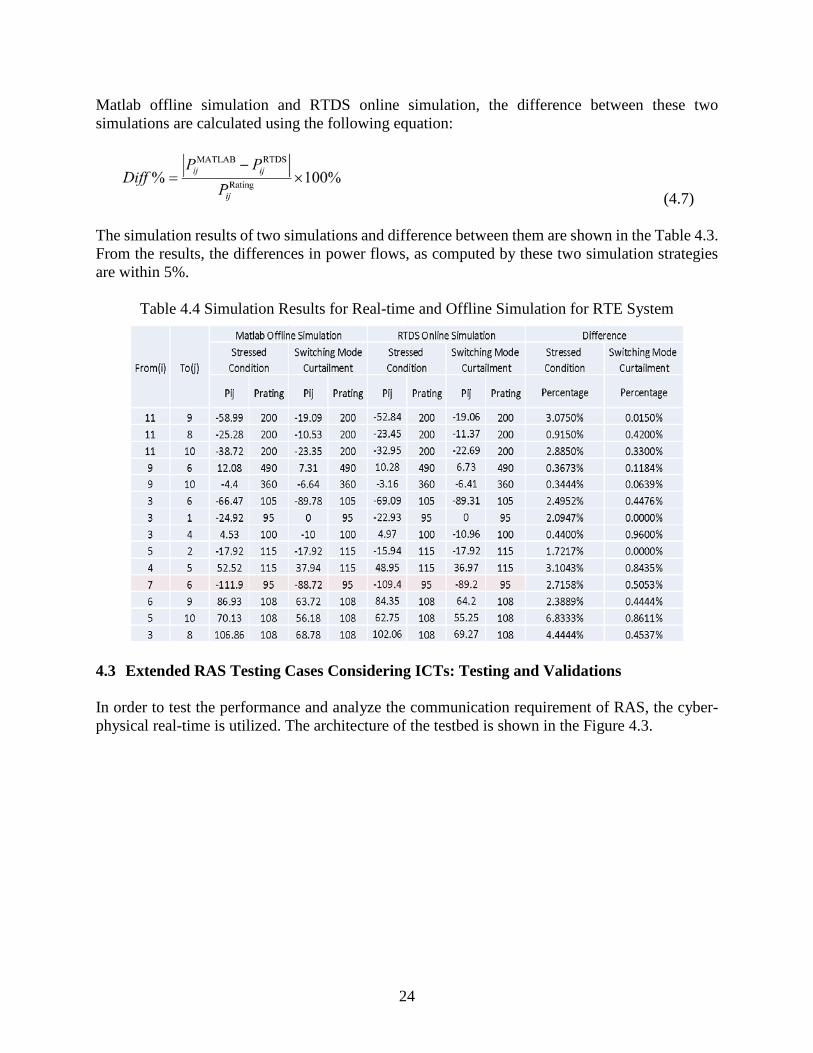
Matlab offline simulation and RTDS online simulation, the difference between these two simulations are calculated using the following equation:
(4.7) The simulation results of two simulations and difference between them are shown in the Table 4.3. From the results, the differences in power flows, as computed by these two simulation strategies are within 5%.
Table 4.4 Simulation Results for Real-time and Offline Simulation for RTE System
4.3 Extended RAS Testing Cases Considering ICTs: Testing and Validations In order to test the performance and analyze the communication requirement of RAS, the cyber-physical real-time is utilized. The architecture of the testbed is shown in the Figure 4.3.

25
Figure 4.3 Software in the Loop Setup for Proposed RAS Architecture
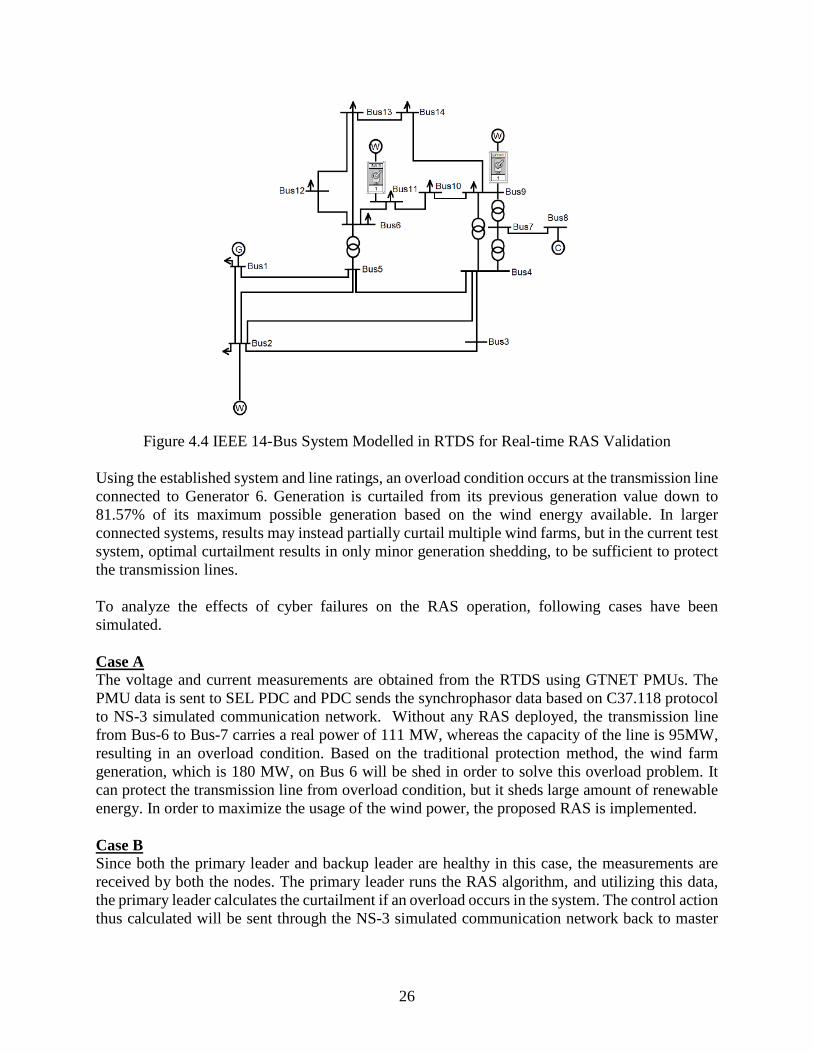
In a simple test case, each simulated substation has its own computation device (node), representing a real-time automation controller or substation PC. RTDS, simulating the grid network, is continually producing measurements for all buses selected at a substation. The measurements from the RTDS are obtained using a GTNET PMU, which is one of the firmware supported RTDS data sources. The measurements from the GTNET PMUs are routed to a PDC, which in turn send the data to a communication network, emulated using a NS-3 network simulator. For the real-time simulation, the RAS logic (outlined in previous report) is run within the testbed’s Matlab programming environment, providing real-time control actions to a modified test case provided by an industry partner, which is modeled and simulated in RTDS. The Modified IEEE 14 Bus system shown in Fig.4, includes 3 wind farms on bus 2, bus 9, and bus 11. An overload in the transmission line from bus 7 to bus 9 was created by increasing the generation of the wind farm at bus 9 from 60 MW to 100 MW.
26
Figure 4.4 IEEE 14-Bus System Modelled in RTDS for Real-time RAS Validation
Using the established system and line ratings, an overload condition occurs at the transmission line connected to Generator 6. Generation is curtailed from its previous generation value down to 81.57% of its maximum possible generation based on the wind energy available. In larger connected systems, results may instead partially curtail multiple wind farms, but in the current test system, optimal curtailment results in only minor generation shedding, to be sufficient to protect the transmission lines. To analyze the effects of cyber failures on the RAS operation, following cases have been simulated. Case A The voltage and current measurements are obtained from the RTDS using GTNET PMUs. The PMU data is sent to SEL PDC and PDC sends the synchrophasor data based on C37.118 protocol to NS-3 simulated communication network. Without any RAS deployed, the transmission line from Bus-6 to Bus-7 carries a real power of 111 MW, whereas the capacity of the line is 95MW, resulting in an overload condition. Based on the traditional protection method, the wind farm generation, which is 180 MW, on Bus 6 will be shed in order to solve this overload problem. It can protect the transmission line from overload condition, but it sheds large amount of renewable energy. In order to maximize the usage of the wind power, the proposed RAS is implemented. Case B Since both the primary leader and backup leader are healthy in this case, the measurements are received by both the nodes. The primary leader runs the RAS algorithm, and utilizing this data, the primary leader calculates the curtailment if an overload occurs in the system. The control action thus calculated will be sent through the NS-3 simulated communication network back to master
27
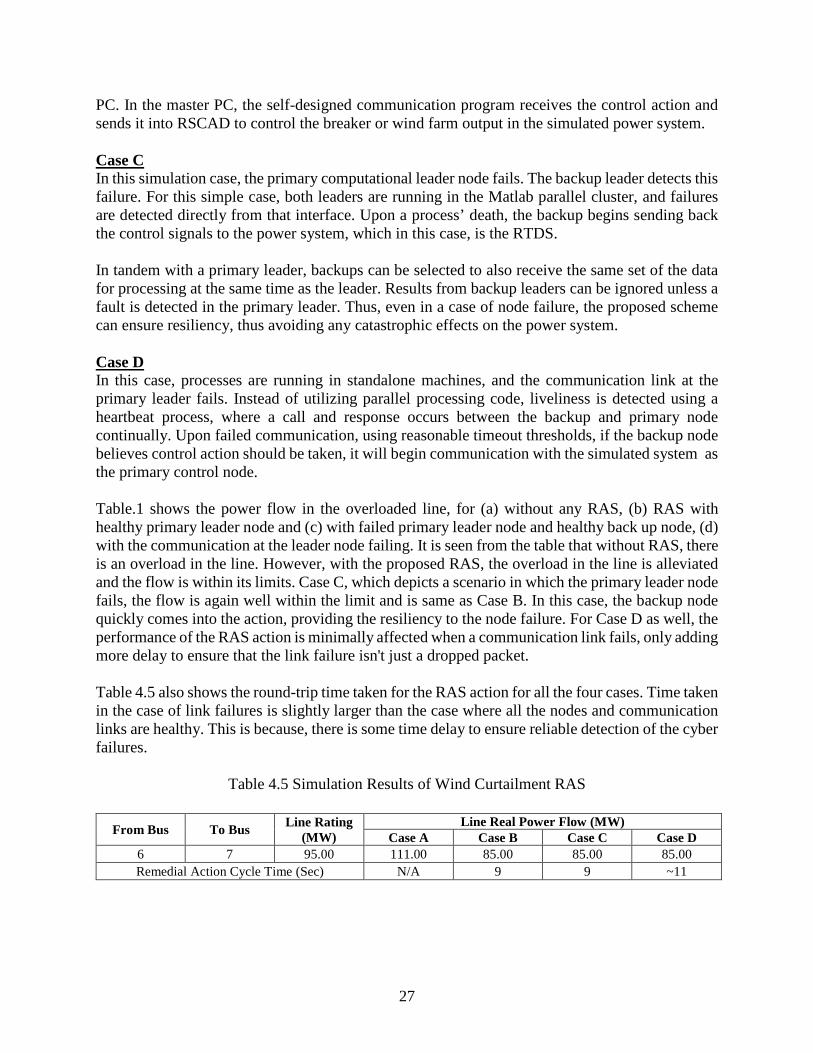
PC. In the master PC, the self-designed communication program receives the control action and sends it into RSCAD to control the breaker or wind farm output in the simulated power system. Case C In this simulation case, the primary computational leader node fails. The backup leader detects this failure. For this simple case, both leaders are running in the Matlab parallel cluster, and failures are detected directly from that interface. Upon a process’ death, the backup begins sending back the control signals to the power system, which in this case, is the RTDS. In tandem with a primary leader, backups can be selected to also receive the same set of the data for processing at the same time as the leader. Results from backup leaders can be ignored unless a fault is detected in the primary leader. Thus, even in a case of node failure, the proposed scheme can ensure resiliency, thus avoiding any catastrophic effects on the power system. Case D In this case, processes are running in standalone machines, and the communication link at the primary leader fails. Instead of utilizing parallel processing code, liveliness is detected using a heartbeat process, where a call and response occurs between the backup and primary node continually. Upon failed communication, using reasonable timeout thresholds, if the backup node believes control action should be taken, it will begin communication with the simulated system as the primary control node. Table.1 shows the power flow in the overloaded line, for (a) without any RAS, (b) RAS with healthy primary leader node and (c) with failed primary leader node and healthy back up node, (d) with the communication at the leader node failing. It is seen from the table that without RAS, there is an overload in the line. However, with the proposed RAS, the overload in the line is alleviated and the flow is within its limits. Case C, which depicts a scenario in which the primary leader node fails, the flow is again well within the limit and is same as Case B. In this case, the backup node quickly comes into the action, providing the resiliency to the node failure. For Case D as well, the performance of the RAS action is minimally affected when a communication link fails, only adding more delay to ensure that the link failure isn't just a dropped packet. Table 4.5 also shows the round-trip time taken for the RAS action for all the four cases. Time taken in the case of link failures is slightly larger than the case where all the nodes and communication links are healthy. This is because, there is some time delay to ensure reliable detection of the cyber failures.
Table 4.5 Simulation Results of Wind Curtailment RAS
From Bus To Bus Line Rating (MW)
Line Real Power Flow (MW) Case A Case B Case C Case D
6 7 95.00 111.00 85.00 85.00 85.00 Remedial Action Cycle Time (Sec) N/A 9 9 ~11
28
5. Conclusions
In this project, the cyber-physical analysis for distributed smart grid applications is addressed by an example remedial action schemes (RAS) for wind curtailment. The real-time cyber-physical architecture is established by using Cisco Fog and RTDS. This project has three major focuses:
1) Cisco Fog is the selected platform in this work for distributed computation. Fog computing is a term defined by Cisco, which is capable of managing multiple endpoint devices or Internet of Things (IoTs) components and is able to deploy programmed services to achieve certain objectives among these devices. In this project, the operation of Cisco Fog focuses on how the deployed software interacts with the endpoint devices through the network topology. To provide necessary supports according to the data delivery and applications for smart grid, Resilient Information Architecture Platform for Smart Grids (RIAPS) is deployed on Cisco Fog devices to set up a distributed computing environment for RAS applications.
2) Evaluations on Cisco Fog devices have been accomplished with respect to the flexibility in data delivery and pushing selective information. Independent and loosely-coupled applications are built entirely platform-independent with cross-application communication through network interfaces. On the other hand, due to the fact that event-based RAS applications are triggered by single or multiple measurement data, the deployed cyber platform can adaptively increase network and processing resources allocated by increasing the rate at which the simulation is queried for measurements, when the system state degrades.
3) Associated with the RTDS running as the real-time power system simulator, the proposed cyber-physical testbed architecture is completed by implementing distributed algorithm on endpoint devices (BeagleBone boards). Wind farm generation curtailment is one of the challenging problems and is mathematically formulated as an optimization problem of minimizing wind curtailment in this project. Distributed algorithm in solving the optimization problem is deployed on separate endpoint devices based on the RTE 11-bus system use case with wind farm generations. Simulation results show the proposed cyber-physical testbed is capable of achieving the optimal wind curtailment solutions in a real-time manner.
29
References
[1] EIA, Renewable Energy Production and Consumption by Source, US Energy Information Administration, 2015
[2] R. Liu, A. Srivastava, A. Askerman, D. Bakken, and P. Panciatici, “Decentralized state estimation and remedial control action for mini- mum wind curtailment using distributed computing platform,” in IEEE Industry Applications Society Annual Meeting, 2016, Oct 2016, pp. 1–9.
[3] S. Eisele, I. Mardari, A. Dubey, and G. Karsai, “Riaps: Resilient information architecture platform for decentralized smart systems,” in 2017 IEEE 20th International Symposium on Real-Time Distributed Computing (ISORC), May 2017, pp. 125–132.
[4] V.V.G Krishnan, G. Shyam, R. Liu, Z. Nie, A. Srivastava, A. Askerman, D. Bakken, and P. Panciatici, “Resilient Information Architecture Platform for Distributed Linear State Estimation” submitted Power Engineering Society General Meeting, 2018. (Under Review)
[5] Y. Gu and L. Xie, “Fast Sensitivity Analysis Approach to Assessing Congestion Induced Wind Curtailment,” in IEEE Transactions on Power Systems, vol. 29, no. 1, pp. 101-110, Jan. 2014.
[6] L. Oleas Chavez, “Erkios: End-to-End Field Based RAS Testing for Enhanced Blackout Protection”, M.S. Thesis, Washington State University, August 2014.
[7] L. Chavez, D. Bakken, A. Bose, P. Panciatici. “Erkios: End-to-end field-based RAS testing”, 2015 IEEE PES Innovative Smart Grid Technologies Conference, Washington, D.C., February 17-20, 2015.
[8] P. Banerjee, S. Niddodi, H. Lee, A. Srivastava, D. Bakken and Patrick Panciatici, “On the Need for Robust Decentralized Coordination to Support Emerging Decentralized Monitoring and Controls Applications in Electric Power Grid,” in Proc. of CIGRE 4th Grid of the Future Symposium, Chicago, USA, Oct 11-13, 2015.
[9] Mallikeswaran, T. Ashwarya, S. Niddodi, A. Srivastava, D. E. Bakken and P. Panciatici, “Cyber Physical Simulation and Remote Testing of Remedial Action Schemes,” Submitted to IEEE PES Transmission & Distribution Conference & Exposition, Dallas, USA, May 2-5, 2016.

![Cyber security in the Smart Grid: Survey and …ecee.colorado.edu/~ekeller/classes/fall2014_advsec/...Grid design [12,13]. Since the research on cyber security for the Smart Grid is](https://img.pdfslide.us/doc/110x75/5f76f61bea3afc7c365913d5/cyber-security-in-the-smart-grid-survey-and-ecee-ekellerclassesfall2014advsec.jpg)