Embed Size (px)
Citation preview

Title: Advanced Cuttings Transport Study Type of Report: Quarterly Technical Reporting Period Start Date: Oct. 1, 2001 Reporting Period End Date: Dec. 31, 2001
Principal Authors: Troy Reed, Principal Investigator Stefan Miska, Co-Principal Investigator Nicholas Takach, Co-Principal Investigator Kaveh Ashenayi, Co-Principal Investigator Gerald Kane Mark Pickell Len Volk Mike Volk Affonso Lourenco Evren Ozbayoglu Lei Zhou Date of Issue: Jan. 30, 2002 DOE Award Number: DE-FG26-99BC15178
The University of Tulsa
600 South College Avenue Tulsa, Oklahoma 74104

2
Title: Advanced Cuttings Transport Study Type of Report: Quarterly Reporting Period Start Date: Oct. 1, 2001 Reporting Period End Date: Dec. 31, 2001
Principal Authors: Troy Reed, Principal Investigator Stefan Miska, Co-Principal Investigator Nicholas Takach, Co-Principal Investigator Kaveh Ashenayi, Co-Principal Investigator Gerald Kane Mark Pickell Len Volk Mike Volk Affonso Lourenco Evren Ozbayoglu Lei Zhou Date of Issue: Jan. 30, 2002 DOE Award Number: DE-FG26-99BC15178
The University of Tulsa
600 South College Avenue Tulsa, Oklahoma 74104

3
DISCLAIMER
This report was prepared as an account of work sponsored by an agency of the United States Government, Neither the United States Government nor any agency thereof, nor any of their employees, makes any warranty, express or implied, or assumes any legal liability or responsibility for the accuracy, completeness, or usefulness of any information, apparatus, product, or process disclosed, or represents that its use would not infringe privately owned rights. Reference herein to any specific commercial product, process, or service by trade name, trademark, manufacturer, or otherwise does not necessarily constitute or imply, its endorsement, recommendation, or favoring, by the United States Government or agency thereof. The views and opinions of authors expressed herein do not necessarily state or reflect those of the United States Government or any agency thereof.

4
1. SUMMARY OF CURRENT TASKS FOR ACTS PROJECT
This is the second quarterly progress report for Year 3 of the ACTS project. It includes a review of progress made in: 1) Flow Loop development and 2) research tasks during the period of time between Oct 1, 2001 and Dec. 31, 2001. This report presents a review of progress on the following specific tasks: a) Design and development of an Advanced Cuttings Transport Facility
(Task 3: Addition of a Cuttings Injection/Collection System), b) Research project (Task 6): “ Study of Cuttings Transport with Foam Under
LPAT Conditions (Joint Project with TUDRP)”, c) Research project (Task 9): “ Study of Foam Flow Behavior Under EPET
Conditions”, d) Research project (Task 10): “Study of Cuttings Transport with Aerated Mud
Under Elevated Pressure and Temperature Conditions”, e) Research on instrumentation tasks to measure: - Cuttings concentration and distribution in a flowing slurry (Task 11), and - Foam properties while transporting cuttings. (Task 12), f) Development of a Safety program for the ACTS Flow Loop. Progress on a comprehensive safety review of all flow-loop components and operational procedures. (Task 1S). g) Activities towards technology transfer and developing contacts with Petroleum and service company members, and increasing the number of JIP members.

5
2. EXECUTIVE SUMMARY OF PROGRESS Flow Loop Construction (Task 3) The detailed designs for a Cuttings Injection/Collection System were completed. This is the primary construction task during Year-3. The design details were submitted for bids and Weamco Engineering was awarded a contract to fabricate a high-pressure Cuttings Injection Hopper and a Collection/Separation Tower. It is anticipated that both units will be received and installed by the end of the grant’s third quarter (March 31). Additional discussion of the Flow Loop is given in Section 3 of this report. Study of Cuttings Transport with Foam Under LPAT Conditions, (Task 6). A layered cuttings transport model is developed with a set of seven equations (2 mass balance, 3 momentum balance, pressure-drop, in-situ cuttings concentration and slip velocity between the cuttings and the fluid) and seven unknowns (velocities in each layer, thickness for each layer, in-situ cuttings concentration, pressure drop and slip velocity between the cuttings and the fluid). A computer simulator is constructed based on the developed cuttings-transport model. Some of the details are discussed in Section 4. Study of Foam Flow Behavior Under EPET Conditions, (Task 9). Work on this research task has now been completed. A summary of results and conclusions are presented in Section 5 of this report. Copies of the thesis report will be provided to the DOE and all JIP sponsors. One of the important findings from this research task is that bubble size has a primary effect on the apparent viscosity of a foam. This identified the need to have an instrument that can generate a foam with a controlled bubble size and then measure its rheological properties. This has led to the development of a new concept for achieving these objectives. It is expected that a patent application for this new tool will be filed with the US Patent Office. Study of Cuttings Transport with Aerated Mud Under Elevated Pressure and Temperature Conditions, (Task 10). A review of the relevant literature and study of the previous work done by TUDRP/ACTS are continuing. A Mathematical modeling is under development. The model is based on an analysis of cuttings-transport phenomena using a layered model. Application of the Principle of Volume Equalization in the model is also being studied. Primary tests have been conducted to test the capacity of the ACTS flow loop for two-phase flow experiments. A Revised test matrix for two-phase flow experiments has been developed. As part of the planned tests, two nuclear densitometers will be used to measure slurry density, the size of slugs and their velocity. Calibration of the densitometers is underway. Testing is expected to begin in late March or early April, 2002. These tests will begin after the Cuttings Injection and Collection System is installed and commissioned.

6
Research on Instrumentation to Measure Cuttings Concentration and Distribution in a Flowing Slurry, (Task 11). A PC board has been developed. A PC will use the PC board to collect data for analysis. We are in the process of implementing some final modifications. The analysis software development is progressing. We will use a technique similar to CT scan approach to create a 3D representation from 2D input. A clear plastic test cell has been designed and built. Some preliminary tests have been conducted. Plans include finishing and implementing the hardware modification and finalize development of the firmware and then test it. At the same time, we are continuing our efforts to implement our data analysis software. This task is reviewed in Section 7. Research on Instrumentation to Measure Foam Properties while Transporting Cuttings, (Task 12). Except for a few minor details, construction of the Dynamic Testing Facility has been completed. An optical box, several optical cells and various optical mounts have been constructed to develop simple, low-cost methods for bubble characterization. The status of this work is reviewed in Section 8. Safety Program for the ACTS Flow Loop, (Task 1S) An Action Plan is being developed to correct hazards identified by the Hazards Review. Additional discussion of this task appears in Section 9. Activities towards Technology Transfer, Developing Contacts with Petroleum & Service Company Members, and Addition of JIP Members. TotalFina-Elf decided to join the Project during this past quarter. We continue to expect that Conoco will join in the near future. The next ACTS-JIP Advisory Board Meeting is scheduled for May, 21, 2002. In addition, we are continuing to make new contacts with other companies in the Petroleum Industry in our search for additional JIP members. Further discussion of these activities is given in Section 10.

7
TABLE OF CONTENTS DISCLAIMER .……….…………………………………………………….… 2 1. SUMMARY OF CURRENT TASKS FOR ACTS PROJECT …………. 3 2. EXECUTIVE SUMMARY OF PROGRESS ……………………………. 4 LIST OF FIGURES ………………………………………………….… 7 3. ACTF DESIGN AND CONSTRUCTION ACCOMPLISHMENTS ……... 8 4. STUDY OF CUTTINGS TRANSPORT WITH FOAM UNDER LPAT CONDITION ………………………………………………….…….……….. 13
5. STUDY OF FOAM FLOW BEHAVIOR UNDER EPET CONDITIONS … 17 6. STUDY OF CUTTINGS TRANSPORT WITH AERATED MUDS UNDER EPAT CONDITIONS ………………………………………………………… 22 7. DEVELOPMENT OF CUTTINGS MONITORING METHODOLOGY …… 31 8. DEVELOPMENT OF METHODS FOR CHARACTERIZING BUBBLES IN ENERGIZED FLUIDS ………………………………………………….… 33
9. SAFETY PROGRAM ……………………………………………………… 36
10. TECHNOLOGY TRANSFER ……………………………………………… 38

8
LIST OF FIGURES ACTF DESIGN AND CONSTRUCTION (Task 3) Fig. 3.1 – Existing Foam Breaker Tower …………………………….. 9 Fig. 3.2 – Fabrication of Collection/Separation Tower …………………….. 9 Fig. 3.3 – Fabrication of Cuttings Injection Hopper …………………….. 10 Fig. 3.4 – Fabrication of One of Five Personnel Access Platform ……….. 10 Fig. 3.5 – Schematic of ACTS Flow Loop ……………………………….. 11 STUDY OF CUTTINGS TRANSPORT WITH FOAM UNDER LPAT (Task 6, Sec. 4) Fig. 4.1 – Screenshot of the Cuttings-Transport Simulator ………………. 15 STUDY OF CUTTINGS TRANSPORT WITH AERATED MUDS UNDER EPAT (Task 10, Sec. 6) Fig. 6.1 – Surface Area per unit Volume vs Void Fraction of Packed Cuttings .. 25 Fig. 6.2 – Wall Shear Stress vs Wall Shear Rate for Intermittent Pipe Flow .…. 27 Fig. 6.3 – Wall Shear Stress vs Wall Shear Rate for Intermittent Pipe Flow .…. 28 DEVELOPMENT OF METHODS FOR CHARACTERIZING BUBBLES IN ENERGIZED FLUIDS (Task 12, Sec. 8) Fig. 8.1 – Optical Arrangements for Measuring Foam Quality and
Average Bubble Size .…………………...…………………….. 35

9
3. ACTF DESIGN AND CONSTRUCTION ACCOMPLISHMENTS 3.1 Construction – Oct. 1 through Dec. 31, 2001 Foam tests at pressures up to 650 psi gauge and temperatures of 185 F were completed during this quarter. An MS thesis has been written by Lourenco, and the results are discussed in Section 5 of this report. Designs for a Cuttings Injection Hopper and a Cuttings Collection/Separation Tower were completed, and Weamco, Inc. is currently building both units in Tulsa. The existing Foam Breaker Tower, shown in Fig. 3.1, was sent to Weamco to become part of the Cuttings Collection/Separation Tower. Additional supplementary equipment such as a Johnson Screen, an Auger for the Injection Hopper, a loading elevator, related piping additions and electrical components will be ordered during the third quarter (first quarter 2002). In addition, liquid hold-up piping, new field terminals for receiving instrumentation signals, pump suction piping modifications, view ports and a drilling choke will all be installed along with the Cuttings system . It is currently expected that installation of this new system will be completed by March 31, 2002. and the commissioning process will begin then.
Photos of the Hopper and Tower in the fabrication process are shown Figs. 3.2, 3.3 and 3.4.

9
Figure 3.1 - Existing Foam Breaker Tower
Figure 3.2 - Fabrication of Collection/Separation Tower

10
Figure 3.3 - Fabrication of Cuttings Injection Hopper
Figure 3.4 - Fabrication of One of Five Personnel Access Platforms

11
The Injection Hopper and Removal Tower will be installed in the Flow Loop as indicated in Figure 3.5.
P T4
TS1
FT3
D P 4 P T5
D P 2 P T2
TS2
TS4
TS10
D P 3 P T3
D P 1 PT1 TS8
TS7
TS9
TS6
TS5
TS3
Figure 3.5 - Schematic of ACTS Flow Loop The Liquid Hold-up piping, which was scheduled for installation this past season but deferred in order to not interfere with on-going experiments, will be installed during the same time. It will include a new Air Receiver Tank, currently in construction. This will allow gas to expand from one known volume into another and permit calculations of the amount of gas captured within the annulus during a liquid and gas hold-up measurement. Other modifications which have been completed this past quarter or will be completed in the first quarter 2002 include: • New field terminals for all the Test Loop instrumentation. These
instruments (e.g., pressure transmitters, temperature transmitters, etc.) currently are individually wired into the control room. The signals are processed there and sent to the computer for data acquisition or system control. The new field terminals will process the signals on the spot and transmit them all through a single coaxial Ethernet cable. This will relieve a considerable congestion currently growing in the existing buried conduits, provide much greater flexibility in the future and immediately provide a more reliable signal.
• The 4-inch Fisher choke valve has been relocated to the piping
immediately upstream of the existing static mixer. This will allow additional shear energy to be added to the flow during foam experiments and will provide a way to control the foam generation process. Actuation will be from the Control Room where the input parameters can be carefully controlled.

12
• Piping modifications have been made to the suction side of both the Moyno and the Halliburton pumps. These modifications will allow both pumps to be operated in parallel for greater flow volume.
• A remote readout for the large Micro Motion flow meter has been installed
on the control console of the Halliburton pump. This will allow the operator to be able to more accurately adjust the flow volume from his station at the pump controls.
Additional new components which are still in progress include: • One two-inch, one three-inch, and three six-inch view ports have still yet to
be received from the manufacturer for a variety of technical problems that they are still working on. A TU representative is planning to travel to the manufacturer to help resolve these problems in the near future.
• The internal feed auger for the Cuttings Injection Hopper is in various
stages of progress. An auger has been located and ordered but extensive modifications will be required. This and the fittings required for its installation should be completed in the first quarter 2002. The drive mechanism for the auger will be installed soon after that.
• The Johnson Screen for cuttings separation in the Cuttings Removal
Tower is to be donated by the manufacturer, but its construction has not been started yet. However, we are confident that it will be completed and installed in the first quarter 2002.
• We have been advised by SWACO that they are donating a Super-Auto
Drilling Choke for our use on the Test Loop. This will be a secondary choke device used between the annular Drilling Section and the Cuttings Removal Tower for those instances where additional pressure drop at that location will prevent over pressurization of the Cuttings Removal Tower or assist in pipe flow to the Tower by allowing a controlled amount of gas expansion.
13
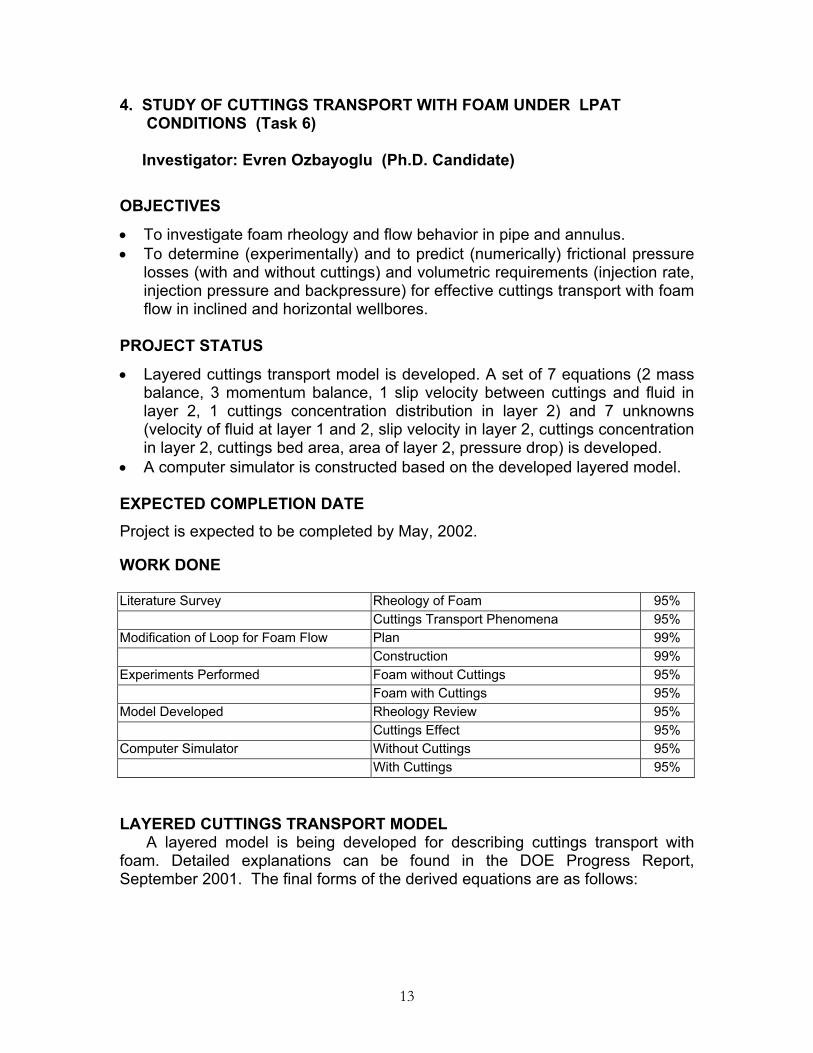
4. STUDY OF CUTTINGS TRANSPORT WITH FOAM UNDER LPAT CONDITIONS (Task 6) Investigator: Evren Ozbayoglu (Ph.D. Candidate)
OBJECTIVES
• To investigate foam rheology and flow behavior in pipe and annulus. • To determine (experimentally) and to predict (numerically) frictional pressure
losses (with and without cuttings) and volumetric requirements (injection rate, injection pressure and backpressure) for effective cuttings transport with foam flow in inclined and horizontal wellbores.
PROJECT STATUS
• Layered cuttings transport model is developed. A set of 7 equations (2 mass balance, 3 momentum balance, 1 slip velocity between cuttings and fluid in layer 2, 1 cuttings concentration distribution in layer 2) and 7 unknowns (velocity of fluid at layer 1 and 2, slip velocity in layer 2, cuttings concentration in layer 2, cuttings bed area, area of layer 2, pressure drop) is developed.
• A computer simulator is constructed based on the developed layered model. EXPECTED COMPLETION DATE Project is expected to be completed by May, 2002. WORK DONE
Literature Survey Rheology of Foam 95% Cuttings Transport Phenomena 95% Modification of Loop for Foam Flow Plan 99% Construction 99% Experiments Performed Foam without Cuttings 95% Foam with Cuttings 95% Model Developed Rheology Review 95% Cuttings Effect 95% Computer Simulator Without Cuttings 95% With Cuttings 95% LAYERED CUTTINGS TRANSPORT MODEL
A layered model is being developed for describing cuttings transport with foam. Detailed explanations can be found in the DOE Progress Report, September 2001. The final forms of the derived equations are as follows:

14
Mass Conservation
( ) ( )1 1III I f II II f C w C fA A C A Cυ ρ υ ρ υ ρ+ − = −
IIII II C c w C cA C A Cυ ρ υ ρ=
Momentum Conservation
0I I II I II I w I w f IP A S L S L g A LSinτ τ ρ α− − − −∆ − ∆ − ∆ − ∆ =
0II I II I II II III II III II w II w II w II III s IIP A S L S L S L F L F L g A LSinτ τ τ ρ α− − − − − − − −∆ + ∆ − ∆ − ∆ − ∆ − ∆ − ∆ =
0III II III II III static bed III II III III wP A S L g A LCos F L F Lτ µ ρ α− − − −∆ + ∆ − ∆ + ∆ − ∆ = where ,i jF is the static friction force between the corresponding layers.
The shear stress between any two surfaces is
( )2
, , 2i i j
i j f i jf
ρ υ υτ
−=
Slip Velocity
( ) ( )( )43
c fcslip
L D f
d g SinC Cos C Sin
ρ ρυ α θ
θ θ ρ −
= + +
v
where θ is the angle depending on the packing structure of the cuttings.
In-Situ Cuttings Concentration
( ) ( ) ( )2 2 2
2 2
22
1
bottom top
bottom top top II y
C
II
C C II y C II yC C C C C II y h
CII y
C C h hC C C h
eCh
υ
υ υυ
υ
− +− + −
−=
COMPUTER SIMULATOR Based on the layered model described above, a computer simulator is being developed. The program is capable of determining the velocities in each layer, the layer geometries, the maximum slip velocity between the cuttings and the fluid, pressure drop and the in-situ cuttings concentration. The program inputs are pressure and temperature at the bit, total in-situ flow rate, in-situ gas ratio, wellbore geometry and inclination, ROP, average cuttings diameter, and a few options for the friction factors, rheological models, drag and lift coefficients, etc. The program can also be used as a pure fluid-flow simulator as well, if ROP is set to “0”. For now, the outputs are in a text format. A graphical output will

15
also be added to the simulator that will enable the user to directly compare the results as soon as the outputs are calculated.
The program divides the wellbore in grids (the length of the grid is user-defined). In a single grid, the fluid is assumed to be incompressible, and calculations are conducted for determining the unknowns. After the unknowns are determined, the inputs for the consecutive grids are calculated including the expansion and temperature changes. The program is prepared in the C++ environment. The platform of the program is Windows, therefore, it can be run in any PC which uses Windows operating system. The user interface of the program is presented in Figure 4.1.
Figure 4.1 Screenshot of the Cuttings-Transport Simulator The simulator is designed for horizontal and inclined sections. Also, this particular layered model assumes that the bed is stationary. Therefore, it is suggested that the hole angle should be greater than 40 degrees from vertical. The criterion is based on varying the inclination angle of the LPAT Flow Loop and observing when a stationary bed, occupying about 40 to 50% of the cross section of the annulus, begins to slide down. In addition to cuttings, the 8” x 4.5” annulus was filled with quiescent (uncirculating) water.

16
FUTURE WORK • The simulator will be completed. • The simulator results will be compared with the experimental data. • Final report will be prepared. NOMENCLATURE A = area, L2
C = cuttings concentration CD = drag coefficient CL = lift coefficient D= diameter, L d = diameter, L g = gravitational constant, L/t2
h = height, L L = length, L ⊆C = diffusion coefficient P = pressure, m/Lt2 S = surface Greek Letters θ = angle ρ = density, m/L3 α = inclination τ = shear stress υ = velocity, L/t Subscripts c = cuttings f = fluid I = first layer II = second layer III = third layer i = layer index j = layer index s = slurry w = wellbore y = direction ACKNOWLEDGEMENTS TUDRP, the ACTS Project and the author thank Bachman Chemicals for donating foaming agent and foam breaker.

17
5. STUDY OF FOAM FLOW BEHAVIOR UNDER ELEVATED PRESSURE AND TEMPERATURE CONDITIONS (Task 9) Investigator: Affonso Marcelo Fernandes Lourenço (MS Candidate)
OBJECTIVES
Perform experimental study of foam flow behavior inside pipes and annuli in a large-scale loop (ACTS) under elevated pressure and temperature. Develop empirical correlations to estimate pressure losses during foam flow
for a given set of gas-liquid ratio, temperature and pressure conditions. ABSTRACT (The following is taken from the MS Thesis by Lourenco, Jan. 2002)
An extensive experimental study on the flow behavior of foam in pipe and annular geometries was conducted using a full-scale flow loop. Under-balanced drilling simulations were conducted with pressures up to 650 psig and temperatures of 185 degrees F.
The main objective of the present work was to develop a mathematical model for the prediction of frictional pressure drops for foam in applications to drilling operations. As part of this research, foam flow properties, its stability and compressibility were also investigated.
A conventional drilling-fluids hydraulic model, based on the Herschel – Bulkley rheological model, was modified for foam fluids using the principle of “Volume Equalization”.
A detailed discussion on the effects of foam generation, foam quality, pressure, temperature and geometry on foam flow behavior is presented in this thesis. Results have shown that quality and foam texture significantly affect foam Rheology. Pressure and temperature appear to have secondary effects. The importance of accounting for wall slippage in foam flow is highlighted, and a new concept to evaluate the slip velocity in annuli is proposed.
Results have shown that foam rheology for these tests can be characterized by a Power-Law model. A computer code was written based on the modified hydraulic model. Satisfactory agreement with experimental data in frictional pressure loss predictions is obtained for the flow of foams through pipes and annuli. SELECTED RESULTS, CONCLUSIONS AND RECOMMENDATIONS 5.1 Foam Stability Foam stability properties were investigated experimentally. The drainage technique represents an easy and fast way to evaluate general foam stability properties. Minimum requirements for the performance of the surfactant, like ability to generate foam and stability in the presence of salt and oil can be verified. Therefore, this measurement can be used as a tool for a preliminary

18
selection of the type of surfactant to be used in foam drilling operations. In spite of this, the information from static drainage tests should not be used to predict any flowing properties of foam. The anionic surfactant used during these experiments showed good ability to generate foam. Satisfactory tolerance to different concentrations of salt and oil was also observed. The increase or decrease of foam stability in the presence of these contaminants is closely related with type and amount of each contaminant and also type and concentration of surfactant. Further investigation is needed to better understand the mechanisms behind the effects of contaminants on foam stability.
5.2 - Study of Volumetric Properties of Foam Experiments were conducted in a PVT cell to compare equations of state for foam commonly used in foam-drilling operations. Three equations of state were chosen for the comparison: Lord’s33, Huey and Bryant’s32 and a modified real gas law equation of state. Results indicate that the tested equations of state tend to underpredict the density of low quality foams. The same trend was observed in the evaluation of foam compressibility. The model proposed by David and Marsden9, which considers foam compressibility to be the product of air compressibility and foam quality, underpredicts foam compressibility. An empirical correction factor was proposed for Lord’s equation of state in the calculation of foam density. Additional experiments to evaluate foam density under dynamics conditions are necessary to confirm the applicability of the correction factor. Results suggest that equations of state accounting for surface tension and structure properties have more chance to succeed in predicting foam density. However, further modifications of those equations are necessary to enable its applicability for engineering purposes. 5.3 - Foam Flow in Pipes and Annuli 1. In addition to foam quality, the experimental results indicate a strong influence of texture (bubble size, shape and size distribution) on foam rheology. The effects of temperature and pressure on foam rheology are secondary. 2. Foams generated at high shear rate conditions have smaller bubbles and higher effective viscosities. Good foam texture with completely different rheological response can be observed depending upon the type of generator and the level of shear rate applied during generation. Above a certain level of shear rate, no significant change in rheology was observed. Theses results show the importance of foam structure for proper rheological characterization of foams. 3. Hydraulic models for foam drilling should have texture linked with a rheological model in order to properly estimate flow properties inside the drillstring and annular sections. Since flow through bit nozzles is characterized by high levels of

19
shear, it is possible to have different types of foams flowing down through the drillstring and back up through the annular sections. 4. The effect of shear rate during foam generation on foam rheology was more significant for high quality foams. Consequently, the lower the quality of foam downhole, the less will be the effect of flow through the bit nozzles. 5. The effective viscosity and the non-Newtonian behavior of foams increase with an increase in foam quality. 6. The thinning effect of temperature on foam rheology is more significant with low-quality foams. The reason is due to the decrease in the liquid phase viscosity and the presence of a higher percentage of liquid in low-quality foams. 7. The change in foam rheology with pressure was not significant in the range of pressures investigated during these experiments. 8. The slippage at the wall is one of the most important phenomena to be considered in foam flow. It is certainly one of the variables responsible for the disagreement in predictions among the existing hydraulic models for foams. 9. The Oldroyd and Jastrzebski22 method provided satisfactory results in estimating the slippage effect. The reliability of the method increases with an increase in the amount of data available for each pipe section. The method is not able to explicitly describe each effect influencing slip at a wall. In spite of this, it accounts for them implicitly, since any change on variables like wall roughness, foam texture, etc, will lead to a change in the wall shear stress. As long as wall shear stress information is available empirically, the method shows good results. 10. The experimental average wall shear stress and hydraulic diameter was used for calculating slip velocity in the annulus. These assumptions seem to under predict the slippage effect for stiff foams. 11. A methodology for the theoretical prediction of the slip velocity in pipes and annuli is proposed (Appendix A4). Satisfactory results in pipe flow were obtained, although sometimes the slip velocity is overestimated. The method failed to properly predict the slip velocity in annular flow. 12. Empirical correlations for slippage coefficient, independent of quality, were developed from the data bank. A different correlation is available for each type of foam simulated during experiments. 13. The development of a reliable theoretical model for the prediction of slip velocity in pipe and annular foam flows represents one of the most important tasks to be accomplished. This information is a must for the success of friction pressure loss predictions in foam drilling.

20
14. The Volume Equalized Principle demonstrated good results in generating a master flow curve for foams. The methodology describes the rheological behavior of different quality foams at different pressures by a unique function. However, two master curves were obtained for the stiffer foam, one for high quality and another for low quality foams. These results suggest the need for incorporating texture effects into the model. 15. The hydraulic model developed by Reed for flow in pipes and annuli of Herschel - Bulkley fluids was modified for horizontal foam flow with the use of a the Volume Equalized Herschel-Bulkley model. 16. Results from these experiments indicate that a Power-Law model can describe the rheological behavior of foams. The occurrence of an apparent yield stress during some high-quality experiments was observed as a result of the slip correction. This yield stress was not a true yield stress of the foam, but an apparent one. It represents the shear stress when foam is flowing nearly as a plug in the conduits with a slip velocity almost equal to the actual average velocity. 17. Seventy percent of the model predictions were within a 30% relative error band for the less viscous foam in the pipe sections. Forty-five percent of the total predictions was within a 15% relative band margin for the same foam. In the annular section case 60% of the predictions were within 30% relative error band and 40% of the total were within a 15% relative error band. The stiffer foam provided better results in pipe sections. In these cases, 80% of model predictions were within a 30% relative error band and 55% of the total were within a 15% relative error margin for the same foam. The annular predictions for the stiffer foam gave poorer results. For these cases, 35% of model predictions were within a 30% relative error band and only 20% within the 15% error band. 18. Some non-laminar flow regimes were observed during experiments in the 2-inch pipe with low quality foams. The model tends to over-predict the frictional pressure losses in the non-laminar region. For these cases, no slip corrections were performed. 19. The predictions for friction pressure losses were satisfactory, considering the many variables involved in the flow of foams. Structural properties and a reliable model for the prediction of slip velocity must be incorporated into the model in order to generate a truly general model. In spite of this, the work represents one the first attempts to develop a general hydraulic model for foam flow in pipes and annuli in all flow regimes.

21
SUMMARY OF ACTIVITIES • Work on this research (Task 9) has now been completed. Copies of the thesis report will be provided to the DOE and all JIP sponsors. • One of the important findings from this hydraulic study of foam is that bubble size has a primary effect on the apparent viscosity of a foam. This identified the need to have an instrument that can generate a foam with a controlled bubble size and then measure its rheological properties. This has led to the development of a new concept for achieving these objectives. It is expected that a patent application for this new tool will be filed with the US Patent Office.

22
6. STUDY OF CUTTINGS TRANSPORT WITH AREATED MUD UNDER ELEVATED PRESSURE AND TEMPERATURE CONDITIONS (TASK 10) Investigator: Lei Zhou (Ph.D. Candidate) Objectives
1. Develop two-phase flow model for aerated fluids under elevated pressure and temperature conditions inside an annular in horizontal position without pipe rotation.
2. Determine experimentally the cuttings transport ability of aerated fluids
under elevated pressure and temperature conditions. 3. Determine the optimum gas/liquid flow rates for cuttings transport.
4. Develop a computational tool to calculate pressure loss in aerated fluids
flowing under elevated pressure and high temperature conditions. Executive Summary A review of the relevant literature and study of the previous work done by TUDRP/ACTS are continuing. A Mathematical modeling is under development. The model is based on an analysis of cuttings-transport phenomena using a layered model. Application of the Principle of Volume Equalization in the model is also being studied. Primary tests have been conducted to test the capacity of the ACTS flow loop for two-phase flow experiments. A Revised test matrix for two-phase flow experiments has been developed. As part of the planned tests, two nuclear densitometers will be used to measure slurry density, the size of slugs and their velocity. Calibration of the densitometers is underway. Testing is expected to begin in late March or early April, 2002. after the cuttings injection and collection system is installed and commissioned. . Past Work
1. Literature review on cuttings transport and hole cleaning. 2. Literature review on two-phase flow in pipe and annular.
3. Study of two-phase flow and slurry flow mechanism.
4. Analysis of particle transport mechanisms
5. Primary test of two-phase flow with ACTS high pressure loop.

23
Present Work
1. Development of a layered model that considers air-liquid-cuttings (a three-phase flow) under slug flow conditions.
2. Study the corresponding two-phase (air-liquid) flow with the principle of
volume equalization. 3. Conducting experiments to measure the packed cuttings porosity. 4. Calibrating the nuclear densitometers.
5. Developing computer simulator for prediction of cuttings transport ability
and two phases flow at EPET conditions. Test Matrix Set up In order to investigate two-phase flow at elevated pressures and temperatures, the ACTS loop will be used to conduct experiments with air and water. The mixtures will go through a 2-inch, a 3-inch, the annular section (5.76” x 3.5”) and finally a 4-inch line, then return to collection tank. A heater will heat the mixture up to 185F0 . Different combination of pressure, temperature, gas and liquid flow rates will be tested. Considering cuttings transport ability, the maximum liquid flow rate tested in this matrix is 300 GPM. LabView software will be used to control the whole system, and all experiment data will be recorded. Considering the limited pump-rate capability of the ACTS liquid injection pump ( < 80 gpm), the higher liquid flow rates will not be available from this pump. Hence, the Halliburton frac pump will be used to deliver most of the liquid flow at the higher flow rates specified in the following test matrix. The small liquid injection pump will deliver a lower liquid flow rate to the Moyno pump. The Moyno pump will take in air and the lower liquid flow to produce a two-phase mixture. The discharge of two-phase flow from the Moyno will then be mixed with the higher liquid flow rate from the Halliburton pump. Flows from the two pumps will then be mixed by passing the combined flows through the existing static mixture.

24
The following is the revised test matrix for a study of two-phase flows at elevated pressures and temperatures.
REVISED TEST MATRIX
80
120
150
180
T(F) P(psi)
Qg
(SCFM)
Ql
(GPM)
Qg
(SCFM)
Ql
(GPM)
Qg
(SCFM)
Ql
(GPM)
Qg
(SCFM)
Ql
(GPM) 100
100
100
150
100
200
100
250
100
200
100
150
150
150
200
150
250
150
300
100
200
150
200
200
200
250
200
400
100
250
150
250
200
250
250
250
500
100
300
150
300
200
300
250
300
Porosity of Packed Cuttings Experiments are being conducted to measure the porosity of packed cuttings. The purposes of these experiments are to measure porosity of the packed cuttings with respect to different values of surface area per unit volume. In addition, the wet density of cuttings (saturated with water) are also being measured. Porosity of the slurry and rock density will be used to calibrate the nuclear densitometers.
Experimental steps:
1. Calibration of graduated cylinders volume.
2. Measure the porosity of packed cuttings.
3. Density of saturated cuttings.
4. Results and discussion.

25
The following plot shows void fraction as a function of surface area per unit
volume.
void fraction
0.37
0.375
0.38
0.385
0.39
0.395
0.4
0.405
0.41
0 0.5 1 1.5 2 2.5
surface area per volume
perc
ent v
oids
500ml1000ml
2000ml
4000ml
Figure 6.1 - Surface Area per Volume versus Void Fraction of Packed Cuttings
A detailed experimental report will be prepared and analyses of the results is continuing. An expected application of the final results will be to calculate the porosity of packed cuttings in a calibration fixture that has been designed to duplicate the metal pipes that were used to build the annular test section. The Principle of Volume Equalization
The objective of the Principle of Volume Equalization to foam flow is to eliminate variations in friction factor along a conduit with changes in foam quality. If this concept is applied to simple two-phase flow, it is expected to produce a constant friction factor as well. But a simple two-phase flow is different from foam flow. In particular, the ratio of gas to liquid can change along the pipe and there can be separation of the two phases to form slugs of liquid interspersed with pockets of air.

26
Since the Volume Equalized Principle (VEP) indicates:
=
HL
m
HL Du
fεε
τ 1,
Where HLε is the specific holdup volume expansion ratio, defined as :
TP
LHL ρ
ρε =
The division of the wall shear stress and wall shear rate by the specific holdup
volume expansion ratio results in unique curves for different flow patterns
independent of the gas/liquid ratio.
The following plots were presented by Wolfgang Winkler in his Ph.D. dissertation.
He applied the VEP concept to gas-liquid flow (at different gas/liquid ratios) and
this resulted in the unique curves shown in Figs. 6.2. and 6.3.

27
Figure 6.2 - Wall Shear Stress versus Wall Shear Rate for Intermittent Pipe Flow

28
Figure 6.3 - Wall Shear Stress versus Wall Shear Rate for Intermittent Pipe Flow
FUTURE WORK
1. Literature survey on two-phase flow, drilling fluid Rheology and cuttings transport in pipes and annuli will continue.
2. Continue to develop a layered model of cuttings transport and modify the
existing models for two-phase flow map prediction.
3. Continue to investigate the application of the VEP concept to two-phase and three-phase flow.
4. Continue to develop a computer simulator for cuttings transport and
prediction of flow-pattern maps.
5. Experiments are being planned to investigate the aerated-fluids flow behavior and cutting transport ability under elevated pressure and temperature conditions.

29
DELIVERABLES
1. Two-phase flow model for aerated fluids under elevated pressure and temperature conditions.
2. Practical guidelines and/or graphs to determine the optimum gas/liquid
flow rates to get the maximum cuttings transport capacity of aerated fluids under elevated pressure and temperature conditions.
3. A computational tool to calculate frictional pressure drops inside an
annulus for aerated fluids flowing over the range of experimental conditions.
4. Semi-annual Advisory Board Meeting (ABM) reports.
Nomenclature P = pressure, psi T = temperature, F Qg = gas flow rate, SCFM Ql = liquid flow rate, GPM τ = wall shear stress HLε = specific holdup volume expansion ratio
mu = average velocity D = pipe diameter Lρ = liquid density
TPρ = gas liquid mixture density
References:
1. Nguyen, D. and Rahman, S.S .:” A Three-layer Hydraulic Program for Effective Cuttings Transport and Hole Cleaning In The Highly Deviated And Horizontal Well,” SPE D&C September 23-26, 1990
2. Tronconi, E.:" Prediction of Slug frequency in horizontal Two-Phase slug
flow," AICHE J. (1990)36, No.5,701. 3. Taitel , Y. and Dukler, A.E.:"A Model for Slug Frequency During Gas-
Liquid Flow in Horizontal and Near Horizontal Pipes," Int. J. Multiphase Flow (1977)3, 585.
30
4. Martins, A.L., M.L. Santana, W.Campos and E.F. Gaspar.:” Evaluating the Transport of Solids Generated by Shale Instabilities in ERW Drilling,” SPE Drilling and Completion, Dec. 1999, pp.254-259.
5. Hyun cho, Subhash, N.shah and Samuel O. Osisanya.:” A Three-Segment Hydraulic Model for Cuttings Transport in Horizontal and Deviated Wells,” SPE 65488.
6. Doan,Q., M.Oguztoreli, Y.Masuda, T. Yonezawa, A.kobayashi and
A.Kamp.:” Modeling of Transient Cuttings Transport in Unbalanced Drilling,” IADC/SPE 62742, to be presented at the 2000 IADC/SPE Asia pacific drilling technology held in kuala Lumpur, Malaysia September 11-13/2000.
7. Doron, P. and Barnea, D.:” A Three-layer Model for Solid–Liquid Flow in
Horizontal Pipes,” International Journal of Multiphase Flow, Vol.19, No.6, 1993,p.1029-1043
8. Wolfgang Winkler.:” Polymer Foam Rheology in Circular Pipes ,“ Ph.D.
dissertation.

31
7. DEVELOPMENT OF CUTTINGS MONITORING METHODOLOGY (Task 11) Investigators: Kaveh Ashenayi and Gerald Kane (Profs Electrical Engr.) Objectives The ultimate objective of this task (Task 11) is to develop a non-invasive technique for quantitatively determining the location of cuttings in the drill pipe. There are four different techniques that could be examined. However, as it was pointed out in the previous reports only three have good potential for success. These are Ultrasound, X-Ray/�-Ray and Optical. Of these, we will concentrate on Ultrasound as the primary approach for Task 11 and use X-Ray/�-Ray only if the first one is not successful Team Composition: The team for developing instrumentation to measure cuttings concentration and distribution (Task 11) charged with completing tasks 11 consisted of Dr. Gerald R. Kane and Dr. Kaveh Ashenayi both registered professional engineers and professors of Electrical Engineering Department at the University of Tulsa. MS level graduate students are assisting them. These students have BS degrees in EE and CS. This particular combination works well since successful completion of this project requires skills from both disciplines. To achieve the objectives of this task, we will need to develop a very complicated electronic hardware/sensor and a software package that correctly interprets the data received. Progress to Date The PC board developed by our team has been assembled and has mostly been debugged. We have developed and finalized a set of commands and finalized the A/D portion. Also, we have tested the data averaging on board. Some hardware modifications have been identified and we are finalizing this list. These modifications deal mainly with sensor signal amplification and conditioning. We had a problem with “NIMDA” virus but fortunately no data was lost. We have reinstalled and are progressing. To assure similar problems will not occur again we have installed the latest hot fixes and patches from Microsoft, and we have started a procedure that should reduce the chance of similar problem arising again. We will use software on the PC to both collect data and analyze data. The data collection part has been completed and tested in conjunction with the printed circuit board. The software will start by allowing the user to setup the communication characteristics of the system. Then will proceed to automatically identify the number of boards connected. This feature will allow us to expand (or

32
reduce) the number of sensor rings without having to manually reconfigure anything in the software or hardware. The software will ask for a unique test number that will be used to identify the data collected in the database. This data will be time stamped and stored in an MS-Access database. Approach The main approach to be investigated is the ultrasound transmission. We will setup a set of rings in the outer pipe and may be a corresponding ring in the inner pipe. In this approach inner ring will act as source and the outer ring will act as receivers. We will measure the sound received and compare it against sound transmitted. After suitable data processing we believe it is possible to get an acceptable picture of what is inside the pipe. This is very similar to the MRI and CT Scan techniques used by physicians. Another approach is to have only the outer ring and use the same basic procedure. Future Work We are almost finished with development of the firmware and will test it after the hardware modifications are complete. At the same time we are implementing our data analysis software. We will use an approach similar to CT scan where a 3D representation can be generated from 2D data. We have done some preliminary tests with the clear plastic cell consisting of two rings of sensors with concentric pipes about 4 feet long. We propose to continue with the same test after the new board is available. Cuttings of known concentration will be placed in a predetermined location in the cell. Using sensors we will try to locate these cuttings and measure their concentration. A PC-based data-acquisition-system is being developed and will be tested. The software will be finished, and then it will be used to store and process information received from the sensors. We will use the combined system to calibrate and perform a complete test.

33
8. DEVELOPMENT OF A METHOD FOR CHARACTERIZING BUBBLES IN ENERGIZED FLUIDS (TASK 12) Investigator: Leonard Volk (ACTS Research Associate) 8.1 INTRODUCTION
Bubbles (as foam or aerated fluid) will be moving at a high rate (up to 6 ft/sec) in the drilling section of the ACTF, and may be very small (down to 0.01 mm). The bubble size and size distribution influence the fluid rheology and the ability of the fluid to transport cuttings. Bubbles in a shear field (flowing) may tend to be ellipsoidal which might alter both the rheology and transport characteristics.
In the ACTS Statement of Work, Task 12 is divided into four subtasks:
• Subtask 12.1. Develop/test a microphotographic method for static conditions • Subtask 12.2. Develop/test a method for dynamic conditions • Subtask 12.3. Develop simple, noninvasive methods for bubble
characterization • Subtask 12.4. Provide technical assistance for installation on ACTF. •
Subtask 12.1 includes (1) magnifying and capturing bubble images, (2) measuring bubble sizes and shapes, and (3) calculating the size distribution and various statistical parameters. Subtask 12.2 develops the methods needed to apply the results of Subtask 12.1 to rapidly moving fluids, especially the method of “freezing” the motion of the bubbles. A dynamic testing facility will be developed in conjunction with Task 11 for development and verification. Subtask 12.3, added in year 3, develops simple, inexpensive and small-in-size methods for characterizing bubbles. This task was previously referred to as “New Techniques”. Techniques and methods developed under Subtask 12.2 and 3 will be applied to the drilling section of the ACTF in Subtask 12.4.
8.2 Objectives
The objectives of this task are to develop the methodology and apparatus needed to measure bubble size, size distribution and shape during cuttings transport experiments.

34
8.3 Project Status 8.3.2 Dynamic Bubble Characterization 8.3.2.1 Dynamic Imaging
Although foam has been generated at low and high pressures in the DynamicTesting Facility, the quality has been low despite the use of a static mixer. We suspect that the shear is insufficient even at high flow rates. We will be exploring methods of adding additional shear to the fluid.
8.3.2.2 Dynamic Testing Facility
After replacing the defective 1-1/2” flanges, all flange connections were leak-tight during a hydrostatic test to 150psi. The Dynamic Testing Facility is essentially completed. It has been specifically designed with easy modification in mind to accommodate a variety of testing. Below is a list of various subtasks that are yet to be completed:
• Fabricate mixer shaft stabilizer • Fabricate cover for mixing tank • Calibrate Moyno RPM indicator to estimate flow rate • Install air bleed line on liquid side of bladder accumulator • Install Lexan protective tube around separator sight glass • Order/install chemical injection pump (for foam breaking) • Order clear section for main line • Calibrate the nitrogen manifold needle valves • Design/construct emergency foam storage (in case we cannot break
foam in real-time following a run) 8.3.3 Novel Techniques for Bubble Characterization
A 32” x 22” x 9” optical box has been constructed in which novel optical techniques for bubble characterization will be tested. Various optical mounts have been constructed to hold optical components and allow for easy alignment. A 3” x 3” x 3” cell has been constructed with one side made of 3/8” thick glass. This cell will be used to examine the second-surface reflection to measure foam quality. Four additional optical cells have been constructed for measuring optical attenuation by foam: 6” x 6” x 6”, 3” x 3” x 3”, 1-1/2” x 1-1/2” x 1-1/2”, ½” x 1-1/2” x 1-1/2”. The first dimension refers to the approximate optical path length. These will be used to evaluate various parameters required to measure the average bubble size. Various light sources and photodiodes will be checked for suitability. Figure 8.1 shows the optical arrangements to evaluate these two techniques. 8.4 Planned Activities 8.4.2 Dynamic Bubble Characterization
• Complete construction/installation of items listed in section 8.3.2.2. • Using the imaging instrumentation and software, develop a routine for
bubble analysis

35
8.4.3 Novel Techniques for Bubble Characterization • Continue development of foam quality method • Continue development of techniques for measuring average bubble size
Figure 8.1 - Optical Arrangements for Measuring Foam Quality and Average Bubble Size.
Mirror
Beam Blocking
Pl t
Optical Cell
OpticalCell
Holes for electrical
i
Holes for electrical
i
FOAM QUALITY
AVERAGE BUBBLE SIZE
Light Source
Light Source
Beam Splitter
Beam Splitter
Photodiod
Photodiode
Photodiode
Photodiode

36
9. SAFETY PROGRAM (TASK 1S)
Chairman, Process Hazards Review Team: Leonard Volk (ACTS R.A.) 9.1 Introduction
This project was initiated during the fourth quarter of 2000 to assess the hazards associated with the Advanced Cuttings Transport Facility (ACTF) and develop an Action Plan to address problems discovered during this Hazards Review. A Hazards Review is an industry accepted method used to improve the overall safety characteristics and reduce the possibilities of accidents in the work place. Each individual component of the ACTF is examined as to the effect and consequences on safety, health, and the environment, of the component in all possible operational modes. A Hazards Review can result in equipment modification, inspection and testing, documentation, personal protective equipment, personnel training, and/or emergency training. The hazards review process begins by selecting a review method. Next a team of qualified individuals must be formed. This team should include those knowledgeable in the review process and those familiar with the process to be reviewed. Prior to beginning the review, all available documentation needs to be gathered. This includes schematics, organized training, periodic inspections and testing results, design and construction documents, operating procedures, etc. Once the schematics have been verified and the operator of the equipment or process has reviewed its operation with the team, the Hazards Review begins. The review should continue uninterrupted until completed. After the findings and recommendations have been completed, a draft report is issued and reviewed by all team members, and the operator of the process or equipment. Following this review, any changes are incorporated and a final report issued. This completes the Hazard Review process. The operator then needs to develop an action plan to implement the recommendations from the Hazard Review. In our case, team members will participate in developing this plan.
9.2 Objective
The objective of this task is to identify problems (findings) that might result in injury, property damage or the release of environmentally damaging materials and provide recommendations to minimize them, and to develop an action plan based on these recommendations. 9.3 Project Status
The draft report was provided to all member companies at the November 13, 2001 Advisory Board Meeting. The draft report of the Hazards Review has been modified reflecting input from the Work Team and has been submitted to the Review Team for their comments. The Action Plan is in preparation using the recommendations listed in the Hazard Review Report as a beginning.

37
9.4 Planned Activities • Develop an Action Plan based on recommendations in Hazards
Review report • Submit Action Plan to ACTF Advisory Board Members for their input. • Issue final Hazards Review report on ACTF. • Implement Action Plan

38
10. TECHNOLOGY TRANSFER Meetings with Petroleum and Service Companies During this past quarter TotalFina-Elf, the French major Petroleum Company, decided to join the project. Conoco is currently considering joining the ACTS Project. They will be invited to attend the upcoming Advisory Board Meeting in May. We will continue to identify and contact additional oil and service companies that will benefit by participating in this project. ACTS-JIP Advisory Board Meeting The next Advisory Board Meeting will held on May 21, 2002. In addition to the DOE, there are currently 11 member companies participating in the ACTS-JIP Project. They are: 1) BP-Amoco, 2) Baker-Hughes , 3) Chevron, 4) Schlumberger Dowell, 5) Halliburton, 6) Intevep, 7) Japan National Oil, 8) Petrobras, 9) Statoil, 10) TotalFina-Elf, 11) Weatherford International.