Embed Size (px)
DESCRIPTION
Investigation which involved re-evaluating the structural condition of the Taq-Kisra vault as well as the effectiveness of recent repairs designed by a Czech-based company using accurate two-dimensional and three- dimensional non-linear finite element analyses.
Citation preview

Advanced Computational Modelling of Taq-Kisra, Iraq
Erasmus Mundus Programme
ADVANCED MASTERS IN STRUCTURAL ANALYSIS OF MONUMENTS AND HISTORICAL CONSTRUCTIONS i
DECLARATION
Name: Nirvan Chandra Makoond
Email: [email protected]
Title of the
Msc Dissertation:
Advanced Computational Modelling of Taq-Kisra, Iraq
Supervisor(s): Milan Jirásek, Jan Zeman
Year: 2015
I hereby declare that all information in this document has been obtained and presented in accordance
with academic rules and ethical conduct. I also declare that, as required by these rules and conduct, I
have fully cited and referenced all material and results that are not original to this work.
I hereby declare that the MSc Consortium responsible for the Advanced Masters in Structural Analysis
of Monuments and Historical Constructions is allowed to store and make available electronically the
present MSc Dissertation.
University: Czech Technical University in Prague
Date: 14 / 07 / 2015
Signature:
___________________________

Advanced Computational Modelling of Taq-Kisra, Iraq
Erasmus Mundus Programme
ii ADVANCED MASTERS IN STRUCTURAL ANALYSIS OF MONUMENTS AND HISTORICAL CONSTRUCTIONS
This page is left blank on purpose.
Advanced Computational Modelling of Taq-Kisra, Iraq
Erasmus Mundus Programme
ADVANCED MASTERS IN STRUCTURAL ANALYSIS OF MONUMENTS AND HISTORICAL CONSTRUCTIONS iii
ACKNOWLEDGEMENTS
The author would like to thank Professors Milan Jirásek and Jan Zeman for their kind supervision,
solicitous availability and valuable guidance throughout the preparation of this thesis.
Sincere thanks also go to Dr. Miroslav Zeman from ProjektyZeman.cz for his time, accounts of
observations and the invaluable data and information he provided.
The author would also like to thank Michal Hlobil, Václav Nežerka and Dr. Tomáš Plachý for their help
in estimating the properties of the gypsum mortar.
The development of this thesis would not have been possible without the knowledge shared by all the
lecturers of the Advanced Masters in Structural Analysis of Monuments and Historical Constructions
and the support of classmates.
The author would also like to thank the SAHC consortium for the major financial support granted in the
form of a scholarship, without which this fulfilling experience would not have been possible.
Finally, thanks go to the author’s parents, friends and family for their unwavering support.

Advanced Computational Modelling of Taq-Kisra, Iraq
Erasmus Mundus Programme
iv ADVANCED MASTERS IN STRUCTURAL ANALYSIS OF MONUMENTS AND HISTORICAL CONSTRUCTIONS
This page is left blank on purpose.

Advanced Computational Modelling of Taq-Kisra, Iraq
Erasmus Mundus Programme
ADVANCED MASTERS IN STRUCTURAL ANALYSIS OF MONUMENTS AND HISTORICAL CONSTRUCTIONS v
ABSTRACT
The Taq-Kisra monument, built in the 6th Century A.D. and located in Iraq is considered to be the
largest brick vault in the world. In March 2013, a Czech-based consulting company ProjektyZeman.cz
was contracted to perform an intensive investigation of the structure and to propose a strategy for its
strengthening and rehabilitation, which eventually took place from late 2013 until the end of 2014.
Because of the limited three-week time provided by the investor, the remedial measures were
designed on the basis of a two-dimensional linear elastic structural analysis using equivalent beam
elements. The present contribution aims to reconcile the remedial measures in the light of more
accurate non-linear two and three-dimensional macro-scale finite element simulations.
Comparisons of cracks observed on the actual structure were used for validation of the models used
for the purpose of this thesis.
Simulations were carried out to investigate the effects of the self-weight and environmental factors
such as wind loading, rainwater ingress in the vault and temperature variations. The reconstruction of
part of the vault, which formed an important part of the strengthening strategy recommended by
ProjektyZeman.cz, was also investigated. The most vulnerable areas were identified as well as the
effect of the various environmental factors.
Since simulations suggest that it is very likely that rainwater ingress can contribute to the propagation
of cracks, the roofing solution proposed by ProjektyZeman.cz should help limit further deterioration.
It was found that although the reconstruction of part of the vault would initially impose greater strains
in the previous existing structure due to additional weight, it would also result in an improved three-
dimensional structural integrity which should help the structure better resist additional loads. This was
verified for the most critical wind loading scenario.
Advanced Computational Modelling of Taq-Kisra, Iraq
Erasmus Mundus Programme
vi ADVANCED MASTERS IN STRUCTURAL ANALYSIS OF MONUMENTS AND HISTORICAL CONSTRUCTIONS
This page is left blank on purpose.
Advanced Computational Modelling of Taq-Kisra, Iraq
Erasmus Mundus Programme
ADVANCED MASTERS IN STRUCTURAL ANALYSIS OF MONUMENTS AND HISTORICAL CONSTRUCTIONS vii
ABSTRAKTNÍ
Monument Taq - Kisra v Iráku, pocházející z 6. století našeho letopočtu, je považován za největší
zděnou klenbu na světě. V březnu 2013 byl českou firmou ProjektyZeman.cz proveden detailní
průzkum památky s cílem navrhnout její rekonstrukci, která byla následně realizována v letech 2013 a
2014. Kvůli omezenému třítýdennímu termínu poskytnutému investorem byl návrh rekonstrukce
založen na zjednodušené analýze pomocí ekvivalentního rámového modelu s lineárně pružným
chováním. Cílem této práce je zhodnotit navržená opatření pomocí přesnějších dvoj- a trojrozměrných
nelineárních výpočtů. Výstižnost modelu je prokázána porovnáním rozložení trhlin předpovězených
výpočtem a pozorovaných na místě.
Provedené simulace zohledňovaly vlastní tíhu konstrukce a vlivy prostředí jako je zatížení větrem,
průnik dešťové vody do klenby a zatížení změnou teploty. Byl uvažován jak původní stav konstrukce
před rekonstrukcí, tak i chování rekonstruované konstrukce dle návrhu firmy ProjektyZeman.cz. Na
základě výpočtů byla identifikována nejcitlivější místa konstrukce v závislosti na vnějších vlivech.
Protože simulace prokazují, že nejpravděpodobnějším vlivem, který přispívá k šíření trhlin, je zatékání
deště, zastřešení navržené firmou ProjektyZeman.cz nepochybně přispěje k zamezení dalšího
poškozování konstrukce. Dále bylo zjištěno, že část konstrukce přidaná při rekonstrukci způsobí větší
deformaci vlivem přitížení, ale zároveň přispěje k její větší prostorové stabilitě, která umožní konstrukci
lépe přenášet další zatížení. Toto tvrzení bylo prokázáno výpočtem pro nejnepříznivější zatěžovací
stav.

Advanced Computational Modelling of Taq-Kisra, Iraq
Erasmus Mundus Programme
viii ADVANCED MASTERS IN STRUCTURAL ANALYSIS OF MONUMENTS AND HISTORICAL CONSTRUCTIONS
This page is left blank on purpose.

Advanced Computational Modelling of Taq-Kisra, Iraq
Erasmus Mundus Programme
ADVANCED MASTERS IN STRUCTURAL ANALYSIS OF MONUMENTS AND HISTORICAL CONSTRUCTIONS ix
RESUMÉ
La modélisation avancée de Taq-Kisra en Irak par la méthode des éléments finis
Le Taq-Kisra, situé en Irak et construit au 6ème siècle après JC, est considérée comme la plus
grande voûte en brique dans le monde. En Mars 2013, la société de conseil en ingénierie
ProjektyZeman.cz, basée en République tchèque, est engagée pour effectuer une enquête
approfondie de la structure en vue de proposer une stratégie pour sa réhabilitation. Celle-ci prit fin en
2014. Les objectifs imposés par l’investisseur ont contraint l’étude structurelle à une analyse élastique
linéaire en deux dimensions utilisant des éléments équivalents de poutre. La présente contribution
vise à réconcilier les mesures correctives en utilisant des méthodes plus précises en deux et trois
dimensions.
Les modèles utilisés ont été validé au travers de comparaisons de fissures observées sur la structure
réelle.
Des simulations ont été réalisées afin d’étudier l’effet du poids de la structure en fonction des facteurs
environnementaux tels que le vent, l’infiltration de l'eau et les changements de température. La
reconstruction d'une partie de la voûte, qui forme une partie importante de la stratégie de réhabilitation
recommandée par ProjektyZeman.cz, a également été étudiée. Les zones les plus vulnérables de la
structure ont ainsi été identifiées.
Les résultats des simulations suggèrent que l’infiltration de l'eau de pluie peut contribuer à la
propagation des fissures. La solution de toiture proposée par ProjektyZeman.cz devrait ainsi
permettre de limiter sa détérioration.
On constate à travers la recherche, qu'indépendamment des contraintes imposées sur la structure
existante par la reconstruction, celle-ci génère une meilleure cohérence structurelle permettant de
mieux résister aux charges supplémentaires. Cette hypothèse a été vérifiée dans un scénario
considérant le vent le plus critique.

Advanced Computational Modelling of Taq-Kisra, Iraq
Erasmus Mundus Programme
x ADVANCED MASTERS IN STRUCTURAL ANALYSIS OF MONUMENTS AND HISTORICAL CONSTRUCTIONS
This page is left blank on purpose.

Advanced Computational Modelling of Taq-Kisra, Iraq
Erasmus Mundus Programme
ADVANCED MASTERS IN STRUCTURAL ANALYSIS OF MONUMENTS AND HISTORICAL CONSTRUCTIONS xi
Table of Contents
1. INTRODUCTION ............................................................................................................................. 1
2. LITERATURE REVIEW .................................................................................................................. 3
2.1 History of Taq-Kisra ................................................................................................. 3
2.2 Project on Reconnaissance and Restoration of Structure ........................................ 5
2.2.1 Overview of Structure ....................................................................................... 5
2.2.2 Materials Report ............................................................................................... 5
2.2.3 Structural Analysis ............................................................................................ 7
2.2.4 Main Problems Identified .................................................................................. 9
2.2.5 Selected Remedial Actions ............................................................................... 9
2.3 Previous structural analysis of Taq-Kisra ............................................................... 10
2.4 Behaviour and properties of masonry .................................................................... 11
2.4.1 Non-linear behaviour of constituents ............................................................... 11
2.4.2 Non-linear behaviour of unit-mortar interface .................................................. 12
2.4.3 Properties of the composite material ............................................................... 13
2.5 Strategies for the numerical modelling of masonry structures ................................ 14
3. GEOMETRICAL MODEL .............................................................................................................. 17
4. ELEMENT SELECTION AND MESH ........................................................................................... 21
4.1 Two-dimensional model ......................................................................................... 21
4.2 Three-dimensional models ..................................................................................... 22
4.2.1 Previous Geometry ......................................................................................... 23
4.2.2 Geometry after reconstruction as a single entity ............................................. 24
4.2.3 Geometry after reconstruction ........................................................................ 25
5. MATERIAL CHARACTERISATION ............................................................................................. 27
5.1 Properties of constituents ...................................................................................... 28
5.1.1 Bricks ............................................................................................................. 28
5.1.2 Mortar ............................................................................................................. 29
5.2 Homogenised properties ........................................................................................ 30
6. SELF-WEIGHT .............................................................................................................................. 35
6.1 Results from two-dimensional plane strain analysis ............................................... 36
6.2 Results from three-dimensional model ................................................................... 37
7. RECONSTRUCTION OF PART OF VAULT ................................................................................ 41
7.1 Results from model considering geometry after reconstruction as a single entity ... 42
Advanced Computational Modelling of Taq-Kisra, Iraq
Erasmus Mundus Programme
xii ADVANCED MASTERS IN STRUCTURAL ANALYSIS OF MONUMENTS AND HISTORICAL CONSTRUCTIONS
7.2 Results from model of reconstruction in two load steps .......................................... 43
8. WIND LOADING ............................................................................................................................ 47
8.1 Wind load case 1 ................................................................................................... 49
8.2 Wind load case 2 ................................................................................................... 51
8.2.1 Determination of safety factor against wind load case 2 .................................. 53
8.3 Wind load case 3 ................................................................................................... 56
8.4 Wind load case 4 ................................................................................................... 57
8.5 Wind load case 5 ................................................................................................... 58
9. RAINWATER INGRESS IN VAULT .............................................................................................. 61
10. TEMPERATURE EFFECTS .......................................................................................................... 65
11. SEISMIC HAZARD ........................................................................................................................ 71
12. COMPARISON OF LOAD CASES CONSIDERED ...................................................................... 73
13. COMPARISON WITH RESULTS FROM PREVIOUS STRUCTURAL ANALYSES .................... 75
14. CONCLUSIONS ............................................................................................................................ 77
15. REFERENCES .............................................................................................................................. 79

Advanced Computational Modelling of Taq-Kisra, Iraq
Erasmus Mundus Programme. 2014/2015 Edition June 2015
ADVANCED MASTERS IN STRUCTURAL ANALYSIS OF MONUMENTS AND HISTORICAL CONSTRUCTIONS 1
1. INTRODUCTION
The Taq-Kisra monument located east of the Tigris River, approximately 35 km south of the modern
city of Baghdad, is the only remaining structure from the royal palace of the ancient Sassanian capital
city of Ctesiphon dating back to the 6th Century A.D. The remaining structure consists predominantly of
a part of the eastern wall and an immense parabolic barrel vault spanning a length of 25.5 m and
reaching a height of 30.3 m at its peak (Figure 1). It is thought to be the largest unreinforced brick
vault in the world. The structure is made of masonry comprising clay-fired bricks and mortar
consisting mostly of gypsum. The vault is severely degraded and in a poor condition.
Figure 1: View of remaining part of barrel vault from the east [1].
In 2013, the Czech based company AVERS was engaged as the main contractor for the restoration
and salvage of the monument. Subsequently, another Czech company, ProjektyZeman.cz, was also
requested to participate in the restoration design. The main tasks carried out by ProjektyZeman.cz
involved surveys and preliminary in-situ tests, collection of samples for determining strength
characteristics, mapping of faults and making an overall assessment of the load-bearing condition of
the structure as well as designing alterations necessary to ensure the stability and extend the service
life of the structure.
Naturally, some form of structural analysis was required to be able to assess the structural state of the
vault and design any necessary alterations. Because of the limited time available, this was done using
two-dimensional equivalent beam elements. This is not the most suitable form of analysis due to the
nature of the construction as well as the complex post-peak behaviour of masonry and the results
therefore need to be interpreted very carefully. Furthermore, three-dimensional analysis could prove to
be particularly insightful due to the unsymmetrical nature of the remaining construction (caused by
collapse of part of the vault).
Advanced Computational Modelling of Taq-Kisra, Iraq
Erasmus Mundus Programme. 2014/2015 Edition June 2015
2 ADVANCED MASTERS IN STRUCTURAL ANALYSIS OF MONUMENTS AND HISTORICAL CONSTRUCTIONS
Hence, this thesis will aim to re-evaluate the structural condition of the Taq-Kisra vault as well as the
effectiveness of the repairs using more accurate two-dimensional and three-dimensional non-linear
finite element analyses. This will be achieved by employing the following methodology:
First a literature review will be carried out on the Projektyzeman.cz project, available
information on Taq-Kisra as well as on relevant aspects of non-linear modelling of masonry
structures.
Consequently, a two-dimensional non-linear finite element analysis will be carried out and the
results will be compared with conclusions made from the analysis carried out by
Projektyzeman.cz.
Subsequently, three-dimensional finite element models of the structure before and after
restoration works will be created.
Finally, these models will be used to evaluate the structural state of the monument both before
and after the restoration works.
Advanced Computational Modelling of Taq-Kisra, Iraq
Erasmus Mundus Programme. 2014/2015 Edition June 2015
ADVANCED MASTERS IN STRUCTURAL ANALYSIS OF MONUMENTS AND HISTORICAL CONSTRUCTIONS 3
2. LITERATURE REVIEW
2.1 History of Taq-Kisra
This section aims to provide a summary of the historical evolution of the structure, with particular
emphasis on past events that have influenced its structural integrity.
Taq-Kisra was built as a royal palace in the 6th Century A.D. in the capital of the Sassanian Empire,
Ctesiphon. The vault that can still be observed today served as the audience hall. The structure was
eventually captured by the Arabs in 637 A.D.
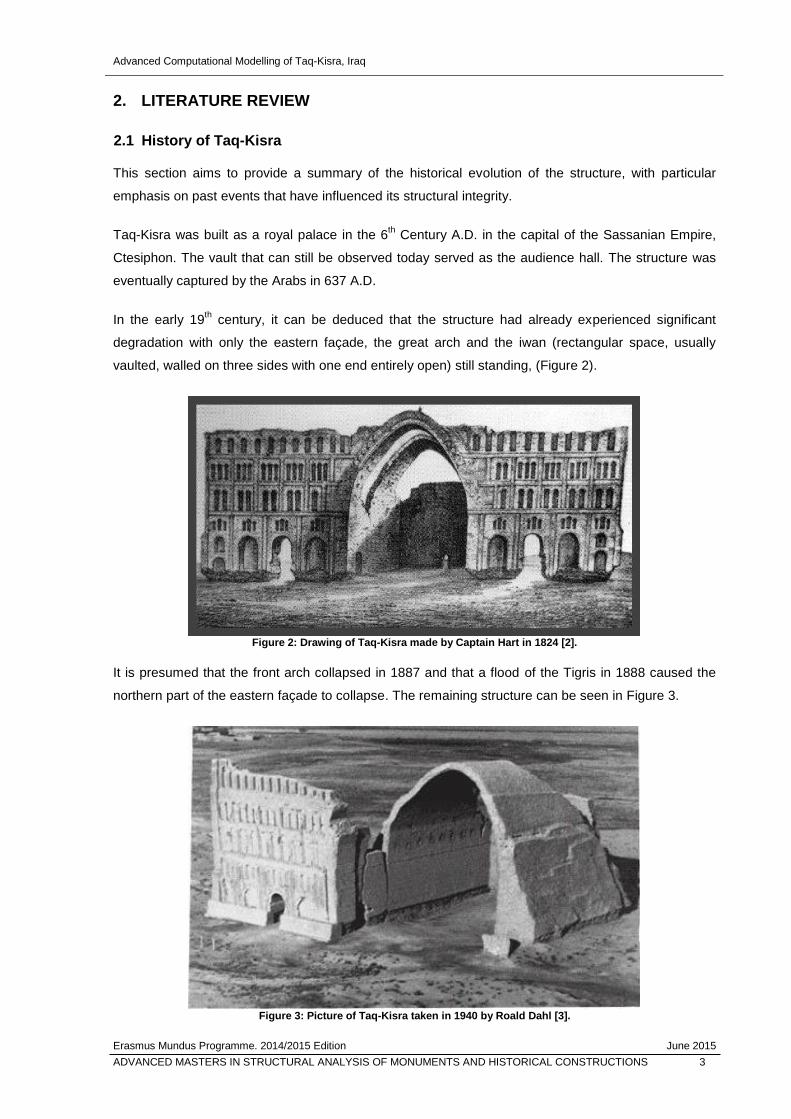
In the early 19th century, it can be deduced that the structure had already experienced significant
degradation with only the eastern façade, the great arch and the iwan (rectangular space, usually
vaulted, walled on three sides with one end entirely open) still standing, (Figure 2).
Figure 2: Drawing of Taq-Kisra made by Captain Hart in 1824 [2].
It is presumed that the front arch collapsed in 1887 and that a flood of the Tigris in 1888 caused the
northern part of the eastern façade to collapse. The remaining structure can be seen in Figure 3.
Figure 3: Picture of Taq-Kisra taken in 1940 by Roald Dahl [3].
Advanced Computational Modelling of Taq-Kisra, Iraq
Erasmus Mundus Programme. 2014/2015 Edition June 2015
4 ADVANCED MASTERS IN STRUCTURAL ANALYSIS OF MONUMENTS AND HISTORICAL CONSTRUCTIONS
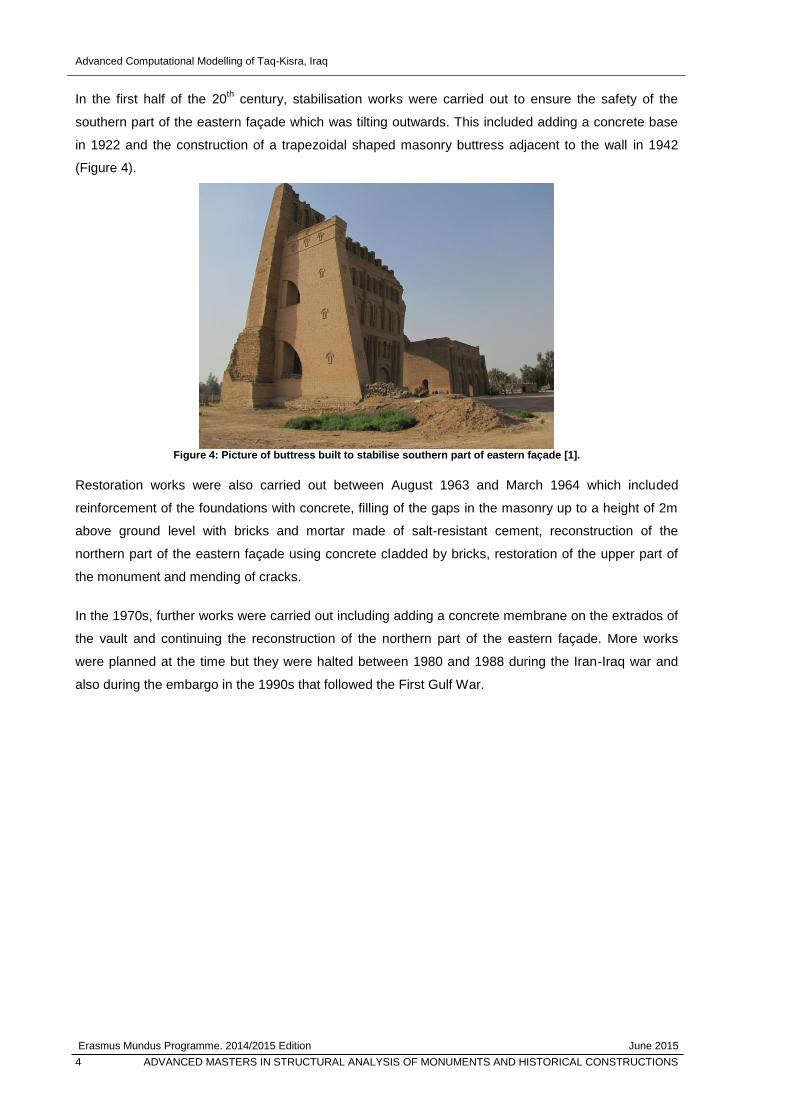
In the first half of the 20th century, stabilisation works were carried out to ensure the safety of the
southern part of the eastern façade which was tilting outwards. This included adding a concrete base
in 1922 and the construction of a trapezoidal shaped masonry buttress adjacent to the wall in 1942
(Figure 4).
Figure 4: Picture of buttress built to stabilise southern part of eastern façade [1].
Restoration works were also carried out between August 1963 and March 1964 which included
reinforcement of the foundations with concrete, filling of the gaps in the masonry up to a height of 2m
above ground level with bricks and mortar made of salt-resistant cement, reconstruction of the
northern part of the eastern façade using concrete cladded by bricks, restoration of the upper part of
the monument and mending of cracks.
In the 1970s, further works were carried out including adding a concrete membrane on the extrados of
the vault and continuing the reconstruction of the northern part of the eastern façade. More works
were planned at the time but they were halted between 1980 and 1988 during the Iran-Iraq war and
also during the embargo in the 1990s that followed the First Gulf War.
Advanced Computational Modelling of Taq-Kisra, Iraq
Erasmus Mundus Programme. 2014/2015 Edition June 2015
ADVANCED MASTERS IN STRUCTURAL ANALYSIS OF MONUMENTS AND HISTORICAL CONSTRUCTIONS 5
2.2 Project on Reconnaissance and Restoration of Structure
This section aims to provide an overview of all the relevant information found in the project
documentation of the works carried out by ProjektyZeman.cz on Taq-Kisra.
2.2.1 Overview of Structure
A brief description of the general dimensions and materials comprising the structure is given here.
The hall under the vault has approximate dimensions of 25.5 x 47.4 m. The vault, which is completely
exposed to the environment, has a peak elevation of 30.3 m, with a thickness which increases from
1.35 m at the apex to approximately 2.10 m at the springing level. The vault is smoothly connected to
the walls which increase to a depth of 7.5 m at ground level.
The vault and walls are made of masonry consisting of clay fired brick and gypsum mortar. The units
have dimensions of 300 x 300 x 70 mm and are arranged in horizontal layers in the walls whilst those
in the vault are arranged in vertical layers. Although there are significant variations in the thickness of
the joints, the average width of the mortar joints can be considered to be 35 mm. Pieces of wood have
been found which suggests that there were probably floors made of wooden beams, but these
structures no longer exist.
There was a concrete membrane of relatively poor quality over the vault which was removed as part of
the ProjektyZeman.cz restoration project. The thickness of the concrete membrane varied from
150 mm at the peak of the vault to 350 mm at the springing level.
Many parts of the vault have collapsed, the most significant of which is a large segment on the
western side of the vault.
2.2.2 Materials Report
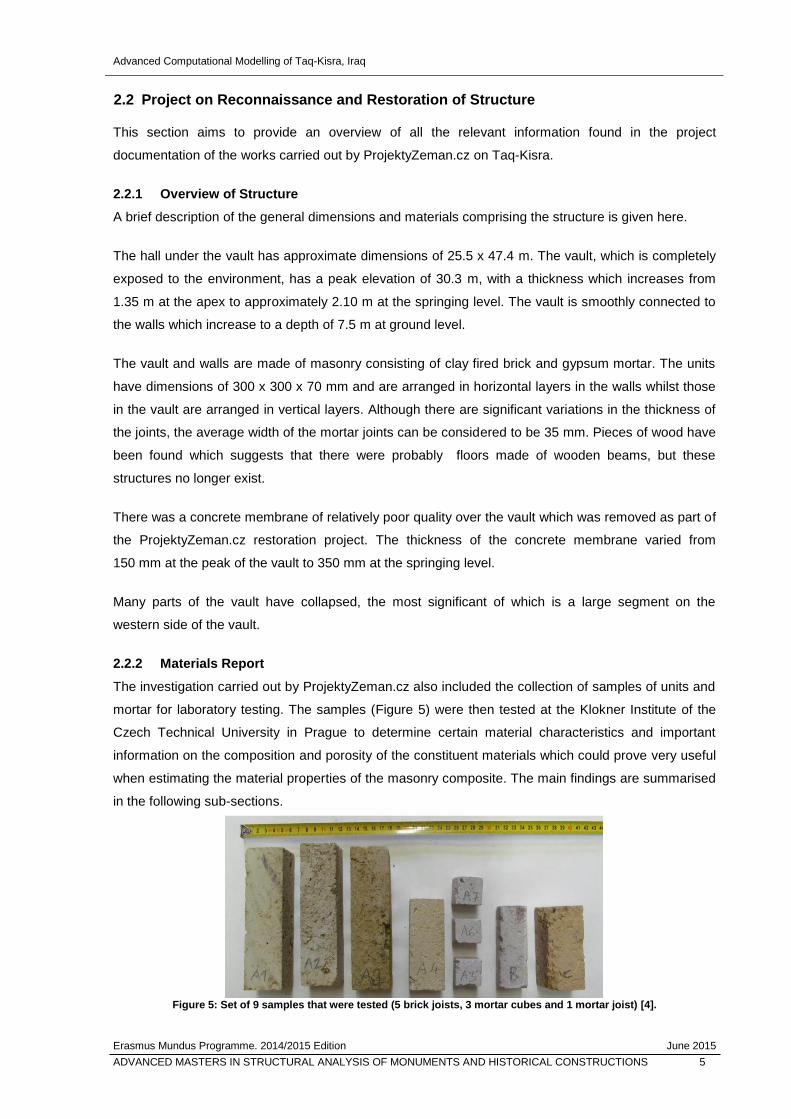
The investigation carried out by ProjektyZeman.cz also included the collection of samples of units and
mortar for laboratory testing. The samples (Figure 5) were then tested at the Klokner Institute of the
Czech Technical University in Prague to determine certain material characteristics and important
information on the composition and porosity of the constituent materials which could prove very useful
when estimating the material properties of the masonry composite. The main findings are summarised
in the following sub-sections.
Figure 5: Set of 9 samples that were tested (5 brick joists, 3 mortar cubes and 1 mortar joist) [4].
Advanced Computational Modelling of Taq-Kisra, Iraq
Erasmus Mundus Programme. 2014/2015 Edition June 2015
6 ADVANCED MASTERS IN STRUCTURAL ANALYSIS OF MONUMENTS AND HISTORICAL CONSTRUCTIONS
2.2.2.1 Bricks
It was found that the main component of the brick element is augite and that the units are generally
very porous and of relatively poor quality. The relevant properties that were determined experimentally
are summarised in Table 1.
Table 1: Properties of bricks determined experimentally.
Name Symbol Units Value
Bulk density γ kg/m3 1160
Elastic Modulus E MPa 2100
Tensile strength - dry ft (dry) MPa 1.4
Compressive strength -dry fc (dry) MPa 2.8
Tensile strength - saturated ft (sat.) MPa 1.2
Compressive strength - saturated fc (sat.) MPa 2.4
Coefficient of thermal expansion α 1/K 7.80E-06
2.2.2.2 Mortar
Thermal analysis, infrared spectrometry and microscopic analysis of the samples were used to
determine that the mortar consists primarily of gypsum (about 67% of the weight) with a smaller
degree of calcium carbonate (5.5% of weight). Small chips of bricks up to the size of 5mm were also
found in the samples. Due to the limited availability of samples, the testing program effectuated on the
mortar was less extensive than the one conducted for the bricks and hence fewer properties could be
determined. The relevant properties found are summarised in Table 2.
Table 2: Properties of mortar determined experimentally.
Name Symbol Units Value
Bulk density γ kg/m3 1460
Compressive strength -dry fc (dry) MPa 3.9
Compressive strength - saturated fc (sat.) MPa 1.6
coefficient of thermal expansion α 1/K 1.65E-05
Advanced Computational Modelling of Taq-Kisra, Iraq
Erasmus Mundus Programme. 2014/2015 Edition June 2015
ADVANCED MASTERS IN STRUCTURAL ANALYSIS OF MONUMENTS AND HISTORICAL CONSTRUCTIONS 7
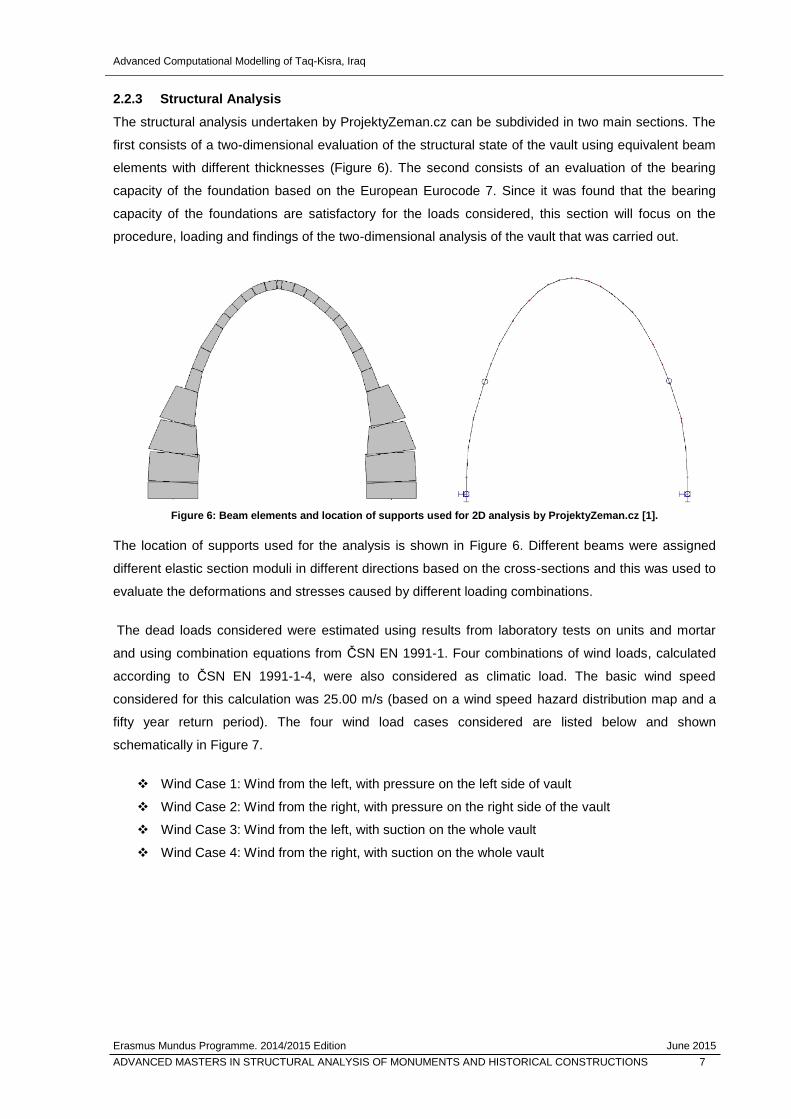
2.2.3 Structural Analysis
The structural analysis undertaken by ProjektyZeman.cz can be subdivided in two main sections. The
first consists of a two-dimensional evaluation of the structural state of the vault using equivalent beam
elements with different thicknesses (Figure 6). The second consists of an evaluation of the bearing
capacity of the foundation based on the European Eurocode 7. Since it was found that the bearing
capacity of the foundations are satisfactory for the loads considered, this section will focus on the
procedure, loading and findings of the two-dimensional analysis of the vault that was carried out.
Figure 6: Beam elements and location of supports used for 2D analysis by ProjektyZeman.cz [1].
The location of supports used for the analysis is shown in Figure 6. Different beams were assigned
different elastic section moduli in different directions based on the cross-sections and this was used to
evaluate the deformations and stresses caused by different loading combinations.
The dead loads considered were estimated using results from laboratory tests on units and mortar
and using combination equations from ČSN EN 1991-1. Four combinations of wind loads, calculated
according to ČSN EN 1991-1-4, were also considered as climatic load. The basic wind speed
considered for this calculation was 25.00 m/s (based on a wind speed hazard distribution map and a
fifty year return period). The four wind load cases considered are listed below and shown
schematically in Figure 7.
Wind Case 1: Wind from the left, with pressure on the left side of vault
Wind Case 2: Wind from the right, with pressure on the right side of the vault
Wind Case 3: Wind from the left, with suction on the whole vault
Wind Case 4: Wind from the right, with suction on the whole vault

Advanced Computational Modelling of Taq-Kisra, Iraq
Erasmus Mundus Programme. 2014/2015 Edition June 2015
8 ADVANCED MASTERS IN STRUCTURAL ANALYSIS OF MONUMENTS AND HISTORICAL CONSTRUCTIONS
Figure 7: Wind load cases considered by ProjektyZeman.cz in structural analysis [1].
The main conclusion from this structural analysis was that the vault in general has enough strength to
support its own weight despite the asymmetrical deformed geometry predicted by the structural
analysis (Figure 8). However, in certain regions, it was deemed that the vault locally cannot withstand
some loads particularly if faults arise due to overloading from the wind. This is particularly true for
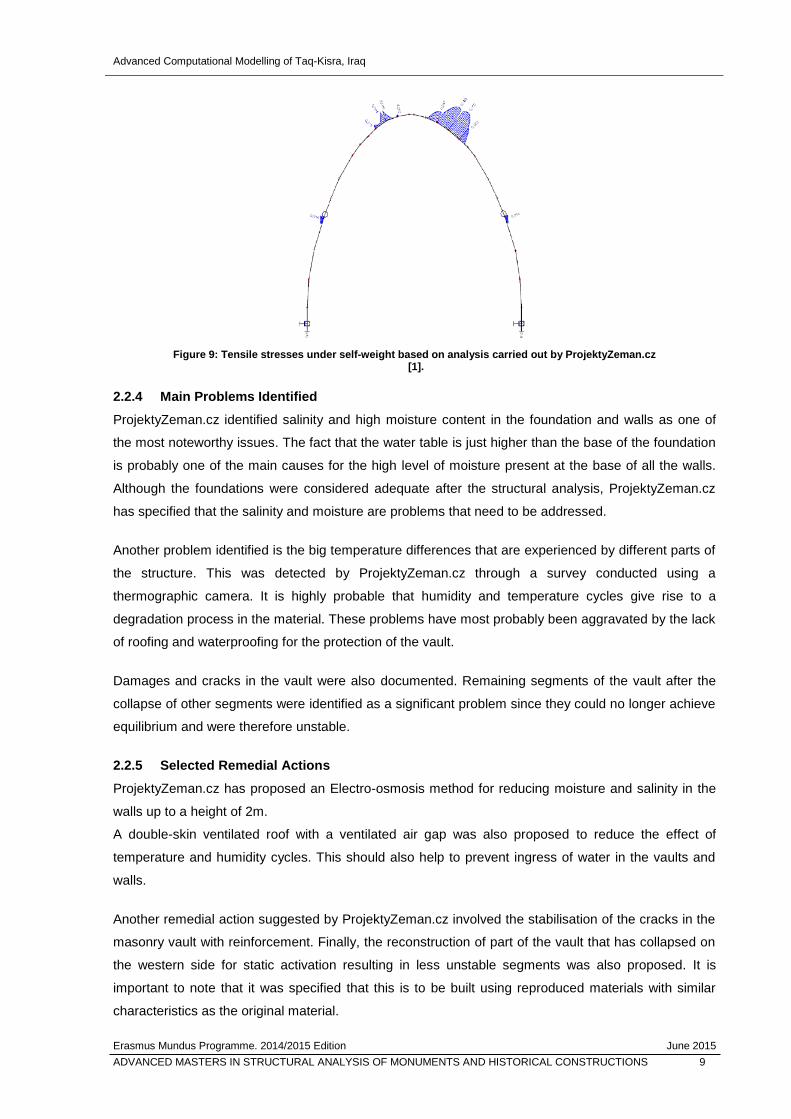
areas which experience tensile stresses as shown in Figure 9. Hence, stainless steel reinforcement
was suggested for areas experiencing tensile stresses.
Figure 8: Deformed geometry of vault under self-weight based on structural analysis carried out by ProjektyZeman.cz
[1].
Wind Case 1 Wind Case 2
Wind Case 3 Wind Case 4
Advanced Computational Modelling of Taq-Kisra, Iraq
Erasmus Mundus Programme. 2014/2015 Edition June 2015
ADVANCED MASTERS IN STRUCTURAL ANALYSIS OF MONUMENTS AND HISTORICAL CONSTRUCTIONS 9
Figure 9: Tensile stresses under self-weight based on analysis carried out by ProjektyZeman.cz
[1].
2.2.4 Main Problems Identified
ProjektyZeman.cz identified salinity and high moisture content in the foundation and walls as one of
the most noteworthy issues. The fact that the water table is just higher than the base of the foundation
is probably one of the main causes for the high level of moisture present at the base of all the walls.
Although the foundations were considered adequate after the structural analysis, ProjektyZeman.cz
has specified that the salinity and moisture are problems that need to be addressed.
Another problem identified is the big temperature differences that are experienced by different parts of
the structure. This was detected by ProjektyZeman.cz through a survey conducted using a
thermographic camera. It is highly probable that humidity and temperature cycles give rise to a
degradation process in the material. These problems have most probably been aggravated by the lack
of roofing and waterproofing for the protection of the vault.
Damages and cracks in the vault were also documented. Remaining segments of the vault after the
collapse of other segments were identified as a significant problem since they could no longer achieve
equilibrium and were therefore unstable.
2.2.5 Selected Remedial Actions
ProjektyZeman.cz has proposed an Electro-osmosis method for reducing moisture and salinity in the
walls up to a height of 2m.
A double-skin ventilated roof with a ventilated air gap was also proposed to reduce the effect of
temperature and humidity cycles. This should also help to prevent ingress of water in the vaults and
walls.
Another remedial action suggested by ProjektyZeman.cz involved the stabilisation of the cracks in the
masonry vault with reinforcement. Finally, the reconstruction of part of the vault that has collapsed on
the western side for static activation resulting in less unstable segments was also proposed. It is
important to note that it was specified that this is to be built using reproduced materials with similar
characteristics as the original material.

Advanced Computational Modelling of Taq-Kisra, Iraq
Erasmus Mundus Programme. 2014/2015 Edition June 2015
10 ADVANCED MASTERS IN STRUCTURAL ANALYSIS OF MONUMENTS AND HISTORICAL CONSTRUCTIONS
2.3 Previous structural analysis of Taq-Kisra
Another form of structural analysis of the Taq-Kisra vault was performed as part of a case study by
J.F.D Dahmen and J. A. Ochsendorf. Since high self-weight and low compressive stresses usually
characterise unreinforced masonry vaults, they can be regarded primarily as problems of stability
rather than strength. Hence a structural analysis technique based on plastic theory; more particularly
on the lower bound theorem of limit analysis was used to investigate the structural stability of the Taq-
Kisra vault. The analysis is based on three underlying fundamental assumptions [5]:
Masonry has no tensile strength
Masonry effectively has unlimited compressive strength due to stresses being so low
No failure due to sliding
Static graphics can then be used to find multiple paths of compressive only forces known as thrust
lines. The lower bound theorem states that if one thrust line can be found to lie entirely within the
masonry, the structure can be demonstrated to be safe. The result from this analysis for the Taq-Kisra
vault is shown in Figure 10.
Figure 10: Static graphic analysis of Taq-Kisra vault [6].
As can be seen from Figure 10, a thrust line can be found to lie within the masonry in the case of the
Taq-Kisra vault. This leads to suggest that the geometry alone is not responsible for the collapsed
segments and that material degradation along with other events in the past have had an important
influence in causing the damages that can be observed today. Nevertheless, it can be seen that the
thrust line is particularly eccentric in different parts of the vault. These eccentricities could suggest that
the structure is in a somewhat precarious state of equilibrium and that some areas of the vault could
be particularly susceptible to damage when experiencing external forces.
Advanced Computational Modelling of Taq-Kisra, Iraq
Erasmus Mundus Programme. 2014/2015 Edition June 2015
ADVANCED MASTERS IN STRUCTURAL ANALYSIS OF MONUMENTS AND HISTORICAL CONSTRUCTIONS 11
2.4 Behaviour and properties of masonry
Masonry is one of the oldest building materials to have been used, with earliest uses dating back more
than 10,000 years. It is a heterogeneous material consisting of units and joints. Units are typically
made of stone, clay-fired bricks, earth bricks or concrete blocks held together with some form of
mortar (except in the case of dry stone masonry where no mortar is used).
Naturally, due to its widespread use over a long period of time, there is a strong variability in the
different arrangements and materials used for masonry structures. This has made the prediction of
material properties of masonry a very difficult task. Furthermore, masonry usually exhibits distinct
directional properties due to its heterogeneous nature. These two aspects of masonry prove
particularly problematic for modern structural analysis using the finite element method since this
requires a mathematical description of the relation between the stress and strain tensor in a material
point of the body, known as a constitutive model. Hence, accurate numerical modelling of masonry
structures often requires an extensive testing campaign. This poses many difficulties, particularly in
the case of historic structures where regular sampling methods and standards cannot always be
applied.
2.4.1 Non-linear behaviour of constituents
The properties of masonry are strongly dependent upon the properties of its constituents. In most
cases, these are quasi-brittle materials exhibiting non-linear behaviour that is characterised by
softening. Softening is the gradual decrease of mechanical resistance under a continuous increase of
deformation forced upon a material specimen or structure [7]. Softening behaviour can be attributed to
the process of progressive crack growth which leads to failure in quasi-brittle materials.
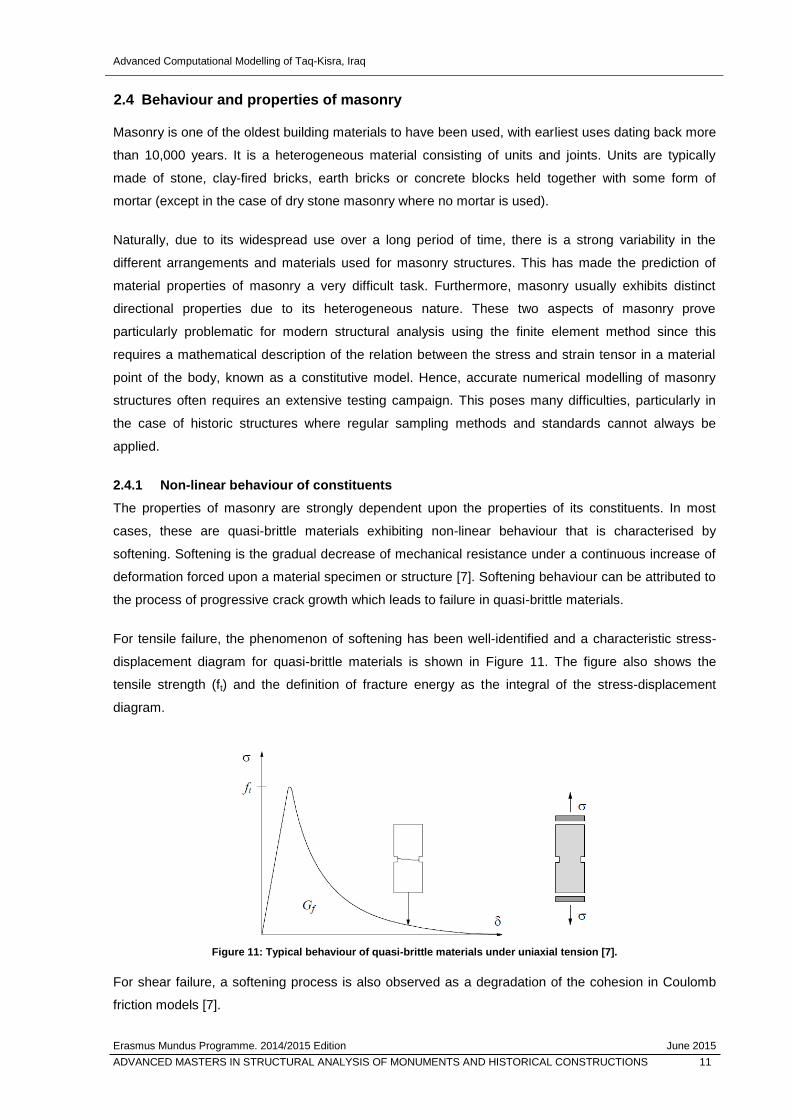
For tensile failure, the phenomenon of softening has been well-identified and a characteristic stress-
displacement diagram for quasi-brittle materials is shown in Figure 11. The figure also shows the
tensile strength (ft) and the definition of fracture energy as the integral of the stress-displacement
diagram.
Figure 11: Typical behaviour of quasi-brittle materials under uniaxial tension [7].
For shear failure, a softening process is also observed as a degradation of the cohesion in Coulomb
friction models [7].
Advanced Computational Modelling of Taq-Kisra, Iraq
Erasmus Mundus Programme. 2014/2015 Edition June 2015
12 ADVANCED MASTERS IN STRUCTURAL ANALYSIS OF MONUMENTS AND HISTORICAL CONSTRUCTIONS
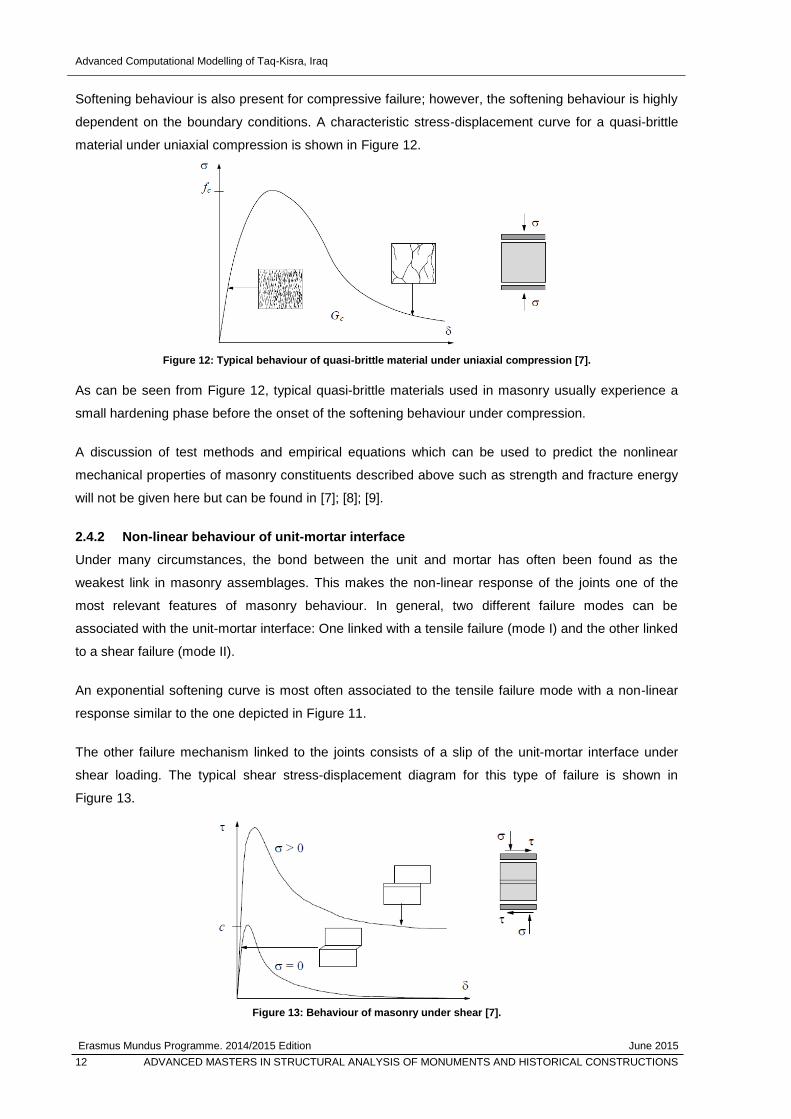
Softening behaviour is also present for compressive failure; however, the softening behaviour is highly
dependent on the boundary conditions. A characteristic stress-displacement curve for a quasi-brittle
material under uniaxial compression is shown in Figure 12.
Figure 12: Typical behaviour of quasi-brittle material under uniaxial compression [7].
As can be seen from Figure 12, typical quasi-brittle materials used in masonry usually experience a
small hardening phase before the onset of the softening behaviour under compression.
A discussion of test methods and empirical equations which can be used to predict the nonlinear
mechanical properties of masonry constituents described above such as strength and fracture energy
will not be given here but can be found in [7]; [8]; [9].
2.4.2 Non-linear behaviour of unit-mortar interface
Under many circumstances, the bond between the unit and mortar has often been found as the
weakest link in masonry assemblages. This makes the non-linear response of the joints one of the
most relevant features of masonry behaviour. In general, two different failure modes can be
associated with the unit-mortar interface: One linked with a tensile failure (mode I) and the other linked
to a shear failure (mode II).
An exponential softening curve is most often associated to the tensile failure mode with a non-linear
response similar to the one depicted in Figure 11.
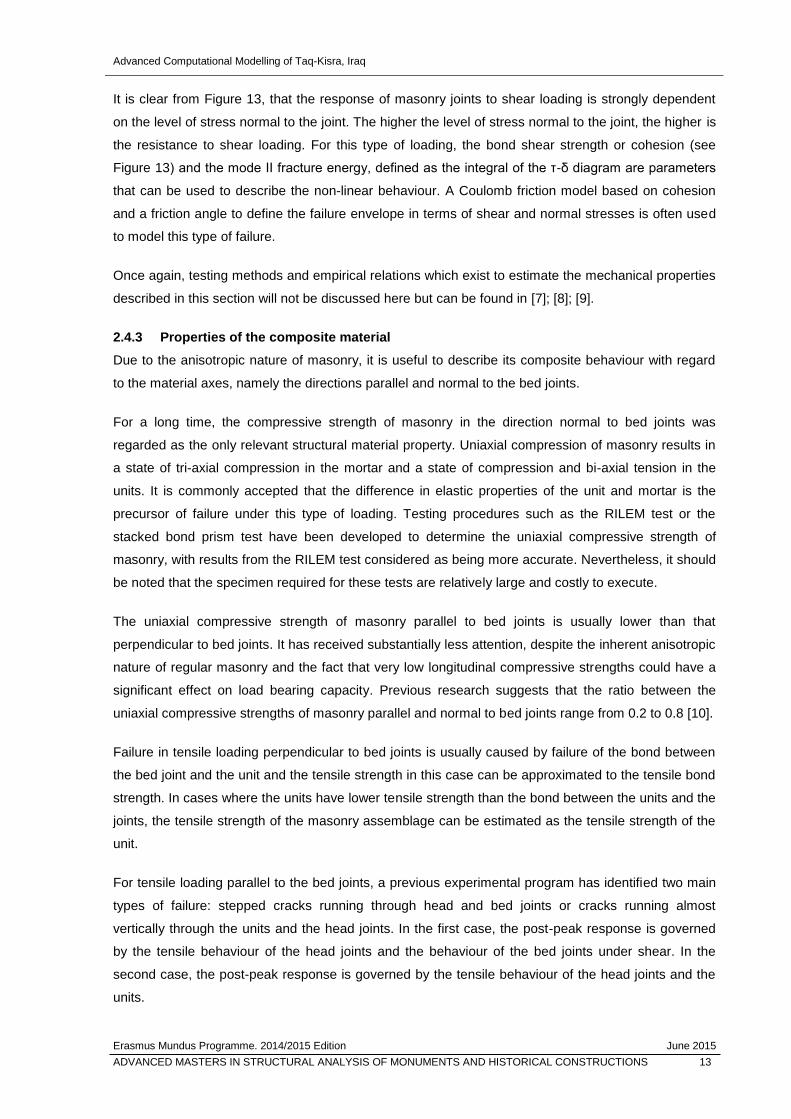
The other failure mechanism linked to the joints consists of a slip of the unit-mortar interface under
shear loading. The typical shear stress-displacement diagram for this type of failure is shown in
Figure 13.
Figure 13: Behaviour of masonry under shear [7].
Advanced Computational Modelling of Taq-Kisra, Iraq
Erasmus Mundus Programme. 2014/2015 Edition June 2015
ADVANCED MASTERS IN STRUCTURAL ANALYSIS OF MONUMENTS AND HISTORICAL CONSTRUCTIONS 13
It is clear from Figure 13, that the response of masonry joints to shear loading is strongly dependent
on the level of stress normal to the joint. The higher the level of stress normal to the joint, the higher is
the resistance to shear loading. For this type of loading, the bond shear strength or cohesion (see
Figure 13) and the mode II fracture energy, defined as the integral of the τ-δ diagram are parameters
that can be used to describe the non-linear behaviour. A Coulomb friction model based on cohesion
and a friction angle to define the failure envelope in terms of shear and normal stresses is often used
to model this type of failure.
Once again, testing methods and empirical relations which exist to estimate the mechanical properties
described in this section will not be discussed here but can be found in [7]; [8]; [9].
2.4.3 Properties of the composite material
Due to the anisotropic nature of masonry, it is useful to describe its composite behaviour with regard
to the material axes, namely the directions parallel and normal to the bed joints.
For a long time, the compressive strength of masonry in the direction normal to bed joints was
regarded as the only relevant structural material property. Uniaxial compression of masonry results in
a state of tri-axial compression in the mortar and a state of compression and bi-axial tension in the
units. It is commonly accepted that the difference in elastic properties of the unit and mortar is the
precursor of failure under this type of loading. Testing procedures such as the RILEM test or the
stacked bond prism test have been developed to determine the uniaxial compressive strength of
masonry, with results from the RILEM test considered as being more accurate. Nevertheless, it should
be noted that the specimen required for these tests are relatively large and costly to execute.
The uniaxial compressive strength of masonry parallel to bed joints is usually lower than that
perpendicular to bed joints. It has received substantially less attention, despite the inherent anisotropic
nature of regular masonry and the fact that very low longitudinal compressive strengths could have a
significant effect on load bearing capacity. Previous research suggests that the ratio between the
uniaxial compressive strengths of masonry parallel and normal to bed joints range from 0.2 to 0.8 [10].
Failure in tensile loading perpendicular to bed joints is usually caused by failure of the bond between
the bed joint and the unit and the tensile strength in this case can be approximated to the tensile bond
strength. In cases where the units have lower tensile strength than the bond between the units and the
joints, the tensile strength of the masonry assemblage can be estimated as the tensile strength of the
unit.
For tensile loading parallel to the bed joints, a previous experimental program has identified two main
types of failure: stepped cracks running through head and bed joints or cracks running almost
vertically through the units and the head joints. In the first case, the post-peak response is governed
by the tensile behaviour of the head joints and the behaviour of the bed joints under shear. In the
second case, the post-peak response is governed by the tensile behaviour of the head joints and the
units.

Advanced Computational Modelling of Taq-Kisra, Iraq
Erasmus Mundus Programme. 2014/2015 Edition June 2015
14 ADVANCED MASTERS IN STRUCTURAL ANALYSIS OF MONUMENTS AND HISTORICAL CONSTRUCTIONS
Investigations have also been made on the biaxial behaviour of masonry which cannot be completely
described from the constitutive behaviour under uniaxial loading conditions. Due to the anisotropic
nature of masonry its biaxial strength envelope cannot be described simply in terms of principal
stresses. Instead, it has to be described either in terms of the full stress vector in a set of material axes
or in terms of principal stresses and the rotation angle between the principal axes and the material
axes.
2.5 Strategies for the numerical modelling of masonry structures
Due to the distinct directional properties and the inherent complexities of the material behaviour
described in the previous section, different strategies with different levels of sophistication have been
used for the numerical representation of masonry structures. In general, modelling can focus on the
individual components or on the masonry composite as a whole. Depending on the application and
level of accuracy required, one of the following three strategies can be used [8]:
Detailed micro-modelling: units and mortar are modelled using continuum elements whereas
the interface between the two is modelled using discontinuum elements.
Simplified micro-modelling: expanded units are modelled using continuum elements whilst the
behaviour of the mortar and interface are combined in discontinuum elements.
Macro-modelling: In this strategy, no distinction is made between the units and the joints and
masonry is modelled as a homogeneous isotropic or anisotropic continuum.
See also Figure 14.
Figure 14: Different modelling strategies for masonry: (a) detailed micro-modelling, (b) simplified micro-modelling,
(c) macro-modelling [7].
The first strategy allows for a very accurate description of the masonry and the combined action of
unit, mortar and interface can be studied in depth. Some accuracy is lost in the second approach as
the Poisson effect of the mortar is not taken into consideration. Complete micro-models can include all
the failure mechanisms of masonry namely cracking of joints, sliding over head or bead joints,
cracking of the units and crushing of the masonry. Naturally, micro-models require a lot of
computational effort as well as a geometrical description of all the units and joints. Hence, they cannot
be feasibly used to model whole large structures; they are mainly applied to modelling small structural
details or to obtain a better understanding of the composite behaviour.
Subsequently, macro-modelling is the only strategy that can be used in practice to model large
structures. It should be noted that macro-models cannot account for shear failure at the joints since
unit and mortar geometries are not discretised. Therefore, failure has to be linked to tension and
Advanced Computational Modelling of Taq-Kisra, Iraq
Erasmus Mundus Programme. 2014/2015 Edition June 2015
ADVANCED MASTERS IN STRUCTURAL ANALYSIS OF MONUMENTS AND HISTORICAL CONSTRUCTIONS 15
compression modes in principal stress space. Naturally, different material models and failure criteria
accounting for the nonlinear post-peak behaviour of masonry can be used. Defining the homogenised
material parameters which control the material behaviour is therefore of utmost importance in
obtaining reliable results.

Advanced Computational Modelling of Taq-Kisra, Iraq
Erasmus Mundus Programme. 2014/2015 Edition June 2015
16 ADVANCED MASTERS IN STRUCTURAL ANALYSIS OF MONUMENTS AND HISTORICAL CONSTRUCTIONS
This page is left blank on purpose.
Advanced Computational Modelling of Taq-Kisra, Iraq
Erasmus Mundus Programme. 2014/2015 Edition June 2015
ADVANCED MASTERS IN STRUCTURAL ANALYSIS OF MONUMENTS AND HISTORICAL CONSTRUCTIONS 17
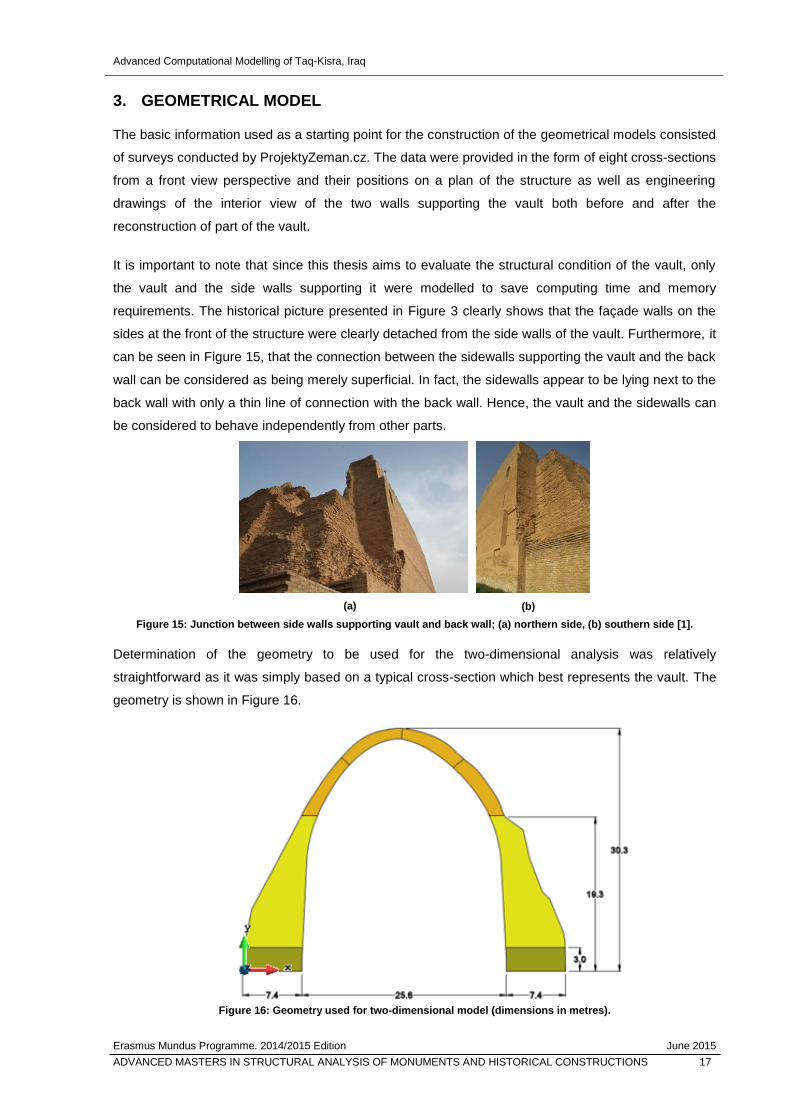
3. GEOMETRICAL MODEL
The basic information used as a starting point for the construction of the geometrical models consisted
of surveys conducted by ProjektyZeman.cz. The data were provided in the form of eight cross-sections
from a front view perspective and their positions on a plan of the structure as well as engineering
drawings of the interior view of the two walls supporting the vault both before and after the
reconstruction of part of the vault.
It is important to note that since this thesis aims to evaluate the structural condition of the vault, only
the vault and the side walls supporting it were modelled to save computing time and memory
requirements. The historical picture presented in Figure 3 clearly shows that the façade walls on the
sides at the front of the structure were clearly detached from the side walls of the vault. Furthermore, it
can be seen in Figure 15, that the connection between the sidewalls supporting the vault and the back
wall can be considered as being merely superficial. In fact, the sidewalls appear to be lying next to the
back wall with only a thin line of connection with the back wall. Hence, the vault and the sidewalls can
be considered to behave independently from other parts.
Figure 15: Junction between side walls supporting vault and back wall; (a) northern side, (b) southern side [1].
Determination of the geometry to be used for the two-dimensional analysis was relatively
straightforward as it was simply based on a typical cross-section which best represents the vault. The
geometry is shown in Figure 16.
Figure 16: Geometry used for two-dimensional model (dimensions in metres).
(a) (b)

Advanced Computational Modelling of Taq-Kisra, Iraq
Erasmus Mundus Programme. 2014/2015 Edition June 2015
18 ADVANCED MASTERS IN STRUCTURAL ANALYSIS OF MONUMENTS AND HISTORICAL CONSTRUCTIONS
The three-dimensional geometry was first constructed by extruding eight cross-sections and applying
appropriate cuts according to the profiles of the side walls and of the damaged vault. The resulting
three-dimensional geometry after this process is shown in Figure 17.
Figure 17: three-dimensional geometry before simplification.
As can be seen from Figure 17, there are many small variations in the topography of the walls and of
the vault. Although these variations are unlikely to have any significant impact on the response of the
structure, they would certainly cause many difficulties while creating a mesh and could result in
localised, spurious and mesh-related stresses during the analysis. Hence, it was decided that a
simplified geometry (Figure 18) which eliminates small irregularities would be used in order to obtain a
more computationally efficient model.
Figure 18: Simplified three-dimensional geometry
The next step consisted of partitioning the volume into quasi-homogeneous parts, in order to partially
reproduce the heterogeneities of the structure. The different parts considered are listed below and
shown in Figure 19:
Dry masonry with bricks in horizontal layers
Wet masonry with bricks in horizontal layers
Dry masonry with bricks in vertical layers
South-east view North-west view
South-east view North-west view

Advanced Computational Modelling of Taq-Kisra, Iraq
Erasmus Mundus Programme. 2014/2015 Edition June 2015
ADVANCED MASTERS IN STRUCTURAL ANALYSIS OF MONUMENTS AND HISTORICAL CONSTRUCTIONS 19
Figure 19: Different parts modelled using homogeneous quasi-brittle material models.
The survey undertaken by ProjektyZeman.cz involved measurements of moisture and the height of the
rising damp was recorded at several points. The average value of these measurements (3 m) was
used to define the boundary between the wet masonry and the dry masonry in the model. Since the
materials report also included results on saturated specimens, it was deemed that the loss in strength
of the material due to humidity could be taken into account by reducing the strength and other
properties based on the experimental results. The material models and parameters used are
explained in greater detail in Section 5.
An important part of the restoration works carried out by ProjektyZeman.cz was the reconstruction of
part of the vault using a compatible material. It was important to model this as this thesis also aims to
evaluate the structural state of the structure after restoration. The geometry of the reconstructed part
is presented in Figure 20.
Figure 20: Reconstruction of part of the vault.
It can be seen in Figure 16 as well as in the figures of the simplified three-dimensional geometrical
models that the vault has been divided in 4 sections (surfaces in two dimensions and volumes in three
dimensions). These partitions were made so that the wind load on the vault could be applied as
recommended by the Eurocode 1. This is described in further detail in Section 8.
Bricks in vertical layers
Bricks in horizontal layers (dry)
Bricks in horizontal layers (wet)

Advanced Computational Modelling of Taq-Kisra, Iraq
Erasmus Mundus Programme. 2014/2015 Edition June 2015
20 ADVANCED MASTERS IN STRUCTURAL ANALYSIS OF MONUMENTS AND HISTORICAL CONSTRUCTIONS
This page is left blank on purpose.

Advanced Computational Modelling of Taq-Kisra, Iraq
Erasmus Mundus Programme. 2014/2015 Edition June 2015
ADVANCED MASTERS IN STRUCTURAL ANALYSIS OF MONUMENTS AND HISTORICAL CONSTRUCTIONS 21
4. ELEMENT SELECTION AND MESH
4.1 Two-dimensional model
Linear triangular elements with a one-point integration scheme were chosen to model the structure in
two dimensions. Although these elements tend to be quite stiff and particularly prone to “locking”, the
relatively low computational effort required to run the two-dimensional simulations allowed a very fine
mesh to be used with good quality elements which should produce good quality results (see Figure
21). A plane strain idealisation was used for these elements since the vault cannot be modelled as a
thin body, and it was therefore deemed that assuming all strains normal to the front face being zero
would provide better results. All elements were assigned a thickness of 1 m.
A trial and error procedure was used to obtain the final mesh. A shape quality criterion based on the
likeness of each element to an equilateral triangle was used to compare different meshes. The
mathematical expression of this quality measure is as follows:
𝑞 =4∙√3∙𝐴
∑ 𝑙𝑖23
𝑖=1
[11]
where A is the area of the triangle and li are the lengths of the triangle’s edges.
An equilateral triangular element will have a value of one, with decreasing values as the shape of the
element becomes worse. A negative value indicates that the element has a negative Jacobian at
some point. Hence, a strong requirement of the final mesh was that no elements could have a
negative shape quality criterion.
An unstructured mesh consisting of 16,411 elements, created using the Rsurf surface mesher
available in the GiD pre-processor [11], with elements having an average assigned side length of 0.3m
was chosen for the final model. The mesh and the cumulative distribution of the quality criterion
described above can be seen in Figure 21.
Figure 21: a) Mesh used for two-dimensional model; b) Cumulative distribution of shape quality criteria.
It can be seen that due to the small size of elements used, the software was able to generate very
good quality elements, most of which have a shape quality criterion, q, greater than 0.9.
(b) (a)
Advanced Computational Modelling of Taq-Kisra, Iraq
Erasmus Mundus Programme. 2014/2015 Edition June 2015
22 ADVANCED MASTERS IN STRUCTURAL ANALYSIS OF MONUMENTS AND HISTORICAL CONSTRUCTIONS
4.2 Three-dimensional models
Linear tetrahedral elements with a one-point integration scheme were employed for three-dimensional
problems. Once again, the final mesh used to run the analyses was chosen using a trial and error
procedure in order to obtain a mesh which would provide a good balance between quality of results
and computational effort. A shape quality criterion based on the likeness of each element to a regular
tetrahedron was used to compare different meshes. The mathematical expression of this quality
measure is as follows:
𝑞 =6∙√2∙𝑉
∑ 𝑙𝑖36
𝑖=1
[11]
where V is the volume of the tetrahedron and li are the lengths of its edges.
A regular tetrahedral element will have a value of one, with decreasing values as the shape of the
element becomes worse. Once again, no elements were allowed to have a negative shape quality
criterion as this would be indicative of a negative Jacobian at some point.
The three-dimensional shape contained many small corners and boundaries between volumes,
particularly in the case of the previous geometry before the reconstruction of the vault, which could
prove particularly difficult to mesh. This meant that the model could be susceptible to inaccurate
mesh-related results in certain areas. This was also taken into consideration and a mesh which did not
exhibit such spurious results was chosen for the final analyses.
Three different meshes were used for the final analyses. The first one was used to model the previous
geometry before the reconstruction of part of the vault. The second mesh was used to model the
geometry of the vault after the reconstruction as a single entity. Naturally, the behaviour of this model
would be unrealistic as the reconstruction was added on the already loaded and deformed previous
geometry of the vault. However, it provides some qualitative insight on how the reconstructed
geometry would behave under additional loading such as wind loads and was therefore included as a
part of this thesis. Finally, a third mesh was used to model the reconstruction in two loading steps in
order to obtain a more realistic understanding of the behaviour of the structure after the reconstruction.
Each of the three meshes used are described briefly and shown in the following sub-sections.
Advanced Computational Modelling of Taq-Kisra, Iraq
Erasmus Mundus Programme. 2014/2015 Edition June 2015
ADVANCED MASTERS IN STRUCTURAL ANALYSIS OF MONUMENTS AND HISTORICAL CONSTRUCTIONS 23
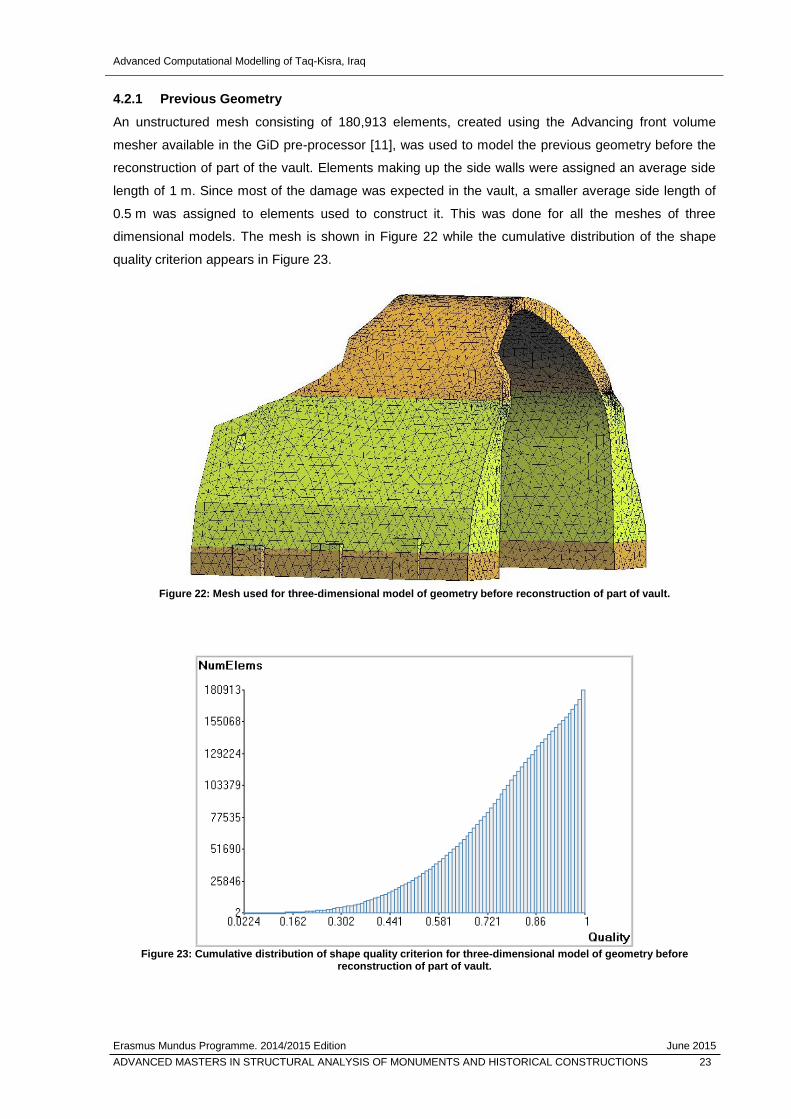
4.2.1 Previous Geometry
An unstructured mesh consisting of 180,913 elements, created using the Advancing front volume
mesher available in the GiD pre-processor [11], was used to model the previous geometry before the
reconstruction of part of the vault. Elements making up the side walls were assigned an average side
length of 1 m. Since most of the damage was expected in the vault, a smaller average side length of
0.5 m was assigned to elements used to construct it. This was done for all the meshes of three
dimensional models. The mesh is shown in Figure 22 while the cumulative distribution of the shape
quality criterion appears in Figure 23.
Figure 22: Mesh used for three-dimensional model of geometry before reconstruction of part of vault.
Figure 23: Cumulative distribution of shape quality criterion for three-dimensional model of geometry before
reconstruction of part of vault.
Advanced Computational Modelling of Taq-Kisra, Iraq
Erasmus Mundus Programme. 2014/2015 Edition June 2015
24 ADVANCED MASTERS IN STRUCTURAL ANALYSIS OF MONUMENTS AND HISTORICAL CONSTRUCTIONS
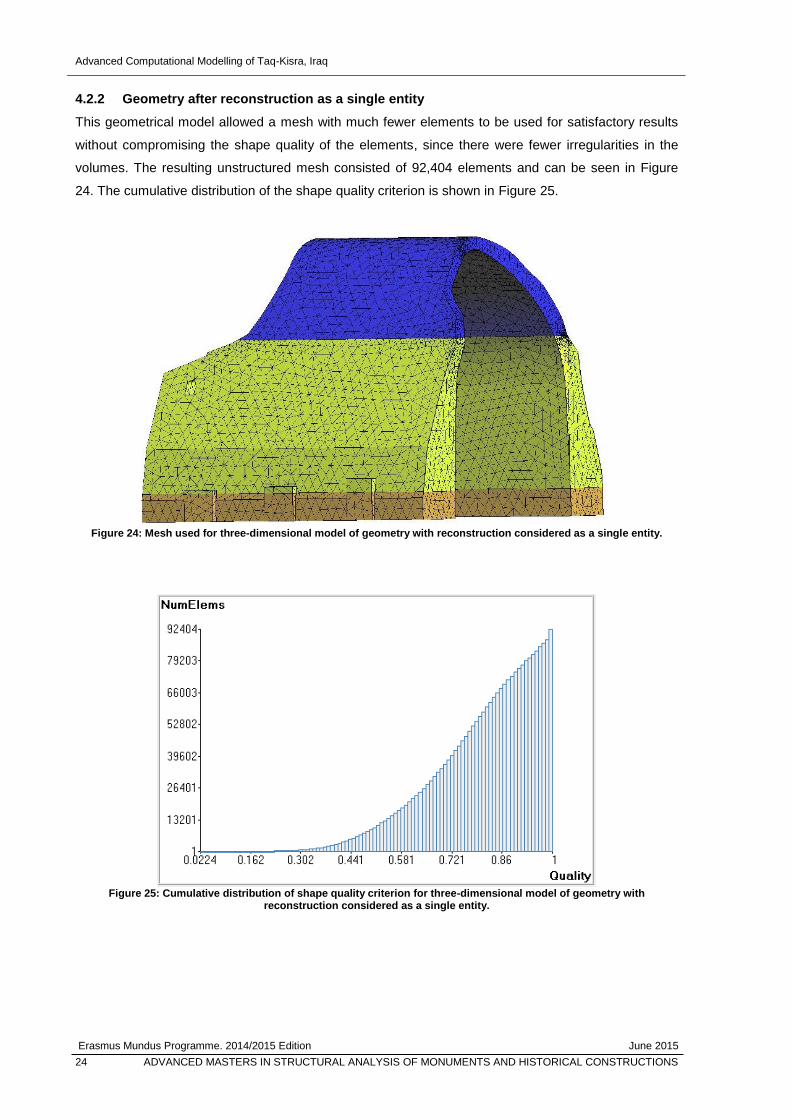
4.2.2 Geometry after reconstruction as a single entity
This geometrical model allowed a mesh with much fewer elements to be used for satisfactory results
without compromising the shape quality of the elements, since there were fewer irregularities in the
volumes. The resulting unstructured mesh consisted of 92,404 elements and can be seen in Figure
24. The cumulative distribution of the shape quality criterion is shown in Figure 25.
Figure 24: Mesh used for three-dimensional model of geometry with reconstruction considered as a single entity.
Figure 25: Cumulative distribution of shape quality criterion for three-dimensional model of geometry with
reconstruction considered as a single entity.
Advanced Computational Modelling of Taq-Kisra, Iraq
Erasmus Mundus Programme. 2014/2015 Edition June 2015
ADVANCED MASTERS IN STRUCTURAL ANALYSIS OF MONUMENTS AND HISTORICAL CONSTRUCTIONS 25
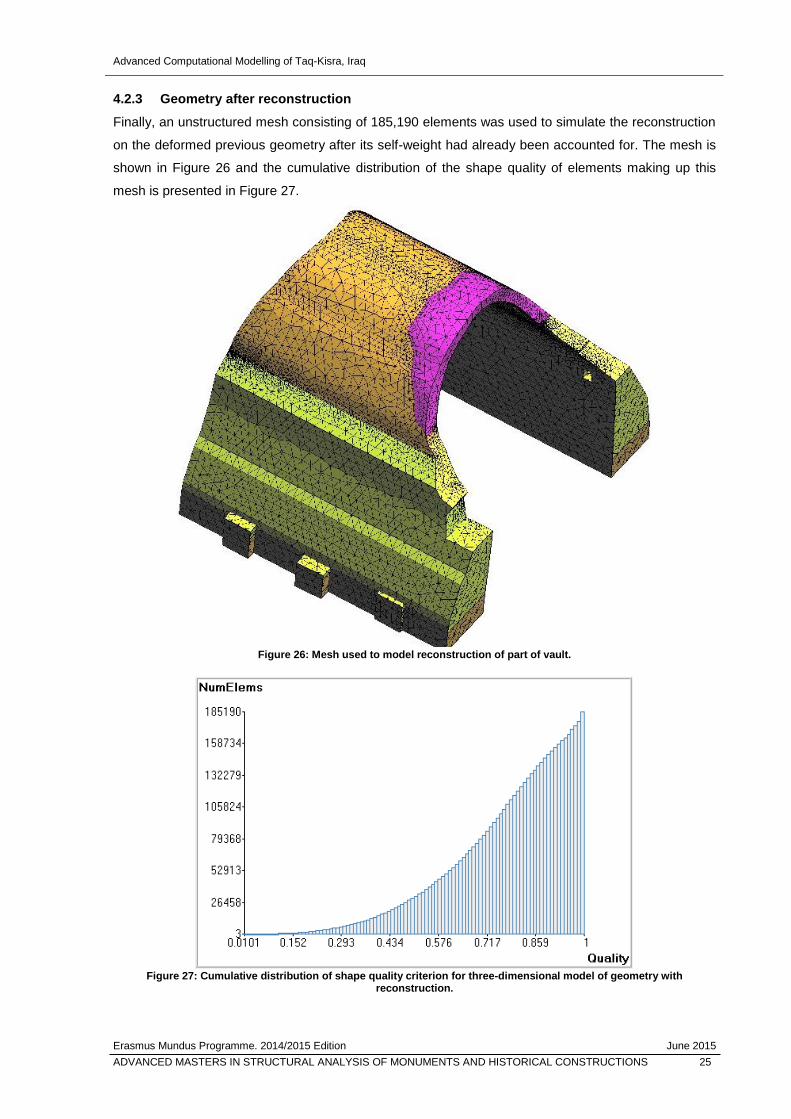
4.2.3 Geometry after reconstruction
Finally, an unstructured mesh consisting of 185,190 elements was used to simulate the reconstruction
on the deformed previous geometry after its self-weight had already been accounted for. The mesh is
shown in Figure 26 and the cumulative distribution of the shape quality of elements making up this
mesh is presented in Figure 27.
Figure 26: Mesh used to model reconstruction of part of vault.
Figure 27: Cumulative distribution of shape quality criterion for three-dimensional model of geometry with
reconstruction.
Advanced Computational Modelling of Taq-Kisra, Iraq
Erasmus Mundus Programme. 2014/2015 Edition June 2015
26 ADVANCED MASTERS IN STRUCTURAL ANALYSIS OF MONUMENTS AND HISTORICAL CONSTRUCTIONS
This page is left blank on purpose.

Advanced Computational Modelling of Taq-Kisra, Iraq
Erasmus Mundus Programme. 2014/2015 Edition June 2015
ADVANCED MASTERS IN STRUCTURAL ANALYSIS OF MONUMENTS AND HISTORICAL CONSTRUCTIONS 27
5. MATERIAL CHARACTERISATION
As previously discussed, the structure consists broadly of two mesoscopic heterogeneous patterns,
namely bricks in horizontal layers and vertical layers (Figure 19). In addition to this, a different material
was assigned to areas below the level of rising damp in order to account for the loss of strength of the
material due to moisture. The non-linear mechanical behaviour of the masonry in all regions were all
modelled using the CC3DNonLinCementitious2 plastic fracturing material model available in the
ATENA commercial code. [12].
This model assumes initial isotropy and adopts a quasi-brittle constitutive law with tensile behaviour
governed by the Rankine failure criteria with exponential softening while the compressive behaviour
makes use of the Menétrey-Willam failure surface with hardening and softening phases. The
equivalent uniaxial stress-strain diagram employed by this model is shown in Figure 28(a) and the
biaxial failure criterion is shown in two-dimensional principal stress space in Figure 28(b). Fracture is
modelled using the orthotropic smeared crack formulation and the fixed crack model with a mesh
adjusted softening modulus. It is important to note that one of the main drawbacks of this material
model is that it does not account for the anisotropic nature of masonry. However, this is partially taken
into account indirectly by using different material models for regions where bricks are in horizontal and
vertical layers.
Figure 28: (a) Uniaxial stress-strain law for CC3DNonLinCementitious2; (b) Biaxial failure criteria [12].
In order to represent a specific material with this model, the following parameters have to be defined:
Tensile strength, ft
Compressive strength, fc
Elastic modulus, E
Poisson’s ratio, ν
Tensile fracture energy, Gf
Limit compressive crack opening, wd
Studies on Poisson’s ratio of masonry assemblages have found an average initial value of 0.17 for
clay brickwork [10] and hence this value was used in all the different material models.
(a) (b)
Advanced Computational Modelling of Taq-Kisra, Iraq
Erasmus Mundus Programme. 2014/2015 Edition June 2015
28 ADVANCED MASTERS IN STRUCTURAL ANALYSIS OF MONUMENTS AND HISTORICAL CONSTRUCTIONS
The limit compressive crack opening is the plastic displacement which defines the end point of the
softening curve in compression. Since there is very little literature on this parameter, the default value
of 0.5mm, based on the experiments of Van MIER on normal concrete [12], was used for all the
material models. It should be noted that this parameter only comes into play when defining localised
damage after the peak compressive stress. Due to the large thickness of the walls at the base, it can
be expected that the compressive stresses being experienced by the material will be very low and
hence the model should still give satisfactory results. An examination of the highest compressive
stresses and strains after modelling the structure under its own self-weight was used to confirm this
hypothesis.
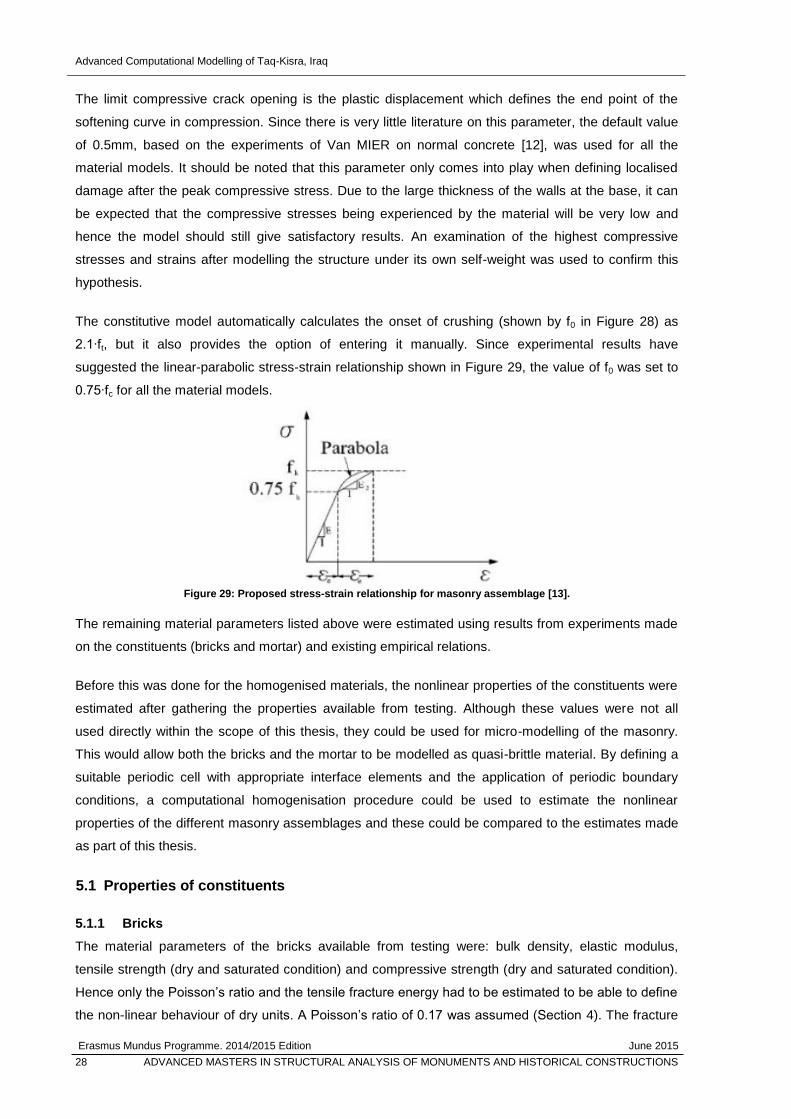
The constitutive model automatically calculates the onset of crushing (shown by f0 in Figure 28) as
2.1∙ft, but it also provides the option of entering it manually. Since experimental results have
suggested the linear-parabolic stress-strain relationship shown in Figure 29, the value of f0 was set to
0.75∙fc for all the material models.
Figure 29: Proposed stress-strain relationship for masonry assemblage [13].
The remaining material parameters listed above were estimated using results from experiments made
on the constituents (bricks and mortar) and existing empirical relations.
Before this was done for the homogenised materials, the nonlinear properties of the constituents were
estimated after gathering the properties available from testing. Although these values were not all
used directly within the scope of this thesis, they could be used for micro-modelling of the masonry.
This would allow both the bricks and the mortar to be modelled as quasi-brittle material. By defining a
suitable periodic cell with appropriate interface elements and the application of periodic boundary
conditions, a computational homogenisation procedure could be used to estimate the nonlinear
properties of the different masonry assemblages and these could be compared to the estimates made
as part of this thesis.
5.1 Properties of constituents
5.1.1 Bricks
The material parameters of the bricks available from testing were: bulk density, elastic modulus,
tensile strength (dry and saturated condition) and compressive strength (dry and saturated condition).
Hence only the Poisson’s ratio and the tensile fracture energy had to be estimated to be able to define
the non-linear behaviour of dry units. A Poisson’s ratio of 0.17 was assumed (Section 4). The fracture

Advanced Computational Modelling of Taq-Kisra, Iraq
Erasmus Mundus Programme. 2014/2015 Edition June 2015
ADVANCED MASTERS IN STRUCTURAL ANALYSIS OF MONUMENTS AND HISTORICAL CONSTRUCTIONS 29
energy was estimated using the ductility index, du, given by the ratio between the fracture energy and
the tensile strength [9]:
𝐺𝑓 = 𝑑𝑢 ∙ 𝑓𝑡
A value of du = 0.029mm was used as recommended in [9] for brick and mortar in the absence of more
information. This results in the fracture energy of 40.6 Nm-1
.
The material parameters of the dry bricks are summarised in the table below along with properties
obtained experimentally on saturated samples.
Table 3: Summary of brick material properties.
Name Symbol Units Value
Bulk density γ kg/m3 1160
Elastic Modulus E MPa 2100
Tensile strength - dry ft (dry) MPa 1.4
Compressive strength -dry fc (dry) MPa 2.8
Poisson’s ratio* ν - 0.17
Fracture Energy* Gf Nm-1
40.6
Tensile strength - saturated ft (sat.) MPa 1.2
Compressive strength - saturated fc (sat.) MPa 2.4
*estimated values
5.1.2 Mortar
Due to a more limited range of mortar samples, there were less experimentally obtained material
parameters available. Only the bulk density and the compressive strength (both for dry and saturated
samples) were obtained from testing. The Poisson’s ratio was once again estimated as 0.17.
The elastic modulus of the mortar proved particularly difficult to estimate since only a limited amount of
research has been carried out on gypsum mortars and there are considerable variations in the moduli
of different mortars of this type. Nevertheless, information from the materials report such as porosity
helped indicate what range of values was reasonable. Subsequently, a trial and error procedure using
different empirical relations developed for concrete was used. The formulation recommended by the
Architectural Institute of Japan [14], which relates the modulus of elasticity to the compressive strength
and the bulk density, provided reasonable results:
𝐸 = 21000 (𝛾
2300)
1.5
(𝑓𝑐
20)0.5
with E and fc in MPa and γ in kg/m3.
The elastic modulus was estimated to be 4690 MPa.

Advanced Computational Modelling of Taq-Kisra, Iraq
Erasmus Mundus Programme. 2014/2015 Edition June 2015
30 ADVANCED MASTERS IN STRUCTURAL ANALYSIS OF MONUMENTS AND HISTORICAL CONSTRUCTIONS
The relationship suggested by the CEB-FIP Model Code 90 was used to estimate the tensile strength
(in MPa) of the mortar from the compressive strength. The relationship suggested is [12]:
𝑓𝑡 = 0.24 ∙ 𝑓𝑐𝑢
23
with fcu representing the compressive strength, in MPa, obtained by laboratory testing on cubic
samples.
The tensile strength was estimated as 0.6MPa.
The tensile fracture energy as well as the Poisson’s ratio were estimated using exactly the same
approach as that described in Section 5.1.1 for the bricks.
The material parameters of the dry mortar are summarised in the table below along with the
compressive strength of saturated samples obtained experimentally.
Table 4: Summary of mortar material properties.
Name Symbol Units Value
Bulk density γ kg/m3 1460
Elastic Modulus* E MPa 4690
Tensile strength – dry* ft (dry) MPa 0.6
Compressive strength -dry fc (dry) MPa 3.9
Poisson’s ratio* ν - 0.17
Fracture Energy* Gf Nm-1
17.2
Compressive strength - saturated fc (sat.) MPa 1.6
*estimated values
5.2 Homogenised properties
Material properties for four different material models were estimated:
Dry masonry with bricks in horizontal layers
Wet masonry with bricks in horizontal layers
Dry masonry with bricks in vertical layers
Wet masonry with bricks in vertical layers
The first three material models listed are used in every model. However, the fourth material model (wet
masonry with bricks in vertical layers) has only been used to investigate the effect of rainwater ingress
in the vault through a reduction in its strength.
The first material property that was estimated was the compressive strength of the masonry
assemblage. This was done using the relationship suggested in Eurocode 6 between the
characteristic compressive strength of the masonry assemblage, the normalised mean compressive
strength of the units (fb) and the mortar strength (fm) [15]:
𝑓𝑘 = 𝐾 ∙ 𝑓𝑏0.7 ∙ 𝑓𝑚
0.3
Advanced Computational Modelling of Taq-Kisra, Iraq
Erasmus Mundus Programme. 2014/2015 Edition June 2015
ADVANCED MASTERS IN STRUCTURAL ANALYSIS OF MONUMENTS AND HISTORICAL CONSTRUCTIONS 31
K is a constant whose value can be approximated using a table available in the Eurocode, it was set
as 0.55. Both the compressive strengths of the mortar and the units have been obtained
experimentally. However, the compressive strength of the units (derived from tests on cubes) had to
be reduced as specified by the Eurocode. The bricks in horizontal layers are likely to experience
compressive loads mostly perpendicular to the bed joints, which is the most common scenario in
masonry structures. Hence the Eurocode formulation described above was used to estimate the
homogenised compressive strength for this particular arrangement of bricks. Since the compressive
strength of the mortar and units had also been obtained experimentally on saturated samples, the
same procedure could be used to approximate the characteristic strength of masonry with horizontal
brick layers under damp conditions. The calculated values are shown in Table 5.
In the absence of more information, the tensile strength of masonry was estimated as 1/10th of the
compressive strength as suggested in [16].
In order to calculate the tensile fracture energy, the modified recommendation from the CEB-FIB
Model Code 90 was used. This is based on the assumption that the relation between tensile and
compressive strength of concrete is 5%. The expression is as follows:
𝐺𝑓 = 0.025 ∙ (2𝑓𝑡)0.7 [9]
Although this relation has been recommended for bricks or for mortar, in the absence of more
information, it has been used to estimate the fracture energy of the different masonry arrangements
considered (Table 5).
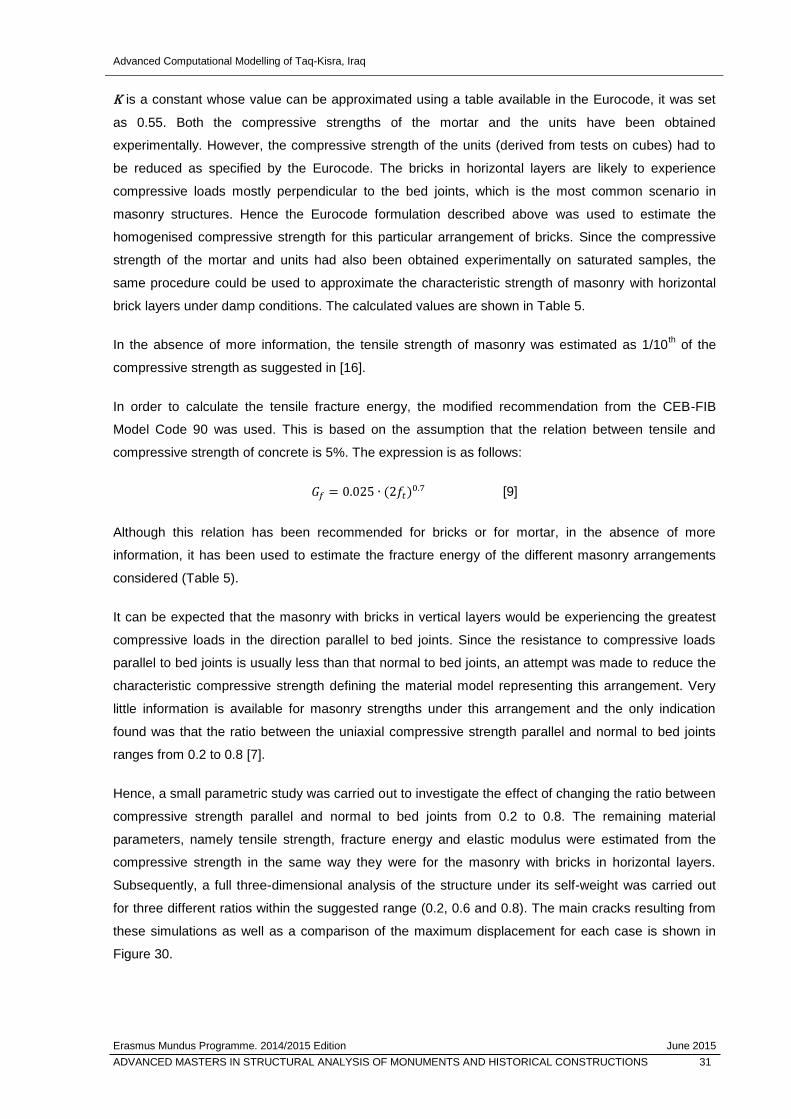
It can be expected that the masonry with bricks in vertical layers would be experiencing the greatest
compressive loads in the direction parallel to bed joints. Since the resistance to compressive loads
parallel to bed joints is usually less than that normal to bed joints, an attempt was made to reduce the
characteristic compressive strength defining the material model representing this arrangement. Very
little information is available for masonry strengths under this arrangement and the only indication
found was that the ratio between the uniaxial compressive strength parallel and normal to bed joints
ranges from 0.2 to 0.8 [7].
Hence, a small parametric study was carried out to investigate the effect of changing the ratio between
compressive strength parallel and normal to bed joints from 0.2 to 0.8. The remaining material
parameters, namely tensile strength, fracture energy and elastic modulus were estimated from the
compressive strength in the same way they were for the masonry with bricks in horizontal layers.
Subsequently, a full three-dimensional analysis of the structure under its self-weight was carried out
for three different ratios within the suggested range (0.2, 0.6 and 0.8). The main cracks resulting from
these simulations as well as a comparison of the maximum displacement for each case is shown in
Figure 30.
Advanced Computational Modelling of Taq-Kisra, Iraq
Erasmus Mundus Programme. 2014/2015 Edition June 2015
32 ADVANCED MASTERS IN STRUCTURAL ANALYSIS OF MONUMENTS AND HISTORICAL CONSTRUCTIONS
Figure 30: Simulations run with different ratios between compressive strength parallel and normal to bed joints;
(a) cracks for ratio of 0.2, (b) cracks for ratio of 0.6, (c) cracks for ratio of 0.8, (d) comparison of maximum displacements
As can be seen from Figure 30(d), the maximum displacement obtained as a result of using a ratio of
0.2 is much greater than the displacements obtained with ratios of 0.6 and 0.8. Furthermore, the
cracks are much more localised in the case of a ratio of 0.2 in spite of the greater displacement. In
order to be able to study the response of the structure as a whole, the distribution of cracks exhibited
by the cases where ratios of 0.6 and 0.8 were used are more desirable since they allow for a better
understanding of vulnerable areas. Local irregularities are likely to be more prominent in the case of a
ratio of 0.2 and results could be less representative of the structural response. Areas experiencing
damage can be visualised better in the case of a ratio of 0.6 when compared to a ratio of 0.8. Hence,
a ratio of 0.6 was chosen to define the compressive strength of masonry parallel to bed joints.
Other properties estimated with volumetric averages were the bulk density (used to define the self-
weight of the structure) and the coefficient of thermal expansion. Those properties had been
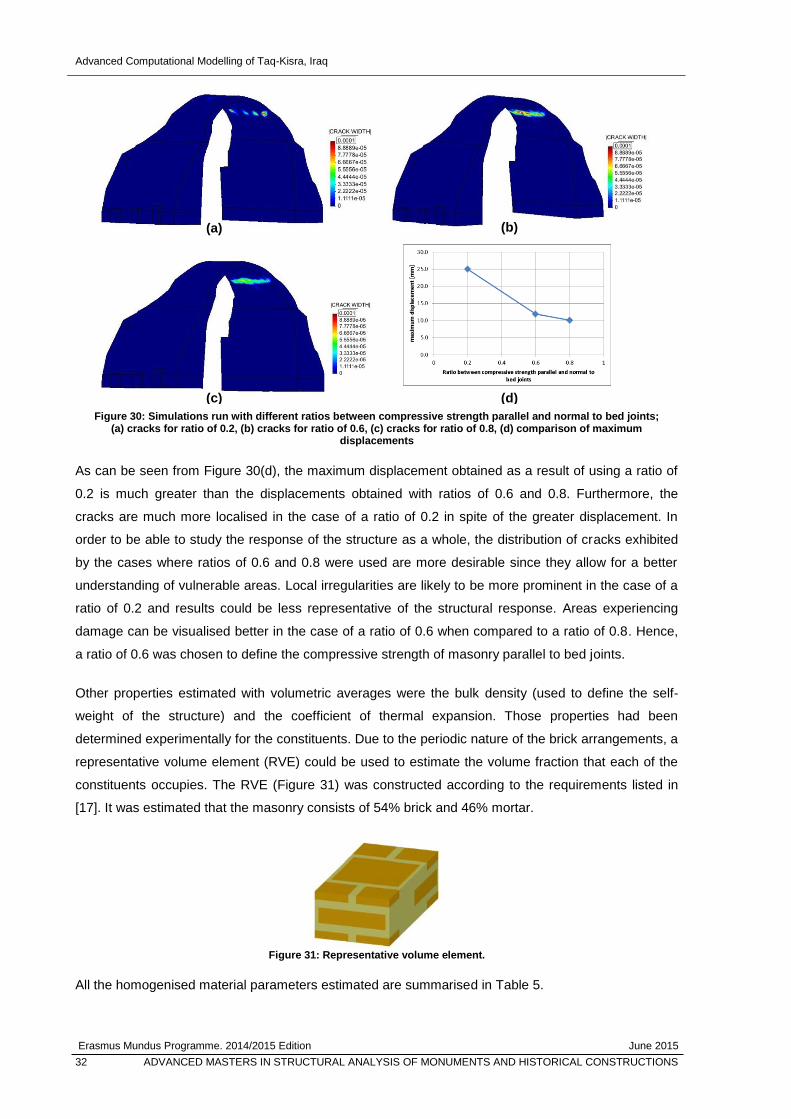
determined experimentally for the constituents. Due to the periodic nature of the brick arrangements, a
representative volume element (RVE) could be used to estimate the volume fraction that each of the
constituents occupies. The RVE (Figure 31) was constructed according to the requirements listed in
[17]. It was estimated that the masonry consists of 54% brick and 46% mortar.
Figure 31: Representative volume element.
All the homogenised material parameters estimated are summarised in Table 5.
(a) (b)
(c) (d)

Advanced Computational Modelling of Taq-Kisra, Iraq
Erasmus Mundus Programme. 2014/2015 Edition June 2015
ADVANCED MASTERS IN STRUCTURAL ANALYSIS OF MONUMENTS AND HISTORICAL CONSTRUCTIONS 33
Table 5: Summary of homogenised material properties for different masonry arrangements.
a) Eurocode6: fk=K∙fb0.7
fm0.3
b) Ratio between compressive strength parallel and perpendicular to bed joints taken as 0.6
c) Taken as approximately 1/10th of compressive strength
d) Eurocode6: E=1000fk
e) Approximation adopted from CEB-FIB Model Code 90: Gf=0.025∙(2ft)0.7
Cracks predicted by the models under different loading scenarios were compared with cracks
observed on the actual structure for validation of the model. These comparisons are described in parts
of the following sections which explain how the different load cases were modelled and describe the
most relevant results.
Horizontal
layers
Horizontal
layers
(wet)
Vertical
layers
Vertical
layers
(wet)
Name Symbol Units Value Value Value Value
Compressive strength fc MPa 1.56a 0.93
a 0.93
b 0.56
b
Tensile strength ft MPa 0.16c 0.10
c 0.10
c 0.06
c
Elastic Modulus E MPa 1555d 928
d 933
d 557
d
Poisson's ratio ν - 0.17 0.17 0.17 0.17
Fracture Energy Gf N/m 11.0e 8.1
e 8.1
e 5.7
e
Limit compressive crack opening wd m 0.0005
Bulk density
kN/m3 12.73
Coefficient of thermal expansion α 1/K 1.2E-05

Advanced Computational Modelling of Taq-Kisra, Iraq
Erasmus Mundus Programme. 2014/2015 Edition June 2015
34 ADVANCED MASTERS IN STRUCTURAL ANALYSIS OF MONUMENTS AND HISTORICAL CONSTRUCTIONS
This page is left blank on purpose.
Advanced Computational Modelling of Taq-Kisra, Iraq
Erasmus Mundus Programme. 2014/2015 Edition June 2015
ADVANCED MASTERS IN STRUCTURAL ANALYSIS OF MONUMENTS AND HISTORICAL CONSTRUCTIONS 35
6. SELF-WEIGHT
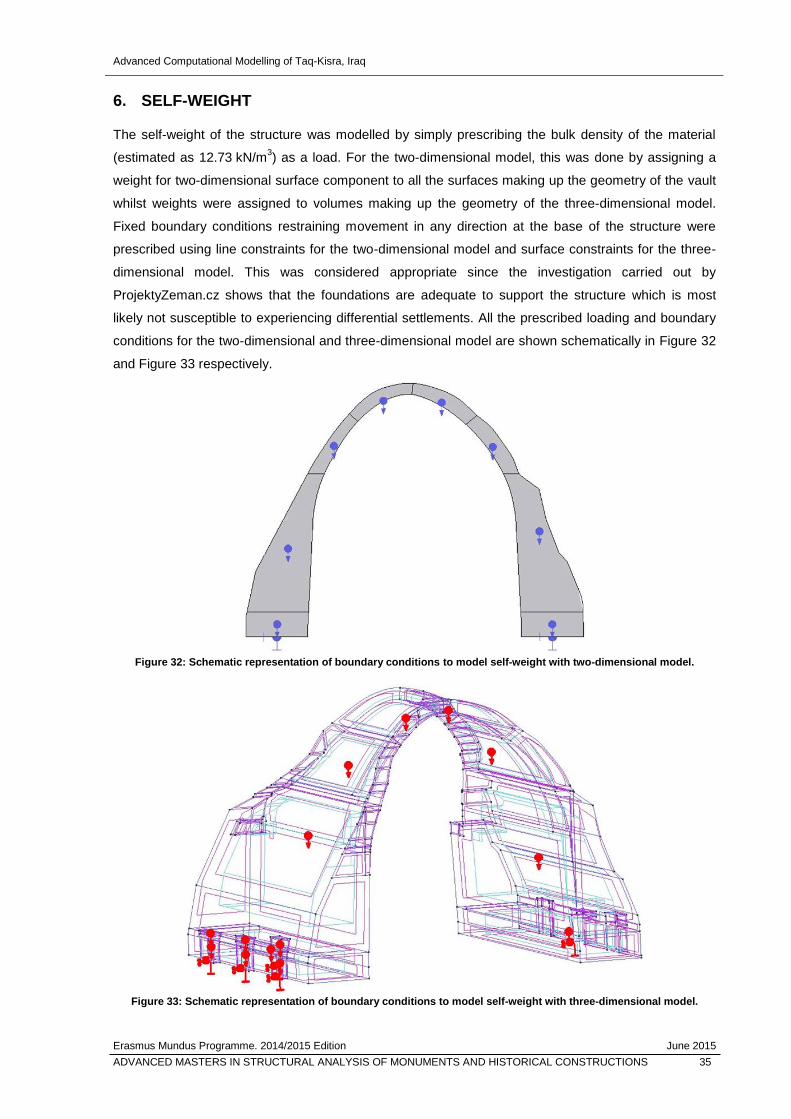
The self-weight of the structure was modelled by simply prescribing the bulk density of the material
(estimated as 12.73 kN/m3) as a load. For the two-dimensional model, this was done by assigning a
weight for two-dimensional surface component to all the surfaces making up the geometry of the vault
whilst weights were assigned to volumes making up the geometry of the three-dimensional model.
Fixed boundary conditions restraining movement in any direction at the base of the structure were
prescribed using line constraints for the two-dimensional model and surface constraints for the three-
dimensional model. This was considered appropriate since the investigation carried out by
ProjektyZeman.cz shows that the foundations are adequate to support the structure which is most
likely not susceptible to experiencing differential settlements. All the prescribed loading and boundary
conditions for the two-dimensional and three-dimensional model are shown schematically in Figure 32
and Figure 33 respectively.
Figure 32: Schematic representation of boundary conditions to model self-weight with two-dimensional model.
Figure 33: Schematic representation of boundary conditions to model self-weight with three-dimensional model.
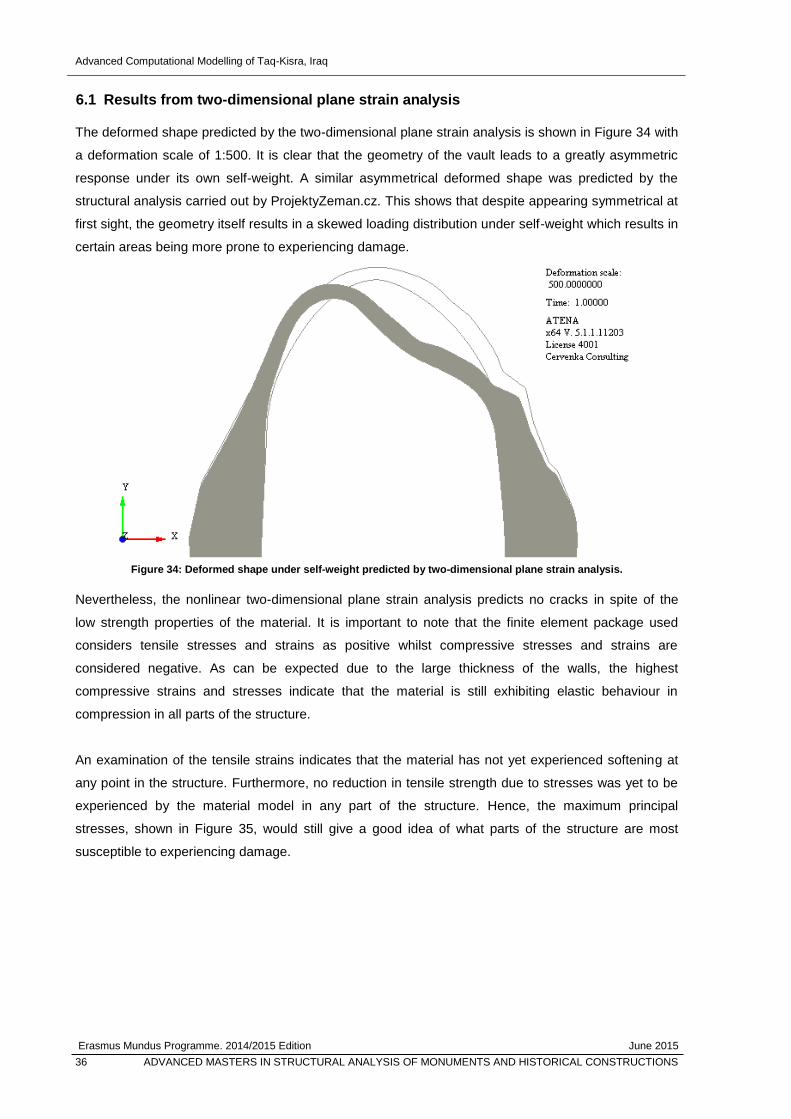
Advanced Computational Modelling of Taq-Kisra, Iraq
Erasmus Mundus Programme. 2014/2015 Edition June 2015
36 ADVANCED MASTERS IN STRUCTURAL ANALYSIS OF MONUMENTS AND HISTORICAL CONSTRUCTIONS
6.1 Results from two-dimensional plane strain analysis
The deformed shape predicted by the two-dimensional plane strain analysis is shown in Figure 34 with
a deformation scale of 1:500. It is clear that the geometry of the vault leads to a greatly asymmetric
response under its own self-weight. A similar asymmetrical deformed shape was predicted by the
structural analysis carried out by ProjektyZeman.cz. This shows that despite appearing symmetrical at
first sight, the geometry itself results in a skewed loading distribution under self-weight which results in
certain areas being more prone to experiencing damage.
Figure 34: Deformed shape under self-weight predicted by two-dimensional plane strain analysis.
Nevertheless, the nonlinear two-dimensional plane strain analysis predicts no cracks in spite of the
low strength properties of the material. It is important to note that the finite element package used
considers tensile stresses and strains as positive whilst compressive stresses and strains are
considered negative. As can be expected due to the large thickness of the walls, the highest
compressive strains and stresses indicate that the material is still exhibiting elastic behaviour in
compression in all parts of the structure.
An examination of the tensile strains indicates that the material has not yet experienced softening at
any point in the structure. Furthermore, no reduction in tensile strength due to stresses was yet to be
experienced by the material model in any part of the structure. Hence, the maximum principal
stresses, shown in Figure 35, would still give a good idea of what parts of the structure are most
susceptible to experiencing damage.

Advanced Computational Modelling of Taq-Kisra, Iraq
Erasmus Mundus Programme. 2014/2015 Edition June 2015
ADVANCED MASTERS IN STRUCTURAL ANALYSIS OF MONUMENTS AND HISTORICAL CONSTRUCTIONS 37
Figure 35: Maximum principal stress under self-weight based on two-dimensional plane strain analysis
(values shown in MPa).
Figure 35 shows a region closer to the intrados on the right side of the vault where the material is
experiencing tensile stresses close to its tensile strength. This is the same region where the structural
two-dimensional analysis conducted by ProjektyZeman.cz predicts there will be tensile stresses.
Moreover, the project documentation from ProjektyZeman.cz states that cracks have been observed in
this region of the structure.
6.2 Results from three-dimensional model
Similarly to the two-dimensional model, the three-dimensional model of the geometry before the
reconstruction of part of the vault also displays an asymmetrical deformed shape under its self-weight.
This is shown using a deformation scale of 1:500 in Figure 36.
Figure 36: Deformed shape predicted by three-dimensional model under self-weight.
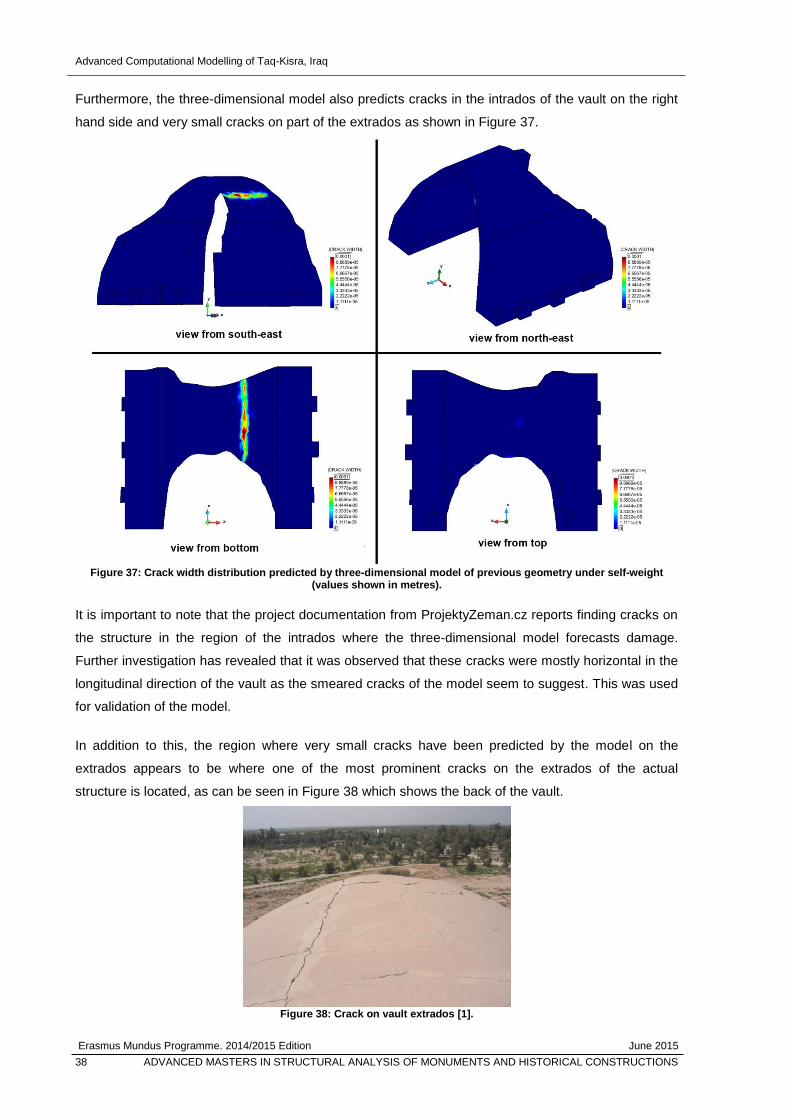
Advanced Computational Modelling of Taq-Kisra, Iraq
Erasmus Mundus Programme. 2014/2015 Edition June 2015
38 ADVANCED MASTERS IN STRUCTURAL ANALYSIS OF MONUMENTS AND HISTORICAL CONSTRUCTIONS
Furthermore, the three-dimensional model also predicts cracks in the intrados of the vault on the right
hand side and very small cracks on part of the extrados as shown in Figure 37.
Figure 37: Crack width distribution predicted by three-dimensional model of previous geometry under self-weight
(values shown in metres).
It is important to note that the project documentation from ProjektyZeman.cz reports finding cracks on
the structure in the region of the intrados where the three-dimensional model forecasts damage.
Further investigation has revealed that it was observed that these cracks were mostly horizontal in the
longitudinal direction of the vault as the smeared cracks of the model seem to suggest. This was used
for validation of the model.
In addition to this, the region where very small cracks have been predicted by the model on the
extrados appears to be where one of the most prominent cracks on the extrados of the actual
structure is located, as can be seen in Figure 38 which shows the back of the vault.
Figure 38: Crack on vault extrados [1].
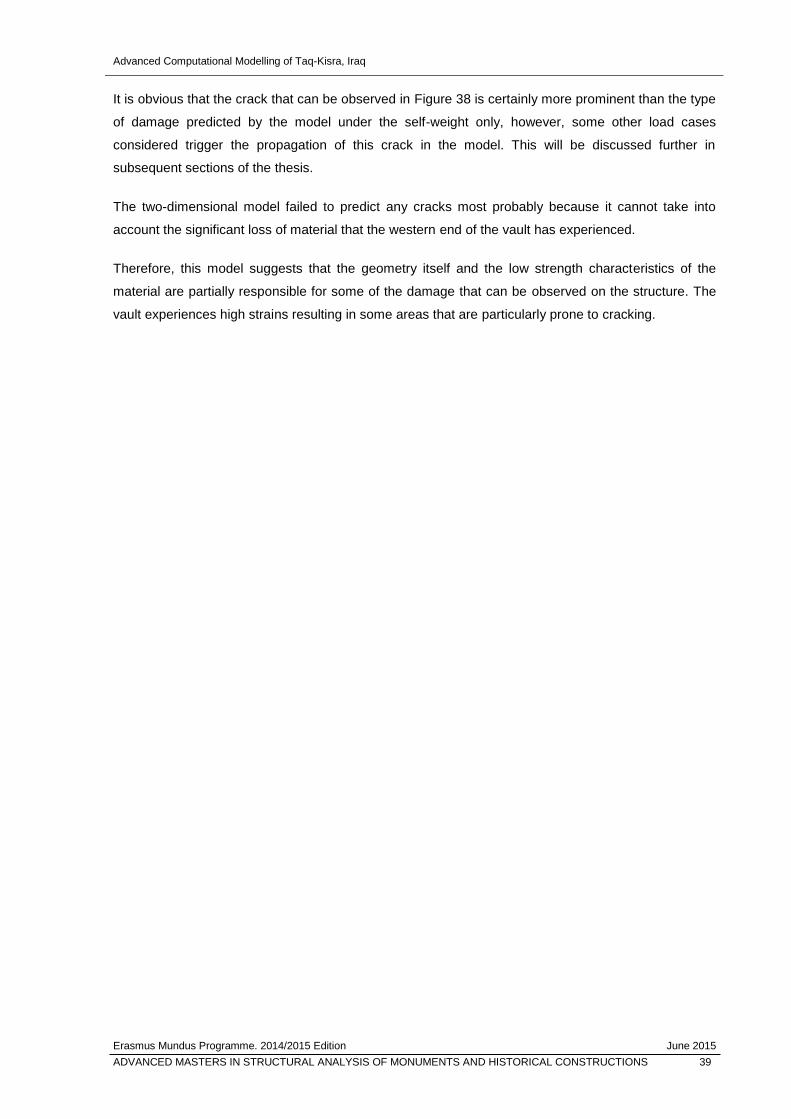
Advanced Computational Modelling of Taq-Kisra, Iraq
Erasmus Mundus Programme. 2014/2015 Edition June 2015
ADVANCED MASTERS IN STRUCTURAL ANALYSIS OF MONUMENTS AND HISTORICAL CONSTRUCTIONS 39
It is obvious that the crack that can be observed in Figure 38 is certainly more prominent than the type
of damage predicted by the model under the self-weight only, however, some other load cases
considered trigger the propagation of this crack in the model. This will be discussed further in
subsequent sections of the thesis.
The two-dimensional model failed to predict any cracks most probably because it cannot take into
account the significant loss of material that the western end of the vault has experienced.
Therefore, this model suggests that the geometry itself and the low strength characteristics of the
material are partially responsible for some of the damage that can be observed on the structure. The
vault experiences high strains resulting in some areas that are particularly prone to cracking.

Advanced Computational Modelling of Taq-Kisra, Iraq
Erasmus Mundus Programme. 2014/2015 Edition June 2015
40 ADVANCED MASTERS IN STRUCTURAL ANALYSIS OF MONUMENTS AND HISTORICAL CONSTRUCTIONS
This page is left blank on purpose.
Advanced Computational Modelling of Taq-Kisra, Iraq
Erasmus Mundus Programme. 2014/2015 Edition June 2015
ADVANCED MASTERS IN STRUCTURAL ANALYSIS OF MONUMENTS AND HISTORICAL CONSTRUCTIONS 41
7. RECONSTRUCTION OF PART OF VAULT
As previously mentioned, an important part of the work carried out by ProjektyZeman.cz involved the
reconstruction of part of the vault on the western side that had collapsed. Naturally, this will help
consolidate crumbling unstable parts at the edge of the vault on the western side. Nevertheless, an
investigation into the more global effects of the reconstruction on the structure was carried out as a
part of this thesis, particularly to find out if the reconstruction also resulted in additional benefits
relating to the overall structural behaviour.
Obviously, this could not be modelled in two dimensions and required the use of a three-dimensional
model. Since it was specified that the reconstruction was to be executed using compatible materials
made to exhibit similar characteristics as the original material, the same parameters used to describe
the material with bricks in vertical layers were employed for the reconstructed part.
Two different modelling strategies were used to investigate the effect of the reconstruction.
The first involved modelling the whole geometry after the reconstruction as a single entity. Naturally,
this is an unrealistic model as the previous geometry would have already deformed and experienced
damage under its own self-weight before the addition. Hence this model should not be used to draw
direct conclusions on the effect of the reconstruction. Nevertheless, it could still provide some insight
into how the structure would respond to additional loads and was therefore included as a part of this
thesis. Moreover, since the vault used to consist of a more integral structure before the collapse of a
significant part of it on the western side, this model could also provide some insight on the state of the
structure before this collapse had occurred fully. The most important results from this modelling
strategy are described in sub-section 7.1.
The second modelling strategy consisted firstly of simulating the previously erected existing structure
under its own self-weight, and then adding the undeformed reconstructed part on the already
deformed previous geometry in a second load step. This was done by removing all the elements of
the reconstructed part from the first load step and adding them in the second load step. It was
important to ensure mesh compatibility at the boundary between the reconstructed part and the
previous geometry. It is important to note that a separate material had to be assigned to the
reconstructed part, even though it had the same properties as the remaining part of the vault, since
ATENA effectively deletes the whole material model associated with the element group when
removing elements. This model should provide a more realistic understanding of how the structure
would behave after the reconstruction. The most important results from this investigation are
described in sub-section 7.2.
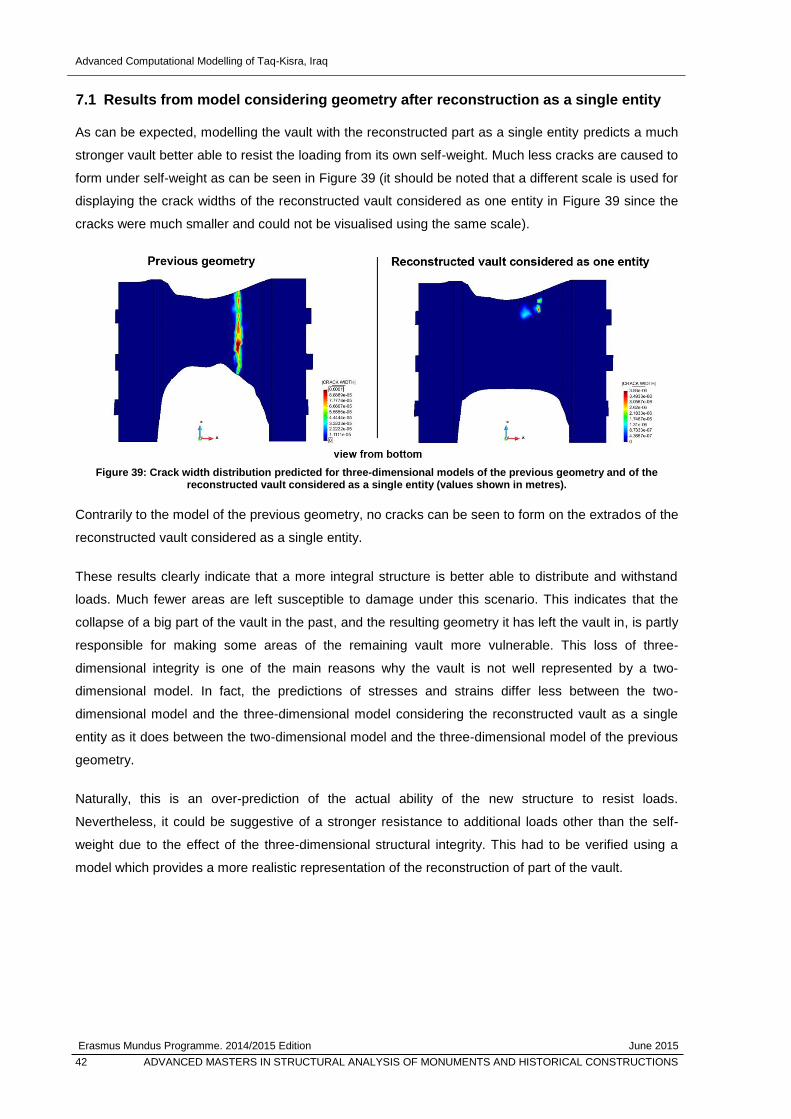
Advanced Computational Modelling of Taq-Kisra, Iraq
Erasmus Mundus Programme. 2014/2015 Edition June 2015
42 ADVANCED MASTERS IN STRUCTURAL ANALYSIS OF MONUMENTS AND HISTORICAL CONSTRUCTIONS
7.1 Results from model considering geometry after reconstruction as a single entity
As can be expected, modelling the vault with the reconstructed part as a single entity predicts a much
stronger vault better able to resist the loading from its own self-weight. Much less cracks are caused to
form under self-weight as can be seen in Figure 39 (it should be noted that a different scale is used for
displaying the crack widths of the reconstructed vault considered as one entity in Figure 39 since the
cracks were much smaller and could not be visualised using the same scale).
Figure 39: Crack width distribution predicted for three-dimensional models of the previous geometry and of the
reconstructed vault considered as a single entity (values shown in metres).
Contrarily to the model of the previous geometry, no cracks can be seen to form on the extrados of the
reconstructed vault considered as a single entity.
These results clearly indicate that a more integral structure is better able to distribute and withstand
loads. Much fewer areas are left susceptible to damage under this scenario. This indicates that the
collapse of a big part of the vault in the past, and the resulting geometry it has left the vault in, is partly
responsible for making some areas of the remaining vault more vulnerable. This loss of three-
dimensional integrity is one of the main reasons why the vault is not well represented by a two-
dimensional model. In fact, the predictions of stresses and strains differ less between the two-
dimensional model and the three-dimensional model considering the reconstructed vault as a single
entity as it does between the two-dimensional model and the three-dimensional model of the previous
geometry.
Naturally, this is an over-prediction of the actual ability of the new structure to resist loads.
Nevertheless, it could be suggestive of a stronger resistance to additional loads other than the self-
weight due to the effect of the three-dimensional structural integrity. This had to be verified using a
model which provides a more realistic representation of the reconstruction of part of the vault.
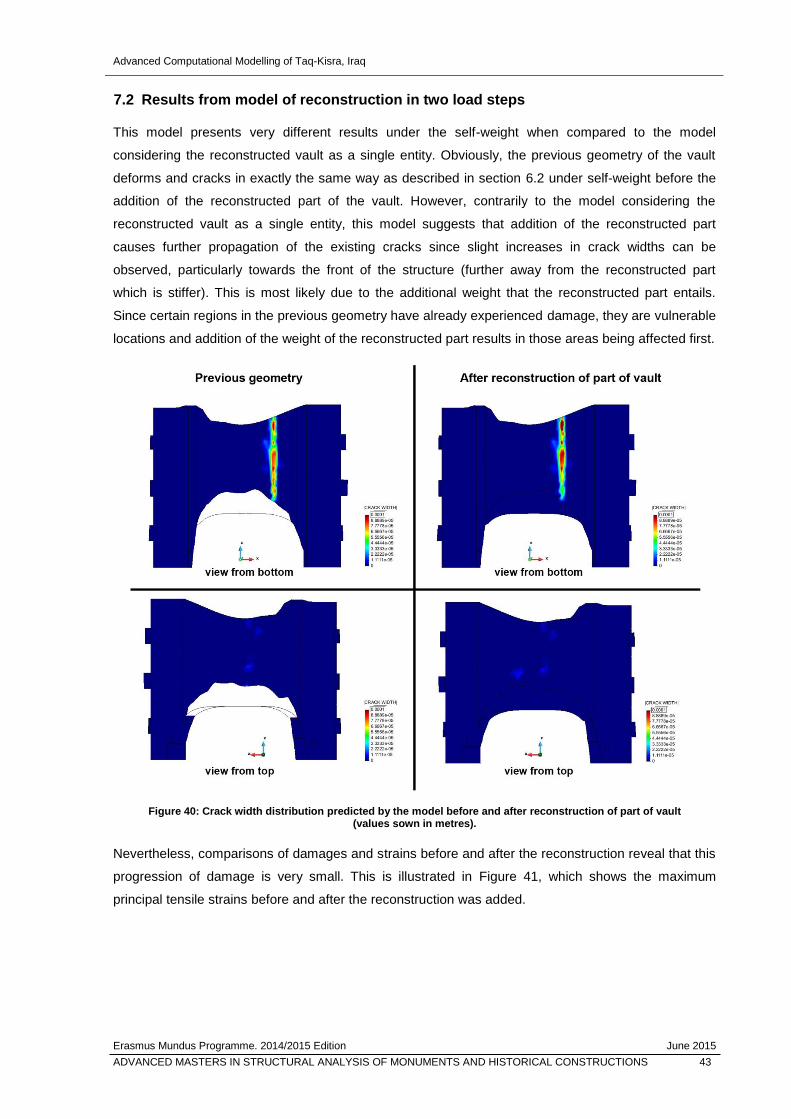
Advanced Computational Modelling of Taq-Kisra, Iraq
Erasmus Mundus Programme. 2014/2015 Edition June 2015
ADVANCED MASTERS IN STRUCTURAL ANALYSIS OF MONUMENTS AND HISTORICAL CONSTRUCTIONS 43
7.2 Results from model of reconstruction in two load steps
This model presents very different results under the self-weight when compared to the model
considering the reconstructed vault as a single entity. Obviously, the previous geometry of the vault
deforms and cracks in exactly the same way as described in section 6.2 under self-weight before the
addition of the reconstructed part of the vault. However, contrarily to the model considering the
reconstructed vault as a single entity, this model suggests that addition of the reconstructed part
causes further propagation of the existing cracks since slight increases in crack widths can be
observed, particularly towards the front of the structure (further away from the reconstructed part
which is stiffer). This is most likely due to the additional weight that the reconstructed part entails.
Since certain regions in the previous geometry have already experienced damage, they are vulnerable
locations and addition of the weight of the reconstructed part results in those areas being affected first.
Figure 40: Crack width distribution predicted by the model before and after reconstruction of part of vault
(values sown in metres).
Nevertheless, comparisons of damages and strains before and after the reconstruction reveal that this
progression of damage is very small. This is illustrated in Figure 41, which shows the maximum
principal tensile strains before and after the reconstruction was added.
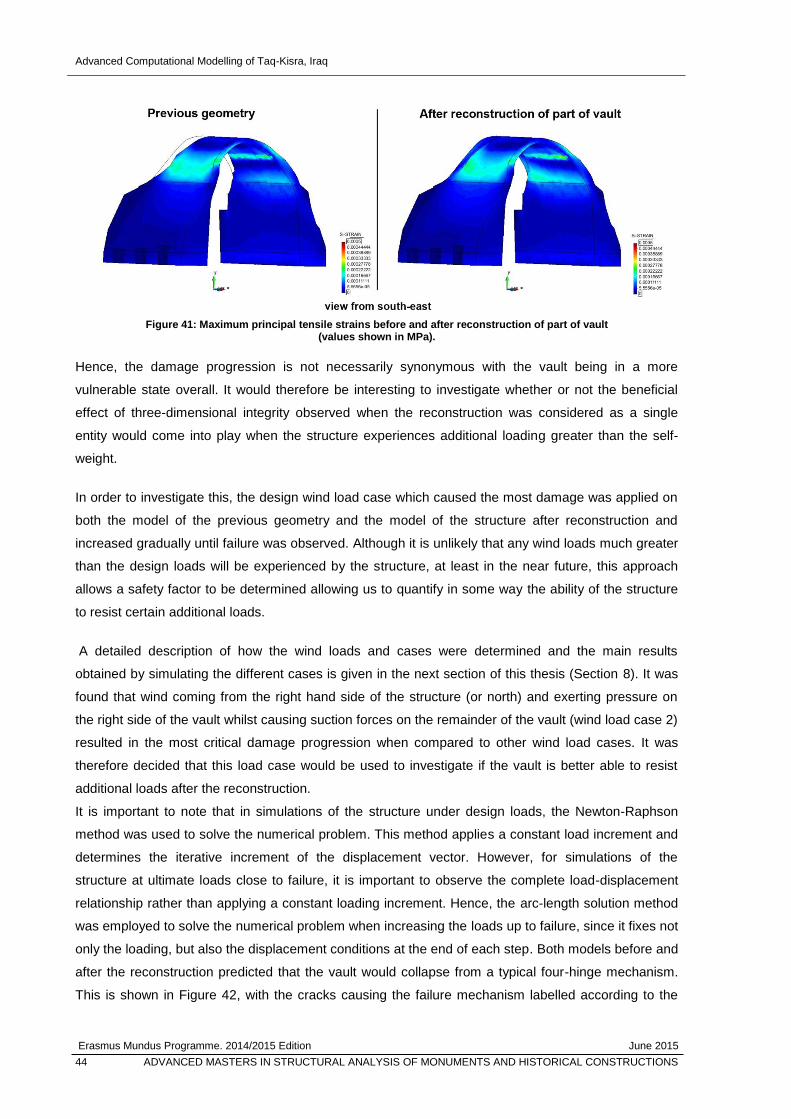
Advanced Computational Modelling of Taq-Kisra, Iraq
Erasmus Mundus Programme. 2014/2015 Edition June 2015
44 ADVANCED MASTERS IN STRUCTURAL ANALYSIS OF MONUMENTS AND HISTORICAL CONSTRUCTIONS
Figure 41: Maximum principal tensile strains before and after reconstruction of part of vault
(values shown in MPa).
Hence, the damage progression is not necessarily synonymous with the vault being in a more
vulnerable state overall. It would therefore be interesting to investigate whether or not the beneficial
effect of three-dimensional integrity observed when the reconstruction was considered as a single
entity would come into play when the structure experiences additional loading greater than the self-
weight.
In order to investigate this, the design wind load case which caused the most damage was applied on
both the model of the previous geometry and the model of the structure after reconstruction and
increased gradually until failure was observed. Although it is unlikely that any wind loads much greater
than the design loads will be experienced by the structure, at least in the near future, this approach
allows a safety factor to be determined allowing us to quantify in some way the ability of the structure
to resist certain additional loads.
A detailed description of how the wind loads and cases were determined and the main results
obtained by simulating the different cases is given in the next section of this thesis (Section 8). It was
found that wind coming from the right hand side of the structure (or north) and exerting pressure on
the right side of the vault whilst causing suction forces on the remainder of the vault (wind load case 2)
resulted in the most critical damage progression when compared to other wind load cases. It was
therefore decided that this load case would be used to investigate if the vault is better able to resist
additional loads after the reconstruction.
It is important to note that in simulations of the structure under design loads, the Newton-Raphson
method was used to solve the numerical problem. This method applies a constant load increment and
determines the iterative increment of the displacement vector. However, for simulations of the
structure at ultimate loads close to failure, it is important to observe the complete load-displacement
relationship rather than applying a constant loading increment. Hence, the arc-length solution method
was employed to solve the numerical problem when increasing the loads up to failure, since it fixes not
only the loading, but also the displacement conditions at the end of each step. Both models before and
after the reconstruction predicted that the vault would collapse from a typical four-hinge mechanism.
This is shown in Figure 42, with the cracks causing the failure mechanism labelled according to the

Advanced Computational Modelling of Taq-Kisra, Iraq
Erasmus Mundus Programme. 2014/2015 Edition June 2015
ADVANCED MASTERS IN STRUCTURAL ANALYSIS OF MONUMENTS AND HISTORICAL CONSTRUCTIONS 45
order in which they appear. The figure also shows whether the cracks first appeared at the intrados or
the extrados (cracks appearing first at the intrados would be indicative of a hinge at the extrados and
vice versa for this particular mechanism). Failure was defined as the point when the crack defining the
fourth hinge was able to form completely throughout the length of the vault.
Figure 42: Failure mechanism predicted by models before and after reconstruction (values shown in metres).
Based on these simulations, the safety factor against the most critical wind load scenario can be said
to have improved from 6.6 to 8 after the reconstruction. Hence, these results suggest that even though
the reconstruction could initially contribute to further propagation of existing cracks and damages due
to additional weight, it would also improve the integrity of the structure and therefore enable it to better
resist additional loading.

Advanced Computational Modelling of Taq-Kisra, Iraq
Erasmus Mundus Programme. 2014/2015 Edition June 2015
46 ADVANCED MASTERS IN STRUCTURAL ANALYSIS OF MONUMENTS AND HISTORICAL CONSTRUCTIONS
This page is left blank on purpose.

Advanced Computational Modelling of Taq-Kisra, Iraq
Erasmus Mundus Programme. 2014/2015 Edition June 2015
ADVANCED MASTERS IN STRUCTURAL ANALYSIS OF MONUMENTS AND HISTORICAL CONSTRUCTIONS 47
8. WIND LOADING
The wind loads to be applied on the structure were determined according to Eurocode 1, Part 1-4 [18],
in a similar way as they were determined for the structural analysis conducted by ProjektyZeman.cz.
All the wind load cases considered were applied incrementally on models after the effect of the self-
weight had already been computed. Naturally, since the design wind loads are of a much smaller
magnitude than the self-weight, the incremental effect of the wind loads is not as prominent as the
initial effect caused by the self-weight. Hence, wind loads were applied incrementally up to twice the
design value for all wind load cases, in order to better understand trends from which conclusions could
be made on the effect of the wind loading scenario in question. Nevertheless, all discussions made in
the subsequent sub-sections refer directly to the design wind loads.
The basic wind velocity, vb, of 25.0 m/s, suggested by ProjektyZeman.cz for a mean return period of
50 years (equivalent to an annual probability of exceedance of 0.02), was used for the determination
of wind actions. This basic wind velocity corresponds to a basic velocity pressure, qb, of 390 Pa,
computed according to:
𝑞𝑏 =1
2∙ 𝜌 ∙ 𝑣𝑏
2 [18]
where ρ is the wind density, taken as 1.25 kg/m3.
This basic pressure was multiplied by a coefficient related to a reference height for different parts of
the structure to obtain peak velocity pressures, qp, for each of the respective parts. Subsequently,
different coefficients were used for different parts of the structure under the different cases considered
as recommended in the Eurocode.
For all the wind load cases considered, the displacements at the base of the structure were
constrained in the same way they were for the models simulating the structure under its own self-
weight.
The first four load cases considered are equivalent to the load cases considered by ProjektyZeman.cz,
namely:
Wind load case 1: Wind from the left (or south), with pressure on the left side of vault
Wind load case 2: Wind from the right (or north), with pressure on the right side of the vault
Wind load case 3: Wind from the left, with suction on the whole vault
Wind load case 4: Wind from the right, with suction on the whole vault
The actual design pressure acting on the sidewalls for these four load cases were based on the
recommended coefficients for walls of a rectangular plan building with pressure applied on walls
directly facing the incoming wind and suction forces applied to walls on the leeward side. The design
pressures acting on the vault were calculated using coefficients determined according to the
recommendations of the Eurocode for vaulted roofs. The Eurocode suggests that the first quarter of
Advanced Computational Modelling of Taq-Kisra, Iraq
Erasmus Mundus Programme. 2014/2015 Edition June 2015
48 ADVANCED MASTERS IN STRUCTURAL ANALYSIS OF MONUMENTS AND HISTORICAL CONSTRUCTIONS
the vault on the windward side experiences pressure whilst the remainder of the vault experiences
suction. This recommended load distribution corresponds to wind load cases one and two, considering
wind coming from the south and north respectively. In addition to this, two other cases considering
suction forces acting on the whole vault while the forces on the sidewalls remain unchanged from
cases one and two were also modelled. It should be noted that in order to be able to assign different
loading conditions on quarter sections of the vault, the macro-elements representing the vault had to
be divided accordingly. This can be seen in figures of the geometry for two-dimensional and three-
dimensional models in Section 3.
These four wind design load cases were applied on the two-dimensional model as well as on the
three-dimensional models of the geometry before reconstruction, the reconstructed vault considered
as a single entity and the reconstruction simulated using two distinct load steps. For the two-
dimensional models, the forces from the wind were simulated using a static approach applying the
wind pressure and suction loads as distributed line loads (in kN/m) on the external boundaries. For
pressure and suction forces, the force should be acting perpendicular to the surface. Since the finite
element package used required assigning components of the loads in orthogonal directions (x and y
directions), the equivalent components of the resulting loads were computed and applied accordingly.
For curved surfaces, the normal of the midpoint of the surface was used to determine the x and y
components. The same approach was used for imposing loads on the three-dimensional models, but
the wind loads were applied as distributed loads on the external surfaces (in kN/m2). Once again, the
components of these loads in the orthogonal x and y directions had to be specified and they were
computed using the same approach as for the two-dimensional models. The prescribed boundary
conditions on the two-dimensional and three-dimensional models are shown in the relevant sub-
sections of this chapter followed by a presentation of the most relevant results.
In addition to these four wind load combinations, the three-dimensional models enabled a fifth wind
load case to be considered that could not be modelled in two dimensions:
Wind load case 5: Wind from the front (or east), with frictional forces on the interior and
exterior surfaces of the side walls and vault as well as pressure and suction forces applied on
windward and leeward oriented faces.
How the design load values were determined for this particular scenario is discussed further in sub-
section 8.5. This wind load case was applied on the three-dimensional models of the geometry before
reconstruction, the reconstructed vault considered as a single entity and the reconstruction simulated
using two distinct load steps. The principal outcomes of these simulations are also presented in sub-
section 8.5. It should be noted that friction forces were disregarded for the first four wind load cases as
suggested in Eurocode 1 for situations when the total area of all surfaces parallel to the wind is much
smaller than the total area of all external surfaces perpendicular to the wind.
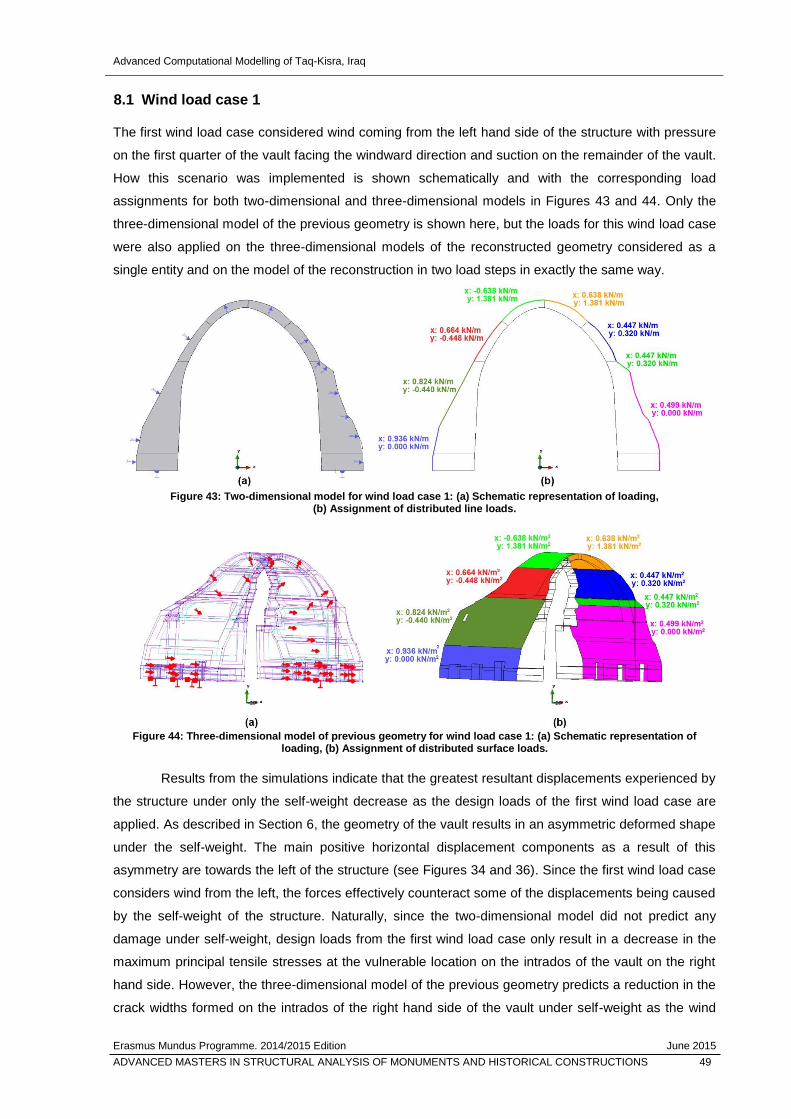
Advanced Computational Modelling of Taq-Kisra, Iraq
Erasmus Mundus Programme. 2014/2015 Edition June 2015
ADVANCED MASTERS IN STRUCTURAL ANALYSIS OF MONUMENTS AND HISTORICAL CONSTRUCTIONS 49
8.1 Wind load case 1
The first wind load case considered wind coming from the left hand side of the structure with pressure
on the first quarter of the vault facing the windward direction and suction on the remainder of the vault.
How this scenario was implemented is shown schematically and with the corresponding load
assignments for both two-dimensional and three-dimensional models in Figures 43 and 44. Only the
three-dimensional model of the previous geometry is shown here, but the loads for this wind load case
were also applied on the three-dimensional models of the reconstructed geometry considered as a
single entity and on the model of the reconstruction in two load steps in exactly the same way.
Figure 43: Two-dimensional model for wind load case 1: (a) Schematic representation of loading,
(b) Assignment of distributed line loads.
Figure 44: Three-dimensional model of previous geometry for wind load case 1: (a) Schematic representation of
loading, (b) Assignment of distributed surface loads.
Results from the simulations indicate that the greatest resultant displacements experienced by
the structure under only the self-weight decrease as the design loads of the first wind load case are
applied. As described in Section 6, the geometry of the vault results in an asymmetric deformed shape
under the self-weight. The main positive horizontal displacement components as a result of this
asymmetry are towards the left of the structure (see Figures 34 and 36). Since the first wind load case
considers wind from the left, the forces effectively counteract some of the displacements being caused
by the self-weight of the structure. Naturally, since the two-dimensional model did not predict any
damage under self-weight, design loads from the first wind load case only result in a decrease in the
maximum principal tensile stresses at the vulnerable location on the intrados of the vault on the right
hand side. However, the three-dimensional model of the previous geometry predicts a reduction in the
crack widths formed on the intrados of the right hand side of the vault under self-weight as the wind
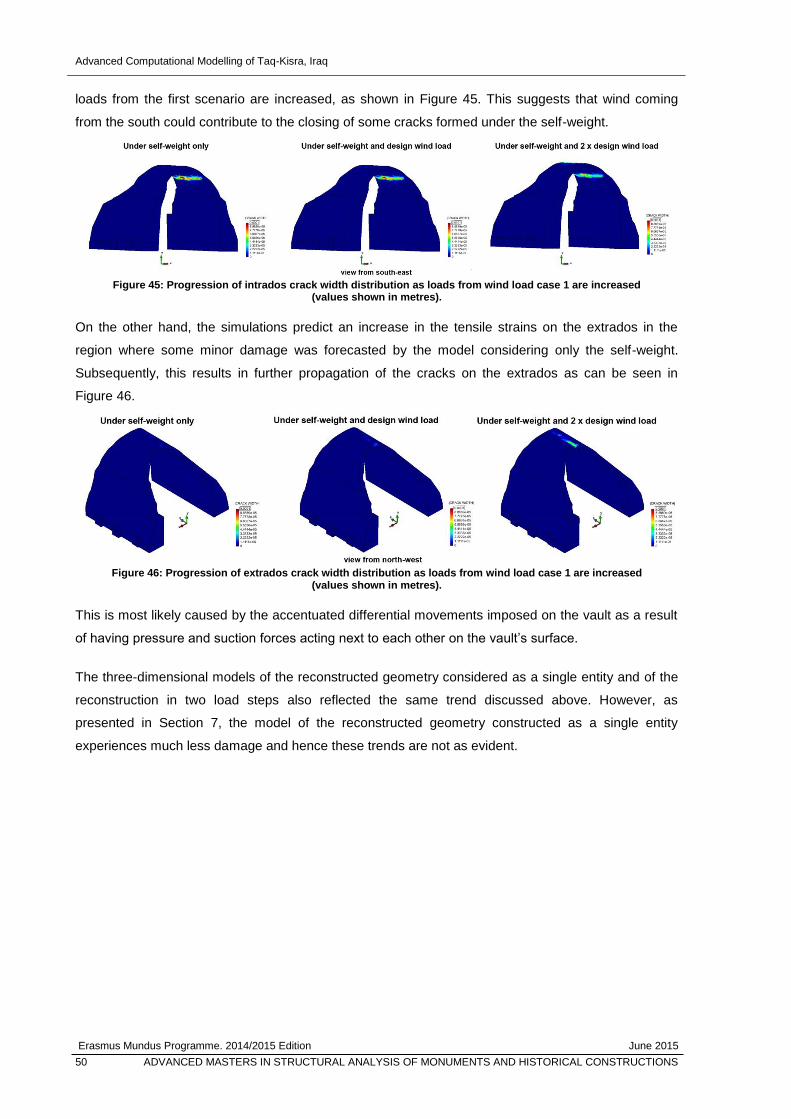
Advanced Computational Modelling of Taq-Kisra, Iraq
Erasmus Mundus Programme. 2014/2015 Edition June 2015
50 ADVANCED MASTERS IN STRUCTURAL ANALYSIS OF MONUMENTS AND HISTORICAL CONSTRUCTIONS
loads from the first scenario are increased, as shown in Figure 45. This suggests that wind coming
from the south could contribute to the closing of some cracks formed under the self-weight.
Figure 45: Progression of intrados crack width distribution as loads from wind load case 1 are increased
(values shown in metres).
On the other hand, the simulations predict an increase in the tensile strains on the extrados in the
region where some minor damage was forecasted by the model considering only the self-weight.
Subsequently, this results in further propagation of the cracks on the extrados as can be seen in
Figure 46.
Figure 46: Progression of extrados crack width distribution as loads from wind load case 1 are increased
(values shown in metres).
This is most likely caused by the accentuated differential movements imposed on the vault as a result
of having pressure and suction forces acting next to each other on the vault’s surface.
The three-dimensional models of the reconstructed geometry considered as a single entity and of the
reconstruction in two load steps also reflected the same trend discussed above. However, as
presented in Section 7, the model of the reconstructed geometry constructed as a single entity
experiences much less damage and hence these trends are not as evident.
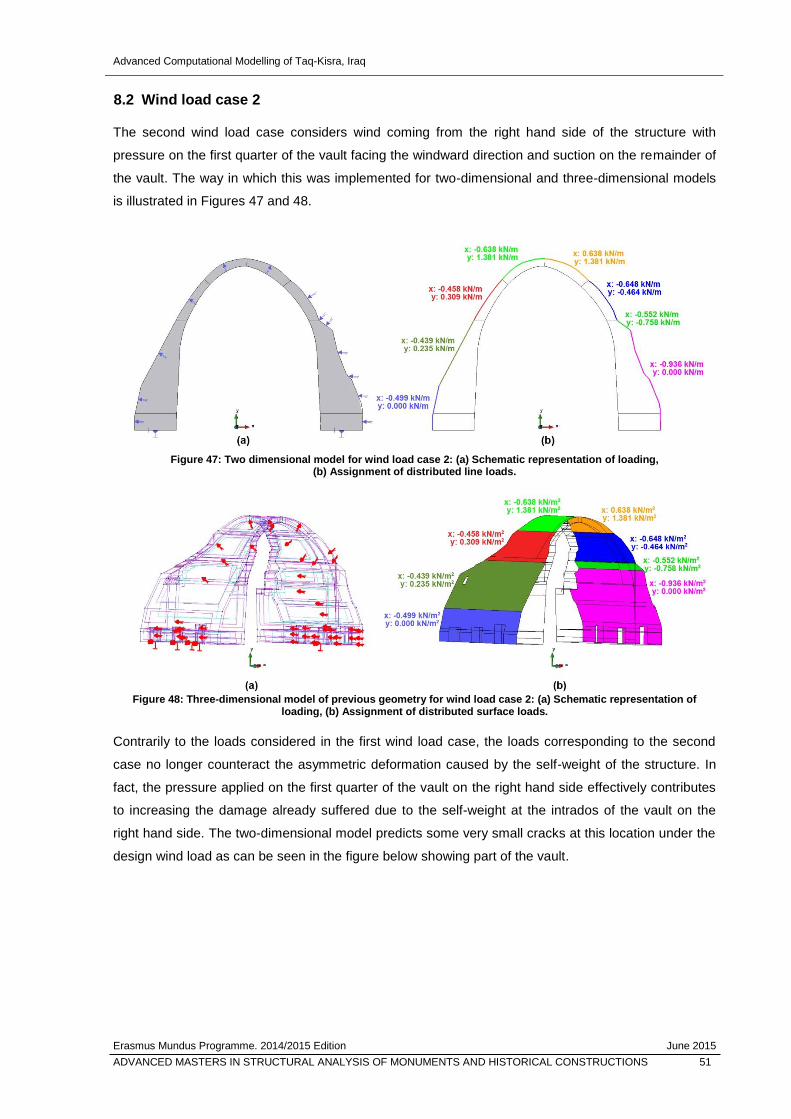
Advanced Computational Modelling of Taq-Kisra, Iraq
Erasmus Mundus Programme. 2014/2015 Edition June 2015
ADVANCED MASTERS IN STRUCTURAL ANALYSIS OF MONUMENTS AND HISTORICAL CONSTRUCTIONS 51
8.2 Wind load case 2
The second wind load case considers wind coming from the right hand side of the structure with
pressure on the first quarter of the vault facing the windward direction and suction on the remainder of
the vault. The way in which this was implemented for two-dimensional and three-dimensional models
is illustrated in Figures 47 and 48.
Figure 47: Two dimensional model for wind load case 2: (a) Schematic representation of loading,
(b) Assignment of distributed line loads.
Figure 48: Three-dimensional model of previous geometry for wind load case 2: (a) Schematic representation of
loading, (b) Assignment of distributed surface loads.
Contrarily to the loads considered in the first wind load case, the loads corresponding to the second
case no longer counteract the asymmetric deformation caused by the self-weight of the structure. In
fact, the pressure applied on the first quarter of the vault on the right hand side effectively contributes
to increasing the damage already suffered due to the self-weight at the intrados of the vault on the
right hand side. The two-dimensional model predicts some very small cracks at this location under the
design wind load as can be seen in the figure below showing part of the vault.
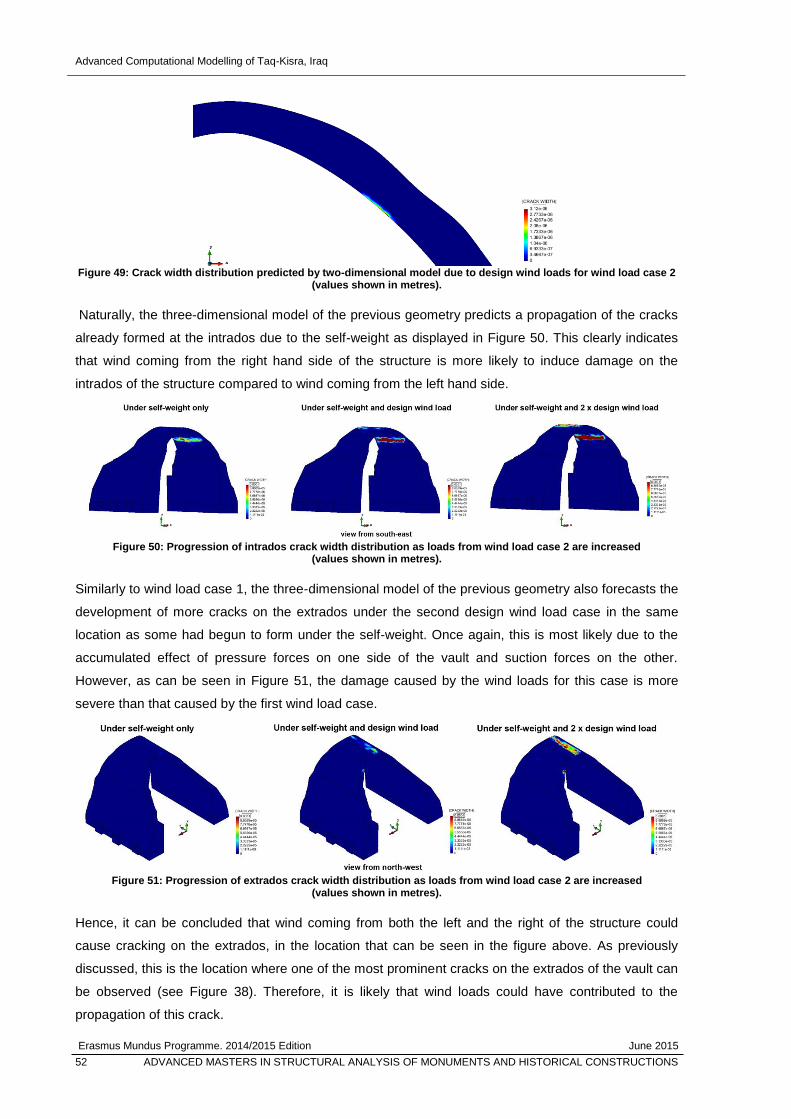
Advanced Computational Modelling of Taq-Kisra, Iraq
Erasmus Mundus Programme. 2014/2015 Edition June 2015
52 ADVANCED MASTERS IN STRUCTURAL ANALYSIS OF MONUMENTS AND HISTORICAL CONSTRUCTIONS
Figure 49: Crack width distribution predicted by two-dimensional model due to design wind loads for wind load case 2
(values shown in metres).
Naturally, the three-dimensional model of the previous geometry predicts a propagation of the cracks
already formed at the intrados due to the self-weight as displayed in Figure 50. This clearly indicates
that wind coming from the right hand side of the structure is more likely to induce damage on the
intrados of the structure compared to wind coming from the left hand side.
Figure 50: Progression of intrados crack width distribution as loads from wind load case 2 are increased
(values shown in metres).
Similarly to wind load case 1, the three-dimensional model of the previous geometry also forecasts the
development of more cracks on the extrados under the second design wind load case in the same
location as some had begun to form under the self-weight. Once again, this is most likely due to the
accumulated effect of pressure forces on one side of the vault and suction forces on the other.
However, as can be seen in Figure 51, the damage caused by the wind loads for this case is more
severe than that caused by the first wind load case.
Figure 51: Progression of extrados crack width distribution as loads from wind load case 2 are increased
(values shown in metres).
Hence, it can be concluded that wind coming from both the left and the right of the structure could
cause cracking on the extrados, in the location that can be seen in the figure above. As previously
discussed, this is the location where one of the most prominent cracks on the extrados of the vault can
be observed (see Figure 38). Therefore, it is likely that wind loads could have contributed to the
propagation of this crack.
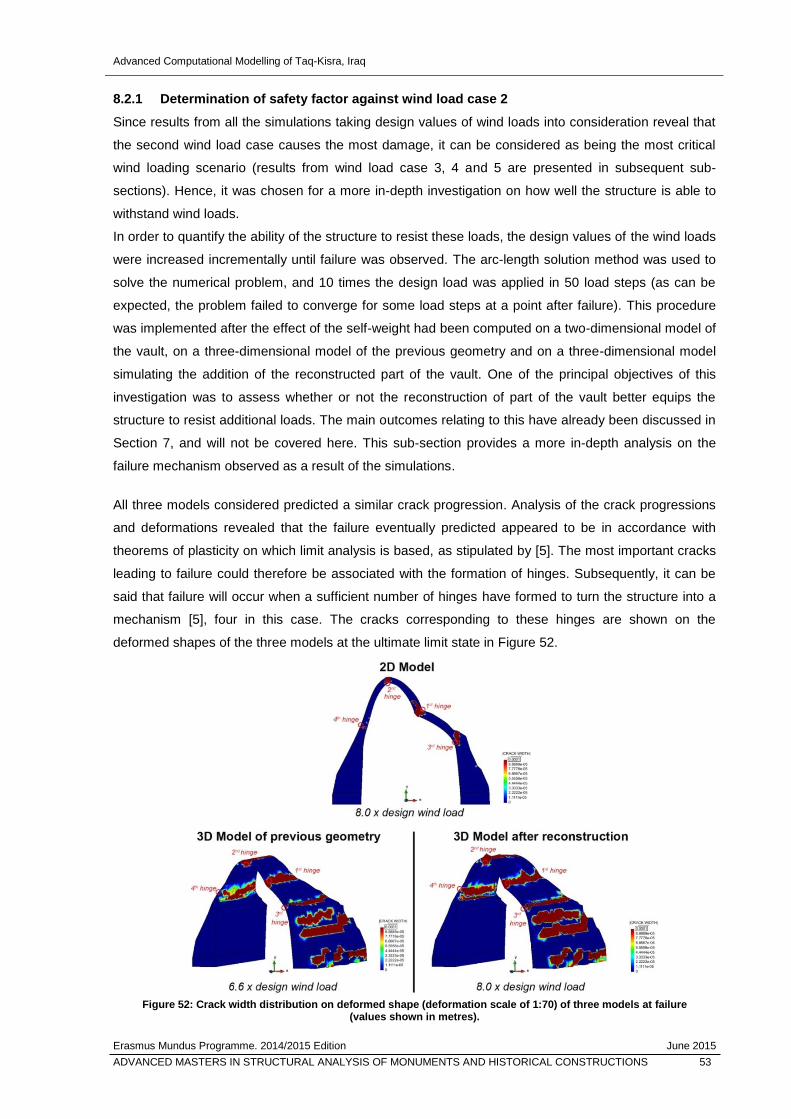
Advanced Computational Modelling of Taq-Kisra, Iraq
Erasmus Mundus Programme. 2014/2015 Edition June 2015
ADVANCED MASTERS IN STRUCTURAL ANALYSIS OF MONUMENTS AND HISTORICAL CONSTRUCTIONS 53
8.2.1 Determination of safety factor against wind load case 2
Since results from all the simulations taking design values of wind loads into consideration reveal that
the second wind load case causes the most damage, it can be considered as being the most critical
wind loading scenario (results from wind load case 3, 4 and 5 are presented in subsequent sub-
sections). Hence, it was chosen for a more in-depth investigation on how well the structure is able to
withstand wind loads.
In order to quantify the ability of the structure to resist these loads, the design values of the wind loads
were increased incrementally until failure was observed. The arc-length solution method was used to
solve the numerical problem, and 10 times the design load was applied in 50 load steps (as can be
expected, the problem failed to converge for some load steps at a point after failure). This procedure
was implemented after the effect of the self-weight had been computed on a two-dimensional model of
the vault, on a three-dimensional model of the previous geometry and on a three-dimensional model
simulating the addition of the reconstructed part of the vault. One of the principal objectives of this
investigation was to assess whether or not the reconstruction of part of the vault better equips the
structure to resist additional loads. The main outcomes relating to this have already been discussed in
Section 7, and will not be covered here. This sub-section provides a more in-depth analysis on the
failure mechanism observed as a result of the simulations.
All three models considered predicted a similar crack progression. Analysis of the crack progressions
and deformations revealed that the failure eventually predicted appeared to be in accordance with
theorems of plasticity on which limit analysis is based, as stipulated by [5]. The most important cracks
leading to failure could therefore be associated with the formation of hinges. Subsequently, it can be
said that failure will occur when a sufficient number of hinges have formed to turn the structure into a
mechanism [5], four in this case. The cracks corresponding to these hinges are shown on the
deformed shapes of the three models at the ultimate limit state in Figure 52.
Figure 52: Crack width distribution on deformed shape (deformation scale of 1:70) of three models at failure
(values shown in metres).
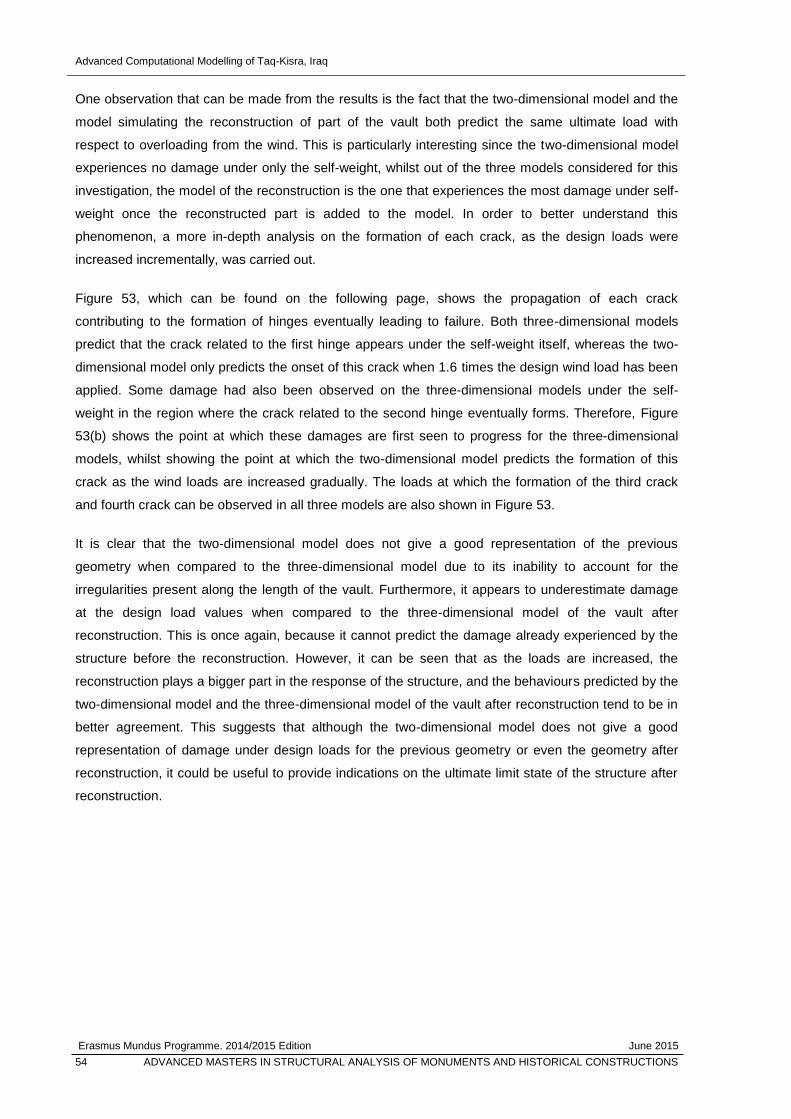
Advanced Computational Modelling of Taq-Kisra, Iraq
Erasmus Mundus Programme. 2014/2015 Edition June 2015
54 ADVANCED MASTERS IN STRUCTURAL ANALYSIS OF MONUMENTS AND HISTORICAL CONSTRUCTIONS
One observation that can be made from the results is the fact that the two-dimensional model and the
model simulating the reconstruction of part of the vault both predict the same ultimate load with
respect to overloading from the wind. This is particularly interesting since the two-dimensional model
experiences no damage under only the self-weight, whilst out of the three models considered for this
investigation, the model of the reconstruction is the one that experiences the most damage under self-
weight once the reconstructed part is added to the model. In order to better understand this
phenomenon, a more in-depth analysis on the formation of each crack, as the design loads were
increased incrementally, was carried out.
Figure 53, which can be found on the following page, shows the propagation of each crack
contributing to the formation of hinges eventually leading to failure. Both three-dimensional models
predict that the crack related to the first hinge appears under the self-weight itself, whereas the two-
dimensional model only predicts the onset of this crack when 1.6 times the design wind load has been
applied. Some damage had also been observed on the three-dimensional models under the self-
weight in the region where the crack related to the second hinge eventually forms. Therefore, Figure
53(b) shows the point at which these damages are first seen to progress for the three-dimensional
models, whilst showing the point at which the two-dimensional model predicts the formation of this
crack as the wind loads are increased gradually. The loads at which the formation of the third crack
and fourth crack can be observed in all three models are also shown in Figure 53.
It is clear that the two-dimensional model does not give a good representation of the previous
geometry when compared to the three-dimensional model due to its inability to account for the
irregularities present along the length of the vault. Furthermore, it appears to underestimate damage
at the design load values when compared to the three-dimensional model of the vault after
reconstruction. This is once again, because it cannot predict the damage already experienced by the
structure before the reconstruction. However, it can be seen that as the loads are increased, the
reconstruction plays a bigger part in the response of the structure, and the behaviours predicted by the
two-dimensional model and the three-dimensional model of the vault after reconstruction tend to be in
better agreement. This suggests that although the two-dimensional model does not give a good
representation of damage under design loads for the previous geometry or even the geometry after
reconstruction, it could be useful to provide indications on the ultimate limit state of the structure after
reconstruction.
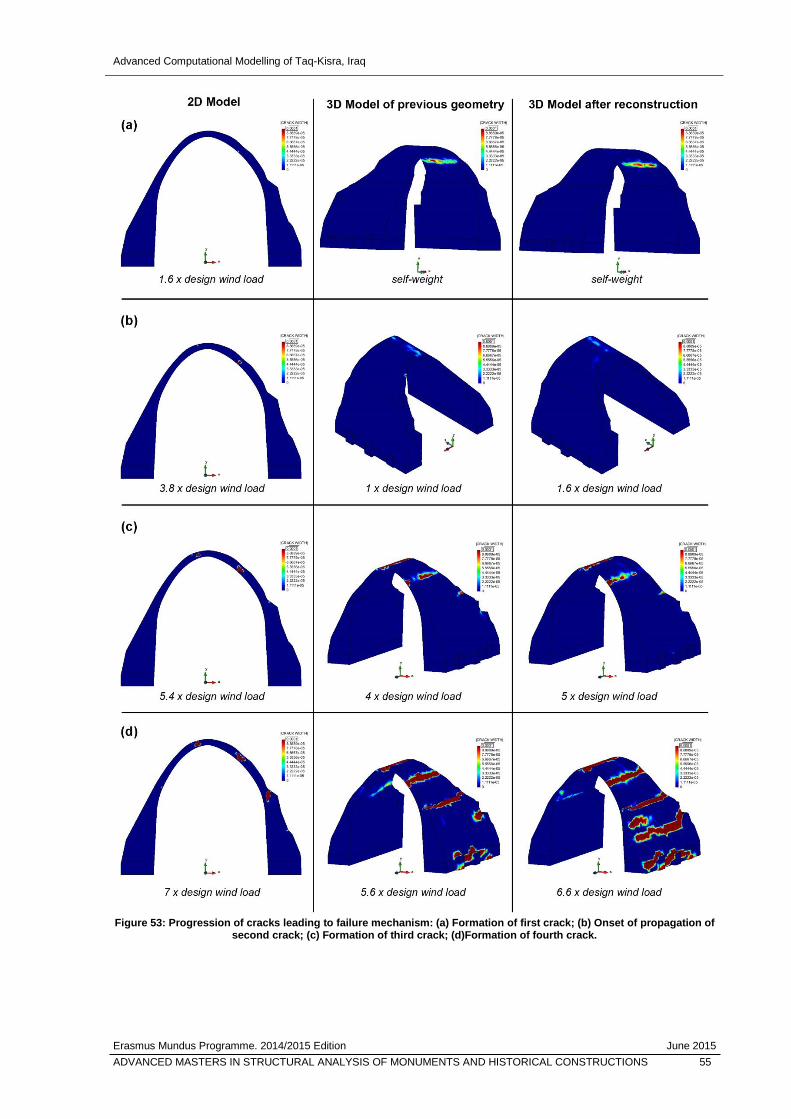
Advanced Computational Modelling of Taq-Kisra, Iraq
Erasmus Mundus Programme. 2014/2015 Edition June 2015
ADVANCED MASTERS IN STRUCTURAL ANALYSIS OF MONUMENTS AND HISTORICAL CONSTRUCTIONS 55
Figure 53: Progression of cracks leading to failure mechanism: (a) Formation of first crack; (b) Onset of propagation of
second crack; (c) Formation of third crack; (d)Formation of fourth crack.
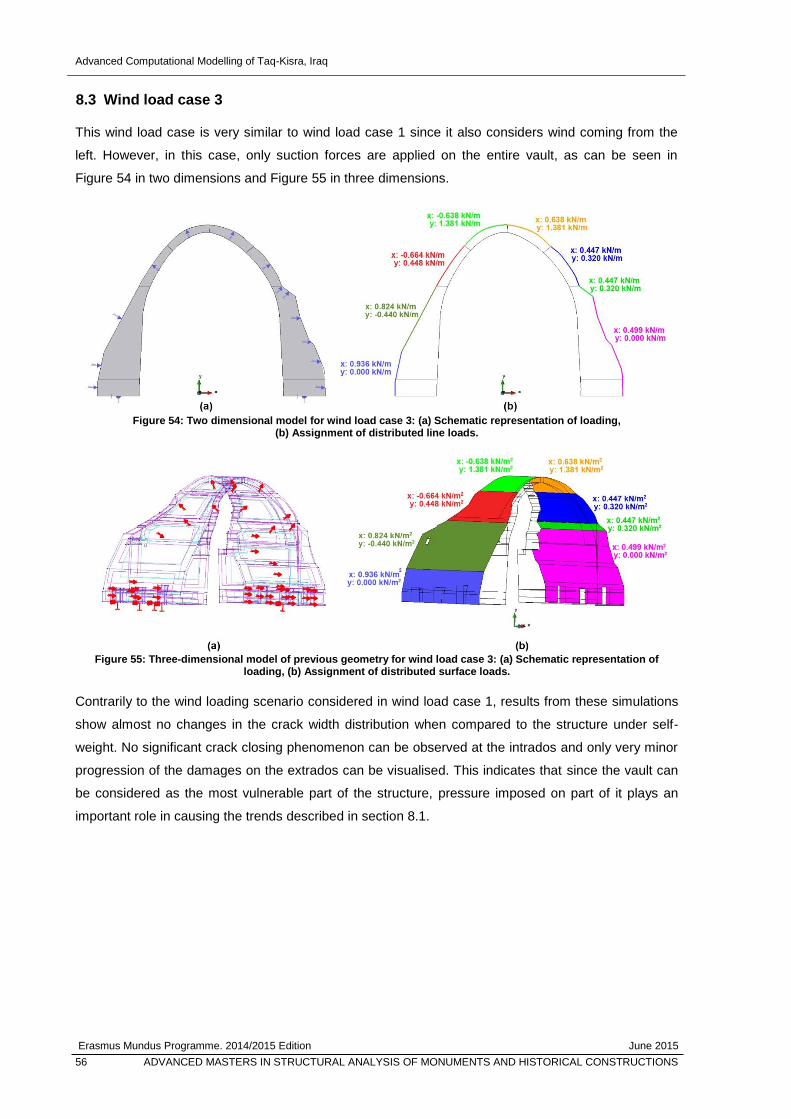
Advanced Computational Modelling of Taq-Kisra, Iraq
Erasmus Mundus Programme. 2014/2015 Edition June 2015
56 ADVANCED MASTERS IN STRUCTURAL ANALYSIS OF MONUMENTS AND HISTORICAL CONSTRUCTIONS
8.3 Wind load case 3
This wind load case is very similar to wind load case 1 since it also considers wind coming from the
left. However, in this case, only suction forces are applied on the entire vault, as can be seen in
Figure 54 in two dimensions and Figure 55 in three dimensions.
Figure 54: Two dimensional model for wind load case 3: (a) Schematic representation of loading,
(b) Assignment of distributed line loads.
Figure 55: Three-dimensional model of previous geometry for wind load case 3: (a) Schematic representation of
loading, (b) Assignment of distributed surface loads.
Contrarily to the wind loading scenario considered in wind load case 1, results from these simulations
show almost no changes in the crack width distribution when compared to the structure under self-
weight. No significant crack closing phenomenon can be observed at the intrados and only very minor
progression of the damages on the extrados can be visualised. This indicates that since the vault can
be considered as the most vulnerable part of the structure, pressure imposed on part of it plays an
important role in causing the trends described in section 8.1.
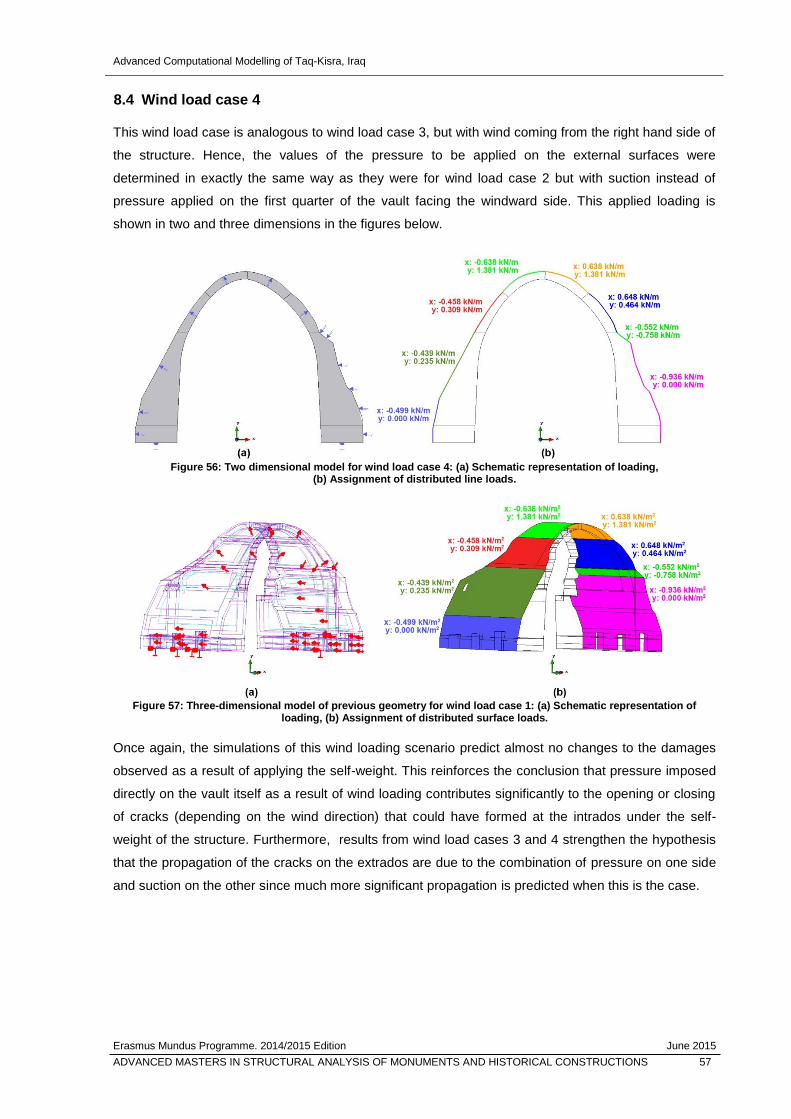
Advanced Computational Modelling of Taq-Kisra, Iraq
Erasmus Mundus Programme. 2014/2015 Edition June 2015
ADVANCED MASTERS IN STRUCTURAL ANALYSIS OF MONUMENTS AND HISTORICAL CONSTRUCTIONS 57
8.4 Wind load case 4
This wind load case is analogous to wind load case 3, but with wind coming from the right hand side of
the structure. Hence, the values of the pressure to be applied on the external surfaces were
determined in exactly the same way as they were for wind load case 2 but with suction instead of
pressure applied on the first quarter of the vault facing the windward side. This applied loading is
shown in two and three dimensions in the figures below.
Figure 56: Two dimensional model for wind load case 4: (a) Schematic representation of loading,
(b) Assignment of distributed line loads.
Figure 57: Three-dimensional model of previous geometry for wind load case 1: (a) Schematic representation of
loading, (b) Assignment of distributed surface loads.
Once again, the simulations of this wind loading scenario predict almost no changes to the damages
observed as a result of applying the self-weight. This reinforces the conclusion that pressure imposed
directly on the vault itself as a result of wind loading contributes significantly to the opening or closing
of cracks (depending on the wind direction) that could have formed at the intrados under the self-
weight of the structure. Furthermore, results from wind load cases 3 and 4 strengthen the hypothesis
that the propagation of the cracks on the extrados are due to the combination of pressure on one side
and suction on the other since much more significant propagation is predicted when this is the case.
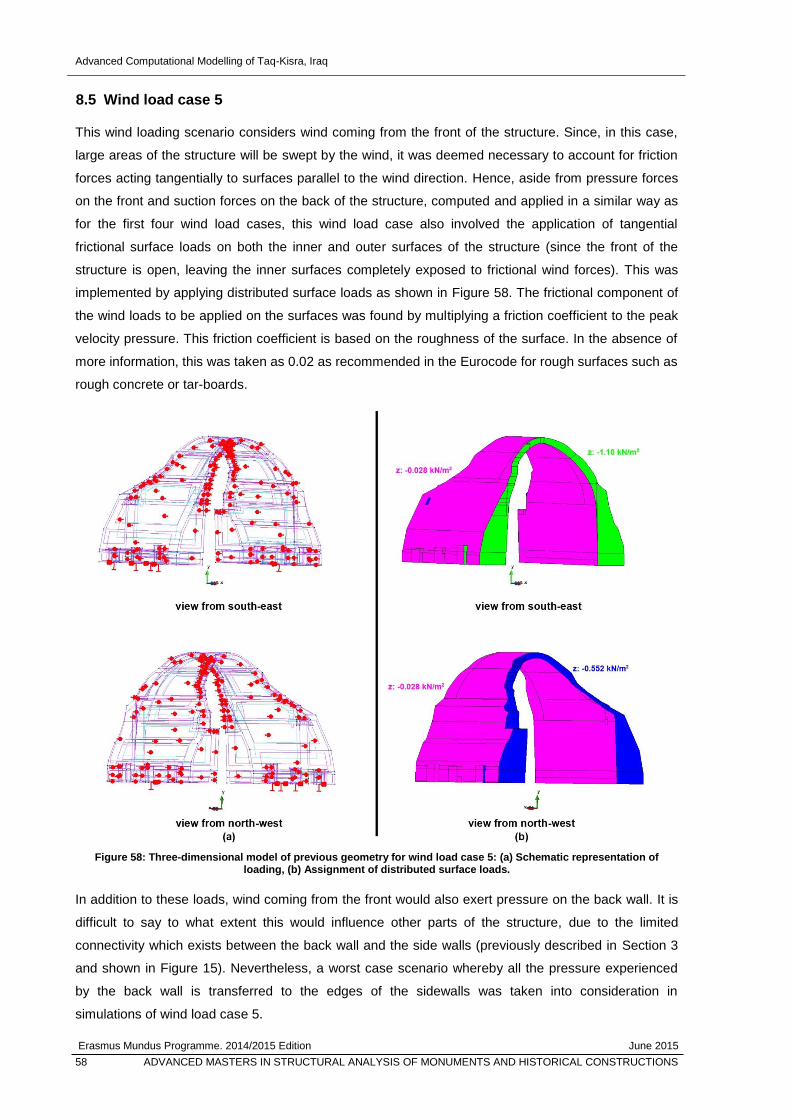
Advanced Computational Modelling of Taq-Kisra, Iraq
Erasmus Mundus Programme. 2014/2015 Edition June 2015
58 ADVANCED MASTERS IN STRUCTURAL ANALYSIS OF MONUMENTS AND HISTORICAL CONSTRUCTIONS
8.5 Wind load case 5
This wind loading scenario considers wind coming from the front of the structure. Since, in this case,
large areas of the structure will be swept by the wind, it was deemed necessary to account for friction
forces acting tangentially to surfaces parallel to the wind direction. Hence, aside from pressure forces
on the front and suction forces on the back of the structure, computed and applied in a similar way as
for the first four wind load cases, this wind load case also involved the application of tangential
frictional surface loads on both the inner and outer surfaces of the structure (since the front of the
structure is open, leaving the inner surfaces completely exposed to frictional wind forces). This was
implemented by applying distributed surface loads as shown in Figure 58. The frictional component of
the wind loads to be applied on the surfaces was found by multiplying a friction coefficient to the peak
velocity pressure. This friction coefficient is based on the roughness of the surface. In the absence of
more information, this was taken as 0.02 as recommended in the Eurocode for rough surfaces such as
rough concrete or tar-boards.
Figure 58: Three-dimensional model of previous geometry for wind load case 5: (a) Schematic representation of
loading, (b) Assignment of distributed surface loads.
In addition to these loads, wind coming from the front would also exert pressure on the back wall. It is
difficult to say to what extent this would influence other parts of the structure, due to the limited
connectivity which exists between the back wall and the side walls (previously described in Section 3
and shown in Figure 15). Nevertheless, a worst case scenario whereby all the pressure experienced
by the back wall is transferred to the edges of the sidewalls was taken into consideration in
simulations of wind load case 5.
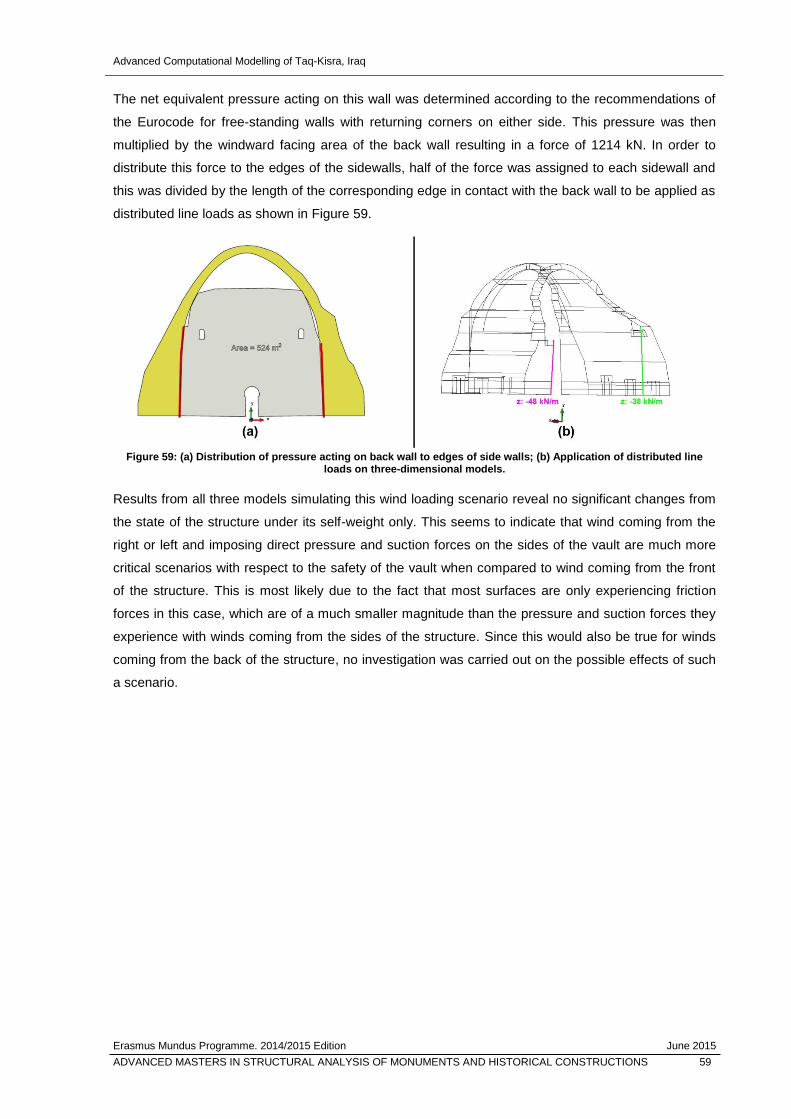
Advanced Computational Modelling of Taq-Kisra, Iraq
Erasmus Mundus Programme. 2014/2015 Edition June 2015
ADVANCED MASTERS IN STRUCTURAL ANALYSIS OF MONUMENTS AND HISTORICAL CONSTRUCTIONS 59
The net equivalent pressure acting on this wall was determined according to the recommendations of
the Eurocode for free-standing walls with returning corners on either side. This pressure was then
multiplied by the windward facing area of the back wall resulting in a force of 1214 kN. In order to
distribute this force to the edges of the sidewalls, half of the force was assigned to each sidewall and
this was divided by the length of the corresponding edge in contact with the back wall to be applied as
distributed line loads as shown in Figure 59.
Figure 59: (a) Distribution of pressure acting on back wall to edges of side walls; (b) Application of distributed line
loads on three-dimensional models.
Results from all three models simulating this wind loading scenario reveal no significant changes from
the state of the structure under its self-weight only. This seems to indicate that wind coming from the
right or left and imposing direct pressure and suction forces on the sides of the vault are much more
critical scenarios with respect to the safety of the vault when compared to wind coming from the front
of the structure. This is most likely due to the fact that most surfaces are only experiencing friction
forces in this case, which are of a much smaller magnitude than the pressure and suction forces they
experience with winds coming from the sides of the structure. Since this would also be true for winds
coming from the back of the structure, no investigation was carried out on the possible effects of such
a scenario.

Advanced Computational Modelling of Taq-Kisra, Iraq
Erasmus Mundus Programme. 2014/2015 Edition June 2015
60 ADVANCED MASTERS IN STRUCTURAL ANALYSIS OF MONUMENTS AND HISTORICAL CONSTRUCTIONS
This page is left blank on purpose.

Advanced Computational Modelling of Taq-Kisra, Iraq
Erasmus Mundus Programme. 2014/2015 Edition June 2015
ADVANCED MASTERS IN STRUCTURAL ANALYSIS OF MONUMENTS AND HISTORICAL CONSTRUCTIONS 61
9. RAINWATER INGRESS IN VAULT
The project documentation provided by ProjektyZeman.cz clearly identified the lack of waterproofing
before the reconstruction works as one of the most noteworthy issues. This left the vault exposed to
the environment and made it particularly susceptible to rainwater ingress. It should be noted that
although the structure is found in a region with a relatively dry climate, precipitation values of up to
30mm have been recorded during peak rainfall periods [19], and hence rainwater ingress could
definitely affect the structure. In order to gain a better understanding of what implications this could
have for the structure, simulations of the structure under self-weight which account for the effect of
rainwater ingress through a reduction of the strength and material properties of the vault were carried
out. A different material model was created for wet masonry with bricks in vertical layers. This was
done by estimating the parameters defining the material based on laboratory tests carried out on
saturated samples of units and mortar, as previously described in section 5. The two-dimensional
geometrical model and the three-dimensional geometrical model of the previous geometry were used
for the execution of this simulation. The material assignments of these two models appear in
Figure 60.
Figure 60: Material assignment for models considering rainwater ingress in vault; (a) two-dimensional model,
(b) three-dimensional model of previous geometry.
The two-dimensional model taking rainwater ingress into consideration predicts only very slight
changes in the way the structure is able to resist its self-weight when compared to the two-
dimensional model with estimated parameters of dry masonry used to define the material of the vault.
Higher tensile strains can be observed in the same vulnerable location on the intrados resulting in the
onset of cracking under the self-weight as can be seen in Figure 61.
Figure 61: Crack width distribution for part of two-dimensional model considering wet material for the vault
(values shown in metres).

Advanced Computational Modelling of Taq-Kisra, Iraq
Erasmus Mundus Programme. 2014/2015 Edition June 2015
62 ADVANCED MASTERS IN STRUCTURAL ANALYSIS OF MONUMENTS AND HISTORICAL CONSTRUCTIONS
On the other hand, the three-dimensional model of the previous geometry presents considerably more
prevalent differences from predictions of the model considering dry masonry in the vault. The widest
cracks form in the same area on the intrados and on the extrados as predicted by the model with a dry
condition of the vault. However, the extent of the damage predicted in those areas is greater if
rainwater ingress in the vault is accounted for as can be seen in Figure 62.
Figure 62: Crack width distribution shown from the bottom and top for three-dimensional models considering dry and
wet material for the vault (values shown in metres).
Furthermore, small signs of damage can also be observed on the opposite surface in the same
location as the most prominent cracks (damages can be seen on the extrados directly opposite to
where the most prominent cracks have formed on the intrados and vice versa). This seems to indicate
that cracks are able to propagate more easily through the thickness of the vault. However, since the
material model does not take into consideration the initial anisotropy, which is characteristic of
masonry, this particular phenomenon might not be truly representative of the response of the actual
structure. Instead, a more realistic interpretation of these results could simply be that the reduced
strength of the material as a consequence of rainwater ingress results in a greater extent of damage in
the vault. Another remark that can be made based on the results is that the cracks which form under
the self-weight have a particular tendency to propagate in the longitudinal direction of the vault. This is
very much in line with some of the cracks that could be observed over the extrados of the real
structure on the poor quality concrete membrane, as can be seen in Figure 63. It is possible that
rainwater ingress has facilitated the propagation of these cracks.
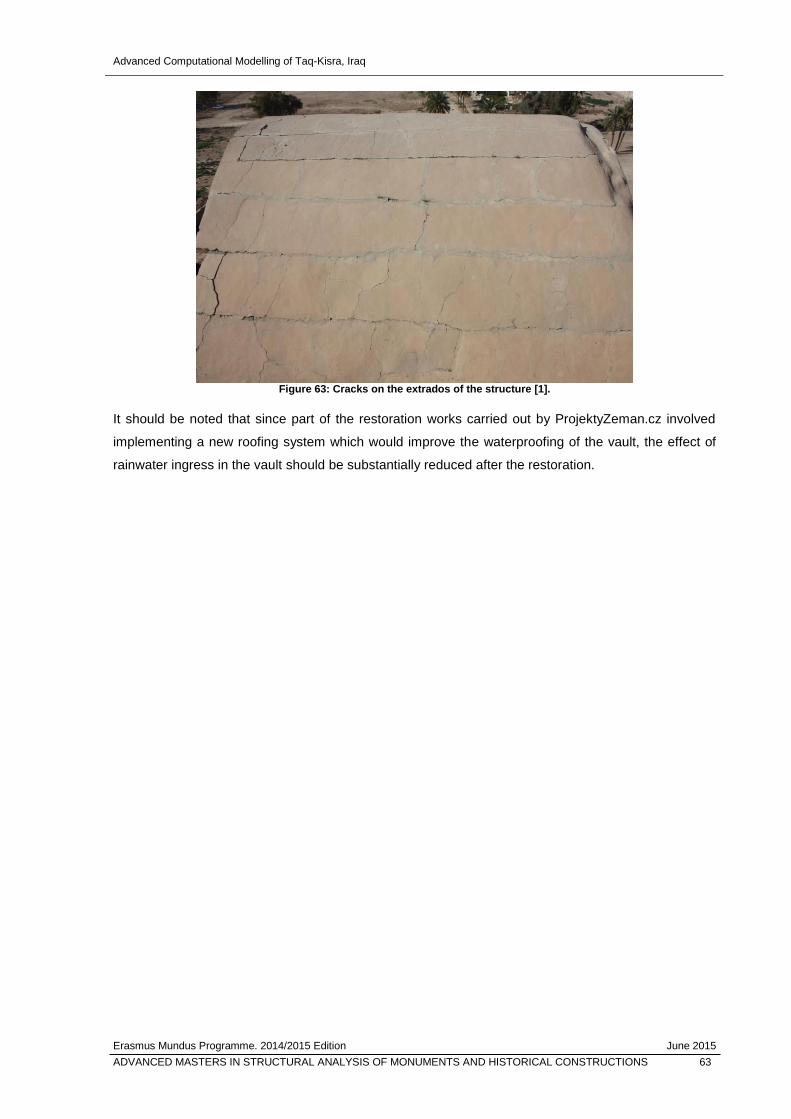
Advanced Computational Modelling of Taq-Kisra, Iraq
Erasmus Mundus Programme. 2014/2015 Edition June 2015
ADVANCED MASTERS IN STRUCTURAL ANALYSIS OF MONUMENTS AND HISTORICAL CONSTRUCTIONS 63
Figure 63: Cracks on the extrados of the structure [1].
It should be noted that since part of the restoration works carried out by ProjektyZeman.cz involved
implementing a new roofing system which would improve the waterproofing of the vault, the effect of
rainwater ingress in the vault should be substantially reduced after the restoration.

Advanced Computational Modelling of Taq-Kisra, Iraq
Erasmus Mundus Programme. 2014/2015 Edition June 2015
64 ADVANCED MASTERS IN STRUCTURAL ANALYSIS OF MONUMENTS AND HISTORICAL CONSTRUCTIONS
This page is left blank on purpose.
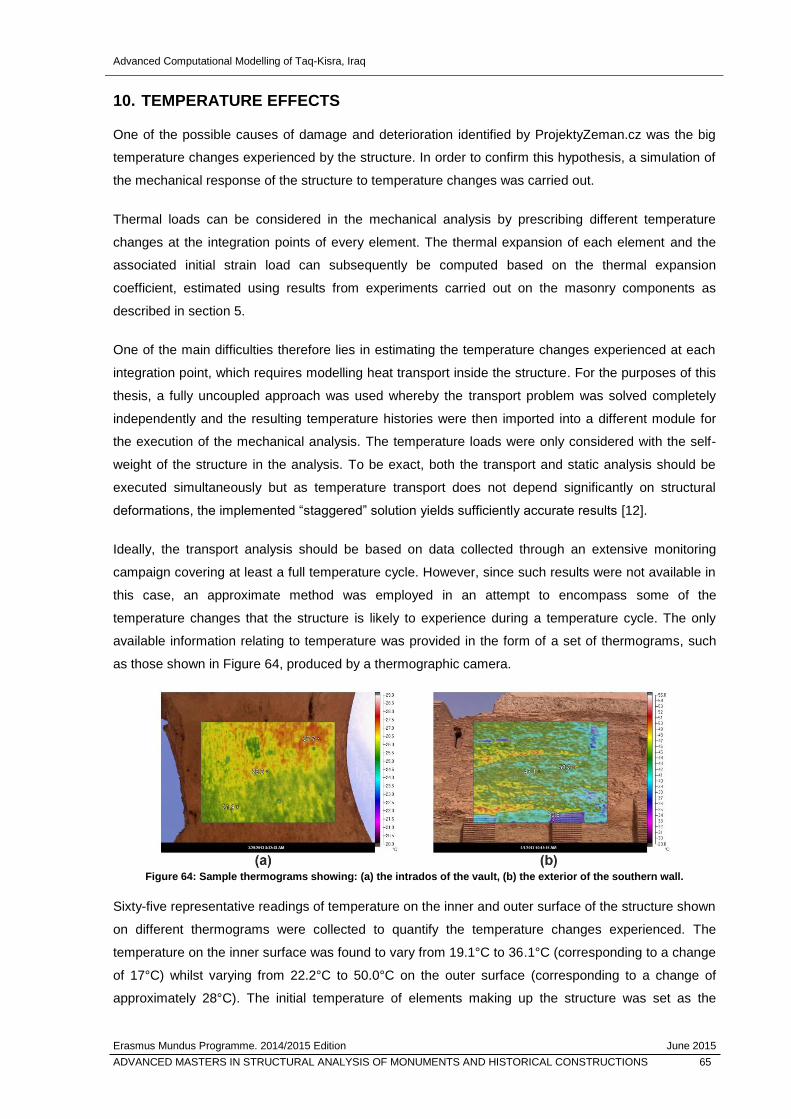
Advanced Computational Modelling of Taq-Kisra, Iraq
Erasmus Mundus Programme. 2014/2015 Edition June 2015
ADVANCED MASTERS IN STRUCTURAL ANALYSIS OF MONUMENTS AND HISTORICAL CONSTRUCTIONS 65
10. TEMPERATURE EFFECTS
One of the possible causes of damage and deterioration identified by ProjektyZeman.cz was the big
temperature changes experienced by the structure. In order to confirm this hypothesis, a simulation of
the mechanical response of the structure to temperature changes was carried out.
Thermal loads can be considered in the mechanical analysis by prescribing different temperature
changes at the integration points of every element. The thermal expansion of each element and the
associated initial strain load can subsequently be computed based on the thermal expansion
coefficient, estimated using results from experiments carried out on the masonry components as
described in section 5.
One of the main difficulties therefore lies in estimating the temperature changes experienced at each
integration point, which requires modelling heat transport inside the structure. For the purposes of this
thesis, a fully uncoupled approach was used whereby the transport problem was solved completely
independently and the resulting temperature histories were then imported into a different module for
the execution of the mechanical analysis. The temperature loads were only considered with the self-
weight of the structure in the analysis. To be exact, both the transport and static analysis should be
executed simultaneously but as temperature transport does not depend significantly on structural
deformations, the implemented “staggered” solution yields sufficiently accurate results [12].
Ideally, the transport analysis should be based on data collected through an extensive monitoring
campaign covering at least a full temperature cycle. However, since such results were not available in
this case, an approximate method was employed in an attempt to encompass some of the
temperature changes that the structure is likely to experience during a temperature cycle. The only
available information relating to temperature was provided in the form of a set of thermograms, such
as those shown in Figure 64, produced by a thermographic camera.
Figure 64: Sample thermograms showing: (a) the intrados of the vault, (b) the exterior of the southern wall.
Sixty-five representative readings of temperature on the inner and outer surface of the structure shown
on different thermograms were collected to quantify the temperature changes experienced. The
temperature on the inner surface was found to vary from 19.1°C to 36.1°C (corresponding to a change
of 17°C) whilst varying from 22.2°C to 50.0°C on the outer surface (corresponding to a change of
approximately 28°C). The initial temperature of elements making up the structure was set as the
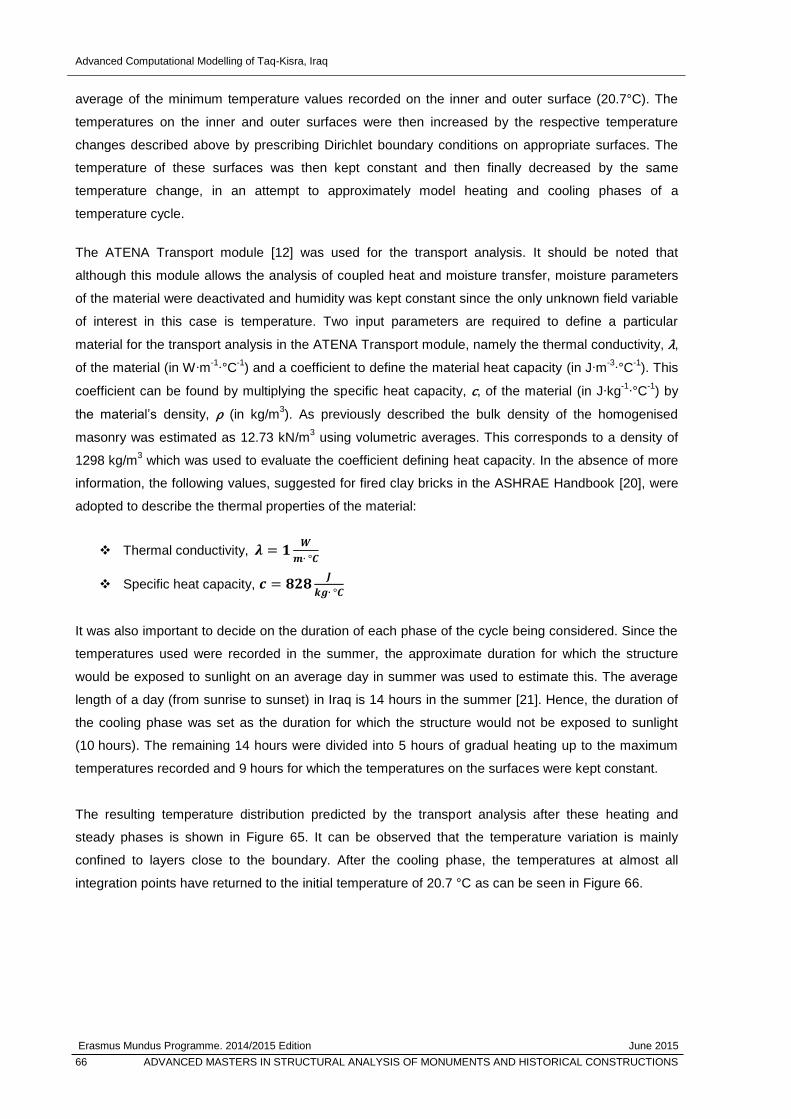
Advanced Computational Modelling of Taq-Kisra, Iraq
Erasmus Mundus Programme. 2014/2015 Edition June 2015
66 ADVANCED MASTERS IN STRUCTURAL ANALYSIS OF MONUMENTS AND HISTORICAL CONSTRUCTIONS
average of the minimum temperature values recorded on the inner and outer surface (20.7°C). The
temperatures on the inner and outer surfaces were then increased by the respective temperature
changes described above by prescribing Dirichlet boundary conditions on appropriate surfaces. The
temperature of these surfaces was then kept constant and then finally decreased by the same
temperature change, in an attempt to approximately model heating and cooling phases of a
temperature cycle.
The ATENA Transport module [12] was used for the transport analysis. It should be noted that
although this module allows the analysis of coupled heat and moisture transfer, moisture parameters
of the material were deactivated and humidity was kept constant since the only unknown field variable
of interest in this case is temperature. Two input parameters are required to define a particular
material for the transport analysis in the ATENA Transport module, namely the thermal conductivity, λ,
of the material (in W∙m-1
∙°C-1
) and a coefficient to define the material heat capacity (in J∙m-3
∙°C-1
). This
coefficient can be found by multiplying the specific heat capacity, c, of the material (in J∙kg-1
∙°C-1
) by
the material’s density, ρ (in kg/m3). As previously described the bulk density of the homogenised
masonry was estimated as 12.73 kN/m3 using volumetric averages. This corresponds to a density of
1298 kg/m3 which was used to evaluate the coefficient defining heat capacity. In the absence of more
information, the following values, suggested for fired clay bricks in the ASHRAE Handbook [20], were
adopted to describe the thermal properties of the material:
Thermal conductivity, 𝝀 = 𝟏𝑾
𝒎∙ °𝑪
Specific heat capacity, 𝒄 = 𝟖𝟐𝟖𝑱
𝒌𝒈∙ °𝑪
It was also important to decide on the duration of each phase of the cycle being considered. Since the
temperatures used were recorded in the summer, the approximate duration for which the structure
would be exposed to sunlight on an average day in summer was used to estimate this. The average
length of a day (from sunrise to sunset) in Iraq is 14 hours in the summer [21]. Hence, the duration of
the cooling phase was set as the duration for which the structure would not be exposed to sunlight
(10 hours). The remaining 14 hours were divided into 5 hours of gradual heating up to the maximum
temperatures recorded and 9 hours for which the temperatures on the surfaces were kept constant.
The resulting temperature distribution predicted by the transport analysis after these heating and
steady phases is shown in Figure 65. It can be observed that the temperature variation is mainly
confined to layers close to the boundary. After the cooling phase, the temperatures at almost all
integration points have returned to the initial temperature of 20.7 °C as can be seen in Figure 66.

Advanced Computational Modelling of Taq-Kisra, Iraq
Erasmus Mundus Programme. 2014/2015 Edition June 2015
ADVANCED MASTERS IN STRUCTURAL ANALYSIS OF MONUMENTS AND HISTORICAL CONSTRUCTIONS 67
Figure 65: Element temperatures after heating and steady phases.
Figure 66: Element temperatures after full cycle considered.
The crack width distribution predicted by the static analysis of the effect of self-weight considering
temperature changes after the heating and steady phases is shown in Figure 67. It can be seen that
many small cracks form close to the boundary of the side walls, where the greatest temperature
variations are being experienced. This indicates that temperature changes could have contributed to
the degradation of material that can be seen on the outer surfaces of the sidewalls of the structure.
Furthermore, the model predicts the formation of many small cracks on the extrados in the same
region as some were previously forecast under the self-weight without considering temperature
changes. Hence, it appears that extreme temperature changes could also have contributed to the
propagation of the crack that has been observed on the structure in a similar region.
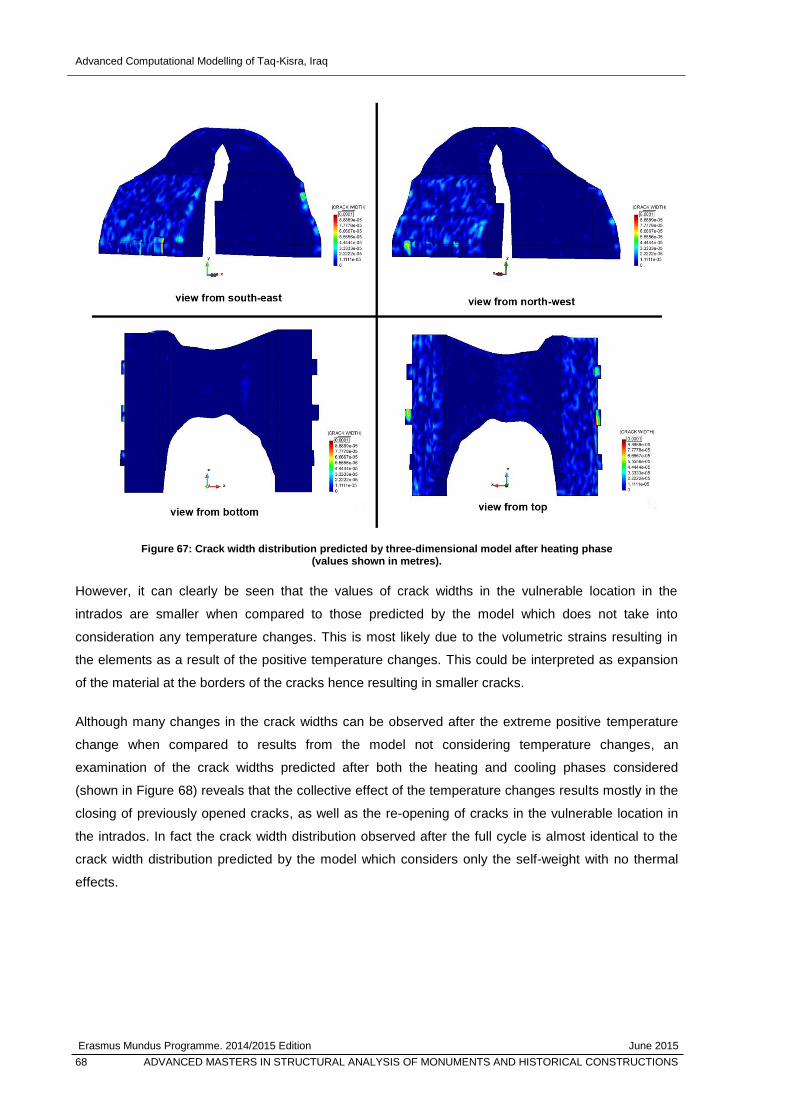
Advanced Computational Modelling of Taq-Kisra, Iraq
Erasmus Mundus Programme. 2014/2015 Edition June 2015
68 ADVANCED MASTERS IN STRUCTURAL ANALYSIS OF MONUMENTS AND HISTORICAL CONSTRUCTIONS
Figure 67: Crack width distribution predicted by three-dimensional model after heating phase
(values shown in metres).
However, it can clearly be seen that the values of crack widths in the vulnerable location in the
intrados are smaller when compared to those predicted by the model which does not take into
consideration any temperature changes. This is most likely due to the volumetric strains resulting in
the elements as a result of the positive temperature changes. This could be interpreted as expansion
of the material at the borders of the cracks hence resulting in smaller cracks.
Although many changes in the crack widths can be observed after the extreme positive temperature
change when compared to results from the model not considering temperature changes, an
examination of the crack widths predicted after both the heating and cooling phases considered
(shown in Figure 68) reveals that the collective effect of the temperature changes results mostly in the
closing of previously opened cracks, as well as the re-opening of cracks in the vulnerable location in
the intrados. In fact the crack width distribution observed after the full cycle is almost identical to the
crack width distribution predicted by the model which considers only the self-weight with no thermal
effects.
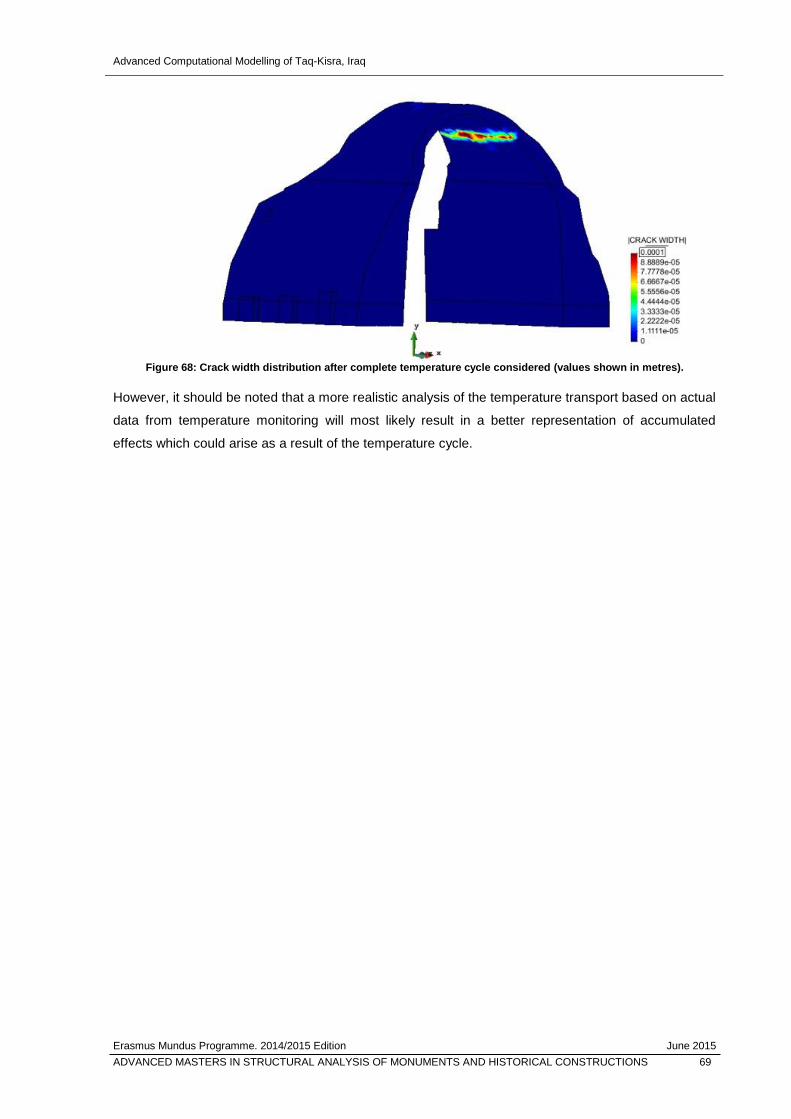
Advanced Computational Modelling of Taq-Kisra, Iraq
Erasmus Mundus Programme. 2014/2015 Edition June 2015
ADVANCED MASTERS IN STRUCTURAL ANALYSIS OF MONUMENTS AND HISTORICAL CONSTRUCTIONS 69
Figure 68: Crack width distribution after complete temperature cycle considered (values shown in metres).
However, it should be noted that a more realistic analysis of the temperature transport based on actual
data from temperature monitoring will most likely result in a better representation of accumulated
effects which could arise as a result of the temperature cycle.
Advanced Computational Modelling of Taq-Kisra, Iraq
Erasmus Mundus Programme. 2014/2015 Edition June 2015
70 ADVANCED MASTERS IN STRUCTURAL ANALYSIS OF MONUMENTS AND HISTORICAL CONSTRUCTIONS
This page is left blank on purpose.
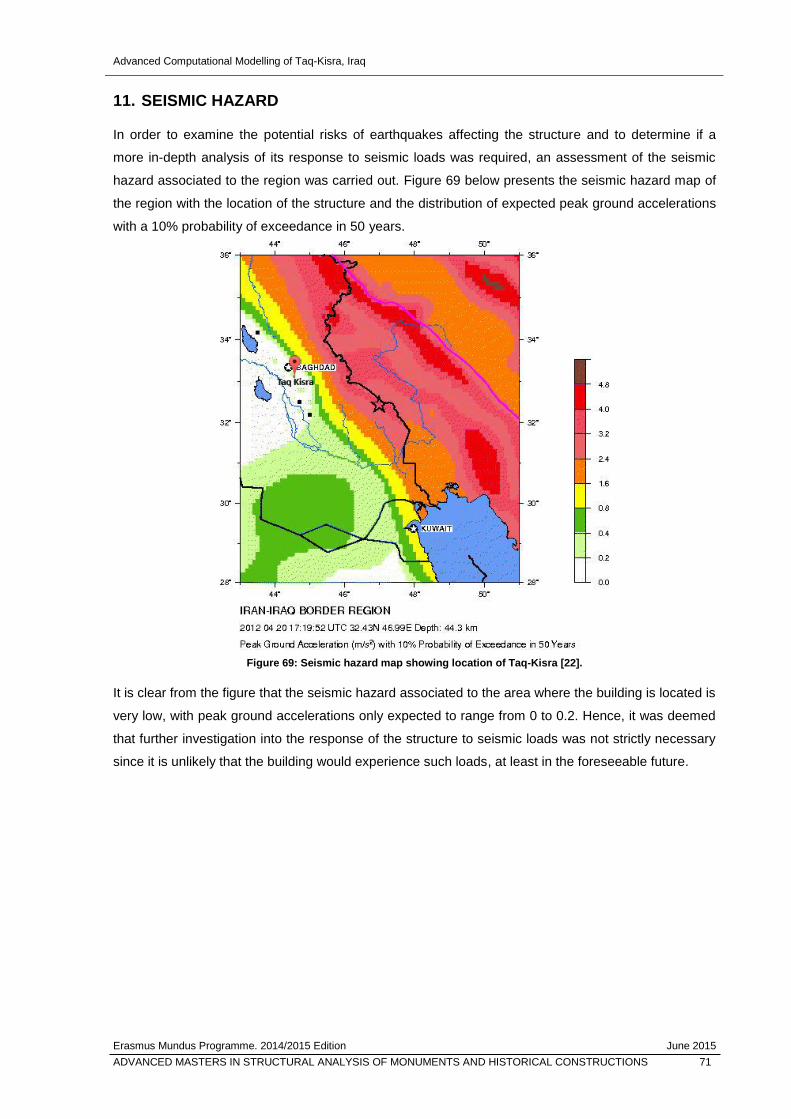
Advanced Computational Modelling of Taq-Kisra, Iraq
Erasmus Mundus Programme. 2014/2015 Edition June 2015
ADVANCED MASTERS IN STRUCTURAL ANALYSIS OF MONUMENTS AND HISTORICAL CONSTRUCTIONS 71
11. SEISMIC HAZARD
In order to examine the potential risks of earthquakes affecting the structure and to determine if a
more in-depth analysis of its response to seismic loads was required, an assessment of the seismic
hazard associated to the region was carried out. Figure 69 below presents the seismic hazard map of
the region with the location of the structure and the distribution of expected peak ground accelerations
with a 10% probability of exceedance in 50 years.
Figure 69: Seismic hazard map showing location of Taq-Kisra [22].
It is clear from the figure that the seismic hazard associated to the area where the building is located is
very low, with peak ground accelerations only expected to range from 0 to 0.2. Hence, it was deemed
that further investigation into the response of the structure to seismic loads was not strictly necessary
since it is unlikely that the building would experience such loads, at least in the foreseeable future.

Advanced Computational Modelling of Taq-Kisra, Iraq
Erasmus Mundus Programme. 2014/2015 Edition June 2015
72 ADVANCED MASTERS IN STRUCTURAL ANALYSIS OF MONUMENTS AND HISTORICAL CONSTRUCTIONS
This page is left blank on purpose.

Advanced Computational Modelling of Taq-Kisra, Iraq
Erasmus Mundus Programme. 2014/2015 Edition June 2015
ADVANCED MASTERS IN STRUCTURAL ANALYSIS OF MONUMENTS AND HISTORICAL CONSTRUCTIONS 73
12. COMPARISON OF LOAD CASES CONSIDERED
The simulations carried out indicate that aside from the fact that certain areas of the vault experience
high strains with respect to the low strength characteristics of the material under only the self-weight,
environmental and climatic factors such as wind loads, temperature effects and rainwater ingress in
the vault also contribute to further damage and deterioration of the material.
A comparison of the different wind loading scenarios considered reveals that wind coming from the
north or the south and acting directly on the sides of the structure have a greater impact on the
structure when compared to wind coming from the front. More surfaces experience direct pressure or
suction in the case of wind coming from the sides. The magnitudes of loads exerted by such forces
are much greater than those of friction forces, experienced by most surfaces in the case of wind
coming from the front. This could explain why wind coming from the sides lead to more significant
changes in the crack width distribution. Furthermore, it was found that wind load cases resulting in a
pressure component acting directly on part of the vault on the windward side are more likely to
influence the crack width distribution. Both wind coming from the right and left hand side of the
structure can cause further propagation of small cracks that could have formed under only the self-
weight in a particular region on the extrados. However, wind coming from the right hand side of the
structure can be considered as more critical, since it also induces further cracking in the vulnerable
area on the intrados whereas wind coming from the left appears to cause a reduction in crack widths
in that area by counteracting the asymmetric loading which arises as a result of just the self-weight of
the structure.
A comparison of the maximum displacements predicted by all the models simulating different
conditions is shown in Figure 70. This should not be used to draw conclusions on the condition or
safety of the structure since it provides no indication on the extent of damage. For example, the model
taking into consideration the extreme positive temperature changes after the heating phase of the
temperature cycle predicts almost the same maximum displacement as the model which does not
consider temperature changes, since the greatest deformations are mostly a result of the self-weight.
However, there are considerable differences between the damage predicted by the two models, with
more cracks forming in areas experiencing big positive temperature changes. Nevertheless, these
comparisons can prove useful when assessing the serviceability limit states of the structure under
different loading conditions. For instance, it is interesting to note that although results from simulations
carried out as part of this thesis indicate that the reconstruction of part of the vault better equips the
structure for resisting additional loads, the additional weight it imposes results in larger displacements
under design loading conditions.
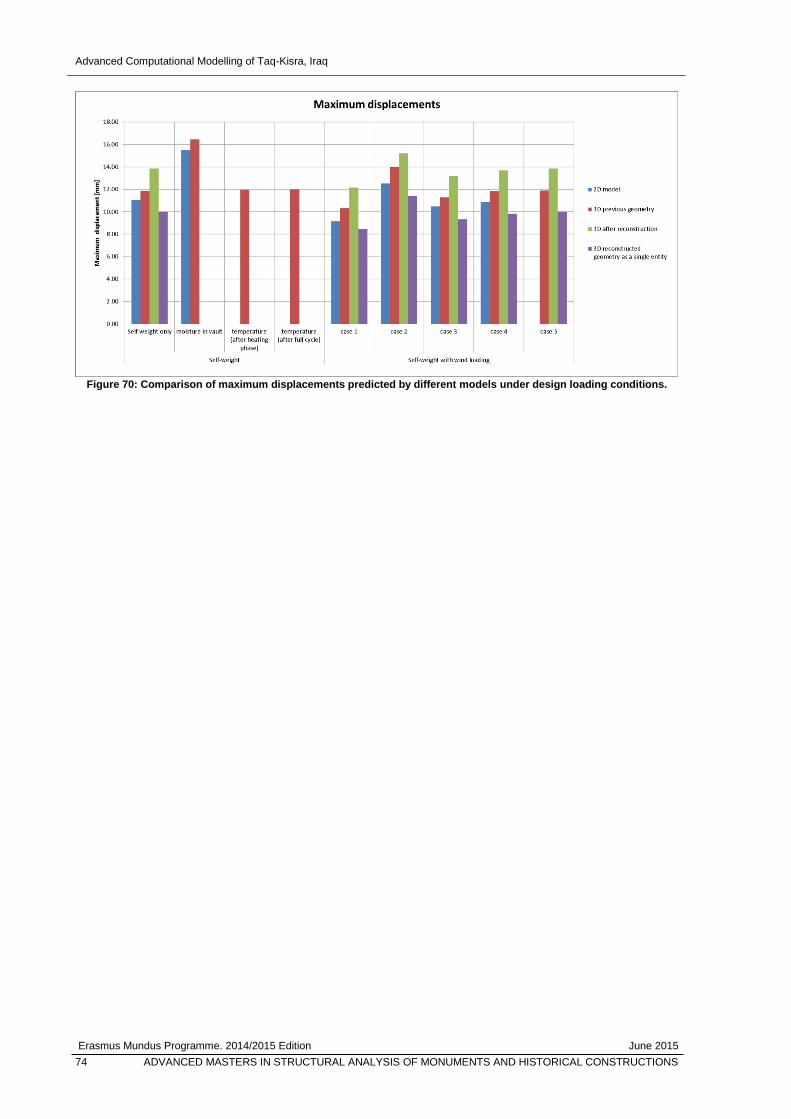
Advanced Computational Modelling of Taq-Kisra, Iraq
Erasmus Mundus Programme. 2014/2015 Edition June 2015
74 ADVANCED MASTERS IN STRUCTURAL ANALYSIS OF MONUMENTS AND HISTORICAL CONSTRUCTIONS
Figure 70: Comparison of maximum displacements predicted by different models under design loading conditions.
Advanced Computational Modelling of Taq-Kisra, Iraq
Erasmus Mundus Programme. 2014/2015 Edition June 2015
ADVANCED MASTERS IN STRUCTURAL ANALYSIS OF MONUMENTS AND HISTORICAL CONSTRUCTIONS 75
13. COMPARISON WITH RESULTS FROM PREVIOUS STRUCTURAL
ANALYSES
The finite element analyses conducted as a part of this thesis predicts similar areas susceptible to
tensile stresses under self-weight and wind loading when compared to results from the two-
dimensional analyses carried out by ProjektyZeman.cz. However, more factors related to the
behaviour of the material, the three-dimensional geometry and the environment could be taken into
consideration. This has allowed more conclusions to be drawn on observed damages and on the
possible effects of the reconstruction of part of the vault.
It is also interesting to note that areas identified as prone to experiencing damage and high tensile
stresses under self-weight as a result of simulations carried out for the purposes of this thesis appear
to correspond to areas where the thrust line is most eccentric in the static graphic analysis presented
in Section 2.3. Naturally, the thrust line shown is only one of many possible solutions, it does not give
any indication on the actual state of the structure and can only be used to evaluate whether or not a
structure is safe. However, in this case, the regions where the thrust line is most eccentric are most
likely where it would first leave the boundary of the structure upon overloading and can therefore be
identified as being vulnerable. This is very much in line with findings from simulations carried out for
the purpose of this thesis.

Advanced Computational Modelling of Taq-Kisra, Iraq
Erasmus Mundus Programme. 2014/2015 Edition June 2015
76 ADVANCED MASTERS IN STRUCTURAL ANALYSIS OF MONUMENTS AND HISTORICAL CONSTRUCTIONS
This page is left blank on purpose.
Advanced Computational Modelling of Taq-Kisra, Iraq
Erasmus Mundus Programme. 2014/2015 Edition June 2015
ADVANCED MASTERS IN STRUCTURAL ANALYSIS OF MONUMENTS AND HISTORICAL CONSTRUCTIONS 77
14. CONCLUSIONS
Based on the analyses carried out as a part of this thesis, the Taq-Kisra monument can be considered
as being safe globally, since it can resist all the design loads considered without reaching an ultimate
limit state. However, the existing geometry and self-weight of the structure itself result in an
asymmetric deformed shape causing certain areas of the vault to experience high strains, particularly
with respect to the low strength properties that characterise the material. This combined with
environmental factors such as exposure to the wind, rainwater ingress in the vault and big temperature
changes results in certain local areas being particularly prone to damage. Moreover, the significant
loss of material that has occurred in the past towards the western side of the vault has left these areas
in an even more vulnerable state, since the loss of structural integrity results in a less efficient
distribution of stresses in the vault. The cumulative effect of such local damages, particularly over long
periods of time, definitely has serious implications for the overall safety of the structure.
It has been demonstrated that the most vulnerable region is most likely on the right hand side of the
intrados of the vault, since the greatest crack widths predicted under almost all loading combinations
considered tend to be localised in this area. Another area which has been identified as prone to
damage, particularly when environmental factors are taken into consideration, is found on the extrados
of the structure, just to the left of the apex. Not only do simulations predict the onset of cracking in
both these areas under the self-weight alone, but some of the other environmental factors considered
also contribute to further propagation of these cracks. Reports from observations of the real structure
confirm the presence of cracks on the real structure in these locations.
It has also been found that winds coming from either side of the structure (north and south) are more
likely to affect its stability when compared to winds coming from the front or back (east and west). Both
wind coming from the north and south appear to cause further propagation of cracks in the vulnerable
location on the extrados. However, only wind coming from the north induces further cracking in the
vulnerable area on the intrados whilst wind coming from the south appears to cause a reduction in
crack widths in that area by counteracting the asymmetric loading which arises as a result of the self-
weight of the structure. Hence, wind coming from the north and exerting pressure on part of the vault
facing the windward side can be considered as the most critical wind loading scenario.
Another environmental factor whose possible effects were investigated as a part of this thesis is
temperature changes. Simulation of the temperature transport inside the structure seems to indicate
that temperature variations are mainly confined to layers close to the boundary. Although many cracks
form particularly at the boundary of the sidewalls after the heating phase, most of these cracks close
as a result of a subsequent cooling phase. This could suggest that the collective effect of a
temperature cycle would result in the closing of previously opened cracks. However, it should be noted
that the temperature transport was modelled on a very approximate basis, only considering possible
temperature changes during a single day, and it is likely that a more accurate representation of the
temperature cycle based on monitoring data could yield different results. Nevertheless, the crack width
distribution predicted after the heating phase gives an indication of the possible effects that
Advanced Computational Modelling of Taq-Kisra, Iraq
Erasmus Mundus Programme. 2014/2015 Edition June 2015
78 ADVANCED MASTERS IN STRUCTURAL ANALYSIS OF MONUMENTS AND HISTORICAL CONSTRUCTIONS
temperature variations could have and also suggests that temperature variations could have
contributed to the degradation of material on the outer surface of the side walls of the vault.
It has also been demonstrated that rainwater ingress could significantly contribute to damage in the
vault, particularly in the two vulnerable locations identified on the intrados and on the extrados. The
roofing solution proposed by ProjektyZeman.cz should definitely help reduce this effect since it would
improve the waterproofing of the vault. It should also help reduce temperature variations in the vault.
Another part of the restoration works suggested by ProjektyZeman.cz involved the reconstruction of
part of the vault. Results from simulations indicate that this would initially exert slightly greater strains
in the previous structure and induce more cracking due to the additional weight. However, it does
create a structure with better three-dimensional structural integrity, and hence should improve its
ability to resist additional loads. This was verified only for the worst case wind scenario by finding a
safety factor to quantify the structure’s ability to resist this additional wind loading before and after the
reconstruction. It was found that the structure would be able to resist 8 times the design wind load
after the reconstruction as opposed to 6.6 times before.
The two-dimensional models underestimate damage under design loads when compared to three-
dimensional models, most likely because it cannot take into account the significant loss of material
that has occurred on the western side before the reconstruction. However, it is interesting to note that
when investigating the ultimate limit state related to the most critical wind loading scenario, it predicts
a similar four-hinge failure mechanism at the same load as the three-dimensional model after
reconstruction. Hence, it is possible that the two-dimensional model could be used to give an
indication on the ultimate limit states of the structure after reconstruction.
Further works on the structural condition of the Taq-Kisra monument could involve a more accurate
analysis of the temperature transport based on data from temperature monitoring. This would allow
the actual effect of the temperature variations to be better represented by the model. Furthermore, the
same methodology as employed for the worst case wind scenario in this thesis could be used to
evaluate the safety factors related to the ultimate limit states of the structure under all the wind load
combinations, taking temperature and rainwater ingress into consideration, both before and after the
reconstruction of the vault. This would provide a quantitative representation of the structure’s safety
under particular conditions, which would allow the effect of the reconstruction to be evaluated and
more precise conclusions to be made on the effect of different conditions.
Advanced Computational Modelling of Taq-Kisra, Iraq
Erasmus Mundus Programme. 2014/2015 Edition June 2015
ADVANCED MASTERS IN STRUCTURAL ANALYSIS OF MONUMENTS AND HISTORICAL CONSTRUCTIONS 79
15. REFERENCES
[1] ProjektyZeman.cz. Reconnaissance and sanation of structure Taq-Kisra, Iraq. 2013.
[2] World Public Library. Taq-i-Kisra, World Public Library. [Online] 2015. [Cited: 24 May 2015.]
http://www.worldlibrary.in/articles/Taq-i_Kisra.
[3] Phillips, Louise. Aerial Photograph of the Arch of Ctesiphon, Iraq, 1940 . [Online] 2014.
[Cited: 24 May 2015.] https://theintermediateperiod.wordpress.com/2014/05/13/aerial-
photograph-of-the-arch-of-ctesiphon-iraq-1940/.
[4] Klokner's institute, Czech Technical University in Prague. Expert's Report:Analysis of
samples of bricks and mortar coming from the national monument Taq-Kisra in Iraq. 2013.
[5] Heyman, J. The stone skeleton. 1st. Cambridge : Cambridge University Press, 1995.
[6] Dahmen, J. F. D. and Ochsendorf, J. A. Earth masonry structures: arches,vaults and
domes. [ed.] Matthew Hall, Rick Lindsay and Meror Krayenhoff. Modern earth buildings. s.l. :
Woodhead Pub. Ltd., 2012, pp. 427-460.
[7] Experimental and numerical issues in the modelling of the mechanical behaviour of masonry.
Lourenço, P. B. Barcelona : CIMNE, 1998.
[8] Computations on historic masonry structures. Lourenço, Paulo B. 3, 2002, Progress in
Structural Engineering and Materials, Vol. 4, pp. 301-319.
[9] Lourenço, Paulo B. Recent advances in masonry modelling : micromodelling and
homogenisation. [ed.] Ugo Galvanetto and M. H. Ferri Aliabadi. Multiscale Modeling in Solid
Mechanics : Computational Approaches. London : Imperial College Press, 2009, pp. 251-294.
[10] Hejazi, Mehrdad and Mehdizadeh Saradj, Fatemah. Persian architectural heritage:
Structure. 1st. s.l. : WIT Press, 2014. pp. 13-28.
[11] CIMNE International Centre for Numerical Methods. GiD Reference Manual.
[12] Červenka, Vladimír , Jendele, Libor and Červenka, Jan. ATENA Program Documentation.
Prague : Červenka Consulting, 2014.
[13] Mechanical behaviour of brick masonries derived from unit and mortar characteristics. Binda,
L., Fontana, A. and Frigerio, G. London : Elsevier, 1988. Proceedings of the 8th International
Brick and Block Masonry Conference.
[14] A Practical Equation for Elastic Modulus of Concrete. Noguchi, Takafumi, et al. 5, 2009, ACI
Structural Journal, Vol. 106.
Advanced Computational Modelling of Taq-Kisra, Iraq
Erasmus Mundus Programme. 2014/2015 Edition June 2015
80 ADVANCED MASTERS IN STRUCTURAL ANALYSIS OF MONUMENTS AND HISTORICAL CONSTRUCTIONS
[15] European committee for standardisation. Eurocode 6: Design of masonry structures. 2005.
[16] Laurenço, Paulo B. and Kabele, Petr. SAHC Presentation on modelling of masonry and
homogenisation.
[17] Homogenization of Masonry Using Numerical Simulations. Ma, Guowei, Hao, Hong and Lu,
Yong. 5, 2001, Journal of Engineering Mechanics, Vol. 127, pp. 421-431.
[18] European committee for standardisation. Eurocode 1: Actions on structures - Part 1-4:
General actions - Wind actions. 2010.
[19] Madain, Iraq Weather Averages. Worldweatheronline.com. [Online] 2015. [Cited: 29 June
2015.] http://www.worldweatheronline.com/Madain-weather-averages/Baghdad/IQ.aspx.
[20] American Society of Heating, Refrigerating and Air-Conditioning Engineers, Inc. 2009
ASHRAE Handbook - Fundamentals (I-P Edition). Atlanta : American Society of Heating,
Refrigerating and Air-Conditioning Engineers, 2009.
[21] Time and Date AS. Sunrise and sunset times in Baghdad. Timeanddate.com. [Online] 2015.
[Cited: 29 June 2015.] http://www.timeanddate.com/sun/iraq/baghdad.
[22] 4.6 Al `Amarah, Iraq-Al Kut EARTHQUAKE. Friendly forecast. [Online] 2015. [Cited: 20 June
2015.] http://www.friendlyforecast.com/earthquake/2012/04/4-6-al-amarah-iraq-al-kut-
earthquake-april-20-2012-at-09-19-52-pm/.
[23] Coupled hygro-mechanical multiscale analysis of masonry walls. Castellazzi, G., et al. 2015,
Engineering Structures, Vol. 84., pp. 266-278.
[24] Comprehensive study on mechanical properties of lime-based pastes with additions of
metakaolin and brick dust. Nežerka, V., et al. 2014, Cement and Concrete Research, Vol. 64,
pp. 17-29.
[25] Uniaxial Compressive Strength and Stiffness of Field-Extracted and Laboratory-Constructed
Masonry Prisms. Lumantarna, Ronald, Biggs, David T. and Ingham, Jason M. 4, 2014,
Journal of Materials in Civil Engineering, Vol. 26, pp. 567-575.
[26] An approach to micro-macro modeling of heterogeneous materials. Kouznetsova, V.,
Brekelmans, W. A. M. and Baaijens, F. P. T. 1, 2001, Computational Mechanics, Vol. 27, pp.
37-48.
[27] D'Ayala, Dina F. Numerical modelling of masonry structures. [ed.] Michael Forsyth. Structures
& construction in historic building conservation. s.l. : Wiley, 2008, pp. 151-172.
Advanced Computational Modelling of Taq-Kisra, Iraq
Erasmus Mundus Programme. 2014/2015 Edition June 2015
ADVANCED MASTERS IN STRUCTURAL ANALYSIS OF MONUMENTS AND HISTORICAL CONSTRUCTIONS 81
[28] In-Plane Behavior of Clay Masonry Walls: Experimental Testing and Finite-Element Modeling.
Da Porto, Francesca, et al. 11, 2010, Journal of Structural Engineering, Vol. 136, pp. 1379-
1392.
[29] Mechanics of masonry in compression: Results from a homogenisation approach. Zucchini,
A. and Lourenço, P. B. 2007, Computers & Structures, Vol. 85, pp. 193-204.
[30] Pragmatic multi-scale and multi-physics analysis of Charles Bridge in Prague. Zeman, Jan, et
al. 11, 2008, Engineering Structures, Vol. 30, pp. 3365-3376.
[31] Derivation of 3D masonry properties using numerical homogenization technique. Wu,
Chengqing and Hao, Hong. 11, 2006, International Journal for Numerical Methods in
Engineering, Vol. 66, pp. 1717-1737.
[32] Homogenization of coupled heat and moisture transport in masonry structures including
interfaces. Sýkora, Jan, Šejnoha, Michal and Šejnoha, Jiří. 13, 2013, Applied Mathematics
and Computation, Vol. 219, pp. 7275-7285.
[33] Computational homogenization of non-stationary transport processes in masonry structures.
Sýkora, Jan, et al. 18, 2012, Journal of Computational and Applied Mathematics, Vol. 236,
pp. 4745-4755.
[34] Mesoscopic study on historic masonry. Sejnoha, J., et al. 1, 2008, Structural Engineering and
Mechanics, Vol. 30, pp. 99-117.
[35] A nonlinear homogenization procedure for periodic masonry. Sacco, Elio. 2, 2009, European
Journal of Mechanics - A/Solids, Vol. 28, pp. 209-222.
[36] An orthotropic damage model for the analysis of masonry structures. Pelà, Luca, Cervera,
Miguel and Roca, Pere. 2013, Construction and Building Materials, Vol. 41, pp. 957-967.
[37] Fracture mechanics in the characterisation of brick masonry structures. Olivito, R. S. and
Stumpo, P. 4, 2001, Materials and Structures, Vol. 34, pp. 217-223.
[38] AVERS spol. s r.o. Restoration intention for Taq Kisra. 2013.
[39] AVERS spol. s r.o. History summary of Taq Kisra. 2013.
[40] A Practical Equation for Elastic Modulus of Concrete. Noguchi, Takafumi, et al. 5, 2009, ACI
Structural Journal, Vol. 106.
[41] Centro Ricerche Archeologiche e Scavi di Torino. Activities of the Institute of
Archaeological Sciences and of the Centre for the Restoration of Monuments in Baghdad -
Ctesiphon. [Online] 2006. [Cited: 22 June 2015.]
http://www.centroscavitorino.it/en/progetti/iraq/istituti-ctesifonte.html#.