Embed Size (px)
Citation preview
1
Advanced Cathode Catalysts and Supports for
PEM Fuel CellsMark K. Debe3M CompanyMay 10, 2011
Project ID: FC 001This presentation does not contain any proprietary, confidential, or otherwise restricted information
2011 Annual Merit Review DOE Hydrogen and Fuel Cells and
Vehicle Technologies Programs

2
OverviewTimeline
Project start : April 1, 2007 Project end : ( 86% complete) Original - March 31, 2011 w/No Cost Ext. – Dec. 31, 2011
BarriersA. Electrode and MEA DurabilityB. Stack Material & Mfg CostC. Electrode and MEA Performance
DOE Technical TargetsBudget
Total Project funding $10.742 MM $8.593 MM DOE and FFRDC $2.148 MM 3M share
Allocated in FY10: $ 1,205,281 Invoiced in FY10: $ 1,303,430 Remaining for FY11: $1,439,013
Dalhousie University (J. Dahn, D. Stevens)
JPL (C. Hays) ANL (N. Markovic, V. Stamenkovic) Project Management – 3M
Partners
Electrocatalyst/ MEA 2015 old
2015new
Lifetime Hrs, > 80oC 5000 5000
Mass Activity(A/mg) 0.44 0.44
PGM, (g/KW rated) 0.2 0.125
Performance @ Rated (W/cm2 ) @ 0.8V
10.25
10.25
Additional InteractionsGM Fuel Cell Activities, Nuvera Fuel Cells, other OEM’s, Proton Energy Systems, Giner EC Systems LLC; LBNL, LANL; DTI; ANL-modeling
3M Advanced Cathode Catalysts …… ………………... 2011 DOE Hydrogen Program Review, May 9-13

3
Objectives: Development of a durable, low cost, high performance cathode electrode (catalyst and support), that is fully integrated into a fuel cell membrane electrode assembly with gas diffusion media, fabricated by high volume capable processes, and is able to meet or exceed the 2015 DOE targets.
Relevance and Approach
Approach: Development of advanced cathode catalysts and supports based on 3M’s nanostructured thin film (NSTF) catalyst technology platform. Optimize integration with membrane and gas diffusion media for best overall MEA performance, durability and cost.
Primary Focus Topics for Past Year: Water management improvements for cool/wet transient operation through materials,
electrode structure and boundary condition optimization and understanding. Continued multiple strategies for increasing NSTF catalyst activity, surface area and
durability, with total loadings of < 0.25 mg-Pt/cm2 /MEA. Focus on key NSTF alloy catalyst compositions and process improvements
discovered and developed in 2009/2010. Continued AST’s to benchmark durability of new NSTF MEA configurations Down-select components for new 2010 “best of class” MEA for final stack testing in 2011. Continue fundamental studies of the NSTF catalyst activity for ORR in general, and
methods for achieving the entitlement activity for NSTF catalysts.
3M Advanced Cathode Catalysts …… ………………... 2011 DOE Hydrogen Program Review, May 9-13

4
3/11/114/1/09
Relevance and Approach: Project Timeline and MilestonesBudget Period 1 Budget Period 2
4/1/07 01/01/10
Q1 Q12 Q16Q11
= Go-No Go for Extension of Task
= Go-No Go for Stack Testing
= Go-No Go for Large Area, Single Cell Durability Tests
Task 1.3 – Activity Optimization
Task 1.1 – ECSA Optimization
Task 1.2 – Cat. Fundamentals
Task 2 – Cat. Durability Gains
Task 5.1 PEM Integration, Task 5.2 GDL Integration
Task 3
Task 4 – Support durability
Task 5.3 - Stacks
Q2 Q3 Q4 Q5 Q6 Q7 Q8 Q9 Q10
Task 6 – Start-up, conditioning
Q13 Q14 Q15
9 month no cost extension requested for stack testing.
3M Advanced Cathode Catalysts …… ………………... 2011 DOE Hydrogen Program Review, May 9-13
= Task End

5
Major Technical Accomplishments Since Last Review (6/8/10) Water management for cool/wet transient operation (Task 5.2)
Developed key strategy for reducing cathode flooding at cool temperatures by taking product water out the anode, the “water-out-anode” mode.• Demonstrated that anode GDL was most critical component for water-out-anode
strategy. Significantly improved cool/wet performance at ambient pressure.• Developed cathode gradient catalyst hybrid construction that also dramatically
helps water management at low temperature as well as high temperature.
New catalyst activity and understanding; annealing and process scale-up (Task 1.3) Extended enhanced catalyst deposition process improvement (P1) from pure Pt to
PtCoMn and obtained same dramatic gains in Pt(hkl) grain size and surface smoothing with simpler, more cost effective coating process.
Surface Energy Treatment (SET) process scaled up for roll-to-roll catalyst annealing. Significantly improves ORR activity of some alloys, more than others.
Demonstrated Pt3Ni7 alloy catalyst mass activities in 50cm2 cells ranging from 0.35 +0.06 A/mg to 0.59 + 0.08 A/mg at 3M and GM depending on lab, protocol and loading measurement. Gain in ORR activity derived from SET catalyst annealing process.
Validated Pt3Ni7 alloy peak composition in compositional spread RDE measurements on NSTF whiskers (Dalhousie).
Obtained first confirmation of Pt3Ni7 composition at nm scale of whiskerettes and Pt enrichment of whiskerette tips (JPL/Cal Tech).
Technical Accomplishments and Progress
3M Advanced Cathode Catalysts …… ………………... 2011 DOE Hydrogen Program Review, May 9-13

6
Continued ---- Major Technical Accomplishments Since Last Year
Catalyst and MEA durability with preliminary 2010 “best of class MEAs” (Task 2) OCV Hold: Demonstrated 12 + 5 % OCV voltage loss after 500 hours at 250/200 kPa
H2/air, 90oC, 30%RH. 1.2 V hold: Demonstrated 10 mV loss at 1.5 A/cm2, 10% loss of ECSA and 10 % loss of
mass activity after 400 hr at 1.2 V at 80C, 150kPa, 100% RH.
30,000 CV cycles: Demonstrated 40 mV loss at 1.5 A/cm2, 18% loss of EC surface area, and 48 % loss of mass activity under 30,000, 0.6-1.0-0.6 V cycles at 50mV/sec, 80/80/800C.
Demonstrated load cycling lifetimes of 9000 hours with 2009 “Best of Class” catalyst loadings (0.05 / 0.10 mg/cm2) in non-supported 3M PEM with chemical stabilizers.
Membrane-electrode integration and CCM scale-up (Task 5.1) Produced 49,000 linear ft combined of NSTF substrate, coated catalyst supports, and
catalyst coated membrane for process development, qualification and customer use.
2010 “Best of class” MEA Down-selection for Final Stack Testing (Task 5.3) Defined and implemented major screening programs for integration of all MEA
components for 2010 best of class MEA for final stack testing. Final short stack testing activities initiated at GM.
Technical Accomplishments and Progress
3M Advanced Cathode Catalysts …… ………………... 2011 DOE Hydrogen Program Review, May 9-13

7
Topics Discussed in This Update
Task 1.3 - Catalysts for increased ORR activity and stability As-deposited Pt3Ni7 ( 2 slides) Catalyst deposition process advances: New P1 process vs. standard P4 (4 slides) Surface energy treatment (SET) process for catalyst annealing ( 4 slides)
Task 2 – Durability testing Membrane durability : OCV hold - 90oC, 30% RH, 22.1/14.7 psig H2/air ( 2 slides) Support stability : 1.2 V hold (new DOE test protocol) ( 2 slides) Catalyst stability against dissolution: CV cycling ( 2 slides)
• 0.6 – 1 V, 30,000 cycles at 80oC Load cycling : MEA lifetime ( 1 slide)
Task 5.1/5.2/5.3 – All Aspects of MEA integration and Preparation for Final Stack Testing 2010 “Best of Class” Down-select for final stack testing (5 slides)
• Objective, Process and Schedule• MEA component factors and testing criteria• Example of component screening results
Too much material, only high level summary of the
down-select process.
Technical Accomplishments and Progress
3M Advanced Cathode Catalysts …… ………………... 2011 DOE Hydrogen Program Review, May 9-13

0 10 20 30 40 50 60 70 80 90 1000.00
0.05
0.10
0.15
0.20
0.25
0.30
0.35
0.40
Atomic %(Ni) from XRF Mass-% Pt and NiORR's at 5 secs - graph 21, data 9
Mas
s Ac
tivity
at 9
00m
V (A
/mg Pt
)
PtxNiy
76 %
(a)
XRF measurements by 3M Co.
Utilized XRF and EMP to measure compositions more precisely. Finite peak width can now be resolved with higher resolution (gravimetric only + 5%) Found that exact position of peak depends on method used.
• By XRF, peak appears to be at 76 at.% Ni in as-made catalyst.• By EMP, peak appears to be at 62 at.% Ni in as-made catalyst.• Gravimetric most accurate and in-between, so chose to call this Pt3Ni7.
Pt3Ni7 at peak by gravimetric at.%
Uniqueness of as-deposited PtxNi1-x : x = 0.30Task 1.3 – New catalysts for increased ORR activity and stability
83.65 3.70 3.75 3.80 3.85 3.900.00
0.05
0.10
0.15
0.20
0.25
0.30
0.35
0.40
3.708 Ang.
ORR's at 5 secs - graph 60, data 11
PtNi fcc Lattice Parameter (Angstroms)
Mas
s Ac
tivity
at 0
.9V
(A/m
g Pt)
(b)
ECS Trans., 33 143 (2010), and J. Electrochem. Soc. (Accepted)
3M Advanced Cathode Catalysts …… ………………... 2011 DOE Hydrogen Program Review, May 9-13
Technical Accomplishments and Progress

9
Ni57Pt43
Ni57Pt43
Ni59Pt41Whiskerette tips are Pt-rich vsthe overall Pt30Ni70 seen by SEM/EDS at Cal Tech from the whole whisker. SEM/EDS agrees with as-made gravimetric composition. 5 nm
STEM Z-Contrast taken with HAADF
TEM by Carol Garland (Cal Tech ), Charles Hays (JPL ) Task 1.3 – New catalysts for increased ORR activity and stability
Pt30Ni70 coated NSTF whiskers from 3M production line process P4.
100 nm
SEM/EDS analysis yields Ni70Pt30
3M Advanced Cathode Catalysts …… ………………... 2011 DOE Hydrogen Program Review, May 9-13
Technical Accomplishments and Progress

Catalyst deposition process advances: New P1 vs Std. P4 P4 = Standard alloy roll-to-roll sputter deposition process
P1= Simpler, more cost effective process than P4 Impact: faster; larger grain sizes; smoother surface morphology
Now applied to Pt68Co29Mn3 as well as pure Pt.
SEM shows no difference in P1 vs P4 NSTF catalyst microstructure:
Improved catalysts for increased ORR activity and stability – P1 vs P4
10
PtCoMn by P1 Deposition Process0.05 PtCoMn 0.10 PtCoMn 0.15 PtCoMn 0.18 PtCoMn
0.10 mg/cm2
0.054 mg/cm2
0.146 mg/cm2
0.18 mg/cm2
Technical Accomplishments and Progress
3M Advanced Cathode Catalysts …… ………………... 2011 DOE Hydrogen Program Review, May 9-13

P1 process develops much larger fcc(hkl) grain sizes in NSTF-PtCoMn All [hkl] grain sizes increase with loading, not so with P4 process. TEM shows absence of NSTF “whiskerettes” on sides of whiskers and
larger grains in catalyst coating, consistent with XRD. Aspects of P1 process also providing “annealing –like” conditions.
0.00 0.05 0.10 0.15 0.200
20
40
60
80
100
120
140
160
XRD Exp 044 - graph 2
Pt Loading (mg/cm2)
New P1 PtCoMn (111) New P1 PtCoMn (200) New P1 PtCoMn (220) New P1 PtCoMn (311) New P1 PtCoMn (222) Std P4 PtCoMn (111) Std P4 PtCoMn (200) Std P4 PtCoMn (220) Std P4 PtCoMn (311)
FC(111) Crystallite sizes for PtCoMn: New P1 vs. Std. P4 Processes
Std. P4 PtCoMnProcess
Pt C
ryst
allite
Size
s (A
)
P1 [hkl]’s
P4[hkl]’s
0.054 mg/cm2
0.15 mg/cm2
P1 - PtCoMn
0.010 mg/cm2
11
Grain Sizes by XRD
Technical Accomplishments and ProgressImproved catalysts for increased ORR activity and stability – P1 vs P4
3M Advanced Cathode Catalysts …… ………………... 2011 DOE Hydrogen Program Review, May 9-13

12
Performance Metrics Comparisons, P1 vs P4 Processes for NSTF Cathodes
• Generally similar high current density performance between P1 loading series (0.1, 0.15 and 0.2 mg/cm2) and P4 standard PtCoMn at 0.10 mg/cm2
• P1- PtCoMn cathode performance with 0.05 mg/cm2 is significantly lower than P1-PtCoMn at three higher loadings.
Technical Accomplishments and ProgressImproved catalysts for increased ORR activity and stability – P1 vs P4
GDS polarization curves.
0.740.750.760.770.780.79
0.00 0.05 0.10 0.15 0.20 0.250.67
0.68
0.69
0.70
0.00 0.05 0.10 0.15 0.20 0.250.570.580.590.600.610.620.63
0.830.840.850.860.870.880.89
Cathode Pt Content (mg/cm2)
P1 PtCoMn (P1D10292) 3M 24u P4 PtCoMn (P409272) 3M 20 or 24u
Cell V
olta
ge @
~20m
A/cm
2 (Vol
ts)
Cathode Pt Content (mg/cm2)
Cell V
olta
ge @
0.32
A/cm
2 (Vol
ts)
Cell V
olta
ge @
1A/c
m2 (V
olts
)
Cell V
olta
ge @
1.46
A/cm
2 (V
olts
)
0.0 0.2 0.4 0.6 0.8 1.0 1.2 1.4 1.60.00.10.20.30.40.50.60.70.80.91.0
P1,P4-PtCoMn: 0.10 to 0.2 mg/cm2
FC018957 325.RAW P1 0.05Pt/P1 0.05PtCoMn 3M 24u 2979/2979 Q2 FC018958 325.RAW P1 0.05Pt/P1 0.05PtCoMn 3M 24u 2979/2979 Q2 FC018955 349.RAW P1 0.05Pt/P1 0.10PtCoMn 3M 24u 2979/2979 Q2 FC018956 359.RAW P1 0.05Pt/P1 0.10PtCoMn 3M 24u 2979/2979 Q2 FC018951 295.RAW P1 0.05Pt/P1 0.15PtCoMn 3M 24u 2979/2979 Q2 FC018952 328.RAW P1 0.05Pt/P1 0.15PtCoMn 3M 24u 2979/2979 Q2 FC018953 336.RAW P1 0.05Pt/P1 0.20PtCoMn 3M 24u 2979/2979 Q2 FC018954 359.RAW P1 0.05Pt/P1 0.20PtCoMn 3M 24u 2979/2979 Q2 FC017894 339.RAW P4 0.05PtCoMn/P4 0.10PtCoMn 3M 24u Q2 FC017895 286.RAW P4 0.05PtCoMn/P4 0.10PtCoMn 3M 24u Q2
Cell V
olta
ge (V
olts
)
J (A/cm2)
80/68/68C, 7.35/7.35psig H2/Air, CS(2,100)/CS(2.5, 167)GDS(0.02->2->0.02, 10steps/decade, 120s/pt, 0.4V limit, 0.1maxJstep)Upscan (high->low J) only.
P1-PtCoMn: 0.05 mg/cm2
High to Low J only shown
• P1 – process yields ~10 mV improvement at 0.32 A/cm2 and 5 mV at 1A/cm2 v. P4 process.
• P1 and P4 processed catalysts have very similar performance at very low (0.02) and very high (1.5 A/cm2) J.
GDS polarization curves metrics.
MEA’s: 3M-24 micron PEM, 3M Std. GDL’s
3M Advanced Cathode Catalysts …… ………………... 2011 DOE Hydrogen Program Review, May 9-13

13
ORR Metrics
PtCoMn : Comparison of P1 (0.05 to 0.20 mg/cm2Pt) to P4 (0.10 mg/cm2
Pt)
Technical Accomplishments and ProgressImproved catalysts for increased ORR activity and stability – P1 vs P4
• Steady increase in P1 PtCoMn ORR kinetics as loading increases.• At 0.1 mg/cm2, P1-PtCoMn (squares) has slightly higher SEF and PDS polarization
curve response than P4 PtCoMn (circles), • Absolute and specific activities are very similar.
468
101214
0.00 0.05 0.10 0.15 0.20 0.2505
10152025
0.00 0.05 0.10 0.15 0.20 0.251.0
1.5
2.00.15
0.20
0.25
PDS
J(0.
813V
)(A
/cm
2 -pla
nar)
Surfa
ce A
rea
(cm
2 -Pt/c
m2 -p
lana
r)
ORR
Abs
olut
e Ac
tivity
(mA/
cm2 -p
lana
r)
P1 PtCoMn P4 PtCoMn
Pt Loading (mg/cm2)
ORR
Spe
cific
Activ
ity @
(mA/
cm2 -P
t)
Pt Loading (mg/cm2)
Conclusion: Slight benefits
and no penalties for simpler, faster P1 process for depositing alloys.
3M Advanced Cathode Catalysts …… ………………... 2011 DOE Hydrogen Program Review, May 9-13

14
Surface Energy Treatment (SET) Post processing
SET process effectively anneals the as-made NSTF catalyst layer
Applied to P4 and P1 made catalysts before making CCM’s
Applied so far to as-deposited Pt68Co29Mn3 and Pt3Ni7
Roll-to-roll capable process–scaled up on pilot scale coating line March, 2011.
Technical Accomplishments and Progress
Improved catalysts for increased ORR activity and stability – SET
Pt(111
)
Pt(200
)
Pt(220
)
Pt(311
)
Pt(222
)0
20
40
60
80
100
120
140 Pt3Ni7 as made SET Treated Pt3Ni7 (4)
LA 6 Series Final - graph 8
Appa
rent
Gra
in S
ize (A
ngst
rom
s)
FCC Pt (hkl)
SET process slightly increases Pt(hkl) grain sizes over as-made P1- PtCoMn and P4 - Pt3Ni7
3M Advanced Cathode Catalysts …… ………………... 2011 DOE Hydrogen Program Review, May 9-13
15
6
810
12
14
10
15
20
0.05 0.10 0.15 0.201.41.61.82.02.2
0.05 0.10 0.15 0.200.86
0.87
0.88
0.89
0.160.180.200.220.24
PDS
0.81
3V J
(A/c
m2-
plan
ar)
SEF
(cm
2-Pt
/cm
2-pl
anar
)
ORR
Abs
olut
e Ac
tivity
@10
50s
(mA/
cm2-
plan
ar)
ORR
Spe
cific
Activ
ity@
105
0s (m
A/cm
2-Pt
)
XRF-Determined Cathode Pt Loading (mg/cm2)
As-Made P1 PtCoMn SET P1 PtCoMn
HCT
Mea
s V
@~2
0mA/
cm2
(Vol
ts)
XRF-Determined Cathode Pt Loading (mg/cm2)
0.75
0.76
0.77
0.78
0.64
0.66
0.68
0.70
0.05 0.10 0.15 0.20
0.50
0.55
0.60
0.05 0.10 0.15 0.201.4
1.6
1.8
0.86
0.87
0.88
0.89
XRF-Determined Cathode Pt Loading (mg/cm2)
As-Made P1 PtCoMn SET P1 PtCoMn
HCT
Mea
s V
@~2
0mA/
cm2
(Vol
ts)
HCT
Mea
s V
@0.
32A/
cm2
(Vol
ts)
HCT
Mea
s V
@1A
/cm
2 (V
olts
)
HCT
Mea
s V
@1.
46A/
cm2
(Vol
ts)
XRF-Determined Cathode Pt Loading (mg/cm2)
HCT
Mea
s J
@0.
5VDS
(A/c
m2)
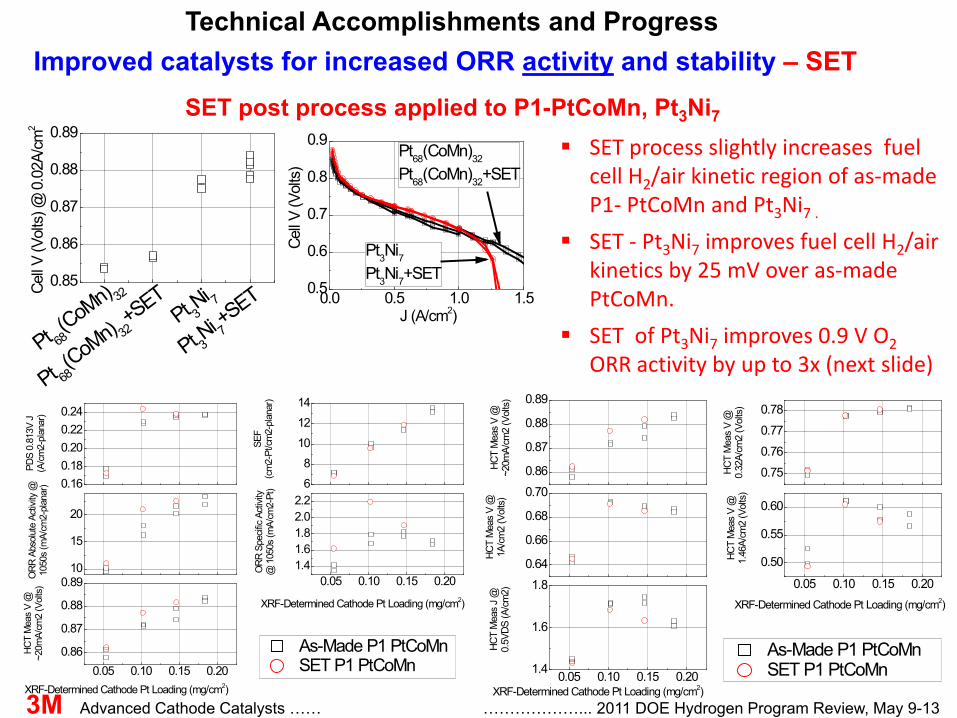
SET process slightly increases fuel cell H2/air kinetic region of as-made P1- PtCoMn and Pt3Ni7 .
SET - Pt3Ni7 improves fuel cell H2/air kinetics by 25 mV over as-made PtCoMn.
SET of Pt3Ni7 improves 0.9 V O2 ORR activity by up to 3x (next slide)
SET post process applied to P1-PtCoMn, Pt3Ni7
0.85
0.86
0.87
0.88
0.89
0.0 0.5 1.0 1.50.5
0.6
0.7
0.8
0.9
Pt 3Ni 7
Pt 3Ni 7
+SET
Pt 68(CoM
n) 32+S
ETCell V
(Vol
ts) @
0.0
2A/c
m2
Pt 68(CoM
n) 32
Pt3Ni7Pt3Ni7+SET
Pt68(CoMn)32
Pt68(CoMn)32+SET
J (A/cm2)Ce
ll V (V
olts
)
Technical Accomplishments and ProgressImproved catalysts for increased ORR activity and stability – SET
3M Advanced Cathode Catalysts …… ………………... 2011 DOE Hydrogen Program Review, May 9-13
0.00 0.03 0.06 0.09 0.12 0.15 0.18 0.210.0
0.1
0.2
0.3
0.4
0.5
0.6
0.7
0.8
0.9Pt3Ni7(A) after surface
energy treatment(open - XRFsolid - ICP)
Pt3Ni7(B) as-madePt3Ni7(A) as-made
PtCo(B)
3
2 Pt68(CoMn)324 3 4
13
1714
Nominally Standard NSTF whiskersMultiple MEA's, Test Stations, LotsNumber of samples = N
10 629
29
Comparison PtNi and PtCoMn Activities-graph 15, data 6
Mas
s Ac
tivity
(A/m
g Pt)
(105
0 se
c)
Pt Loading in PtM or PtCoMn (mg/cm2)
1
DOE Target0.44 A/mgPt
16
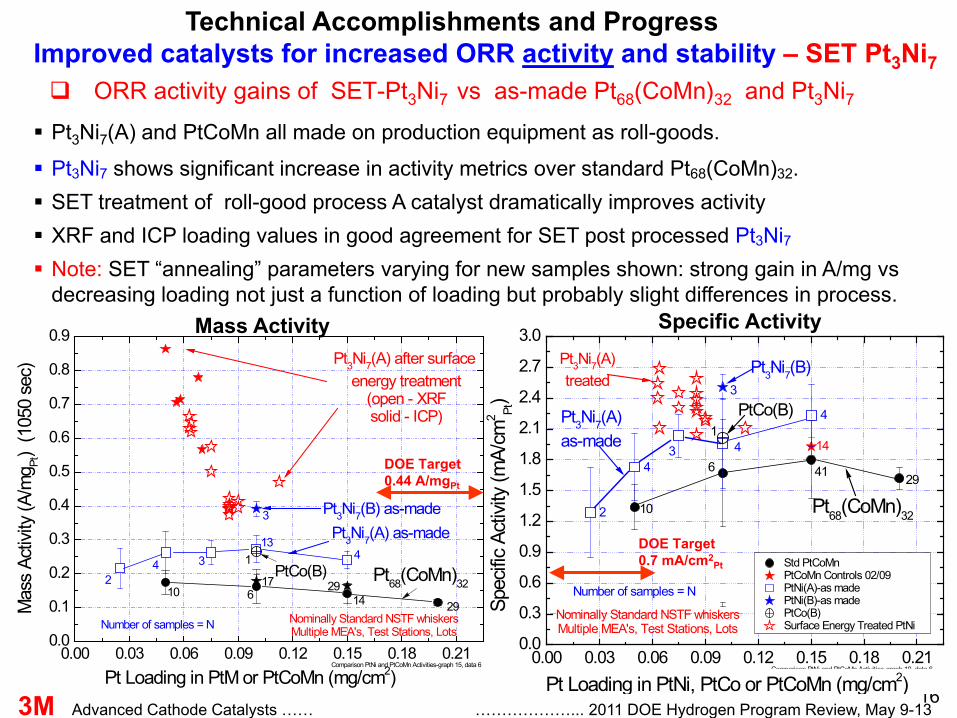
Pt3Ni7(A) and PtCoMn all made on production equipment as roll-goods.
Pt3Ni7 shows significant increase in activity metrics over standard Pt68(CoMn)32. SET treatment of roll-good process A catalyst dramatically improves activity XRF and ICP loading values in good agreement for SET post processed Pt3Ni7 Note: SET “annealing” parameters varying for new samples shown: strong gain in A/mg vs
decreasing loading not just a function of loading but probably slight differences in process.Mass Activity
ORR activity gains of SET-Pt3Ni7 vs as-made Pt68(CoMn)32 and Pt3Ni7
0.00 0.03 0.06 0.09 0.12 0.15 0.18 0.210.0
0.3
0.6
0.9
1.2
1.5
1.8
2.1
2.4
2.7
3.0Pt3Ni7(A)treated
PtCo(B)
Pt3Ni7(B)3
Pt68(CoMn)32
Pt3Ni7(A)as-made
4
434
2
Comparison PtNi and PtCoMn Activities-graph 10, data 6
14
Nominally Standard NSTF whiskersMultiple MEA's, Test Stations, Lots
2941
10
6
Number of samples = N
Spec
ific A
ctivi
ty (m
A/cm
2 Pt)
Pt Loading in PtNi, PtCo or PtCoMn (mg/cm2)
Std PtCoMn PtCoMn Controls 02/09 PtNi(A)-as made PtNi(B)-as made PtCo(B) Surface Energy Treated PtNi
1
Specific Activity
DOE Target0.7 mA/cm2
Pt
Technical Accomplishments and ProgressImproved catalysts for increased ORR activity and stability – SET Pt3Ni7
3M Advanced Cathode Catalysts …… ………………... 2011 DOE Hydrogen Program Review, May 9-13
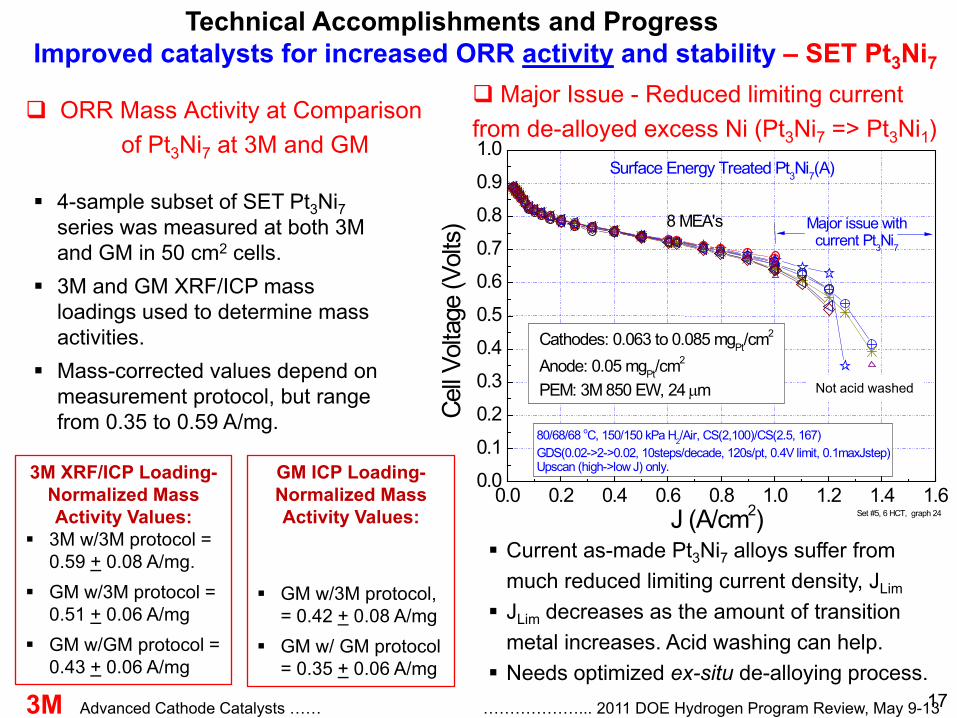
4-sample subset of SET Pt3Ni7series was measured at both 3M and GM in 50 cm2 cells.
3M and GM XRF/ICP mass loadings used to determine mass activities.
Mass-corrected values depend on measurement protocol, but range from 0.35 to 0.59 A/mg.
3M XRF/ICP Loading-Normalized Mass Activity Values:
3M w/3M protocol = 0.59 + 0.08 A/mg.
GM w/3M protocol = 0.51 + 0.06 A/mg
GM w/GM protocol = 0.43 + 0.06 A/mg
ORR Mass Activity at Comparison of Pt3Ni7 at 3M and GM
17
Technical Accomplishments and ProgressImproved catalysts for increased ORR activity and stability – SET Pt3Ni7
0.0 0.2 0.4 0.6 0.8 1.0 1.2 1.4 1.60.0
0.1
0.2
0.3
0.4
0.5
0.6
0.7
0.8
0.9
1.0Surface Energy Treated Pt3Ni7(A)
Set #5, 6 HCT, graph 24
Cell V
olta
ge (V
olts
)
J (A/cm2)
80/68/68 oC, 150/150 kPa H2/Air, CS(2,100)/CS(2.5, 167)GDS(0.02->2->0.02, 10steps/decade, 120s/pt, 0.4V limit, 0.1maxJstep)Upscan (high->low J) only.
Major issue withcurrent Pt3Ni7
Cathodes: 0.063 to 0.085 mgPt/cm2
Anode: 0.05 mgPt/cm2
PEM: 3M 850 EW, 24 µm
8 MEA's
Major Issue - Reduced limiting current from de-alloyed excess Ni (Pt3Ni7 => Pt3Ni1)
Current as-made Pt3Ni7 alloys suffer from much reduced limiting current density, JLim
JLim decreases as the amount of transition metal increases. Acid washing can help. Needs optimized ex-situ de-alloying process.
Not acid washed
GM ICP Loading-Normalized Mass Activity Values:
GM w/3M protocol, = 0.42 + 0.08 A/mg
GM w/ GM protocol = 0.35 + 0.06 A/mg
3M Advanced Cathode Catalysts …… ………………... 2011 DOE Hydrogen Program Review, May 9-13
18
Accelerated Durability Tests with “Preliminary 2010 Best of Class” Down-Selected MEA Components:1. MEA /Membrane durability : OCV hold, 500 hours 90oC, 30% RH, 22.1/14.7 psig H2/air Targets: < 20% loss of OCV after 500 hours
2. Catalyst support stability: 1.2 V hold, 400 hours 1.2 V for 400 hours; 80/80/80 oC; 7.35/7.35 psig H2/N2, 696/1657 SCCM. Targets: < 40% activity; < 30mV loss at 1.5 A/cm2; < 40% loss ECSA
3. Catalyst stability against dissolution: CV cycling, 30,000 cycles 0.6 - 1.0 - 0.6 V; 30,000 cycles at 50 mV/sec; 80/80/80 oC ; 100/100 kPa,
H2/N2; 200/200SCCM. Targets: < 40% activity; < 30mV loss at 0.8 A/cm2; < 40% loss ECSA
4. MEA Load cycling: 3M Protocol, Updated Historical MEA lifetimes 80/64/64oC, Constant Flows (Stoichs: 1.7 to 15); OCV, 0.2 < J < 1 A/cm2
Improved catalysts for increased ORR activity and stability
Technical Accomplishments and Progress
3M Advanced Cathode Catalysts …… ………………... 2011 DOE Hydrogen Program Review, May 9-13

19
MEA definitions Anode catalyst: P1 – Pt or PtCoMn, 0.05 mg/cm2
PEM: 3M-S with additiveCathode Catalyst: P1 - PtCoMn , 0.15 mg/cm2
Cathode GDL’s: 3M standardAnode GDL’s: 3M standard and Type B
OCV Hold at : **
Cell T = 90 oC,
%RH = 30/30%
H 2 inlet = 250 kPa
Air Inlet = 200 kPa
Anode Flow = 696 sccm
Cath. Flow = 1657SCCM
Technical Accomplishments and ProgressImproved catalysts for increased ORR activity and stability – OCV Hold
OCV Hold with “Preliminary 2010 Best of Class” : First five MEA’s exceed x-over 500 hour target. Sixth one allowed to run until x-over = 20 mA/cm2 – reached 1300 hrs on 3/30/11.
3M Advanced Cathode Catalysts …… ………………... 2011 DOE Hydrogen Program Review, May 9-13
0.00.20.40.60.81.0
0102030405060
0102030405060
0 200 400 600 8000
10
20
30
40
0 200 400 600 8000
5
10
15
20
Cell V
olta
ge (V
olts
)
Time (hrs)
OCV Loss at 500 hrs = 12 + 5%Target: < 20% over 500 hrs.
5 MEAs
Anod
e FR
R(µ
g/cm
2 /day
)
Cath
ode
FRR
(µg/
cm2 /d
ay)
Time (hrs)
H 2 Cro
ssov
er(m
A/cm
2 )
X-over(500 hrs) = 13 + 4 mA/cm2
Anode Fluoride Release Rate Cathode Fluoride Release Rate
GDL Type AShor
t Con
d.(m
S/cm
2 )
GDL Type B
** Crossover values are measured at the same operating conditions as used for the OCV hold test (but with N2 on cathode). So crossover and shorting values appear much worse than if we used the prescribed USFCC method (ambient pressure, room T).

0.0 0.2 0.4 0.6 0.8 1.0 1.2 1.4 1.6 1.8 2.00.00.10.20.30.40.50.60.70.80.91.0
After 435 Hours
FC19476 381.RAW Initial FC19476 515.RAW After 79Hours FC19476 662.RAW After 126Hours FC19476 848.RAW After 198Hours FC19476 998.RAW After 247Hours FC19476 1169.RAW After 317Hours FC19476 1304.RAW After 365Hours FC19476 1474.RAW. After 435Hours
C:\Users\US117400\Documents\DOE-6 022511\Reviews for DOE\2011 Annual Merit Review\DOE Catalyst Support Cycle 020111-[graDOEFC19476]
Cell V
olta
ge (V
olts
)
J (A/cm2)
80/59/59 oC, 150/150 kPa H2/Air (OUTLET), CS(1.5,100)/CS(1.8, 167)GDS(0->2->0A/cm2, 0.2A/cm2/step, 180s/pt, 0.4V lim)
DOE Polarization Curve During Catalyst Support Cycle Durability Testing
Initial
20
Polarization curves taken periodically using both DOE and 3M protocols.
Pol. Curves show little effect of 1.2 V hold for 435 hrs.
Metrics exceed Targets.DOE Pol. Curve Protocol3M Std. Pol. Curve Protocol
Technical Accomplishments and ProgressImproved catalysts for increased ORR activity and stability – 1.2 V Hold
400 hrs MEA definitions
Anode catalyst: P1 – PtCoMn, 0.05 mg/cm2
PEM: 3M-Supported with additiveCathode Catalyst: P1 - PtCoMn , 0.15 mg/cm2
Anode/Cathode GDL’s: 3M standard
0.0 0.2 0.4 0.6 0.8 1.0 1.2 1.4 1.6 1.8 2.00.00.10.20.30.40.50.60.70.80.91.0
After 198 Hrs.
After 435 Hours
FC19476 344.RAW Initial FC19476 559.RAW After 79 Hours FC19476 721.RAW After 126 Hours FC19476 892.RAW After 198 Hours FC19476 1042.RAW After 247 Hours FC19476 1347.RAW After 365 Hours FC19476 1518.RAW After 435 Hours
C:\Users\US117400\Documents\DOE-6 022511\Reviews for DOE\2011 Annual Merit Review\DOE Catalyst Support Cycle 020111-[graHCTUSFC19476]
Cell V
olta
ge (V
olts
)
J (A/cm2)
80/68/68 oC, 150/150 kPa H2/Air, CS(2,100)/CS(2.5, 167)GDS(0.02->2->0.02, 10 steps/decade, 120s/pt, 0.4V limit, 0.1maxJstep)
HCT Polarization Curve During Catalyst Support Cycle Durability Testing
Initial
3M Advanced Cathode Catalysts …… ………………... 2011 DOE Hydrogen Program Review, May 9-13

21
ORR and Polarization Curve Metrics vs Number of Hours at 1.2 V
Surface Area loss of 10% exceeds target ( < 40% loss) DOE Pol. curve loss of ~10mV at 1.5 A/cm2 exceeds target ( < 30 mV loss) Specific activity loss of 0% exceeds target ( < 40% loss) Second sample test underway.
Technical Accomplishments and ProgressImproved catalysts for increased ORR activity and stability – 1.2 V Hold
400 hrs
0 100 200 300 4000.775
0.780
0.785 FC19476 FC19624
DOE Curve Metrics During Catalyst Support 1.2 V Hold Durability Testing
Cell V
olta
ge
@ 1
.50A
/cm
2
(Vol
ts)
Cell V
olta
ge
@ 1
.00A
/cm
2
(Vol
ts)
Cell V
olta
ge
@ 0
.20A
/cm
2
(Vol
ts)
0 100 200 300 4000.665
0.670
0.675
0.680
0 100 200 300 4000.56
0.57
0.58
0.59
Hold Time @ 1.20V (Hours)
0 100 200 300 4000.84
0.85
0.86
0.87 FC19476 FC19624
0 100 200 300 4000.665
0.670
0.675
0.680
Cell V
olta
ge
@ 0
.02A
/cm
2
(Vol
ts)
Cell V
olta
ge
@ 1
.00A
/cm
2
(Vol
ts)
0 100 200 300 4000.50
0.55
0.60
Hold Time @ 1.20V (Hours)
HCT Curve Metrics During Catalyst Support 1.2 V Hold Durability Testing
Cell V
olta
ge
@ 1
.46A
/cm
2
(Vol
ts)
0 100 200 300 40010
11
12
13
FC19476 FC19624
Activity Metrics During Catalyst Support 1.2 V Hold Durability Testing
Surfa
ce A
rea
(cm
2 -Pt/c
m2 -p
lana
r)
0 100 200 300 4000.02000.02250.02500.02750.0300
ORR
Abs
olut
e Ac
tivity
(A/c
m2 -p
lana
r)
Hold Time @ 1.20V (Hours)0 100 200 300 400 500
1.71.81.92.02.12.2
ORR
Spe
cific
Activ
ity(m
A/cm
2 -Pt)
3M Advanced Cathode Catalysts …… ………………... 2011 DOE Hydrogen Program Review, May 9-13

22
MEA definition Anode catalyst: P1 - 0.05 mg/cm2 PtCoMn GDL’s: 3M standardPEM: 3M-Supported with additiveCathode Catalyst: P1 - 0.15 mg/cm2 PtCoMn
Test Protocol
30,000 cycles at 50 mV/sec; 0.6 - 1.0 - 0.6 V; 80/80/80 oC 100/100 kPa H2/N2, 200/200SCCM.
DOE Pol. Curve Protocol3M Std. Pol. Curve Protocol
Polarization curves taken periodically using both DOE and 3M (HCT) protocols. Pol. Curves show clear effect of CV cycling through 30,000 cycles.
Technical Accomplishments and ProgressImproved catalysts for increased ORR activity and stability – CV Cycle
0.0 0.2 0.4 0.6 0.8 1.0 1.2 1.4 1.6 1.8 2.00.00.10.20.30.40.50.60.70.80.91.0
After 30kCycles
Initial
FC19514 398.DAT Initial FC19514 NO DATA FC19514 NO DATA FC19514 806.DAT. After 5k cycles FC19514 930.DAT. After 10k cycles FC19514 1052.DAT. After 20k cycles FC19514 1201.DAT After 30k cycles
Cell V
olta
ge (V
olts
)
J (A/cm2)
80/68/68C, 7.35/7.35psig H2/Air, CS(2,100)/CS(2.5, 167)GDS(0.02->2->0.02, 10steps/decade, 120s/pt, 0.4V limit, 0.1maxJstep)
0.0 0.2 0.4 0.6 0.8 1.0 1.2 1.4 1.6 1.8 2.00.00.10.20.30.40.50.60.70.80.91.0
0.70 V at 0.8 A/cm2 initial
After 30k Cycles
FC19514 473.DAT Initial FC19514 541.DAT After 1k cycles FC19514 659.DAT After 3k cycles FC19514 759.DAT After 5k cycles FC19514 883.DAT After 10k cycles FC19514 1004.DAT. After 20k cycles FC19514 1154.DAT. After 30k cycles
Cell V
olta
ge (V
olts
)
J (A/cm2)
80/59/59 oC, 150 kPa H2/Air (OUTLET), CS(1.5,100)/CS(1.8, 167)GDS(0->2->0A/cm2, 0.2A/cm2/step, 180s/pt, 0.4V lim)
Initial
0.66 V at 0.8 A/cm2
3M Advanced Cathode Catalysts …… ………………... 2011 DOE Hydrogen Program Review, May 9-13

23
ORR and Polarization Curve Metrics vs Number of Cycles
Surface area loss of 18% exceeds target (< 40% loss of initial area). DOE Pol. curve loss of 40 mV at 0.8 A/cm2 does not meet target (< 30 mV loss). Mass activity loss of 48% does not meet target (< 40% loss of initial catalytic activity).
Technical Accomplishments and ProgressImproved catalysts for increased ORR activity and stability – CV Cycle
0 5 10 15 20 25 30910111213
Activity Metrics of Series' MEAs
Surfa
ce A
rea
(cm
2 -Pt/c
m2 -p
lana
r)
0 5 10 15 20 25 300.010
0.015
0.020
0.025
0.030
ORR
Abs
olut
e Ac
tivity
(A/c
m2 -p
lana
r)
Number of Cycles (1000's)0 5 10 15 20 25 30
1.0
1.5
2.0
2.5
ORR
Spe
cific
Activ
ity(m
A/cm
2 -Pt)
0 5 10 15 20 25 300.760.770.780.790.80
Cell V
olta
ge
@ 1
.50A
/cm
2
(Vol
ts)
Cell V
olta
ge
@ 1
.00A
/cm
2
(Vol
ts)
Cell V
olta
ge
@ 0
.20A
/cm
2
(Vol
ts)
0 5 10 15 20 25 300.600.620.640.660.68
DOE Polarization Curve Metrics During Electrocatalyst Cycle Durability Testing
0 5 10 15 20 25 300.35
0.40
0.45
0.50
0.55
Number of Cycles (1000's)
0 5 10 15 20 25 300.84
0.85
0.86
0.87
0.88
0 5 10 15 20 25 300.600.620.640.660.68
Cell V
olta
ge@
0.0
2A/c
m2
(Vol
ts)
Cell V
olta
ge
@ 1
.00A
/cm
2
(Vol
ts)
0 5 10 15 20 25 300.40
0.45
0.50
0.55
0.60
Number of Cycles (1000's)
HCT Polarization Curve Metrics During Electrocatalyst Cycle Durability Testing
Cell V
olta
ge@
1.4
6A/c
m2
(Vol
ts)
3M Advanced Cathode Catalysts …… ………………... 2011 DOE Hydrogen Program Review, May 9-13

24
Test Point
J (A/cm2)
Duration (m
in)
Stoich.
1 0.20 5 5
2 0.02 20 15
3 0.80 15 1.7
4 0.80 10 3
5 0.02 20 15
6 0.80 15 1.7
7 0.20 20 5
8 1.00 20 1.7
NSTF MEA’s lifetimes without chemical stabilizers exceeded 5000 hours under load cycling accelerated testing, 7000 hours with reinforcement and no stabilizers. Now completed: 2009 Best of Class MEA (0.05/0.10 mg/cm2 PtCoMn) with
chemical stabilizers in 24 µm 3M PEM, but no reinforcement, reached 9000 hours before cross-over failure.
3M Accelerated Load Cycling Lifetime Testing – Historical Update
SHIVA 1Load Cycle Protocol
80/64/64oC
0
1000
2000
3000
4000
5000
6000
7000
8000
9000
10000
with stabilizer,no reinforcement
2 NSTF MEA's0.2/0.2 mgPt/cm2
Experimental PEM**no stabilizer
4 NSTF MEA's, 0.05/0.1 mgPt/cm2
in 3M-850EW, 20 µm PEM
Shiva Lifetime Comparisons - graph 1
Life
time
to O
CV F
ailu
re a
t 0.8
V (h
ours
)
MEA Type
4 NSTF MEA's0.2/0.2 mgPt/cm2
3M 850 EW, 35µmno stabilizer
7 Pt/C MEA's3M-850 EW, 35 µm
no stabilizer
**GORE-SELECTR membrane prepared by Gore using 3M ionomer. GORE-SELECT and GORE and designs are trademarks of W.L. Gore and Associates, Inc.
2005 - 2008 2009 - 2010
Load cycling at 80/64/64 oC
no stabilizer or
reinforcement
Technical Accomplishments and Progress
3M Advanced Cathode Catalysts …… ………………... 2011 DOE Hydrogen Program Review, May 9-13

Objective: Down-select all final MEA component sets for NSTF 2010 best of class MEA for final stack testing at GM.
MEA component sets in down-selection process: (primary focus ~ 9 months)• Cathode catalyst: composition, loading, deposition process, post process• Anode catalyst: composition and deposition process (finalized)• PEM: thickness, supported vs un-supported, chemical additive levels, etc.• Anode GDL: Backing layer type, MPL properties• Cathode GDL: Backing layer type and MPL properties, Interfacial coatings
Target date for final component sets roll-good manufactured: March 18, 2011.
25
Task 5.1/5.2/5.3 – MEA Integration and Final Stack Testing 2010 “Best of Class” MEA component down-selection process
Technical Accomplishments and Progress
Planned schedule for stack testing: April 1 to Dec. 31, 2011. Testing Objectives:
• Stack #1: 29 cell Rainbow, 6 MEA component sets, ~ 200 hrs, BOL• Stack #2: 29 cell, 1 to 2 MEA component sets, ~ 3300 hrs durability
Final Stack Testing
3M Advanced Cathode Catalysts …… ………………... 2011 DOE Hydrogen Program Review, May 9-13

26
Task 5.1/5.2/5.3 – MEA Integration for Final Stack Testing 2010 Best of Class” MEA component down-selection process
Anode GDL backing types from vendors – multiple series PTFE treatment of anode GDL backing layers MPL basis weights and roll-to-roll coating parameter series Anode GDL shorting mitigation strategies PEM equivalent weights, supported vs non-supported series PEM thickness series 3M standard PEM + additive series 3M-S + additive series Cathode P1-PtCoMn loading series Cathode P1 vs P4 processing conditions SET processing parameters for P1-PtCoMn SET processing parameters for Pt3Ni7 Cathode Hybrid CCB loading series Cathode Hybrid CCB Pt/C type series Cathode Hybrid CCB ink composition series Cathode Hybrid CCB coating process series 3M-S CCM production series Hybrid + Anode GDL combined series SET + P1 combined series Anode catalyst PtCoMn vs Pt series Pt3Ni7 -PEM thickness interaction series CCM lamination material set series many others
Material set studies completed in last half-year as part of MEA down-select process:
Technical Accomplishments and Progress
100’s of
MEA’s
3M Advanced Cathode Catalysts …… ………………... 2011 DOE Hydrogen Program Review, May 9-13

27
Conditioning: Thermal Cycles Potentiodynamic Scans: 75/70/70C, 0/0psig H2/Air, 800/1800SCCM, PDS(10s/pt) ORR Activity: 80/80/80C, 150/150kPa H2/O2, 696/1657SCCM, PSS(0.900VMEAS, 20min). Estimate of
shorting and crossover at same conditions by CV (0.65-0.085V, 2mV/s) ECSA: 70/70/70C, 100/100kPa H2/N2, 800/1800SCCM, CV (0.65-0.085V, 100mV/s). Average of up-
scan and down-scan HUPD charge of short, crossover corrected CVs, 210µC/cm2Pt.
HCT (GDS polarization curves): 80/68/68C, 7.5/7.5psig H2/Air, CS2/2.5, GDS(120s/pt) Startup Transient + Cool Poteniostatic Scans (PSS):
• Precondition: 80C, 30/30% RH, 696/1657SCCM H2/Air, 100/100kPa, GSS(0.05, 10min)• Startup Transient: 30C, 100/100% RH, 100/150kPa,696/1657SCCM H2/Air, PSS(0.4V, 10min)• CoolPSS: xC (x=30->50), 100/100 or 0/0% RH, 100/150kPa, 696/1657SCCM H2/Air, PSS(0.4V,
10min) T Sens: xC (x=80->30->80) 100/100% RH, 100/100kPa, 800/1800SCCM H2/Air, PSS(0.6V, 15min) Reversible Stability:
• Degradation: 90/90/90C, 1044/2485SCCM H2/Air, 200/200kPa, GDS(0->1.5, 120s/pt), 10 hours• Performance Check: HCT
Load Transient: xC, y/y% RH (y=140, 100, or 0), 150/150kPa, 696/1657SCCM H2/Air, PSS(0.6V,5min),GSS(0.02,30s), GSS(1.0,30s)
Humidification Sensitivity: 90C, x/xC dewpoint (x=90,77,65,59,49C), 200/200kPa, CS2/2 H2/Air, GSS(1.2,30min/pt)
Task 5.1/5.2/5.3 – MEA Integration for Final Stack Testing Component Down-Select - General Test Protocols and Criteria Summary
Technical Accomplishments and Progress
3M Advanced Cathode Catalysts …… ………………... 2011 DOE Hydrogen Program Review, May 9-13

HCT-GDS 0.32 A/cm2
HCT-GDS 1.0 A/cm2
HCT-GDS 1.46 A/cm2
HCT-GDS 2.0 A/cm2
Hot/DrySteady State
Hot/WetSteady State
Cool/DrySteady State
Cool/WetSteady State
Hot/DryTransient
Hot/WetTransient
Cool/DryTransient
Cool/WetTransient
Shorting Reversible Stability
CV cycling OCV Hold
Results : PEM additive type A at optimum wt%, vs no-additive
MEA Tested = 0.05 Pt/0.15 PtCoMn, 3M 24 µm, H2315/2979
Better than control
Worse than controlSame as control
Example 1: Outcome of Down-Select Process for Type A PEM additive
Conclusion: Very promising, no negative issues identified. 28
Task 5.1/5.2/5.3 – MEA Integration for Final Stack Testing 2010 Best of Class” MEA component down-selection process
Technical Accomplishments and Progress
3M Advanced Cathode Catalysts …… ………………... 2011 DOE Hydrogen Program Review, May 9-13

Impact of anode GDL on start-up transient and steady state current density at 30 oC, 100% RH and ambient anode pressure:
29
Example 2: Anode GDL Options for improved water management
Task 5.1/5.2/5.3 – MEA Integration for Final Stack Testing 2010 Best of Class” MEA component down-selection process
Anode GDL backing layer is the most significant component affecting control of water flow from cathode to anode and thereby water management with ultra-thin electrodes.
Startup transient current of experimental GDL C is more than 2x better than any other, including those with the Hybrid B on the cathode.
GDL type C resistance still a little too high, so not down-selected for final stacks.0 100 200 300
0.00.2
0.40.6
0.81.0
1.21.4
1.6
GDL C w/MPL on An; Hybrid CCB on Cathode
3M Std. on both Anode and Cathode
3M Std. on Anode ; Hybrid CCB on Cathode
GDL A, no MPL on An. ; 3M Std. on Cathode
GDL A, no MPL on An.; Hybrid CCB on Cath.
GDL C w/MPL; 3M Std. on Cathode
C:\Users\US117400\Documents\DOE-6 110810\FreedomCAR Tech Team Presentations\2011\MRC MS3BE-040US 102010-[Graph9]
J( A
/cm
2 )
Time(s)
30C, 100/100% RH, 0/7.35psig H2/Air, 800/1800SCCM, PSS(0.4V, 10min)
Startup TransientGDL C, no MPL on Anode; 3M Std. on Cathode
Technical Accomplishments and Progress
3M Advanced Cathode Catalysts …… ………………... 2011 DOE Hydrogen Program Review, May 9-13

30
CollaborationsSubcontractors Dalhousie University : Subcontractor. Focused on Pt3Ni7 studies. Funding ended Dec., 2010. ANL (Markovic/Stamenkovic group): Subcontractor, periodic measurements in 2010.
NASA-JPL: Subcontractor, periodic interactions in 2010. TEM, co-deposition of Pt3Ni7 in 2010.
System Integrators and stack manufacturers (partial list) GM Fuel Cell Activities-Honeoye Falls: Collaboration outside of DOE H2 program with materials
generated at 3M under this contract. Multi-year single cell performance and activity validations, stack testing, cold/freeze start and water management evaluations, PEM and GDL integration, durability testing, fundamental modeling studies.
Nuvera Fuel Cells – Large area short stack testing-combining open flow field with NSTF MEAs –collaborative work under Task 3 concluded by mid-2010.
Proton Energy Systems – Collaboration outside of DOE H2 program. Performance testing of NSTF MEAs in electrolyzers. Continuous testing and periodic interaction past year.
Giner EC Systems, LLC – Collaboration outside of DOE H2 program. Performance testing of NSTF MEAs in electrolyzers. Periodic testing and interaction past year.
National Laboratories ANL(Ahluwalia) – Supplied extensive NSTF fuel cell performance data for ANL systems modeling. LBNL, LANL, UTC– Collaborative interactions outside this contract under LBNL project “FC
fundamentals at Low and Subzero temperatures.” NIST – Samples and data supplied to NIST for optical method development for CCM Pt loading
measurement done under FC Manufacturing
3M Advanced Cathode Catalysts …… ………………... 2011 DOE Hydrogen Program Review, May 9-13

31
Future Work ( 3/11/11 to 12/31/11) 2010 Best of Class MEA Down-SelectionConclude current activities to down-select the remaining MEA components for
final stack testing at GM:Define 6 MEA configurations for rainbow short stack BOL testing. Select final MEA configuration for long term testing, Fabricate final MEAs sufficient for both stacks.
Final Stack Testing Secure 9 month no cost extension with Golden, CO office. Deliver MEA media to stack integrator by 3/25/2011 for BOL stack and final
MEA configuration for long term durability stack testing, targeting 3300 hrs by 12/31/11.
Execute testing plan.
Continue limited effort on one or two key issues related to anode GDL for water management and long term irreversible voltage decay.
Prepare and Submit Final Report3M Advanced Cathode Catalysts …… ………………... 2011 DOE Hydrogen Program Review, May 9-13

32
Characteristic Units Targets2015
Status: Values for roll-good CCM w/ 0.15mgPt/cm2 per MEA or as stated
PGM Total Content gPt/kWe rated in stack
0.125 < 0.18gPt/kW for cell V < 0.67 Vin 50 cm2 cell at 150kPa inlet.
0.19gPt/kW, 400 cm2 GM short stack
PGM Total Loading mg PGM / cm2
total0.125 0.15 – 0.20, A+C with current PtCoMn
alloy
Mass Activity (150kPa H2/O2 80oC. 100% RH, 1050 sec)
A/mg-Pt @ 900 mV, 150kPa O2
0.44 0.24 A/mg in 50 cm2 w/ PtCoMn > 0.43 A/mg in 50 cm2 with SET Pt3Ni7
Specific Activity (150 kPa H2/O2 at 80oC, 100% RH)
µ A/cm2-Pt @ 900 mV
720 2,100 for PtCoMn, 0.1mgPt/cm2
2,500 for new Pt3Ni7, 0.1mgPt/cm2
Durability: 30,000 cycles 0.6 -1.0V, 50mV/sec,80/80/800C, 100kPa,H2/N2
- mV at 0.8 A/cm2
- % ECSA loss - % Mass activity
< 30mV< 40% < 40 %
- 40 mV loss at 1.5 A/cm2
- 18% loss ECSA- 48 % loss mass activity
Durability: 1.2 V for 400 hrs. at 80oC, H2/N2, 150kPa, 100% RH
- mV at 1.5 A/cm2
% ECSA loss% Mass activity
< 30mV < 40% < 40%
- 10 mV loss at 1.5 A/cm2
-10% loss ECSA-10 % loss mass activity
Durability: OCV hold for 500 hrs.250/200 kPa H2/air, 90oC, 30%RH
H2 X-over mA/cm2
% OCV loss< 20
< 20 %
13 + 4 mA/cm2 at 500 hrs (5 MEAs)-12 + 5 % OCV loss in 500 hrs
Durability under Load Cycling(membrane lifetime test)
Hours, T < 80oCHours, T > 80oC
50005000
9000 hrs, 3M PEM (20µm, 850 EW w/ stabilizers), 50cm2 , 80/64/64 oC
2000 hrs (OEM short stack,0.1/0.15)
Project Summary : Status Against DOE Targets – March, 2011 (blue = new)
3M Advanced Cathode Catalysts …… ………………... 2011 DOE Hydrogen Program Review, May 9-13

33
Technical Back-Up Slides
3M Advanced Cathode Catalysts …… ………………... 2011 DOE Hydrogen Program Review, May 9-13

34
Composition APt0.27Ni0.73
Composition BPt0.27Ni0.73 on Pt
0 40 80 1200
5
10
15
20
25
30
35
40
SEF
from
Des
orpt
ion B
ranch
of CV (
cm2/c
m2)
0 40 80 120CV Cycle Number
0 40 80 120
Composition CPt0.27Ni0.73 on Pt0.75Ni0.25
0.10 mg Pt/cm2
Surface area enhancement factor (SEF) from Hupd RDE measurements of the three NSTF alloy and pure Pt coated whisker compositions A, B, C on GC disks
Schematic illustration of three NSTF compositions prepared and tested on RDE’s
Technical Back-Up SlideTask 1.3 – New catalysts for increased ORR activity and stability –
Pt3Ni7 work at Dalhousie University
CV’s: 30-1100-30 mV vs RHE at 50 mV/sec
Pt0.27Ni0.73, 0.10 mg Pt/cm2
Pt0.75Ni0.25, 0.07 mg Pt/cm2
Pt0.27Ni0.73, 0.03 mg Pt/cm2
Pt0.75Ni0.25, 0.07 mg Pt/cm2
Pt0.27Ni0.73, 0.03 mg Pt/cm2
Pt, 0.07 mg Pt/cm2
Pt0.27Ni0.73, 0.03 mg Pt/cm2
Pt, 0.07 mg Pt/cm2
Pt0.27Ni0.73, 0.03 mg Pt/cm2
A
B
C
Single layer
Bi-layer
Bi-layer
ECSA of Composition A is much larger than bi-layer constructions B or C. Results imply a highly porous Pt-skin type model in which Ni dissolution occurs throughout the deposited
film creating a high catalytic surface area. Suggests all the area is Hupd active. Ni dissolution from the entire Pt3Ni7 layer is required to generate the high surface area and activity. Not all of the Ni is however lost. The results suggest that the remaining Ni modifies the electronic
properties of the Pt surface to increase the activity of the catalytic sites relative to Pt.
Uniqueness of as-deposited PtxNi1-x : x = 0.30
Gary Chih-Kang Liu, D.A. Stevens, J. C. Burns, R.J. Sanderson, George Vernstrom, R.T. Atanasoski, M.K. Debe and J. R. Dahn, “Oxygen reduction activity of dealloyed Pt1-xNix catalysts,” J. Electrochem. Soc., accepted for publication
3M Advanced Cathode Catalysts …… ………………... 2011 DOE Hydrogen Program Review, May 9-13

35
Improved Anode GDL + Thinner Membrane significantly improves performance at on Low Temperature and Ambient Pressure.
Performance in bottom right slide similar to that of MEA with dispersed electrodes.
0.0 0.2 0.4 0.6 0.8 1.0 1.2 1.4 1.60.0
0.2
0.4
0.6
0.8
1.0NSTFC MEA, 50 cm2 Cell
FC12225-graph7
Cell V
olta
ge (V
)
J (A/cm2)
FC12225-469 30°C FC12225-471 35°C FC12225-473 40°C FC12225-475 45°C FC12225-477 50°C FC12225-479 60°C FC12225-481 70°C
0.0 0.2 0.4 0.6 0.8 1.0 1.2 1.4 1.60.0
0.2
0.4
0.6
0.8
1.0
FC018963 334.DAT 80C FC018963 336.DAT 75C FC018963 338.DAT 70C FC018963 340.DAT 65C FC018963 342.DAT 60C FC018963 344.DAT 55C FC018963 346.DAT 50C FC018963 348.DAT 45C FC018963 350.DAT 40C FC018963 352.DAT 35C FC018963 354.DAT 30C
Anode: P1 0.05Pt. Cathode: P4 0.15PtCoMn. PEM: Ultra-thin.Anode, Cathode GDLs: MRC CS3BE-040US/2979. Cell: Oscar.
Cell V
olta
ge (V
olts
)
J (A/cm2)
xC, 100/100% RH 0/0psig H2/Air, 800/1800SCCMPDS(0.25V->0.85V, 0.05V/step, 10s/step)
Potentiodynamic Consant Flow Curves v. Cell Temperature
35 µm PEM, 0.2 mg/cm2 PtCoMn3M Std. GDLs on anode/cathode
13 µm PEM, 0.15 mg/cm2 PtCoMnGDL C on anode, 3M Std. GDL on cathode
Example 3: PEM Factors for CCM parameter screening in 50 cm2 fuel cell tests
Task 5.1/5.2/5.3 – MEA Integration for Final Stack Testing 2010 Best of Class” MEA component down-selection process
2010: 30-80oCAmbient Pressure
2005: 30-70oC
Technical Back-Up Slide
3M Advanced Cathode Catalysts …… ………………... 2011 DOE Hydrogen Program Review, May 9-13

36
Example 4: Cathode GDL Options
Task 5.1/5.2/5.3 – MEA Integration for Final Stack Testing 2010 Best of Class” MEA component down-selection process
Cathode GDL Options: Backing type: Fixed, 3M Standard Hydrophobic treatment - % PTFE MPL type – probably fixed Hybrid vs non-hybrid (Hybrid CCB)
• Pt/C type and loading, I/C ratio, • C diluent fraction• Coating chemistry and method
Deciding Factors: Water management metrics (enhanced
water out the cathode) ORR metrics HCT metrics (Mass transfer overpotential) at
high temperature Pt loading cost/benefit ratio Accelerated stress tests
Anode = NSTF Pt, 0.05 mg/cm2
Cathode = 3M Gradient = NSTF + Pt/C (CCB on 3M GDL) PEM = 3M 20 µm, Anode GDL = MPL-free type A
used as-received
NSTF 2009 Best of ClassCCM: 0.05/ 0.10 mg/cm2
3M20 µm
850 EW
Anode GDL
No PTFE or MPL
Cathode CCB3M GDL with <0.05 mg/cm2
Pt/C
Hybrid Type B: US 6,238,534
Technical Back-Up Slide
3M Advanced Cathode Catalysts …… ………………... 2011 DOE Hydrogen Program Review, May 9-13

37
Example 4: Cathode GDL Options: Hybrid B: 30oC Steady State vs. PAnode
• Hybrid B MEA’s show significant low Temperature benefit relative to NSTF CCM-only.• Water management effects of cathode CCB and Anode GDL, PA appear primarily additive:
- CCB helps take water out cathode- Anode GDL and low anode pressure help take water out the anode.
Task 5.1/5.2/5.3 – MEA Integration for Final Stack Testing 2010 Best of Class” MEA component down-selection process
Benefit of water out the cathode
Benefit of water out the anode
0 50 100 150 2000.0
0.4
0.8
1.2
1.6
0.05PtCoMn/NSTF / 0.10PtCoMn/NSTF+0.05Pt/CH2315 / 2979
30/0/0C, x/150kPa H2/Air,800/1800SCCM, PSS(0.4V,10-15min)
0.05PtCoMn/NSTF / 0.10PtCoMn/NSTFH2315 / 2979
C:\Documents and Settings\us314230\My Documents\publications\2010 ECS\PAPER Water Management - SubAtm Anode SteadyState 020810-[Graph22]
J (A
/cm
2 )
Anode P (kPa)
0.05PtCoMn/NSTF / 0.10PtCoMn/NSTF2979/2979
Anode GDL type A; Cathode Hybrid B
Anode GDL type A; Cath. GDL 3M Std.
3M Std. GDL both An./Ca.
Technical Back-Up Slide
3M Advanced Cathode Catalysts …… ………………... 2011 DOE Hydrogen Program Review, May 9-13

Strategies to increase the fraction of water moving out the anode and decrease the liquid water moving out the cathode are most effective for increasing cool, wet limiting currents.• Natural NSTF hydrophilic property enables this approach• Best strategy in principle for any MEA if it can be done – harvests product water to
humidify PEM, decreases O2 mass transport impedance on the cathode.
Novel effect of sub-atmospheric anode pressure (PA ) operation demonstrated:• Several-fold increase in room temperature limiting current• PA effect sensitive to temperature, anode GDL properties. Useful for screening GDL’s.• Conventional “thick” dispersed electrode MEAs do not show same benefit.• Water balance mechanistic study
– Reduced anode pressure decreases total water flux out cathode.– Simple model suggests performance improvement due to decreased liquid product
water flux through cathode GDL.
Material Factors- Anode GDL backing layer appears to be most significant component affecting
control of water flow from cathode to anode at ambient pressure.- Continuing to screen new vendor supplied GDL backing layers and 3M MPL’s for best
performance and minimal negative factors such as shorting. 38
Task 5.1/5.2/5.3 – MEA Integration for Final Stack Testing 2010 Best of Class” MEA component down-selection process
Low Temperature Water Management Summary
Technical Back-Up Slide
3M Advanced Cathode Catalysts …… ………………... 2011 DOE Hydrogen Program Review, May 9-13

NSTF CCM Scale-up Status: Process improvements continuously being implemented for roll-good CCM
component fabrication, quality and cost improvements.
Produced 202,000 linear ft combined of NSTF substrate, coated catalyst supports, and catalyst coated membrane for process development, qualification and customer use since tracking started in 2006.
Thru Feb. 10 2011
MCTSCatalyst Coated MCTS
+ CCM 202,000 lin ft
Task 5.1 NSTF/PEM Integration and Process Scale-up Related Activities
392006 2007 2008 2009 2010 20110
10000
20000
30000
40000
50000
60000
70000 Combined total volume of NSTF substrate, support and catalyst semi-finished and CCM roll-goods.
Tota
l Rol
l-goo
d Fo
otag
e/ye
ar (l
n ft)
Year
Through Present
3M Advanced Cathode Catalysts …… ………………... 2011 DOE Hydrogen Program Review, May 9-13
Technical Back-Up Slide