Embed Size (px)
Citation preview

Advanced Architectures and Control Concepts for
MORE MICROGRIDS
Contract No: SES6-019864
WORK PACKAGE C Alternative Designs for Microgrids
DC2: Novel protection systems for microgrids
Final Version
Partial Report

Document Information
Title: Novel protection systems for microgrids
Date: 11.11.2009
Task(s): TC2 Technical requirements for network protection
Coordination: Alexandre Oudalov1 [email protected] Authors: Alexandre Oudalov1 [email protected] Antonio Fidigatti2 [email protected] Thomas Degner3 [email protected] Boris Valov3 [email protected] Christian Hardt4 [email protected] José Miguel Yarza5 [email protected] Rachel Li6 [email protected] Nick Jenkins6 [email protected] Bieshoy Awad6 [email protected] Frank van Overbeeke7 [email protected] Nikos Hatziargyriou8 [email protected] Maria Lorentzou8 [email protected]
1 ABB Switzerland Ltd., Corporate Research Switzerland 2 ABB SACE S.p.A Italy 3 Fraunhofer IWES (former ISET) Germany 4 SMA Germany 5 ZIV Spain 6 University of Manchester UK 7 EMforce Netherlands 8 NTUA Greece
Access: Project Consortium
European Commission X PUBLIC
Status: For Information Draft Version Final Version (internal document) Submission for Approval (deliverable) X Final Version (deliverable, approved on. )

Summary This report summarizes a work conducted in the task TC2 focused on technical requirements for
network protection in microgrids.
Protection must respond to both utility grid and Microgrid faults. If the fault is on the utility grid, the
desired response may be to isolate the Microgrid from the main utility as rapidly as necessary to
protect the Microgrid loads. If the fault is within the Microgrid, the protection coordinator isolates the
smallest possible section of the Microgrid to eliminate the fault. In order to cope with the bi-
directional energy flow due to large numbers of microsources new protection schemes are required. In
this task the following areas have been investigated:
ABB reviewed and re-evaluated the network protection paradigm to suit Microgrid operation. A
possible increase of fault levels can be another symptom of directly coupled DER. Many generators
will contribute to faults and may push the system fault level past the duties of switchgear. Replacing
switchgear is a costly task. ABB studied the possibility of avoiding this cost through the use of
advanced protection devices such as fault current limiters and self-adjusting protection devices.
Fraunhofer IWES (former ISET) and SMA studied the enhancement of the central electronic switch
developed in the Microgrids-project by latest impedance measurement techniques with low and
additional monitoring and communication capabilities. Fraunhofer IWES also investigated novel
protection schemes using real-time data of the medium voltage level and offline data of the energy
management systems of the Microgrids. Tests have been carried out in the DeMoTec laboratory with
an intelligent protection device.
EMforce has investigated the development of low-cost electronic protection devices particularly
suited for LV networks with low fault levels.
ZIV studied the possibilities of performing the required coordinated behaviour of the whole system in
the case of faults in various locations and specifically identified the opportunities to share data
between local generator/load units and network protections in order to allow for an optimal operation
of the system, clearing selectively during the incidents or the faults, as well as allowing the proper
sequences for the restoration of the normal service conditions.
ICCS/NTUA and UMIST revisited the earthing requirements for the network, the sources and the
consumer premises to ensure the safety of operation in either mode (grid-tied and isolated). UMIST
also evaluated the effect on network regulating means, such as the load tap changers of transformers,
and proposed new requirements and control strategies.

Table of contents
1 Adaptive Protection and Fault Current Limiters (ABB Corporate Research) ........................ 7 1.1 Summary .................................................................................................................................. 7
1.2 Introduction .............................................................................................................................. 8 1.2.1 General information about Microgrids ........................................................................................................... 8 1.2.2 Technical challenges in Microgrids ................................................................................................................ 9
1.3 Protection Issues in Microgrid ............................................................................................... 11 1.3.1 Distribution system protection ..................................................................................................................... 11 1.3.2 Over-current distribution feeder protection .................................................................................................. 13 1.3.3 Over-current distribution feeder protection and DERs ................................................................................. 14 1.3.4 Grid connected mode with external faults (F1, F2) ...................................................................................... 14 1.3.5 Grid connected mode with fault in the microgrid (F3) ................................................................................. 17 1.3.6 Grid connected mode with fault in the end-consumer site (F4) .................................................................... 17 1.3.7 Islanded mode with fault in the microgrid (F3) ............................................................................................ 18 1.3.8 Islanded mode and fault in the end-consumer site (F4) ................................................................................ 18 1.3.9 Conclusive remarks ...................................................................................................................................... 18
1.4 Adaptive Protection for Microgrid ......................................................................................... 19 1.4.1 Centralized adaptive protection system ........................................................................................................ 20 1.4.2 Off-line analysis ........................................................................................................................................... 21 1.4.3 On-line operation ......................................................................................................................................... 23 1.4.4 Directional interlock ..................................................................................................................................... 24
1.5 Simulation Results ................................................................................................................. 26 1.5.1 Microgrid with DERs switched off in the grid mode ................................................................................... 26 1.5.2 Microgrid with synchronous DERs switched on in the grid and islanded modes ........................................ 32
1.6 Fault Current Limiters in Microgrids ..................................................................................... 36 1.6.1 Increase of fault current levels...................................................................................................................... 36 1.6.2 Fault current limitation technologies ............................................................................................................ 37 1.6.3 Is-limiter ....................................................................................................................................................... 40 1.6.4 Liquid metal fault current limiter ................................................................................................................. 40
1.7 Conclusions ............................................................................................................................ 44
1.8 References .............................................................................................................................. 45
1.9 Appendix ................................................................................................................................ 47
2 Novel Protection System for Microgrids (Fraunhofer IWES) ................................................. 48 2.1 Summary ................................................................................................................................ 48
2.2 Introduction ............................................................................................................................ 48
2.3 State of the art ........................................................................................................................ 49 2.3.1 Effect of DER on system protection – a review on proposed protection concepts for distribution networks49 2.3.2 Challenges for system protection in Microgrids ........................................................................................... 52
2.4 Analysis of different fault situations – definition of required protection behaviour ............. 54 2.4.1 Microgrid configuration and relevant data ................................................................................................... 55 2.4.2 Short-circuit currents for interconnected and islanded operation ................................................................. 57 2.4.3 Fault in area between main grid and Microgrids .......................................................................................... 57 2.4.4 Fault in low voltage connection point of Microgrid ..................................................................................... 58 2.4.5 Faults inside Microgrid ................................................................................................................................ 59 2.4.6 Faults in case of islanded operation of Microgrid ........................................................................................ 61

2.5 Development of novel protection scheme and device ............................................................ 61 2.5.1 General requirements for adaptive protection .............................................................................................. 61 2.5.2 Protection scheme and its units .................................................................................................................... 62 2.5.3 Online communication between units .......................................................................................................... 63 2.5.4 Software and hardware implementation ....................................................................................................... 63 2.5.5 Test procedure .............................................................................................................................................. 71 2.5.6 Proof of protection adaptability – results ..................................................................................................... 73 2.5.7 Evaluation of the test .................................................................................................................................... 75 2.5.8 Study of possibility for enhancement of the central static switch ................................................................. 76
2.6 The developed protection scheme in view of German Grid Codes........................................ 80
2.7 The developed protection scheme in view of Virtual Power Plants, Virtual Utilities and
Smart grids ......................................................................................................................................... 83
2.8 Conclusion .............................................................................................................................. 84
2.9 References .............................................................................................................................. 85
3 Protection Device for Low Voltage Network with Low Fault Levels (EMforce) ................... 90
4 Novel Protection System for Microgrid (ZIV) ........................................................................ 128 4.1 Introduction .......................................................................................................................... 128
This chapter contains information which has not been released for public disclosure. Please refer to the paper “ Fault Current Source to Ensure the Fault Level in Inverter-Dominated Networks” which is available from the Microgrids website. The paper presents a summary of the work in this chapter. Should you be interested in more technical details, please contact the author via [email protected]

4.2 Protection Challenges ........................................................................................................... 130
4.3 Microgrid Simulation Model for Test Purposes .................................................................. 132
4.4 Tests Description .................................................................................................................. 134
4.5 Innovative Protection Methods ............................................................................................ 134 4.5.1 Adaptive Protection Systems ...................................................................................................................... 134 4.5.2 IED‘s Requirements ................................................................................................................................... 135 4.5.3 Calculation of Protection Settings .............................................................................................................. 136 4.5.4 Communications Architectures and Protocols............................................................................................ 137 4.5.5 IEC 61850. Application of Communications between Smart IEDs ............................................................ 140 4.5.6 IEC 61850, a Cost-efficient Solution ......................................................................................................... 141
4.6 IEC 61850. More Value for DER in Distribution System ................................................... 143 4.6.1 DER‘sCommunication Systems ................................................................................................................. 144 4.6.2 Active Distribution and DER ..................................................................................................................... 144 4.6.3 Next Steps for IEC 61850 .......................................................................................................................... 145
4.7 Conclusions .......................................................................................................................... 145
4.8 Bibliography ......................................................................................................................... 146
5 Active Islanding for SELFSYNC controlled inverters (SMA)............................................... 146 5.1 Introduction .......................................................................................................................... 146
5.2 SELFSYNC® - control ........................................................................................................ 148
5.3 Description of the active Anti-Islanding scheme ................................................................. 149
5.4 References ............................................................................................................................ 153
6 EMTP application for investigating the performance of LV earthing systems under impulse excitation (NTUA) .............................................................................................................................. 154
6.1 Introduction .......................................................................................................................... 154
6.2 Earthing for fault and lightning protection .......................................................................... 155 6.2.1 Fault Conditions ......................................................................................................................................... 155 6.2.2 Lightning strike .......................................................................................................................................... 155
6.3 Application to realistic study case network ......................................................................... 156 6.3.1 Description of the study case network ........................................................................................................ 156 6.3.2 Calculation results ...................................................................................................................................... 158
6.4 Discussion of the results ...................................................................................................... 164
6.5 Conclusions .......................................................................................................................... 165
6.6 References ............................................................................................................................ 165
6.7 Appendix .............................................................................................................................. 166
7 Grounding System Analysis of Multiple Microgrids (University of Manchester) ............... 168 7.1 Introduction .......................................................................................................................... 168
7.2 Models of Microgrids used for calculation of fault currents and grounding system analysis169
7.3 Methodology ........................................................................................................................ 171 7.3.1 Safety criterion ........................................................................................................................................... 172 7.3.2 Touch voltage and step voltage .................................................................................................................. 172

7.4 Fault current calculation of multiple Microgrids ................................................................. 177
7.5 Grounding system analysis ................................................................................................... 177 7.5.1 Grounding system design ........................................................................................................................... 177 7.5.2 5.2 Performance evaluation of grounding system of Microgrids ................................................................ 179
7.6 Conclusion ............................................................................................................................ 181
7.7 References ............................................................................................................................ 181
8 On Load Tap Changer and Microgrids Voltage Control Strategies (University of Manchester) ........................................................................................................................................ 182
8.1 Introduction .......................................................................................................................... 182
8.2 On Load Tap Changers ........................................................................................................ 183 8.2.1 Mechanical tap changers ............................................................................................................................ 183 8.2.2 Solid state tap changers .............................................................................................................................. 184 8.2.3 Vacuum switch and solid state based tap changers .................................................................................... 185
8.3 Voltage Control in Distribution Networks ........................................................................... 187
8.4 Effect of Distributed Generation on Voltage Control of On-load Tap Changer .................. 189
8.5 Voltage Control Schemes ..................................................................................................... 190 8.5.1 Automatic voltage reference setting ........................................................................................................... 191 8.5.2 Supervisory control .................................................................................................................................... 191 8.5.3 The probabilistic load flow method ............................................................................................................ 191
8.6 Voltage Control for Microgrids ........................................................................................... 192 8.6.1 Voltage control scheme .............................................................................................................................. 192 8.6.2 Case studies ................................................................................................................................................ 196
8.7 Conclusions .......................................................................................................................... 200
8.8 References ............................................................................................................................ 201
8.9 Appendices ........................................................................................................................... 202 8.9.1 Appendix A ................................................................................................................................................ 202 8.9.2 Appendix B ................................................................................................................................................ 203
1 Adaptive Protection and Fault Current Limiters
(ABB Corporate Research)
1.1 Summary
Microgrids comprise low voltage distribution systems with distributed energy resources (DER) and
controllable loads which can operate connected to the medium voltage grid or islanded in a controlled
coordinated way. This concept aims to move from ―connect and forget‖ philosophy towards an
integration of DER. Microgrids provide clear economic and environmental benefits for end-
customers, utilities and society. However, their implementation poses great technical challenges, such

as a protection of microgrid. Local generation in a combination with a possible islanded operation can
pose protection sensitivity and selectivity problems in case of fault depending on the relay settings.
This report presents a novel adaptive microgrid protection system using digital relaying and advanced
communication. The protection system is based on a centralized architecture where relay protection
settings are modified centrally with regard to a microgrid operating condition.
In addition an effect of high penetration of synchronous DERs on fault current levels in microgrid is
estimated. Possible solution based on liquid metal fault current limiter is presented and discussed.
1.2 Introduction
1.2.1 General information about Microgrids
Power systems currently undergo considerable change in operating requirements – mainly as a result
of deregulation and due to an increasing amount of distributed energy resources (DER). In many cases
DER include different technologies that allow generation in small scale (micro-sources) and some of
them take advantage of renewable energy resources (RES) such as solar, wind or hydro energy.
Having micro-sources close to the load has the advantage of reducing transmission losses as well as
preventing network congestions. Moreover, the chance of having a power supply interruption of end-
customers connected to a low voltage (LV) distribution grid (in Europe 230 V and in the USA 110 V)
is diminished since adjacent micro-sources, controllable loads and energy storage systems can operate
in the islanded mode in case of severe system disturbances (in fact a power delivery can be fully
independent of the state of the main grid). This is known today as a microgrid [Lasset2002,
Hatziatr2007]. The typical Microgrid has the same size as a low voltage distribution feeder and will
rare exceed a capacity of 1 MVA and a geographical span of 1 km. Usually more than 90% of low
voltage domestic customers are supplied by underground cable when the rest is supplied by overhead
lines. The Microgrid often provides both electricity and heat to the consumers by means of combined
heat and power plants (CHP), gas turbines, fuel cells, photovoltaic (PV) systems, wind turbines, etc.
The energy storage systems usually include batteries and flywheels.
A single Microgrid is depicted in Figure 1 where the microgrid is connected to the main medium voltage (MV) grid when the circuit
breaker (CB) CB1 is closed (the circuit breakers CB3.2 and 6.2 are normally open). Several
neighbouring low voltage microgrids can be inter-connected via a medium voltage grid or directly via
low voltage links. This operating topology is known is multi-microgrids (Figure 2).
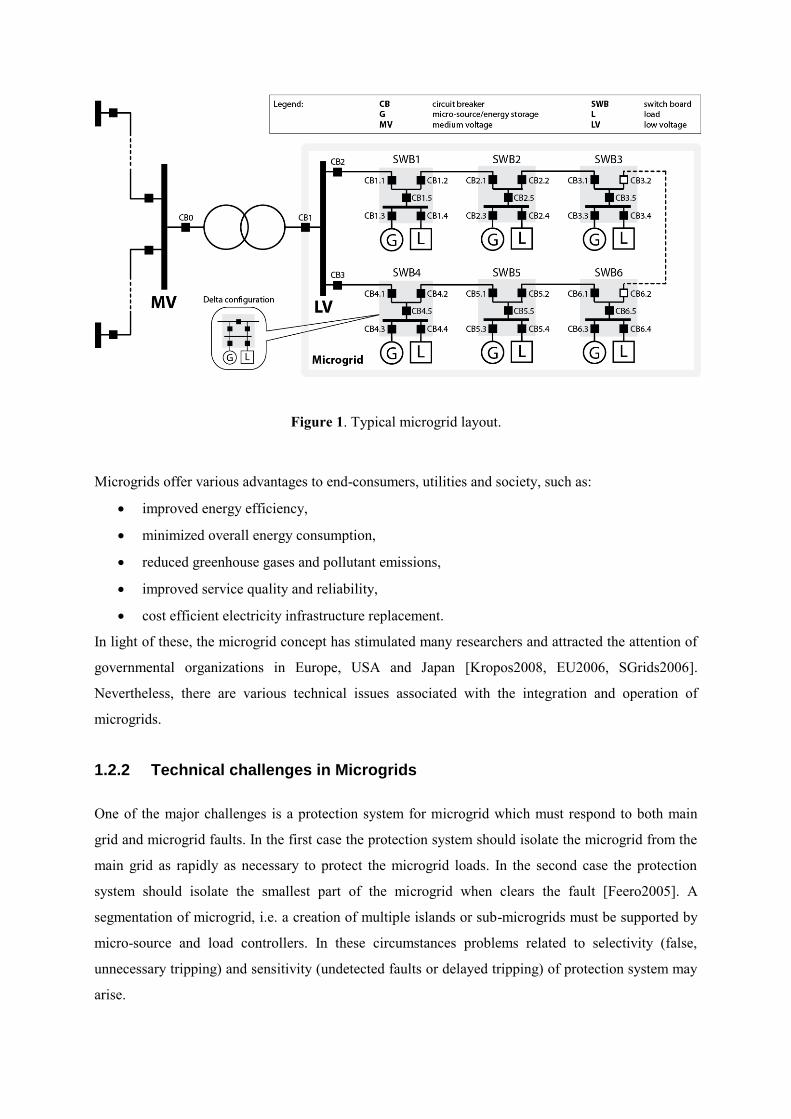
Figure 1. Typical microgrid layout.
Microgrids offer various advantages to end-consumers, utilities and society, such as:
improved energy efficiency,
minimized overall energy consumption,
reduced greenhouse gases and pollutant emissions,
improved service quality and reliability,
cost efficient electricity infrastructure replacement.
In light of these, the microgrid concept has stimulated many researchers and attracted the attention of
governmental organizations in Europe, USA and Japan [Kropos2008, EU2006, SGrids2006].
Nevertheless, there are various technical issues associated with the integration and operation of
microgrids.
1.2.2 Technical challenges in Microgrids
One of the major challenges is a protection system for microgrid which must respond to both main
grid and microgrid faults. In the first case the protection system should isolate the microgrid from the
main grid as rapidly as necessary to protect the microgrid loads. In the second case the protection
system should isolate the smallest part of the microgrid when clears the fault [Feero2005]. A
segmentation of microgrid, i.e. a creation of multiple islands or sub-microgrids must be supported by
micro-source and load controllers. In these circumstances problems related to selectivity (false,
unnecessary tripping) and sensitivity (undetected faults or delayed tripping) of protection system may
arise.

Figure 2. Multi-microgrids topology.
Some issues related to a protection of microgrids and distribution grids with a large penetration of
DER have been addressed in recent publications [AlNass2005, Vilath2006, Dries2007, Nukk2007].
Basically, there are two main issues, first is related to a number of installed DER units in the
microgrid and second is related to an availability of a sufficient level of short-circuit current in the
islanded operating mode of microgrid since this level may substantially drop down after a
disconnection from a stiff main grid. In [Girgis2001] the authors have made short-circuit current
calculations for radial feeders with DER and observed that short-circuit currents which are used in
over-current (OC) protection relays depend on a connection point of and a feed-in power from DER.
Because of these directions and amplitudes of short circuit currents will vary. In fact, operating
conditions of microgrid are constantly changing because of the intermittent micro-sources (wind and
solar) and periodic load variation. Also a network topology can be regularly changed aimed at loss
minimization or achievement of other economic or operational targets. In addition controllable islands
of different size and content can be formed as a result of faults in the main grid or inside a microgrid.
In such circumstances a loss of relay coordination may happen and generic OC protection with a
single setting group may become inadequate, i.e. it will not guarantee a selective operation for all
possible faults. Therefore, it is essential to ensure that settings chosen for OC protection relays take

into account a grid topology and changes in location, type and amount of generation. Otherwise,
unwanted operation or failure to operate when required may occur.
In order to cope with bi-directional power flows and low short-circuit current levels in microgrids
dominated by micro-sources with power electronic interfaces a new protection philosophy is required,
where setting parameters of relays must be checked/updated periodically to ensure that they are still
appropriate. This report presents a novel adaptive microgrid protection concept using advanced
communication system, real-time measurements and data from off-line short circuit analysis. This
concept is based on an adaptation of protection relay settings with regard to a microgrid state
(topology, generation and load status). Further, on the hardware realization (basic components,
communication, etc.) of this concept and numerically simulated test results are presented and
discussed.
The outlay of this report is as follows, Section 2 gives a brief overview of major protection issues in
microgrids. Section 3 illustrates a novel adaptive protection concept for microgrids, followed by a
discussion of the simulated results in Section 4. Section 5 gives an overview of modern protection
devices. Section 6 provides conclusions.
1.3 Protection Issues in Microgrid
1.3.1 Distribution system protection
Generally a low voltage distribution system (including microgrid) is divided into local protective zones which are covered either by a network (overhead lines and cables) or apparatus (buses, transformers, generators, loads, etc.) protection (
Figure 3).
Figure 3. Protection zones of different MV and LV circuit breakers with over-current relays for grid
elements and apparatuses.

Requirements which provide a basis for design criteria of a distribution protection system are known
as ―3S‖ which stands for:
Sensitivity - protection system should be able to identify an abnormal condition that exceeds a
nominal threshold value
Selectivity - protection system should disconnect only the faulted part (or the smallest
possible part containing the fault) of the system in order to minimize fault consequences.
Speed - protective relays should respond to abnormal conditions in the least possible time in
order to avoid damage to equipment and maintain stability.
―3S‖ can be extended by:
Dependability – protection system shall operate correctly when required to operate (detect
and disconnect all faults within the protected zone) and shall be designed to perform its
intended function while itself experiencing a credible failure
Security – protection system shall not operate when not required to operate (reject all power
system events and transients that are not faults) and shall be designed to avoid misoperation
while itself experiencing a credible failure.
Redundancy - A protection system has to care for redundant function of relays in order to
improve reliability. Redundant functionalities are planed and referred to as backup protection.
Moreover, redundancy is reached by combining different protection principles, for example
distance and differential protection for transmission lines
Cost - maximum protection at the lowest cost possible.
1.3.1.1 Over-current and directional over-current protection
A protection of distribution grid where feeders are radial with loads tapped-off along feeder sections
is usually designed assuming a unidirectional power flow and is based on a detection of high fault
currents using fuses, thermo-magnetic switches and moulded case circuit breakers with a standard
over-current (OC) relays (ANSI 51) with time-current discriminating capabilities. More sophisticated
directional OC relays (ANSI 67) are used for the protection of ring and meshed grids.
1.3.1.2 Distance protection
Some utilities install distance relays (ANSI 21) for line protection. The distance relay compares the
fault current against the voltage at the relay location to calculate the impedance from the relay to the
faulty point. As a rule of thumb distance relay has three protection zones: zone 1 covers 80-85%
length of the protected line, zone 2 covers 100% length of the protected line plus 50% next line, zone
3 covers 100% length of the protected line plus 100% second line, plus 25% third line. If a fault

occurs in the operating zone of the distance relay, the measured impedance is less than the setting and
the distance relay operates to trip the circuit breaker. Unfortunately, the distance protection can be
affected by DERs and loads since the measured impedance of the distance relay is a function of in-
feed currents and might cause the relay to operate incorrectly.
1.3.1.3 Differential protection
Differential over-current protection relays (ANSI 87) are mainly used to protect an important piece of
equipment such as distributed generators and transformers. Today, differential protection is also
widely used to protect underground distribution lines using a communication (pilot wires, fibre optics,
radio or microwave, etc.) between line terminals. It has the highest selectivity and only operates in the
case of an internal fault but it requires a reliable communication for instantaneous data transfer
between terminals of the protected element (pilot wire, optical fibres, or free space via radio or
microwave). Because of a vulnerability to possible communication failures, differential protection
requires a separate back-up protection scheme. It increases a total cost of protection system and limits
its application in microgrids.
Although several protection principles can be used in low voltage distribution grid, over-current
protection dominates this segment. Therefore, we focus on issues related to over-current protection in
microgrids.
1.3.2 Over-current distribution feeder protection
Over-current protection detects the fault from a high value of the fault current flowing downwards. In
modern digital (micro processor based) relays a tripping short-circuit current Ik can be set in a wide
range (e.g. 0.6-15 times rated current of a circuit breaker In). If a measured line current is above the
tripping setting, the relay operates to trip the CB on the line with a delay defined by a coordination
study and compatible with a locking strategy used (no locking, fixed hierarchical locking, directional
hierarchical locking).
A typical shape of over-current trip curve of a modern electronic trip circuit breaker is shown in
Figure 4. The trip curve consists of an inverse time part L (protection against overloads), a constant
time delay part S (protection against short circuit with short time delay trip) and an instantaneous part
I (instantaneous protection against short circuit). The S part may consist of several steps. It is common
today that in modern digital over-current relays all parts of the trip curve are adjustable in a wide
range by small increment steps.

Figure 4. Typical time-current curve for a low voltage electronic trip circuit breaker.
1.3.3 Over-current distribution feeder protection and DERs During the last decade a typical situation in low voltage distribution grids has been slowly changing
due to an installation of DER such as solar (photovoltaic) panels, micro-wind and micro-gas turbines
(usually combined heat and power ), etc. Most of the micro generators and energy storage devices are
not suitable for supplying power directly to the grid and have to be interfaced to the grid by means of
power electronics (PE) components. A use of PE interfaces leads to a number of challenges in
microgrid‘s protection, especially in the islanded mode.
Figure 5 represents the same microgrid as shown in Figure 1 with two feeders connected to the LV bus ant to the MV bus via a distribution transformer.
Each feeder has three switchboards (SWB). Each SWB has star or delta configuration and connects
DERs and loads to the low voltage feeder. We analyzed two external (F1, F2) and two internal (F3,
F4) microgrid faults. All LV circuit breakers (from CB1 to CB6.5) may have different ratings but are
equipped with a conventional over-current protection and used for segmenting the microgrid.
In general, protection issues in microgrid can be divided in two groups regarding to a microgrid
operating state (Table 1). Table 1 also shows an importance of ―3S‖ (sensitivity, selectivity and
speed) requirements for different cases, which provides a basis for design criteria of a microgrid
protection system.
Next sections provide more details on each possible combination in Table 1.
1.3.4 Grid connected mode with external faults (F1, F2)
In case of fault F1 a main grid (MV) protection clears the fault. If sensitive loads are presented in
microgrid, the microgrid could have to be isolated by CB1 as fast as 70 ms (depending on a voltage

sag level in the microgrid) [SEMI2006]. Also microgrid has to be isolated from the main grid by CB1
in case of no MV protection tripping. A detection of F1 with a generic OC relay can be problematic in
case most of DERs in the microgrid are connected by means of PE interfaces which have built-in fault
current limitation (i.e. there is no significant rise in current passing through CB1). Typically they are
capable of supplying 1.1-1.2*IDERrated (rated current of micro generator) to a fault, unless the
converters are specifically designed to provide high fault currents. These numbers are much lower
than a short-circuit current supplied by the main grid. A directional OC relay in CB1 is only a feasible
solution if current is used for the fault detection. In order to increase relay sensitivity a pick-up
current setting is defined as a sum of fault current contributions from the connected DER units (1).
DERs that have to be taken into consideration are the subset of units that contribute to the short circuit
current on the defined direction.
n
rDERDERk IkI1
min *
(1)
where IrDER is a rated output current of a particular DER and k is a fault current contribution
coefficient of the same DER. This coefficient is set at 1.1 for DERs with power electronics interfaces
and at 5 for synchronous DER units [KEMA2005]. This value will vary in case of a large number of
different types of DERs. Thus, the setting has to be continuously monitored and adapted when
microgrid generation undergoes changes (number and type of connected DER).
Figure 5. External and internal fault scenarios in microgrid.
Alternatively, voltage sag (magnitude and duration) or/and system frequency (instantaneous value and
rate of change) can be used as another indicators for a tripping of CB1. Some distribution network

operators (DNO) may require microgrid to stay connected and supply reactive power to the fault up to
several seconds.
TABLE 1
MAJOR CLASSES OF MICROGRID PROTECTION PROBLEMS
Operating mode
Fault location
External faults (main grid) Internal faults (microgrid)
MV feeder, bus-bar (F1)
Distribution transformer
(F2)
LV feeder (F3)
LV consumer (F4)
Grid connected (CB1 is closed)
Fault is normally managed by MV system. Microgrid isolation by CB1 in case of no MV protection tripping. Possible fault sensitivity problems for CB1*.
Fault is normally managed by MV system (CB0). CB1 is opened by ―follow-me‖
function of CB0. In case if communication fails then possible fault sensitivity problem for CB1*.
Disconnect a smallest portion of microgrid (CB1.2 and CB2.1). CB1.2 is opened by fault current from the grid (high level). Low level of a reversed fault current from feeder‘s
end may cause sensitivity problems for CB2.1*. In this case a ―follow-me‖
function of CB1.2 can to open CB2.1. In case if communication fails then possible fault sensitivity problems for CB2.1*.
Faulty load is isolated by CB2.4 or fuse. In case of no tripping the SWB is isolated by CB2.5 and local DER is cut-off. No sensitivity or selectivity problems.
Islanded (CB1 is open) --- ---
Disconnect the smallest portion of microgrid (CB1.2 and CB2.1). Low level of fault currents from both directions may cause sensitivity problems for CB1.2 and CB2.1*.
Faulty load is isolated by CB2.4 or fuse. In case of no tripping the SWB is isolated by CB2.5 and local DER is cut-off. Sensitivity or selectivity problems no likely.
*) low fault current contribution from the microgrid in case of DERs with PE interfaces.
In case of fault F2 a distribution transformer OC protection clears the fault by opening CB0. CB1 is
opened simultaneously by ―follow-me‖ function (hardware lock) of CB0. In case of hardware lock
failure a possible fault sensitivity problem can arise as in the case of fault F1. Typical solutions are
similar to F1 case (directional adaptive OC protection, under-voltage and under-frequency protection,
various islanding detection methods [Bower2002]).

1.3.5 Grid connected mode with fault in the microgrid (F3)
In case of fault F3 a microgrid protection must disconnect a smallest possible portion of the LV feeder
by CB1.2 and CB2.1. CB1.2 is opened due to a high level of short-circuit current supplied by the main
MV grid. If CB1.2 fails to trip, the fault F3 must be cleared by CB1.1 which is a backup protection for
CB1.2. However, a sensitivity of OC protection relay in CB1.1 can be potentially disturbed in case a
large synchronous DER (e.g. diesel generator) is installed and switched-on in SWB1 (i.e. between
CB1.1 and the fault F3). In this case the fault current passing through the CB1.1 in case with DER
will be smaller than in case without DER. This effect is known as protection blinding (the larger the
synchronous DER the greater is the effect, in some cases the fault current seen by CB1.1 can be
reduced by more than 30%) and may result in a delayed CB1.1 tripping because of the fault current
transition from a definite-time part to an inverse-time part of relay tripping characteristic (Figure 4). A
delayed fault tripping will lead to an unnecessary disconnection of local synchronous DER (usually
low power diesel generators have very low inertia and will run out of step in case of a delayed fault
tripping). This issue can be solved by a proper coordination of microgrid and DER protection systems.
Another option is adapting protection settings with regard to current operating conditions (DER
status).
If, as likely, CB1.2 operates faster than CB2.1 it will island a part of the microgrid which will be
connected to the fault F3. If it is possible to balance generation and load in the islanded segment of
the microgrid (micro-sources are capable to supply loads directly or after load shedding) it is
expedient to isolate that group of micro-sources and loads from the fault F3 by opening CB2.1 and
possibly closing CB3.2-6.2. However, a reversed and low level short circuit current in case of DER
with PE interfaces will cause a sensitivity problem for CB2.1 similar to one described in section A in
case of the fault F1. Possible solutions include directional adaptive OC protection and a ―follow-me‖
function of CB1.2 which opens CB2.1 (in case of communication failure possible sensitivity problems
for CB2.1).
1.3.6 Grid connected mode with fault in the end-consumer site (F4)
In case of fault F4 a high short-circuit current is supplied to the fault from the main grid together with
a contribution from DER and will lead to a tripping of CB2.4. Frequently, there is a fuse instead of
CB which is rated in such a way that a shortest possible fault isolation time is guaranteed. In case of
no tripping the SWB2 is isolated by CB2.5 and local DER is cut-off. No sensitivity or selectivity
problems are foreseen in this scenario.

1.3.7 Islanded mode with fault in the microgrid (F3)
The microgrid operates in the islanded mode when it is intentionally disconnected from the main MV
grid by CB1 (full microgrid) or a CB along the LV feeder (a segment of the microgrid). This
operating mode is characterized by an absence of a high level of short-circuit current supplied by the
main grid. Generic OC relays would be replaced by directional OC relays because fault currents flow
from both directions to the fault F3. If CB1.2 and CB2.1 use setting groups chosen for the grid
connected mode they will have a selectivity problem to detect the fault F4 and trip within acceptable
time frame in case of DER with PE interfaces (the fault current could shift from a definite-time part to
an inverse-time part of the relay tripping characteristic). The question arises: why one needs to care
about a fault if there is no fault current? The answer is safety of people and that permanent faults may
spread out and destroy more equipment.
There are two possible ways to address the problem:
Install a source of high short-circuit current (e.g. a flywheel or a super-capacitor) to trip
CBs/blow fuses with settings/ratings for the grid connected mode [Overb2006]. However, a
short-circuit handling capability of PE interfaces can be increased only by increasing the
respective power rating or by extensive cooling which both lead to higher investment cost
[Jaya2004].
Install an adaptive microgrid protection using on-line data on microgrid topology and status of
available micro-sources/loads.
1.3.8 Islanded mode and fault in the end-consumer site (F4)
In case of fault F4 a low short-circuit current is supplied to the fault from the local DERs. There is no
grid contribution to the fault current level. However, CB2.4 settings selected for the main grid
connected mode are just slightly higher than rated load current. It assures that the end-customer site
will be disconnected even if only DERs with PE interfaces are available in the microgrid. In case of
no tripping the SWB2 must be isolated by CB2.5 using directional OC relay. Similar to the grid
connected mode there are no sensitivity or selectivity problems are foreseen in the islanded mode for
the fault in the end-consumer site.
1.3.9 Conclusive remarks
Finally it was seen that the main microgrid protection problem is related to a large difference between
fault currents in main grid connected and islanded modes. A microgrid protection system must have a
high sensitivity to faults and selectively isolate/sectionalize microgrid especially in the case of DERs
with PE interfaces (low fault current levels).

In fact a decision on either sectionalize microgrid or shut it down in case of fault will depend on needs
of microgrid customers and whether a cost involved (protection and communication) could be
justified for benefits gained by a sectionalizing (e.g. reduced end-consumer interruption time).
According to system reliability index figures, approximately 20-40 faults (overhead lines) and <5
(underground cables) per 100 km occur annually in typical European low voltage networks
[CIRED2005]. It implies that, taking into account the on the connections faults, less than 2 faults per
5 years (overhead lines) and 1 fault per 20 years (underground cables) will take place inside a typical
microgrid spanning over 1 km. However, more faults happen in MV grid and microgrid has to be
isolated from the fault.
1.4 Adaptive Protection for Microgrid
This section illustrates an adaptive protection system that can potentially solve problems identified in
the previous section by anticipating an impact of distributed energy resources (DERs) and microgrid
configuration on the over-current relay performance and accordingly change the relay settings to
ensure that the whole microgrid is protected at all times. Adaptive protection is as "an online activity
that modifies the preferred protective response to a change in system conditions or requirements in a
timely manner by means of externally generated signals or control action" [Rock1988]. Technical
requirements and suggestions for a practical implementation of adaptive microgrid protection system
are as following:
Use of digital (microprocessor based) directional OC relays (fuses or electro-mechanical and
standard solid state relays are especially for selectivity holding inapplicable, because they
don‘t provide flexibility for setting of tripping characteristics as well as no current direction
sensitivity feature).
Digital directional OC relays must dispose of possibility for using different tripping
characteristics (several settings groups, i.e. modern digital over-current relays for low voltage
applications have 2-4 settings groups) that can be parameterized locally or remotely
automatically or manually.
Use of new/existing communication infrastructure (e.g. twisted pair, power line, optic fibre,
radio, etc.) and standard communication protocols (Modbus, Profibus, DeviceNet, IEC61850,
etc.) such that individual relays can communicate and exchange information with a central
computer or between different individual relays fast and reliably to guarantee a required
application performance.

An adaptive protection system which will satisfy these requirements will be characterized by a
relatively high investment cost in comparison to a conventional protection system based on fuses. In
light of this it is interesting to carry out a separate cost-benefit analysis in case of microgrid. Cost will
correspond to investment and operating costs over a system lifetime and benefit will correspond to a
reduced outage time and opportunity loss. It is not a subject of this study where the focus is on a
design and technical realization of an adaptive protection system for microgrids.
1.4.1 Centralized adaptive protection system
An example of a centralized adaptive protection system is shown in Figure 6. There is a microgrid central controller (MCC) and communication system in addition to primary switching equipment shown in
Figure 1. The function of MCC is carried out by a PLC (programmable logic controller), a station
computer or a generic PC sitting in MV/LV substation.
Figure 6. A centralized adaptive protection system for microgrid.
Electronics make each CB with an integrated directional OC relay capable of exchanging information
with MCC (master-slave scheme, where the MCC is a master and circuit breakers are slaves). For
example, in Figure 6 CBs are connected to the serial communication bus RS485 and use standard
industrial communication protocol Modbus [ABB2007]. By polling individual relays the MCC can
read data (electrical values, status) from CBs and if necessary modify relay settings (tripping
characteristics).

When the fault happens each individual relay takes a tripping decision locally (independently of the
MCC) and performs in accordance to Figure 7. In case an abnormal situation is detected a tripping
condition is checked (a measured current in a specific direction is compared with the actual relay
setting). If the tripping condition is reached a CB is open.
The main goal of the adaptive protection system shown in Figure 6 is to maintain settings of each
over-current relay regarding a current state of the microgrid (both grid configuration and status of
DERs are taking into consideration).
Figure 7. Local over-current protection function inside circuit breaker.
It is effectuated by a special adaptation module in the MCC which is responsible for a periodic check
and update of relay settings. It consists of two main components:
pre-calculated information during off-line fault analysis of a given microgrid
an on-line operating block.
1.4.2 Off-line analysis
A set of meaningful microgrid configurations as well as feeding-in states of DERs (on/off) is created
for off-line fault analysis and is called an event table. Each record in the event table has a number of
elements equal to a number of monitored CBs in the microgrid (some elements may have higher
priority than others, e.g. the central CB which connects LV and MV grids) and is binary encoded, i.e.
element=1 if a corresponding CB is closed and 0 if it is open (Figure 8).

Figure 8. Structure of the event table.
Next, fault currents passing through all monitored CBs are estimated by simulating different short-
circuit faults (3-phase, phase-to-ground, etc.) in different locations of the protected microgrid at a
time. During repetitive short-circuit calculations a topology or a status of a single DER or load is
modified between iterations. As different fault locations for different microgrid states are processed
the results (the magnitude and direction of fault current seen by each relay) are saved in a specific
data structure.
Based on these results suitable settings for each directional OC relay and for each particular system state are calculated in such a way that guarantees a selective operation of microgrid protection. These settings are grouped into an action table which has the same dimension as the event table. In addition to a regulation of protection settings other actions such as activation of protection function can be done, e.g. a directional interlock can be activated in the islanding situation. A flow chart diagram in
Figure 9 summarizes the off-line part of the adaptive protection algorithm.
Figure 9. Phases of the off-line adaptive protection algorithm.

The event and action tables are parts of the configuration level of the microgrid protection and control
system shown in Figure 10, where:
External Field Level represents energy market prices, weather forecast, heuristic strategy
directives and other utility information
Management Level includes historic measurements and distribution management system
(DMS)
Configuration Level consists of a station computer or PLC situated centrally (substation) or
locally (switchboard) which is able to detect a system state change and send a required action
to hardware level
Hardware Level transmits a required action from the configuration level to on-field devices
by means of a communication network. In the case of a large microgrid, this function can be
divided between several local controllers which communicate only selected information to the
central unit.
Protection Level may include CB status, release settings, interlocking configuration, etc.
Together with Real-time Measurements Level they are sitting inside on-field devices.
Figure 10. Microgrid protection and control architecture
1.4.3 On-line operation
During the on-line operation the MCC monitors the microgrid state by polling individual directional
OC relays. This process runs periodically or is triggered by an event (tripping of CB, protection alarm,

etc.) and uses communication system shown in Figure 6. The microgrid state information received by
the MCC is used to construct a status record which has a similar dimension as a single record in the
event table. The status record is used to identify a corresponding entry in the event table. Finally, the
algorithm retrieves the pre-calculated relay settings from the corresponding record in the action table
and uploads the settings to on-field devices via the communication system. Figure 11 illustrates
phases of the adaptive protection algorithm running on-line.
Figure 11. Phases of on-line adaptive protection algorithm with available look-up tables (the event
and action tables).
1.4.4 Directional interlock
Fault detection and selective isolation are very challenging tasks in microgrids dominated by micro-
generators with power electronics interfaces (Table 1). This subsection presents a solution based on
extension of the microgrids adaptive protection system with a directional interlock. A non-directional
interlock together with non-directional over-current relays are well known techniques used in radial
distribution feeders without DERs [Yong1990]. The interlock starts from the end of the feeder
towards the supply side and connects an output port of the trip unit to an input port of the trip unit
immediately to the supply side by means of a simple screened-twisted-pair cable. In the case of fault,
the CB immediately to the supply side sends a locking signal to the hierarchically higher CB and,
before intervening, checks that a similar locking signal has not been reached by the CB on the load
side. This guarantees a selective operation of relays even where it is not possible to use a current
discrimination. However, in a presence of DERs along the feeder the non-directional interlock will
not work correctly because the fault will be supplied from both sides and all CBs between the fault
and the most remote DER at the end of the feeder will be unnecessarily tripped which makes difficult
to detect the fault location .
An evolution of this pre-cabled system could be an adaptive directional interlock in order to avoid a
non-selective operation of relays in the microgrid. The interlock direction is changed by reassignment
of output and input ports of corresponding relays. The interlock direction is changed on-fly (in less
than 50 ms) depending on a direction of the fault current with regard to a direction of the interlock (a
default interlock direction is from the end of the feeder towards the supply side, i.e. MV grid) before
the fault (Figure 12). A direction of interlock of each over-current relay before the fault is defined by
a position (OUT/IN) of relay communication ports.
Figure 12. Adaptive directional interlock.
The reassignment of ports is based on the following rules:
if the fault current direction is opposite to the present interlock direction then keep present port assignment and relay sends locking signal to the present interlock direction
if the fault current direction is similar to the present interlock direction then switch output/input ports, i.e. interlock direction and relay sends locking signal to the new interlock direction (opposite to the present interlock
direction)

Adaptive directional interlock sends the blocking signals in correct directions, i.e. relays on both sides
of faulty element will trip and selectively isolate the fault.
1.5 Simulation Results
This section shows an illustrative example of a centralized adaptive protection system combined with
a directional interlock and the results are discussed. We used the same microgrid setup as shown in
Figure 6. Parameters of the test microgrid are given in Appendix. The microgrid consists of several
DERs including synchronous machines and units with PE interfaces.
We explored two scenarios with regard to a microgrid configuration and status of DERs:
microgrid without DERs in the grid connected mode
microgrid with DERs (synchronous machines) in the grid connected and islanded modes
1.5.1 Microgrid with DERs switched off in the grid mode
The first scenario is shown in Figure 13. This microgrid topology was used as a base case and the first
entry in the event table.
Figure 13. Scenario A1: the microgrid with DERs switched off is connected to a medium voltage
distribution grid.
We assume that each electronic trip circuit breaker has a similar shape of the over-current protection trip curve (Figure 4). In order to provide a selective operation of different circuit breakers we used different time delays ts of the constant time delay part S in the range between Ikmin (the expected minimum short circuit current) and Ikmax (the expected maximum short circuit current). CB1 is the

closest circuit breaker to the source and has the longest time delay ts. The most distant CB3.2 and CB6.2 have the shortest time delay ts (
Figure 14). The instantaneous tripping part I is removed from all curves for a simplification purposes.
Figure 14. Trip curves for circuit breakers in the upper feeder (identical for CBs in the lower feeder)
in the base case and a tripping sequence in Scenario A1 (Figure 13).
The microgrid topology and suitable OC protection settings ts for all CBs (calculated during the off-line fault analysis [ABB2008-2]) in the base case are shown in Table 2 based on Figure 13 and
Figure 14. DER and load protection settings do not set here but the information on DER and load
status (on/off) is required for a correct operation of the microgrid adaptive protection.
In case of fault in the cable between SWB1 and SWB2 (Figure 13) all CBs between the fault and the LV busbar see the fault supplied by the main MV grid (red box in Table 2), but only CB1.2 will trip after ts=150 ms (
Figure 14) and CB2.1 will be opened by the ―follow-me‖ function of CB1.2 in order to avoid
connecting the fault to the healthy feeder by closing CB3.2 and CB6.2. Other CBs that see the fault
are delayed (in absence of a logic discrimination auxiliary connection). However, this method is
limited by a number of discriminating time steps (a maximum ts is recommended to be less than 800
ms) and is only suitable for feeders with a small number of switchboards.

TABLE 2
SCENARIO A1: STATUS OF CIRCUIT BREAKERS 1=CLOSE, 0=OPEN AND OVER-CURRENT PROTECTION
SETTINGS TS IN SECONDS. RED BOX AND NUMBERS SHOW CBS THAT SEE THE FAULT IN FIGURE 13
Upp
er
feed
er CB1 CB2 CB1.1 CB1.2 CB2.1 CB2.2 CB3.1 CB3.2
1 1 1 1 1 1 1 0 0.3 0.2 0.2 0.15 0.15 0.1 0.1 0.05
Low
er
feed
er CB3 CB4.1 CB4.2 CB5.1 CB5.2 CB6.1 CB6.2
1 1 1 1 1 1 0 0.2 0.2 0.15 0.15 0.1 0.1 0.05
DER
+
load
CB1.3 CB1.4 CB1.5 CB2.3 CB2.4 CB2.5 CB3.3 CB3.4 CB3.5
0 1 1 0 1 1 0 1 1
DER
+
load
CB4.3 CB4.4 CB4.5 CB5.3 CB5.4 CB5.5 CB6.3 CB6.4 CB6.5
0 1 1 0 1 1 0 1 1
Assume SWB2 and SWB3 are re-supplied via SWB6 (CB3.2 and CB6.2 are closed) after the fault
between SWB1 and SWB2 is selectively eliminated (CB1.2 and CB2.1 are open). A selectivity
problem may appear if using base case protection settings from Table 2.
Figure 15. Scenario A2: the microgrid with all DERs switched off is connected to the medium
voltage distribution grid.
For example, if the second fault will appear between SWB2 and SWB3 (

Figure 15) it will be eliminated by CB3.2 and CB6.2 (ts=50ms) instead of CB3.1 (ts=100 ms) and the load in SWB3 will be unnecessarily tripped as shown in Figure 16.
Figure 16. Base case trip curves and a tripping sequence in Scenario A2 with non-directional OC
protection (
Figure 15).
Selectivity can be improved by:
application of directional over-current relays,
modification of protection settings of non-directional OC relays.
In the first case we would need to install a new hardware. Each relay will have two ts settings, one for
each direction (clockwise and counter-clockwise) as shown in
Table 3. In this case a selective protection operation is guaranteed ( Figure 17) and SWB3 will remain connected after the fault is eliminated.

TABLE 3
SCENARIO A2: STATUS OF CBS AND DIRECTIONAL OC PROTECTION SETTINGS TS
Upp
er fe
eder
CB1 CB2 CB1.1 CB1.2 CB2.1 CB2.2 CB3.1 CB3.2
1 1 1 0 0 1 1 1 → 0.75 0.55 0.55 0.4 0.4 0.3 0.3 0.2 ← 0.05 0.05 0.1 0.1 0.15 0.15 0.2
Low
er fe
eder
CB3 CB4.1 CB4.2 CB5.1 CB5.2 CB6.1 CB6.2
1 1 1 1 1 1 1 → 0.55 0.55 0.4 0.4 0.3 0.3 0.2 ← 0.05 0.05 0.1 0.1 0.15 0.15 0.2
DER
+
load
CB1.3 CB1.4 CB1.5 CB2.3 CB2.4 CB2.5 CB3.3 CB3.4 CB3.5
0 1 1 0 1 1 0 1 1
DER
+
load
CB4.3 CB4.4 CB4.5 CB5.3 CB5.4 CB5.5 CB6.3 CB6.4 CB6.5
0 1 1 0 1 1 0 1 1

Figure 17. Base case trip curves and a tripping sequence in Scenario A2 with directional OC
protection (
Figure 15).
In the second case we modify the S part of the base case trip curves by adjusting ts settings ( Figure 18). Second records in the event and action tables are created during the off-line fault analysis
(Table 4).
TABLE 4
SCENARIO A2: STATUS OF CBS AND MODIFIED NON-DIRECTIOANL OC PROTECTION SETTINGS TS
Upp
er
feed
er CB1 CB2 CB1.1 CB1.2 CB2.1 CB2.2 CB3.1 CB3.2
1 1 1 0 0 1 1 1 0.4 0.2 0.2 0.15 0.15 0.05 0.05 0.1
Low
er
feed
er CB3 CB4.1 CB4.2 CB5.1 CB5.2 CB6.1 CB6.2
1 1 1 1 0 1 1 0.3 0.3 0.2 0.2 0.15 0.15 0.1
DER
+
load
CB1.3 CB1.4 CB1.5 CB2.3 CB2.4 CB2.5 CB3.3 CB3.4 CB3.5
0 1 1 0 1 1 0 1 1
DER
+
load
CB4.3 CB4.4 CB4.5 CB5.3 CB5.4 CB5.5 CB6.3 CB6.4 CB6.5
0 1 1 0 1 1 0 1 1

In particular we can observe lower ts for CB2.2 and CB3.1 and higher ts for CB3.2 and CB6.2 in
comparison to the values shown in Table 2.
Figure 18. Modified base case trip curves (ts settings) and a tripping sequence in Scenario A2 with
non-directional OC protection (
Figure 15).
The second solution with a modification of ts settings is characterized by more narrow range of the
time delay ts. The maximum time delay ts=0.4 s versus 0.75 s in the case of directional OC protection.
1.5.2 Microgrid with synchronous DERs switched on in the grid and islanded
modes
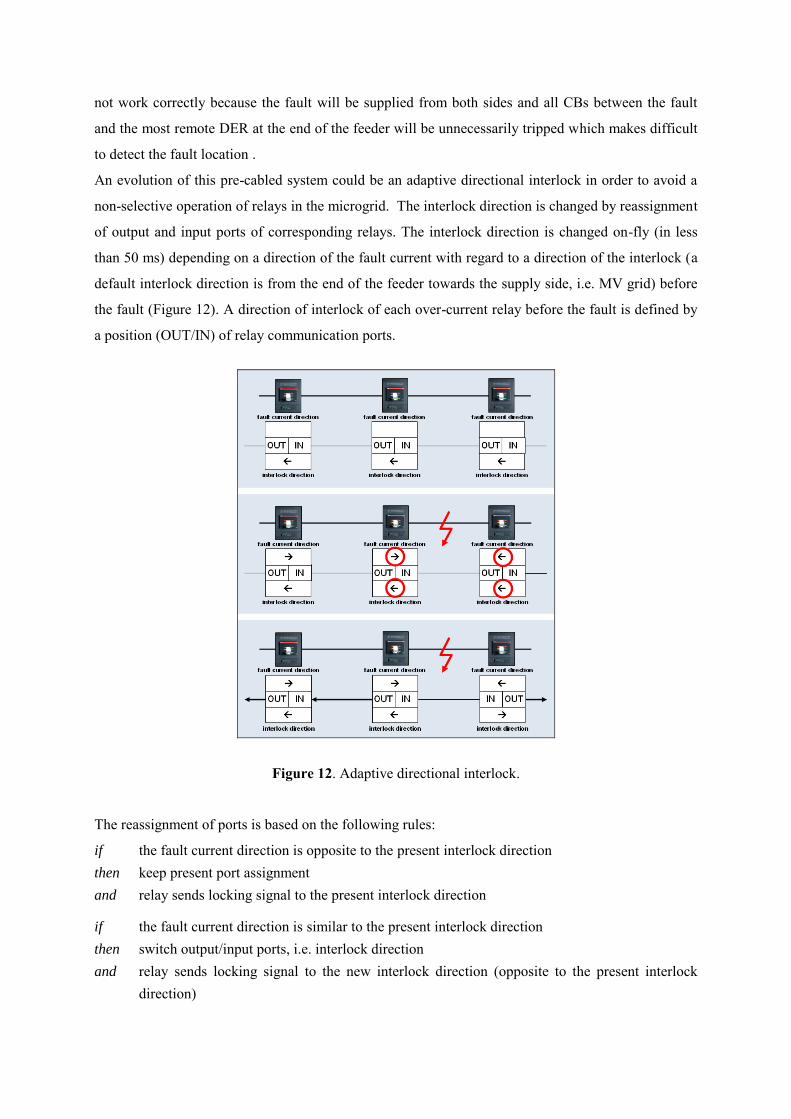
Assume there is a considerable change in the microgrid configuration and status of DER units: the cable between SWB4 and SWB5 is disconnected for a maintenance work and SWB5 and SWB6 are supplied via SWB3 (CB3.2 and CB6.2 are closed) as illustrated in
Figure 19. Two identical synchronous diesel generators (parameters are given in Appendix) are
connected in SWB1 and SWB6. In addition we assume that all non-directional OC protection relays
use time delay settings ts from the base case shown in Table 2.
Figure 19. Scenario B1: the microgrid with synchronous DERs switched on is connected to the
medium voltage distribution grid.
In the case of fault between SWB1 and SWB2 ( Figure 19) there is no problem to detect and selectively isolate the fault from the main grid side by CB1.2, also because the fault current seen by CB1.2 becomes higher Ikmax = 15 kA (Figure 20) vs. 13.5 kA ( Figure 14) in the base case due to a contribution from the synchronous DER in SWB1. The fault
current supplied by the second DER in SWB6 and seen by CB2.1 is 2 kA (Figure 20). It can only
activate the L part of the relay‘s trip curve with the expected tripping time delay of 40 s. Therefore,
CB2.1 is opened by the ―follow-me‖ function of CB1.2 and isolates the fault from the LV feeder side
in ts=150 ms (if using a directional OC protection then ts=400 ms, see
Table 3).
The main concern is ts ≥ 150 ms set for the OC relay in CB1.2 which may affect a stability of the
synchronous DER with a small inertia in SWB1. A preferred solution is based on the adaptive
directional interlock (Section 3.4). The time delay ts is set at 50 ms for all OC relays in the microgrid.

Then blocking signals are sent in correct directions which prevents an unnecessarily disconnection of
DERs and healthy parts of the microgrid.
Figure 20. Base case trip curves and a tripping sequence in Scenario B1 with directional OC
protection (
Figure 19).
Next we assume that after an isolation of the first fault the island which includes SWB2, 3, 5
formed as shown in
Figure 21. The synchronous DER in SWB6 is switched to a frequency control mode and additionally
each load in the island is dropped from 100A to 50A.
Assume there is a second fault inside the islanded microgrid between SWB2 and SWB3 and all non-directional OC relays use ts settings from the base case shown in Table 2. Ideally, the fault should be cleared by CB2.2 and CB3.1. CB2.2 can not trip since there is no fault current source in SWB2, but it can be opened by the ―follow-me‖ function of CB3.1. The ts of CB3.1 is set at 100 ms for a minimum fault current level of 4*In CB = 3.2 kA. In case of using directional OC protection ts = 150 ms for CB3.1 (Table 3). However, the maximum fault current supplied by the synchronous DER in SWB6 and seen by CB3.1 Ikmax=2.4 kA (
Figure 22). This will activate the L part of the relay‘s trip curve with the expected tripping time delay
of 25 s. During this time DER in SWB6 will be disconnected by its out-of-step protection.

Figure 21. Scenario B2: the islanded microgrid with the synchronous DER in SWB6.
In order to guarantee fast fault isolation in the islanded mode where the main grid does not contribute to the fault, the trip curve must be pushed to the left dynamically depending on the microgrid topology and a number of connected DERs (1). The modified trip curves for scenario B2 are illustrated in
Figure 22.
Figure 22. Base case and modified trip curves and a tripping sequence in Scenario B2 (
Figure 21).

Protection settings for all CBs in the island are calculated during the off-line fault analysis and shown
in Table 5 as recorded in the event and action tables.
Another protection alternative is based on the adaptive directional interlock (Section 3.4). The
tripping time is set at 50 ms for all CBs inside the island and the minimum short circuit current has to
be dynamically modified (reduced) depending on type and number of connected DER units.
TABLE 5
SCENARIO B2: STATUS OF CBS AND MODIFIED OC PROTECTION SETTINGS IKMIN AND TS
Upp
er fe
eder
CB1 CB2 CB1.1 CB1.2 CB2.1 CB2.2 CB3.1 CB3.2
1 1 1 0 0 1 1 1 Ikmin 3.2 3,2 3.2 3.2 3.2 1.2 1.2 1.2
ts 0.3 0.2 0.2 0.15 0.15 0.05 0.05 0.1
Low
er fe
eder
CB3 CB4.1 CB4.2 CB5.1 CB5.2 CB6.1 CB6.2
1 1 0 0 1 1 0 Ikmin 3.2 3.2 3.2 3.2 1.2 1.2 1.2
ts 0.2 0.2 0.15 0.15 0.05 0.05 0.1
DER
+
load
CB1.3 CB1.4 CB1.5 CB2.3 CB2.4 CB2.5 CB3.3 CB3.4 CB3.5
1 1 1 0 1 1 0 1 1
DER
+
load
CB4.3 CB4.4 CB4.5 CB5.3 CB5.4 CB5.5 CB6.3 CB6.4 CB6.5
0 1 1 0 1 1 1 1 1

1.6 Fault Current Limiters in Microgrids
1.6.1 Increase of fault current levels
Distribution utilities calculate fault current levels during network planning stage to ensure that fault
levels remain within the design limits of various grid components. These calculations are based on
knowledge about connected generating units and rotating equipment at customer sites. In today‘s
distribution networks, the presence of DERs provides an additional contribution to the fault level, and
the embedded nature of the DER makes the fault current calculations more complex as they should
take into account the consequences of operational switching combinations to a degree not required
when all generation was via the transmission network [KEMA2005]. When the fault current
contribution from a single DER is not large, the aggregated contribution of many DER units can alter
the fault current levels enough to exceed a design limit of various primary equipment components to
which it is connected (e.g. circuit breakers, cables, bus bars, etc.). When fault level design limits are
exceeded, there is a risk of damage to and failure of the equipment with consequent risk of injury to
personnel and interruption of supply under short circuit fault conditions. In this case a costly physical
upgrade of primary equipment may be needed. A fault level contribution from a DER is mainly
determined by its type and a coupling method to the grid. Today DERs connected to low voltage
microgrids are usually photo-voltaic (PV) generators and micro and mini combined heat and power
(CHP) units. The existing low voltage microgrids can accept a large number of PV generators. The
impact in an area with PV covering 100% microgrid load would add less than 5% to the commonly
used fault levels. However, in case of large amounts of domestic mini CHP equipped with
synchronous generators their fault current contribution may become an issue especially in microgrids
in urban areas with low fault level headroom availability.
The following analysis provides an indication of the likely scale of the problem. We used the microgrid shown in Figure 1 where only one synchronous DER is connected to SWB1. An increase of a total short circuit current in SWB1-3 due to a contribution of DER in SWB1 was estimated. Different size of DER was considered and the final results are shown in
Figure 23. The given values are expressed as a ratio between the initial symmetrical short-circuit
current (IEC60909-0 Clause 1.3.5 [IEC2001]) for a three-phase fault with DER and without DER. It
can be observed that the highest effect of DER is seen by the SWB where DER is connected and that
the fault current level with DER can reach 135% of the fault current without DER. In such
circumstances a capability of microgrid to accommodate additional DER units is reduced.
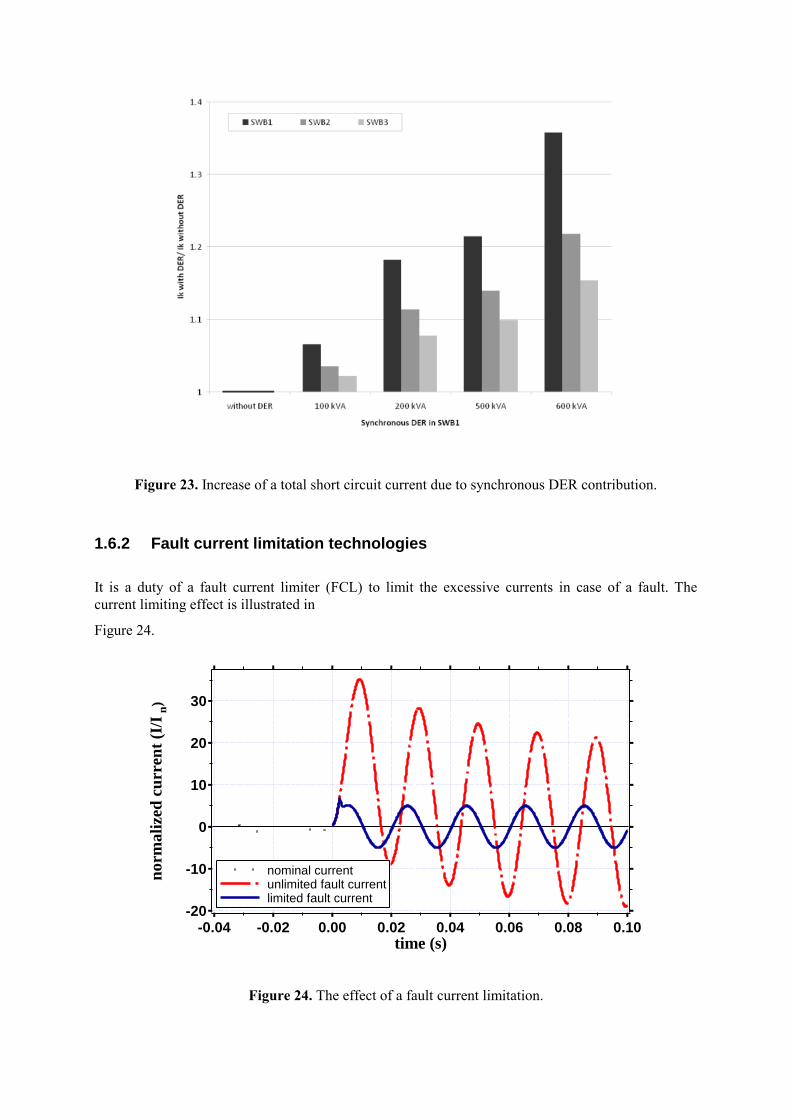
Figure 23. Increase of a total short circuit current due to synchronous DER contribution.
1.6.2 Fault current limitation technologies
It is a duty of a fault current limiter (FCL) to limit the excessive currents in case of a fault. The current limiting effect is illustrated in
Figure 24.
30
20
10
0
-10
-20
no
rma
lize
d c
urr
ent
(I/I
n)
0.100.080.060.040.020.00-0.02-0.04time (s)
nominal current unlimited fault current limited fault current
Figure 24. The effect of a fault current limitation.

In case of fault, the fault current increases with a certain rate of rise depending on the circuit parameters and on the phase angle at initiation. When a fault occurs, the FCL has to react and limit the current, preferentially before the first peak in the fault-current waveform is reached (<5 ms).
Figure 25 demonstrates available and emerging technical solutions for current limitation below
equipment design limits [CIGRE2003]. These solutions fall in two groups: passive and active.
Figure 25: Alternative methods of fault current limitation.
Passive solutions limit a fault current by increasing current path impedance at nominal and fault
conditions. Therefore, it generates losses and voltage drop under nominal conditions. Active devices
show a highly non-linear behaviour and quickly increase the impedance during the fault. Their main
disadvantage is a need of replacement after each operation and a careful adjustment of protective
relay settings to maintain selectivity [CIGRE2006]. There are also low voltage circuit breakers
available with a built-in current limiting functionality [ABB2007]. The current limitation is done by a
sufficient voltage built-up inside the breaker. The current path inside a CB is constructed in a way that
magnetic forces quickly move the arc into a set of metallic plates, making the arc splitting into a
number of smaller arcs, each causing a voltage drop of 20-30V and limiting the fault current
[Lindm2004]. However, the current limiting circuit breakers only limit the current in case of actuation
and always interrupt. Selectivity is therefore limited.
[CIGRE2003] provides a list of requirements for the ideal FCL:
Negligible impedance under nominal operating conditions – i.e. negligible resistive and
reactive losses, no related needs for cooling and no voltage drop,
Fast response – the first peak of short-circuit current (<5 ms) must be limited in order to limit
the magnetic forces on the primary equipment components,

Multiple operations – the FCL device has to recover automatically, with very short recovery
time in order to be able to respond to multiple re-closure cycles, and in order to not require a
field trip of service personal for replacement of components after operation,
Selectivity – the ―let through‖ current should be selectable, either by the design of the FCL
device or by a configurable setting. It should not limit motor start currents and not respond to
transients or capacitor switching currents. The current for coordination with protective
devices has to be provided, so that existing protection concepts do not need to be modified,
High reliability – the FCL must correctly operate under any fault magnitude and any fault
phase condition. Correct response must reliably occur after a long duration without fault
events as well as in cases of consecutive multiple faults,
Compact size, long lifetime, maintenance free and low cost.
In Table 6, compliance with the requirements for the ideal FCL is compared for different
technologies.
TABLE 6
COMPARISON OF REQUIREMENTS AND CURRENT LIMITATION (CL) TECHNOLOGIES
Technology Requirements
nominal impedance
response time
repeat-ability
selectivity reliability costs, size
CL transformer V drop fast Given ok high high, small CL reactor V drop fast Given ok high med, med Resonant circuit ok fast Given ok high high, large CL fuse ok fast Replace limited high low, small Is-limiter ok fast Replace limited high high, small CL circuit breaker ok fast Ok limited high low, small PTC resistor ok medium Cooling limited medium low, small
Superconducting FCL ok Fast Cooling ok not proven High, med. Liquid Metal FCL ok medium Ok ok not proven med, small Driven-Arc FCL ok fast Ok limited not proven med, med Semiconductor based FCL ok fast Ok limited not proven high, med. Hybrid FCL ok Fast Cooling limited not proven med, med.
Next we provide details on Is limiter and liquid metal FCL - promising current limiting methods which
are currently commercially available and under development respectively.

1.6.3 Is-limiter
A device called Is-limiter combines a fast switch and a current limiting fuse in parallel (Figure 26a)
[ABB2008-1]. Under normal operation the current flows via the low impedance switch. Upon
detection of a fault current by the electronic control circuit, the fast switch is triggered and the current
is commutated to the fuse. By using a small charge for interrupting the main current path, the Is-
limiter is able to interrupt the fault current within 0.5 ms after receiving the tripping signal. Due to the
electronic control the tripping conditions can selectively be chosen. The Is-limiter is a single-shot
device and the switch/fuse insert needs to be replaced after actuation. Is-limiters are available for up to
40.5 kV and for rated currents of several kA.
Figure 26. IS-limiter with insert (a) and its current limiting effect (b).
If the current is not allowed to be completely interrupted by the Is-limiter a parallel combination of an
Is-limiter with a reactor can be used. Upon tripping of the Is-limiter the current is commutated on the
reactor, which limits the fault current. The elimination of the permanent resistive copper losses of the
reactor makes the Is-limiter being amortized within a few years only.
1.6.4 Liquid metal fault current limiter A physical concept of liquid metal current limitation based on Pinch-effect was introduced in the beginning of 70th. [Schoft2005] and [Tepper2006] propose an innovative liquid metal current limiting principle that does not apply the Pinch-effect but limits the current without arcing.
Figure 27 illustrates major components and operating principle of liquid metal fault current limiter
(LMFCL). It consists of solid metal electrodes for connection of the device to a transmission
line/cable and multiple capillaries filled in with movable liquid metal electrodes. The liquid metal
used nowadays is an alloy Galinstan (68.5% of gallium, 21.5% of indium and 10% of tin), has high
electric conductivity, a melting temperature of about -20°C, and is environmentally friendly. Liquid

metal electrodes are guided automatically along resistive material elements for the current limiting
path by a magnetic over-current-dependent Lorenz force Fmag. Magnetic forces can be generated either
by the fault current itself or externally. The device can therefore either be self- or externally triggered
with a response time in the low millisecond time range.
In a normal operation, a continuous, inner conductive connection exists between the solid electrodes via the liquid metal electrodes (
Figure 27a). At nominal current LMFCL has negligible losses comparable to busbar or cable losses. During the fault, the liquid metal electrodes are displaced in the capillaries. The jump in fluid height interrupts the electrical connection of the solid electrodes via the liquid metal, resulting in a strong increase of the total electric resistance and current limiting action of the device ( Figure 27b). Subsequent to clearing or eliminating the short circuit, the connecting capillaries refill
with liquid metal without any external action (back-flow of the liquid metal into its original position
by the gravitation force) whereupon the LMFCL is operational again – a ―self healing‖ property.
Figure 27. Operating principle of LMFCL: conducting (a) and current limiting (b) modes.
Amongst the advantages achieved by the LMFCL are:
electric arc-free, reversible active current limitation,
low resistance in the main current path,
rapid reaction time,
self-healing effect,
little wear and easy maintenance,
cost level of LMFCL is expected to be in the same range with conventional circuit breakers,
i.e. approximately around 1 kUSD per MW.

A single capillary is able to carry a nominal current of several hundred Amps and can create a voltage drop of up to 100V. By using capillaries in series and parallel connection, a LMFCL for literally any current or voltage can be constructed.
Figure 28 illustrates the experimental LMFCL setup with six parallel current paths each consists of
four series capillaries. This arrangement has 2kA rated current, 20kA short circuit current and 1kV
rated voltage.
Figure 28. Liquid metal FCL matrix.
Sites for high short circuit current testing are extensive and complex. Thus, in the present early
developments, a less extensive testing facility is used. An impulse current test bench is applied in
order to study the liquid mechanics and the electric characteristics of liquid metal filled capillaries
with resistive capillary walls. The test system setup is described in details in [Tepper2006]. First, the
characteristic of liquid metal filled capillaries with resistive capillary walls is studied under normal
air. In order to achieve a good electrical contact between liquid metal and the capillary walls the
capillary walls are wetted by liquid metal before assembly. Liquid metal moves upwards in the
capillaries while the accelerating magnetic field is applied and the capillary resistance increases (
Figure 29). However, it is observed that the capillary resistance breaks down from time to time during
liquid metal movement (
Figure 29, green curve). This effect mainly stems from the fact that liquid metal oxidizes under air. It
has a profound effect on the way the liquid metal wets different surfaces. Residues of liquid metal
oxide unintentionally wet the insulating material in the back and in the front of the capillaries. The
thin liquid metal film on the resistive capillary walls somewhat short circuits the resistive path. As a
result the proposed principle does not work reliably under normal air.

Figure 29. Development of capillary resistance (single capillary, capillary height 8 mm, width 5 mm,
and depth 10 mm, and the height of liquid metal inside the capillary is 8 mm, air, wetted electrodes).
Next, the liquid metal capillaries are put in a vacuum chamber (10-6 mbar) made from non magnetic
austenitic stainless steel and the experiments are repeated (
Figure 30).
Figure 30. Development of capillary resistance (vacuum, non wetted electrodes).
The capillary walls were no longer wetted by liquid metals. Thus the electrical contact between liquid
metal and the resistive capillary walls degrades so that the risk of liquid metal loosing its contact to
the capillary walls during the movement increases. On the other hand the resistive capillary walls
keep their well defined resistance and there is no thin liquid metal film that may partly short circuit
the resistive capillary walls. The results of the experiments exhibit that at low and medium

accelerating forces a liquid metal is still in good electric contact with the resistive capillary walls
while moving upwards in the capillary. The maximum measured resistance of the capillaries
corresponds to the total resistance of the capillary walls. The development of the capillary resistance
shows a smooth and continuous increase during liquid metal movement (
Figure 30, green curve). Therefore, it can be concluded that liquid metal filled capillaries with non
wetted resistive capillary walls under vacuum represent the best configuration to be used in the
LMFCL. Though, it has to be assured that the applied magnetic field does not lead to excessive
accelerating forces on the liquid metal inside the capillary.
PSPICE was used to perform numeric simulations considering the electrical properties of the test
bench and the properties of the liquid metal filled capillaries. Doing so and still assuming the test
parameters from the non wetted, single capillary under vacuum (
Figure 30) the present simulation also exhibits the electric characteristics of the liquid metal filled
capillary (
Figure 31). The simulated electrical characteristic of the liquid metal filled capillary closely matches
the experimental results. The present configuration of geometry and accelerating magnetic force
provides a good balance in the trade of between cohesion of liquid metal and speed of current
limitation.
Figure 31. Numeric simulation of development of capillary resistance vs. experimental results
(vacuum, non wetted electrodes).
1.7 Conclusions

In this report, the effect of DERs and topological changes on sensitivity and selectivity of microgrid protection
(loss of relay coordination) is investigated. A novel adaptive microgrid protection system using digital relaying
and advanced communication infrastructure is proposed.
The adaptive protection system is based on a centralized architecture with pre-calculated information where
protection settings are updated periodically by the microgrid central controller with regard to a microgrid
operating state. Settings for non-directional or directional over-current relays are pre-calculated during off-line
fault analysis of a given microgrid.
Fault detection and selective isolation are very challenging tasks in microgrids dominated by DER with power
electronics interfaces. The proposed solution is based on extension of the microgrids adaptive protection system
with a directional interlock.
Several scenarios have been set up to illustrate the effects of adaptation of relay settings. The results of these
simulations have been reported and analyzed.
High penetration level of synchronous DERs makes the existing microgrids in many cases reaching their fault
level limits and further extension is not possible without costly replacement of the equipment. Several current
limiting solutions for avoiding replacement of equipment exist and are regularly applied by utilities. However, all
solutions have some disadvantageous. The ideal current limiter for commercial application as described above
does unfortunately not yet exist and has therefore still to be developed.
1.8 References
[ABB2007] ABB SACE S.p.A, ―Low voltage moulded case circuit breakers Tmax‖, Product
brochure, 2007. Available [online]:
http://library.abb.com/global/scot/scot209.nsf/veritydisplay/117ea5b751d87f12c1257
34e002a25dc/$File/1SDC210015B0203.pdf
[ABB2008-1] ABB Carol Emag, ―Is limiter‖, Product brochure, 2008. Available [online]:
http://library.abb.com/global/scot/scot235.nsf/veritydisplay/31656b3a0912262ac1257
4f700565d1e/$File/2243-08%20E_300dpi.pdf
[ABB2008-2] ABB SACE S.p.A, ―DOC simulation tool‖, User Manual version 1.0, 2008
[AlNass2005] H. Al-Nasseri, M.A. Redfern, R. O'Gorman, ―Protecting microgrid systems containing
solid-state converter generation‖, Int. Conf. on Future Power Systems, 2005
[Bower2002] W. Bower, M. Ropp, ―Evaluation of islanding detection methods for photovoltaic
utility interactive power systems,‖ IEA-PVPS, http://www.iea-pvps.org, Online report
T5-09, March 2002. [Online]. Available: http://www.oja-services.nl/iea-
pvps/products/download/rep5_09.pdf
[CIGRE2003] CIGRE WG A3.10, ―Fault Current Limiters – Fault Current Limiters in Electrical
Medium and High Voltage Systems‖, CIGRE Technical Brochure, No. 239, 2003

[CIGRE2006] CIGRE WG A3.16, ―Guideline on the impacts of fault current limiting devices on
protection systems‖, A3-06 (SC) 33 IWD, Final Draft, 2006
[CIRED2005] CIRED WG03, ―Questionnaire about distribution networks‖, Summary of results
[online]. Available: http://www.cired.be/WG03-Report%20appendix%20A.pdf [Dries2007] J. Driesen, P. Vermeyen, R. Belmans, "Protection issues in microgrids with multiple
distributed generation units," 4th Power Conversion Conf., Nagoya, 2007
[EU2006] EU Microgrids [online]. Available: http://microgrids.power.ece.ntua.gr
[Feero2005] W. Feero, D. Dawson, J. Stevens, ―Protection Issues of the Micorgrid Concept‖,
[online]. Available: http://certs.lbl.gov/pdf/protection-mg.pdf
[Girgis2001] A. Girgis and S. Brahma, ―Effect of Distributed Generation on Protective Device
Coordination in Distribution System‖, Large Engineering Systems Conf. on Power
Engineering, 2001
[Hatziar2007] N. Hatziargyriou, A. Asano, R. Iravani, C. Marnay, ―Microgrids‖, IEEE Power
Energy Mag., vol. 5, no. 4, pp.78-94, July/August, 2007.
[IEC2001] IEC 60909-0, ―Short-circuit currents in three-phase AC systems – Part 0: Calculation
of currents‖, 2001
[Jaya2004] N. Jayawarna, ―Fault current contribution from power converters‖, EU Microgrids
project [online], Available: www.microgrids.eu, 2004
[KEMA2005] KEMA Limited, ―The contribution to distribution network fault levels from the
connection of distributed generation‖, 2005
[Kraetz2000] A. Krätzschmar, F. Berger, P. Terhoeven, S. Rolle, ―Liquid metal current limiters‖,
20th Int. Conf. on Electrical Contacts, 2000
[Kropos2008] B. Kroposki, R. Lasseter, T. Ise, S. Morozumi, S. Papathanassiou, N. Hatziargyriou,
―Making Microgrids Work‖, IEEE Power Energy Mag., vol.6, no.3, pp.40-53,
May/June, 2008.
[Lasset2002] R.H. Lasseter, ―MicroGrids‖, IEEE PES Winter Meeting, New York, 2002
[Lindm2004] M. Lindmayer, E. Marzahn, A. Mutzke, T. Rüther, M. Springstubbe, ―The process of
arc-splitting between metal plates in low voltage arc chutes‖, 22nd Int. Conf. on
Electrical Contacts, Seattle, 2004
[Nukk2007] H. Nukkhajoei, R.H. Lasseter, ―Microgrid Protection‖, IEEE PES General Meeting,
2007
[Overb2006] F. van Overbeeke, ―Technical requirements for protection device for LV network
with low fault level‖, EU More Microgrids project [online], Available:
www.microgrids.eu, 2006
[Rock1988] G.D. Rockefeller et al., ―Adaptive Transmission Relaying Concepts for Improved
Performance‖, IEEE Transactions on Power Delivery, Vol. 3, No. 4, 1988

[Schoft2005] S. Schoft, J. Tepper, K. Niayesh, ―Short Circuti Current Limitation by Means of
Liquid Metal Technology‖, 10th Int. Conf. Switching Arc Phenomena, Lodz, 2005
[SEMI2006] EPRI, ―Overview of SEMI F47-0706‖ [online]. Available: www.f47testing.com, 2006
[SGrids2006] European Technology Smart Grid Platform, ―SmartGrids: Vision and Strategy for
European Electricity Networks of the Future‖ [online]. Available:
http://www.smartgrids.eu/documents/vision.pdf
[Tepper2006] J. Tepper, S. Schoft, ‖Fault Current Limitation by means of Liquid Metal
Technology―; 23d Int. Conf. on Electrical Contacts, Sendai, 2006
[Vilath2006] D.M. Vilathgamuwa, P.C. Loh, Y. Li, ―Protection of Microgrids During Utility
Voltage Sags‖, IEEE Transactions on Industrial Electronics, vol. 53, no. 5, Oct.
2006
[Yong1990] S. Yong, T. Michalak, ―Optimizing system coordination and over-current protection
with zone selective interlocking‖, in Proc. Textile, Fiber and Film Industry Technical
Conference, 1990
1.9 Appendix
Parameters of utility grid Value Rated voltage, V 6000 Short circuit power, MVA 500 Parameters of distribution transformer Value Rated voltage primary/secondary, V 6000/400 Rated power, kVA 630 Vcc, % 4 LV distribution system TN-S Parameters of cables Value Type EPR/XLPE Cross-section phase, mm2 3x185 Cross-section neutral, mm2 95 Nominal current, A 750 Resistance at 200C phase/neutral, mOhm 8.34/16.24 Inductance at 200C phase/neutral, mOhm 6.17/6.25 Length, meters 150 Parameters of feeder circuit breakers Value Rated voltage, V 400 Rated current, A 800 Parameters of loads Value Rated voltage, V 400 Rated current, A 100 Rated power factor, cos 0.9 Parameters of synchronous DERs Value

Rated voltage, V 400 Rated apparent power, kVA 160 Rated power factor, cos 0.8 Direct-axis sub-transient reactance Xd‘‘, % 9.6 Quadrature-axis sub-transient reactance Xq‘‘, % 10.2 Direct-axis transient reactance Xd‘, % 21 Direct-axis synchronous reactance Xd, % 260 Negative sequence reactance X2, % 9.8 Zero sequence reactance X0, % 2.1 Direct-axis sub-transient short circuit time constant Td‘‘, ms 11 Direct-axis transient short circuit time constant Td‘, ms 85
2 Novel Protection System for Microgrids
(Fraunhofer IWES)
2.1 Summary
A new protection scheme for Microgrids was developed, implemented and tested. The new protection
scheme, implemented in a ―Multifunctional Intelligent Digital Relay (MIDR)‖, permits automatic
adaptation of protection settings according to the actual type of grid structure and the interconnection
of Distributed Energy Resources. In the case of a fault a routine implemented to the MIDR generates
selective tripping signals which are sent to respective circuit breaker/s. The MIDR allows for
continuous measurement and monitoring of the analogue and digital signals originating from
equipment and network respectively.
For the tests the MIDR was connected to a 10-kV hardware network simulator. Current and voltage
measurements from that network were taken by the MIDR and processed in real-time. Data from a
Decentralised Energy Management System were taken periodically, but not in real time. These data
were used for the adaptation of protection settings. With the performed tests the proper functioning of
the MIDR could be proved.
2.2 Introduction
This report presents the activities carried out by Fraunhofer IWES concerning ―Novel protection
schemes for Microgrids‖. The activities comprise analyses of conventional protection methodologies
for use in Microgrids, definition of required protection behaviour, development and test of novel
protection schemes and devices, and investigations on the central static switch.
In Chapter ‖State of the art―, the actual state of the art concerning distribution network protection is
described and discussed regarding its relevance for grid integration of Microgrids. Possible challenges

for protection and control are described, and appropriate methodologies given in scientific papers are
presented and critically discussed.
Chapter ―Analysis of different fault situations – definition of required protection behaviour‖ deals
with analyses of fault situations in Microgrids. The chapter starts with giving background information
on configuration and operating characteristics of the Microgrid considered in this report. Based on
that, different possible fault situations in the Microgrid are analysed. For each scenario requirements
on the protection behaviour are formulated.
In Chapter ―Development of novel protection scheme and device‖ the development of a novel
protection scheme for use in Microgrids, and its software and hardware implementation is described.
Chapter ―Investigation of novel protection device – test and validation‖ deals with the laboratory test
of the developed novel protection device. Details on the used equipment, the chosen test procedure
and the results of the test are given. Furthermore, the last subchapter presents the investigations
performed on the central static Microgrid switch.
In Chapter ―The developed protection scheme in view of German Grid Codes‖ relevant issues
concerning compatibility of the developed novel protection scheme and the new German
interconnection guideline for generating units connected to the medium voltage distribution network
are discussed.
In Chapter ―The developed protection scheme in view of Virtual Power Plants, Virtual Utilities and
Smart grids‖ the developed novel protection scheme is discussed in the context of Virtual Power
Plants, Virtual Utilities and Smart Grids respectively.
Chapter ―Conclusion‖ gives concluding remarks on the activities.
2.3 State of the art
In this chapter an overview on state-of-the-art protection concepts for distribution networks with
distributed generation is given.
Moreover, specific challenges for system protection in Microgrids are described.
2.3.1 Effect of DER on system protection – a review on proposed protection
concepts for distribution networks
The consequences of the changes in grid structure due to the integration of Distributed Energy
Resources (DER) affect the protection system, which has been conventionally designed for a vertical
grid structure, and may lead to protection malfunction [HAD99], [SAL01], [CHI03], [HAK04]. The
existing protection concepts have to be adjusted according to the changes in grid structure or new
concepts are to be developed [HAN03], [JKL02], [JÄK02], as future problems with the protection
system are likely to occur. Most of the blackouts in recent years can be regarded as a consequence of

protection practices which have not been adequately adjusted to the new structural conditions
[RET03]. As a literature research shows, this problem is globally dealt with and solutions are
searched for [CHE08], [MÄK08], [JAV08], [YUA07], [VIA06].
As revealed by the literature research, after the interconnection of new DER adequate adjustments in
the settings of the time overcurrent protection devices are necessary, to guarantee the required level of
selectivity and stability for both interconnected and islanded operation. Time overcurrent protection is
typical for medium voltage (MV) grids as it is quite simple. To solve the problems originating from
the interconnection of DER one solution could be a flexible adaptation of the protection relay settings
combined with the utilisation of protection relays with direction determination function. Adaptation
of settings could mean a permanent adaptation of relay characteristic settings or a switching of relay
settings groups. However, the more units of DER are to be interconnected, the more difficult a
selective parameterisation of the protection system becomes, as the short-circuit ratios are
fundamentally changing. To avoid this type of problem Iliceto et al. [GAT03] claim, that
interconnected DER should only have a marginal impact on the short-circuit ratios, what does not
conform to reality. The more DER are integrated the more the short-circuit ratios are changed.
Another possibility to solve the problem of selective parameterisation would be an iterative and
optimised calculation process [MÄK04], [ABY03]. Based on actual data of the grid and the
generation units, this calculation process provides offline coordinated relay settings according to
standardised time overcurrent tripping curves. It is not clear if this calculation process converges in all
possible cases and if the tripping times are short enough not to loose stability. Moreover other
concepts to solve these problems are necessary. The investigations on a network branch done by
Brahma and Girgis [BRA02] revealed that it is necessary to apply microprocessor-based time
overcurrent relays having the following characteristics:
- possibility of the utilisation of standardised tripping curves for the operation with and without
DER,
- possibility of the utilisation of user-defined tripping curves.
Adaptive protection devices are one solution when having changing grid conditions. In [BRA04] the
authors suggest to divide the system into zones with each zone having an appropriate amount of DER.
Furthermore the DER unit with the highest capacity shall be responsible for frequency control. These
separate zones are to be connected by zone-forming circuit breakers, which are centrally controlled by
a main relay in the substation. The circuit breakers shall also be capable to synchronise. The main
relay is a computer-based device, which is able to process and save large amounts of data and to
communicate with other devices, e.g. with the zone-forming circuit breakers and the interconnection

protection devices of the DER. The main relay shall detect the fault, determine type and location of
the fault and then isolate the affected zone by opening the relevant circuit breakers. Also the DER of
the affected zone have to be disconnected. Thus, all other zones can continue normal operation. Also
automatic reclosing (if applied) is controlled by the main relay. The protection algorithm described
above requires continuous real-time measurement of different quantities as well as the
synchronisation of all three-phase current phasors (i.e. phasors of all DER and the phasors of the main
power network). Furthermore the directions of energy flow are calculated continuously. The devices
for phasor measurement use the pulse of a GPS receiver [JIA99], [JIA00], [JIO00].
When using one main relay, in case of breakdown of this device the whole protection concept fails.
To minimise fault clearance times of time overcurrent protection devices Zhang et al. [ZHA04] used
the existing primary network instead of setting up a separate network for communication. They
introduced an acceleration module, which detects tripping actions of fast protection devices by
changes in short-circuit ratios and initiates appropriate actions. In doing so the previous protection
concept of classical grading is not modified. This concept did not result from the problem of a
growing number of DER, but from the problem of fundamental changes in subordinated grids arising
from intermediate infeeds. Intermediate infeeds lead to a growing density of nodes and therefore to
higher fault clearance times when applying classical grading with standardised time overcurrent
protection devices [MOR08], [GAL05], [GEI05], [KAU04], [VER04].
Distance protection devices can clear a fault in high-speed. Today this type of devices is not applied
in LV, but in MV grids; in HV grids it is common practice for line protection. Chilvers et al. [CHI03]
suggest a concept of protecting subordinated grids with DER by using distance protection devices. By
affecting the current phasors, intermediate infeeds of DER have an impact on the measurement of the
fault impedance. Therefore the maximum possible power of interconnected DER becomes limited. As
the DER connected to different nodes results in a higher short-circuit power, short-circuit current
limiters may be required, which again restricts the functionality of distance protection devices. The
effects of the utilisation of fault current limiters have been analysed by the CIGRE working group
A3.16 ―Fault Current Limiters – Impact on Protection Schemes‖.
These remarks on the ―State of the Art‖ show that experts agree on the main impacts of distributed
generation and the resulting need for research regarding the handling of problems in protection
coordination, the development of adaptive protection concepts etc. [DEG04], [SAL01], [SCH99],
[BOP03], [YAG03], [HAK05], [SHU06], [KEI07].
To allow for conformity with the axioms of grid protection (i.e. selectivity, sensitivity, reliability,
speed and cost effectiveness) and to ensure a high level of security of supply even under the

conditions of a high DER penetration, there is the need for holistic research and the development of
systematic solutions and basic concepts, which presently are indeterminable within circles of experts
[DEG04].
2.3.2 Challenges for system protection in Microgrids
All investigations done in this work package are based on the project specific definition of the term
―Microgrid‖:
Microgrids comprise Low Voltage distribution systems with distributed energy sources, storage
devices and controllable loads, operated
a) connected to the main power network or
b) islanded,
in a controlled, coordinated way [MIC06].
Legend: DMS – Distribution Management System, MGCC – Microgrid system Central Controller
Fig. 2.1 Configuration of Micro grid [MIC06]
The existence of two possible and normal states of operation presents new challenges concerning
system management, layout of equipment (controllable) and characteristics of the protection system.
To avoid non-selective tripping of protection relays, the protection system of the future shall
permanently be capable of:
- identifying the actual state of operation,

- automatically defining and implementing new required protection settings.
The German interconnection guidelines for generation units [COD08], [COD01] describe
requirements on the parallel operation of generators with the power system (e.g. the behaviour of the
generation units during fault conditions). However, none of the European guidelines comprise the
term ―Microgrid‖.
As mentioned above, the idea of the Microgrids project is to consider both states of operation;
interconnected and intentionally islanded operation. Thus, the concept of Microgrids would lead to
advantages compared to the old philosophy, for instance:
- In case of faults in the main grid the Microgrids can independently disconnect from the main
grid, build up a coordinated and controlled state of operation and uninterruptedly supply
power to the interior loads.
- In case of faults inside the Microgrid only the smallest possible part of the Microgrid should
be isolated to keep alive the rest of the Microgrid, allowing for an ongoing power supply from
the Microgrid‘s generation units to both the adjacent loads and the main grid.
To guarantee reliable functioning of the protection system, this universal concept requires the
utilisation of more sophisticated and (for the time being) more expensive protection devices,
compared to the conventional concept of simply operating the generation units in parallel to the main
grid. As literature researches revealed there is a big backlog in developments in this field of
application.
Therefore new protection concepts and involved protection equipment shall be developed or, if
applicable, the protection system properties shall be adjusted.
For the development of protection concepts for Microgrids the following challenges shall be
considered in particular:
- Changes in the operating performance of the grid, e.g. bi-directional power flows,
permanently fluctuating short-circuit powers, appearance of new phenomena under fault
conditions (i.e. enlargement of short-circuit currents, reduction of short-circuit currents under
islanded operation conditions, blinding and sympathetic tripping)
- Acceleration of transient phenomena
- Suitability of conventional protection practices in terms of new types of grid operation and
phenomena

In the following some of the phenomena mentioned above (underlined) shall be explained more in
detail:
Enlargement and reduction of short-circuit currents
In most cases according to the principle of superposition the short-circuit current in a Short-Circuit-
Point (SCP) is enlarged by the short-circuit contribution of DER. For instance, the short-circuit
current at SCP 4 in Fig 3.1 (chapter 3) is the sum of the short-circuit contribution originating from the
MV level (main power network), the PV system, the storage unit and the flywheel unit). This
phenomenon is described in several books with focus on ―calculation of short-circuit current‖.
Therefore, no reference is given here.
By contrast, during islanded operation the short-circuit currents in the Microgrid are reduced
[MÄK04], [FRI08], [MOR08], [KAU04], [VER04], [POP08], [DEU07], [KUM04].
Blinding
At certain grid points the occurring short-circuit current can go down to low values, due to the short-
circuit contribution of DER installed in other sections of the considered network. This phenomenon is
referred to as ―blinding‖ [MÄK05]. The negative aspect of this phenomenon is non-tripping of
protection relays, despite existence of a fault in the related feeder.
Sympathetic tripping
In contrast to the phenomenon ―blinding‖ the phenomenon ―sympathetic tripping‖ [MÄK05], [KEI07]
describes a hyper function of protection relays in neighbouring feeders of the defective feeder.
2.4 Analysis of different fault situations – definition of required
protection behaviour
In this chapter a short-circuit as well as a protection analysis of a typical Microgrid configuration are
performed.
At first, the approach is based on the determination of a typical Microgrid configuration including its
commonly used equipment (transformers, lines etc.) and feed-in situations. In a next step the range of
occurring short-circuit powers at different grid points is identified. Finally, different fault situations
are considered and requirements on the protection behaviour are defined.

For both interconnected and islanded operation of the Microgrid there are different framework
requirements for protection functioning. Primarily this is related to changes in short-circuit power and
network impedance for different nodes within the Microgrid. Protection settings may have to be
changed when switching from one mode of network operation to another. In doing so the settings
could be adapted to the current network status, comprising type of network operation, switching states
of the circuit breakers and connected DER and loads.
In addition, there are the requirements of Grid Codes [COD04] and the specifications for parallel
mains operation of DER [COD01], [COD08]. Network protection must take into account situations
with remarkable infeed contribution from DER.
2.4.1 Microgrid configuration and relevant data
Circuit diagram
For the investigations the basic grid configuration of the Microgrid in Fig. 2.1 was taken and adapted
(see Fig. 3.1 below). It consists of a MV public power supply system and two radial branches of LV
lines with the DER units connected at LV bus bars [SHU09].
Technical data
Cables
The radial feeders were configured in the following way, in order to achieve the maximum total
length:
- Voltage limits ±10 % of UN = 400 V (EN 50160, Nov. 1999, slow voltage deviations)
- The power of connected loads or DER units corresponds with the transmission capacity of
line (75 to 750 kVA)
Distribution line which corresponds with a minimum cross section of transmission cable:
Type R’
(Ohm / km)
X’ (Ohm / km)
C’ (10-6 F / km)
Nominal current (A)
Nominal transmission
capacity (kVA) NAKBA 4 x
35sm 0.876 0.091 0.59 108 74.82
By assumption of a common load of 75 kVA, which is connected at busbar St8, the total line length of
225 m between SCP2 and SCP9 was calculated.

Fig. 2.2 Configuration of the Microgrid from Fig. 2.1 for analysis of short-circuits
Distribution line which corresponds with a maximum cross section of transmission cable:
Type R’
(Ohm / km)
X’ (Ohm / km)
C’ (10-6 F / km)
Nominal current (A)
Nominal transmission
capacity (kVA) NKY 1 x 500rm 0.0366 0.0848 1.33 1025 710.14
By assumption of a common load of 750 kVA the total line length of 435 m was calculated.
In each case the short-circuit calculations were made for a maximum and minimum fault sequential on
each busbar with and without DER unit.
Distribution transformer
Rated apparent power SrT 1600 kVA
ukrT 6 %
ZrT, OS 3.75 Ω
Interconnection point of Microgrid to the 10 kV network

The short-circuit apparent powers at the 10-kV side of the transformer are assumed as:
- SSC1 = 200 MVA for interconnected operation and
- SSC2 = 20 MVA for islanded operation
2.4.2 Short-circuit currents for interconnected and islanded operation
In order to show the variations of the value of the short-circuit app. powers occurring when changing
from interconnected to islanded operation, short-circuit calculations for all grid points given in Fig.
3.1 were done. Table 3.1 shows the grade of variation of short-circuit apparent powers, by giving the
ratio SSC, interconnected / SSC, islanded for different grid points.
Table 2.1 Range of variation of short-circuit apparent powers in different grid points of the Microgrid when changing from interconnected to islanded operation
Number of bus bar SSC, interconnected / SSC, islanded (cross section 500
mm²)
SSC, interconnected / SSC, islanded (cross section 35
mm²) SCP1 2.95 - 2.98 2.95 - 2.98 SCP4 1.73 - 2.76 1.09 - 1.97 SCP6 1.45 - 2.58 1.03 - 1.49 SCP9 1.32 - 2.43 1.02 - 1.30
These data show that
- the range of variation is 1.02 to 2.98,
- the reduction at the LV side of the transformer is extremely high (2.95 to 2.98),
- the variation at remote grid points can be very small (only 1.02 to 1.30).
These values demonstrate that there might be selectivity problems in terms of system protection. An
adaptation of protection settings could be a solution to avoid protection malfunction and non-selective
tripping respectively. Without any changes in the protection concept and settings respectively,
selectivity can be endangered when connecting / disconnecting DER or changing from interconnected
to islanded operation. To avoid protection malfunction network operation might be continuously
supervised and protection settings might be adapted where required.
In the following different fault scenarios are analyzed.
2.4.3 Fault in area between main grid and Microgrids
In this case a short-circuit at short-circuit point no. 1 (SCP1, Fig. 3.2) is considered.

For this fault scenario, neither exchange of power between different Microgrids, nor between the
Microgrid and the main power network is possible. The following behaviour of the system protection
has to be ensured:
- Relay R1 has to trip in order to isolate the Microgrid from the fault
- Relay R2.1 can trip optionally. By doing so the transformer is disconnected from the
Microgrid and the operation of the Microgrid is not burdened by the inductive no-load
currents of the transformer.
In the Microgrid a type of operation has to be established, that controls ―itself‖ by means of a control
algorithm like e.g. SELFSYNC.
Fig. 2.3 Relevant short-circuit grid points
2.4.4 Fault in low voltage connection point of Microgrid
In case of a fault at SCP2 (Fig. 3.3) conventional protection concepts will clear the fault by tripping
the relays R2.1, R2.2 and R2.3. This will only work, if relays R2.2 and R2.3 are non-directional.

To guarantee a selective fault clearance for all possible fault situations, the LV station controller shall
monitor the direction of the short-circuit currents at both LV feeders. This is technically feasible, as
all LV switching cabinets are located in the same room within one switching substation. Blocking
contacts of the relays shall be connected to the logical block ―AND-OR-AND‖. The logical block of
the DEMS has to synchronously compare the logic signals of short-circuit directions for all branches.
Decisions are made and corresponding tripping signals are sent to the circuit breakers. For instance, in
case of a fault at SCP2 the logical block of the DEMS sends tripping signals if it has ―1-1-1‖ at its
digital inputs. ―1‖ is obtained, when there is a short-circuit current instead of nominal current and the
occurring voltage drop is higher than permissible. Relay R2.1, R2.2 and R2.3 will then receive
tripping signals.
Fig. 2.4 Fault at the LV side of the transformer
2.4.5 Faults inside Microgrid
In this case faults at SCP3 to SCP10 are considered (Fig. 3.2). In the following an example of a fault
inside the Microgrid is discussed.

Fig. 2.5 Faults at the LV level, inside Microgrid
In case of a fault inside the Microgrid at SCP3 (Fig. 3.4), the following behaviour of conventional
system protection can be expected:
- Relay R2.2 will trip.
- If relay R3.1 is directional (in the direction of conventional power flow), it will not trip and
DER units at the upstream feeder may feed the fault.
- Non-directional relay R2.3 will trip (cp. subchapter 3.4). This behaviour is non-selective and
is known as the phenomenon ―sympathetic tripping‖ (see chapter 2). By selective protection
behaviour, the power supply at the right feeder could have been sustained.
- The interconnection protection R3.2 will disconnect the micro turbine.
For a selective fault clearance, the following protection behaviour is required:
- Relay R2.2 measures the same direction of current as under normal operating conditions.
Based on a comparison of this operating state and recorded (―trained‖) data on normal
operating conditions, a tripping signal could be generated and sent to relay R2.2, as logic data
combined with measurements reveal a short-circuit.

- Relay R3.1 shall also receive a tripping command to avoid any contribution to the short-
circuit current from the upstream grid section.
- In order to avoid the phenomenon ―sympathetic tripping‖ relay R2.3 has to be blocked. (In
conventional protection systems, relay R2.3 will trip if it does not offer the functionality of
direction determination.)
By continuously monitoring the operating conditions of the different sections of the Microgrid, the
new protection system gains the characteristics of a differential protection relay.
2.4.6 Faults in case of islanded operation of Microgrid
When a Microgrid is operated as an island, system protection also has to be adjusted according to the
changed grid relationships (SC powers etc.). The logic used for protection behaviour can stay the
same as connected to the main power network, but the relay settings have to be changed.
2.5 Development of novel protection scheme and device
In this chapter the development of a novel protection scheme for use in Microgrids, and its software
and hardware implementation is described.
The necessity for adaptability of protection settings for different types of network operation has been
demonstrated by numerous publications [HAN03], [JKL02], [JÄK02] [RET03], [CHE08], [MÄK08],
[JAV08], [YUA07], [VIA06].
The task to develop the claimed adaptability of protection settings is diversified. Therefore, there is
not a unique solution to be developed. Depending on the characteristics of grid and equipment,
different solutions can be found.
Fraunhofer IWES [SHU06] suggests integrating a state estimation to the protection system, which
monitors the DER operating state and sets up a corresponding data exchange with the protection
system. Thus, new network operating conditions could be assessed, functioning of the protection
system could be analysed and, if required, protection settings could be adapted.
2.5.1 General requirements for adaptive protection
Extraordinary changes will occur during transition from interconnected to islanded network operation.
The application of DER, which are dependent on fluctuating primary energy sources, leads to changes
in network operating conditions and lowers the efficiency of the conventional protection system
during faults.

In order to cope with these changes, as mentioned above Fraunhofer IWES [SHU06] suggests
integrating a state estimation to the protection system, which monitors the DER operating state and
sets up data exchange with the protection system.
To ensure effective functionality of system protection in Microgrids, either the existing controllers of
DER and loads can be used or separate controllers can be installed at all points of interconnection
(Fig. 3.1).
2.5.2 Protection scheme and its units
In the flow chart of Fig. 4.1 the algorithm of the developed adaptive protection relay is shown
[SHU06]. The scheme consists of two blocks:
- Real time block
- Non real time block
The Real time block analyses the actual grid state, acquired by continuous measurement of grid
parameters, and detects disturbances due to adjusted tripping characteristics. When the tripping
condition is reached, a tripping signal to the respective circuit breaker is generated.
The Non real time block uses the prediction data of the availability of Distributed Generators (DG) /
DER, in order to review the selectivity of tripping characteristics for each new operating condition
and to adapt, if selectivity is not given any longer. If the adaptation is successful and the boundary
conditions are not broken, the tripping characteristics of respective relays will be matched. If there is
no possible solution without breaking the boundary conditions, a signal will be generated that forbids
the acceptance of the operation predicted by the (Decentralised) Energy Management System (DEMS
/ EMS).
The suggested adaptive protection concept does not consider the function of automatic reclosing,
which usually is used for temporary faults occurring at OHL (overhead lines).
Special relevance in this concept has the data transfer between adaptive relays and EMS via long
distances. Communication via power line carrier (PLC) and LAN was selected.
In the flow chart below bold-lined figures indicate modules for adaptive protection. Thin-lined figures
represent modules of conventional protection technique.

2.5.3 Online communication between units
For the implementation of the adaptive network protection concept into the utilities‘ distribution
networks already existing communication systems and protocols can be applied.
For instance, the application of IEC 61850 (Communication Networks and Systems in Substations)
facilitates coaction of equipment from different manufacturers. The standard IEC 61850 allows for
real-time communication by means of periodically sent telegrams. In case of a spontaneous change in
state at the sending unit, telegrams will be sent with a high repetition rate within a few milliseconds
right after the change in state (GOOSE = Generic Object Oriented Substation Event). Thus, changes
in state can be detected rapidly.
The communication link can be established by means of common interfaces (RS485, glass optical
fibre, plastic optical fibre) and protocols (MODBUS, IEC 870-5-101, IEC 60870-5-103, DNP 3.0).
2.5.4 Software and hardware implementation
For the implementation of the suggested concept and the hardware verification respectively, a real-
time capable Embedded Controller PXI-8186 with integrated graphical development platform
LabVIEW for design, control and test, analogue Data Acquisition Card PXI-6071E and Digital I/O
Card PXI-6528 from ―National Instruments‖ was used (Fig. 4.2). The design of the hardware
architecture and the choice of software environment are arranged according to the requirements
concerning computing power and real time capability of the problem.
The software-technical realisation of the concept shown in the flowchart of Fig. 4.2 occurs in
LabVIEW. In LabVIEW the user interface as well as the program logic has been created with
graphical blocks. This system, that combines the hardware structure with the developed software
structure of the suggested adaptive network overcurrent protection concept, was named
Multifunctional Intelligent Digital Relay (MIDR). The MIDR was implemented into the 10-kV
Medium Voltage Network Simulator (MVNS), where the DLC and EMS systems had already been
implemented to.
The data on DG / DER availability predicted by the EMS will be stored in data bases. Because of the
fluctuating power generation and distributed generators operation program, this data base of the EMS
will be dynamically updated. The connection building between the data base of EMS and the MIDR
was realised in LabVIEW via ODBC-interface by means of freeware library LabSQL. At the time the
data bases of EMS are realised as MySQL data bases. The algorithm of MIDR is able to request not
only a MySQL data base, but also other data bases like e.g. PostgreSQL, Oracle, MSSQL, Access etc.
In order to access the data of EMS data bases for adaptation of tripping characteristics, the

communication between the MIDR and data bases of EMS via Ethernet and DLC communication was
established and data transmission analysed.
Fig. 2.6 Simplified flow chart of suggested concept

The algorithm of MIDR on the basis of requested data calculates the actual short-circuit current
supplied by all available DER connected to the appropriate feeder and adapts the high-set overcurrent
element (I>>) of the protection relay. For the time being only this adaptive overcurrent protection
function has been implemented into MIDR-algorithm. The acquisition of actual grid state still occurs
in real time, whereas the non-real time data from EMS serve for tripping characteristics adaptation of
appropriate relays. The implemented tripping characteristics, which must be adapted, are definite time
overcurrent, definite time overcurrent time and inverse time overcurrent protection characteristics.
The user-defined tripping characteristics can be set by entering their current-time coordinates, which
will be interpolated by means of linear functions.
Due to the suggested adaptive protection concept, the boundary conditions must not be broken by
matching of tripping characteristics for each energy flow direction by using adaptation factors. For the
tripping ranges boundary conditions have already been implemented into algorithm. The boundary
conditions consist of inrush currents and damage curves for different transformer types, motor start-up
current curves and the thermal damage curves of power lines. All data, settings and parameters of
tripping characteristics, boundary conditions etc. will be stored in an Access data base. For supporting
of the error location and fault diagnosis, event logging and transient recording functions were
implemented in the MIDR.
A hardware platform for later embedding of an expert system was created, allowing for the
implementation of adaptive network protection concept. This platform saves the knowledge base on
the conventional and adaptive protection concepts and contains all the data and ―if - then‖ rules to
make an automatic decision. The MIDR combines all the data and rules and offers the possibility to
implement and test the adaptive network protection concepts in distribution grids with high DER
penetration. The developed user interface offers an uncomplicated possibility for setting,
parameterisation and view in time-current diagrams.
The Analogue Card DAC PXI-6071E allows for the acquisition of the analogue signals of the
measured quantities current and voltage. The Digital Card PXI-6528 allows for both the acquisition of
switching states of circuit breakers and for the release of tripping signals. The implementation of the
MIDR has been performed by means of a modular design of hardware and software. Therefore, by the
development of new modules a quick enhancement of the system is possible.

Fig. 2.7 Interaction of MIDR with other relevant components
In Fig. 4.3 the developed adaptive protection relay ―MIDR‖ is shown.
Fig. 2.8 Multifunctional Intelligent Digital Relay (MIDR)

2.6 Investigation of novel protection device – test and validation
In this chapter the laboratory test of the developed novel protection device is described and its
behaviour is evaluated. In the last subchapter (5.5) the investigations performed on the central static
Microgrid switch are presented.
Methodology
The objective of the practical validation of the Multifunctional Intelligent Digital Relay (MIDR, see
Fig 4.1) is to prove protection adaptability for the developed hard- and software by means of physical
models of equipment (transformers, loads, DER etc.) in the 0.4 kV and 10 kV voltage level.
This involves the following steps:
- creation of a data base with data of grid and equipment,
- build-up of the data base connection,
- test of the software developed for data exchange / query of data,
- definition and application of different relay settings groups / adaptation of protection settings.
As result should be evaluated:
- capability of automatic adaptation of relay tripping characteristics and
- estimation of selectivity.
2.6.1 Equipment for test
The equipment used for the test has to simulate the configuration of a representative Microgrid (Fig.
5.1 and 5.2). The configuration of the Microgrid in Fig. 5.2 has been represented by means of the
Medium Voltage Network Simulator (10 kV) of Fraunhofer IWES.
Medium Voltage Network Simulator (MVNS)
At the ―Fraunhofer-Institute for Wind Energy and Energy System Technology (Fraunhofer IWES)‖ a
physical network model with a rated voltage of 10 kV has been developed for investigations on
decentralised grid structures and islanded grids with special regard to interconnected DER. The
Medium Voltage Network Simulator (MVNS) was put into operation in 2003 [STR03], [VAL03]. By
the utilisation of a rated voltage of 10 kV, which is a common voltage in medium voltage grids
worldwide, several different stationary and dynamic grid investigations can be carried out without the
necessity of measurement conversions. As the availability of real technical data of most DER is

inadequate, alternatively carried out numerical simulations cannot be done without making
assumptions or approximations and therefore lead to inaccurate simulation results. The 10-kV MVNS
is installed in Fraunhofer IWES‘ laboratory DeMoTec. Amongst other facilities the DeMoTec is
equipped with PV systems, CHP units, Diesel generator sets, models of wind power plants and
different types of inverters (Fig. 5.3).
Fig. 2.9 Configuration of Microgrid (Fig. 2.1)
Fig. 2.10 Configuration of the Microgrid from Fig. 5.1 for test

Fig. 2.11 Structure and equipment of 10-kV Medium Voltage Network Simulator (MVNS) in DeMoTec at Fraunhofer IWES

Multifunctional Intelligent Digital Relay (MIDR)
In the test set-up the MIDR comprises the functionalities of both DEMS and MV / LV station
controller (compare Fig. 3.2).
Fig. 2.12 Technical realisation of the 10-kV network simulator
For each of the three feeders (Fig. 5.3, transformers T-1 to T-3) there is a separate data base server
(see Fig. 5.5). In the data bases data on interconnected DER (i.e. available short-circuit power
provided by DER units) and the actual Microgrid topology is stored.
Fig. 2.13: Three data base servers (left), MIDR and signal processing unit (right)
Fig. 2.14: Visualisation of the real-time measurement performed by the MIDR
According to the flow chart in Fig 4.1 the actual interconnection states and short-circuit powers of
DER units are written to the respective data bases and continuously communicated to the MIDR.
Communication between the MIDR and the data base servers can be built up via PLC or Ethernet.
Based on the requested operational data (short-circuit power of DER in the different grid sections)

and the actual short-circuit power available from the main grid, the MIDR calculates possible short-
circuit currents and adapts protection settings where required. According to the protection
characteristics and the measurement signals supplied by the current and voltage transformers (see Fig.
5.6), the MIDR decides whether there is a fault or not and sends tripping signals to respective circuit
breakers, if required.
The data base servers are realised by means of MySQL servers. By using the software ―Bullzip MS
Access to MySQL‖ the data base files are converted from .mdb-format (MS Access) into .sql-format.
MIDR was implemented in LabVIEW. For building up the connection to the data base servers the tool
―LabSQL‖ is used.
2.6.2 Test procedure
To prove proper functioning of the MIDR, tests are carried out according to the steps:
- build-up of the data base connection and query of data,
- adaptation of protection settings.
The tests are done for both islanded and interconnected operation of the Microgrid. As there is no real
DEMS available for the tests, the settings for the two types of operation (islanded / interconnected to
the main grid) are changed manually in the MIDR; i.e. the short-circuit power available from the main
grid is set to 0 and to a specific value respectively. For building up the connection between the MIDR
and the data bases the MySQL servers have to operate properly. In order to control the availability
and functionality of the servers the software tool ―XAMPP‖ is used (see Fig. 5.7). With this tool the
operational status of the servers can be continuously monitored during the tests. The software ―Active
Ports‖ is applied to check if the port used by MySQL is available and if this port connects to the right
IP address (see Fig. 5.8).
Fig. 2.15: Software tool XAMPP, used for check of proper server operation
Fig. 2.16: Software Active Ports

To allow for data query MySQL has to be started and the respective data base has to be selected. In
Fig. 5.9 the ―MySQL Command Line Client‖ is shown.
Fig. 2.17: MySQL Command Line Client
The results of the connection build-up and the data query respectively are documented in a text file. In
the following an excerpt of this file is given:
midr_db_test.txt
13:55:04;0;DB connection 1 built up;0;
13:56:44;0;DB connection 2 built up;0;
13:58:24;0;DB connection 3 built up;0;
13:59:24;0;DB 1 data query successful;0;
13:59:30;0;DB 2 data query successful;0;
13:59:35;0;DB 3 data query successful;0;
13:59:40;1;DB 1 data query successful;0;
13:59:45;1;DB 2 data query successful;0;
13:59:50;1;DB 3 data query successful;0;
13:59:55;2;DB 1 data query successful;0;
14:00:00;2;DB 2 data query successful;0;
14:00:05;2;DB 3 data query successful;0;
14:00:10;3;DB 1 data query successful;0;
14:00:15;3;DB 2 data query successful;0;
14:00:20;3;DB 3 data query successful;0;
14:00:25;4;DB 1 data query successful;0;
Having successfully built up data base connections, the adaptation of protection settings according to
the amount of interconnected DER and the actual grid switching state can be tested. For the
calculation as well as for the adaptation of protection settings by MIDR, characteristic data of
equipment has to be entered and predefined protection parameters (e.g. definite time, inverse time
overcurrent etc.) have to be selected (see Fig. 5.10).

Fig. 2.18: Equipment data and predefinition of protection parameters in MIDR
2.6.3 Proof of protection adaptability – results
For the test two MV / LV feeders of the Microgrid are considered:
At the LV side of transformer T-1 (Feeder 1, Fig. 5.3) a synchronous generator is connected which is
able to feed the loads of the Microgrid in case of islanded operation.
At the LV side of transformer T-3 (Feeder 3) an inductive motor with Irated = 50 A is connected. This
value is indicated in the two current-time (I-t) protection diagrams by means of a white line (see
below). These diagrams show the MIDR protection settings at Feeder 3 for interconnected (Fig. 5.11)
and islanded operation (Fig. 5.12). The blue curve gives the simplified motor start-up characteristic.
Furthermore, the green curve indicates the short-circuit characteristic (damage curve) of the LV cable
installed between the motor and the transformer T-3. The pink curve, being the tripping characteristic
of Feeder 3, controls the operation of the circuit-breaker at the LV side of transformer T-3. The
tripping curve is set between the motor start-up characteristic and the damage curve of the LV cable.
Its high set element (I>>) is set to 0.8 times maximum available short-circuit current.
Interconnected operation
For interconnected operation the maximum available short-circuit current at Feeder 3 is calculated to
3700 A, which is indicated by the red line in Fig. 5.11. Therefore, I>> (right part of the pink curve) is
set to 0.8 x 3700 A = 2960 A for interconnected operation.
Islanded operation

For islanded operation (i.e. all short-circuit power provided by DER) the maximum available short-
circuit current at Feeder 3 is calculated to 800 A (see Fig. 5.12). Therefore, I>> is now set to 0.8 x
800 A = 640 A.
As can be seen from the diagrams below the MIDR automatically adapts the protection settings in
accordance with the conditions of the Microgrid. In case of a fault occurring in the Microgrid or in the
main grid, the pink curve is exceeded and tripping signals are generated by the MIDR in order to trip
the respective circuit breaker/s. In this last matter the MIDR behaves like a conventional protection
relay.
Fig. 2.19: I-t protection diagram for Feeder 3, interconnected operation
Fig. 2.20: I-t protection diagram for Feeder 3, islanded operation
Similarly to the example above, where a transition from interconnected to islanded operation is
performed, the protection settings will be adapted for a change in the amount of interconnected DER
(i.e. a change in short-circuit contribution provided by DER). The MIDR continuously sums up the
DER short-circuit power (relevant data available from data base servers) and the short-circuit power
originating from the main grid (if applicable). The red line which indicates the overall short-circuit
power is shifted accordingly and the pink curve adapts to the new conditions (compare diagrams
above).

2.6.4 Evaluation of the test
The following results have been reached by the test:
1. The state of interconnected operation considerably differs from the state of islanded
operation. Protection settings for interconnected operation are not sufficient for islanded
operation and have to be adapted.
2. The speed of protection adaptability is limited by the probability of fault occurrence during
adaptation. The justification for the time duration necessary for protection adaptation exceeds
the aims of this project. During the tests carried out the time duration for adaptation has been
estimated to be in the range of a few seconds.
3. The developed Multifunctional Intelligent Digital Relay allows for continuous measurement
and monitoring of the analogue and digital signals originating from the test equipment.
During the test the input and output signals of the MVNS have been available in real-time.
The data from the DEMS (data base servers) has been available in non-real-time for the
adaptation of protection settings.
4. The Multifunctional Intelligent Digital Relay permits automatic adaptation of protection
settings according to the actual grid structure and the interconnection status of DER. In the
case of a fault a routine implemented to the MIDR generates selective tripping signals which
are sent to respective circuit breaker/s.
Thus, the objective of the test, to prove proper protection adaptability, has been achieved.
The test carried out has confirmed the challenges known from the aforementioned publications and
also revealed other aspects, which demonstrate the need for further investigations and developments.
In the following some key aspects from Fraunhofer IWES‘ point of view are given:
- DER units could be designed by manufacturers in a way, allowing for enhanced monitoring /
measurement and communication functionalities.
- A data link (between MIDR and DEMS) with sufficient speed and reliability is a prerequisite
for the proposed adaptive protection scheme.
- The developed adaptive protection scheme could be further developed by introduction of pre-
settings for typical operating conditions.

2.6.5 Study of possibility for enhancement of the central static switch
For Microgrid operation and its integration to the main grid, the central Microgrid switch is of vital
importance. Therefore, requirements on this switch have to be formulated and tests of appropriate
equipment are to be carried out.
There are the following requirements concerning the central Microgrid switch:
- circuit breaker qualities (adequate capability of breaking a short-circuit),
- speed (faster than 20 ms),
- remote controlled by shunt release or undervoltage release (tripping signal sent by the
intelligent controller) and
- cost effectiveness.
The Microgrid switch has to be a switch that is able to separate the intended sub-network (Microgrid)
with islanding capabilities from the main grid. For instance, these demands are met by the LV
moulded-case circuit breaker ―ABB Tmax T2‖. This switch is equipped with a magnetic drive
operating mechanism for remote-controlled switching-on and switching-off under normal operation
conditions (> 100 ms). The shunt release provides for a remote de-energisation, < 15 ms [ABB07]
(e.g. switching-off command from the intelligent controller).
Today the following equipment is in service:
- MV grids: HH-fuses (High-voltage High-breaking-capacity-fuse), vacuum / SF6 circuit
breakers and
- LV grids: LH-fuses (Low-voltage High-breaking-capacity-fuse), line protection switches, LV
moulded-case circuit breakers.
Protection devices consist of an intelligent, programmable relay or a simple relay, which is integrated
in a switching unit (e.g. line protection switch) or operated externally (switch and relay are installed
in separate units). They have diverse current-time characteristics, release times and communication
and monitoring functions.
Since in LV grids only low-cost protection equipment is in service, there is only a very low degree of
flexibility. A fuse cannot be parameterised. Cheap switches with integrated relays do not offer
communication functionalities. Inverse time overcurrent characteristics are fixed and cannot be
changed. The relays commonly applied do not allow the definition of different settings groups. There

is a large backlog regarding low-cost programmable digital devices with communication
functionalities.
In order to compare the functionalities of commercially available standard switches and electronic
switches, the very important point in this task was the investigation of the speed of the conventional
Low Voltage Circuit Breaker (LVCB).
The following LVCBs were investigated (see Table 5.1).
Table 2.2 Comparison of LVCBs from different manufacturers
Description Nominal
current, In [A]
Nominal voltage, Un [V]
Shunt release
Undervoltage release
Comments
Manufacturer 1 160 400 208 - 277 V
AC/DC 220 - 250 V
AC/DC
Motorised operating
mechanism
Manufacturer 2 250 400 208 - 250 V
AC/DC 208 - 240 V
AC
Motorised operating
mechanism
Manufacturer 3 160 400 24 V AC/DC 220 - 240 V
AC/DC
Magnetic drive operating
mechanism
(In order to protect the commercial interests of the manufacturers the names of the manufacturers
have been made anonymous.)
Measuring setup
Measurements of the total breaking time of LVCBs were made with shunt and undervoltage release.
For each test series 20 trippings were released and the time until all the three currents extinguished
was measured. All characteristics (three currents and the control voltage) were processed and
represented by the oscilloscope ―Tektronix TDS 3014‖. The total breaking time was determined
manually from the moment of the first observable deviation of control voltage until the last current
extinguished.
All measurements were made under normal load conditions (measurements under fault conditions,
e.g. experiments on short-circuit currents, were not made). The following Fig. 5.13 shows the
measuring setup.
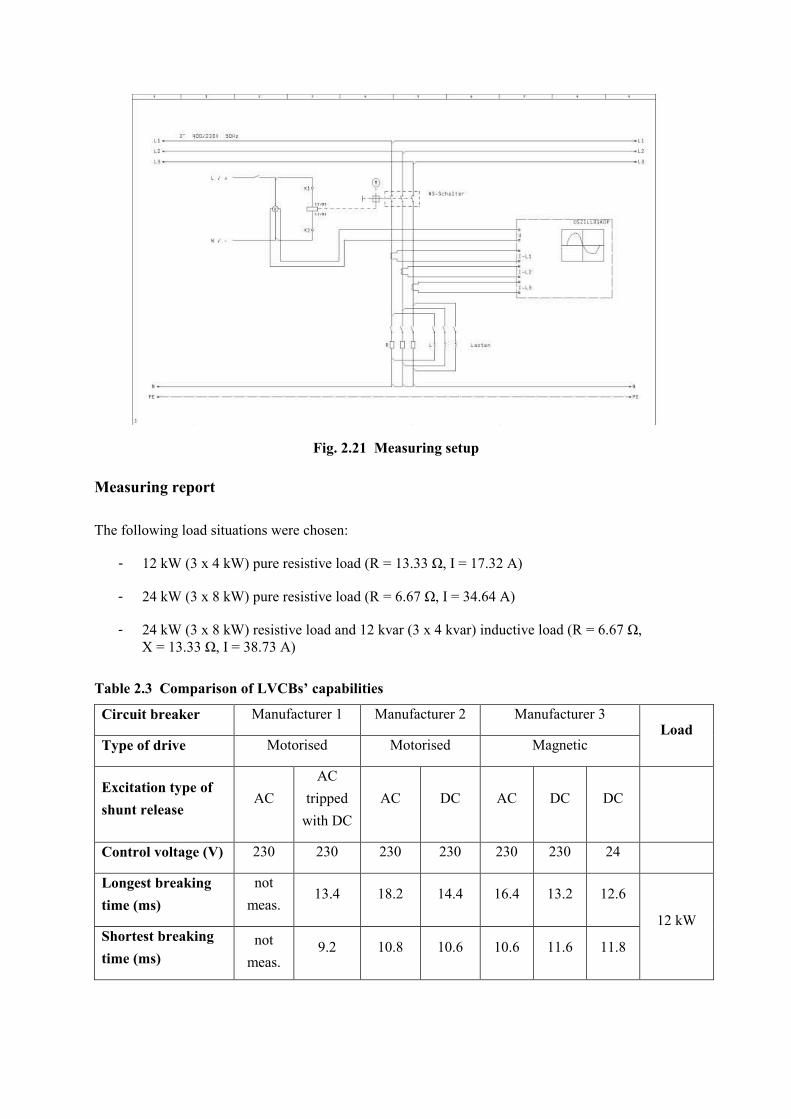
Fig. 2.21 Measuring setup
Measuring report
The following load situations were chosen:
- 12 kW (3 x 4 kW) pure resistive load (R = 13.33 Ω, I = 17.32 A)
- 24 kW (3 x 8 kW) pure resistive load (R = 6.67 Ω, I = 34.64 A)
- 24 kW (3 x 8 kW) resistive load and 12 kvar (3 x 4 kvar) inductive load (R = 6.67 Ω,
X = 13.33 Ω, I = 38.73 A)
Table 2.3 Comparison of LVCBs’ capabilities
Circuit breaker Manufacturer 1 Manufacturer 2 Manufacturer 3 Load
Type of drive Motorised Motorised Magnetic
Excitation type of shunt release
AC AC
tripped with DC
AC DC AC DC DC
Control voltage (V) 230 230 230 230 230 230 24
Longest breaking time (ms)
not meas.
13.4 18.2 14.4 16.4 13.2 12.6
12 kW Shortest breaking time (ms)
not meas.
9.2 10.8 10.6 10.6 11.6 11.8

Average breaking time (ms)
not meas.
11.5 13.5 12.2 13.5 12.3 12.3
Longest breaking time (ms) 14.6
not meas. 18.0
not meas.
not meas.
not meas.
not meas.
24 kW Shortest breaking time (ms) 10.2
not meas.
11.4 not
meas. not
meas. not
meas. not
meas.
Average breaking time (ms) 12.1
not meas.
14.3 not
meas. not
meas. not
meas. not
meas.
Longest breaking time (ms) 15.2 12.4 14.8 13.4 17.2 13.2 13.3
24 kW and
12 kvar
Shortest breaking time (ms) 9.4 10.2 10.8 10.2 11.3 12.1 12.0
Average breaking
time (ms) 11.5 11.1 12.5 12.2 13.2 12.7 12.6

Analysis of measurement results
For the tested LVCBs the following table (Table 5.3) shows the optimum configuration for a quick
tripping (in dependence of load cases). The type of release in all cases is shunt release.
Table 2.4 Optimum configurations for quick tripping of LVCBs1
Load Optimum configuration for the shortest total
breaking time, Manufacturer 1
Optimum configuration for the shortest total
breaking time, Manufacturer 2
Optimum configuration for the shortest total
breaking time, Manufacturer 3
12 kW 13.4 ms AC tripped with
DC 230 V 14.4 ms DC 230 V 12.6 ms DC 24 V
24 kW and
12 kvar 12.4 ms
AC tripped with DC 230 V
13.4 ms DC 230 V 13.2 ms DC 24 V
All in all the following can be observed:
- Shunt release is faster than undervoltage release
- DC control is faster than AC control
- The total breaking time of LVCBs is less than 15 ms.
2.7 The developed protection scheme in view of German Grid
Codes
In the project ―More Microgrids‖ investigations in the field of system protection have been carried out
since 01.01.2006. At that time the state of the art regarding medium and low voltage grids was
characterised by mainly locally controlled, none adjustable protection relays and unidirectional power
flows (from the big power plants to the customers / loads). The discussion on the meaning of the term
―Microgrid‖ has only been started. First concepts on the layout of a Microgrid and part of its electric
operating conditions have been analysed in the European project ―Microgrids‖ (ENK5-CT-2002-
00610).
Regarding Microgrid operation there are numerous scientific, technical and legal aspects which have
not been studied sufficiently so far. Therefore, international grid codes on the operation and
1 For each optimum configuration and for each load case the longest breaking time is given.

integration of Microgrids do not exist. The results of the project ―More Microgrids‖ shall contribute
to the reduction of this backlog.
During the final phase of the investigations done in this project, there was the publication of the
German Guideline ―Generating Plants Connected to the Medium-Voltage Network. Guideline for
generating plants‘ connection to and parallel operation with the medium-voltage network‖ [COD08].
This guideline also contains details on layout and utilisation of system protection. For this reason the
compatibility between the developed protection scheme and the new German Technical Guideline
was analysed. The check of compatibility has revealed the following aspects:
A. Design of system protection
1. All DER have to be equipped with automatic or remote-controlled protection systems which
are able to break short circuits. This is a pre-condition for achieving selectivity in the
developed protection concept.
2. DER have to guarantee full protection functionality under all operating conditions.
3. The protection concepts and relay settings used by both the distribution system operator and
DER operator have to be coordinated, in order to allow for a safe operation of both adjoining
grid sections. In Microgrids the phenomena blinding and sympathetic tripping may occur.
4. In contrast to the protection concept developed in this project, the technical guideline does not
postulate automatic adaptation of protection settings. Therefore, the results of this project are
more forward-looking than the technical guideline.
5. At international level there is no acknowledged definition of the term ―Microgrid‖ so far (see
chapter 7). This often leads to problems of misunderstanding regarding scientific, technical
and legal aspects.
B. Advancements of Fraunhofer IWES’ concept
1. Protection settings are remote-controlled and adaptable.
2. Part of the protection functions specified in the guideline (e.g. frequency and voltage
protection) can be implemented to the control of power electronic devices like inverters (see
Fig. 6.1). Thus, the layout of DER interconnection is simplified, the reliability of the system
increases and the cost of protection and the whole system respectively is reduced.

3. DER units should have interfaces for communication with the control centre of the Microgrid
(e.g. DEMS) and support different communication protocols.
Legend: U< and U<< – under-voltage protection, U> and U>> – rise-in-voltage protection, f< – under-frequency protection, f> – rise-in-frequency protection, Q & U< – reactive-power / under-voltage protection
Fig. 2.22: Coaction of protection components in the Microgrid test grid (Fig. 2.1) and the developed protection scheme by Fraunhofer IWES
However, the embodiments and settings given in the technical guideline are examples. In Fig 6.1 only
one possible solution for the protection layout of a Microgrid is shown. System protection has to be
laid out according to the equipment topologies and grid configuration.
The comparison between the concept developed by Fraunhofer IWES and the requirements given in
the guideline shows that the approaches complement one another and that there are no contradictions.
The new German guideline confirms the correctness of Fraunhofer IWES‘ concept and also gives
suggestions for further improvement.

2.8 The developed protection scheme in view of Virtual Power
Plants, Virtual Utilities and Smart grids
The rapid development in the field of power generation from renewable energy resources requires the
establishment of new organisational and technical grid structures, which in publications are referred
to by the terms ―Microgrids‖, ―Smart grids‖, ―Virtual Utility‖, ―Virtual Power Plant‖ et cetera. Each
structure aims at a characteristic layout and operating philosophy. Protection concepts have to be
suitable for the different structures. The investigation on the suitability of the developed protection
scheme for use in Virtual Power Plants etc. is complicated due to the absence of a clear definition of
the terms named above. This problem was also addressed in other European and national projects (e.g.
FENIX). For this and other reasons an analysis on the definition of these terms was performed in
[BRA08]. In the following some definitions of the aforementioned terms are given and considered in
view of system protection.
Expression Relevant protection aspects Microgrids comprise Low Voltage distribution systems with distributed energy sources, storage devices and controllable loads, operated connected to the main power network or islanded, in a controlled, coordinated way. [MIC06] A Microgrid is an integrated energy system consisting of interconnected load and distributed energy sources which as an integrated system can operate in parallel with the grid or in an intentional island mode. [ARG06]
For operating conditions with interconnection to the main power network conventional protection concepts have to be reviewed, and under certain conditions new protection settings and/or concepts are necessary. For islanded operation, protection concepts have to be enhanced by new intelligent concepts and/or characteristics. The Novel Protection Scheme developed by Fraunhofer IWES is one possible approach for the layout of those protection systems.
The Virtual Utility approach is a more flexible option than the Microgrid as it can utilise both local and remote generation resources, and requires little immediate change in the way the power networks are operated. [RAM05]
A Virtual Power Plant is an information and communication system that aggregates Controllable Distributed Energy units or Active Customer Networks by direct centralised control. [BRA08]
All Virtual Power Plants known in Germany comprise equipment in the medium voltage level. Proper functioning of Microgrids, having their biggest part in the low voltage level, are a prerequisite / a basis for a Virtual Power Plant. Therefore, enhancement of LV networks by

installation of adaptive protection systems can help to increase redundancy and stability of Virtual Power Plants. Such an enhancement is technically feasible and desirable. Economical aspects have to be further investigated.
The overview given above shows, that the concepts ―Virtual Utility‖ and ―Virtual Power Plant‖
mainly comprise organisational and economical aspects.
However, for the design of Microgrids the results of this project call for the application of novel
intelligent protection schemes.
2.9 Conclusion
In this project different operating and fault conditions in Microgrids and in the main distribution
network with special regard to a high level of interconnected Distributed Energy Resources have been
analysed. In terms of the application of conventional protection concepts significant weak points have
been determined.
The analysis of these problems was taken as a basis for the development of a new protection concept
and the related hard- and software of a new protection device. This development, consisting of novel
protection scheme, hard- and software, was named ―Multifunctional Intelligent Digital Relay―.
The developed concept has been implemented to Fraunhofer IWES‘ DeMoTec laboratory and it has
been validated successfully. The following results have been reached by the test:
- The developed Multifunctional Intelligent Digital Relay permits automatic adaptation of
protection settings according to the actual type of grid structure and the interconnection of
DER. In the case of a fault a routine implemented to the MIDR generates selective tripping
signals which are sent to respective circuit breaker/s.
- The Multifunctional Intelligent Digital Relay allows for continuous measurement and
monitoring of the analogue and digital signals originating from the test equipment. During the
test the input and output signals of the 10 kV network simulator have been available in real-
time. The data from the DEMS (i.e. data base servers) has been available in non-real-time for
the adaptation of protection settings.
Thus, the objective of the test, to prove protection adaptability, has been achieved. The test carried out
has confirmed the challenges known from the aforementioned publications and also revealed other

aspects, which demonstrate the need for further investigations and developments. In the following
some key aspects from Fraunhofer IWES‘ point of view are given:
- DER units could be designed by manufacturers in a way, allowing for enhanced monitoring /
measurement and communication functionalities.
- A data link (between MIDR and DEMS) with sufficient speed and reliability is a prerequisite
for the proposed adaptive protection scheme.
- The developed adaptive protection scheme could be further developed by introduction of pre-
settings for typical operating conditions.
Furthermore, the developed protection concept is compatible to the new German Technical Guideline
―Generating Plants Connected to the Medium-Voltage Network‖.
The possibility of an enhancement of the central static switch has been analysed based on
commercially available standard switches and electronic switches, including both their cost and
technical characteristics. The experiments proved that with commercially available switches a total
breaking time of less than 15 ms can be realised, which is sufficient for the application as central
Microgrid switch.
2.10 References [ABY03] H. A. Abyaneh, M. Al-Dabbagh, H. K. Karegar, S. H. H. Sadeghi, R. A. J. Khan, A
New Optimal Approach for Coordination of Overcurrent Relays in Interconnected Power Systems, IEEE Trans. On Power Delivery, Vol. 18, Nr. 2, IEEE, April 2003.
[ABB07] ABB SACE S.a.p., Offene Leistungsschalter für die Niederspannung, Technischer
Katalog, ABB Verlag, 2007. [ARG06] P. Agrawal, M. Rawson, S. Blazewicz, F. Small: ―How ‗Microgrids‘ are Poised To
Alter The Power Deliver Landscape.‖ Utility Automation & Engineering T&D,
August 2006. [BOP03] T. Bopp, A. Shafiu, I. Cobelo, I. Chilvers, N. Jenkins, G. Strbac, H. Li, P. Crossley,
Commercial and Technical Integration of Distributed Generation into Distribution Networks, CIRED 17th International Conference on Electricity Distribution, Barcelona, May 2003.
[BRA02] S. Brahma, A. Girgis, Microprocessor-Based Reclosing to Coordinate Fuse and Recloser in a System with High Penetration of Distributed Generation, Proceedings IEEE Power Engineering Society, Winter Meeting, Vol. 1, No. 1, IEEE, 2002.
[BRA04] S. Brahma, A. Girgis, Development of Adaptive Protection Scheme for Distribution Systems With High Penetration of Distributed Generation, IEEE
Transactions on Power Delivery, Vol. 19, No. 1, IEEE, Jan. 2004. [BRA08] M. Braun, Ph. Strauss. A review on aggregation approaches of controllable
distributed energy units in electrical power systems. International Journal of Distributed Energy Resources. Volume 4 Number 4 (2008) Pages 297-319.
[CHE08] H. Cheung, A. Hamlyn et al. Network-Integrated Adaptive Protection for Feeders with Distributed Generations. IEEE Power & Energy Society 2008 General Meeting, Pittsburgh, 2008.
[CHI03] I. Chilvers, N. Jenkins, P. Crossley, Development of Distribution Network Protection Schemes to Maximise the Connection of Distributed Generation, CIRED 17th International Conference on Electricity Distribution, Barcelona, May 2003.
[COD08] Technical Guideline ―Generating Plants Connected to the Medium-Voltage Network. Guideline for generating plants´ connection to and parallel operation
with the medium-voltage network‖. BDEW Bundesverband der Energie- und Wasserwirtschaft e.V. Berlin. June 2008 issue.
[COD01] Eigenerzeugungsanlagen am Niederspannungsnetz – Richtlinie für Anschluss und
Parallelbetrieb von Eigenerzeugungsanlagen am Niederspannungsnetz. 4. Auflage, VDEW., 2001.
[COD04] EEG-Erzeugungsanlagen am Hoch- und Höchstspannungsnetz. Leitfaden für
Anschluss und Parallelbetrieb von Erzeugungsanlagen auf Basis erneuerbaren Energien an das Hoch- und Höchstspannungsnetz in Ergänzung zu den NetzCodes.
Verband der Netzbetreiber – VDN, e.V. beim VDEW, August 2004. [DEG04] T. Degner, Ph. Strauß et. al., DISPOWER - Distributed Generation with High
Penetration of Renewable Energy Sources, First International Conference on the Integration of Renewable Energy Sources and Distributed Energy Resources, Brussels Belgium, Dec. 2004.
[DEG06] T. Degner, A. Shustov, B. Decker, C. Hennig, Bestimmung der Blindarbeit bei Megawatt PV-Anlagen, Tagungsband, 21. Symposium Photovoltaische Solarenergie, Bad Staffelstein, 08.-10.03.2006
[DCO07] Ch. Epe, J. Fuhrberg-Baumann, U. Herbst u.a., Distribution Code 2007, Regeln für
den Zugang zu Verteilungsnetzen, Verband der Netzbetreiber – VDN, e.V. beim VDEW, August 2007.
[DEU07] J. Deuse, S. Grenard. Effective Impact of DER on Distribution System Protection. CIRED 19th International Conference on Electricity Distribution, Vienna, May 2007.
[ENG03] A. Engler, O. Osika, Simulation of Inverter Dominated Minigrids, 2nd European PV-Hybrid and Mini-Grid Conference, Kassel, Sept. 2003.
[ENG04] A. Engler, O. Haas, M. Landau, V. Schlebusch, A. Shustov, Ph. Strauß, M.
Vandenbergh, Integration dezentraler Generatoren in das Verteilungsnetz - Pilot- und Experimentieranlage im DeMoTec -, Neuntes Kasseler Symposium Energie-Systemtechnik, Pilotanlagen – Innovationen in der Erprobung, Tagungsband, ISET

e.V., Kassel, 11.-12.11.2004. [ENG05] A. Engler, C Hardt et. Al. Agent based Micro Grid Management System,
International Conference on Future Power Systems, Amsterdam, Nov. 2005. [ENS05] A. Engler, N. Soultanis, Droop control in LV-Grids, International Conference on
Future Power Systems, Amsterdam, Nov. 2005. [EIG01] Projektgruppe "Eigenerzeugungsanlagen am Niederspannungsnetz" des VDEW-
Arbeitsausschusses "TAB", Eigenerzeugungsanlagen am Niederspannungsnetz, Richtlinie für Anschluss und Parallelbetrieb von Eigenerzeugungsanlagen am Niederspannungsnetz, 4. Ausgabe, VWEW Energieverlag GmbH, Frankfurt am Main, 2001.
[EIG98] VDEW-Fachausschuss "Elektrotechnik", Eigenerzeugungsanlagen am Mittelspannungsnetz, Richtlinie für Anschluss und Parallelbetrieb von
Eigenerzeugungsanlagen am Mittelspannungsnetz, 2. Ausgabe, VWEW Energieverlag GmbH, Frankfurt am Main, 1998.
[EEA04] A. Engler, et. al., Operation of a prototype Microgrid system based on micro-sources equipped with fast-acting power electronics interfaces, 35th Annual IEEE Power Electronics Specialists Conference, Aachen, June 2004.
[FRI08] W. Friedl, L. Fickert, E. Schmautzer, C. Oberkircher. Safety and Reliability for Smart-, Micro- and Islanded Grids. CIRED Seminar: SmartGrids for Distribution, Frankfurt/Main, June 2008.
[GAT03] F. M. Gatta, F. Iliceto, S. Lauria, P. Masato, Behaviour of Dispersed Generation in Distribution Networks during System Disturbances. Measures to Prevent Disconnection, CIRED 17th International Conference on Electricity Distribution, Barcelona, 12-15 May 2003.
[GAL05] T. Gallery, L. Martinez, D. Klopotan. Impact of Distributed Generation on Distribution Network Protection. 40th University Power Engineering Conference, Cork, Oct. 2005.
[GEI05] M. Geidl. Protection of Power Systems with Distributed Generation: State of the art. Swiss Federal Institute of Technology (ETH), Zurich, July 2005.
[HAD99] N. Hadjsaid, J. Canard, F. Dumas, Dispersed generation impact on distribution networks, IEEE Computer Applications in Power, Vol. 12, IEEE, April 1999.
[HAK04] B. Hadzi-Kostova, Z. Styczynski, Identification of Problems by Connecting Decentralised Energy Resources on the Distribution Network, IV Mako CIGRE Section B5-05, CIGRE, 2004.
[HAK05] B. Hadzi-Kostova, Z. Styczynski, Network Protection in Distribution Systems with Distributed Generation, IEEE PES Transmission and Distribution Conference, New Orleans USA, 2005.
[HAN03] E. Handschin, W. Horenkamp, Neue dezentrale Versorgungstrukturen, etz Heft 9, etz, 2003.
[JAV08] S.A.M Javadian, M.R. Haghifam. Designing a new Protection System for Distribution Networks Including DG. 9th International Conference on

Developments in Power System Protection, Glasgow, 2008. [JÄK02] J. Jäger, R. Krebs, Reliability Improvement of MV-Power Systems by Coordinated
Network Protection, Proceeding of 13th International Conference on PSP of IEEE, Bled, Slovenia, Sept. 2002.
[JIA00] J. A. Jiang, J. Z. Yang, Y. H. Lin, C. W. Liu , J. C. Ma, An Adaptive PMU Based Fault Detection/Location Technique for Transmission Lines Part I: Theory and Algorithms, IEEE Trans. Power Delivery, Volume 15, IEEE, Apr. 2000.
[JIA99] J. A. Jiang, Y. H. Liu, C. W. Liu, J. Z. Yang, T. M. Too, An Adaptive. Fault Locator System for Transmission Lines, Proceedings IEEE Power Engineering Society Summer Meeting, Volume 2, IEEE, 1999.
[JIO00] J. A. Jiang, Y. H. Lin, J. Z. Yang, T. M. Too, C. W. Liu, An Adaptive PMU Based Fault Detection/Location Technique for Transmission Lines Part II: PMU Implementation And Performance Evaluation, IEEE Trans. Power Delivery, Volume 15, IEEE, Oct. 2000.
[JKL02] J. Jäger, R. Krebs, S. Lemmer, Perspektiven Moderner Schutztechnik, ELEKTRIE,
Heft 9-12, ELEKTRIE, 2002. [KEI07] T. Keil, J. Jäger, A. Shustov, T. Degner, Changing network conditions due to
distributed generation - systematic review and analysis of their impacts on protection, control and communication systems, CIRED, 19th International Conference on Electricity Distribution, Vienna, 21-24 May 2007.
[KAU04] K. Kauhaniemi, L. Kumpulainen. Impact of Distributed Generation on the Protection of Distribution Networks. 8th IEE International Conference on Developments in Power System Protection, Amsterdam, April 2004.
[MÄK04] K. Mäki, S. Repo, P. Järventausta, Effect of Wind Power Based Distributed Generation on Protection of Distribution Network, IEE Developments in Power System Protection, Amsterdam, April 2004
[MÄK07] K. Mäki, A. Kulmala, S. Repo, P. Järventausta Studies on Grid Impacts of
Distributed Generation in a Combined Real-Time Simulation Environment. International Conference on Power Systems Transients, Lyon, June 2007.
[MÄK08] K. Mäki, S. Repo, P. Järventausta, M. Kärenlampi. Definition of DG protection planning methods for network information systems. CIRED Seminar: SmartGrids for Distribution, Frankfurt/Main, June 2008.
[MIC02] Microgrids, Large Scale Integration of Micro-Generation to Low Voltage Grids, Contract Number, ENK5-CT-2002-00610, 01/01/03-31/12/05.
[MIC06] More Microgrids, Advanced Architectures and Control Concept for More Microgrids, Annex I – Description of Work, Contract Number SES6-019864.
[MOR08] J. Morren, S.W.H. de Haan. Impact of Distributed Generation Units with Power Electronic Converters on Distribution Network Protection. 9th International Conference on Developments in Power System Protection, Glasgow, 2008.
[POP08] D.S. Popovic, E.E. Boskov. Advanced Fault Management as a part of Smart Grid solution. CIRED Seminar: SmartGrids for Distribution, Frankfurt/Main, June 2008.

[RAM05] C. Ramsay, M. Leach: ―Can Virtual Utilities Revive the Consolidation Market?‖
BIEE Academic Conference, 22-23 September 2005. [RET03] D. Retzmann, Blackouts in 2003 - Analyse und Folgerungen, Tagungsband
CIGRE/CIRED Informationsveranstaltung in Erlangen, CIGRE/CIRED, Okt. 2005. [SAL01] S. K. Salman, I. M. Rida, Investigating the Impact of Embedded Generation on
Relay Settings of Utilities' Electrical Feeders, IEEE Transactions on Power Delivery, Vol. 16, No. 2, IEEE, April 2001.
[SCH99] G. C. Schoonenberg, A. R. A. Pikkert, F. van Overbeeke, C. Spoorenberg, Concepts for Medium Voltage Distribution Networks: A New Philosophy, CIRED Proceedings 1999 International Conference on Electricity Distribution, Session 5, Paper No.2, CIRED, 1999.
[SHU04] A. Shustov, Ch. Hardt, V. Schlebusch, B. Valov, Mittelspannungsnetznachbildung zur Untersuchung verteilter elektrischer Versorgungssysteme, Tagungsband, 19. Symposium Photovoltaische Solarenergie, Bad Staffelstein, 10.-12.03.2004.
[SCH05] J. Schmid, A. Engler, Inverter Dominated Grids, EXPO World Conference on Wind Energy, Renewable Energy, Fuel Cell & Exhibition, Sizuoka Japan, June 2005 .
[SHU06] A. Shustov, B. Valov, Lösungswege der Integrationsprobleme dezentraler
Energieerzeugungsanlagen in elektrischen Verteilungsnetzen, Vorträge des
internationalen wissenschaftlich-technischen Seminars, Polytechnische Universität
Tomsk, 10.-11.04.2006. [SHU09] A. Shustov, Netzschutz für elektrische Energieversorgungssysteme mit hohem
Anteil dezentraler Stromerzeugungsanlagen, Dissertation, Universität Kassel,
2009. [STR03] Ph. Strauss, A. Engler, B. Valov, A. Shustov, 10-kV-
Mittelspannungsnetznachbildung, 48. Internationales Wissenschaftliches Kolloquium, TU Ilmenau, September 2003.
[VAD06] M. Vandenbergh, A. Engler, R. Geipel, M. Landau, Ph. Strauss, Microgrid management with a high share of renewable energy sources, 21st European Photovoltaic Solar Energy Conference, Dresden, WIP München, Sept. 2006.
[VAL03] Valov B., Engler A., Shustov A. Projekt eines 10-kV physikalischen Modells vom Inselnetz. Intern. Wiss. Konferenz „Elektroenergie, elektrotechnische Systeme und
Komplexe―, Polyt. Uni. Tomsk (Russland), 3.-5. Sept. 2003, S. 264-266. [VDE02] DIN und VDE, Kurzschlussströme in Drehstromnetzen, Teil 0: Berechnung der
Ströme (IEC 60909-0:2001), Deutsche Fassung EN 60909-0:2001, VDE Verlag GmbH, Berlin, Juli 2002.
[VER04] P. Vermeyen, J. Driesen, R. Belmans. Protection of grids with distributed generation. IEEE Young Researchers Symposium in Electrical Power Engineering – Intelligent Energy Conversion, Delft, March 2004.
[VIA06] F.A. Viawan, D. Karlsson, A. Sannino. Protection Scheme for Meshed Distribution Systems with High Penetration of Distributed Generation. Power systems

conference: Advanced Metering, Protection, Control, Communication and Distributed Resources, Clemson, 2006.
[YAG03] M. Yagi et. al., Development of Dispersed Generation and Consequences for Power Systems, Final Report CIGRE WG C6.01 (ex 37.33), CIGRE, July 2003.
[YUA07] D. Yuan, N. Zhang et al. An Adaptive Noncommunication Protection for Distribution Systems. Universities Power Engineering Conference, Barcelona, 2007.
[ZHA04] M. Zhang, X. Dong, Z.Q. Bo, B. R. J. Caunce, Practical Accelerated Overcurrent Protection for Distribution Feeder, Proceedings of Int. Conf. on Advanced Power System Automation and Protection, Jeju Korea, Oct. 2004.
3 Protection Device for Low Voltage Network with
Low Fault Levels (EMforce)
This chapter contains information which has not been released for public disclosure. Please refer to the paper “ Fault Current Source to Ensure the Fault Level in Inverter-Dominated Networks” which is available from the Microgrids website. The paper presents a summary of the work in this chapter. Should you be interested in more technical details, please contact the author via [email protected]

4 Novel Protection System for Microgrid (ZIV)
4.1 Introduction
Microgrids and Distributed Generation are pushing the Intelligent Grid‘s development. As the number
of Distributed Energy Resources (DER) increases and communication to the various resources
becomes more pervasive, the ability to operate segments of the grid as islands or Microgrids becomes
reality. The drivers are clear - the desire for high-availability and high-quality power for the digital

society. Other advantages for customers and utilities are, basically, improvement of energetic
efficiency, exploitation of residual heating, reduction of environmental impact, improvement of
reliability and flexibility, investments reduction and operational benefits for the network.
DER includes not only generation such as solar, wind, and micro-turbines, but also negative power
generation through demand response programs, controllable loads, and direct load control. Renewable
energy resources are becoming competitive with existing generation resources. Many utility
commissions are incentivizing additional renewable generation sources (solar and wind) on the grid.
Battery and inverter technology is evolving such that a utility can justify the capital cost of the
installation based on the difference in price from buying energy at night at a low price and selling it
back during peak daytime rates.
Microgrids do present challenges to the utility from a protection, control, and dispatch perspective.
Traditional protection is based on the fact that for a short circuit, significant overcurrents will flow in
a direction towards the fault. In a Microgrid environment, a significant portion of the generation will
be inverter-based which, through design, is current limited. New protection philosophies will need to
be developed to protect these systems.
On the control side, it will be necessary for the Microgrid to be seamlessly islanded and re-
synchronized. It may be required that the Microgrid be dispatched as a single load entity. This will
mean that a local controller will have to be able to communicate with all of the DERs on the
Microgrid, to maintain a constant power flow at the Point of Common Coupling (PCC). The amount
of power dispatched will be set either on a contracted value or optimized based on the dynamic price
of electricity.
This report identifies and analyzes the main difficulties to perform a coordinated behavior of the
whole protection system, for faults in the medium voltage (MV) network, and especially in case of
internal faults to the microgrid. In order to face up to bidirectional power flows caused by the high
number of distributed generators, and in order to clear properly internal faults in the microgrid when
it‘s operating in islanded mode, new protection schemes becomes necessary.
The compromise between security and cost entails some restrictions when solutions are implemented,
due to the fact that complex and expensive protection systems will not be economically feasible
applied to the low voltage (LV) network. This report proposes solutions based on simple protection
functions supported by means the massive use of IED‘s communications.
Communications provide new opportunities to share data between the components of the microgrid
(generators, storage systems and loads) in real time, and also with the protection system in MV. In
this way it‘s achieved an optimization on microgrid‘s operation, clearing selectively internal faults,
and enabling system restoration schemes to return to normal operation conditions.

Centralized and de-centralized communications architectures are compared, highlighting their
advantages and disadvantages. Protocols are also object of this analysis, because not all of them are
suitable for both architectures.
In order to get maximum benefit for the consumers and for the network, a perfect coordination
between the microgrid and MV network is a must. Applied this requirement to protection field, we
need to design systems that guarantee quality of service not only during normal operation conditions
but also during contingencies inside and outside the microgrid.
4.2 Protection Challenges
Basically, a microgrid can operate connected to the MV network or islanded from it. And it becomes
essential to protect it on both operation modes against any type of fault, faults happening in MV
distribution network and also the ones inside the microgrid.
Considering current protection systems in distribution, designed for radial architectures with
unidirectional power flows, based usually on fuses and current limiters to face faults, the protection of
a microgrid brings new technical challenges. The most significant determining factors are enumerated
below:
Structural changes on distribution networks: the presence of generation capacity on MV
network and also on LV network entails that power flows are bi-directional.
Two potential operation modes: connected to MV network or islanded mode.
Topological changes within the microgrids due to connections and disconnections of
generators, storage systems and loads.
Intrinsic intermittency of some of the generation resources, basically renewable ones, like
photovoltaic, wind farms and domestic wind mills, the one extracted from sea waves and tides, and so
on.
Presence of generation and storage technologies that connects to the LV network by means of
power electronic devices, basically DC/AC inverters. The capacity of these inverters to generate short
circuit current is very limited, not being able to produce more than 1,2 to 2 times the generator rated
current in case of a fault. These figures contrast with much higher values provided by conventional
synchronous generators.
Reduction of times allowed to clear faults in the MV network and also in the LV network in
order to keep safe microgrids‘ stability.
The target is to maintain the microgrid‘s security and stability on both operation modes, connected or
islanded. At this time, by security reasons, microgrids are not allowed to operate on islanded mode,
but in the future this mode will probably be permitted due to the benefits that can provide. And

certainly, islanded mode operation entails the biggest difficulties when a microgrid‘s protection
system has to be designed.
New advanced protection schemes are becoming essential, capable of adapting to variable
configurations and conditions on the microgrid and even on the distribution network. It can be stated
that protection devices will become indispensable part of the distribution automation. Problems those
in the past were only relevant for transmission systems, like stability and frequency control, now are
becoming relevant also for distribution systems.
Bi-directionality of power flow requires more complex protections, at least they should be directional.
But the main central issue with regard to the protection of a microgrid is, for internal faults, the
variability of short-circuit currents depending on the current configuration. This phenomenon is
particularly significant when operating in islanded mode.
Figure 1. Faults in distribution network and in the microgrid
Basically, the ideal microgrid‘s protection system must react properly for faults in MV network and
also for internal faults. Below there is an analysis of the cases to be faced:
When microgrid is connected to the distribution network, either for internal or external faults, high
enough short-circuit current is guaranteed to detect it quickly.
For instance, if an external fault like F1 or F2 happens, MV protection system will be in charge of
separating as soon as possible the microgrid from the MV network opening CB2 circuit breaker. In
principle, there shouldn‘t be any technical problem to do it due to the high short circuit current

provided by the distribution network. Besides, microgrid could continue operating in islanded mode in
case of existing a balance between load and generation/storage. If MV protection system doesn‘t act
adequately, microgrid‘s protections will have to trip CB3 circuit breaker, with the risk of sensitivity
problems if generated by the microgrid short circuit current is too low.
In case of an internal fault in a microgrid‘s feeder operating in ―connected mode‖, like the one
represented by F3 or F4, MV network will provide high short circuit current and a directional
protections will be able to clear it easily. Nevertheless, sensitivity problems can happen again due to
the low contribution of microgrid‘s generators to the fault. This problem can be solved by means of
transferring trips to the corresponding SWi switches.
But the big challenges arise when faults like F3 or F4 happen and microgrid is exploited in islanded
mode. The lack of contribution from the side of MV network for internal faults means a drastic
reduction of short circuit current, especially if there is no synchronous generator. This factor affects
protection devices in terms of sensitivity. As it was mentioned before, generators connected to the LV
network through inverters, through power electronics, are unable to feed the fault with short circuit
currents much higher than the rated current. This circumstance makes very difficult to set i.e.
overcurrent units, because their pick-up settings should be very little greater than the maximum load.
To make it even more complex, microgrid‘s operating conditions are very variable and difficultly
controllable, what implies that short circuit current will be also variable. Regarding this subject
renewable energies have the biggest impact, because these sources depend on the wind, the sun and
the tides, absolutely not controllable. There is also a periodic variation of loads. And finally, changes
in the microgrid‘s topology of need also to be considered, where generators and storage devices con
be on or off, available or not, due to many reasons (losses minimization, cost-efficiency reasons,
maintenance, and so on).
Considering all these possible operation conditions, a generic overcurrent protection with a single
setting group will not be able to guarantee selective trips for all type of faults that can happen.
Microgrid will not need complex or new protection functions but an adaptive protection system.
4.3 Microgrid Simulation Model for Test Purposes
A computer-simulated model of a microgrid has been developed to carry out tests in order to get data
and check de validity of the proposed solutions. The microgrid model was developed using the
PSCAD programme version 4.2., and it corresponds to a ―domotic house‖ existing in a Spanish
province, namely Alava.
The figure below shows the single line diagram corresponding to the electrical installation and all its
elements.

Figure 2: Single line diagram of the ‗‖domotic house‖.
The aim of this simulation is, basically, the validation of the new protection principles that will be
described in the following sections. It‘s analyzed the behaviour of different types of generators and a
storage system based on batteries for different faults, and their interaction with the distribution
network.
This model contains two generation devices, an electric generator based on a Stirling motor (5kW), a
micro-turbine (10kW), and a set of PV panels (1,8kW). On the other hand, as storage system there is a
dynamic voltage restorer (DVR) based on batteries.
Figure 3: Electric power generators and storage system in the ―domotic house‖
And there are also a number of loads connected to the microgrid. These loads are divided into the
following groups: lift, fancoil network, house and multiuse.

Figure 4: Electric loads in the ―domotic house‖
4.4 Tests Description
The tests have been divided into two main groups. During the initial phase, the aim has been to study
the distribution of power between the different elements of the system, placing special emphasis on
the transients generated as the result of the connection and disconnection of the various power
sources, as well as the loads to which the microgrid is subjected. In these cases, the aim was to study
the behaviour of the models simulated so that they could be validated.
During the second phase, tests have focused on the simulation of faults either in the distribution
network or within the microgrid. Basically the objective was to quantify the value of short-circuit
currents for both types of faults in order to validate the adaptive methods proposed to protect the
microgrid.
To this ends, two different scenarios were established: one in which the microgrid was connected to
the distribution network, and one in which the microgrid was disconnected (islanded mode).
4.5 Innovative Protection Methods
4.5.1 Adaptive Protection Systems Obviously, the availability of more powerful inverters, in terms of capacity to provide higher short-
circuit currents, would be a substantial advance. This improvement will arrive sooner or later, but in
the meantime we need solutions that nowadays technology allows and that are cost-efficient.
Basically, the basic technical requirements to implement an adaptive protection system are the
following:
Utilization of numerical relays (IEDs) instead of, i.e., traditional fuses. Type of protection and
control functions are slightly out of scope of this analysis, because this study is focus on the
conceptual design of the system as a whole. Nevertheless, it‘s worth pointing out that most probably

functions different from the ones used in HV and MV substations are not necessary. On the other
hand, perhaps a simple overcurrent function is not enough, being necessary at least a directional
overcurrent function to deal with bi-directional power flows.
Availability within those IEDs of more than one ―setting group‖ and/or multiple instances of
the same function. These setting groups or instances of the same function need to be activated or
deactivated locally or remotely, manually or automatically.
A communications system between IEDs. With regard to this requirement, options are
numerous, for protocols and also for architectures and physical layers. Each alternative offers
advantages and disadvantages, but we‘ll focus on alternatives in terms of decision making, basically
centralized systems or de-centralized systems where each IED takes its own decisions.
Protection and control functions will work properly to protect a microgrid if IEDs are able to get in
real-time microgrid‘s topological information, data about generators on or off, about the status of
storage systems, and even about number and size of loads connected within the microgrid. These
conditions have to be checked continuously in order to guarantee that settings are suitable for each
microgrid‘s configuration. This is the concept of an Adaptive Protection System.
4.5.2 IED’s Requirements
Nowadays, all protection and control devices that utilities install in EHV, HV and MV substations use
numerical technology. These devices are called IEDs (Intelligent Electronic Devices).
Regarding MV/LV substations and LV distribution networks, they are living a process of deep
changes to become part of the Smart Grids. Smart Grids require intelligent systems, therefore LV
network needs to become more intelligent than today. So it‘s absolutely reasonable to think that, for
example, fuses will be substituted progressively by more capable and smarter devices, like switches or
breakers with numerical modules or relays (IEDs).
Concerning the IED‘s requirements to protect a microgrid, basically there is no special innovation.
Same technologies and similar functions than in HV substations have to be applied: overcurrent
functions, directional OC functions, voltage and frequency functions, breaker failure, directional
interlock logics, and so on. Detection of islanding situation is an essential function, and it will be
stated below, but this functionality also can be covered with standard functions like the ones
mentioned before. Besides, communication protocols and standards used in HV/MV network can be
applied directly to the microgrids.
Perhaps the novelty or innovation will be in providing very cost-efficient protection systems, because
the scale of microgrid‘s generators and network obliges to scale down the cost of systems designed
for HV/MV substations.

Very specialized relays are necessary. Specialized in terms of being as simple as possible to reduce
the cost, but powerful in terms of adaptability to the microgrid by means of multiple setting groups,
multiple instances of the same protection unit, and communication capacities.
4.5.3 Calculation of Protection Settings
The concept of adaptability for the microgrid‘s protection system is based in the necessity of having
available different settings according to the various microgrid‘s operation modes. These operation
modes change dynamically, so settings need to change dynamically too.
The availability of different settings in an IED can be solved in different ways, like having several
setting groups or many instances of a protection function, in both cases external signals will trigger
the change of setting group or the activation/de-activation of protection function instances.
But a tricky point is how to determine the settings for each operation mode. This problem can be
faced basically in two ways that are discussed below:
Calculating settings on-line, dynamically according with microgrid‘s current electrical model.
Pre-calculating protection settings off-line, defining a possible cases table and analyzing them
in the configuration phase.
4.5.3.1 On-line Calculation
On-line calculation requires a computer executing simulations for faults in different points within the
microgrid as soon as a change in the microgrid‘s topology or generation/storage is detected. This
system needs microgrid‘s electrical model and a real-time simulator; first need is not always available
but it‘s feasible to have it, nevertheless second need can result quite expensive, entering in
contradiction with the cost-effectiveness required.
In case the cost of the system proves to be cheap enough, there are still some inconveniences. Once
system notices about a change in the microgrid, all settings for the IEDs need to be re-calculated; this
fact means that at least part of the relays will change of parameterization, and probably those relays
will have never been tested with such settings. In addition to that, time needed to execute the
simulations involves a delay that has to be considered, because it‘s a period during which IEDs might
be operating with unsuitable settings.
The possibility of including the electrical model in each IED is actually not feasible. Processing
power needed to simulate network behavior during short-circuits is over the capabilities of IEDs, at
least fulfilling the cost-effectiveness principle.
4.5.3.2 Off-line Calculation

Off-line calculation is based on the identification of feasible operating conditions of microgrid. The
first step is the identification of the number of microgrid‘s possible configurations, mainly dependent
on the number of circuit breakers or switches, and generators/storage systems on or off.
After the simplification of this set of different operating conditions, a new set of test cases is obtained.
And based on this simplified set of cases, having the electrical model of the microgrid, all possible
faults have to be simulated taking into consideration types of fault and points of occurrence.
As result of simulations, in the stage of system parameterization, a list of actions per IED is obtained.
These actions can be basically changes of settings (pickups, delays), units activations/de-activations
or even changes of complete setting groups.
The application of this method requires IEDs with multiple setting groups and units, but the
complexity falls on the configuration stage. Afterwards, neither IEDs nor any external system need to
execute complex calculations to determine the suitable settings. Another great advantage is that user
knows in advance all settings to be configured in the IEDs, and therefore all of them can be tested
during the commissioning of microgrid‘s protection system. This method can be used over any
communications architecture, either a centralized one or a decentralized architecture.
The main problem of this method is that the list of actions can be huge when the microgrid is big.
Without any simplification, the maximum number of cases in the list of actions is 2i, where ―i‖ is the
number of switching devices in the microgrid. Therefore, in big microgrids, the number of cases can
be very cumbersome. One possible solution is the partition of the microgrid into smaller pieces,
working with the concept of multi-microgrids.
4.5.4 Communications Architectures and Protocols The implementation of an adaptive protection system requires that IEDs communicate between them
or with a central element. By means of the communications, IEDs can provide and receive
information about the topology of the microgrid, about the status of generators, storage systems and
loads, and even commands to execute an action.
We‘ll focus on the application of pre-calculated protection settings, and it is analyzed how to deploy it
with centralized and decentralized communications architecture.
It‘s convenient to define what a centralized architecture is and what a de-centralized architecture
means. So, below both architectures are analyzed.
4.5.4.1 Centralized Architecture
It‘s is the most conventional communication scheme, and an example can be seen below in figure 5.
There is a central element, called MGCC (Microgrid System Central Controller) that takes decisions

over protection IEDs. These IEDs are identified as MC (Microgenerator Controller) and LC (Load
Controller), and they need to have different settings for different operation circumstances.
This architecture is supported by many communication protocols, being the most common ones within
electricity sector the following: MODBUS, DNP3, PROCOME, IEC 870-5-101/104, CAN BUS or
IEC 61850.
Figure 5. Centralized communication system on a microgrid
4.5.4.2 De-centralized Architecture This is not a so conventional communication scheme, and an example can be seen below in figure 6.
Within this architecture a central device like MGCC is not necessary, intelligence is distributed
between IEDs themselves. Every IED, with the information received from other IEDs, is autonomous
in order to change its own settings or setting groups.
This architecture is only feasible when communication protocol allows establish direct
communication between the IEDs, substituting hardwired connections between the relays. Concerning
standard protocols basically there are two options, IEC 61850 and BUS CAN.
4.5.4.3 Physical Layer The centralized architecture can be deployed with serial communications, bus communications, over
PLC and even on an ETHERNET network.

However, a decentralized architecture needs to be implemented over a bus or an ETHERNET
network, although with the suitable bandwidth will could also be implemented over PLC.
Distribution
Substation
Load
Load
MV LV
Residential customer
CB1
CB2
Residential customer
CB4
Flywheel
(Storage)
SW1
Microgrid
CB3
SW6
SW5
SW4
SW3
SW2
SW7
MC
LC
LC
LC
LC
LC
MC
MC
MC
MC
Group of houses
Appartments
Wind mill
Photovoltaic pannels
Fuel cell
Residential customer
MC
Figure 6. De-centralized communication system on a microgrid 4.5.4.4 Advantages and Disadvantages The most significant advantage of a centralized architecture is that local devices (MC and LC) don‘t
take decisions, and therefore are simpler. The effort of data processing falls on the central device
(MGCC), the one that will decide based on data provided by the local devices.
For example, to implement an adaptive protection system, table of actions is solely within MGCC,
which will receive the status of all the switching devices and generators/storage systems/loads from
local devices (MC/LC). MGCC will send commands to IEDs (MC/LC) and will change their settings.
The main disadvantage of a centralized architecture is very well-known, the dependence on the central
device (MGCC). A failure in this central element means the whole lost of the adaptive protection
system.
Concerning the de-centralized architecture, it‘s just the opposite. The great advantage is the no
dependence on only one device so that system continues working. And its biggest disadvantage is the
requirement of more capacity of local devices (MC/LC), because each one will have its own actions
list in order to adapt autonomously to microgrid‘s conditions.

4.5.5 IEC 61850. Application of Communications between Smart IEDs Within the range of protocols that enable a protection system become adaptive, it‘s obligatory
highlight the standard IEC 61850.
Smart Grids are been developed on the basis of communications, and specially making use of standard
protocols. IEC 61850 is not a protocol but a standard, and it‘s unavoidably the future in
communications systems for the power system.
Its main disadvantage is that it requires an ETHERNET network to work. Today ETHERNET is a
technology very common, but it still means an extra cost and a technical complexity in LV
installations. In fact, in rural areas for example it‘s not always available and it‘s expensive to bring it.
And in addition to this, it‘s an added complexity for people in charge of the maintenance, for instance;
this people work more comfortable with hardwired systems than with data travelling through the
network.
Its use implies a lot of advantages:
This standard can be applied to every type of electrical installation. It‘s able to functionally
cover any application.
IEC 61850 standard guarantees interoperability between devices from different manufacturers.
It standardizes data models and protocol (MMS).
It simplifies the engineering process and IEDs configuration.
It provides a high scalability to the microgrids, because characteristics as interoperability,
engineering definition and communication services enable the growth of the microgrid along the time.
The performance that provides this standard is higher indeed than with other protocols. First,
we can forget cables not used for communications; everything can be solved over the network.
This standard has communication services to do usual operations in the world of electrical
installations, like change of settings and setting groups, report of information, commands, and so on.
But there is a service that is remarkable, GOOSE service. The GOOSE service makes possible direct
information exchange between IEDs, accepting any type of data (single signals, double signals,
measurements,…), guarantying that is transmitted in less than 3 ms (faster than a cable between
digital outputs and inputs), and that is always available because is retransmitted indefinitely. It‘s a
multi-master system that offers the higher reliability. See figure 7.
Obviously, applying GOOSE messages to communicate IEDs within the microgrid, we have a very
valuable tool to adapt their configurations to any operation scenario. All IEDs could receive data from
the others very rapidly, so the reconfiguration process would be also very fast.
In figure 8, there is an example of how GOOSE can be used in a microgrid. In this case, protection
IED in the LV side of distribution transformer is publishing a signal to block the trip of protection

IEDs within the microgrid in bays 1A, 1B, 1C and 1D.Protection IEDs on those bays need only to
subscribe to that GOOSE message and then blocking scheme is effective.
GOOSE messages can be used to inform other IEDs about topology changes (i.e. from connected
mode to islanded mode), to implement protection schemes (like the one in figure 8), to execute
commands, to change active setting group, and so on.
Afterwards, for example in the case of topology changes, IEDs will have to react i.e. changing their
settings.
Real
Data
Virtual
ZeroVirtual
Zero
Local
Database
GoCB
GOOSE
Publisher
Control Point
(SPC)
GOOSE
Subscriber
Control Point
(SPC)
GOOSE
Connection
Status
(SPS)
Other
Subscriber
IEDs……
GOOSE Publisher IED1 GOOSE Subscriber IED2
`
Central HMI
MMS Connection
Between HMI and IEDs
Figure 7. GOOSE service diagram
BI1
QA1
PIED BI1
QA1
BI1
QA1
BI1
QA1
BI1
QA1
Transformer
MV/LV
1A 1B 1C 1D
PIED PIED PIED
GOOSE Message
PIED
Block Signal
º
MICROGRID
Figure 8. Blocking scheme for faults out of microgrid
4.5.6 IEC 61850, a Cost-efficient Solution

An adaptive protection system as the one designed according to IEC 61850 standard requires a higher
investment than a traditional system for Low Voltage, based on fuses and current limiters. However, a
microgrid could not be feasible without an adaptive protection system.
A cost-benefit study would have to consider many benefits, also the financial ones, which a microgrid
is able to provide. Besides, the technology to be used is not new, its maturity and its level of
deployment on higher voltage levels make it affordable.
The cost of IEDs has been decreasing since numerical technology was born more than 15 years ago.
Today it‘s possible to find multi-function relays designed for industrial environments with a very
cheap price.
Perhaps one of the main concerns at the time of considering IEC 61850 as a solution is the cost of the
network, specially the cost of devices that were not necessary before, the ―switches‖.
Switches allow organizing the traffic within the network, taking into consideration several parameters
like the priority of a message, or managing VLANs not to mix different traffics.
Switches are necessary, but it‘s possible to have cheaper architectures by means the integration of
these switches within IEDs. Integration means cost reduction, although obviously involves also some
lost. In figure 9, it can be seen an ETHERNET network done with a simple ring of switches topology.
And in figure 10, there is an example with switches integrated within the IED.
Figure 9. ETHERNET network topology. Simple ring of switches

Figure 10. ETHERNET network topology. Rings with internal switches in IEDs The implementation of an ETHERNET network as a single ring of IEDs with integrated switches is a
very good solution in order to make the microgrid as cheap as possible but with very good
performance.
4.6 IEC 61850. More Value for DER in Distribution System The starting point is that DER is the basic element in every microgrid.
DER can be a contributor to meeting the energy delivery requirements of an electric utility. In many
situations, the incremental cost per kWh of the energy will limit the use of DER to peak periods when
lower cost energy is not available from other sources, or to emergency situations in which there is no
alternative. DER use for emergency power supply could be taken one step beyond meeting the needs
of an individual customer‘s load by intentional islanding of distribution circuits via active distribution
management in which the demand and DER in a given circuit or group of circuits can be aligned with
each other, and the circuit or circuits can then be islanded to operate in stand-alone mode during
emergencies. This is basically the concept of a microgrid.
In addition to that, local emissions may also limit what can be done with DER. Diesel-engine
generators can be limited to a very small number of hours of run time per year and therefore may only
be used for emergency power supply. Renewable-based DER are intermittently available depending
on the resource availability and are usually run to capture the resource whenever it is available, which
reduces the consumption from fuel-burning alternatives.
Another use of DER may be, for instance, to contribute to the volt/VAR management in distribution
operations. With proper design, a coordinated operation could improve voltage profiles and reduce

electrical losses in distribution circuits. These system support options are referred to as ―ancillary
services‖.
For all these system support functions, the distribution system protection and control capabilities will
need to be aligned with these modes of operation.
To improve the viability and use of DER in these support functions, an easy, cost-effective and
seamless communication system for integrating the DER into active distribution system management
and control is needed. DER is one of the active components in a distribution system that must be
made interoperable with other active components (switchgear, capacitor banks, etc.), which are using
IEC 61850 more and more to execute their functions. Therefore, IEC 61850 includes DER as part of
the body of standards. And as a natural consequence, microgrid‘s protection systems should be use
this communication standard.
4.6.1 DER’sCommunication Systems
The communication systems for DER shouldn‘t be something unto themselves, but rather a part of the
overall communication infrastructure for distribution system operations. IEC Standard 61850, Part 7-
420 has been under development for the past few years and has now reached the point of Final Draft
International Standard (FDIS). Hopefully, it will be released by IEC in the coming year 2010. The
information models provide standardized names and structure for the data that is exchanged with the
DER devices, and take advantage of the protection and control logical nodes defined for substations.
This document has been developed by a working group (WG 17) with participation from 12 countries.
This document includes the information models for four DER types:
Photovoltaic power systems
Fuel cell power plants
Reciprocating engine generator systems
Combined heat and power systems
These four specific DER types were chosen for the normative document due to the availability of
domain information at the time work was started and due to the prior existence of a standard for wind
power. However, some of the logical nodes in the document are generically applicable to all types of
DER. For some logical nodes, it is necessary only to refer to those that already existed in other parts
of the series.
4.6.2 Active Distribution and DER
A power distribution system smarter requires more sophisticated management and control systems
than have been in use in the past. Using more smart devices in a distribution system involves also

active distribution management and control systems to get the best of the distribution system
operation. Basically, an active distribution management and control systems includes:
The distribution monitoring system capabilities to know the active equipment (i.e. DER) state
information, voltage, current, power factor, power quality, and so on.
Data processing capabilities to handle large amounts of real-time data coming from the
monitoring systems
Simulations tools to do state estimation and support control algorithms in determining dispatch
actions that are needed.
Control systems, including control algorithms to dispatch the active components and achieve
the desired distribution management functions in real-time distribution operations.
The IEC 61850 standards are needed to enable interoperability of the IEDs in the distribution system
with active distribution management and control, without excessive custom engineering in every case.
To achieve successful active distribution management with DER integration, the DER object models
do not need to be installed in the DER devices themselves. It may be easier to install them at the local
control and protection level with direct links to the DER devices. This approach may be particularly
useful for retrofits to existing DER installations.
4.6.3 Next Steps for IEC 61850 To achieve this vision for active distribution management with fully integrated DER, the IEC 61850
series of standards is being completed.
WG 17 is being expanded to develop the object models for distribution feeder and network
equipment, such as switchgear, capacitor banks, and reclosers. This will involve extensions and
adaptations from the substation work and reuse of logical nodes from the substation and DER work
wherever possible. WG 17 will also maintain the DER standards and add other DER types (such as
storage and electric vehicle charging), as the necessary domain information becomes available.
4.7 Conclusions
It‘s a fact that the main challenge of protecting a microgrid comes from the great difference between
short circuit currents when microgrid is connected to the distribution network and when it‘s islanded.
Evolution of power electronic systems will have a big impact. These systems allow connecting some
generation technologies like photovoltaic and fuel cells, but nowadays they are a handicap.
Topological changes in the microgrid and variability of generation, especially with renewal resources,
fall on the sensitivity and selectivity of protection relays. These phenomena are completely
incontrollable.

Due to these factors, and due to the benefits microgrids provide, adaptive protection systems are
considered the solution. These systems have the advantage of using very mature technologies and
conventional protection functions.
Solution is open because can be implemented in different ways and with different standards, but
always making use of the opportunities that offer the communication systems.
Centralized or decentralized communication architecture, both are feasible, with advantages and
disadvantages. But it‘s evident that standards like IEC 61850 allows point-to-point communication,
enabling decentralized systems, and providing many application advantages.
4.8 Bibliography
Reza Iravani, ―Control and Protection Requirements for Microgrids‖, Montreal 2006 – Symposium on
Microgrids.
Nikos Hatziargyriou, ―Microgrids. The key to unlock distributed energy resources?‖, IEEE power &
energy magazine, Volume 6 – Number 3, May/June 2008.
H. Nikkhajoei & R. H. Lasseter, ―Microgrid Protection‖, IEEE PES general Meeting, 24-28 June
2007, Tampa, FL
Alexandre Oudalov & Antonio Fidigatti, ―Adaptive network protection in microgrids‖, International
Journal of Distributed Energy Resources, Volume 4 Number 3 (2009)
5 Active Islanding for SELFSYNC controlled
inverters (SMA)
5.1 Introduction
Islanding of a grid connected DG occurs when a section of the utility system containing such
generators is disconnected from the main utility, but the independent DGs continue to energize the
utility lines in the isolated section (termed as an island). In the context of Microgrids it becomes
necessary to distinguish between indented and unintended islanding.
Unintended islanding is a concern primarily because it can pose a hazard to utility and customer
equipment, maintenance personnel and the general public. Poor power quality can damage loads in the
uncontrolled island. Another concern is the out of phase switching of the recloser. Therefore, it is
necessary to detect the unintentional formation of an island at the Microgrid central switch and
undertake the necessary steps to bring the Microgrid back into a controlled state.

In [MG2004] the behaviour of a SELFSYNC [ENG03] controlled inverter during different grid
faults has been investigated. It was shown that all three fault types (low impedance, overload
situation, high impedance grid fault) could be handled. Further investigations of the high impedance
situation have shown that the used impedance measurement device was limited in the capability of
detecting the island situation in the case of presence of multiple inverters (Fig.1).
Fig. 1: Multi inverter Microgrid
Novel controller algorithms for inverters [ENG03] based on voltage and frequency droops aim to
increase the stabilty of grids. This feature is opposed by the present requirements concerning the
detection of loss of mains given in grid connection standards like VDE0126 1-1 (Germany) or UL
1741 (USA).
Conventional closed loop current controlled inverters make use of a variety of different active
islanding detection schemes like frequency shifting, phase shifting etc. A further method of detecting
an islanded situatuation is the measurement of the grid impedance at the connection point. One
interesting approach to measure the impedance of a grid has been developed by partner ISET and is
described in [VIO02]. The method is based on the injection of small interharmonic currents and the
measurement of the resulting influence on the voltage. The impedance at the interharmonic
frequencies and with an appropriate algorithm the impedance at the fundamental grid frequency can
be calculated.
The original aim of the task was to join the ISET algorithm with the SELFSYNC control. The
feasibility in priciple has been shown in simulations, but unfortunately, after the implementation into
an inverter, this method ceased to work due to higher distortion levels of the currents.
So SMA focussed on the work to find an alternative method compatible with the ISET SELFSYNC
control.

5.2 SELFSYNC® - control The SELFSYNC® - control has been developed in [ENG02] and implemented into the Sunny Island
4500 in 2002. The main advantage of this concept is the ability to form so called Microgrids of in
principle ―unlimited‖ size. During the development of its successor, the Sunny Island 5048, it has
been decided to follow this concept and adopt it to the new inverter.
Fig. 2: Basic overview of the Sunny Island 5048 The main difference between the SI4500 and the SI5048 is the hardware topology. The SI5048 is
based on a 50Hz transformer opposed to the HF concept of the SI4500. Taking into account that the
inverter operates more or less like an ideal voltage source equipped with the SELFSYNC® droops
and an additional inductor, the inverter can be represented as the following equivalent circuit.
Fig. 3: Equivalent circuit of a SELFSYNC® inverter
One can calculate the power flow while paralleling the device with a second voltage source (the grid
grid or another SELFSYNC® inverter) according to the following equations.
Fig. 4: Parallel operation of two inverters

sin
2
,2,1
1L
vvP
N
rmsrms
cos
22
,2,1
2
,1
1L
vv
L
vQ
N
rmsrms
N
rms
For small :
L
vvP
N
rmsrms
2
,2,1
1
L
vv
L
vQ
N
rmsrms
N
rms
22
,2,1
2
,1
1
The above approximation reveals, that the active power flow is mainly influenced by the angle
between the voltages and the reactive power flow is mainly influenced by the difference in magnitude.
This relationship can be used for a new active islanding detection method.
5.3 Description of the active Anti-Islanding scheme During grid connected mode, the inverters rms voltage setpoint is being superimposed with an
additional small sinusoidal signal of a specified frequency much lower than the nominal grid
frequency (e.g. 1-5 Hz ). According to the equations above this modulation of the voltage leads to an
exchange of reactive power with the external source (e.g. grid). This small sinusoidal reactive power
exchange can be detected with an appropriate algorithm.
In case of the loss of the external source, no exchange is being detected.
Special resonant filters (VI-Filters) are matched to the frequency of the „test signal―. The 1st filter
eliminates a possible bias in the external reactive power measurement. The 2nd filter is used to
calculate a fictive „RMS value― of the sinusoidal reactive power modulation. In case this value does
not exceed a certain threshold, the decicion module adopts the gain of the test signal automatically
and after a specified time disconnects the inverter from the grid.

The above figure displays the Matlab/Stateflow graph of the decicion module.
Modelling and Simulation
The described AID method has been modelled with the help of Matlab/Simulink. The above figure
shows the integration of the two modules (signal generation and signal evaluation) into the ISET
SELFSYNC algorithm. Due to the automatic code generation with Simulink Realtime workshop, the
above systems can be directly transferred to C code and implemented into the real inverter.

The AID method has been tested against the standard oscillator testing procedure defined by
VDE0126 1-1 and UL1741.
During this testing procedure the inverter is feeding in power. The oscillator circuit is matched in a
way, that all the inverter power is taken by the RLC combination and no power is fed to the grid.
Once the switch to the grid is opened (islanded situation) the inverter must detect the loss of mains
and disconnect itself within a specified time (UL1741: 2s ; VDE0126 1-1: 5s).
The following graph shows the simulation results:
The loss of mains event ocurrs at 5.0s. The upper plot shows the drop of the fictive ―Ai rms‖ value
calculated from the sinusoidal reactive power modulation. After the value has fallen under a limit (AI

Limit) the algorithm increases the test signals peak value and trips the breaker at after a specified time
(AI Sensitivity) at 6.0 s.
Measurements
The algorithm has been implemetented into the inverter series Sunny Island 5048 and was tested at
the SMA inverter testcenter. The picture below shows one of the the automatic inverter test systems
with an integrated RLC resonant circuit according to VDE0126 1-1.

The loss of mains event ocurrs at 94.6s. The upper plot shows the drop of the fictive ―Ai rms‖ value
calculated from the sinusoidal reactive power modulation. After the value has fallen under a limit (AI
Limit) the algorithm increases the test signals peak value and trips the breaker at after a specified time
(AI Sensitivity) at 96.6 s.
By varying the relevant parametrs the trip time could be further shortened in order to fulfil the given
requirement (2 seconds according to UL1741).
Conclusion:
SELFSYNC control successfully transferred to the SI5048 Enhanced by a scalable AID method
In combination with a „Grid-connection box― certified according to VDE 0126 1-1 For SI5048U certified according to UL Patent currently under application
5.4 References [MG04] Christian Hardt, Electronic Switch / Interface Network Monitoring, Microgrids -
Large scale integration of Micro-Generation to low voltage grids, Technical report, June 30, 2004
[ENG03] A. Engler, Device for equal-rated parallel operation of single or three-phase voltage
sources, Patent EP 1 286 444 A2, 26.02.2003 [ENG02] A. Engler, Regelung von Batteriestromrichtern in modularen und erweiterbaren
Inselnetzen, Verlag Dissertation.de, Berlin, 05/2002, ISBN 3-89825-439-9 [VIO02] H. Faßhauer, M. Viotto, Verfahren und Vorrichtung zur Messung der Impedanz eines
elektrischen Energieversorgungsnetzes, Patent 102 07 856, 2002

6 EMTP application for investigating the
performance of LV earthing systems under
impulse excitation (NTUA)
6.1 Introduction The penetration of distributed generation (DG) at medium and low voltages (MV and LV), both in
utility networks and downstream of the meter, is increasing in developed countries worldwide.
MicroGrids are attracting substantial interest because they have the potential to increase the use of
renewable generation contributing substantially to the reduction of carbon emissions, and to the
commitments of most developed countries to meet their greenhouse gas emissions reduction targets
(typically based on the Kyoto Protocol). Also, the presence of generation close to demand can
increase the power quality and reliability (PQR) of electricity delivered to sensitive end users.
A MicroGrid should achieve the same level of safety as any other conventional distribution
system. Safety criteria involve the calculated touch and step voltages in case of fault and the transient
ground potential rise (GPR) in case of lightning strike. Different practices for neutral earthing in the
low-voltage distribution system have effect on the relative dispersion of fault or lightning current that
seeks the path of minimum impedance to earth. Today, two approaches are well entrenched in their
respective territories, the so-called TN system and TT system where the difference lies in the mode of
earthing the neutral, while the IT scheme is applied in private installations with increased continuity
of supply requirements.
The analysis of the earthing requirements and protection implications of the micro grids
necessitates the use of suitable modeling and simulation tools. One appropriate package for
this purpose is EMTP, which is extensively used for the analysis of power systems and
networks of all voltage levels, primarily for the study of fast electromagnetic transients.
EMTP can provide a simulation platform with proven accuracy and more than adequate
modeling capabilities of the various system elements and network topologies. The potential of
utilizing EMTP for the analysis of microgrid earthing and protection issues has been explored
by ICCS/NTUA within WPE [1][5] focusing mainly on a fault situation. The objective of this
step is to explore the performance of earthing systems under lightning impulse. The safety
criterion is the transient touch, step voltages and the ground potential rise (GPR). The realistic
study case LV network elaborated by ICCS/NTUA [3] is considered. The two main earthing
systems considered are TN and TT, since only these are used in public distribution networks.
Different soil resistivity values, protection schemes and loading conditions are considered and
results are compared and discussed.

6.2 Earthing for fault and lightning protection
6.2.1 Fault Conditions In a LV (low voltage) distribution network the major fault current contributor is the upstream
distribution network while the micro-source provides a small fraction of the fault current. In a MV
(medium voltage) distribution network a MV phase/ frame fault or a fault between MV and LV
windings may present a risk for equipment and for the users of the LV network. MV and LV earth
connections are usually separated, but if all the earth connections are grouped into a single one, a
dangerous rise in potential of LV frames is possible. In general the neutral is not distributed and there
is no protective conductor (PE) in the MV network or between the MV load and substation. MV
Phase/earth fault generates single-phase short circuit current limited by earth connection resistance
and other impedances, if any. The proposed protection guidelines for a MicroGrid ensure that the
source earth at the distribution transformer would not be lost in any event. Consequently the micro-
sources could be operated safely even without earthing their neutral points locally. Protective earthing
of the micro-sources is achieved by connecting the generator frame and all conductive parts to a main
earthing terminal.
6.2.2 Lightning strike In many cases met in practice the high altitude where a microgrid is installed in addition to a high
ground flash density, makes the system vulnerable to lighting flashes. The lightning current is seeking
the path of the least impedance to earth. Previous research [6] and International standards suggest that
in case of a direct lightning strike on a building, high energy lightning currents may flow through the
electrical installations that equip the building. Depending on the earthing type of the low voltage
distribution system that connects the building with the electricity supply (i.e. TN S, TN CS or TT), the
expected overvoltages and lightning/surge currents may vary.
Inside the customer premises all the earthed parts including the electrical protective earth (PE)
and the lightning protection earthing system (LPS) have a common reference point. This reference
point may be for example a potential equalization-bonding bar or similar providing that it has one or
more short connections to the LPS earthing system. The purpose of installing surge protective devices
(SPDs) is to provide equipotential bonding during transient conditions between live and earthed parts
of the electrical system and equipment and therefore to protect it from undesired transient
overvoltages and to divert lightning current to the ground. When lightning strikes the external LPS of
a building, the local rises in potential cause a high potential difference between conductors or
components connected to it and others that are not referenced to it. By providing equipotential
bonding between earthed and live conductors through SPDs this high potential difference can be

reduced. But due to the conduction of the SPDs, partial lightning current flows through them towards
the transformer site via the phase and the neutral conductors.
For primary protection and in order to fulfill the current testing requirements of IEC
61643-1 Class I [8], the main SPD design should be based on spark gaps since common
varistor technology cannot, yet, cope with the energy that the above standard recommends for
Class I testing method. The selection of the SPD depends on the expected lightning current
that it should discharge and on the overvoltage category of the equipment that is to be
protected. Knowing the overvoltage category the selected SPDs should have a lower voltage
protection level in order to provide sufficient surge overvoltage protection. The SPDs used in
the modeled case study systems here, are selected according to the IEC international standards
[8].
6.3 Application to realistic study case network
6.3.1 Description of the study case network In Fig. 1 the LV study case network considered is illustrated. Details of the network are given in
[3].
Figure 1. One line diagram of the LV network used for simulations

Figure 2. Line parameter values of the LV network used for simulations
Assuming a lightning strike to the installation, the GPR will be raised locally if the TT earthing
system is used because all the injected current and energy will be dispersed via the nearest earthing
resistance. A brief estimation of the GPR is then possible considering the lightning current amplitude
and local earthing resistance. On the contrary, when the TN earthing system is installed, GPR can not
be easily estimated, making necessary the use of EMTP or other sophisticated program. Emphasis
here is given to the TN earthing system. The customer connection arrangement is shown in figure 3. Standardized connection of LV consumers
Possible
junction box
LV meter
and fuse box
LV line
(TN-C network)
Supply
cable
Consumer installation
main switchboard
(TN-S or TT system)
Meter
PE
N
PEN
3
3
M
N bar
3
N
PE PE bar
Meter to switch-
board cable
MCB for small sizes
Fuses for larger
Bonding jumber for TN system
Isolated for TT system
Consumer
ground
DGConnection point
for DG source of
the consumer
Figure 3. Customer connection arrangements.
For primary protection and in order to fulfil the current testing requirements of IEC 61643-1 Class I
[8], the main SPD design should be based on spark gaps since common varistor technology cannot,
yet, cope with the energy that the above standard recommends for Class I testing method. The
selection of the SPD depends on the expected lightning current that it should discharge and on the
overvoltage category of the equipment that is to be protected. Knowing the overvoltage category the
selected SPDs should have a lower voltage protection level in order to provide sufficient surge
overvoltage protection.
For the case studies only the origin of the electrical installation is taken into consideration. Equipment
at the origin of the installation according to IEC 60364-4-44 may be classified in overvoltage category
IV and for 230-400V systems the required impulse withstand voltage level is 6kV. Therefore the
upstream SPDs should provide a voltage protection level of less or equal to 6kV. Model of the SPD is
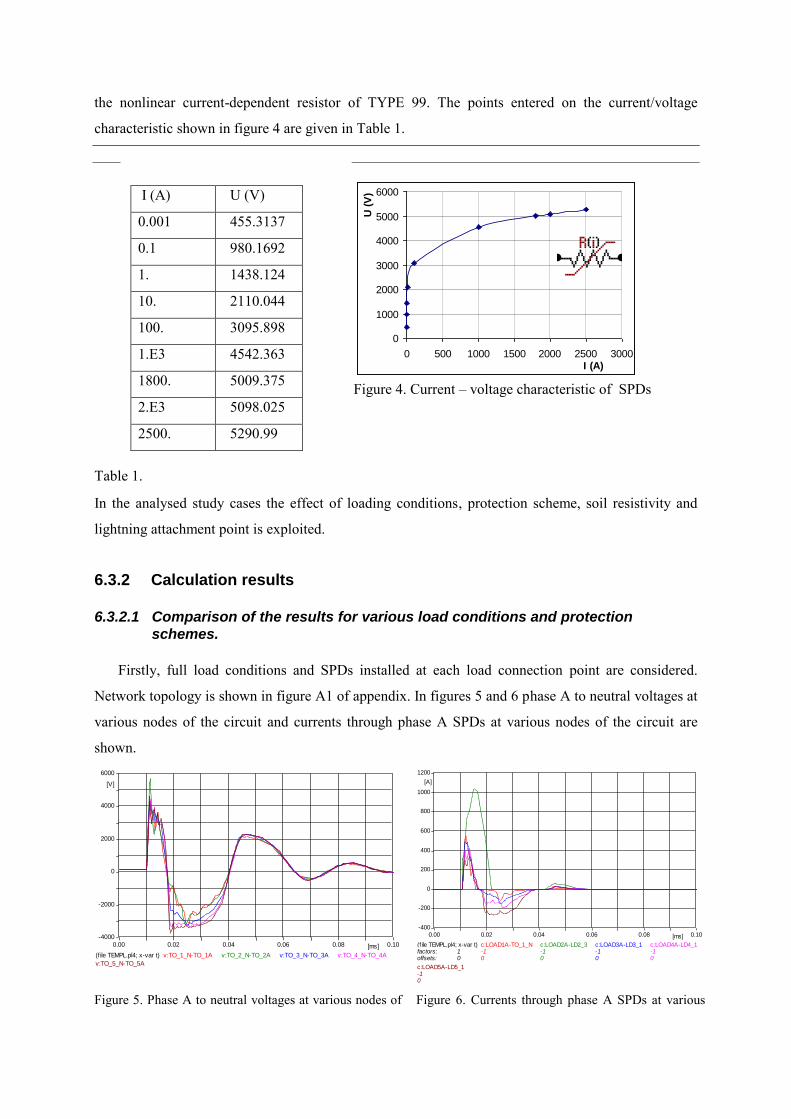
the nonlinear current-dependent resistor of TYPE 99. The points entered on the current/voltage
characteristic shown in figure 4 are given in Table 1.
Table 1.
I (A) U (V)
0.001 455.3137
0.1 980.1692
1. 1438.124
10. 2110.044
100. 3095.898
1.E3 4542.363
1800. 5009.375
2.E3 5098.025
2500. 5290.99
Figure 4. Current – voltage characteristic of SPDs
In the analysed study cases the effect of loading conditions, protection scheme, soil resistivity and
lightning attachment point is exploited.
6.3.2 Calculation results 6.3.2.1 Comparison of the results for various load conditions and protection
schemes. Firstly, full load conditions and SPDs installed at each load connection point are considered.
Network topology is shown in figure A1 of appendix. In figures 5 and 6 phase A to neutral voltages at
various nodes of the circuit and currents through phase A SPDs at various nodes of the circuit are
shown.
Figure 5. Phase A to neutral voltages at various nodes of Figure 6. Currents through phase A SPDs at various
(f ile TEMPL.pl4; x-var t) factors:offsets:
10
c:LOAD1A-TO_1_N -10
c:LOAD2A-LD2_3 -10
c:LOAD3A-LD3_1 -10
c:LOAD4A-LD4_1 -10
c:LOAD5A-LD5_1 -10
0.00 0.02 0.04 0.06 0.08 0.10[ms]
-400
-200
0
200
400
600
800
1000
1200
[A]
(f ile TEMPL.pl4; x-var t) v:TO_1_N-TO_1A v:TO_2_N-TO_2A v:TO_3_N-TO_3A v:TO_4_N-TO_4A
v:TO_5_N-TO_5A
0.00 0.02 0.04 0.06 0.08 0.10[ms]
-4000
-2000
0
2000
4000
6000
[V]
0
1000
2000
3000
4000
5000
6000
0 500 1000 1500 2000 2500 3000I (A)
U (
V)

the circuit nodes of the circuit
Next, the load of the overall system is reduced to 20% while SPDs are installed at each load
connection point. Network topology is shown in figure A1 of appendix. In figures 7 and 8 phase A to
neutral voltages at various nodes of the circuit and currents through phase A SPDs at various nodes of
the circuit are shown.
Figure 7. Phase A to neutral voltages at various nodes of the circuit
Figure 8. Currents through phase A SPDs at various nodes of the circuit
Considering 100% load and only one SPD at load 2 the network topology is as shown in figure A2
in appendix. In figures 9 and 10 phase A to neutral voltages at various nodes of the circuit and
currents through phase A SPD at node 2 are shown.
Figure 9. Phase A to neutral voltages at various nodes of the circuit
Figure 10. Currents through phase A SPD at node 2
Next, the load of the overall system is reduced to 20% load and there is only one SPD at load 2.
The network topology is as shown in figure A2 in appendix. In figures 11 and 12 phase A to neutral
voltages at various nodes of the circuit and currents through phase A SPD at node 2 are shown.
(f ile 100.pl4; x-v ar t)
factors:
offsets:
1
0,00E+00
c:LOAD2A-LD2_3
-1
0,00E+00
0,00 0,02 0,04 0,06 0,08 0,10[ms]
-1000
-500
0
500
1000
1500
2000
2500
3000
[A]
(f ile 100.pl4; x-v ar t) v :TO_1_N-TO_1A v :TO_2_N-TO_2A v :TO_3_N-TO_3A v :TO_4_N-TO_4A
v :TO_5_N-TO_5A
0,00 0,02 0,04 0,06 0,08 0,10[ms]-25,00
-18,75
-12,50
-6,25
0,00
6,25
12,50
18,75
25,00
[kV]
(f ile 20.pl4; x-v ar t)
factors:
offsets:
1
0,00E+00
c:LOAD2A-LD2_3
-1
0,00E+00
c:LOAD3A-LD3_1
-1
0,00E+00
c:LOAD4A-LD4_1
-1
0,00E+00
c:LOAD5A-LD5_1
-1
0,00E+00
c:LOAD1A-TO_1_N
-1
0,00E+00
0,00 0,02 0,04 0,06 0,08 0,10[ms]
-500
-250
0
250
500
750
1000
1250
1500
[A]
(f ile 20.pl4; x-v ar t) v :TO_1_N-TO_1A v :TO_2_N-TO_2A v :TO_3_N-TO_3A v :TO_4_N-TO_4A
v :TO_5_N-TO_5A
0,00 0,02 0,04 0,06 0,08 0,10[ms]-4000
-1800
400
2600
4800
7000
[V]

Figure 11. Phase A to neutral voltages at various nodes of the circuit
Figure 12. Currents through phase A SPD at node 2
Considering 100% load and no SPDs, the network topology is as shown in figure A3 in the
appendix. In figure 13 phase A to neutral voltages at various nodes of the circuit are shown.
Figure 13. Phase A to neutral voltages at various nodes of the circuit
Next, the load of the overall system is reduced to 20% and there are no SPDs installed. The
network topology is as shown in figure A3 in the appendix. In figure 14 phase A to neutral voltages at
various nodes of the circuit are shown.
(f ile 100.pl4; x-v ar t) v :TO_1_N-TO_1A v :TO_2_N-TO_2A v :TO_3_N-TO_3A v :TO_4_N-TO_4A
v :TO_5_N-TO_5A
0,00 0,02 0,04 0,06 0,08 0,10[ms]-40
-30
-20
-10
0
10
20
30
40
[kV]
(f ile 20.pl4; x-v ar t)
factors:
offsets:
1
0,00E+00
c:LOAD2A-LD2_3
-1
0,00E+00
0,00 0,02 0,04 0,06 0,08 0,10[ms]
-1000
-500
0
500
1000
1500
2000
2500
3000
[A]
(f ile 20.pl4; x-v ar t) v :TO_1_N-TO_1A v :TO_2_N-TO_2A v :TO_3_N-TO_3A v :TO_4_N-TO_4A
v :TO_5_N-TO_5A
0,00 0,02 0,04 0,06 0,08 0,10[ms]-25,00
-18,75
-12,50
-6,25
0,00
6,25
12,50
18,75
25,00
[kV]

Figure 14. Phase A to neutral voltages at various nodes of the circuit
Considering, full load conditions and SPDs installed at every load connection the network
topology is as shown in figure A1 of appendix. Grounding resistances are equal to 1Ω everywhere in
the network in order to represent low soil resistivity conditions. In figures 15 and 16 phase A to
neutral voltages at various nodes of the circuit and currents through phase A SPDs at various nodes of
the circuit are shown.
(f ile ALL.pl4; x-v ar t)
factors:
offsets:
1
0,00E+00
c:LOAD2A-LD2_3
-1
0,00E+00
c:LOAD3A-LD3_1
-1
0,00E+00
c:LOAD4A-LD4_1
-1
0,00E+00
c:LOAD5A-LD5_1
-1
0,00E+00
0,00 0,02 0,04 0,06 0,08 0,10[ms]
-150
-50
50
150
250
350
[A]
Figure 15. Phase A to neutral voltages at various nodes of the circuit
Figure 16. Currents through phase A SPDs at various nodes of the circuit
Next, full load conditions, low soil resistivity and only one SPD installed at load 2 are considered.
The network topology is as shown in figure A2 of appendix. In figures 16 and 17 phase A to neutral
voltages at various nodes of the circuit and currents through phase A SPDs at node 2 are shown.
(f ile ALL.pl4; x-v ar t) v :TO_1_N-TO_1A v :TO_2_N-TO_2A v :TO_3_N-TO_3A v :TO_4_N-TO_4A
v :TO_5_N-TO_5A
0,00 0,02 0,04 0,06 0,08 0,10[ms]-4000
-3000
-2000
-1000
0
1000
2000
3000
[V]
(f ile 20.pl4; x-v ar t) v :TO_1_N-TO_1A v :TO_2_N-TO_2A v :TO_3_N-TO_3A v :TO_4_N-TO_4A
v :TO_5_N-TO_5A
0,00 0,02 0,04 0,06 0,08 0,10[ms]-40
-30
-20
-10
0
10
20
30
40
[kV]

Figure 17. Phase A to neutral voltages at various nodes of the circuit
Figure 18. Currents through phase A SPD at node 2
Next, full load conditions, low soil resistivity and none of the SPDs are considered. The network
topology is as shown in figure A3 of appendix. In figure 19 phase A to neutral voltages at various
nodes of the circuit are shown.
Figure 19. Phase A to neutral voltages at various nodes of the circuit
Further analysis involves the investigation of the response of the system when lightning hits
phase-A conductor. Considering full load conditions and SPDs installed at every load connection
point the network topology is as shown in figure A4. In figures 20 and 21 phase A to neutral voltages
at various nodes of the circuit and currents through phase A SPDs at various nodes of the circuit are
shown.
(f ile NONE.pl4; x-v ar t) v :TO_1_N-TO_1A v :TO_2_N-TO_2A v :TO_3_N-TO_3A v :TO_4_N-TO_4A
v :TO_5_N-TO_5A
0,00 0,02 0,04 0,06 0,08 0,10[ms]-6000
-3800
-1600
600
2800
5000
[V]
(f ile 2.pl4; x-v ar t)
factors:
offsets:
1
0,00E+00
c:LOAD2A-LD2_3
-1
0,00E+00
0,00 0,02 0,04 0,06 0,08 0,10[ms]
-50
0
50
100
150
200
250
300
350
[A]
(f ile 2.pl4; x-v ar t) v :TO_1_N-TO_1A v :TO_2_N-TO_2A v :TO_3_N-TO_3A v :TO_4_N-TO_4A
v :TO_5_N-TO_5A
0,00 0,02 0,04 0,06 0,08 0,10[ms]-5000
-4000
-3000
-2000
-1000
0
1000
2000
3000
[V]

Figure 20. Phase A to neutral voltages at various nodes of the circuit
Figure 21. Currents through phase A SPDs at various nodes of the circuit
Next, only one SPD at load 2 connection is considered, while lightning hits phase-A conductor.
Network topology is as shown in figure A5. At full load conditions, phase A to neutral voltages at
various nodes of the circuit and currents through phase A SPD at node 2 are shown in figures 22 and
23.
Figure 22. Phase A to neutral voltages at various nodes of the circuit
Figure 23. Currents through phase A SPD at node 2
If none of the SPDs is considered, while lightning hits phase-A conductor the network topology is
as shown in figure A6. At full load conditions, phase A to neutral voltages at various nodes of the
circuit are shown in figure 24.
(f ile 2.pl4; x-v ar t) c:LOAD2A-LD2_3 c:LOAD2B-LD2_3 c:LOAD2C-LD2_3
0,00 0,02 0,04 0,06 0,08 0,10[ms]-10
-5
0
5
10
15
20
25
30
[kA]
(f ile 2.pl4; x-v ar t) v :TO_1_N-TO_1A v :TO_2_N-TO_2A v :TO_3_N-TO_3A v :TO_4_N-TO_4A
v :TO_5_N-TO_5A
0,00 0,02 0,04 0,06 0,08 0,10[ms]-50
-40
-30
-20
-10
0
10
20
[kV]
(f ile ALL.pl4; x-v ar t) c:LOAD1A-TO_1_N c:LOAD2A-LD2_3 c:LOAD3A-LD3_1 c:LOAD4A-LD4_1
c:LOAD5A-LD5_1
0,00 0,02 0,04 0,06 0,08 0,10[ms]-5
0
5
10
15
20
25
[kA]
(f ile ALL.pl4; x-v ar t) v :TO_1_N-TO_1A v :TO_2_N-TO_2A v :TO_3_N-TO_3A v :TO_4_N-TO_4A
v :TO_5_N-TO_5A
0,00 0,02 0,04 0,06 0,08 0,10[ms]-9000
-7000
-5000
-3000
-1000
1000
3000
5000
[V]

Figure 24. Phase A to neutral voltages at various
nodes of the circuit
6.4 Discussion of the results
The TN earthing system provides low impedance return path for faults or lightning currents in the
LV grid, because the resistance of the PEN conductor is generally low. TN systems have the
advantage that in case of fault events or lightning strikes, the touch and step voltages as well as the
transient ground potential rise (GPR) are generally smaller than in TT systems. This is due to the
voltage drop in the phase conductor and the lower impedance of the PEN conductor compared with
the consumer installation earthing resistance in TT systems. Additionally, TN systems can be
operated with simple over current protection, which ensures the disconnection of a fault. However,
faults in the electrical network at a higher voltage level may migrate into the LV grid causing high
touch voltages at LV premises. Moreover, if network modifications occur, the protection scheme may
need to be adapted following the fault loop impedance changes. In the TT system, faults in the LV
and MV grid do not migrate to other customers in the LV grid and earthing of the installation is
simpler and the easiest to implement.
An insight into the results of simulations in figures 5 to 24 shows that phase A to neutral voltages
at various nodes of the circuit are oscillating mainly at the kHz frequency range. These oscillations
are due to propagation and reflection of travelling waves along the conductors of the system. In all
cases it can be observed that voltages attenuate faster when one or all the SPDs are installed in the
system.
Without substantial connected loads in the system, the surges appearing at the lightning
attachment point would propagate along the circuits with very little attenuation. Comparing the results
in figures 5 and 7 very small differences can be observed when the load of the system is reduced to
20%. Consequently the concept that surge voltages decrease from the service entrance to the outlets
could be misleading for a lightly loaded system, the protection scheme of which should be based on
the propagation of unattenuated voltages [7].
(f ile NON.pl4; x-v ar t) v :TO_1_N-TO_1A v :TO_2_N-TO_2A v :TO_3_N-TO_3A v :TO_4_N-TO_4A
v :TO_5_N-TO_5A
0,00 0,02 0,04 0,06 0,08 0,10[ms]-400
-250
-100
50
200
350
500
[kV]

Low soil resistivity values or low earthing resistances along the network contribute significantly
in lowering transient voltages and currents.
When lightning hits phase A conductor, voltages along the network are comparable to those when
lightning is injected in PEN provided that SPDs are used, while currents through phase A SPD are
much larger.
Surge protecting devices (SPDs) provide the intended protection and lower the observed
overvoltages along the network. The effect of installation of surge protectors is a smaller reduction of
overvoltages when in low soil resistivity than in case of high soil resistivity. Application of surge
protectors is necessary when lightning hits the phase conductor in order to reduce attenuation time
and amplitude of high transient overvoltages.
The current flowing through the PEN conductor in all cases is higher than the current flowing
through the phases where it is limited due to the transformer inductance.
From the study cases presented in the previous sections it is deduced that EMTP can be easily
applied to the study of the microgrid earthing systems. It can easily represent the complexity of actual
networks with sufficient detail and accuracy, while the simulation times required are not prohibitive at
all.
6.5 Conclusions
TN system earthing with a multi-grounded neutral is preferable to the TT system for fault
protection. The isolated operation of a microgrid does not pose any exceptional requirements on the
earthing arrangements of microsources and consumer premises. Lightning behaviour of the microgrid
LV network varies with system characteristics and protection scheme. SPDs should be included in the
protection scheme of the system. Accurate network models can be used with EMTP for the study of
the microgrid earthing systems.
6.6 References [1] «MICROGRIDS – Large Scale Integration of Micro-Generation to Low Voltage Grids», EU
Contract ENK5-CT-2002-00610, http://microgrids.power.ece.ntua.gr
[2] H.W. Dommel ‗EMTP Theory Book‘, BPA, Oregon, 1986
[3] S. Papathanassiou, N. Hatziargyriou, K. Strunz, «A Benchmark Low Voltage Microgrid
Network». Proc. CIGRE Symposium ―Power Systems with Dispersed Generation‖, Athens, April
2005.
[4] J.A.Lopez, N.Gil: «Advanced Architectures and Control Concepts for MORE MICROGRIDS»,
Description of a Test Network to be Used for Simulation Platform Development, draft v.1.0, July
2006.

[5] N.Jenkins, N.Jayawarna, M.Lorentzou, S.Papathanassiou, N.Hatziargyriou: «Safety Guidelines
for a Microgrid» Technical Report, Large Scale Integration of Micro-Generation to Low Voltage
Grids, Final Draft., November 2004
[6] N.Kokkinos, I.Cotton: «Transient Behaviour of Low Voltage Distribution Systems», Proc. of the
ICLP (International Conference in Lightning Protection), Avignon, France, 2004
[7] A.Mansoor, F.Martzloff: «The effect of neutral earthing practices on lightning current dispersion
in a low voltage installation», IEEE Trans on PWRD, vol.13,no.3, July 1998.
[8] IEC 61643-1 : Surge protective devices connected to low-voltage power distribution systems, Part
I: Performance requirements and testing methods.
6.7 Appendix The network topology of all the cases examined in paragraph 3 is modeled in ATPDraw as it is
shown in figures A1. to A6
Figure A1. TN with a multi-grounded neutral - All SPDs
Figure A2. TN with a multi-grounded neutral – SPDs only at 2

Figure A3. TN with a multi-grounded neutral -None of the SPDs installed
Figure A4. TN with a multi-grounded neutral - All SPDs – Lightning hits phase conductor

Figure A5. TN with a multi-grounded neutral – SPDs only at 2 - Lightning hits phase conductor.
Figure A6. TN with a multi-grounded neutral -None of the SPDs installed – Lightning hits phase conductor
7 Grounding System Analysis of Multiple
Microgrids (University of Manchester)
7.1 Introduction
Electrical safety of a Microgrid is a vital operational requirement. A Microgrid‘s Earthing and
protection are critical. The goal of this study is to investigate the earthing system of multiple
Microgrids and explore the fault currents for different fault scenarios of multiple Microgrids.

A Microgrid will be subject to the same safety requirement as a conventional utility electric power
system. Previous studies have explored the earthing requirements and fault currents for a single
Microgrid [1]. In this study, the earthing requirement is revisited. A grounding system has been
chosen for multiple Microgrids, and its electrical safety is analysed by calculating step and touch
potentials.
In this report, Models of Microgrids, which are used in this study, are first presented. The
methodology is described for grounding system analysis. The results of fault current distribution are
analysed. An earthing system is presented and evaluated for multiple Microgrids. Finally, the
conclusions are summarized.
7.2 Models of Microgrids used for calculation of fault currents
and grounding system analysis
The benchmark model of a Microgrid, which is defined by the National Technical University of
Athens was selected as the single Microgrid model in this study [2]. This model was chosen as the
basis for fault current calculation and earthing system design. Fig. 1 shows the benchmark model.
This benchmark model consists of a single radial feeder and includes all kinds of Microsources, such
as photovoltaic generators, wind turbines, fuel cells and Microturbines for Micro-CHP applications. A
central storage unit is desirable to accommodate islanded operation of a Microgrid. A flywheel energy
storage system is used as the central storage unit in this model. The Microgrid in Fig. 1 is simplified
to a Microgrid shown in Fig 2 [1], which is used in this study.
Fig. 1 Benchmark LV single Microgrid network from NTUA [2]

Fig. 2 A simple Microgrid model [1]
In this study, a multi-Microgrid network as shown in Fig. 3 was used for further investigations [3].
This multiple Microgrids comprise of two Microgrids (Microgrid A and Microgrid B). In Fig. 3 the
study case network may be used to simulate multiple Microgrid entities within the same LV network
e.g. by considering two Microgrids, with Microturbines as Microsources. The network in Fig. 3 can
be applied to simulate Microgrids with different LV feeders and different load types. The symbol FCL
represents a fault current limiter.
The probable earthing systems for a Microgrid are TN-C-S and TT in the order of their suitability.
The IT grounding system is eliminated as a probable system since the IT system is seldom used [4]
[5].
In Fig 4, another Microgrid in Fig. 2 is added to simulate multiple Microgrids. The multiple
Microgrids consist of two Microgrids: Microgrid A and Microgrid B. Microgrid A is connected to
Microgrid B at 0.4 kV buses. Each 20/0.4 kV distribution transformer secondary is earthed and the
earth resistance is equal to 3 . The grounding system was investigated for the multiple Microgrids.
CB2
20/0.4 kV, 50Hz, 400kVA
%4kU Dyn11%1kr
3+N
F1
F2
AC
Micro gas turbine
3 kW30
3+N+PE A residential consumer
3 AI s 40F3
CB3 CB4
3+N
B
A
Data of the cable from B to C:
21204 mm Al XLPE twisted cable
400m
kmr /325.0
kmx /073.0
Main distribution network
100MVA
C
20kV
0.4kV
9.0cos
AC
Flywheel storage
200kW
3

Fig. 3 LV network for the study of multiple LV Microgrids from ABB [3]
Fig. 4 Single phase-to-ground fault of multiple Micro-grids
7.3 Methodology

A grounding system has to be designed which ensures no electrical hazards existing outside or within
the substation during normal and fault conditions. A safety grounding design will provide a path for
electric currents in to the earth under normal and fault conditions, and ensure the safety of a person in
the locality.
7.3.1 Safety criterion
Touch and step voltages determine the safety of personnel and is used to evaluate the safety and
adequacy of the design. Microgrid ground system safety analysis is based on the step and touch
voltage criterion. The maximum touch and step voltages of any accidental circuit should not exceed
the limits. The maximum allowable voltage limits should be calculated. The touch and step voltages
in and around the substation will be examined. The safety of the substation ground is determined by
ensuring the touch and step voltages do not exceed the safety limits defined in the following sections.
7.3.2 Touch voltage and step voltage
7.3.2.1 Tolerable body current limit
An accidental ground circuit is established when a person is exposed to a potential gradient close to a
grounded facility. The tolerable body current IB is used to define the tolerable touch voltage and step
voltage of the accidental circuit.
To ensure safety, shock currents should be kept below the fibrillation threshold of the heart. The
tolerable current is related to the energy absorbed by the body according to the following formula for
durations from 0.03 to 3.0 seconds,
sBB tIS 2 (1)
Where
SB is empirical constant related to the electric shock energy tolerated by a certain percentage of
a given population.
IB is current (rms) through the body (A)
ts is duration of the current exposure (s).
From Equation (1),
s
Bt
kI (2)
Where
BSk

It is assumed that 99.5% of the population can safely endure a current with magnitude and duration
determined by Equation (2) without causing ventricular fibrillation.
Fibrillation current is assumed to be a function of individual body weight. Shock energy that can be
survived by 99.5% of persons weighting approximately 50 kg is (SB)50kg = 0.0135. Hence k50 = 0.116
Therefore the tolerable body current limit for persons with 50kg body weight is
s
kgBt
I116.0
)( 50 (3)
For persons weighting approximately 70 kg, (SB)70kg = 0.0246. Hence k70 = 0.157
Thus the tolerable body current limit for persons with 70kg body weight is
s
kgBt
I157.0
)( 70 (4)
7.3.2.2 Touch voltage
Touch voltage is defined as: the potential difference between the Ground Potential Rise (GPR) and
the surface potential at the point where a person is standing while at the same time having a hand in
contact with a grounded structure [6].
An accidental circuit is shown in Fig. 5, where a person is exposed to a touch voltage. In Fig. 5, a
fault current If is discharged to the earth through the substation grounding system and the human
body. The current Ib flows through the person‘s body to the ground. H is the point of a grounded
metallic structure at which the person is touching. The person‘s two feet are in contact with the
surface of the earth in the small area F.
RB
Z(system)
If
Ig
Ib
H
F
Station Grid
Fig. 5 Touch voltage exposure
The above network is presented as Fig 6 according to the Thevenin theorem.
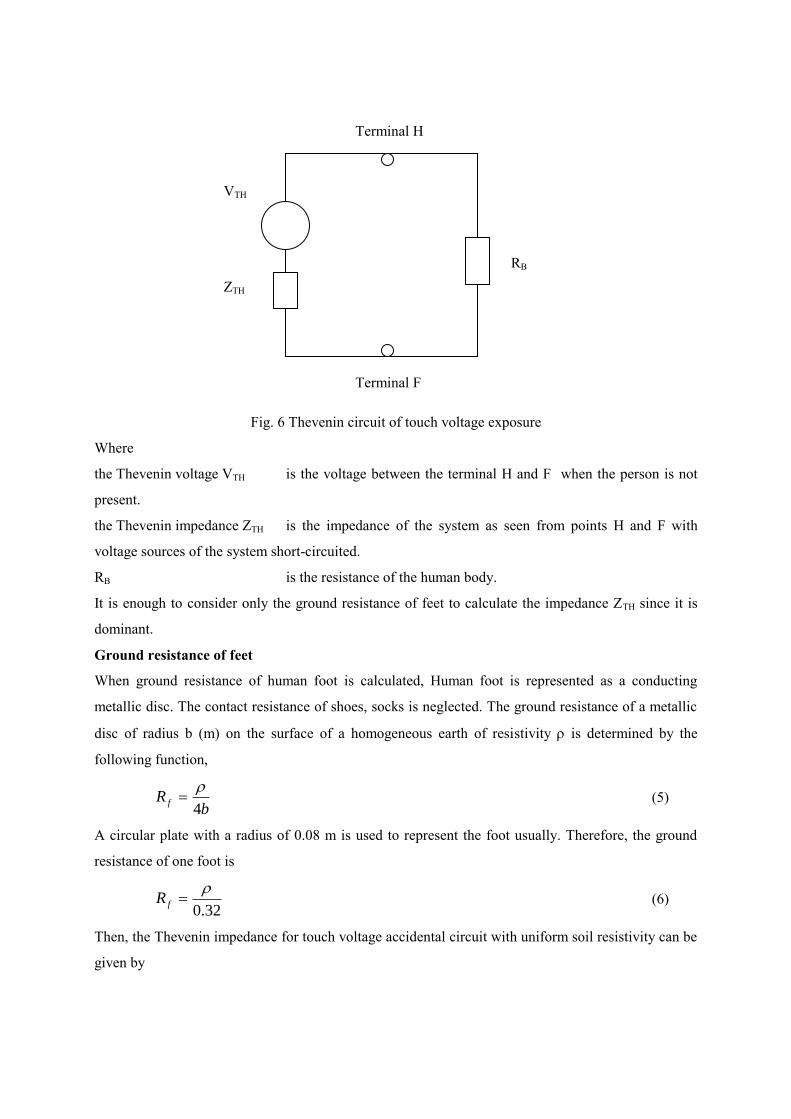
Fig. 6 Thevenin circuit of touch voltage exposure
Where
the Thevenin voltage VTH is the voltage between the terminal H and F when the person is not
present.
the Thevenin impedance ZTH is the impedance of the system as seen from points H and F with
voltage sources of the system short-circuited.
RB is the resistance of the human body.
It is enough to consider only the ground resistance of feet to calculate the impedance ZTH since it is
dominant.
Ground resistance of feet
When ground resistance of human foot is calculated, Human foot is represented as a conducting
metallic disc. The contact resistance of shoes, socks is neglected. The ground resistance of a metallic
disc of radius b (m) on the surface of a homogeneous earth of resistivity is determined by the
following function,
b
R f4
(5)
A circular plate with a radius of 0.08 m is used to represent the foot usually. Therefore, the ground
resistance of one foot is
32.0
fR (6)
Then, the Thevenin impedance for touch voltage accidental circuit with uniform soil resistivity can be
given by
RB
Terminal H
Terminal F
VTH
ZTH

5.1
2
f
TH
RZ (7)
Although the internal resistance of the human body is approximately equal to 300 , the body
resistance including the skin could range from 500 to 3000 . The resistance of human body RB is
taken as 1000 for this study. The resistance could be from hand to feet or from one foot to the other
foot.
Therefore, from Fig. 6 the current through the body of the person Ib is determined by the following
function,
BTH
THb
RZ
VI
(8)
from Equations (7) and (8), the tolerable touch voltage in V is
)5.1( BBtouch RIE (9)
Here, IB is the tolerable body current. RB is the resistance of the human body. is the soil resistivity
(.m).
For body weight of 50 kg and RB =1000 , from Equation (3) and (9),
s
toucht
E116.0
*)5.11000(50, (10)
ts is the duration of current exposure.
For body weight of 70 kg and RB =1000 , from Equation (4) and (9)
s
toucht
E157.0
*)5.11000(70, (11)
7.3.2.3 Step voltage
Step voltage is defined as: the difference in surface potential experienced by a person bridging a
distance of 1 m with the feet without contacting any grounded object. Fig. 7 shows an accident when a
person is exposed to a step voltage [6].

RB
Z(system)
If
Ig
Ib
F1
Station Grid
F2
Fig. 7 Exposure to step voltage
According to the Thevenin theorem, the above network is presented as Fig 8. In Fig. 8, a fault current
If is discharged to the earth through the substation grounding system. The current Ib flows through the
person‘s body from one foot F2 to the other foot F1.
Fig. 8 Thevenin circuit of touch voltage exposure
Where
the Thevenin voltage VTH is the voltage between the terminal F1 and F2
when the person is not present.
the Thevenin impedance ZTH is the impedance of the system as seen from
points F1 and F2 with voltage sources of the
system short-circuited.
RB is the resistance of the human body.
RB
Terminal F1
Terminal F2
VTH
ZTH

The Thevenin impedance ZTH for step voltage accidental circuit with uniform soil resistivity is
defined as
6
2 fTH RZ (12)
The tolerable step voltage in V is
)6( BBstep RIE (13)
Here, IB is the tolerable body current. RB is the resistance of the human body. is the soil resistivity
(.m).
For body weight of 50 kg, and for RB=1000
s
stept
E116.0
*)61000(50, (14)
For body weight of 70 kg, and for RB=1000
s
stept
E157.0
*)61000(70, (15)
7.4 Fault current calculation of multiple Microgrids
Touch and step voltage distribution in a Microgrid depends on the fault current discharged in to the
earthing system and the earthing system itself. The earthing design of Microgrids is based on the fault
current values. Therefore, the single-phase-to-ground fault currents of multiple Microgrids were
analysed both manually and using software CDEGS. Also, fault currents were calculated for both grid
connected and islanded Microgrids. The method of symmetrical components was employed to
manually calculate the fault current distribution in Microgrids. The fault current results from the
module SPLITS in CDEGS software were compared with the results of manual calculations.
Table 1 lists the maximum single phase-to-earth fault currents from both CDEGS software and
manual calculation. The maximum possible earth current is 153.5 (A) totally, and 76.7 (A) from each
Microgrid transformer. Thus 80 A was selected as the earth fault current value being discharged into
the ground. This value was applied to analyse the performance of the selected earthing system.
7.5 Grounding system analysis
7.5.1 Grounding system design
Fig. 9 shows the grounding system designed by Jayawarna and Jenkins for a single Microgrid
transformer. Since the selected fault current discharged into the ground in Jayawarna and Jenkins‘

study is same as that in this study (80 A), this grounding system shown in Fig. 9 was chosen as the
earthing system for each Microgrid transformer in this study [2].
Table 1 Results of single phase-to-ground fault currents
Earthing system
Fault type and location
Total fault current manually calculated (A)
CDEGS results of fault current (A) Total fault current
Earth current from Microgrid A
Earth current from Microgrid B
Total earth current
Neutral current
TT grid connected
F2E 143.2 145.8 72.9 72.9 145.8 0
TT islanded
F2E 145.7 146.4 73.2 73.2 146.4 0
TT grid connected
F2‘E 147 153.5 76.7 76.7 153.5 0
TT islanded
F2‘E 151.5 150.8 75.4 75.4 150.8 0
2 — means the fault happens at the remote end of the feeder.
2‘ — means the fault happens at the beginning of the feeder.
F2E – means the phase-to-earth fault current at the remote end of the feeder.
F2‘E – means the phase-to-earth fault current at the beginning of the feeder.
This grounding system composes of a 5m * 5m grid of four horizontal conductors along with four
vertical ground rods at each corner of the grid. Each vertical rod is 5m long. The grid is buried at 0.5
m depth. Two horizontal conductors are applied to increase the ground system area. Each of the two
horizontal conductors is 25m long [7] [8].
Earth surface
Additional horizontal conductor
Additional horizontal conductor
Vertical ground rods
25 m 25 m 5 m
5 m
5 m
0.5 m

Fig. 9 Grounding system of a Microgrid transformer [2]
7.5.2 5.2 Performance evaluation of grounding system of Microgrids
7.5.2.1 Touch and step voltage limits
The touch voltage and step voltage limits were defined. From Equation (10), the touch voltage limit is
calculated for a body weight of 50 kg and a fault clearing time of 0.7 seconds,
)(4.159
7.0
116.0*)1005.11000(50, VEtouch (16)
From Equation (14), the step voltage limit is calculated for a body weight of 50 kg and a fault clearing
time of 0.7 seconds,
)(8.221
7.0
116.0*)10061000(50, VEtouch (17)
Here, a uniform soil model is chosen and the soil resistivity is taken as equal to 100 (.m).
The safe voltage limits are increased for a body weight of 70 kg, higher surface resistivity and faster
fault clearing times. Here, the body weight is 50 kg and fault clearing time is 0.7 second. The soil
resistivity is 100 (.m). Therefore, the worst scenario was selected to determine the maximum touch
and step voltages. The safety threshold of touch voltage was 160 (v) and the safety threshold of step
voltage was 222 (v) for each Microgrid in this study [2].
7.5.2.2 Step and touch voltages of the design
The touch voltage and step voltage in Microgrids were evaluated using the module MALZ in the
software CDEGS within and around the substation based on the fault current results. From Table 1,
80 A was selected as the earth fault current value being discharged into the ground.
In order to investigate touch and step voltages above the grounding system and immediate around the
system, a profile containing observation points spaced 1 m apart at the surface of the earth above the
grounding system was defined and this profile was replicated every 1m along the grid, as shown in
Fig. 10. The observation points were defined to cover an area extending 2m outside the substation [2].
Therefore, eight profiles were created. Profiles 1 and 8 are outside the substation. Profiles 2-7 are
within the substation ground area. Due to the symmetry of the ground system, profile1 coincides with
profile 8, 2 with 7, 3 with 6, 4 with 5.
Fig. 11 presents the actual touch voltages around the grounding system. Fig. 12 shows the actual step
voltages around the grounding system. The actual touch and step potentials were compared with the
safety limits. It was discovered that the maximum touch voltage within the substation occurs towards
its centre and was approximately 44 V. The touch voltages were higher outside the substation, but

they were still below the touch voltage limit (160 for touch voltage). The maximum step voltage was
about 33 V, thus step voltages were within safety limit (222 for step voltage) in and around this
substation [2].
Fig. 10 Observation profiles (after [2])
Fig. 11 Touch voltages around the ground system from MALZ

Fig. 12 Step voltages around the ground system from MALZ
7.6 Conclusion
A ground system was chosen for each Microgrid in multiple Microgrids. The touch and step voltage
limits were defined. The actual touch and step voltages were discovered using the module MALZ in
CDEGS software. The actual touch and step potentials were compared with the touch and step voltage
limits.
It is discovered that the maximum touch and step voltages are well below the touch and step voltage
limits. Therefore, the selected ground system satisfies the safety criterion. The results indicate that the
proposed grounding system for a single Microgrid satisfies the safety requirement for each Microgrid
in this study of multiple Microgrids earthing system.
7.7 References
[1] N. Jayawarna, N. Jenkins, M. Barnes, M. Lorentzou, S. Papthanassiou and N. Hatziagyriou,
―Safety Analysis of a MicroGrid‖, International Conference on Future Power System 2005,
pp. 1-7, 16-18, Nov., 2005.
[2] Papathanassiou, S., Hatziargyriou, N., Struntz, K., ―A benchmark low voltage Microgrid
network,‖

www.ee.washington.edu/Conference/2005/papathanassiou_Hatziargyriou_Strunz_LV_Bench
mark_CIGRE05.pdf.
[3] Alexandre Oudalov, ―Alternative designs for Microgrids‖, 2nd
consortium meeting,
Mannheim, Germany, July, 2006.
[4] N. Jayawarna, N. Jenkins, ―LV distribution in UK‖, EU Project MICROGRIDS: Large-Scale
Integration of Micro-Generation to Low Voltage Grids – ENK5-CT-2002-00610.
[5] N. Jayawarna, N. Jenkins, ―Review of earthing in a Microgrid ‖, EU Project MICROGRIDS:
Large-Scale Integration of Micro-Generation to Low Voltage Grids – ENK5-CT-2002-00610.
[6] IEEE standard 90-2000 (Revision of IEEE standard 80-1986), ―IEEE guide for safety in AC
substation grounding‖, 2000.
[7] N. Jayawarna, N. Jenkins, ―Microgrid Grounding System Analysis‖, EU Project
MICROGRIDS: Large-Scale Integration of Micro-Generation to Low Voltage Grids – ENK5-
CT-2002-00610.
[8] EU Project ―MICROGRIDS: Large-Scale Integration of Micro-Generation to Low Voltage
Grids – ENK5-CT-2002-00610‖. http://microgrids.power.ece.ntua.gr/micro/default.php
8 On Load Tap Changer and Microgrids Voltage
Control Strategies (University of Manchester)
8.1 Introduction
One of the widely used methods to control voltage on a power system is to use a tap changing
transformer. Power transformers usually have multiple taps on either the primary or the secondary
windings. Switching between various taps changes the turns ratio by a certain amount and hence
changes both the voltage level at one of the transformer terminals and the reactive power flow through
the transformer.
Transformers installed in both transmission system and medium voltage (MV) distribution networks
are generally equipped with On Load Tap Changers (OLTCs). OLTC allows changing the transformer
tap position without disconnecting the transformer from the circuit. MV/LV distribution transformers
do not generally have OLTC controllers and thus, changing tap location involves disconnecting the
transformer from the network.
OLTC control affects the voltage level of the whole system with the same magnitude. It is used to
hold the voltage level at a certain point in the distribution system within a specified dead band.

Voltage magnitude at other nodes will vary around the voltage of this point. Proper selection of the
voltage controlled point has a potential effect over the voltage profile of the whole system.
Traditionally, the voltage controlled point was selected to be the transformer low tension (LT).
In this report, a review of OLTC configurations is presented. New requirements for the tap changer
are identified in the context of micro grids. Then voltage control in radial networks with and without
distributed generation is presented. A multi level voltage control scheme was investigated. It is based
on local measurements and a single communication link between the transformer OLTC controller
and a selected MicroSource. The control method is then expanded to operate with many MicroGrids
and Passive Distribution Feeders connected to the same distribution transformer.
8.2 On Load Tap Changers
Transformers installed in medium voltage networks and above use on load tap changers to adjust the
transformer terminal voltage without interrupting the load current. By changing the turns ratio of the
transformer through a tap changer, the voltage magnitude is easily increased or decreased to maintain
the voltage with in a defined level. A number of tap changers have been proposed and they are
presented next.
8.2.1 Mechanical tap changers
A typical mechanical on load tap changer configuration is shown in Figure 1. The tap changer
composes of a selector and a diverter unit that are placed in separate oil-filled compartments. When a
tap change is needed, a tap adjacent to the one currently in use is pre-selected by closing the
appropriate selector switch. The diverter then transfers the load current to the new selected tap
through the operation of the moving arm E.
For example, in Figure 1, tap 4 is connected and the next tap required is tap 5. In order to perform this
tap change, the diverter contact arm E is moved rapidly from left to right from A to B to C to D. When
contacts B and C are connected, an inter-tap current path appears through resistors. It takes the contact
arm E about 75 ms to move across the contacts. As a result, the inter-tap current is short lived and the
resistors need only be transiently rated.
A typical 240 MVA transformer tap changer takes about 100s to traverse a full range of 19 taps [1].
Mechanical on load tap changers are widely used in power systems and requires periodic
maintenance.

Figure 1: A typical mechanical on-load tap changer [1]
8.2.2 Solid state tap changers
Solid-state tap changers are used to improve the response speed and to reduce the maintenance needs
of tap changers. A solid state tap changer comprise of solid state switches as shown in Figure 2.
Figure 2: Solid state on-load tap changer [2]
The electronic switches are employed and they are electronically controlled gate devices. These
electronically controlled gate devices (e.g. thyristers) are connected as an inverse parallel-connected
pair to each tap winding. A tap change is achieved by turning on the appropriate thyristor pair while
turning off another thyristor-pair. A control device triggers predetermined groups of the thyristor pair
to connect or bypass certain ones of tap winding sections and thereby provide a wide range of
individual output voltage regulation.

The semiconductor switch selection is related to the required power level. Thyristors and GTOs (Gate
Turn-off thyristor) are feasible. IGCTs (Integrated Gate Commutated Thrystor) are also good
candidates.
The taps must be changed under full operation of the transformer so that a continuous control of the
transformer voltage is achieved. By controlling the transformer turn ratio, the voltage at the secondary
side of the power transformer stays constant despite the changes of the voltage at the power grid or
changes of the load [3].
A solid-state tap changer needs little maintenance due to no moving parts, and provides fast responds
with the emergence of high-power semiconductors. The lifetime of a solid state tap changer is at least
equal to that of a mechanical tap changer. However, solid-state tap changers have high conduction
loss and increased operating cost.
For the thyristor bank in solid-state tap changer a problem is the over-voltage because of steep fronted
lightening surges being propagated into the transformer. The initial voltage distribution across a
transformer winding is dependent upon the inherent capacitance distribution. Usually the turns at the
low potential or earth end of the winding are subject to the least hard duty and hence the tapped
winding should be connected there [4]. The design must ensure that the thyristor over-voltages are
limited to a safe value. When the location of the transformer and its associated feeders reduce the
magnitude and especially the wave front steepness of any incoming surges to a safe value, a solid-
state tap changer can be applied [4].
8.2.3 Vacuum switch and solid state based tap changers
The selector has the same circuit configuration as the mechanical tap changer illustrated in Figure 1.
However, in this configuration, the selector composes of vacuum switches and bistable
electromechanical actuators. The usual oil-immersed contact and complicated mechanical drive of the
mechanical tap changers is replaced. The vacuum switches have a high power handling capacity and
have long life. The bistable actuator drives the vacuum switch through a non-conducting shaft. The
actuator is operated by applying a pulse of current to one of two operating coils, one for closing and
one for opening. Switch transition takes around 20 ms, and then a permanent magnet retains the
moving member in the new position and simultaneously provides the required hold-on and hold-off
force.
The diverter of this type of tap changer is shown in Figure 3. The diverter comprises of two solid
state switches, which are connected between each of the selector output leads and the star point.

Figure 3: Vacuum Switch based Diverter [1]
During a tap change, two solid state switches perform the transfer of phase current from one tap to the
next. An auxiliary circuit (not shown here) is used to assist smooth transition of the load current from
one side to the other. The load current is transferred from the conducting solid-state switch to the
parallel connected vacuum switch following a tap change. The solid-state switch is consequently
relieved of conduction loss and protected from over current due to faults. Directly after the tap
change, the selector disconnects the other solid-state switch from the transformer, so that high-voltage
surges cannot damage it [1]. It is important to note that the vacuum switches do not make or break the
load current in this configuration.
A new OLTC has recently been developed at Areva T&D to allow higher penetration level of
distributed generation [5]. It utilises two vacuum switches rather than the mechanical diverter switch.
Disconnecting one vacuum switch and connecting the other at the same time accomplish the tap
changing operation. A resonant commutation circuit is employed to extinguish the arc in the vacuum
switch that is disconnected. This OLTC configuration is shown in Figure 4.
Figure 4: Newly proposed tap changer configuration [5]
This new on load tap changer has been specifically developed to address regulation of voltage on
networks that is expected to have a significant number of distributed CHP units. The proposed design

is flexible and can be adapted to fit a wide range of existing transformer designs. According to
AREVA, the new tap changer is cheap and more reliable than the existing ones and has a projected
life in excess of 30 years.
8.3 Voltage Control in Distribution Networks
Table 1 lists some of the standards and regulations that define voltage control limits in electrical
networks [6] [7]. Except the EN 50160, all the other standards and regulations define a deterministic
limit for voltage regulation. However, EN 50160 defines a statistical limit for voltage regulation. It
states that during each period of one week, 95% of the 10 min mean rms values of the supply voltage
shall be within the range of ±10% of the nominal voltage for low voltages below 1kV and medium
voltage between 1kV and 35 kV [6].
Table 5: Standards for voltage levels Standard
or
regulatio
n
EN 50160
IEC 61000-
2-2
The Electricity Safety,
Quality and Continuity
Regulation 2002
The Electricity Supply
Regulations 1988
Voltage
range
Low and
Medium
voltage
±10%
Low
voltage
±10%
Low voltage +10%, -6%;
High voltage below 132
kV ±6%;
High voltage above 132
kV ±10%.
Above 50 V below
1kV +10%, -6%;
Above 1 kV below 132
kV ±6%.
Most distribution systems are radial. Radial systems are simple to operate, easy to protect, and require
minimal number of switchgears. In distribution system design voltage and continuity of supply are
considered. Figure 5 illustrates a radial feeder with a source transformer supplying power to
consumer.
Figure5: A simple system illustrating voltage drop along the feeder
In Figure 5, the complex voltage at busbar 1 is
)(1221 jXRIVV (1)
PL+jQL R+jX
1V 2V
1 2
12I

Where, 1V and 2V are complex voltages at busbars 1 and 2. R is the line resistance, and X is the line
reactance. 12I is the complex current which flows from busbar 1 to busbar 2. A local load at busbar 2
is PL+jQL .
Where, the current which flows from busbar 1 to busbar 2 is
*
2
12V
jQPI LL (2)
From equation (1) and (2), the complex voltage at busbar 1 is
*
2
*
2
21V
RQXPj
V
XQRPVV LLLL
(3)
Equation (3) expresses the complex voltage at busbar 1 in terms of load, network impedance and the
complex voltage at busbar 2. The X/R ratio is relatively low for distribution networks and the voltage
angle drop represented by the imaginary part of the Equation (3) is small and may be ignored.
Therefore, Equation (3) is approximated as the following equation,
2
21V
XQRPVV LL
(4)
Therefore,
2
12V
XQRPVV LL (5)
It can be seen that the voltage at the end of feeder is determined by both the source voltage and the
voltage drop along the feeder. The voltage drop along the feeder is determined by the line resistance
and reactance, the reactive power flow and active power flow.
The voltage variations are caused by the variations of the active and reactive loads in the distribution
network. That is to say, when the load current flowing through the resistance and reactance of the
lines varies in a distribution system, voltage fluctuations occur.
In order to keep voltages at the ends of feeders within permitted limits, source voltages are often
maintained above nominal voltage using on-load tap-changing transformers, capacitor banks and
reactive power compensators. When the demand increases in the network, the tap changing
transformer at the substation would increase the source voltage to keep the voltage at the end of the
lines within the required limits. Voltage control can also be achieved by regulating reactive power
throughout the system. The reactive power can be controlled by using shunt capacitors, shunt reactors,
series capacitors, synchronous condensers, and static var compensators (SVC).
Tap changers are controlled by automatic voltage control (AVC) relays as shown in Figure 6, in order
to maintain the substation voltage V1 at a desired voltage reference Vref. The substation voltage V1 and
voltage reference Vref are input to the AVC relay. By comparing V1 and Vref the AVC relay ensures
that V1 is within a defined voltage band Vd of the AVC relay. If V1 > Vref + Vd/2, the AVC relay

instructs the tap changer to decrease V1. If V1 < Vref - Vd/2, the AVC relay instructs the tap changer to
increase V1. The AVC relay has been designed for passive distribution networks with unidirectional
power flows [7] [8].
Figure 6: Voltage control using OLTC transformer with AVC relay
8.4 Effect of Distributed Generation on Voltage Control of On-
load Tap Changer
When a distributed generator is connected in a radial network, the power flowing through the feeder
may be changed. The connection of distributed generator could influence the voltage control of the
network and sudden isolation of the distributed generator could cause under-voltage condition.
Figure 7 shows a simple distribution system with distributed generator connected at busbar 2.
Figure 7: A simple system illustrating voltage rise effect by DG
In Figure 7, the complex voltage at busbar 1 is represented as the follows;
*
2
*
2
21
)()()()(
V
RQQXPPj
V
XQQRPPVV GLGLGLGL
(6)
PL+jQL
R+jX
V1 V2
PG±jQG
1 2
DG
PL+jQL R+jX
V1 V2
1 2
AVC
LTC
Vref

Similar to Equation (3), Equation (6) is approximated as
2
21
)()(
V
XQQRPPVV GLGL
(7)
Here, the distributed generator supplies active and reactive power PG±jQG. The negative value of
reactive power generation indicates that the distributed generator is importing reactive power from the
system.
The generator‘s active power export decreases the power flow from the primary substation to the
consumer, thus decreasing the voltage drop along the feeder. If the feeder load is less than the
generator power export, power will flow from the generator to the primary substation causing a
voltage rise from primary substation to the generator. To export its power in a resistive network, a
generator is likely to have to operate at a higher voltage than the source voltage unless it is able to
absorb a significant amount of reactive power. The voltage rise is more serious at the condition of no
demand on the system as all the generation is exported back to the primary substation. As a result, it is
the voltage rise during period of no or minimum demand that limits the amount of generation
connected.
As mentioned earlier, connecting a generator to the distribution system will affect the flow of power
and the voltage profiles. The OLTC controlled by AVC relay may fail to supply acceptable voltage
for the feeder with DG due to the possibility of having bidirectional power flow rather than the
conventional unidirectional power flow encountered in passive distribution networks. Consequently
whenever a generator is connected to the distribution system, it is necessary to consider whether the
power may be exported back through the primary substation and to ensure that the transformer‘s tap
changers are capable of operating with a reverse power flow if required.
It is necessary to control OLTC tap position according to DG outputs in order to allow higher levels
of distributed resources. Otherwise, power injection levels can be severely limited if substation
voltage is kept constant by the OLTC transformer.
8.5 Voltage Control Schemes
Distributed generation can influence conventional voltage control. The connection of distributed
generator to one end of a line changes the power flow of the line to be bidirectional. The conventional
operation approach of tap changing transformer at the substation is not suitable for such situation
since it assumes a voltage drop on all lines downstream from the transformer. Modern communication
systems help us to find voltage level at the end of all lines. Such control problems could be solved
using the following methods.

8.5.1 Automatic voltage reference setting
The control based on automatic voltage reference setting (AVRS) approach was developed to suit
distribution networks with distributed generation. An AVRS algorithm acts as an outer control loop to
the basic AVC relay. The AVRS algorithm uses the maximum voltage vmax and the minimum voltage
vmin from potential points on the network to alter vref of the AVC relay. The AVRS algorithm
compares the vmax and vmin with the network upper and lower voltage limits vupper and vlower
respectively. If vmax> vupper or vmin< vlower, the control algorithm calculates the required voltage
reference correction v to be added to the current vref of the AVC relay. The shift in vref moves the
dead band of the AVC relay forcing the tap changer to tap up or down to bring the violated vmax and
vmin within allowable feeder voltage limits [7-9].
8.5.2 Supervisory control
As distribution networks have lower standards of protection and control compared to transmission
systems, they do not have any dedicated communication links between the various points on the
network. Therefore, any equipment that is installed to improve voltage control must make its
decisions based on data available from local measurements.
Conventionally, the OLTC and the capacitor banks are controlled independently using local
measurements. A supervisory control method avoids this control approach. Instead, the supervisory
control continuously monitors voltage drop along the feeders connected to a substation and then
operates the OLTC and the capacitor banks local to the substation. The controller calculates the
feeder voltage drop vdrop using the feeder current Ifd similar to the line drop compensation in an AVC
relay. Instead of directly using R and X of the feeder to calculate the voltage drop, an effective
impedance zeff obtained from a series of load flows under various load conditions was used. The main
aim of zeff was to overcome the practical difficulty of defining load centres due to spread of the load
on the feeder [7] [8].
8.5.3 The probabilistic load flow method
The classical tools used to assess the impact of DGs on the network voltages are load flow programs.
However, using traditional load flow analysis it is not possible to achieve a realistic impression of
where and when over-voltages or under-voltages occur in the network during a whole study period,
because these analyses are based on some selected combination of consumer loads and DG power
production. Probabilistic load flow (PLF) can be applied to incorporate the effect of load and
production variation. PLF requires modeling of loads and power productions as probability density
functions and provides the complete spectrum of all probable values of the bus voltages and power

flows in the study period with their respective probabilities taking into account generation and load
uncertainties and correlations and topological variations.
Modelling the effects of reactive power control means is particularly important. In this way, operation
limit violations are obtained for the whole study period with the probability of each violation. Thus
PLF allows decisions to be based on objective data, i.e. probabilities of occurrence.
8.6 Voltage Control for Microgrids
A micro grid is often defined as part of a LV distribution network consisting a number of small
modular generators, controllable loads and some kind of energy storage. A single 11/0.4kV
transformer that may be assumed to have a tap-changing transformer supplies the network.
8.6.1 Voltage control scheme
A multi level control scheme incorporating reactive power, and OLTC control can be used in
MicroGrids. In this scheme, shown in Figure 8, reactive power control is the primary control that
responds instantaneously to reduce voltage deviations. The slower secondary control is provided by
the OLTC which responds to reduce reactive power output of a selected MicroSource (Control
MicroSource).
OLTC
Controller
Calculate
P1
DeadbandI1
P3,Q3+
k3Q3
V3
V0
P1,Q1
k1
V1V0
pcf
Control
MicroSource
Other MicroSources
-P2,Q2+
k2Q2
V2-
+-+-
Q1
P1
V0
Figure 8: Voltage control scheme
The reactive power output of the MicroSources is controlled according to voltage droop
characteristics as in [10-13]. Droop line slopes are selected based on the voltage limits and the rated
reactive power of the MicroSources. A typical reactive power droop characteristic is shown in Figure

9 and described by equation (8). In this equation, Q is the reactive power output of the generator, V is
its terminal voltage, V0 is its nominal voltage, and k is the inverse of the droop line slop and is given
by (9) in which Vmax is the maximum permissible voltage deviation.
V
QQmax-Qmax
Vmax
Vmin
Q generationQ absorbtion
VmaxV0
Figure 9: Typical droop characteristics
0Q k V V (8)
max
max
Qk
V
(9)
Voltage levels in the resistive MicroGrid are mainly affected by active power. An increase in active
power injection from any generator increases the voltage of all busbars. Reactive power injected by
all MicroSources will then be reduced by the droop control. An example of those changes is
illustrated by points 1, 2, and 3 in Figure 10. The reactive power output of the Control MicroSource
indicates the changes in reactive power generation of other MicroSources. The Control MicroSource
is selected such that it is centrally located in the MicroGrid so the voltage differences between its
busbar and the busbars of other MicroSources and loads are low.
The OLTC controller receives the value of reactive power generated by the Control MicroSource and
changes the taps in order to maintain the reactive power within a specified deadband as illustrated by
points 3 and 4 in Figure 10a. This tap action will also reduce the reactive power in other
MicroSources as shown in Figure 10b.

V1
Q1Q1maxQ1min
V2
Q2Q2maxQ2min
Droop characteristics of the Control
MicroSource
Droop characteristics of
another MicroSource
1
2
3 4
Dead band
1
2
34
Increase in P1Increase in P1
Reactive power
response
Reactive
power response
Tap action Tap action
(4a) (4b)
Figure 10: Control system response to a change in active power injection The deadband has to be larger than the maximum possible change in reactive power generation
associated with any single tap step. If this limit is violated, the OLTC will hunt. Subsequent to a tap
change, the total change in reactive power generation of all MicroSources can be approximated by
equation (10) in which Qtotal is the sum of all changes in reactive power generation of all
MicroSources, ktotal is the sum of all individual values of k, Vs is the open circuit transformer voltage
at the initial tap position, Vs is the change in the transformer open circuit voltage due to the tap step,
and X is the total MicroGrid reactance. Full derivation of this equation is in Appendix A.
2
0
12 4
total s totaltotal s
s total total
k V k XQ V
V k X k V X
(10)
This change in reactive power is shared by all MicroSources. The change in the Control MicroSource
reactive power will then be given by equation (11) where the subscript 1 denotes the Control
MicroSource. This value, after being increased by 20% to account for the approximations and
uncertainties, is used as the reactive power deadband.
11 total
total
kQ Q
k (11)
The system is sensitive to voltage, and consequently power, variations at the busbar of the Control
MicroSource. The OLTC response to an increase in the Control MicroSource active output power
may then result in low voltages at other busbars. This effect is reduced by shifting the deadband. This
shift in the deadband is introduced by compensating the reactive power value sent to the OLTC
controller by subtracting a term that is proportional to active power as shown in equation (12). In this
equation, Q1 is the reactive power of the Control MicroSource, Qc is the compensated reactive power

value sent to the OLTC controller, P1 is the active power injected at the busbar of the Control
MicroSource.
1 1c cfQ Q p P (12)
The power compensation factor, pcf, is calculated from equation (13). In this equation k1 is the inverse
of the droop of the Control MicroSource, N is the total number of MicroSources, and R1j is
determined by the resistance of the paths from both the Control MicroSource and the jth MicroSource
to the transformer, path1 and pathj in Figure11. The resistance R1j is equal to the difference between
the resistance of path1 and that of the common part of the two paths, common_path1j. Figure 11 shows
these resistances.
1
2
11
N
j
j
cf
R
p kN
(13)
Control MicroSource
1
2 3 j N
R12
R13R1j
path1
pathjcommon_path1j
Figure 11: Resistance values used with power compensation factors
This control system assumes voltage levels are more affected by active power than reactive power.
Consequently, due to the high transformer reactance, MicroSources connected to the transformer
busbar have to work on constant reactive power output in order to be integrated to this control
scheme.
In practice, multiple MicroGrids and Passive Distribution Feeders may be connected to the same
transformer as shown in Figure 12. The OLTC controller receives the reactive power signal from the
Control MicroSource of each MicroGrid. The minimum voltage of each Passive Feeder is estimated
using line drop compensation. The OLTC controller then acts to keep the average value of the
received reactive power signals within a deadband unless the estimated voltage of the Passive Feeder
drops below its lower limit.

n11 n32
w1 w2
Qc1 Qc2
OLTC
Controller
Vmin ++
MicroGrid (1)
MicroGrid (2)
Passive Distribution Feeder
V
LDC
I
Control
MicroSource1 2 N3
Control
MicroSource
1 2 N3
Figure 12: Multi MicroGrid/feeder operation
Since the droop line slopes of the Control MicroSources are based on their individual ratings, their
reactive power outputs were normalised to a common base before being averaged. This is represented
by n11, n32 in Figure 12 where the first subscript denotes the Control MicroSource while the second
subscript denotes the MicroGrid. Different weights, w1, and w2 in Figure 12, were used for each
MicroGrid according to the sum of the power rating of the generators.
8.6.2 Case studies
The control scheme was applied to the model system described in [14] which comprises two
MicroGrids and a Passive Distribution Feeder as shown in Figure 13. All loads and generation are
assumed to be balanced across all three phases. All generators connected to the same busbar are
lumped together. The assumed active and reactive power ratings for all MicroSources and the thermal
limits of the service cables in MicroGrid (1) are listed in Appendix B.
8.6.2.1 Single microgrid
For single MicroGrid operation, only MicroGrid (1) is considered. The Control MicroSource is the
MicroSource connected to busbar 16. The deadband is ±4.5kVAr and the power compensation factor
is 0.0752kVAr/kW. Figure 14 shows four cases of the operating point moving along the droop
characteristics for the two MicroSources connected to busbars 16 and 19. The points in this figure are
marked as follows
(o): Initial point at which the system is operating at no load, no generation, and rated
transformer open circuit voltage
(): Operating points after a change in generation or load with no tap change.
(■): Operating point after a tap change.

MicroGrid (1)
Pa
ss
ive
Dis
trib
uti
on
Fe
ed
er
14
15
19
18
16 17
20
31
24
28
30
15
.4kV
A
13
.8kV
A
8.8
kV
A
4.4
kV
A
13.8kVA
11kVA
57
kV
A
5.7kVA
25kVA
25kVA5.7kVA
70
kV
A
0.4kV
20kV
20/0.4kV, 50Hz, 400kVA
±2.5%,±5% OLTC
MV Network
MicroGrid (2)
6
Figure 13: System model
Figure 14: Snapshots of different operating points in single MicroGrid operation
The four cases in Figure 14 are as follows:
Case (1) The system was fully loaded except at busbar 16. The MicroGrid voltages
consequently dropped and the MicroSources responded by generating reactive power.

As the reactive power generation by the Control MicroSource was outside the
deadband, the OLTC increased the voltage by 2.5%.
Case (2) The MicroSources connected to busbars 14, 15, 17, and 18 increased their output
power to 15, 4.5, 45 and 45kW respectively. All MicroSources, due to droop control,
absorbed reactive power to reduce the voltage rise. The high reactive power absorbed
by the Control MicroSource triggered a tap action that reduced the transformer
voltage by 2.5%.
Case (3) The Control MicroSource increased its power generation to 40kW. The increase in its
terminal voltage and reactive power absorption was larger than those of any other
MicroSource. Power generated by the Control MicroSource shifted its deadband to
the left by the amount of generated power times the power compensation factor as in
equation (12). This shift prevented the tap action.
Case (4) This case is similar to Case (3) but the increase in power generation was 100kW. The
voltage rise and the subsequent reactive power absorption of all MicroSources were
significant and the OLTC reduced the voltage by 2.5%.
The voltage control strategy affects the power that can be generated by each MicroSource. Figure 15
shows the allowable power generation with all loads set to zero, with the generators under constant
reactive power output, controlled by voltage droops, and controlled by the Multi Level Control. The
thermal limits of power transfer over the cables connecting the MicroSources to the main feeder are
shown by the line. Two sets of results are shown with thermal limits being not enforced in Set (1) and
enforced in Set (2). The allowable power generation in the MicroGrid is increased significantly by the
Multi Level Control scheme.
0
20
40
60
80
100
120
140
160
180
14 15 16 17 19 14 15 16 17 19
Thermal limits not enforced Thermal limits enfirced
Allo
wable
Pow
er
Genera
tion(k
W)
Constant Power Output Operation Droop Control Multi Level Control
Thermal Limits
Set (1) Set (2)
MicroSources at busbar MicroSources at busbar
Figure15: Maximum power generation at no load conditions 8.6.2.2 Multiple microgrids and passive distribution feeders
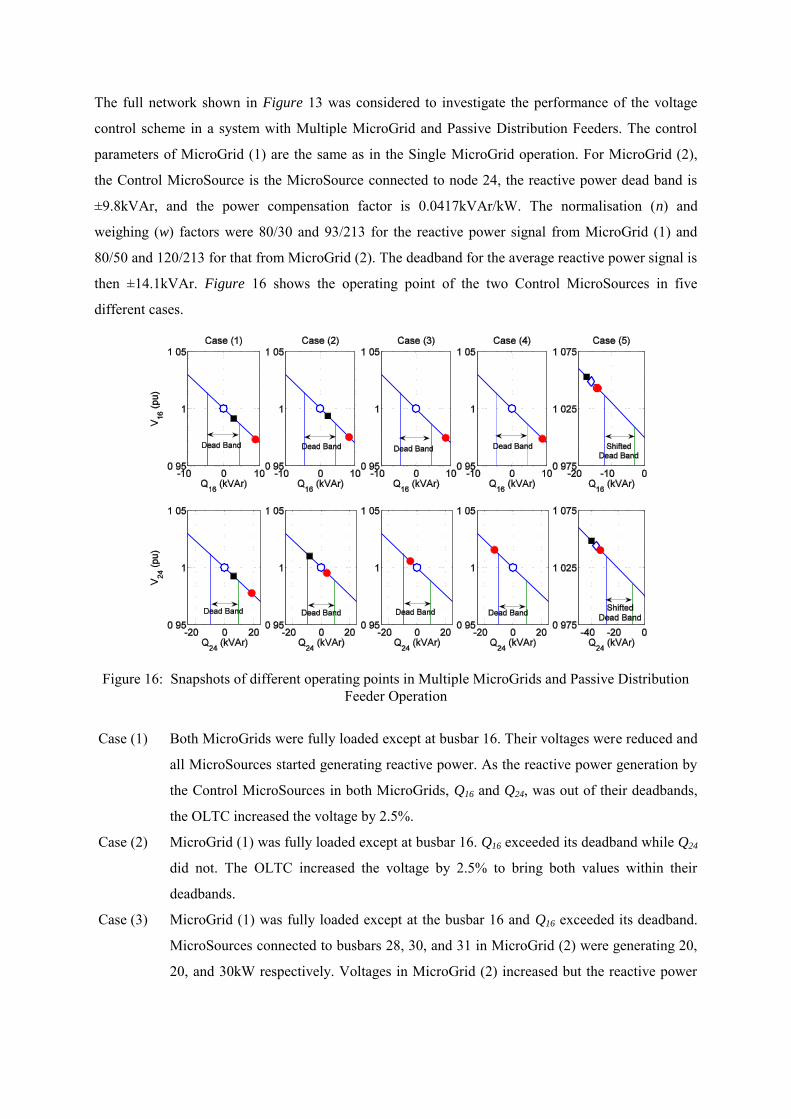
The full network shown in Figure 13 was considered to investigate the performance of the voltage
control scheme in a system with Multiple MicroGrid and Passive Distribution Feeders. The control
parameters of MicroGrid (1) are the same as in the Single MicroGrid operation. For MicroGrid (2),
the Control MicroSource is the MicroSource connected to node 24, the reactive power dead band is
±9.8kVAr, and the power compensation factor is 0.0417kVAr/kW. The normalisation (n) and
weighing (w) factors were 80/30 and 93/213 for the reactive power signal from MicroGrid (1) and
80/50 and 120/213 for that from MicroGrid (2). The deadband for the average reactive power signal is
then ±14.1kVAr. Figure 16 shows the operating point of the two Control MicroSources in five
different cases.
Figure 16: Snapshots of different operating points in Multiple MicroGrids and Passive Distribution
Feeder Operation
Case (1) Both MicroGrids were fully loaded except at busbar 16. Their voltages were reduced and
all MicroSources started generating reactive power. As the reactive power generation by
the Control MicroSources in both MicroGrids, Q16 and Q24, was out of their deadbands,
the OLTC increased the voltage by 2.5%.
Case (2) MicroGrid (1) was fully loaded except at busbar 16. Q16 exceeded its deadband while Q24
did not. The OLTC increased the voltage by 2.5% to bring both values within their
deadbands.
Case (3) MicroGrid (1) was fully loaded except at the busbar 16 and Q16 exceeded its deadband.
MicroSources connected to busbars 28, 30, and 31 in MicroGrid (2) were generating 20,
20, and 30kW respectively. Voltages in MicroGrid (2) increased but the reactive power

absorption Q24 did not exceed its deadband. The taps were not changed as restoring Q16
to its deadband would have brought Q24 outside its deadband.
Case (4) This case is similar to Case (3) but the output powers of the MicroSources were 40, 40,
and 60kW. Both Q16 and Q24 exceeded their deadbands but in opposite directions. Hence,
taps were not changed.
Case (5) MicroSources at busbars 14, 15, 16, 17, 19, 24, 28, 30, and 31 were initially, at point (),
generating 50, 15,100,150,150,250,100,100 and 150kW. The initial transformer open
circuit voltage was 95%. A 140kVA load was then connected to the Passive Distribution
Feeder which brought its voltage below acceptable limits. The OLTC then increased the
voltage to 97.5% regardless of the voltage levels in the two MicroGrids.
8.7 Conclusions
Conventional on-load tap changers have mechanical switches, and they are widely used although they
impose high maintenance costs. Solid state tap changers have fast response times and require little
maintenance but they have high conduction loss hence have reduced reliability and increased
operating cost. Vacuum switch based tap changers reduce the conduction losses significantly. A new
on load tap changer has been specifically developed by AREVA to address regulation of voltage on
networks that is expected to have a significant number of micro generators.
The conventional operation approach of tap changing transformer at substation cannot be directly
applicable to regulate micro grid voltage since it assumes a voltage drop on all lines from the
transformer. The AVRS algorithm modifies the reference voltage of the AVC relay according to the
maximum and minimum voltages from the potential points on the network. The supervisory control
and probabilistic load flow methods are also directly not applicable to control micro grid voltage.
A novel control scheme has bee proposed to use in conjunction with the newly developed tap changer
for networks with micro generators. A voltage control scheme for MicroGrids was investigated. It is
based on the recent availability of a vacuum OLTC that can be installed in MV/LV transformers and
the flexible operation capabilities of MicroSources with power electronic interfaces. It uses primary
and secondary level control loops. Only one communication link is required between a selected
generator and the OLTC. Other controllers respond only to local measurements. This control scheme
has been tested in a model MicroGrid in which it increased the power generation limit of all
MicroSources. Expansion of this control methodology to more complex systems was also investigated
and its operation tested in a model network compromising two MicroGrids and a Passive Feeder.

8.8 References [9] Shuttleworth, R., Tian, X.; Fan, C., Power, A., ―New Tap Changing Scheme‖, IEE
Proceedings on Electric Power Applications, Vol. 143 (1), pp. 108 – 112, Jan. 1996.
[10] Bauer, P., De Haan, S.W.H., ―Solid state tap changers for utility transformers‖, AFRICON,
1999 IEEE, Vol. 2, pp. 897 – 902, 28 Sept.-1 Oct. 1999.
[11] Meyer, A.S.; Van Coller, J., ―Electronic tap changers for use with ultra-light rural distribution
lines‖, AFRICON, 1999 IEEE, Vol. 2, pp. 909 – 912, 28 Sept.-1 Oct. 1999.
[12] Yousef-Zai, F.Q., O'Kelly, D., ―Solid-state on-load transformer tap changer‖, IEE
Proceedings in Electric Power Applications, Vol. 143 (6), pp. 481 – 491, Nov. 1996.
[13] C. Oates, A. Barlow, and V. Levi. ―Tap Changer for Distributed Power.‖ in CIRED 2007,19th
International Conference on Electricity Distribution. 2007. Vienna, Austria.
[14] European Committee for Electrotechnical Standardization, ―EN50160-Voltage Characteristics
of Electricity supplied by Public Distribution Systems‖, European Committee for
Electrotechnical Standardization (CENELEC), Brussels, November 1994.
[15] Ackermann, T.; Knyazkin, V.; ―Interaction between distributed generation and the
distribution network: operation aspects‖, IEEE/PES Transmission and Distribution
Conference and Exhibition 2002: Asia Pacific. , Vol. 2, pp. 1357-1362, 6-10, Oct., 2002.
[16] Anaya-Lara O., Jenkins N., ―A distribution Management System Controller (DMSC) for
Active Voltage Control in Microgrids‖, Internal Report, More Microgrids, EU Project MORE
MICROGRIDS: Advanced Architectures and Control Concepts for More Microgrids, – SES6-
019864.
[17] Hird, C.M., Leite, H., Jenkins, N. and Li H., ―Network voltage controller for distributed
generation‖, IEE proceedings Generation Transmission Distribution, Vol. 151, No.2, March
2004.
[18] R.H. Lasseter. ―MicroGrids.‖ in 2002 IEEE Power Engineering Society Winter Meeting.
New York, USA.
[19] A. Engler. ―Applicability of droops in low voltage grids.‖ International Journal of Distributed
Energy Resources, 2005. 1(1).
[20] P. Piagi and R.H. Lasseter. ―Autonomous control of microgrids.‖ in 2006 IEEE Power
Engineering Society General Meeting. Montreal, Canada.

[21] A.Arulampalam, M. Barnes, A. Engler, A. Goodwin, and N. Jenkins. ―Control of Power
Electronic Interfaces in Distributed Generation MicroGrids.‖ International Journal of
Electronics, vol. 91, no. 9, 2004. 91(9): p. 503-523.
[22] S. Papathanassiou, N. Hatziargyriou, and K. Strunz, ―A Benchmark Low Voltage Microgrid
Network,‖ in Proceedings of the CIGRE Symposium: Power Systems with Dispersed
Generation. 2005: Athens.
[23] G.F. Moore, Electric Cables Handbook. Third edition: Oxford : Blackwell Science, 1997.
8.9 Appendices
8.9.1 Appendix A
The MicroGrid was approximated into a simple network, shown in Figure 17, with one equivalent
MicroSource and one load connected via a distribution feeder to the LV terminal of an ideal
transformer with OLTC. Ptotal and Qtotal are the output active and reactive power of this MicroSource,
PL and QL are the load active and reactive power, R is the system resistance, X is the system reactance,
Vs is the transformer voltage, and VL is the load voltage.
MicroSourceMV
Network
Ideal
Transformer PL, QL
Ptotal, Qtotal
R+jXVs
VL
Figure 17: A distribution feeder with one Microsource
Approximate value of the load voltage is given by (14)
total L total L
L s
L
P P R Q Q XV V
V
(14)
Since the reactive power output of the equivalent MicroSource controlled by droop, its value, as
calculated from (8), is given by (15)
0total total LQ k V V (15)
Solving equations (14) and (15), the load voltage is given by (16)
2
02 2
s total s totalL g L L total
V k X V k XV P P R Q X k V X
(16)
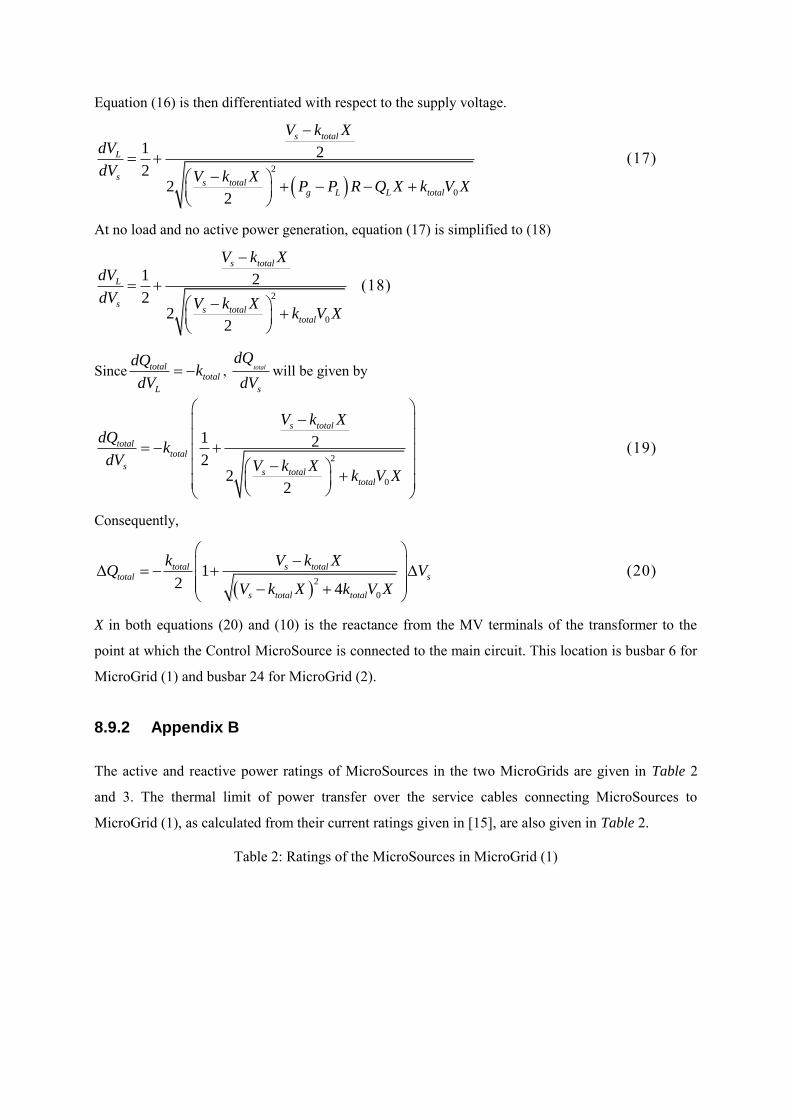
Equation (16) is then differentiated with respect to the supply voltage.
2
0
1 2
22
2
s total
L
ss total
g L L total
V k XdV
dV V k XP P R Q X k V X
(17)
At no load and no active power generation, equation (17) is simplified to (18)
2
0
1 2
22
2
s total
L
ss total
total
V k XdV
dV V k Xk V X
(18)
Since totaltotal
L
dQk
dV , total
s
dQ
dVwill be given by
2
0
1 2
22
2
s total
totaltotal
ss total
total
V k XdQ
kdV V k X
k V X
(19)
Consequently,
2
0
12 4
total s totaltotal s
s total total
k V k XQ V
V k X k V X
(20)
X in both equations (20) and (10) is the reactance from the MV terminals of the transformer to the
point at which the Control MicroSource is connected to the main circuit. This location is busbar 6 for
MicroGrid (1) and busbar 24 for MicroGrid (2).
8.9.2 Appendix B
The active and reactive power ratings of MicroSources in the two MicroGrids are given in Table 2
and 3. The thermal limit of power transfer over the service cables connecting MicroSources to
MicroGrid (1), as calculated from their current ratings given in [15], are also given in Table 2.
Table 2: Ratings of the MicroSources in MicroGrid (1)

Table 3: Ratings of the MicroSources in MicroGrid (2)
Busbar P (kW) Q (kVAr) Thermal limit of service cable (kW)
14 150 ±10 80 15 100 ±3 46 16 250 ±20 104 17 200 ±30 104 19 250 ±30 80
Busbar P (kW) Q kVAr
24 300 ±50 28 150 ±20 30 150 ±20 31 200 ±30