Embed Size (px)
Citation preview

1Advanced Analytics to Drive Key Business Outcomes
Advanced Analytics to Drive Key Business Outcomes
Featuring Dr. Ron GreySenior Vice President
2Advanced Analytics to Drive Key Business Outcomes
| 2
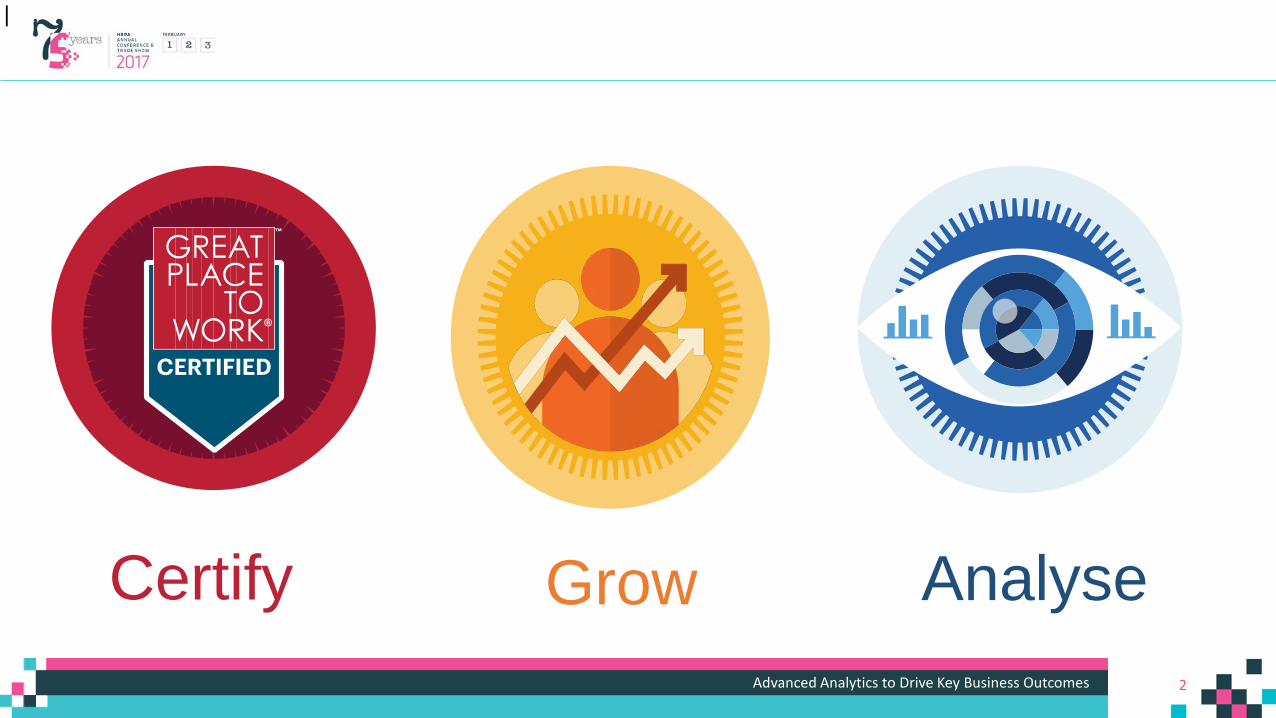
Certify Grow Analyse
3Advanced Analytics to Drive Key Business Outcomes
| 3
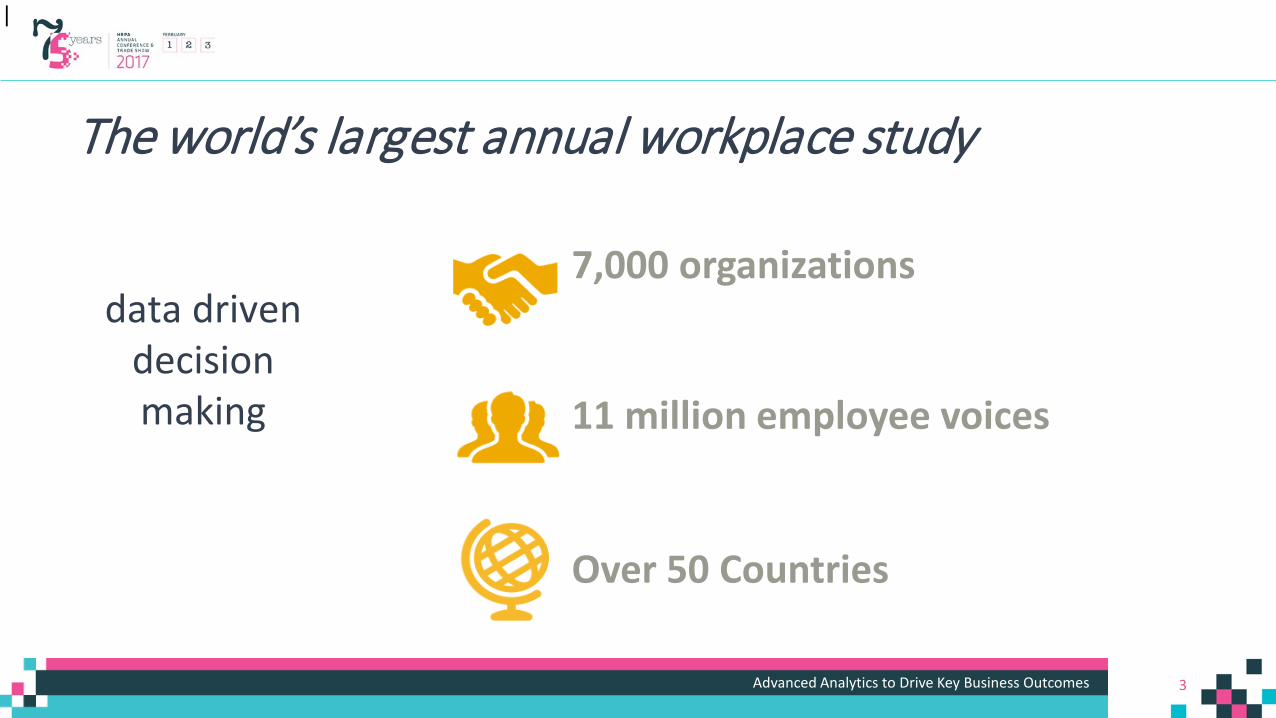
The world’s largest annual workplace study
7,000 organizations
11 million employee voices
Over 50 Countries
data driven decision making

4Advanced Analytics to Drive Key Business Outcomes
Quantitative Assessment
| 4
Unparalleled benchmarking Gold standard survey tool (HBR, LSE, TEDx)
5Advanced Analytics to Drive Key Business Outcomes
| 5
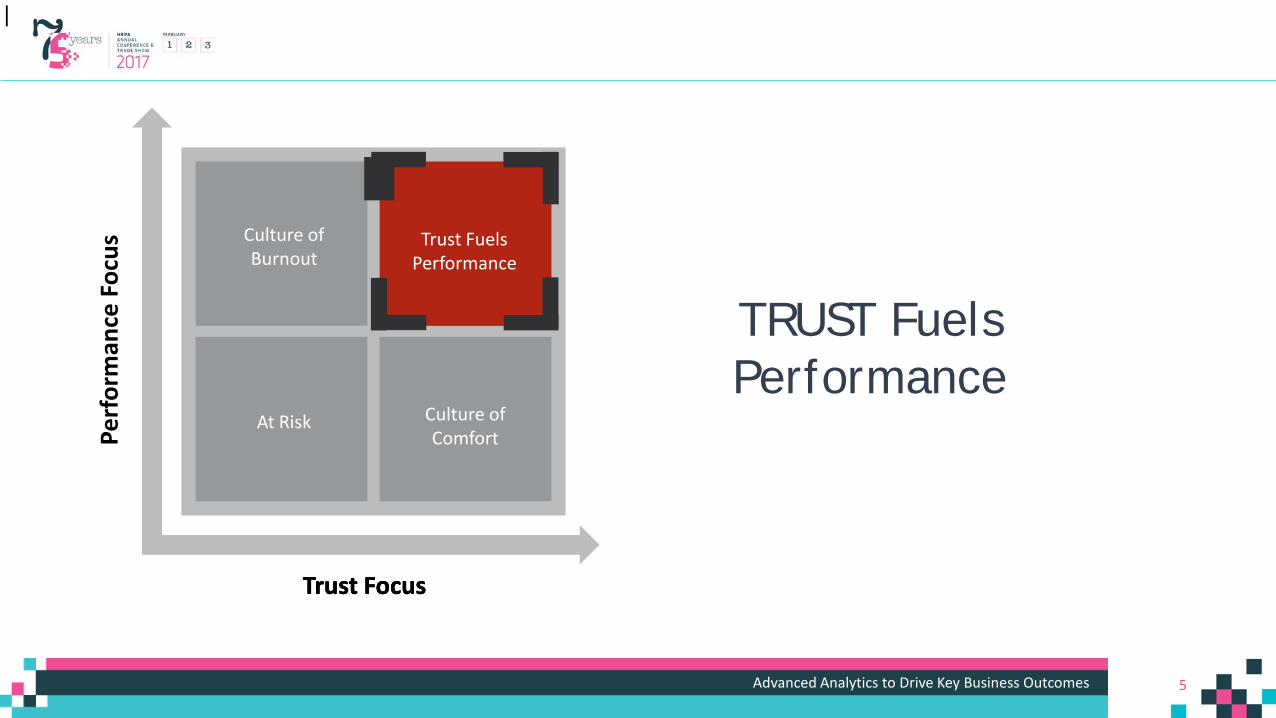
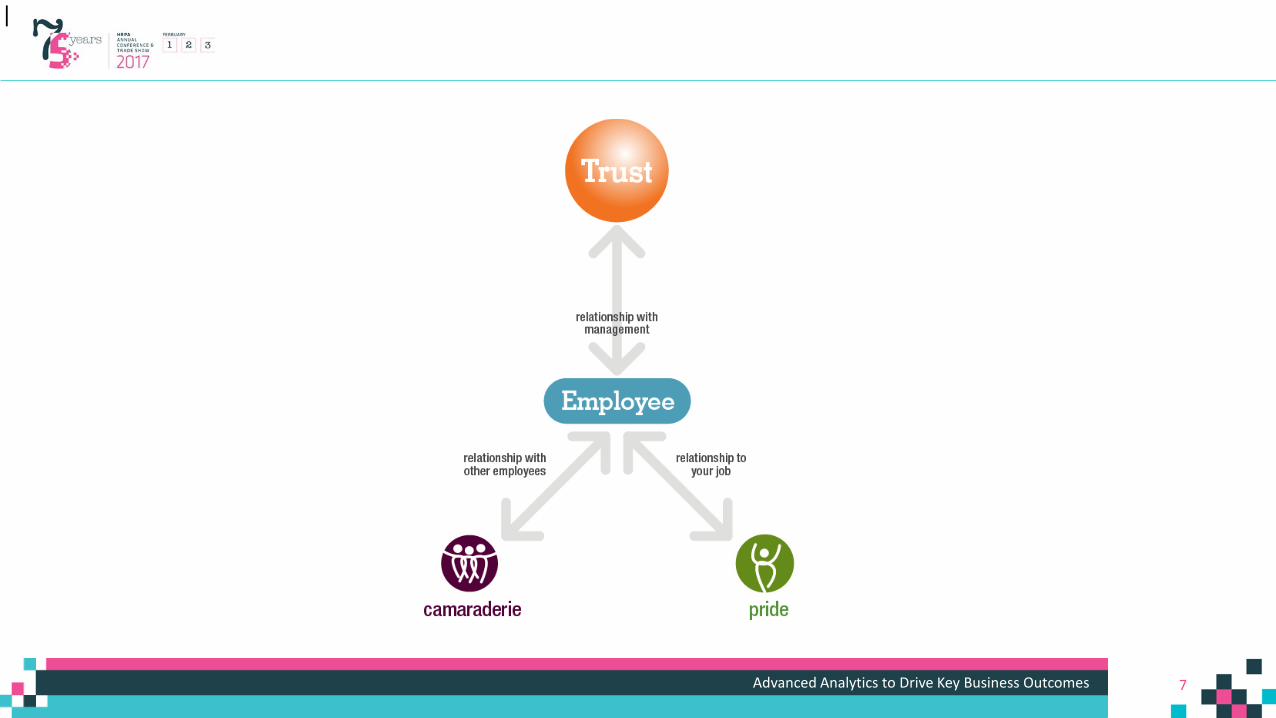
TRUST Fuels Performance
Trust Focus
Perf
orm
ance
Foc
us Trust FuelsPerformance
Culture of Burnout
At Risk Culture of Comfort
Trust FocusTrust Focus
6Advanced Analytics to Drive Key Business Outcomes
| 6
7Advanced Analytics to Drive Key Business Outcomes
| 7
8Advanced Analytics to Drive Key Business Outcomes
| 8
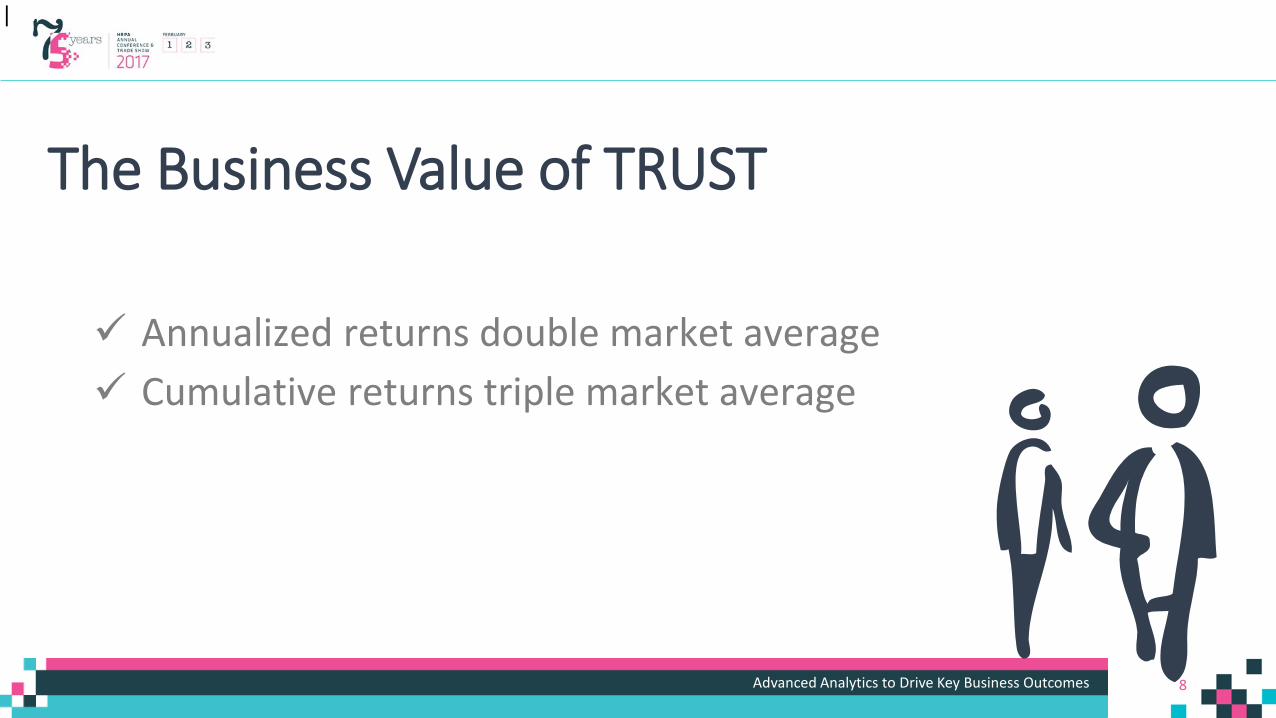
The Business Value of TRUST
Annualized returns double market average Cumulative returns triple market average
9Advanced Analytics to Drive Key Business Outcomes
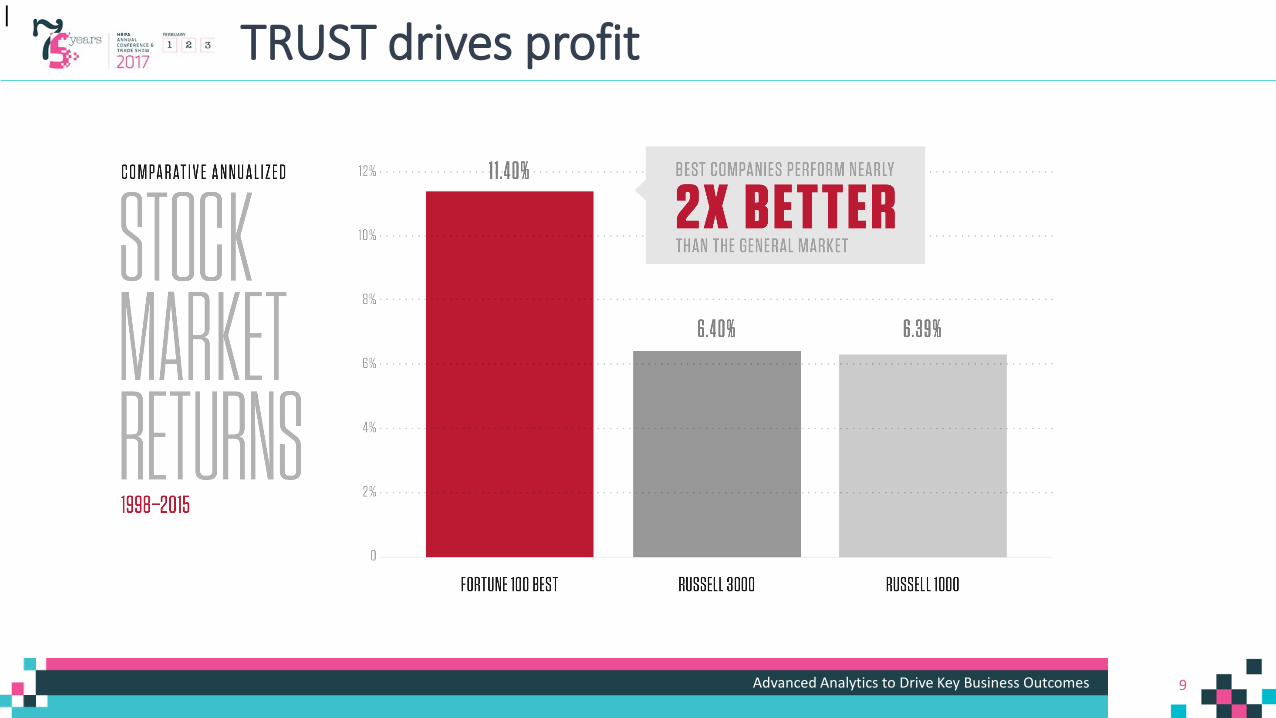
| 9TRUST drives profit
10Advanced Analytics to Drive Key Business Outcomes
| 10
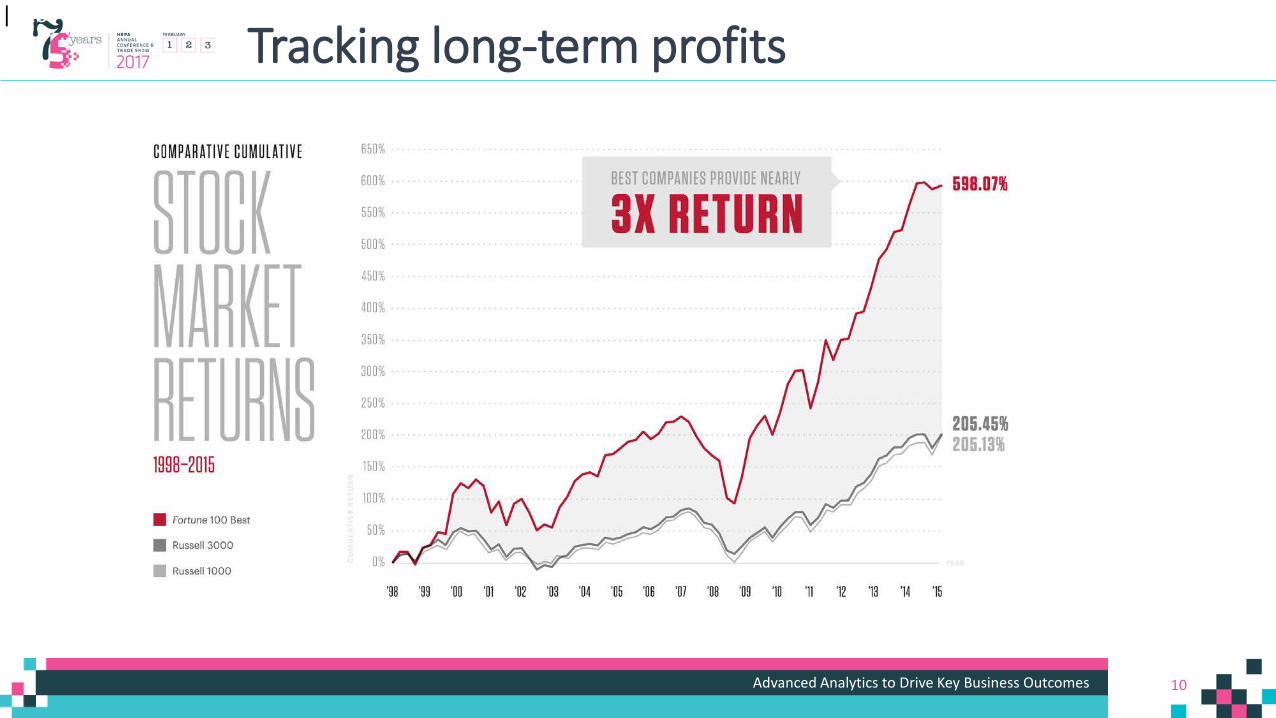
Tracking long-term profits
11Advanced Analytics to Drive Key Business Outcomes
| 11
Do the benefits of trust outweigh the costs? risk recent performance
size dividend yield
industry
growth opportunities… the answer is a resounding yes
12Advanced Analytics to Drive Key Business Outcomes
| 12
13Advanced Analytics to Drive Key Business Outcomes
| 13
Qualitative Assessment
People Practices & Policies» The inputs for your culture
14Advanced Analytics to Drive Key Business Outcomes
| 14
Comparative Scoring
• Qualitative assessment of management practices• 9 KEY PRACTICE AREAS
15Advanced Analytics to Drive Key Business Outcomes
| 15
Dr. Ron Grey
Sr. Vice President,Great Place to Work
16Advanced Analytics to Drive Key Business Outcomes
| 16
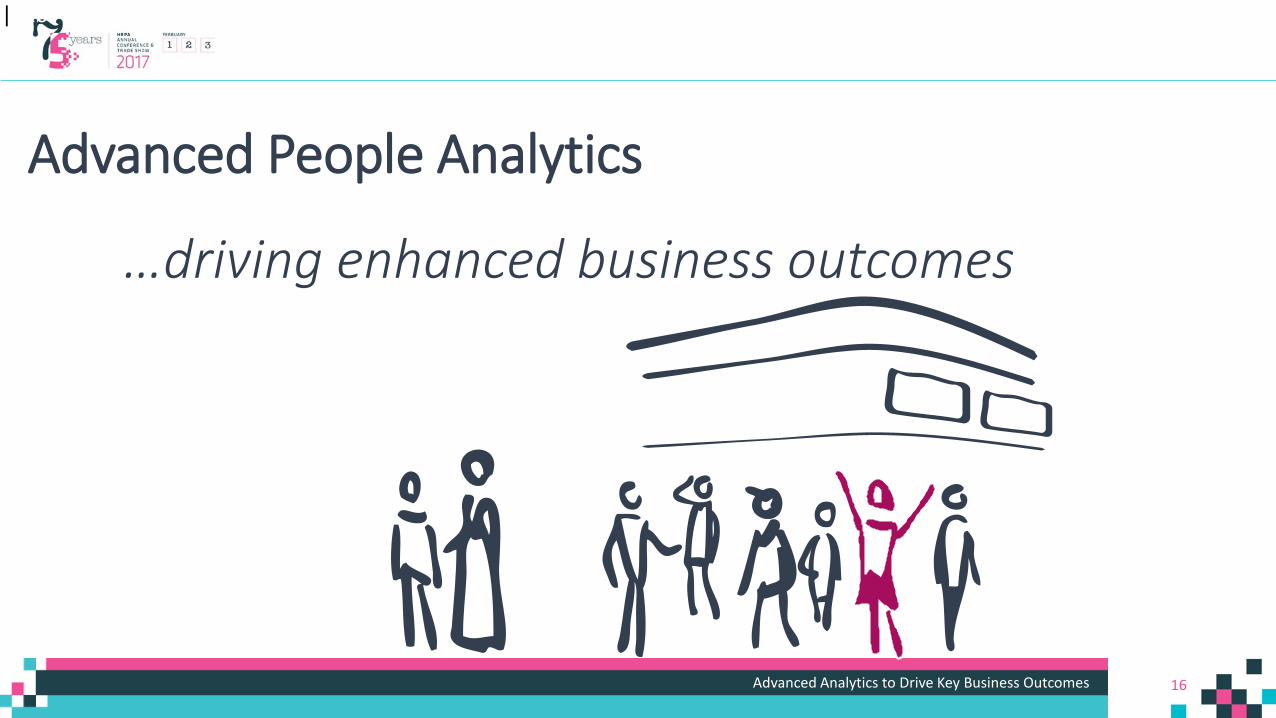
Advanced People Analytics
…driving enhanced business outcomes
17Advanced Analytics to Drive Key Business Outcomes
17
19Advanced Analytics to Drive Key Business Outcomes
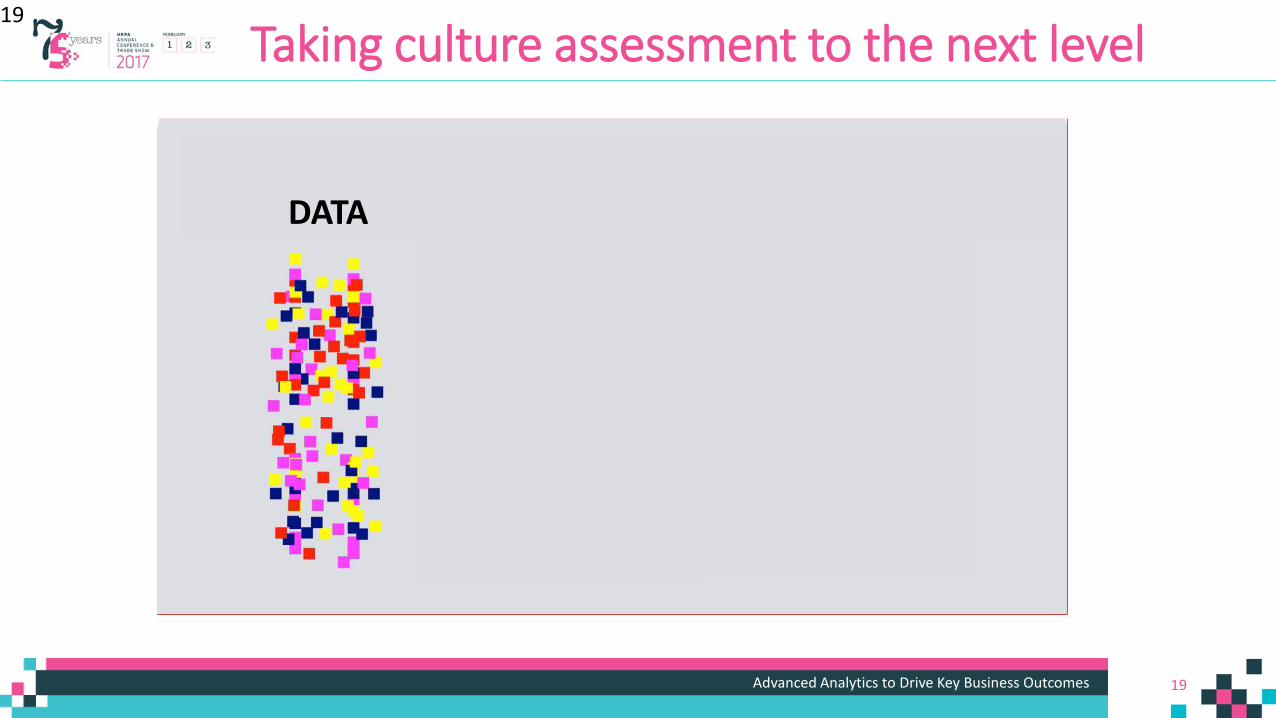
Taking culture assessment to the next level19
DATA DESCRIPTIVE PREDICTIVE
20Advanced Analytics to Drive Key Business Outcomes
Advanced people analytics 20
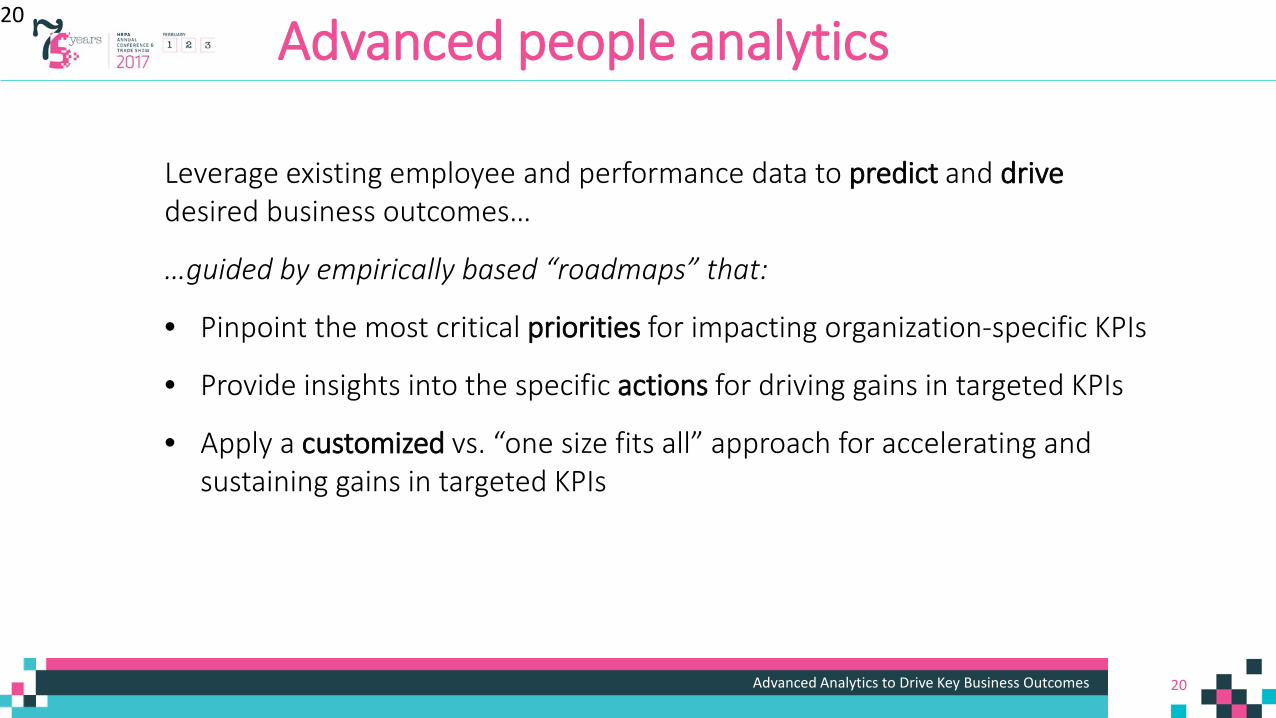
Leverage existing employee and performance data to predict and drivedesired business outcomes…
…guided by empirically based “roadmaps” that:
• Pinpoint the most critical priorities for impacting organization-specific KPIs
• Provide insights into the specific actions for driving gains in targeted KPIs
• Apply a customized vs. “one size fits all” approach for accelerating and sustaining gains in targeted KPIs
21Advanced Analytics to Drive Key Business Outcomes
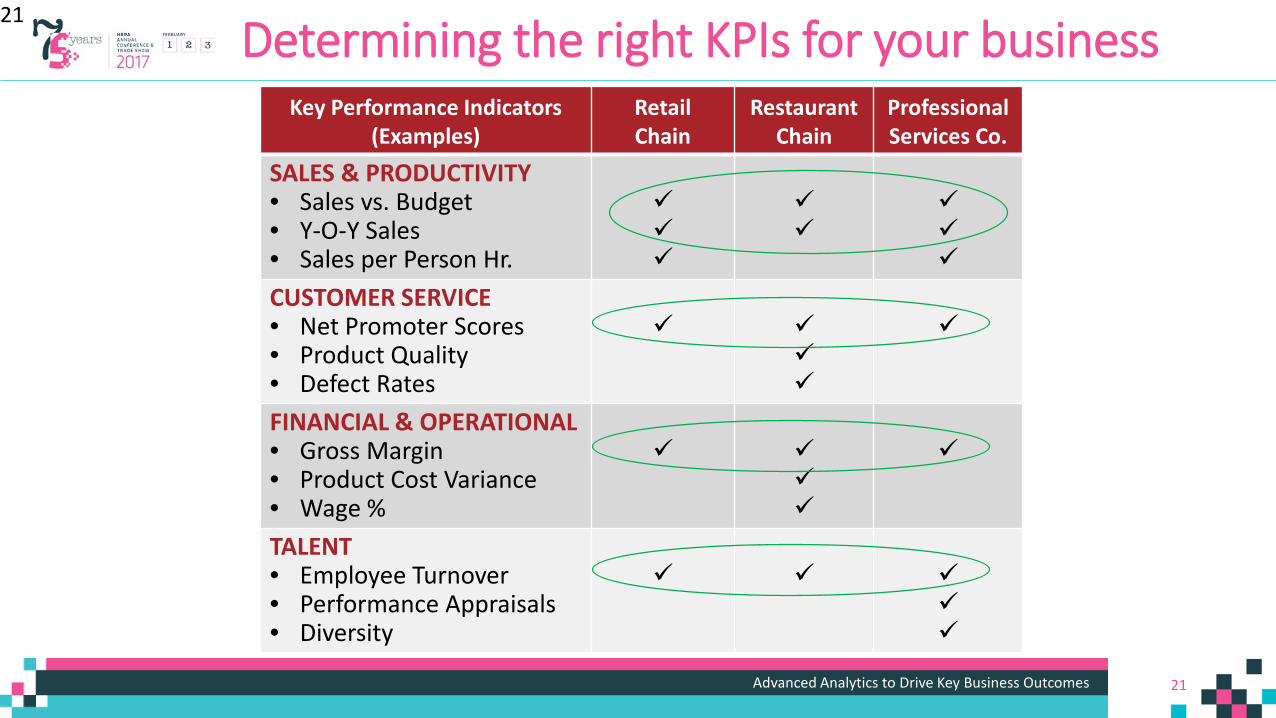
Determining the right KPIs for your business Key Performance Indicators
(Examples)RetailChain
RestaurantChain
ProfessionalServices Co.
SALES & PRODUCTIVITY• Sales vs. Budget• Y-O-Y Sales• Sales per Person Hr.
CUSTOMER SERVICE• Net Promoter Scores• Product Quality• Defect Rates
FINANCIAL & OPERATIONAL• Gross Margin• Product Cost Variance• Wage %
TALENT• Employee Turnover• Performance Appraisals• Diversity
21
22Advanced Analytics to Drive Key Business Outcomes
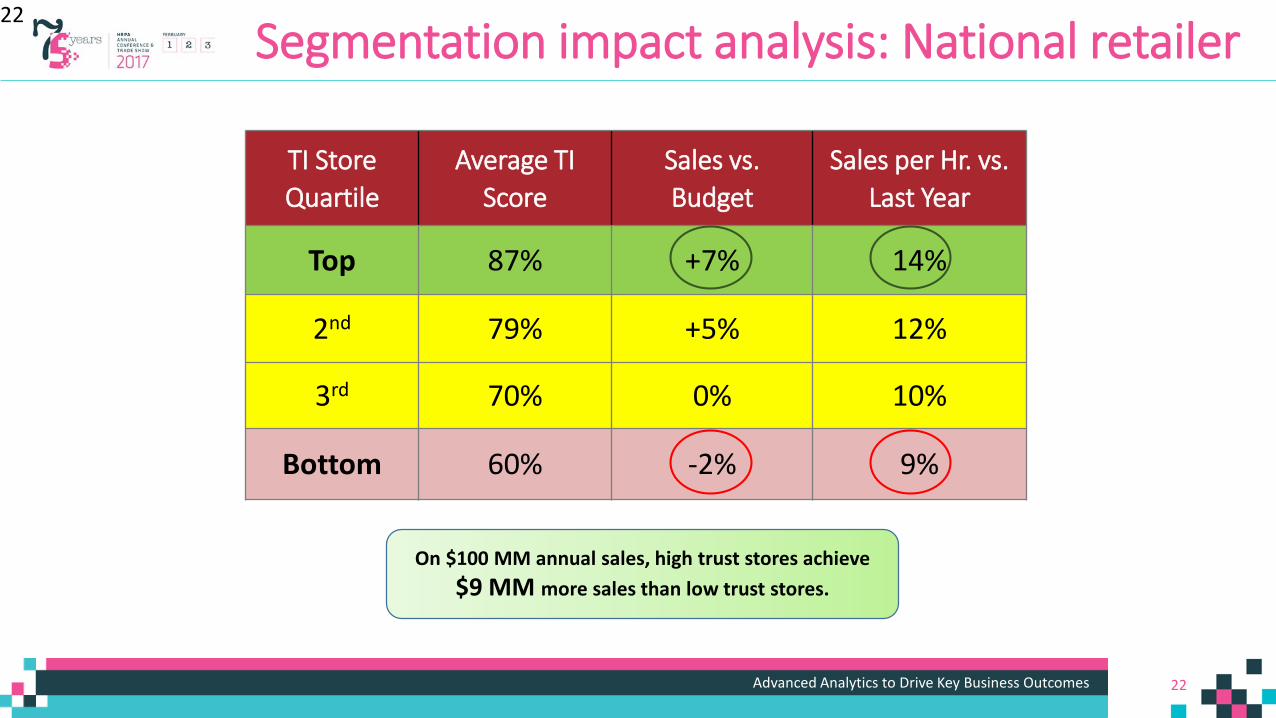
Segmentation impact analysis: National retailer22
TI Store Quartile
Average TIScore
Sales vs. Budget
Sales per Hr. vs. Last Year
Top 87% +7% 14%
2nd 79% +5% 12%
3rd 70% 0% 10%
Bottom 60% -2% 9%
On $100 MM annual sales, high trust stores achieve $9 MM more sales than low trust stores.
23Advanced Analytics to Drive Key Business Outcomes
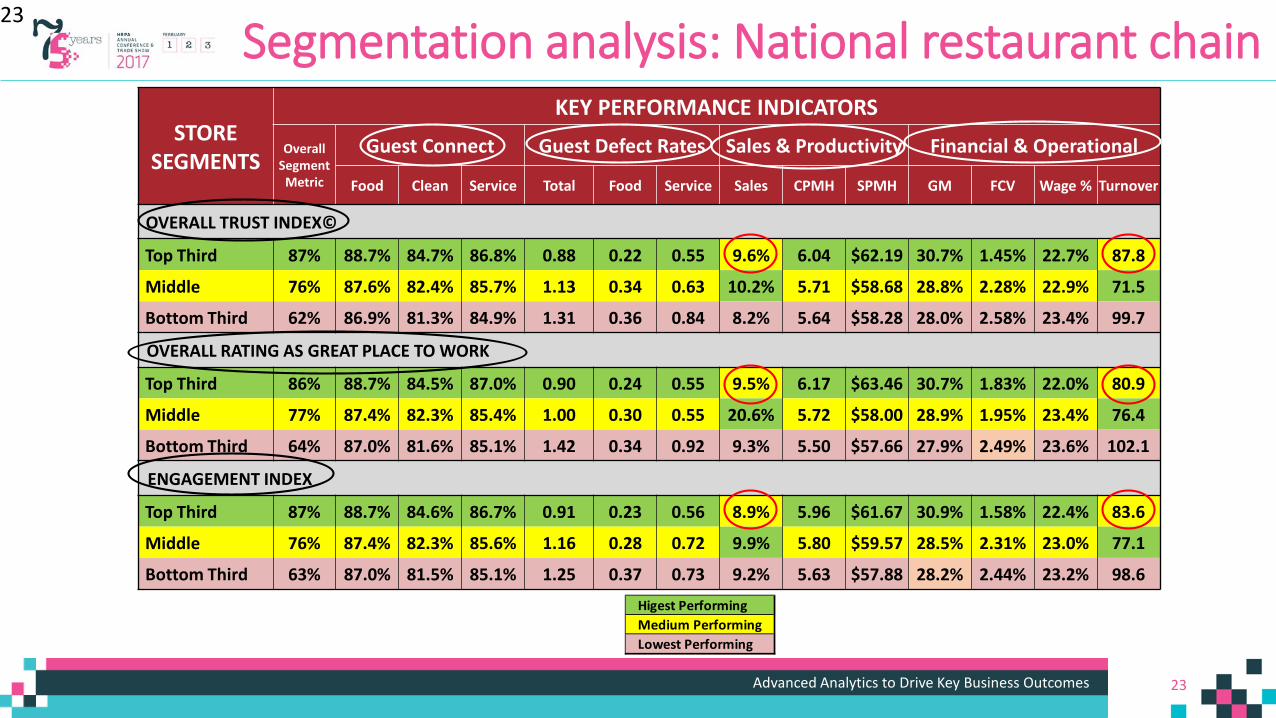
Segmentation analysis: National restaurant chain23
Medium PerformingLowest Performing
Higest Performing
STORE SEGMENTS
KEY PERFORMANCE INDICATORS
Overall Segment
Metric
Guest Connect Guest Defect Rates Sales & Productivity Financial & Operational
Food Clean Service Total Food Service Sales CPMH SPMH GM FCV Wage % Turnover
OVERALL TRUST INDEX©
Top Third 87% 88.7% 84.7% 86.8% 0.88 0.22 0.55 9.6% 6.04 $62.19 30.7% 1.45% 22.7% 87.8
Middle 76% 87.6% 82.4% 85.7% 1.13 0.34 0.63 10.2% 5.71 $58.68 28.8% 2.28% 22.9% 71.5
Bottom Third 62% 86.9% 81.3% 84.9% 1.31 0.36 0.84 8.2% 5.64 $58.28 28.0% 2.58% 23.4% 99.7
OVERALL RATING AS GREAT PLACE TO WORK
Top Third 86% 88.7% 84.5% 87.0% 0.90 0.24 0.55 9.5% 6.17 $63.46 30.7% 1.83% 22.0% 80.9
Middle 77% 87.4% 82.3% 85.4% 1.00 0.30 0.55 20.6% 5.72 $58.00 28.9% 1.95% 23.4% 76.4
Bottom Third 64% 87.0% 81.6% 85.1% 1.42 0.34 0.92 9.3% 5.50 $57.66 27.9% 2.49% 23.6% 102.1
ENGAGEMENT INDEX
Top Third 87% 88.7% 84.6% 86.7% 0.91 0.23 0.56 8.9% 5.96 $61.67 30.9% 1.58% 22.4% 83.6
Middle 76% 87.4% 82.3% 85.6% 1.16 0.28 0.72 9.9% 5.80 $59.57 28.5% 2.31% 23.0% 77.1
Bottom Third 63% 87.0% 81.5% 85.1% 1.25 0.37 0.73 9.2% 5.63 $57.88 28.2% 2.44% 23.2% 98.6
24Advanced Analytics to Drive Key Business Outcomes
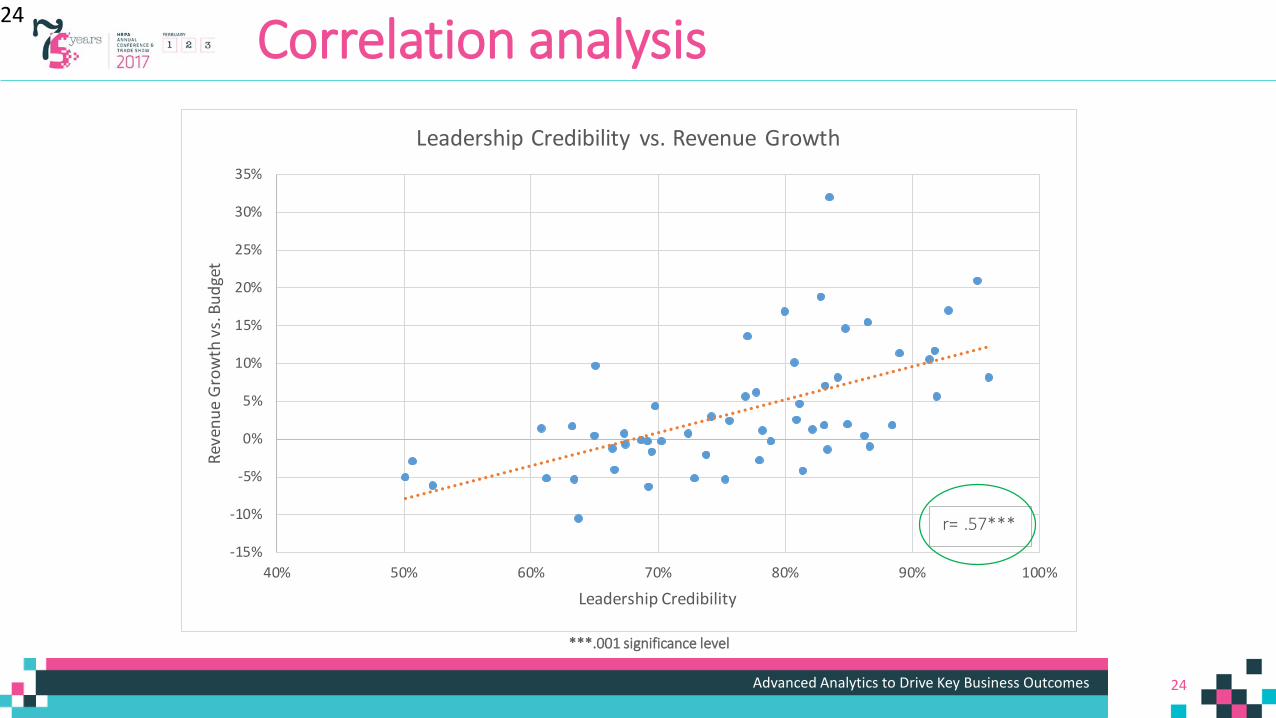
Correlation analysis 24
-15%
-10%
-5%
0%
5%
10%
15%
20%
25%
30%
35%
40% 50% 60% 70% 80% 90% 100%
Reve
nue
Gro
wth
vs.
Bud
get
Leadership Credibility
Leadership Credibility vs. Revenue Growth
r= .57***
***.001 significance level

25Advanced Analytics to Drive Key Business Outcomes
Multiple Regression analysis25
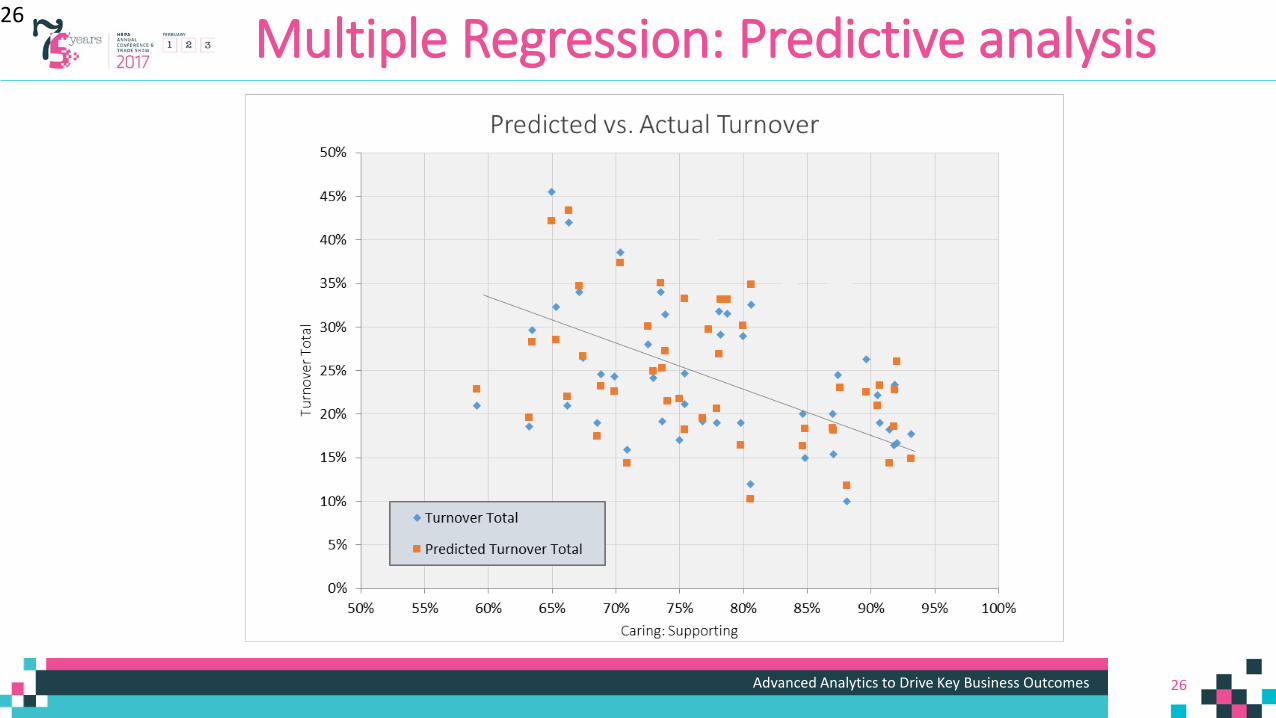
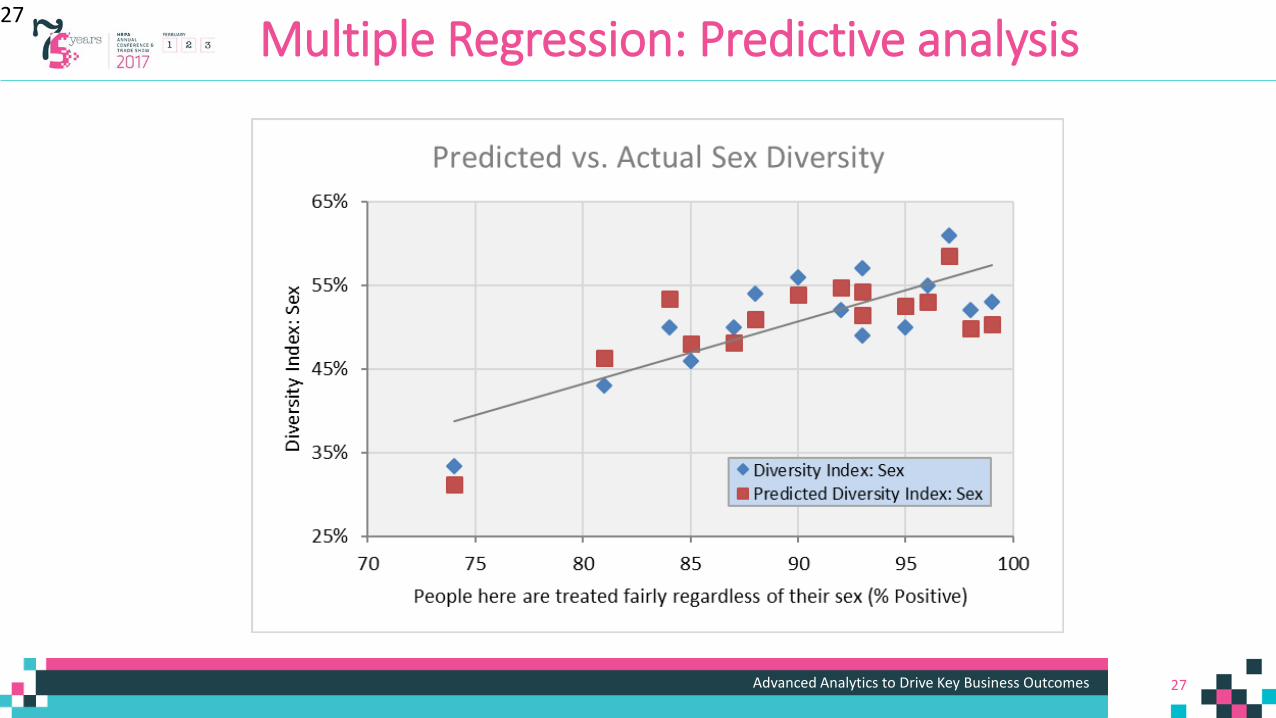
1. Relative weight of each Trust practice in influencing KPI2. Combined multiple correlation of Trust practices with KPI3. % of KPI predicted by the Multiple Regression equation
Key Performance Indicators
Most Significant Trust Practices Beta1 R2 Variance3 Significance
REVENUE GROWTH
Inspiring .51
.70 49% 0.0001Listening .45
Hiring .39
NET PROMOTER SCORES
Listening .49
.66 44% 0.0001Hiring .46
Training & Developing .38
GROSS MARGIN
Speaking .47
.60 36% 0.001Listening .45
Resource Management .35
26Advanced Analytics to Drive Key Business Outcomes
Multiple Regression: Predictive analysis26
27Advanced Analytics to Drive Key Business Outcomes
Multiple Regression: Predictive analysis27
28Advanced Analytics to Drive Key Business Outcomes
28
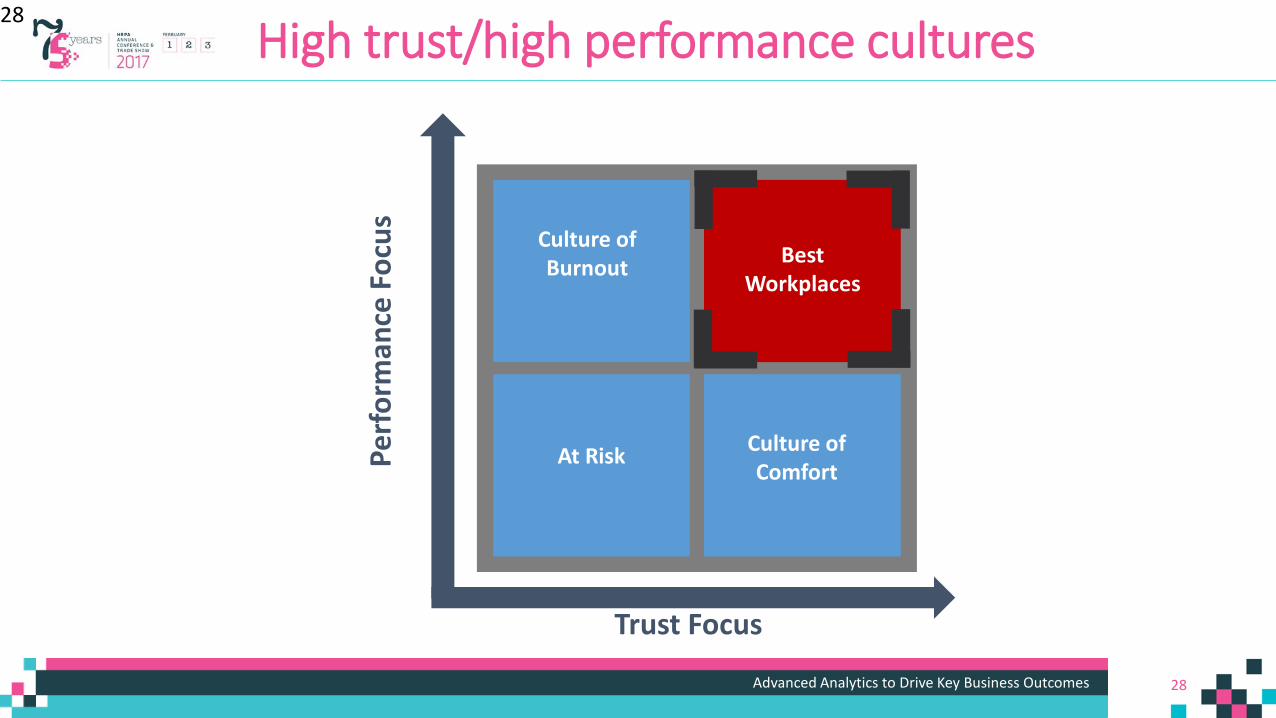
Trust Focus
Perf
orm
ance
Foc
us
Best Workplaces
Culture of Burnout
At Risk Culture of Comfort
High trust/high performance cultures
29Advanced Analytics to Drive Key Business Outcomes
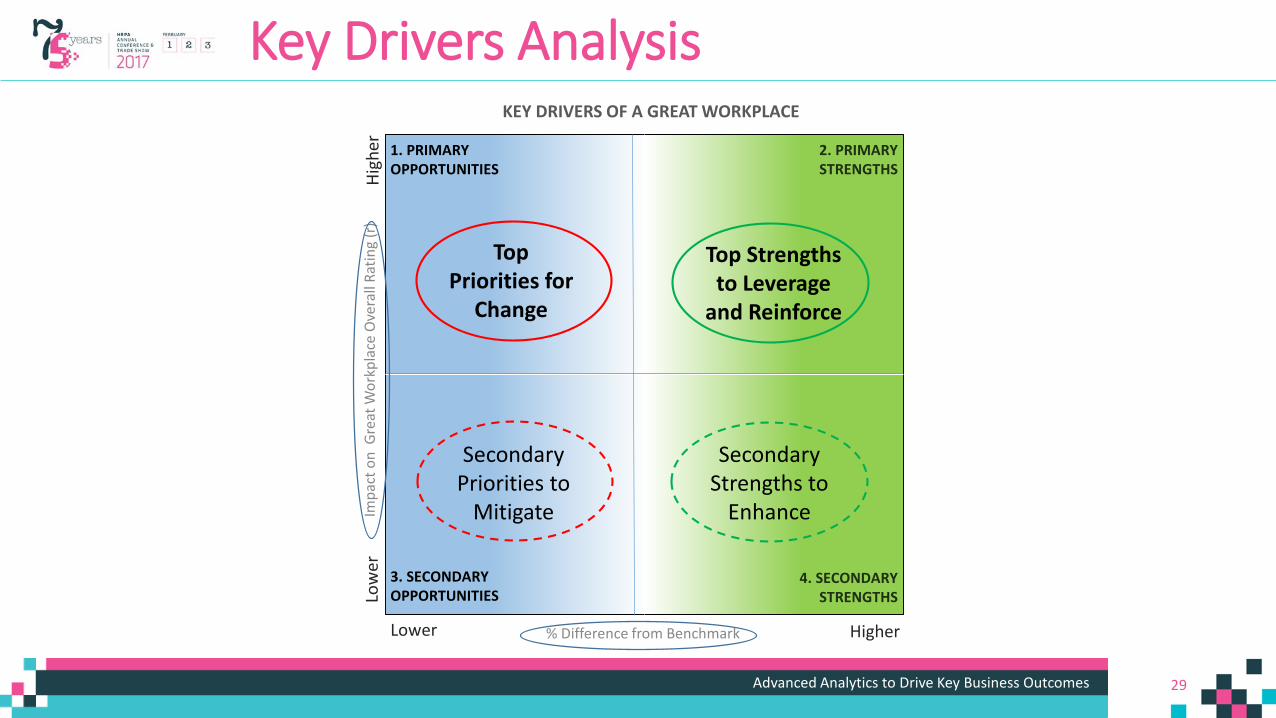
Key Drivers Analysis
Impa
ct o
n G
reat
Wor
kpla
ce O
vera
ll Ra
ting
(r)
% Difference from Benchmark
KEY DRIVERS OF A GREAT WORKPLACE
1. PRIMARY OPPORTUNITIES
2. PRIMARYSTRENGTHS
3. SECONDARYOPPORTUNITIES
4. SECONDARY STRENGTHS
HigherLower
Low
erHi
gher
Top Priorities for
Change
Top Strengths to Leverage
and Reinforce
Secondary Priorities to
Mitigate
Secondary Strengths to
Enhance
30Advanced Analytics to Drive Key Business Outcomes
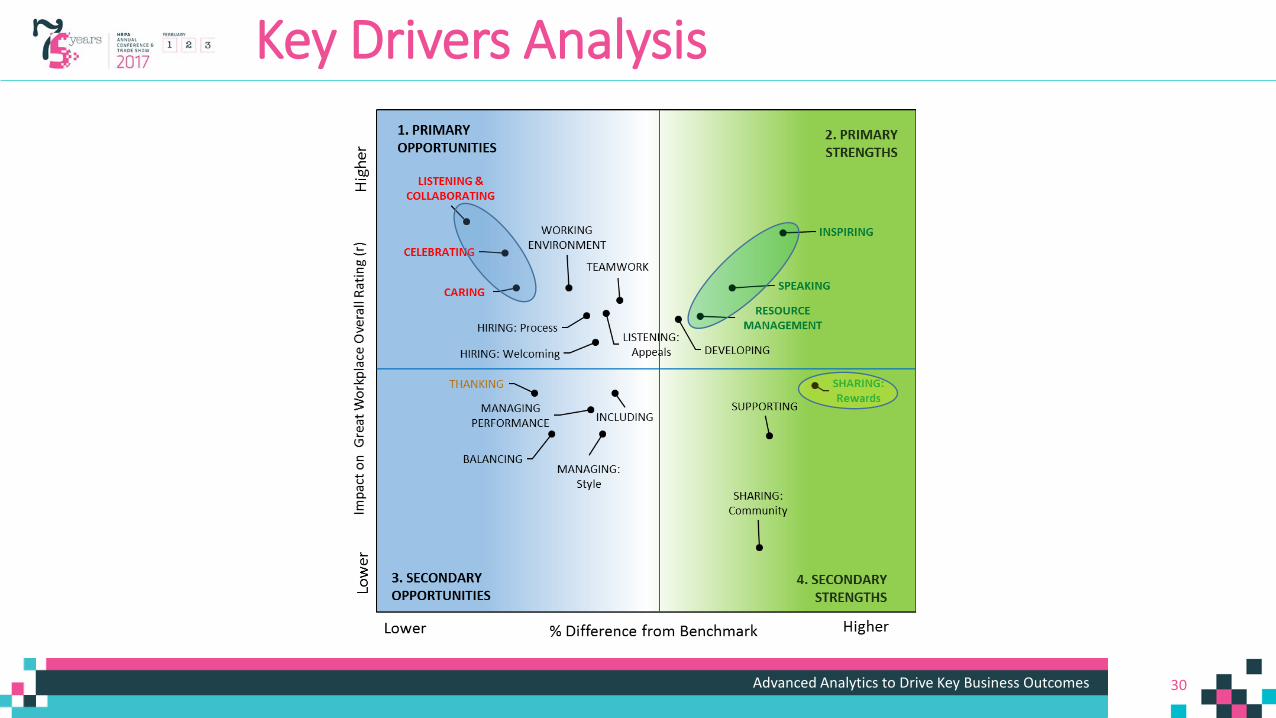
Key Drivers Analysis
32Advanced Analytics to Drive Key Business Outcomes
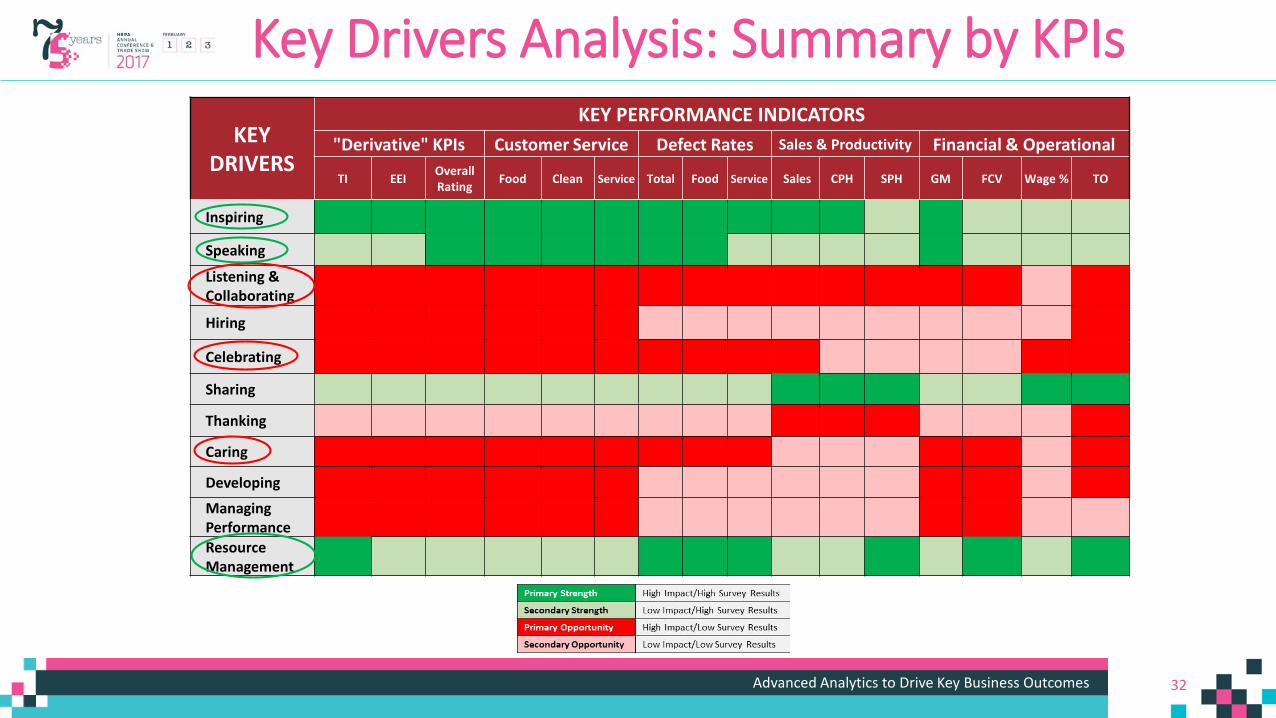
Key Drivers Analysis: Summary by KPIs KEY
DRIVERS
KEY PERFORMANCE INDICATORS "Derivative" KPIs Customer Service Defect Rates Sales & Productivity Financial & Operational
TI EEI Overall Rating Food Clean Service Total Food Service Sales CPH SPH GM FCV Wage % TO
Inspiring
Speaking
Listening & Collaborating
Hiring
Celebrating
Sharing
Thanking
Caring
Developing
Managing PerformanceResource Management
33Advanced Analytics to Drive Key Business Outcomes
Advanced people analytics:
• Pinpoint the most highly leveraged people management practices for accelerating and sustaining enhanced KPI results
• Identify the specific combinations of management practices that interact for greatest business impact
• Provide “customized” vs. “one size fits all” roadmaps for driving different KPIs
• Provide insights and empirical evidence for guiding and inspiring targeted culture change
33Key “take away” points
34Advanced Analytics to Drive Key Business Outcomes
| 34
The journey from good to great
Register» STEP 1: Become CERTIFIED» STEP 2: Become LISTED
35Advanced Analytics to Drive Key Business Outcomes
| 35
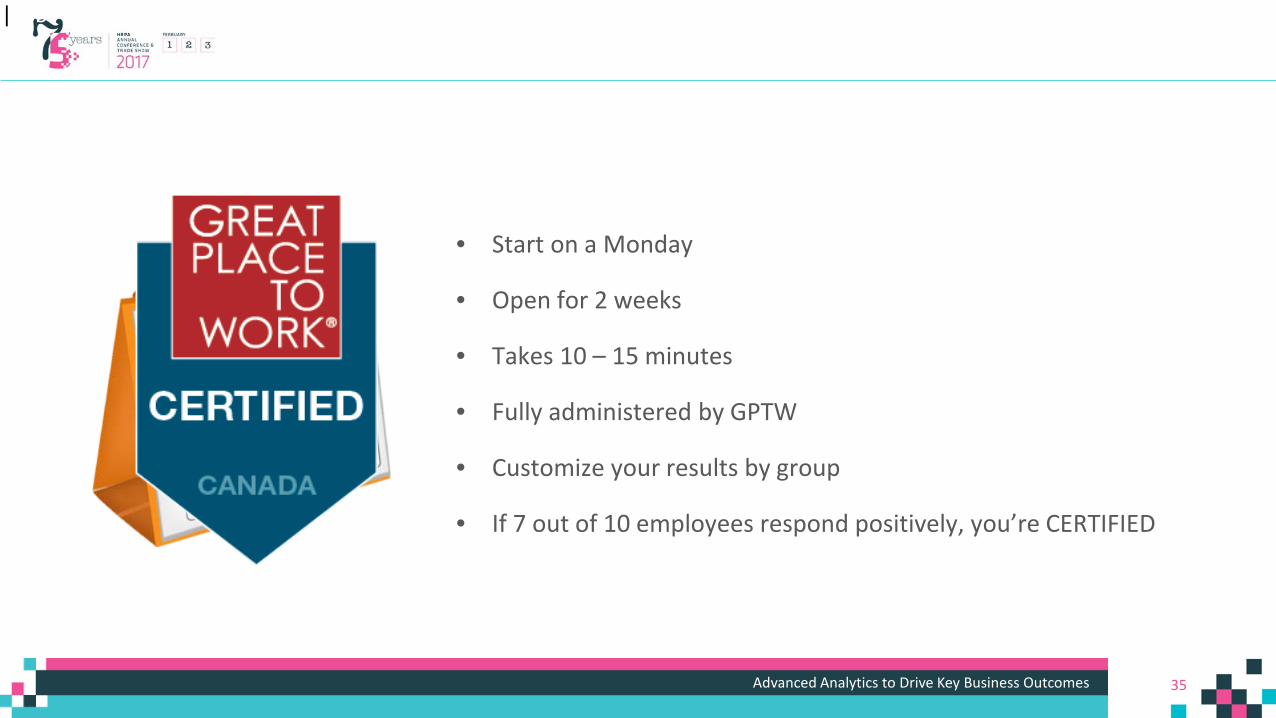
• Start on a Monday
• Open for 2 weeks
• Takes 10 – 15 minutes
• Fully administered by GPTW
• Customize your results by group
• If 7 out of 10 employees respond positively, you’re CERTIFIED

36Advanced Analytics to Drive Key Business Outcomes
37Advanced Analytics to Drive Key Business Outcomes
37

38Advanced Analytics to Drive Key Business Outcomes
Jen WetherowSr. National [email protected]
THANK YOU!
Ron GreySr. Vice [email protected]