Embed Size (px)
Citation preview
Advanced analysis of the HLY 2005 values
Carol Jagger, University of Leicester, UK
and the EHLEIS team
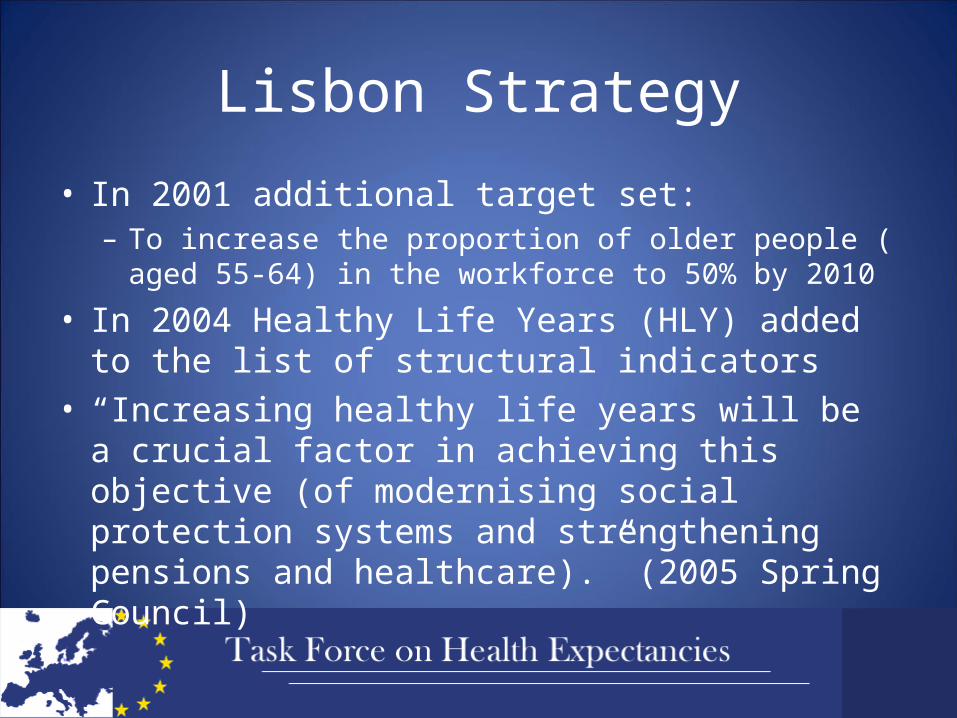
Lisbon Strategy
• In 2001 additional target set:– To increase the proportion of older people ( aged 55-64) in
the workforce to 50% by 2010
• In 2004 Healthy Life Years (HLY) added to the list of structural indicators
• “Increasing healthy life years will be a crucial factor in achieving this objective (of modernising social protection systems and strengthening pensions and healthcare).” (2005 Spring Council)

Healthy productive life in the EU
• Focus on Healthy Life Years at age 50 – Are countries with highest life expectancies the healthiest?– What is the variation in Healthy Life Years at age 50? – What factors explain differences among countries (wealth,
health expenditure, employment, education)?– What is the potential for increasing the size of the older
workforce?
Are countries with highest life expectancies the healthiest?
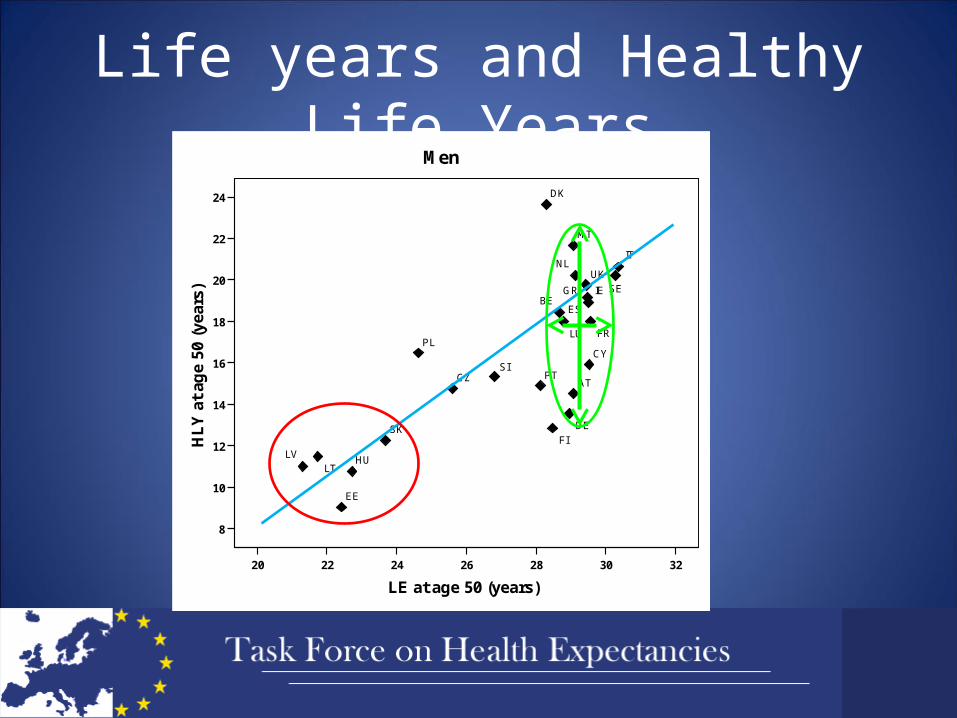
Life years and Healthy Life Years
32302826242220
LE at age 50 (years)
24
22
20
18
16
14
12
10
8
HL
Y a
t ag
e 50
(ye
ars)
UKSE
ES
SI
SK
PT
PL
NL
MT
LU
LTLV
IT
IE
HU
GR
DE
FR
FI
EE
DK
CZ
CY
BE
AT
Men
What is the variation in Healthy Life Years at age 50?
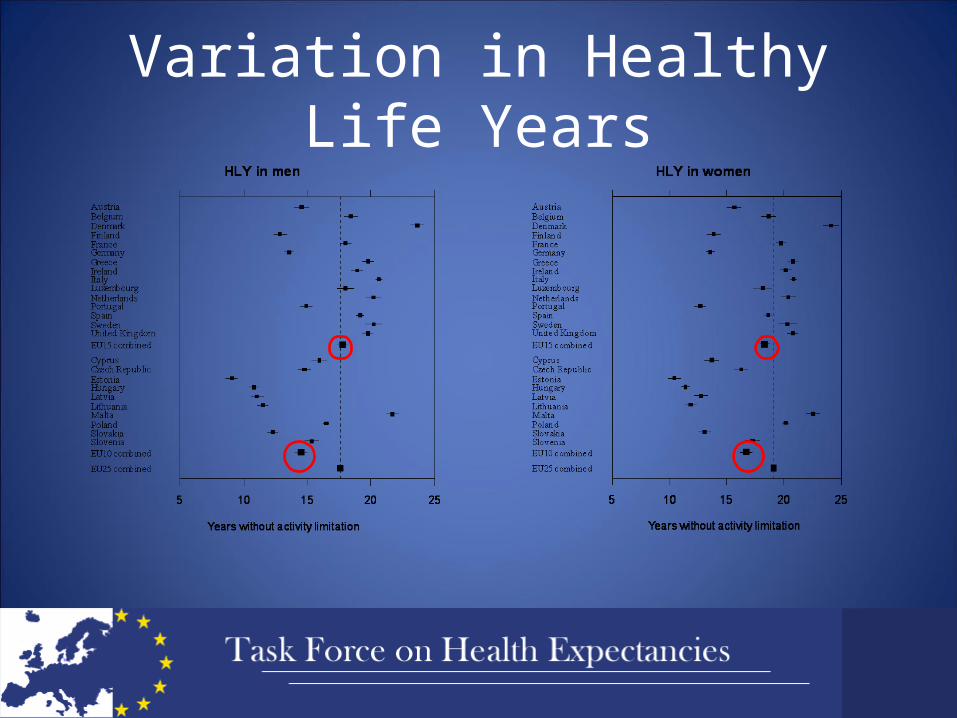
Variation in Healthy Life Years
What factors explain differences among countries?
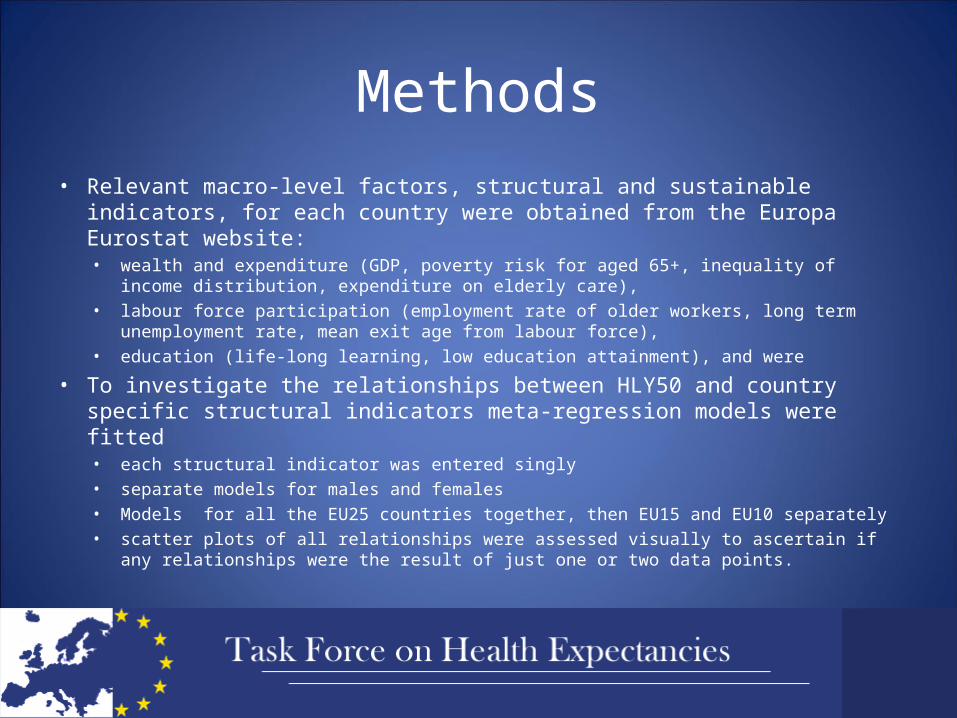
Methods• Relevant macro-level factors, structural and sustainable indicators, for each
country were obtained from the Europa Eurostat website:• wealth and expenditure (GDP, poverty risk for aged 65+, inequality of income distribution,
expenditure on elderly care), • labour force participation (employment rate of older workers, long term unemployment
rate, mean exit age from labour force), • education (life-long learning, low education attainment), and were
• To investigate the relationships between HLY50 and country specific structural indicators meta-regression models were fitted• each structural indicator was entered singly• separate models for males and females• Models for all the EU25 countries together, then EU15 and EU10 separately• scatter plots of all relationships were assessed visually to ascertain if any relationships were
the result of just one or two data points.
–
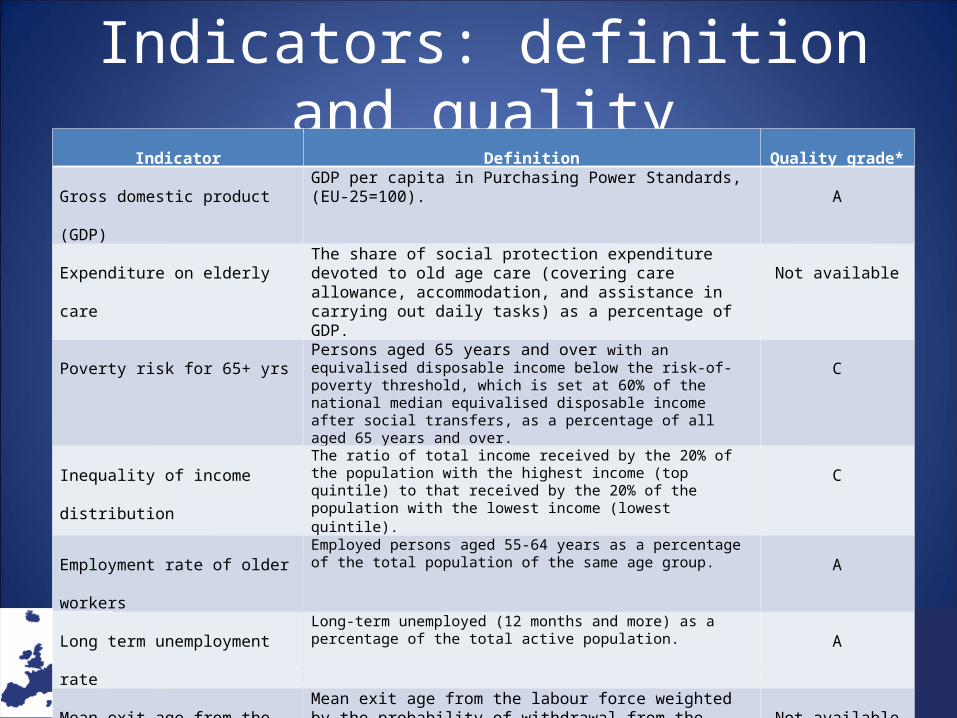
Indicators: definition and qualityIndicator Definition Quality grade*
Gross domestic product (GDP)GDP per capita in Purchasing Power Standards, (EU-25=100).
A
Expenditure on elderly careThe share of social protection expenditure devoted to old age care (covering care allowance, accommodation, and assistance in carrying out daily tasks) as a percentage of GDP.
Not available
Poverty risk for 65+ yrsPersons aged 65 years and over with an equivalised disposable income below the risk-of-poverty threshold, which is set at 60% of the national median equivalised disposable income after social transfers, as a percentage of all aged 65 years and over.
C
Inequality of income distributionThe ratio of total income received by the 20% of the population with the highest income (top quintile) to that received by the 20% of the population with the lowest income (lowest quintile).
C
Employment rate of older workersEmployed persons aged 55-64 years as a percentage of the total population of the same age group. A
Long term unemployment rateLong-term unemployed (12 months and more) as a percentage of the total active population. A
Mean exit age from the labour forceMean exit age from the labour force weighted by the probability of withdrawal from the labour market. Not available
Life-long learningPercentage of the adult population aged 25-64 years participating in education and training over the four weeks prior to the survey. Not available
Low education attainmentPercentage of the population aged 25-64 years having completed at most lower secondary education (International Standard Classification of Education level of 2 or less).
Not available
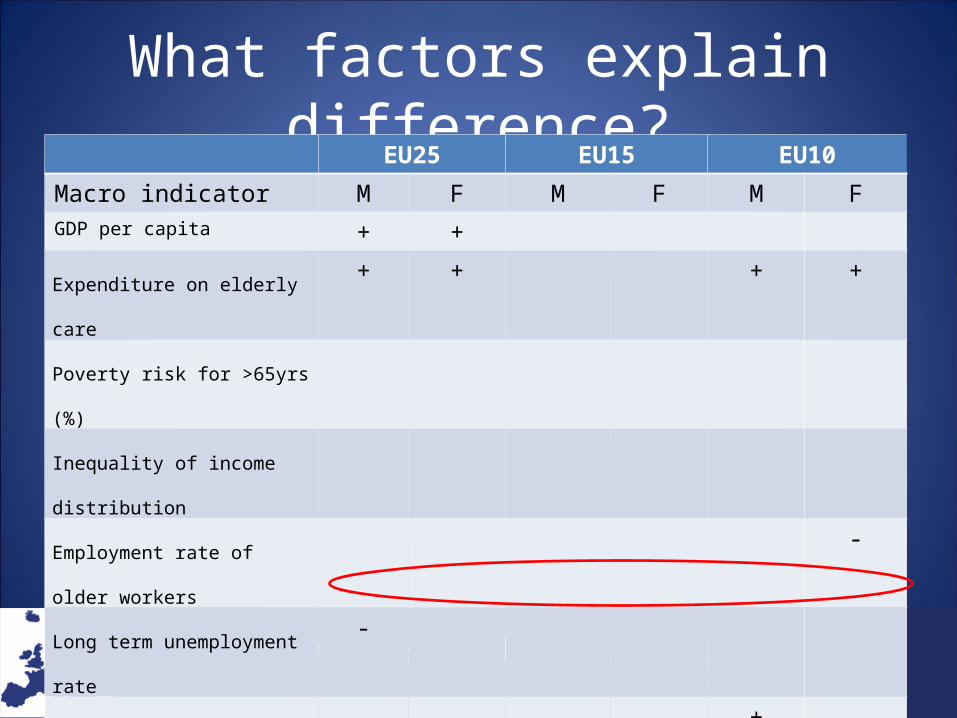
What factors explain difference?EU25 EU15 EU10
Macro indicator M F M F M FGDP per capita + +
Expenditure on elderly care+ + + +
Poverty risk for >65yrs (%)
Inequality of income distribution
Employment rate of older
workers
-
Long term unemployment rate-
Mean exit age from labour force+
Life-long learning (%)+
Low education attainment (%)+ + +
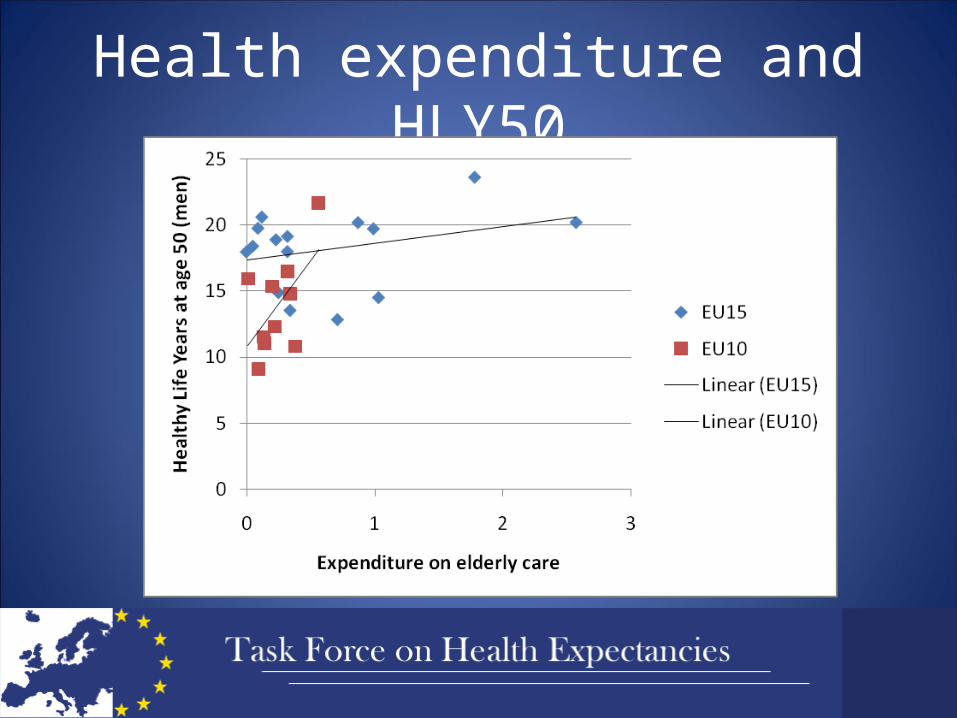
Health expenditure and HLY50
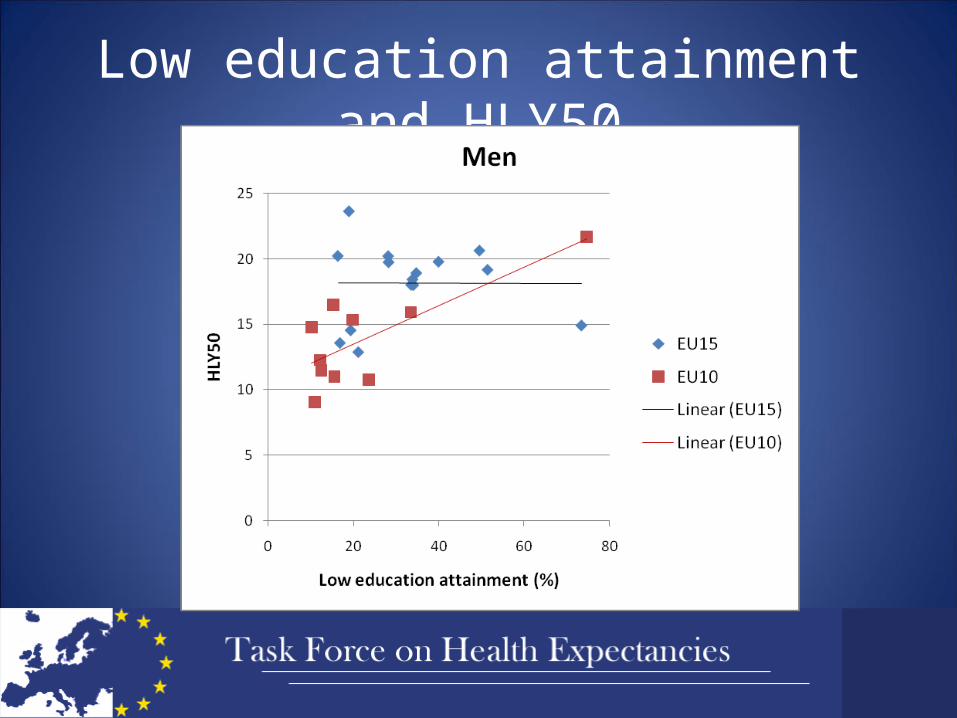
Low education attainment and HLY50
What is the potential to increase the size of the older workforce?
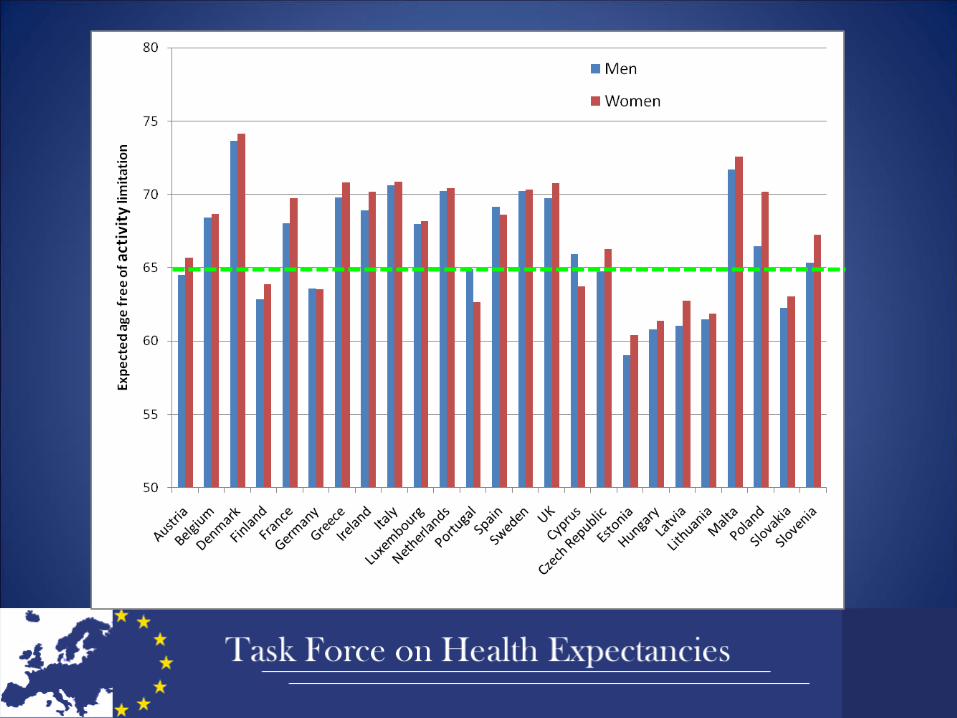
Key messages
• Women live on average 6 years longer than men but most of the extra years are with moderate or severe activity limitations.
• At age 50 the expected HLY are 17.6 for men and 19.1 for women on average in the EU25
• Gaps between Member States reach 14.5 years for men and 13.7 years for women, underlying that the labour force participation of older workers cannot be expected to be uniform throughout all MS.
Full paper
Inequalities in healthy life years in the 25 countries of the European Union in 2005: a cross-national meta-regression analysisCarol Jagger, Clare Gillies, Francesco Moscone, Emmanuelle Cambois, Herman Van Oyen, Wilma Nusselder, Jean-Marie Robine, and the EHLEIS team
Lancet, published online November 17, 2008 DOI:10.1016/S0140-6736(08)61594-9
Advanced analysis of the HLY 2005 values
Carol Jagger, University of Leicester, UK
and the EHLEIS team