Embed Size (px)
Citation preview
Advanced Access: Decentralizing the Urgent Care
Presented by:
Jeremy Chrisman, DO, Medical Director
Thomas Sanchez, Chief Operating Officer
Agenda/Overview • Where is The Vancouver Clinic? • Who are we? • Why change? • Why did we do it? • How did we do it? • How did it turn out? • Where are we today? • What did we learn? • Benefits beyond dollars and data? • What’s next? • Questions?
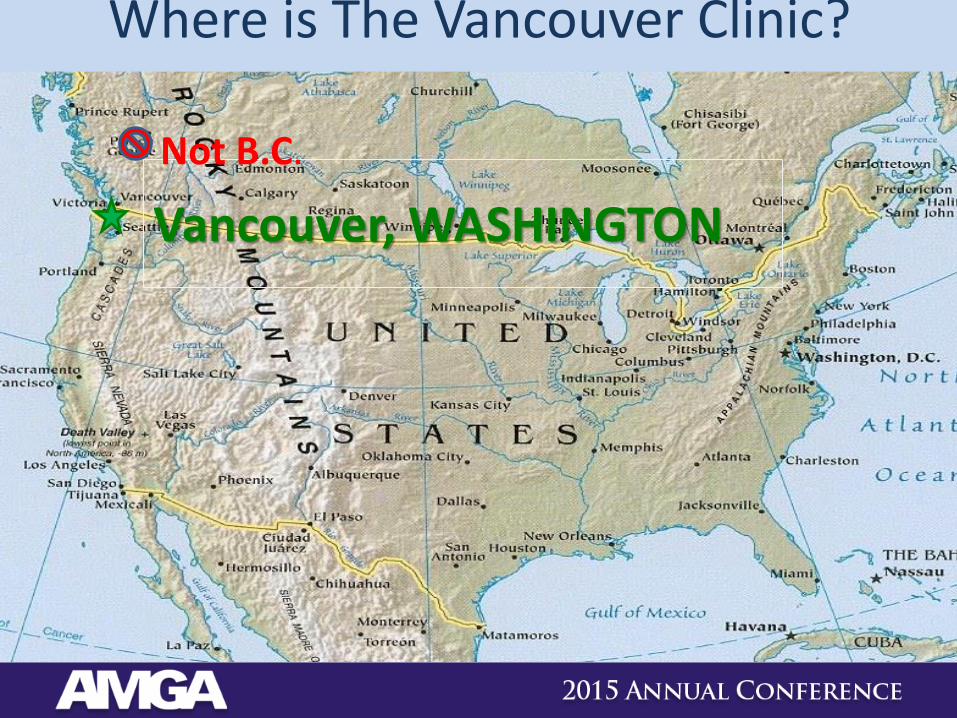
Vancouver, WASHINGTON
Not B.C.
Where is The Vancouver Clinic?

Vancouver, WA

What do you call two straight days of rain in Vancouver?
What does daylight savings time mean in Vancouver?
What did the Vancouver native say to the Pillsbury Doughboy?
It only rains twice a year in Vancouver….
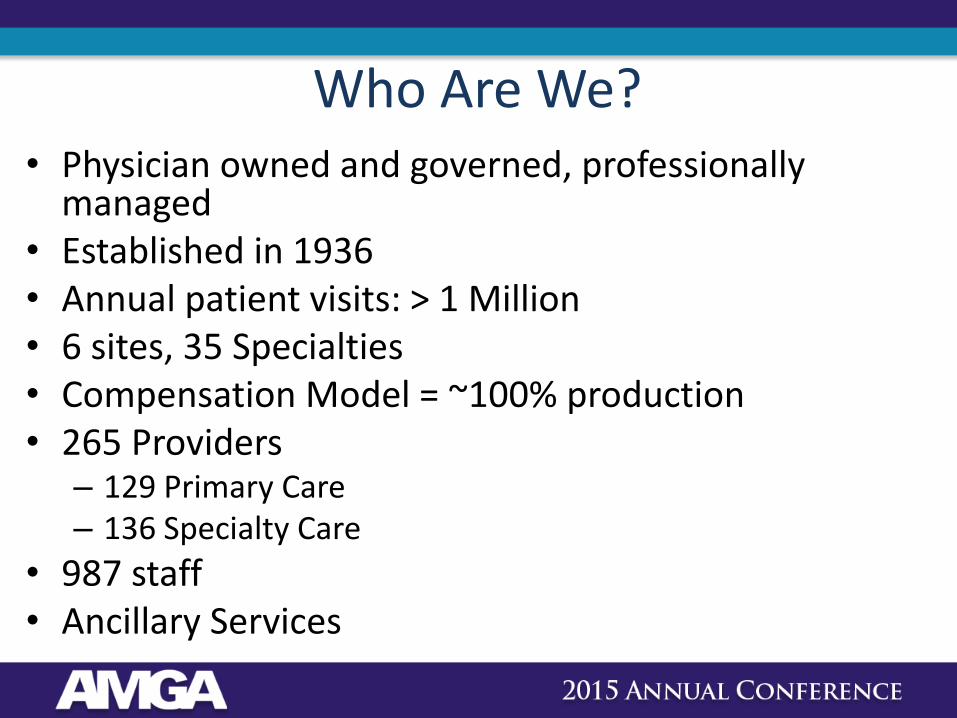
Who Are We? • Physician owned and governed, professionally
managed • Established in 1936 • Annual patient visits: > 1 Million • 6 sites, 35 Specialties • Compensation Model = ~100% production • 265 Providers
– 129 Primary Care – 136 Specialty Care
• 987 staff • Ancillary Services

Who Are We?
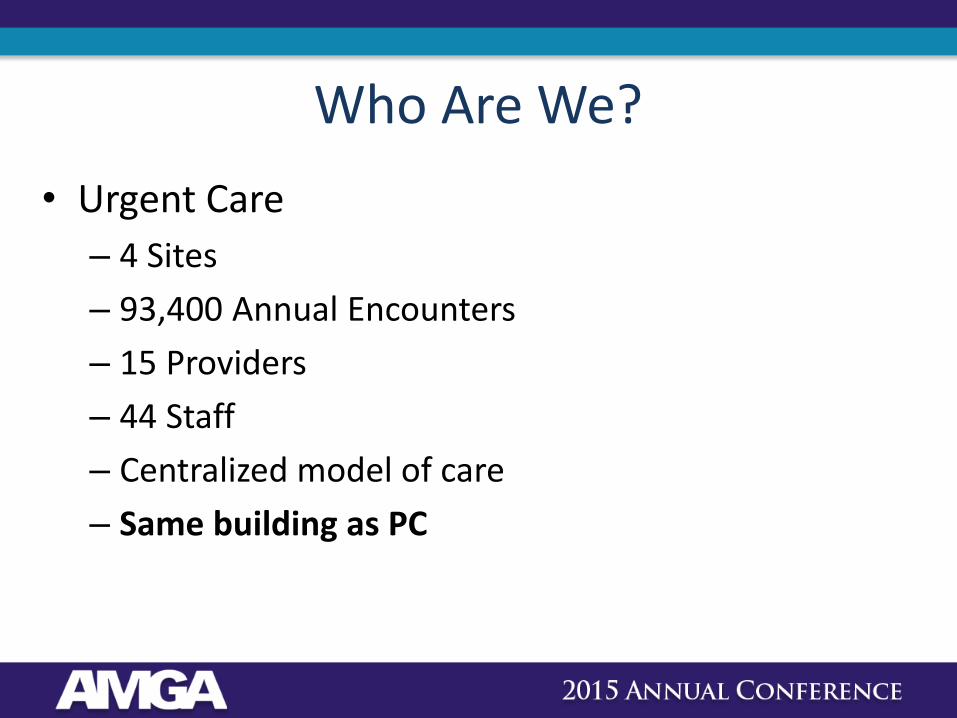
• Urgent Care
– 4 Sites
– 93,400 Annual Encounters
– 15 Providers
– 44 Staff
– Centralized model of care
– Same building as PC
Who are we?
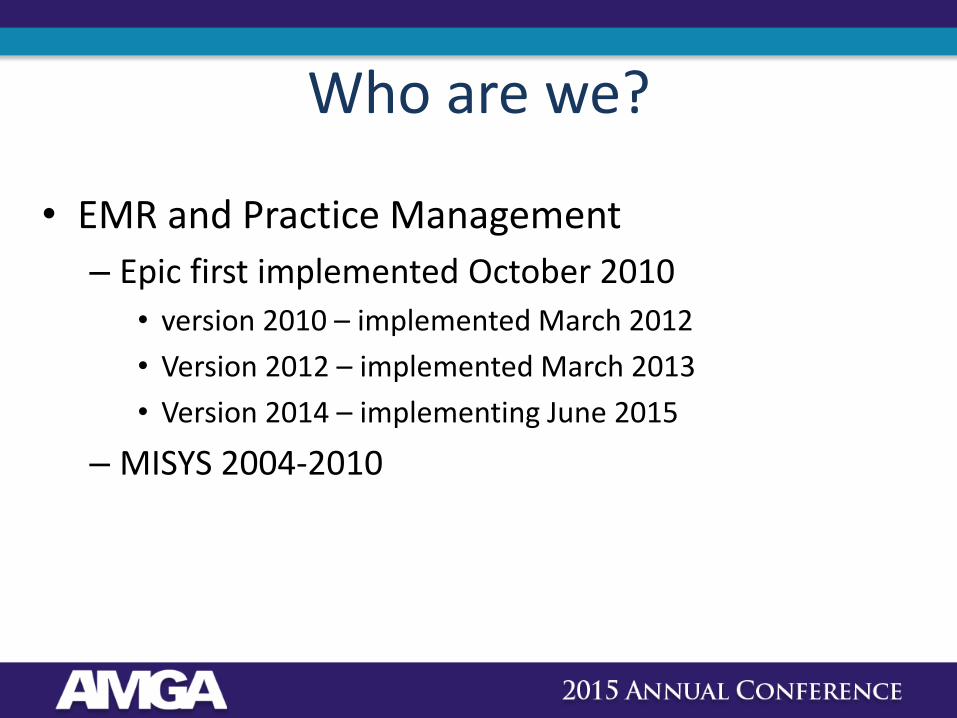
• EMR and Practice Management
– Epic first implemented October 2010
• version 2010 – implemented March 2012
• Version 2012 – implemented March 2013
• Version 2014 – implementing June 2015
– MISYS 2004-2010
Why Change?
• Advanced Access implementation in PC
– Failed implementation 2009
Lessons Learned
• Continuity is king
• Understand panel size
• Tension between reserving capacity for panel and business that wants to fill the schedule
• How do you reserve a providers capacity for their panel while still guaranteeing a full schedule?
Advanced Access
– Restart implementation Fall 2011
– Fully implemented:
• Pediatrics 7/2012
• Internal Medicine 2/2013
• Family Medicine 5/2013
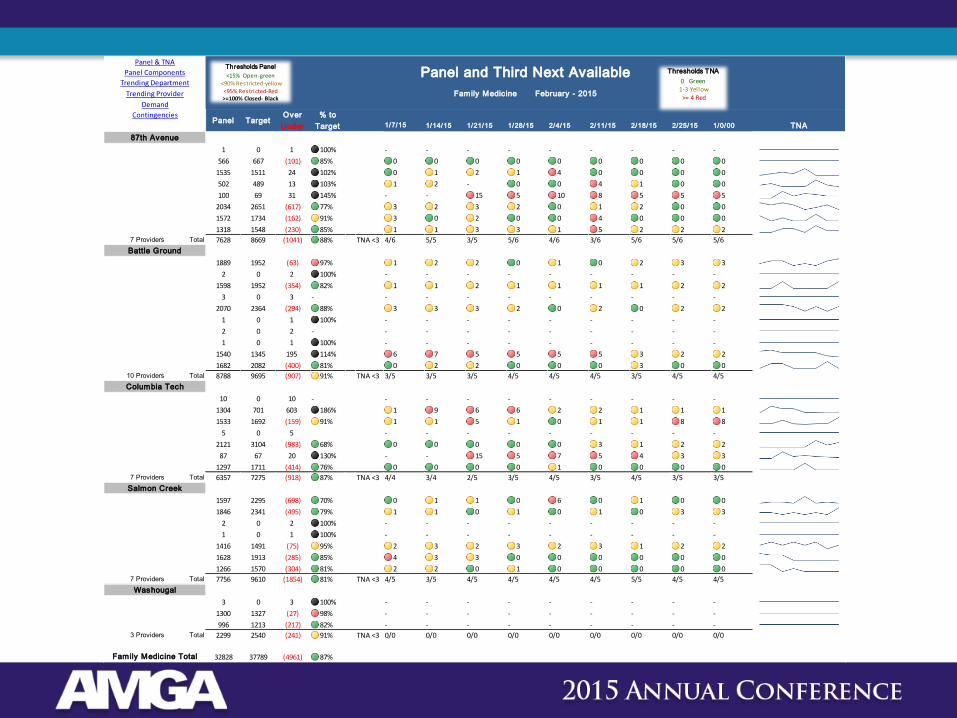
Panel & TNA
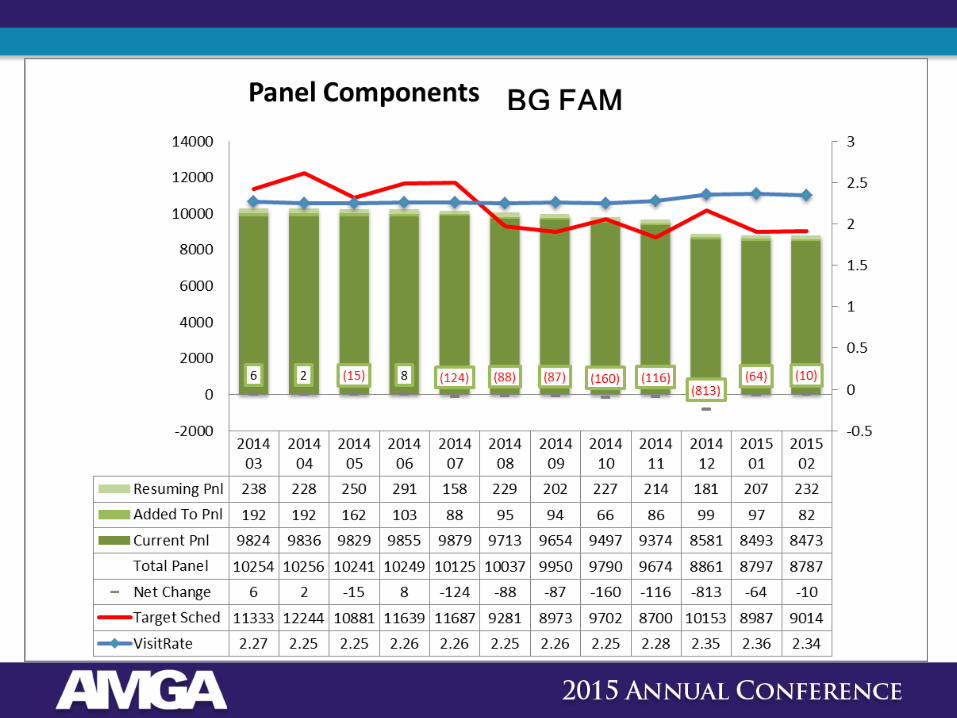
Panel Components
Trending Department
Trending Provider
Demand
Contingencies
1/7/15 1/14/15 1/21/15 1/28/15 2/4/15 2/11/15 2/18/15 2/25/15 1/0/00 TNA
87th Avenue 2 3 4 5 6 7 8 9 9
BIERMANN,K 1 0 1 100% - - - - - - - - -
BROOKS, EMI 566 667 (101) 85% 0 0 0 0 0 0 0 0 0
COFFEE,C 1535 1511 24 102% 0 1 2 1 4 0 0 0 0
HARSHMAN,KAT 502 489 13 103% 1 2 - 0 0 4 1 0 0
Michael Paul 100 69 31 145% - - 15 5 10 8 5 5 5
MOHANDESSI,S 2034 2651 (617) 77% 3 2 3 2 0 1 2 0 0
PARK,Y 1572 1734 (162) 91% 3 0 2 0 0 4 0 0 0
ODARICH, TET 1318 1548 (230) 85% 1 1 3 3 1 5 2 2 2
7 Providers Total 7628 8669 (1041) 88% TNA <3 4/6 5/5 3/5 5/6 4/6 3/6 5/6 5/6 5/6
Battle Ground
DOERFLER,E 1889 1952 (63) 97% 1 2 2 0 1 0 2 3 3
HAMPTON,J 2 0 2 100% - - - - - - - - -
HOLMES,R 1598 1952 (354) 82% 1 1 2 1 1 1 1 2 2
LOWER,C 3 0 3 - - - - - - - - - -
NIEHM,S 2070 2364 (294) 88% 3 3 3 2 0 2 0 2 2
RICHARDS,S 1 0 1 100% - - - - - - - - -
SHAVER, M 2 0 2 - - - - - - - - - -
SIMONS,A 1 0 1 100% - - - - - - - - -
VELAT,A 1540 1345 195 114% 6 7 5 5 5 5 3 2 2
WEED, M 1682 2082 (400) 81% 0 2 2 0 0 0 3 0 0
10 Providers Total 8788 9695 (907) 91% TNA <3 3/5 3/5 3/5 4/5 4/5 4/5 3/5 4/5 4/5
Columbia Tech
DROWN, A 10 0 10 - - - - - - - - - -
DRYNAN,KIMB 1304 701 603 186% 1 9 6 6 2 2 1 1 1
HOLZMAN, JES 1533 1692 (159) 91% 1 1 5 1 0 1 1 8 8
JORDHEN,L 5 0 5 - - - - - - - - -
KOH,S 2121 3104 (983) 68% 0 0 0 0 0 3 1 2 2
PAULL, RICA 87 67 20 130% - - 15 5 7 5 4 3 3
SUPPLITT,G 1297 1711 (414) 76% 0 0 0 0 1 0 0 0 0
7 Providers Total 6357 7275 (918) 87% TNA <3 4/4 3/4 2/5 3/5 4/5 3/5 4/5 3/5 3/5
Salmon Creek
DANSIE,M 1597 2295 (698) 70% 0 1 1 0 6 0 1 0 0
GREANEY,S 1846 2341 (495) 79% 1 1 0 1 0 1 0 3 3
RYAN, MINHUE 2 0 2 100% - - - - - - - - -
SHAH,M 1 0 1 100% - - - - - - - - -
TRAN,D 1416 1491 (75) 95% 2 3 2 3 2 3 1 2 2
VELYCHKO, I 1628 1913 (285) 85% 4 3 3 0 0 0 0 0 0
NASH,HEATHER 1266 1570 (304) 81% 2 2 0 1 0 0 0 0 0
7 Providers Total 7756 9610 (1854) 81% TNA <3 4/5 3/5 4/5 4/5 4/5 4/5 5/5 4/5 4/5
Washougal
NORTON, C 3 0 3 100% - - - - - - - - -
PEARSON,KATH 1300 1327 (27) 98% - - - - - - - - -
WALTON,E 996 1213 (217) 82% - - - - - - - - -
3 Providers Total 2299 2540 (241) 91% TNA <3 0/0 0/0 0/0 0/0 0/0 0/0 0/0 0/0 0/0
Family Medicine Total 32828 37789 (4961) 87%
% to
Target
Over
UnderTargetPanel
Panel and Third Next Available
Family Medicine February - 2015
Thresholds Panel
<15% Open-green<90% Restricted-yellow
<95% Restricted-Red>=100% Closed- Black
Thresholds TNA
0 Green1-3 Yellow
>= 4 Red
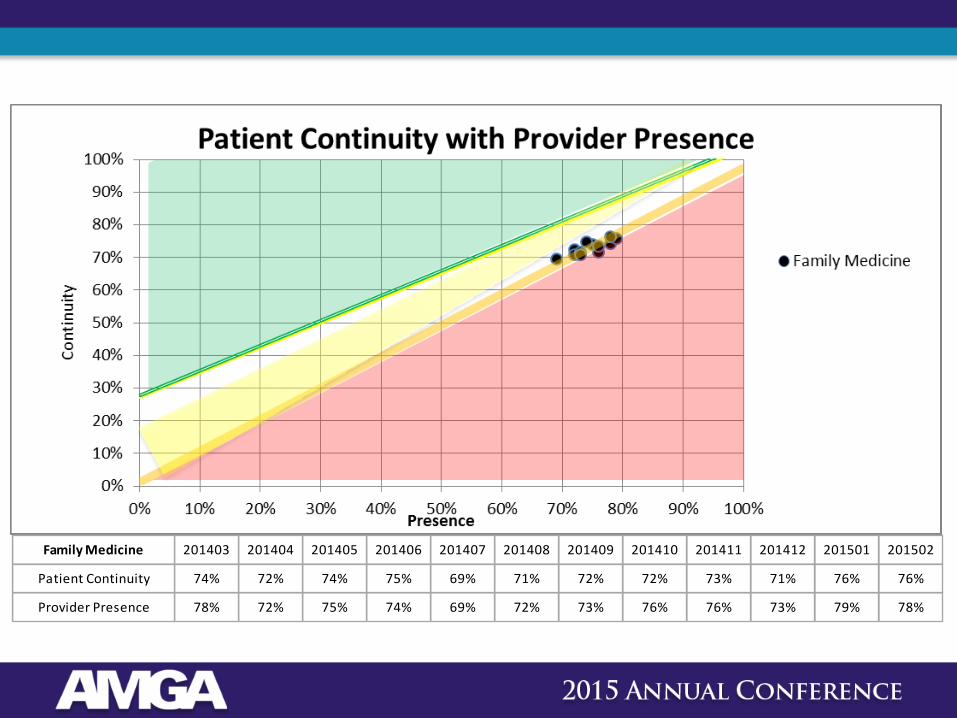
Family Medicine 201403 201404 201405 201406 201407 201408 201409 201410 201411 201412 201501 201502
Patient Continuity 74% 72% 74% 75% 69% 71% 72% 72% 73% 71% 76% 76%
Provider Presence 78% 72% 75% 74% 69% 72% 73% 76% 76% 73% 79% 78%
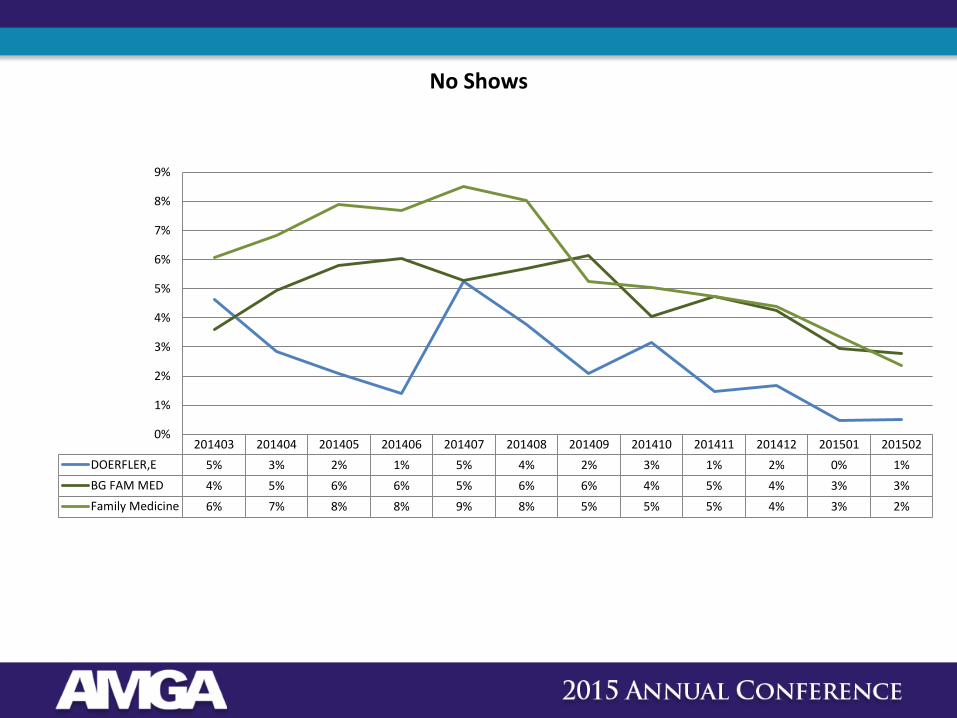
201403 201404 201405 201406 201407 201408 201409 201410 201411 201412 201501 201502
DOERFLER,E 5% 3% 2% 1% 5% 4% 2% 3% 1% 2% 0% 1%
BG FAM MED 4% 5% 6% 6% 5% 6% 6% 4% 5% 4% 3% 3%
Family Medicine 6% 7% 8% 8% 9% 8% 5% 5% 5% 4% 3% 2%
0%
1%
2%
3%
4%
5%
6%
7%
8%
9%
No Shows
Why Did We Do It?
• PC Providers’ anxiety
– 100% production based compensation
– The warehouse of patients
– Open and unused slots
• Implement “Urgent Care visit type” and expiring appointment.
Additional Benefits
• Build new PC panels
• Utilize providers on 1st year guarantee to do a percentage of Urgent Care work.
• Increases overall efficiency of our system
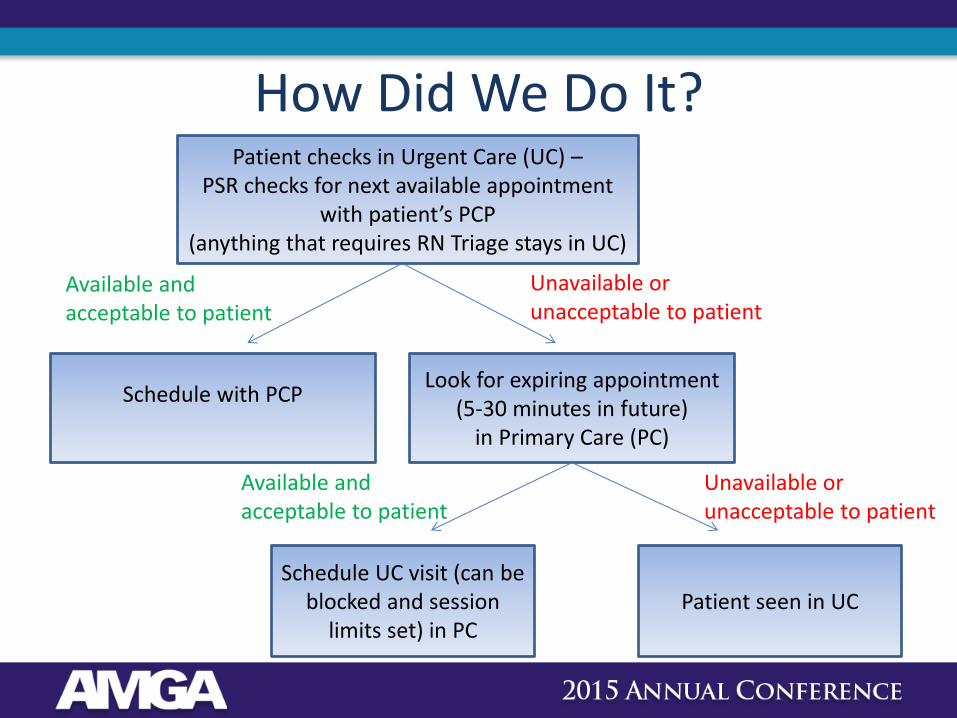
How Did We Do It? Patient checks in Urgent Care (UC) –
PSR checks for next available appointment with patient’s PCP
(anything that requires RN Triage stays in UC)
Schedule with PCP
Look for expiring appointment (5-30 minutes in future)
in Primary Care (PC)
Schedule UC visit (can be blocked and session
limits set) in PC Patient seen in UC
Available and acceptable to patient
Unavailable or unacceptable to patient
Available and acceptable to patient
Unavailable or unacceptable to patient
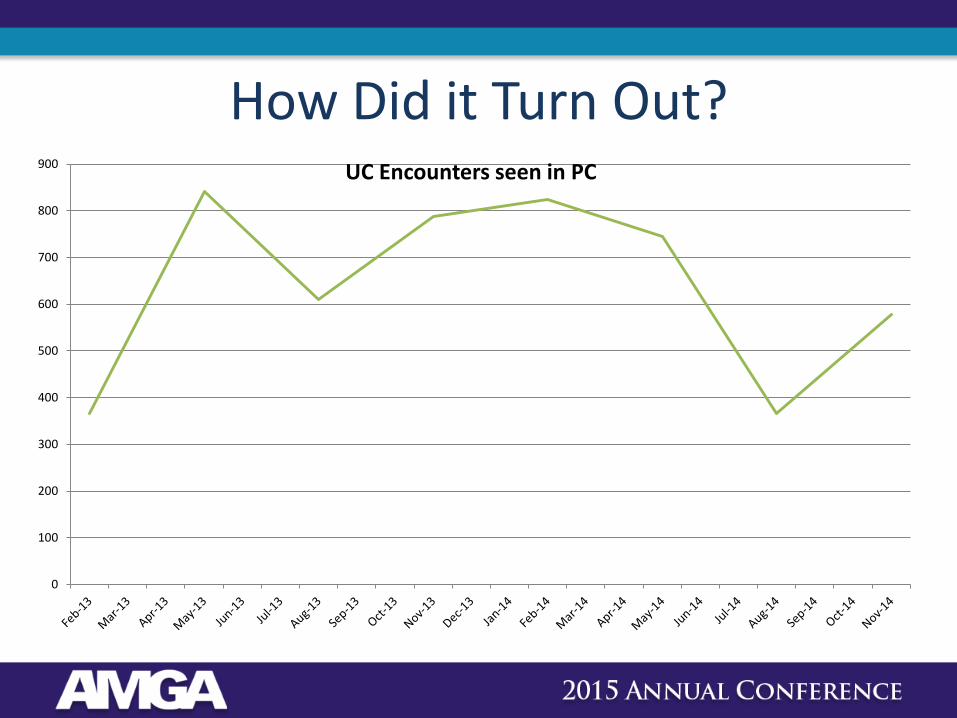
How Did it Turn Out?
0
100
200
300
400
500
600
700
800
900 UC Encounters seen in PC
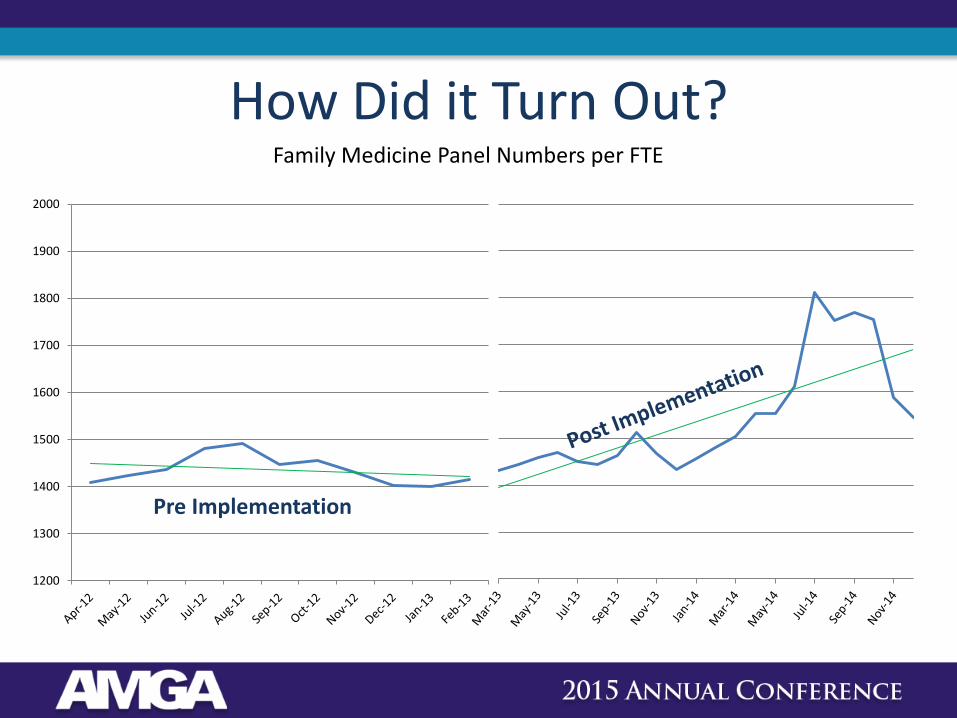
How Did it Turn Out? Family Medicine Panel Numbers per FTE
1200
1300
1400
1500
1600
1700
1800
1900
2000
Pre Implementation
Where Are We Today?
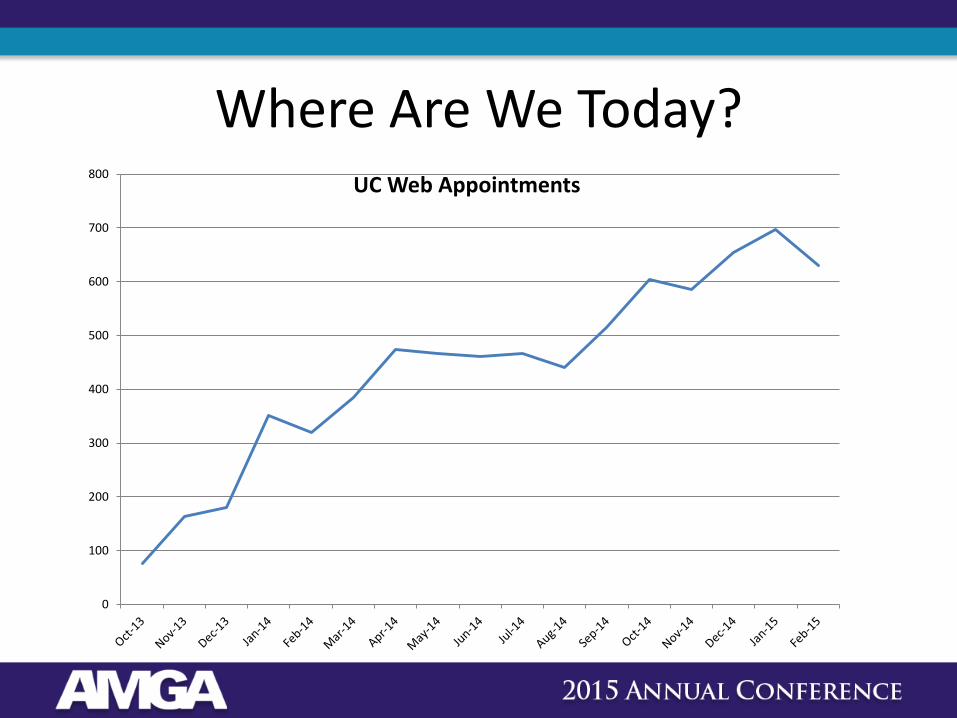
• The shift of volume in Urgent Care using the UC visit types has allowed an overall growth in patients presenting to the UC.
• Two main factors in the year over year increase in patients presenting to UC:
– Decreased wait times
– Web appointments
Web Appointments
• Summer 2013: UC visit via website.
• Since inception, we have > 8,000 web appointments.
• This business continues to increase.
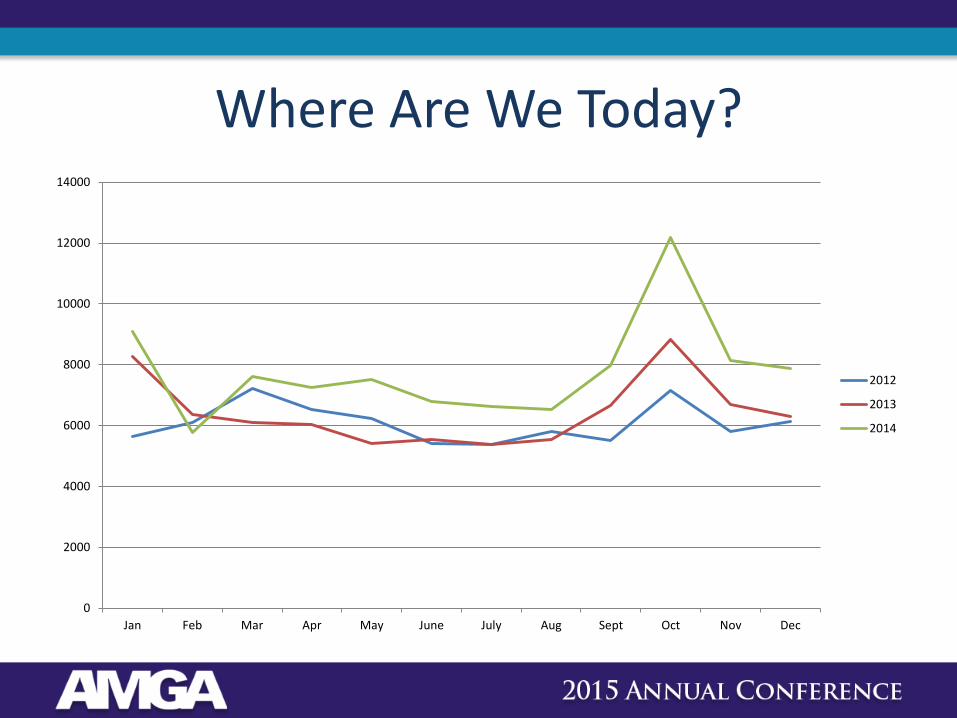
Where Are We Today?
0
2000
4000
6000
8000
10000
12000
14000
Jan Feb Mar Apr May June July Aug Sept Oct Nov Dec
2012
2013
2014
Where Are We Today?
0
100
200
300
400
500
600
700
800UC Web Appointments

Where Are We Today?
• Work RVUs per FTE
0
1000
2000
3000
4000
5000
6000
7000
8000
2009 2011 2014
Family Medicine
Internal Medicine
Pediatrics
Urgent Care
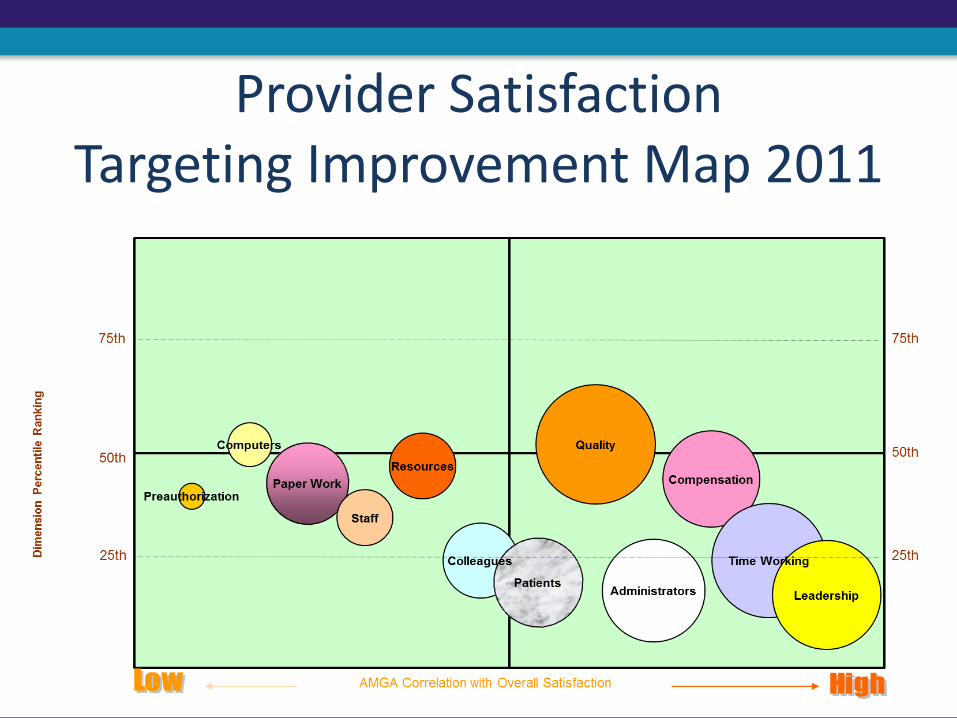
Provider Satisfaction Targeting Improvement Map 2011
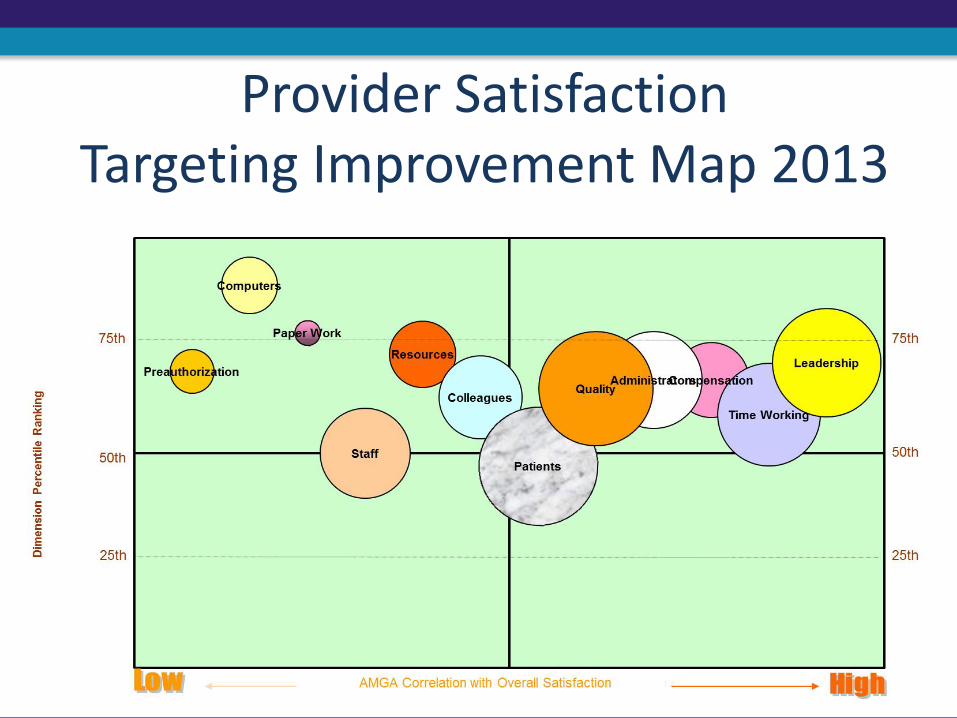
Provider Satisfaction Targeting Improvement Map 2013
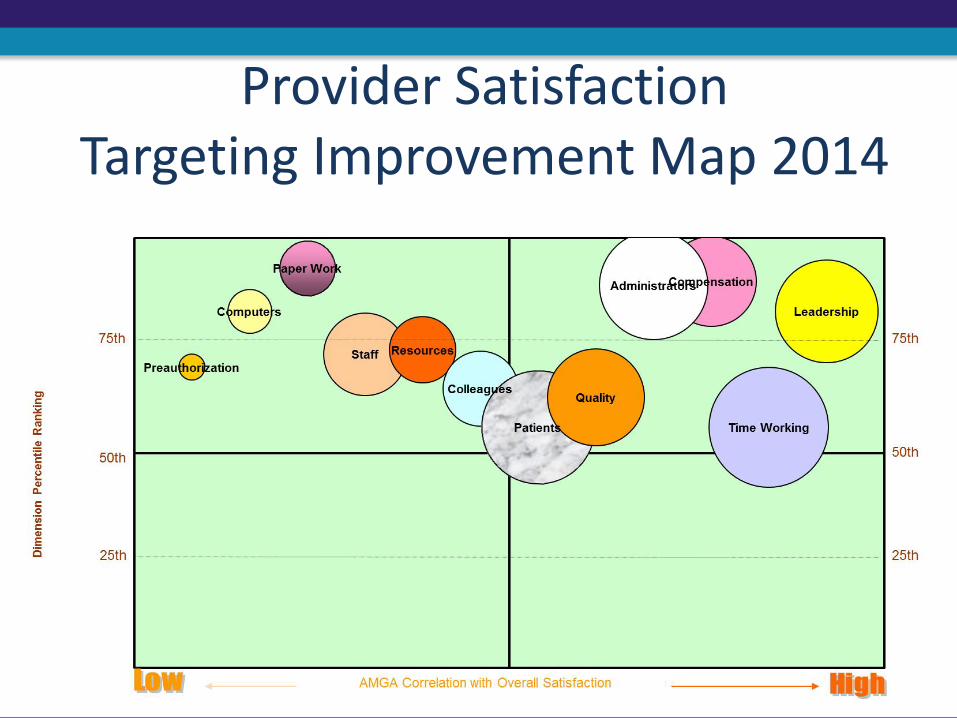
Provider Satisfaction Targeting Improvement Map 2014
What Did We Learn?
• “Open slot” in PCP schedule did not always mean available
• Need to develop list of presenting problems that PCPs are comfortable with
• PCP’s communicating with UC staff directly around perceived problems
List of Criteria to Determine if Patient Stays in Urgent Care
• Elevated BP • Possible FX • Burns • Lacerations • Abscess • Blurred vision • Chest pain • Concussion • Shortness of breath • Dizziness, numbness or tingling
Benefits Beyond Dollars and Data
Opened up communication between department providers that would not have happened otherwise (much more cordial….It’s “our” patient, not “my” patient).
What’s Next?
• Ongoing maintenance
• Communication
• Continuous Improvement
Questions?