Embed Size (px)
Citation preview
18
Advanced 3-D Tutorial
Introduction
To demonstrate some of the features of VisualAnalysis we have put together thisadvanced tutorial for you to use. This tutorial assumes that you have a basic knowledge ofVisualAnalysis, and are familiar with 2-D modeling. It is highly recommended that youhave been through the Visual Analysis Getting Started tutorial before using this tutorial.
What You Will Learn
This tutorial will teach you the following skills:
⇒ 3-D Modeling Techniques⇒ Generating a Parametric Model⇒ Altering a Structure by Moving Nodes⇒ Using the View Manager to Navigate Complex Models⇒ Using Polar Coordinates⇒ Creating Curved Members⇒ Creating Member End Releases⇒ Saving Time with Cut & Paste⇒ Renaming Elements⇒ Creating and Editing Plate Elements⇒ Creating Custom Report Styles⇒ Reporting Results Graphically
19
The Structure
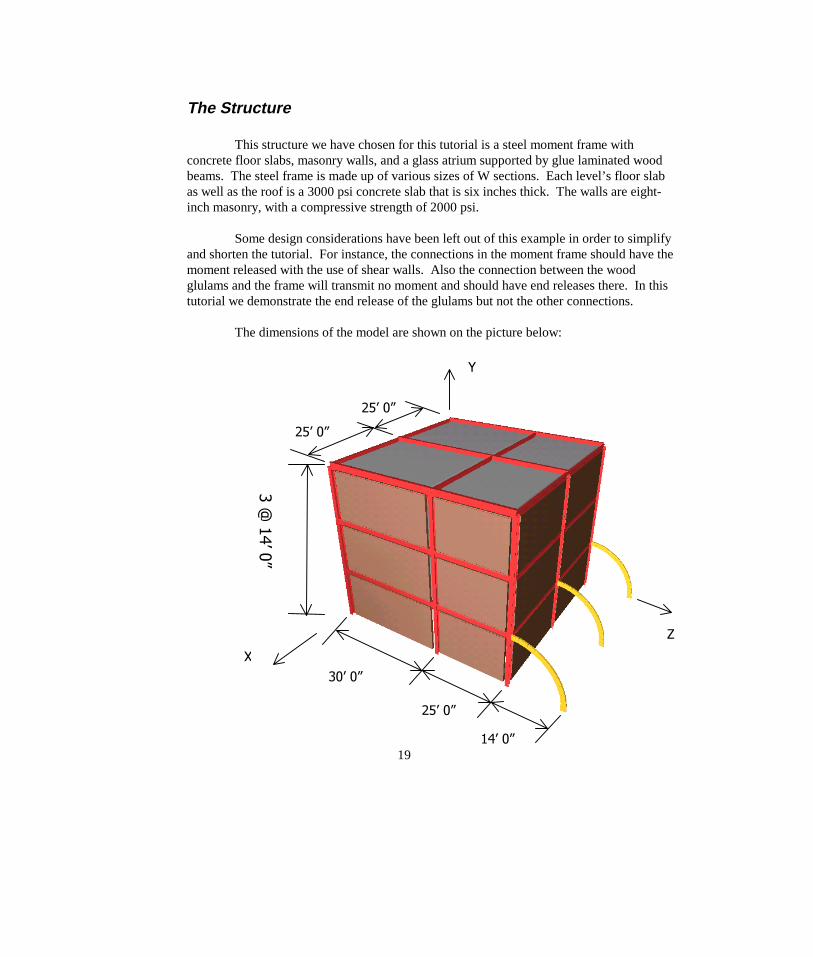
This structure we have chosen for this tutorial is a steel moment frame withconcrete floor slabs, masonry walls, and a glass atrium supported by glue laminated woodbeams. The steel frame is made up of various sizes of W sections. Each level’s floor slabas well as the roof is a 3000 psi concrete slab that is six inches thick. The walls are eight-inch masonry, with a compressive strength of 2000 psi.
Some design considerations have been left out of this example in order to simplifyand shorten the tutorial. For instance, the connections in the moment frame should have themoment released with the use of shear walls. Also the connection between the woodglulams and the frame will transmit no moment and should have end releases there. In thistutorial we demonstrate the end release of the glulams but not the other connections.
The dimensions of the model are shown on the picture below:
��#���¶��´
��¶��´
��¶��´
=
<
;
��¶��´
��¶��´
��¶��´
20
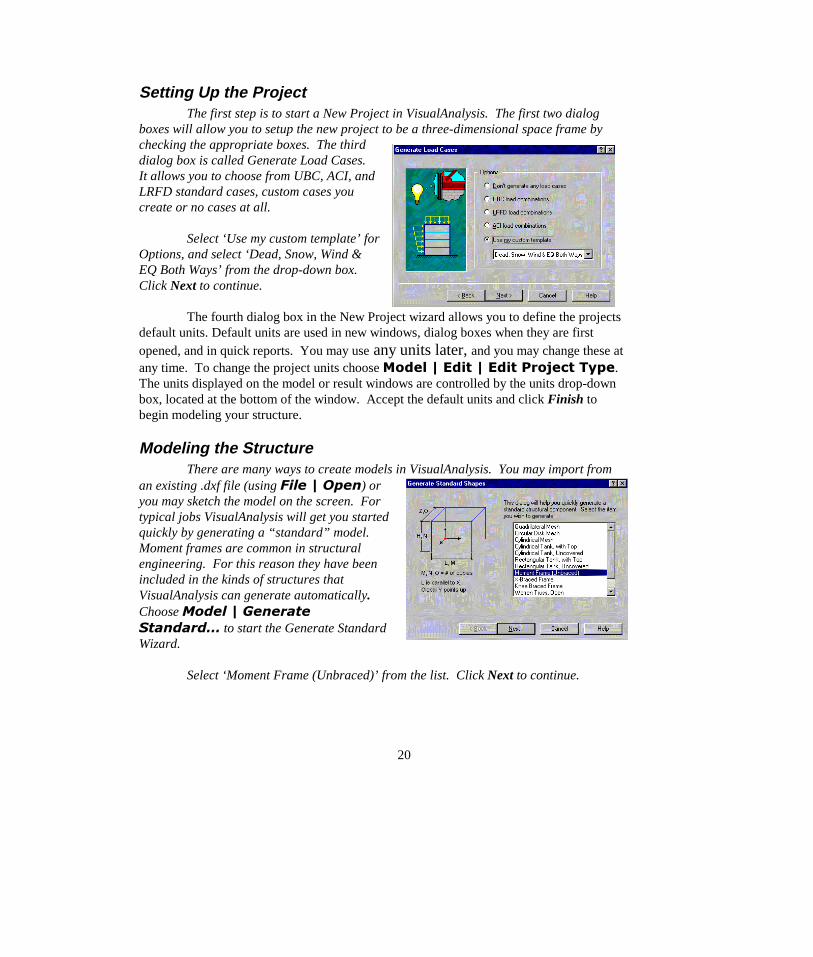
Setting Up the ProjectThe first step is to start a New Project in VisualAnalysis. The first two dialog
boxes will allow you to setup the new project to be a three-dimensional space frame bychecking the appropriate boxes. The thirddialog box is called Generate Load Cases.It allows you to choose from UBC, ACI, andLRFD standard cases, custom cases youcreate or no cases at all.
Select ‘Use my custom template’ forOptions, and select ‘Dead, Snow, Wind &EQ Both Ways’ from the drop-down box.Click Next to continue.
The fourth dialog box in the New Project wizard allows you to define the projectsdefault units. Default units are used in new windows, dialog boxes when they are firstopened, and in quick reports. You may use any units later, and you may change these atany time. To change the project units choose 0RGHO�_�(GLW�_�(GLW�3URMHFW�7\SH.The units displayed on the model or result windows are controlled by the units drop-downbox, located at the bottom of the window. Accept the default units and click Finish tobegin modeling your structure.
Modeling the StructureThere are many ways to create models in VisualAnalysis. You may import from
an existing .dxf file (using )LOH�_�2SHQ) oryou may sketch the model on the screen. Fortypical jobs VisualAnalysis will get you startedquickly by generating a “standard” model.Moment frames are common in structuralengineering. For this reason they have beenincluded in the kinds of structures thatVisualAnalysis can generate automatically.Choose 0RGHO�_�*HQHUDWH6WDQGDUG« to start the Generate StandardWizard.
Select ‘Moment Frame (Unbraced)’ from the list. Click Next to continue.
21
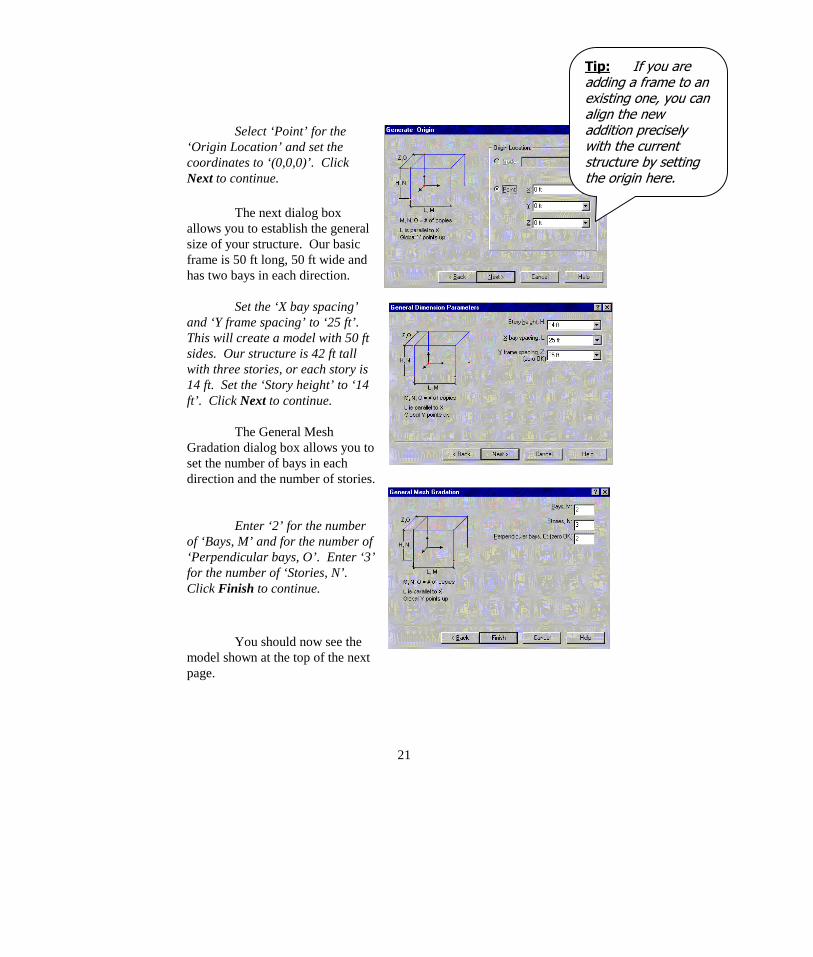
Select ‘Point’ for the‘Origin Location’ and set thecoordinates to ‘(0,0,0)’. ClickNext to continue.
The next dialog boxallows you to establish the generalsize of your structure. Our basicframe is 50 ft long, 50 ft wide andhas two bays in each direction.
Set the ‘X bay spacing’and ‘Y frame spacing’ to ‘25 ft’.This will create a model with 50 ftsides. Our structure is 42 ft tallwith three stories, or each story is14 ft. Set the ‘Story height’ to ‘14ft’. Click Next to continue.
The General MeshGradation dialog box allows you toset the number of bays in eachdirection and the number of stories.
Enter ‘2’ for the numberof ‘Bays, M’ and for the number of‘Perpendicular bays, O’. Enter ‘3’for the number of ‘Stories, N’.Click Finish to continue.
You should now see themodel shown at the top of the nextpage.
7LS� ,I�\RX�DUHDGGLQJ�D�IUDPH�WR�DQH[LVWLQJ�RQH��\RX�FDQDOLJQ�WKH�QHZDGGLWLRQ�SUHFLVHO\ZLWK�WKH�FXUUHQWVWUXFWXUH�E\�VHWWLQJWKH�RULJLQ�KHUH�
22
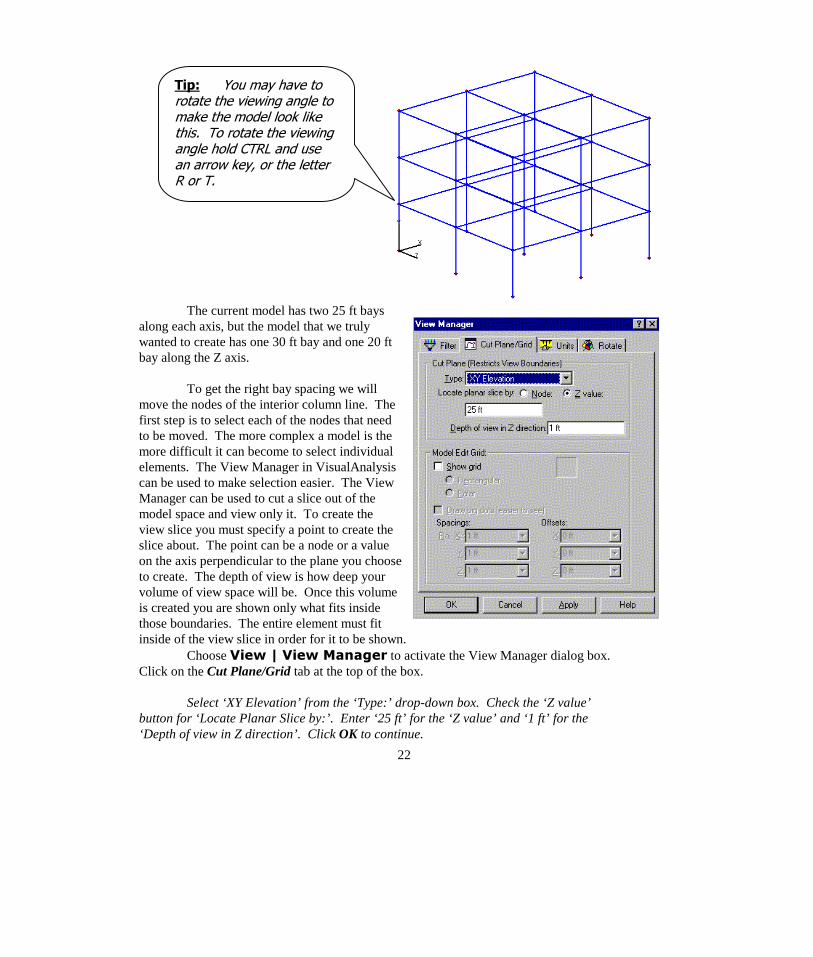
The current model has two 25 ft baysalong each axis, but the model that we trulywanted to create has one 30 ft bay and one 20 ftbay along the Z axis.
To get the right bay spacing we willmove the nodes of the interior column line. Thefirst step is to select each of the nodes that needto be moved. The more complex a model is themore difficult it can become to select individualelements. The View Manager in VisualAnalysiscan be used to make selection easier. The ViewManager can be used to cut a slice out of themodel space and view only it. To create theview slice you must specify a point to create theslice about. The point can be a node or a valueon the axis perpendicular to the plane you chooseto create. The depth of view is how deep yourvolume of view space will be. Once this volumeis created you are shown only what fits insidethose boundaries. The entire element must fitinside of the view slice in order for it to be shown.
Choose 9LHZ�_�9LHZ�0DQDJHU to activate the View Manager dialog box.Click on the Cut Plane/Grid tab at the top of the box.
Select ‘XY Elevation’ from the ‘Type:’ drop-down box. Check the ‘Z value’button for ‘Locate Planar Slice by:’. Enter ‘25 ft’ for the ‘Z value’ and ‘1 ft’ for the‘Depth of view in Z direction’. Click OK to continue.
7LS� <RX�PD\�KDYH�WRURWDWH�WKH�YLHZLQJ�DQJOH�WRPDNH�WKH�PRGHO�ORRN�OLNHWKLV���7R�URWDWH�WKH�YLHZLQJDQJOH�KROG�&75/�DQG�XVHDQ�DUURZ�NH\��RU�WKH�OHWWHU5�RU�7�
23
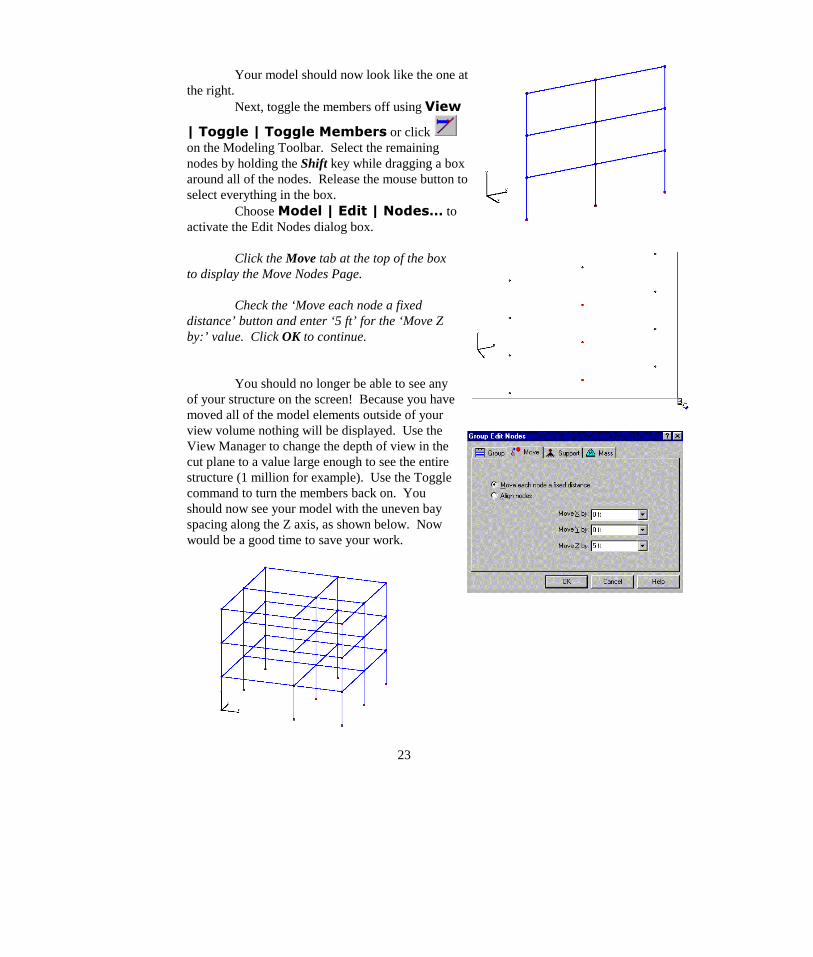
Your model should now look like the one atthe right.
Next, toggle the members off using 9LHZ
_�7RJJOH�_�7RJJOH�0HPEHUV or click on the Modeling Toolbar. Select the remainingnodes by holding the Shift key while dragging a boxaround all of the nodes. Release the mouse button toselect everything in the box.
Choose 0RGHO�_�(GLW�_�1RGHV« toactivate the Edit Nodes dialog box.
Click the Move tab at the top of the boxto display the Move Nodes Page.
Check the ‘Move each node a fixeddistance’ button and enter ‘5 ft’ for the ‘Move Zby:’ value. Click OK to continue.
You should no longer be able to see anyof your structure on the screen! Because you havemoved all of the model elements outside of yourview volume nothing will be displayed. Use theView Manager to change the depth of view in thecut plane to a value large enough to see the entirestructure (1 million for example). Use the Togglecommand to turn the members back on. Youshould now see your model with the uneven bayspacing along the Z axis, as shown below. Nowwould be a good time to save your work.
24
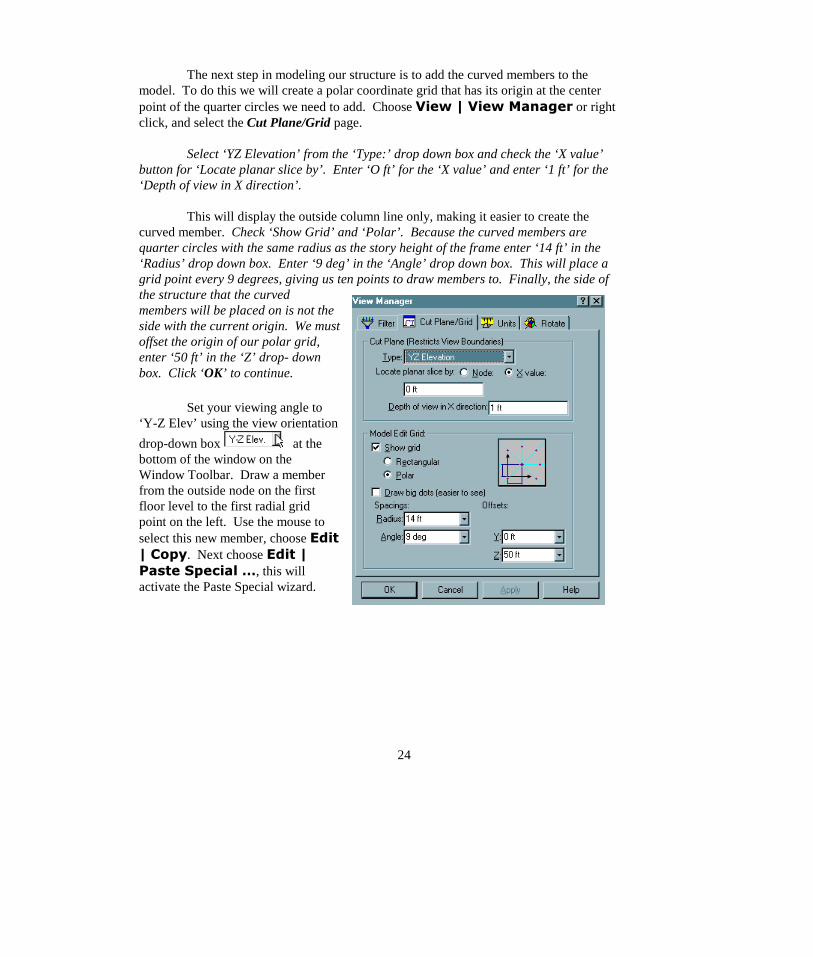
The next step in modeling our structure is to add the curved members to themodel. To do this we will create a polar coordinate grid that has its origin at the centerpoint of the quarter circles we need to add. Choose 9LHZ�_�9LHZ�0DQDJHU or rightclick, and select the Cut Plane/Grid page.
Select ‘YZ Elevation’ from the ‘Type:’ drop down box and check the ‘X value’button for ‘Locate planar slice by’. Enter ‘O ft’ for the ‘X value’ and enter ‘1 ft’ for the‘Depth of view in X direction’.
This will display the outside column line only, making it easier to create thecurved member. Check ‘Show Grid’ and ‘Polar’. Because the curved members arequarter circles with the same radius as the story height of the frame enter ‘14 ft’ in the‘Radius’ drop down box. Enter ‘9 deg’ in the ‘Angle’ drop down box. This will place agrid point every 9 degrees, giving us ten points to draw members to. Finally, the side ofthe structure that the curvedmembers will be placed on is not theside with the current origin. We mustoffset the origin of our polar grid,enter ‘50 ft’ in the ‘Z’ drop- downbox. Click ‘OK’ to continue.
Set your viewing angle to‘Y-Z Elev’ using the view orientation
drop-down box at thebottom of the window on theWindow Toolbar. Draw a memberfrom the outside node on the firstfloor level to the first radial gridpoint on the left. Use the mouse toselect this new member, choose (GLW_�&RS\. Next choose (GLW�_3DVWH�6SHFLDO�«, this willactivate the Paste Special wizard.
25
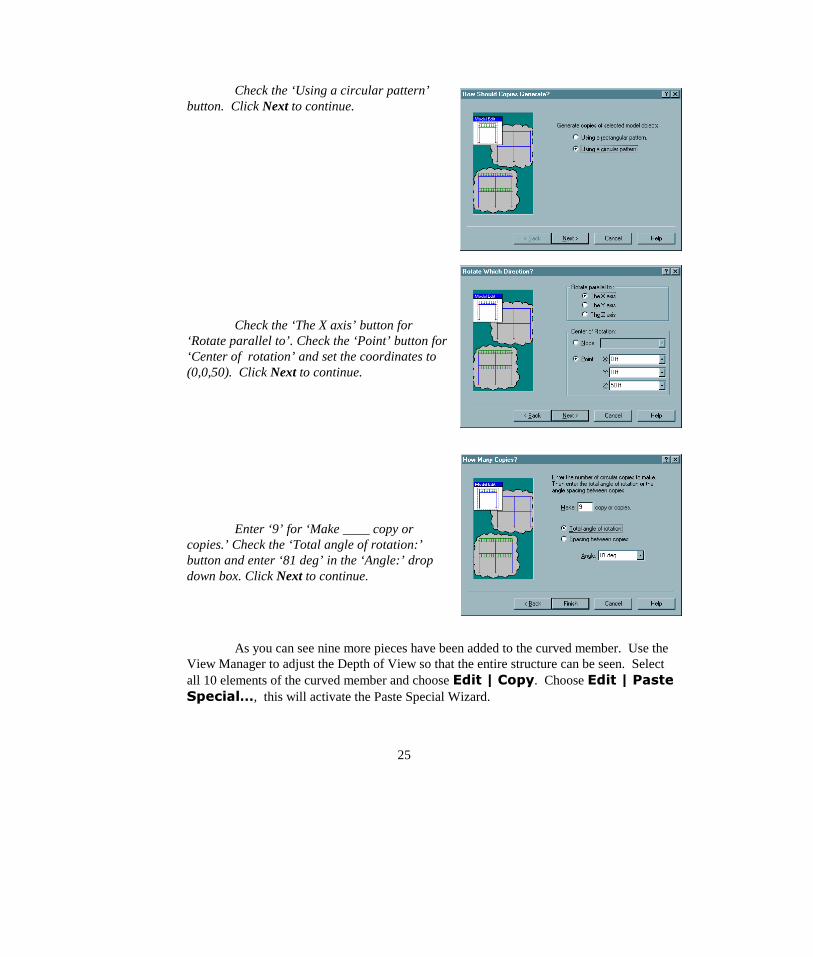
Check the ‘Using a circular pattern’button. Click Next to continue.
Check the ‘The X axis’ button for‘Rotate parallel to’. Check the ‘Point’ button for‘Center of rotation’ and set the coordinates to(0,0,50). Click Next to continue.
Enter ‘9’ for ‘Make ____ copy orcopies.’ Check the ‘Total angle of rotation:’button and enter ‘81 deg’ in the ‘Angle:’ dropdown box. Click Next to continue.
As you can see nine more pieces have been added to the curved member. Use theView Manager to adjust the Depth of View so that the entire structure can be seen. Selectall 10 elements of the curved member and choose (GLW�_�&RS\. Choose (GLW�_�3DVWH6SHFLDO«, this will activate the Paste Special Wizard.
26
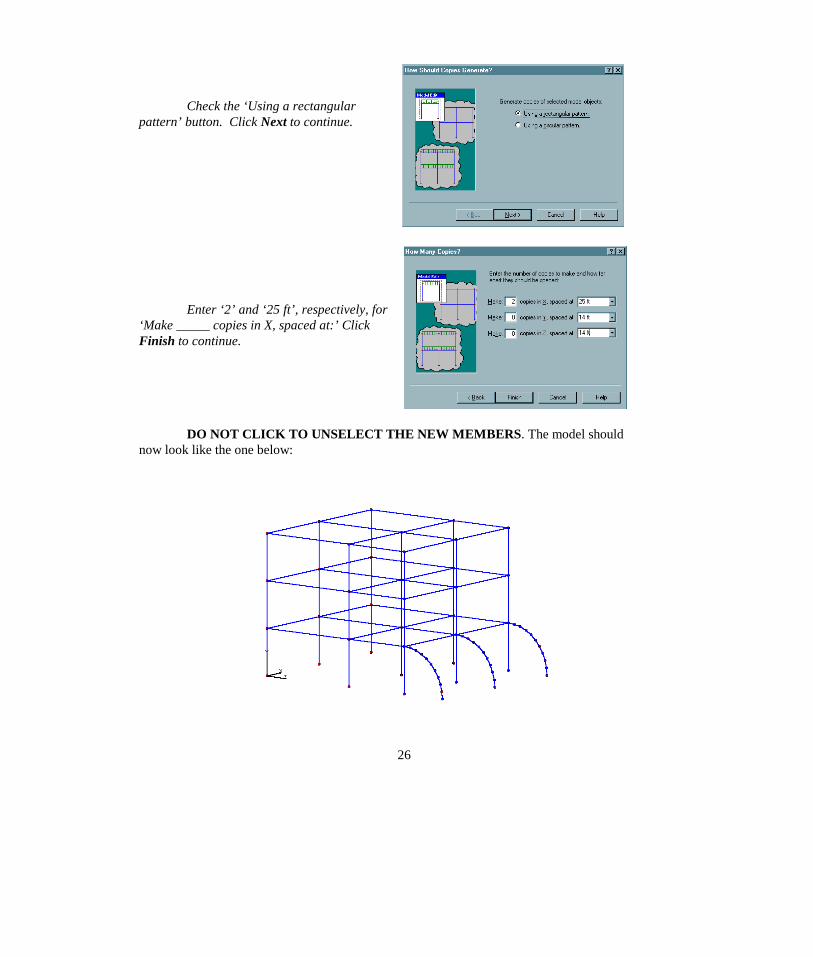
Check the ‘Using a rectangularpattern’ button. Click Next to continue.
Enter ‘2’ and ‘25 ft’, respectively, for‘Make _____ copies in X, spaced at:’ ClickFinish to continue.
DO NOT CLICK TO UNSELECT THE NEW MEMBERS. The model shouldnow look like the one below:
27
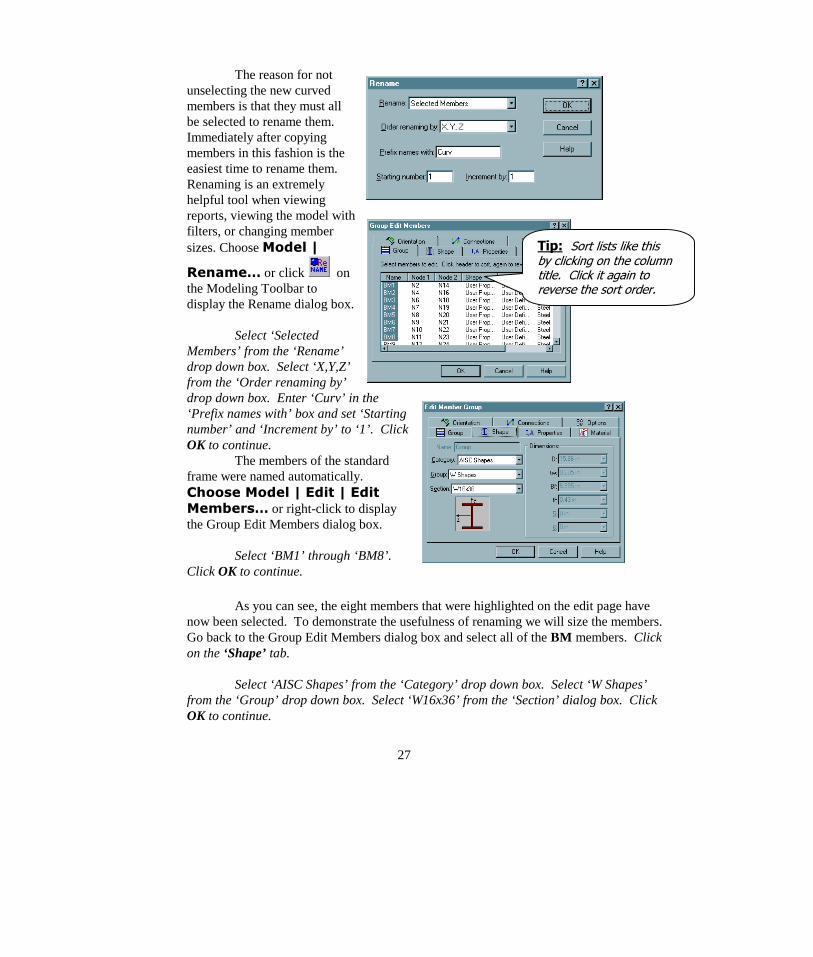
The reason for notunselecting the new curvedmembers is that they must allbe selected to rename them.Immediately after copyingmembers in this fashion is theeasiest time to rename them.Renaming is an extremelyhelpful tool when viewingreports, viewing the model withfilters, or changing membersizes. Choose 0RGHO�_
5HQDPH« or click onthe Modeling Toolbar todisplay the Rename dialog box.
Select ‘SelectedMembers’ from the ‘Rename’drop down box. Select ‘X,Y,Z’from the ‘Order renaming by’drop down box. Enter ‘Curv’ in the‘Prefix names with’ box and set ‘Startingnumber’ and ‘Increment by’ to ‘1’. ClickOK to continue.
The members of the standardframe were named automatically.&KRRVH�0RGHO�_�(GLW�_�(GLW0HPEHUV« or right-click to displaythe Group Edit Members dialog box.
Select ‘BM1’ through ‘BM8’.Click OK to continue.
As you can see, the eight members that were highlighted on the edit page havenow been selected. To demonstrate the usefulness of renaming we will size the members.Go back to the Group Edit Members dialog box and select all of the BM members. Clickon the ‘Shape’ tab.
Select ‘AISC Shapes’ from the ‘Category’ drop down box. Select ‘W Shapes’from the ‘Group’ drop down box. Select ‘W16x36’ from the ‘Section’ dialog box. ClickOK to continue.
7LS���6RUW�OLVWV�OLNH�WKLVE\�FOLFNLQJ�RQ�WKH�FROXPQWLWOH���&OLFN�LW�DJDLQ�WRUHYHUVH�WKH�VRUW�RUGHU�
28
Repeat this process for the columns, girders, and curved members using thesections shown below.
Member Section
Column (COL) W12X79
Girder (G) W24X68
Curved Members (Curv) Western Species Glulam, GL5.125X15
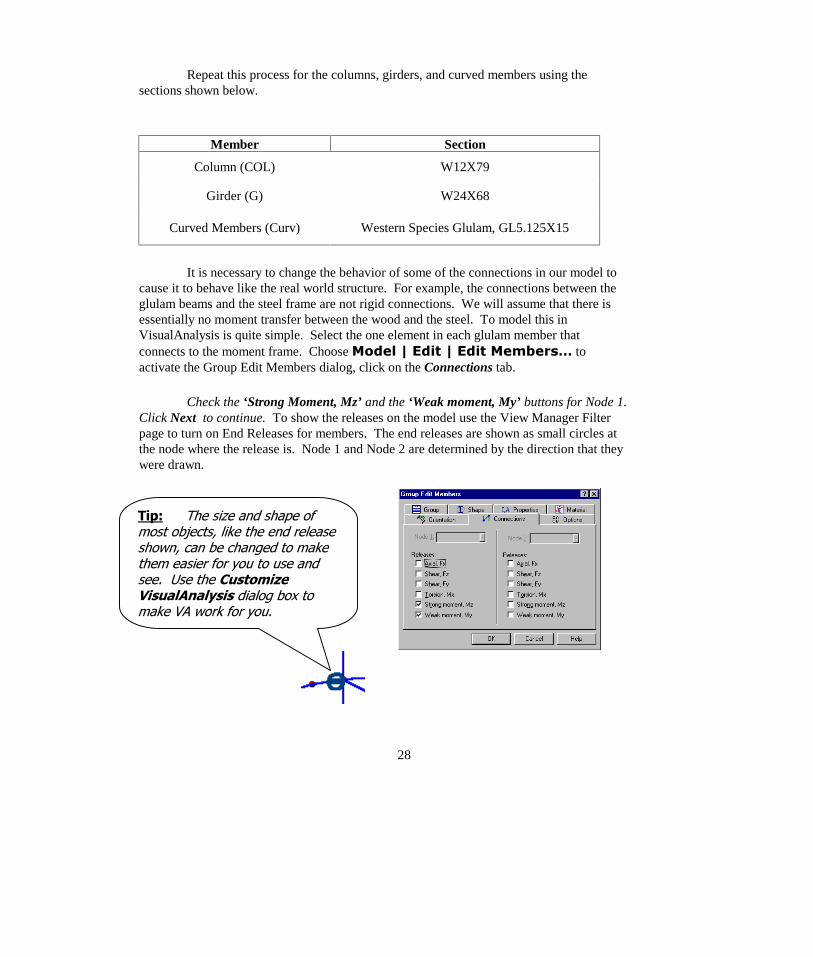
It is necessary to change the behavior of some of the connections in our model tocause it to behave like the real world structure. For example, the connections between theglulam beams and the steel frame are not rigid connections. We will assume that there isessentially no moment transfer between the wood and the steel. To model this inVisualAnalysis is quite simple. Select the one element in each glulam member thatconnects to the moment frame. Choose 0RGHO�_�(GLW�_�(GLW�0HPEHUV« toactivate the Group Edit Members dialog, click on the Connections tab.
Check the ‘Strong Moment, Mz’ and the ‘Weak moment, My’ buttons for Node 1.Click Next to continue. To show the releases on the model use the View Manager Filterpage to turn on End Releases for members. The end releases are shown as small circles atthe node where the release is. Node 1 and Node 2 are determined by the direction that theywere drawn.
7LS� 7KH�VL]H�DQG�VKDSH�RIPRVW�REMHFWV��OLNH�WKH�HQG�UHOHDVHVKRZQ��FDQ�EH�FKDQJHG�WR�PDNHWKHP�HDVLHU�IRU�\RX�WR�XVH�DQGVHH���8VH�WKH�&XVWRPL]H9LVXDO$QDO\VLV�GLDORJ�ER[�WRPDNH�9$�ZRUN�IRU�\RX�
29
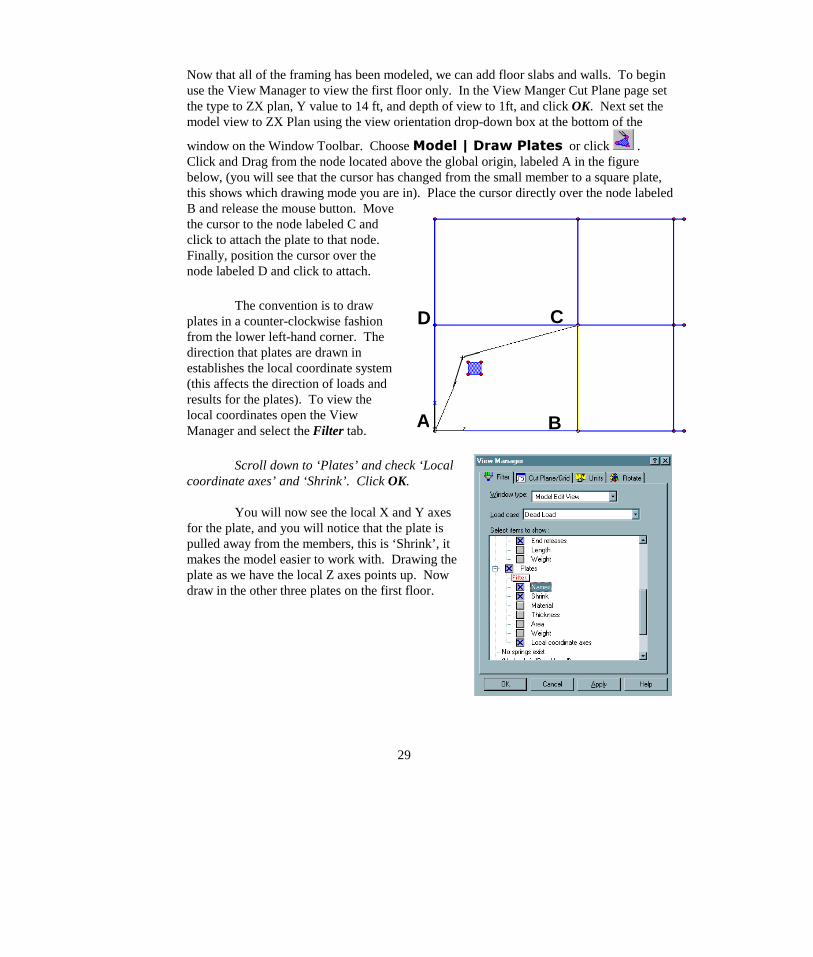
Now that all of the framing has been modeled, we can add floor slabs and walls. To beginuse the View Manager to view the first floor only. In the View Manger Cut Plane page setthe type to ZX plan, Y value to 14 ft, and depth of view to 1ft, and click OK. Next set themodel view to ZX Plan using the view orientation drop-down box at the bottom of the
window on the Window Toolbar. Choose 0RGHO�_�'UDZ�3ODWHV or click .Click and Drag from the node located above the global origin, labeled A in the figurebelow, (you will see that the cursor has changed from the small member to a square plate,this shows which drawing mode you are in). Place the cursor directly over the node labeledB and release the mouse button. Movethe cursor to the node labeled C andclick to attach the plate to that node.Finally, position the cursor over thenode labeled D and click to attach.
The convention is to drawplates in a counter-clockwise fashionfrom the lower left-hand corner. Thedirection that plates are drawn inestablishes the local coordinate system(this affects the direction of loads andresults for the plates). To view thelocal coordinates open the ViewManager and select the Filter tab.
Scroll down to ‘Plates’ and check ‘Localcoordinate axes’ and ‘Shrink’. Click OK.
You will now see the local X and Y axesfor the plate, and you will notice that the plate ispulled away from the members, this is ‘Shrink’, itmakes the model easier to work with. Drawing theplate as we have the local Z axes points up. Nowdraw in the other three plates on the first floor.
A
C
B
D
30
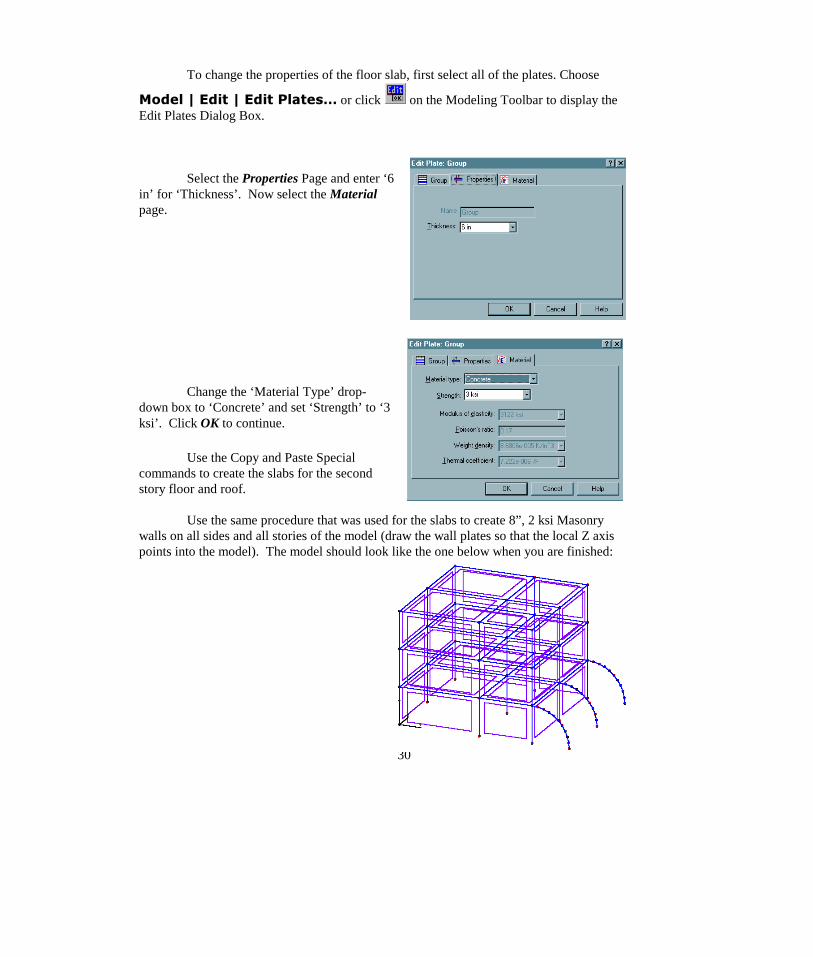
To change the properties of the floor slab, first select all of the plates. Choose
0RGHO�_�(GLW�_�(GLW�3ODWHV« or click on the Modeling Toolbar to display theEdit Plates Dialog Box.
Select the Properties Page and enter ‘6in’ for ‘Thickness’. Now select the Materialpage.
Change the ‘Material Type’ drop-down box to ‘Concrete’ and set ‘Strength’ to ‘3ksi’. Click OK to continue.
Use the Copy and Paste Specialcommands to create the slabs for the secondstory floor and roof.
Use the same procedure that was used for the slabs to create 8”, 2 ksi Masonrywalls on all sides and all stories of the model (draw the wall plates so that the local Z axispoints into the model). The model should look like the one below when you are finished:
31
This model appears to be an accurate representation of a moment frame with masonry wallsand concrete floor slabs. This can be deceiving, however. The model we have created usesa single large plate element to model the floors and walls. The problem with this is that theplate elements are only connected to the supporting members at the nodes. In the realworld the plates are in continuous contact with the supporting members. Modeling thestructure as we have can cause larger deflections in some members than if they weremodeled with intermediate connections. The walls may also be too stiff when modeled as asingle element per bay. A final concern involves load path continuity. If a snow load wereapplied to the roof plates as shown above, the load would be transferred to the corners ofthe plate and directly down to the columns. The supporting beams would receive no load.To fix these problems the single plate will be split into smaller pieces, so that more nodesare provided to allow the real world connection to be more accurately modeled. The moreeach plate is split the more accurate the model becomes. However, this new model also hasdrawbacks. More elements require more time to analyze, this is particularly important withlarge models. Increasing the number of elements causes the model to be less manageableand the results more difficult to evaluate. Finally, this new model may not be refinedenough. It may be necessary to split the elements even more (see the VisualAnalysis UsersGuide for a discussion of “How Many Plate Elements are Enough”.)
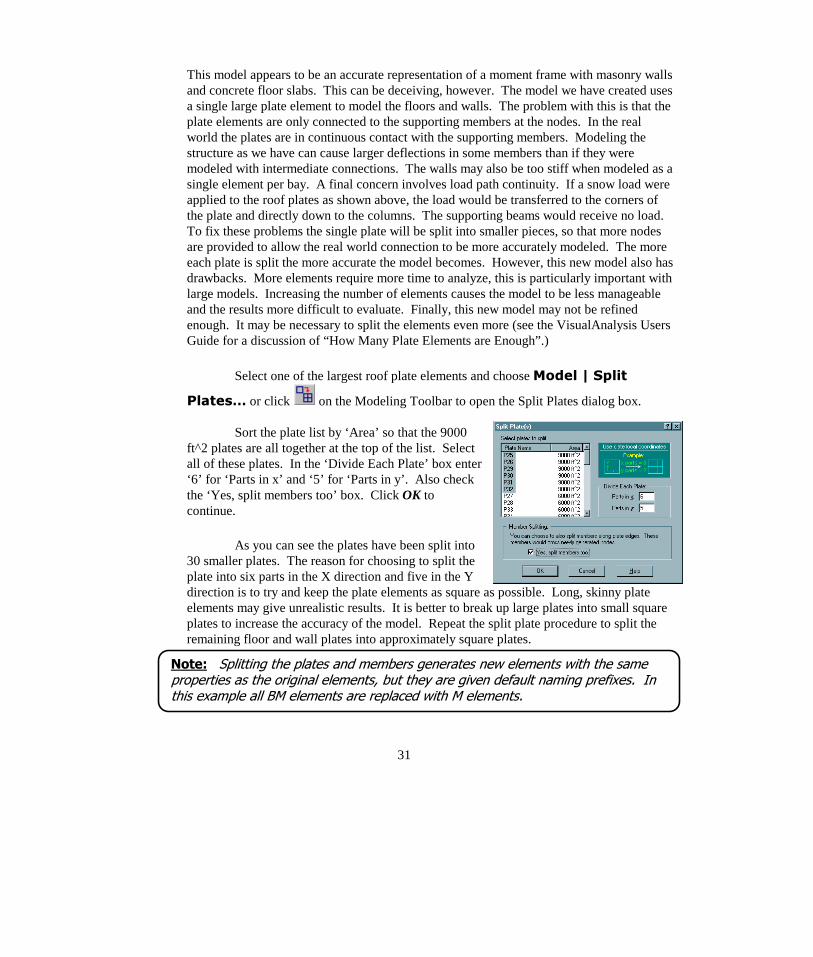
Select one of the largest roof plate elements and choose 0RGHO�_�6SOLW
3ODWHV« or click on the Modeling Toolbar to open the Split Plates dialog box.
Sort the plate list by ‘Area’ so that the 9000ft^2 plates are all together at the top of the list. Selectall of these plates. In the ‘Divide Each Plate’ box enter‘6’ for ‘Parts in x’ and ‘5’ for ‘Parts in y’. Also checkthe ‘Yes, split members too’ box. Click OK tocontinue.
As you can see the plates have been split into30 smaller plates. The reason for choosing to split theplate into six parts in the X direction and five in the Ydirection is to try and keep the plate elements as square as possible. Long, skinny plateelements may give unrealistic results. It is better to break up large plates into small squareplates to increase the accuracy of the model. Repeat the split plate procedure to split theremaining floor and wall plates into approximately square plates.
1RWH� 6SOLWWLQJ�WKH�SODWHV�DQG�PHPEHUV�JHQHUDWHV�QHZ�HOHPHQWV�ZLWK�WKH�VDPHSURSHUWLHV�DV�WKH�RULJLQDO�HOHPHQWV��EXW�WKH\�DUH�JLYHQ�GHIDXOW�QDPLQJ�SUHIL[HV���,QWKLV�H[DPSOH�DOO�%0�HOHPHQWV�DUH�UHSODFHG�ZLWK�0�HOHPHQWV�
32
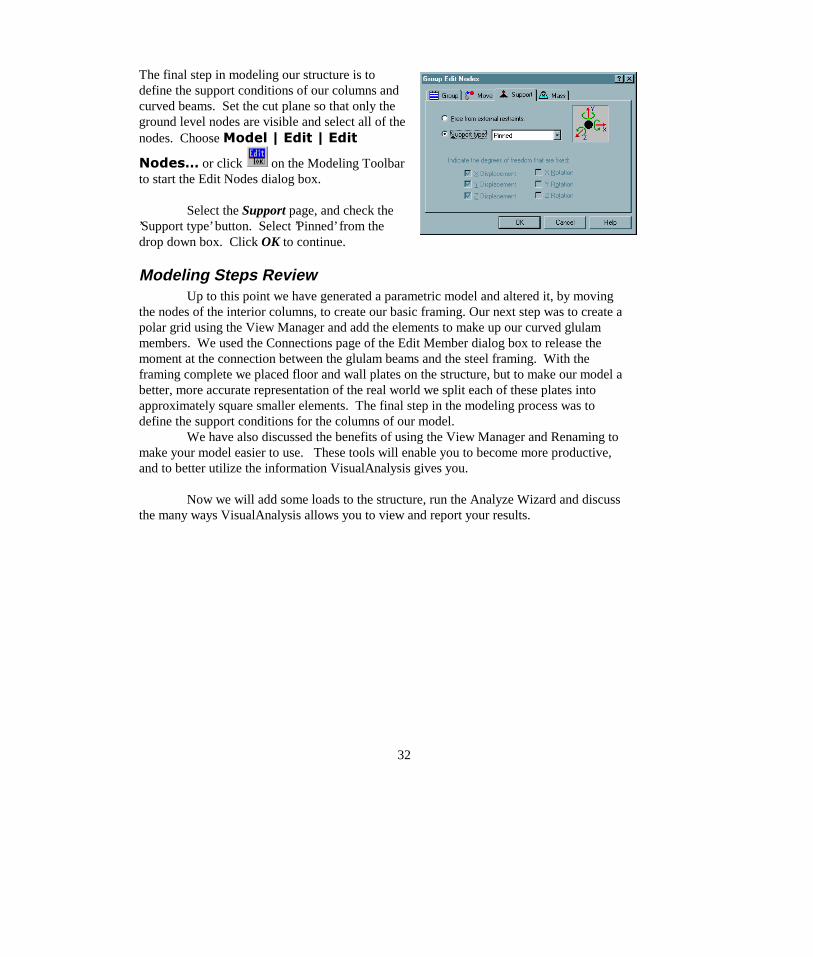
The final step in modeling our structure is todefine the support conditions of our columns andcurved beams. Set the cut plane so that only theground level nodes are visible and select all of thenodes. Choose 0RGHO�_�(GLW�_�(GLW
1RGHV« or click on the Modeling Toolbarto start the Edit Nodes dialog box.
Select the Support page, and check the’Support type’ button. Select ’Pinned’ from thedrop down box. Click OK to continue.
Modeling Steps ReviewUp to this point we have generated a parametric model and altered it, by moving
the nodes of the interior columns, to create our basic framing. Our next step was to create apolar grid using the View Manager and add the elements to make up our curved glulammembers. We used the Connections page of the Edit Member dialog box to release themoment at the connection between the glulam beams and the steel framing. With theframing complete we placed floor and wall plates on the structure, but to make our model abetter, more accurate representation of the real world we split each of these plates intoapproximately square smaller elements. The final step in the modeling process was todefine the support conditions for the columns of our model.
We have also discussed the benefits of using the View Manager and Renaming tomake your model easier to use. These tools will enable you to become more productive,and to better utilize the information VisualAnalysis gives you.
Now we will add some loads to the structure, run the Analyze Wizard and discussthe many ways VisualAnalysis allows you to view and report your results.
33
Modeling the Loads
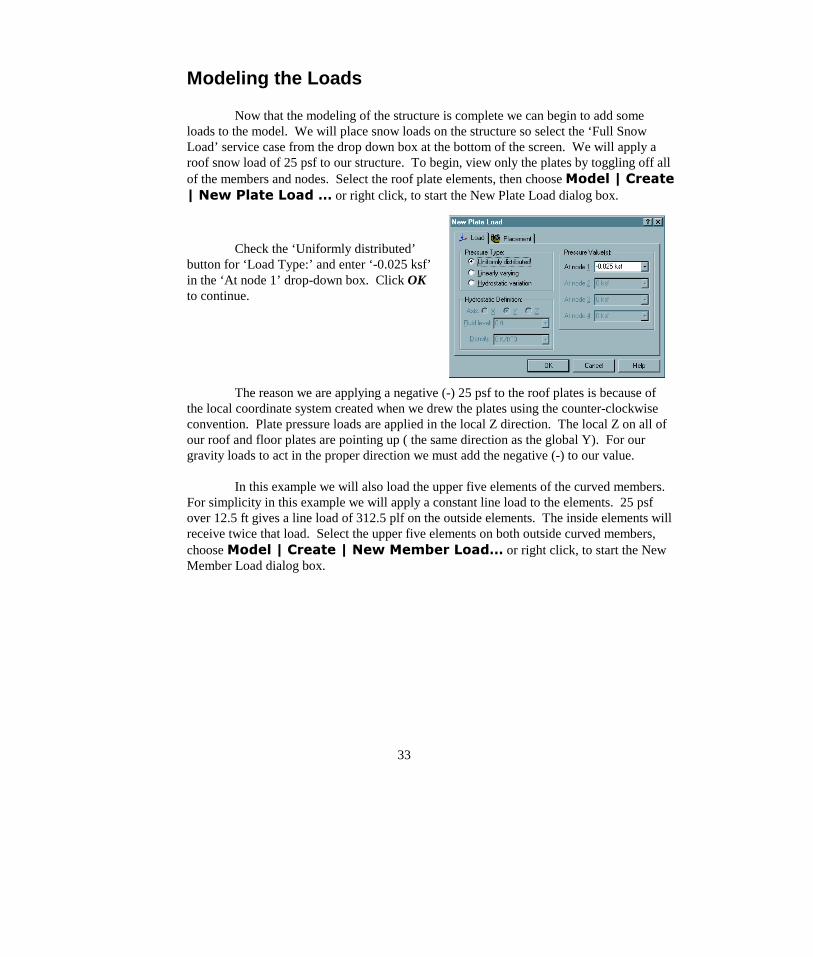
Now that the modeling of the structure is complete we can begin to add someloads to the model. We will place snow loads on the structure so select the ‘Full SnowLoad’ service case from the drop down box at the bottom of the screen. We will apply aroof snow load of 25 psf to our structure. To begin, view only the plates by toggling off allof the members and nodes. Select the roof plate elements, then choose 0RGHO�_�&UHDWH_�1HZ�3ODWH�/RDG�« or right click, to start the New Plate Load dialog box.
Check the ‘Uniformly distributed’button for ‘Load Type:’ and enter ‘-0.025 ksf’in the ‘At node 1’ drop-down box. Click OKto continue.
The reason we are applying a negative (-) 25 psf to the roof plates is because ofthe local coordinate system created when we drew the plates using the counter-clockwiseconvention. Plate pressure loads are applied in the local Z direction. The local Z on all ofour roof and floor plates are pointing up ( the same direction as the global Y). For ourgravity loads to act in the proper direction we must add the negative (-) to our value.
In this example we will also load the upper five elements of the curved members.For simplicity in this example we will apply a constant line load to the elements. 25 psfover 12.5 ft gives a line load of 312.5 plf on the outside elements. The inside elements willreceive twice that load. Select the upper five elements on both outside curved members,choose 0RGHO�_�&UHDWH�_�1HZ�0HPEHU�/RDG« or right click, to start the NewMember Load dialog box.
34
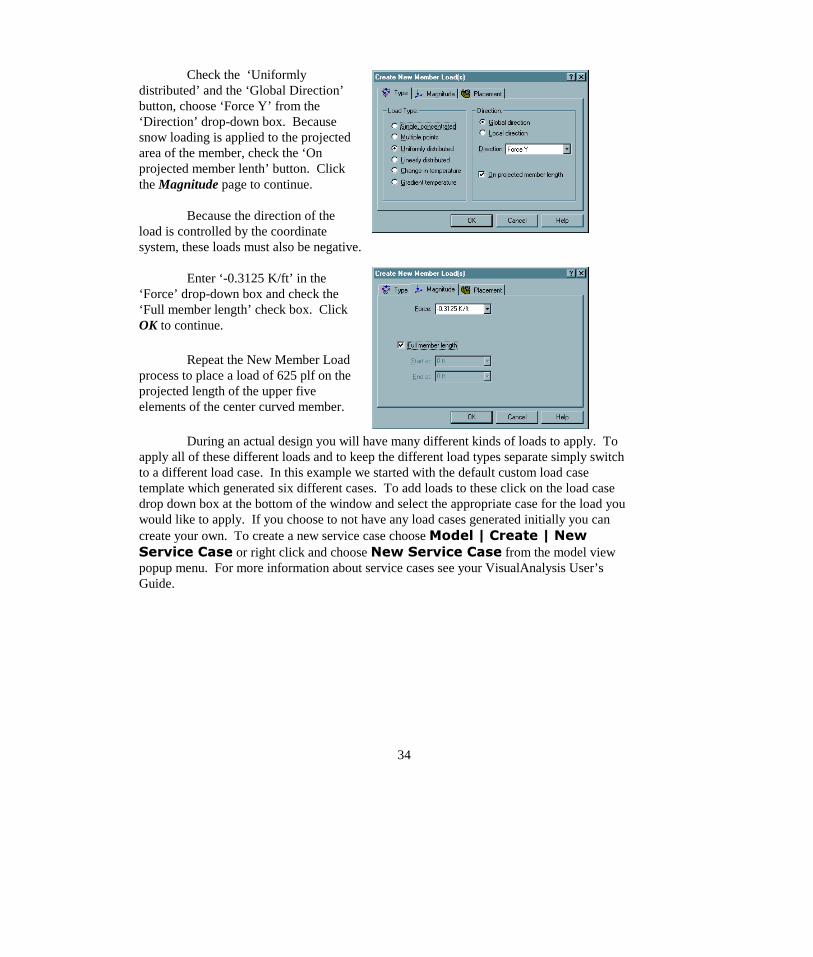
Check the ‘Uniformlydistributed’ and the ‘Global Direction’button, choose ‘Force Y’ from the‘Direction’ drop-down box. Becausesnow loading is applied to the projectedarea of the member, check the ‘Onprojected member lenth’ button. Clickthe Magnitude page to continue.
Because the direction of theload is controlled by the coordinatesystem, these loads must also be negative.
Enter ‘-0.3125 K/ft’ in the‘Force’ drop-down box and check the‘Full member length’ check box. ClickOK to continue.
Repeat the New Member Loadprocess to place a load of 625 plf on theprojected length of the upper fiveelements of the center curved member.
During an actual design you will have many different kinds of loads to apply. Toapply all of these different loads and to keep the different load types separate simply switchto a different load case. In this example we started with the default custom load casetemplate which generated six different cases. To add loads to these click on the load casedrop down box at the bottom of the window and select the appropriate case for the load youwould like to apply. If you choose to not have any load cases generated initially you cancreate your own. To create a new service case choose 0RGHO�_�&UHDWH�_�1HZ6HUYLFH�&DVH or right click and choose 1HZ�6HUYLFH�&DVH from the model viewpopup menu. For more information about service cases see your VisualAnalysis User’sGuide.
35
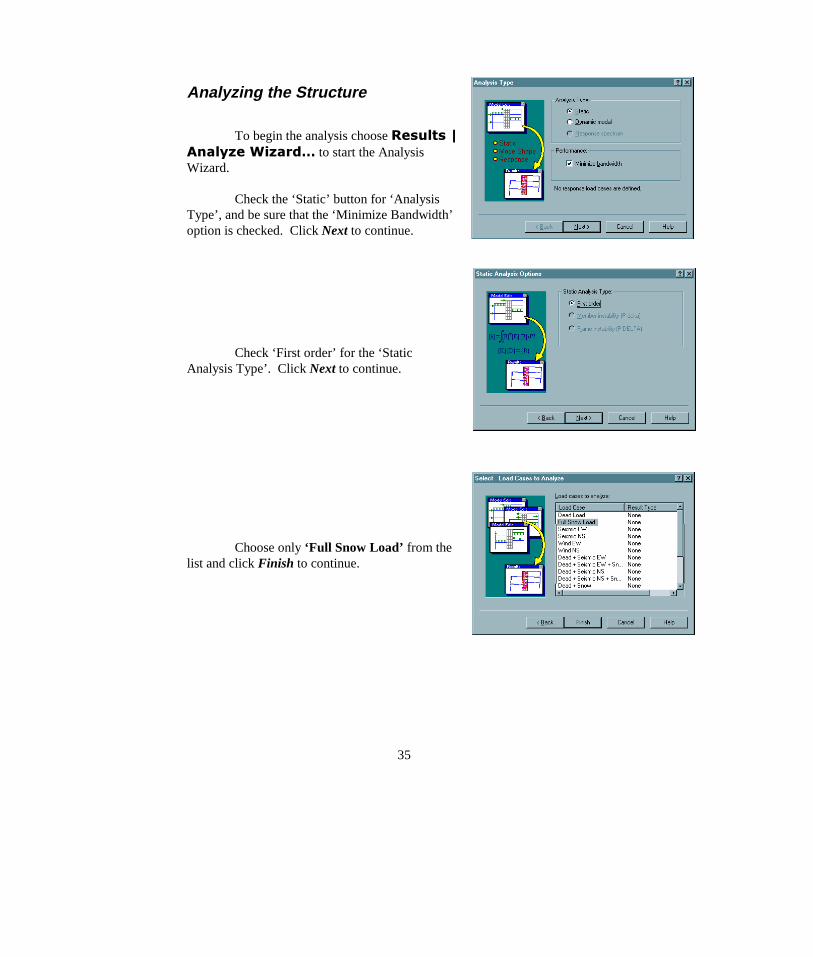
Analyzing the Structure
To begin the analysis choose 5HVXOWV�_$QDO\]H�:L]DUG« to start the AnalysisWizard.
Check the ‘Static’ button for ‘AnalysisType’, and be sure that the ‘Minimize Bandwidth’option is checked. Click Next to continue.
Check ‘First order’ for the ‘StaticAnalysis Type’. Click Next to continue.
Choose only ‘Full Snow Load’ from thelist and click Finish to continue.
36
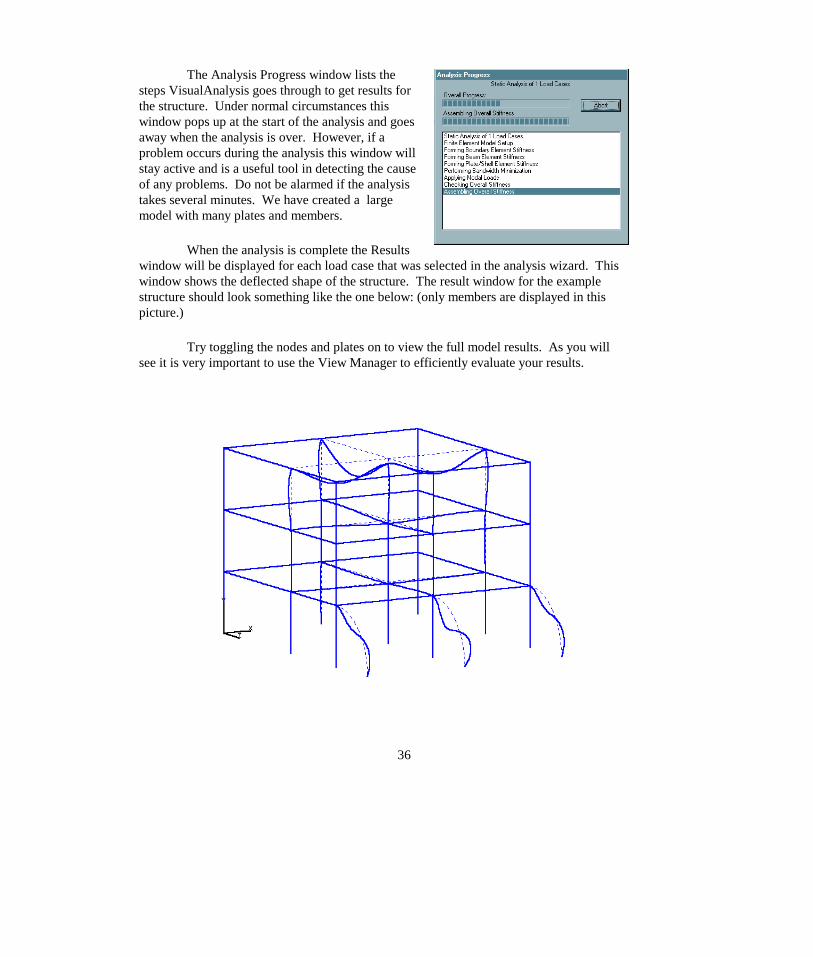
The Analysis Progress window lists thesteps VisualAnalysis goes through to get results forthe structure. Under normal circumstances thiswindow pops up at the start of the analysis and goesaway when the analysis is over. However, if aproblem occurs during the analysis this window willstay active and is a useful tool in detecting the causeof any problems. Do not be alarmed if the analysistakes several minutes. We have created a largemodel with many plates and members.
When the analysis is complete the Resultswindow will be displayed for each load case that was selected in the analysis wizard. Thiswindow shows the deflected shape of the structure. The result window for the examplestructure should look something like the one below: (only members are displayed in thispicture.)
Try toggling the nodes and plates on to view the full model results. As you willsee it is very important to use the View Manager to efficiently evaluate your results.
37
Reporting Results
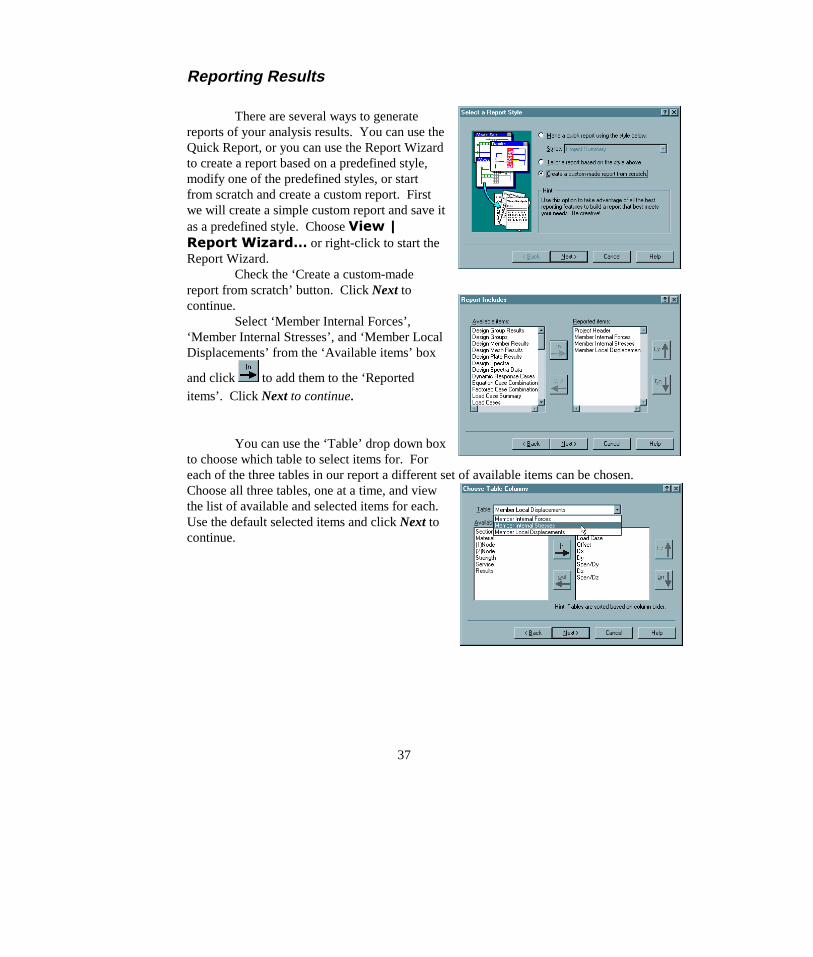
There are several ways to generatereports of your analysis results. You can use theQuick Report, or you can use the Report Wizardto create a report based on a predefined style,modify one of the predefined styles, or startfrom scratch and create a custom report. Firstwe will create a simple custom report and save itas a predefined style. Choose 9LHZ�_5HSRUW�:L]DUG« or right-click to start theReport Wizard.
Check the ‘Create a custom-madereport from scratch’ button. Click Next tocontinue.
Select ‘Member Internal Forces’,‘Member Internal Stresses’, and ‘Member LocalDisplacements’ from the ‘Available items’ box
and click to add them to the ‘Reporteditems’. Click Next to continue.
You can use the ‘Table’ drop down boxto choose which table to select items for. Foreach of the three tables in our report a different set of available items can be chosen.Choose all three tables, one at a time, and viewthe list of available and selected items for each.Use the default selected items and click Next tocontinue.
38
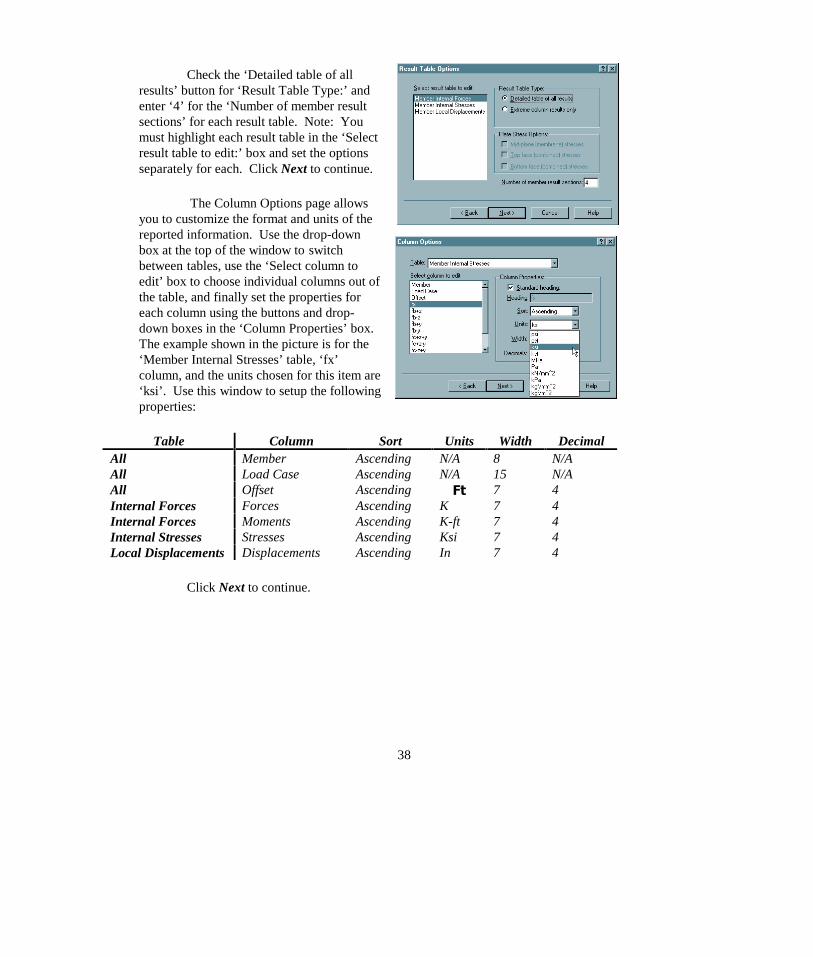
Check the ‘Detailed table of allresults’ button for ‘Result Table Type:’ andenter ‘4’ for the ‘Number of member resultsections’ for each result table. Note: Youmust highlight each result table in the ‘Selectresult table to edit:’ box and set the optionsseparately for each. Click Next to continue.
The Column Options page allowsyou to customize the format and units of thereported information. Use the drop-downbox at the top of the window to switchbetween tables, use the ‘Select column toedit’ box to choose individual columns out ofthe table, and finally set the properties foreach column using the buttons and drop-down boxes in the ‘Column Properties’ box.The example shown in the picture is for the‘Member Internal Stresses’ table, ‘fx’column, and the units chosen for this item are‘ksi’. Use this window to setup the followingproperties:
Table Column Sort Units Width DecimalAll Member Ascending N/A 8 N/AAll Load Case Ascending N/A 15 N/AAll Offset Ascending )W 7 4Internal Forces Forces Ascending K 7 4Internal Forces Moments Ascending K-ft 7 4Internal Stresses Stresses Ascending Ksi 7 4Local Displacements Displacements Ascending In 7 4
Click Next to continue.
39
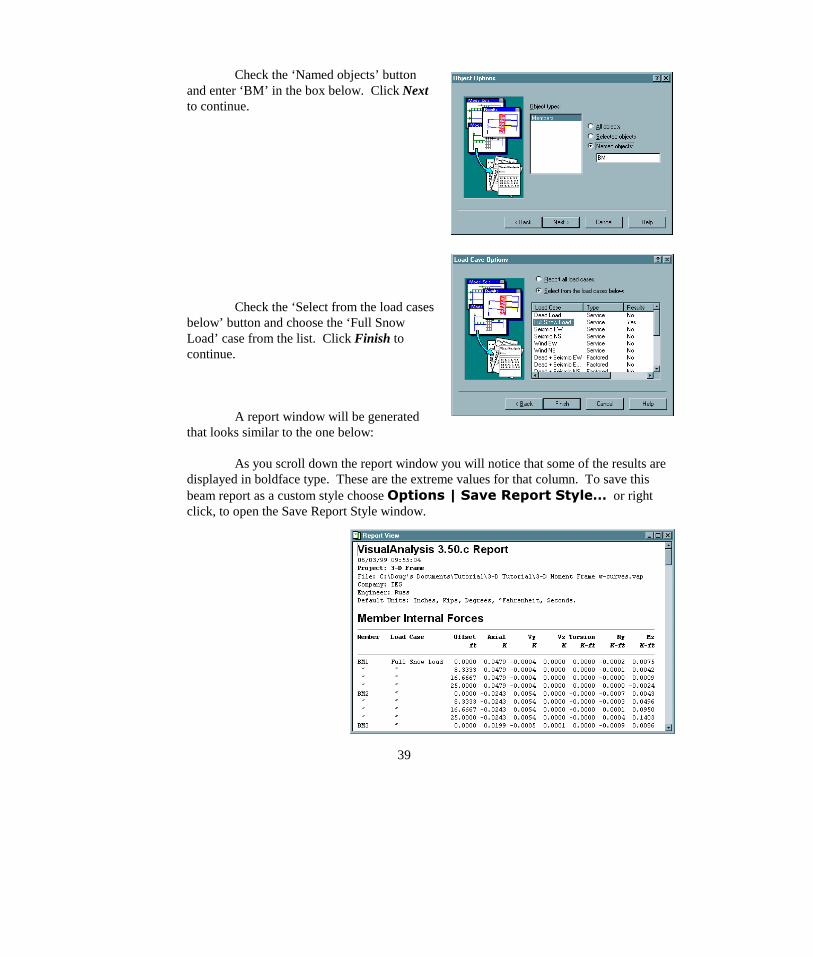
Check the ‘Named objects’ buttonand enter ‘BM’ in the box below. Click Nextto continue.
Check the ‘Select from the load casesbelow’ button and choose the ‘Full SnowLoad’ case from the list. Click Finish tocontinue.
A report window will be generatedthat looks similar to the one below:
As you scroll down the report window you will notice that some of the results aredisplayed in boldface type. These are the extreme values for that column. To save thisbeam report as a custom style choose 2SWLRQV�_�6DYH�5HSRUW�6W\OH« or rightclick, to open the Save Report Style window.
40
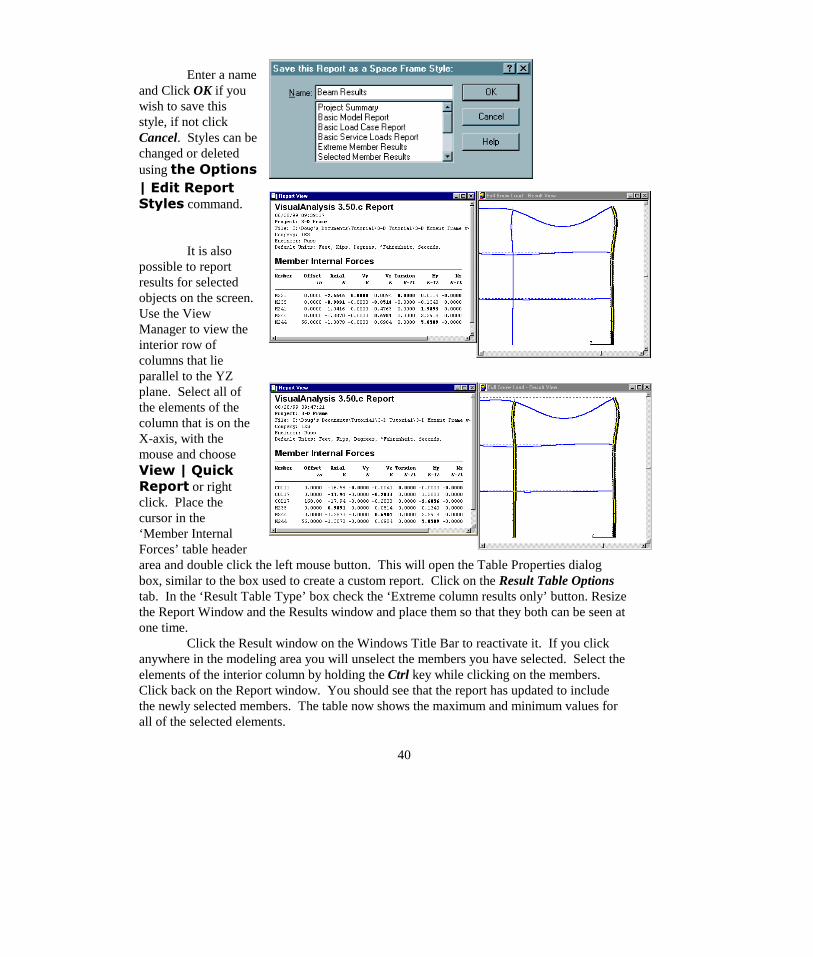
Enter a nameand Click OK if youwish to save thisstyle, if not clickCancel. Styles can bechanged or deletedusing WKH�2SWLRQV_�(GLW�5HSRUW6W\OHV command.
It is alsopossible to reportresults for selectedobjects on the screen.Use the ViewManager to view theinterior row ofcolumns that lieparallel to the YZplane. Select all ofthe elements of thecolumn that is on theX-axis, with themouse and choose9LHZ�_�4XLFN5HSRUW or rightclick. Place thecursor in the‘Member InternalForces’ table headerarea and double click the left mouse button. This will open the Table Properties dialogbox, similar to the box used to create a custom report. Click on the Result Table Optionstab. In the ‘Result Table Type’ box check the ‘Extreme column results only’ button. Resizethe Report Window and the Results window and place them so that they both can be seen atone time.
Click the Result window on the Windows Title Bar to reactivate it. If you clickanywhere in the modeling area you will unselect the members you have selected. Select theelements of the interior column by holding the Ctrl key while clicking on the members.Click back on the Report window. You should see that the report has updated to includethe newly selected members. The table now shows the maximum and minimum values forall of the selected elements.
41
Graphically Reporting Results
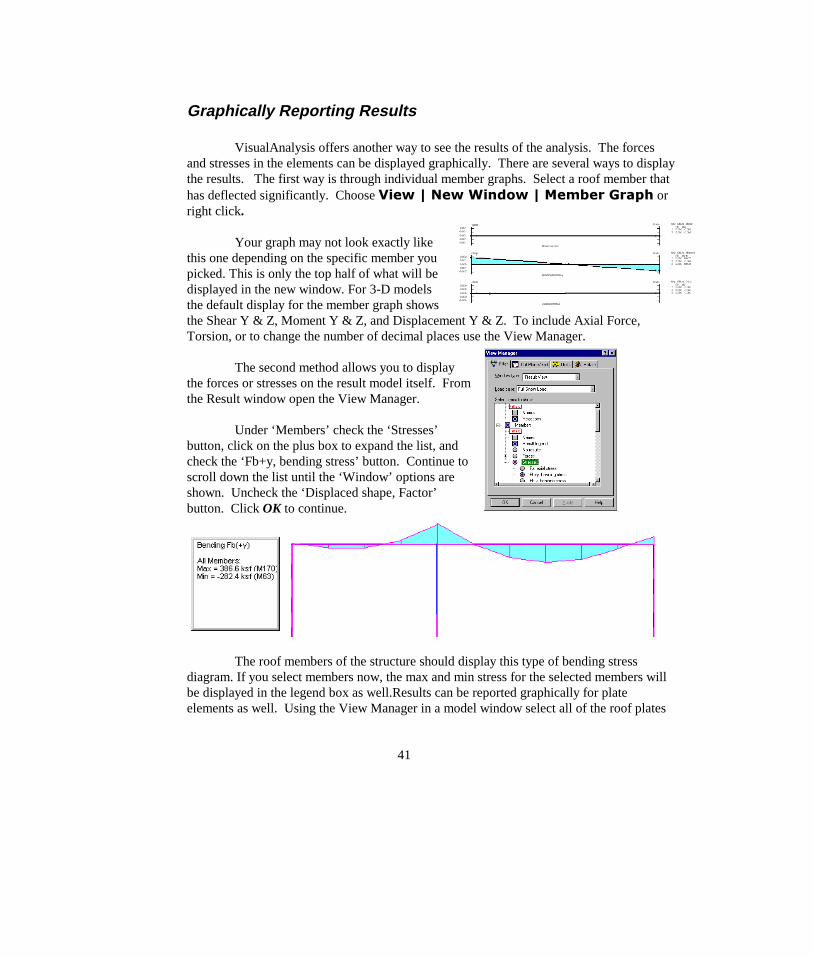
VisualAnalysis offers another way to see the results of the analysis. The forcesand stresses in the elements can be displayed graphically. There are several ways to displaythe results. The first way is through individual member graphs. Select a roof member thathas deflected significantly. Choose 9LHZ�_�1HZ�:LQGRZ�_�0HPEHU�*UDSK orright click.
Your graph may not look exactly likethis one depending on the specific member youpicked. This is only the top half of what will bedisplayed in the new window. For 3-D modelsthe default display for the member graph showsthe Shear Y & Z, Moment Y & Z, and Displacement Y & Z. To include Axial Force,Torsion, or to change the number of decimal places use the View Manager.
The second method allows you to displaythe forces or stresses on the result model itself. Fromthe Result window open the View Manager.
Under ‘Members’ check the ‘Stresses’button, click on the plus box to expand the list, andcheck the ‘Fb+y, bending stress’ button. Continue toscroll down the list until the ‘Window’ options areshown. Uncheck the ‘Displaced shape, Factor’button. Click OK to continue.
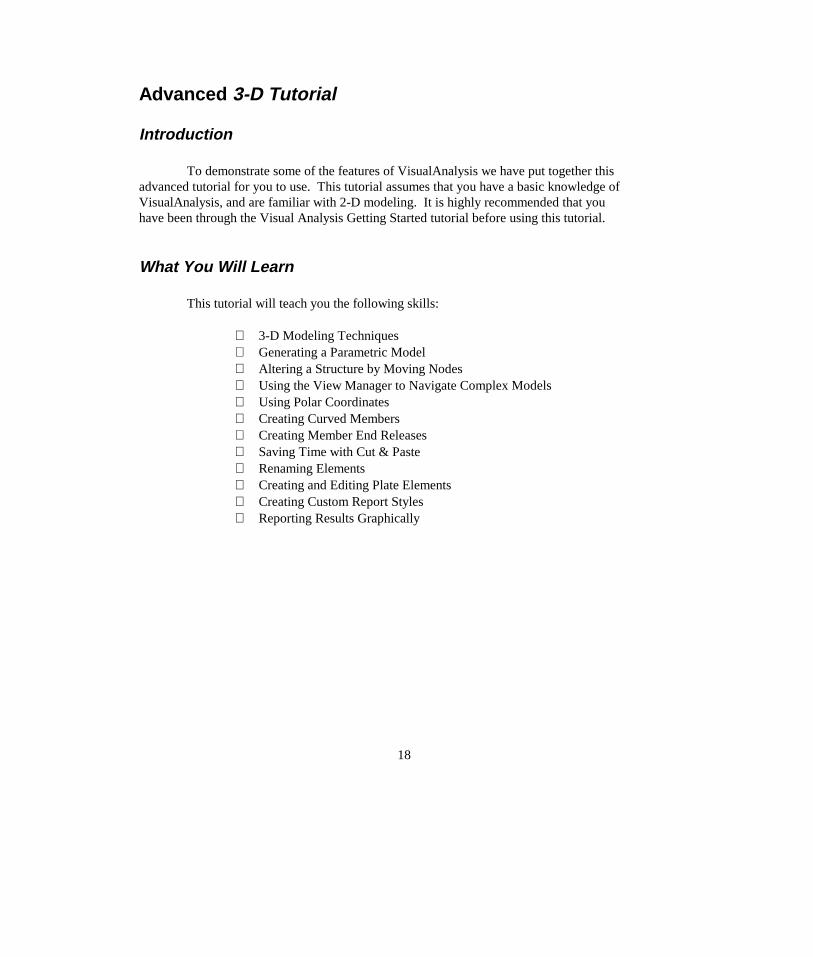
The roof members of the structure should display this type of bending stressdiagram. If you select members now, the max and min stress for the selected members willbe displayed in the legend box as well.Results can be reported graphically for plateelements as well. Using the View Manager in a model window select all of the roof plates
42
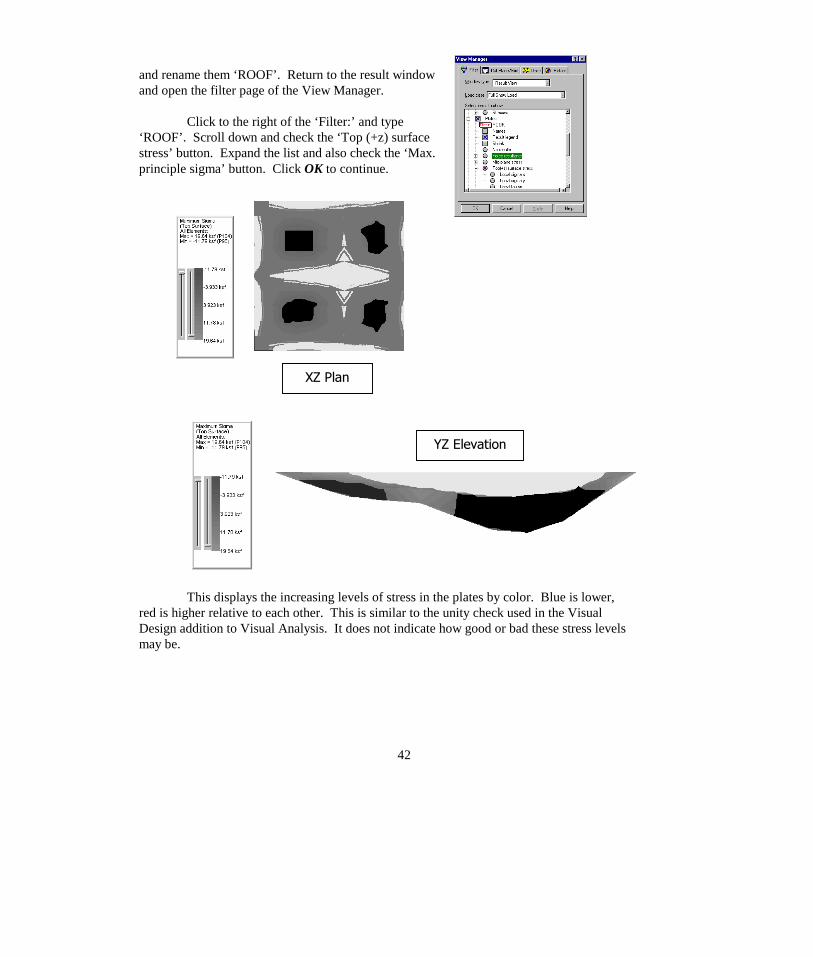
and rename them ‘ROOF’. Return to the result windowand open the filter page of the View Manager.
Click to the right of the ‘Filter:’ and type‘ROOF’. Scroll down and check the ‘Top (+z) surfacestress’ button. Expand the list and also check the ‘Max.principle sigma’ button. Click OK to continue.
This displays the increasing levels of stress in the plates by color. Blue is lower,red is higher relative to each other. This is similar to the unity check used in the VisualDesign addition to Visual Analysis. It does not indicate how good or bad these stress levelsmay be.
<=�(OHYDWLRQ
;=�3ODQ

43
Launch PointHopefully, this tutorial has given you some insights into the design and operation
of this VisualAnalysis. There is obviously much more to learn and explore!Often, the best way to learn is by experimenting. Please make use of the F1 key,
the on-line help system and the User’s Guide. Included with VisualAnalysis are a numberof example problems that you can try to recreate, or simply play with to discover how theprogram works. The examples are discussed in the User's Guide.