Embed Size (px)
Citation preview

© The Japan Society of Mechanical Engineers
Advance Publication by J-STAGE
Mechanical Engineering Journal
DOI:10.1299/mej.17-00009
Received date : 1 January, 2017
Accepted date : 22 May, 2017
J-STAGE Advance Publication date : 2 June, 2017
© The Japan Society of Mechanical Engineers
Abstract The technique of rapid evaluation of fatigue limit using infrared thermography was developed and has been paid attention during the past 30 years. This technique is beneficial because it also makes possible to detect the location of fatigue damage in real products. In the thermographic technique, the fatigue limit is determined based on the temperature evolution with the load amplitude. In this research, two methods for quantifying the temperature evolution from measured temperature variation (mean temperature rise and second harmonic amplitude) as well as two types of infrared camera (quantum and thermal type) are compared with each other in order to assess the applicability of the thermographic technique. Experiments are conducted for double edge notched specimens of type 304 stainless steel. A data processing technique developed by the authors recently is employed in order to determine the fatigue limit appropriately. The results of fatigue limit evaluation are compared with true fatigue limit. In conclusion, it is found that the second harmonic amplitude is not affected by heat conduction and provides sufficiently accurate result. In contrast, the mean temperature rise is affected by heat conduction and should not be applied to objects with high stress concentration. It is also shown that the thermal type camera is not sensitive enough to measure the second harmonic amplitude.
Key words : Fatigue limit, Infrared thermography, Dissipated energy, Notch, Stainless steel
1. Introduction
It is desirable to evaluate the fatigue limit of real engineering products in order to ensure safety and reliability against fatigue damage. However, fatigue test of real products is practically difficult to conduct because it requires huge cost, namely, a large number of loading cycles with a large number of specimens. Therefore, it is demanded to establish a low cost technique for evaluating the fatigue limit of real products.
Several techniques for rapid evaluation of the fatigue limit had been studied widely from the beginning of the 20th century. These techniques are based on the evolution of any physical quantity (for example, temperature, elastic modulus, electric resistance) with load amplitude. However, they are less reliable than the standard fatigue test using modern fatigue testing machines (Vitovec and Lazan, 1953) and hence are not applied in practice nowadays. In addition, they are basically developed for testing of specimens and are not readily applicable to real products.
On the other hand, a technique for rapid evaluation of the fatigue limit using infrared thermography has been developed and paid attention during the past 30 years (Inoue, 2011). Although this thermographic technique is based on the same principle as the techniques mentioned above, it has an advantage. Namely, it can visualize the temperature evolution and hence enables to detect location of fatigue damage within the test object. It should be emphasized that this advantage is beneficial especially in the application to real products.
The thermographic technique was proposed by Risitano et al. in 1986 (La Rosa and Risitano, 2000). A cyclic loading
Rapid evaluation of fatigue limit using infrared
quantifying temperature evolution
Ryogo KAWAI*, Takumi YOSHIKAWA*, Yu KUROKAWA*, Yousuke IRIE** and Hirotsugu INOUE* *Tokyo Institute of Technology
2-12-2 O-okayama, Meguro, Tokyo 152-8552, Japan
E-mail: [email protected]
**Panasonic Corporation, AVC Networks Company
1-15 Matsuo-cho, Kadoma City, Osaka 571-8504, Japan
thermography: comparison between two methods for

© The Japan Society of Mechanical Engineers
was applied to a steel specimen and the temperature variation of the specimen was measured with infrared thermography. Note that the temperature oscillates around mean value due to the thermoelastic effect. They observed that the mean temperature rise is negligibly small when the stress amplitude is lower than the fatigue limit while it gradually increases with loading cycle when the stress amplitude is higher than the fatigue limit. They categorized the mean temperature rise behavior into three phases: rising phase in the beginning of cyclic loading (Phase 1), constant phase after equilibrium (Phase 2), and rapid increasing phase just before the failure (Phase 3). Then they proposed a technique to evaluate the fatigue limit based on either the rate of mean temperature rise in Phase 1 or the mean temperature in Phase 2. Similar technique was also developed by Luong in 1992 (Luong, 1992). In contrast to Risitano’s technique, his technique considers the mean temperature rise not only above but also below the fatigue limit.
Brémond pointed out that it is possible to detect the plastic deformation due to cyclic loading by measuring the temperature amplitude at double the loading frequency (Brémond, 1995). The energy dissipation is mainly due to the plastic deformation and occurs at both loading and unloading processes of cyclic loading. Since the dissipated energy changes mostly into heat, it is possible to detect the plastic deformation by measuring the second harmonic amplitude of temperature variation. Note that the first harmonic amplitude of temperature variation corresponds to the sum of the principal stresses because of the thermoelastic effect. Later, Krapez et al. (1999) verified that the fatigue limit can be also evaluated by the second harmonic amplitude of the temperature variation.
As mentioned above, two methods are known for quantifying the temperature evolution: one is the mean temperature rise associated with cyclic loading and the other is the second harmonic amplitude of temperature variation during cyclic loading. The second harmonic amplitude is much smaller and hence more difficult to detect accurately than the mean temperature rise. There have been a number of reports on thermographic technique using one of the two methods. The fatigue limit evaluation based on the mean temperature rise was reported by Luong (1992, 1998), La Rosa and Risitano (2000), Curá et al. (2012), and De Finis et al. (2015). On the other hand, the fatigue limit evaluation based on the second harmonic amplitude was reported by Irie et al. (2010), and Akai et al. (2012). However, comparison between these two methods has been made only by Krapez et al. (1999, 2002).
For wider application of the thermographic technique, the cost of infrared camera should be also considered. The quantum type infrared camera with high sensitivity is usually needed to detect small temperature variation such as the second harmonic amplitude. However, the quantum type infrared camera is much more expensive and less portable than the thermal type infrared camera. On the other hand, the thermal type infrared camera is usually enough to detect the mean temperature rise. It is also worth to assess the applicability of these two type cameras to rapid evaluation of the fatigue limit.
In this research, combinations of two methods for quantifying the temperature evolution (mean temperature rise and second harmonic amplitude) and two types of infrared camera (quantum type and thermal type) are compared with each other in order to assess the applicability of the thermographic technique for rapid evaluation of the fatigue limit. 2. Experimental method
Type 304 stainless steel was used in this study as one of the typical engineering material. Double edge notched specimens with three different notch root radii R = 1.0, 2.0 and 5.0 mm (Fig. 1) were subjected to test. Table 1 summarizes the stress concentration factor and the “true” fatigue limit evaluated by conducting the standard fatigue test. The specimen surface was sprayed with matt black paint to make the emissivity high and uniform enough.
It is noted that specimen without notch was not considered in this study because applicability of the thermographic technique using both mean temperature rise and second harmonic amplitude to smooth specimen has been already verified so far and also because it is not the aim of this study to investigate the notch effect in fatigue of materials. In addition, it should be noted that the fatigue limit is evaluated in terms of load amplitude instead of stress amplitude in this study, because the aim of this study is to investigate the applicability of the thermographic technique not to materials but to real structures. The fatigue limit of materials must be evaluated by the standard fatigue test. Notched specimen can be considered as one of the simplest example of real structures.

© The Japan Society of Mechanical Engineers
Fig. 1 Type 304 stainless steel specimen with 1.0, 2.0 and 5.0 mm notch. (Thickness: 3 mm)
Table 1 Stress concentration factor and fatigue limit of specimen.
Notch root radius [mm] Stress concentration factor Fatigue limit [kN] 5 1.4 6.4 2 1.9 5.7 1 2.5 5.2
Sinusoidal tensile load was applied to the specimen with hydraulic servo fatigue testing machine (Shimadzu,
Servopulser EHF-L10kN or EHF-FB10kN), where the stress ratio was zero. The load amplitude was increased from zero to a specified value (8.0 kN) with a constant increment (0.1 or 0.2 kN). At each load amplitude, the specimen was applied cyclic loading (750 or 525 cycles) and the temperature variation was measured using a quantum type infrared camera (Cedip, Silver 480M) or a thermal type infrared camera (Optris, PI 450). Tables 2 and 3 show specification and experimental condition for each camera.
The loading frequency was determined by considering the performance of the testing machine and the infrared camera. The testing machine can apply cyclic loading to the specimen up to 25 Hz at the highest load amplitude (8.0 kN). The quantum type camera can measure the temperature variation accurately at frequency more than 50 Hz while the thermal type camera only up to 10 Hz. As a result, in order to measure the second harmonic amplitude of temperature variation, the loading frequency was set to 25 Hz and 5 Hz for quantum and thermal type camera, respectively.
Excessive temperature rise of the specimen due to cyclic loading was taken care in order to avoid its influence on the fatigue limit evaluation. An interval time of 180 s was taken between every consecutive cyclic loadings. In the experiment with the quantum type camera, the temperature rise was only about 3 K for R = 1.0 mm specimen during the test (80 steps of load amplitudes from 0.1 kN to 8.0 kN, namely 4 hours and 37 minutes). In the experiment of the thermal type camera, it was only about 2 K for R = 1.0 mm specimen during the test (40 steps of load amplitudes from 0.2 to 8.0 kN, namely 3 hours and 10 minutes). Therefore, the temperature rise due to the cyclic loading should have little influence on the fatigue limit in this experiment.
The temperature drift was not negligible for the thermal type camera. In order to compensate for the drift, the average temperature variation over an area outside the specimen was subtracted from the temperature variation inside the specimen. This subtraction was applied to all data measured by the thermal type camera.
b = 3 mm
B = 7.5 mm
70 mm
140 mm
b = 3 mm
B = 7.5 mm
70 mm
140 mm
b = 3 mm
B = 7.5 mm
70 mm
140 mm

© The Japan Society of Mechanical Engineers
Table 2 Specification of infrared camera. Quantum type Thermal type
Infrared sensor InSb Microbolometer Pixel size 320 × 256 382 × 288
Cooling system Stirling cooler None NETD [mK] 20 40
Maximum frame rate [Hz] 400 80
Table 3 Experimental condition. Infrared camera Quantum type Thermal type Frame rate [Hz] 249 80
Fatigue testing machine EHF-L10kN EHF-FB10kN Loading frequency [Hz] 25 5
Stress ratio 0 0 Increment of load amplitude [kN] 0.1 0.2
Number of cycles at each load amplitude
750 525
3. Data processing
In the thermographic technique, the fatigue limit is usually determined by detecting the change of increasing rate of the temperature evolution against the load amplitude. However, in order to detect this “knee point” appropriately, a data processing technique developed by the authors recently (Kawai et al, 2015) was employed. The features of this data processing technique are as follows:
(1) The fundamental harmonic amplitude of the temperature variation (corresponding to the sum of the principal stresses because of the thermoelastic effect) is taken instead of the load amplitude.
(2) The temperature evolutions below and above the knee point are curve fitted by a quadratic and a linear function of the fundamental harmonic amplitude of the temperature variation, respectively.
(3) The best knee point is determined uniquely by the least squares concept (Hayabusa et al, 2011). In addition, inappropriate data are omitted by applying the adjusted R-squared concept.
(4) This process can be conducted without any human judgement and hence the knee point (namely the fatigue limit) can be determined automatically if appropriate experimental data are available. 4. Results
Figure 2 shows a temperature distribution (snapshot) obtained by the quantum type camera at 6 kN load amplitude for R = 5.0 mm specimen. The fatigue limit was evaluated using the temperature variation data obtained at the notch root shown in Fig. 2. Similar pixel was selected in all cases.
Fig. 2 The pixel used for fatigue limit evaluation.
304.5
302
302.5
303
303.5
304
200
6080
100120140160180
240100 120 140 160 180 200 220
Evaluation PointTemperature [K
]
X [pixel]
Y [p
ixel
]

© The Japan Society of Mechanical Engineers
Figure 3 shows temperature variation measured by each camera at load amplitude of 8.0 kN for R = 1 mm specimen. It is observed that the mean temperature increases gradually with time and also that the temperture oscillates around the mean temperature due to the thermoelastic effect. For the quantum type camera, the mean temperature gradient instead of the mean temperature rise was evaluated by the increasing rate of mean temperature in the range from 22 to 30 s before reaching equilibrium (Phase 1) as shown in Fig. 3(a). On the other hand, for the thermal type camera, the mean temperature rise was evaluated by the difference between mean temperatures before starting the cyclic loading and after reaching equilibrium (Phase 2). The mean temperature after reaching equilibrium was determined by average temperature in the range from 80 to 105 s as shown in Fig. 3(b). The second harmonic amplitude was evaluated by Fourier transform of the temperature variation in the same range for each type camera.
(a) Quantum type
(b) Thermal type
Fig. 3 Temperature variation measured at the notch root (8.0 kN load amplitude, R = 1.0 mm).
Figure 4 shows the temperature amplitude spectrum obtained by each type camera at load amplitude of 7 kN for R = 5.0 mm specimen. As shown in Figs. 4(a) and (c), the fundamental harmonic amplitude is clearly detected by both type cameras. However, as shown in Figs. 4(b) and (d), the second harmonic amplitude is detected only by the quantum type camera. It is difficult to detect the second harmonic amplitude by the thermal type camera. From result of preliminary experiment, it was found that the second harmonic amplitude was detected successfully with the quantum type camera at loading frequency 10 Hz. Therefore, it is considered that the second harmonic amplitude can be also detected with the quantum type camera even at loading frequency 5 Hz. Thus, the difficulty in detecting the second harmonic amplitude by the thermal type camera is not due to the low loading frequency but insufficient sensitivity.
307
304
305
306
320 5 10 15 20 25 30
Phase 1
Time [s]
Tem
pera
ture
[K]
2.5
-0.50
0.51
1.52
110-5 0 10 20 30 40 50 60 70 80 90 100
Phase 1 Phase 2
Time [s]
Mea
n te
mpe
ratu
re ri
se [K
]

© The Japan Society of Mechanical Engineers
(a) Quantum type (b) Quantum type (Enlarged)
(c) Thermal type (d) Thermal type (Enlarged)
Fig. 4 Frequency spectrum of temperature variation (7 kN load amplitude, R = 5.0 mm).
The temperature distributions (snapshots) obtained by both type cameras at several load amplitudes for R = 5.0 mm specimen are shown in Figs. 5 and 6, respectively. In every cases, temperature gradient along the longitudinal direction of the specimen is observed. This is caused by the heat generated by the actuator of the testing machine because the actuator is located below the specimen for the thermal type camera and vice versa for the quantum type camera. Apart from that, little temperature rise is observed around the notch when the load amplitude is lower than the fatigue limit (6.4 kN). On the other hand, when the load amplitude is higher than the fatigue limit, a temperature rise is clearly observed around the notch.
Figure 7 shows the second harmonic amplitude distribution obtained by the quantum type camera for the same cases. The second harmonic amplitude around the notch increases gradually with the load amplitude even lower than the fatigue limit. This suggests that the second harmonic amplitude is more sensitive to detect the energy dissipation than the mean temperature rise. It is also noted that the second harmonic amplitude is almost uniformly distributed over the specimen except for the notch area. This means that the second harmonic amplitude is not influenced very much by the heat conduction inside the specimen.
The knee point was evaluated for each specimen by applying the data processing technique developed by the authors recently (Kawai et al, 2015). Figure 8 shows examples of curve fitting for determining the knee point of R = 2.0 mm specimen. The open circular marks represent data excluded according to the adjusted R-squared concept. The knee point is determined as the cross point of the quadratic curve (red) and the linear curve (blue). It is clear that the knee point is determined successfully except for the second harmonic amplitude obtained by the thermal type camera.
Figure 9 shows comparison between the fatigue limits evaluated by different techniques and cameras. Each result is average value for three specimens. The black line shows the “true” fatigue limit for each notch radius. The fatigue limit evaluated by the second harmonic amplitude obtained by the quantum type camera coincides well with the true fatigue limit for all specimens tested. On the other hand, the fatigue limit evaluated by the mean temperature rise is rather close to the true fatigue limit only for R = 5.0 mm specimen but is much larger for R = 2.0 and 1.0 mm specimens regardless of camera type.
Tem
pera
ture
am
plitu
de [K
]
Frequency [Hz]
0.6
00.10.20.30.40.5
600 10 20 30 40 50
0.05
00.01
0.020.03
0.04
600 10 20 30 40 50Tem
pera
ture
am
plitu
de [K
]
Frequency [Hz]
0.6
00.10.20.30.40.5
150 2.5 5 7.5 10 12.5
Tem
pera
ture
am
plitu
de [K
]
Frequency [Hz]
0.05
00.01
0.020.03
0.04
150 2.5 5 7.5 10 12.5Tem
pera
ture
am
plitu
de [K
]Frequency [Hz]

© The Japan Society of Mechanical Engineers
(a) 2 kN (b) 4 kN
(c) 6 kN (d) 8 kN
Fig. 5 Temperature distribution (snapshots) obtained by thermal type camera (R = 5.0 mm).
(a) 2 kN (b) 4 kN
(c) 6 kN (d) 8 kN
Fig. 6 Temperature distribution (snapshots) obtained by quantum type camera (R = 5.0 mm).
Mean tem
perature rise [K]
X [pixel]
Y [p
ixel
] 1.5
-1
-0.5
0
0.5
1
200
100
120
140
160
180
240140 160 180 200 220
Mean tem
perature rise [K]
X [pixel]
Y [p
ixel
]
1.5
-1
-0.5
0
0.5
1
200
100
120
140
160
180
240140 160 180 200 220
Mean tem
perature rise [K]
X [pixel]
Y [p
ixel
]
1.5
-1
-0.5
0
0.5
1
200
100
120
140
160
180
240140 160 180 200 220
Mean tem
perature rise [K]
X [pixel]
Y [p
ixel
]
1.5
-1
-0.5
0
0.5
1
200
100
120
140
160
180
240140 160 180 200 220
Temperature [K
]
X [pixel]
Y [p
ixel
]
306
301
302
303
304
305
200
6080
100120140160180
240100 120 140 160 180 200 220
Temperature [K
]
X [pixel]
Y [p
ixel
]
306
301
302
303
304
305
200
6080
100120140160180
240100 120 140 160 180 200 220
Temperature [K
]
X [pixel]
Y [p
ixel
]
306
301
302
303
304
305
200
6080
100120140160180
240100 120 140 160 180 200 220
Temperature [K
]
X [pixel]
Y [p
ixel
]
306
301
302
303
304
305
200
6080
100120140160180
240100 120 140 160 180 200 220

© The Japan Society of Mechanical Engineers
(a) 2 kN (b) 4 kN
(c) 6 kN (d) 8 kN
Fig. 7 Second harmonic amplitude distribution measured by quantum type camera (R = 5.0 mm).
(a) Second harmonic amplitude, Quantum (b) Mean temerature rise, Quantum
(c) Second harmonic amplitude, Thermal (d) Mean temerature rise, Thermal
Fig. 8 Curve fitting for determining the fatigue limit (R = 2.0 mm).
The second harmonic
amplitude [m
K]
X [pixel]
Y [p
ixel
] 30
0
5
10
15
20
25
200
6080
100120140160180
240100 120 140 160 180 200 220
The second harmonic
amplitude [m
K]
X [pixel]
Y [p
ixel
]
30
0
5
10
15
20
25
200
6080
100120140160180
240100 120 140 160 180 200 220
The second harmonic
amplitude [m
K]
X [pixel]
Y [p
ixel
]
30
0
5
10
15
20
25
200
6080
100120140160180
240100 120 140 160 180 200 220
The second harmonic
amplitude [m
K]
X [pixel]
Y [p
ixel
]
30
0
5
10
15
20
25
200
6080
100120140160180
240100 120 140 160 180 200 220
100
020
4060
80
10 0.2 0.4 0.6 0.8The fundamental harmonic
amplitude [K]
The
seco
nd h
arm
onic
ampl
itude
[mK
]
0.4
0
0.1
0.2
0.3
10 0.2 0.4 0.6 0.8The fundamental harmonic
amplitude [K]
Mea
n te
mpe
ratu
re
grad
ient
[mK
/cyc
le]
40
0
10
20
30
10 0.2 0.4 0.6 0.8The fundamental harmonic
amplitude [K]
The
seco
nd h
arm
onic
ampl
itude
[mK
]
2
-0.50
0.51
1.5
10 0.2 0.4 0.6 0.8Mea
n te
mpe
ratu
re ri
se [K
]
The fundamental harmonicamplitude [K]
© The Japan Society of Mechanical Engineers
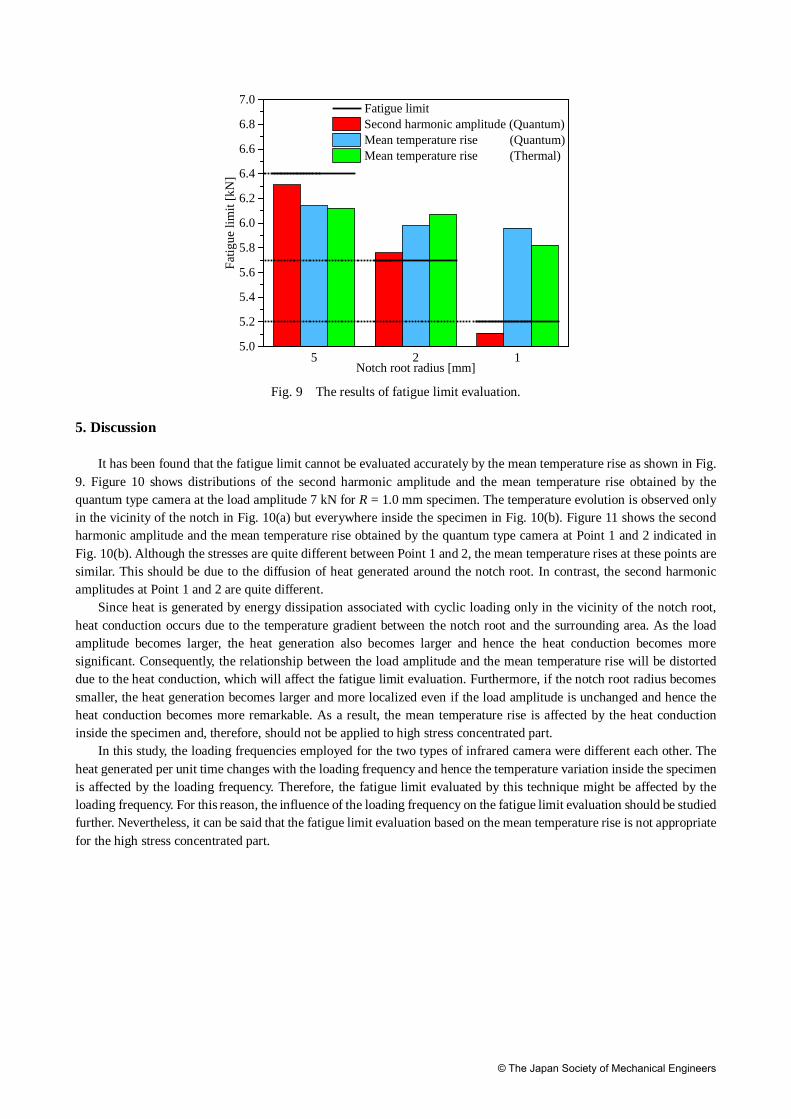
Fig. 9 The results of fatigue limit evaluation.
5. Discussion
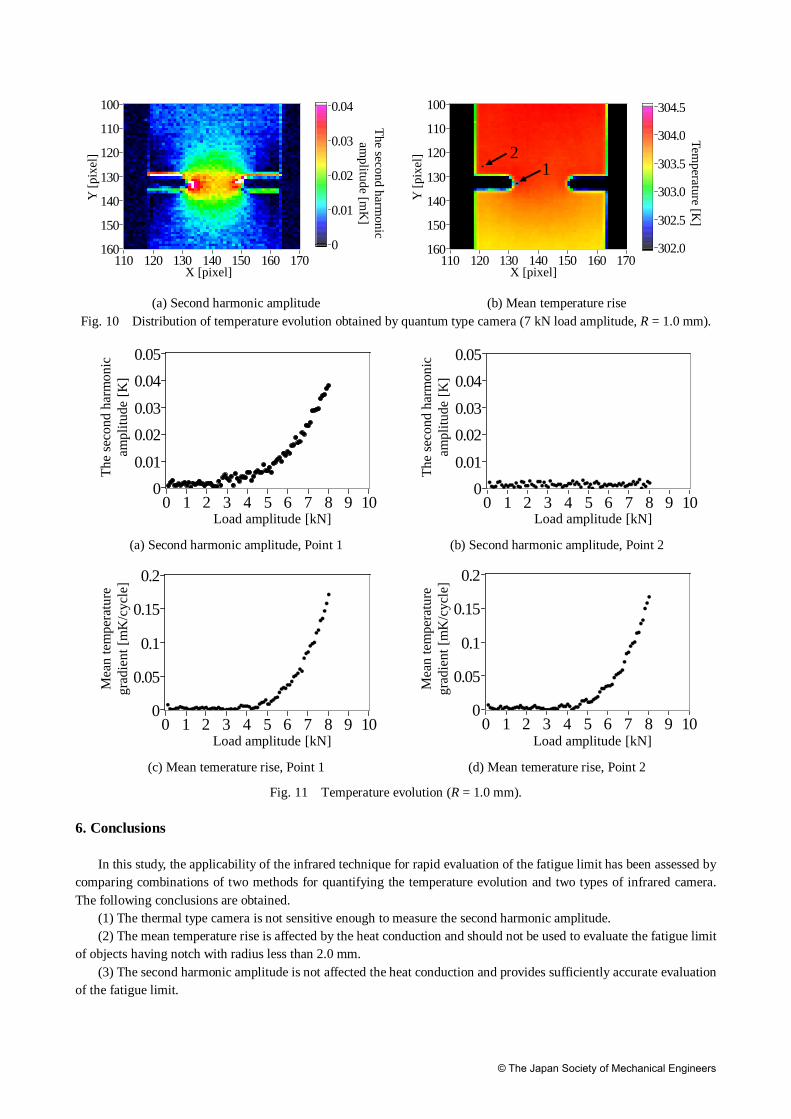
It has been found that the fatigue limit cannot be evaluated accurately by the mean temperature rise as shown in Fig. 9. Figure 10 shows distributions of the second harmonic amplitude and the mean temperature rise obtained by the quantum type camera at the load amplitude 7 kN for R = 1.0 mm specimen. The temperature evolution is observed only in the vicinity of the notch in Fig. 10(a) but everywhere inside the specimen in Fig. 10(b). Figure 11 shows the second harmonic amplitude and the mean temperature rise obtained by the quantum type camera at Point 1 and 2 indicated in Fig. 10(b). Although the stresses are quite different between Point 1 and 2, the mean temperature rises at these points are similar. This should be due to the diffusion of heat generated around the notch root. In contrast, the second harmonic amplitudes at Point 1 and 2 are quite different.
Since heat is generated by energy dissipation associated with cyclic loading only in the vicinity of the notch root, heat conduction occurs due to the temperature gradient between the notch root and the surrounding area. As the load amplitude becomes larger, the heat generation also becomes larger and hence the heat conduction becomes more significant. Consequently, the relationship between the load amplitude and the mean temperature rise will be distorted due to the heat conduction, which will affect the fatigue limit evaluation. Furthermore, if the notch root radius becomes smaller, the heat generation becomes larger and more localized even if the load amplitude is unchanged and hence the heat conduction becomes more remarkable. As a result, the mean temperature rise is affected by the heat conduction inside the specimen and, therefore, should not be applied to high stress concentrated part.
In this study, the loading frequencies employed for the two types of infrared camera were different each other. The heat generated per unit time changes with the loading frequency and hence the temperature variation inside the specimen is affected by the loading frequency. Therefore, the fatigue limit evaluated by this technique might be affected by the loading frequency. For this reason, the influence of the loading frequency on the fatigue limit evaluation should be studied further. Nevertheless, it can be said that the fatigue limit evaluation based on the mean temperature rise is not appropriate for the high stress concentrated part.
5 2 15.0
5.2
5.4
5.6
5.8
6.0
6.2
6.4
6.6
6.8
7.0 Fatigue limit
Second harmonic amplitude (Quantum) Mean temperature rise (Quantum) Mean temperature rise (Thermal)
Fatig
ue li
mit
[kN
]
Notch root radius [mm]
© The Japan Society of Mechanical Engineers
(a) Second harmonic amplitude (b) Mean temperature rise Fig. 10 Distribution of temperature evolution obtained by quantum type camera (7 kN load amplitude, R = 1.0 mm).
(a) Second harmonic amplitude, Point 1 (b) Second harmonic amplitude, Point 2
(c) Mean temerature rise, Point 1 (d) Mean temerature rise, Point 2
Fig. 11 Temperature evolution (R = 1.0 mm). 6. Conclusions
In this study, the applicability of the infrared technique for rapid evaluation of the fatigue limit has been assessed by comparing combinations of two methods for quantifying the temperature evolution and two types of infrared camera. The following conclusions are obtained.
(1) The thermal type camera is not sensitive enough to measure the second harmonic amplitude. (2) The mean temperature rise is affected by the heat conduction and should not be used to evaluate the fatigue limit
of objects having notch with radius less than 2.0 mm. (3) The second harmonic amplitude is not affected the heat conduction and provides sufficiently accurate evaluation
of the fatigue limit.
The second harmonic
amplitude [m
K]
X [pixel]
Y [p
ixel
] 0.04
0
0.01
0.02
0.03
160
100
110
120
130
140
150
170110 120 130 140 150 160
Temperature [K
]
X [pixel]
Y [p
ixel
]
304.5
302.0
302.5
303.0
303.5
304.0
160
100
110
120
130
140
150
170110 120 130 140 150 160
12
Load amplitude [kN]
The
seco
nd h
arm
onic
ampl
itude
[K]
0.05
00.01
0.020.03
0.04
100 1 2 3 4 5 6 7 8 9Load amplitude [kN]
The
seco
nd h
arm
onic
ampl
itude
[K]
0.05
00.01
0.020.03
0.04
100 1 2 3 4 5 6 7 8 9
Load amplitude [kN]
Mea
n te
mpe
ratu
re
grad
ient
[mK
/cyc
le] 0.2
0
0.05
0.1
0.15
100 1 2 3 4 5 6 7 8 9
0.2
0
0.05
0.1
0.15
100 1 2 3 4 5 6 7 8 9Load amplitude [kN]
Mea
n te
mpe
ratu
re
grad
ient
[mK
/cyc
le]

© The Japan Society of Mechanical Engineers
References Akai, A., Shiozawa, D. and Sakagami, T., Fatigue limit evaluation for austenitic stainless steel, Journal of Society of
Materials Science, Vo. 61, No. 12 (2012), pp.953-959 (in Japanese). Brémond, P., La thermographie infraroude pour voir les contraintes, Mesures, No.673 (1995), pp.53–56. Curá, F., Gallinatti, A. E. and Sesana, R., Dissipative aspects in thermographic methods, Fatigue & Fracture of
Engineering Materials & Structures, Vol. 35 (2012), pp.1133-1147. De Finis, R., Palumbo, D., Ancona, F. and Galietti, U., Fatigue limit evaluation of various martensitic stainless steels
with new robust thermographic data analysis, International Journal of Fatigue, Vol. 74 (2015), pp.88-96. Hayabusa, K., Nakamoto, H., Inaba, K. and Kishimoto, K., Evaluation on rotational bending fatigue limits using
thermography, Ebara Engineering Review, No.230 (2011), pp.3–6 (in Japanese). Inoue, H., Rapid evaluation of fatigue limits using infrared thermography, Journal of JSNDI, Vol.60 (2011), pp.322–327
(in Japanese). Irie, Y., Inoue, H., Mori, T. and Takao, M., Evaluation fatigue limit of notched specimen by measurement of dissipated
energy, Transactions of the Japan Society of Mechanical Engineers, Series A, Vol. 76 (2010), pp.410-412 (in Japanese).
Kawai, R., Kurokawa, Y., Irie, Y. and Inoue, H., Reliability improvement of fatigue limit evaluation method based on temperature variation measurement, Proceedings of the JSME M&M 2015 Conference, No.15-6 (2015), Paper No. OS0404-327 (in Japanese).
Krapez, J-C., Pacou, D. and Bertin, C., Application of lock-in thermography to rapid evaluation of fatigue limit in metals, Proceedings of the 5th International Workshop on Advanced Infrared Technology and Applications, Venice, Italy (1999), pp.379–385.
Krapez, J-C. and Pacou, D., Thermography detection of early thermal effects during fatigue tests of steel and aluminium samples, AIP Conference Proceedings, Vol. 615 (2002), pp.1545–1552.
La Rosa, G. and Risitano, A., Thermographic methodology for rapid determination of the fatigue limit of materials and mechanical components, International Journal of Fatigue, Vol.22, No.1 (2000), pp.65–73.
Luong, M.P., Infrared thermography of fatigue in metals, Proceedings of SPIE, Vol.1682 (1992), pp.222–233. Luong, M.P., Fatigue limit evaluation of metals using as infrared thermographic technique, Mechanics of Materials, Vol.
28 (1998), pp.155-163. Vitovec, F. H. and Lazan, B. J., Review of previous work on short-time tests for predicting fatigue properties of materials,
WADC Technical Report, No.53-122 (1953), Wright Air Development Center.