Embed Size (px)
Citation preview
Adults’ Media Use and Attitudes
Report 2017
0

Content
1
56
59
60
51
57
57
56
20
22
22
29
27
26
25
13
12
11
11
9
8
13
5
4
4
4
4
5
3
5
3
4
5
3
4
3
2016
2015
2014
2012
2010
2007
2005
Strongly agree Slightly agree Neither/ Don't know Slightly disagree Strongly disagree
2
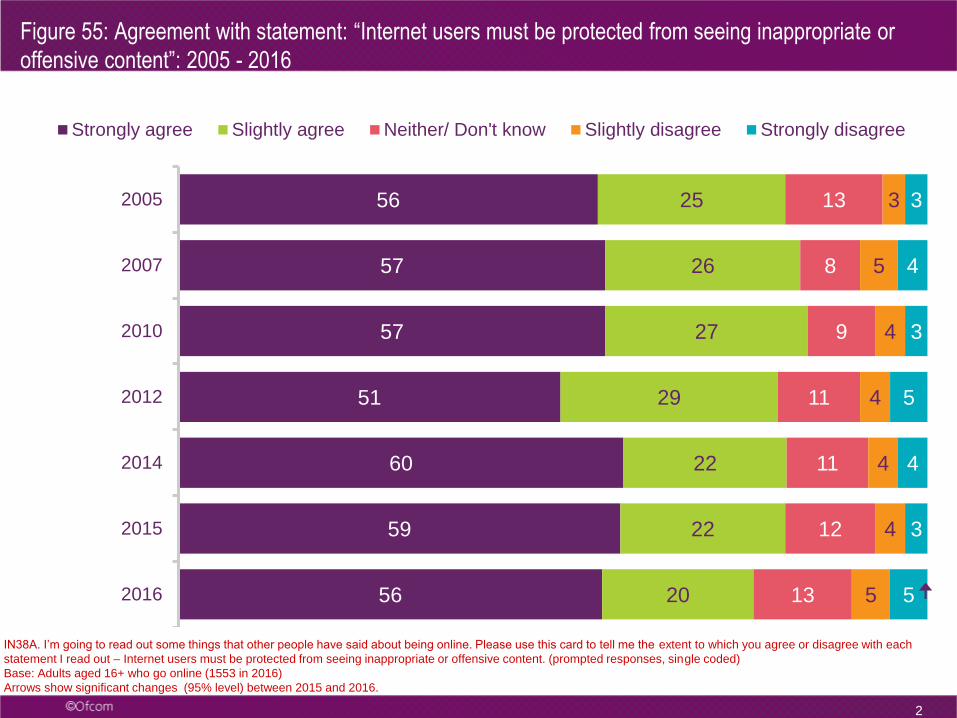
Figure 55: Agreement with statement: “Internet users must be protected from seeing inappropriate or
offensive content”: 2005 - 2016
IN38A. I’m going to read out some things that other people have said about being online. Please use this card to tell me the extent to which you agree or disagree with each
statement I read out – Internet users must be protected from seeing inappropriate or offensive content. (prompted responses, single coded)
Base: Adults aged 16+ who go online (1553 in 2016)
Arrows show significant changes (95% level) between 2015 and 2016.
70
4642
73
55
3430
54
40
2421
52
37
21 23
51
40
2421
49
39
2825
50
3530
23
3
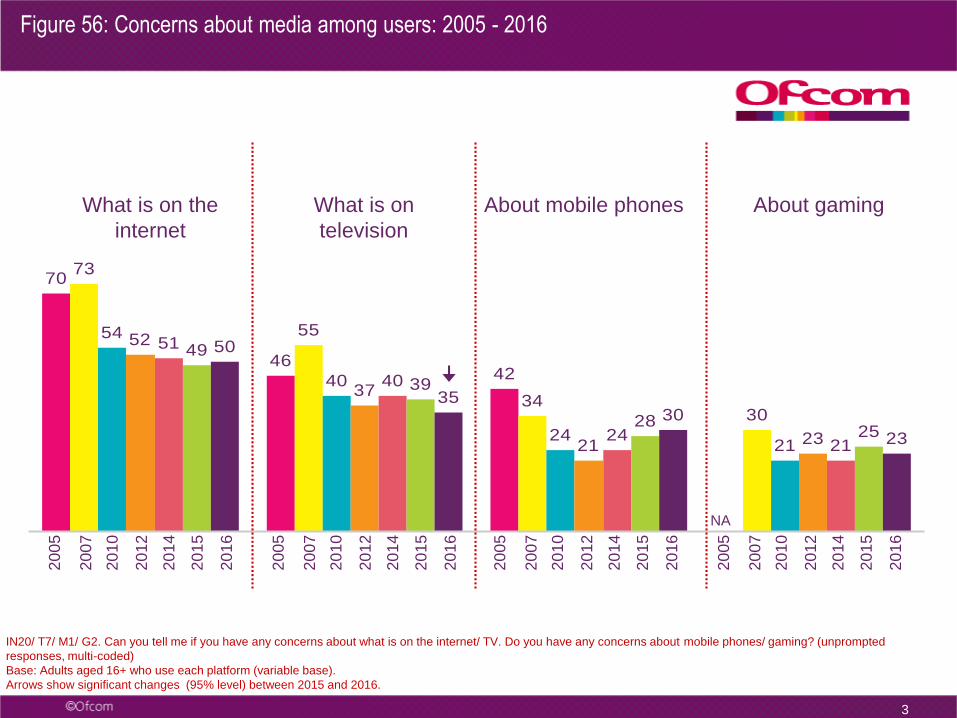
IN20/ T7/ M1/ G2. Can you tell me if you have any concerns about what is on the internet/ TV. Do you have any concerns about mobile phones/ gaming? (unprompted
responses, multi-coded)
Base: Adults aged 16+ who use each platform (variable base).
Arrows show significant changes (95% level) between 2015 and 2016.
NA
What is on
television
What is on the
internet
About mobile phones About gaming
Figure 56: Concerns about media among users: 2005 - 20162
00
5
20
10
20
12
20
14
20
15
20
16
20
07
20
05
20
10
20
12
20
14
20
15
20
16
20
07
20
05
20
10
20
12
20
14
20
15
20
16
20
07
20
05
20
10
20
12
20
14
20
15
20
16
20
07
4
40
22 24
72
37
19 22
7 4 2
40
2319
7 62
39
20 21
7 62
35
2016
6 5 2
Any concerns Harmful/offensive content
Quality ofcontent/ repeats
Advertising/sponsorship
Any diversity incontent
Don't trust/ fixed/biased
2010 2012 2014 2015 2016
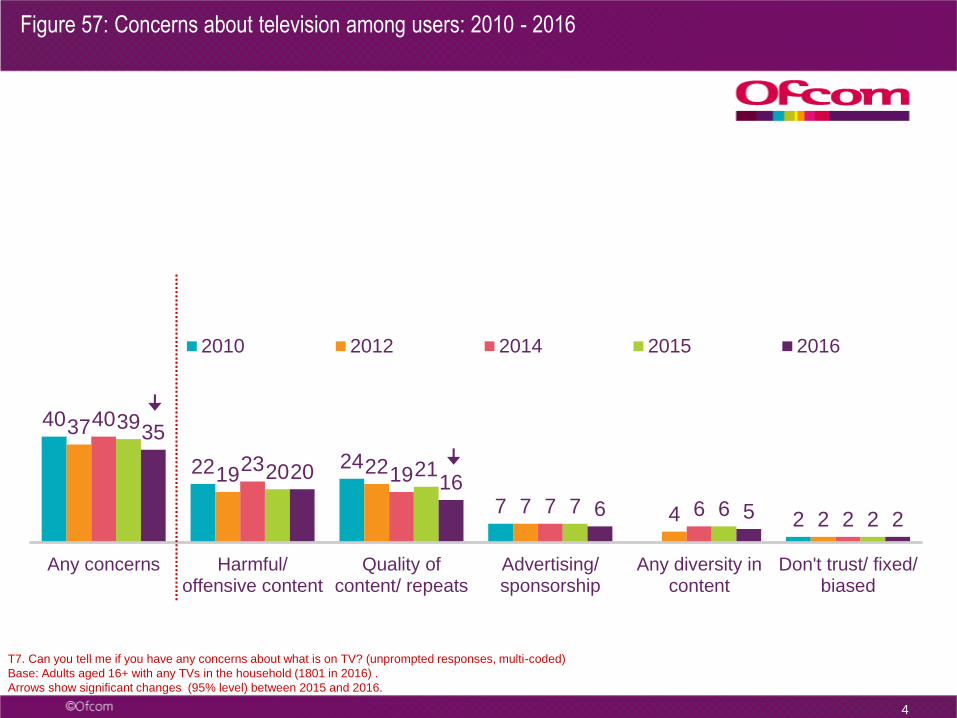
T7. Can you tell me if you have any concerns about what is on TV? (unprompted responses, multi-coded)
Base: Adults aged 16+ with any TVs in the household (1801 in 2016) .
Arrows show significant changes (95% level) between 2015 and 2016.
Figure 57: Concerns about television among users: 2010 - 2016
5
54
40
18 21
10 7
52
35
1725
9 9
51
38
2821
9 7
49
36
24 21
8 6
50
38
22 20
9 7
Any concerns Offensive/ illegalcontent
Risks to others/society
Security/ fraud Personal privacy Advertising
2010 2012 2014 2015 2016
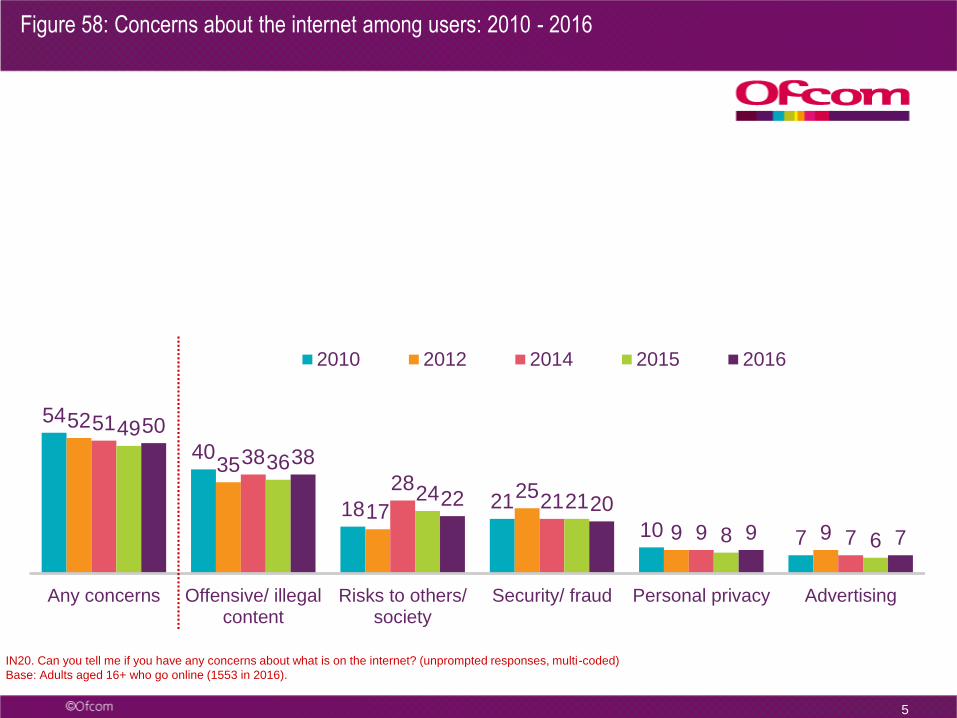
IN20. Can you tell me if you have any concerns about what is on the internet? (unprompted responses, multi-coded)
Base: Adults aged 16+ who go online (1553 in 2016).
Figure 58: Concerns about the internet among users: 2010 - 2016
6
21 162 6 2
2317
7 5 4
2113 8 5 5
2514
8 7 6
2311 8 7 6
Any concerns Offensive content Health Risks to others/ society Affordability
2010 2012 2014 2015 2016
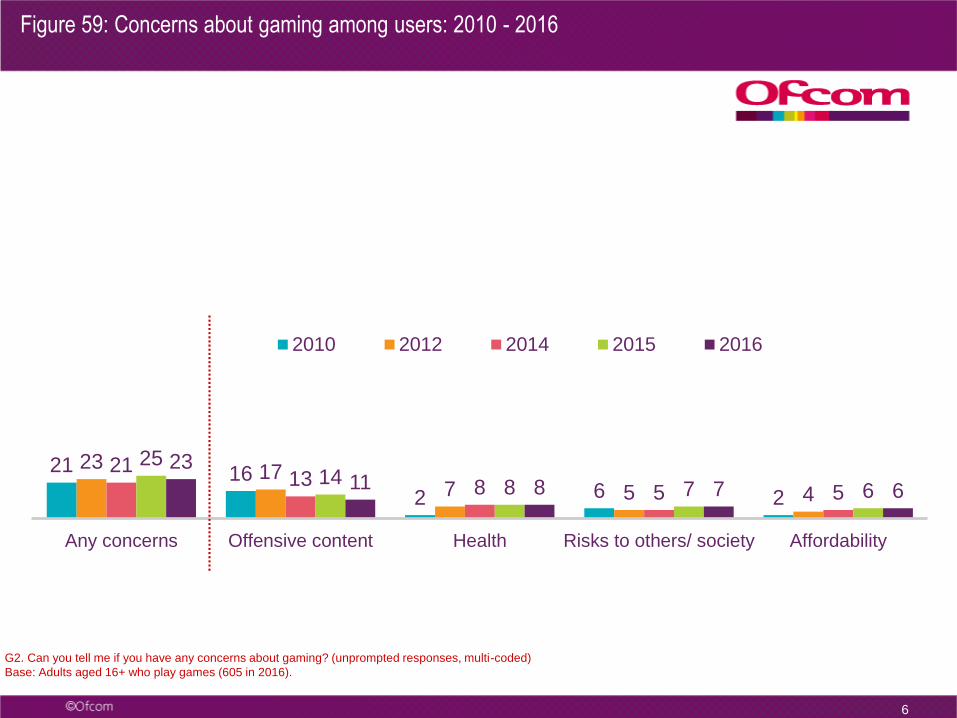
G2. Can you tell me if you have any concerns about gaming? (unprompted responses, multi-coded)
Base: Adults aged 16+ who play games (605 in 2016).
Figure 59: Concerns about gaming among users: 2010 - 2016
7
24
8 6 4 510
21
6 7 7 6 5
24
8 116 5 4
28
10 12 8 7 5
30
10 10 8 7 6
Any concerns Risks to others/society
Affordability Security/ fraud Privacy Health
2010 2012 2014 2015 2016
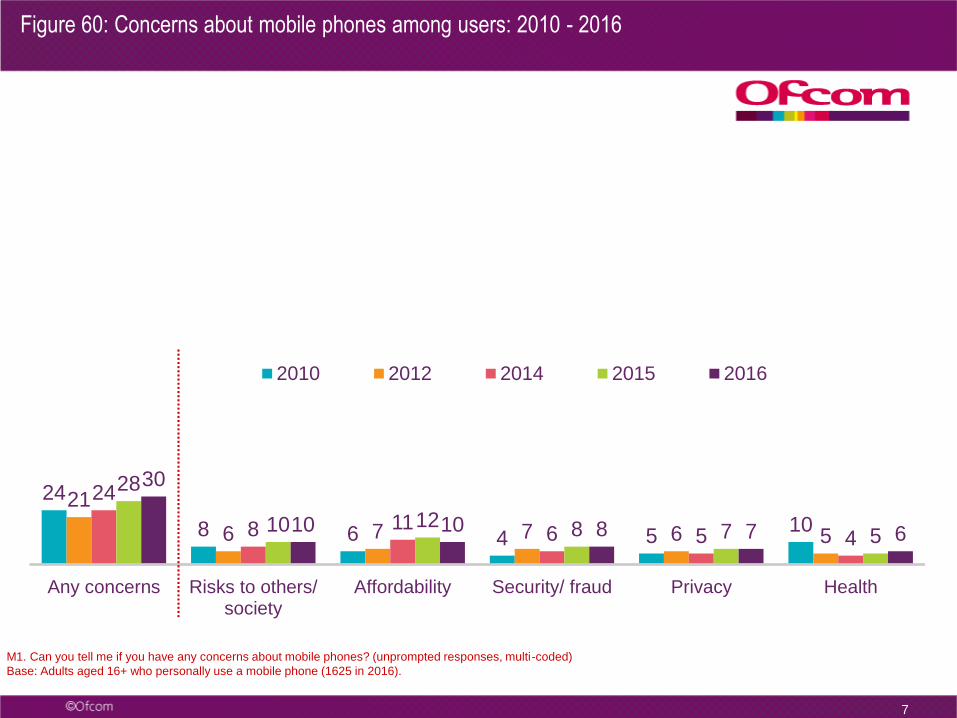
M1. Can you tell me if you have any concerns about mobile phones? (unprompted responses, multi-coded)
Base: Adults aged 16+ who personally use a mobile phone (1625 in 2016).
Figure 60: Concerns about mobile phones among users: 2010 - 2016
51
63
58
61
59
44
32
17
59
56
44
41
50
51
All adults
16-24
25-34
35-44
45-54
55-64
65-74
75+
AB
C1
C2
DE
Male
Female
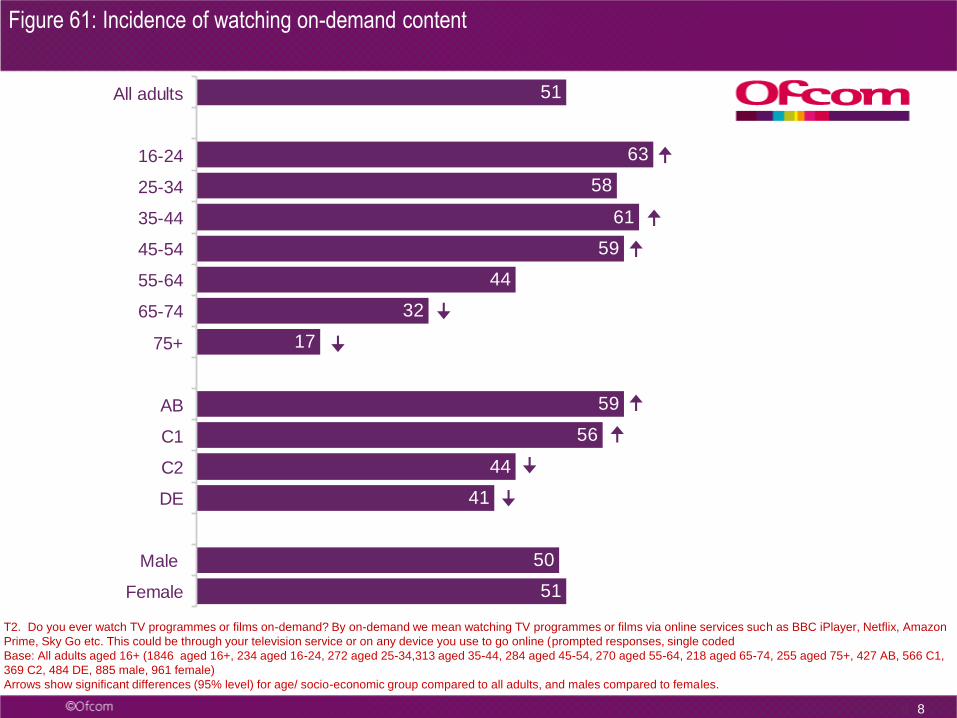
Figure 61: Incidence of watching on-demand content
8 8
T2. Do you ever watch TV programmes or films on-demand? By on-demand we mean watching TV programmes or films via online services such as BBC iPlayer, Netflix, Amazon
Prime, Sky Go etc. This could be through your television service or on any device you use to go online (prompted responses, single coded
Base: All adults aged 16+ (1846 aged 16+, 234 aged 16-24, 272 aged 25-34,313 aged 35-44, 284 aged 45-54, 270 aged 55-64, 218 aged 65-74, 255 aged 75+, 427 AB, 566 C1,
369 C2, 484 DE, 885 male, 961 female)
Arrows show significant differences (95% level) for age/ socio-economic group compared to all adults, and males compared to females.
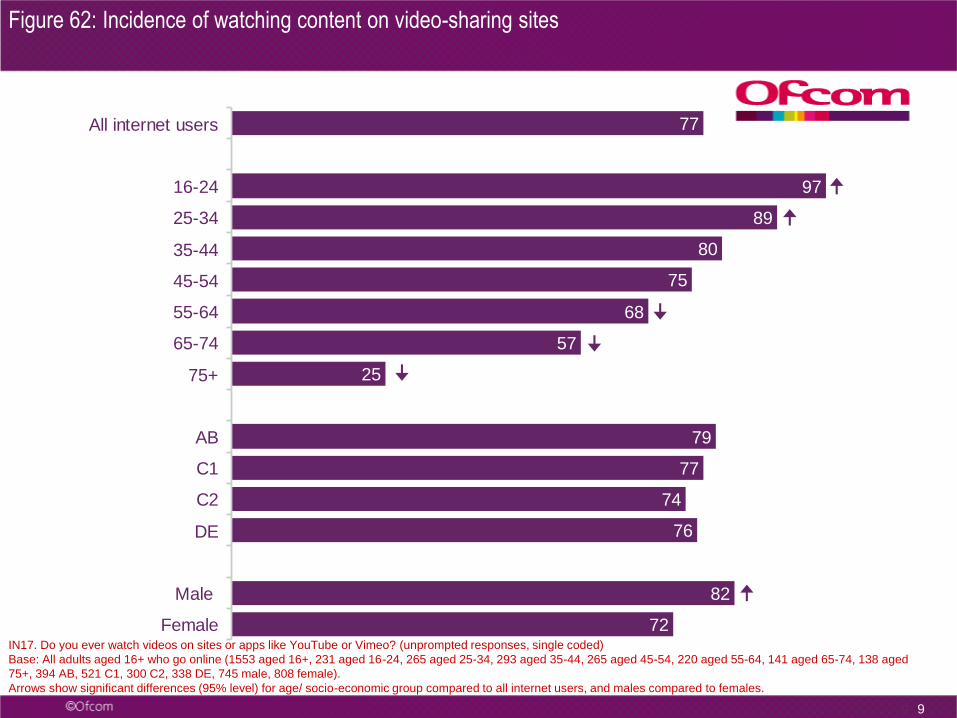
77
97
89
80
75
68
57
25
79
77
74
76
82
72
All internet users
16-24
25-34
35-44
45-54
55-64
65-74
75+
AB
C1
C2
DE
Male
Female
Figure 62: Incidence of watching content on video-sharing sites
9 9
IN17. Do you ever watch videos on sites or apps like YouTube or Vimeo? (unprompted responses, single coded)
Base: All adults aged 16+ who go online (1553 aged 16+, 231 aged 16-24, 265 aged 25-34, 293 aged 35-44, 265 aged 45-54, 220 aged 55-64, 141 aged 65-74, 138 aged
75+, 394 AB, 521 C1, 300 C2, 338 DE, 745 male, 808 female).
Arrows show significant differences (95% level) for age/ socio-economic group compared to all internet users, and males compared to females.
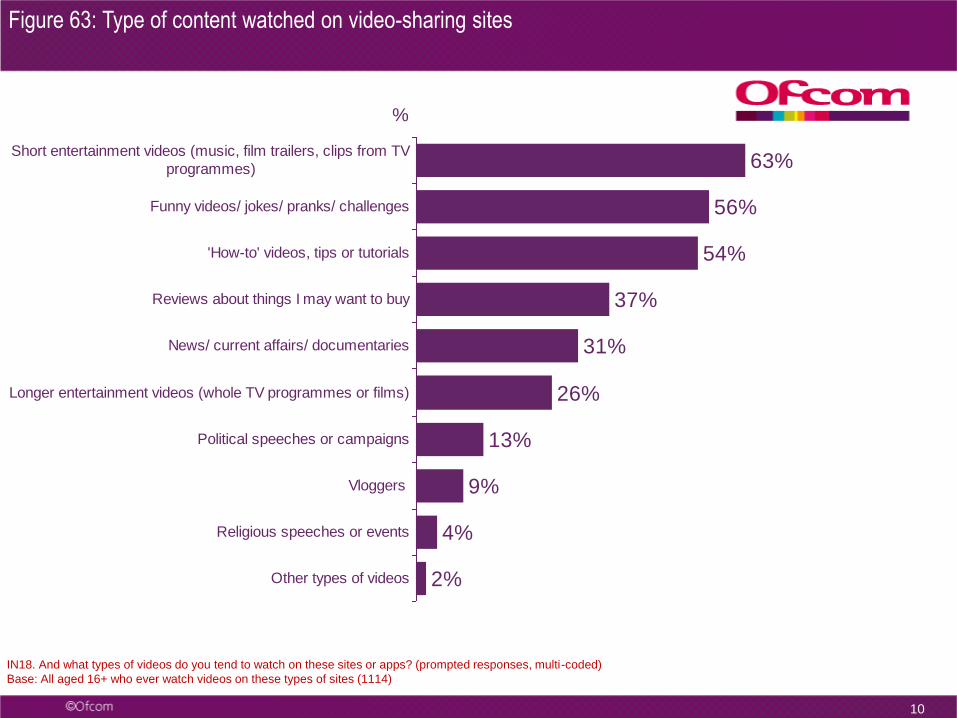
2%
4%
9%
13%
26%
31%
37%
54%
56%
63%
Other types of videos
Religious speeches or events
Vloggers
Political speeches or campaigns
Longer entertainment videos (whole TV programmes or films)
News/ current affairs/ documentaries
Reviews about things I may want to buy
'How-to' videos, tips or tutorials
Funny videos/ jokes/ pranks/ challenges
Short entertainment videos (music, film trailers, clips from TV
programmes)
Figure 63: Type of content watched on video-sharing sites
10
IN18. And what types of videos do you tend to watch on these sites or apps? (prompted responses, multi-coded)
Base: All aged 16+ who ever watch videos on these types of sites (1114)
%
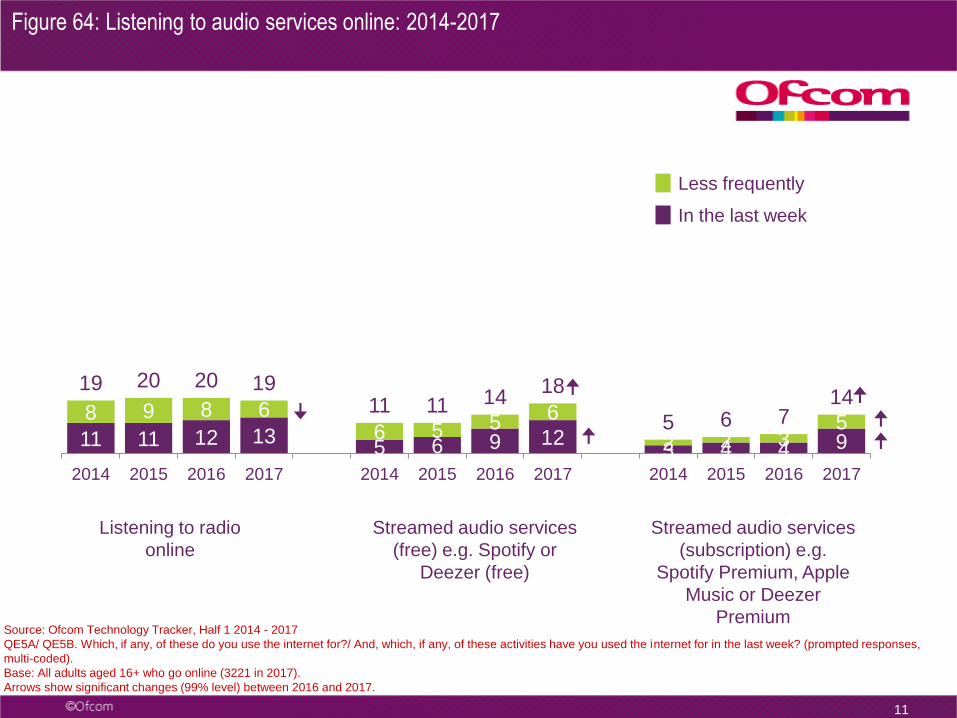
Figure 64: Listening to audio services online: 2014-2017
11
11 11 12 135 6 9 12
3 4 4 9
8 9 8 66 5 5 6
2 2 35
19 20 20 1911 11 14
18
5 6 714
2014 2015 2016 2017 2014 2015 2016 2017 2014 2015 2016 2017
Source: Ofcom Technology Tracker, Half 1 2014 - 2017
QE5A/ QE5B. Which, if any, of these do you use the internet for?/ And, which, if any, of these activities have you used the internet for in the last week? (prompted responses,
multi-coded).
Base: All adults aged 16+ who go online (3221 in 2017).
Arrows show significant changes (99% level) between 2016 and 2017.
Listening to radio
online
Streamed audio services
(free) e.g. Spotify or
Deezer (free)
Streamed audio services
(subscription) e.g.
Spotify Premium, Apple
Music or Deezer
Premium
Less frequently
In the last week
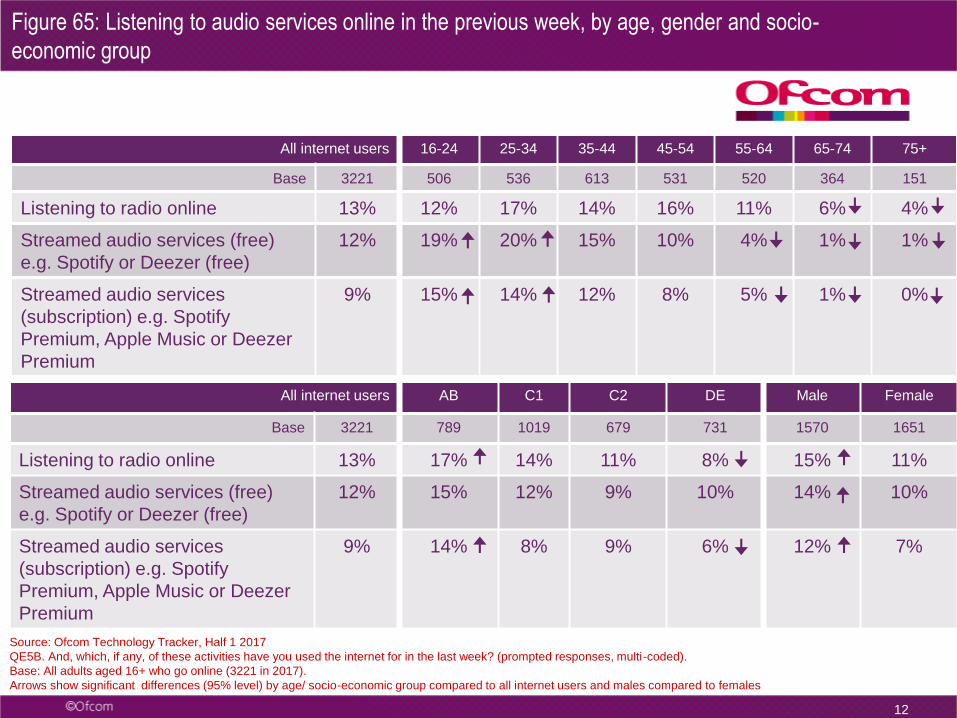
All internet users AB C1 C2 DE Male Female
Base 3221 789 1019 679 731 1570 1651
Listening to radio online 13% 17% 14% 11% 8% 15% 11%
Streamed audio services (free)
e.g. Spotify or Deezer (free)
12% 15% 12% 9% 10% 14% 10%
Streamed audio services
(subscription) e.g. Spotify
Premium, Apple Music or Deezer
Premium
9% 14% 8% 9% 6% 12% 7%
Figure 65: Listening to audio services online in the previous week, by age, gender and socio-
economic group
12
All internet users 16-24 25-34 35-44 45-54 55-64 65-74 75+
Base 3221 506 536 613 531 520 364 151
Listening to radio online 13% 12% 17% 14% 16% 11% 6% 4%
Streamed audio services (free)
e.g. Spotify or Deezer (free)
12% 19% 20% 15% 10% 4% 1% 1%
Streamed audio services
(subscription) e.g. Spotify
Premium, Apple Music or Deezer
Premium
9% 15% 14% 12% 8% 5% 1% 0%
Source: Ofcom Technology Tracker, Half 1 2017
QE5B. And, which, if any, of these activities have you used the internet for in the last week? (prompted responses, multi-coded).
Base: All adults aged 16+ who go online (3221 in 2017).
Arrows show significant differences (95% level) by age/ socio-economic group compared to all internet users and males compared to females
13
41
20
13
6
6
2
3
11
13
16
14
20
7
23
26
30
29
21
17
19
10
22
27
21
22
20
26
63
33
50
58
73
77
79
87
67
60
63
64
59
68
All adults
16-24
25-34
35-44
45-54
55-64
65-74
75+
AB
C1
C2
DE
Male
Female
Play games online with or against other people Don't play games online with or against other people
Don't play games
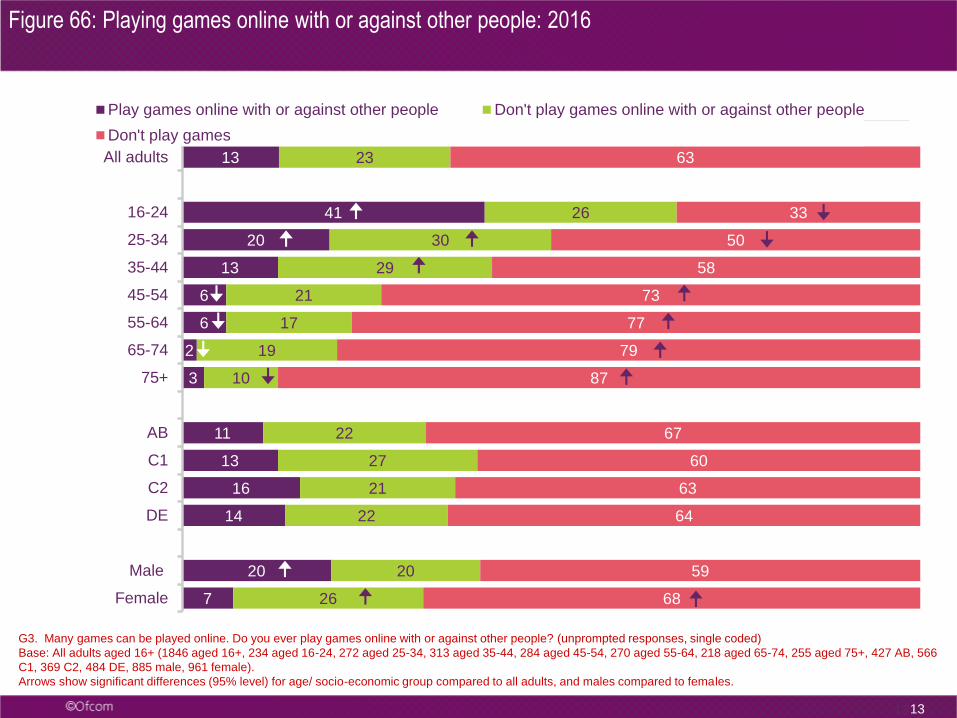
Figure 66: Playing games online with or against other people: 2016
1313
G3. Many games can be played online. Do you ever play games online with or against other people? (unprompted responses, single coded)
Base: All adults aged 16+ (1846 aged 16+, 234 aged 16-24, 272 aged 25-34, 313 aged 35-44, 284 aged 45-54, 270 aged 55-64, 218 aged 65-74, 255 aged 75+, 427 AB, 566
C1, 369 C2, 484 DE, 885 male, 961 female).
Arrows show significant differences (95% level) for age/ socio-economic group compared to all adults, and males compared to females.
58
68
22
20
20
11
When I'm engrossed in agame I don't really think
about who the other peopleare, I'm only interested in
their game characters
When I chat or message thepeople I'm playing with about
the game it enhances thegaming experience
Agree Neither/ Don't know Disagree
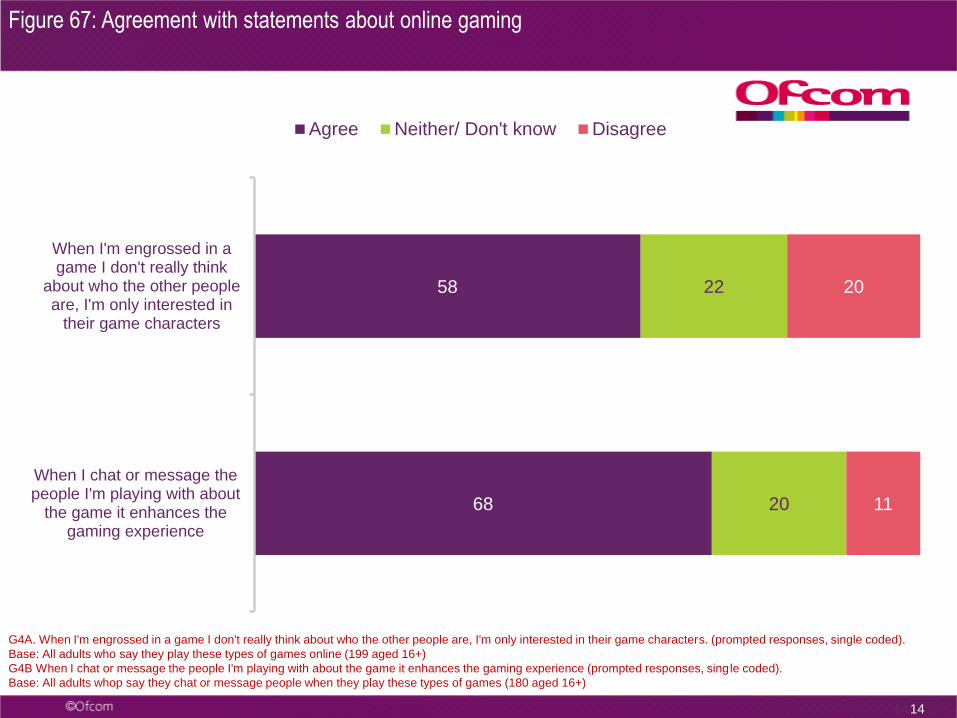
Figure 67: Agreement with statements about online gaming
1414
G4A. When I'm engrossed in a game I don't really think about who the other people are, I'm only interested in their game characters. (prompted responses, single coded).
Base: All adults who say they play these types of games online (199 aged 16+)
G4B When I chat or message the people I'm playing with about the game it enhances the gaming experience (prompted responses, single coded).
Base: All adults whop say they chat or message people when they play these types of games (180 aged 16+)
1
3
2
18
18
21
34
49
64
Don't know
Other
(UNPROMPTED) Look through the guide or
planner
Mentioned on social media
Discussed or reviewed in the media
Recommended/ highlighted by on-demand
service
Trailers/ adverts on TV/ radio
Friends/ family recommend to me
Missed when originally broadcast
15
%
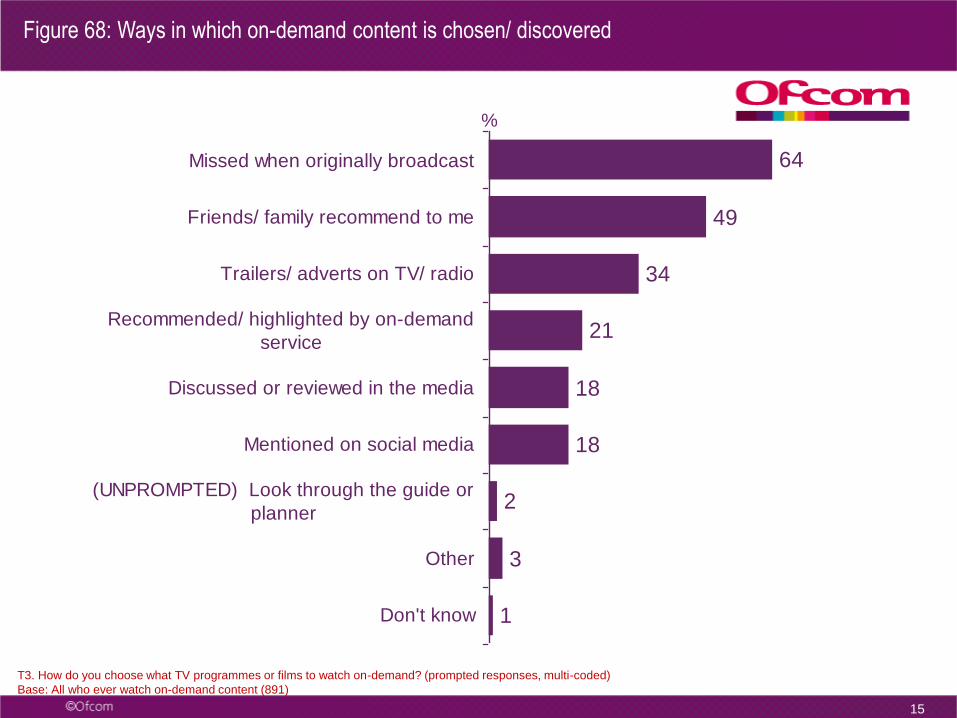
T3. How do you choose what TV programmes or films to watch on-demand? (prompted responses, multi-coded)
Base: All who ever watch on-demand content (891)
Figure 68: Ways in which on-demand content is chosen/ discovered
1
2
6
12
14
32
38
45
62
Don't know
Other
Clicking on an online advert
From articles/ adverts in newspapers or
magazines (online or paper)
My subscription section
Recommended/ trending/ most popular section
on the site
Links from social media sites
Search engine results
Friends or family tell me/ email me about them
16
%
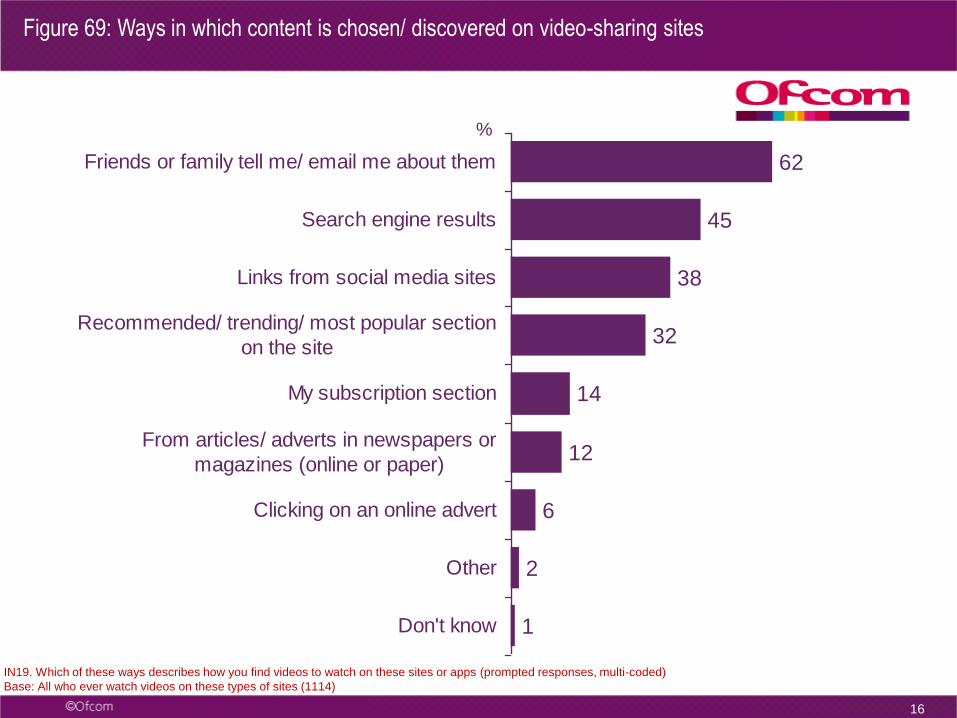
Figure 69: Ways in which content is chosen/ discovered on video-sharing sites
IN19. Which of these ways describes how you find videos to watch on these sites or apps (prompted responses, multi-coded)
Base: All who ever watch videos on these types of sites (1114)
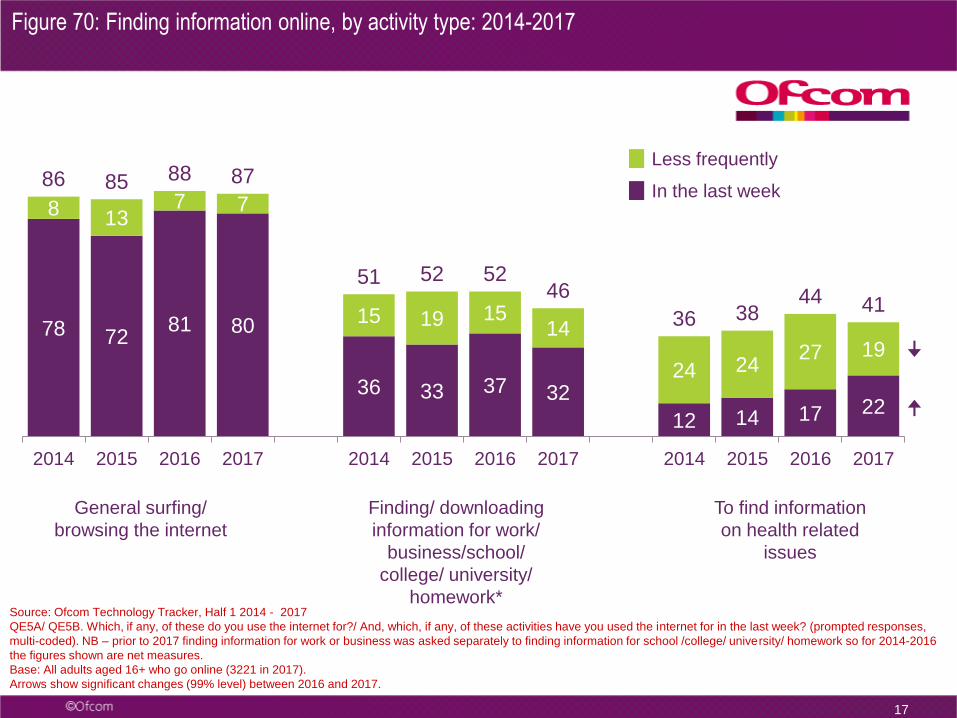
Figure 70: Finding information online, by activity type: 2014-2017
17
78 7281 80
36 33 37 32
12 14 17 22
8 137 7
15 19 1514
24 2427 19
86 85 88 87
51 52 5246
36 3844 41
2014 2015 2016 2017 2014 2015 2016 2017 2014 2015 2016 2017
Finding/ downloading
information for work/
business/school/
college/ university/
homework*
To find information
on health related
issues
General surfing/
browsing the internet
Less frequently
In the last week
Source: Ofcom Technology Tracker, Half 1 2014 - 2017
QE5A/ QE5B. Which, if any, of these do you use the internet for?/ And, which, if any, of these activities have you used the internet for in the last week? (prompted responses,
multi-coded). NB – prior to 2017 finding information for work or business was asked separately to finding information for school /college/ university/ homework so for 2014-2016
the figures shown are net measures.
Base: All adults aged 16+ who go online (3221 in 2017).
Arrows show significant changes (99% level) between 2016 and 2017.
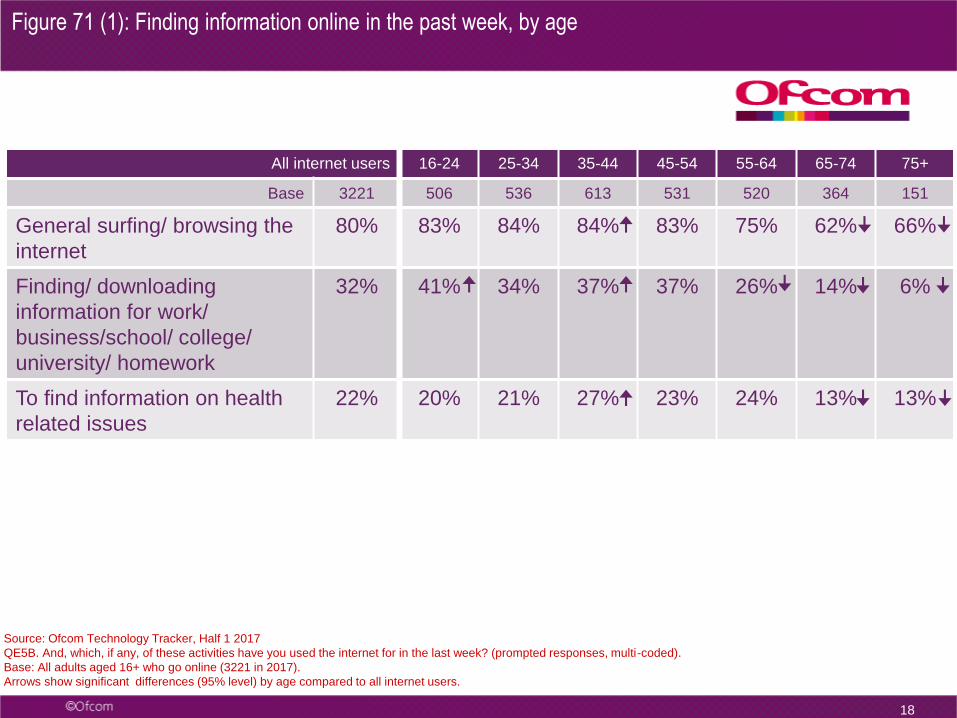
Figure 71 (1): Finding information online in the past week, by age
18
All internet users 16-24 25-34 35-44 45-54 55-64 65-74 75+
Base 3221 506 536 613 531 520 364 151
General surfing/ browsing the
internet
80% 83% 84% 84% 83% 75% 62% 66%
Finding/ downloading
information for work/
business/school/ college/
university/ homework
32% 41% 34% 37% 37% 26% 14% 6%
To find information on health
related issues
22% 20% 21% 27% 23% 24% 13% 13%
Source: Ofcom Technology Tracker, Half 1 2017
QE5B. And, which, if any, of these activities have you used the internet for in the last week? (prompted responses, multi-coded).
Base: All adults aged 16+ who go online (3221 in 2017).
Arrows show significant differences (95% level) by age compared to all internet users.
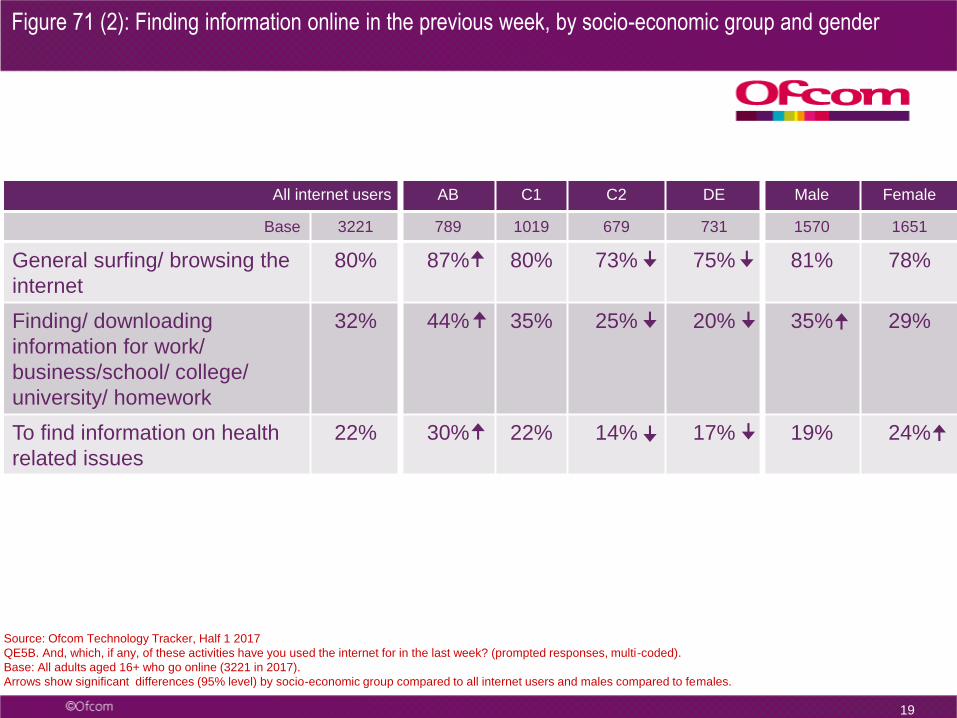
All internet users AB C1 C2 DE Male Female
Base 3221 789 1019 679 731 1570 1651
General surfing/ browsing the
internet
80% 87% 80% 73% 75% 81% 78%
Finding/ downloading
information for work/
business/school/ college/
university/ homework
32% 44% 35% 25% 20% 35% 29%
To find information on health
related issues
22% 30% 22% 14% 17% 19% 24%
Figure 71 (2): Finding information online in the previous week, by socio-economic group and gender
19
Source: Ofcom Technology Tracker, Half 1 2017
QE5B. And, which, if any, of these activities have you used the internet for in the last week? (prompted responses, multi-coded).
Base: All adults aged 16+ who go online (3221 in 2017).
Arrows show significant differences (95% level) by socio-economic group compared to all internet users and males compared to females.
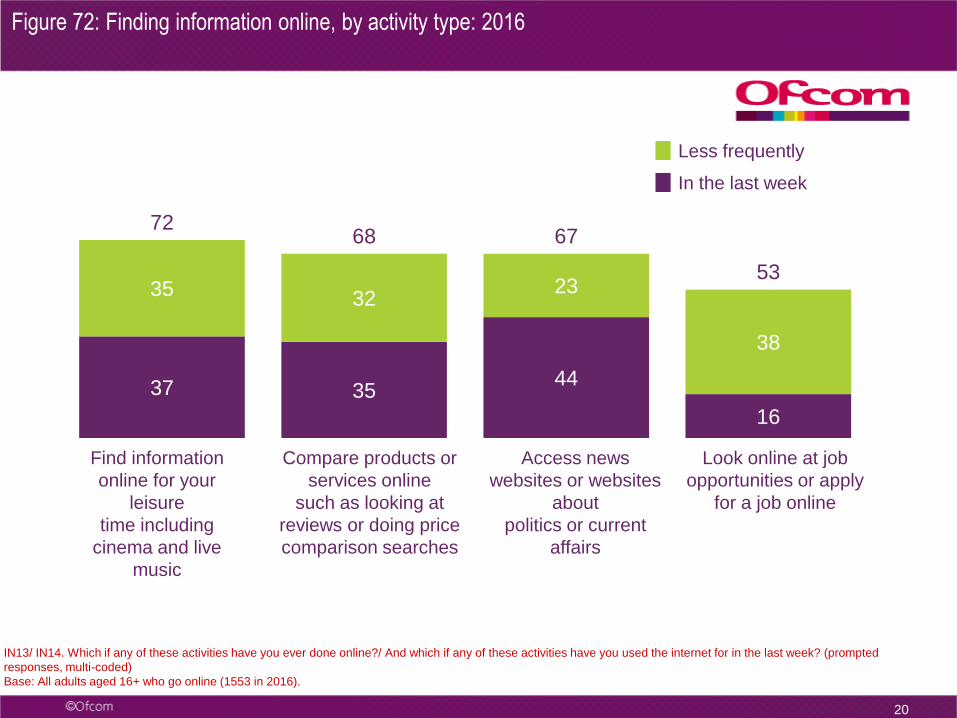
Figure 72: Finding information online, by activity type: 2016
20
37 3544
16
35 3223
38
7268 67
53
Find information
online for your
leisure
time including
cinema and live
music
IN13/ IN14. Which if any of these activities have you ever done online?/ And which if any of these activities have you used the internet for in the last week? (prompted
responses, multi-coded)
Base: All adults aged 16+ who go online (1553 in 2016).
Compare products or
services online
such as looking at
reviews or doing price
comparison searches
Access news
websites or websites
about
politics or current
affairs
Look online at job
opportunities or apply
for a job online
Less frequently
In the last week
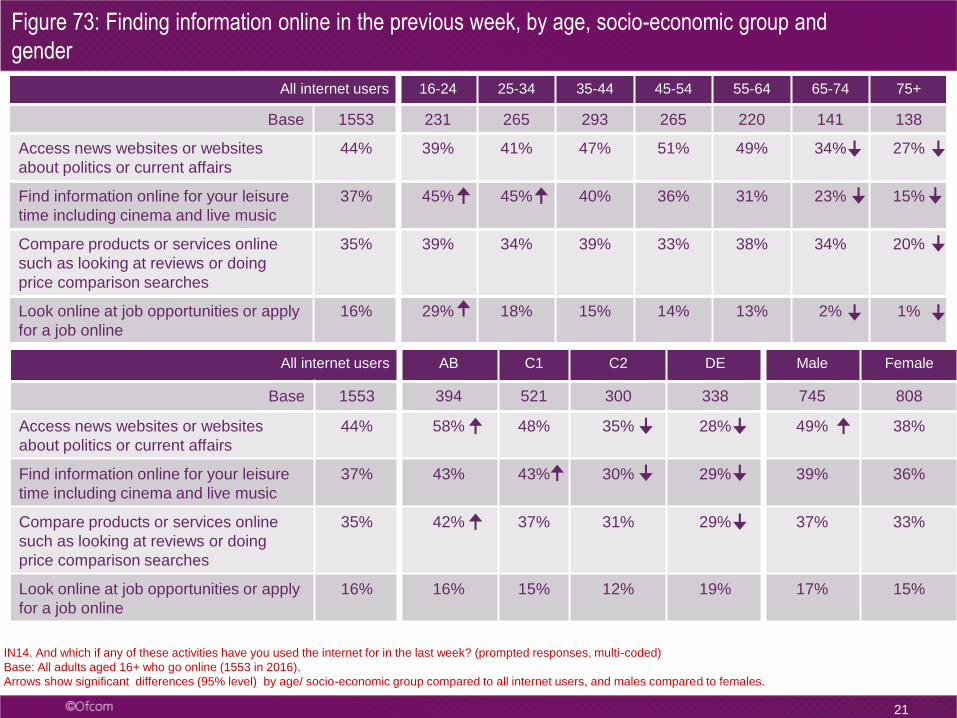
Figure 73: Finding information online in the previous week, by age, socio-economic group and
gender
21
All internet users 16-24 25-34 35-44 45-54 55-64 65-74 75+
Base 1553 231 265 293 265 220 141 138
Access news websites or websites
about politics or current affairs
44% 39% 41% 47% 51% 49% 34% 27%
Find information online for your leisure
time including cinema and live music
37% 45% 45% 40% 36% 31% 23% 15%
Compare products or services online
such as looking at reviews or doing
price comparison searches
35% 39% 34% 39% 33% 38% 34% 20%
Look online at job opportunities or apply
for a job online
16% 29% 18% 15% 14% 13% 2% 1%
All internet users AB C1 C2 DE Male Female
Base 1553 394 521 300 338 745 808
Access news websites or websites
about politics or current affairs
44% 58% 48% 35% 28% 49% 38%
Find information online for your leisure
time including cinema and live music
37% 43% 43% 30% 29% 39% 36%
Compare products or services online
such as looking at reviews or doing
price comparison searches
35% 42% 37% 31% 29% 37% 33%
Look online at job opportunities or apply
for a job online
16% 16% 15% 12% 19% 17% 15%
IN14. And which if any of these activities have you used the internet for in the last week? (prompted responses, multi-coded)
Base: All adults aged 16+ who go online (1553 in 2016).
Arrows show significant differences (95% level) by age/ socio-economic group compared to all internet users, and males compared to females.
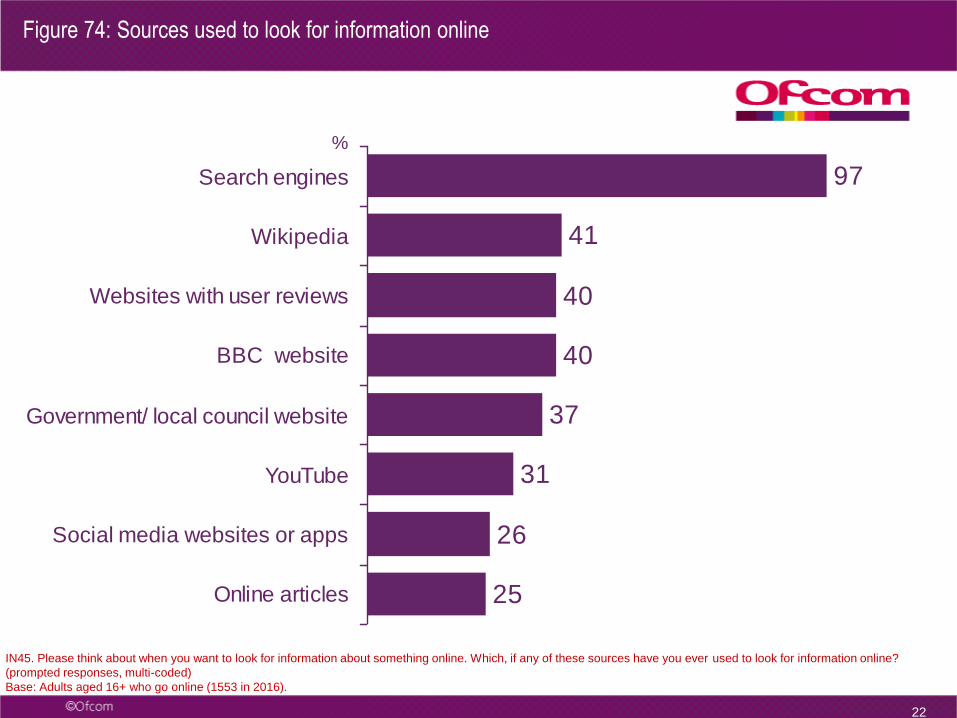
25
26
31
37
40
40
41
97
Online articles
Social media websites or apps
YouTube
Government/ local council website
BBC website
Websites with user reviews
Wikipedia
Search engines
22
%
IN45. Please think about when you want to look for information about something online. Which, if any of these sources have you ever used to look for information online?
(prompted responses, multi-coded)
Base: Adults aged 16+ who go online (1553 in 2016).
Figure 74: Sources used to look for information online
80
75
83
80
85
75
79
76
78
88
81
77
82
6
4
4
6
7
9
5
7
7
4
2
7
5
4
11
4
3
4
2
3
5
5
3
4
6
3
3
7
4
4
1
2
2
4
2
6
2
5
2
1
3
2
2
1
1
2
2
2
1
1
1
1
3
4
2
1
1
1
2
1
1
1
1
1
1
1
2
2
1
1
1
1
3
1
1
1
All internet users who do this
16-24
25-34
35-44
45-54
55-64
65+
AB
C1
C2
DE
Male
Female
Search engines Websites with user reviews YouTube
Social media Government/ local council website BBC website
Online articles Wikipedia
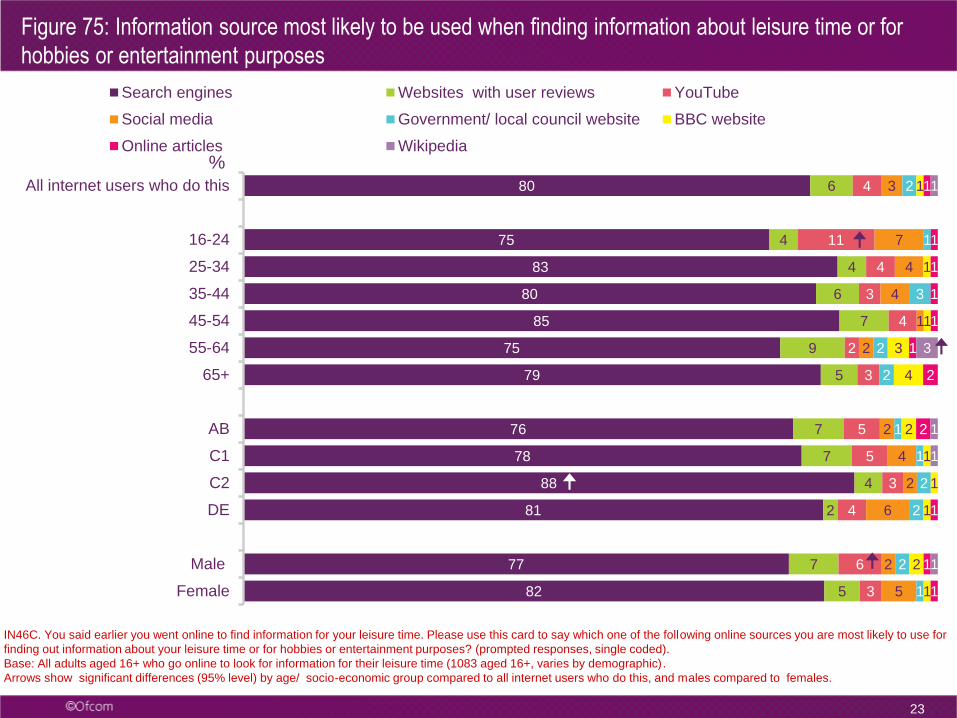
23
%
IN46C. You said earlier you went online to find information for your leisure time. Please use this card to say which one of the following online sources you are most likely to use for
finding out information about your leisure time or for hobbies or entertainment purposes? (prompted responses, single coded).
Base: All adults aged 16+ who go online to look for information for their leisure time (1083 aged 16+, varies by demographic).
Arrows show significant differences (95% level) by age/ socio-economic group compared to all internet users who do this, and males compared to females.
Figure 75: Information source most likely to be used when finding information about leisure time or for
hobbies or entertainment purposes
79
83
84
72
84
77
74
77
81
77
84
82
77
8
2
5
13
6
7
15
8
8
9
7
5
11
3
3
3
4
2
5
1
4
3
2
3
3
3
2
3
1
2
2
6
2
3
3
1
1
2
2
2
3
2
2
2
1
1
3
2
2
3
2
1
3
1
2
1
1
3
3
1
2
1
2
3
1
2
1
2
2
1
1
1
1
1
1
All internet users who do this
16-24
25-34
35-44
45-54
55-64
65+
AB
C1
C2
DE
Male
Female
Search engines Government/ local council website Wikipedia
BBC website Online articles Social media
YouTube Websites with user reviews
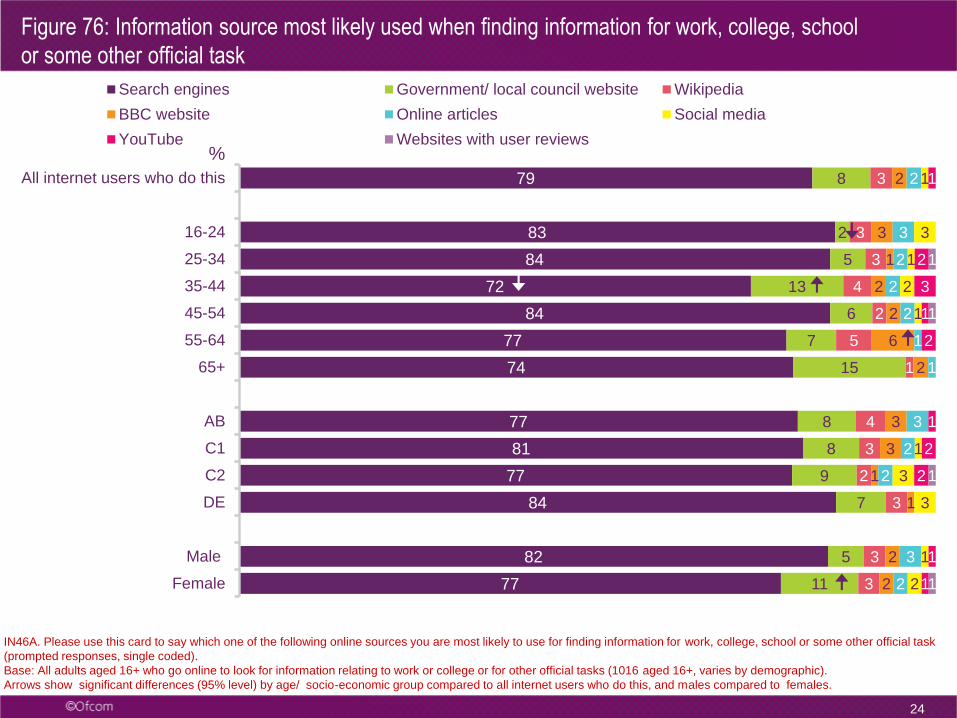
24
%
IN46A. Please use this card to say which one of the following online sources you are most likely to use for finding information for work, college, school or some other official task
(prompted responses, single coded).
Base: All adults aged 16+ who go online to look for information relating to work or college or for other official tasks (1016 aged 16+, varies by demographic).
Arrows show significant differences (95% level) by age/ socio-economic group compared to all internet users who do this, and males compared to females.
Figure 76: Information source most likely used when finding information for work, college, school
or some other official task
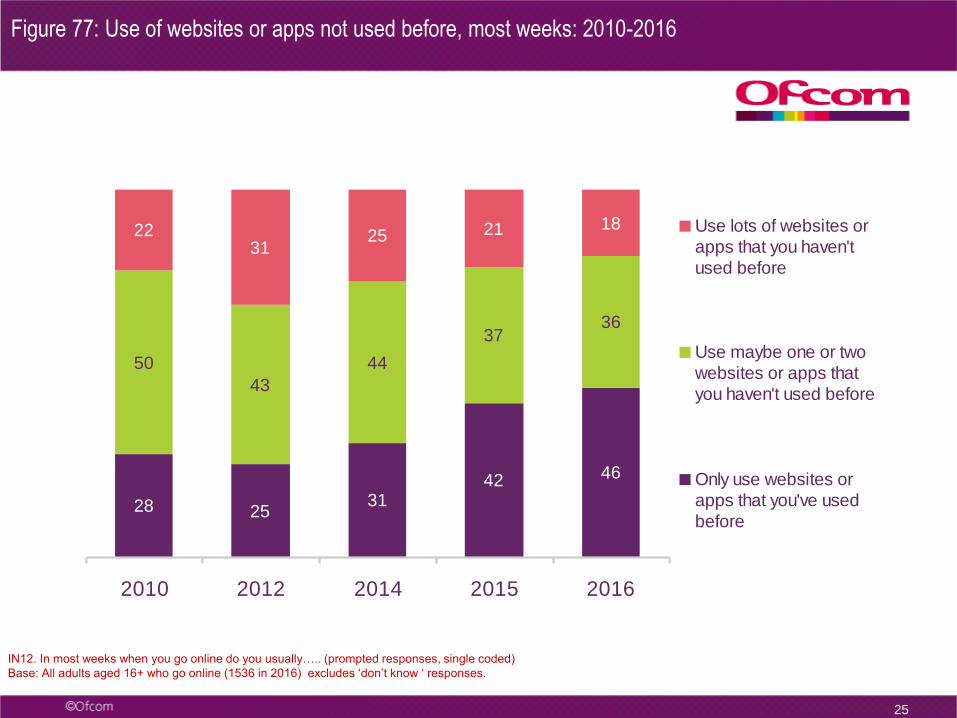
Figure 77: Use of websites or apps not used before, most weeks: 2010-2016
25
28 3142 46
50
43
44
3736
2231
25 21 18
25
2010 2012 2014 2015 2016
Use lots of websites or
apps that you haven't
used before
Use maybe one or two
websites or apps that
you haven't used before
Only use websites or
apps that you've used
before
IN12. In most weeks when you go online do you usually….. (prompted responses, single coded)
Base: All adults aged 16+ who go online (1536 in 2016) excludes ‘don’t know ‘ responses.
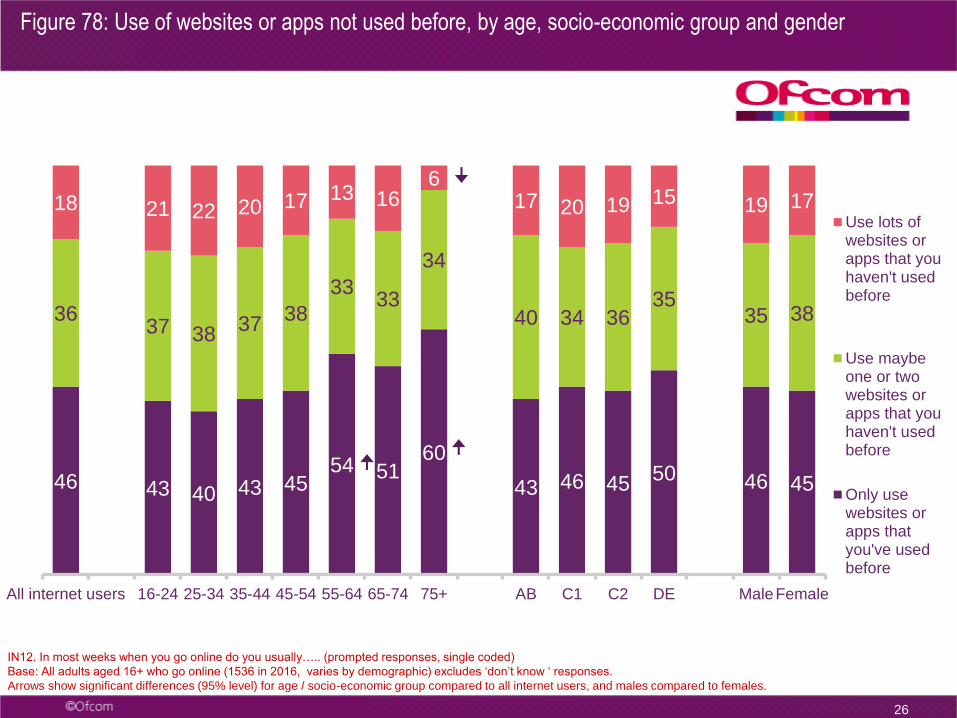
Figure 78: Use of websites or apps not used before, by age, socio-economic group and gender
26
46 43 40 43 4554 51
60
43 46 4550 46 45
3637 38
3738
3333
34
40 34 3635
35 38
18 21 22 20 17 13 166
17 20 19 15 19 17
All internet users 16-24 25-34 35-44 45-54 55-64 65-74 75+ AB C1 C2 DE MaleFemale
Use lots ofwebsites orapps that youhaven't usedbefore
Use maybeone or twowebsites orapps that youhaven't usedbefore
Only usewebsites orapps thatyou've usedbefore
IN12. In most weeks when you go online do you usually….. (prompted responses, single coded)
Base: All adults aged 16+ who go online (1536 in 2016, varies by demographic) excludes ‘don’t know ‘ responses.
Arrows show significant differences (95% level) for age / socio-economic group compared to all internet users, and males compared to females.
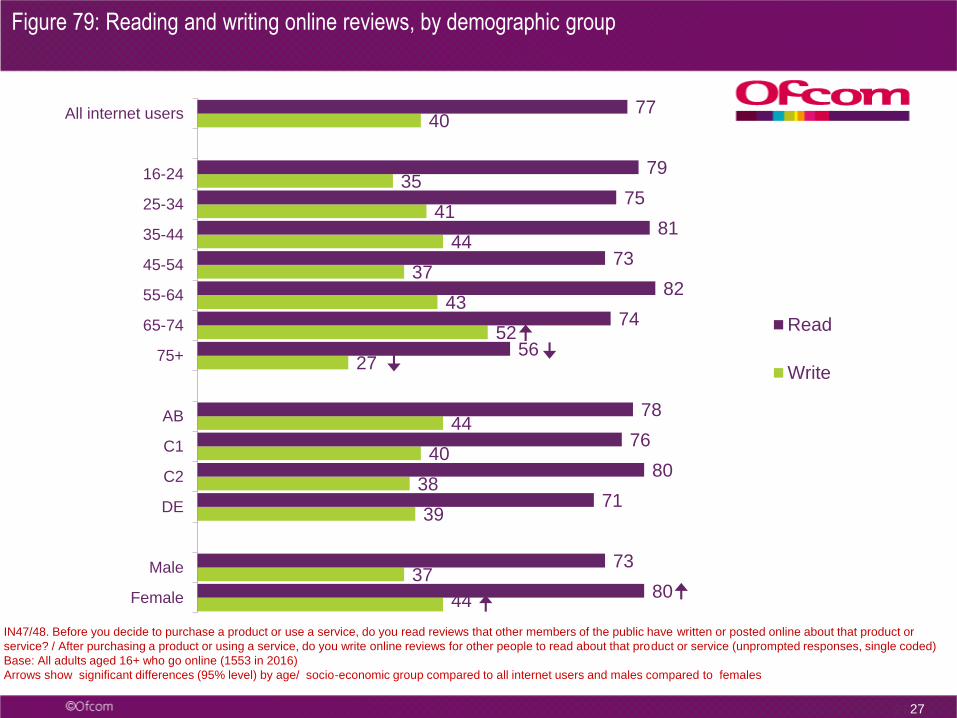
44
37
39
38
40
44
27
52
43
37
44
41
35
40
80
73
71
80
76
78
56
74
82
73
81
75
79
77
Female
Male
DE
C2
C1
AB
75+
65-74
55-64
45-54
35-44
25-34
16-24
All internet users
Read
Write
IN47/48. Before you decide to purchase a product or use a service, do you read reviews that other members of the public have written or posted online about that product or
service? / After purchasing a product or using a service, do you write online reviews for other people to read about that product or service (unprompted responses, single coded)
Base: All adults aged 16+ who go online (1553 in 2016)
Arrows show significant differences (95% level) by age/ socio-economic group compared to all internet users and males compared to females
2727
Figure 79: Reading and writing online reviews, by demographic group
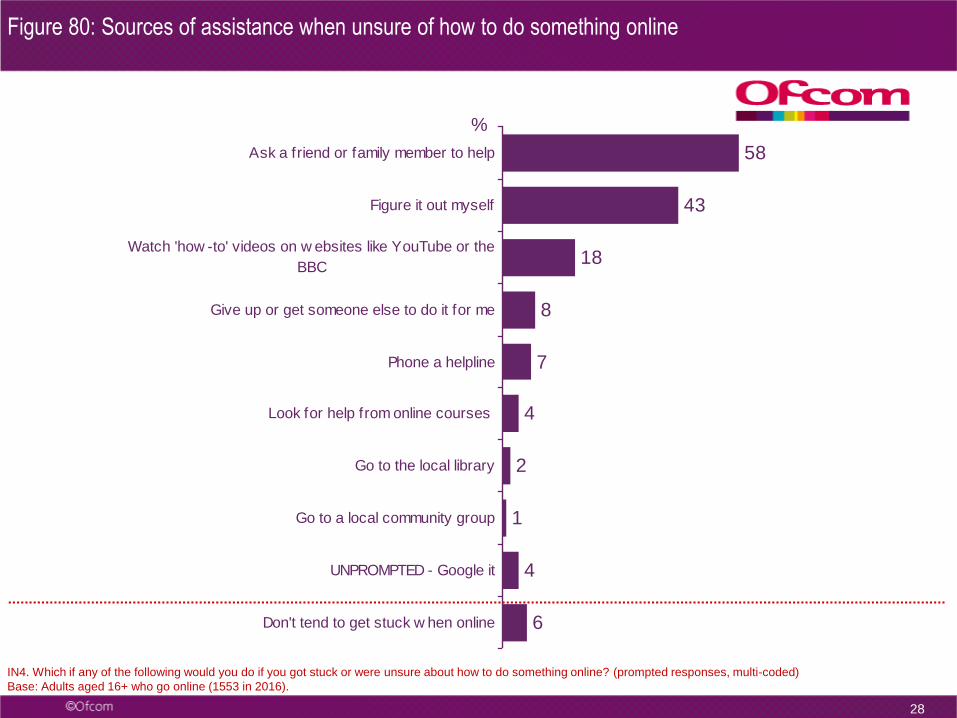
6
4
1
2
4
7
8
18
43
58
Don't tend to get stuck w hen online
UNPROMPTED - Google it
Go to a local community group
Go to the local library
Look for help from online courses
Phone a helpline
Give up or get someone else to do it for me
Watch 'how -to' videos on w ebsites like YouTube or the
BBC
Figure it out myself
Ask a friend or family member to help
28
%
IN4. Which if any of the following would you do if you got stuck or were unsure about how to do something online? (prompted responses, multi-coded)
Base: Adults aged 16+ who go online (1553 in 2016).
Figure 80: Sources of assistance when unsure of how to do something online


![Jokes SMS [Santa Banta Jokes]](https://img.pdfslide.us/doc/110x75/56d6bff51a28ab3016985db5/jokes-sms-santa-banta-jokes.jpg)