Embed Size (px)
Citation preview
Effect of a 24-month physical activity intervention compared to health education on cognitive outcomes in sedentary older adults: the LIFE Randomized Trial
Kaycee M. Sink, MD, MAS1, Mark A. Espeland, PhD2, Cynthia M. Castro, PhD3, Timothy Church, MD, PhD, MPH4, Ron Cohen, PhD5, John A. Dodson, MD6, Jack Guralnik, MD, PhD7, Hugh C. Hendrie, MB, ChB, D.Sc8, Janine Jennings, PhD9, Jeffery Katula, PhD, MA10, Oscar L. Lopez, MD11, Mary M. McDermott, MD12, Marco Pahor, MD5, Kieran F. Reid, PhD; MPH13, Julia Rushing, MS2, Joe Verghese, MBBS14, Stephen Rapp, PhD15, and Jeff D. Williamson, MD, MHS1 for the LIFE Study investigatorsKaycee M. Sink: [email protected]; Mark A. Espeland: [email protected]; Cynthia M. Castro: [email protected]; Timothy Church: [email protected]; Ron Cohen: [email protected]; John A. Dodson: [email protected]; Jack Guralnik: [email protected]; Hugh C. Hendrie: [email protected]; Janine Jennings: [email protected]; Jeffery Katula: [email protected]; Oscar L. Lopez: [email protected]; Mary M. McDermott: [email protected]; Marco Pahor: [email protected]; Kieran F. Reid: [email protected]; Julia Rushing: [email protected]; Joe Verghese: [email protected]; Stephen Rapp: [email protected]; Jeff D. Williamson: [email protected] of Internal Medicine, Section on Gerontology and Geriatric Medicine, Wake Forest School of Medicine, Winston-Salem, NC 27157
2Department of Biostatistical Sciences, Wake Forest School of Medicine, Winston-Salem, NC 27157
3Stanford Prevention Research Center, Stanford University School of Medicine, Palo Alto, CA 94304
4Pennington Biomedical Research Center, Baton Rouge, LA 70808
5College of Medicine, University of Florida, Gainesville, FL, 32608
6Leon H. Charney Division of Cardiology, Department of Medicine, New York University School of Medicine, New York, NY 10016
7Department of Epidemiology and Public Health, Division of Gerontology, University of Maryland School of Medicine, Baltimore, MD 21201
8Department of Psychiatry and Center for Aging Research, Indiana University
9Department of Psychology, Wake Forest University, Winston-Salem, NC, 27109
10Department of Health and Exercise Sciences, Wake Forest University, Winston-Salem, NC, 27109
Correspondence: Kaycee Sink, MD, MAS, Wake Forest School of Medicine, Sticht Center on Aging, One Medical Center Blvd, Winston-Salem, NC 27157, 336-713-8558; [email protected].
Disclosures:Dr. Lopez is a consultant for Baxter, Lilly, Grifols, and Lundbeck
Trial Registration: ClinicalsTrials.gov identifier NCT01072500.
HHS Public AccessAuthor manuscriptJAMA. Author manuscript; available in PMC 2016 August 25.
Published in final edited form as:JAMA. 2015 August 25; 314(8): 781–790. doi:10.1001/jama.2015.9617.
Author M
anuscriptA
uthor Manuscript
Author M
anuscriptA
uthor Manuscript
11Departments of Neurology and Psychiatry, University of Pittsburgh, Pittsburgh, PA 15213
12Department of Medicine, Northwestern University Fienberg School of Medicine, Chicago, IL
13Nutrition, Exercise Physiology and Sarcopenia Laboratory, Jean Mayer USDA Human Nutrition Research Center on Aging, Tufts University, Boston, MA 02111
14Departments of Neurology and Medicine, Albert Einstein College of Medicine, Bronx, NY
15Department of Psychiatry, Wake Forest School of Medicine, Winston-Salem, NC 27157
Abstract
Importance—Epidemiologic evidence suggests that physical activity benefits cognition, but
results from randomized trials are limited and mixed.
Objective—To determine whether a 24-month physical activity program results in better
cognitive function and/or lower risk of mild cognitive impairment (MCI) or dementia compared to
a health education program.
Design, Setting, and Participants—The Lifestyle Interventions and Independence for Elders
(LIFE) study was a multicenter, randomized clinical trial that enrolled 1635 community-living
participants at 8 centers in the U.S. from February 2010 until December 2011. Participants were
sedentary adults aged 70–89 years at risk for mobility disability, but able to walk 400m.
Intervention—Participants were randomized to a structured, moderate-intensity physical activity
program (n=818) that included walking, resistance training, and flexibility exercises or to a health
education program (n=817) of educational workshops and upper extremity stretching.
Outcomes and Measures—Pre-specified secondary outcomes of the LIFE study included
cognitive function measured by the Digit Symbol Coding task (0–133 scale, higher=better) and
Hopkins Verbal Learning Test-Revised (12-word list recall) assessed in 1,476 (90.3%)
participants. Tertiary outcomes included global and executive cognitive function and incident MCI
or dementia at 24 months. Pre-specified subgroups analyses were performed based on age, sex,
baseline physical performance, and baseline Modified Mini-Mental State Examination score.
Results—At 24 months, DSC and HVLT-R scores (adjusted for clinic site, gender, and baseline
values) were not different between groups. Mean DSC scores were 46.26 points for physical
activity vs. 46.28 for health education; mean difference −0.014 points, 95% CI −0.80 to 0.77, p=
0.97. Mean HVLT-R delayed recall scores were 7.22 for physical activity vs. 7.25 for health
education; mean difference −0.03 words, 95% CI −0.29 to 0.24, p= 0.84.
No differences for any other cognitive or composite measures were observed. Participants
randomized to physical activity who were ≥80 years (n=307) and those with poorer baseline
physical performance (n=328) had better changes in executive function composite scores vs. those
randomized to health education (interaction p=0.01, respectively). Incident MCI or dementia
occurred in 98 (13.2%) participants randomized to physical activity and 91 (12.1%) participants
randomized to health education (OR 1.08, 95% CI 0.80 to 1.46).
Conclusions and Relevance—Among sedentary older adults, a 24-month moderate intensity
physical activity program, compared to a health education program, did not result in
improvements in global or domain-specific cognitive function.
Sink et al. Page 2
JAMA. Author manuscript; available in PMC 2016 August 25.
Author M
anuscriptA
uthor Manuscript
Author M
anuscriptA
uthor Manuscript
Introduction
Epidemiologic evidence suggests that regular physical activity is associated with lower rates
of cognitive decline. Exercise is associated with improved cerebral blood flow and neuronal
connectivity,1 maintenance or improvement in brain volume,2;3 and favorable changes in
brain-derived neurotrophic factor and neurogenesis.4;5 In transgenic Alzheimer’s mouse
models, exercise reduces beta-amyloid deposition.6
Randomized clinical trials (RCT) assessing the effect of physical activity on cognitive
function are equivocal,7–9 perhaps due to small sample sizes, short intervention periods, and
differences in cohorts and protocols, particularly physical activity intensity.7 Two recent
small RCTs of physical activity found no benefit of a structured physical activity program
vs. no intervention or cognitive training in non-demented older adults with cognitive
complaints or at risk of cognitive decline.10;11 However, a 6-month RCT of a home-based
physical activity program vs. usual care in participants with memory complaints or mild
cognitive impairment found a modest cognitive benefit.12 The LIFE Pilot study showed a
correlation between changes in physical and cognitive performance in a 12 month exercise
trial.13
Here we report the pre-specified secondary cognitive outcomes of the LIFE Study, the
largest and longest RCT to assess the effect of a standardized physical activity intervention
on cognitive function and cognitive impairment in sedentary older adults at risk for mobility
disability.14 We hypothesized that compared to health education, physical activity for 24
months would result in better cognitive function and lower risk of incident all-cause mild
cognitive impairment (MCI) or dementia.
Methods
Trial design and participants
The LIFE study was a multicenter, single-blinded, randomized clinical trial of a physical
activity intervention versus a health education control conducted at 8 field centers across the
U.S. Participants were from rural and urban communities. (See acknowledgment section for
the field centers.) Details of the LIFE Study design and results have been published.14;15
The study included sedentary men and women aged 70–89 years who were at high risk for
mobility disability based on objectively assessed lower extremity functional limitations
defined as a Short Physical Performance Battery (SPPB)16 score ≤9 (out of 12), but who
could walk 400 m in 15 minutes at baseline without assistance. Eligible participants had no
diagnosis of dementia or significant cognitive impairment on the Modified Mini-Mental
State Examination17 (3MSE) based on education- and race-specific norms. Participants with
<9 years of education were excluded if the screening 3MSE score was <70 for African
Americans and Spanish Speakers or <76 for English-speaking non-African Americans.
Participants with ≥9 years of education were excluded if their 3MSE score was <76 for
African Americans and <80 for Spanish speakers and English-speaking non-African
Americans. Race and ethnicity were self-reported and collected as required by the National
Institutes of Health.
Sink et al. Page 3
JAMA. Author manuscript; available in PMC 2016 August 25.
Author M
anuscriptA
uthor Manuscript
Author M
anuscriptA
uthor Manuscript
Recruitment was predominantly by mass mailing to age-eligible residents. Additional
strategies included newspaper, radio and television advertisements, and presentations at
health fairs, senior centers, medical clinics, and churches.
The LIFE study was approved by the institutional review boards at all participating sites and
monitored by a data safety monitoring board appointed by the National Institute on Aging.
Written informed consent was obtained from all participants.
Interventions
Participants were randomly assigned, using a secure web-based data management system
(permuted block algorithm with random block lengths), with equal probability to either a
physical activity intervention or a successful aging health education program, stratifying by
field center and sex. The physical activity intervention focused on walking, strength,
flexibility, and balance training. Participants were expected to attended two center-based
visits per week and perform home-based activity 3–4 times per week. The physical activity
sessions progressed towards a goal of 30 min of walking at moderate intensity, 10 min of
primarily lower extremity strength training with ankle weights, 10 min of balance training,
and large muscle group flexibility exercises.
The health education group attended weekly health education workshops during the first 26
weeks of the intervention and at least monthly sessions thereafter. Sessions lasted 60–90
minutes and consisted of interactive and didactic presentations, facilitator demonstrations,
guest speakers, or field trips. Sessions included approximately 10 minutes of group
discussion and interaction and 5- to 10-minutes of upper extremity stretching and flexibility
exercises. Example topics included travel safety, age appropriate preventive services, legal/
financial issues, and nutrition. The intervention committee ensured that health education
activities were consistent across sites and unlikely to increase physical activity.
Measurements
Outcome assessments were conducted in person by masked staff every six months. Home,
telephone, and proxy assessments were attempted if participants could not attend clinic
visits. Information on demographics, medical and hospitalization history, medication
inventory, quality of well-being, and functional limitation was based on self-report.18 Usual
physical activity was assessed by self-report using the CHAMPS questionnaire to measure
total weekly minutes in walking and strength training19 and objectively using an Actigraph
accelerometer to measure total minutes of at least moderate activity (>760 counts/minute)
over seven days14.
Cognitive assessment
A previously described neuropsychological battery of tests was administered by trained and
certified examiners at baseline and 24 months post-randomization.20 Three computerized
tasks were administered at baseline and either 18 or 30 months depending on when the
participant was enrolled.20
Sink et al. Page 4
JAMA. Author manuscript; available in PMC 2016 August 25.
Author M
anuscriptA
uthor Manuscript
Author M
anuscriptA
uthor Manuscript
Neuropsychological battery—Cognitive tests at baseline included the Modified Mini-
Mental State Examination (3MSE),17 a 100-point test of global cognitive function; the
Wechsler Adult Intelligence Scale-III Digit Symbol Coding (DSC),21 a test of psychomotor
speed, attention, and working memory; the Hopkins Verbal Learning Test-Revised (HVLT-
R),22 a 12-item word list learning and recall task; and a modified version of the Rey-
Osterrieth Complex Figure to assess visuospatial function (copy) and figural memory
(immediate recall). At 24 months these measures were repeated along with the Boston
Naming Test, a measure of language;23 the Trail Making Test24 parts A (measuring
attention, concentration, and psychomotor speed) and B (executive function); and Category
Fluency for animals, a measure of executive function. In all tests except Trail Making,
higher scores indicate better performance.
Computerized battery—Using a laptop computer, participants were administered 3 tasks
that were chosen for added sensitivity in assessing speed of processing and executive
function: the n-back (1-back and 2-back) task,25 the Eriksen Flanker task,26 and a task
switching paradigm.27
Mild Cognitive Impairment (MCI) and Dementia outcome determinations
At baseline and 24 months post-randomization, all participants were assigned one of the
following cognitive classifications: No Cognitive Impairment, MCI, or Dementia.
Participants who scored ≤88 on the 3MSE were sent for central adjudication by a panel of
eight clinical experts in the diagnosis of late life cognitive impairment, blinded to treatment
assignment.20 Each case was assigned to 2 independent adjudicators; disagreements were
resolved by the full panel. Adjudicators reviewed data from the neuropsychological battery,
medical history, medications, discharge diagnoses for hospitalizations during the trial,
Center for Epidemiology Studies-Depression (CESD) scores,28 self-reported disability, and
informant-reported functional status (Functional Assessment Questionnaire, FAQ).29 The
FAQ is a 10-item interviewer-administered questionnaire assessing degree of dependence in
cognitively challenging activities of daily living such as preparing balanced meals, traveling
outside the neighborhood, and managing finances. The FAQ was administered to the
participant’s proxy for all participants with a 3MSE score ≤88 at baseline and 24 months.
MCI and dementia were adjudicated based on the 2011 National Institute on Aging/
Alzheimer’s Association criteria.30;31
Statistical analyses
The LIFE protocol specified DSC (total score) and HVLT-R (mean of the immediate and
delayed recall subscales) as the two primary cognitive outcomes for assessing cognitive
decline, each tested according to the intention to treat principle with analysis of covariance
using 24-month data and covariate adjustment for field center, gender, and the baseline
value. Additional pre-specified cognitive outcomes were based on scores from the
computerized battery. Raw scores from this battery were first winsorized to limit the
influence of extreme values: this was done by replacing scores less than the 1st percentile of
the cohort wide distribution with the value of the 1st percentile and replacing scores greater
than the 99th percentile with the 99th percentile value. Z-scores were formed for each
cognitive test score by dividing their difference from the baseline mean by the baseline
Sink et al. Page 5
JAMA. Author manuscript; available in PMC 2016 August 25.
Author M
anuscriptA
uthor Manuscript
Author M
anuscriptA
uthor Manuscript
standard deviation. Composite scores for the HVLT-R (immediate and delayed recall
scores), n-back (1- and 2-back scores), task switching (no switch and switch reaction times),
and flanker tasks (congruent and incongruent reaction times) were formed by averaging the
z-scores for their two individual components. The global cognitive function score was the
average of scores from these composites and the z-transformed DSC, renormalized to have
mean 0 and standard deviation 1 at baseline. The executive function composite score was the
renormalized average of scores from the n-back, task switching, and Flanker tasks. In
creating these composite scores, averages were taken of all available data, i.e., missing data
if participants did not complete the full battery were ignored. Supporting analyses were
conducted using multiple imputation in which missing measures and exam scores were
imputed to create five databases that were analyzed in parallel.32
Subgroup comparisons using interaction terms were pre-specified for gender and baseline
SPPB (<8 versus ≥8), 3MSE (<90 versus ≥90), and age (70–79 years versus ≥80 years).
Associations between changes in cognitive function and changes in objective and subjective
physical activity were assessed using linear regression and tests of interactions.
Progression in cognitve impairment (i.e., from baseline normal cognitive function to either
MCI or dementia or from baseline MCI to dementia), was a tertiary outcome. Logistic
regression was used to compare progression rates between intervention groups. Participants
with prevalent MCI (n=141) at baseline were not included in the incidence of MCI, but were
included in the incident dementia outcome if they progressed to dementia at 24 months.
Seven participants were adjudicated to have dementia at the baseline visit (in spite of
otherwise meeting LIFE entry criteria). These participants were excluded from the incident
dementia outcome analysis.
Analyses were conducted using SAS 9.4; two-sided inferences with p<0.05 were considered
statistically significant. The targeted sample size (N=1600) was expected to provide 87%
power to detect mean differences between groups of 0.15 SD for cognitive tests. This was
projected to correspond to mean differences of 1.8 units for DSC scores and 0.8 units for
HVLT immediate memory scores.
Results
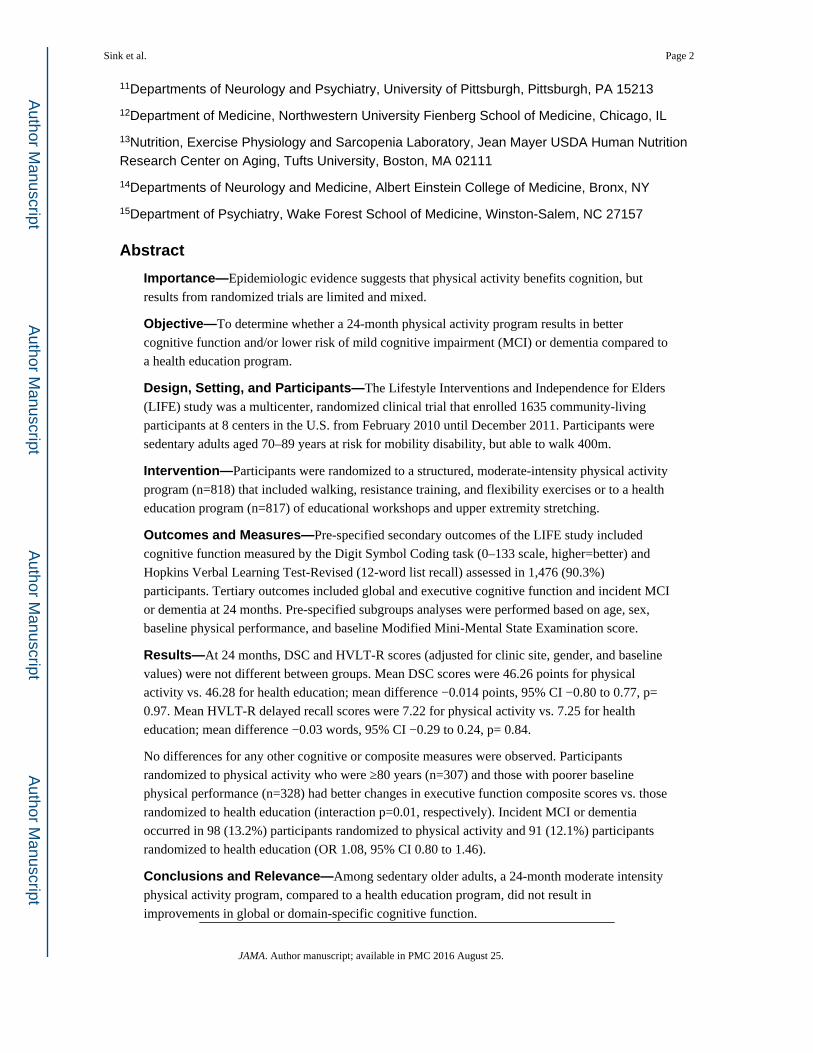
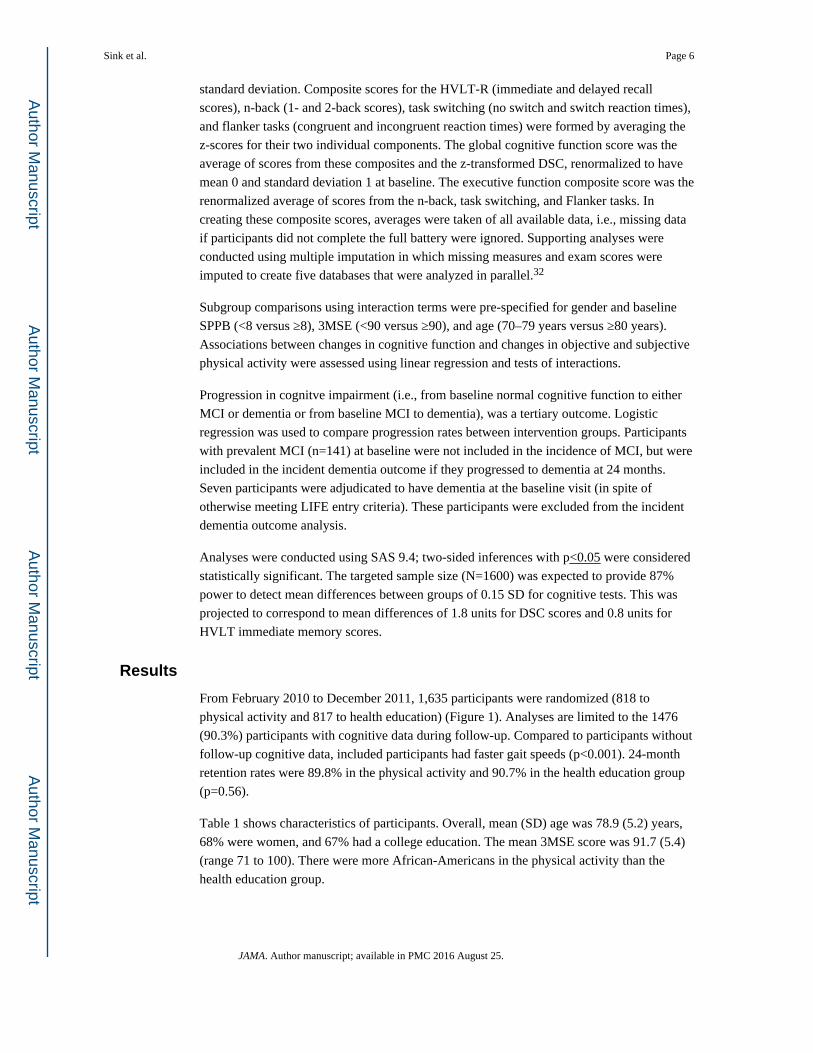
From February 2010 to December 2011, 1,635 participants were randomized (818 to
physical activity and 817 to health education) (Figure 1). Analyses are limited to the 1476
(90.3%) participants with cognitive data during follow-up. Compared to participants without
follow-up cognitive data, included participants had faster gait speeds (p<0.001). 24-month
retention rates were 89.8% in the physical activity and 90.7% in the health education group
(p=0.56).
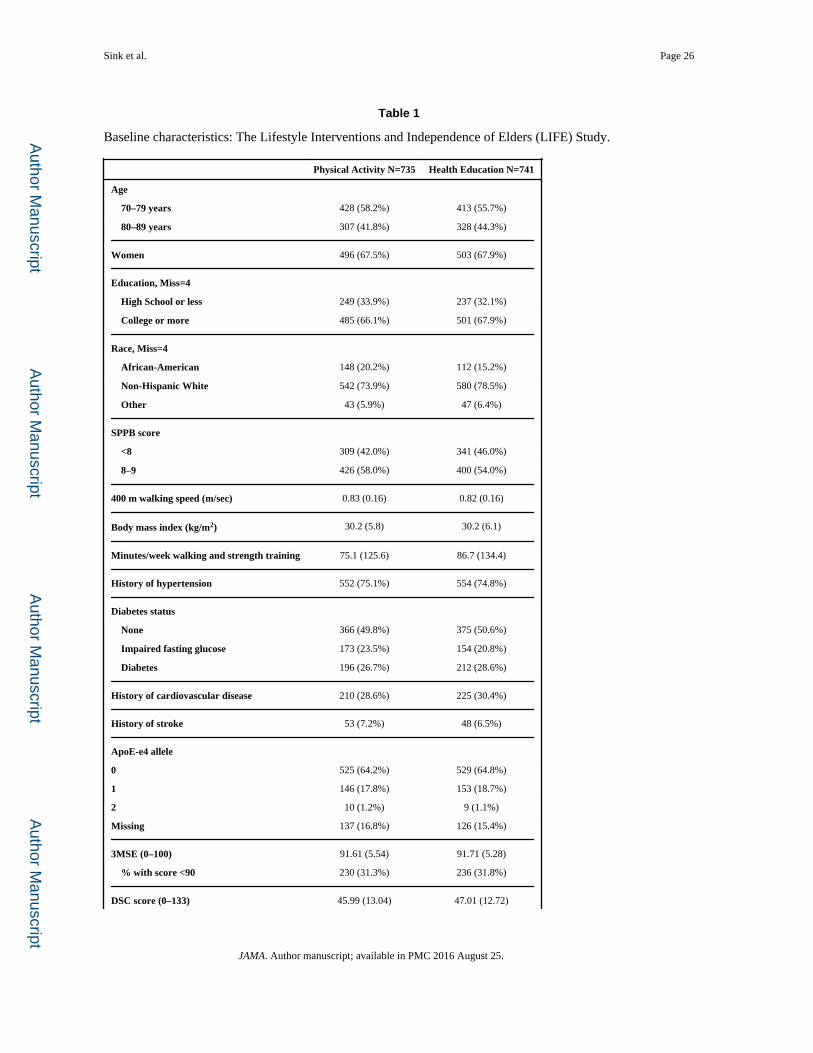
Table 1 shows characteristics of participants. Overall, mean (SD) age was 78.9 (5.2) years,
68% were women, and 67% had a college education. The mean 3MSE score was 91.7 (5.4)
(range 71 to 100). There were more African-Americans in the physical activity than the
health education group.
Sink et al. Page 6
JAMA. Author manuscript; available in PMC 2016 August 25.
Author M
anuscriptA
uthor Manuscript
Author M
anuscriptA
uthor Manuscript
Intervention adherence
Based on accelerometry data, and compared to the health education group, the physical
activity group maintained moderate/vigorous physical activity between baseline and 24-
month follow-up (mean −2.1 minutes/week (95% CI −9.7 to 13.9) vs −40.4 minutes/week
(95% CI −29.4 to −51.4), p<0.001). Based on CHAMPS questionnaire data, and compared
to the health education group, the physical activity group had greater increase in self-
reported physical activity from baseline to 24 months (mean +130.4 min/week (95% CI
116.7 to 144.1) vs +30.5 min/week (95% CI 18.9 to 42.1), p<0.001). The median attendance
at physical activity sessions was 71%, excluding medical leave.
Cognitive function results
At baseline, interviewer-administered cognitive assessments were collected on all
participants. Computer-based assessments were collected on 85.5% (2-back) to 96.2%
(Flanker) of participants. There were no differences between groups on any cognitive tests at
baseline.
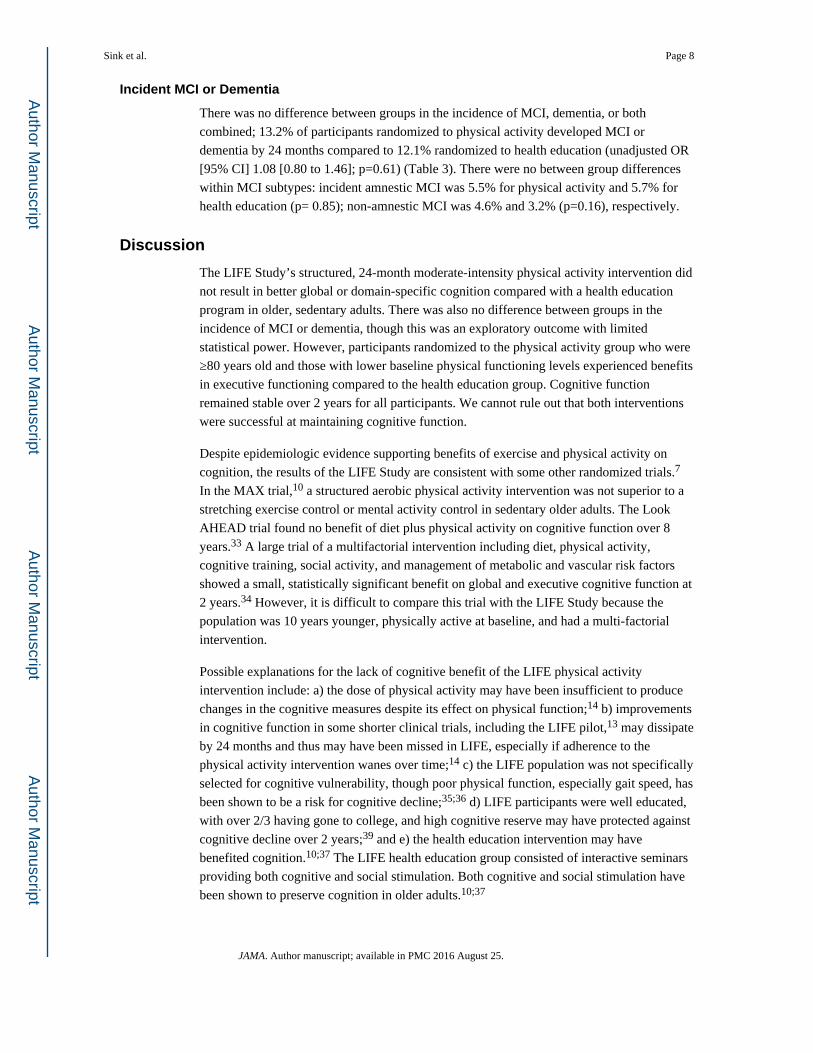
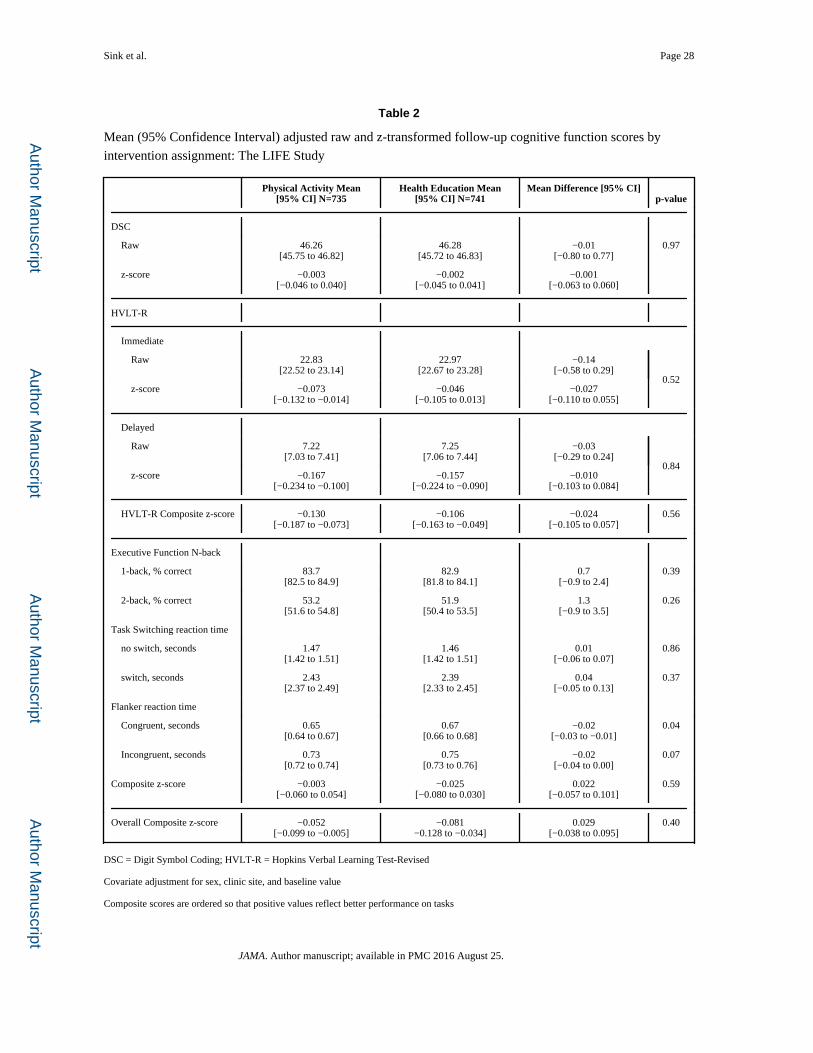
Table 2 presents the raw scores and z-transformed cognitive outcomes, adjusting for clinic
site, gender, and baseline values. Z-scores are interpreted as the change from baseline in
standard deviations. The adjusted mean raw DSC scores (range 1–133) at follow up were not
different between groups (46.26 points (95% CI 45.71 to 46.82) in the physical activity
group and 46.28 (95% CI 45.73 to 46.83) in the health education; mean difference −0.01
points, 95% CI −0.80 to 0.77, p= 0.97). Similarly, adjusted mean HVLT-R delayed recall
scores (range 0–12) were not different between groups (7.22 words (95% CI 7.03 to 7.41)
for physical activity vs. 7.25 (95% CI 7.06 to 7.44) for health education; mean difference
−0.03 words, 95% CI −0.29 to 0.24, p= 0.84). There were no between-group differences in
the executive function composite z-score (p=0.59) or mean global composite score (p=0.40).
Additional adjustment for race/ethnicity and education did not change the results.
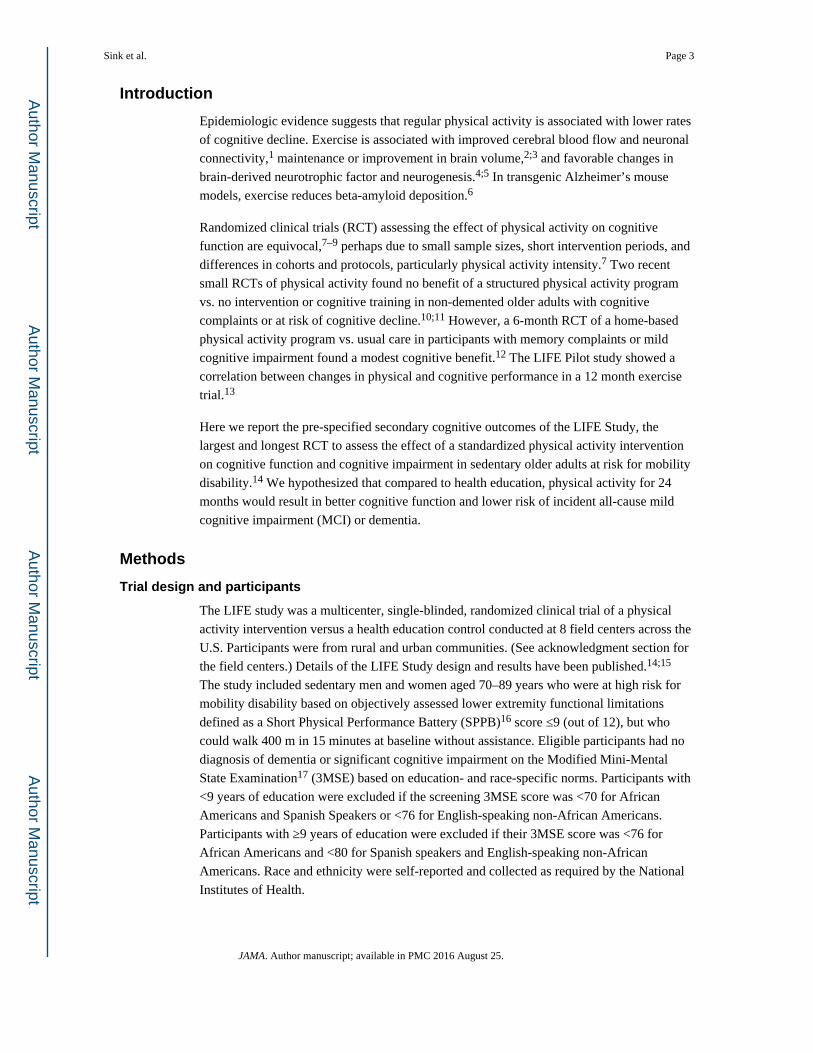
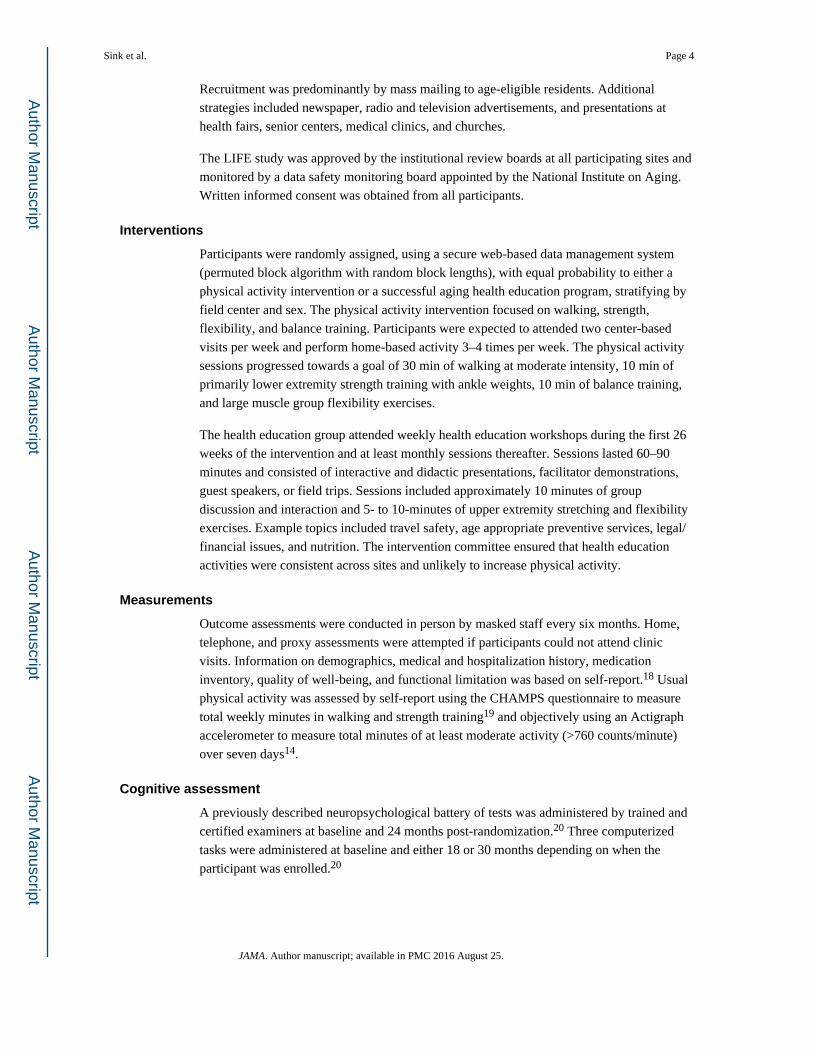
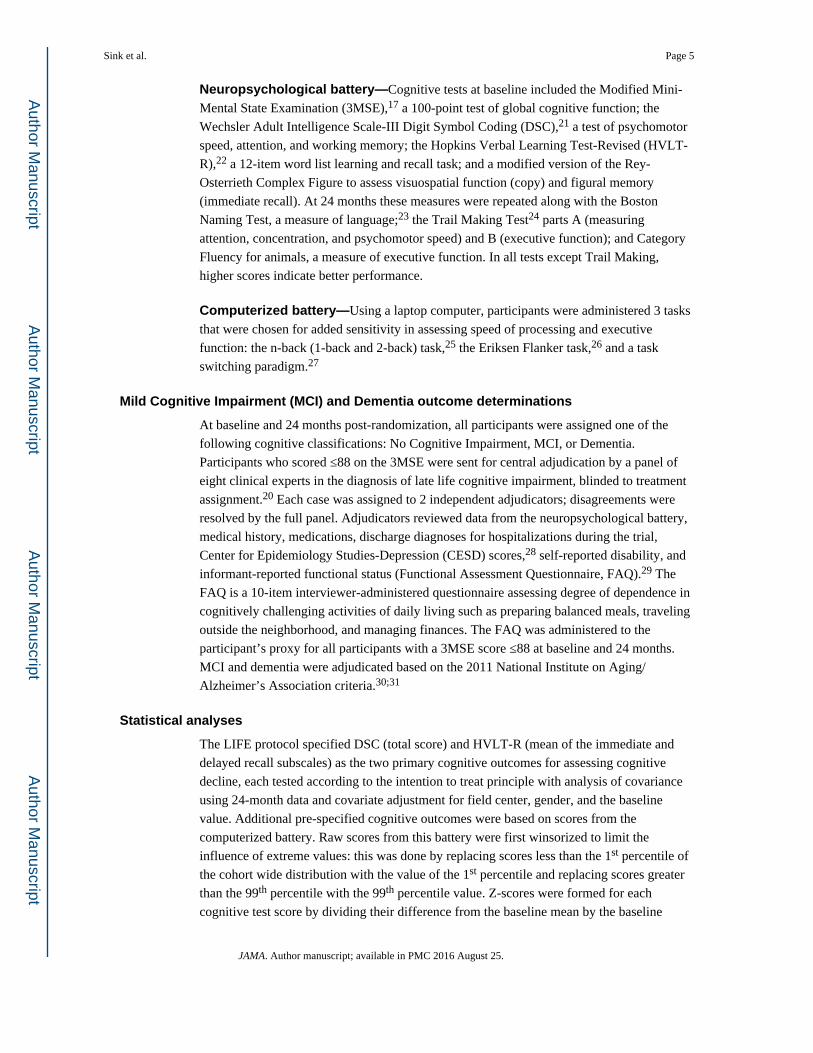
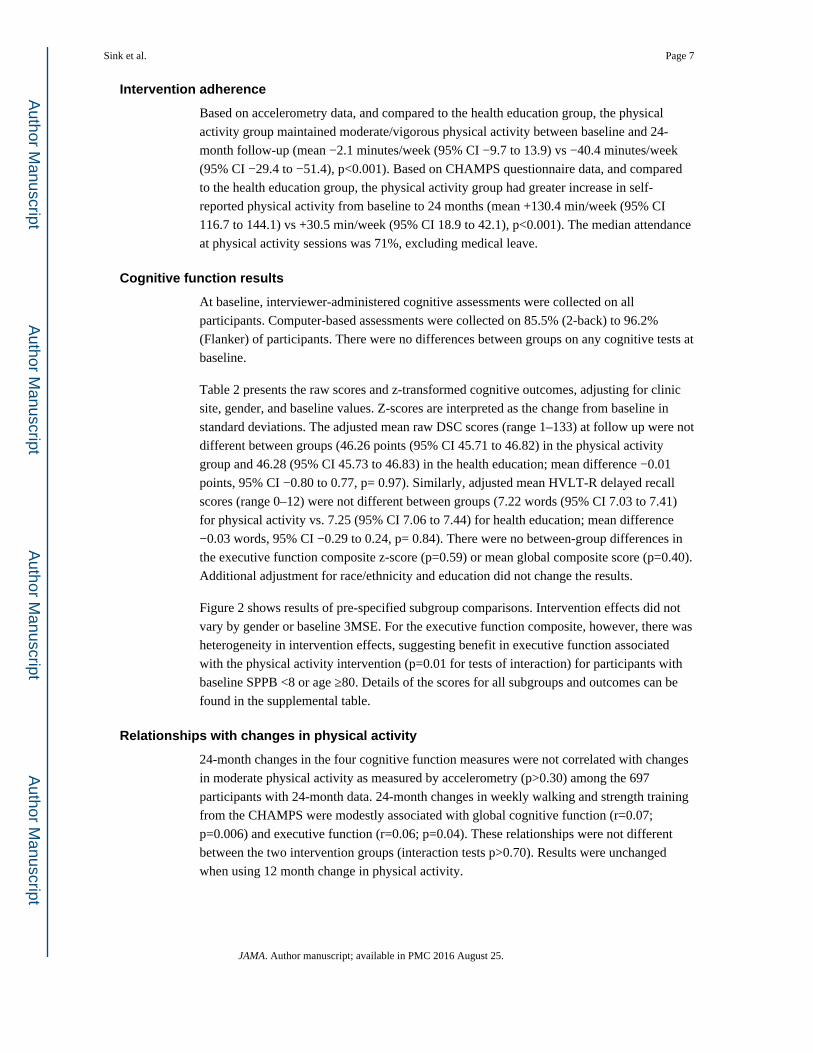
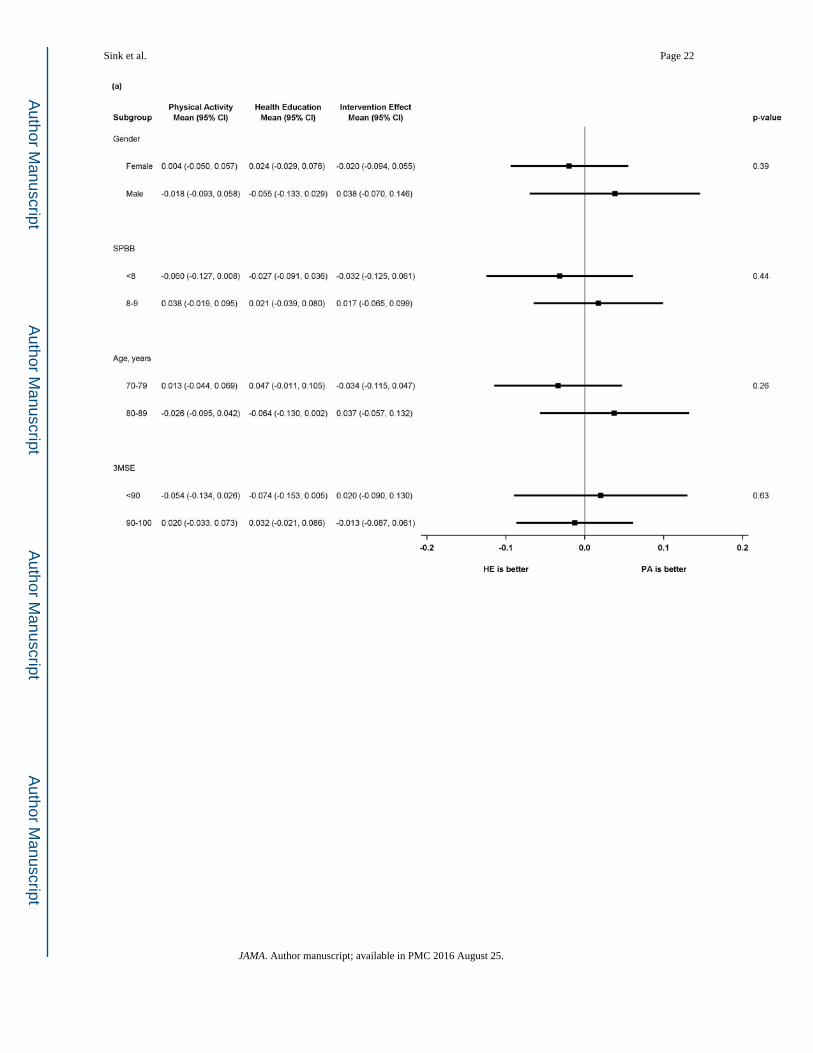
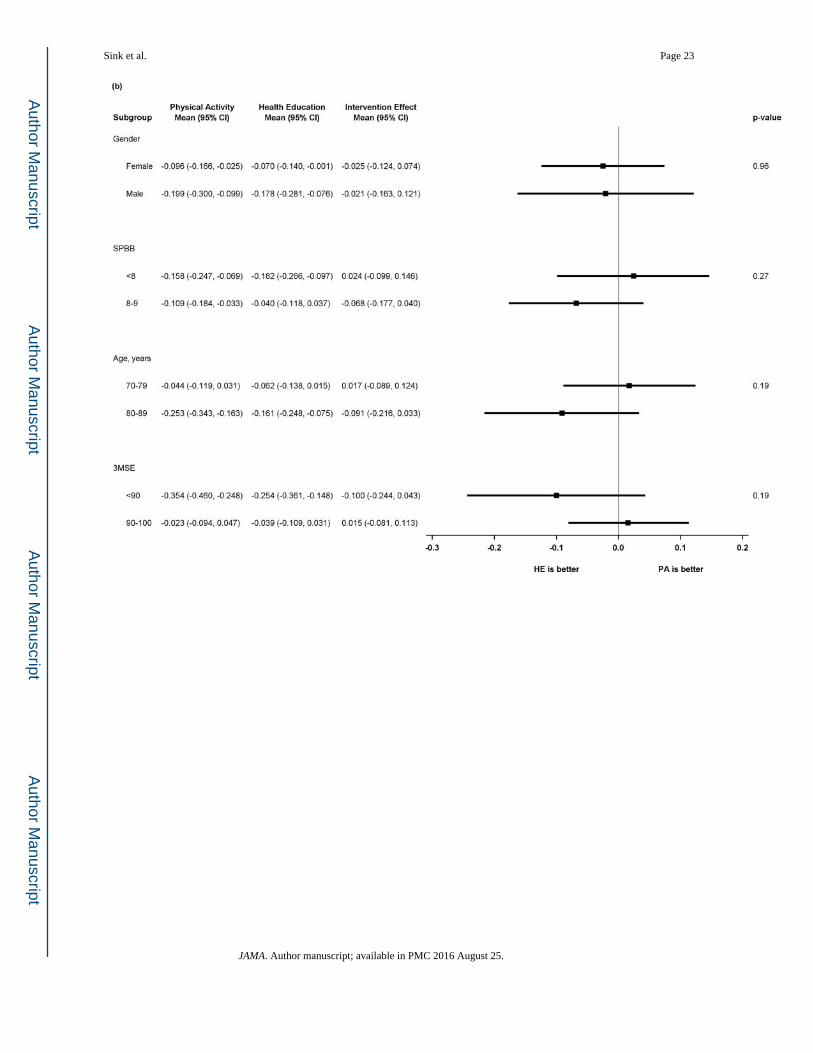
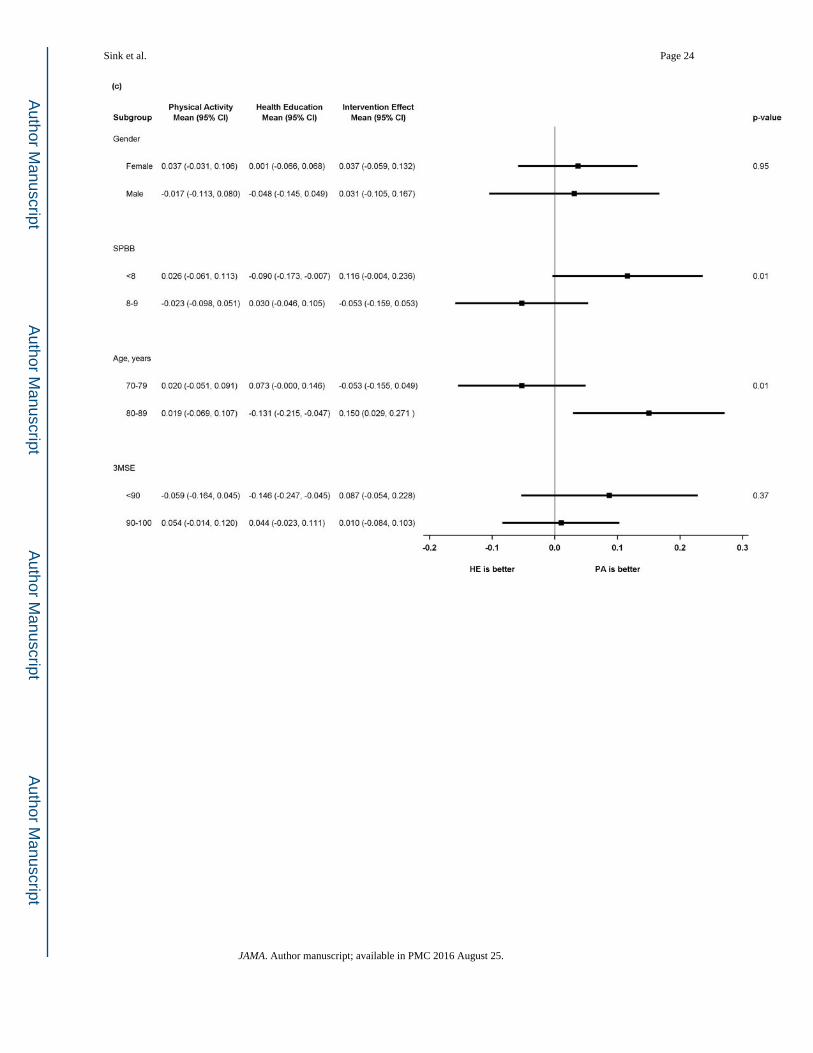
Figure 2 shows results of pre-specified subgroup comparisons. Intervention effects did not
vary by gender or baseline 3MSE. For the executive function composite, however, there was
heterogeneity in intervention effects, suggesting benefit in executive function associated
with the physical activity intervention (p=0.01 for tests of interaction) for participants with
baseline SPPB <8 or age ≥80. Details of the scores for all subgroups and outcomes can be
found in the supplemental table.
Relationships with changes in physical activity
24-month changes in the four cognitive function measures were not correlated with changes
in moderate physical activity as measured by accelerometry (p>0.30) among the 697
participants with 24-month data. 24-month changes in weekly walking and strength training
from the CHAMPS were modestly associated with global cognitive function (r=0.07;
p=0.006) and executive function (r=0.06; p=0.04). These relationships were not different
between the two intervention groups (interaction tests p>0.70). Results were unchanged
when using 12 month change in physical activity.
Sink et al. Page 7
JAMA. Author manuscript; available in PMC 2016 August 25.
Author M
anuscriptA
uthor Manuscript
Author M
anuscriptA
uthor Manuscript
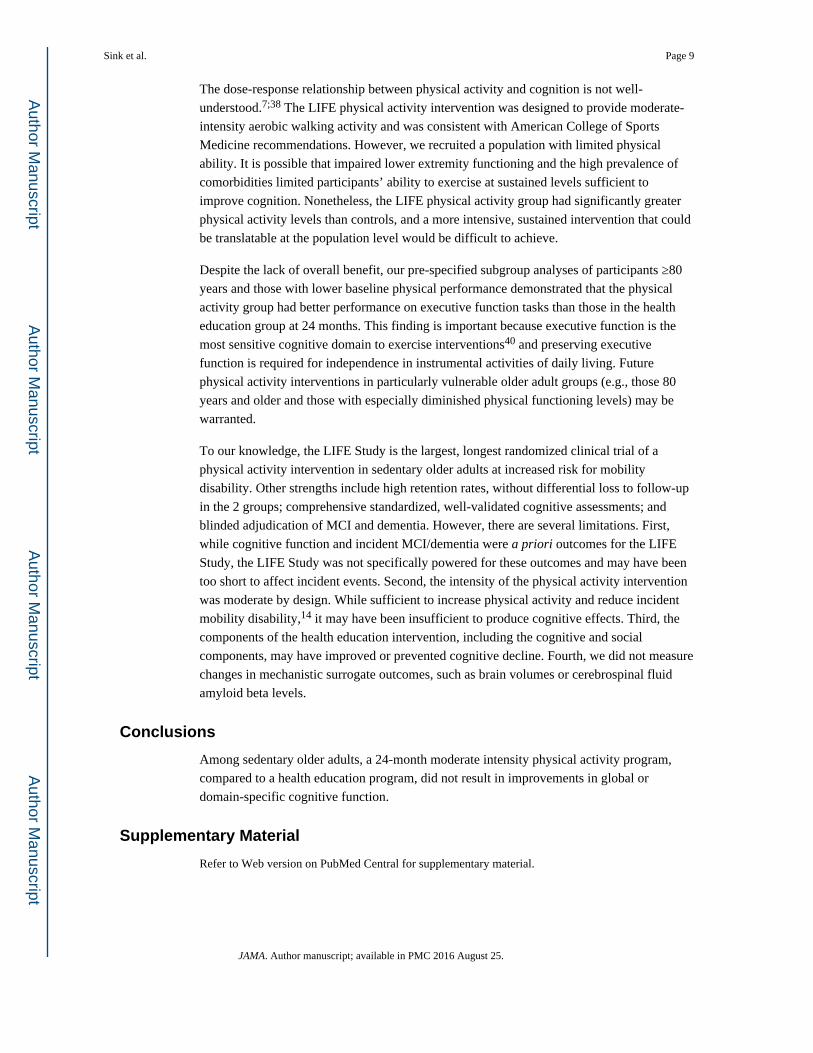
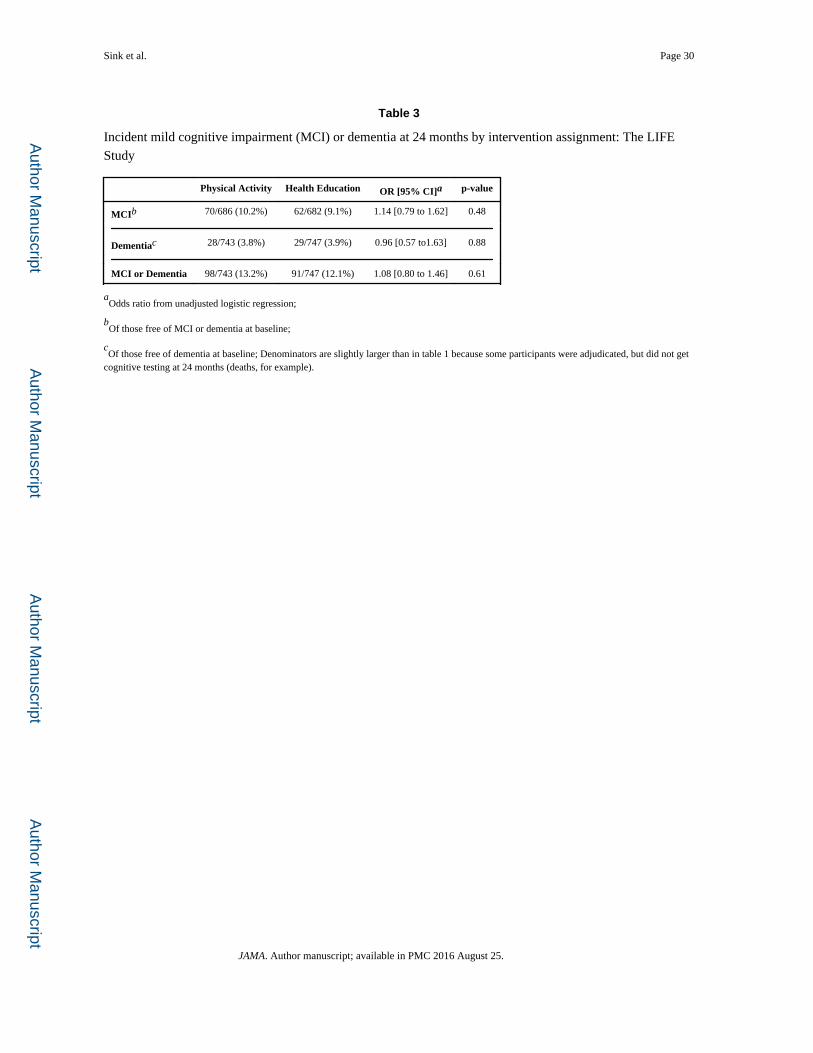
Incident MCI or Dementia
There was no difference between groups in the incidence of MCI, dementia, or both
combined; 13.2% of participants randomized to physical activity developed MCI or
dementia by 24 months compared to 12.1% randomized to health education (unadjusted OR
[95% CI] 1.08 [0.80 to 1.46]; p=0.61) (Table 3). There were no between group differences
within MCI subtypes: incident amnestic MCI was 5.5% for physical activity and 5.7% for
health education (p= 0.85); non-amnestic MCI was 4.6% and 3.2% (p=0.16), respectively.
Discussion
The LIFE Study’s structured, 24-month moderate-intensity physical activity intervention did
not result in better global or domain-specific cognition compared with a health education
program in older, sedentary adults. There was also no difference between groups in the
incidence of MCI or dementia, though this was an exploratory outcome with limited
statistical power. However, participants randomized to the physical activity group who were
≥80 years old and those with lower baseline physical functioning levels experienced benefits
in executive functioning compared to the health education group. Cognitive function
remained stable over 2 years for all participants. We cannot rule out that both interventions
were successful at maintaining cognitive function.
Despite epidemiologic evidence supporting benefits of exercise and physical activity on
cognition, the results of the LIFE Study are consistent with some other randomized trials.7
In the MAX trial,10 a structured aerobic physical activity intervention was not superior to a
stretching exercise control or mental activity control in sedentary older adults. The Look
AHEAD trial found no benefit of diet plus physical activity on cognitive function over 8
years.33 A large trial of a multifactorial intervention including diet, physical activity,
cognitive training, social activity, and management of metabolic and vascular risk factors
showed a small, statistically significant benefit on global and executive cognitive function at
2 years.34 However, it is difficult to compare this trial with the LIFE Study because the
population was 10 years younger, physically active at baseline, and had a multi-factorial
intervention.
Possible explanations for the lack of cognitive benefit of the LIFE physical activity
intervention include: a) the dose of physical activity may have been insufficient to produce
changes in the cognitive measures despite its effect on physical function;14 b) improvements
in cognitive function in some shorter clinical trials, including the LIFE pilot,13 may dissipate
by 24 months and thus may have been missed in LIFE, especially if adherence to the
physical activity intervention wanes over time;14 c) the LIFE population was not specifically
selected for cognitive vulnerability, though poor physical function, especially gait speed, has
been shown to be a risk for cognitive decline;35;36 d) LIFE participants were well educated,
with over 2/3 having gone to college, and high cognitive reserve may have protected against
cognitive decline over 2 years;39 and e) the health education intervention may have
benefited cognition.10;37 The LIFE health education group consisted of interactive seminars
providing both cognitive and social stimulation. Both cognitive and social stimulation have
been shown to preserve cognition in older adults.10;37
Sink et al. Page 8
JAMA. Author manuscript; available in PMC 2016 August 25.
Author M
anuscriptA
uthor Manuscript
Author M
anuscriptA
uthor Manuscript
The dose-response relationship between physical activity and cognition is not well-
understood.7;38 The LIFE physical activity intervention was designed to provide moderate-
intensity aerobic walking activity and was consistent with American College of Sports
Medicine recommendations. However, we recruited a population with limited physical
ability. It is possible that impaired lower extremity functioning and the high prevalence of
comorbidities limited participants’ ability to exercise at sustained levels sufficient to
improve cognition. Nonetheless, the LIFE physical activity group had significantly greater
physical activity levels than controls, and a more intensive, sustained intervention that could
be translatable at the population level would be difficult to achieve.
Despite the lack of overall benefit, our pre-specified subgroup analyses of participants ≥80
years and those with lower baseline physical performance demonstrated that the physical
activity group had better performance on executive function tasks than those in the health
education group at 24 months. This finding is important because executive function is the
most sensitive cognitive domain to exercise interventions40 and preserving executive
function is required for independence in instrumental activities of daily living. Future
physical activity interventions in particularly vulnerable older adult groups (e.g., those 80
years and older and those with especially diminished physical functioning levels) may be
warranted.
To our knowledge, the LIFE Study is the largest, longest randomized clinical trial of a
physical activity intervention in sedentary older adults at increased risk for mobility
disability. Other strengths include high retention rates, without differential loss to follow-up
in the 2 groups; comprehensive standardized, well-validated cognitive assessments; and
blinded adjudication of MCI and dementia. However, there are several limitations. First,
while cognitive function and incident MCI/dementia were a priori outcomes for the LIFE
Study, the LIFE Study was not specifically powered for these outcomes and may have been
too short to affect incident events. Second, the intensity of the physical activity intervention
was moderate by design. While sufficient to increase physical activity and reduce incident
mobility disability,14 it may have been insufficient to produce cognitive effects. Third, the
components of the health education intervention, including the cognitive and social
components, may have improved or prevented cognitive decline. Fourth, we did not measure
changes in mechanistic surrogate outcomes, such as brain volumes or cerebrospinal fluid
amyloid beta levels.
Conclusions
Among sedentary older adults, a 24-month moderate intensity physical activity program,
compared to a health education program, did not result in improvements in global or
domain-specific cognitive function.
Supplementary Material
Refer to Web version on PubMed Central for supplementary material.
Sink et al. Page 9
JAMA. Author manuscript; available in PMC 2016 August 25.
Author M
anuscriptA
uthor Manuscript
Author M
anuscriptA
uthor Manuscript
Acknowledgments
Mark Espeland had full access to all of the data in the study and takes responsibility for the integrity of the data and the accuracy of the data analysis.
Valerie K. Wilson, MD (Adjunct Instructor, Wake Forest School of Medicine, Winston Salem, NC and Staff physician, Veterans Affairs, Johnson City, TN) contributed to the work reported in this manuscript as an adjudicator of cognitive outcomes. She received compensation for her effort.
Funding:
The Lifestyle Interventions and Independence for Elders Study is funded by a National Institutes on Health/National Institute on Aging Cooperative Agreement #UO1 AG22376 and a supplement from the National Heart, Lung and Blood Institute 3U01AG022376-05A2S, and sponsored in part by the Intramural Research Program, National Institute on Aging, NIH.
This research is also supported by the following Claude D. Pepper Older Americans Independence Centers: Boston (1P30AG031679), Florida (1 P30 AG028740), Pittsburgh (P30 AG024827), Wake Forest (1 P30 AG21332) and Yale (P30AG021342).
Dr. Ried’s contribution is partially supported by the U.S. Department of Agriculture, under agreement No. 58-1950-7-707. Any opinions, findings, conclusion, or recommendations expressed in this publication are those of the author(s) and do not necessarily reflect the view of the U.S. Dept of Agriculture.
Role of the Sponsors: The NIH sponsor was avoting member (1 of 12 votes) of the LIFE Steering Committee, which approved the design and conduct of the study; collection, management, analysis, and interpretation of the data; preparation, review, and approval of the manuscript; and decision to submit the manuscript for publication.
Appendix: Research Investigators for the LIFE Study
Northwestern University, Chicago, IL
Mary M. McDermott, MD – Field Center Principal Investigator
Bonnie Spring, PhD – Field Center Co-Principal Investigator
Joshua Hauser, MD
Martha Gulati, MD
Sanjiv Shah, MD
Kathryn Domanchuk
Rex Graff
Kasia Kadela
Alvito Rego
Pennington Biomedical Research Center, LA
Timothy Church, MD, PhD, MPH – Field Center Principal Investigator
Steven Blair, PED (University of South Carolina)
Valerie Myers, PhD
Sink et al. Page 10
JAMA. Author manuscript; available in PMC 2016 August 25.
Author M
anuscriptA
uthor Manuscript
Author M
anuscriptA
uthor Manuscript
Ron Monce, PA-C
Nathan Britt, NP
Melissa Nauta, BS
Ami Parks, MPA, BS
Ruben Rodarte, MBA, MS, BS
Heidi Millet, BS
Catrine Tudor-Locke, PhD, FACSM
Ben Butitta, BS
Sheletta Donatto, MS, RD, LDN, CDE
National Heart, Lung and Blood Institute, Bethesda, MD
Denise Bonds, MD
National Institute on Aging, Bethesda, MD
Evan C. Hadley, MD
Kushang V. Patel, PhD
Sergei Romashkan, MD, PhD
Office of Behavioral and Social Sciences Research, National Institutes of Health
Robert M. Kaplan, PhD
Stanford University, Palo Alto, CA
Abby C. King, PhD – Field Center Principal Investigator
Cynthia M. Castro, PhD
William L. Haskell, PhD
Randall S. Stafford, MD, PhD
Veronica Yank, MD
Leslie A. Pruitt, PhD
Kathy Berra, MSN, NP-C, FAAN
Carol Bell, NP
Sink et al. Page 11
JAMA. Author manuscript; available in PMC 2016 August 25.
Author M
anuscriptA
uthor Manuscript
Author M
anuscriptA
uthor Manuscript
Rosita Thiessen
Kate P. Youngman, MA
Selene B. Virgen, BAS
Kristina N. Tarin, MS, CSCS
Heather Klaftenegger
Carolyn A. Prosak, RD
Ines Campero, BA
Dulce M. Garcia
José Soto, BA
Linda Chio
David Hoskins, MS
Tufts University, Boston, MA
Roger Fielding, PhD – Field Center Principal Investigator
Miriam Nelson, PhD
Sara Folta, PhD
Edward Phillips, MD
Christine Liu, MD
Erica Cifarelli, MS
Kieran Reid, MSc, MPH
Paige Lacasse, BS
Dylan Kirn, BS
Evan Pasha, BS
Sonnly Ribourg, BS
Karen Ruais, NP
Won Kim, BS
Gregory Cloutier, BS
Sink et al. Page 12
JAMA. Author manuscript; available in PMC 2016 August 25.
Author M
anuscriptA
uthor Manuscript
Author M
anuscriptA
uthor Manuscript
University of Florida, Gainesville, FL
- Todd Manini, PhD
Field Center Principal Investigator
Marco Pahor, MD – Field Center Co-Principal Investigator
Stephen Anton, PhD
Thomas Buford, PhD
Susan Nayfield, MD, MSc
Joe Nocera, PhD
Michael Marsiske, PhD
Bhanu Sandesara, MD
Jocelyn Lee, PhD
Deborah Hiatt-Jensen, ARNP, MPH
Mieniecia Black, MS
Kimberly Case, PhD
Katherine Herring, BS
Amber Schwier-Delvisco, BS
Bill Burk
Brian Hoover, BS
Jeffrey Knaggs, BS
Allison Martin, MS, RCEP
Brooks Center for Rehabilitation Studies (Satellite Site)
Chonglun Xie, MD
Holly Morris, RN
Flo Singletary, MS, CCC-SLP
Jackie Causer
Susan Yonce, RN
Sink et al. Page 13
JAMA. Author manuscript; available in PMC 2016 August 25.
Author M
anuscriptA
uthor Manuscript
Author M
anuscriptA
uthor Manuscript
Christine Del Boccio
Charles Gay, D.C.
Tangerica Peavy Alexander
Administrative Coordinating Center
Marco Pahor, MD – Principal Investigator of the LIFE Study
Stephen Anton, PhD
Thomas Buford, PhD
Christiaan Leeuwenburgh, PhD
Susan Nayfield, MD, MSc
Todd Manini, PhD
Connie Caudle
Lauren Crump, MPH
Latonia Holmes
Jocelyn Lee, PhD
Ronald Lester, PhD, MBA
Ching-ju Lu, MPH
Ryan O’Mara
Electrocardiogram Reading Center
Carl J. Pepine MD, MACC
Mario Ariet, PhD
Eileen Handberg, PhD, ARNP
Daniel Deluca, BS
James Hill, MD, MS, FACC
University of Maryland School of Medicine, Baltimore, MD
Jack M. Guralnik, MD, PhD – Co-Principal Investigator of the LIFE Study
University of Pittsburgh, Pittsburgh, PA
Sink et al. Page 14
JAMA. Author manuscript; available in PMC 2016 August 25.
Author M
anuscriptA
uthor Manuscript
Author M
anuscriptA
uthor Manuscript
Anne B. Newman, MD, MPH – Field Center Principal Investigator
Stephanie A. Studenski, MD, MPH – Field Center Co-Principal Investigator
Bret H. Goodpaster, PhD
Oscar Lopez, MD
Nancy W. Glynn, PhD
Janet T. Bonk, MPH, RN
Jennifer Rush, MPH
Piera Kost, BA
Allison Gerger, BS
Pamela Vincent, CMA
LaTisha Davis, BS
Mark A. Newman, PhD
George Grove, MS
Kathy Williams, RN, BSEd, MHSA
VA San Diego Healthcare System and University of California, San Diego, San Diego, CA
Erik J. Groessl, PhD
Wake Forest University, Winston-Salem, NC
Stephen B. Kritchevsky, PhD – Field Center Principal Investigator
Anthony Marsh, PhD – Field Center Co-Principal Investigator
Tina Brinkley, PhD
Jamehl Demons, MD
Kaycee Sink, MD, MAS
Kimberly Kennedy, BA, CCRC
Rachel Shertzer-Skinner, MA, CCRC
Abbie Wrights, MS
Rose Fries, RN, CCRC
Sink et al. Page 15
JAMA. Author manuscript; available in PMC 2016 August 25.
Author M
anuscriptA
uthor Manuscript
Author M
anuscriptA
uthor Manuscript
Deborah Barr, MA, RHEd, CHES
Cognition Reading Center
Jeff Williamson, MD, MHS – Center Principal Investigator
Kaycee M Sink, MD, MAS – Center Co-Principal Investigator
Hugh C. Hendrie, MB, ChB, DSc (Indiana University)
Stephen R. Rapp, PhD
Joe Verghese, MBBS (Albert Einstein College of Medicine of Yeshiva University)
Nancy Woolard
Valerie K Wilson, MD
Data Management, Analysis and Quality Control Center (DMAQC)
Michael E. Miller, PhD – DMAQC Principal Investigator
Mark Espeland, PhD – DMAQC Co-Principal Investigator
Walter Ambrosius, PhD
Don Babcock, BSEE, PE
Daniel Beavers, PhD, MS
Robert P. Byington, PhD, MPH, FAHA
Delilah Cook
Curt Furberg, MD, PhD
Candace Goode
Jason Griffin, BS
Lea Harvin, BS
Leora Henkin, MPH, Med
John Hepler, BFA
Fang-Chi Hsu, PhD
Kathy Joyce
Laura Lovato, MS
Sink et al. Page 16
JAMA. Author manuscript; available in PMC 2016 August 25.
Author M
anuscriptA
uthor Manuscript
Author M
anuscriptA
uthor Manuscript
Wesley Roberson, BSBA
Julia Robertson, BS
Julia Rushing, BSPH, MStat
Scott Rushing, BS
Cynthia L. Stowe, MPM
Michael P. Walkup, MS
Don Hire, BS
Jack Rejeski, PhD
Jeff Katula, PhD, MA
Peter H. Brubaker, PhD
Shannon Mihalko, PhD
Janine M. Jennings, PhD
Kathy Lane, BA
Yale University, New Haven, CT
Thomas M. Gill, MD – Field Center Principal Investigator
Robert S. Axtell, PhD, FACSM – Field Center Co-Principal Investigator (Southern
Connecticut State University, Exercise Science Department)
Susan S. Kashaf, MD, (VA Connecticut Healthcare System)
Nathalie de Renekeire, MD
Joanne M. McGloin, MDiv, MS, MBA
Raeleen Mautner, PhD
Sharon M. Huie-White, MPH
Luann Bianco, BA
Janice Zocher
Denise M. Shepard, RN, MBA
Barbara Fennelly, MA, RN
Sean Halpin, MA
Sink et al. Page 17
JAMA. Author manuscript; available in PMC 2016 August 25.
Author M
anuscriptA
uthor Manuscript
Author M
anuscriptA
uthor Manuscript
Theresa Barnett, MS, APRN
Karen C. Wu, RN
Lynne P. Iannone, MS
Julie A. Bugaj, MS
Christine Bailey, MA
Spirometry Reading Center
Geoffrey Chupp, MD
Gail Flynn, RCP, CRFT
Thomas M. Gill, MD
John Hankinson, PhD (Hankinson Consulting, Inc.)
Carlos A. Vaz Fragoso, MD
Reference List
1. Burdette JH, Laurienti PJ, Espeland MA, et al. Using network science to evaluate exercise-associated brain changes in older adults. Front Aging Neurosci. 2010; 2:23. [PubMed: 20589103]
2. Colcombe SJ, Erickson KI, Scalf PE, et al. Aerobic exercise training increases brain volume in aging humans. J Gerontol A Biol Sci Med Sci. 2006; 61:1166–1170. [PubMed: 17167157]
3. Erickson KI, Leckie RL, Weinstein AM. Physical activity, fitness, and gray matter volume. Neurobiol Aging. 2014; 35(Suppl 2):S20–S28. [PubMed: 24952993]
4. Coelho FG, Gobbi S, Andreatto CA, Corazza DI, Pedroso RV, Santos-Galduroz RF. Physical exercise modulates peripheral levels of brain-derived neurotrophic factor (BDNF): a systematic review of experimental studies in the elderly. Arch Gerontol Geriatr. 2013; 56:10–15. [PubMed: 22749404]
5. Erickson KI, Gildengers AG, Butters MA. Physical activity and brain plasticity in late adulthood. Dialogues Clin Neurosci. 2013; 15:99–108. [PubMed: 23576893]
6. Adlard PA, Perreau VM, Pop V, Cotman CW. Voluntary exercise decreases amyloid load in a transgenic model of Alzheimer’s disease. J Neurosci. 2005; 25:4217–4221. [PubMed: 15858047]
7. Snowden M, Steinman L, Mochan K, et al. Effect of exercise on cognitive performance in community-dwelling older adults: review of intervention trials and recommendations for public health practice and research. J Am Geriatr Soc. 2011; 59:704–716. [PubMed: 21438861]
8. Denkinger MD, Nikolaus T, Denkinger C, Lukas A. Physical activity for the prevention of cognitive decline: current evidence from observational and controlled studies. Z Gerontol Geriatr. 2012; 45:11–16. [PubMed: 22278001]
9. Smith PJ, Blumenthal JA, Hoffman BM, et al. Aerobic exercise and neurocognitive performance: a meta-analytic review of randomized controlled trials. Psychosom Med. 2010; 72:239–252. [PubMed: 20223924]
10. Barnes DE, Santos-Modesitt W, Poelke G, et al. The Mental Activity and eXercise (MAX) trial: a randomized controlled trial to enhance cognitive function in older adults. JAMA Intern Med. 2013; 173:797–804. [PubMed: 23545598]
11. Legault C, Jennings JM, Katula JA, et al. Designing clinical trials for assessing the effects of cognitive training and physical activity interventions on cognitive outcomes: the Seniors Health
Sink et al. Page 18
JAMA. Author manuscript; available in PMC 2016 August 25.
Author M
anuscriptA
uthor Manuscript
Author M
anuscriptA
uthor Manuscript
and Activity Research Program Pilot (SHARP-P) study, a randomized controlled trial. BMC Geriatr. 2011; 11:27. [PubMed: 21615936]
12. Lautenschlager NT, Cox KL, Flicker L, et al. Effect of physical activity on cognitive function in older adults at risk for Alzheimer disease: a randomized trial. JAMA. 2008; 300:1027–1037. [PubMed: 18768414]
13. Williamson JD, Espeland M, Kritchevsky SB, et al. Changes in cognitive function in a randomized trial of physical activity: results of the lifestyle interventions and independence for elders pilot study. J Gerontol A Biol Sci Med Sci. 2009; 64:688–694. [PubMed: 19244157]
14. Pahor M, Guralnik JM, Ambrosius WT, et al. Effect of structured physical activity on prevention of major mobility disability in older adults: the LIFE study randomized clinical trial. JAMA. 2014; 311:2387–2396. [PubMed: 24866862]
15. Fielding RA, Rejeski WJ, Blair SN, et al. The Lifestyle Interventions and Independence for Elders (LIFE) Study: Design and Methods. J Gerontol A Biol Sci Med Sci. 2011; 66:1226–1237. [PubMed: 21825283]
16. Guralnik JM, Ferrucci L, Simonsick EM, Salive ME, Wallace RB. Lower-extremity function in persons over the age of 70 years as a predictor of subsequent disability. N Engl J Med. 1995; 332:556–561. [PubMed: 7838189]
17. Teng EL, Chui HC. The Modified Mini-Mental State (3MS) examination. J Clin Psychiatry. 1987; 48:314–318. [PubMed: 3611032]
18. Rejeski WJ, Fielding RA, Blair SN, et al. The Lifestyle Interventions and Independence for Elders (LIFE) Pilot Study: Design and Methods. Contemp Clin Trials. 2005; 26:141–154. [PubMed: 15837437]
19. Stewart AL, Verboncoeur CJ, McLellan BY, et al. Physical activity outcomes of CHAMPS II: a physical activity promotion program for older adults. J Gerontol A Biol Sci Med Sci. 2001; 56:M465–M470. [PubMed: 11487597]
20. Sink KM, Espeland MA, Rushing J, et al. The LIFE Cognition Study: design and baseline characteristics. Clin Interv Aging. 2014; 9:1425–1436. [PubMed: 25210447]
21. Wechsler, D. WAIS-III manual. New York: Psychological Corporation; 1997.
22. Brandt, J.; Benedict, RHB. Hopkins Verbal Learning Test-Revised Professional manual. Lutz, FL: Psychological Assessment Resources, Inc; 2001.
23. Kaplan, E.; Goodglass, H.; Weintraub, S. The Boston Naming Test. 2nd. Philadelphia, PA: 1983.
24. Reitan, R. Trail Making Test. Manual for administration and scoring. Tucson, AZ: Neuropsychological Laboratory; 1992.
25. Kirchner WK. Age differences in short-term retention of rapidly changing information. J Exp Psychol. 1958; 55:352–358. [PubMed: 13539317]
26. Eriksen B, Eriksen CW. Effects of noise letters upon the identificaiton of a target letter in a nonsearch task. Perception & Psychophysics. 1974; 16:143–149.
27. Rogers R, Monsell S. Costs of a predictable switch between simple cognitive tasks. J Exp Psychol Gen. 1995; 124:207–231.
28. Weissman MM, Sholomskas D, Pottenger M, Prusoff BA, Locke BZ. Assessing depressive symptoms in five psychiatric populations: a validation study. Am J Epidemiol. 1977; 106:203–214. [PubMed: 900119]
29. Pfeffer RI, Kurosaki TT, Harrah CH Jr, Chance JM, Filos S. Measurement of functional activities in older adults in the community. J Gerontol. 1982; 37:323–329. [PubMed: 7069156]
30. Albert MS, DeKosky ST, Dickson D, et al. The diagnosis of mild cognitive impairment due to Alzheimer’s disease: recommendations from the National Institute on Aging-Alzheimer’s Association workgroups on diagnostic guidelines for Alzheimer’s disease. Alzheimers Dement. 2011; 7:270–279. [PubMed: 21514249]
31. McKhann GM, Knopman DS, Chertkow H, et al. The diagnosis of dementia due to Alzheimer’s disease: recommendations from the National Institute on Aging-Alzheimer’s Association workgroups on diagnostic guidelines for Alzheimer’s disease. Alzheimers Dement. 2011; 7:263–269. [PubMed: 21514250]
32. Yuan Y. Multiple Imputation Using SAS Software. J Statistical Software. 2011; 45:1–25.
Sink et al. Page 19
JAMA. Author manuscript; available in PMC 2016 August 25.
Author M
anuscriptA
uthor Manuscript
Author M
anuscriptA
uthor Manuscript
33. Espeland MA, Rapp SR, Bray GA, et al. Long-term impact of behavioral weight loss intervention on cognitive function. J Gerontol A Biol Sci Med Sci. 2014; 69:1101–1108. [PubMed: 24619151]
34. Ngandu T, Lehtisalo J, Solomon A, et al. A 2 year multidomain intervention of diet, exercise, cognitive training, and vascular risk monitoring versus control to prevent cognitive decline in at-risk elderly people (FINGER): a randomised controlled trial. Lancet. 2015; 385:2255–2263. [PubMed: 25771249]
35. Robertson DA, Savva GM, Coen RF, Kenny RA. Cognitive function in the prefrailty and frailty syndrome. J Am Geriatr Soc. 2014; 62:2118–2124. [PubMed: 25370593]
36. Mielke MM, Roberts RO, Savica R, et al. Assessing the temporal relationship between cognition and gait: slow gait predicts cognitive decline in the Mayo Clinic Study of Aging. J Gerontol A Biol Sci Med Sci. 2013; 68:929–937. [PubMed: 23250002]
37. Verghese J, Lipton RB, Katz MJ, et al. Leisure activities and the risk of dementia in the elderly. N Engl J Med. 2003; 348:2508–2516. [PubMed: 12815136]
38. Etnier JL, Nowell PM, Landers DM, Sibley BA. A meta-regression to examine the relationship between aerobic fitness and cognitive performance. Brain Res Rev. 2006; 52:119–130. [PubMed: 16490256]
39. Stern Y. Cognitive reserve in ageing and Alzheimer’s disease. Lancet Neurol. 2012; 11:1006–1012. [PubMed: 23079557]
40. Colcombe S, Kramer AF. Fitness effects on the cognitive function of older adults: a meta-analytic study. Psychol Sci. 2003; 14:125–130. [PubMed: 12661673]
Sink et al. Page 20
JAMA. Author manuscript; available in PMC 2016 August 25.
Author M
anuscriptA
uthor Manuscript
Author M
anuscriptA
uthor Manuscript
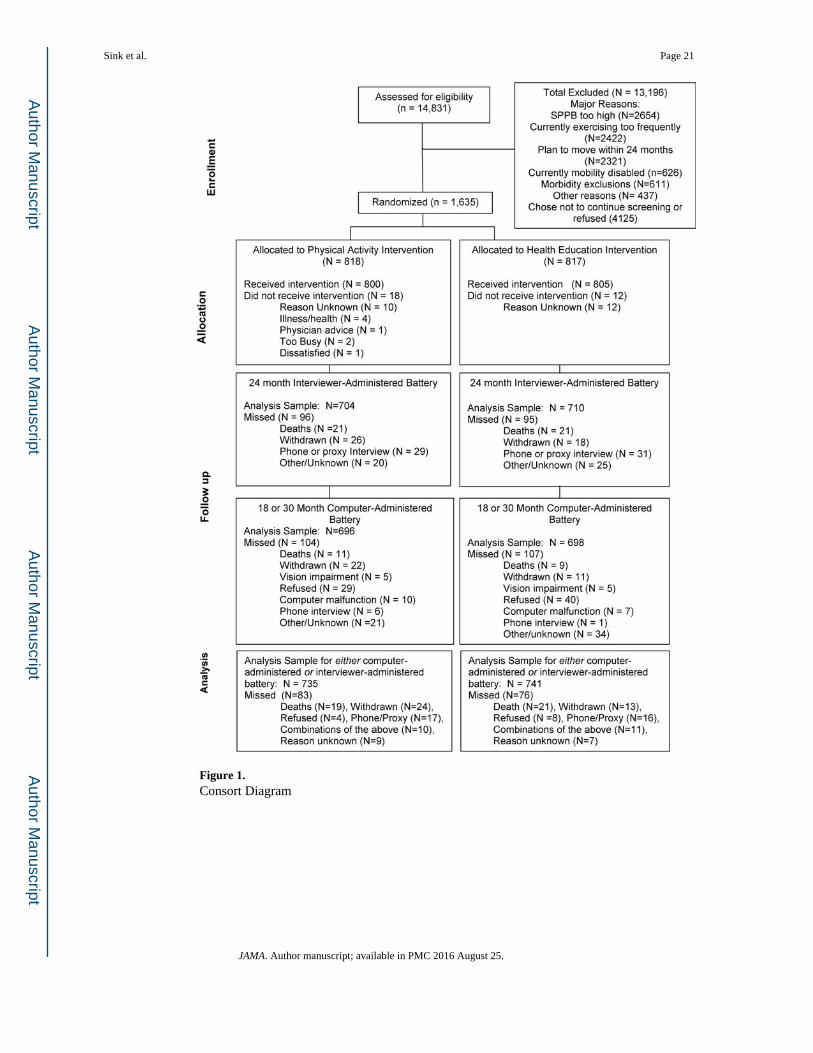
Figure 1. Consort Diagram
Sink et al. Page 21
JAMA. Author manuscript; available in PMC 2016 August 25.
Author M
anuscriptA
uthor Manuscript
Author M
anuscriptA
uthor Manuscript
Sink et al. Page 22
JAMA. Author manuscript; available in PMC 2016 August 25.
Author M
anuscriptA
uthor Manuscript
Author M
anuscriptA
uthor Manuscript
Sink et al. Page 23
JAMA. Author manuscript; available in PMC 2016 August 25.
Author M
anuscriptA
uthor Manuscript
Author M
anuscriptA
uthor Manuscript
Sink et al. Page 24
JAMA. Author manuscript; available in PMC 2016 August 25.
Author M
anuscriptA
uthor Manuscript
Author M
anuscriptA
uthor Manuscript
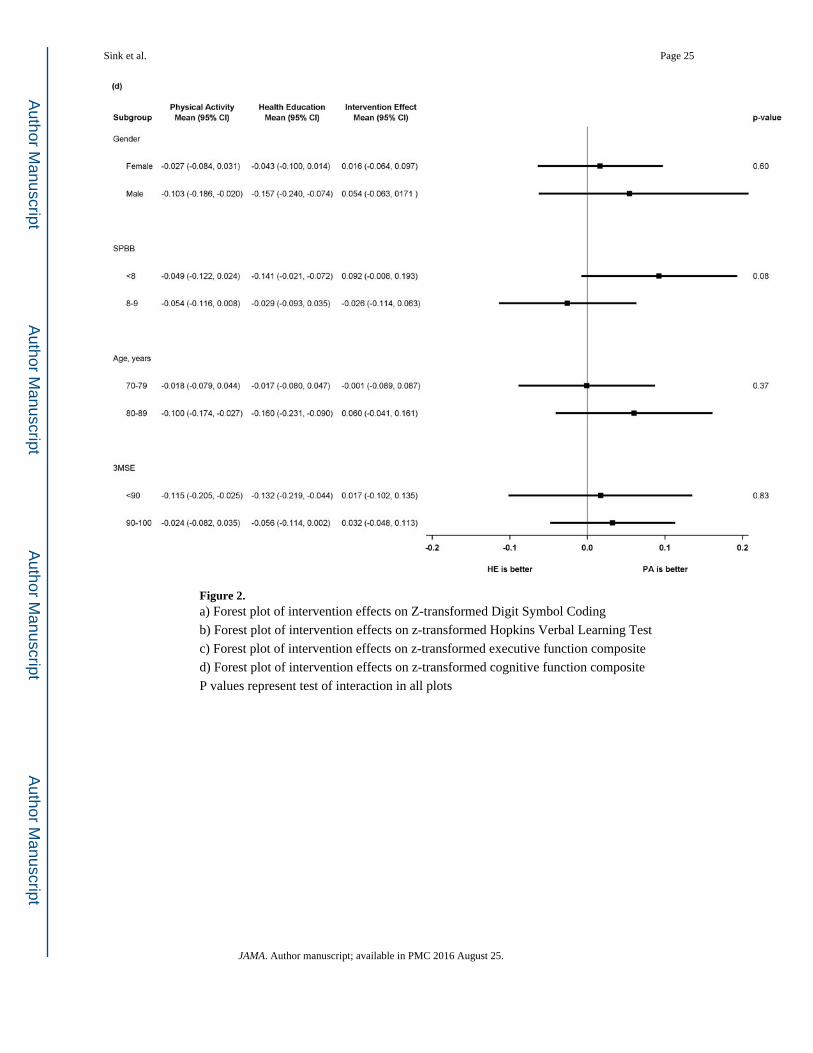
Figure 2. a) Forest plot of intervention effects on Z-transformed Digit Symbol Coding
b) Forest plot of intervention effects on z-transformed Hopkins Verbal Learning Test
c) Forest plot of intervention effects on z-transformed executive function composite
d) Forest plot of intervention effects on z-transformed cognitive function composite
P values represent test of interaction in all plots
Sink et al. Page 25
JAMA. Author manuscript; available in PMC 2016 August 25.
Author M
anuscriptA
uthor Manuscript
Author M
anuscriptA
uthor Manuscript
Author M
anuscriptA
uthor Manuscript
Author M
anuscriptA
uthor Manuscript
Sink et al. Page 26
Table 1
Baseline characteristics: The Lifestyle Interventions and Independence of Elders (LIFE) Study.
Physical Activity N=735 Health Education N=741
Age
70–79 years 428 (58.2%) 413 (55.7%)
80–89 years 307 (41.8%) 328 (44.3%)
Women 496 (67.5%) 503 (67.9%)
Education, Miss=4
High School or less 249 (33.9%) 237 (32.1%)
College or more 485 (66.1%) 501 (67.9%)
Race, Miss=4
African-American 148 (20.2%) 112 (15.2%)
Non-Hispanic White 542 (73.9%) 580 (78.5%)
Other 43 (5.9%) 47 (6.4%)
SPPB score
<8 309 (42.0%) 341 (46.0%)
8–9 426 (58.0%) 400 (54.0%)
400 m walking speed (m/sec) 0.83 (0.16) 0.82 (0.16)
Body mass index (kg/m2) 30.2 (5.8) 30.2 (6.1)
Minutes/week walking and strength training 75.1 (125.6) 86.7 (134.4)
History of hypertension 552 (75.1%) 554 (74.8%)
Diabetes status
None 366 (49.8%) 375 (50.6%)
Impaired fasting glucose 173 (23.5%) 154 (20.8%)
Diabetes 196 (26.7%) 212 (28.6%)
History of cardiovascular disease 210 (28.6%) 225 (30.4%)
History of stroke 53 (7.2%) 48 (6.5%)
ApoE-e4 allele
0 525 (64.2%) 529 (64.8%)
1 146 (17.8%) 153 (18.7%)
2 10 (1.2%) 9 (1.1%)
Missing 137 (16.8%) 126 (15.4%)
3MSE (0–100) 91.61 (5.54) 91.71 (5.28)
% with score <90 230 (31.3%) 236 (31.8%)
DSC score (0–133) 45.99 (13.04) 47.01 (12.72)
JAMA. Author manuscript; available in PMC 2016 August 25.
Author M
anuscriptA
uthor Manuscript
Author M
anuscriptA
uthor Manuscript
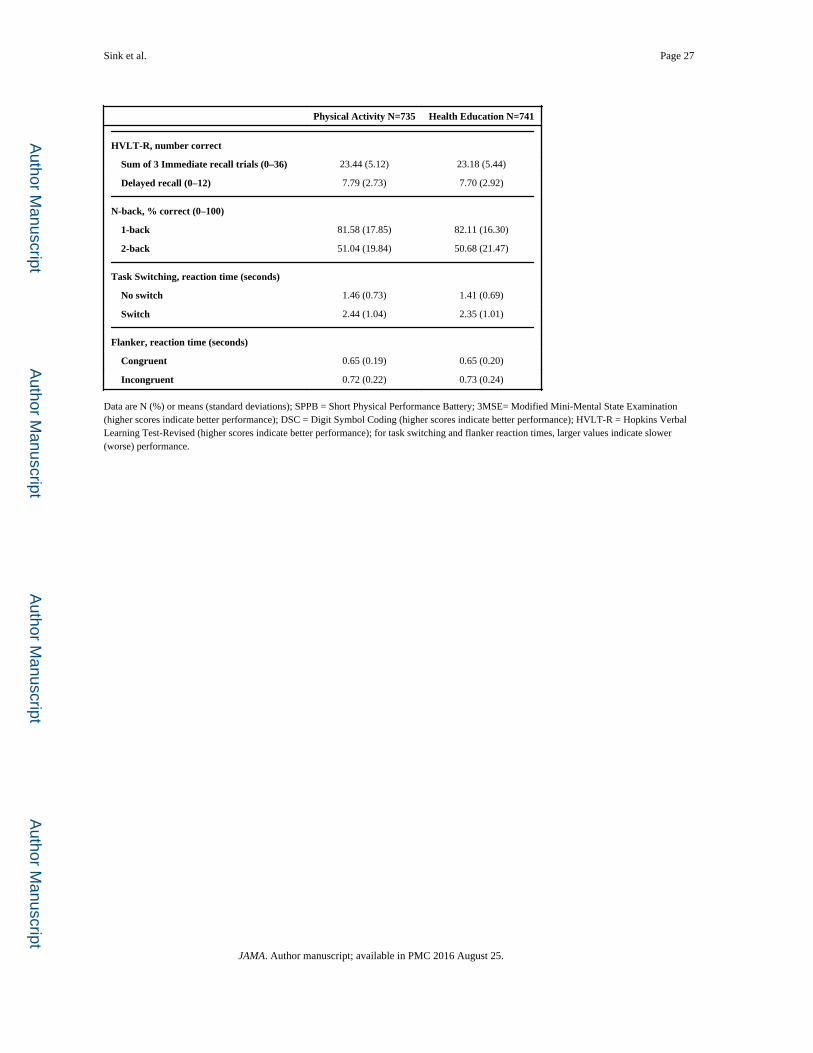
Sink et al. Page 27
Physical Activity N=735 Health Education N=741
HVLT-R, number correct
Sum of 3 Immediate recall trials (0–36) 23.44 (5.12) 23.18 (5.44)
Delayed recall (0–12) 7.79 (2.73) 7.70 (2.92)
N-back, % correct (0–100)
1-back 81.58 (17.85) 82.11 (16.30)
2-back 51.04 (19.84) 50.68 (21.47)
Task Switching, reaction time (seconds)
No switch 1.46 (0.73) 1.41 (0.69)
Switch 2.44 (1.04) 2.35 (1.01)
Flanker, reaction time (seconds)
Congruent 0.65 (0.19) 0.65 (0.20)
Incongruent 0.72 (0.22) 0.73 (0.24)
Data are N (%) or means (standard deviations); SPPB = Short Physical Performance Battery; 3MSE= Modified Mini-Mental State Examination (higher scores indicate better performance); DSC = Digit Symbol Coding (higher scores indicate better performance); HVLT-R = Hopkins Verbal Learning Test-Revised (higher scores indicate better performance); for task switching and flanker reaction times, larger values indicate slower (worse) performance.
JAMA. Author manuscript; available in PMC 2016 August 25.
Author M
anuscriptA
uthor Manuscript
Author M
anuscriptA
uthor Manuscript
Sink et al. Page 28
Table 2
Mean (95% Confidence Interval) adjusted raw and z-transformed follow-up cognitive function scores by
intervention assignment: The LIFE Study
Physical Activity Mean [95% CI] N=735
Health Education Mean [95% CI] N=741
Mean Difference [95% CI]p-value
DSC
Raw 46.26[45.75 to 46.82]
46.28[45.72 to 46.83]
−0.01[−0.80 to 0.77]
0.97
z-score −0.003[−0.046 to 0.040]
−0.002[−0.045 to 0.041]
−0.001[−0.063 to 0.060]
HVLT-R
Immediate
Raw 22.83[22.52 to 23.14]
22.97[22.67 to 23.28]
−0.14[−0.58 to 0.29]
0.52 z-score −0.073
[−0.132 to −0.014]−0.046
[−0.105 to 0.013]−0.027
[−0.110 to 0.055]
Delayed
Raw 7.22[7.03 to 7.41]
7.25[7.06 to 7.44]
−0.03[−0.29 to 0.24]
0.84 z-score −0.167
[−0.234 to −0.100]−0.157
[−0.224 to −0.090]−0.010
[−0.103 to 0.084]
HVLT-R Composite z-score −0.130[−0.187 to −0.073]
−0.106[−0.163 to −0.049]
−0.024[−0.105 to 0.057]
0.56
Executive Function N-back
1-back, % correct 83.7[82.5 to 84.9]
82.9[81.8 to 84.1]
0.7[−0.9 to 2.4]
0.39
2-back, % correct 53.2[51.6 to 54.8]
51.9[50.4 to 53.5]
1.3[−0.9 to 3.5]
0.26
Task Switching reaction time
no switch, seconds 1.47[1.42 to 1.51]
1.46[1.42 to 1.51]
0.01[−0.06 to 0.07]
0.86
switch, seconds 2.43[2.37 to 2.49]
2.39[2.33 to 2.45]
0.04[−0.05 to 0.13]
0.37
Flanker reaction time
Congruent, seconds 0.65[0.64 to 0.67]
0.67[0.66 to 0.68]
−0.02[−0.03 to −0.01]
0.04
Incongruent, seconds 0.73[0.72 to 0.74]
0.75[0.73 to 0.76]
−0.02[−0.04 to 0.00]
0.07
Composite z-score −0.003[−0.060 to 0.054]
−0.025[−0.080 to 0.030]
0.022[−0.057 to 0.101]
0.59
Overall Composite z-score −0.052[−0.099 to −0.005]
−0.081−0.128 to −0.034]
0.029[−0.038 to 0.095]
0.40
DSC = Digit Symbol Coding; HVLT-R = Hopkins Verbal Learning Test-Revised
Covariate adjustment for sex, clinic site, and baseline value
Composite scores are ordered so that positive values reflect better performance on tasks
JAMA. Author manuscript; available in PMC 2016 August 25.
Author M
anuscriptA
uthor Manuscript
Author M
anuscriptA
uthor Manuscript
Sink et al. Page 29
Executive function composite: n-back, task switching, and flanker tasks
Overall composite includes: DSC, HVLT-R immediate and delayed recall, n-back, task switching and flanker tasks
JAMA. Author manuscript; available in PMC 2016 August 25.
Author M
anuscriptA
uthor Manuscript
Author M
anuscriptA
uthor Manuscript
Sink et al. Page 30
Table 3
Incident mild cognitive impairment (MCI) or dementia at 24 months by intervention assignment: The LIFE
Study
Physical Activity Health Education OR [95% CI]a p-value
MCIb 70/686 (10.2%) 62/682 (9.1%) 1.14 [0.79 to 1.62] 0.48
Dementiac 28/743 (3.8%) 29/747 (3.9%) 0.96 [0.57 to1.63] 0.88
MCI or Dementia 98/743 (13.2%) 91/747 (12.1%) 1.08 [0.80 to 1.46] 0.61
aOdds ratio from unadjusted logistic regression;
bOf those free of MCI or dementia at baseline;
cOf those free of dementia at baseline; Denominators are slightly larger than in table 1 because some participants were adjudicated, but did not get
cognitive testing at 24 months (deaths, for example).
JAMA. Author manuscript; available in PMC 2016 August 25.