Embed Size (px)
Citation preview
90
ADULT POLYCYSTIC KIDNEY DISEASE ANDINSURANCE: A CASE STUDY IN GENETIC
HETEROGENEITYCristina Gutierrez* and Angus S. Macdonald†
ABSTRACT
Adult Polycystic Kidney Disease (APKD) is a single-gene autosomal dominant genetic disorderleading to end-stage renal disease (ESRD, meaning kidney failure). It is associated with mutationsin either of two genes, APKD1 and APKD2, and although diagnosis is still mostly by ultrasonog-raphy rather than DNA-based tests, this may change in the future. Recent studies have shownthat the rates of onset of ESRD associated with APKD1 mutations are much greater than thoseassociated with APKD2 mutations, a form of genetic heterogeneity that differs from, for example,familial breast cancer. In this paper we model the the impact of mutations in APKD1 or APKD2on critical illness insurance, extending the work of Gutierrez and Macdonald (2003), which wasbased on studies predating DNA-based tests. We then extend the model to life insurance andshow that the financial impact is strongly dependent on the availability of treatment (dialysis andtransplant), but that if it is available, extra premiums for life insurance are modest. We show thatgenetic heterogeneity introduces a novel problem, because carrying an APKD2 mutation is lessrisky than having a family history of APKD. Thus, in jurisdictions where family history may be usedin underwriting but genetic tests may not, it may be illegal to use knowledge that benefits theapplicant.
1. INTRODUCTION
1.1 Heterogeneous Genetic Disorders and InsuranceThere is a growing literature on the actuarial implications of genetic disorders, mostly focused on thesmall number of single-gene disorders that are dominantly inherited, severe, highly penetrant and haveonset during adult ages. See Macdonald (2003a, 2004) for an introduction to the relevant geneticalbackground and Daykin et al. (2003) for a recent review of the actuarial and social policy issues. Manyof these issues involve the concept of ‘‘genetic exceptionalism’’: namely, the idea that genes are sofundamental to a person’s definition as a human being that special considerations should apply toanything genetic.
The development of DNA-based genetic tests for inherited disorders has had two consequences:
* Cristina Gutierrez, PhD, member of CONAC, Director of Public Health Insurance Policies, Economic Analysis Unit, Ministry of Health of Mexico,Paseo de la Reforma 450 piso 14, Col. Juarez, CP 06600, Mexico City, Tel (52-55) 52-08-22-08, Fax (52-55) 55-14-56-02; email: [email protected]. Cristina co-produced the present paper when she worked at the Genetics and Insurance Research Centre.† Angus S. Macdonald, PhD, FFA, FRSE, Professor in the Department of Actuarial Mathematics and Statistics and the Maxwell Institute ofMathematical Sciences, Heriot-Watt University, Edinburgh EH14 4AS, United Kingdom. Telephone �44 (0)131 451 3209; Fax �44 (0)131 4513209; email: [email protected].
ADULT POLYCYSTIC KIDNEY DISEASE AND INSURANCE: A CASE STUDY IN GENETIC HETEROGENEITY 91
a. It is possible to identify whether a person at risk of carrying a mutation because of their familyhistory is or is not a mutation carrier. This, of course, is the origin of the debate on genetics andinsurance.
b. Some disorders previously identified on the basis of their symptoms are now known to be caused bymutations in any one of several genes. Examples are early-onset Alzheimer’s disease, familial breast/ovarian cancer, and adult polycystic kidney disease (APKD). Sometimes mutations in different genesmay lead to quite different outcomes, such as characteristic ages at onset. Thus, variability displayedby a single disease is resolved, by a genetic test, into different genetic causes.
The example we study is APKD, a progressive disease leading to kidney failure (known as end-stagerenal disease [ESRD]). Mutations in either of two genes, APKD1 and APKD2, cause APKD, and carriersof APKD1 mutations tend to have much earlier ages at ESRD than do carriers of APKD2 mutations.
Such genetic heterogeneity as in (b) above has particular implications for an insurance market inwhich there is a moratorium on the use of genetic information in underwriting. The information thatmight be available to an underwriter, concerning an applicant and his or her first-degree relatives(FDRs), is the following:
a. Applicant has been tested and does not carry an APKD mutationb. Applicant has been tested and carries an APKD1 mutationc. Applicant has been tested and carries an APKD2 mutationd. Applicant has not been tested, but an FDR carries an APKD1 mutatione. Applicant has not been tested, but an FDR carries an APKD2 mutationf. Applicant has not been tested, but an FDR carries an APKD1 or APKD2 mutation.
Moratoria are now common but differ in whether they allow a family history of a genetic disorder tobe used (as in the United Kingdom) or not (as in Sweden). In the United Kingdom, the three moratoriathat have been implemented by the Association of British Insurers (ABI) have banned the use of DNA-based test results except for very large amounts of coverage. Strictly implemented, this would confinethe underwriter to knowing (f) above; they would be forbidden to ask questions from whose answersthey could learn (a)–(e). As a consequence a person who had been tested and proved not to be amutation carrier could not reveal this and would have to pay the premium appropriate for his or herfamily history. In practice this strict avoidance of using test results is not enforced, and a ‘‘clear’’ testresult will be taken into account. This appears to be an unobjectionable use of genetic informationwhere it is to the applicant’s benefit. We will call this a ‘‘lenient’’ moratorium.
Genetic heterogeneity, however, means that a genetic test often will not resolve a family history intoa simple yes or no outcome, but place the tested individual somewhere within a broader spectrum ofpossibilities, including being a carrier of a mild or severe gene mutation. Then, it need not be the casethat the premium rate appropriate for someone with a family history of overt symptoms of a disorderwill be lower than that for carriers of a milder form of mutation. A carrier of such a milder form ofmutation, identified by a genetic test, could then apply the same logic as is applied to ‘‘clear’’ tests inpractice and argue that, since the result would be to their benefit, their genetic test result should beused to allow them a lower premium rate, yet still higher than standard. Thus the use of adverse testresults in underwriting could appear through the back door. This would present significant problemsfor a ‘‘lenient’’ moratorium, but we will show in this paper that it is not just a theoretical possibility:APKD is an example.
APKD was previously studied by Gutierrez and Macdonald (2003), and we will refer the reader tothat paper for many details of the model. Their study, however, relied on epidemiology that did notdistinguish between the two mutations that cause APKD; here we do.
1.2 Treatable Genetic Disorders and InsuranceThe second theme of this paper, not previously allowed for in actuarial studies, is the treatability of agenetic disorder. Kidney failure is a standard cause of claim under most critical illness (CI) contracts,
92 NORTH AMERICAN ACTUARIAL JOURNAL, VOLUME 11, NUMBER 1
and there is little or nothing that can be done to affect the progression of APKD to ESRD. Then,however, survival depends on renal replacement therapy (RRT, meaning dialysis and/or a kidney trans-plant). The availability of RRT varies from country to country and over time; it is expensive and time-consuming, and transplants are critically dependent on a supply of kidneys from cadavers or livingdonors. The implications for life insurance, clearly, depend on what it is reasonable to assume aboutRRT. This feature has not been too important in previous actuarial studies, usually because a disorderis currently untreatable (Huntington’s disease, early-onset Alzheimer’s disease), but it will increasinglymatter as treatments are developed or because screening and prophylactic surgery may be possible(see Gui and Macdonald 2003).
At first sight, the availability of treatment ought to alleviate any insurance problems caused bypresymptomatic genetic testing, for individuals and insurers, but this may not be true. Where thetreatment is effective but drastic, such as double mastectomy for carriers of BRCA1 or BRCA2 muta-tions, many at-risk persons might not want the treatment and hence might choose not to be tested.If the insurance industry signals that testing and treatment is a precondition for insurance at reason-able cost, this could be deemed to be interference in the person’s medical autonomy. An even moreextreme example would be a disorder so severe that persons with a family history would be declined:then a ‘‘clear’’ test result, and a ‘‘lenient’’ moratorium, would be the only route to obtaining insurance,and again signals from the insurance industry could be a factor in the decision to be tested. This is apossibility that the industry would perhaps be wise to avoid.
1.3 Adult Polycystic Kidney DiseaseWith a population frequency of about 1 per 1000 (Dalgaard 1957), APKD is one of the most commonsingle-gene disorders in humans. As mentioned above, it leads to ESRD, after which survival dependson RRT.
It is inherited dominantly, meaning that a mutation from either parent is sufficient to lead to disease,and so far two genes have been identified, mutations in either of which on its own cause APKD: theyare called APKD1 and APKD2 (or equivalently PKD1 and PKD2). The existence of APKD3 is suspectedbut not confirmed. APKD1 mutations are both more common than APKD2 mutations (they accountfor about 85% and 15% of APKD, respectively) and more severe, leading to ESRD at much earlier ages.Mutations in the two genes therefore have quite different implications for insurance.
APKD features cysts that proliferate in the kidneys, and these can be reliably detected by ultraso-nography by about age 30 at the latest, and long before ESRD. Although the cysts are symptomatic ofAPKD, an affected person may be ‘‘asymptomatic’’ in insurance terms because debilitation or deathmay be many years away. Therefore many of the issues that now surround DNA-based genetic testinghave existed for APKD for a long time but did not attract the intense scrutiny that genetics seems tobring. Gutierrez and Macdonald (2003) modeled the impact on CI insurance of ultrasonic ‘‘genetictests’’ for APKD; one aim of this paper is to examine the impact of now being able to test for APKD1and APKD2 mutations. Such testing is not yet in widespread use, except in a research setting, butsince APKD1 and APKD2 mutations imply very different prognoses, they may be used to help interpretthe results of ultrasound tests.
Gutierrez and Macdonald (2003) described the general epidemiology of APKD, and we refer thereader there for details. In Section 2 we describe recent studies estimating age at onset of ESRDassociated with the APKD1 and APKD2 genes, including fitting suitable functions for actuarial mod-eling. In Section 3 we model survival after ESRD, based on the availability of RRT. We find that thisdepends on duration since ESRD as well as age.
Section 4.1 (and Appendix B) describe a model of CI insurance. Using this, and the rates of onsetof ESRD, we model the costs arising either from using or from not using information about APKD1and APKD2 risk in underwriting. In Section 4.2 we estimate extra premiums appropriate if the presenceof an APKD1 or APKD2 mutation is known. In Section 4.4 we model the potential costs of adverseselection if insurers do not use information about APKD1 or APKD2 risk known to the applicant,because a moratorium on family histories and/or genetic test results may be in place.
ADULT POLYCYSTIC KIDNEY DISEASE AND INSURANCE: A CASE STUDY IN GENETIC HETEROGENEITY 93
In Section 5 we describe a semi-Markov model allowing for survival and treatment after onset, ap-plicable to life insurance. In Section 6 we show extra premiums based on available genetic information,and in Section 7 we give some sample figures for the costs of adverse selection based on undisclosedgenetic information. Our conclusions are in Section 8.
2. ONSET OF ESRD ASSOCIATED WITH APKD1 AND APKD2 MUTATIONS
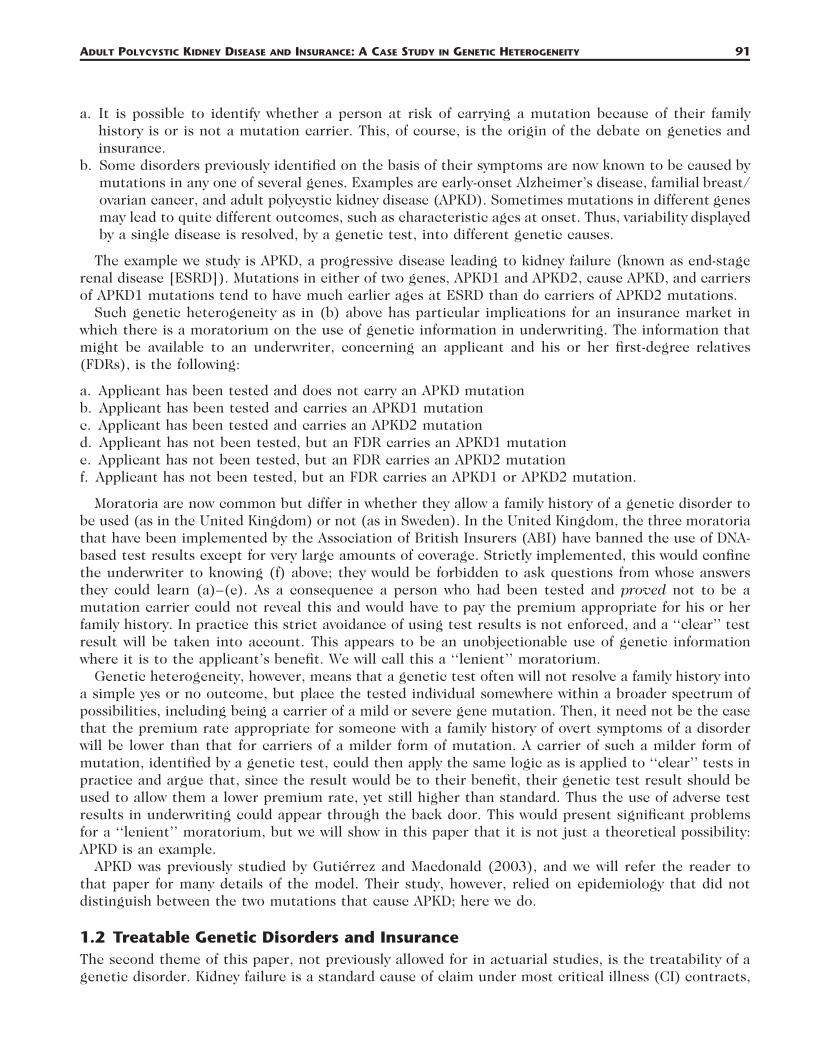
2.1 Penetrance Estimates of APKD1 and APKD2 MutationsThe ‘‘penetrance’’ of an APKD mutation means the probability that ESRD has occurred in a knownmutation carrier, in the absence of any competing decrements: let q(x) denote the penetrance at agex. At least three studies have published penetrance estimates of APKD1 and APKD2 mutations: Johnsonand Gabow (1997), Hateboer et al. (1999), and Ravine et al. (1992). All of these papers gave graphsof Kaplan-Meier estimates of the ‘‘survival’’ probability 1 � q(x).
In each case the event of interest was the first to occur of ESRD, or death by any cause: that is,death was not treated as a type of censoring. The approach we adopt is to fit suitable curves to eachKaplan-Meier estimate, which we take to be estimates of
xESRD DEADS(x) � exp � � (� � � ) dt , (2.1)� �t t
0
where is the rate (force) of onset of ESRD and is the force of mortality. Then on itsESRD DEAD ESRD� � �x x x
own can be found using a suitable population mortality table. The curve-fitting is done by unweightedleast squares (no exposures or confidence intervals being available), and with one exception a blend ofan exponential polynomial at low ages and a Gamma function at high ages was found to fit very well.Bear in mind that we are most interested in ages up to about 60 for actuarial applications.
2.2 Johnson and Gabow (1997)Johnson and Gabow (1997) studied 287 subjects with APKD1 mutations from 44 families, and 34subjects with APKD2 mutations from one family, drawn from patients at the University of ColoradoHealth Sciences Center and described in Gabow et al. (1992). APKD1 families were identified by linkageto markers close to the APKD1 locus, and families not showing such linkage were assumed to be APKD2families. The survival time was defined as the time to dialysis, transplantation, or death, whichevercame first. In subjects not reaching ESRD or death, the date of the last serum creatinine value obtainedwas taken as the time of censoring. The authors kindly provided us with the original data for theirKaplan-Meier estimates; these and our fitted functions are shown in Figure 1.
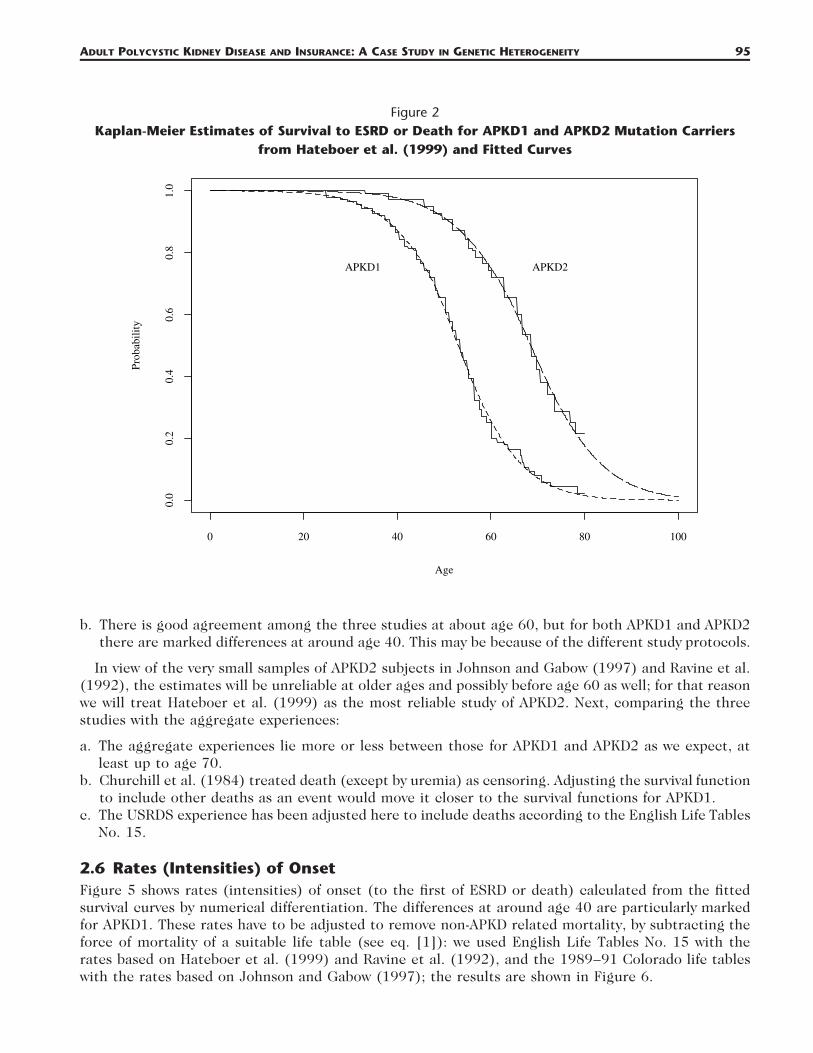
2.3 Hateboer et al. (1999)Hateboer et al. (1999) studied APKD patients from centers in Bulgaria, Leiden, Santander, Barcelona,Madrid, Cardiff, and London. The sample included 333 subjects with APKD1 mutations from 31 families,and 291 subjects with APKD2 mutations from 31 families. The survival time (since birth) was definedas the age at onset of ESRD (meaning the age at which RRT became necessary or, in people who diedof renal failure, the age at death) or age at death, whichever was first. The Kaplan-Meier estimates ofsurvival functions (our graph based on the published graph), and our fitted functions, are shown inFigure 2.
2.4 Ravine et al. (1992)Ravine et al. (1992) studied APKD patients from centers in Melbourne and Victoria, Australia. Afterthe family history had been recorded from each index patient, other known affected family membersand those at 50% risk were asked to cooperate in the study. Families were tested for evidence of linkageto sites close to the APKD1 locus. Families with probability of linkage of greater than 0.95 were ac-
94 NORTH AMERICAN ACTUARIAL JOURNAL, VOLUME 11, NUMBER 1
Figure 1Kaplan-Meier Estimates of Survival to ESRD or death for APKD1 and APKD2 Mutation Carriers
from Johnson and Gabow (1997) and Fitted Curves
Age
Prob
abili
ty
0 20 40 60 80 100
0.0
0.2
0.4
0.6
0.8
1.0
APKD1 APKD2
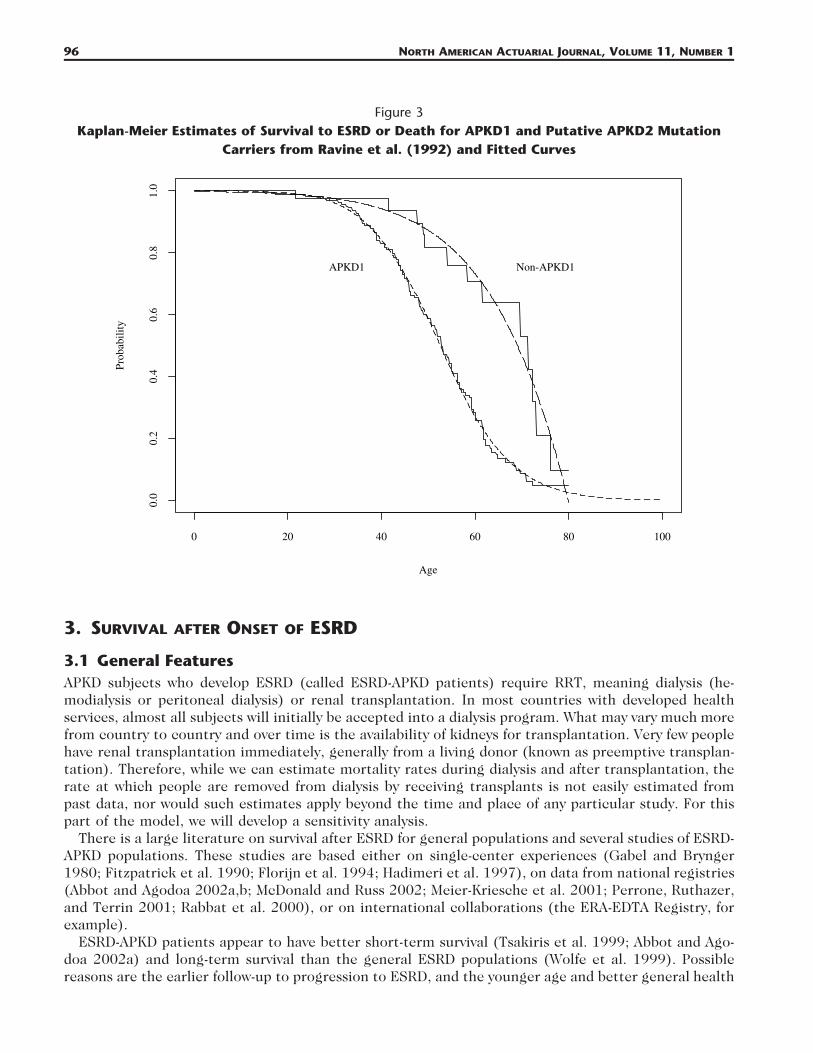
cepted as having APKD1 mutations. Families showing no such linkage were described simply as ‘‘non-PKD1.’’ Eighteen APKD1 families (285 persons) were identified, and five non-APKD1 families (49 per-sons), all of European descent. The survival time (since birth) was taken as the age at onset of ESRD(with the same definition as in Hateboer et al. [1999]) or death (whichever occurred first). The Kaplan-Meier estimates of survival functions (our graph based on the published graph), and our fitted functions,are shown in Figure 3.
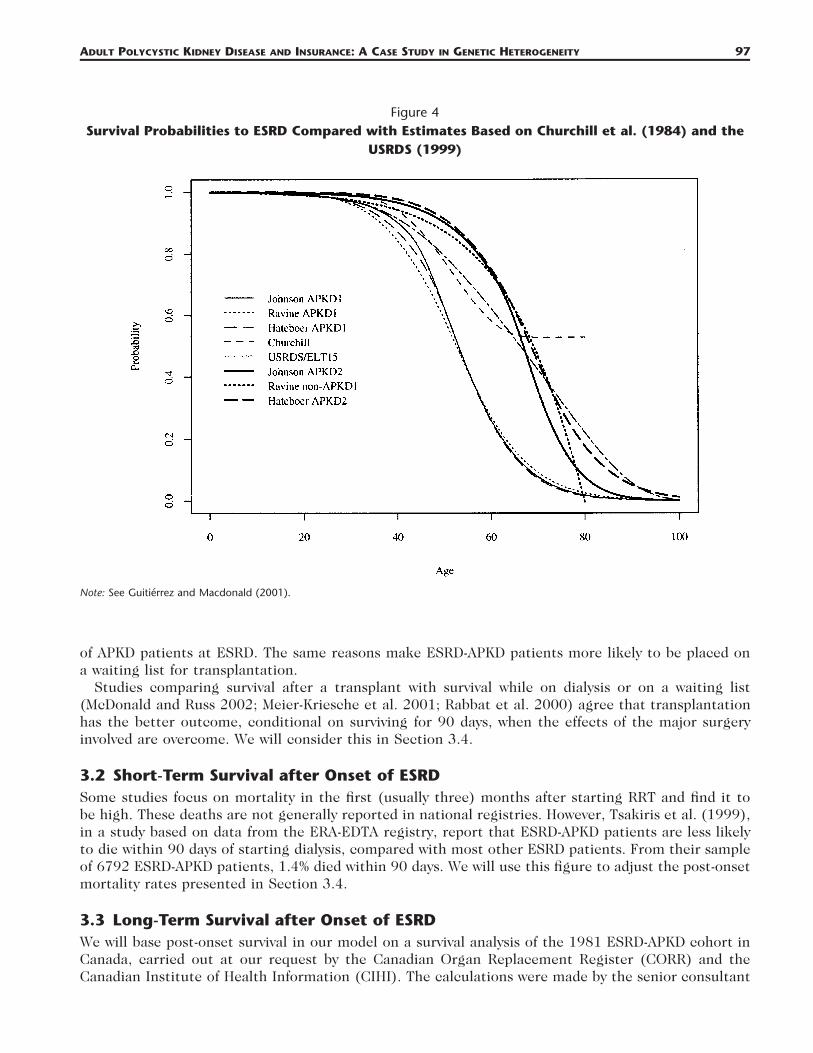
2.5 Comparison of the Three Studies and Previous StudiesGutierrez and Macdonald (2003) modeled APKD and CI insurance using studies of APKD that eitherpredated the discoveries of, or did not distinguish between, the APKD1 and APKD2 genes. For brevitywe refer to these as the ‘‘aggregate experiences.’’ Churchill et al. (1984) gave a Kaplan-Meier estimatein respect of onset of ESRD or earlier death by uremia (blood poisoning due to the failure of thekidneys to clear toxins). The United States Renal Disease Survey (USRDS; USRDS 1999) also suppliednumbers of new cases of ESRD caused by APKD that were used in conjunction with U.S. populationdata. Figure 4 shows the fitted survival functions based on all three studies, as well as those based onthe two aggregate experiences.
First, comparing the three studies described in Sections 2.2–2.4:
a. The fitted functions seem very good for APKD1, and reasonable for APKD2, for which there are manyfewer observations. The study by Hateboer et al. (1999) had the largest sample of APKD2 mutationcarriers, and the fit there is very good.
ADULT POLYCYSTIC KIDNEY DISEASE AND INSURANCE: A CASE STUDY IN GENETIC HETEROGENEITY 95
Figure 2Kaplan-Meier Estimates of Survival to ESRD or Death for APKD1 and APKD2 Mutation Carriers
from Hateboer et al. (1999) and Fitted Curves
Age
Prob
abili
ty
0 20 40 60 80 100
0.0
0.2
0.4
0.6
0.8
1.0
APKD1 APKD2
b. There is good agreement among the three studies at about age 60, but for both APKD1 and APKD2there are marked differences at around age 40. This may be because of the different study protocols.
In view of the very small samples of APKD2 subjects in Johnson and Gabow (1997) and Ravine et al.(1992), the estimates will be unreliable at older ages and possibly before age 60 as well; for that reasonwe will treat Hateboer et al. (1999) as the most reliable study of APKD2. Next, comparing the threestudies with the aggregate experiences:
a. The aggregate experiences lie more or less between those for APKD1 and APKD2 as we expect, atleast up to age 70.
b. Churchill et al. (1984) treated death (except by uremia) as censoring. Adjusting the survival functionto include other deaths as an event would move it closer to the survival functions for APKD1.
c. The USRDS experience has been adjusted here to include deaths according to the English Life TablesNo. 15.
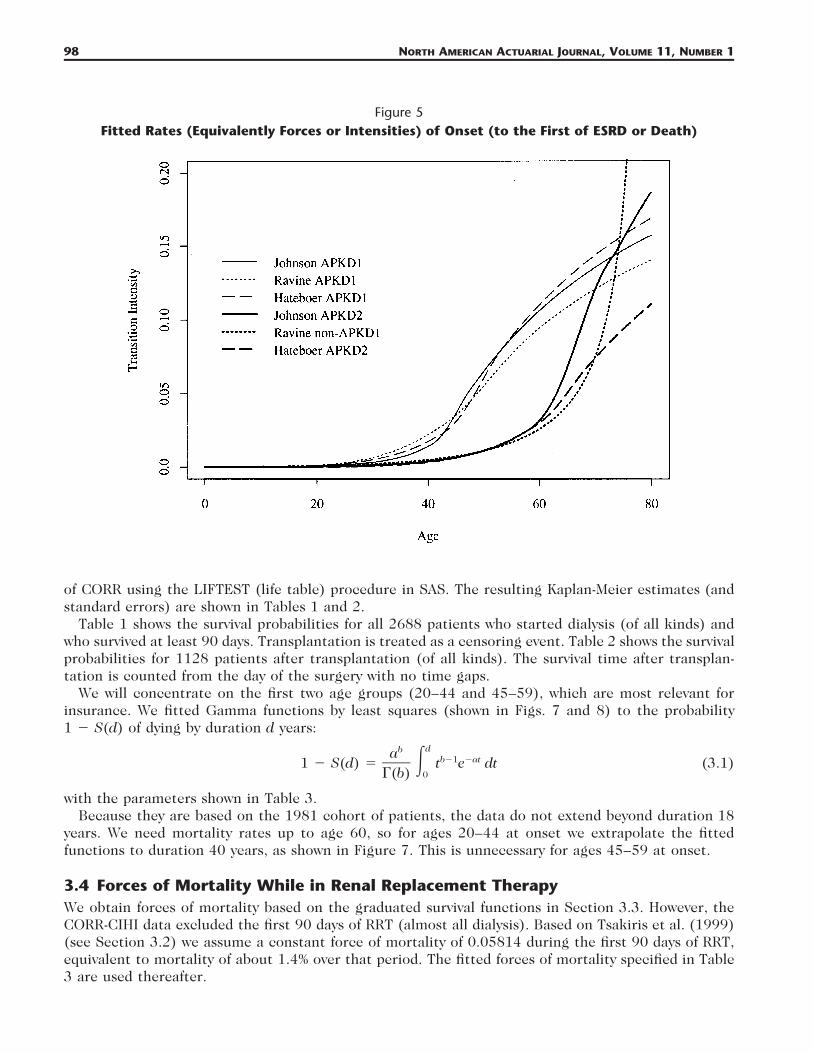
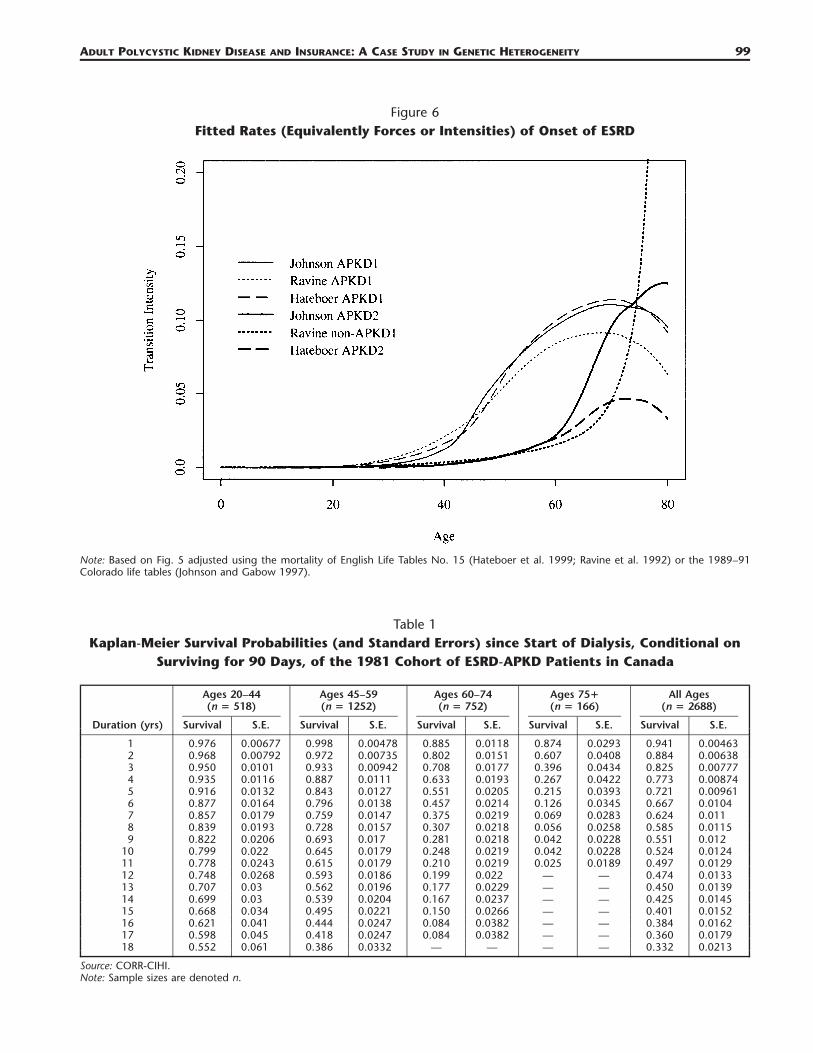
2.6 Rates (Intensities) of OnsetFigure 5 shows rates (intensities) of onset (to the first of ESRD or death) calculated from the fittedsurvival curves by numerical differentiation. The differences at around age 40 are particularly markedfor APKD1. These rates have to be adjusted to remove non-APKD related mortality, by subtracting theforce of mortality of a suitable life table (see eq. [1]): we used English Life Tables No. 15 with therates based on Hateboer et al. (1999) and Ravine et al. (1992), and the 1989–91 Colorado life tableswith the rates based on Johnson and Gabow (1997); the results are shown in Figure 6.
96 NORTH AMERICAN ACTUARIAL JOURNAL, VOLUME 11, NUMBER 1
Figure 3Kaplan-Meier Estimates of Survival to ESRD or Death for APKD1 and Putative APKD2 Mutation
Carriers from Ravine et al. (1992) and Fitted Curves
Age
Prob
abili
ty
0 20 40 60 80 100
0.0
0.2
0.4
0.6
0.8
1.0
APKD1 Non-APKD1
3. SURVIVAL AFTER ONSET OF ESRD
3.1 General FeaturesAPKD subjects who develop ESRD (called ESRD-APKD patients) require RRT, meaning dialysis (he-modialysis or peritoneal dialysis) or renal transplantation. In most countries with developed healthservices, almost all subjects will initially be accepted into a dialysis program. What may vary much morefrom country to country and over time is the availability of kidneys for transplantation. Very few peoplehave renal transplantation immediately, generally from a living donor (known as preemptive transplan-tation). Therefore, while we can estimate mortality rates during dialysis and after transplantation, therate at which people are removed from dialysis by receiving transplants is not easily estimated frompast data, nor would such estimates apply beyond the time and place of any particular study. For thispart of the model, we will develop a sensitivity analysis.
There is a large literature on survival after ESRD for general populations and several studies of ESRD-APKD populations. These studies are based either on single-center experiences (Gabel and Brynger1980; Fitzpatrick et al. 1990; Florijn et al. 1994; Hadimeri et al. 1997), on data from national registries(Abbot and Agodoa 2002a,b; McDonald and Russ 2002; Meier-Kriesche et al. 2001; Perrone, Ruthazer,and Terrin 2001; Rabbat et al. 2000), or on international collaborations (the ERA-EDTA Registry, forexample).
ESRD-APKD patients appear to have better short-term survival (Tsakiris et al. 1999; Abbot and Ago-doa 2002a) and long-term survival than the general ESRD populations (Wolfe et al. 1999). Possiblereasons are the earlier follow-up to progression to ESRD, and the younger age and better general health
ADULT POLYCYSTIC KIDNEY DISEASE AND INSURANCE: A CASE STUDY IN GENETIC HETEROGENEITY 97
Figure 4Survival Probabilities to ESRD Compared with Estimates Based on Churchill et al. (1984) and the
USRDS (1999)
Note: See Guitierrez and Macdonald (2001).
of APKD patients at ESRD. The same reasons make ESRD-APKD patients more likely to be placed ona waiting list for transplantation.
Studies comparing survival after a transplant with survival while on dialysis or on a waiting list(McDonald and Russ 2002; Meier-Kriesche et al. 2001; Rabbat et al. 2000) agree that transplantationhas the better outcome, conditional on surviving for 90 days, when the effects of the major surgeryinvolved are overcome. We will consider this in Section 3.4.
3.2 Short-Term Survival after Onset of ESRDSome studies focus on mortality in the first (usually three) months after starting RRT and find it tobe high. These deaths are not generally reported in national registries. However, Tsakiris et al. (1999),in a study based on data from the ERA-EDTA registry, report that ESRD-APKD patients are less likelyto die within 90 days of starting dialysis, compared with most other ESRD patients. From their sampleof 6792 ESRD-APKD patients, 1.4% died within 90 days. We will use this figure to adjust the post-onsetmortality rates presented in Section 3.4.
3.3 Long-Term Survival after Onset of ESRDWe will base post-onset survival in our model on a survival analysis of the 1981 ESRD-APKD cohort inCanada, carried out at our request by the Canadian Organ Replacement Register (CORR) and theCanadian Institute of Health Information (CIHI). The calculations were made by the senior consultant
98 NORTH AMERICAN ACTUARIAL JOURNAL, VOLUME 11, NUMBER 1
Figure 5Fitted Rates (Equivalently Forces or Intensities) of Onset (to the First of ESRD or Death)
of CORR using the LIFTEST (life table) procedure in SAS. The resulting Kaplan-Meier estimates (andstandard errors) are shown in Tables 1 and 2.
Table 1 shows the survival probabilities for all 2688 patients who started dialysis (of all kinds) andwho survived at least 90 days. Transplantation is treated as a censoring event. Table 2 shows the survivalprobabilities for 1128 patients after transplantation (of all kinds). The survival time after transplan-tation is counted from the day of the surgery with no time gaps.
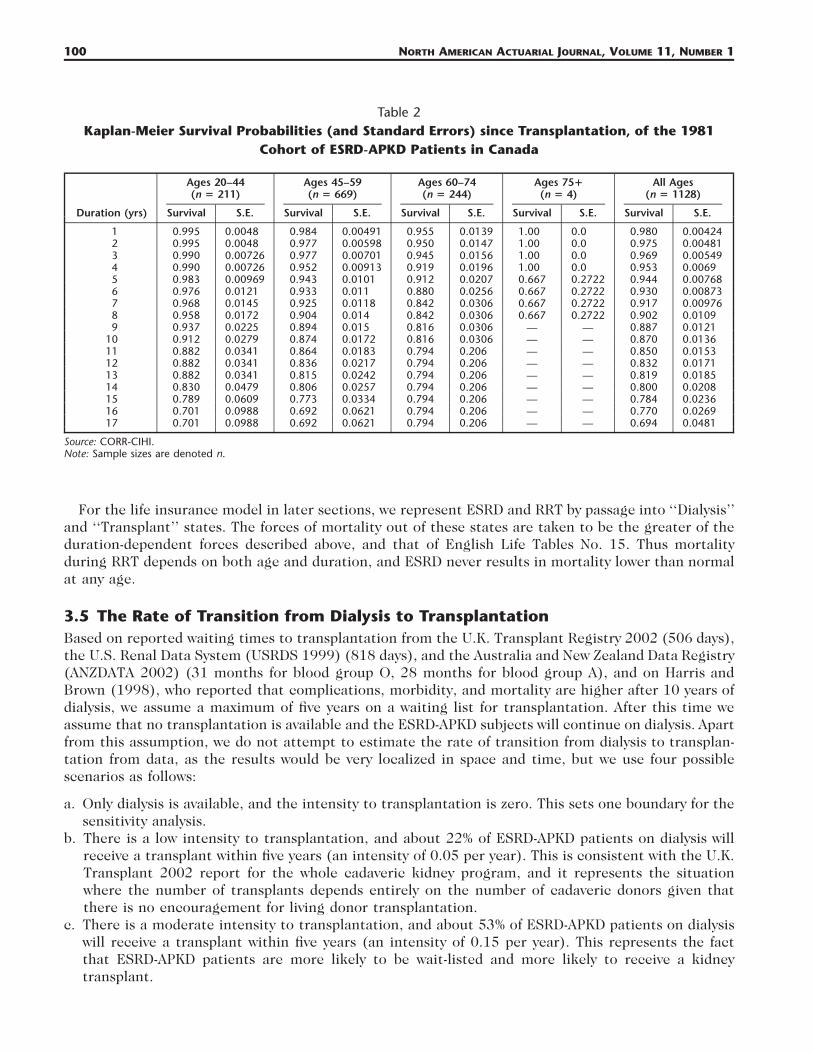
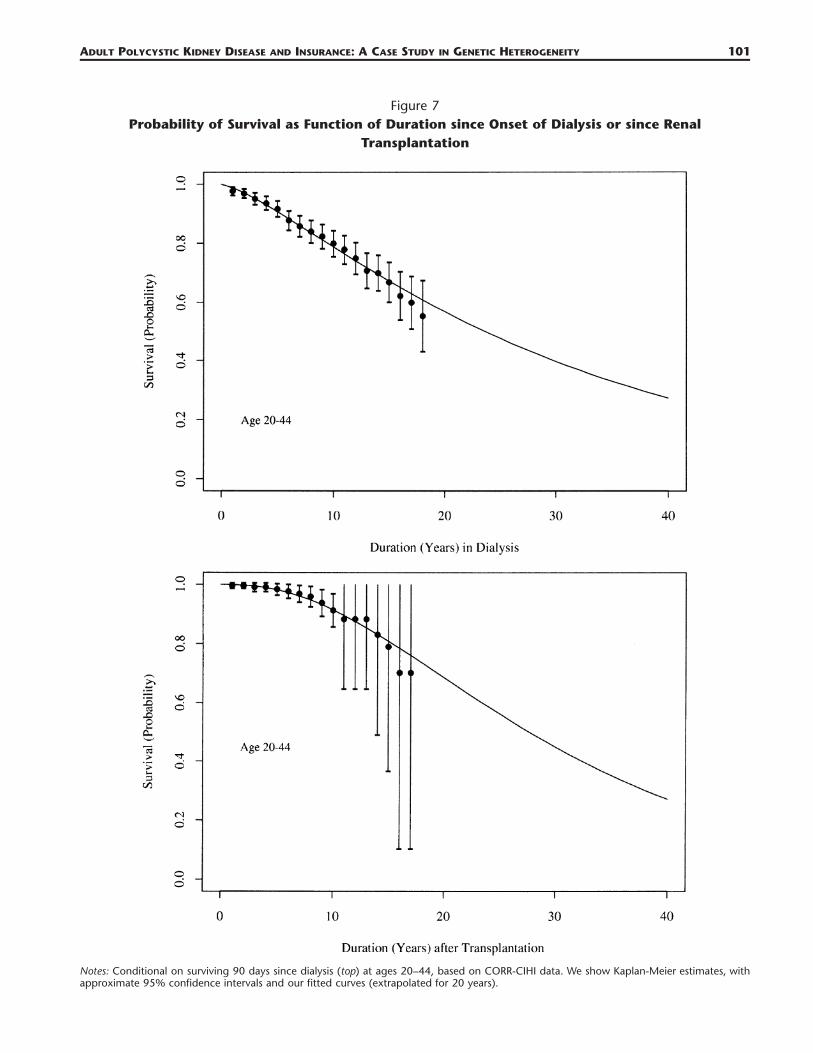
We will concentrate on the first two age groups (20–44 and 45–59), which are most relevant forinsurance. We fitted Gamma functions by least squares (shown in Figs. 7 and 8) to the probability1 � S(d) of dying by duration d years:
dba b�1 �at1 � S(d) � � t e dt (3.1)0�(b)
with the parameters shown in Table 3.Because they are based on the 1981 cohort of patients, the data do not extend beyond duration 18
years. We need mortality rates up to age 60, so for ages 20–44 at onset we extrapolate the fittedfunctions to duration 40 years, as shown in Figure 7. This is unnecessary for ages 45–59 at onset.
3.4 Forces of Mortality While in Renal Replacement TherapyWe obtain forces of mortality based on the graduated survival functions in Section 3.3. However, theCORR-CIHI data excluded the first 90 days of RRT (almost all dialysis). Based on Tsakiris et al. (1999)(see Section 3.2) we assume a constant force of mortality of 0.05814 during the first 90 days of RRT,equivalent to mortality of about 1.4% over that period. The fitted forces of mortality specified in Table3 are used thereafter.
ADULT POLYCYSTIC KIDNEY DISEASE AND INSURANCE: A CASE STUDY IN GENETIC HETEROGENEITY 99
Figure 6Fitted Rates (Equivalently Forces or Intensities) of Onset of ESRD
Note: Based on Fig. 5 adjusted using the mortality of English Life Tables No. 15 (Hateboer et al. 1999; Ravine et al. 1992) or the 1989–91Colorado life tables (Johnson and Gabow 1997).
Table 1Kaplan-Meier Survival Probabilities (and Standard Errors) since Start of Dialysis, Conditional on
Surviving for 90 Days, of the 1981 Cohort of ESRD-APKD Patients in Canada
Duration (yrs)
Ages 20–44(n � 518)
Survival S.E.
Ages 45–59(n � 1252)
Survival S.E.
Ages 60–74(n � 752)
Survival S.E.
Ages 75�(n � 166)
Survival S.E.
All Ages(n � 2688)
Survival S.E.
1 0.976 0.00677 0.998 0.00478 0.885 0.0118 0.874 0.0293 0.941 0.004632 0.968 0.00792 0.972 0.00735 0.802 0.0151 0.607 0.0408 0.884 0.006383 0.950 0.0101 0.933 0.00942 0.708 0.0177 0.396 0.0434 0.825 0.007774 0.935 0.0116 0.887 0.0111 0.633 0.0193 0.267 0.0422 0.773 0.008745 0.916 0.0132 0.843 0.0127 0.551 0.0205 0.215 0.0393 0.721 0.009616 0.877 0.0164 0.796 0.0138 0.457 0.0214 0.126 0.0345 0.667 0.01047 0.857 0.0179 0.759 0.0147 0.375 0.0219 0.069 0.0283 0.624 0.0118 0.839 0.0193 0.728 0.0157 0.307 0.0218 0.056 0.0258 0.585 0.01159 0.822 0.0206 0.693 0.017 0.281 0.0218 0.042 0.0228 0.551 0.012
10 0.799 0.022 0.645 0.0179 0.248 0.0219 0.042 0.0228 0.524 0.012411 0.778 0.0243 0.615 0.0179 0.210 0.0219 0.025 0.0189 0.497 0.012912 0.748 0.0268 0.593 0.0186 0.199 0.022 — — 0.474 0.013313 0.707 0.03 0.562 0.0196 0.177 0.0229 — — 0.450 0.013914 0.699 0.03 0.539 0.0204 0.167 0.0237 — — 0.425 0.014515 0.668 0.034 0.495 0.0221 0.150 0.0266 — — 0.401 0.015216 0.621 0.041 0.444 0.0247 0.084 0.0382 — — 0.384 0.016217 0.598 0.045 0.418 0.0247 0.084 0.0382 — — 0.360 0.017918 0.552 0.061 0.386 0.0332 — — — — 0.332 0.0213
Source: CORR-CIHI.Note: Sample sizes are denoted n.
100 NORTH AMERICAN ACTUARIAL JOURNAL, VOLUME 11, NUMBER 1
Table 2Kaplan-Meier Survival Probabilities (and Standard Errors) since Transplantation, of the 1981
Cohort of ESRD-APKD Patients in Canada
Duration (yrs)
Ages 20–44(n � 211)
Survival S.E.
Ages 45–59(n � 669)
Survival S.E.
Ages 60–74(n � 244)
Survival S.E.
Ages 75�(n � 4)
Survival S.E.
All Ages(n � 1128)
Survival S.E.
1 0.995 0.0048 0.984 0.00491 0.955 0.0139 1.00 0.0 0.980 0.004242 0.995 0.0048 0.977 0.00598 0.950 0.0147 1.00 0.0 0.975 0.004813 0.990 0.00726 0.977 0.00701 0.945 0.0156 1.00 0.0 0.969 0.005494 0.990 0.00726 0.952 0.00913 0.919 0.0196 1.00 0.0 0.953 0.00695 0.983 0.00969 0.943 0.0101 0.912 0.0207 0.667 0.2722 0.944 0.007686 0.976 0.0121 0.933 0.011 0.880 0.0256 0.667 0.2722 0.930 0.008737 0.968 0.0145 0.925 0.0118 0.842 0.0306 0.667 0.2722 0.917 0.009768 0.958 0.0172 0.904 0.014 0.842 0.0306 0.667 0.2722 0.902 0.01099 0.937 0.0225 0.894 0.015 0.816 0.0306 — — 0.887 0.0121
10 0.912 0.0279 0.874 0.0172 0.816 0.0306 — — 0.870 0.013611 0.882 0.0341 0.864 0.0183 0.794 0.206 — — 0.850 0.015312 0.882 0.0341 0.836 0.0217 0.794 0.206 — — 0.832 0.017113 0.882 0.0341 0.815 0.0242 0.794 0.206 — — 0.819 0.018514 0.830 0.0479 0.806 0.0257 0.794 0.206 — — 0.800 0.020815 0.789 0.0609 0.773 0.0334 0.794 0.206 — — 0.784 0.023616 0.701 0.0988 0.692 0.0621 0.794 0.206 — — 0.770 0.026917 0.701 0.0988 0.692 0.0621 0.794 0.206 — — 0.694 0.0481
Source: CORR-CIHI.Note: Sample sizes are denoted n.
For the life insurance model in later sections, we represent ESRD and RRT by passage into ‘‘Dialysis’’and ‘‘Transplant’’ states. The forces of mortality out of these states are taken to be the greater of theduration-dependent forces described above, and that of English Life Tables No. 15. Thus mortalityduring RRT depends on both age and duration, and ESRD never results in mortality lower than normalat any age.
3.5 The Rate of Transition from Dialysis to TransplantationBased on reported waiting times to transplantation from the U.K. Transplant Registry 2002 (506 days),the U.S. Renal Data System (USRDS 1999) (818 days), and the Australia and New Zealand Data Registry(ANZDATA 2002) (31 months for blood group O, 28 months for blood group A), and on Harris andBrown (1998), who reported that complications, morbidity, and mortality are higher after 10 years ofdialysis, we assume a maximum of five years on a waiting list for transplantation. After this time weassume that no transplantation is available and the ESRD-APKD subjects will continue on dialysis. Apartfrom this assumption, we do not attempt to estimate the rate of transition from dialysis to transplan-tation from data, as the results would be very localized in space and time, but we use four possiblescenarios as follows:
a. Only dialysis is available, and the intensity to transplantation is zero. This sets one boundary for thesensitivity analysis.
b. There is a low intensity to transplantation, and about 22% of ESRD-APKD patients on dialysis willreceive a transplant within five years (an intensity of 0.05 per year). This is consistent with the U.K.Transplant 2002 report for the whole cadaveric kidney program, and it represents the situationwhere the number of transplants depends entirely on the number of cadaveric donors given thatthere is no encouragement for living donor transplantation.
c. There is a moderate intensity to transplantation, and about 53% of ESRD-APKD patients on dialysiswill receive a transplant within five years (an intensity of 0.15 per year). This represents the factthat ESRD-APKD patients are more likely to be wait-listed and more likely to receive a kidneytransplant.
ADULT POLYCYSTIC KIDNEY DISEASE AND INSURANCE: A CASE STUDY IN GENETIC HETEROGENEITY 101
Figure 7Probability of Survival as Function of Duration since Onset of Dialysis or since Renal
Transplantation
Notes: Conditional on surviving 90 days since dialysis (top) at ages 20–44, based on CORR-CIHI data. We show Kaplan-Meier estimates, withapproximate 95% confidence intervals and our fitted curves (extrapolated for 20 years).
102 NORTH AMERICAN ACTUARIAL JOURNAL, VOLUME 11, NUMBER 1
Figure 8Probability of Survival as Function of Duration since Onset of Dialysis or since Renal
Transplantation
Notes: Conditional on surviving 90 days since dialysis (top) at ages 45–59, based on CORR-CIHI data. We show Kaplan-Meier estimates, withapproximate 95% confidence intervals and our fitted curves.
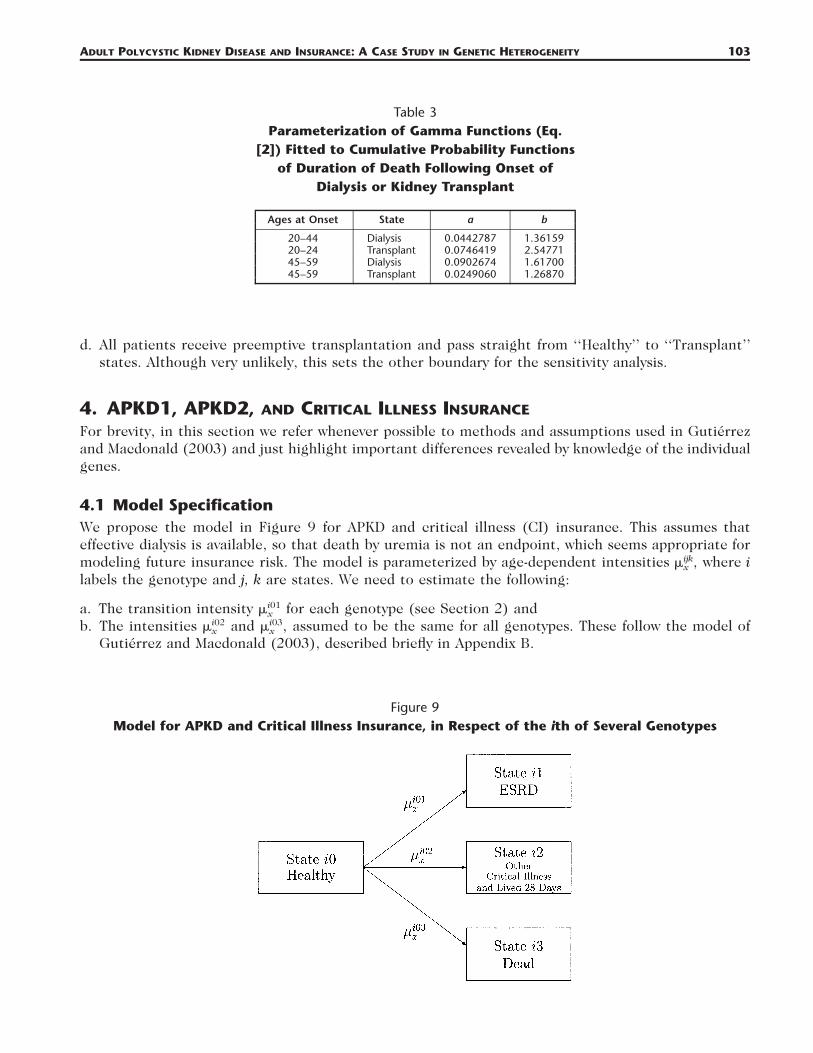
ADULT POLYCYSTIC KIDNEY DISEASE AND INSURANCE: A CASE STUDY IN GENETIC HETEROGENEITY 103
Table 3Parameterization of Gamma Functions (Eq.
[2]) Fitted to Cumulative Probability Functionsof Duration of Death Following Onset of
Dialysis or Kidney Transplant
Ages at Onset State a b
20–44 Dialysis 0.0442787 1.3615920–24 Transplant 0.0746419 2.5477145–59 Dialysis 0.0902674 1.6170045–59 Transplant 0.0249060 1.26870
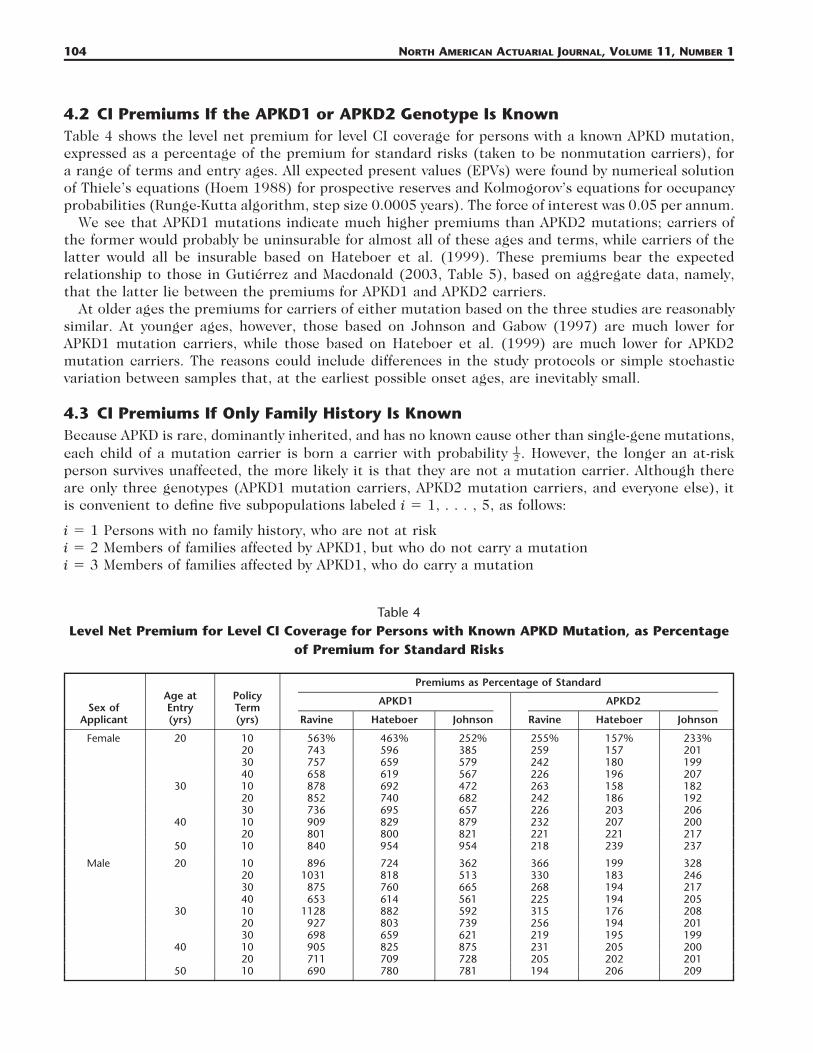
Figure 9Model for APKD and Critical Illness Insurance, in Respect of the ith of Several Genotypes
d. All patients receive preemptive transplantation and pass straight from ‘‘Healthy’’ to ‘‘Transplant’’states. Although very unlikely, this sets the other boundary for the sensitivity analysis.
4. APKD1, APKD2, AND CRITICAL ILLNESS INSURANCE
For brevity, in this section we refer whenever possible to methods and assumptions used in Gutierrezand Macdonald (2003) and just highlight important differences revealed by knowledge of the individualgenes.
4.1 Model SpecificationWe propose the model in Figure 9 for APKD and critical illness (CI) insurance. This assumes thateffective dialysis is available, so that death by uremia is not an endpoint, which seems appropriate formodeling future insurance risk. The model is parameterized by age-dependent intensities where iijk� ,x
labels the genotype and j, k are states. We need to estimate the following:
a. The transition intensity for each genotype (see Section 2) andi01�x
b. The intensities and assumed to be the same for all genotypes. These follow the model ofi02 i03� � ,x x
Gutierrez and Macdonald (2003), described briefly in Appendix B.
104 NORTH AMERICAN ACTUARIAL JOURNAL, VOLUME 11, NUMBER 1
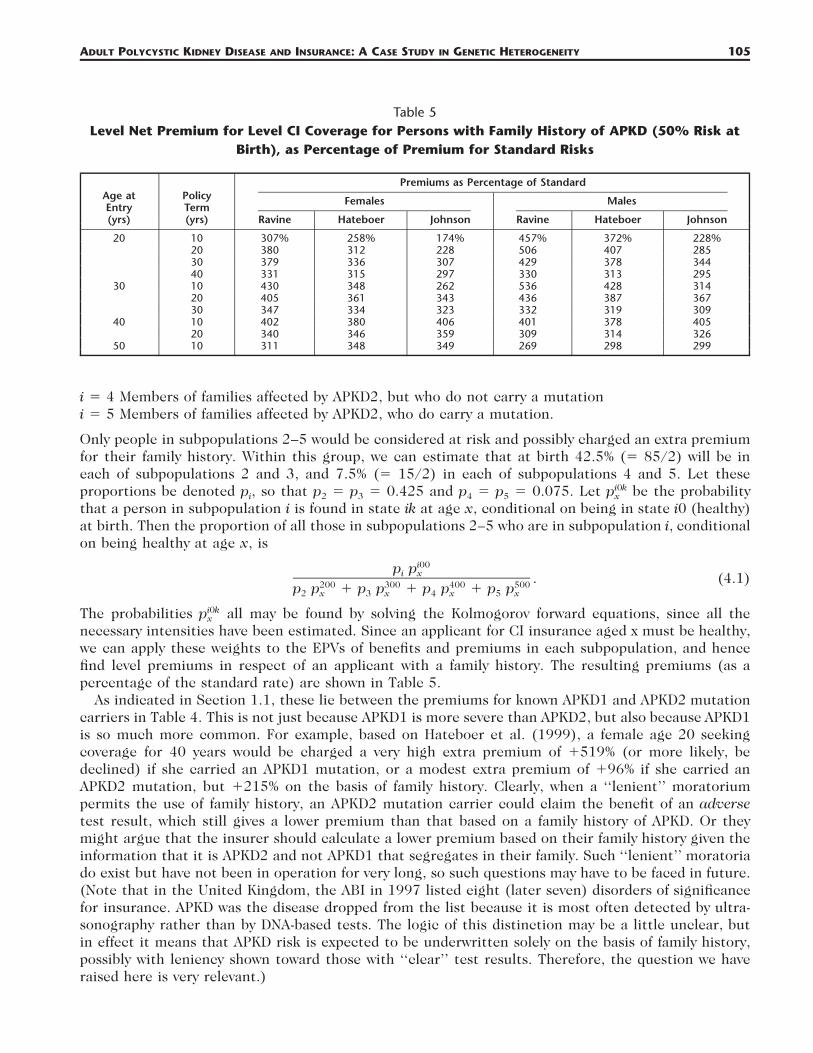
Table 4Level Net Premium for Level CI Coverage for Persons with Known APKD Mutation, as Percentage
of Premium for Standard Risks
Sex ofApplicant
Age atEntry(yrs)
PolicyTerm(yrs)
Premiums as Percentage of Standard
APKD1
Ravine Hateboer Johnson
APKD2
Ravine Hateboer Johnson
Female 20 10 563% 463% 252% 255% 157% 233%20 743 596 385 259 157 20130 757 659 579 242 180 19940 658 619 567 226 196 207
30 10 878 692 472 263 158 18220 852 740 682 242 186 19230 736 695 657 226 203 206
40 10 909 829 879 232 207 20020 801 800 821 221 221 217
50 10 840 954 954 218 239 237
Male 20 10 896 724 362 366 199 32820 1031 818 513 330 183 24630 875 760 665 268 194 21740 653 614 561 225 194 205
30 10 1128 882 592 315 176 20820 927 803 739 256 194 20130 698 659 621 219 195 199
40 10 905 825 875 231 205 20020 711 709 728 205 202 201
50 10 690 780 781 194 206 209
4.2 CI Premiums If the APKD1 or APKD2 Genotype Is KnownTable 4 shows the level net premium for level CI coverage for persons with a known APKD mutation,expressed as a percentage of the premium for standard risks (taken to be nonmutation carriers), fora range of terms and entry ages. All expected present values (EPVs) were found by numerical solutionof Thiele’s equations (Hoem 1988) for prospective reserves and Kolmogorov’s equations for occupancyprobabilities (Runge-Kutta algorithm, step size 0.0005 years). The force of interest was 0.05 per annum.
We see that APKD1 mutations indicate much higher premiums than APKD2 mutations; carriers ofthe former would probably be uninsurable for almost all of these ages and terms, while carriers of thelatter would all be insurable based on Hateboer et al. (1999). These premiums bear the expectedrelationship to those in Gutierrez and Macdonald (2003, Table 5), based on aggregate data, namely,that the latter lie between the premiums for APKD1 and APKD2 carriers.
At older ages the premiums for carriers of either mutation based on the three studies are reasonablysimilar. At younger ages, however, those based on Johnson and Gabow (1997) are much lower forAPKD1 mutation carriers, while those based on Hateboer et al. (1999) are much lower for APKD2mutation carriers. The reasons could include differences in the study protocols or simple stochasticvariation between samples that, at the earliest possible onset ages, are inevitably small.
4.3 CI Premiums If Only Family History Is KnownBecause APKD is rare, dominantly inherited, and has no known cause other than single-gene mutations,each child of a mutation carrier is born a carrier with probability . However, the longer an at-risk1–2person survives unaffected, the more likely it is that they are not a mutation carrier. Although thereare only three genotypes (APKD1 mutation carriers, APKD2 mutation carriers, and everyone else), itis convenient to define five subpopulations labeled i � 1, . . . , 5, as follows:
i � 1 Persons with no family history, who are not at riski � 2 Members of families affected by APKD1, but who do not carry a mutationi � 3 Members of families affected by APKD1, who do carry a mutation
ADULT POLYCYSTIC KIDNEY DISEASE AND INSURANCE: A CASE STUDY IN GENETIC HETEROGENEITY 105
Table 5Level Net Premium for Level CI Coverage for Persons with Family History of APKD (50% Risk at
Birth), as Percentage of Premium for Standard Risks
Age atEntry(yrs)
PolicyTerm(yrs)
Premiums as Percentage of Standard
Females
Ravine Hateboer Johnson
Males
Ravine Hateboer Johnson
20 10 307% 258% 174% 457% 372% 228%20 380 312 228 506 407 28530 379 336 307 429 378 34440 331 315 297 330 313 295
30 10 430 348 262 536 428 31420 405 361 343 436 387 36730 347 334 323 332 319 309
40 10 402 380 406 401 378 40520 340 346 359 309 314 326
50 10 311 348 349 269 298 299
i � 4 Members of families affected by APKD2, but who do not carry a mutationi � 5 Members of families affected by APKD2, who do carry a mutation.
Only people in subpopulations 2–5 would be considered at risk and possibly charged an extra premiumfor their family history. Within this group, we can estimate that at birth 42.5% (� 85/2) will be ineach of subpopulations 2 and 3, and 7.5% (� 15/2) in each of subpopulations 4 and 5. Let theseproportions be denoted pi, so that p2 � p3 � 0.425 and p4 � p5 � 0.075. Let be the probabilityi0kpx
that a person in subpopulation i is found in state ik at age x, conditional on being in state i0 (healthy)at birth. Then the proportion of all those in subpopulations 2–5 who are in subpopulation i, conditionalon being healthy at age x, is
i00p pi x . (4.1)200 300 400 500p p � p p � p p � p p2 x 3 x 4 x 5 x
The probabilities all may be found by solving the Kolmogorov forward equations, since all thei0kpx
necessary intensities have been estimated. Since an applicant for CI insurance aged x must be healthy,we can apply these weights to the EPVs of benefits and premiums in each subpopulation, and hencefind level premiums in respect of an applicant with a family history. The resulting premiums (as apercentage of the standard rate) are shown in Table 5.
As indicated in Section 1.1, these lie between the premiums for known APKD1 and APKD2 mutationcarriers in Table 4. This is not just because APKD1 is more severe than APKD2, but also because APKD1is so much more common. For example, based on Hateboer et al. (1999), a female age 20 seekingcoverage for 40 years would be charged a very high extra premium of �519% (or more likely, bedeclined) if she carried an APKD1 mutation, or a modest extra premium of �96% if she carried anAPKD2 mutation, but �215% on the basis of family history. Clearly, when a ‘‘lenient’’ moratoriumpermits the use of family history, an APKD2 mutation carrier could claim the benefit of an adversetest result, which still gives a lower premium than that based on a family history of APKD. Or theymight argue that the insurer should calculate a lower premium based on their family history given theinformation that it is APKD2 and not APKD1 that segregates in their family. Such ‘‘lenient’’ moratoriado exist but have not been in operation for very long, so such questions may have to be faced in future.(Note that in the United Kingdom, the ABI in 1997 listed eight (later seven) disorders of significancefor insurance. APKD was the disease dropped from the list because it is most often detected by ultra-sonography rather than by DNA-based tests. The logic of this distinction may be a little unclear, butin effect it means that APKD risk is expected to be underwritten solely on the basis of family history,possibly with leniency shown toward those with ‘‘clear’’ test results. Therefore, the question we haveraised here is very relevant.)
106 NORTH AMERICAN ACTUARIAL JOURNAL, VOLUME 11, NUMBER 1
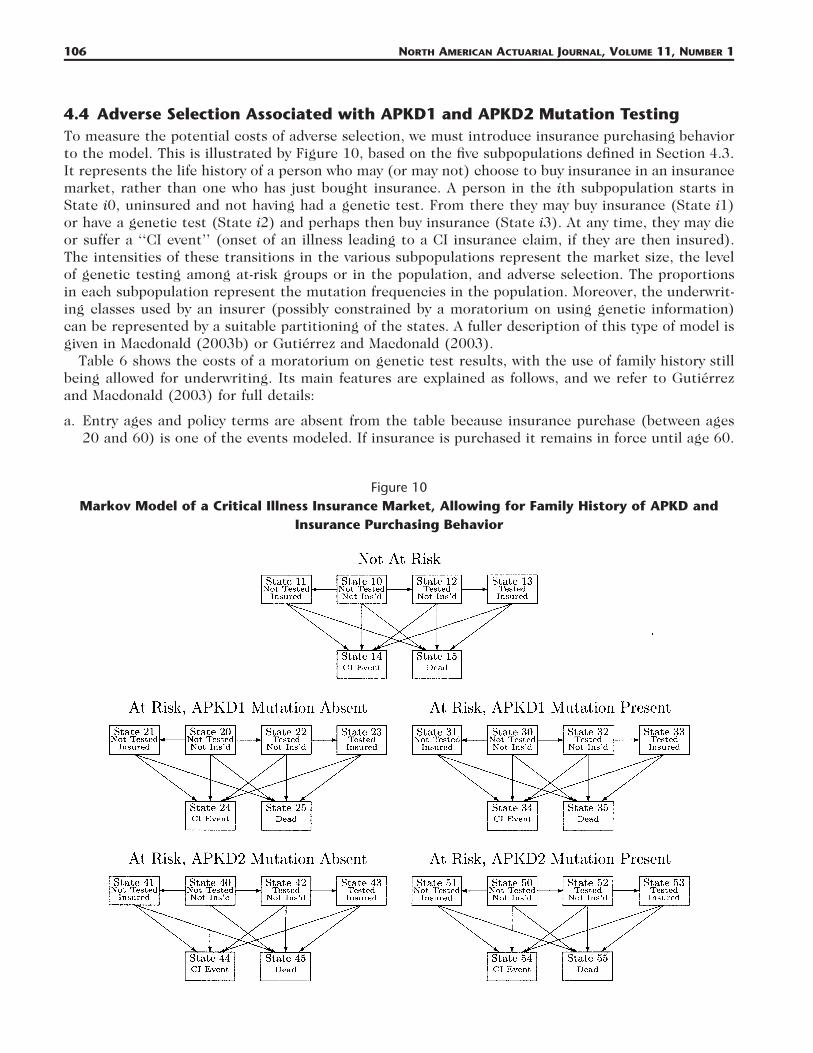
Figure 10Markov Model of a Critical Illness Insurance Market, Allowing for Family History of APKD and
Insurance Purchasing Behavior
4.4 Adverse Selection Associated with APKD1 and APKD2 Mutation TestingTo measure the potential costs of adverse selection, we must introduce insurance purchasing behaviorto the model. This is illustrated by Figure 10, based on the five subpopulations defined in Section 4.3.It represents the life history of a person who may (or may not) choose to buy insurance in an insurancemarket, rather than one who has just bought insurance. A person in the ith subpopulation starts inState i0, uninsured and not having had a genetic test. From there they may buy insurance (State i1)or have a genetic test (State i2) and perhaps then buy insurance (State i3). At any time, they may dieor suffer a ‘‘CI event’’ (onset of an illness leading to a CI insurance claim, if they are then insured).The intensities of these transitions in the various subpopulations represent the market size, the levelof genetic testing among at-risk groups or in the population, and adverse selection. The proportionsin each subpopulation represent the mutation frequencies in the population. Moreover, the underwrit-ing classes used by an insurer (possibly constrained by a moratorium on using genetic information)can be represented by a suitable partitioning of the states. A fuller description of this type of model isgiven in Macdonald (2003b) or Gutierrez and Macdonald (2003).
Table 6 shows the costs of a moratorium on genetic test results, with the use of family history stillbeing allowed for underwriting. Its main features are explained as follows, and we refer to Gutierrezand Macdonald (2003) for full details:
a. Entry ages and policy terms are absent from the table because insurance purchase (between ages20 and 60) is one of the events modeled. If insurance is purchased it remains in force until age 60.
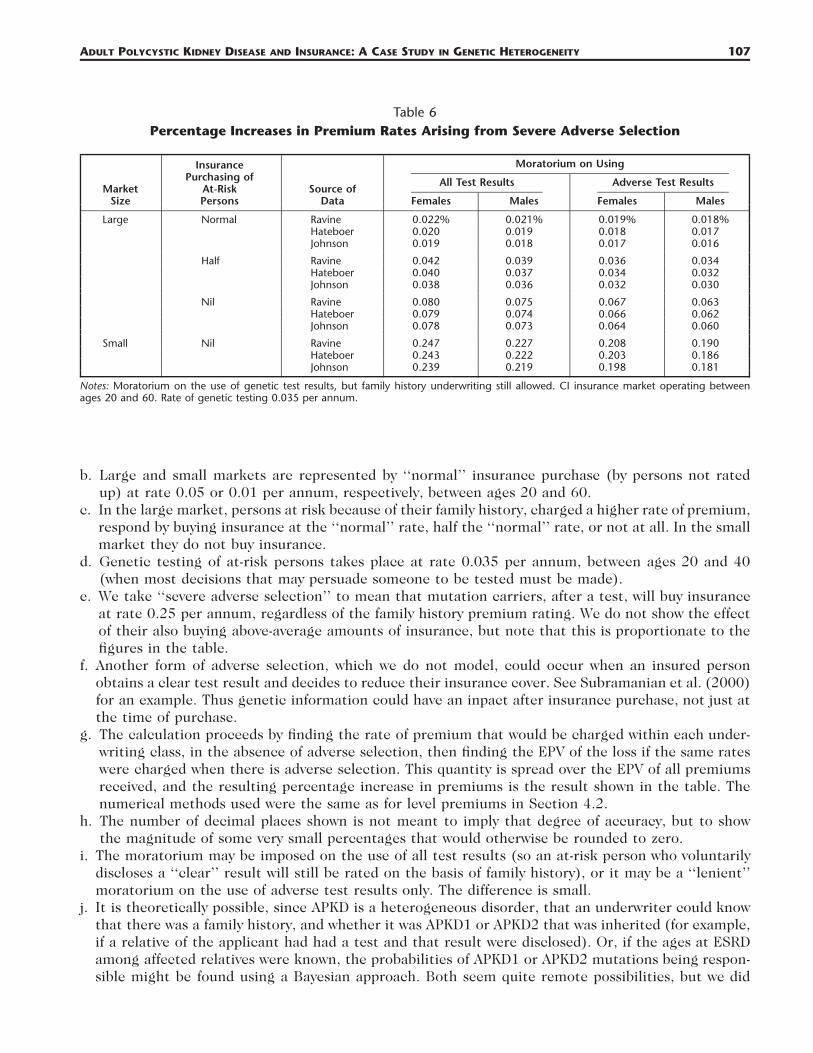
ADULT POLYCYSTIC KIDNEY DISEASE AND INSURANCE: A CASE STUDY IN GENETIC HETEROGENEITY 107
Table 6Percentage Increases in Premium Rates Arising from Severe Adverse Selection
MarketSize
InsurancePurchasing of
At-RiskPersons
Source ofData
Moratorium on Using
All Test Results
Females Males
Adverse Test Results
Females Males
Large Normal Ravine 0.022% 0.021% 0.019% 0.018%Hateboer 0.020 0.019 0.018 0.017Johnson 0.019 0.018 0.017 0.016
Half Ravine 0.042 0.039 0.036 0.034Hateboer 0.040 0.037 0.034 0.032Johnson 0.038 0.036 0.032 0.030
Nil Ravine 0.080 0.075 0.067 0.063Hateboer 0.079 0.074 0.066 0.062Johnson 0.078 0.073 0.064 0.060
Small Nil Ravine 0.247 0.227 0.208 0.190Hateboer 0.243 0.222 0.203 0.186Johnson 0.239 0.219 0.198 0.181
Notes: Moratorium on the use of genetic test results, but family history underwriting still allowed. CI insurance market operating betweenages 20 and 60. Rate of genetic testing 0.035 per annum.
b. Large and small markets are represented by ‘‘normal’’ insurance purchase (by persons not ratedup) at rate 0.05 or 0.01 per annum, respectively, between ages 20 and 60.
c. In the large market, persons at risk because of their family history, charged a higher rate of premium,respond by buying insurance at the ‘‘normal’’ rate, half the ‘‘normal’’ rate, or not at all. In the smallmarket they do not buy insurance.
d. Genetic testing of at-risk persons takes place at rate 0.035 per annum, between ages 20 and 40(when most decisions that may persuade someone to be tested must be made).
e. We take ‘‘severe adverse selection’’ to mean that mutation carriers, after a test, will buy insuranceat rate 0.25 per annum, regardless of the family history premium rating. We do not show the effectof their also buying above-average amounts of insurance, but note that this is proportionate to thefigures in the table.
f. Another form of adverse selection, which we do not model, could occur when an insured personobtains a clear test result and decides to reduce their insurance cover. See Subramanian et al. (2000)for an example. Thus genetic information could have an inpact after insurance purchase, not just atthe time of purchase.
g. The calculation proceeds by finding the rate of premium that would be charged within each under-writing class, in the absence of adverse selection, then finding the EPV of the loss if the same rateswere charged when there is adverse selection. This quantity is spread over the EPV of all premiumsreceived, and the resulting percentage increase in premiums is the result shown in the table. Thenumerical methods used were the same as for level premiums in Section 4.2.
h. The number of decimal places shown is not meant to imply that degree of accuracy, but to showthe magnitude of some very small percentages that would otherwise be rounded to zero.
i. The moratorium may be imposed on the use of all test results (so an at-risk person who voluntarilydiscloses a ‘‘clear’’ result will still be rated on the basis of family history), or it may be a ‘‘lenient’’moratorium on the use of adverse test results only. The difference is small.
j. It is theoretically possible, since APKD is a heterogeneous disorder, that an underwriter could knowthat there was a family history, and whether it was APKD1 or APKD2 that was inherited (for example,if a relative of the applicant had had a test and that result were disclosed). Or, if the ages at ESRDamong affected relatives were known, the probabilities of APKD1 or APKD2 mutations being respon-sible might be found using a Bayesian approach. Both seem quite remote possibilities, but we did
108 NORTH AMERICAN ACTUARIAL JOURNAL, VOLUME 11, NUMBER 1
Table 7Percentage Increases in Standard CI Premium Rates Arising from New Underwriting Classes and
Severe Adverse Selection Following a Moratorium on Use of Adverse Genetic Test Results andFamily History
MarketSize
Source ofData
Premium Increases Arisingfrom New Underwriting
Classes
Females Males
Premium Increases Arisingfrom Severe Adverse
Selection
Females Males
Large Ravine 0.205% 0.190% 0.109% 0.103%Hateboer 0.201 0.186 0.096 0.090Johnson 0.196 0.181 0.082 0.077
Small Ravine 0.196 0.176 0.803 0.739Hateboer 0.197 0.177 0.747 0.686Johnson 0.195 0.176 0.690 0.633
Notes: CI insurance market operating between ages 20 and 60. Rate of genetic testing 0.035.
rerun the figures in Table 6 assuming that mutations were identifiable and found it made a negligibledifference.
The costs are all very small (bearing in mind that APKD is one of the more common single-genedisorders). Moreover, it makes little difference which of the three sources of data we use. Comparingthese with the corresponding results in Gutierrez and Macdonald (2003, Table 8), which were basedon aggregate data, we find that the costs in this study are all a little higher, but reasonably close. Theyseem quite consistent with Figure 4, bearing in mind that APKD1 is so much more common thanAPKD2.
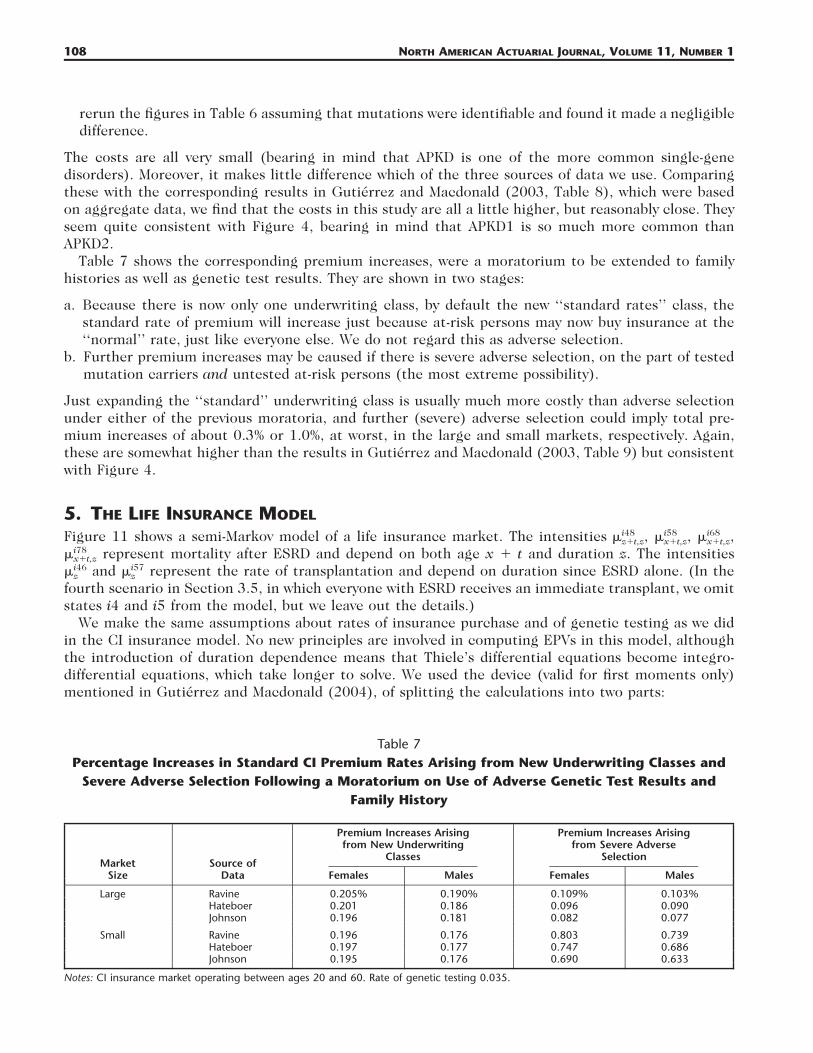
Table 7 shows the corresponding premium increases, were a moratorium to be extended to familyhistories as well as genetic test results. They are shown in two stages:
a. Because there is now only one underwriting class, by default the new ‘‘standard rates’’ class, thestandard rate of premium will increase just because at-risk persons may now buy insurance at the‘‘normal’’ rate, just like everyone else. We do not regard this as adverse selection.
b. Further premium increases may be caused if there is severe adverse selection, on the part of testedmutation carriers and untested at-risk persons (the most extreme possibility).
Just expanding the ‘‘standard’’ underwriting class is usually much more costly than adverse selectionunder either of the previous moratoria, and further (severe) adverse selection could imply total pre-mium increases of about 0.3% or 1.0%, at worst, in the large and small markets, respectively. Again,these are somewhat higher than the results in Gutierrez and Macdonald (2003, Table 9) but consistentwith Figure 4.
5. THE LIFE INSURANCE MODEL
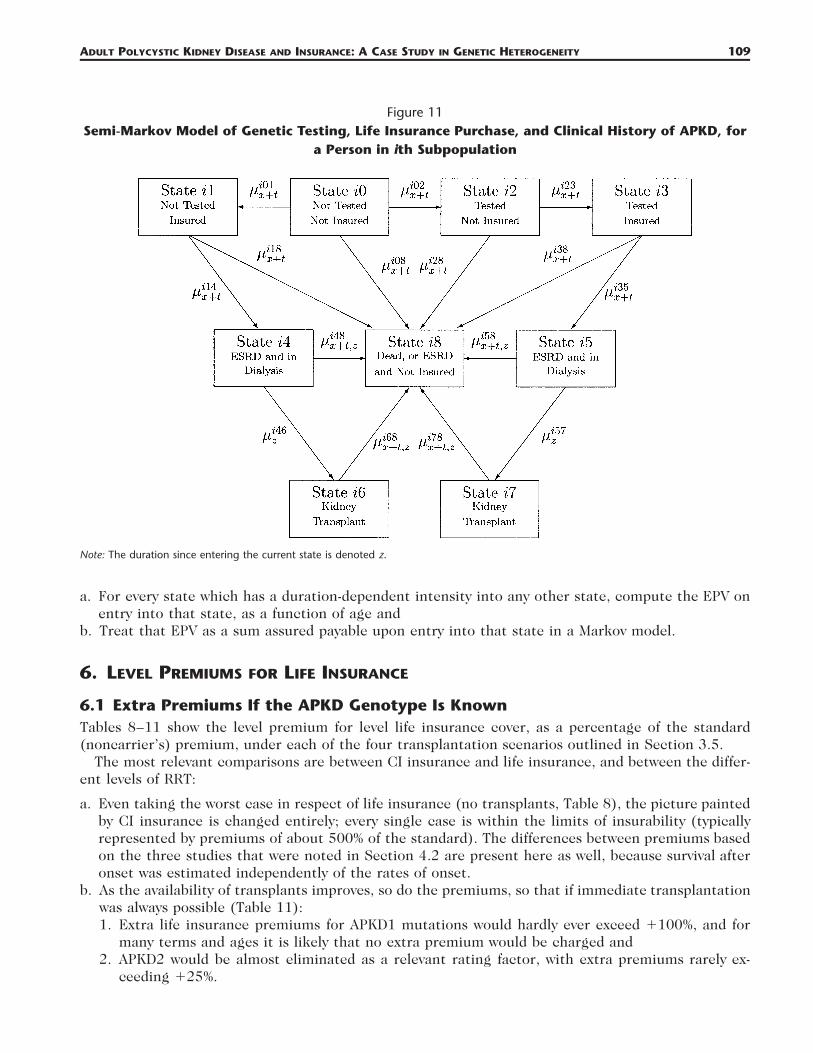
Figure 11 shows a semi-Markov model of a life insurance market. The intensities i48 i58 i68� , � , � ,z�t,z x�t,z x�t,z
represent mortality after ESRD and depend on both age x � t and duration z. The intensitiesi78�x�t,z
and represent the rate of transplantation and depend on duration since ESRD alone. (In thei46 i57� �z z
fourth scenario in Section 3.5, in which everyone with ESRD receives an immediate transplant, we omitstates i4 and i5 from the model, but we leave out the details.)
We make the same assumptions about rates of insurance purchase and of genetic testing as we didin the CI insurance model. No new principles are involved in computing EPVs in this model, althoughthe introduction of duration dependence means that Thiele’s differential equations become integro-differential equations, which take longer to solve. We used the device (valid for first moments only)mentioned in Gutierrez and Macdonald (2004), of splitting the calculations into two parts:
ADULT POLYCYSTIC KIDNEY DISEASE AND INSURANCE: A CASE STUDY IN GENETIC HETEROGENEITY 109
Figure 11Semi-Markov Model of Genetic Testing, Life Insurance Purchase, and Clinical History of APKD, for
a Person in ith Subpopulation
Note: The duration since entering the current state is denoted z.
a. For every state which has a duration-dependent intensity into any other state, compute the EPV onentry into that state, as a function of age and
b. Treat that EPV as a sum assured payable upon entry into that state in a Markov model.
6. LEVEL PREMIUMS FOR LIFE INSURANCE
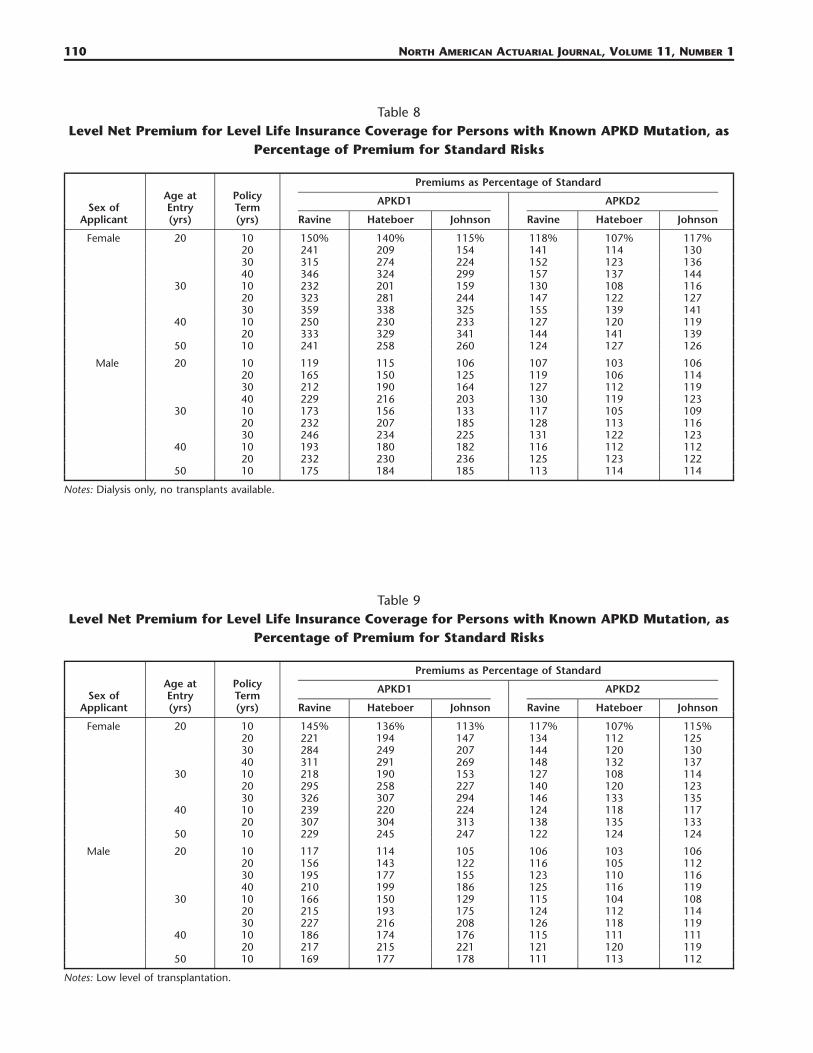
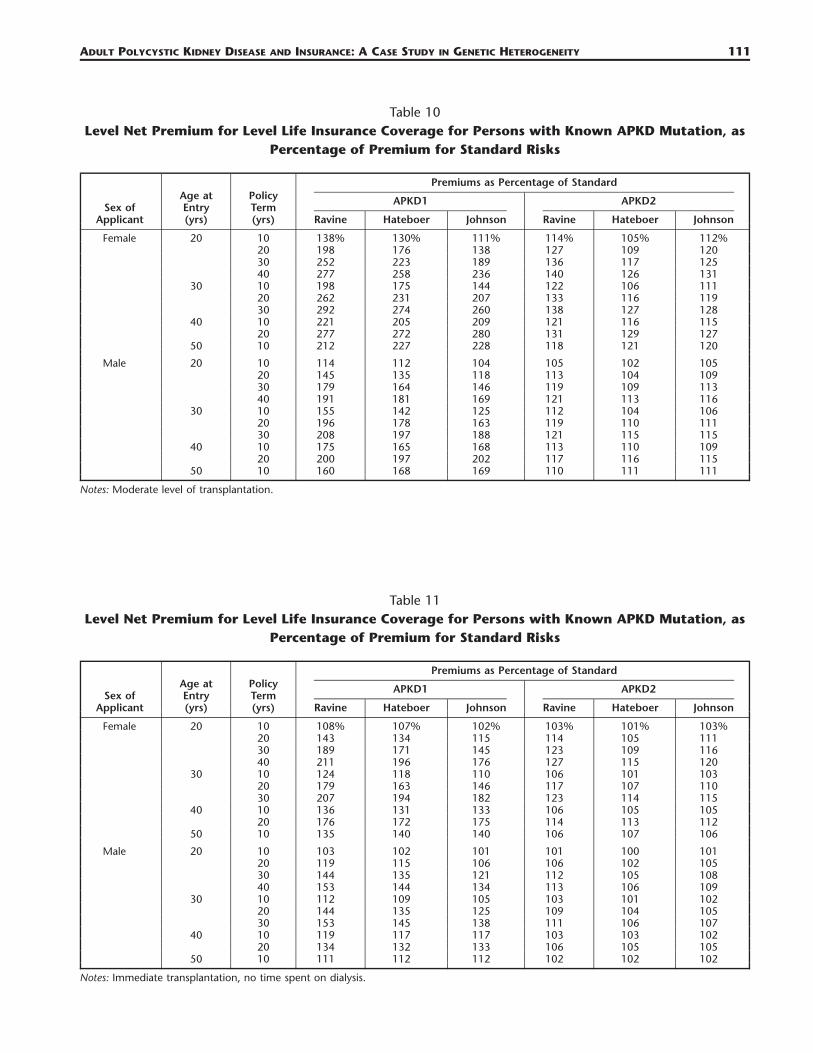
6.1 Extra Premiums If the APKD Genotype Is KnownTables 8–11 show the level premium for level life insurance cover, as a percentage of the standard(noncarrier’s) premium, under each of the four transplantation scenarios outlined in Section 3.5.
The most relevant comparisons are between CI insurance and life insurance, and between the differ-ent levels of RRT:
a. Even taking the worst case in respect of life insurance (no transplants, Table 8), the picture paintedby CI insurance is changed entirely; every single case is within the limits of insurability (typicallyrepresented by premiums of about 500% of the standard). The differences between premiums basedon the three studies that were noted in Section 4.2 are present here as well, because survival afteronset was estimated independently of the rates of onset.
b. As the availability of transplants improves, so do the premiums, so that if immediate transplantationwas always possible (Table 11):1. Extra life insurance premiums for APKD1 mutations would hardly ever exceed �100%, and for
many terms and ages it is likely that no extra premium would be charged and2. APKD2 would be almost eliminated as a relevant rating factor, with extra premiums rarely ex-
ceeding �25%.
110 NORTH AMERICAN ACTUARIAL JOURNAL, VOLUME 11, NUMBER 1
Table 8Level Net Premium for Level Life Insurance Coverage for Persons with Known APKD Mutation, as
Percentage of Premium for Standard Risks
Sex ofApplicant
Age atEntry(yrs)
PolicyTerm(yrs)
Premiums as Percentage of Standard
APKD1
Ravine Hateboer Johnson
APKD2
Ravine Hateboer Johnson
Female 20 10 150% 140% 115% 118% 107% 117%20 241 209 154 141 114 13030 315 274 224 152 123 13640 346 324 299 157 137 144
30 10 232 201 159 130 108 11620 323 281 244 147 122 12730 359 338 325 155 139 141
40 10 250 230 233 127 120 11920 333 329 341 144 141 139
50 10 241 258 260 124 127 126
Male 20 10 119 115 106 107 103 10620 165 150 125 119 106 11430 212 190 164 127 112 11940 229 216 203 130 119 123
30 10 173 156 133 117 105 10920 232 207 185 128 113 11630 246 234 225 131 122 123
40 10 193 180 182 116 112 11220 232 230 236 125 123 122
50 10 175 184 185 113 114 114
Notes: Dialysis only, no transplants available.
Table 9Level Net Premium for Level Life Insurance Coverage for Persons with Known APKD Mutation, as
Percentage of Premium for Standard Risks
Sex ofApplicant
Age atEntry(yrs)
PolicyTerm(yrs)
Premiums as Percentage of Standard
APKD1
Ravine Hateboer Johnson
APKD2
Ravine Hateboer Johnson
Female 20 10 145% 136% 113% 117% 107% 115%20 221 194 147 134 112 12530 284 249 207 144 120 13040 311 291 269 148 132 137
30 10 218 190 153 127 108 11420 295 258 227 140 120 12330 326 307 294 146 133 135
40 10 239 220 224 124 118 11720 307 304 313 138 135 133
50 10 229 245 247 122 124 124
Male 20 10 117 114 105 106 103 10620 156 143 122 116 105 11230 195 177 155 123 110 11640 210 199 186 125 116 119
30 10 166 150 129 115 104 10820 215 193 175 124 112 11430 227 216 208 126 118 119
40 10 186 174 176 115 111 11120 217 215 221 121 120 119
50 10 169 177 178 111 113 112
Notes: Low level of transplantation.
ADULT POLYCYSTIC KIDNEY DISEASE AND INSURANCE: A CASE STUDY IN GENETIC HETEROGENEITY 111
Table 10Level Net Premium for Level Life Insurance Coverage for Persons with Known APKD Mutation, as
Percentage of Premium for Standard Risks
Sex ofApplicant
Age atEntry(yrs)
PolicyTerm(yrs)
Premiums as Percentage of Standard
APKD1
Ravine Hateboer Johnson
APKD2
Ravine Hateboer Johnson
Female 20 10 138% 130% 111% 114% 105% 112%20 198 176 138 127 109 12030 252 223 189 136 117 12540 277 258 236 140 126 131
30 10 198 175 144 122 106 11120 262 231 207 133 116 11930 292 274 260 138 127 128
40 10 221 205 209 121 116 11520 277 272 280 131 129 127
50 10 212 227 228 118 121 120
Male 20 10 114 112 104 105 102 10520 145 135 118 113 104 10930 179 164 146 119 109 11340 191 181 169 121 113 116
30 10 155 142 125 112 104 10620 196 178 163 119 110 11130 208 197 188 121 115 115
40 10 175 165 168 113 110 10920 200 197 202 117 116 115
50 10 160 168 169 110 111 111
Notes: Moderate level of transplantation.
Table 11Level Net Premium for Level Life Insurance Coverage for Persons with Known APKD Mutation, as
Percentage of Premium for Standard Risks
Sex ofApplicant
Age atEntry(yrs)
PolicyTerm(yrs)
Premiums as Percentage of Standard
APKD1
Ravine Hateboer Johnson
APKD2
Ravine Hateboer Johnson
Female 20 10 108% 107% 102% 103% 101% 103%20 143 134 115 114 105 11130 189 171 145 123 109 11640 211 196 176 127 115 120
30 10 124 118 110 106 101 10320 179 163 146 117 107 11030 207 194 182 123 114 115
40 10 136 131 133 106 105 10520 176 172 175 114 113 112
50 10 135 140 140 106 107 106
Male 20 10 103 102 101 101 100 10120 119 115 106 106 102 10530 144 135 121 112 105 10840 153 144 134 113 106 109
30 10 112 109 105 103 101 10220 144 135 125 109 104 10530 153 145 138 111 106 107
40 10 119 117 117 103 103 10220 134 132 133 106 105 105
50 10 111 112 112 102 102 102
Notes: Immediate transplantation, no time spent on dialysis.
112 NORTH AMERICAN ACTUARIAL JOURNAL, VOLUME 11, NUMBER 1
This is striking evidence of the significant impact that treatment can have, even in respect of otherwisesevere disorders.
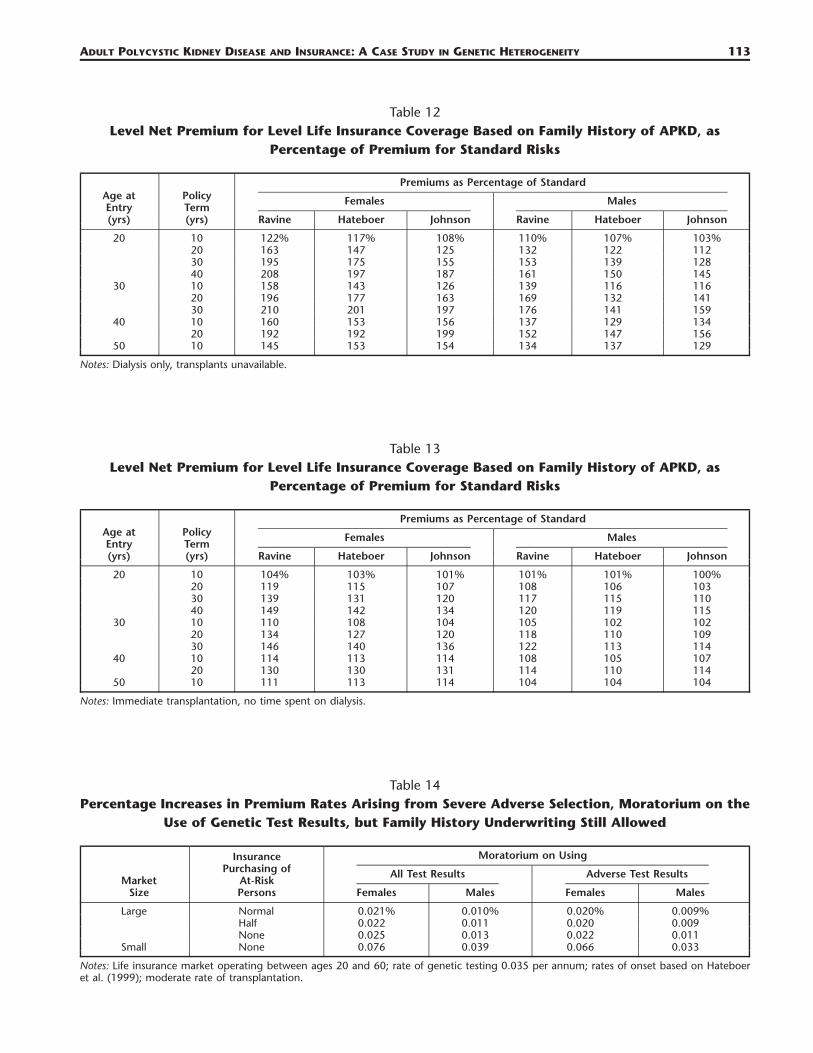
6.2 Extra Premiums Based on Family History OnlyTables 12 and 13 show the level premium for level life insurance coverage, as a percentage of thestandard (noncarrier’s) premium, for applicants with a family history of APKD. For brevity, since theeffect of the intermediate treatment scenarios was made clear in Section 6, we show only the extremescenarios of no transplantation and immediate transplantation.
Once again, our most significant result is the potentially awkward ranking of premium ratings basedon different levels of genetic information. For example, in the case of no transplantation, and basedon Hateboer et al. (1999), a female age 20 seeking life coverage for 40 years would be charged a highextra premium of �224% if she carried an APKD1 mutation, or (possibly) a small extra premium of�37% if she carried an APKD2 mutation, but �97% on the basis of family history.
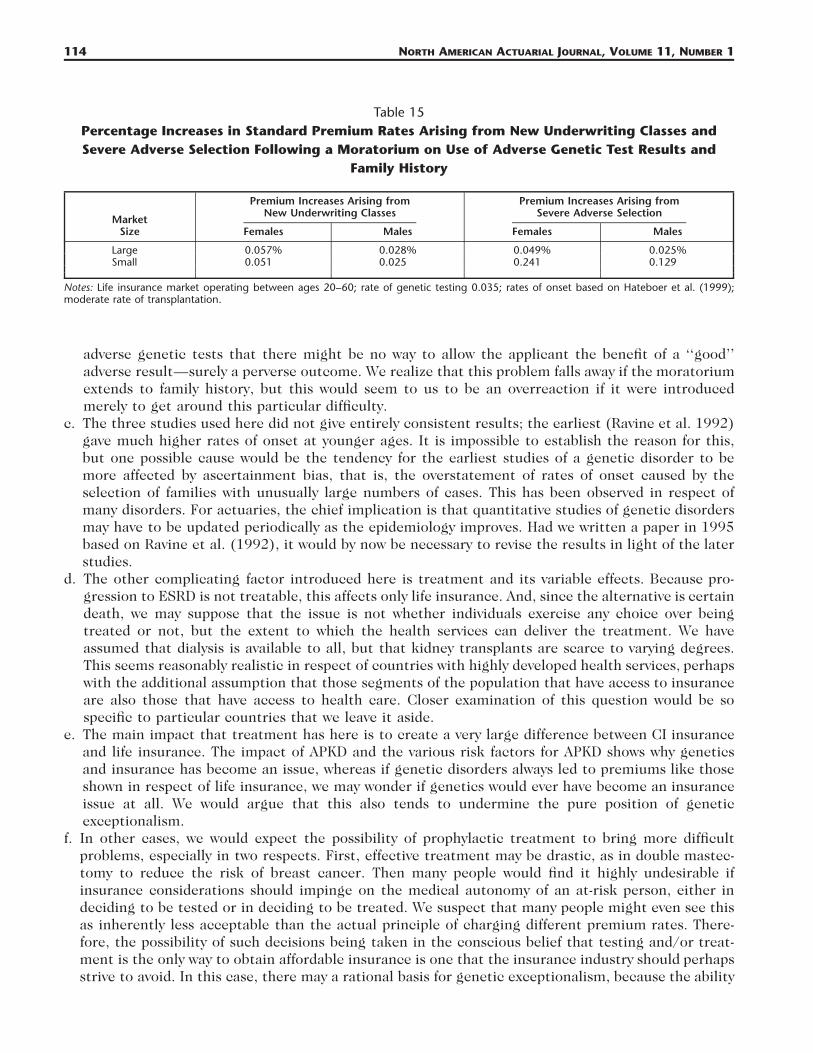
7. LIFE INSURANCE AND ADVERSE SELECTION
Since it is already evident from the previous comparison between CI and life insurance that the costsof APKD risk in respect of the latter are much lower, we will not show adverse selection costs in everyscenario. Also, we noted from Tables 6 and 7 that there was very little difference in the CI adverseselection costs based on the three different studies. Therefore, here we show only adverse selectioncosts based on one treatment scenario (a moderate rate of transplantation, which seems reasonablyrealistic for our purposes) and on one study, namely, Hateboer et al. (1999), which we had alreadynoted as being possibly the most reliable of the three in respect of APKD2.
Table 14 shows the results of severe adverse selection in the presence of a moratorium on genetictests alone, while Table 15 shows the results of a moratorium extending to family history as well, inthe same two stages as before to separate out genuine adverse selection from the creation of a broaderunderwriting class. In support of studies of other disorders, these tables show that only the removal offamily history as a rating factor makes any possible difference, and we would remind the reader thatwe think our assumptions are extreme.
8. CONCLUSIONS
We have modeled the impact on insurance of a genetic disorder that is more complex than othersstudied to date, in several respects:
a. It is heterogeneous, being caused by mutations in either of two genes. While this is also true offamilial breast or ovarian cancer, for example, in the case of APKD the relative mutation frequenciesand penetrances combine to make knowledge of family history a riskier piece of information thanan adverse test result for an APKD2 mutation. This subverts our intuitive ranking of the ‘‘strength’’of genetic information, in which we would naturally suppose family history to carry less risk than aknown mutation. Since it is clear that some such intuitive ranking may have influenced the form ofmoratoria currently in use, this may call for some rethinking. Perhaps the basic conflict to which itpoints is the extra moral, social, or ethical weight that sometimes seems to be attached to geneticinformation, with more weight being attached to information that is seen as ‘‘more genetic.’’ Therelative ranking of the ‘‘more genetic’’ APKD2 test result and the ‘‘less genetic’’ family history ofAPKD does not support a pure form of genetic exceptionalism.
b. The counterintuitive ranking of risks does lead to some practical difficulties in the application of amoratorium. It seems to be accepted in most jurisdictions that a ‘‘lenient’’ moratorium is accept-able, so that genetic information that benefits the applicant may be used in underwriting. Now, itis possible that an adverse test result may benefit the applicant. However, such has been the desireof those involved in shaping the various moratoria to nail down the possibility of insurers using
ADULT POLYCYSTIC KIDNEY DISEASE AND INSURANCE: A CASE STUDY IN GENETIC HETEROGENEITY 113
Table 12Level Net Premium for Level Life Insurance Coverage Based on Family History of APKD, as
Percentage of Premium for Standard Risks
Age atEntry(yrs)
PolicyTerm(yrs)
Premiums as Percentage of Standard
Females
Ravine Hateboer Johnson
Males
Ravine Hateboer Johnson
20 10 122% 117% 108% 110% 107% 103%20 163 147 125 132 122 11230 195 175 155 153 139 12840 208 197 187 161 150 145
30 10 158 143 126 139 116 11620 196 177 163 169 132 14130 210 201 197 176 141 159
40 10 160 153 156 137 129 13420 192 192 199 152 147 156
50 10 145 153 154 134 137 129
Notes: Dialysis only, transplants unavailable.
Table 13Level Net Premium for Level Life Insurance Coverage Based on Family History of APKD, as
Percentage of Premium for Standard Risks
Age atEntry(yrs)
PolicyTerm(yrs)
Premiums as Percentage of Standard
Females
Ravine Hateboer Johnson
Males
Ravine Hateboer Johnson
20 10 104% 103% 101% 101% 101% 100%20 119 115 107 108 106 10330 139 131 120 117 115 11040 149 142 134 120 119 115
30 10 110 108 104 105 102 10220 134 127 120 118 110 10930 146 140 136 122 113 114
40 10 114 113 114 108 105 10720 130 130 131 114 110 114
50 10 111 113 114 104 104 104
Notes: Immediate transplantation, no time spent on dialysis.
Table 14Percentage Increases in Premium Rates Arising from Severe Adverse Selection, Moratorium on the
Use of Genetic Test Results, but Family History Underwriting Still Allowed
MarketSize
InsurancePurchasing of
At-RiskPersons
Moratorium on Using
All Test Results
Females Males
Adverse Test Results
Females Males
Large Normal 0.021% 0.010% 0.020% 0.009%Half 0.022 0.011 0.020 0.009None 0.025 0.013 0.022 0.011
Small None 0.076 0.039 0.066 0.033
Notes: Life insurance market operating between ages 20 and 60; rate of genetic testing 0.035 per annum; rates of onset based on Hateboeret al. (1999); moderate rate of transplantation.
114 NORTH AMERICAN ACTUARIAL JOURNAL, VOLUME 11, NUMBER 1
Table 15Percentage Increases in Standard Premium Rates Arising from New Underwriting Classes andSevere Adverse Selection Following a Moratorium on Use of Adverse Genetic Test Results and
Family History
MarketSize
Premium Increases Arising fromNew Underwriting Classes
Females Males
Premium Increases Arising fromSevere Adverse Selection
Females Males
Large 0.057% 0.028% 0.049% 0.025%Small 0.051 0.025 0.241 0.129
Notes: Life insurance market operating between ages 20–60; rate of genetic testing 0.035; rates of onset based on Hateboer et al. (1999);moderate rate of transplantation.
adverse genetic tests that there might be no way to allow the applicant the benefit of a ‘‘good’’adverse result—surely a perverse outcome. We realize that this problem falls away if the moratoriumextends to family history, but this would seem to us to be an overreaction if it were introducedmerely to get around this particular difficulty.
c. The three studies used here did not give entirely consistent results; the earliest (Ravine et al. 1992)gave much higher rates of onset at younger ages. It is impossible to establish the reason for this,but one possible cause would be the tendency for the earliest studies of a genetic disorder to bemore affected by ascertainment bias, that is, the overstatement of rates of onset caused by theselection of families with unusually large numbers of cases. This has been observed in respect ofmany disorders. For actuaries, the chief implication is that quantitative studies of genetic disordersmay have to be updated periodically as the epidemiology improves. Had we written a paper in 1995based on Ravine et al. (1992), it would by now be necessary to revise the results in light of the laterstudies.
d. The other complicating factor introduced here is treatment and its variable effects. Because pro-gression to ESRD is not treatable, this affects only life insurance. And, since the alternative is certaindeath, we may suppose that the issue is not whether individuals exercise any choice over beingtreated or not, but the extent to which the health services can deliver the treatment. We haveassumed that dialysis is available to all, but that kidney transplants are scarce to varying degrees.This seems reasonably realistic in respect of countries with highly developed health services, perhapswith the additional assumption that those segments of the population that have access to insuranceare also those that have access to health care. Closer examination of this question would be sospecific to particular countries that we leave it aside.
e. The main impact that treatment has here is to create a very large difference between CI insuranceand life insurance. The impact of APKD and the various risk factors for APKD shows why geneticsand insurance has become an issue, whereas if genetic disorders always led to premiums like thoseshown in respect of life insurance, we may wonder if genetics would ever have become an insuranceissue at all. We would argue that this also tends to undermine the pure position of geneticexceptionalism.
f. In other cases, we would expect the possibility of prophylactic treatment to bring more difficultproblems, especially in two respects. First, effective treatment may be drastic, as in double mastec-tomy to reduce the risk of breast cancer. Then many people would find it highly undesirable ifinsurance considerations should impinge on the medical autonomy of an at-risk person, either indeciding to be tested or in deciding to be treated. We suspect that many people might even see thisas inherently less acceptable than the actual principle of charging different premium rates. There-fore, the possibility of such decisions being taken in the conscious belief that testing and/or treat-ment is the only way to obtain affordable insurance is one that the insurance industry should perhapsstrive to avoid. In this case, there may a rational basis for genetic exceptionalism, because the ability
ADULT POLYCYSTIC KIDNEY DISEASE AND INSURANCE: A CASE STUDY IN GENETIC HETEROGENEITY 115
of a genetic test (for a single-gene disorder) to deliver a firm ‘‘yes’’ or ‘‘no’’ in respect of a perfectlyhealthy individual is rather unusual. Second, surgery might sometimes be delayed until screeningdetects early symptoms; this is the basis for proposed screening programs for familial forms of bowelcancer, for example. It may be possible almost to normalize the mortality risk, but this depends onbeing enrolled in, and remaining in, a screening program. It is not clear how this can reasonably bemade a condition for favorable premium rating, when there is a close association with sensitivegenetic information.
g. The practicality of using genetic tests in underwriting, even if it is allowed, depends on accuratetests being cheaply available. This is not yet the case for APKD1 and APKD2 mutations, but it is apossibility in the reasonably near future. They could be used predictively, before cysts appear, butthis is likely to be confined to people with an affected relative, who choose to be tested. A morelikely use is perhaps diagnostically, as an aid to prognosis.
h. The costs of adverse selection shown here are small in absolute terms, although showing how muchmore serious a moratorium extending to family history might be in relative terms. This informationshould not be viewed in isolation, however, since APKD is just one of several single-gene disorders.We view these results as part of an ongoing research program aimed at modeling enough of themajor genetic disorders to be able to measure the potential for adverse selection on the basis ofepidemiological evidence—the ‘‘bottom-up’’ approach to this problem mentioned in Daykin et al.(2003).
Finally, we note that while this study has had genetic heterogeneity and treatment as its foci, it hasremained within the relatively clear-cut area of severe, single-gene disorders. We should expect heter-ogeneity and treatments to be major features when we come to study complex, multifactorial disorderssuch as heart disease and many cancers.
APPENDIX A
FITTED SURVIVAL FUNCTIONS BASED ON TIME TO ESRD OR DEATH
A.1 JOHNSON AND GABOW (1997)For APKD1:
2S(x) � 1 � exp(�6.12251 � 0.058346x � 0.000921743x ) (x � 39), (A.1)13.2644 12.26440.310552 exp(�0.310552x)x
S(x) � 25.6616 (x � 49) (A.2)� ��(13.2644)
with blending by curve of sines (Benjamin and Pollard 1980) between ages 39 and 49, and for APKD2:2S(x) � 1 � exp(�8.51304 � 0.14592x � 0.000441722x ) (x � 56), (A.3)
39.8749 38.87490.673076 exp(�0.673076x)xS(x) � 17.7985 (x � 74) (A.4)� ��(39.8749)
with blending by curve of sines between ages 56 and 74.
A.2 HATEBOER ET AL. (1999)For APKD1:
2S(x) � 1 � exp(�9.08371 � 0.231087x � 0.00138536x ) (x � 40), (A.5)15.1344 14.13440.345615 exp(�0.345615x)x
S(x) � 23.0056 (x � 55) (A.6)� ��(15.1344)
with blending by curve of sines between ages 40 and 55, and for APKD2:

116 NORTH AMERICAN ACTUARIAL JOURNAL, VOLUME 11, NUMBER 1
2S(x) � 1 � exp(�11.8117 � 0.25559x � 0.00136435x ) (x � 58), (A.7)21.278 20.2780.364067 exp(�0.364067x)x
S(x) � 24.7781 (x � 70) (A.8)� ��(21.278)
with blending by curve of sines between ages 58 and 70.
A.3 RAVINE ET AL. (1992)For APKD1:
2S(x) � 1 � exp(�10.0993 � 0.294084x � 0.00219349x ) (x � 40), (A.9)12.0004 11.00040.277887 exp(�0.277887x)x
S(x) � 24.4878 (x � 60) (A.10)� ��(12.0004)
with blending by curve of sines between ages 40 and 60, and for APKD2:2S(x) � 1 � exp(�6.53247 � 0.102286x � 0.000256903x ) (x � 80). (A.11)
APPENDIX B
THE CRITICAL ILLNESS INSURANCE MODEL
Gutierrez and Macdonald (2003) obtained the following model for CI insurance based on medicalstudies and population data. Full references can be found in that paper.
a. Rates of onset were found for the following:1. Cancer (excluding nonmalignant skin cancers). For males:
c� � exp(�11.25 � 0.105x) (x � 51),x
c 2 �7 3� � exp(0.2591585 � 0.01247354x � 0.0001916916x � 8.952933 � 10 x ) (x � 60)x
with linear interpolation between ages 51 and 60, and for females:c 2� � exp(�10.78 � 0.123x � 0.00033x ) (x � 53),x
c� � �0.01545632 � 0.0003805097x (x � 53)x
2. Heart Attack. For males:h� � exp(�13.2238 � 0.152568x) (x � 44),xh� � (�0.01245109 � 0.000315605x) (x � 49)x
with linear interpolation between ages 44 and 49, and for females:15.6412 14.64120.15317 exp(�0.15317x)xh� � 0.598694 .� � ��x �(15.6412)
3. Stroke: For males:s 2 3� � exp(�16.9524 � 0.294973x � 0.001904x � 0.00000159449x )x
and for females:s� � exp(�11.1477 � 0.081076x).x
b. Twenty-eight-day survival factors for heart attack and stroke victims were taken from Dinani et al.(2000) (this relates to the common contractual condition that payment depends on surviving for
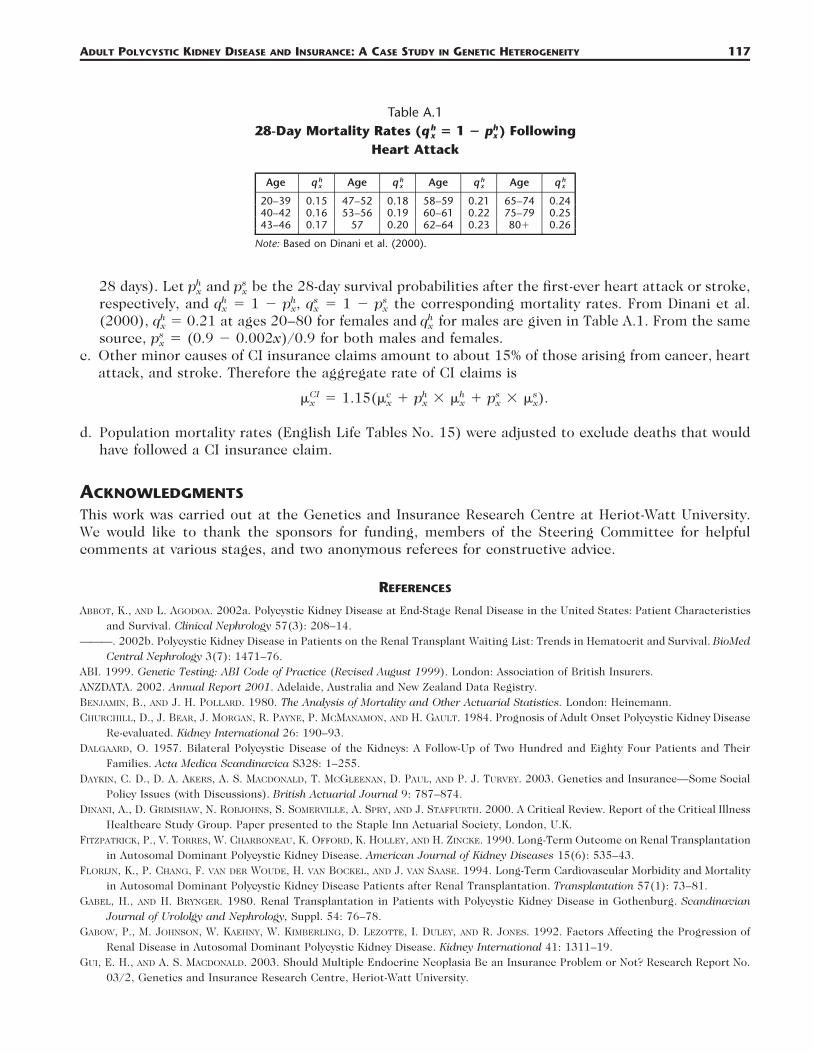
ADULT POLYCYSTIC KIDNEY DISEASE AND INSURANCE: A CASE STUDY IN GENETIC HETEROGENEITY 117
Table A.128-Day Mortality Rates ( � 1 � ) Followingh hq px x
Heart Attack
Age hq x Age hq x Age hq x Age hq x
20–39 0.15 47–52 0.18 58–59 0.21 65–74 0.2440–42 0.16 53–56 0.19 60–61 0.22 75–79 0.2543–46 0.17 57 0.20 62–64 0.23 80� 0.26
Note: Based on Dinani et al. (2000).
28 days). Let and be the 28-day survival probabilities after the first-ever heart attack or stroke,h sp px x
respectively, and � 1 � � 1 � the corresponding mortality rates. From Dinani et al.h h s sq p , q px x x x
(2000), � 0.21 at ages 20–80 for females and for males are given in Table A.1. From the sameh hq qx x
source, � (0.9 � 0.002x)/0.9 for both males and females.spx
c. Other minor causes of CI insurance claims amount to about 15% of those arising from cancer, heartattack, and stroke. Therefore the aggregate rate of CI claims is
CI c h h s s� � 1.15(� � p � � � p � � ).x x x x x x
d. Population mortality rates (English Life Tables No. 15) were adjusted to exclude deaths that wouldhave followed a CI insurance claim.
ACKNOWLEDGMENTS
This work was carried out at the Genetics and Insurance Research Centre at Heriot-Watt University.We would like to thank the sponsors for funding, members of the Steering Committee for helpfulcomments at various stages, and two anonymous referees for constructive advice.
REFERENCES
ABBOT, K., AND L. AGODOA. 2002a. Polycystic Kidney Disease at End-Stage Renal Disease in the United States: Patient Characteristicsand Survival. Clinical Nephrology 57(3): 208–14.
———. 2002b. Polycystic Kidney Disease in Patients on the Renal Transplant Waiting List: Trends in Hematocrit and Survival. BioMedCentral Nephrology 3(7): 1471–76.
ABI. 1999. Genetic Testing: ABI Code of Practice (Revised August 1999). London: Association of British Insurers.ANZDATA. 2002. Annual Report 2001. Adelaide, Australia and New Zealand Data Registry.BENJAMIN, B., AND J. H. POLLARD. 1980. The Analysis of Mortality and Other Actuarial Statistics. London: Heinemann.CHURCHILL, D., J. BEAR, J. MORGAN, R. PAYNE, P. MCMANAMON, AND H. GAULT. 1984. Prognosis of Adult Onset Polycystic Kidney Disease
Re-evaluated. Kidney International 26: 190–93.DALGAARD, O. 1957. Bilateral Polycystic Disease of the Kidneys: A Follow-Up of Two Hundred and Eighty Four Patients and Their
Families. Acta Medica Scandinavica S328: 1–255.DAYKIN, C. D., D. A. AKERS, A. S. MACDONALD, T. MCGLEENAN, D. PAUL, AND P. J. TURVEY. 2003. Genetics and Insurance—Some Social
Policy Issues (with Discussions). British Actuarial Journal 9: 787–874.DINANI, A., D. GRIMSHAW, N. ROBJOHNS, S. SOMERVILLE, A. SPRY, AND J. STAFFURTH. 2000. A Critical Review. Report of the Critical Illness
Healthcare Study Group. Paper presented to the Staple Inn Actuarial Society, London, U.K.FITZPATRICK, P., V. TORRES, W. CHARBONEAU, K. OFFORD, K. HOLLEY, AND H. ZINCKE. 1990. Long-Term Outcome on Renal Transplantation
in Autosomal Dominant Polycystic Kidney Disease. American Journal of Kidney Diseases 15(6): 535–43.FLORIJN, K., P. CHANG, F. VAN DER WOUDE, H. VAN BOCKEL, AND J. VAN SAASE. 1994. Long-Term Cardiovascular Morbidity and Mortality
in Autosomal Dominant Polycystic Kidney Disease Patients after Renal Transplantation. Transplantation 57(1): 73–81.GABEL, H., AND H. BRYNGER. 1980. Renal Transplantation in Patients with Polycystic Kidney Disease in Gothenburg. Scandinavian
Journal of Urololgy and Nephrology, Suppl. 54: 76–78.GABOW, P., M. JOHNSON, W. KAEHNY, W. KIMBERLING, D. LEZOTTE, I. DULEY, AND R. JONES. 1992. Factors Affecting the Progression of
Renal Disease in Autosomal Dominant Polycystic Kidney Disease. Kidney International 41: 1311–19.GUI, E. H., AND A. S. MACDONALD. 2003. Should Multiple Endocrine Neoplasia Be an Insurance Problem or Not? Research Report No.
03/2, Genetics and Insurance Research Centre, Heriot-Watt University.
118 NORTH AMERICAN ACTUARIAL JOURNAL, VOLUME 11, NUMBER 1
GUTIERREZ, M. C., AND A. S. MACDONALD. 2003. Adult Polycystic Kidney Disease and Critical Illness Insurance. North American ActuarialJournal 7(2): 93–115.
GUTIERREZ, M. C., AND A. S. MACDONALD. 2004. Huntington’s Disease, Critical Illness Insurance and Life Insurance. ScandinavianActuarial Journal, 279–313.
HADIMERI, H., G. NORDEN, S. FRIMAN, AND G. NYBERG 1997. Autosomal Dominant Polycystic Kidney Disease in a Kidney TransplantPopulation. Nephrology, Dialysis and Transplantation 12: 1431–36.
HARRIS, S., AND E. BROWN. 1998. Patients Surviving More than 10 Years on Haemodialysis: The Natural History of the Complicationsof Treatment. Nephrology Dialysis Transplantation 13: 1226–33.
HATEBOER, N., N. BOGDANOVA, M. DIJK, E. COTO, A. SAGGAR-MALIK, J. SAN MILLAN, R. TORRA, D. RAVINE, AND M. BREUNING FOR THE
EUROPEAN PKD1-PKD2 STUDY GROUP. 1999. Comparison of Phenotypes of Polycystic Kidney Disease Types 1 and 2. EuropeanPKD1-PKD2 Study Group. Lancet 353: 103–7.
HOEM, J. M. 1988. The Versatility of the Markov Chain as a Tool in the Mathematics of Life Insurance. Transactions of the 23rdInternational Congress of Actuaries, Helsinki, S: 171–202.
JOHNSON, A., AND P. GABOW. 1997. Identification of Patients with Autosomal Dominant Polycystic Kidney Disease at Highest Risk ofEnd-Stage Renal Disease. Journal of Medical Genetics 34: 827–30.
MACDONALD, A. S. 2003a. Genetics and Insurance: What Have We Learned So Far? Scandinavian Actuarial Journal 324–48.———. 2003b. Moratoria on the Use of Genetic Tests and Family History for Mortgage-Related Life Insurance. British Actuarial
Journal 9: 217–37.———. 2004. Genetics and Insurance. In Encyclopaedia of Actuarial Science, ed. J. L. Teugels and B. Sundt. Chichester: John Wiley.
2: 769–78.MCDONALD, S., AND G. RUSS 2002. Survival of Recipients of Cadaveric Kidney Transplants Compared with Those Receiving Dialysis
Treatment in Australia and New Zealand, 1991–2001. Nephrology Dialysis Transplantation 17: 2212–19.MEIER-KRIESCHE, H., A. OJO, F. PORT, J. ARNDORFER, D. CIBRIK, AND B. KAPLAN. 2001. Survival Improvement among Patients with End-
Stage Renal Disease: Trends over Time for Transplant Recipients and Wait-Listed Patients. Journal of the American Society ofNephrology 12: 1293–96.
PERRONE, R., R. RUTHAZER, AND N. TERRIN. 2001. Survival after End-Stage Renal Disease in Autosomal Dominant Polycystic KidneyDisease: Contribution of Extrarenal Complications to Mortality. American Journal of Kidney Disease 38(4): 777–84.
RABBAT, C., K. THORPE, D. RUSSELL, AND D. CHURCHILL. 2000. Comparison of Mortality Risk for Dialysis Patients and Cadaveric FirstRenal Transplant Recipients in Ontario, Canada. Journal of the American Society of Nephrology 11: 917–22.
RAVINE, D., R. WALKER, R. GIBSON, S. FORREST, R. RICHARDS, K. FRIEND, L. SHEFFIELD, P. KINCAID-SMITH, AND D. DANKS. 1992. Phenotypeand Genotype Heterogeneity in Autosomal Dominant Polycystic Kidney Disease. Lancet 340: 1330–33.
SUBRAMANIAN, K., J. LEMAIRE, J. C. HERSHEY, M. V. PAULY, K. ARMSTRONG, AND D. A. ASCH. 2000. Estimating Adverse Selection Costsfrom Genetic Testing for Breast and Ovarian Cancer: The Case of Life Insurance. Journal of Risk and Insurance 66: 531–50.
TSAKIRIS, D., E. JONES, D. BRIGS, C. ELINDER, O. MEHLS, S. MENDEL, G. PICCOLI, S. RIGDEN, J. DOS SANTOS, K. SIMPSON, AND Y. VANREN-TERGHEM. 1999. Deaths within 90 Days from Starting Renal Replacement Therapy in the ERA-EDTA Registry between 1990 and1992. Nephrology Dialysis Transplantation 14: 2343–50.
U.K. TRANSPLANT. 2002. U.K. Transplant Annual Report 2001. U.K. Transplant–Bristol, U.K. Renal Registry.UNITED STATES RENAL DISEASES SYSTEM. 1999. Annual Report of the United States Renal Diseases System. USRDS.WATSON, M., AND V. TORRES. 1996. Polycystic Kidney Disease. Oxford: Oxford University Press.WOLFE, R., V. ASHBY, E. MILFORD, A. OJO, R. ETTENGER, L. AGODOA, P. HELD, AND F. PORT. 1999. Comparison of Mortality in All Patients
on Dialysis, Patients on Dialysis Awaiting Transplantation and Recipients of a First Cadaveric Transplant. New England Journalof Medicine 341: 1725–30.
Discussions on this paper can be submitted until July 1, 2007. The authors reserve the right to reply to anydiscussion. Please see the Submission Guidelines for Authors on the inside back cover for instructions on thesubmission of discussions.