Embed Size (px)
Citation preview
Published: July 05, 2011
r 2011 American Chemical Society 16439 dx.doi.org/10.1021/jp203468n | J. Phys. Chem. C 2011, 115, 16439–16450
ARTICLE
pubs.acs.org/JPCC
Adsorption of Glycine on Au(hkl) and Gold Thin Film Electrodes:An in Situ Spectroelectrochemical StudyAndrea P. Sandoval, Jos�e Manuel Orts, Antonio Rodes,* and Juan M. Feliu
Departamento de Química Física e Instituto Universitario de Electroquímica, Universidad de Alicante, Apartado 99,E-03080 Alicante, Spain
1. INTRODUCTION
Amino acids are small molecules that constitute proteinstructures, which are themolecular expression of genetic informa-tion and are responsible for almost every biological function.1,2
The study of the adsorption of amino acids is fundamental tounderstand the way in which proteins interact with surfacesallowing the development of biosensors and medical devicesand for understanding of the processes related with surfacefouling in industrial applications.3,4
Furthermore, amino acids are interesting probe molecules dueto the variety of functional groups that can be found in the samemolecule (�COOH, �NH2, �OH, �CHx, etc.). This makesthem good models to observe the effect of structural change onadsorption processes at electrocatalytic surfaces.
Hor�anyi and Rizmayer carried out the first studies on theinfluence of the presence of amino acids on electrocatalyticreactions.5,6 They found by a radiotracer method that theadsorption of glycine takes place on Pt in acid and alkalinemedia, showing in this latter case an irreversible chemisorptionbehavior. On the other hand, the adsorption in acid media wasfound to be a reversible potential dependent process.
The electrochemical oxidation of glycine was later studied byRoscoe et al.7 in acid and alkaline media with a polycrystalline Ptelectrode using current�potential measurements under station-ary conditions, as well as cyclic voltammetry and open circuit
potential measurements. Their results suggest the possibleproduction of surface free radicals and the formation of CO2 asthe rate determining step. According to these authors, theadsorbed intermediates formed during the electro-oxidation ofglycine hydrolyze to produce formaldehyde and ammonia, ashappens during the oxidation ofR- and β-alanine.8 These studieswere extended to other amino acids such as L-phenylalanine byusing impedance spectroscopy, a quartz crystal nanobalance,9
and infrared spectroscopy,10 leading to the conclusion thatL-phenylalanine is weakly chemisorbed at potentials negative tothe potential of zero charge (PZC) and changes its orientationrelative to the surface at potentials close to the PZC.
Huerta et al. studied the behavior of glycine, L-alanine, and L-serine at platinum single crystal surfaces in acid media usingin situ infrared spectroscopy.11�14 These studies showed that thedissociative adsorption of these amino acids on Pt(111) electro-des produces adsorbed cyanide. The reversible adsorption of theamino acid through the carboxylate group was also observed. Inthe case of serine, multibonded CO was found to be formed dueto the presence of the�CH2OH group.12 Adsorbed cyanide wasalso found as the product of oxidative adsorption of glycine on
Received: April 13, 2011Revised: June 16, 2011
ABSTRACT: The adsorption of glycine at gold single crystal andevaporated thin-film electrodes with preferential (111) orientationwas studied in perchloric acid solutions by cyclic voltammetryexperiments combined with external reflection infrared spectrosco-py (gold single crystals) and surface-enhanced infrared reflectionabsorption spectroscopy under attenuated total reflection condi-tions (ATR-SEIRAS) (gold thin films). Theoretical harmonicvibrational frequencies obtained from B3LYP/LANL2DZ, 6-31+G(d) calculations for glycinate species adsorbed on Au clusterswith (111) orientation were used to interpret the experimentalspectra. The optimized geometry obtained from DFT calculations for zwitterionic glycine plus a water molecule corresponds to abidentate asymmetrical bridge configuration under the application of an external electric field of 0.01 atomic units. The absence of anadsorbate band for the asymmetric OCO stretching in the experimental infrared spectra confirms the bidentate bonding of glycinateanions through the oxygen atoms of the carboxylate group irrespective of the crystallographic orientation of the electrode surface,the glycinate coverage, and/or the electrode potential. The ATR-SEIRA spectra show an important coadsorption of perchlorateanions that compensates the positive charge of the protonated ammonium group. In addition to typical interfacial water bandsassociated to perchlorate anions, the spectra also show bands around 2800 cm�1 that can be related to the formation of hydrogenbonds between interfacial water and the ammonium group of the adsorbed glycinate species. The infrared experimental study isextended to the oxidation of glycine at potentials above 1.10 V, showing the formation of carbon dioxide and adsorbed cyanide.
16440 dx.doi.org/10.1021/jp203468n |J. Phys. Chem. C 2011, 115, 16439–16450
The Journal of Physical Chemistry C ARTICLE
Pt(110) and Pt(100), although in the latter case cyanide furtheroxidizes to NO and CO2.
13
Sun et al.15 studied the adsorption of glycine, serine, andthreonine on polycrystalline Pt and Au electrodes in alkalinemedia using in situ Raman spectroscopy (SERS). They foundthat these amino acids dissociate on the Pt surfaces to form acyanide adlayer. The threshold potential for the dissociation onthe Pt surface increases in the order glycine < threonine < serine.On gold surfaces the formation of cyanide only occurs when theamino acids undergo oxidation. Sun’s group also studied theelectrochemical behavior of glycine in alkaline media on Au(111)and polycrystalline electrodes, using in situ infrared spectroscopyand electrochemical quartz crystal microbalance (EQCM).16 Inthis study it was demonstrated that the existence of dissociativeadsorption of glycine and the dissolution of the metal are causedby the formation of oxidized species such as OCN�.
Experimental studies of glycine adsorption at the metal/vacuum interface have been carried out for the (111) and(100) orientations of copper.17 Upon adsorption, glycine under-goes deprotonation, the stable adsorbate species under ultrahighvacuum conditions being glycinate. Density functional theory(DFT) studies for these systems18�21 have concluded, in agree-ment with experimental results, that the adsorption geometry ofadsorbed glycinate on these surfaces is a bidentate, bridgeconfiguration, for low coverages, with bonding through the twooxygen atoms of the carboxylate. At high coverages, an additionalbond to the metal is formed involving the lone pair of thenitrogen atom which is placed in a “top” adsorption site. We arenot aware of similar studies for gold surfaces.
In this study we focus on the electrochemical behavior ofglycine, presenting its adsorption on Au(hkl) single crystal andquasi-Au(111) thin-film electrodes in acidic media. The results ofcyclic voltammetry as well as those obtained from in situspectroscopy experiments carried out with both external andinternal reflection (ATR-SEIRAS) configurations will be dis-cussed. In order to better support the assignment of experimentalvibrational frequencies, DFT will be used for calculating theore-tical vibrational frequencies of adsorbed glycine species.
2. MODEL AND COMPUTATIONAL DETAILS
A theoretical study of the adsorbed glycine species was carriedout on a cluster modeling the unreconstructed Au(111) surface.This choice is justified both by the preferential (111) orientationof the gold thin film electrodes used in this work and by theresults of previous studies with metal surfaces of low Millerindices that show that experimental and harmonic calculatedfrequencies of adsorbed carboxylate anions do not dependsignificantly on the crystallographic orientation of the metalsurface.22,23 This paper presents experimental evidence (seebelow) that this is also the case for glycine adsorption on goldsingle crystal electrodes with basal crystallographic orientations.
The model consists of a metal cluster of 31 gold atomsarranged in two layers of 19 and 12 atoms, plus a glycinezwitterion (NH3
+�CH2�COO�) and a water molecule, inthe presence of an external electric field of 0.01 atomic units(equivalent to 5.14 � 109 V m�1). The inclusion of a watermolecule and application of an external electric field were neededin order to reproduce the experimental frequencies. These twoingredients in the model account (at least partially) for theimportance of solvation (by screening the positive charge in theammonium group) and applied potential (by removing negative
charge density from the oxygen atoms of the carboxylate group).In the absence of the water and field, the geometry optimizationevolved toward the canonical, nonzwitterionic structure, which isnot the stable form in aqueous solution, and does not seem to beplausible under the electrochemical experimental conditions. Amore detailed report on the theoretical study of the effect ofelectric field and solvating water on the structure and vibrationalfrequencies of adsorbed glycine will be presented in a separatepaper.24 The cluster size is big enough to prevent bonding of theglycine species to the metal atoms in the cluster border, during afull optimization of the adsorbate geometry. The geometry of themetal cluster was kept fixed, with the gold nuclei located at theirpositions in the truncated crystal, and the same distances betweenneighboring gold atoms as that in the bulk metal (0.28837 nm).25
A full optimization of the geometry of the adsorbate systemwas carried out starting from different configurations, using theB3LYP functional as implemented in the Gaussian 03 code.26
The B3LYP functional combines the three-parameter hybridexchange functional of Becke27 with the Lee�Yang�Parr corre-lation functional.28 This functional, in combination with the 6-31+G(d)29�31 basis for the C, O, and H atoms and theLANL2DZ32 effective core potential and associated double-ζbasis set for describing the gold metal atoms, has been used toestimate theoretical values of harmonic frequencies that coincideremarkably well with the experimental values measured foradsorbed acetate on Cu,33,34 Ag,23 and Au22 surfaces. A goodconcordance between theoretical and experimental frequencyvalues was also found for some acetate derivatives, such asfluoroacetates,35 glyoxylate,36 and glycolate37 anions adsorbedon gold surfaces. All frequency values are given without applyingany scaling factor. Assignments of the calculated frequencies arebased on the visualization of the vibrational normal modes usingMolden.38
3. EXPERIMENTAL SECTION
Working electrodes used in the electrochemical and in situexternal reflection infrared spectroscopy experiments were goldsingle crystals with diameters around 2.0 and 4.5 mm, respec-tively. They were prepared from a high-purity gold wire(99,9998% Alfa-Aesar) following Clavilier’s method for platinumelectrodes.39 Prior to each experiment, the electrodes were heatedin a gas�oxygen flame, cooled down in air, and protected withultrapure water.
In the internal reflection infrared spectroscopy experiments a25 nm thick gold thin film thermally evaporated on a siliconprism was used as the working electrode. Deposition was carriedout in the vacuum chamber of a PVD75 coating system (Kurt J.Lesker Ltd.) equipped with a turbomolecular pump. Beforedeposition, pressure was lowered at ca. 10�6 Torr. The deposi-tion rate, which was fixed at 0.006 nm s�1, and the thickness ofthe thin film were monitored with a quartz crystal microbalance.
HClO4 working solutions (0.1 M) were prepared from theconcentrated acid (Merck Suprapur) and ultrapure water (18.2MΩ cm, Elga Vivendi). Either glycine (>99%, Sigma-Aldrich) orglycine-2,2-d2 (98 atom % D, Isotec) were added to theperchloric acid solution to obtain the desired concentrations.Solutions were deareated with Ar (N50, Air Liquide). Solutionsin deuterated water were prepared with deuterium oxide (99.9atom % D, Aldrich) as received.
All the experiments were performed in glass cells using a goldwire as the counter electrode and a reversible hydrogen electrode
16441 dx.doi.org/10.1021/jp203468n |J. Phys. Chem. C 2011, 115, 16439–16450
The Journal of Physical Chemistry C ARTICLE
(RHE) as the reference electrode. The cells used in spectro-electrochemical experiments36,40 are equipped with a prismaticwindow beveled at 60�. This prism was of either Si or CaF2, forthe internal and external reflection experiments, respectively. Allthe spectra are presented in absorbance units (a.u.). They wereobtained with a resolution of 8 cm�1 and are referred to thesingle beam spectrum collected at 0.10 V. In external reflectionexperiments, the spectra collected in the reversible glycineadsorption/desorption region were obtained from 10 sets of100 interferograms, which were accumulated alternately at thereference and sample potentials using the so-called SNIFTIRtechnique. A single set of 100 interferograms was collected in theATR-SEIRAS experiments. In the experiments exploring theirreversible glycine oxidation reaction, the spectra were collectedduring a slow potential scan from 0.1 to 1.70 V. One hundred
interferograms were collected for each spectrum, which corre-sponds to a potential window of 20 mV.
4. RESULTS AND DISCUSSION
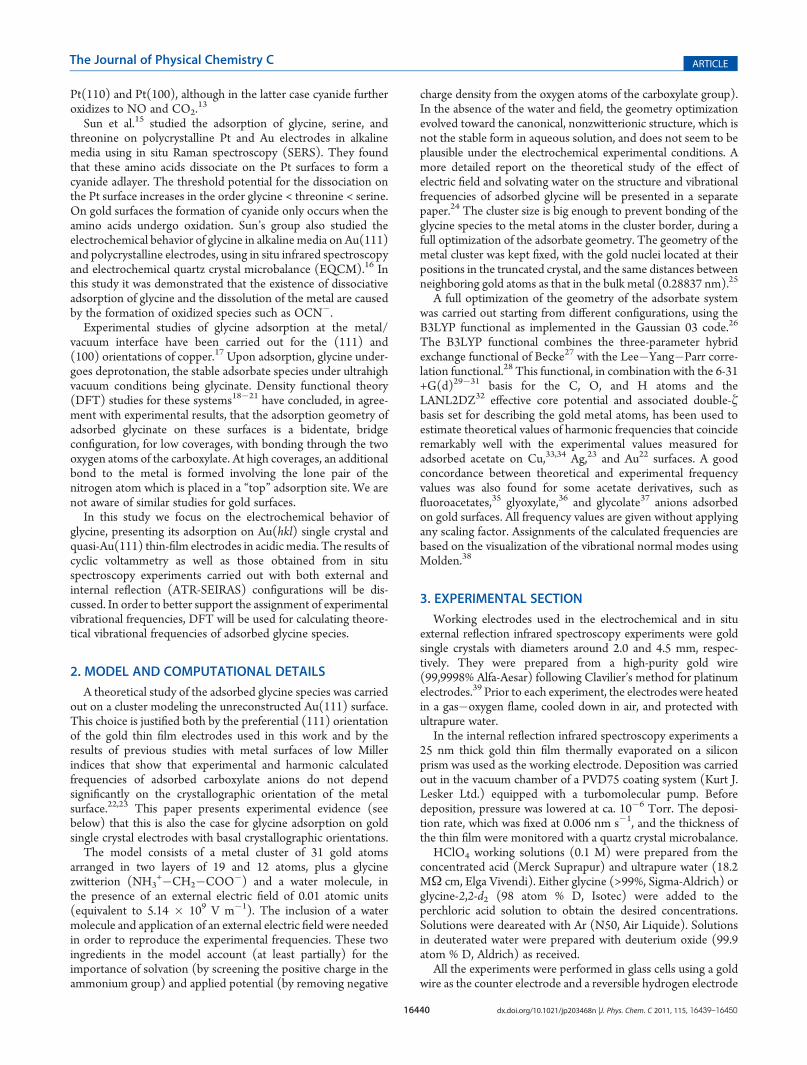
4.1. Optimized Geometry and Theoretical Frequencies ofAdsorbed Glycine on a Cluster Modeling an Unrecon-structed Au(111) Surface. The full optimization at theB3LYP/6-31+G(d),LANL2DZ level of the system composedof a zwitterionic glycine plus a water molecule adsorbed on aAu31(111) cluster, under the application of an external electricfield of 0.01 atomic units led to a geometry where glycine is bondedto the metal surface through both oxygen atoms of the carboxylategroup (Figure 1). The OCO plane is perpendicular to the clustersurface and aligned with one of the dense rows of the outermostmetal layer. As the interaction with the ammonium group is notthe same for the oxygen atoms, some asymmetry arises in theoxygen�gold bonding. One of the oxygen atoms is on top of oneAu atom (tilted by less than 0.5�), at a distance of 2.317 Å. Thedistance between the second oxygen atom and its nearest goldneighbor is 2.800 Å. This greater value is a consequence of beingsignificantly shifted from the corresponding “top” position. Fromthese considerations, it could be considered as an unidentatebonding. However, the tilt of the O�O line with respect to theparallel to the surface is relatively small, of only 9.7�. This meansthat the dynamic dipole corresponding to the asymmetric stretchof the carboxylate group remains essentially parallel to the metalsurface and, due to the surface selection rule, that holds ininfrared experiments with both external41 and internal42 reflec-tion configurations, would not be detectable in the in situ IRmeasurements. On this ground, it could be more appropriate todescribe the glycine adsorbate as bonded in a bidentate, asym-metrical bridge, configuration. As discussed elsewhere,24 theoptimized geometry in the absence of the water moleculesand/or the electric field corresponds clearly to a unidentate
Figure 1. Calculated optimized geometry (B3LYP/6-31+G(d),LANL2DZ) of glycinate adsorbed on a Au31(111) cluster, in the presenceof a water molecule and an external electric field (0.01 atomic units).
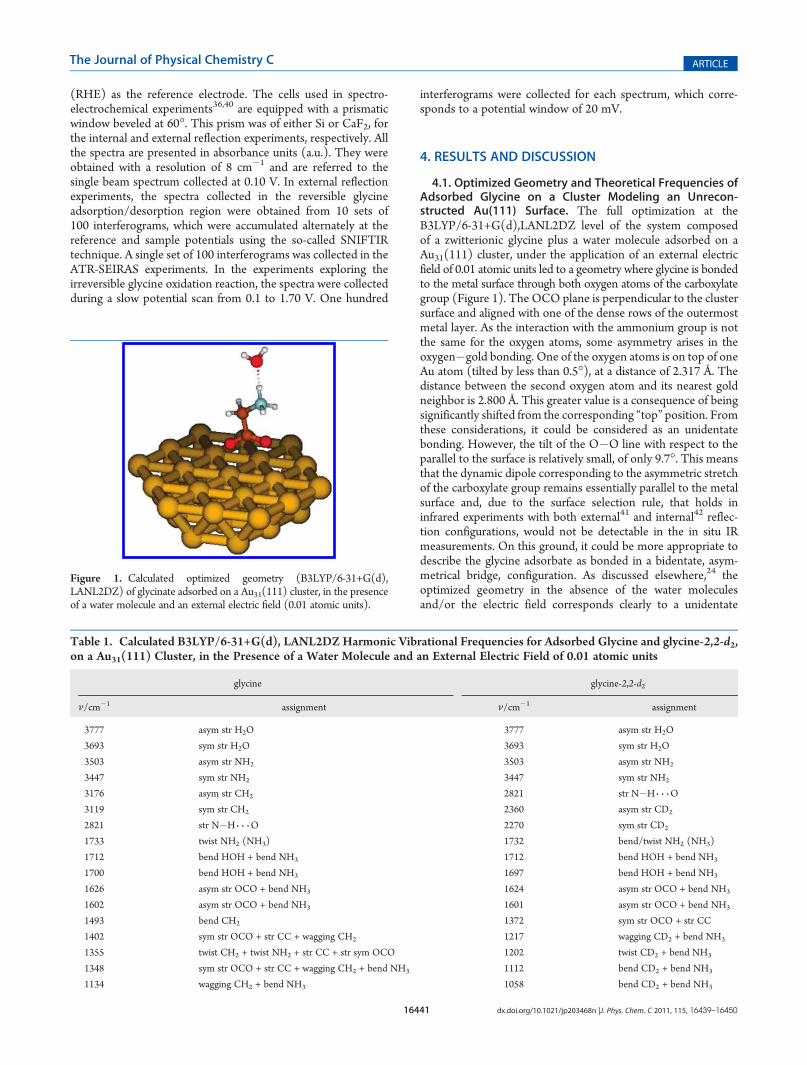
Table 1. Calculated B3LYP/6-31+G(d), LANL2DZ Harmonic Vibrational Frequencies for Adsorbed Glycine and glycine-2,2-d2,on a Au31(111) Cluster, in the Presence of a Water Molecule and an External Electric Field of 0.01 atomic units
glycine glycine-2,2-d2
ν/cm�1 assignment ν/cm�1 assignment
3777 asym str H2O 3777 asym str H2O
3693 sym str H2O 3693 sym str H2O
3503 asym str NH2 3503 asym str NH2
3447 sym str NH2 3447 sym str NH2
3176 asym str CH2 2821 str N�H 3 3 3O3119 sym str CH2 2360 asym str CD2
2821 str N�H 3 3 3O 2270 sym str CD2
1733 twist NH2 (NH3) 1732 bend/twist NH2 (NH3)
1712 bend HOH + bend NH3 1712 bend HOH + bend NH3
1700 bend HOH + bend NH3 1697 bend HOH + bend NH3
1626 asym str OCO + bend NH3 1624 asym str OCO + bend NH3
1602 asym str OCO + bend NH3 1601 asym str OCO + bend NH3
1493 bend CH2 1372 sym str OCO + str CC
1402 sym str OCO + str CC + wagging CH2 1217 wagging CD2 + bend NH3
1355 twist CH2 + twist NH2 + str CC + str sym OCO 1202 twist CD2 + bend NH3
1348 sym str OCO + str CC + wagging CH2 + bend NH3 1112 bend CD2 + bend NH3
1134 wagging CH2 + bend NH3 1058 bend CD2 + bend NH3
16442 dx.doi.org/10.1021/jp203468n |J. Phys. Chem. C 2011, 115, 16439–16450
The Journal of Physical Chemistry C ARTICLE
configuration with a clear tilt of the O�O line with respect to thegold surface.The calculated B3LYP/6-31+G(d),LANL2DZ harmonic vi-
brational frequencies corresponding to the equilibrium geometryfor adsorbed glycine described above are summarized in Table 1,for the range above 1000 cm�1. Calculated values for glycine andglycine with its methylene group fully deuterated are alsoreported. The OH stretchings of water and the NH stretchingsof the ammonium group (involving only those two H atoms thatare not hydrogen bonded to the oxygen of the water) appear inthe range between 3400 and 3800 cm�1, while their correspond-ing bendings absorb around 1700�1730 cm�1. Because of theinteraction through hydrogen bond with the water oxygen, thecorresponding N�H stretching appears at 2821 cm�1, signifi-cantly red-shifted with respect to the NH stretching of the nothydrogen-bonded atoms at 3503 and 3447 cm�1. All thesefrequencies remain unchanged upon deuteration of the methy-lene group. In the deuterated glycine, the stretchings correspond-ing to the methylene group have calculated frequencies of 2360and 2270 cm�1, significantly red shifted with respect to the valuesfor glycine (3176 and 3119 cm�1), as expected.Regarding the carboxylate group, the frequencies of the two
modes involving contributions of the asymmetric OCO stretchare obtained between 1600 and 1625 cm�1 for both the hydro-gen and deuterium cases. The situation is more complex in the
range between 1100 and 1500 cm�1, where the CH2 bending andtwist, the symmetric OCO stretch, and the bending and twist oftheNH3 group are all active, giving rise to combinationmodes. Innon-deuterated glycine, the mode at 1493 cm�1 is due to pureCH2 bending. The frequencies at 1402, 1355, and 1348 cm�1
correspond to normal modes containing significant contributionof the symmetric OCO stretch, but also of bending and twist ofCH2 and NH3, or of CC stretch. Upon deuteration, the down-shift of the methylene contributions causes a simpler situation,where the symmetric OCO stretch only contributes to the modeat 1372 cm�1, while the frequencies between 1100 and1300 cm�1 are due to combination modes involving the bendingand twist of NH3 and CD2 groups.4.2. Glycine Adsorption at Gold Single Crystal Electrodes.
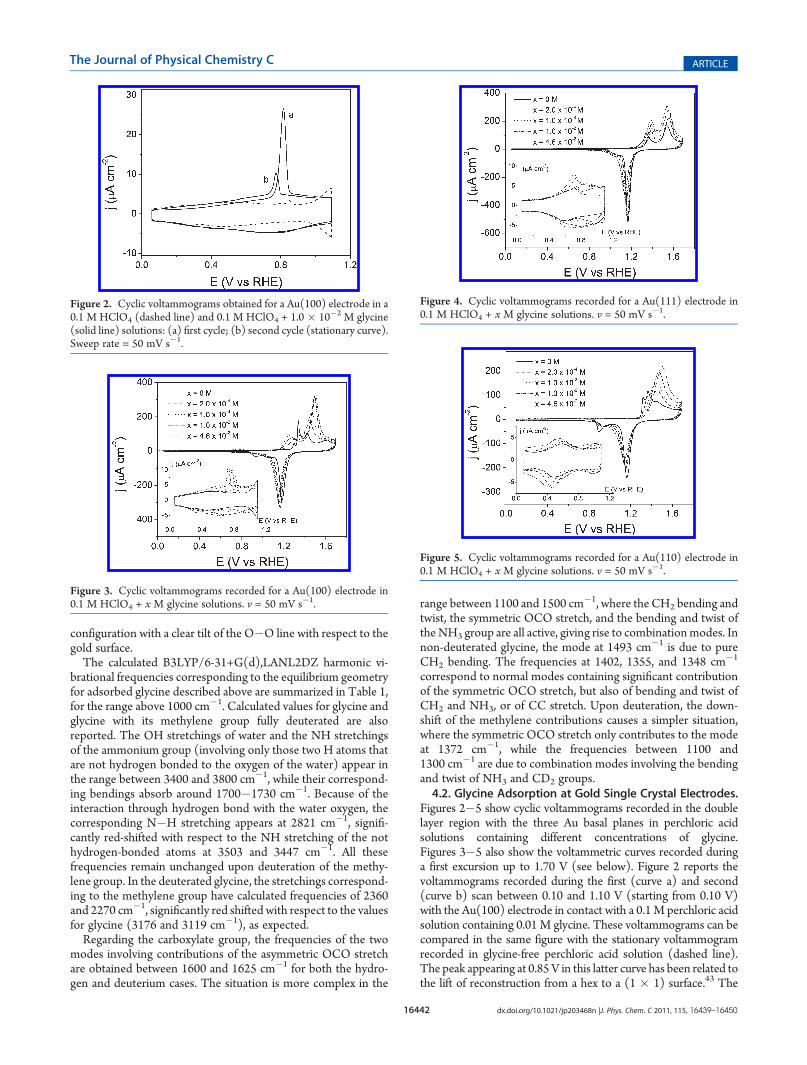
Figures 2�5 show cyclic voltammograms recorded in the doublelayer region with the three Au basal planes in perchloric acidsolutions containing different concentrations of glycine.Figures 3�5 also show the voltammetric curves recorded duringa first excursion up to 1.70 V (see below). Figure 2 reports thevoltammograms recorded during the first (curve a) and second(curve b) scan between 0.10 and 1.10 V (starting from 0.10 V)with the Au(100) electrode in contact with a 0.1M perchloric acidsolution containing 0.01 M glycine. These voltammograms can becompared in the same figure with the stationary voltammogramrecorded in glycine-free perchloric acid solution (dashed line).The peak appearing at 0.85V in this latter curve has been related tothe lift of reconstruction from a hex to a (1 � 1) surface.43 The
Figure 2. Cyclic voltammograms obtained for a Au(100) electrode in a0.1 M HClO4 (dashed line) and 0.1 M HClO4 + 1.0 � 10�2 M glycine(solid line) solutions: (a) first cycle; (b) second cycle (stationary curve).Sweep rate = 50 mV s�1.
Figure 3. Cyclic voltammograms recorded for a Au(100) electrode in0.1 M HClO4 + x M glycine solutions. v = 50 mV s�1.
Figure 4. Cyclic voltammograms recorded for a Au(111) electrode in0.1 M HClO4 + x M glycine solutions. v = 50 mV s�1.
Figure 5. Cyclic voltammograms recorded for a Au(110) electrode in0.1 M HClO4 + x M glycine solutions. v = 50 mV s�1.
16443 dx.doi.org/10.1021/jp203468n |J. Phys. Chem. C 2011, 115, 16439–16450
The Journal of Physical Chemistry C ARTICLE
observation of this peak is related to the ability of the surface toreconstruct at low potentials but in a lesser extent than after theflame annealing process. In the presence of glycine the overallvoltammetric charge within the double layer region increases andthe peak related to the lift of the surface reconstruction appearsshifted to less positive potential compared with the case ofperchloric acid. This shift indicates that the adsorption of glycinefavors the lift of the reconstruction. This behavior has beenreported for other anions and small organic molecules.43 Sincethe voltammogram recorded in the glycine-containing solution isstable during continuous cycles, it can be stated that there are noirreversible adsorption processes such as those observed in the caseof platinum.11 The voltammetric curves obtained with the Au-(100) electrode (Figure 3) clearly show that the voltammetriccharge between 0.10 and 1.10 V steadily increases when increasingthe glycine concentration. At the same time, it can be observed thatthe charge under the dereconstruction peak increases with glycineconcentration while shifting toward less positive potentials.For the Au(111) electrode, Figure 4, a voltammetric peak
appearing at ca. 0.68 V during the positive potential scan in theglycine-free perchloric acid has also been associated to the liftingof a reconstructed (
√3 � 22) structure yielding a (1 � 1)
surface.43 Although less evident than in the case of the Au(100)electrode, the peak for the removal of the surface reconstructionalso shifts to lower potentials with the increase of the glycineconcentration up to 4.6 � 10�2 M, and its charge density alsoincreases. Regarding the Au(110) electrode, Figure 5, a quasi-reversible peak can be seen near 0.5 V, which is shifted to lesspositive potentials with the increase of glycine concentration.The peak shape is typical of an adsorption/desorption processand can be related to the presence of glycine.Potential step experiments with glycine solutions at different
concentrations were carried out in order to determine the chargedensity at the Au(111) electrode surface at different electrode
potentials for further thermodynamic analysis. From the voltam-metric curves reported in Figure 4 it can be seen that at potentialsbelow 0.40 V the voltammograms do not vary due to the presenceof glycine. Hence a potential of 0.1 V was chosen as the potential ofdesorption, E*. From E* the potential was held at a desiredadsorption potential,Eθ, for 30 s, in order to allow glycine adsorptionand surface structure stabilization, and then steppedback to the initialpotential, E*. A detailed description of the thermodynamic analysismethodology is provided in earlier contributions.44�46
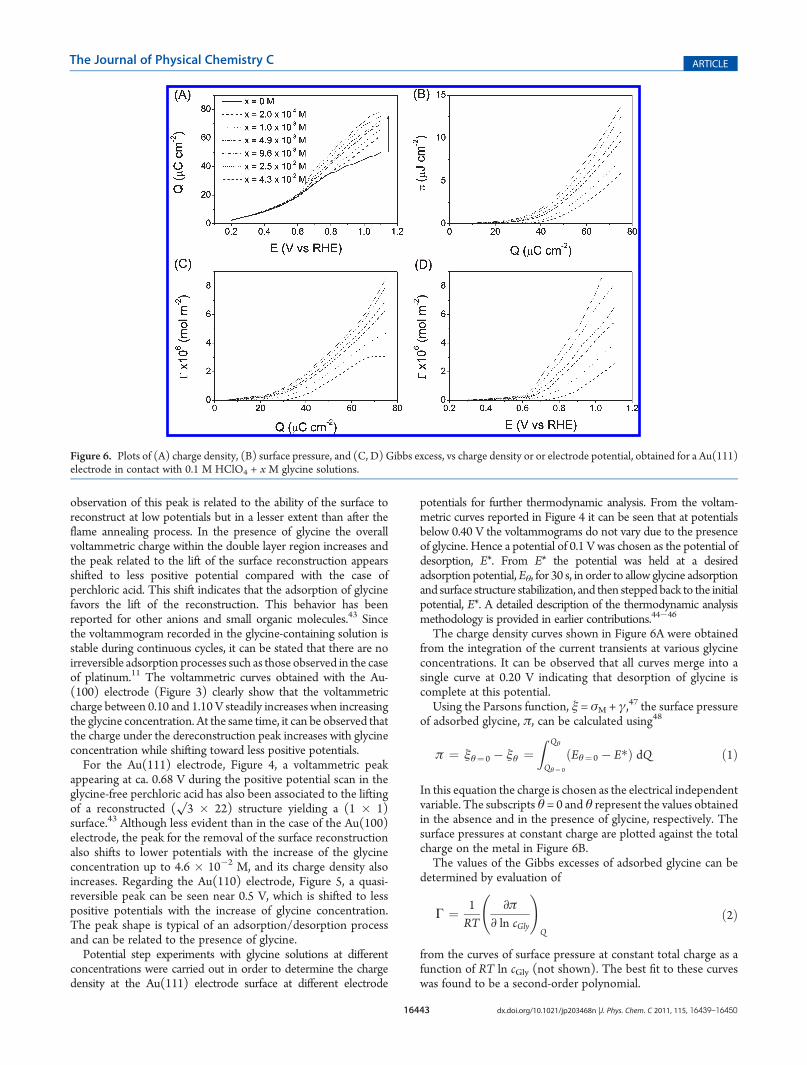
The charge density curves shown in Figure 6A were obtainedfrom the integration of the current transients at various glycineconcentrations. It can be observed that all curves merge into asingle curve at 0.20 V indicating that desorption of glycine iscomplete at this potential.Using the Parsons function, ξ = σM + γ,47 the surface pressure
of adsorbed glycine, π, can be calculated using48
π ¼ ξθ¼ 0 � ξθ ¼Z Qθ
Qθ¼ 0
ðEθ¼ 0 � E�Þ dQ ð1Þ
In this equation the charge is chosen as the electrical independentvariable. The subscripts θ = 0 and θ represent the values obtainedin the absence and in the presence of glycine, respectively. Thesurface pressures at constant charge are plotted against the totalcharge on the metal in Figure 6B.The values of the Gibbs excesses of adsorbed glycine can be
determined by evaluation of
Γ ¼ 1RT
∂π
∂ ln cGly
!Q
ð2Þ
from the curves of surface pressure at constant total charge as afunction of RT ln cGly (not shown). The best fit to these curveswas found to be a second-order polynomial.
Figure 6. Plots of (A) charge density, (B) surface pressure, and (C, D) Gibbs excess, vs charge density or or electrode potential, obtained for a Au(111)electrode in contact with 0.1 M HClO4 + x M glycine solutions.
16444 dx.doi.org/10.1021/jp203468n |J. Phys. Chem. C 2011, 115, 16439–16450
The Journal of Physical Chemistry C ARTICLE
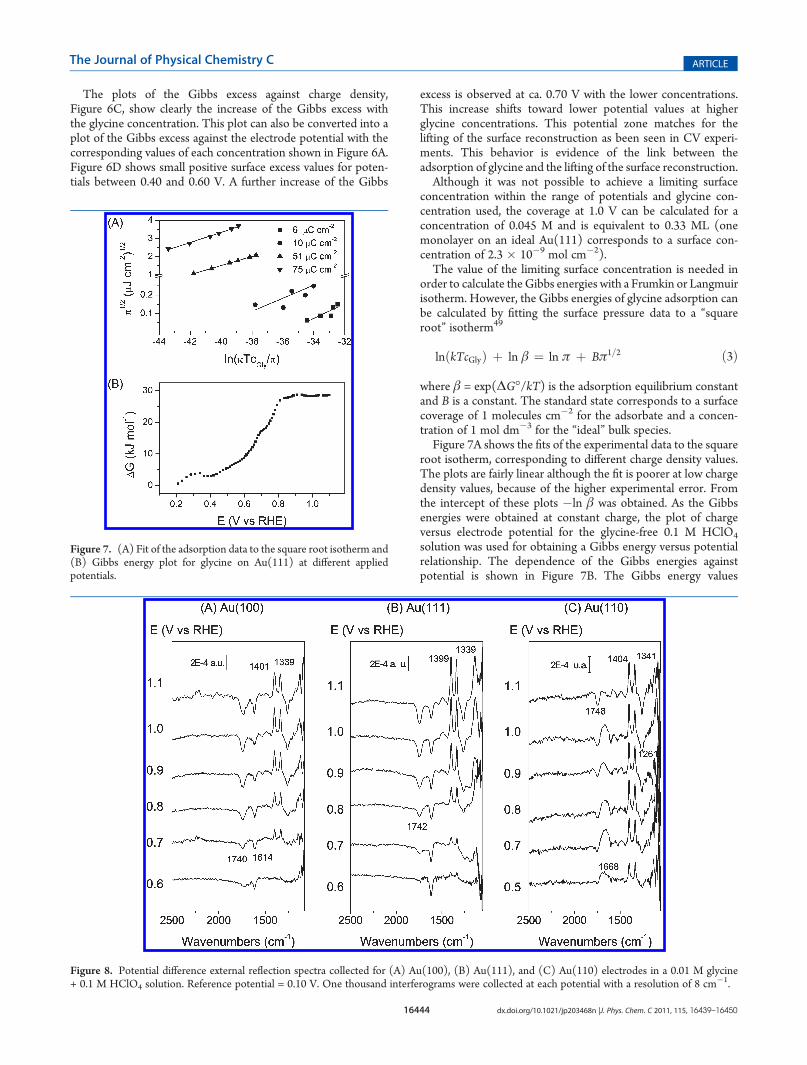
The plots of the Gibbs excess against charge density,Figure 6C, show clearly the increase of the Gibbs excess withthe glycine concentration. This plot can also be converted into aplot of the Gibbs excess against the electrode potential with thecorresponding values of each concentration shown in Figure 6A.Figure 6D shows small positive surface excess values for poten-tials between 0.40 and 0.60 V. A further increase of the Gibbs
excess is observed at ca. 0.70 V with the lower concentrations.This increase shifts toward lower potential values at higherglycine concentrations. This potential zone matches for thelifting of the surface reconstruction as been seen in CV experi-ments. This behavior is evidence of the link between theadsorption of glycine and the lifting of the surface reconstruction.Although it was not possible to achieve a limiting surface
concentration within the range of potentials and glycine con-centration used, the coverage at 1.0 V can be calculated for aconcentration of 0.045 M and is equivalent to 0.33 ML (onemonolayer on an ideal Au(111) corresponds to a surface con-centration of 2.3 � 10�9 mol cm�2).The value of the limiting surface concentration is needed in
order to calculate theGibbs energies with a Frumkin or Langmuirisotherm. However, the Gibbs energies of glycine adsorption canbe calculated by fitting the surface pressure data to a “squareroot” isotherm49
lnðkTcGlyÞ þ ln β ¼ ln π þ Bπ1=2 ð3Þ
where β = exp(ΔG�/kT) is the adsorption equilibrium constantand B is a constant. The standard state corresponds to a surfacecoverage of 1 molecules cm�2 for the adsorbate and a concen-tration of 1 mol dm�3 for the “ideal” bulk species.Figure 7A shows the fits of the experimental data to the square
root isotherm, corresponding to different charge density values.The plots are fairly linear although the fit is poorer at low chargedensity values, because of the higher experimental error. Fromthe intercept of these plots �ln β was obtained. As the Gibbsenergies were obtained at constant charge, the plot of chargeversus electrode potential for the glycine-free 0.1 M HClO4
solution was used for obtaining a Gibbs energy versus potentialrelationship. The dependence of the Gibbs energies againstpotential is shown in Figure 7B. The Gibbs energy values
Figure 7. (A) Fit of the adsorption data to the square root isotherm and(B) Gibbs energy plot for glycine on Au(111) at different appliedpotentials.
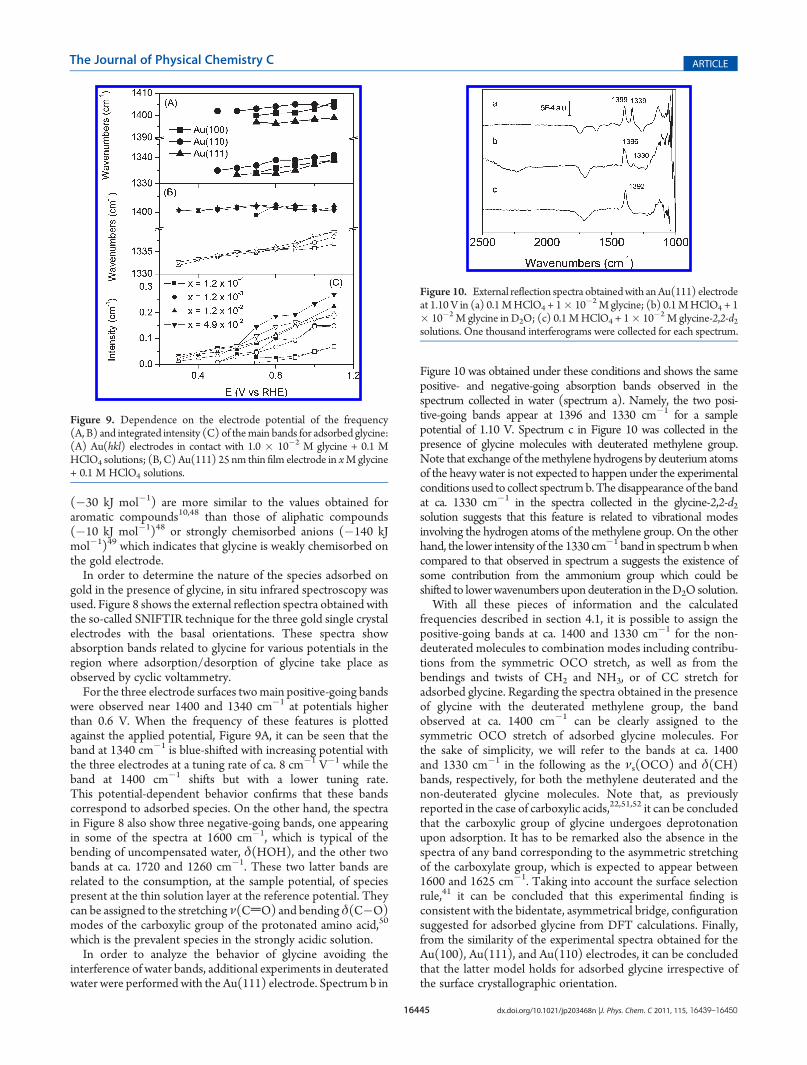
Figure 8. Potential difference external reflection spectra collected for (A) Au(100), (B) Au(111), and (C) Au(110) electrodes in a 0.01 M glycine+ 0.1 M HClO4 solution. Reference potential = 0.10 V. One thousand interferograms were collected at each potential with a resolution of 8 cm�1.
16445 dx.doi.org/10.1021/jp203468n |J. Phys. Chem. C 2011, 115, 16439–16450
The Journal of Physical Chemistry C ARTICLE
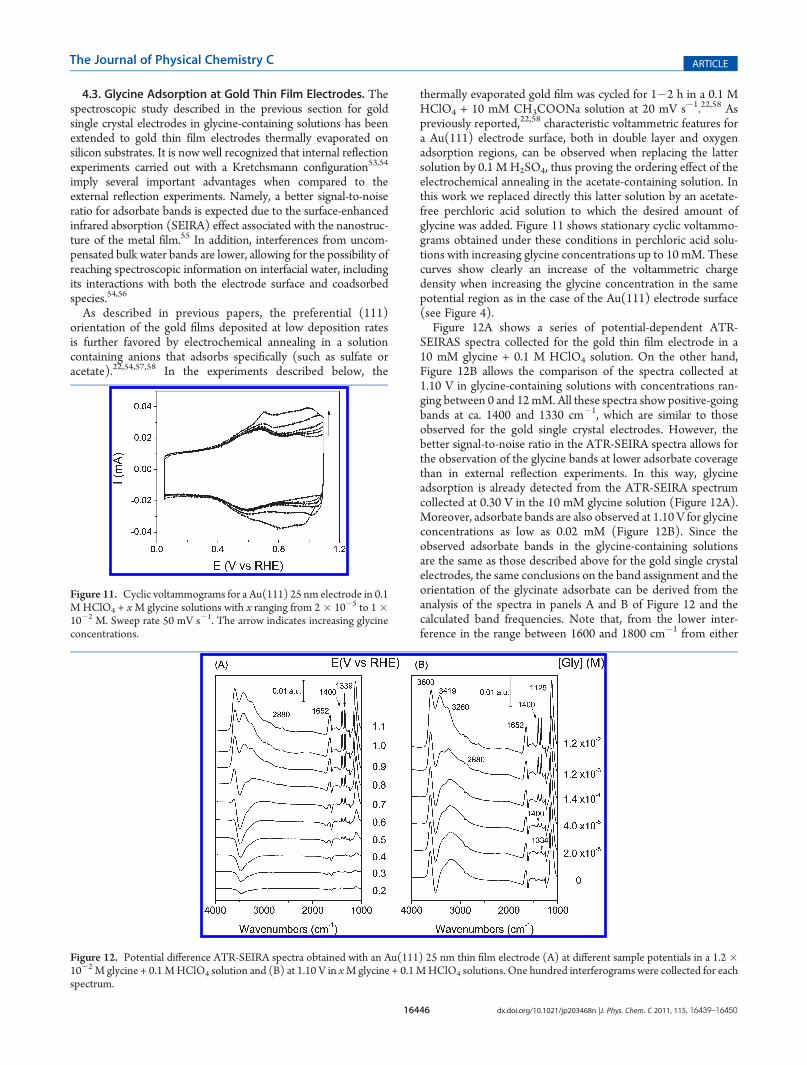
(�30 kJ mol�1) are more similar to the values obtained foraromatic compounds10,48 than those of aliphatic compounds(�10 kJ mol�1)48 or strongly chemisorbed anions (�140 kJmol�1)49 which indicates that glycine is weakly chemisorbed onthe gold electrode.In order to determine the nature of the species adsorbed on
gold in the presence of glycine, in situ infrared spectroscopy wasused. Figure 8 shows the external reflection spectra obtained withthe so-called SNIFTIR technique for the three gold single crystalelectrodes with the basal orientations. These spectra showabsorption bands related to glycine for various potentials in theregion where adsorption/desorption of glycine take place asobserved by cyclic voltammetry.For the three electrode surfaces twomain positive-going bands
were observed near 1400 and 1340 cm�1 at potentials higherthan 0.6 V. When the frequency of these features is plottedagainst the applied potential, Figure 9A, it can be seen that theband at 1340 cm�1 is blue-shifted with increasing potential withthe three electrodes at a tuning rate of ca. 8 cm�1 V�1 while theband at 1400 cm�1 shifts but with a lower tuning rate.This potential-dependent behavior confirms that these bandscorrespond to adsorbed species. On the other hand, the spectrain Figure 8 also show three negative-going bands, one appearingin some of the spectra at 1600 cm�1, which is typical of thebending of uncompensated water, δ(HOH), and the other twobands at ca. 1720 and 1260 cm�1. These two latter bands arerelated to the consumption, at the sample potential, of speciespresent at the thin solution layer at the reference potential. Theycan be assigned to the stretching ν(CdO) and bendingδ(C�O)modes of the carboxylic group of the protonated amino acid,50
which is the prevalent species in the strongly acidic solution.In order to analyze the behavior of glycine avoiding the
interference of water bands, additional experiments in deuteratedwater were performed with the Au(111) electrode. Spectrum b in
Figure 10 was obtained under these conditions and shows the samepositive- and negative-going absorption bands observed in thespectrum collected in water (spectrum a). Namely, the two posi-tive-going bands appear at 1396 and 1330 cm�1 for a samplepotential of 1.10 V. Spectrum c in Figure 10 was collected in thepresence of glycine molecules with deuterated methylene group.Note that exchange of themethylene hydrogens by deuterium atomsof the heavy water is not expected to happen under the experimentalconditions used to collect spectrumb.The disappearance of the bandat ca. 1330 cm�1 in the spectra collected in the glycine-2,2-d2solution suggests that this feature is related to vibrational modesinvolving the hydrogen atoms of the methylene group. On the otherhand, the lower intensity of the 1330 cm�1 band in spectrumbwhencompared to that observed in spectrum a suggests the existence ofsome contribution from the ammonium group which could beshifted to lowerwavenumbers upon deuteration in theD2O solution.With all these pieces of information and the calculated
frequencies described in section 4.1, it is possible to assign thepositive-going bands at ca. 1400 and 1330 cm�1 for the non-deuterated molecules to combination modes including contribu-tions from the symmetric OCO stretch, as well as from thebendings and twists of CH2 and NH3, or of CC stretch foradsorbed glycine. Regarding the spectra obtained in the presenceof glycine with the deuterated methylene group, the bandobserved at ca. 1400 cm�1 can be clearly assigned to thesymmetric OCO stretch of adsorbed glycine molecules. Forthe sake of simplicity, we will refer to the bands at ca. 1400and 1330 cm�1 in the following as the νs(OCO) and δ(CH)bands, respectively, for both the methylene deuterated and thenon-deuterated glycine molecules. Note that, as previouslyreported in the case of carboxylic acids,22,51,52 it can be concludedthat the carboxylic group of glycine undergoes deprotonationupon adsorption. It has to be remarked also the absence in thespectra of any band corresponding to the asymmetric stretchingof the carboxylate group, which is expected to appear between1600 and 1625 cm�1. Taking into account the surface selectionrule,41 it can be concluded that this experimental finding isconsistent with the bidentate, asymmetrical bridge, configurationsuggested for adsorbed glycine from DFT calculations. Finally,from the similarity of the experimental spectra obtained for theAu(100), Au(111), and Au(110) electrodes, it can be concludedthat the latter model holds for adsorbed glycine irrespective ofthe surface crystallographic orientation.
Figure 9. Dependence on the electrode potential of the frequency(A, B) and integrated intensity (C) of themain bands for adsorbed glycine:(A) Au(hkl) electrodes in contact with 1.0 � 10�2 M glycine + 0.1 MHClO4 solutions; (B, C) Au(111) 25 nm thin film electrode in xMglycine+ 0.1 M HClO4 solutions.
Figure 10. External reflection spectra obtainedwith anAu(111) electrodeat 1.10 V in (a) 0.1MHClO4 + 1� 10�2M glycine; (b) 0.1MHClO4 + 1� 10�2 M glycine in D2O; (c) 0.1MHClO4 + 1� 10�2 M glycine-2,2-d2solutions. One thousand interferograms were collected for each spectrum.
16446 dx.doi.org/10.1021/jp203468n |J. Phys. Chem. C 2011, 115, 16439–16450
The Journal of Physical Chemistry C ARTICLE
4.3. Glycine Adsorption at Gold Thin Film Electrodes. Thespectroscopic study described in the previous section for goldsingle crystal electrodes in glycine-containing solutions has beenextended to gold thin film electrodes thermally evaporated onsilicon substrates. It is now well recognized that internal reflectionexperiments carried out with a Kretchsmann configuration53,54
imply several important advantages when compared to theexternal reflection experiments. Namely, a better signal-to-noiseratio for adsorbate bands is expected due to the surface-enhancedinfrared absorption (SEIRA) effect associated with the nanostruc-ture of the metal film.55 In addition, interferences from uncom-pensated bulk water bands are lower, allowing for the possibility ofreaching spectroscopic information on interfacial water, includingits interactions with both the electrode surface and coadsorbedspecies.54,56
As described in previous papers, the preferential (111)orientation of the gold films deposited at low deposition ratesis further favored by electrochemical annealing in a solutioncontaining anions that adsorbs specifically (such as sulfate oracetate).22,54,57,58 In the experiments described below, the
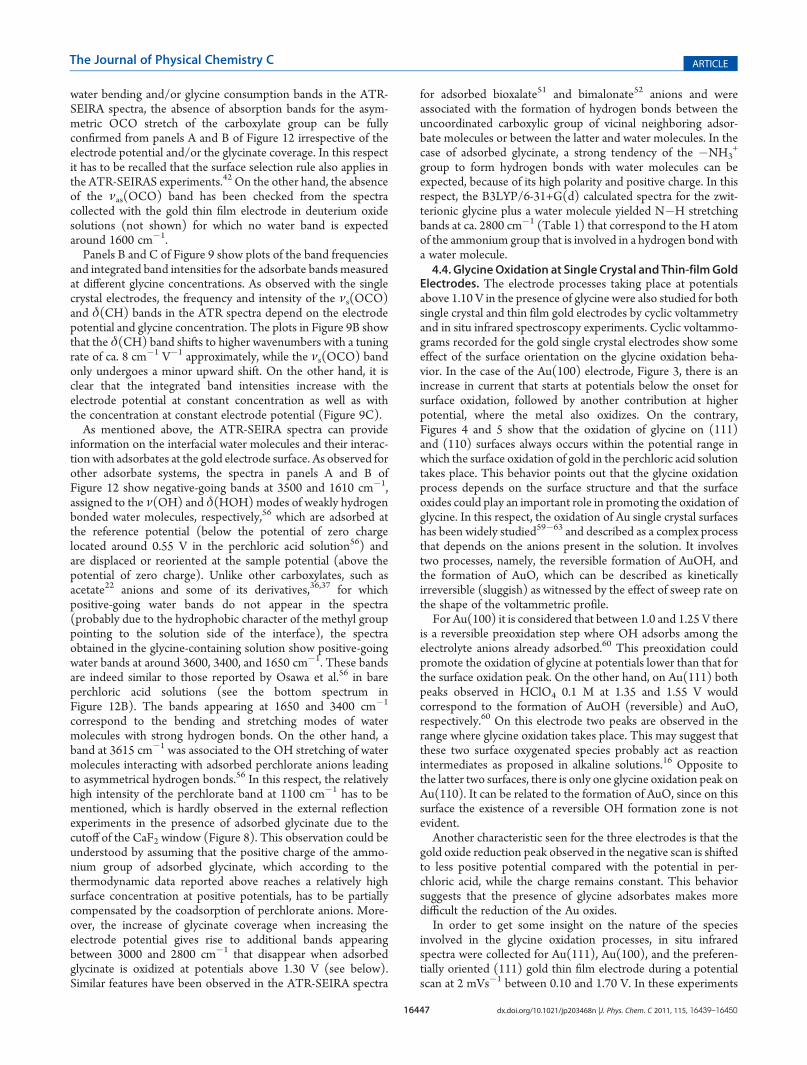
thermally evaporated gold film was cycled for 1�2 h in a 0.1 MHClO4 + 10 mM CH3COONa solution at 20 mV s�1.22,58 Aspreviously reported,22,58 characteristic voltammetric features fora Au(111) electrode surface, both in double layer and oxygenadsorption regions, can be observed when replacing the lattersolution by 0.1 M H2SO4, thus proving the ordering effect of theelectrochemical annealing in the acetate-containing solution. Inthis work we replaced directly this latter solution by an acetate-free perchloric acid solution to which the desired amount ofglycine was added. Figure 11 shows stationary cyclic voltammo-grams obtained under these conditions in perchloric acid solu-tions with increasing glycine concentrations up to 10 mM. Thesecurves show clearly an increase of the voltammetric chargedensity when increasing the glycine concentration in the samepotential region as in the case of the Au(111) electrode surface(see Figure 4).Figure 12A shows a series of potential-dependent ATR-
SEIRAS spectra collected for the gold thin film electrode in a10 mM glycine + 0.1 M HClO4 solution. On the other hand,Figure 12B allows the comparison of the spectra collected at1.10 V in glycine-containing solutions with concentrations ran-ging between 0 and 12mM. All these spectra show positive-goingbands at ca. 1400 and 1330 cm�1, which are similar to thoseobserved for the gold single crystal electrodes. However, thebetter signal-to-noise ratio in the ATR-SEIRA spectra allows forthe observation of the glycine bands at lower adsorbate coveragethan in external reflection experiments. In this way, glycineadsorption is already detected from the ATR-SEIRA spectrumcollected at 0.30 V in the 10 mM glycine solution (Figure 12A).Moreover, adsorbate bands are also observed at 1.10 V for glycineconcentrations as low as 0.02 mM (Figure 12B). Since theobserved adsorbate bands in the glycine-containing solutionsare the same as those described above for the gold single crystalelectrodes, the same conclusions on the band assignment and theorientation of the glycinate adsorbate can be derived from theanalysis of the spectra in panels A and B of Figure 12 and thecalculated band frequencies. Note that, from the lower inter-ference in the range between 1600 and 1800 cm�1 from either
Figure 11. Cyclic voltammograms for a Au(111) 25 nm electrode in 0.1M HClO4 + xM glycine solutions with x ranging from 2� 10�5 to 1�10�2 M. Sweep rate 50 mV s�1. The arrow indicates increasing glycineconcentrations.
Figure 12. Potential difference ATR-SEIRA spectra obtained with an Au(111) 25 nm thin film electrode (A) at different sample potentials in a 1.2�10�2 M glycine + 0.1MHClO4 solution and (B) at 1.10 V in xMglycine + 0.1MHClO4 solutions. One hundred interferograms were collected for eachspectrum.
16447 dx.doi.org/10.1021/jp203468n |J. Phys. Chem. C 2011, 115, 16439–16450
The Journal of Physical Chemistry C ARTICLE
water bending and/or glycine consumption bands in the ATR-SEIRA spectra, the absence of absorption bands for the asym-metric OCO stretch of the carboxylate group can be fullyconfirmed from panels A and B of Figure 12 irrespective of theelectrode potential and/or the glycinate coverage. In this respectit has to be recalled that the surface selection rule also applies inthe ATR-SEIRAS experiments.42 On the other hand, the absenceof the νas(OCO) band has been checked from the spectracollected with the gold thin film electrode in deuterium oxidesolutions (not shown) for which no water band is expectedaround 1600 cm�1.Panels B and C of Figure 9 show plots of the band frequencies
and integrated band intensities for the adsorbate bands measuredat different glycine concentrations. As observed with the singlecrystal electrodes, the frequency and intensity of the νs(OCO)and δ(CH) bands in the ATR spectra depend on the electrodepotential and glycine concentration. The plots in Figure 9B showthat the δ(CH) band shifts to higher wavenumbers with a tuningrate of ca. 8 cm�1 V�1 approximately, while the νs(OCO) bandonly undergoes a minor upward shift. On the other hand, it isclear that the integrated band intensities increase with theelectrode potential at constant concentration as well as withthe concentration at constant electrode potential (Figure 9C).As mentioned above, the ATR-SEIRA spectra can provide
information on the interfacial water molecules and their interac-tion with adsorbates at the gold electrode surface. As observed forother adsorbate systems, the spectra in panels A and B ofFigure 12 show negative-going bands at 3500 and 1610 cm�1,assigned to the ν(OH) and δ(HOH) modes of weakly hydrogenbonded water molecules, respectively,56 which are adsorbed atthe reference potential (below the potential of zero chargelocated around 0.55 V in the perchloric acid solution56) andare displaced or reoriented at the sample potential (above thepotential of zero charge). Unlike other carboxylates, such asacetate22 anions and some of its derivatives,36,37 for whichpositive-going water bands do not appear in the spectra(probably due to the hydrophobic character of the methyl grouppointing to the solution side of the interface), the spectraobtained in the glycine-containing solution show positive-goingwater bands at around 3600, 3400, and 1650 cm�1. These bandsare indeed similar to those reported by Osawa et al.56 in bareperchloric acid solutions (see the bottom spectrum inFigure 12B). The bands appearing at 1650 and 3400 cm�1
correspond to the bending and stretching modes of watermolecules with strong hydrogen bonds. On the other hand, aband at 3615 cm�1 was associated to the OH stretching of watermolecules interacting with adsorbed perchlorate anions leadingto asymmetrical hydrogen bonds.56 In this respect, the relativelyhigh intensity of the perchlorate band at 1100 cm�1 has to bementioned, which is hardly observed in the external reflectionexperiments in the presence of adsorbed glycinate due to thecutoff of the CaF2 window (Figure 8). This observation could beunderstood by assuming that the positive charge of the ammo-nium group of adsorbed glycinate, which according to thethermodynamic data reported above reaches a relatively highsurface concentration at positive potentials, has to be partiallycompensated by the coadsorption of perchlorate anions. More-over, the increase of glycinate coverage when increasing theelectrode potential gives rise to additional bands appearingbetween 3000 and 2800 cm�1 that disappear when adsorbedglycinate is oxidized at potentials above 1.30 V (see below).Similar features have been observed in the ATR-SEIRA spectra
for adsorbed bioxalate51 and bimalonate52 anions and wereassociated with the formation of hydrogen bonds between theuncoordinated carboxylic group of vicinal neighboring adsor-bate molecules or between the latter and water molecules. In thecase of adsorbed glycinate, a strong tendency of the �NH3
+
group to form hydrogen bonds with water molecules can beexpected, because of its high polarity and positive charge. In thisrespect, the B3LYP/6-31+G(d) calculated spectra for the zwit-terionic glycine plus a water molecule yielded N�H stretchingbands at ca. 2800 cm�1 (Table 1) that correspond to the H atomof the ammonium group that is involved in a hydrogen bond witha water molecule.4.4. GlycineOxidation at Single Crystal and Thin-filmGold
Electrodes. The electrode processes taking place at potentialsabove 1.10 V in the presence of glycine were also studied for bothsingle crystal and thin film gold electrodes by cyclic voltammetryand in situ infrared spectroscopy experiments. Cyclic voltammo-grams recorded for the gold single crystal electrodes show someeffect of the surface orientation on the glycine oxidation beha-vior. In the case of the Au(100) electrode, Figure 3, there is anincrease in current that starts at potentials below the onset forsurface oxidation, followed by another contribution at higherpotential, where the metal also oxidizes. On the contrary,Figures 4 and 5 show that the oxidation of glycine on (111)and (110) surfaces always occurs within the potential range inwhich the surface oxidation of gold in the perchloric acid solutiontakes place. This behavior points out that the glycine oxidationprocess depends on the surface structure and that the surfaceoxides could play an important role in promoting the oxidation ofglycine. In this respect, the oxidation of Au single crystal surfaceshas been widely studied59�63 and described as a complex processthat depends on the anions present in the solution. It involvestwo processes, namely, the reversible formation of AuOH, andthe formation of AuO, which can be described as kineticallyirreversible (sluggish) as witnessed by the effect of sweep rate onthe shape of the voltammetric profile.For Au(100) it is considered that between 1.0 and 1.25 V there
is a reversible preoxidation step where OH adsorbs among theelectrolyte anions already adsorbed.60 This preoxidation couldpromote the oxidation of glycine at potentials lower than that forthe surface oxidation peak. On the other hand, on Au(111) bothpeaks observed in HClO4 0.1 M at 1.35 and 1.55 V wouldcorrespond to the formation of AuOH (reversible) and AuO,respectively.60 On this electrode two peaks are observed in therange where glycine oxidation takes place. This may suggest thatthese two surface oxygenated species probably act as reactionintermediates as proposed in alkaline solutions.16 Opposite tothe latter two surfaces, there is only one glycine oxidation peak onAu(110). It can be related to the formation of AuO, since on thissurface the existence of a reversible OH formation zone is notevident.Another characteristic seen for the three electrodes is that the
gold oxide reduction peak observed in the negative scan is shiftedto less positive potential compared with the potential in per-chloric acid, while the charge remains constant. This behaviorsuggests that the presence of glycine adsorbates makes moredifficult the reduction of the Au oxides.In order to get some insight on the nature of the species
involved in the glycine oxidation processes, in situ infraredspectra were collected for Au(111), Au(100), and the preferen-tially oriented (111) gold thin film electrode during a potentialscan at 2 mVs�1 between 0.10 and 1.70 V. In these experiments
16448 dx.doi.org/10.1021/jp203468n |J. Phys. Chem. C 2011, 115, 16439–16450
The Journal of Physical Chemistry C ARTICLE
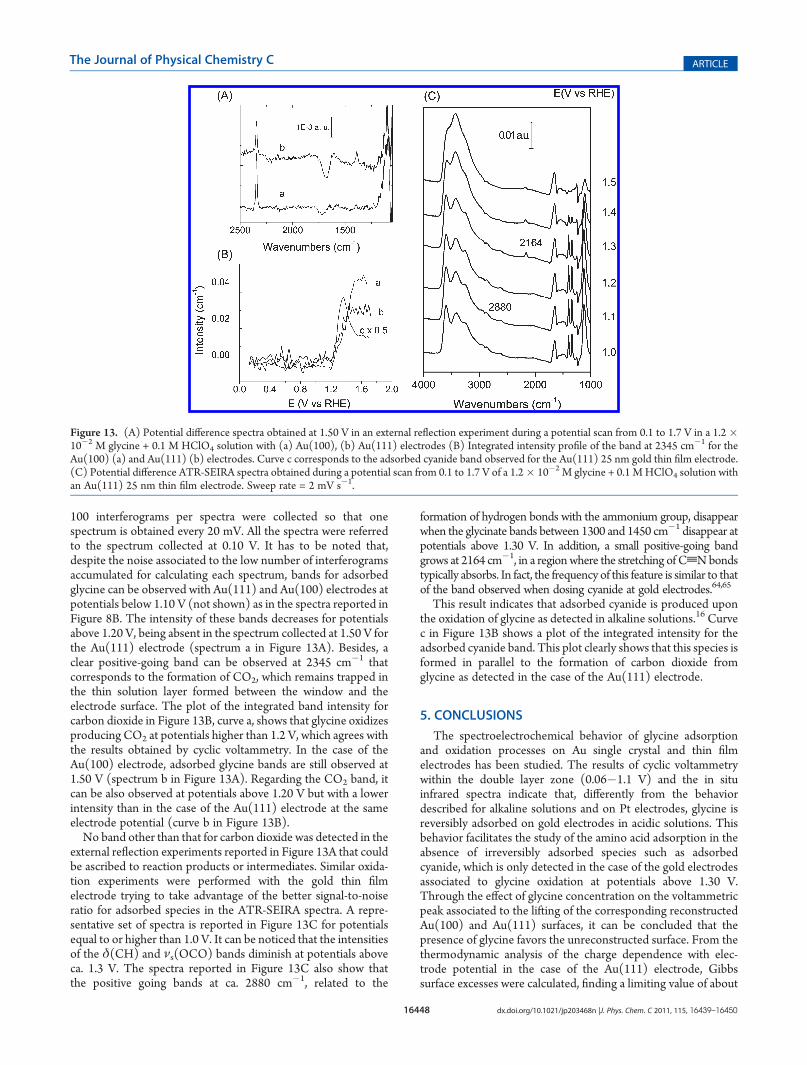
100 interferograms per spectra were collected so that onespectrum is obtained every 20 mV. All the spectra were referredto the spectrum collected at 0.10 V. It has to be noted that,despite the noise associated to the low number of interferogramsaccumulated for calculating each spectrum, bands for adsorbedglycine can be observed with Au(111) and Au(100) electrodes atpotentials below 1.10 V (not shown) as in the spectra reported inFigure 8B. The intensity of these bands decreases for potentialsabove 1.20 V, being absent in the spectrum collected at 1.50 V forthe Au(111) electrode (spectrum a in Figure 13A). Besides, aclear positive-going band can be observed at 2345 cm�1 thatcorresponds to the formation of CO2, which remains trapped inthe thin solution layer formed between the window and theelectrode surface. The plot of the integrated band intensity forcarbon dioxide in Figure 13B, curve a, shows that glycine oxidizesproducing CO2 at potentials higher than 1.2 V, which agrees withthe results obtained by cyclic voltammetry. In the case of theAu(100) electrode, adsorbed glycine bands are still observed at1.50 V (spectrum b in Figure 13A). Regarding the CO2 band, itcan be also observed at potentials above 1.20 V but with a lowerintensity than in the case of the Au(111) electrode at the sameelectrode potential (curve b in Figure 13B).No band other than that for carbon dioxide was detected in the
external reflection experiments reported in Figure 13A that couldbe ascribed to reaction products or intermediates. Similar oxida-tion experiments were performed with the gold thin filmelectrode trying to take advantage of the better signal-to-noiseratio for adsorbed species in the ATR-SEIRA spectra. A repre-sentative set of spectra is reported in Figure 13C for potentialsequal to or higher than 1.0 V. It can be noticed that the intensitiesof the δ(CH) and νs(OCO) bands diminish at potentials aboveca. 1.3 V. The spectra reported in Figure 13C also show thatthe positive going bands at ca. 2880 cm�1, related to the
formation of hydrogen bonds with the ammonium group, disappearwhen the glycinate bands between 1300 and 1450 cm�1 disappear atpotentials above 1.30 V. In addition, a small positive-going bandgrows at 2164 cm�1, in a regionwhere the stretching of CtNbondstypically absorbs. In fact, the frequency of this feature is similar to thatof the band observed when dosing cyanide at gold electrodes.64,65
This result indicates that adsorbed cyanide is produced uponthe oxidation of glycine as detected in alkaline solutions.16 Curvec in Figure 13B shows a plot of the integrated intensity for theadsorbed cyanide band. This plot clearly shows that this species isformed in parallel to the formation of carbon dioxide fromglycine as detected in the case of the Au(111) electrode.
5. CONCLUSIONS
The spectroelectrochemical behavior of glycine adsorptionand oxidation processes on Au single crystal and thin filmelectrodes has been studied. The results of cyclic voltammetrywithin the double layer zone (0.06�1.1 V) and the in situinfrared spectra indicate that, differently from the behaviordescribed for alkaline solutions and on Pt electrodes, glycine isreversibly adsorbed on gold electrodes in acidic solutions. Thisbehavior facilitates the study of the amino acid adsorption in theabsence of irreversibly adsorbed species such as adsorbedcyanide, which is only detected in the case of the gold electrodesassociated to glycine oxidation at potentials above 1.30 V.Through the effect of glycine concentration on the voltammetricpeak associated to the lifting of the corresponding reconstructedAu(100) and Au(111) surfaces, it can be concluded that thepresence of glycine favors the unreconstructed surface. From thethermodynamic analysis of the charge dependence with elec-trode potential in the case of the Au(111) electrode, Gibbssurface excesses were calculated, finding a limiting value of about
Figure 13. (A) Potential difference spectra obtained at 1.50 V in an external reflection experiment during a potential scan from 0.1 to 1.7 V in a 1.2�10�2 M glycine + 0.1 M HClO4 solution with (a) Au(100), (b) Au(111) electrodes (B) Integrated intensity profile of the band at 2345 cm
�1 for theAu(100) (a) and Au(111) (b) electrodes. Curve c corresponds to the adsorbed cyanide band observed for the Au(111) 25 nm gold thin film electrode.(C) Potential difference ATR-SEIRA spectra obtained during a potential scan from 0.1 to 1.7 V of a 1.2� 10�2 M glycine + 0.1 MHClO4 solution withan Au(111) 25 nm thin film electrode. Sweep rate = 2 mV s�1.
16449 dx.doi.org/10.1021/jp203468n |J. Phys. Chem. C 2011, 115, 16439–16450
The Journal of Physical Chemistry C ARTICLE
0.33 glycine adsorbates per surface metal atom before the onsetof glycine oxidation.
The main adsorbate bands observed in the infrared spectra ofglycine appear at ca. 1400 and 1340 cm�1 on all the surfacesstudied, with band intensities and band frequencies that dependon the adsorbate coverage, which is controlled by the glycineconcentration and electrode potential. From DFT calculations,the bands at ca. 1400 and 1340 cm�1 can be assigned to theνs(OCO) and δ(CH) modes of adsorbed glycinate anions,respectively, although in the case of the non-deuterated speciesboth bands are complex combination bands involving contribu-tions also fromCH2 andNH3 twist or C�C stretch. In the case ofadsorbed glycinate anions with the deuterated methylene groupthe DFT calculated harmonic frequencies indicate that there isonly one band having significant contribution of the νs(OCO)mode in the spectral range between 1200 and 1400 cm�1.Because of the absence of the band for the asymmetric stretchingof the carboxylate group both in the external and internalreflection spectra (that from the DFT calculations would appearbetween 1600 and 1650 cm�1), the surface selection rulesuggests that glycine adsorbs to the surface through both oxygenatoms of the carboxylate group. This conclusion is consistentwith the optimized geometry derived from the DFT B3LYP/6-31+G(d), LANL2DZ calculations, which can be described asan asymmetric bridge bidentate configuration, with bondingthrough the two oxygen atoms of the carboxylate. Additionally,the ATR-SEIRA spectra show bands for coadsorbed perchlorateanions and interfacial water molecules associated to glycinateadsorption. The intensity of the former band is much higher thanin the case of adsorbed acetate anions, suggesting that significantamounts of perchlorate remain at the electrode interface in orderto compensate the positive charge associated to the protonatedammonium group. Regarding the main interfacial water bands,the latter seem to be related to the incorporation of theperchlorate anions. An additional difference with the behaviorreported for adsorbed acetate is the experimental observation ofadsorbate bands in the region around 2800 cm�1, which inagreement with the DFT frequency calculations are related toNH stretching modes weakened by the involvement of the Hatom in hydrogen bonds with neighboring water molecules.
Regarding the reactivity of glycine at gold electrodes, thevoltammetric results indicate that glycine oxidation is a complex,surface sensitive process. External reflection infrared spectrosco-py has shown the accumulation in the thin solution layer of theCO2 produced, whereas the increased sensitivity of the ATR-SEIRA experiments allowed for the observation of bands due toadsorbed CN.
’AUTHOR INFORMATION
Corresponding Author*E-mail: [email protected].
’ACKNOWLEDGMENT
Financial support from Ministerio de Ciencia e Innovaci�on(Spain) (Projects CTQ2010-16271 and CTQ2009-13142, Fon-dos FEDER), Generalitat Valenciana (Prometeo/2009/045 andACOMP/2011/200), and the University of Alicante is greatlyacknowledged. A.P.S. is grateful to the Generalitat Valenciana forthe award of a Santiago Grisolía grant.
’REFERENCES
(1) Herzog, G.; Arrigan, D. W. M. Analyst 2007, 132, 615.(2) Lehninger, A. L.; Nelson, D. L.; Cox, M. M. Principles of
Biochemistry, 2nd ed.; Worth Publishers: New York, 1993.(3) Kanagaraja, S.; Lundstrom, I.; Nygren, H.; Tengvall, P. Bioma-
terials 1996, 17, 2225.(4) Horvatovich, P.; Govorukhina, N.; Bischoff, R. Analyst 2006,
131, 1193.(5) Hor�anyi, G.; Rizmayer, E. M. J. Electroanal. Chem. 1975, 64, 15.(6) Hor�anyi, G.; Rizmayer, E. M. J. Electroanal. Chem. 1986, 198,
393.(7) Marangoni, D. G.; Smith, R. S.; Roscoe, S. G.Can. J. Chem. 1988.(8) Marangoni, D. G.; Wylie, I. G. N.; Roscoe, S. G. J. Electroanal.
Chem. 1991, 320, 269.(9) Wright, J. E. I.; Fatih, K.; Brosseau, C. L.; Omanovic, S.; Roscoe,
S. G. J. Electroanal. Chem. 2003, 550�551, 41.(10) Li, H. Q.; Chen, A.; Roscoe, S. G.; Lipkowski, J. J. Electroanal.
Chem. 2001, 500, 299.(11) Huerta, F.; Morall�on, E.; Cases, F.; Rodes, A.; V�azquez, J. L.;
Aldaz, A. J. Electroanal. Chem. 1997, 421, 179.(12) Huerta, F.; Morall�on, E.; Cases, F.; Rodes, A.; V�azquez, J. L.;
Aldaz, A. J. Electroanal. Chem. 1997, 431, 269.(13) Huerta, F.; Morall�on, E.; V�azquez, J. L.; P�erez, J. M.; Aldaz, A.
J. Electroanal. Chem. 1998, 445, 155.(14) Huerta, F.; Morall�on, E.; V�azquez, J. L.; Aldaz, A. J. Electroanal.
Chem. 1999, 475, 38.(15) Xiao, X. Y.; Sun, S. G.; Yao, J. L.; Wu, Q. H.; Tian, Z. Q.
Langmuir 2002, 18, 6274.(16) Zhen, C. H.; Sun, S. G.; Fan, C. J.; Chen, S. P.; Mao, B. W.; Fan,
Y. J. Electrochim. Acta 2004, 49, 1249.(17) Efstathiou, V.; Woodruff, D. P. Surf. Sci. 2003, 531, 304.(18) Rankin, R. B.; Sholl, D. S. J. Phys. Chem. B 2005, 109, 16764.(19) Rankin, R. B.; Sholl, D. S. Surf. Sci. 2004, 548, 301.(20) Mae, K.; Morikawa, Y. Surf. Sci. 2004, 553, L63.(21) Balnkenburg, S.; Schmidt,W.G.Nanotechnology 2007, 18, 424030.(22) Bern�a, A.; Delgado, J. M.; Orts, J. M.; Rodes, A.; Feliu, J. M.
Electrochim. Acta 2008, 53, 2309.(23) Delgado, J. M.; Rodes, A.; Orts, J. M. J. Phys. Chem. C 2007,
111, 14476.(24) Orts, J. M.; Sandoval A. P.; Rodes, A.; Feliu, J. M. In
preparation.(25) Lide, D. R. CRC Handbook of Chemistry and Physics; 86th ed.;
CRC Press: Boca Raton, FL, 2005.(26) Frisch, M. J.; Trucks, G. W.; Schlegel, H. B.; Scuseria, G. E.;
Robb, M. A.; Cheeseman, J. R.; Montgomery, J.; Vreven, T.; Kudin,K. N.; Burant, J. C.; Millam, J. M.; Iyengar, S. S.; Tomasi, J.; Barone, V.;Mennucci, B.; Cossi, M.; Scalmani, G.; Rega, N.; Petersson, G. A.;Nakatsuji, H.; Hada, M.; Ehara, M.; Toyota, K.; Fukuda, R.; Hasegawa,J.; Ishida, M.; Nakajima, T.; Honda, Y.; Kitao, O.; Nakai, H.; Klene, M.;Li, X.; Knox, J. E.; Hratchian, H. P.; Cross, J. B.; Adamo, C.; Jaramillo, J.;Gomperts, R.; Stratmann, E.; Yazyev, O.; Austin, A. J.; Cammi,R.; Pomelli, C.; Ochterski, J. W.; Ayala, P. Y.; Morokuma, K.; Voth,G. A.; Salvador, P.; Dannenberg, J. J.; Zakrzewski, V. G.; Dapprich, S. D.;Strain, M. C.; Farkas, O.; Malick, D. K.; Rabuck, A. D.; Raghavachari,K.; Foresman, J. B.; Ortiz, J. V.; Cui, Q.; Baboul, A. G.; Clifford, S.;Cioslowski, J.; Stefanov, B. B.; Liu, G.; Liashenko, A.; Piskorz, P.;Komaromi, I.; Martin, R. L. F.; Keith, T.; Al-Laham, M. A.; Peng,C. Y.; Nanayakkara, A.; Challacombe, M.; Gill, P. M. W.; Johnson, B.;Chen, W.; Wong, M. W.; Gonz�alez, C.; Pople, J. A.Gaussian 03, RevisionD.02; Gaussian, Inc.: Pittsburgh, PA, 2004.
(27) Becke, A. D. J. Chem. Phys. 1993, 98, 5648.(28) Lee, C.; Yang, W.; Parr, R. G. Phys. Rev. B 1988, 37, 785.(29) Hehre, W. J.; Ditchfield, R.; Pople, J. A. J. Chem. Phys. 1972, 56,
2257.(30) Hariharan, P. C.; Pople, J. A. Theor. Chim. Acta 1973, 28, 213.(31) Clark, T.; Chandrasekhar, J.; Spitznagel, G. W.; Schleyer,
P. V. R. J. Comput. Chem. 1983, 4, 294.
16450 dx.doi.org/10.1021/jp203468n |J. Phys. Chem. C 2011, 115, 16439–16450
The Journal of Physical Chemistry C ARTICLE
(32) Hay, P. J.; Wadt, W. R. J. Chem. Phys. 1985, 82, 299.(33) York, S. M.; Haq, S.; Kilway, K. V.; Phillips, J. M.; Leibsle, F. M.
Surf. Sci. 2003, 522, 34.(34) Phillips, J. M.; Leibsle, F. M.; Holder, A. J.; Keith, T. Surf. Sci.
2003, 545, 1.(35) Delgado, J. M.; Blanco, R.; Orts, J. M.; P�erez, J. M.; Rodes, A.
J. Phys. Chem. C 2009, 113, 989.(36) Delgado, J. M.; Blanco, R.; Orts, J. M.; P�erez, J. M.; Rodes, A.
J. Phys. Chem. C 2010, 114, 12554.(37) Delgado, J. M.; Blanco, R.; Orts, J. M.; P�erez, J. M.; Rodes, A.
Electrochim. Acta 2010, 55, 2055.(38) Schaftenaar, G.; Noordik, J. H. J. Comput.-Aided Mol. Des. 2000,
14, 123.(39) Clavilier, J.; Armand, D.; Sun, S. G.; Petit, M. J. Electroanal.
Chem. 1986, 205, 267.(40) Rodes, A.; P�erez, J. M.; Aldaz, A. In Handbook of Fuel Cells.
Fundamentals, Technology and Applications; Vielstich, W., Gasteiger,H. A., Lamm, A., Eds.; John Wiley & Sons, Ltd.: Chichester, 2003;Vol.2, pp 191�219.(41) Greenler, R. G. J. Chem. Phys. 1966, 44, 310.(42) Osawa, M.; Ataka, K.; Yoshii, K.; Nishikawa, Y. Appl. Spectrosc.
1993, 47, 1497.(43) Kolb, D. M. Prog. Surf. Sci. 1996, 51, 109.(44) Herrero, E.; Mostany, J.; Feliu, J. M.; Lipkowski, J. J. Electroanal.
Chem. 2002, 534, 79.(45) Mostany, J.; Herrero, E.; Feliu, J. M.; Lipkowski, J. J. Electroanal.
Chem. 2003, 558, 19.(46) Mostany, J.; Climent, V.; Herrero, E.; Feliu, J. M. J. Electroanal.
Chem. 2010, 649, 119.(47) Parsons, R. Proc. R. Soc. London, Ser. A 1961, 79, 261.(48) Lipkowski, J.; Stolberg, L. In Adsorption of Molecules at Metal
Electrodes; Ross, P. N., Ed.; VCH: New York, 1992; p 171.(49) García-Ar�aez,N.; Climent, V.;Herrero, E.; Feliu, J.M.; Lipkowski,
J. J. Electroanal. Chem. 2006, 591, 149.(50) Socrates, G. Infrared and Raman Characteristic Group Frequen-
cies; John Wiley & Sons: Chichester, 2001.(51) Bern�a, A.; Delgado, J. M.; Orts, J. M.; Rodes, A.; Feliu, J. M.
Langmuir 2006, 22, 7192.(52) Delgado, J. M.; Bern�a, A.; Orts, J. M.; Rodes, A.; Feliu, J. M.
J. Phys. Chem. C 2007, 111, 9943.(53) Osawa, M. Diffraction and Spectroscopic Methods in Electro-
chemistry. In Advances in Electrochemical Science and Engineering; Alkire,R., Kolb, D. M., Lipkowski, J., Ross, P. N., Eds.; Wiley-VCH: Weinheim,2006; Vol.9.(54) Wandlowski, T.; Ataka, K.; Pronkin, S.; Diesing, D. Electrochim.
Acta 2004, 49, 1233.(55) Osawa, M.; Ataka, K.; Yoshii, K.; Yotsuyanagi, T. J. Electron
Spectrosc. Relat. Phenom. 1993, 64/65, 371.(56) Ataka, K.; Yotsuyanagi, T.; Osawa, M. J. Phys. Chem. 1996,
100, 10664.(57) Ataka, K.; Osawa, M. Langmuir 1998, 14, 951.(58) Delgado, J. M.; Orts, J. M.; P�erez, J. M.; Rodes, A J. Electroanal.
Chem. 2008, 617, 130.(59) Angerstein-Kozlowska,H.;Conway,B. E.;Hamelin,A.; Stoicoviciu,
L. Electrochim. Acta 1986, 31, 1051.(60) Angerstein-Kozlowska,H.;Conway,B. E.;Hamelin,A.; Stoicoviciu,
L. J. Electroanal. Chem. 1987, 228, 429.(61) Hamelin, A. J. Electroanal. Chem. 1996, 407, 1.(62) Hamelin, A. In Modern Aspects of Electrochemistry; Bockris, J.
O’M., Conway, B. E., White, R. E., Eds.; Plenum Press: New York, 1985;Vol.16, pp 1�101.(63) Hamelin, A.; Gao, X.; Weaver, M. J. J. Electroanal. Chem. 1992,
323, 361.(64) Corrigan, D. S.; Gao, P.; Leung, L. W.; Weaver, M. J. Langmuir
1986, 2, 744.(65) Beltramo, G. I.; Shubina, T. E.; Mitchell, S. J.; Koper, M. T. M.
J. Electroanal. Chem. 2004, 563, 111.


![=HKL 1057-88 ¦1.3 · =HKL 25664-83 ¦3.4.2 =HKL 25706-83 ¦3.4.2 =HKL 25771-83 ¦1.3.1 GZklhysbc klZg^Zjl jZkijhkljZgy_lky gZ hqbs_ggu_ l\_j^u_ g_nlygu_ iZjZnbgu djbklZeebq_kdh]h](https://img.pdfslide.us/doc/110x75/603d5f78a303d269d73d5eee/hkl-1057-88-13-hkl-25664-83-342-hkl-25706-83-342-hkl-25771-83-131.jpg)