Embed Size (px)
Citation preview
Adsorption of Disperse Blue2BLN by Microwave ActivatedRed MudJie Fu,a,b Ran Song,a Wen-Jun Mao,a Qing Wang,b Shu-Qing An,b Qing-Fu Zeng,c
and Hai-Liang Zhua,ba School of Life Sciences, State Key Laboratory of Pharmaceutical Biotechnology, Nanjing University, Nanjing 210093, China;[email protected] (for correspondence)b School of the Environment, State Key Laboratory of Pollution Control and Resource Reuse, Nanjing University,Nanjing 210093, Chinac Engineering Research Center for Clean Production of Textile Dyeing and Printing of Ministry of Education,Wuhan University of Science & Engineering, Wuhan 430073, China
Published online 9 November 2010 in Wiley Online Library (wileyonlinelibrary.com). DOI 10.1002/ep.10506
The ability of red mud (RM) to adsorb disperse blue2BLN from water was studied and the condition ofadsorption process was optimized. The results showedthat the microwave activated RM had good adsorptioncapacity. The adsorption process was in accord withLangmuir isotherm model. The saturated adsorptionamount of disperse blue 2BLN by activated RM was�45 mg/g. The factors that affected the adsorption pro-cess included dosage of RM, temperature, and pHvalue. The optimal condition was 408C, pH 3.0, 15 g/LRM and 30 min reaction time, under which the re-moval percentages of color, chemical oxygen demandand total organic carbon reached �99%, 64% and50%, respectively. � 2010 American Institute of ChemicalEngineers Environ Prog, 30: 558–566, 2011Keywords: adsorption, disperse blue 2BLN, micro-
wave, red mud
INTRODUCTION
In recent years, synthetic dyes are extensively used inmany industries, such as textile, cosmetic, printing,drug, and food processing [1]. Unfortunately, large vol-umes of dye wastewater are discharged, which are notonly aesthetic pollution but also heath threats becauseof the toxicities and potential carcinogenicities of resid-ual dyes [2]. Removal of theses dyes from wastewater
has therefore attracted increased attention [3]. To protectthe water environment, Chinese government promul-gated relevant policy to control of printing and dyeingwastewater pollution in 2001 [4]. However, due to thecomplex chemical structure of synthetic dyes, they areresistant to be broken down and difficult to be treatedin wastewater. Among these dyes, anthraquinone dyesare highly resistant and toxic [5]. Different technologieshave been studied for the degradation of anthraquinonedyes in wastewater. Some methods are based onadvanced oxidation processes and can effectively de-grade the dyes [6]. However, high costs limit their practi-cal application. Chlorine oxidants are used in othermethods based on their strong oxidative capacities [7].The disadvantage of chlorine oxidants is the generationof a large amount of adsorbable organic halogens [8].
Red mud (RM) is a waste material, which is formedduring the production of alumina when the bauxiteore is subjected to caustic leaching [9]. Large quantitiesof RM are generated in China (1–2 tons RM per ton ofalumina produced). The utilization of RM, as a cheapadsorbent for phosphate has been considered [9–12].Orescanin et al. [13] use bauxite waste (RM and wastebase) to remove heavy metals from industrial waste-waters. However, the adsorption of organic contamina-tions by RM has been rarely reported.
Therefore, the aim of this work is to study theadsorption of disperse blue 2BLN (2BLN), a typicalanthraquinone dye, by microwave (MW) activatedRM. We investigated the kinetics, isotherm, and ther-
Additional Supporting Information may be found in the onlineversion of this article.� 2010 American Institute of Chemical Engineers
558 December 2011 Environmental Progress & Sustainable Energy (Vol.30, No.4) DOI 10.1002/ep
modynamics of adsorption process. We also studiedthe regeneration of RM by MW. The information ofour result could be helpful for study of removal oforganic contaminations by RM.
MATERIALS AND METHODS
MaterialsCommercial 2BLN was obtained from Tianjin
Chemicals Company (Tianjin, China). Distilled waterwas used for preparation of 2BLN aqueous solutions.RM (31.94% Al2O3, 28.46% CaO, 20.00% SiO2, 5.45%Fe2O3, 5.2% TiO2, and 4.42% Na2O) was supplied byGuizhou Hongda Aluminium Plant (Guizhou, China).
Procedure
MW Activation of RMRM was dipped in distilled water and pH value
was adjusted to �5.0 with 1 M HCl. After being wellstirred for 10 min with a B5-1A magnetic stirrer(Shiyuan Scientific Equipment, Shanghai, China) andkept still for 5 h, the suspension was activated in aG90T23ASP-2B MW oven (Guangdong Galanz Group,China) for 30 min. The RM was then dried in an ovenat 1208C for �3 h. The dried RM was crushed in amortar until passing an 80-mesh analysis.
Adsorption KineticsA 100 mL 2BLN solution (300 mg/L) was placed in a
beaker (400 mL). MW activated RM (MW-RM) adsorbentor inactivated RM (10 g/L) was added and then stirred at208C. At a series of time intervals (5, 10, 15, 30, 60, 120,180, and 240 min), samples were taken from the sus-pension, filtered and analyzed to measure the amountof adsorbed 2BLN. In addition, to study adsorption ther-modynamics, the adsorption kinetics experiments wereconducted at 30 and 408C, respectively.
Adsorption IsothermIsotherm experiments were carried out at 208C. A
100 mL 2BLN solution of varying concentration (100–1000 mg/L) was placed in a beaker and 10 g/L MW-RM or inactivated RM was added. After being stirredfor 4 h to obtain adsorption equilibrium, sampleswere taken from the suspension, filtered and ana-lyzed to measure the amount of saturated adsorbed2BLN and equilibrium concentration of 2BLN.
Effects of Operational ParametersA 100 mL 2BLN solution (300 mg/L) was placed in a
beaker and MW-RM was added. After being stirred for30 min, samples were withdrawn from the suspension,filtered and analyzed to measure the adsorption per-centage and amount of adsorbed 2BLN. In this experi-ment, the effects of temperature (20, 30, 40, 50, 60, and708C), initial pH values (1.0, 3.0, 5.0, 7.0, 9.0, 11.0, and13.0) and MW-RM dosage (5, 10, 15, 20, 25, and 30 g/L)on the adsorption of 2BLN were characterized.
RegenerationUnder the optimal conditions of initial pH 3.0,
408C, 15 g/L MW-RM and 30 min reaction time, MW-
RM was repeatedly used to treat a series of 100 mL2BLN solutions (300 mg/L) for several times. TheMW-RM was then regenerated by using the RM acti-vation method. Subsequently, the regenerated MW-RM was used to treat a new 2BLN solution under theoptimal conditions. The color, chemical oxygendemand (COD) and total organic carbon (TOC) oftreated 2BLN solution were measured to evaluate theadsorption efficiency.
Analysis
Analysis of Visible (Vis) AbsorbanceThe Vis-range wavelength absorbance was meas-
ured on a UV1100 spectrophotometer (Beijing Ray-leigh analytical instrument, Beijing, China). Accordingto Lambert-Beer laq, low concentration of 2BLN hasdirect ratio relationship with the absorbance. There-fore, standard 2BLN solutions in a series of concen-trations were prepared and their absorbance at maxi-mum absorption wavelength (kmax) of 2BLN (565nm) were measured. The standard curve of absorb-ance-concentration was drawn, from which the 2BLNconcentration (mg/L) could be obtained.
The amount of adsorbed 2BLN was calculated byusing Eq. 1:
qt ¼ ðC0 � CtÞVm
(1)
where qt is the amount of adsorbed 2BLN (mg/g), C0
and Ct are the concentrations (mg/L) of initial andtreated solutions respectively, V is the solution vol-ume (L) and m is the mass of adsorbent (g).
The adsorption percentage and color removal per-centage (CR%) were calculated as Eq. 2:
h ¼ CR% ¼ ðC0 � CtÞC0
3100% ¼ ðA0 � AtÞA0
3 100% (2)
where h is the adsorption percentage, A0 and At arethe absorbance (Abs) of initial and treated solutions.
Analysis of CODCOD was measured with a JH-12 COD analysis ap-
paratus (Qingdao Laoshan electron instrument, Qing-dao, China) and chemical oxygen demand removalpercentage (CODR%) were calculated as Eq. 3:
CODR% ¼ COD0 � CODt
COD03 100% (3)
where COD0 and CODt are the COD values (mg/L)of the initial and treated solutions.
Analysis of TOCA Multi N/C TOC Analyzer (Carl Zeiss Yena, Ger-
many) was used to measure TOC concentrationaccording national standard GB13193-91 [14]. All sam-ples were diluted 10 times before analysis. The totalorganic carbon removal percentage (TOCR%) wasexpressed in Eq. 4:
Environmental Progress & Sustainable Energy (Vol.30, No.4) DOI 10.1002/ep December 2011 559
TOCR% ¼ TOC0 � TOCt
TOC03 100% (4)
where TOC0 and TOCt are the TOC values (mg/L) ofthe initial and treated solutions.
Analysis of Fourier Transform Infrared Spectroscopy (FTIR)FTIR spectra were obtained at room temperature
with an NEXUS870 FTIR spectrometer (Nicolet). TheFTIR spectra were recorded within the range of 4000-400 cm21. The potassium bromide (KBr) disc tech-nique was used for sample preparation.
RESULTS AND DISCUSSION
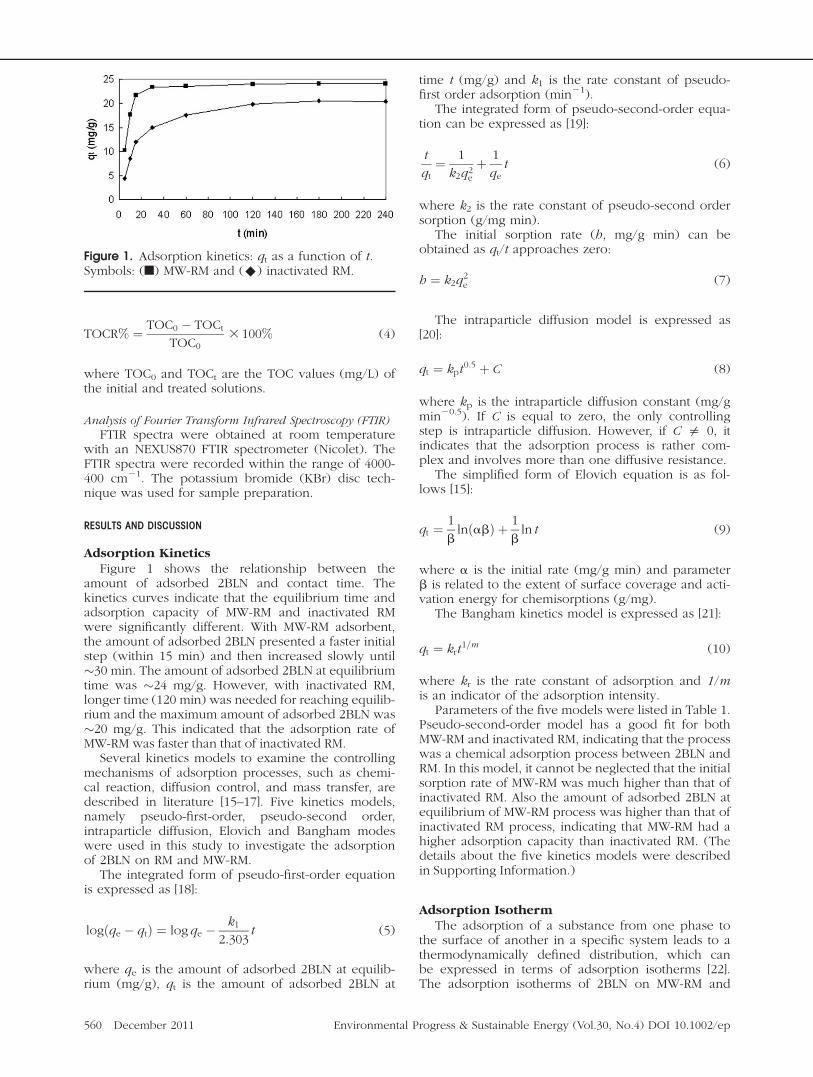
Adsorption KineticsFigure 1 shows the relationship between the
amount of adsorbed 2BLN and contact time. Thekinetics curves indicate that the equilibrium time andadsorption capacity of MW-RM and inactivated RMwere significantly different. With MW-RM adsorbent,the amount of adsorbed 2BLN presented a faster initialstep (within 15 min) and then increased slowly until�30 min. The amount of adsorbed 2BLN at equilibriumtime was �24 mg/g. However, with inactivated RM,longer time (120 min) was needed for reaching equilib-rium and the maximum amount of adsorbed 2BLN was�20 mg/g. This indicated that the adsorption rate ofMW-RM was faster than that of inactivated RM.
Several kinetics models to examine the controllingmechanisms of adsorption processes, such as chemi-cal reaction, diffusion control, and mass transfer, aredescribed in literature [15–17]. Five kinetics models,namely pseudo-first-order, pseudo-second order,intraparticle diffusion, Elovich and Bangham modeswere used in this study to investigate the adsorptionof 2BLN on RM and MW-RM.
The integrated form of pseudo-first-order equationis expressed as [18]:
logðqe � qtÞ ¼ log qe � k12:303
t (5)
where qe is the amount of adsorbed 2BLN at equilib-rium (mg/g), qt is the amount of adsorbed 2BLN at
time t (mg/g) and k1 is the rate constant of pseudo-first order adsorption (min21).
The integrated form of pseudo-second-order equa-tion can be expressed as [19]:
t
qt¼ 1
k2q2eþ 1
qet (6)
where k2 is the rate constant of pseudo-second ordersorption (g/mg min).
The initial sorption rate (h, mg/g min) can beobtained as qt/t approaches zero:
h ¼ k2q2e (7)
The intraparticle diffusion model is expressed as[20]:
qt ¼ kpt0:5 þ C (8)
where kp is the intraparticle diffusion constant (mg/gmin20.5). If C is equal to zero, the only controllingstep is intraparticle diffusion. However, if C = 0, itindicates that the adsorption process is rather com-plex and involves more than one diffusive resistance.
The simplified form of Elovich equation is as fol-lows [15]:
qt ¼ 1
blnðabÞ þ 1
bln t (9)
where a is the initial rate (mg/g min) and parameterb is related to the extent of surface coverage and acti-vation energy for chemisorptions (g/mg).
The Bangham kinetics model is expressed as [21]:
qt ¼ krt1=m (10)
where kr is the rate constant of adsorption and 1/mis an indicator of the adsorption intensity.
Parameters of the five models were listed in Table 1.Pseudo-second-order model has a good fit for bothMW-RM and inactivated RM, indicating that the processwas a chemical adsorption process between 2BLN andRM. In this model, it cannot be neglected that the initialsorption rate of MW-RM was much higher than that ofinactivated RM. Also the amount of adsorbed 2BLN atequilibrium of MW-RM process was higher than that ofinactivated RM process, indicating that MW-RM had ahigher adsorption capacity than inactivated RM. (Thedetails about the five kinetics models were describedin Supporting Information.)
Adsorption IsothermThe adsorption of a substance from one phase to
the surface of another in a specific system leads to athermodynamically defined distribution, which canbe expressed in terms of adsorption isotherms [22].The adsorption isotherms of 2BLN on MW-RM and
Figure 1. Adsorption kinetics: qt as a function of t.Symbols: (n) MW-RM and (^) inactivated RM.
560 December 2011 Environmental Progress & Sustainable Energy (Vol.30, No.4) DOI 10.1002/ep
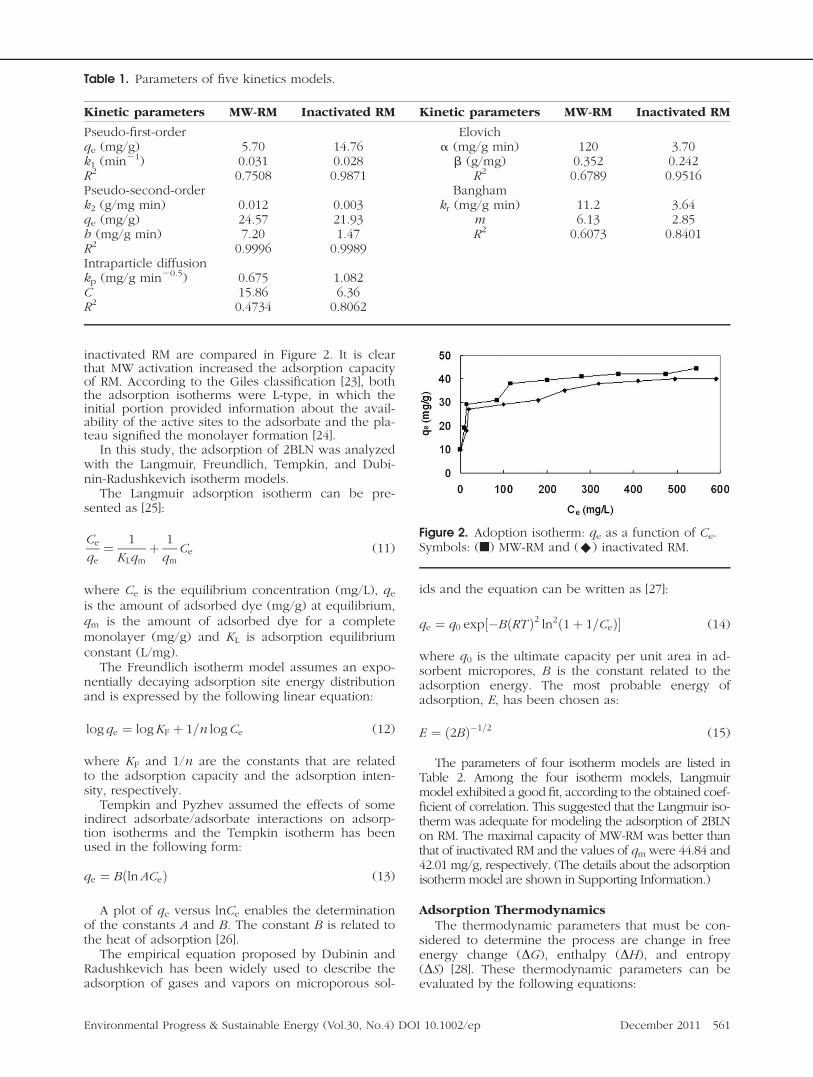
inactivated RM are compared in Figure 2. It is clearthat MW activation increased the adsorption capacityof RM. According to the Giles classification [23], boththe adsorption isotherms were L-type, in which theinitial portion provided information about the avail-ability of the active sites to the adsorbate and the pla-teau signified the monolayer formation [24].
In this study, the adsorption of 2BLN was analyzedwith the Langmuir, Freundlich, Tempkin, and Dubi-nin-Radushkevich isotherm models.
The Langmuir adsorption isotherm can be pre-sented as [25]:
Ce
qe¼ 1
KLqmþ 1
qmCe (11)
where Ce is the equilibrium concentration (mg/L), qeis the amount of adsorbed dye (mg/g) at equilibrium,qm is the amount of adsorbed dye for a completemonolayer (mg/g) and KL is adsorption equilibriumconstant (L/mg).
The Freundlich isotherm model assumes an expo-nentially decaying adsorption site energy distributionand is expressed by the following linear equation:
log qe ¼ logKF þ 1=n logCe (12)
where KF and 1/n are the constants that are relatedto the adsorption capacity and the adsorption inten-sity, respectively.
Tempkin and Pyzhev assumed the effects of someindirect adsorbate/adsorbate interactions on adsorp-tion isotherms and the Tempkin isotherm has beenused in the following form:
qe ¼ BðlnACeÞ (13)
A plot of qe versus lnCe enables the determinationof the constants A and B. The constant B is related tothe heat of adsorption [26].
The empirical equation proposed by Dubinin andRadushkevich has been widely used to describe theadsorption of gases and vapors on microporous sol-
ids and the equation can be written as [27]:
qe ¼ q0 exp½�BðRT Þ2 ln2ð1þ 1=CeÞ� (14)
where q0 is the ultimate capacity per unit area in ad-sorbent micropores, B is the constant related to theadsorption energy. The most probable energy ofadsorption, E, has been chosen as:
E ¼ ð2BÞ�1=2 (15)
The parameters of four isotherm models are listed inTable 2. Among the four isotherm models, Langmuirmodel exhibited a good fit, according to the obtained coef-ficient of correlation. This suggested that the Langmuir iso-therm was adequate for modeling the adsorption of 2BLNon RM. The maximal capacity of MW-RM was better thanthat of inactivated RM and the values of qm were 44.84 and42.01 mg/g, respectively. (The details about the adsorptionisotherm model are shown in Supporting Information.)
Adsorption ThermodynamicsThe thermodynamic parameters that must be con-
sidered to determine the process are change in freeenergy change (DG), enthalpy (DH), and entropy(DS) [28]. These thermodynamic parameters can beevaluated by the following equations:
Figure 2. Adoption isotherm: qe as a function of Ce.Symbols: (n) MW-RM and (^) inactivated RM.
Table 1. Parameters of five kinetics models.
Kinetic parameters MW-RM Inactivated RM Kinetic parameters MW-RM Inactivated RM
Pseudo-first-order Elovichqe (mg/g) 5.70 14.76 a (mg/g min) 120 3.70k1 (min21) 0.031 0.028 b (g/mg) 0.352 0.242R2 0.7508 0.9871 R2 0.6789 0.9516Pseudo-second-order Banghamk2 (g/mg min) 0.012 0.003 kr (mg/g min) 11.2 3.64qe (mg/g) 24.57 21.93 m 6.13 2.85h (mg/g min) 7.20 1.47 R2 0.6073 0.8401R2 0.9996 0.9989Intraparticle diffusionkp (mg/g min20.5) 0.675 1.082C 15.86 6.36R2 0.4734 0.8062
Environmental Progress & Sustainable Energy (Vol.30, No.4) DOI 10.1002/ep December 2011 561
Kc ¼ CAe=Ce (16)
DG ¼ �RT lnKc (17)
lnKc ¼ DS=R � DH=RT (18)
where R is the gas constant (8.314 J/K mol); T is tempera-ture (K); Kc is the equilibrium constant; CAe is the amountof adsorbed dye on the adsorbent at equilibrium (mg/L);and Ce is the equilibrium concentration of the dye in thesolution (mg/L). CAe and Ce were obtained from qe val-ues of the pseudo-second-order model.
As shown in Table 3, the DG for the adsorption of2BLN on RM is negative, indicating that the adsorp-tion is spontaneous and can be considered as physi-sorption. The DG value decreases with an increase intemperature, indicating that the spontaneous natureof the adsorption was inversely proportional to thetemperature and higher temperature enhanced theadsorption, which is consistent with Huang et al.’swork [12]. The higher adsorption capacity at highertemperature might be attributed to the greater pene-tration of the dyes into the micropores caused by aswelling effect in the internal structure of the RM,which increases with increasing temperature [29].
The values of DH and DS can be obtained fromthe slope and intercept of a plot of lnKc against 1/T,respectively. As shown in Table 3, the positive valueof DH indicates the endothermic nature of theadsorption process and the positive value of DS con-firms the increased randomness at the solid-soluteinterface during adsorption. The low value of DS alsoindicates that no remarkable changes in entropyoccur [30]. (The plot of adsorption thermodynamics isdescribed in Supporting Information.)
Effects of Operational Parameters
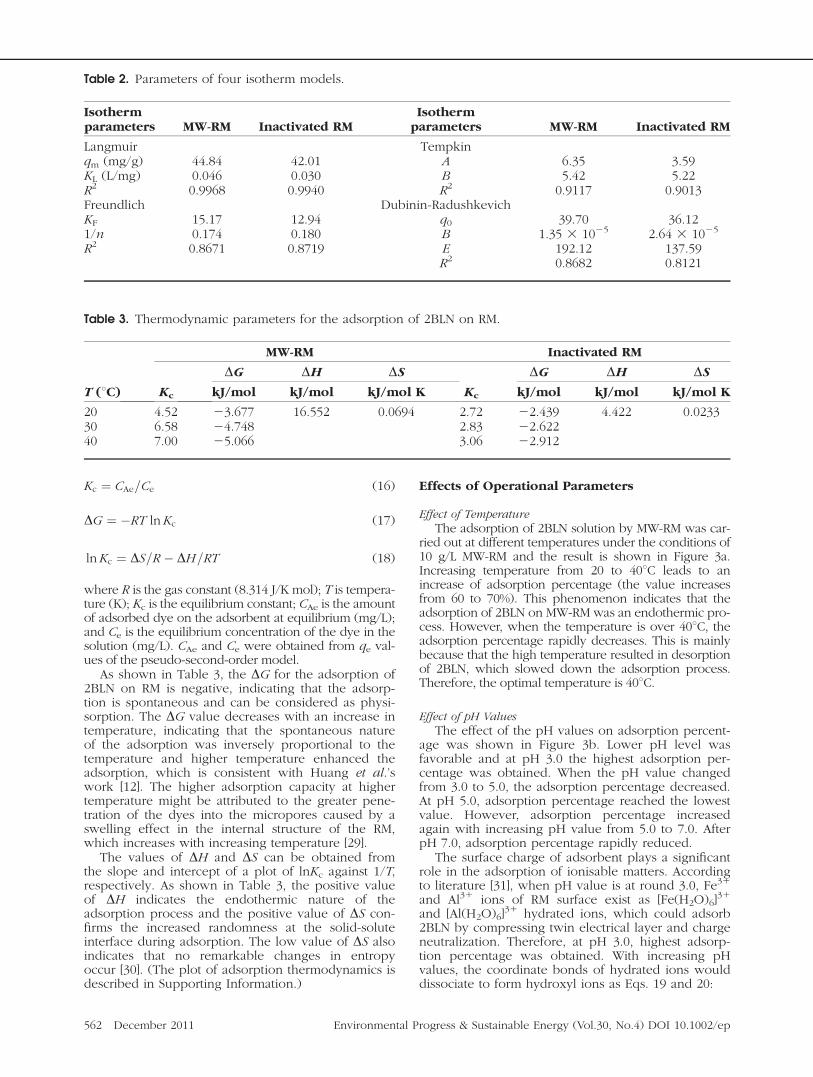
Effect of TemperatureThe adsorption of 2BLN solution by MW-RM was car-
ried out at different temperatures under the conditions of10 g/L MW-RM and the result is shown in Figure 3a.Increasing temperature from 20 to 408C leads to anincrease of adsorption percentage (the value increasesfrom 60 to 70%). This phenomenon indicates that theadsorption of 2BLN on MW-RM was an endothermic pro-cess. However, when the temperature is over 408C, theadsorption percentage rapidly decreases. This is mainlybecause that the high temperature resulted in desorptionof 2BLN, which slowed down the adsorption process.Therefore, the optimal temperature is 408C.
Effect of pH ValuesThe effect of the pH values on adsorption percent-
age was shown in Figure 3b. Lower pH level wasfavorable and at pH 3.0 the highest adsorption per-centage was obtained. When the pH value changedfrom 3.0 to 5.0, the adsorption percentage decreased.At pH 5.0, adsorption percentage reached the lowestvalue. However, adsorption percentage increasedagain with increasing pH value from 5.0 to 7.0. AfterpH 7.0, adsorption percentage rapidly reduced.
The surface charge of adsorbent plays a significantrole in the adsorption of ionisable matters. Accordingto literature [31], when pH value is at round 3.0, Fe31
and Al31 ions of RM surface exist as [Fe(H2O)6]31
and [Al(H2O)6]31 hydrated ions, which could adsorb
2BLN by compressing twin electrical layer and chargeneutralization. Therefore, at pH 3.0, highest adsorp-tion percentage was obtained. With increasing pHvalues, the coordinate bonds of hydrated ions woulddissociate to form hydroxyl ions as Eqs. 19 and 20:
Table 3. Thermodynamic parameters for the adsorption of 2BLN on RM.
T (8C)
MW-RM Inactivated RM
Kc
DG DH DS
Kc
DG DH DS
kJ/mol kJ/mol kJ/mol K kJ/mol kJ/mol kJ/mol K
20 4.52 23.677 16.552 0.0694 2.72 22.439 4.422 0.023330 6.58 24.748 2.83 22.62240 7.00 25.066 3.06 22.912
Table 2. Parameters of four isotherm models.
Isothermparameters MW-RM Inactivated RM
Isothermparameters MW-RM Inactivated RM
Langmuir Tempkinqm (mg/g) 44.84 42.01 A 6.35 3.59KL (L/mg) 0.046 0.030 B 5.42 5.22R2 0.9968 0.9940 R2 0.9117 0.9013Freundlich Dubinin-RadushkevichKF 15.17 12.94 q0 39.70 36.121/n 0.174 0.180 B 1.35 3 1025 2.64 3 1025
R2 0.8671 0.8719 E 192.12 137.59R2 0.8682 0.8121
562 December 2011 Environmental Progress & Sustainable Energy (Vol.30, No.4) DOI 10.1002/ep
½FeðH2OÞ6�3þ ��Hþ
þHþ½FeðOHÞðH2OÞ5�2þ
��Hþ
þHþ½FeðOHÞ2ðH2OÞ4�þ
��Hþ
þHþ½FeðOHÞ3ðH2OÞ3� (19)
½AIðH2OÞ6�3þ ��Hþ
þHþ½AIðOHÞðH2OÞ5�2þ
��Hþ
þHþ½AIðOHÞ2ðH2OÞ4�þ
��Hþ
þHþ½AIðOHÞ3ðH2OÞ3� (20)
Therefore, charge neutralization weakened withthe decrease of charge and the adsorption gradually
decreased. When pH value was around 5.0, [Fe(OH)3]and [Al(OH)3] precipitations were the main forms ofFe31 and Al31. Lowest adsorption percentage wasachieved because of the lowest charge neutralization.When pH value is increased continuously, [Fe(OH)3]and [Al(OH)3] precipitations re-dissolved and hydro-lyzed to form complex anions as Eqs. 21 and 22:
½FeðOHÞ3ðH2OÞ3� ��Hþ
þHþ½FeðOHÞ4ðH2OÞ2��
��Hþ
þHþ½FeðOHÞ5ðH2OÞ�2�
��Hþ
þHþ½FeðOHÞ6ðH2OÞ�3� (21)
½AIðOHÞ3ðH2OÞ3� ��Hþ
þHþ½AIðOHÞ4ðH2OÞ2��
��Hþ
þHþ½AIðOHÞ5ðH2OÞ�2�
��Hþ
þHþ½AIðOHÞ6ðH2OÞ�3� (22)
Therefore, charge neutralization strengthened withthe increase of charge and the adsorption increased.However, when pH value continued to increase, largequantities of gel materials would form, whichreduced the charge neutralization. Therefore, adsorp-tion percentage significantly decreased.
Effect of MW-RM DosageFigure 3c shows the effect of different MW-RM
dosage on adsorption percentage and amount ofadsorbed dye when the process was conducted at408C and pH 3.0. The adsorption percentage signifi-cantly increased with increasing MW-RM adsorbentdosage from 5 to 15 g/L. However, when MW-RM ad-sorbent is increased continuously, the adsorption per-centage increased unnoticeably. On the other hand,the amount of adsorbed 2BLN gradually decreasedwith the increasing MW-RM dosage, especiallywhen the dosage is over 15 g/L. Therefore, given theefficiency and economy of such operation, the best
Figure 3. Effect of operational parameters: (a) effectof temperature, (b) effect of pH value and (c) effectof MW-RM dosage. Symbols: (n) h and (^) qe.
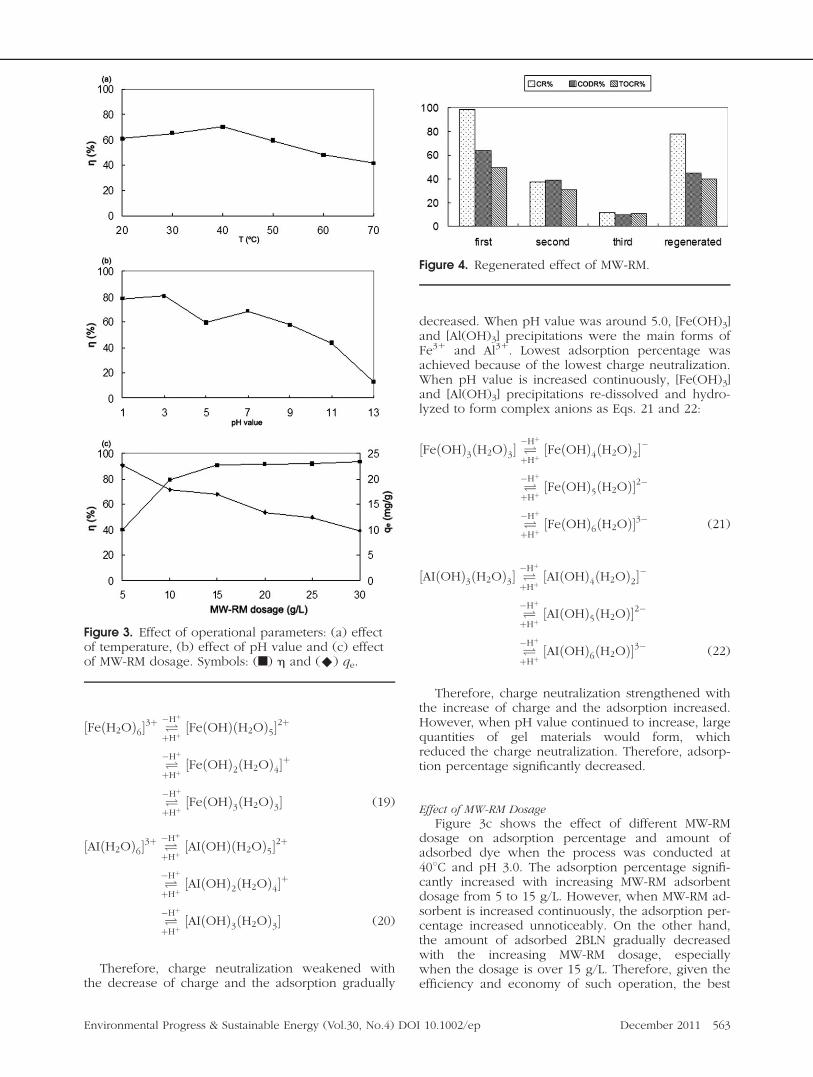
Figure 4. Regenerated effect of MW-RM.
Environmental Progress & Sustainable Energy (Vol.30, No.4) DOI 10.1002/ep December 2011 563
MW-RM adsorbent dosage is 15 g/L, under whichboth the adsorption percentage and amount ofadsorbed dye were kept high.
RegenerationMW-RM was used to repeatedly treat 2BLN solu-
tion and the CR%, CODR% and CODR% reduced rap-idly, as shown in Figure 4. After the third time, theCR%, CODR%, and TOCR% values decreased by�87%, 54% and 39%, respectively. This is mainlybecause the adsorption capability of MW-RM gradu-ally approached saturation. However, when MW-RMwas regenerated by MW irradiation after third treat-ment, the CR%, CODR%, and TOCR% increased again
to �78%, 45% and 40%, respectively. This suggestedthat MW irradiation might be a good method toregenerated RM.
There were two possible mechanisms during theregeneration process: (1) In the MW irradiation, arcswere produced between RM particles and tempera-ture rapidly increased resulting to formation of ‘‘hotspots’’, where temperature would reach up to12008C. The inner pores of RM would be quicklyextended. (2) Large amount of plasmas (such as Fe21
and Fe31), strong oxidants (such as O3 and HO�) andarcs (ultraviolet) were produced, which would de-grade the adsorbed dye molecules either on the sur-face of RM or in the pores of RM.
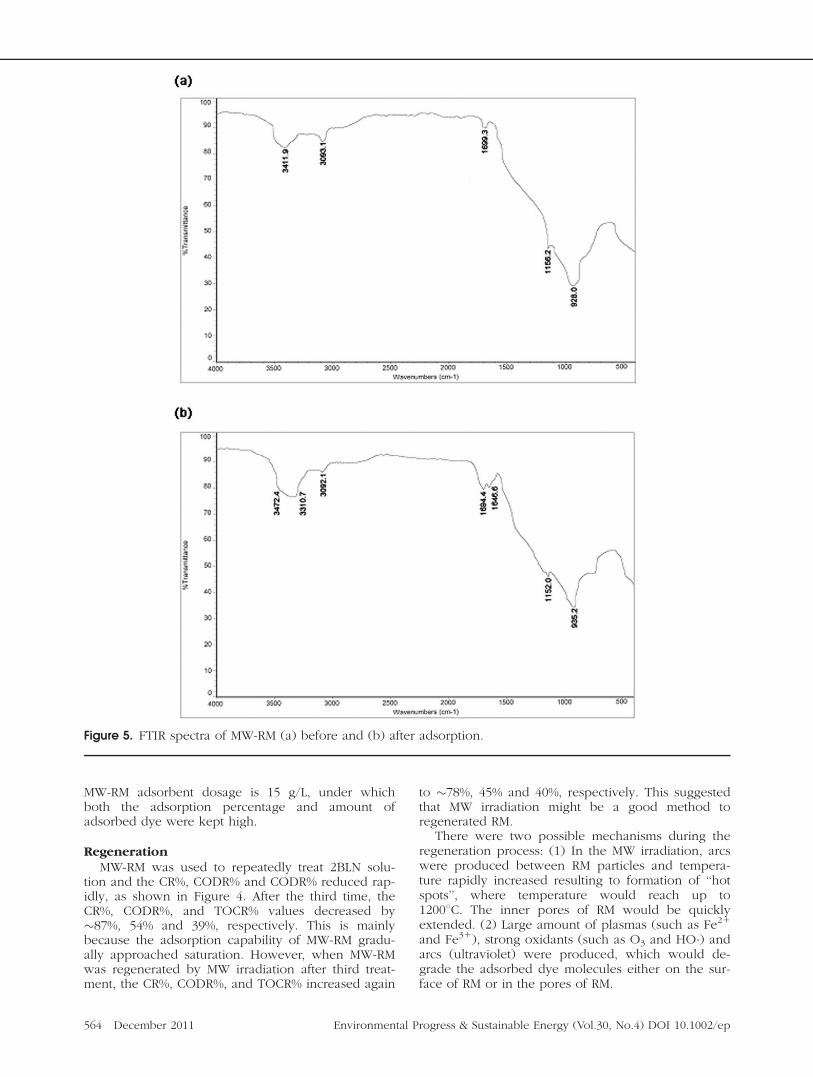
Figure 5. FTIR spectra of MW-RM (a) before and (b) after adsorption.
564 December 2011 Environmental Progress & Sustainable Energy (Vol.30, No.4) DOI 10.1002/ep
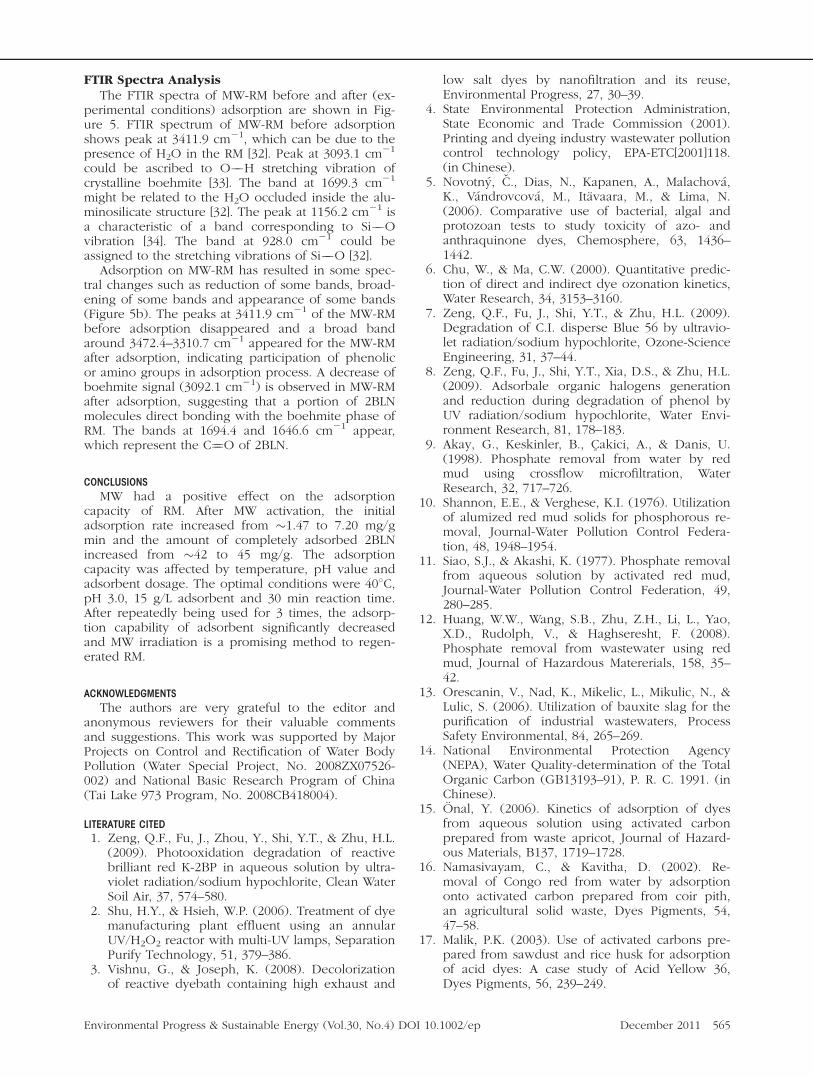
FTIR Spectra AnalysisThe FTIR spectra of MW-RM before and after (ex-
perimental conditions) adsorption are shown in Fig-ure 5. FTIR spectrum of MW-RM before adsorptionshows peak at 3411.9 cm21, which can be due to thepresence of H2O in the RM [32]. Peak at 3093.1 cm21
could be ascribed to O��H stretching vibration ofcrystalline boehmite [33]. The band at 1699.3 cm21
might be related to the H2O occluded inside the alu-minosilicate structure [32]. The peak at 1156.2 cm21 isa characteristic of a band corresponding to Si��Ovibration [34]. The band at 928.0 cm21 could beassigned to the stretching vibrations of Si��O [32].
Adsorption on MW-RM has resulted in some spec-tral changes such as reduction of some bands, broad-ening of some bands and appearance of some bands(Figure 5b). The peaks at 3411.9 cm21 of the MW-RMbefore adsorption disappeared and a broad bandaround 3472.4–3310.7 cm21 appeared for the MW-RMafter adsorption, indicating participation of phenolicor amino groups in adsorption process. A decrease ofboehmite signal (3092.1 cm21) is observed in MW-RMafter adsorption, suggesting that a portion of 2BLNmolecules direct bonding with the boehmite phase ofRM. The bands at 1694.4 and 1646.6 cm21 appear,which represent the C¼¼O of 2BLN.
CONCLUSIONS
MW had a positive effect on the adsorptioncapacity of RM. After MW activation, the initialadsorption rate increased from �1.47 to 7.20 mg/gmin and the amount of completely adsorbed 2BLNincreased from �42 to 45 mg/g. The adsorptioncapacity was affected by temperature, pH value andadsorbent dosage. The optimal conditions were 408C,pH 3.0, 15 g/L adsorbent and 30 min reaction time.After repeatedly being used for 3 times, the adsorp-tion capability of adsorbent significantly decreasedand MW irradiation is a promising method to regen-erated RM.
ACKNOWLEDGMENTS
The authors are very grateful to the editor andanonymous reviewers for their valuable commentsand suggestions. This work was supported by MajorProjects on Control and Rectification of Water BodyPollution (Water Special Project, No. 2008ZX07526-002) and National Basic Research Program of China(Tai Lake 973 Program, No. 2008CB418004).
LITERATURE CITED
1. Zeng, Q.F., Fu, J., Zhou, Y., Shi, Y.T., & Zhu, H.L.(2009). Photooxidation degradation of reactivebrilliant red K-2BP in aqueous solution by ultra-violet radiation/sodium hypochlorite, Clean WaterSoil Air, 37, 574–580.
2. Shu, H.Y., & Hsieh, W.P. (2006). Treatment of dyemanufacturing plant effluent using an annularUV/H2O2 reactor with multi-UV lamps, SeparationPurify Technology, 51, 379–386.
3. Vishnu, G., & Joseph, K. (2008). Decolorizationof reactive dyebath containing high exhaust and
low salt dyes by nanofiltration and its reuse,Environmental Progress, 27, 30–39.
4. State Environmental Protection Administration,State Economic and Trade Commission (2001).Printing and dyeing industry wastewater pollutioncontrol technology policy, EPA-ETC[2001]118.(in Chinese).
5. Novotny, C., Dias, N., Kapanen, A., Malachova,K., Vandrovcova, M., Itavaara, M., & Lima, N.(2006). Comparative use of bacterial, algal andprotozoan tests to study toxicity of azo- andanthraquinone dyes, Chemosphere, 63, 1436–1442.
6. Chu, W., & Ma, C.W. (2000). Quantitative predic-tion of direct and indirect dye ozonation kinetics,Water Research, 34, 3153–3160.
7. Zeng, Q.F., Fu, J., Shi, Y.T., & Zhu, H.L. (2009).Degradation of C.I. disperse Blue 56 by ultravio-let radiation/sodium hypochlorite, Ozone-ScienceEngineering, 31, 37–44.
8. Zeng, Q.F., Fu, J., Shi, Y.T., Xia, D.S., & Zhu, H.L.(2009). Adsorbale organic halogens generationand reduction during degradation of phenol byUV radiation/sodium hypochlorite, Water Envi-ronment Research, 81, 178–183.
9. Akay, G., Keskinler, B., Cakici, A., & Danis, U.(1998). Phosphate removal from water by redmud using crossflow microfiltration, WaterResearch, 32, 717–726.
10. Shannon, E.E., & Verghese, K.I. (1976). Utilizationof alumized red mud solids for phosphorous re-moval, Journal-Water Pollution Control Federa-tion, 48, 1948–1954.
11. Siao, S.J., & Akashi, K. (1977). Phosphate removalfrom aqueous solution by activated red mud,Journal-Water Pollution Control Federation, 49,280–285.
12. Huang, W.W., Wang, S.B., Zhu, Z.H., Li, L., Yao,X.D., Rudolph, V., & Haghseresht, F. (2008).Phosphate removal from wastewater using redmud, Journal of Hazardous Matererials, 158, 35–42.
13. Orescanin, V., Nad, K., Mikelic, L., Mikulic, N., &Lulic, S. (2006). Utilization of bauxite slag for thepurification of industrial wastewaters, ProcessSafety Environmental, 84, 265–269.
14. National Environmental Protection Agency(NEPA), Water Quality-determination of the TotalOrganic Carbon (GB13193–91), P. R. C. 1991. (inChinese).
15. Onal, Y. (2006). Kinetics of adsorption of dyesfrom aqueous solution using activated carbonprepared from waste apricot, Journal of Hazard-ous Materials, B137, 1719–1728.
16. Namasivayam, C., & Kavitha, D. (2002). Re-moval of Congo red from water by adsorptiononto activated carbon prepared from coir pith,an agricultural solid waste, Dyes Pigments, 54,47–58.
17. Malik, P.K. (2003). Use of activated carbons pre-pared from sawdust and rice husk for adsorptionof acid dyes: A case study of Acid Yellow 36,Dyes Pigments, 56, 239–249.
Environmental Progress & Sustainable Energy (Vol.30, No.4) DOI 10.1002/ep December 2011 565
18. Lagergreen, S. (1898). About the theory of so-called adsorption of soluble substances, KungligaSvenska Vetenskapsakademiens Handlingar 24,1–39.
19. Ho, Y.S., & McKay, G. (1999). Comparative sorp-tion kinetic studies of dye and aromatic com-pounds onto fly ash, Journal of EnvironmentalScience and Health Part A, 34, 1179–1204.
20. Kobya, M. (2004). Removal of Cr (VI) from aque-ous solutions by adsorption onto hazelnut shellactivated carbon: kinetic and equilibrium studies,Bioresource Technology, 91, 317–321.
21. Rodrıguez, A., Garcıa, J., Ovejero, G., & Mes-tanza, M. (2009). Adsorption of anionic and cati-onic dyes on activated carbon from aqueous so-lution: Equilibrium and kinetics, Journal of Haz-ardous Matererials, 172, 1311–1320.
22. Kinniburgh, D.G. (1986). General purpose adsorp-tion isotherms, Environmental Science and Tech-nology, 20, 895–904.
23. Giles, C.H., Mac Ewan, T.H., Nakhwa, S.N., &Smith, D. (1960). Studies in adsorption. Part XI. Asystem of classification of solution adsorption iso-therms, Journal of the Chemical Society, 4, 3973–3993.
24. Zohra, B., Aicha, K., Fatima, S., Nourredine, B., &Zoubir, D. (2008). Adsorption of Direct Red 2 onbentonite modified by cetyltrimethylammoniumbromide, Chemical Engineering Journal, 136,295–306.
25. Langmuir, I. (1916). The constitution and funda-mental properties of solids and liquids, Journal ofthe American Chemical Society, 38, 2221–2295.
26. Allen, S.J., Mckay, G., & Porter, J.F. (2004). Adsorp-tion isotherm models for basic dye adsorption bypeat in single and binary component systems,
Journal of Colloid and Interface Science, 280, 322–333.
27. Hsieh, C.T., & Teng, H. (2000). Liquid phaseadsorption of phenol onto activated carbons pre-pared with different activation levels, Journal ofColloid Interface Science, 230, 171–175.
28. Akcay, M. (2006). Characterization and adsorp-tion properties of tetrabutylammonium montmo-rillonite (TBAM) clay: Thermodynamic andkinetic calculations, Journal of Colloid InterfaceScience, 296, 16–21.
29. Eren, E. (2009). Removal of basic dye by modi-fied Unye Bentonite, Journal of Hazardous Mate-rials, 162, 1355–1363.
30. Han, R., Zhang, J., Han, P., Wang, Y., Zhao, Z., &Tang, M. (2009). Study of equilibrium, kineticand thermodynamic parameters about methyleneblue adsorption onto natural zeolite, ChemicalEngineering Journal, 145, 496–504.
31. Baes, C.F., & Mesmer, R.E. (1976). The hydrolysisof cations, New York: Wiley-Interscience.
32. Castaldi, P., Silvetti, M., Santona, L., Enzo, S., &Melis P. (2008). XRD, FT-IR, and thermal analysisof bauxite ore-processing waste (red mud)exchanged with heavy metals, Clays and ClayMinerals, 56, 461–469.
33. Boumaza, A., Favaro, L., Ledion, J., Sattonaay, G.,Brubach, J.B., Berthet, P., Huntz, A.M., Roy, P., &Tetot, R. (2009). Transition alumina phasesinduced by heat treatment of boehmite: An X-raydiffraction and infrared spectroscopy study, Jour-nal of Solid State Chemistry, 182, 1171–1176.
34. Gok, A., Omastova, M., & Prokes, J. (2007). Syn-thesis and characterization of red mud/polyanilinecomposite: Electrical properties and thermal stabil-ity, European Polymer Journal, 43, 2471–2480.
566 December 2011 Environmental Progress & Sustainable Energy (Vol.30, No.4) DOI 10.1002/ep