Embed Size (px)
Citation preview
37,605 (1978).
136,391 (1977). (3) C. V. Puglisi. J. C. Meyer, and J. A. F. de Silva, J. Chromatogr.,
(4) P. Jenner and B:Testa, Drug Metab. Reu., 2,117 (1973). (5) S. J. Lan, K. J. Kripalani, $. V. Dean, P. Egli, L. T. Difazio, and
(6) W. J. Wechter, R. J. Reischer, D. G. Loughhead, G. J. Van Gies-
(7) G. J. Van Giessen and D. G. Kaiser, J. Pharm. Sci., 64, 798
E. C. Schreiber, Drug Metab. Dispos., 4,330 (1976).
sen, and D. Kaiser, Natl. Med. Chem. Symp., 14,91 (1974).
(1975). (8) W. J. Wechter, D. G. Loughhead, R. J. Reischer, G. J. Van Gies-
sen, and D. G. Kaiser, Biochem. Biophys. Res. Commun., 61, 833 (1974).
(9) D. G. Kaiser, G. J. Van Giessen, R. J. Reischer, and W. J. Wechter, J. Pharm. Sci., 65,269 (1976).
(10) D. G. Kaiser and G. J. Van Giessen, ibid., 63,219 (1974). (11) J. M. Kemmerer, B. A. Koechlin, and F. A. Rubio, Fed. Proc., 37,
605 (1978).
ADS-12: An Automated Programmable 12-Tablet Dissolution Testing System
F. J. CIOFFI x, S. MARTYNOVYCH, and H. BENDROT * Received June 30,1978, from E. R. Squibb & Sons, Inc., New Brunswick, NJO8903. address: Computer Mart, Iselin, N.J.
Accepted for publication April 17,1979. *Present
Abstract A novel computerized automated system is described which conforms to the basic requirements set forth in the compendia for testing the dissolution characteristics of solid dosage forms. This modular system can test 12 tablets simultaneously. It can maintain sink conditions at all times and can handle any chemistry amenable to an automatic analyzer. Dissolution, sampling, chemistry, and readout are all accomplished si- multaneously, reducing the complete test time for 12 tablets to the dis- solution time itself.
Keyphrases Dissolution testing systems-automated programmable 12-tablet system Automated testing-dissolution testing system, au- tomated, programmable, 12 tablet
In recent years, investigation of dissolution rates of solid dosage forms has become of prime importance to the pharmaceutical industry, due in part to the commitment by the Food and Drug Administration (FDA) to assure the bioavailability of active drugs from their various dosage forms. In a few cases, the FDA has already shown a corre- lation between in uitro dissolution results and in uiuo bioavailability.
Dissolution testing can serve also as an important cri- terion of the effects of different constituents in drug for- mulations. In manufacturing, it can be useful for deter- mining uniformity within and between different produc- tion batches. The USP considers this latter use to be so important that its 1980 revision will require a dissolution test for all tablet and capsule dosage forms. Guidelines for establishing dissolution requirements for oral solid dosage forms have been established already and are available from the USP.
BACKGROUND
Due to the increased testing workload that will result from this new USP requirement, many pharmaceutical companies have begun auto- mating dissolution testing. Multiple automated dissolution testing ap- paratus have also been developed (1-3) and were reviewed critically in a previous paper (4), which pointed out that none of them met the re- quirements of a truly versatile, completely automated multiple dissolu- tion testing system. The ADS-6 (4) (computerized six-tablet automatic dissolution testing system), which was developed in this laboratory in 1972, incorporates the USP-recommended dissolution apparatus (either the basket or paddle) and can test six tablets simultaneously. Unlike other systems, it is completely automated from tablet introduction to final readout of the raw data on punched paper tape. In addition, this system
maintains sink conditions’ a t all times and performs any type of chem- istry amenable to the automated analyzer. The raw data are computer analyzed in minutes, and final results are presented as a complete tabular report, a graphical dissolution profile, or both.
The ADS-12 has all of the features of the ADS-6, but it can test 12 tablets from one lot simultaneously, which is important in view of the latest USP requirement, or two different lots of six tablets each.
EXPERIMENTAL
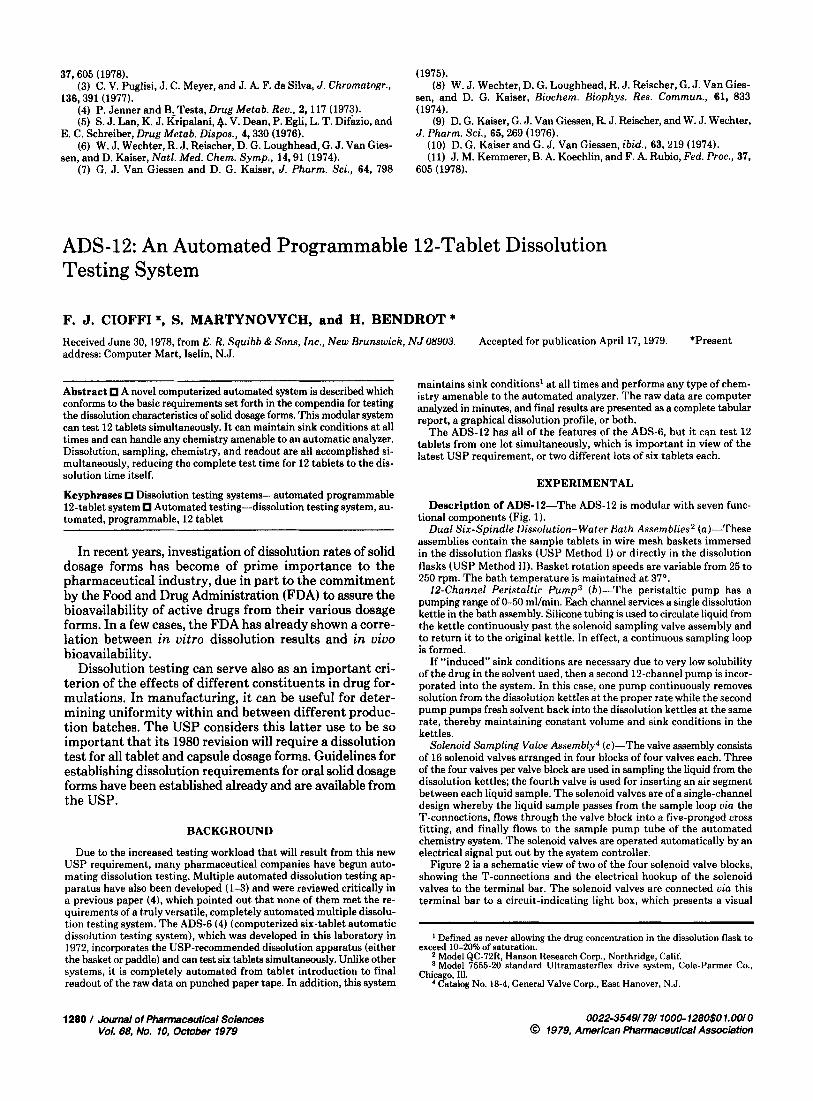
Description of ADS-12-The ADS-12 is modular with seven func- tional components (Fig. 1).
Dual Six-Spindle Dissolution- Water Bath Assemblies2 (a)-These assemblies contain the sample tablets in wire mesh baskets immersed in the dissolution flasks (USP Method I) or directly in the dissolution flasks (USP Method 11). Basket rotation speeds are variable from 25 to 250 rpm. The bath temperature is maintained a t 37”.
12-Channel Peristaltic Pump3 (b)-The peristaltic pump has a pumping range of 0-50 ml/min. Each channel services a single dissolution kettle in the bath assembly. Silicone tubing is used to circulate liquid from the kettle continuously past the solenoid sampling valve assembly and to return it to the original kettle. In effect, a continuous sampling loop is formed.
If “induced” sink conditions are necessary due to very low solubility of the drug in the solvent used, then a second 12-channel pump is incor- porated into the system. In this case, one pump continuously removes solution from the dissolution kettles at the proper rate while the second pump pumps fresh solvent back into the dissolution kettles a t the same rate, thereby maintaining constant volume and sink conditions in the kettles.
Solenoid Sampling Value Assembly4 (c)-The valve assembly consists of 16 solenoid valves arranged in four blocks of four valves each. Three of the four valves per valve block are used in sampling the liquid from the dissolution kettles; the fourth valve is used for inserting an air segment between each liquid sample. The solenoid valves are of a single-channel design whereby the liquid sample passes from the sample loop uia the T-connections, flows through the valve block into a five-pronged cross fitting, and finally flows to the sample pump tube of the automated chemistry system. The solenoid valves are operated automatically by an electrical signal put out by the system controller.
Figure 2 is a schematic view of two of the four solenoid valve blocks, showing the T-connections and the electrical hookup of the solenoid valves to the terminal bar. The solenoid valves are connected uia this terminal bar to a circuit-indicating light box, which presents a visual
1 Defined as never allowing the drug concentration in the dissolution flask to
* Model QC-72R. Hanson Research Corp., Northridge, Calif. 3 Model 7555-20 standard Ultramasterflex drive system, Cole-Parmer Co.,
4 Catalog No. 18-4, General Valve Corp.. East Hanover, N.J.
exceed 10-2070 of saturation.
Chicago, Ill.
1200 I Journal of Pharmaceutical Sciences Vol. 68, No. 10, October 1979
002235491 791 1000- 1280$01.00JO @ 1979, American Pharmceutical Association
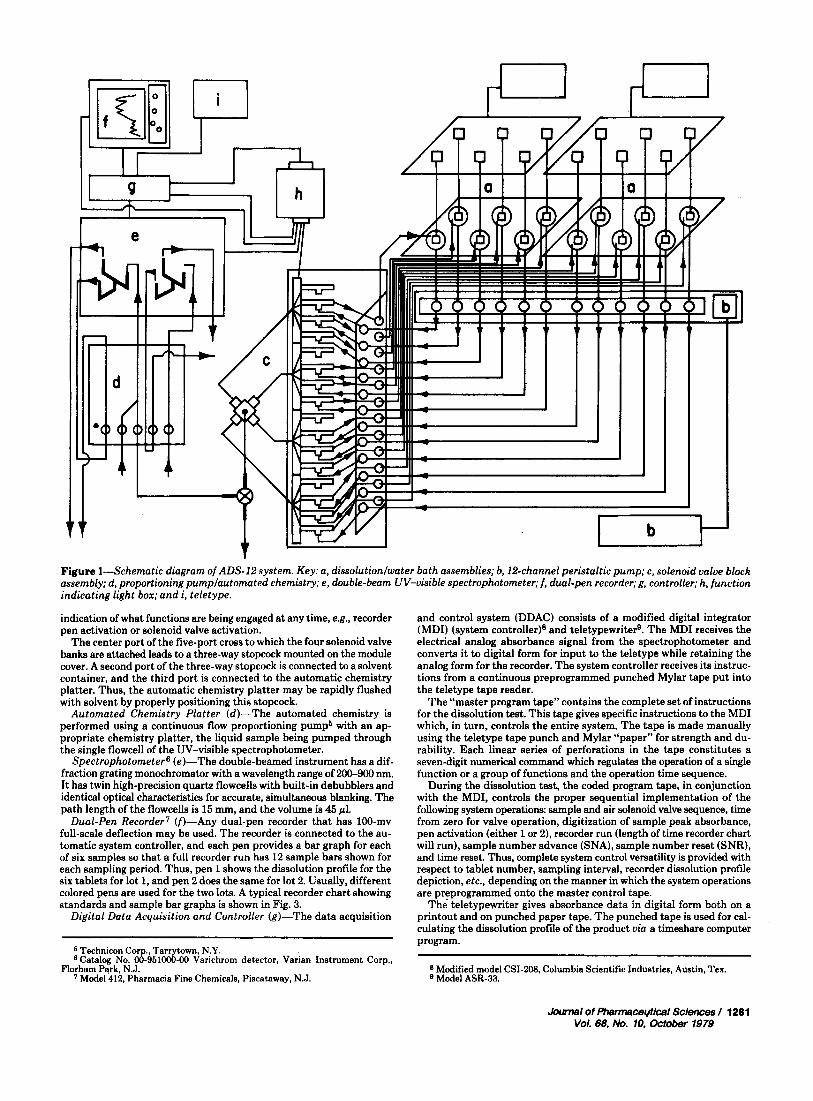
Figure 1-Schematic diagram of ADS-12 system. Key: a, dissolutionlwater bath assemblies; b, 12-channel peristaltic pump; c, solenoid valve block assembly; d, proportioning pumplautonated chemistry; e, double-beam UV-visible spectrophotometer; f, dwl-pen recorder; g , controller; h, function indicating light box; andi,. teletype.
indication of what functions are being engaged at any time, e.g., recorder pen activation or solenoid valve activation.
The center port of the five-port cross to which the four solenoid valve hanks are attached leads to a three-way stopcock mounted on the module cover. A second port of the three-way stopcock is connected to a solvent container, and the third port is connected to the automatic chemistry platter. Thus, the automatic chemistry platter may be rapidly flushed with solvent by properly positioning this stopcock.
Automated Chemistry Platter (d)-The automated chemistry is performed using a continuous flow proportioning pump6 with an ap- propriate chemistry platter, the liquid sample being pumped through the single flowcell of the UV-visible spectrophotometer.
SpectrophotometerG (e)-The double-beamed instrument has a dif- fraction grating monochromator with a wavelength range of 200-900 nm. It has twin high-precision quartz flowcells with built-in debubblers and identical optical characteristics for accurate, simultaneous blanking. The path length of the flowcells is 15 mm, and the volume is 45 pl.
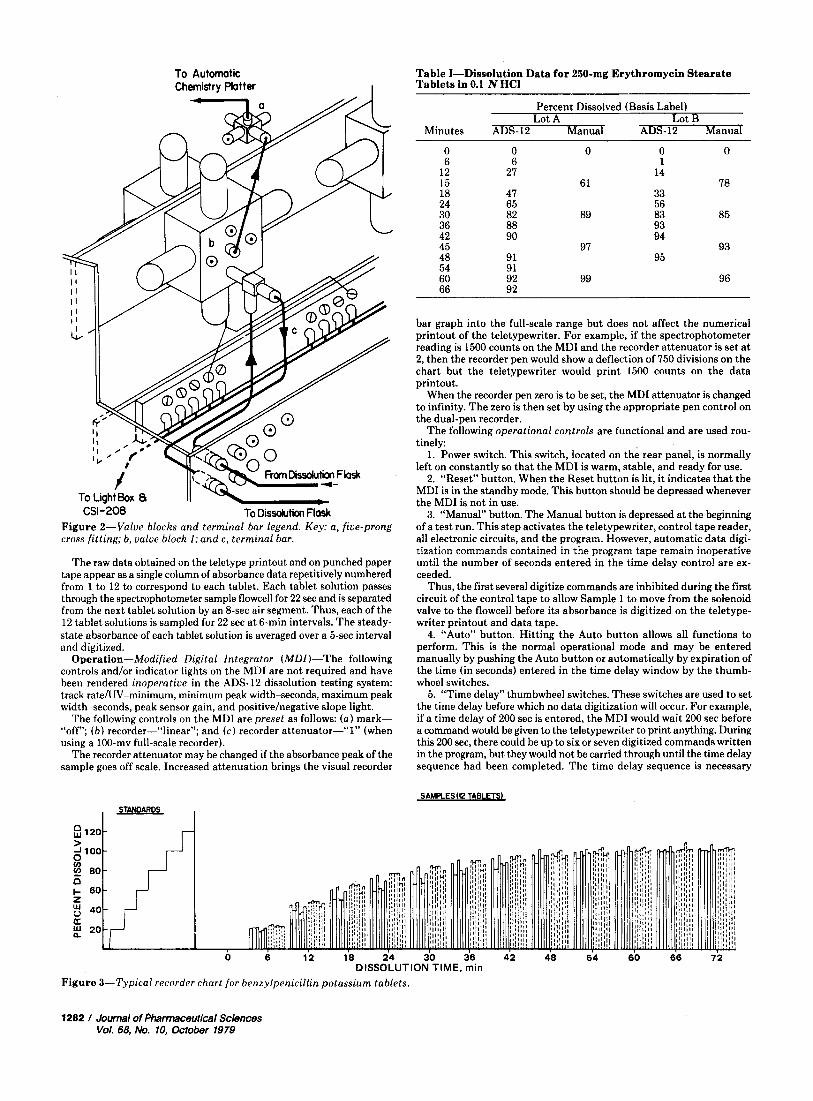
Dual-Pen Recorder7 (f)-Any dual-pen recorder that has 100-mv full-scale deflection may be used. The recorder is connected to the au- tomatic system controller, and each pen provides a bar graph for each of six samples so that a full recorder run has 12 sample bars shown for each sampling period. Thus, pen 1 shows the dissolution profile for the six tablets for lot 1, and pen 2 does the same for lot 2. Usually, different colored pens are used for the two lots. A typical recorder chart showing standards and sample bar graphs is shown in Fig. 3.
Digital Data Acquisition and Controller &)-The data acquisition
6 Technicon Corp., Tarrytown, N.Y. Catalog No. 00-951000-00 Varichrom detector, Varian Instrument Corp.,
Model 412, Pharmacia Fine Chemicals, Piscataway, N.J. Florham Pqrk, N.J.
and control system (DDAC) consists of a modified digital integrator (MDI) (system controller)s and teletypewriterD. The MDI receives the electrical analog absorbance signal from the spectrophotometer and converts it to digital form for input to the teletype while retaining the analog form for the recorder. The system controller receives its instruc- tions from a continuous preprogrammed punched Mylar tape put into the teletype tape reader.
The “master program tape” contains the complete set of instructions for the dissolution test. This tape gives specific instructions to the MDI which, in turn, controls the entire system. The tape is made manually using the teletype tape punch and Mylar “paper” for strength and du- rability. Each linear series of perforations in the tape constitutes a seven-digit numerical command which regulates the operation of a single function or a group of functions and the operation time sequence.
During the dissolution test, the coded program tape, in conjunction with the MDI, controls the proper sequential implementation of the following system operations: sample and air solenoid valve sequence, time from zero for valve operation, digitization of sample peak absorbance, pen activation (either 1 or 2), recorder run (length of time recorder chart will run), sample number advance (SNA), sample number reset (SNR), and time reset. Thus, complete system control versatility is provided with respect to tablet number, sampling interval, recorder dissolution profile depiction, etc., depending on the manner in which the system operations are preprogrammed onto the master control tape.
The teletypewriter gives absorbance data in digital form both on a printout and on punched paper tape. The punched tape is used for cal- culating the dissolution profile of the product via a timeshare computer program.
8 Modified model CSI-208, Columbia Scientific Industries, Austin, l’ex. Model ASR-33.
Jownal of phsrmeceytlcal Sciences 1 1281 Vol. 68, No. 10, October 1979
To Automatic Chemistry Platter I
Table I-Dissolution Data for 250-mg Erythromycin Stearate Tablets in 0.1 N HCl
CSI-208 To Dissolution Flask Figure %-Value blocks and terminal bar legend. Key: a, five-prong cross fitting; b, value block 1; and c, terminal bar.
The raw data obtained on the teletype printout and on punched paper tape appear as a single column of absorbance data repetitively numbered from 1 to 12 to correspond to each tablet. Each tablet solution passes through the spectrophotometer sample flowcell for 22 sec and is separated from the next tablet solution by an 8-sec air segment. Thus, each of the 12 tablet solutions is sampled for 22 sec a t 6-min intervals. The steady- state absorbance of each tablet solution is averaged over a 5-sec interval and digitized.
Operation-Modified Digital Integrator (MDf)--The following controls and/or indicator lights on the MDI are not required and have been rendered inoperative in the ADS-12 dissolution testing system: track rate/UV-minimum, minimum peak width-seconds, maximum peak width-seconds, peak sensor gain, and positive/negative slope light.
The following controls on the MDI are preset as follows: (a) mark- “off”; (b) recorder-“linear”; and (c) recorder attenuator-“1” (when using a 100-mv full-scale recorder).
The recorder attenuator may be changed if the absorbance peak of the sample goes off scale. Increased attenuation brings the visual recorder
Percent Dissolved (Basis Label) - . - - Lot A Lot n
Minutes ADS-12 Manual ADS-12 Manual
18 47 33 24 65 56 30 82 89 83 85 36 88 93 42 90 94 45 97 93 48 91 95 54 91 ~~ ~~
60 92 99 96 66 92
bar graph into the full-scale range but does not affect the numerical printout of the teletypewriter. For example, if the spectrophotometer reading is 1500 counts on the MDI and the recorder attenuator is set at 2, then the recorder pen would show a deflection of 750 divisions on the chart but the teletypewriter would print 1500 counts on the data printout.
When the recorder pen zero is to be set, the MDI attenuator is changed to infinity. The zero is then set by using the appropriate pen control on the dual-pen recorder.
The following operational controls are functional and are used rou- tinely:
1. Power switch. This switch, located on the rear panel, is normally left on constantly so that the MDI is warm, stable, and ready for use.
2. “Reset” button. When the Reset button is lit, it indicates that the MDI is in the standby mode. This button should be depressed whenever the MDI is not in use.
3. “Manual” button. The Manual button is depressed at the beginning of a test run. This step activates the teletypewriter, control tape reader, all electronic circuits, and the program. However, automatic data digi- tization commands contained in the program tape remain inoperative until the number of seconds entered in the time delay control are ex- ceeded.
Thus, the first several digitize commands are inhibited during the first circuit of the control tape to allow Sample 1 to move from the soknoid valve to the flowcell before its absorbance is digitized on the teletype- writer printout and data tape.
4. “Auto” button. Hitting the Auto button allows all functions to perform. This is the normal operational mode and may be entered manually by pushing the Auto button or automatically by expiration of the time (in seconds) entered in the time delay window by the thumb- wheel switches.
5. “Time delay” thumbwheel switches. These switches are used to set the time delay before which no data digitization will occur. For example, if a time delay of 200 sec is entered, the MDI would wait 200 sec before a command would be given to the teletypewriter to print anything. During this 200 sec, there could be up to six or seven digitized commands written in the program, but they would not be carried through until the time delay sequence had been completed. The time delay sequence is necessary
S A M R E S W TABLETS)
I TANDARDS I S
p 1201 rl > 100
80 D g 60
40
20 a
0 6 12 18 24 30 36 42 48 54 60 66 72 DISSOLUTION TIME, min
Figure 3-Typical recorder chart for benzylpenicillin potassium tablets.
1282 1 Journal of Pharmaceutical Sciences Vol. 68, No. 10, October 1979
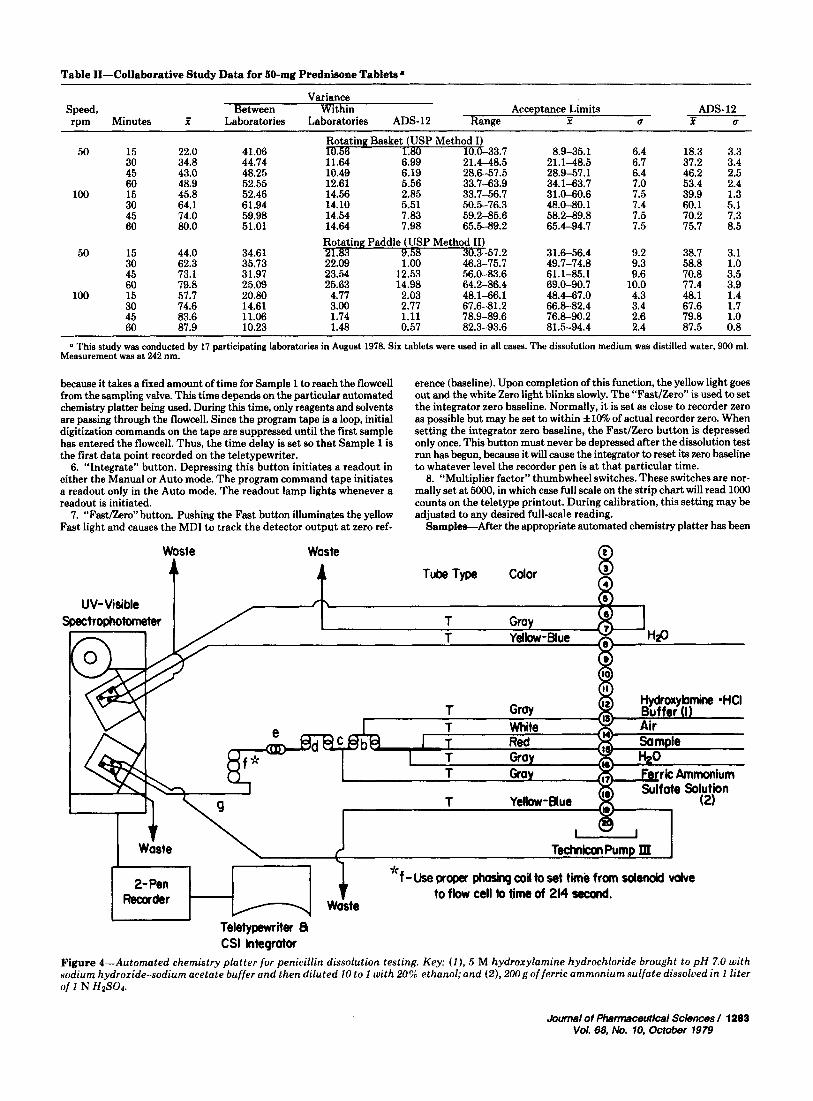
Table 11-Collaborative Study Data for 50-mg Prednisone Tablets a
Variance Speed, rom Minutes f
. ~ _ _ Acceptance Limits ADS-12
X f U Laboratories Laboratories ADS-12 Range U - Between Within
50 15 22.0 30 34.8 45 43.0 60 48.9
100 15 45.8 30 64.1 45 74.0 60 80.0
41.06 44.74
Rotating Basket (USP Method I) 6.4 18.3 3.3 ::::4“ :::: 2 1.4-48.5 21.1-48.5 6.7 37.2 3.4
8.9-35.1 10.633.7
48.25 10.49 6.19 28.6-57.5 28.9-57.1 6.4 46.2 2.5 52.55 12.61 5.56 33.7-63.9 34.1-63.7 7.0 53.4 2.4 ~~.
52.46 6 1.94 59.98
14.56 2.85 33.7-56.7 31.0-60.6 7.5 39.9 1.3 14.10 5.51 50.5-76.3 48.0-80.1 7.4 60.1 5.1 14.54 7.83 59.2-85.6 58.2-89.8 7.5 70.2 7.3
51.01 14.64 7.98 65.5-89.2 65.4-94.7 7.5 75.7 8.5 Rotating Paddle (USP Method 11)
50 15 44.0 34.61 30.3-57.2 31.6-56.4 9.2 38.7 3.1
45 73.1 31.97 23.54 12.53 56.0-83.6 61.1-85.1 9.6 70.8 3.5 60 79.8 25.09 25.63 14.98 64.2-86.4 69.0-90.7 10.0 77.4 3.9
100 15 57.7 20.80 4.77 2.03 48.1-66.1 48.4-67.0 4.3 48.1 1.4
30 62.3 35.73 E2l ::: 46.3-75.7 49.7-74.8 9.3 58.8 1.0
30 74.6 14.61 45 83.6 11.06 60 87.9 10.23
3.00 2.77 67.6-81.2 66.8-82.4 3.4 67.6 1.7 1.74 1.11 78.9-89.6 76.8-90.2 2.6 79.8 1.0 1.48 0.57 82.3-93.6 81.5-94.4 2.4 87.5 0.8
a This study was conducted by 17 participating laboratories in August 1978. Six tablets were used in all cases. The dissolution medium was distilled water, 900 ml. Measurement was at 242 nm.
because it takes a fixed amount of time for Sample 1 to reach the flowcell from the sampling valve. This time depends on the particular automated chemistry platter being used. During this time, only reagents and solvents are passing through the flowcell. Since the program tape is a loop, initial digitization commands on the tape are suppressed until the first sample has entered the flowcell. Thus, the time delay is set so that Sample 1 is the first data point recorded on the teletypewriter.
6. “Integrate” button. Depressing this button initiates a readout in either the Manual or Auto mode. The program command tape initiates a readout only in the Auto mode. The readout lamp lights whenever a readout is initiated.
7. “Fast/Zero” button. Pushing the Fast button illuminates the yellow Fast light and causes the MDI to track the detector output a t zero ref-
erence (baseline). Upon completion of this function, the yellow light goes out and the white Zero light blinks slowly. The “Fast/Zero” is used to set the integrator zero baseline. Normally, it is set as close to recorder zero as possible but may be set to within f10% of actual recorder zero. When setting the integrator zero baseline, the Fast/Zero button is depressed only once. This button must never be depressed after the dissolution test run has begun, because it will cause the integrator to reset its zero baseline to whatever level the recorder pen is at that particular time.
8. “Multiplier factor” thumbwheel switches. These switches are nor- mally set at 5000, in which case full scale on the strip chart will read lo00 counts on the teletype printout. During calibration, this setting may be adjusted to any desired full-scale reading.
Samples-After the appropriate automated chemistry platter has been
\ I I x f - use wooer phasing coil to set time from tdenoid d v e I & ! 1-u Waste t to flow cell to time of 214 second.
Teletypewriter L1 CSI Integrator
Figure 4-Automated chemistry platter for penicillin dissolution testing. Key: ( 1 ), 5 M hydroxylamine hydrochloride brought to pH 7.0 with sodium hydroxide-sodium acetate buffer and then diluted 10 to 1 with 20% ethanol; and (2), 200g of ferric ammonium sulfate dissolved in I liter of I N H z S 0 4 .
Journal of phermaceutical Sciences I 1283 Vol. 68. No. 10, October 1979
AUTWTED DISSOLUTION TEST .000 16.000 30.000 h5.000 60.000 76.000 + . . . . . + . . . . . + . . . . . + . .... + ..... + 110.000+ PROOUCT: 50oK: CT PENTIDS DATE TESTEO:1/12/77
CODE: PLATTER C-1 ANALYST: PJC LOT m e n : LOT-1
S0LVENT:DISTILLEO UATER VOLVIIE: 1 0 m . F-0 UL/nINUTE BASKET ROTATION RATE:lOORPU 1-37 0EG.C
PERCENT DISSOLVED (CORRECTED IU SINK CONDITIONS) (BASIS-lABEL)
T I E TABLET NUWBER
WIN) 1 2 3 4 5 6 HIN Iuy AVC
0 .6 6 22.9 12 47.2 18 63.2 24 15.3 30 83.9 36 92.6 &2 97.3 48 101.4 54 103.9 60 105.1 66 106.9 12 108.4
DT(50).13.1 OI(85)-30.8
.I .8 .6 .l 22.6 23.3 18.8 20.5 40.1 50.2 37.9 39.5 52.9 66.5 52.2 52.1 62.2 19.2 64.1 62.3 69.6 88.4 16.5 71.5 80.0 95.9 85.8 81.1 86.4 101.9 91.5 89.3 91.1 106.0 96.1 99.9 96.5 104.2 99.7 106.1
100.5 106.0 103.9 110.5 104.1 106.1 104.3 110.3 106.3 107.1 105.9 113.9
16.6 12.0 17.1 11.0 40.7 21.8 35.5 38.9
AUTWTED DISSOLUTION TEST
. 7 .6 .8 .7 22.3 18.4 23.3 21.7 45.4 37.9 50.2 43.5 61.5 52.1 66.5 58.1 73.4 62.2 79.2 69.5 82.2 69.6 88.4 78.7 81.5 80.0 95.9 87.2 92.9 86.4 101.9 93.2 98.7 91.7 106.0 99.1 102.8 96.5 106.7 102.3 104.7 100.5 110.5 105.1 104.0 104.0 110.3 106.0 101.0 105.9 113.9 108.1
ACROSS wyw AVC. E. -
13.1 14.9 5.1 14.7NInutm 33.2 34.5 23.8 34.4nInutr.
-
PROOUCT:500m; CT PENTIDS C0DE:PUTTER C-1 LOT NU~BER:LM-Z
DATE TESTED:1/12/77 ANALYST: FJC
CONTROL:5C545(2)
S0LVENT:DISTILLED WATER voLVIIE:looowL. F-0 WL/UINUTE BASKET ROTATION IUTE:lOORPH 1-37 0EC.C
PERCENT OISSOLVED(C0RRECTED TO SINK CONDITIONS) (BAS I S-UBEL) .....................................................
Tim? TABLET NIJUUER - WIN) 1 2 3 4 5 6 HIN IvJ( AVG
0 . 7 .6 .6 .5 .l .l .5 .7 .6 6 12 18 24 30 M 42 48 54 60 66 72
.. 24.8 25.6 23.5 24.7 24.0 23.9 23.5 25.6 24.4 49.9 52.2 50.2 51.4 b4.7 49.2 44.1 52.2 49.6 61.9 69.6 68.7 69.2 59.1 66.9 59.7 69.6 67.0 81.6 81.3 80.5 82.1 69.9 17.1 69.9 82.1 78.1 91.0 89.1 89.0 89.9 71.1 84.5 77.7 91.0 86.9 94.9 92.8 94.7 95.2 83.9 90.5 83.9 95.2 92.0
100.0 97.7 101.6 100.3 91.5 95.5 91.5 101.6 97.8 102.2 99.1 103.7 106.1 96.7 100.3 96.7 106.7 101.5 104.5 102.5 107.2 108.5 100.0 103.1 100.0 108.5 104.3 105.8 104.8 107.1 109.3 1W.6 105.7 104.6 109.3 106.2 106.6 106.9 107.9 115.7 107.4 107.5 106.6 115.7 108.6 108.8 106.0 109.3 111.1 110.4 110.4 106.0 111.1 109.0
ACROSS DCW AVG. z.
~ ( 5 0 ) . 12.0 11.5 12.0 11.7 15.1 12.3 12.3 a9 12.=ut*. ~(85)- 26.3 26.8 27.2 26.2 36.9 30.5 29.0 17.5 ~8*611inuros
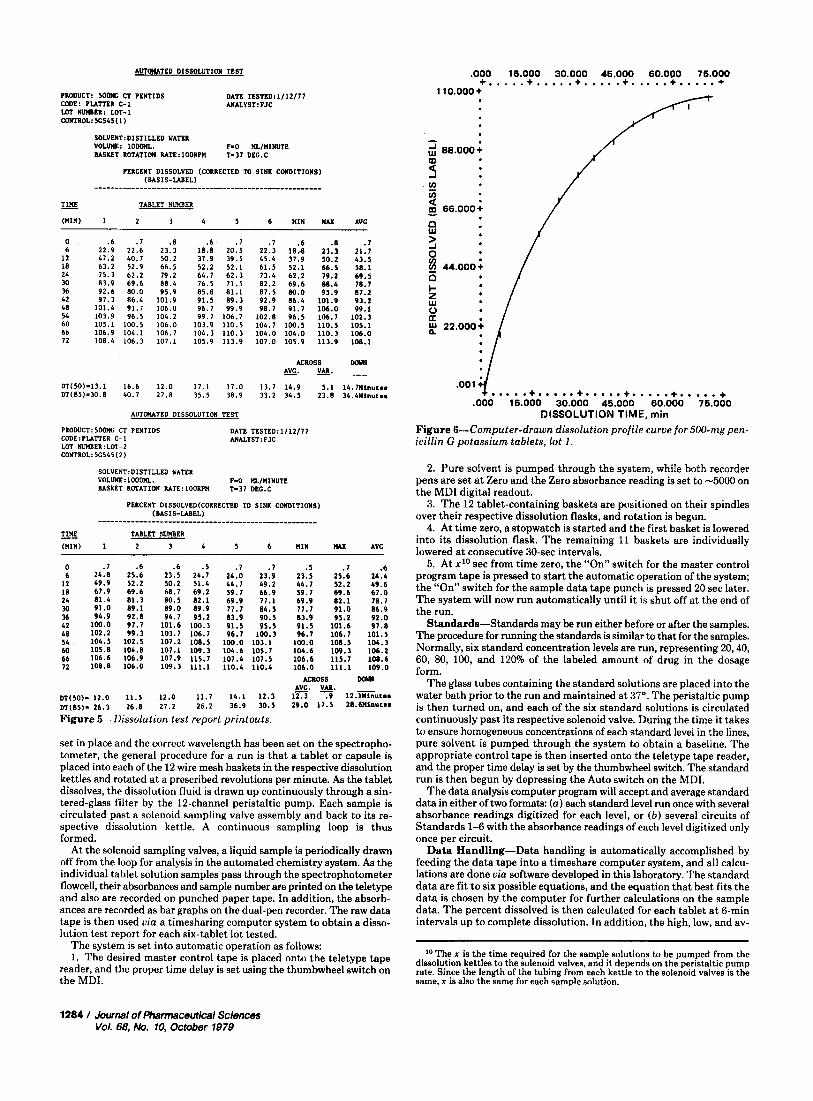
Figure 5-Dissolution test report printouts.
set in place and the correct wavelength has been set on the spectropho- tometer, the general procedure for a run is that a tablet or capsule is placed into each of the 12 wire mesh baskets in the respective dissolution kettles and rotated at a prescribed revolutions per minute. As the tablet dissolves, the dissolution fluid is drawn up continuously through a sin- tered-glass filter by the 12-channel peristaltic pump. Each sample is circulated past a solenoid sampling valve assembly and back to its re- spective dissolution kettle. A continuous sampling loop is thus formed.
At the solenoid sampling valves, a liquid sample is periodically drawn off from the loop for analysis in the automated chemistry system. As the individual tablet solution samples pass through the spectrophotometer flowcell, their absorbances and sample number are printed on the teletype and also are recorded on punched paper tape. In addition, the absorb- ances are recorded as bar graphs on the dual-pen recorder. The raw data tape is then used uia a timesharing computer system to obtain a disso- lution test report for each six-tablet lot tested.
The system is set into automatic operation as follows: 1. The desired master control tape is placed onto the teletype tape
reader, and the proper time delay is set using the thumbwheel switch on the MDI.
L ‘ i
1 .001 ..... + ..... + ..... + ..... + ..... +
.000 15.000 30.000 45.000 60.000 75.000 DISSOLUTION TIME, min
Figure 6-Computer-drawn dissolution profile curve for 500-mg pen- icillin G potassium tablets, lot 1 .
2. Pure solvent is pumped through the system, while both recorder pens are set at Zero and the Zero absorbance reading is set to -5000 on the MDI digital readout.
3 . The 12 tablet-containing baskets are positioned on their spindles over their respective dissolution flasks, and rotation is begun.
4. At time zero, a stopwatch is started and the first basket is lowered into its dissolution flask. The remaining 11 baskets are individually lowered at consecutive 30-sec intervals.
6. At x10 sec from time zero, the “On” switch for the master control program tape is pressed to start the automatic operation of the system; the “On” switch for the sample data tape punch is pressed 20 sec later. The system will now run automatically until i t is shut off a t the end of the run.
Standards-Standards may be run either before or after the samples. The procedure for running the standards is similar to that for the samples. Normally, six standard concentration levels are run, representing 20,40, 60, 80, 100, and 120% of the labeled amount of drug in the dosage form.
The glass tubes containing the standard solutions are placed into the water bath prior to the run and maintained at 37”. The peristaltic pump is then turned on, and each of the six standard solutions is circulated continuously past its respective solenoid valve. During the time it takes to ensure homogeneous concentrations of each standard level in the lines, pure solvent is pumped through the system to obtain a baseline. The appropriate control tape is then inserted onto the teletype tape reader, and the proper time delay is set by the thumbwheel switch. The standard run is then begun by depressing the Auto switch on the MDI.
The data analysis computer program will accept and average standard data in either of two formats: (a ) each standard level run once with several absorbance readings digitized for each level, or ( b ) several circuits of Standards 1-6 with the absorbance readings of each level digitized only once per circuit.
Data Handling-Data handling is automatically accomplished by feeding the data tape into a timeshare computer system, and all calcu- lations are done uia software developed in this laboratory. The standard data are fit t o six possible equations, and the equation that best fits the data is chosen by the computer for further calculations on the sample data. The percent dissolved is then calculated for each tablet a t 6-min intervals up to complete dissolution. In addition, the high, low, and av-
10 The x is the time required for the sample solutions to be pumped from the dissolution kettles to the solenoid valves, and it depends on the peristaltic pump rate. Since the length of the tubing from each kettle to the solenoid valves is the same, x is also the same for each sample solution.
1284 I Journal of Pharmaceutical Sciences Vol. 68, No. 10, October 7979
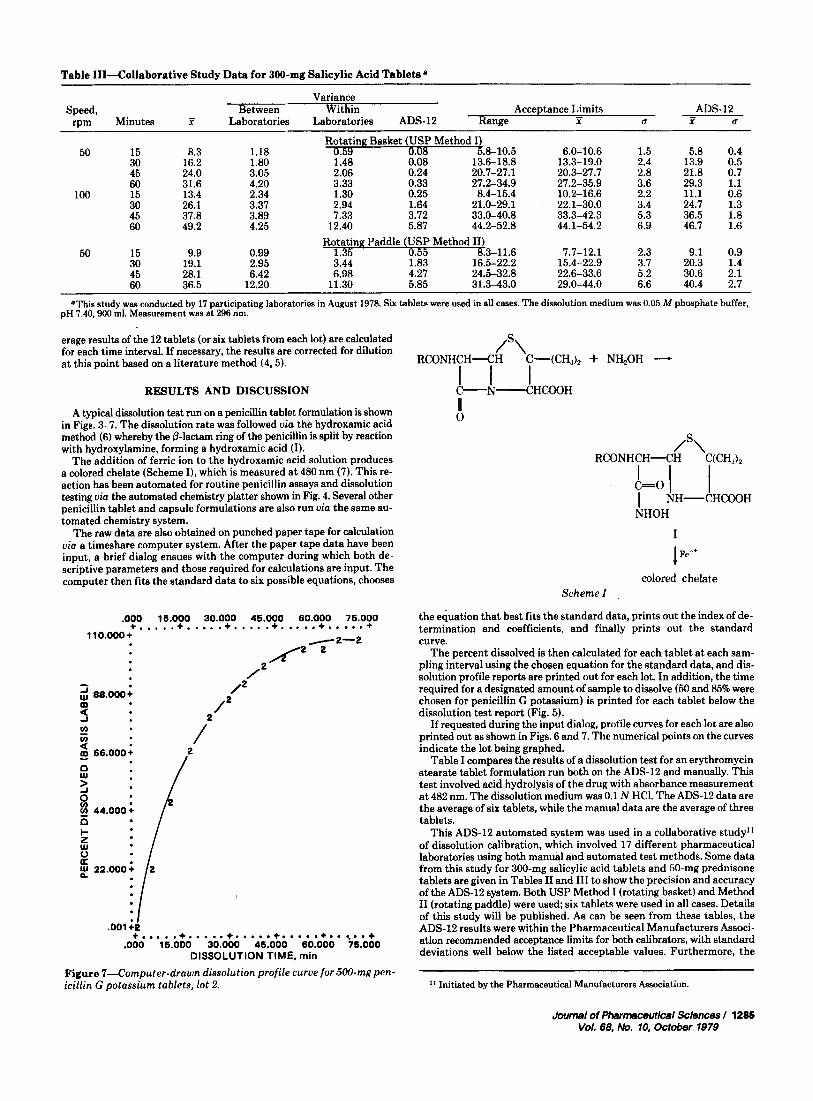
Table 111-Collaborative Study Data for 300-mg Salicylic Acid Tablets
Variance ADS-12 - Between Within Acceptance Limits
rDm Minutes X Laboratories Laboratories ADS-12 Range f U X U - Speed,
Rotating Basket (USP Method I) 50 15 8.3 1.18 0.59 0.08 5.8-10.5 6.0-10.6 1.5 5.8 0.4
30 16.2 1.80 1.48 0.08 13.6-18.8 2.4 13.9 0.5 45 24.0 3.05 2.06 0.24 20.7-27.1 20.3-27.7 2.8 21.8 0.7 60 31.6 4.20 3.33 0.33 27.2-34.9 27.2-35.9 3.6 29.3 1.1
1 0 0 1.5 13.4 2.34 1.30 0.25 8.4-15.4 10.2-16.6 2.2 11.1 0.6
13.3-19.0
_ _ . . - _. _-- -- 30 26.1 3.37 2.94 1.64 21.0-29.1 22.1-30.0 3.4 24.7 1.3 45 37.8 3.89 7.33 3.72 33.0-40.8 33.3-42.3 5.3 36.5 1.8 60 49.2 4.25 12.40 5.87 44.2-52.8 44.1-54.2 6.9 46.7 1.6
Rotating Paddle (USP Method 111 50 15 9.9 0.99 1.35 8.3-11.6 7.7-12.1 2.3 9.1 0.9
30 19.1 2.95 3.44 2: 16.5-22.2 15.4-22.9 3.7 20.3 1.4 45 28.1 6.42 6.98 4.27 24.5-32.8 22.6-33.6 5.2 30.6 2.1 60 36.5 12.20 11.30 5.85 31.3-43.0 29.0-44.0 6.6 40.4 2.7
~ ~ ~~
'This study was conducted by 17 participating laboratories in August 1978. Six tablets were used in all cases. The dissolution medium was 0.05 M phosphate buffer, pH 7.40.900 ml. Measurement was at 296 nm.
erage results of the 12 tablets (or six tablets from each lot) are calculated for each time interval. If necessary, the results are corrected for dilution at this point based on a literature method (4.5).
RESULTS AND DISCUSSION
A typical dissolution test run on a penicillin tablet formulation is shown in Figs. 3-7. The dissolution rate was followed uia the hydroxamic acid method (6) whereby the @-lactam ring of the penicillin is split by reaction with hydroxylamine, forming a hydroxamic acid (I).
The addition of ferric ion to the hydroxamic acid solution produces a colored chelate (Scheme I), which is measured at 480 nm (7). This re- action has been automated for routine penicillin assays and dissolution testing uia the automated chemistry platter shown in Fig. 4. Several other penicillin tablet and capsule formulations are also run uia the same au- tomated chemistry system.
The raw data are also obtained on punched paper tape for calculation uia a timeshare computer system. After the paper tape data have been input, a brief dialog ensues with the computer during which both de- scriptive parameters and those required for calculations are input. The computer then fits the standard data to six possible equations, chooses
.OOO 16.000 30.000 45.000 60.000 75.000 + . . . . .+ .... .+. ... .+. .... +.. ...+ 1 10.000 +
L * I 2 y u1 0 K g 22.000; ' /
.001 ;o + ..... + ..... + ..... + ..... + ...*.. + D O 0 15.000 30.000 46.000 60.000 75.000
DISSOLUTION TIME, min
Figure 7-Computer-drawn dissolution profile curue for 500-mgpen- icillin G potassium tablets, lot 2.
P\ R C O N H C H 4 H C-(CH& + NHPOH 4
I I I ~--~-~HcooH II 0
P\ RCONHCH-CH CCH,),
c=o( I I I NH-CHCOOH NHOH
I
colored chelate Scheme I ,
the equation that best fits the standard data, prints out the index of de- termination and coefficients, and finally prints out the standard curve.
The percent dissolved is then calculated for each tablet a t each sam- pling interval using the chosen equation for the standard data, and dis- solution profile reports are printed out for each lot. In addition, the time required for a designated amount of sample to dissolve (50 and 85% were chosen for penicillin G potassium) is printed for each tablet below the dissolution test report (Fig. 5).
If requested during the input dialog, profile curves for each lot are also printed out as shown in Figs. 6 and 7. The numerical points on the curves indicate the lot being graphed.
Table I compares the results of a dissolution test for an erythromycin stearate tablet formulation run both on the ADS-12 and manually. This test involved acid hydrolysis of the drug with absorbance measurement a t 482 nm. The dissolution medium was 0.1 N HCI. The ADS-12 data are the average of six tablets, while the manual data are the average of three tablets.
This ADS-12 automated system was used in a collaborative study1* of dissolution calibration, which involved 17 different pharmaceutical laboratories using both manual and automated test methods. Some data from this study for 300-mg salicylic acid tablets and 50-mg prednisone tablets are given in Tables I1 and I11 to show the precision and accuracy of the ADS-12 system. Both USP Method I (rotating basket) and Method I1 (rotating paddle) were used six tablets were used in all cases. Details of this study will be published. As can be seen from these tables, the ADS-12 results were within the Pharmaceutical Manufacturers Associ- ation recommended acceptance limits for both calibrators, with standard deviations well below the listed acceptable values. Furthermore, the
11 Initiated by the Pharmaceutical Manufacturers Association.
Journal of pharmaceutical Sciences I 1285 Vol. 88, No. 10, October 1979
within-laboratory variance for the ADS-12 data was significantly lower than the average for the 17 participating laboratories.
CONCLUSION The described computerized automated dissolution testing system
conforms to the basic requirements of the USP dissolution test. The system, which can be adapted to almost any type of tablet agitation technique, can test 12 solid dosage forms simultaneously under either sink or nonsink conditions and can test products requiring any type of chemistry amenable to an automatic analyzer. Total run time is reduced essentially to sample dissolution time since sampling and analysis are performed simultaneously with sample dissolution. A complete disso- lution profile report, with or without graphs, is obtained within minutes after the required sample dissolution time.
REFERENCES
(1) R. A. Castello, G. Jellinek, J. Konieczny. K. C. Kwan, and R. 0.
(2) A. Ferrari and A. Khoury, Ann. N.Y. Acad. Sci., 153, 660
(3) W. F. Beyer and E. W. Smith, J . Pharm. Sci., 60,1556 (1971). (4) F. J. Cioffi, H. M. Abdou, and A. T. Warren, ibid., 65, 1234
(5) A. Richter, B. Myhre, and S. C. Khanna, J. Pharm. Pharrnacol.,
(6) T. Higuchi and E. Rrochmann-Hanssen, “Pharmaceutical Anal-
(7) G. Boxer and P. Everett, Anal. Chem., 21,670 (1949).
Toberman, J. Pharm. Sci., 57,485 (1968).
(1968).
‘(1976).
21,409 (1969).
ysis,’’ Interscience, New York, N.Y., 1961.
Use of Rabbits for GI Drug Absorption Studies: Relationship between Dissolution Rate and Bioavailability of Griseofulvin Tablets
TADAO MAEDA x, HIROSHI TAKENAKA, YOSHIYA YAMAHIRA, and TAKESHI NOGUCHI Received October 30,1978, from the Formulation Research Department, Pharmaceuticals Diuision, Surnitomo Chemical Co., Ltd., Kurakakiuchi 1-3-45, Ibaraki-City, Osaka 567, Japan. Accepted for publication April 17,1979.
Abstract The correlation between the dissolution rate and bioavail- ability of griseofulvin tablets was studied in stomach-emptying-controlled rabbits and in humans. Three different test tablets, each consisting of two dose levels (62.5 or 125 mg) of griseofulvin, were used. The dissolution rates in 0.5 hr were -75,40, and 12%. With oral administration at 62.5 mghabbit, the ratio of peak plasma level, C,,,, was 1.00:0.660.40 and that of the area under the curve (AUC) was 1.00:0.730.46 for the three tablets. The corresponding CL- ratio was 1.00:0.740.34 and the AUC ratio was 1.000.720.33 in humans at the dose level of 500 mg. A good correlation was observed for the rank order of C,, and AUC between rabbits and humans, but such a correlation was not seen between in uiuo data and in uitro data at a larger dose of 125 mghabbit. This finding was attributable to the dose, which exceeded the GI drug dissolution or ab- sorption capacities. These results suggest that the stomach-emptying- controlled rabbit is useful for evaluating oral dosage forms for human use and that dose level selection is important in the bioavailability study of a barely water-soluble drug.
Keyphrases 0 Models, animals-rabbits, use in GI drug absorption studies, griseofulvin tablet dissolution rate and bioavailability, compared to humans 0 Griseofulvin-dissolution rate and bioavailability, rabbits compared to humans 0 GI t r a c t d r u g absorption, griseofulvin, rabbits compared to humans Antifungal agents-griseofulvin, diesolution rate and bioavailability, rabbits compared to humans
Use of human subjects in bioavailability studies for dosage forms provides the most appropriate results; but in new drug development and preformulation studies, such use presents economic, ethical, analytical, and statistical difficulties.
The availability of adequate animal models has been desired for estimating the bioavailability of dosage forms in humans. The beagle dog has been used as a model ani- mal in some studies (1-3). Although rabbits are easy to breed, have a mild temper, and are a low-cost laboratory animal, they have not been considered useful for drug absorption studies because of the difficulty in obtaining an empty stomach (4). However, control of the stomach emptying rate increased the usefulness of rabbits in GI
drug absorption studies and produced a good correlation in GI drug absorption between rabbits and humans (5). Since the earlier work was performed on powdered drugs using griseofulvin, indomethacin, and nalidixic acid, fur- ther investigation on oral dosage forms was desired. This paper describes the usefulness of rabbits in dosage form bioavailability studies.
While the dissolution test has been widely used as an in uitro test for solid dosage forms, efforts have been made to obtain good correlations between in uitro data and in uiuo data (6-8). In this study, three groups of griseofulvin tablets were prepared using three grades of polyvinyl al- cohol as binders for granulation so that the dissolution rate of each group was different. With these tablets, bioavail- ability tests were performed in stomach-emptying-con- trolled rabbits, and the correlation between in uitro dis- solution tendency and in uiuo absorption characteristics was examined. Bioavailability studies were also conducted in humans, and the suitability of the stomach-emptying- controlled rabbit as an animal model for dosage form evaluation was reviewed.
EXPERIMENTAL
Materials-Griseofulvin USP was micronized to <5 pm using a fluid energy mill. The granule was prepared by the conventional wet granu- lation method. The granule contained, by weight, 83.3 parts of micronized griseofulvin, 6.7 parts of calcium carboxymethylcellulose JP, 8.0 parts of lactose USP, and 1.5 parts of polyvinyl alcohol as the binder.
To control drug release from the tablet, three grades of polyvinyl al- cohol’, prepared by partial or full saponification of polyvinyl acetate, were used as the binders for granulation: grade L for Formula L, grade H for Formula N, and grades M and H (21) for Formula M (Table I). After 99.5 parta of the granules was mixed with 0.5 part of magnesium stearate USP
1 Gohsenol, Nippon Gohsei Kagaku Kogyo Co., Tokyo, Japan.
1286 f Journal of Pharmaceutical Sciences Vol. 68, No. 10, October 1979
0022-3549f 791 1000- 1286$01.00f 0 @ 1979. American pharmaceutical Association