Embed Size (px)
Citation preview
www.ijcrt.org © 2021 IJCRT | Volume 9, Issue 8 August 2021 | ISSN: 2320-2882
IJCRT2108283 International Journal of Creative Research Thoughts (IJCRT) www.ijcrt.org c613
ADOPTION OF INNOVATIONS IN
IRRIGATION SYSTEM IN AZAMGARH
DISTRICT (Sample Study)
Dr. Shweta Srivatava, Assistant Professor,
PRSU, Prayagraj
“IrrIgatIon Is everythIng In IndIa; water Is more valuable than land, because,
when water is applied to land it increases its productiveness at least six fold
and renders great extents of land productive, which otherwise would produce
nothing or next to nothIng.”
- Sir Charles Trevelyan
Abstract:
“Irrigation in an agrarian economy assumes the same importance as blood in human body. It has played a
vital role continuously in this process of agricultural development. It is most important input required for
successful farming. Agricultural development and adoption of modern technology are possible only by the
provision of adequate irrigation facilities. Better results from HYVs depend largely on assured and
controlled irrigation as they require water at specific period of growth, development and flowering (Husain
and Reddy 1996). Thus, the success of agriculture depends mainly on irrigation which works as a mother
factor in the improvement of land use mechanics, cropping intensity and patterns and cropped-land
productivity (Banerjee 1986). The ‘New Agriculture Strategy’ has also given importance to the
development of modern irrigation system, which is major determinant in the adoption of HYVs and
resultant agricultural productivity. Thus, it is clear that the crop productivity as well as satisfactory
performance of other inputs like fertilizers, insecticides and pesticides largely depends on appropriate
timing of irrigation and quantity of water supplied to crops. This paper is based on primary data analysis,
and here an attempt has been made to find out the adoption pattern of irrigation innovations in time and
space frame. For this Logistic curves have been drawn to assess the adoption pattern of irrigation
innovations in the study area. Hagerstrand’s Monte Carlo Simulation Technique has also been employed to
assess the process of adoption.”
www.ijcrt.org © 2021 IJCRT | Volume 9, Issue 8 August 2021 | ISSN: 2320-2882
IJCRT2108283 International Journal of Creative Research Thoughts (IJCRT) www.ijcrt.org c614
Keywords: Irrigation, Agricultural Development, Adoption of Modern Technology, Hagerstrand’s Monte
Carlo Simulation Technique.
The term ‘IRRIGATION’ includes all operations or practices in the artificial supply of water to the
land for growing crops. It is a means by which water is passed on to dry areas from rivers, canals, or wells
to increase the fertility of the land. It is the science of harnessing and controlling water resources for the
benefit of agriculture. Scientific irrigation involves the knowledge of available water supply, its
conservation and application to the land, the characteristics and needs of the different types of soil, and the
requirements of the various crops to be produced. For the growth of plants, water must be available in the
appropriate quantities and at the right time, depending on the species of plant and climatic conditions.
Crops like sugarcane and rice need larger quantities than wheat and other cereals (Rao, 1979).
Irrigation (artificial application of water to crops), is an old art in India. It began with agriculture
itself. References to the practice of irrigation in India have been traced to many centuries prior to the
commencement of the Christian era (Prasad, 2009). In India, nothing moves unless agriculture moves, and
no input for agriculture is more important than water. Water is a basic input. Agricultural output and its
efficiency, to a great extent, depend upon inputs applied and the methods adopted. However, the recent
attempts for modernization in the field of agriculture in many areas have been largely restrained due to the
non-availability of adequate water.
In this paper, an attempt has been made to identify the impact of these factors on the adoption of
new farm practices and resultant disparities in the Azamgarh district.
Study Area
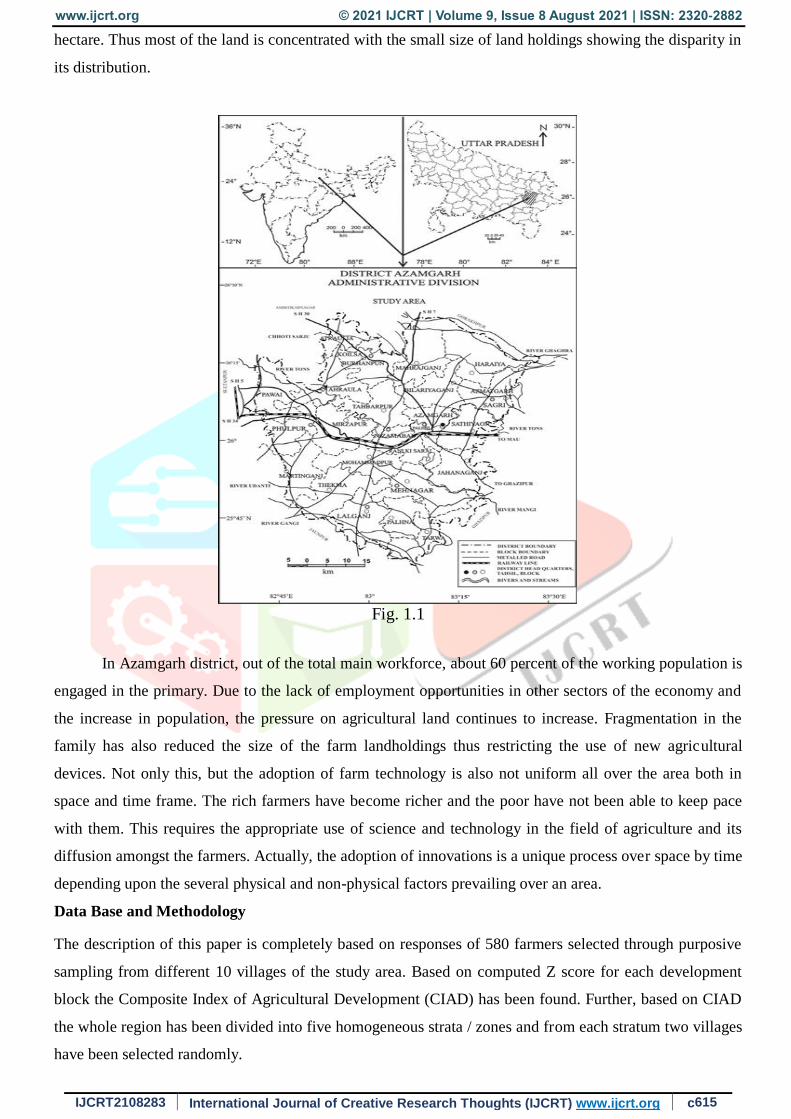
The Azamgarh district is located in the eastern part of Uttar Pradesh, lying between 25º40´ N and 26º27´ N
latitudes and 82º40´ E and 83º32´ E longitudes occupying an area of 4054 sq. km. (fig 1.1) with a total
population of 46,12,134 persons. The average density of the study area is 1138 persons per sq. km. (2011).
The district is bounded north by Gorakhpur, Sant Kabir Nagar, and Ambedkar Nagar districts, west by
Sultanpur and Jaunpur and Ghazipur district, and on the east by Mau district. Administratively, the district
is divided into eight tehsils and twenty-two community development blocks.
The district slops very gentle towards the southeast. The district is a part of the
Indo-Gangetic plain and formed of alluvium of the Quaternary age. The average annual rainfall is 901mm.
with an average temperature of 24ºC. The district has good transportation facilities. It is well connected by
north-eastern railways, state highways, and other roads. Agriculture and its allied activities are the main
sources of livelihood to the majority of the people in the district. The district’s physical environment is
very suitable for agriculture. Crops like rice, wheat, sugarcane, pulses, vegetables, etc. are grown on a large
scale. Good irrigation facility is provided by canals of the Ghaghara irrigation system. Farm size and its
ownerships determine the use of new farm inputs but expensive technologies are not affordable by the
majority of poor farmers. In the study area, the average size of land holdings was 0.55 hectare in 2011.
There are more than 606570 operational holdings in the district, out of which about 85% have less than one
www.ijcrt.org © 2021 IJCRT | Volume 9, Issue 8 August 2021 | ISSN: 2320-2882
IJCRT2108283 International Journal of Creative Research Thoughts (IJCRT) www.ijcrt.org c615
hectare. Thus most of the land is concentrated with the small size of land holdings showing the disparity in
its distribution.
Fig. 1.1
In Azamgarh district, out of the total main workforce, about 60 percent of the working population is
engaged in the primary. Due to the lack of employment opportunities in other sectors of the economy and
the increase in population, the pressure on agricultural land continues to increase. Fragmentation in the
family has also reduced the size of the farm landholdings thus restricting the use of new agricultural
devices. Not only this, but the adoption of farm technology is also not uniform all over the area both in
space and time frame. The rich farmers have become richer and the poor have not been able to keep pace
with them. This requires the appropriate use of science and technology in the field of agriculture and its
diffusion amongst the farmers. Actually, the adoption of innovations is a unique process over space by time
depending upon the several physical and non-physical factors prevailing over an area.
Data Base and Methodology
The description of this paper is completely based on responses of 580 farmers selected through purposive
sampling from different 10 villages of the study area. Based on computed Z score for each development
block the Composite Index of Agricultural Development (CIAD) has been found. Further, based on CIAD
the whole region has been divided into five homogeneous strata / zones and from each stratum two villages
have been selected randomly.
www.ijcrt.org © 2021 IJCRT | Volume 9, Issue 8 August 2021 | ISSN: 2320-2882
IJCRT2108283 International Journal of Creative Research Thoughts (IJCRT) www.ijcrt.org c616
It is known fact that several agricultural innovations have been introduced in the region till date, but only
some important innovations related to irrigation have been taken into consideration to achieve the
objectives. Relevant informations have been collected from three important factors as institutional,
technological and socio-economic. The field work was carried out in 2011-12 in both the agricultural
seasons to obtain primary data personally through interviewing farmers. Simple scoring technique was used
to measure the adoption of selected innovation. Logistic curves have also been drawn to assess the
adoption pattern of irrigation innovations in the present paper. Hagerstrand’s Monte Carlo Simulation
Technique has been employed to assess the process of adoption.
Besides above, the secondary data have been collected from published/unpublished records of
government/semi-government/non-government organizations/institutions/offices of the state, district,
Tehsil and Block levels.
Sample Study
For the sample study, ten villages altogether from all the development zones were selected to find
out the pattern of adoption of various means of irrigation. Since pump-sets are the major source of
irrigation in the study area, therefore the emphasis was laid on the detailed study of this device in practice.
Firstly, using the purposive sampling method 580 respondents were selected from all the villages those
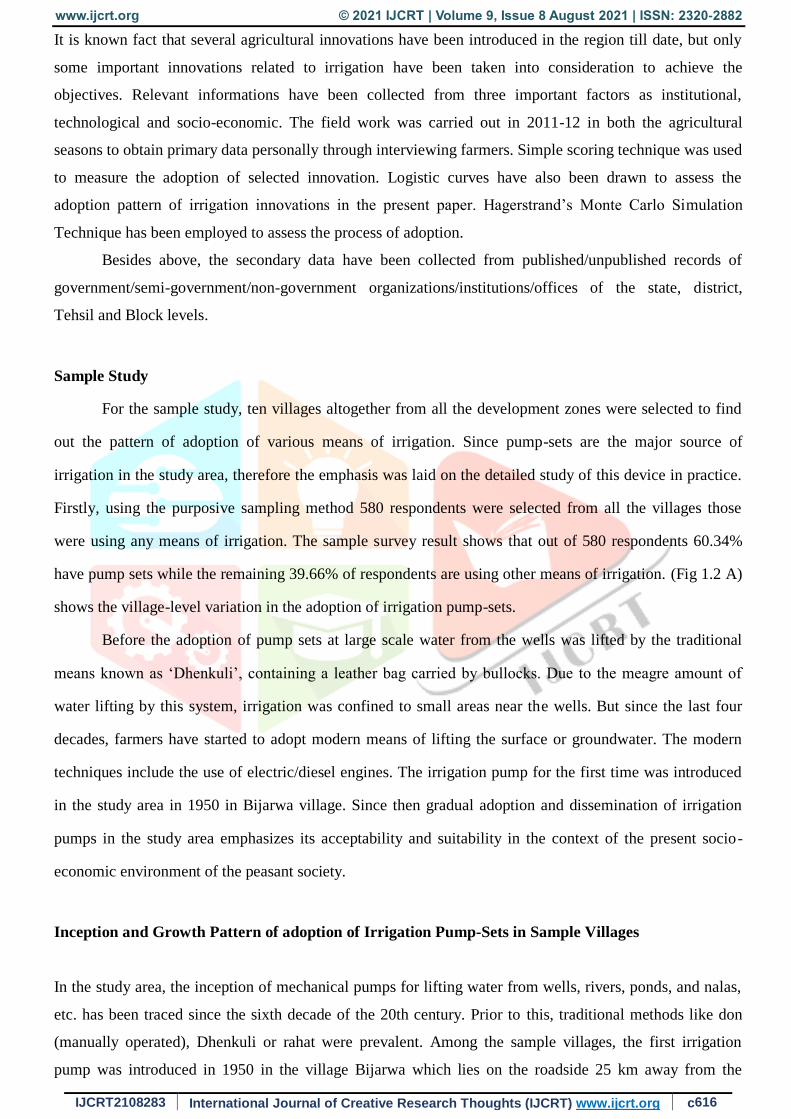
were using any means of irrigation. The sample survey result shows that out of 580 respondents 60.34%
have pump sets while the remaining 39.66% of respondents are using other means of irrigation. (Fig 1.2 A)
shows the village-level variation in the adoption of irrigation pump-sets.
Before the adoption of pump sets at large scale water from the wells was lifted by the traditional
means known as ‘Dhenkuli’, containing a leather bag carried by bullocks. Due to the meagre amount of
water lifting by this system, irrigation was confined to small areas near the wells. But since the last four
decades, farmers have started to adopt modern means of lifting the surface or groundwater. The modern
techniques include the use of electric/diesel engines. The irrigation pump for the first time was introduced
in the study area in 1950 in Bijarwa village. Since then gradual adoption and dissemination of irrigation
pumps in the study area emphasizes its acceptability and suitability in the context of the present socio-
economic environment of the peasant society.
Inception and Growth Pattern of adoption of Irrigation Pump-Sets in Sample Villages
In the study area, the inception of mechanical pumps for lifting water from wells, rivers, ponds, and nalas,
etc. has been traced since the sixth decade of the 20th century. Prior to this, traditional methods like don
(manually operated), Dhenkuli or rahat were prevalent. Among the sample villages, the first irrigation
pump was introduced in 1950 in the village Bijarwa which lies on the roadside 25 km away from the
www.ijcrt.org © 2021 IJCRT | Volume 9, Issue 8 August 2021 | ISSN: 2320-2882
IJCRT2108283 International Journal of Creative Research Thoughts (IJCRT) www.ijcrt.org c617
district headquarter. This was apparently because of its nearness to Azamgarh city. The second irrigation
pump was adopted in 1965 and till then this number increased to six. Onwards to this significant year
adoption of modern irrigation pumps in the study area was continuous but slow. By the year 1985,
altogether110 irrigation pumps were in the operational stage in ten sample villages with an average
adoption of 6 irrigation pumps per year (counted from 1965). But the average adoption rate increased after
1985 and by the end of the year 2010, it reached 10 pumps per year (table 1.1). The faster adoption of
irrigation pumps onwards 1986 may be attributed to the severe drought observed in 1979-80. Most of the
distributaries of canals remained dry during this period due to scanty rainfall causing the lowering of water
level in most of the rivers of the source region The farmers were motivated to seek alternative sources of
irrigation and the Government also supported this alternative search through loans and subsidies under
various rural development programmes.
Adoption Curve
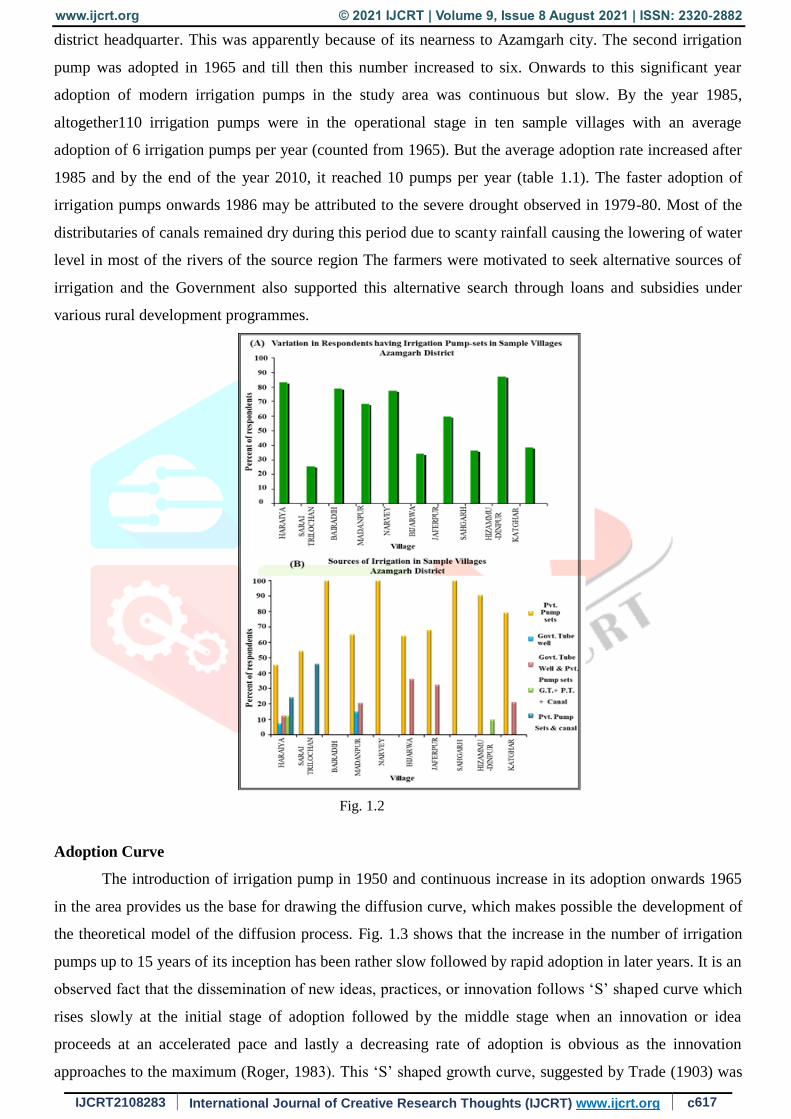
The introduction of irrigation pump in 1950 and continuous increase in its adoption onwards 1965
in the area provides us the base for drawing the diffusion curve, which makes possible the development of
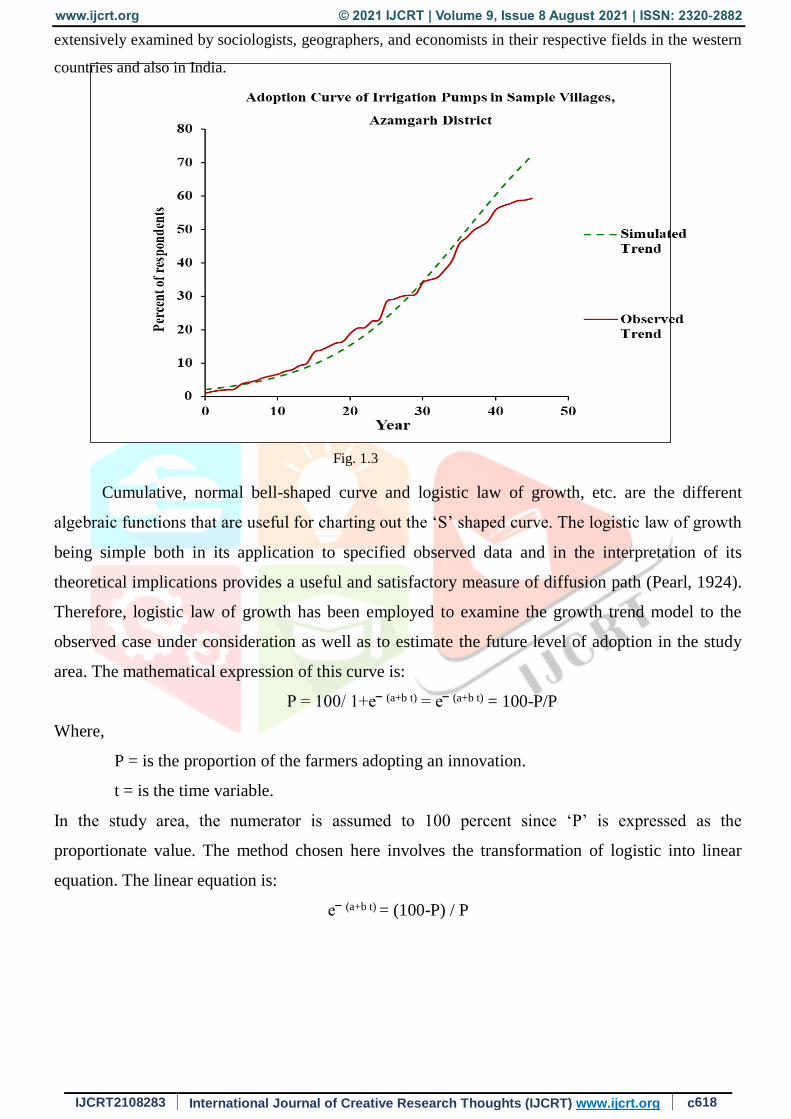
the theoretical model of the diffusion process. Fig. 1.3 shows that the increase in the number of irrigation
pumps up to 15 years of its inception has been rather slow followed by rapid adoption in later years. It is an
observed fact that the dissemination of new ideas, practices, or innovation follows ‘S’ shaped curve which
rises slowly at the initial stage of adoption followed by the middle stage when an innovation or idea
proceeds at an accelerated pace and lastly a decreasing rate of adoption is obvious as the innovation
approaches to the maximum (Roger, 1983). This ‘S’ shaped growth curve, suggested by Trade (1903) was
Fig. 1.2
www.ijcrt.org © 2021 IJCRT | Volume 9, Issue 8 August 2021 | ISSN: 2320-2882
IJCRT2108283 International Journal of Creative Research Thoughts (IJCRT) www.ijcrt.org c618
extensively examined by sociologists, geographers, and economists in their respective fields in the western
countries and also in India.
Cumulative, normal bell-shaped curve and logistic law of growth, etc. are the different
algebraic functions that are useful for charting out the ‘S’ shaped curve. The logistic law of growth
being simple both in its application to specified observed data and in the interpretation of its
theoretical implications provides a useful and satisfactory measure of diffusion path (Pearl, 1924).
Therefore, logistic law of growth has been employed to examine the growth trend model to the
observed case under consideration as well as to estimate the future level of adoption in the study
area. The mathematical expression of this curve is:
P = 100/ 1+e‾ (a+b t) = e‾ (a+b t) = 100-P/P
Where,
P = is the proportion of the farmers adopting an innovation.
t = is the time variable.
In the study area, the numerator is assumed to 100 percent since ‘P’ is expressed as the
proportionate value. The method chosen here involves the transformation of logistic into linear
equation. The linear equation is:
e‾ (a+b t) = (100-P) / P
Fig. 1.3
www.ijcrt.org © 2021 IJCRT | Volume 9, Issue 8 August 2021 | ISSN: 2320-2882
IJCRT2108283 International Journal of Creative Research Thoughts (IJCRT) www.ijcrt.org c619
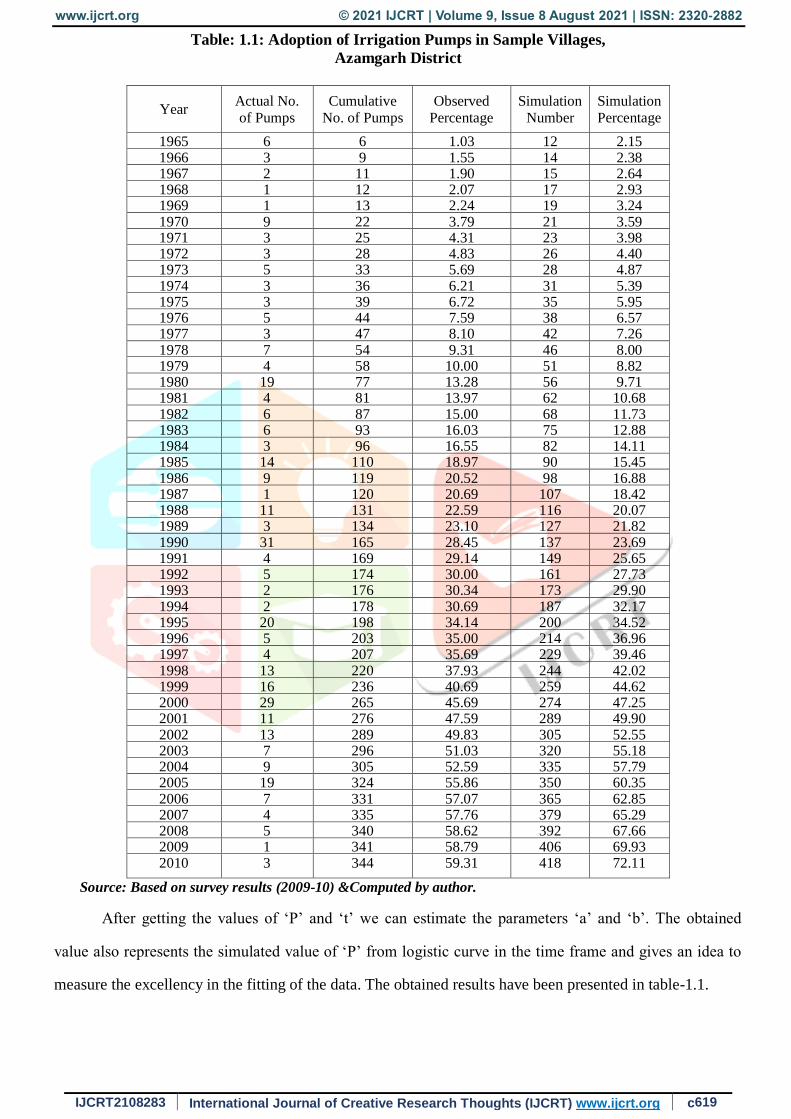
Table: 1.1: Adoption of Irrigation Pumps in Sample Villages,
Azamgarh District
Year Actual No.
of Pumps
Cumulative
No. of Pumps
Observed
Percentage
Simulation
Number
Simulation
Percentage
1965
6 6 1.03 12 2.15 1966 3 9 1.55 14 2.38 1967 2 11 1.90 15 2.64 1968 1 12 2.07 17 2.93 1969 1 13 2.24 19 3.24 1970 9 22 3.79 21 3.59 1971 3 25 4.31 23 3.98 1972 3 28 4.83 26 4.40 1973 5 33 5.69 28 4.87 1974 3 36 6.21 31 5.39 1975 3 39 6.72 35 5.95 1976 5 44 7.59 38 6.57 1977 3 47 8.10 42 7.26 1978 7 54 9.31 46 8.00 1979 4 58 10.00 51 8.82 1980 19 77 13.28 56 9.71 1981 4 81 13.97 62 10.68 1982 6 87 15.00 68 11.73 1983 6 93 16.03 75 12.88 1984 3 96 16.55 82 14.11 1985 14 110 18.97 90 15.45 1986 9 119 20.52 98 16.88 1987 1 120 20.69 107 18.42 1988 11 131 22.59 116 20.07 1989 3 134 23.10 127 21.82 1990 31 165 28.45 137 23.69 1991 4 169 29.14 149 25.65 1992 5 174 30.00 161 27.73 1993 2 176 30.34 173 29.90 1994 2 178 30.69 187 32.17 1995 20 198 34.14 200 34.52 1996 5 203 35.00 214 36.96 1997 4 207 35.69 229 39.46 1998 13 220 37.93 244 42.02 1999 16 236 40.69 259 44.62 2000 29 265 45.69 274 47.25 2001 11 276 47.59 289 49.90 2002 13 289 49.83 305 52.55 2003 7 296 51.03 320 55.18 2004 9 305 52.59 335 57.79 2005 19 324 55.86 350 60.35 2006 7 331 57.07 365 62.85 2007 4 335 57.76 379 65.29 2008 5 340 58.62 392 67.66 2009 1 341 58.79 406 69.93 2010 3 344 59.31 418 72.11
Source: Based on survey results (2009-10) &Computed by author.
After getting the values of ‘P’ and ‘t’ we can estimate the parameters ‘a’ and ‘b’. The obtained
value also represents the simulated value of ‘P’ from logistic curve in the time frame and gives an idea to
measure the excellency in the fitting of the data. The obtained results have been presented in table-1.1.
www.ijcrt.org © 2021 IJCRT | Volume 9, Issue 8 August 2021 | ISSN: 2320-2882
IJCRT2108283 International Journal of Creative Research Thoughts (IJCRT) www.ijcrt.org c620
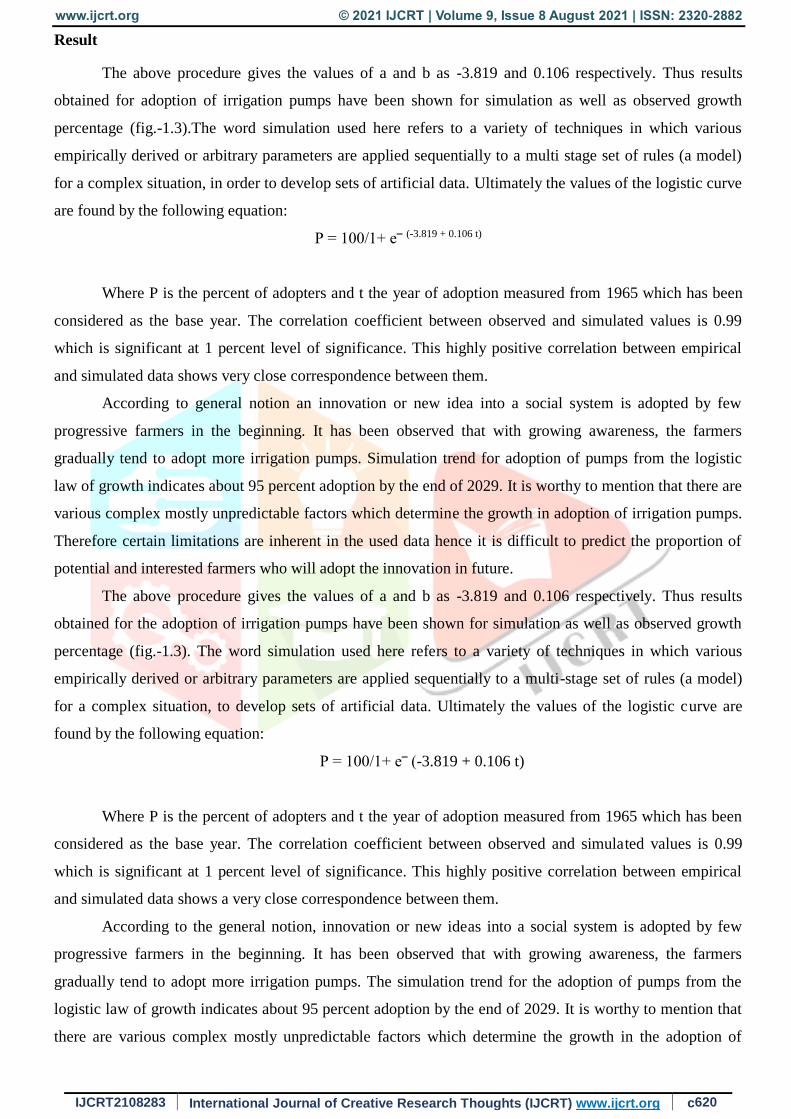
Result
The above procedure gives the values of a and b as -3.819 and 0.106 respectively. Thus results
obtained for adoption of irrigation pumps have been shown for simulation as well as observed growth
percentage (fig.-1.3).The word simulation used here refers to a variety of techniques in which various
empirically derived or arbitrary parameters are applied sequentially to a multi stage set of rules (a model)
for a complex situation, in order to develop sets of artificial data. Ultimately the values of the logistic curve
are found by the following equation:
P = 100/1+ e‾ (-3.819 + 0.106 t)
Where P is the percent of adopters and t the year of adoption measured from 1965 which has been
considered as the base year. The correlation coefficient between observed and simulated values is 0.99
which is significant at 1 percent level of significance. This highly positive correlation between empirical
and simulated data shows very close correspondence between them.
According to general notion an innovation or new idea into a social system is adopted by few
progressive farmers in the beginning. It has been observed that with growing awareness, the farmers
gradually tend to adopt more irrigation pumps. Simulation trend for adoption of pumps from the logistic
law of growth indicates about 95 percent adoption by the end of 2029. It is worthy to mention that there are
various complex mostly unpredictable factors which determine the growth in adoption of irrigation pumps.
Therefore certain limitations are inherent in the used data hence it is difficult to predict the proportion of
potential and interested farmers who will adopt the innovation in future.
The above procedure gives the values of a and b as -3.819 and 0.106 respectively. Thus results
obtained for the adoption of irrigation pumps have been shown for simulation as well as observed growth
percentage (fig.-1.3). The word simulation used here refers to a variety of techniques in which various
empirically derived or arbitrary parameters are applied sequentially to a multi-stage set of rules (a model)
for a complex situation, to develop sets of artificial data. Ultimately the values of the logistic curve are
found by the following equation:
P = 100/1+ e‾ (-3.819 + 0.106 t)
Where P is the percent of adopters and t the year of adoption measured from 1965 which has been
considered as the base year. The correlation coefficient between observed and simulated values is 0.99
which is significant at 1 percent level of significance. This highly positive correlation between empirical
and simulated data shows a very close correspondence between them.
According to the general notion, innovation or new ideas into a social system is adopted by few
progressive farmers in the beginning. It has been observed that with growing awareness, the farmers
gradually tend to adopt more irrigation pumps. The simulation trend for the adoption of pumps from the
logistic law of growth indicates about 95 percent adoption by the end of 2029. It is worthy to mention that
there are various complex mostly unpredictable factors which determine the growth in the adoption of
www.ijcrt.org © 2021 IJCRT | Volume 9, Issue 8 August 2021 | ISSN: 2320-2882
IJCRT2108283 International Journal of Creative Research Thoughts (IJCRT) www.ijcrt.org c621
irrigation pumps. Therefore certain limitations are inherent in the used data hence it is difficult to predict
the proportion of potential and interested farmers who will adopt the innovation in the future.
References
Banerjee, S. (1986): “Regional Imbalances in the Agricultural Development in Uttar Pradesh”, Sudha
Publication, Varanasi, p. 29
Dhawan, B.D. (1988): “Irrigation in India’s Agricultural Development”, Sage Publication, New Delhi,
p.14, 16.
Husain, M. (1996): “Systematic Agricultural Geography”, Rawat Publication, New Delhi.
Pearl, R. (1924): “Studied in Human Biology”, Baltimore, pp.558-583, cited from Shetty, N.S. (1966):
“Inter-Farm Rates of Technological Diffusion in Indian Agriculture,” Indian Journal of agricultural
Economics, Vol. 21, pp. 189-198.
Prasad, C. S. (2009): “Agriculture and Rural Development in India since 1947,” New Century Publication,
New Delhi, India, p.63.
Rao, K.L. (1979): “India’s Water Wealth, Its Assessment. Uses and Projections,” Orient Longman Limited,
New Delhi, p. 121.
Reddy, M.V. (1996): "Irrigation Development Problems and Prospects”, pub. in (ed.) by Abdul Aziz and
Sudhir Krishana, “Regional Development, Problems and Policy Measures”, Concept Publication,
New Delhi, p. 75.
Roger, E.M. (1983): “Diffusion of Innovations”, Third Edition, Free Press, London, New York, pp. 243-
44.
Staub, W. J. and Blase, M. G. (1971): “Genetic Technology and Agricultural Development”, Science, Vol.
173, No.3992, p. 122.
Trade, G. (1903): “The Laws of Immitation” (Translated by Elrie Clew Persons) Holt Rinehart and
Winston, New York, cited from Ram Chandran, R. (1968): “Spatial Diffusion of Innovation in
Rural India,” Mysore, p. 50.
Water Technology Centre, (1977): “Water Requirement and Irrigation Management of Crops in India,”
Agricultural Research Institute, New Delhi, p. 2.