Embed Size (px)
Citation preview
CIMMYT
Adoption, Management,and Impact of
Hybrid Maize Seed in India
R.P. Singh and Michael L. Morris
ICAR/CIMMYT Collaborative Research Program
E C O N O M I C S
Working Paper 97-06
31
* R.P. Singh is with the Division of Agricultural Economics, Indian Agricultural Research Institute (IARI), NewDelhi. Michael L. Morris is with the Economics Program, International Maize and Wheat Improvement Center(CIMMYT), Mexico. The views expressed in this paper are the authors’ and do not necessarily reflect policies oftheir respective institutions.
Adoption, Management,and Impact of
Hybrid Maize Seed in India
R.P. Singh and Michael L. Morris*
ICAR/CIMMYT Collaborative Research Program
E C O N O M I C S
Working Paper 97-06
CIMMYT is an internationally funded, nonprofit scientific research and training organization.Headquartered in Mexico, the Center works with agricultural research institutions worldwide toimprove the productivity and sustainability of maize and wheat systems for poor farmers indeveloping countries. It is one of 16 similar centers supported by the Consultative Group onInternational Agricultural Research (CGIAR). The CGIAR comprises over 50 partner countries,international and regional organizations, and private foundations. It is cosponsored by the Food andAgriculture Organization (FAO) of the United Nations, the International Bank for Reconstructionand Development (World Bank), the United Nations Development Programme (UNDP), and theUnited Nations Environment Programme (UNEP).
Financial support for CIMMYT’s research agenda currently comes from many sources, including thegovernments of Australia, Austria, Belgium, Canada, China, Denmark, France, Germany, India, Iran,Italy, Japan, the Republic of Korea, Mexico, the Netherlands, Norway, the Philippines, Spain,Switzerland, the United Kingdom, and the USA, and from the European Union, the FordFoundation, the Inter-American Development Bank, the Kellogg Foundation, the OPEC Fund forInternational Development, the Rockefeller Foundation, the Sasakawa Africa Association, UNDP,and the World Bank.
Responsibility for this publication rests solely with CIMMYT.
Printed in Mexico.
Correct citation: Singh, R.P., and M.L. Morris. 1997. Adoption, Management, and Impact of Hybrid MaizeSeed in India. CIMMYT Economics Working Paper No. 97-06. Mexico, D.F.: CIMMYT.
Abstract: This paper presents results of a 1995 survey of 864 maize-growing households in six statesthat account for more than 70% of India’s maize area: Andhra Pradesh, Bihar, Karnataka, MadhyaPradesh, Rajasthan, and Uttar Pradesh. The current adoption of improved open-pollinated maizevarieties (OPVs) and hybrids is quantified, the relationship between adoption of improvedgermplasm and use of improved crop management practices is examined, the economic impacts ofadoption are estimated, farmers’ seed procurement and management practices are described, andimplications for maize research and development policy are discussed. On the whole, the surveyresults confirm that India’s national maize seed industry is expanding rapidly. Since seed policyreforms were introduced in the late 1980s, the area planted to improved OPVs and hybrids hasgrown rapidly, and adoption of improved germplasm has fueled important changes in farmers’ cropmanagement practices. However, special policy measures may be needed to ensure that the benefitsof improved germplasm are widely shared, such as the introduction of targeted input subsidiesdesigned to reduce the cost of adopting improved seed and complementary inputs, governmentinvestment in irrigation infrastructure to reduce production risk in drought-prone environments,and market development initiatives to provide small-scale producers with access to stable andreliable outlets where they can sell surplus grain.
ISSN: 0258-8587AGROVOC descriptors: India; maize; Zea mays; seed; seed industry; hybrids; open pollination;varieties; crop management; cropping patterns; technology transfer; innovation adoption; inputoutput analysis; economic analysis; economic policiesAGRIS category codes: E16 Production Economics
E14 Development Economics and PoliciesDewey decimal classification: 338.17
Contents
Page
iv Tablesv Figures
vi Acknowledgmentsvii Executive Summary
1 Introduction
2 The Maize Economy of India2 Maize Production and Consumption Trends4 Recent Developments in the Maize Seed Industry
4 Data Sources and Analysis4 Sample Design6 Sample Representativeness7 Data Collection7 Characteristics of Sample Households
10 Adoption of Improved Germplasm and Complementary Inputs11 Adoption of Improved Germplasm13 Production Practices and Input Use15 Impact of Improved Maize Seed Adoption
17 Procurement and Management of Improved Maize Seed17 Maize Varietal Preferences17 Seed Replacement Patterns21 Seed Procurement Practices22 Seed Management Practices23 Demand for Hybrid Maize Seed
25 Summary and Policy Implications25 Summary of Main Findings27 Implications for Seed Policy28 Implications for Research
28 References
Tables
Page
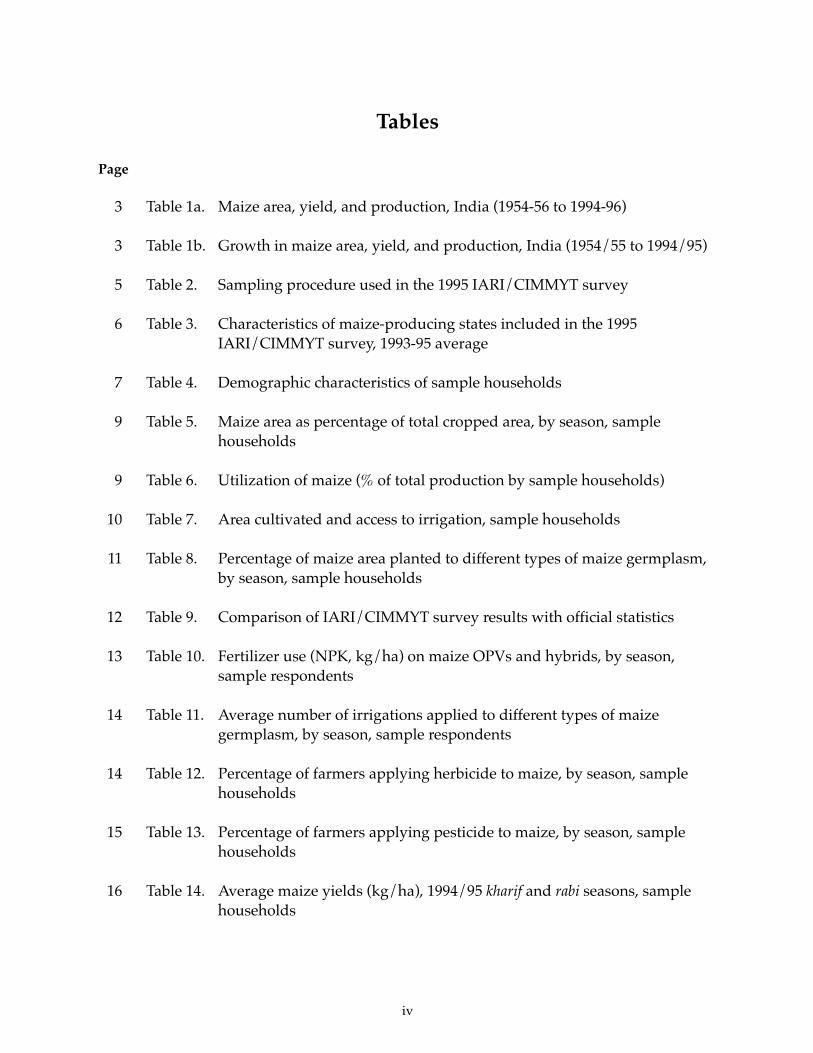
3 Table 1a. Maize area, yield, and production, India (1954-56 to 1994-96)
3 Table 1b. Growth in maize area, yield, and production, India (1954/55 to 1994/95)
5 Table 2. Sampling procedure used in the 1995 IARI/CIMMYT survey
6 Table 3. Characteristics of maize-producing states included in the 1995IARI/CIMMYT survey, 1993-95 average
7 Table 4. Demographic characteristics of sample households
9 Table 5. Maize area as percentage of total cropped area, by season, samplehouseholds
9 Table 6. Utilization of maize (% of total production by sample households)
10 Table 7. Area cultivated and access to irrigation, sample households
11 Table 8. Percentage of maize area planted to different types of maize germplasm,by season, sample households
12 Table 9. Comparison of IARI/CIMMYT survey results with official statistics
13 Table 10. Fertilizer use (NPK, kg/ha) on maize OPVs and hybrids, by season,sample respondents
14 Table 11. Average number of irrigations applied to different types of maizegermplasm, by season, sample respondents
14 Table 12. Percentage of farmers applying herbicide to maize, by season, samplehouseholds
15 Table 13. Percentage of farmers applying pesticide to maize, by season, samplehouseholds
16 Table 14. Average maize yields (kg/ha), 1994/95 kharif and rabi seasons, samplehouseholds
iv
v
Page
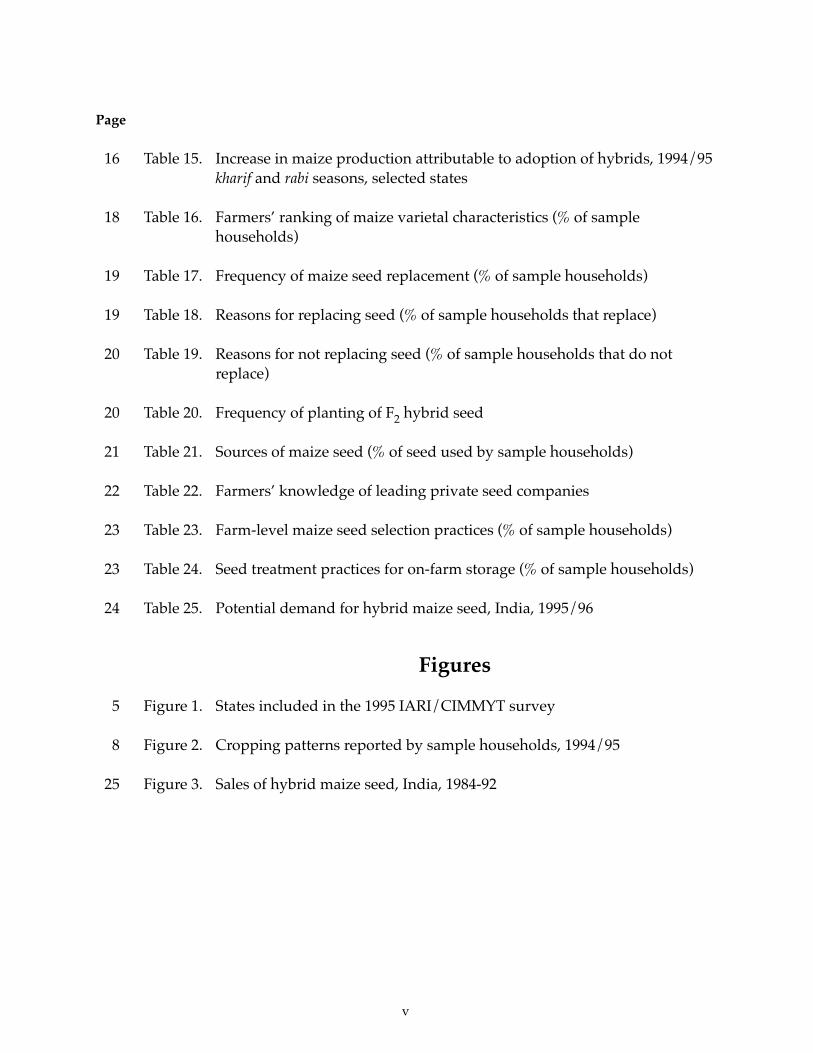
16 Table 15. Increase in maize production attributable to adoption of hybrids, 1994/95kharif and rabi seasons, selected states
18 Table 16. Farmers’ ranking of maize varietal characteristics (% of samplehouseholds)
19 Table 17. Frequency of maize seed replacement (% of sample households)
19 Table 18. Reasons for replacing seed (% of sample households that replace)
20 Table 19. Reasons for not replacing seed (% of sample households that do notreplace)
20 Table 20. Frequency of planting of F2 hybrid seed
21 Table 21. Sources of maize seed (% of seed used by sample households)
22 Table 22. Farmers’ knowledge of leading private seed companies
23 Table 23. Farm-level maize seed selection practices (% of sample households)
23 Table 24. Seed treatment practices for on-farm storage (% of sample households)
24 Table 25. Potential demand for hybrid maize seed, India, 1995/96
Figures
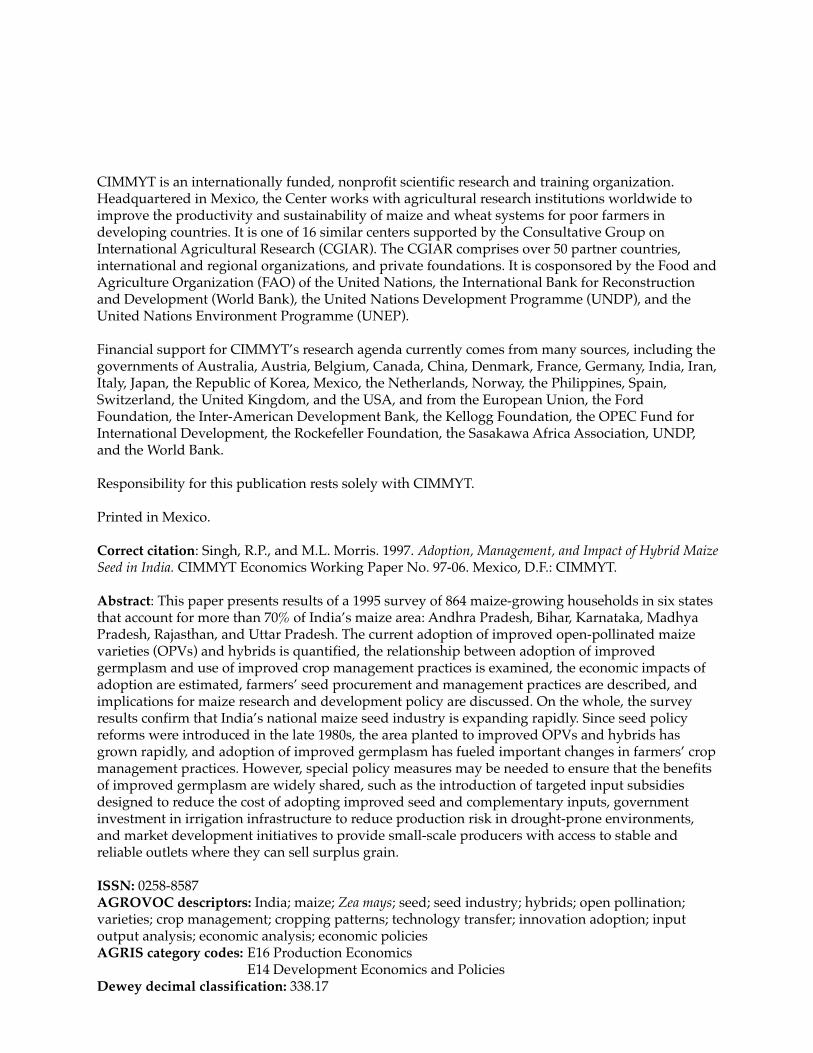
5 Figure 1. States included in the 1995 IARI/CIMMYT survey
8 Figure 2. Cropping patterns reported by sample households, 1994/95
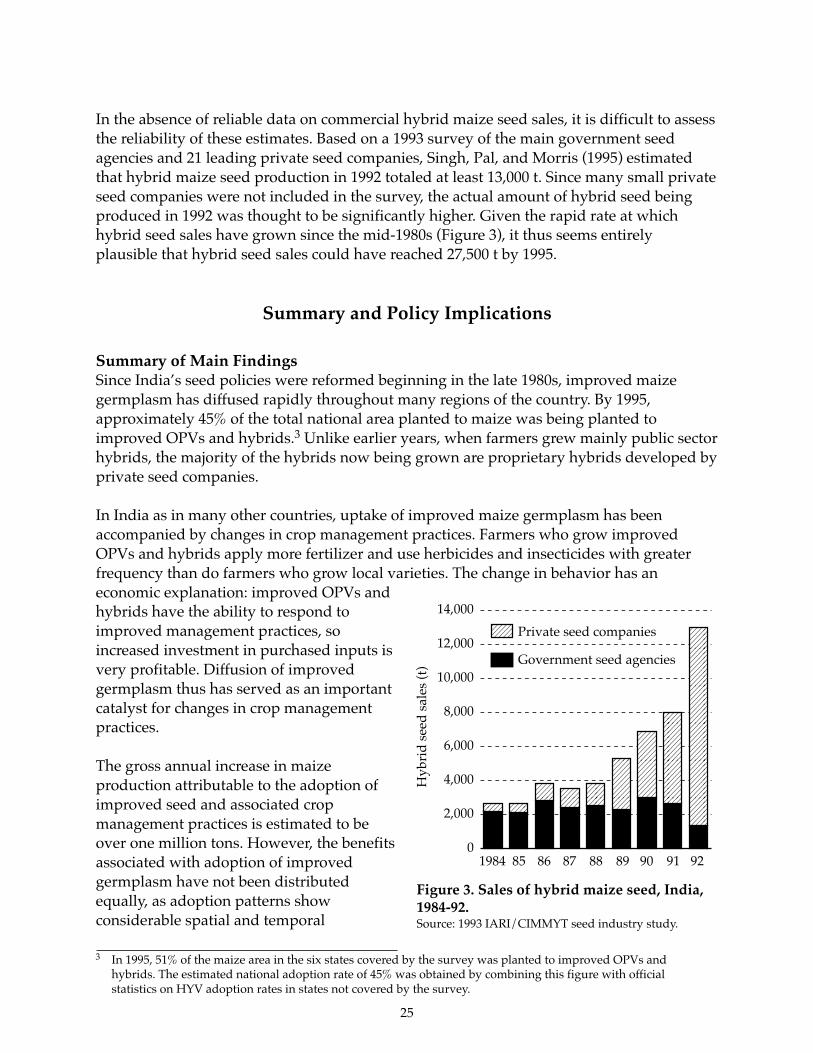
25 Figure 3. Sales of hybrid maize seed, India, 1984-92
Acknowledgments
This paper has been produced as part of the India Maize Seed Industry Study, a jointresearch project involving the Division of Agricultural Economics of the Indian AgriculturalResearch Institute (IARI), the IARI Directorate of Maize Research, and the EconomicsProgram of the International Maize and Wheat Improvement Center (CIMMYT). As withany collaborative effort, the paper has benefited from the contributions of many people.Although it is not possible to cite all of them, several deserve to be singled out.
R.S. Paroda (Director General, Indian Council for Agricultural Research — ICAR), R.B.Singh (Director, IARI), Mangla Rai (Deputy Director General, Crops, ICAR), N.N. Singh(Project Director, Maize, IARI), Derek Byerlee (former Director, CIMMYT EconomicsProgram), and Prabhu Pingali (Director, CIMMYT Economics Program) were instrumentalin mobilizing support for the study.
Suresh Pal (National Centre for Agricultural Policy, ICAR) helped design the study andparticipated in the field data collection. Roshan Lal, Dharam Raj Singh, and Jai Singh(Division of Agricultural Economics, IARI) participated in data collection and compilation.Victor Hernández (CIMMYT Economics Program) provided computing support. DaveHodson (CIMMYT GIS Laboratory) produced the map. Surinder Vasal (CIMMYT MaizeProgram) and Erika Meng (CIMMYT Economics Program) served as internal reviewers.
Many Joint Directors and Deputy Directors of the Department of Agriculture posted in thevarious survey districts provided information needed for the selection of the sample frame.Heads of Departments of Agricultural Economics in the following state agriculturaluniversities assisted in selecting enumerators for the field surveys: Andhra PradeshAgricultural University, Hyderabad; Rajendra Agricultural University, Samastipur;University of Agricultural Sciences, Dharwar; Jawahar Nehru Agricultural University,Jabalpur; Rajasthan Agricultural University, Udaipur; and Chandra Sekar AzadAgricultural University, Kanpur.
Finally, we owe a special debt of gratitude to the many rural households that agreed toparticipate in the survey. We sincerely hope that our findings will contribute to thedevelopment of improved production technologies that will help to improve their lives.
vi
Executive Summary
This paper describes the results of a recent IARI/CIMMYT study that examined the use ofimproved maize seed in India. The study had multiple objectives: to quantify the currentlevel of adoption of improved open-pollinated varieties (OPVs) and hybrids, to explore therelationship between adoption of improved germplasm and use of improved cropmanagement practices, to estimate the economic impacts of adoption, to describe farmers’seed procurement and management practices, and to discuss implications for maizeresearch and development policy. Data for the study were collected in 1995 through asurvey of 864 maize-growing households located in Andhra Pradesh, Bihar, Karnataka,Madhya Pradesh, Rajasthan, and Uttar Pradesh. Together, these six states account for morethan 70% of the area planted to maize in India.
Key findings of the study included the following:
• During the 1994/95 cropping season, approximately 45% of India’s maize area wasplanted to improved OPVs and hybrids. Unlike earlier years, when farmers grew mainlypublic sector materials, most of the improved materials currently grown are proprietaryhybrids developed by private seed companies. Use of improved OPVs and hybrids ishighest in states where maize is an important commercial crop and lowest in stateswhere maize is primarily grown for home consumption.
• Uptake of improved maize germplasm has been accompanied by changes in cropmanagement practices. Farmers who grow improved OPVs and hybrids apply morefertilizer and use herbicides and insecticides with greater frequency than do farmers whogrow local varieties. The change in behavior has an economic explanation: improvedOPVs and hybrids have the ability to respond to improved management practices, soincreased investment in purchased inputs is profitable. Diffusion of improvedgermplasm thus has served as an important catalyst for changes in crop managementpractices.
• Maize varietal preferences vary considerably from one production environment to thenext. All things being equal, maize-growing households prefer OPVs and hybrids thatyield well, but the characteristics associated with high yield vary according to eachproduction environment. Consumption characteristics are also important, withconsumer preferences once again varying from one region to another.
• In states where maize is an important commercial crop and adoption of hybrids isextensive, the majority of maize-growing households replace their seed annually;typically these households purchase seed from an external source, such as a privatetrader or a government seed agency. But in states in which maize is grown mainly forhome consumption and adoption of hybrids is low, the vast majority of maize-growinghouseholds rarely or never replace their seed, preferring to replant seed saved from theirown harvest. Slightly more than one-fifth of all households reported that they sometimesreplant F2 hybrid seed. Of these households, many indicated that they plant F2 hybridseed because they are reluctant to invest scarce resources in a crop as risky as maizeand/or because the yield difference between F1 and F2 generations of hybrid seed isrelatively small.
vii
What has been the aggregate economic impact of hybrid maize adoption? Based ondifferences observed between average yields of OPVs and average yields of hybrids, andtaking into account the area planted to OPVs and hybrids in each state, it is possible toestimate the gross annual increase in maize production attributable to the adoption ofhybrids and associated crop management practices. In the absence of hybrids, maizeproduction in the six states would have been more than one million tons lower during1994/95 than it actually was.
What is the total demand for hybrid maize seed in India? The survey findings on hybridadoption rates can be combined with the findings on farmers’ seed management practices togenerate an estimate of the potential demand for hybrid maize seed. Assuming an averageplanting rate of 20 kg/ha, and using official government estimates for hybrid adoption ratesin the states that were not covered by the survey, potential demand for hybrid maize seed in1995 for all of India was approximately 31,000 t. When the estimated figures for potentialdemand for hybrid seed are adjusted using a hybrid seed recycling factor (based on thereported incidence of F2 seed use), the estimated effective demand for hybrid maize seed forall of India is around 27,500 t.
On the whole, the survey results confirm that India’s national maize seed industry is in aphase of rapid expansion. Since seed policy reforms were introduced in the late 1980s, thearea planted to improved OPVs and hybrids has grown rapidly, and adoption of improvedgermplasm has stimulated important changes in farmers’ crop management practices.However, despite the considerable gains that have been made in meeting the needs ofcommercial farmers, many poor farmers who do not represent an attractive market forcommercial seed have yet to experience the benefits of improved germplasm. Special policymeasures therefore may be needed to ensure that the benefits of improved germplasm arewidely shared. Such measures might include introduction of targeted input subsidiesdesigned to reduce the cost of adopting improved seed and complementary inputs(especially fertilizer), government investment in irrigation infrastructure designed to reduceproduction risk in drought-prone environments, and market development initiativesdesigned to provide small-scale producers with access to stable and reliable outlets wherethey can sell surplus grain.
viii
1
Adoption, Management, and Impactof Hybrid Maize Seed in India
R.P. Singh and Michael L. Morris
Introduction
Maize was the first major cereal crop in India to be affected by hybridization, but theimpact of hybrid technology in the Indian maize sector was not immediately apparent.Following the release in 1961 of the first commercial maize hybrid, uptake of hybrid seedremained modest until the early 1980s. During this period, the production and distributionof seed of most staple food crops remained firmly in the hands of public organizations, asgovernment policies limited the private sector’s role to producing and selling the seed ofselected vegetable crops and ornamental plants.
Policy reforms introduced during the late 1980s in an attempt to encourage greater privatesector participation in the Indian seed industry stimulated a noticeable increase ininvestment in plant breeding research and seed production. The maize seed industry wasparticularly affected by these policy reforms. During the early 1990s, the number of privatemaize seed companies operating in India rose sharply, and private sector investment inmaize research increased significantly (Singh, Pal, and Morris 1995). Meanwhile, theincreased availability of proprietary hybrids produced by private seed companiesaccelerated the diffusion of hybrid maize seed.
Although the recent changes clearly have benefited many of India’s maize farmers, concernhas been expressed in some circles that private seed companies, in their efforts to generateprofits for shareholders, are concentrating on large-scale commercial growers whileignoring small-scale, subsistence-oriented farmers who do not represent an attractivemarket for commercial seed. In the absence of detailed information about the circumstancesunder which maize seed is actually used, it is difficult to know whether or not this concernis justified. The present study was undertaken in an attempt to document the adoption ofhybrid maize seed in a range of production environments, to describe household-level seedprocurement and seed management practices, and to explore options for future maizeresearch and development policies.
This report summarizes the results of a recent study of maize seed management practices insix important maize-growing states that together account for more than 70% of the areaplanted to maize in India. Specific objectives of the study included:• to quantify and document the adoption of improved maize germplasm and its
relationship with the use of improved crop management practices;• to estimate the economic impact of the adoption of improved maize germplasm;• to describe farmers’ seed procurement and seed management practices; and• to discuss the implications for maize research and development policy.
2
To provide an idea of the context in which this survey was undertaken, the paper begins witha brief overview of India’s maize economy and a summary of recent developments in thenational maize seed industry. Next, the field data collection activities undertaken as part ofthis study are described, and the maize-growing households included in the sample areprofiled. The paper then reviews farm-level germplasm adoption patterns. Estimates of thegross economic benefits associated with the adoption of improved OPVs and hybrids aredeveloped. Farm-level seed procurement and seed management practices are described, andthe relationship between adoption of improved germplasm and adoption of improved cropmanagement practices is explored. The concluding section of the paper summarizes the mainfindings of the study and discusses policy implications.
The Maize Economy of India
Among the cereals grown in India, maize ranks as one of the most important. Traditionally,maize was grown as a staple food destined primarily for home consumption. Farm householdrequirements, governed by quality and taste preferences, influenced production decisions.However, in recent years significant changes have occurred as the result of the increasingcommercial orientation of the agricultural economy and rising demand for diversified enduses, especially feed and industrial uses. At the same time, substantial investment in maizeresearch has generated improved production technologies that have provided farmers withthe means to respond to changes in demand.
Maize Production and Consumption TrendsMaize in India is grown in a wide range of production environments, ranging from thetemperate hill zones in Himachal Pradesh in the North to the semiarid desert margins inRajasthan in the West to the humid tropical zones in Karnataka in the South. Between 1955and 1975, the total area planted to maize expanded at an average annual rate of more than2.2%, causing national maize area to grow from 3.7 million hectares to almost 6 millionhectares (Table 1). Beginning in the early 1970s, however, expansion in maize area abruptlyceased, as maize was forced to compete with other crops for increasingly scarce land.
Although total maize area has remained virtually unchanged for the past 25 years, significantshifts have occurred in where and when maize is grown. The most significant change hasbeen the rapid area expansion in winter (rabi) maize, particularly in the states of Bihar,Andhra Pradesh, and Karnataka; in large part, this expansion resulted from the introductionof improved materials showing good cold tolerance. In the traditional maize-growing statesof Madhya Pradesh and Rajasthan, maize area has expanded, whereas it has declined in UttarPradesh because of increased competition from higher value alternative crops
Under the impetus of the spread of improved germplasm and crop management practices,average maize yields have registered continuous growth for more than four decades (Table 1).However, the rate of growth has been somewhat uneven. After rising rapidly at more than 3%per year during the 1950s and early 1960s, yields grew more slowly during the 1970s and1980s as maize was displaced from many favorable production zones by newly introduced,high yielding wheat and rice varieties. More rapid maize yield growth resumed in the 1990s.
3
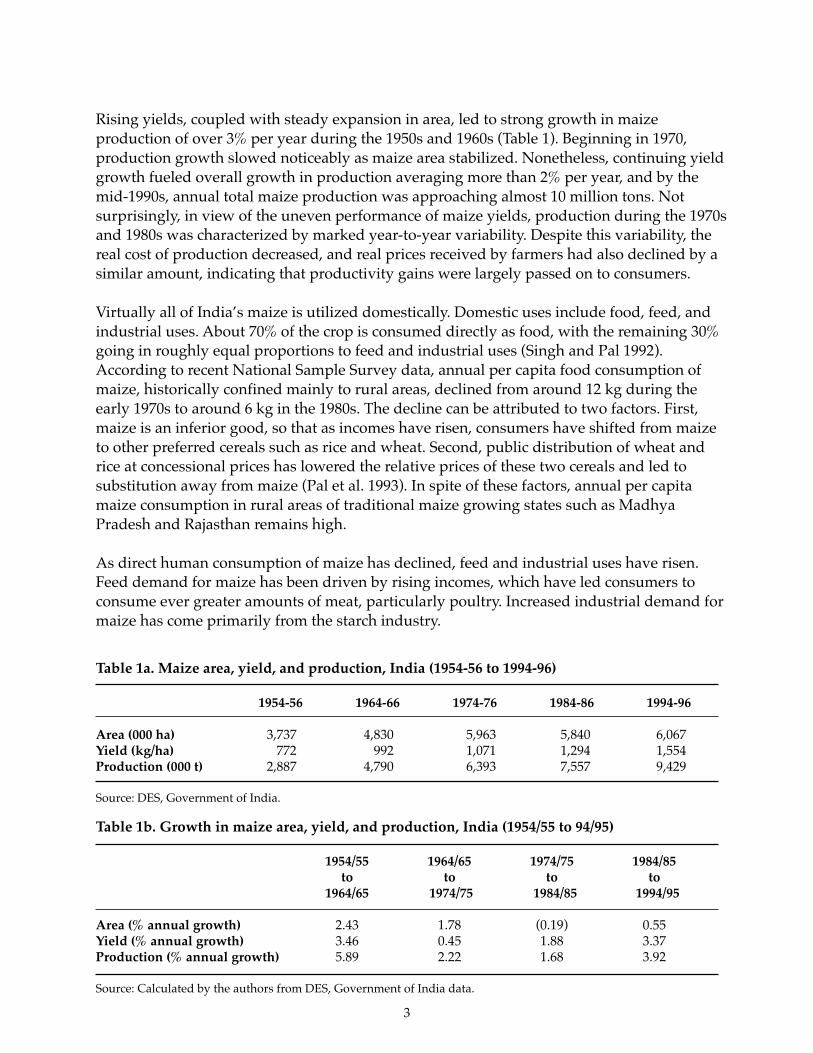
Rising yields, coupled with steady expansion in area, led to strong growth in maizeproduction of over 3% per year during the 1950s and 1960s (Table 1). Beginning in 1970,production growth slowed noticeably as maize area stabilized. Nonetheless, continuing yieldgrowth fueled overall growth in production averaging more than 2% per year, and by themid-1990s, annual total maize production was approaching almost 10 million tons. Notsurprisingly, in view of the uneven performance of maize yields, production during the 1970sand 1980s was characterized by marked year-to-year variability. Despite this variability, thereal cost of production decreased, and real prices received by farmers had also declined by asimilar amount, indicating that productivity gains were largely passed on to consumers.
Virtually all of India’s maize is utilized domestically. Domestic uses include food, feed, andindustrial uses. About 70% of the crop is consumed directly as food, with the remaining 30%going in roughly equal proportions to feed and industrial uses (Singh and Pal 1992).According to recent National Sample Survey data, annual per capita food consumption ofmaize, historically confined mainly to rural areas, declined from around 12 kg during theearly 1970s to around 6 kg in the 1980s. The decline can be attributed to two factors. First,maize is an inferior good, so that as incomes have risen, consumers have shifted from maizeto other preferred cereals such as rice and wheat. Second, public distribution of wheat andrice at concessional prices has lowered the relative prices of these two cereals and led tosubstitution away from maize (Pal et al. 1993). In spite of these factors, annual per capitamaize consumption in rural areas of traditional maize growing states such as MadhyaPradesh and Rajasthan remains high.
As direct human consumption of maize has declined, feed and industrial uses have risen.Feed demand for maize has been driven by rising incomes, which have led consumers toconsume ever greater amounts of meat, particularly poultry. Increased industrial demand formaize has come primarily from the starch industry.
Table 1a. Maize area, yield, and production, India (1954-56 to 1994-96)
1954-56 1964-66 1974-76 1984-86 1994-96
Area (000 ha) 3,737 4,830 5,963 5,840 6,067Yield (kg/ha) 772 992 1,071 1,294 1,554Production (000 t) 2,887 4,790 6,393 7,557 9,429
Source: DES, Government of India.
Table 1b. Growth in maize area, yield, and production, India (1954/55 to 94/95)
1954/55 1964/65 1974/75 1984/85to to to to
1964/65 1974/75 1984/85 1994/95
Area (% annual growth) 2.43 1.78 (0.19) 0.55Yield (% annual growth) 3.46 0.45 1.88 3.37Production (% annual growth) 5.89 2.22 1.68 3.92
Source: Calculated by the authors from DES, Government of India data.

4
Recent Developments in the Maize Seed IndustryThe passage in 1966 of the Central Seed Act laid the legal foundation for India’s present-dayseed industry. In addition to setting out regulations governing the production anddistribution of seed, the Central Seed Act prescribed certification standards and assignedresponsibility for their enforcement to the state governments. A distinguishing feature ofthe Central Seed Act was that effective control over seed of most staple food crops remainedfirmly in the hands of government organizations. Private companies gradually came intoexistence, but only in certain segments of the market (e.g., vegetables and flowers), but seedproduction and distribution for important cereals such as rice, wheat, sorghum, and maizewere actively pursued through state agencies.
Policy reforms introduced during the late 1980s had important implications for the seedindustry. In 1987, the seed industry licensing policy was modified to encourage greaterparticipation by private companies, and in 1988 the doors to foreign competition werethrown open when the New Policy for Seed Development was passed. The New Policy forSeed Development, a landmark piece of legislation, permitted private companies to importseed of vegetables, flowers, and ornamental plants, subject to certain restrictions regardingaccess to and disposal of foreign exchange; under certain conditions, it also permittedimports of seed of coarse grains, pulses, and oilseeds. Meanwhile, import duties on seedand seed processing equipment were reduced significantly.
Although they applied to all crops, the seed industry reforms introduced during the late1980s had an especially noticeable impact on maize. By lowering barriers to entry andloosening restrictions on certain previously prescribed procedures, they cleared the way forincreased participation by private companies. Within a few months, dozens of newcompanies sprang up and began producing maize seed to sell in direct competition with thegovernment seed agencies. These included not only Indian-owned companies butsubsidiaries of large transnational companies active in the global seed trade. Initially thedomestic companies concentrated on producing seed of public varieties and hybrids, but ascompetition intensified, many of them launched research programs in an effort to developproprietary products that could be differentiated in the marketplace. By 1994, the level ofprivate sector investment in maize research was approximately equal to the level of publicsector investment, and seed sales by private companies had surpassed those of public seedorganizations.
Data Sources and Analysis
Data for the present study were collected through a survey of 864 maize-growinghouseholds distributed among six states. The data pertain to the 1994/95 agricultural year.
Sample DesignA five-stage, clustered, purposive sampling procedure was used to select households forinclusion in the study. The five stages involved selection of: (1) states, (2) districts, (3)blocks, (4) villages, and (5) households. The sampling procedure, summarized in Table 2, is
5
������������
������
����
���������
������������
���������
RajasthanRajasthanUttar�
PradeshUttar�
PradeshBiharBihar
Madhya PradeshMadhya Pradesh
Karna-�takaKarna-�taka
Andhra�PradeshAndhra�Pradesh
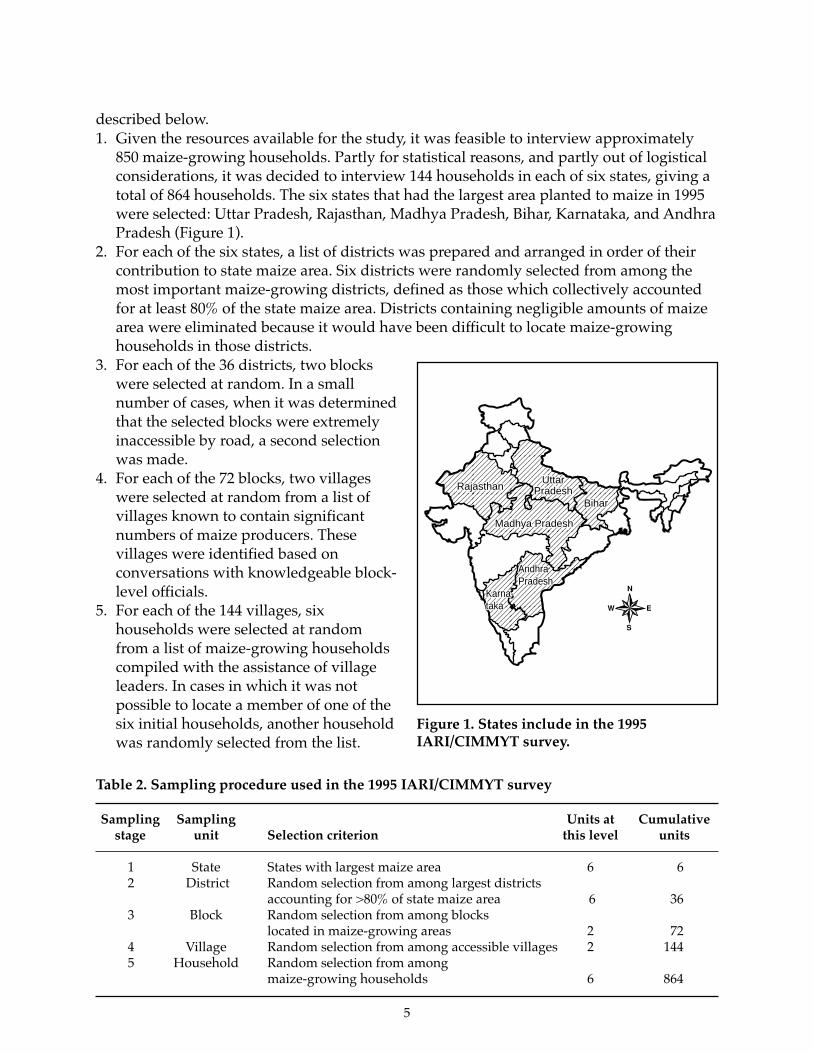
described below.1. Given the resources available for the study, it was feasible to interview approximately
850 maize-growing households. Partly for statistical reasons, and partly out of logisticalconsiderations, it was decided to interview 144 households in each of six states, giving atotal of 864 households. The six states that had the largest area planted to maize in 1995were selected: Uttar Pradesh, Rajasthan, Madhya Pradesh, Bihar, Karnataka, and AndhraPradesh (Figure 1).
2. For each of the six states, a list of districts was prepared and arranged in order of theircontribution to state maize area. Six districts were randomly selected from among themost important maize-growing districts, defined as those which collectively accountedfor at least 80% of the state maize area. Districts containing negligible amounts of maizearea were eliminated because it would have been difficult to locate maize-growinghouseholds in those districts.
3. For each of the 36 districts, two blockswere selected at random. In a smallnumber of cases, when it was determinedthat the selected blocks were extremelyinaccessible by road, a second selectionwas made.
4. For each of the 72 blocks, two villageswere selected at random from a list ofvillages known to contain significantnumbers of maize producers. Thesevillages were identified based onconversations with knowledgeable block-level officials.
5. For each of the 144 villages, sixhouseholds were selected at randomfrom a list of maize-growing householdscompiled with the assistance of villageleaders. In cases in which it was notpossible to locate a member of one of thesix initial households, another householdwas randomly selected from the list.
Table 2. Sampling procedure used in the 1995 IARI/CIMMYT survey
Sampling Sampling Units at Cumulativestage unit Selection criterion this level units
1 State States with largest maize area 6 6 2 District Random selection from among largest districts
accounting for >80% of state maize area 6 363 Block Random selection from among blocks
located in maize-growing areas 2 724 Village Random selection from among accessible villages 2 1445 Household Random selection from among
maize-growing households 6 864
Figure 1. States include in the 1995IARI/CIMMYT survey.
6
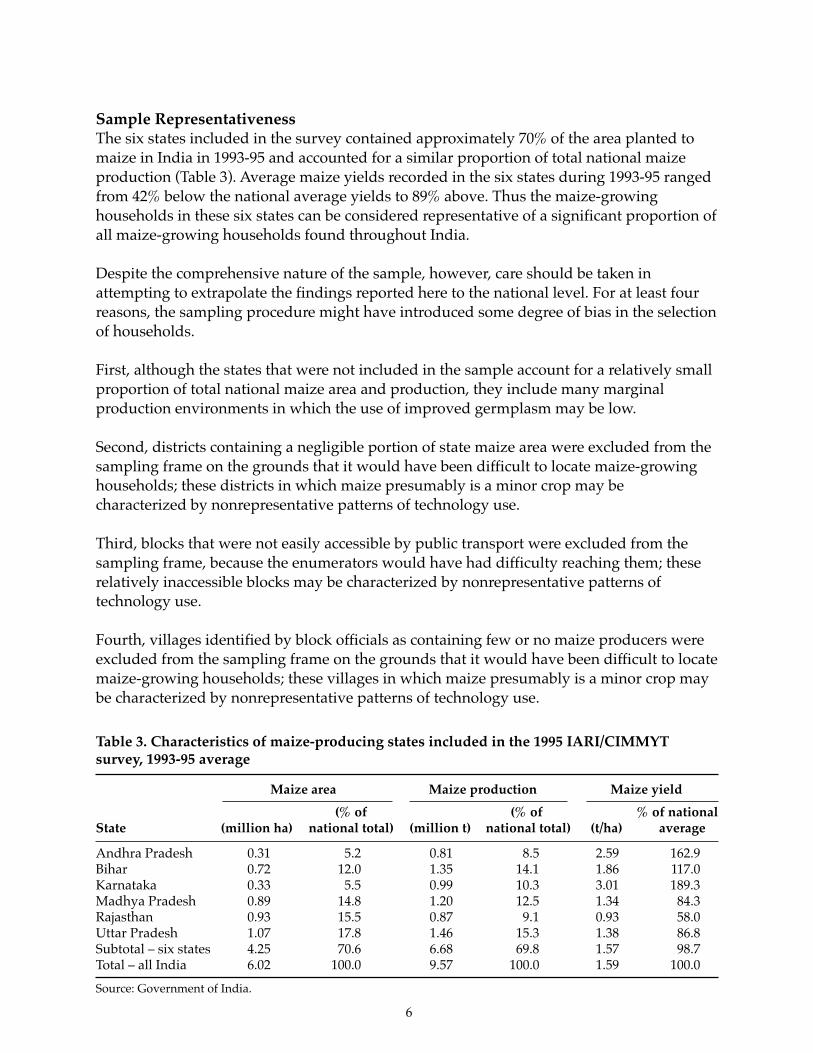
Sample RepresentativenessThe six states included in the survey contained approximately 70% of the area planted tomaize in India in 1993-95 and accounted for a similar proportion of total national maizeproduction (Table 3). Average maize yields recorded in the six states during 1993-95 rangedfrom 42% below the national average yields to 89% above. Thus the maize-growinghouseholds in these six states can be considered representative of a significant proportion ofall maize-growing households found throughout India.
Despite the comprehensive nature of the sample, however, care should be taken inattempting to extrapolate the findings reported here to the national level. For at least fourreasons, the sampling procedure might have introduced some degree of bias in the selectionof households.
First, although the states that were not included in the sample account for a relatively smallproportion of total national maize area and production, they include many marginalproduction environments in which the use of improved germplasm may be low.
Second, districts containing a negligible portion of state maize area were excluded from thesampling frame on the grounds that it would have been difficult to locate maize-growinghouseholds; these districts in which maize presumably is a minor crop may becharacterized by nonrepresentative patterns of technology use.
Third, blocks that were not easily accessible by public transport were excluded from thesampling frame, because the enumerators would have had difficulty reaching them; theserelatively inaccessible blocks may be characterized by nonrepresentative patterns oftechnology use.
Fourth, villages identified by block officials as containing few or no maize producers wereexcluded from the sampling frame on the grounds that it would have been difficult to locatemaize-growing households; these villages in which maize presumably is a minor crop maybe characterized by nonrepresentative patterns of technology use.
Table 3. Characteristics of maize-producing states included in the 1995 IARI/CIMMYTsurvey, 1993-95 average
Maize area Maize production Maize yield
(% of (% of % of nationalState (million ha) national total) (million t) national total) (t/ha) average
Andhra Pradesh 0.31 5.2 0.81 8.5 2.59 162.9Bihar 0.72 12.0 1.35 14.1 1.86 117.0Karnataka 0.33 5.5 0.99 10.3 3.01 189.3Madhya Pradesh 0.89 14.8 1.20 12.5 1.34 84.3Rajasthan 0.93 15.5 0.87 9.1 0.93 58.0Uttar Pradesh 1.07 17.8 1.46 15.3 1.38 86.8Subtotal – six states 4.25 70.6 6.68 69.8 1.57 98.7Total – all India 6.02 100.0 9.57 100.0 1.59 100.0
Source: Government of India.
7
For these reasons, it is possible that the final sample of maize-growing households includedin the study might not be perfectly representative of the entire population of maize-growinghouseholds in India. The possibility of selection bias should be taken into account ininterpreting the survey results.
Data CollectionThe survey was conducted between April and August, 1995. Enumerators were recruited ineach of the six target states to ensure fluency in local languages. All of the enumerators werecurrent or former graduate students in agricultural sciences at one of the state agriculturaluniversities, so they were knowledgeable about local agricultural production practices.Working singly or in pairs, the enumerators were able to complete all 144 interviews for eachstate within about a month. Data collection was staggered slightly from state to state toprovide sufficient time for the survey supervisors to spend several days training each groupof enumerators and participating in the first few days of interviews.
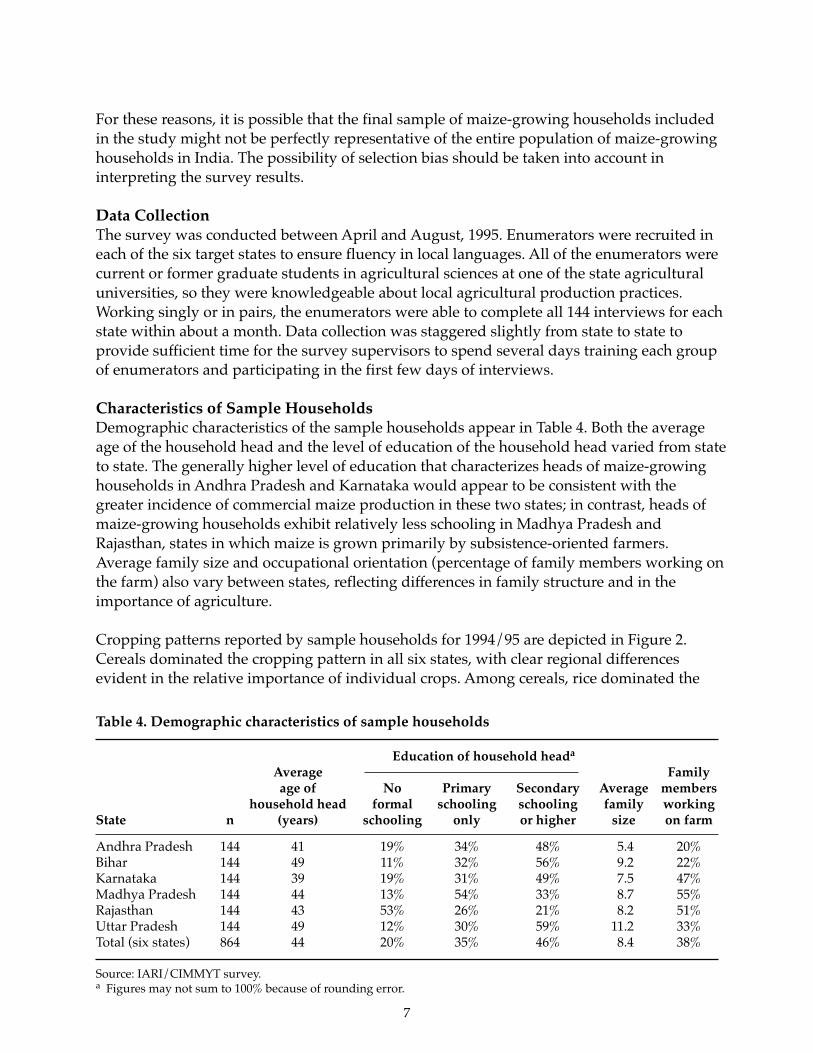
Characteristics of Sample HouseholdsDemographic characteristics of the sample households appear in Table 4. Both the averageage of the household head and the level of education of the household head varied from stateto state. The generally higher level of education that characterizes heads of maize-growinghouseholds in Andhra Pradesh and Karnataka would appear to be consistent with thegreater incidence of commercial maize production in these two states; in contrast, heads ofmaize-growing households exhibit relatively less schooling in Madhya Pradesh andRajasthan, states in which maize is grown primarily by subsistence-oriented farmers.Average family size and occupational orientation (percentage of family members working onthe farm) also vary between states, reflecting differences in family structure and in theimportance of agriculture.
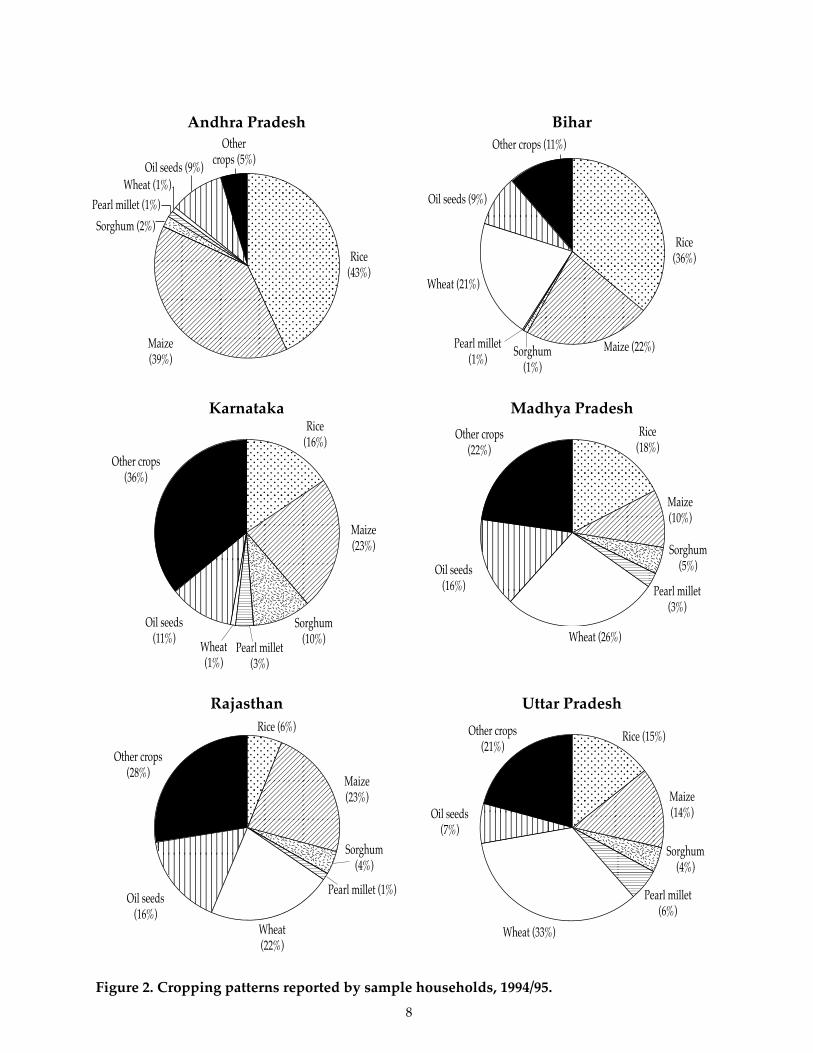
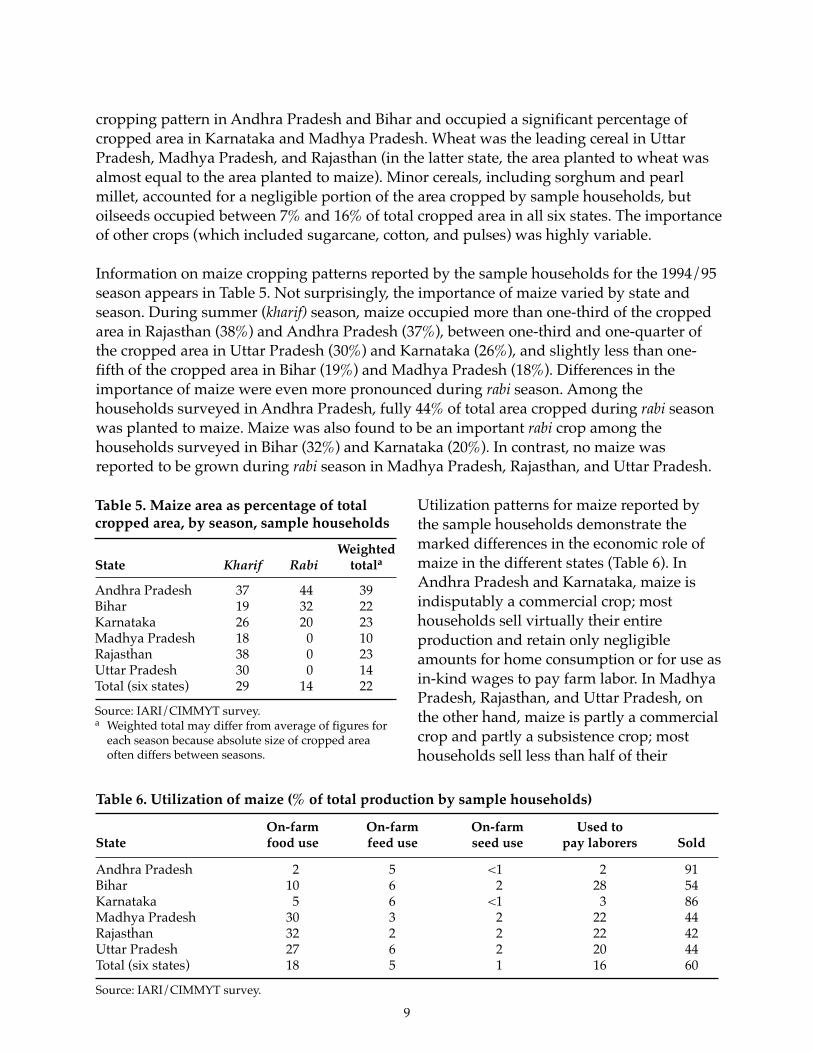
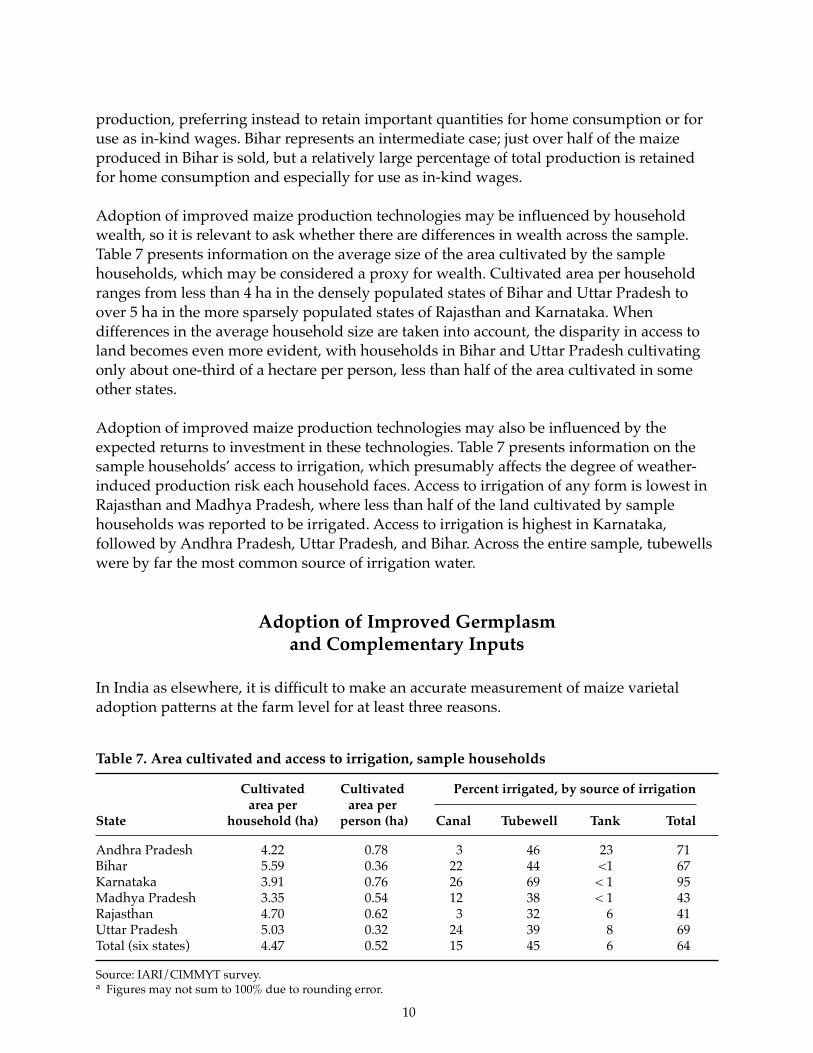
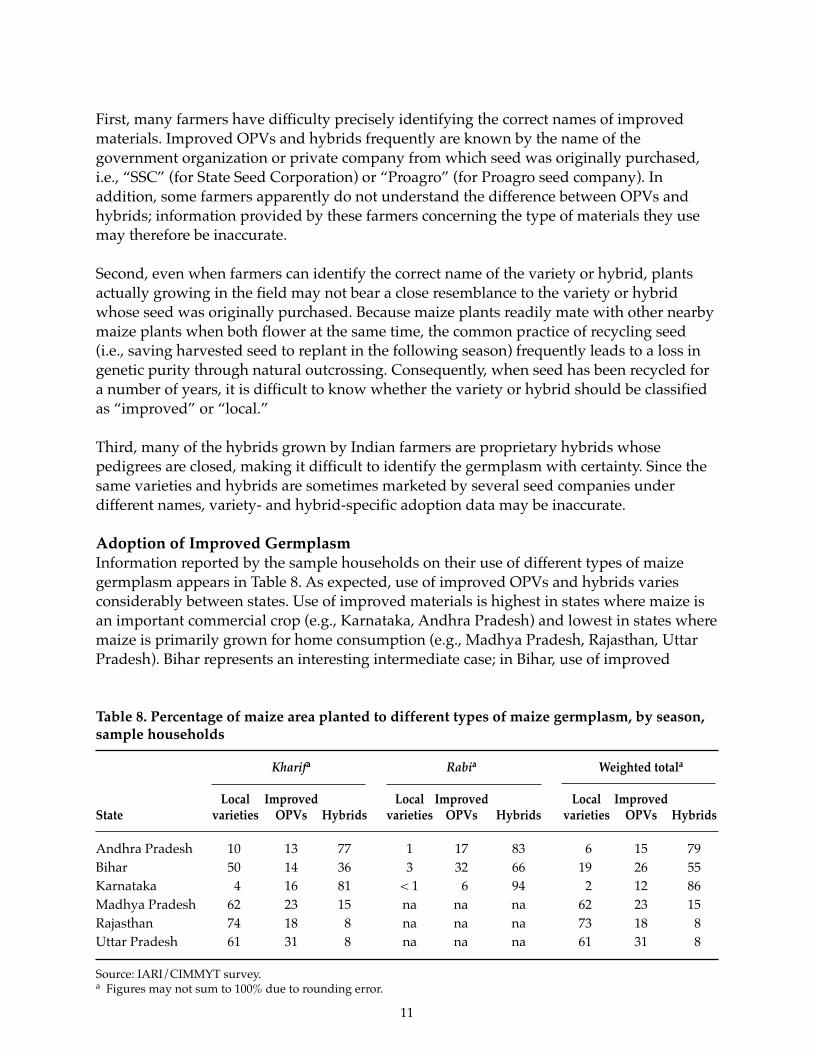
Cropping patterns reported by sample households for 1994/95 are depicted in Figure 2.Cereals dominated the cropping pattern in all six states, with clear regional differencesevident in the relative importance of individual crops. Among cereals, rice dominated the
Table 4. Demographic characteristics of sample households
Education of household heada
Average Familyage of No Primary Secondary Average members
household head formal schooling schooling family workingState n (years) schooling only or higher size on farm
Andhra Pradesh 144 41 19% 34% 48% 5.4 20%Bihar 144 49 11% 32% 56% 9.2 22%Karnataka 144 39 19% 31% 49% 7.5 47%Madhya Pradesh 144 44 13% 54% 33% 8.7 55%Rajasthan 144 43 53% 26% 21% 8.2 51%Uttar Pradesh 144 49 12% 30% 59% 11.2 33%Total (six states) 864 44 20% 35% 46% 8.4 38%
Source: IARI/CIMMYT survey.a Figures may not sum to 100% because of rounding error.
8
������������
����������������������������
����
Andhra Pradesh
Rice(43%)
Maize(39%)
Sorghum (2%)
Pearl millet (1%)Wheat (1%)
Oil seeds (9%)
Othercrops (5%)
����
����
����������
��������������������
Bihar
Rice(36%)
Maize (22%)Sorghum(1%)
Pearl millet(1%)
Wheat (21%)
Oil seeds (9%)
Other crops (11%)
����
���������������������
���������������
���
KarnatakaRice
(16%)
Maize(23%)
Sorghum(10%)
Pearl millet(3%)
Wheat(1%)
Oil seeds(11%)
Other crops(36%)
����������������������������
���
Madhya PradeshRice
(18%)
Maize(10%)
Sorghum(5%)
Pearl millet(3%)
Wheat (26%)
Oil seeds(16%)
Other crops(22%)
����������������������������������
���
RajasthanRice (6%)
Maize(23%)
Sorghum(4%)
Pearl millet (1%)
Wheat(22%)
Oil seeds(16%)
Other crops(28%)
����
����������������������������
������
Uttar Pradesh
Rice (15%)
Maize(14%)
Sorghum(4%)
Pearl millet(6%)
Wheat (33%)
Oil seeds(7%)
Other crops(21%)
Figure 2. Cropping patterns reported by sample households, 1994/95.
9
cropping pattern in Andhra Pradesh and Bihar and occupied a significant percentage ofcropped area in Karnataka and Madhya Pradesh. Wheat was the leading cereal in UttarPradesh, Madhya Pradesh, and Rajasthan (in the latter state, the area planted to wheat wasalmost equal to the area planted to maize). Minor cereals, including sorghum and pearlmillet, accounted for a negligible portion of the area cropped by sample households, butoilseeds occupied between 7% and 16% of total cropped area in all six states. The importanceof other crops (which included sugarcane, cotton, and pulses) was highly variable.
Information on maize cropping patterns reported by the sample households for the 1994/95season appears in Table 5. Not surprisingly, the importance of maize varied by state andseason. During summer (kharif) season, maize occupied more than one-third of the croppedarea in Rajasthan (38%) and Andhra Pradesh (37%), between one-third and one-quarter ofthe cropped area in Uttar Pradesh (30%) and Karnataka (26%), and slightly less than one-fifth of the cropped area in Bihar (19%) and Madhya Pradesh (18%). Differences in theimportance of maize were even more pronounced during rabi season. Among thehouseholds surveyed in Andhra Pradesh, fully 44% of total area cropped during rabi seasonwas planted to maize. Maize was also found to be an important rabi crop among thehouseholds surveyed in Bihar (32%) and Karnataka (20%). In contrast, no maize wasreported to be grown during rabi season in Madhya Pradesh, Rajasthan, and Uttar Pradesh.
Utilization patterns for maize reported bythe sample households demonstrate themarked differences in the economic role ofmaize in the different states (Table 6). InAndhra Pradesh and Karnataka, maize isindisputably a commercial crop; mosthouseholds sell virtually their entireproduction and retain only negligibleamounts for home consumption or for use asin-kind wages to pay farm labor. In MadhyaPradesh, Rajasthan, and Uttar Pradesh, onthe other hand, maize is partly a commercialcrop and partly a subsistence crop; mosthouseholds sell less than half of their
Table 5. Maize area as percentage of totalcropped area, by season, sample households
WeightedState Kharif Rabi totala
Andhra Pradesh 37 44 39Bihar 19 32 22Karnataka 26 20 23Madhya Pradesh 18 0 10Rajasthan 38 0 23Uttar Pradesh 30 0 14Total (six states) 29 14 22
Source: IARI/CIMMYT survey.a Weighted total may differ from average of figures for
each season because absolute size of cropped areaoften differs between seasons.
Table 6. Utilization of maize (% of total production by sample households)
On-farm On-farm On-farm Used toState food use feed use seed use pay laborers Sold
Andhra Pradesh 2 5 <1 2 91Bihar 10 6 2 28 54Karnataka 5 6 <1 3 86Madhya Pradesh 30 3 2 22 44Rajasthan 32 2 2 22 42Uttar Pradesh 27 6 2 20 44Total (six states) 18 5 1 16 60
Source: IARI/CIMMYT survey.
10
production, preferring instead to retain important quantities for home consumption or foruse as in-kind wages. Bihar represents an intermediate case; just over half of the maizeproduced in Bihar is sold, but a relatively large percentage of total production is retainedfor home consumption and especially for use as in-kind wages.
Adoption of improved maize production technologies may be influenced by householdwealth, so it is relevant to ask whether there are differences in wealth across the sample.Table 7 presents information on the average size of the area cultivated by the samplehouseholds, which may be considered a proxy for wealth. Cultivated area per householdranges from less than 4 ha in the densely populated states of Bihar and Uttar Pradesh toover 5 ha in the more sparsely populated states of Rajasthan and Karnataka. Whendifferences in the average household size are taken into account, the disparity in access toland becomes even more evident, with households in Bihar and Uttar Pradesh cultivatingonly about one-third of a hectare per person, less than half of the area cultivated in someother states.
Adoption of improved maize production technologies may also be influenced by theexpected returns to investment in these technologies. Table 7 presents information on thesample households’ access to irrigation, which presumably affects the degree of weather-induced production risk each household faces. Access to irrigation of any form is lowest inRajasthan and Madhya Pradesh, where less than half of the land cultivated by samplehouseholds was reported to be irrigated. Access to irrigation is highest in Karnataka,followed by Andhra Pradesh, Uttar Pradesh, and Bihar. Across the entire sample, tubewellswere by far the most common source of irrigation water.
Adoption of Improved Germplasmand Complementary Inputs
In India as elsewhere, it is difficult to make an accurate measurement of maize varietaladoption patterns at the farm level for at least three reasons.
Table 7. Area cultivated and access to irrigation, sample households
Cultivated Cultivated Percent irrigated, by source of irrigationarea per area per
State household (ha) person (ha) Canal Tubewell Tank Total
Andhra Pradesh 4.22 0.78 3 46 23 71Bihar 5.59 0.36 22 44 <1 67Karnataka 3.91 0.76 26 69 < 1 95Madhya Pradesh 3.35 0.54 12 38 < 1 43Rajasthan 4.70 0.62 3 32 6 41Uttar Pradesh 5.03 0.32 24 39 8 69Total (six states) 4.47 0.52 15 45 6 64
Source: IARI/CIMMYT survey.a Figures may not sum to 100% due to rounding error.
11
First, many farmers have difficulty precisely identifying the correct names of improvedmaterials. Improved OPVs and hybrids frequently are known by the name of thegovernment organization or private company from which seed was originally purchased,i.e., “SSC” (for State Seed Corporation) or “Proagro” (for Proagro seed company). Inaddition, some farmers apparently do not understand the difference between OPVs andhybrids; information provided by these farmers concerning the type of materials they usemay therefore be inaccurate.
Second, even when farmers can identify the correct name of the variety or hybrid, plantsactually growing in the field may not bear a close resemblance to the variety or hybridwhose seed was originally purchased. Because maize plants readily mate with other nearbymaize plants when both flower at the same time, the common practice of recycling seed(i.e., saving harvested seed to replant in the following season) frequently leads to a loss ingenetic purity through natural outcrossing. Consequently, when seed has been recycled fora number of years, it is difficult to know whether the variety or hybrid should be classifiedas “improved” or “local.”
Third, many of the hybrids grown by Indian farmers are proprietary hybrids whosepedigrees are closed, making it difficult to identify the germplasm with certainty. Since thesame varieties and hybrids are sometimes marketed by several seed companies underdifferent names, variety- and hybrid-specific adoption data may be inaccurate.
Adoption of Improved GermplasmInformation reported by the sample households on their use of different types of maizegermplasm appears in Table 8. As expected, use of improved OPVs and hybrids variesconsiderably between states. Use of improved materials is highest in states where maize isan important commercial crop (e.g., Karnataka, Andhra Pradesh) and lowest in states wheremaize is primarily grown for home consumption (e.g., Madhya Pradesh, Rajasthan, UttarPradesh). Bihar represents an interesting intermediate case; in Bihar, use of improved
Table 8. Percentage of maize area planted to different types of maize germplasm, by season,sample households
Kharifa Rabia Weighted totala
Local Improved Local Improved Local ImprovedState varieties OPVs Hybrids varieties OPVs Hybrids varieties OPVs Hybrids
Andhra Pradesh 10 13 77 1 17 83 6 15 79Bihar 50 14 36 3 32 66 19 26 55Karnataka 4 16 81 < 1 6 94 2 12 86Madhya Pradesh 62 23 15 na na na 62 23 15Rajasthan 74 18 8 na na na 73 18 8Uttar Pradesh 61 31 8 na na na 61 31 8
Source: IARI/CIMMYT survey.a Figures may not sum to 100% due to rounding error.
12
materials is high during rabi season (when the state’s main commercial maize crop isgrown) and low during kharif season (when many small-scale farmers plant maize as asupplementary food crop).
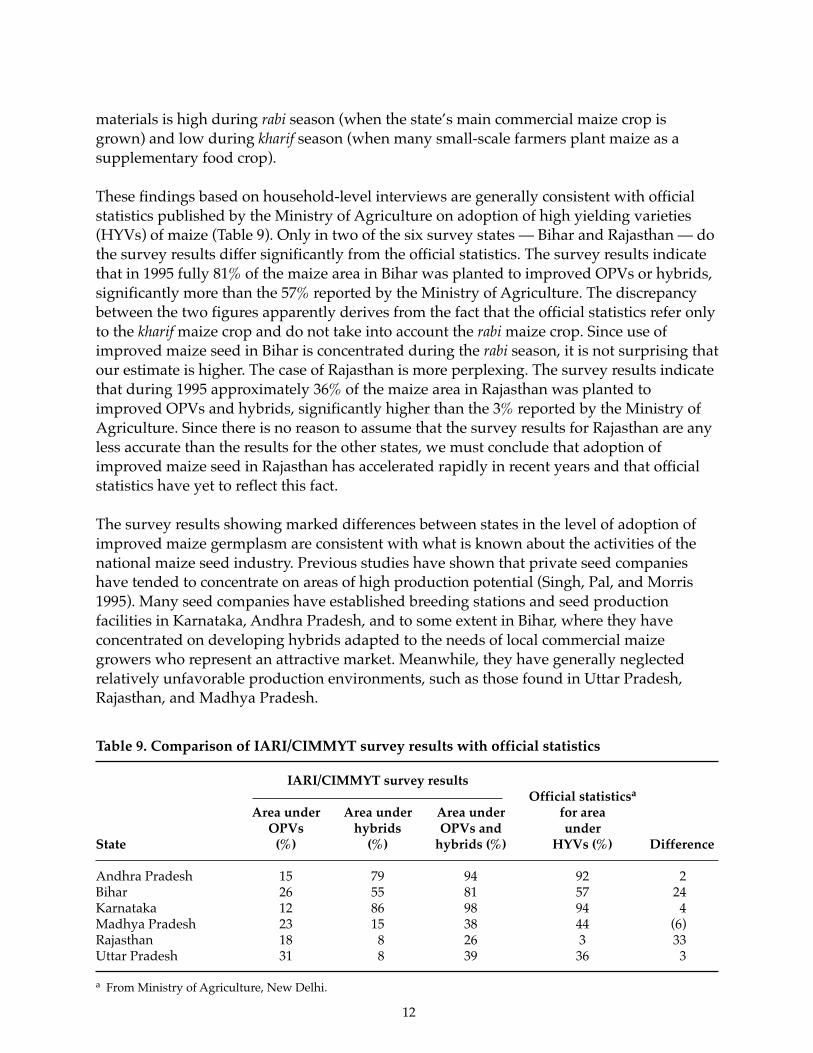
These findings based on household-level interviews are generally consistent with officialstatistics published by the Ministry of Agriculture on adoption of high yielding varieties(HYVs) of maize (Table 9). Only in two of the six survey states — Bihar and Rajasthan — dothe survey results differ significantly from the official statistics. The survey results indicatethat in 1995 fully 81% of the maize area in Bihar was planted to improved OPVs or hybrids,significantly more than the 57% reported by the Ministry of Agriculture. The discrepancybetween the two figures apparently derives from the fact that the official statistics refer onlyto the kharif maize crop and do not take into account the rabi maize crop. Since use ofimproved maize seed in Bihar is concentrated during the rabi season, it is not surprising thatour estimate is higher. The case of Rajasthan is more perplexing. The survey results indicatethat during 1995 approximately 36% of the maize area in Rajasthan was planted toimproved OPVs and hybrids, significantly higher than the 3% reported by the Ministry ofAgriculture. Since there is no reason to assume that the survey results for Rajasthan are anyless accurate than the results for the other states, we must conclude that adoption ofimproved maize seed in Rajasthan has accelerated rapidly in recent years and that officialstatistics have yet to reflect this fact.
The survey results showing marked differences between states in the level of adoption ofimproved maize germplasm are consistent with what is known about the activities of thenational maize seed industry. Previous studies have shown that private seed companieshave tended to concentrate on areas of high production potential (Singh, Pal, and Morris1995). Many seed companies have established breeding stations and seed productionfacilities in Karnataka, Andhra Pradesh, and to some extent in Bihar, where they haveconcentrated on developing hybrids adapted to the needs of local commercial maizegrowers who represent an attractive market. Meanwhile, they have generally neglectedrelatively unfavorable production environments, such as those found in Uttar Pradesh,Rajasthan, and Madhya Pradesh.
Table 9. Comparison of IARI/CIMMYT survey results with official statistics
IARI/CIMMYT survey resultsOfficial statisticsa
Area under Area under Area under for areaOPVs hybrids OPVs and under
State (%) (%) hybrids (%) HYVs (%) Difference
Andhra Pradesh 15 79 94 92 2Bihar 26 55 81 57 24Karnataka 12 86 98 94 4Madhya Pradesh 23 15 38 44 (6)Rajasthan 18 8 26 3 33Uttar Pradesh 31 8 39 36 3
a From Ministry of Agriculture, New Delhi.
13
Production Practices and Input UseAlthough improved seed can make a contribution to productivity independently of otherinputs, it also has the ability to increase the productivity of other inputs. If farmers canobtain hybrid seed that performs well under local conditions, the efficiency with whichother inputs are converted into economically valuable outputs increases, which increasesthe incentives to invest in the other inputs. Therefore it is not surprising that technicalchange in agriculture frequently is driven by changes in crop varieties, which in turndepend on farmers having reliable access to improved seed.
To what extent, if any, has adoption of hybrid maize seed among sample households beenaccompanied by changes in crop management practices?
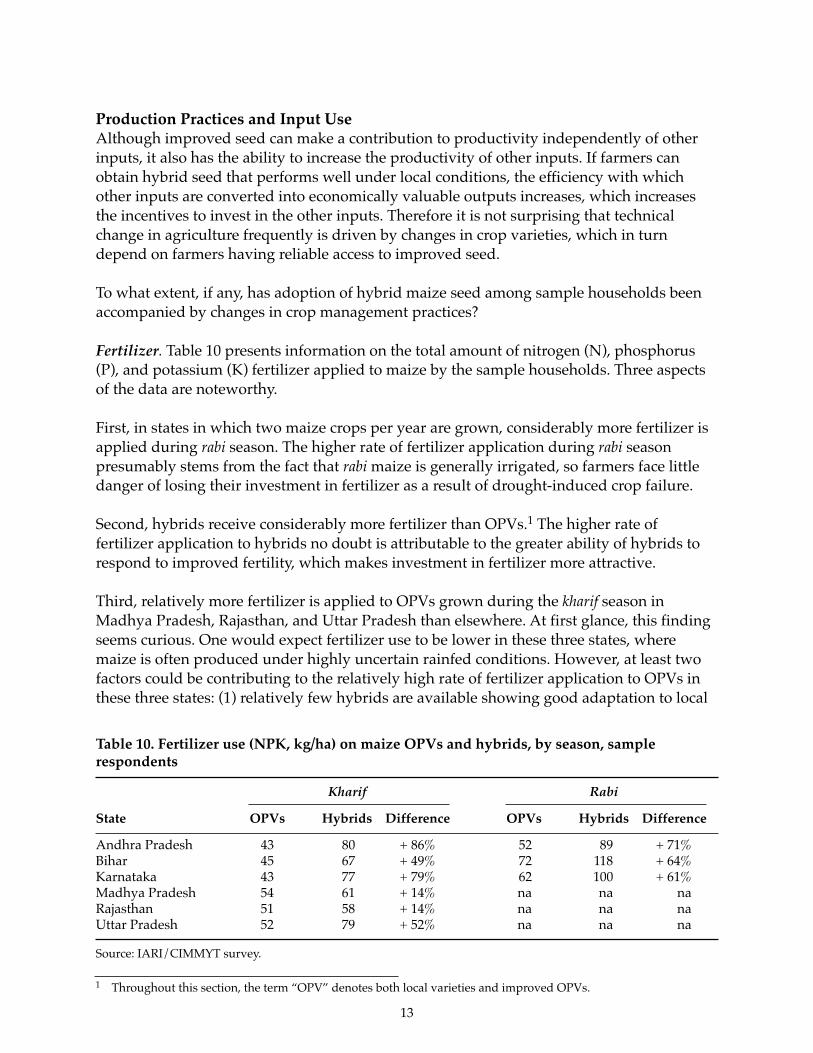
Fertilizer. Table 10 presents information on the total amount of nitrogen (N), phosphorus(P), and potassium (K) fertilizer applied to maize by the sample households. Three aspectsof the data are noteworthy.
First, in states in which two maize crops per year are grown, considerably more fertilizer isapplied during rabi season. The higher rate of fertilizer application during rabi seasonpresumably stems from the fact that rabi maize is generally irrigated, so farmers face littledanger of losing their investment in fertilizer as a result of drought-induced crop failure.
Second, hybrids receive considerably more fertilizer than OPVs.1 The higher rate offertilizer application to hybrids no doubt is attributable to the greater ability of hybrids torespond to improved fertility, which makes investment in fertilizer more attractive.
Third, relatively more fertilizer is applied to OPVs grown during the kharif season inMadhya Pradesh, Rajasthan, and Uttar Pradesh than elsewhere. At first glance, this findingseems curious. One would expect fertilizer use to be lower in these three states, wheremaize is often produced under highly uncertain rainfed conditions. However, at least twofactors could be contributing to the relatively high rate of fertilizer application to OPVs inthese three states: (1) relatively few hybrids are available showing good adaptation to local
Table 10. Fertilizer use (NPK, kg/ha) on maize OPVs and hybrids, by season, samplerespondents
Kharif Rabi
State OPVs Hybrids Difference OPVs Hybrids Difference
Andhra Pradesh 43 80 + 86% 52 89 + 71%Bihar 45 67 + 49% 72 118 + 64%Karnataka 43 77 + 79% 62 100 + 61%Madhya Pradesh 54 61 + 14% na na naRajasthan 51 58 + 14% na na naUttar Pradesh 52 79 + 52% na na na
Source: IARI/CIMMYT survey.
1 Throughout this section, the term “OPV” denotes both local varieties and improved OPVs.
14
conditions (so farmers prefer OPVs), and (2) only one maize crop per year is grown in thesethree states (so farmers apply more fertilizer because there is no carry-over effect fromfertilizer applied during the rabi season).
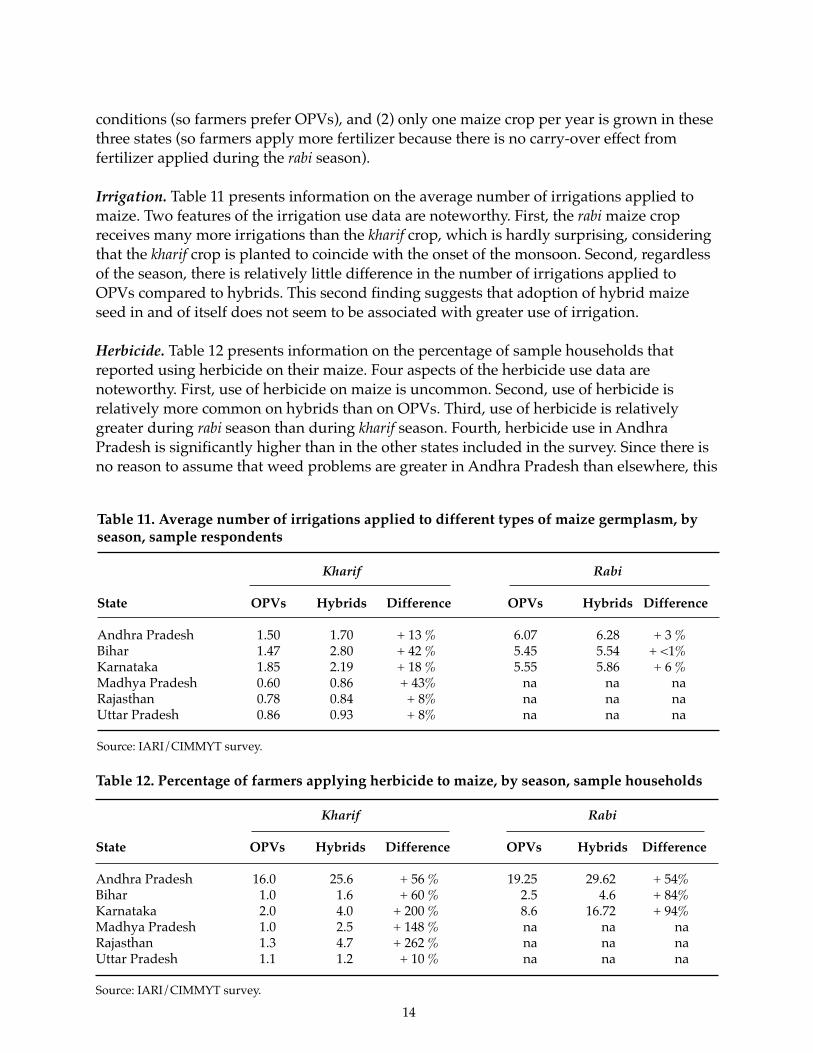
Irrigation. Table 11 presents information on the average number of irrigations applied tomaize. Two features of the irrigation use data are noteworthy. First, the rabi maize cropreceives many more irrigations than the kharif crop, which is hardly surprising, consideringthat the kharif crop is planted to coincide with the onset of the monsoon. Second, regardlessof the season, there is relatively little difference in the number of irrigations applied toOPVs compared to hybrids. This second finding suggests that adoption of hybrid maizeseed in and of itself does not seem to be associated with greater use of irrigation.
Herbicide. Table 12 presents information on the percentage of sample households thatreported using herbicide on their maize. Four aspects of the herbicide use data arenoteworthy. First, use of herbicide on maize is uncommon. Second, use of herbicide isrelatively more common on hybrids than on OPVs. Third, use of herbicide is relativelygreater during rabi season than during kharif season. Fourth, herbicide use in AndhraPradesh is significantly higher than in the other states included in the survey. Since there isno reason to assume that weed problems are greater in Andhra Pradesh than elsewhere, this
Table 11. Average number of irrigations applied to different types of maize germplasm, byseason, sample respondents
Kharif Rabi
State OPVs Hybrids Difference OPVs Hybrids Difference
Andhra Pradesh 1.50 1.70 + 13 % 6.07 6.28 + 3 %Bihar 1.47 2.80 + 42 % 5.45 5.54 + <1%Karnataka 1.85 2.19 + 18 % 5.55 5.86 + 6 %Madhya Pradesh 0.60 0.86 + 43% na na naRajasthan 0.78 0.84 + 8% na na naUttar Pradesh 0.86 0.93 + 8% na na na
Source: IARI/CIMMYT survey.
Table 12. Percentage of farmers applying herbicide to maize, by season, sample households
Kharif Rabi
State OPVs Hybrids Difference OPVs Hybrids Difference
Andhra Pradesh 16.0 25.6 + 56 % 19.25 29.62 + 54%Bihar 1.0 1.6 + 60 % 2.5 4.6 + 84%Karnataka 2.0 4.0 + 200 % 8.6 16.72 + 94%Madhya Pradesh 1.0 2.5 + 148 % na na naRajasthan 1.3 4.7 + 262 % na na naUttar Pradesh 1.1 1.2 + 10 % na na na
Source: IARI/CIMMYT survey.
15
result presumably means that maize growers in Andhra Pradesh have had greater exposureto herbicide and better appreciate its value.
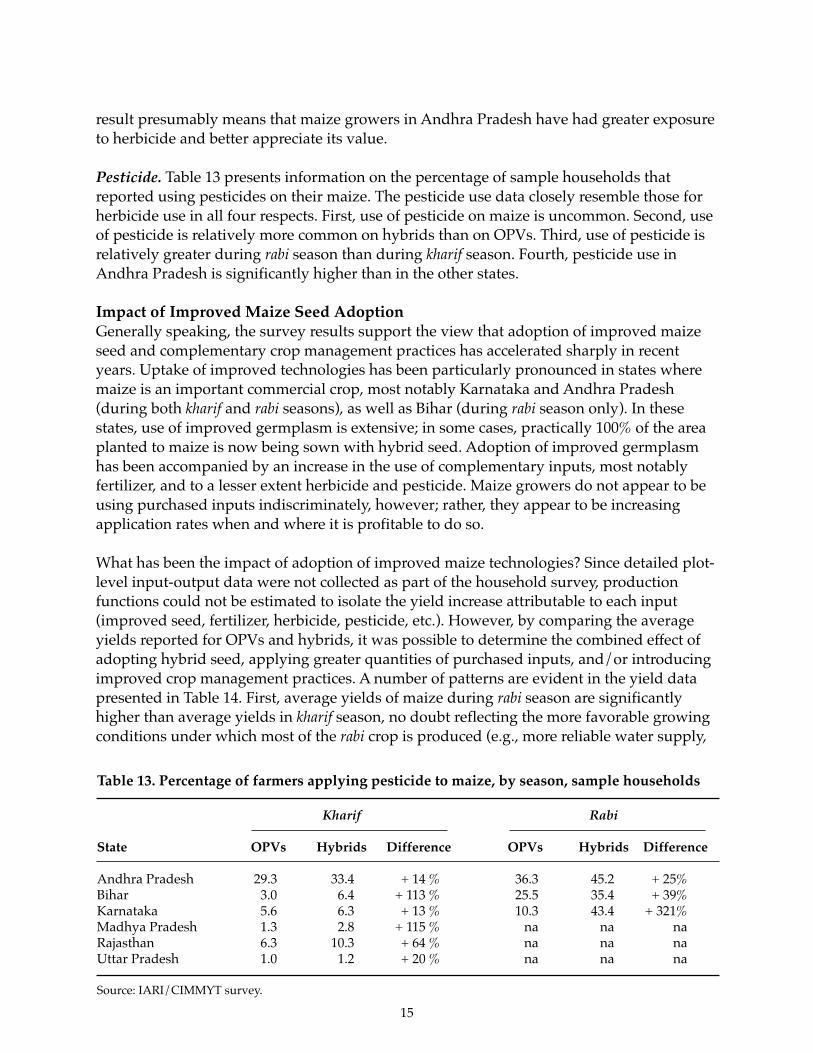
Pesticide. Table 13 presents information on the percentage of sample households thatreported using pesticides on their maize. The pesticide use data closely resemble those forherbicide use in all four respects. First, use of pesticide on maize is uncommon. Second, useof pesticide is relatively more common on hybrids than on OPVs. Third, use of pesticide isrelatively greater during rabi season than during kharif season. Fourth, pesticide use inAndhra Pradesh is significantly higher than in the other states.
Impact of Improved Maize Seed AdoptionGenerally speaking, the survey results support the view that adoption of improved maizeseed and complementary crop management practices has accelerated sharply in recentyears. Uptake of improved technologies has been particularly pronounced in states wheremaize is an important commercial crop, most notably Karnataka and Andhra Pradesh(during both kharif and rabi seasons), as well as Bihar (during rabi season only). In thesestates, use of improved germplasm is extensive; in some cases, practically 100% of the areaplanted to maize is now being sown with hybrid seed. Adoption of improved germplasmhas been accompanied by an increase in the use of complementary inputs, most notablyfertilizer, and to a lesser extent herbicide and pesticide. Maize growers do not appear to beusing purchased inputs indiscriminately, however; rather, they appear to be increasingapplication rates when and where it is profitable to do so.
What has been the impact of adoption of improved maize technologies? Since detailed plot-level input-output data were not collected as part of the household survey, productionfunctions could not be estimated to isolate the yield increase attributable to each input(improved seed, fertilizer, herbicide, pesticide, etc.). However, by comparing the averageyields reported for OPVs and hybrids, it was possible to determine the combined effect ofadopting hybrid seed, applying greater quantities of purchased inputs, and/or introducingimproved crop management practices. A number of patterns are evident in the yield datapresented in Table 14. First, average yields of maize during rabi season are significantlyhigher than average yields in kharif season, no doubt reflecting the more favorable growingconditions under which most of the rabi crop is produced (e.g., more reliable water supply,
Table 13. Percentage of farmers applying pesticide to maize, by season, sample households
Kharif Rabi
State OPVs Hybrids Difference OPVs Hybrids Difference
Andhra Pradesh 29.3 33.4 + 14 % 36.3 45.2 + 25%Bihar 3.0 6.4 + 113 % 25.5 35.4 + 39%Karnataka 5.6 6.3 + 13 % 10.3 43.4 + 321%Madhya Pradesh 1.3 2.8 + 115 % na na naRajasthan 6.3 10.3 + 64 % na na naUttar Pradesh 1.0 1.2 + 20 % na na na
Source: IARI/CIMMYT survey.
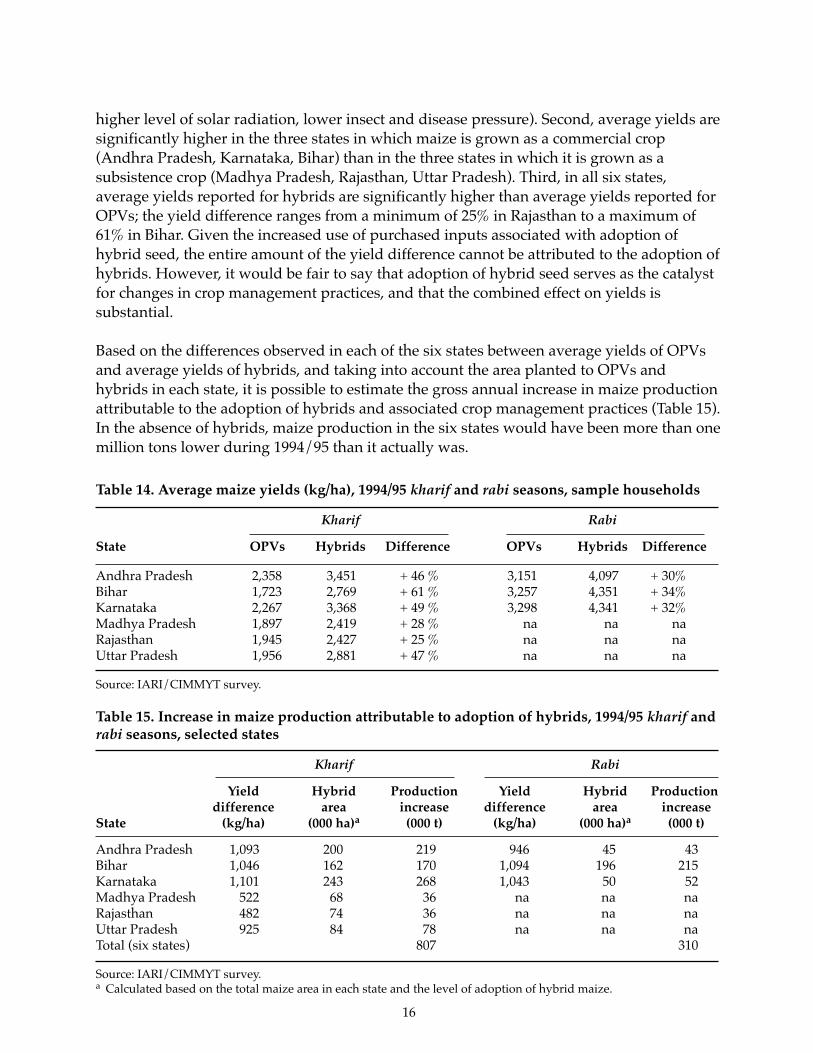
16
higher level of solar radiation, lower insect and disease pressure). Second, average yields aresignificantly higher in the three states in which maize is grown as a commercial crop(Andhra Pradesh, Karnataka, Bihar) than in the three states in which it is grown as asubsistence crop (Madhya Pradesh, Rajasthan, Uttar Pradesh). Third, in all six states,average yields reported for hybrids are significantly higher than average yields reported forOPVs; the yield difference ranges from a minimum of 25% in Rajasthan to a maximum of61% in Bihar. Given the increased use of purchased inputs associated with adoption ofhybrid seed, the entire amount of the yield difference cannot be attributed to the adoption ofhybrids. However, it would be fair to say that adoption of hybrid seed serves as the catalystfor changes in crop management practices, and that the combined effect on yields issubstantial.
Based on the differences observed in each of the six states between average yields of OPVsand average yields of hybrids, and taking into account the area planted to OPVs andhybrids in each state, it is possible to estimate the gross annual increase in maize productionattributable to the adoption of hybrids and associated crop management practices (Table 15).In the absence of hybrids, maize production in the six states would have been more than onemillion tons lower during 1994/95 than it actually was.
Table 14. Average maize yields (kg/ha), 1994/95 kharif and rabi seasons, sample households
Kharif Rabi
State OPVs Hybrids Difference OPVs Hybrids Difference
Andhra Pradesh 2,358 3,451 + 46 % 3,151 4,097 + 30%Bihar 1,723 2,769 + 61 % 3,257 4,351 + 34%Karnataka 2,267 3,368 + 49 % 3,298 4,341 + 32%Madhya Pradesh 1,897 2,419 + 28 % na na naRajasthan 1,945 2,427 + 25 % na na naUttar Pradesh 1,956 2,881 + 47 % na na na
Source: IARI/CIMMYT survey.
Table 15. Increase in maize production attributable to adoption of hybrids, 1994/95 kharif andrabi seasons, selected states
Kharif Rabi
Yield Hybrid Production Yield Hybrid Productiondifference area increase difference area increase
State (kg/ha) (000 ha)a (000 t) (kg/ha) (000 ha)a (000 t)
Andhra Pradesh 1,093 200 219 946 45 43Bihar 1,046 162 170 1,094 196 215Karnataka 1,101 243 268 1,043 50 52Madhya Pradesh 522 68 36 na na naRajasthan 482 74 36 na na naUttar Pradesh 925 84 78 na na naTotal (six states) 807 310
Source: IARI/CIMMYT survey.a Calculated based on the total maize area in each state and the level of adoption of hybrid maize.
17
Procurement and Management of Improved Maize Seed
The aggregate data on varietal adoption and diffusion patterns indicate where improvedmaize germplasm has made an impact, but they reveal little about what is actuallyhappening at the farm level. To shed light on microlevel aspects of hybrid seed use,households were questioned about their seed acquisition and management practices.
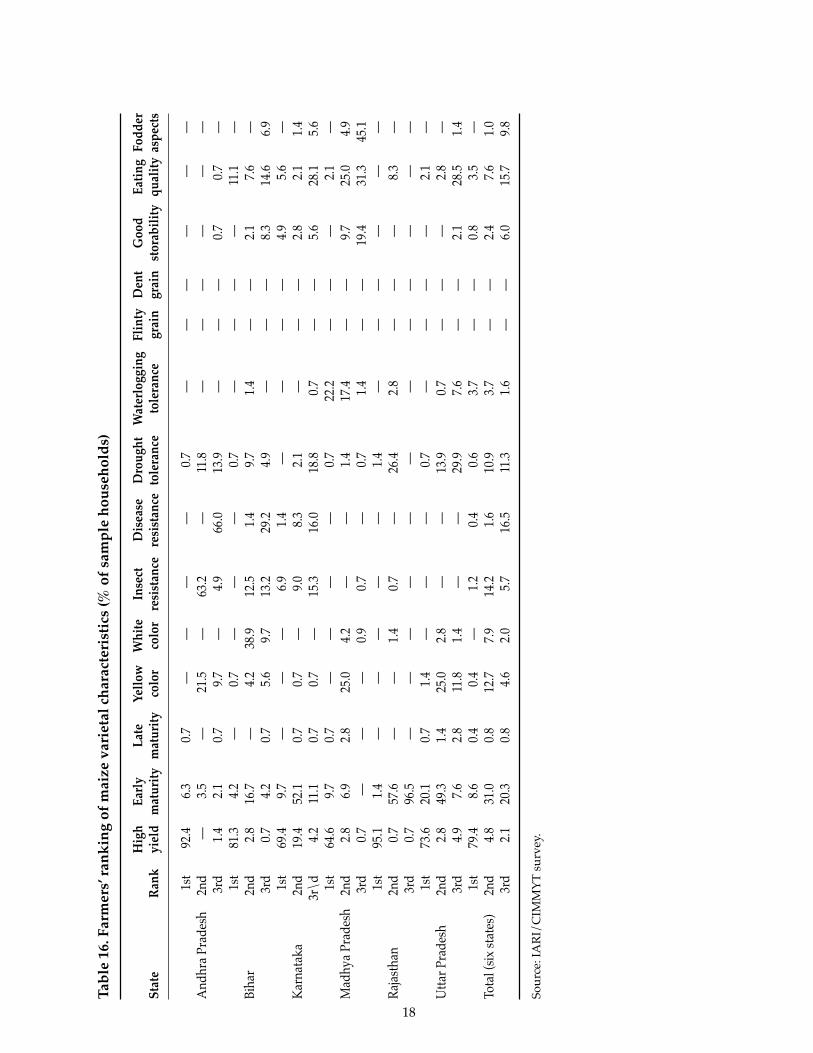
Maize Varietal PreferencesWhat characteristics do Indian farmers look for in a maize variety or hybrid? Surveyparticipants were asked to cite the three characteristics that they consider most important inselecting a maize OPV or hybrid. In all six states, high yield was consistently ranked as themost important characteristic (Table 16). The second and third most importantcharacteristics varied between states, ranging from agronomic performance (e.g., earlymaturity, drought tolerance) to resistance to biotic stresses (insects or diseases), grain color,fodder aspects, storage characteristics, and eating quality.
Although it is difficult to discern clear patterns in the responses, several trends stand out.Early maturity and/or drought tolerance were consistently mentioned in all six states,indicating that lack of a reliable water supply remains a major problem in most productionenvironments. (This tendency was most evident in the exceptionally dry state of Rajasthan,where early maturity and drought tolerance were cited as important by almost allhouseholds – virtually to the exclusion of all other characteristics.) Insect and diseaseresistance were frequently mentioned in the southernmost states of Andhra Pradesh andKarnataka, presumably reflecting the greater incidence of disease and insect pressure inthese states’ warmer, moister production environments. Grain color was mentioned inseveral states; interestingly, many households in Andhra Pradesh, Madhya Pradesh, andUttar Pradesh expressed a preference for yellow grain, while many households in Biharfavored white grain. In no state was grain texture (flint versus dent) mentioned as animportant characteristic. Eating quality was considered important in several states,particularly those in which maize is a major food crop. Only in Madhya Pradesh werefodder aspects cited as important.
Generally speaking, the data presented in Table 16 reinforce the notion that maize varietalpreferences vary considerably from one production environment to the other. All thingsbeing equal, maize-growing households prefer OPVs and hybrids that yield well, but thecharacteristics associated with high yield vary according to each production environment.Consumption characteristics are also important, with consumer preferences once againvarying from one region to another.
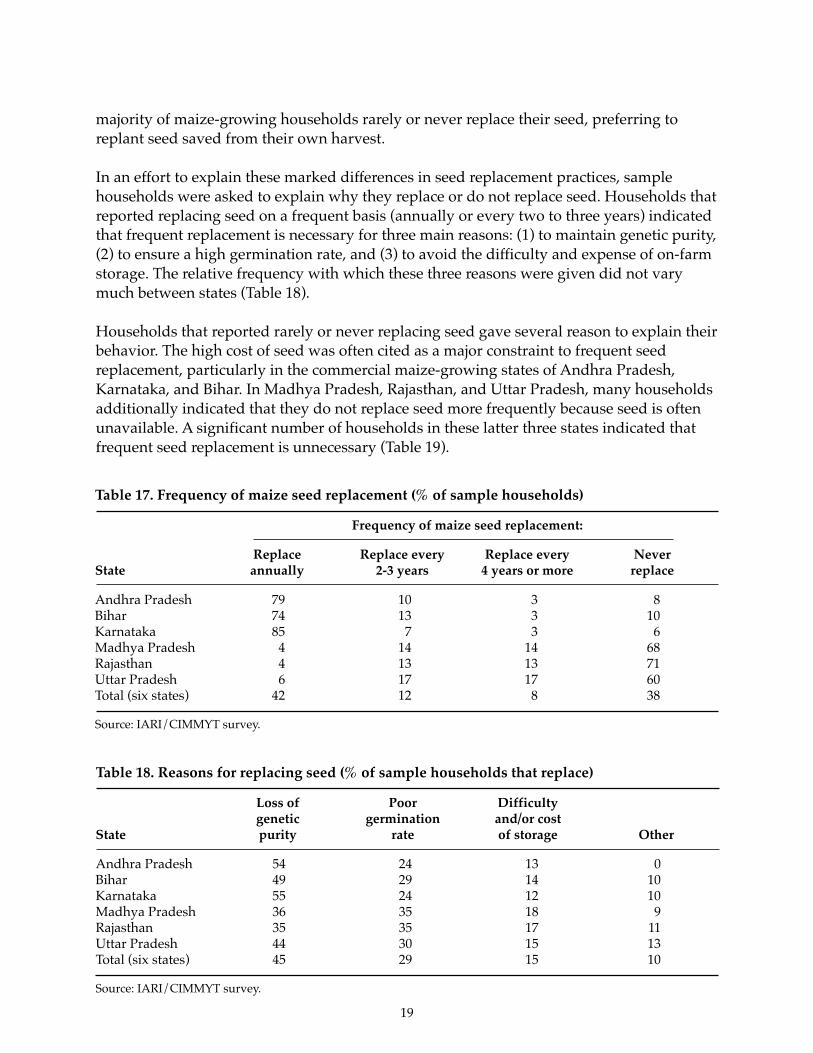
Seed Replacement PatternsHow often do Indian maize farmers replace their seed? Table 17 presents informationreported by sample households on the frequency of maize seed replacement. In AndhraPradesh, Karnataka, and Bihar, states in which maize is an important commercial crop andadoption of hybrids is extensive, the vast majority of maize-growing households replacetheir seed annually. But in Madhya Pradesh, Rajasthan, and Uttar Pradesh, states in whichmaize is grown mainly for home consumption and adoption of hybrids is low, the vast
18
Tab
le 1
6. F
arm
ers’
ran
kin
g of
mai
ze v
arie
tal c
har
acte
rist
ics
(% o
f sa
mp
le h
ouse
hol
ds)
Hig
hEa
rly
Late
Yell
owW
hite
Inse
ctD
isea
seD
roug
htW
ater
logg
ing
Flin
tyD
ent
Goo
dEa
ting
Fodd
erSt
ate
Ran
kyi
eld
mat
urit
ym
atur
ity
colo
rco
lor
resi
stan
cere
sist
ance
tole
ranc
eto
lera
nce
grai
ngr
ain
stor
abil
ity
qual
ity
aspe
cts
1st
92.4
6.3
0.7
——
——
0.7
——
——
——
And
hra
Prad
esh
2nd
—3.
5—
21.5
—63
.2—
11.8
——
——
——
3rd
1.4
2.1
0.7
9.7
—4.
966
.013
.9—
——
0.7
0.7
—1s
t81
.34.
2—
0.7
——
—0.
7—
——
—11
.1—
Biha
r2n
d2.
816
.7—
4.2
38.9
12.5
1.4
9.7
1.4
——
2.1
7.6
—3r
d0.
74.
20.
75.
69.
713
.229
.24.
9—
——
8.3
14.6
6.9
1st
69.4
9.7
——
—6.
91.
4—
——
—4.
95.
6—
Kar
nata
ka2n
d19
.452
.10.
70.
7—
9.0
8.3
2.1
——
—2.
82.
11.
43r
\d4.
211
.10.
70.
7—
15.3
16.0
18.8
0.7
——
5.6
28.1
5.6
1st
64.6
9.7
0.7
——
——
0.7
22.2
——
—2.
1—
Mad
hya
Prad
esh
2nd
2.8
6.9
2.8
25.0
4.2
——
1.4
17.4
——
9.7
25.0
4.9
3rd
0.7
——
—0.
90.
7—
0.7
1.4
——
19.4
31.3
45.1
1st
95.1
1.4
——
——
—1.
4—
——
——
—Ra
jast
han
2nd
0.7
57.6
——
1.4
0.7
—26
.42.
8—
——
8.3
—3r
d0.
796
.5—
——
——
——
——
——
—1s
t73
.620
.10.
71.
4—
——
0.7
——
——
2.1
—U
ttar P
rade
sh2n
d2.
849
.31.
425
.02.
8—
—13
.90.
7—
——
2.8
—3r
d4.
97.
62.
811
.81.
4—
—29
.97.
6—
—2.
128
.51.
41s
t79
.48.
60.
40.
4—
1.2
0.4
0.6
3.7
——
0.8
3.5
—To
tal (
six
stat
es)
2nd
4.8
31.0
0.8
12.7
7.9
14.2
1.6
10.9
3.7
——
2.4
7.6
1.0
3rd
2.1
20.3
0.8
4.6
2.0
5.7
16.5
11.3
1.6
——
6.0
15.7
9.8
Sour
ce: I
AR
I/C
IMM
YT
sur
vey.
19
majority of maize-growing households rarely or never replace their seed, preferring toreplant seed saved from their own harvest.
In an effort to explain these marked differences in seed replacement practices, samplehouseholds were asked to explain why they replace or do not replace seed. Households thatreported replacing seed on a frequent basis (annually or every two to three years) indicatedthat frequent replacement is necessary for three main reasons: (1) to maintain genetic purity,(2) to ensure a high germination rate, and (3) to avoid the difficulty and expense of on-farmstorage. The relative frequency with which these three reasons were given did not varymuch between states (Table 18).
Households that reported rarely or never replacing seed gave several reason to explain theirbehavior. The high cost of seed was often cited as a major constraint to frequent seedreplacement, particularly in the commercial maize-growing states of Andhra Pradesh,Karnataka, and Bihar. In Madhya Pradesh, Rajasthan, and Uttar Pradesh, many householdsadditionally indicated that they do not replace seed more frequently because seed is oftenunavailable. A significant number of households in these latter three states indicated thatfrequent seed replacement is unnecessary (Table 19).
Table 17. Frequency of maize seed replacement (% of sample households)
Frequency of maize seed replacement:
Replace Replace every Replace every NeverState annually 2-3 years 4 years or more replace
Andhra Pradesh 79 10 3 8Bihar 74 13 3 10Karnataka 85 7 3 6Madhya Pradesh 4 14 14 68Rajasthan 4 13 13 71Uttar Pradesh 6 17 17 60Total (six states) 42 12 8 38
Source: IARI/CIMMYT survey.
Table 18. Reasons for replacing seed (% of sample households that replace)
Loss of Poor Difficultygenetic germination and/or cost
State purity rate of storage Other
Andhra Pradesh 54 24 13 0Bihar 49 29 14 10Karnataka 55 24 12 10Madhya Pradesh 36 35 18 9Rajasthan 35 35 17 11Uttar Pradesh 44 30 15 13Total (six states) 45 29 15 10
Source: IARI/CIMMYT survey.
20
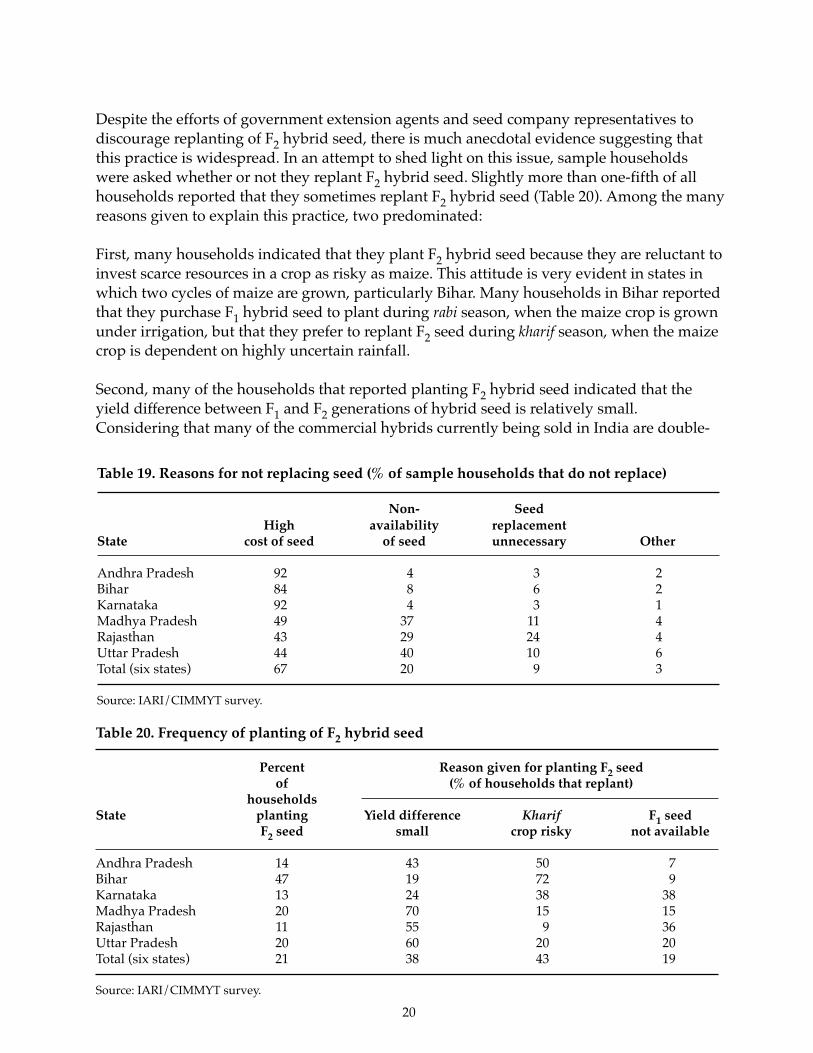
Despite the efforts of government extension agents and seed company representatives todiscourage replanting of F2 hybrid seed, there is much anecdotal evidence suggesting thatthis practice is widespread. In an attempt to shed light on this issue, sample householdswere asked whether or not they replant F2 hybrid seed. Slightly more than one-fifth of allhouseholds reported that they sometimes replant F2 hybrid seed (Table 20). Among the manyreasons given to explain this practice, two predominated:
First, many households indicated that they plant F2 hybrid seed because they are reluctant toinvest scarce resources in a crop as risky as maize. This attitude is very evident in states inwhich two cycles of maize are grown, particularly Bihar. Many households in Bihar reportedthat they purchase F1 hybrid seed to plant during rabi season, when the maize crop is grownunder irrigation, but that they prefer to replant F2 seed during kharif season, when the maizecrop is dependent on highly uncertain rainfall.
Second, many of the households that reported planting F2 hybrid seed indicated that theyield difference between F1 and F2 generations of hybrid seed is relatively small.Considering that many of the commercial hybrids currently being sold in India are double-
Table 19. Reasons for not replacing seed (% of sample households that do not replace)
Non- SeedHigh availability replacement
State cost of seed of seed unnecessary Other
Andhra Pradesh 92 4 3 2Bihar 84 8 6 2Karnataka 92 4 3 1Madhya Pradesh 49 37 11 4Rajasthan 43 29 24 4Uttar Pradesh 44 40 10 6Total (six states) 67 20 9 3
Source: IARI/CIMMYT survey.
Table 20. Frequency of planting of F2 hybrid seed
Percent Reason given for planting F2 seedof (% of households that replant)
householdsState planting Yield difference Kharif F1 seed
F2 seed small crop risky not available
Andhra Pradesh 14 43 50 7Bihar 47 19 72 9Karnataka 13 24 38 38Madhya Pradesh 20 70 15 15Rajasthan 11 55 9 36Uttar Pradesh 20 60 20 20Total (six states) 21 38 43 19
Source: IARI/CIMMYT survey.
21
cross hybrids, this is undoubtedly correct; the expected yield decline in the F2 generation ofmany double-cross hybrids is as low as 10-15%. Depending on the circumstances, andtaking into account the possibility of weather-induced crop failure, farmers thus may beacting entirely rationally in planting F2 hybrids.
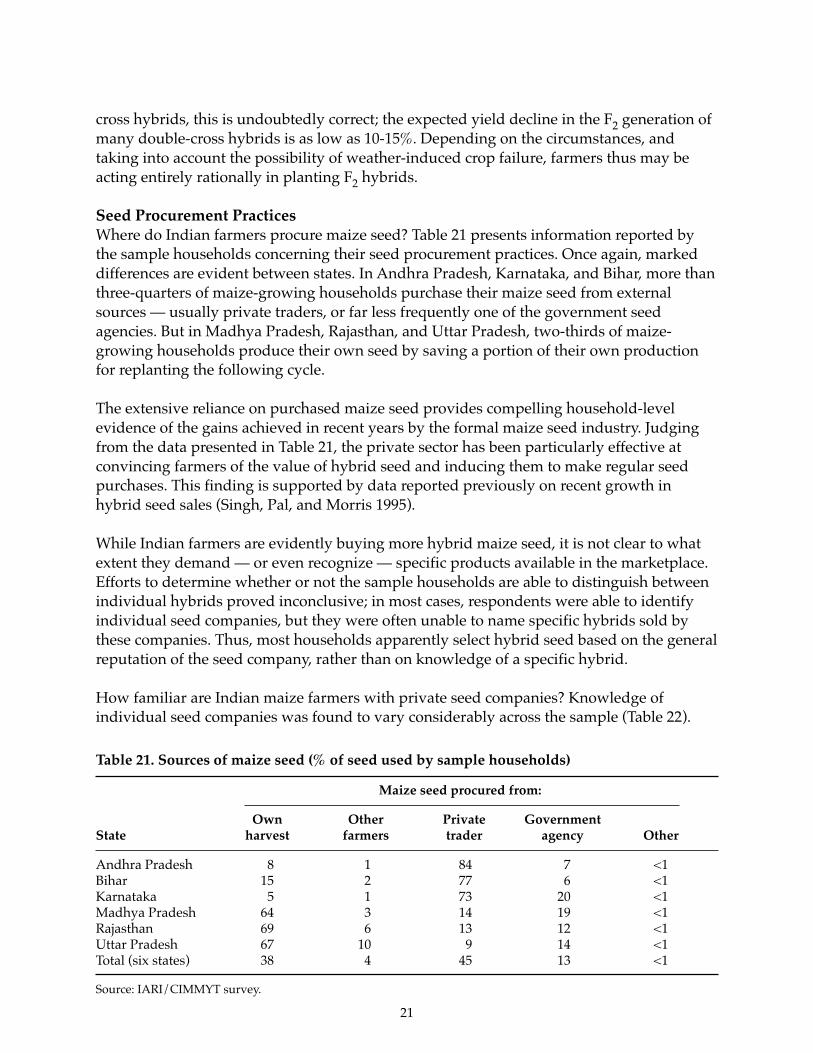
Seed Procurement PracticesWhere do Indian farmers procure maize seed? Table 21 presents information reported bythe sample households concerning their seed procurement practices. Once again, markeddifferences are evident between states. In Andhra Pradesh, Karnataka, and Bihar, more thanthree-quarters of maize-growing households purchase their maize seed from externalsources — usually private traders, or far less frequently one of the government seedagencies. But in Madhya Pradesh, Rajasthan, and Uttar Pradesh, two-thirds of maize-growing households produce their own seed by saving a portion of their own productionfor replanting the following cycle.
The extensive reliance on purchased maize seed provides compelling household-levelevidence of the gains achieved in recent years by the formal maize seed industry. Judgingfrom the data presented in Table 21, the private sector has been particularly effective atconvincing farmers of the value of hybrid seed and inducing them to make regular seedpurchases. This finding is supported by data reported previously on recent growth inhybrid seed sales (Singh, Pal, and Morris 1995).
While Indian farmers are evidently buying more hybrid maize seed, it is not clear to whatextent they demand — or even recognize — specific products available in the marketplace.Efforts to determine whether or not the sample households are able to distinguish betweenindividual hybrids proved inconclusive; in most cases, respondents were able to identifyindividual seed companies, but they were often unable to name specific hybrids sold bythese companies. Thus, most households apparently select hybrid seed based on the generalreputation of the seed company, rather than on knowledge of a specific hybrid.
How familiar are Indian maize farmers with private seed companies? Knowledge ofindividual seed companies was found to vary considerably across the sample (Table 22).
Table 21. Sources of maize seed (% of seed used by sample households)
Maize seed procured from:
Own Other Private GovernmentState harvest farmers trader agency Other
Andhra Pradesh 8 1 84 7 <1Bihar 15 2 77 6 <1Karnataka 5 1 73 20 <1Madhya Pradesh 64 3 14 19 <1Rajasthan 69 6 13 12 <1Uttar Pradesh 67 10 9 14 <1Total (six states) 38 4 45 13 <1
Source: IARI/CIMMYT survey.
22
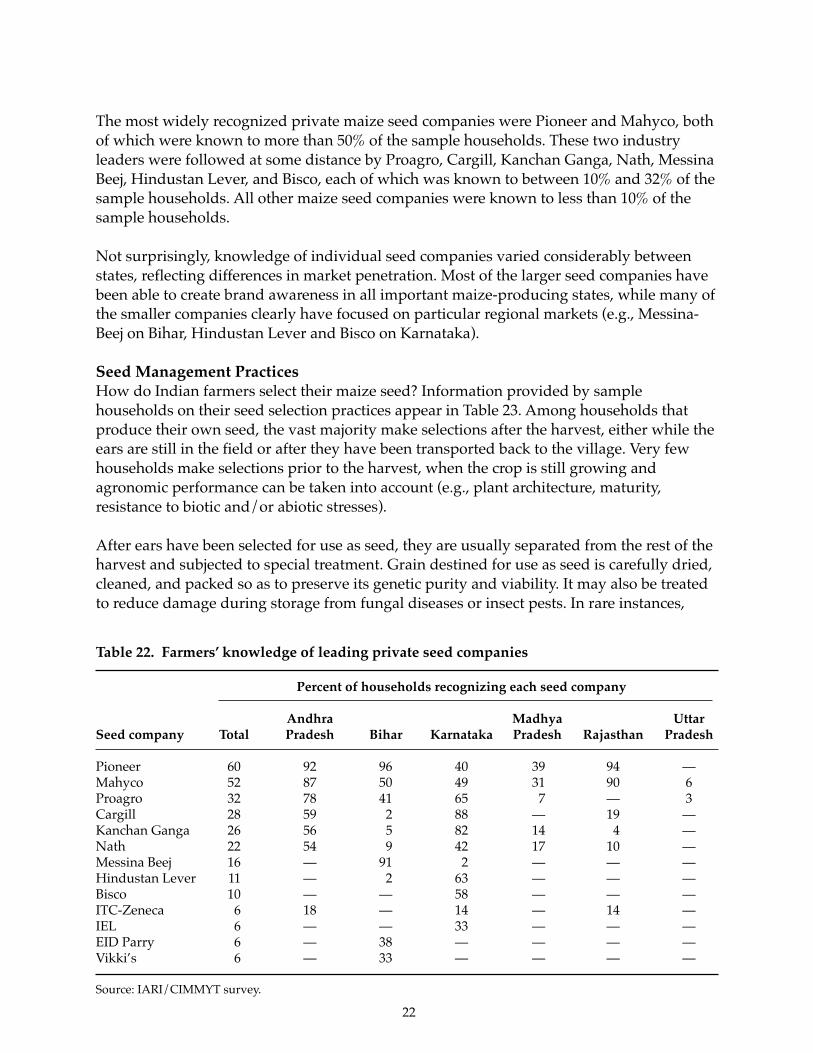
The most widely recognized private maize seed companies were Pioneer and Mahyco, bothof which were known to more than 50% of the sample households. These two industryleaders were followed at some distance by Proagro, Cargill, Kanchan Ganga, Nath, MessinaBeej, Hindustan Lever, and Bisco, each of which was known to between 10% and 32% of thesample households. All other maize seed companies were known to less than 10% of thesample households.
Not surprisingly, knowledge of individual seed companies varied considerably betweenstates, reflecting differences in market penetration. Most of the larger seed companies havebeen able to create brand awareness in all important maize-producing states, while many ofthe smaller companies clearly have focused on particular regional markets (e.g., Messina-Beej on Bihar, Hindustan Lever and Bisco on Karnataka).
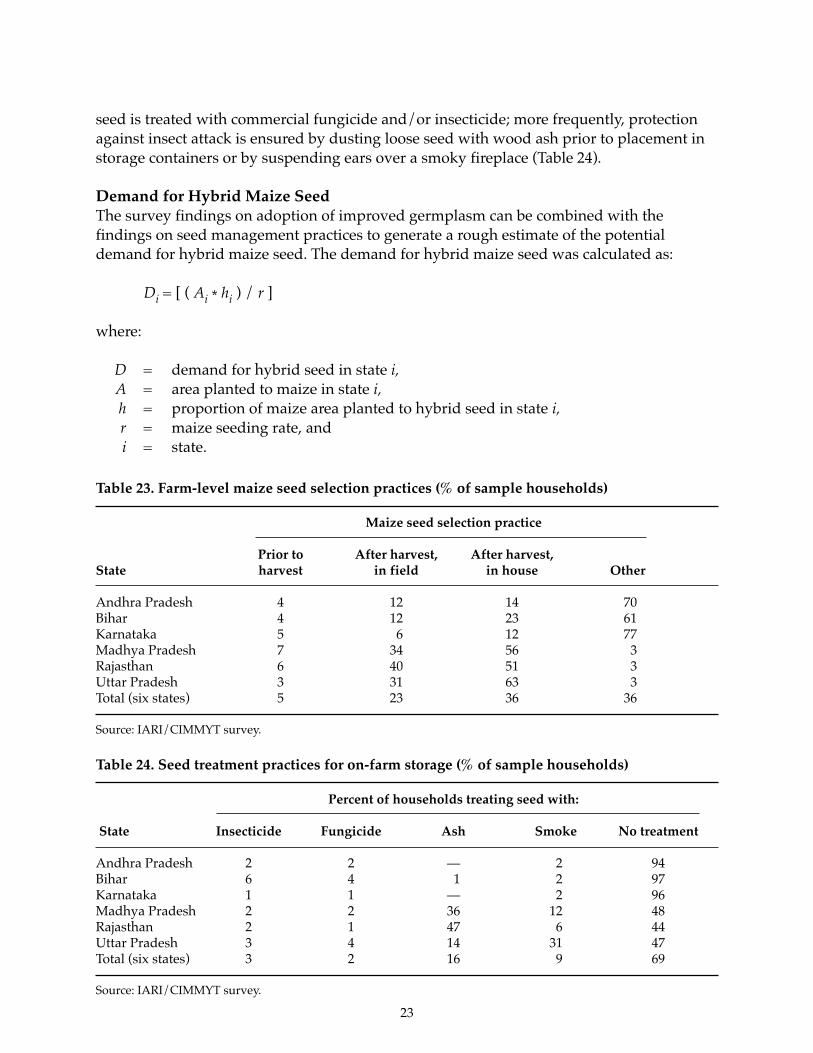
Seed Management PracticesHow do Indian farmers select their maize seed? Information provided by samplehouseholds on their seed selection practices appear in Table 23. Among households thatproduce their own seed, the vast majority make selections after the harvest, either while theears are still in the field or after they have been transported back to the village. Very fewhouseholds make selections prior to the harvest, when the crop is still growing andagronomic performance can be taken into account (e.g., plant architecture, maturity,resistance to biotic and/or abiotic stresses).
After ears have been selected for use as seed, they are usually separated from the rest of theharvest and subjected to special treatment. Grain destined for use as seed is carefully dried,cleaned, and packed so as to preserve its genetic purity and viability. It may also be treatedto reduce damage during storage from fungal diseases or insect pests. In rare instances,
Table 22. Farmers’ knowledge of leading private seed companies
Percent of households recognizing each seed company
Andhra Madhya UttarSeed company Total Pradesh Bihar Karnataka Pradesh Rajasthan Pradesh
Pioneer 60 92 96 40 39 94 —Mahyco 52 87 50 49 31 90 6Proagro 32 78 41 65 7 — 3Cargill 28 59 2 88 — 19 —Kanchan Ganga 26 56 5 82 14 4 —Nath 22 54 9 42 17 10 —Messina Beej 16 — 91 2 — — —Hindustan Lever 11 — 2 63 — — —Bisco 10 — — 58 — — —ITC-Zeneca 6 18 — 14 — 14 —IEL 6 — — 33 — — —EID Parry 6 — 38 — — — —Vikki’s 6 — 33 — — — —
Source: IARI/CIMMYT survey.
23
seed is treated with commercial fungicide and/or insecticide; more frequently, protectionagainst insect attack is ensured by dusting loose seed with wood ash prior to placement instorage containers or by suspending ears over a smoky fireplace (Table 24).
Demand for Hybrid Maize SeedThe survey findings on adoption of improved germplasm can be combined with thefindings on seed management practices to generate a rough estimate of the potentialdemand for hybrid maize seed. The demand for hybrid maize seed was calculated as:
Di = [ ( Ai * hi ) / r ]
where:
D = demand for hybrid seed in state i,A = area planted to maize in state i,h = proportion of maize area planted to hybrid seed in state i,r = maize seeding rate, andi = state.
Table 23. Farm-level maize seed selection practices (% of sample households)
Maize seed selection practice
Prior to After harvest, After harvest,State harvest in field in house Other
Andhra Pradesh 4 12 14 70Bihar 4 12 23 61Karnataka 5 6 12 77Madhya Pradesh 7 34 56 3Rajasthan 6 40 51 3Uttar Pradesh 3 31 63 3Total (six states) 5 23 36 36
Source: IARI/CIMMYT survey.
Table 24. Seed treatment practices for on-farm storage (% of sample households)
Percent of households treating seed with:
State Insecticide Fungicide Ash Smoke No treatment
Andhra Pradesh 2 2 — 2 94Bihar 6 4 1 2 97Karnataka 1 1 — 2 96Madhya Pradesh 2 2 36 12 48Rajasthan 2 1 47 6 44Uttar Pradesh 3 4 14 31 47Total (six states) 3 2 16 9 69
Source: IARI/CIMMYT survey.
24
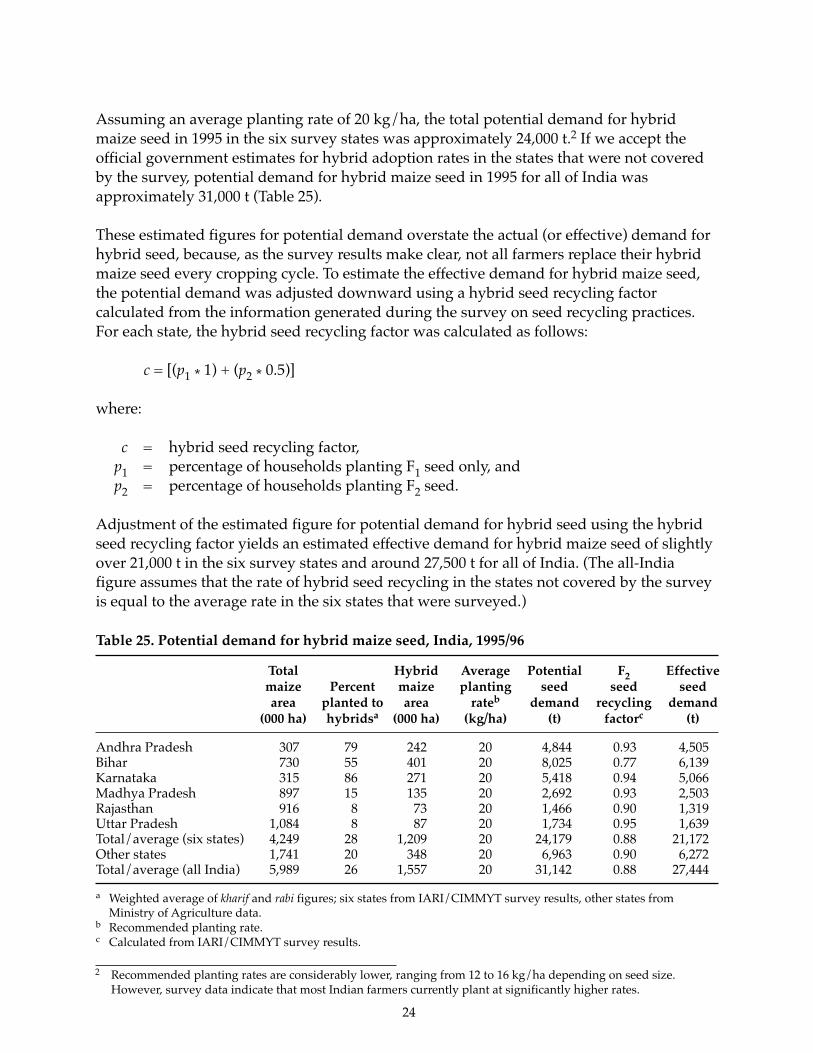
Assuming an average planting rate of 20 kg/ha, the total potential demand for hybridmaize seed in 1995 in the six survey states was approximately 24,000 t.2 If we accept theofficial government estimates for hybrid adoption rates in the states that were not coveredby the survey, potential demand for hybrid maize seed in 1995 for all of India wasapproximately 31,000 t (Table 25).
These estimated figures for potential demand overstate the actual (or effective) demand forhybrid seed, because, as the survey results make clear, not all farmers replace their hybridmaize seed every cropping cycle. To estimate the effective demand for hybrid maize seed,the potential demand was adjusted downward using a hybrid seed recycling factorcalculated from the information generated during the survey on seed recycling practices.For each state, the hybrid seed recycling factor was calculated as follows:
c = [(p1 * 1) + (p2 * 0.5)]
where:
c = hybrid seed recycling factor,p1 = percentage of households planting F1 seed only, andp2 = percentage of households planting F2 seed.
Adjustment of the estimated figure for potential demand for hybrid seed using the hybridseed recycling factor yields an estimated effective demand for hybrid maize seed of slightlyover 21,000 t in the six survey states and around 27,500 t for all of India. (The all-Indiafigure assumes that the rate of hybrid seed recycling in the states not covered by the surveyis equal to the average rate in the six states that were surveyed.)
Table 25. Potential demand for hybrid maize seed, India, 1995/96
Total Hybrid Average Potential F2 Effectivemaize Percent maize planting seed seed seedarea planted to area rateb demand recycling demand
(000 ha) hybridsa (000 ha) (kg/ha) (t) factorc (t)
Andhra Pradesh 307 79 242 20 4,844 0.93 4,505Bihar 730 55 401 20 8,025 0.77 6,139Karnataka 315 86 271 20 5,418 0.94 5,066Madhya Pradesh 897 15 135 20 2,692 0.93 2,503Rajasthan 916 8 73 20 1,466 0.90 1,319Uttar Pradesh 1,084 8 87 20 1,734 0.95 1,639Total/average (six states) 4,249 28 1,209 20 24,179 0.88 21,172Other states 1,741 20 348 20 6,963 0.90 6,272Total/average (all India) 5,989 26 1,557 20 31,142 0.88 27,444
a Weighted average of kharif and rabi figures; six states from IARI/CIMMYT survey results, other states fromMinistry of Agriculture data.
b Recommended planting rate.c Calculated from IARI/CIMMYT survey results.
2 Recommended planting rates are considerably lower, ranging from 12 to 16 kg/ha depending on seed size.However, survey data indicate that most Indian farmers currently plant at significantly higher rates.
25
In the absence of reliable data on commercial hybrid maize seed sales, it is difficult to assessthe reliability of these estimates. Based on a 1993 survey of the main government seedagencies and 21 leading private seed companies, Singh, Pal, and Morris (1995) estimatedthat hybrid maize seed production in 1992 totaled at least 13,000 t. Since many small privateseed companies were not included in the survey, the actual amount of hybrid seed beingproduced in 1992 was thought to be significantly higher. Given the rapid rate at whichhybrid seed sales have grown since the mid-1980s (Figure 3), it thus seems entirelyplausible that hybrid seed sales could have reached 27,500 t by 1995.
Summary and Policy Implications
Summary of Main FindingsSince India’s seed policies were reformed beginning in the late 1980s, improved maizegermplasm has diffused rapidly throughout many regions of the country. By 1995,approximately 45% of the total national area planted to maize was being planted toimproved OPVs and hybrids.3 Unlike earlier years, when farmers grew mainly public sectorhybrids, the majority of the hybrids now being grown are proprietary hybrids developed byprivate seed companies.
In India as in many other countries, uptake of improved maize germplasm has beenaccompanied by changes in crop management practices. Farmers who grow improvedOPVs and hybrids apply more fertilizer and use herbicides and insecticides with greaterfrequency than do farmers who grow local varieties. The change in behavior has aneconomic explanation: improved OPVs andhybrids have the ability to respond toimproved management practices, soincreased investment in purchased inputs isvery profitable. Diffusion of improvedgermplasm thus has served as an importantcatalyst for changes in crop managementpractices.
The gross annual increase in maizeproduction attributable to the adoption ofimproved seed and associated cropmanagement practices is estimated to beover one million tons. However, the benefitsassociated with adoption of improvedgermplasm have not been distributedequally, as adoption patterns showconsiderable spatial and temporal
3 In 1995, 51% of the maize area in the six states covered by the survey was planted to improved OPVs andhybrids. The estimated national adoption rate of 45% was obtained by combining this figure with officialstatistics on HYV adoption rates in states not covered by the survey.
�����������������
��������
�������������
14,000
12,000
10,000
8,000
6,000
4,000
2,000
01984 85 86 87 88 89 90 91 92
Figure 3. Sales of hybrid maize seed, India,1984-92.Source: 1993 IARI/CIMMYT seed industry study.
Hyb
rid
see
d s
ales
(t)
Private seed companies
Government seed agencies
26
variability. In states and/or cropping seasons in which maize is grown primarily bycommercial farmers (e.g., Andhra Pradesh, Karnataka, Bihar during rabi season), virtually100% of the maize area is planted to improved germplasm, including around 90% plantedto hybrids. But in states and/or cropping seasons in which maize is grown primarily bysubsistence-oriented farmers (e.g., Rajasthan, Madhya Pradesh, Uttar Pradesh, Bihar duringkharif season), use of improved germplasm is much less extensive, and hybrid adoptionlevels have yet to attain 10%.
Indian farmers exhibit clear preferences when it comes to selecting maize OPVs andhybrids. The varietal characteristics they take into account fall into two basic groups:(1) characteristics that contribute to high yield (e.g., early maturity, drought tolerance, insectresistance, disease resistance), and (2) characteristics that determine whether or not the cropmeets local consumption requirements (e.g., grain color, grain texture, taste, storability).Depending on their own particular circumstances, farmers place different degrees ofemphasis on the relative importance of different characteristics. In unfavorableenvironments characterized by high levels of production risk (including many rainfedregions), farmers often value early maturity and drought tolerance above all othercharacteristics. But in more favorable environments subject to low levels of production risk(including many high rainfall and irrigated zones), grain quality characteristics usuallyassume greater importance.
Farmers who grow OPVs generally replace their seed at infrequent intervals, preferringinstead to save seed from their own harvest for replanting the following cropping season.Most farmer-produced seed is selected following the harvest, once the crop has beentransported back to the village. Ears selected for use as seed are usually stored separatelyfrom regular grain and may be treated with purchased chemicals (e.g., fungicide,insecticide), ashes, or smoke to prevent disease and/or insect damage during storage.
Most of the farmers who have adopted hybrids understand the importance of regularlyreplacing seed. In states and/or cropping seasons in which use of hybrids is extensive, themajority of maize farmers replace their seed at the beginning of each cropping cycle.However, a significant number of farmers recycle hybrid seed; over one-fifth of thehouseholds surveyed reported planting F2 seed. Replanting recycled F2 seed may well berational when there is a high risk of crop failure, when the expected yield decline is low (asis frequently the case with double-cross hybrids), and/or when hybrid seed is expensive.
Although the market for hybrid maize seed in India is growing rapidly, knowledge ofspecific maize hybrids remains very limited. Most farmers select hybrid seed based on thereputation of the seed company, rather than on detailed knowledge about how a specificmaterial performs. Knowledge of individual seed companies varies considerably. A fewcompanies, notably Pioneer and Mahyco, have established national reputations and arewell known throughout India. Other companies, including Proagro, Cargill, KanchanGanga, Nath, Messina Beej, Hindustan Lever, and Bisco, are well known in some states butnot in others.
27
Implications for Seed PolicyFrom a policy perspective, the results presented in this paper provide grounds for bothoptimism and pessimism. On a positive note, our findings confirm that India’s nationalmaize seed industry is undergoing a phase of rapid expansion. Since seed policy reformswere introduced beginning in the late 1980s, the area planted to improved OPVs andhybrids has grown rapidly, and adoption of improved germplasm has fueled importantchanges in farmers’ crop management practices. Significantly, from a budgetary point ofview, these achievements have been realized during a period when the government hasactually scaled back its involvement in maize seed production, as evidenced by decliningvolumes of subsidized maize seed sold by the National Seeds Corporation and the variousState Seeds Corporations.
Efforts to liberalize the private maize seed industry are clearly paying off. Private seedcompanies have demonstrated the ability to develop superior hybrids, produce high qualityseed, and distribute that seed to farmers at affordable prices. Fears that the Indian maizeseed industry would be overrun by powerful multinational seed companies have provenlargely unfounded; although many multinationals have established a presence in India, theIndian maize seed industry continues to be populated by a large number of Indian-ownedcompanies that have demonstrated their ability to compete effectively in the marketplace.These positive developments send a strong signal that seed policy reforms are succeeding inbringing about their intended effects.
But despite the considerable progress that has been achieved thus far, policy makers wouldbe well advised to keep a close watch on future developments in the national maize seedindustry. If the Indian experience is at all similar to that of other countries, the diffusion ofimproved germplasm can be expected to slow once adoption levels in the commercialfarming sector approach 100%. When that happens, the industry may suddenly stopgrowing as seed companies realize that further expansion into marginal productionenvironments populated primarily by subsistence-oriented farmers is inherentlyunprofitable. At that point, instead of seeking to increase their sales by reaching out tofarmers who have never tried hybrids, seed companies may decide to focus their efforts oncapturing and retaining a bigger share of the limited – yet very lucrative — marketcomprised of commercial growers.
Although it is difficult to say just when growth in effective demand for improved maize seedwill cease, it can safely be predicted that at least for the foreseeable future, many of India’spoorest maize farmers are unlikely to provide attractive commercial opportunities for profit-oriented private firms. Since subsistence-oriented farmers are unlikely to be servedeffectively by the private seed industry, special policy measures will probably be needed toensure that the benefits of improved germplasm are widely distributed. Such policymeasures might include introduction of targeted input subsidies designed to reduce the costof adopting improved seed and complementary inputs (especially fertilizer), governmentinvestment in irrigation infrastructure designed to reduce production risk in drought-proneenvironments, and/or market development initiatives designed to provide small-scalemaize producers with access to stable and reliable outlets where they can sell surplus grain.
28
Implications for ResearchThe adoption data presented in this study indicate that India’s maize research system hasbeen quite successful in developing improved OPVs and hybrids that meet the needs of thenation’s commercial maize growers. Public and private breeding programs can both claim ashare of the credit for this success, because their activities are in many wayscomplementary. With the emergence of a flourishing private maize seed industry, manypublic breeding programs have begun to shift the main focus of their activities, moving“upstream” in the research pipeline in a conscious effort to strengthen their involvement inactivities that are unlikely to be performed by the private sector, such as prebreeding, basicpopulation improvement, development of special-trait germplasm, and inbreeding.Meanwhile, private seed companies have become adept at identifying specific markets anddeveloping commercial hybrids adapted to these markets. The growing collaborationbetween the public and private research systems has been reflected in recent years inincreasing interchanges of germplasm, information, and personnel.
Although the emergence of a flourishing private maize seed industry has relieved some ofthe pressure on public breeding programs, government research administrators must becareful to ensure that the allocation of research resources remains consistent with nationalpolicy objectives. In the past, maize breeding efforts in both the public and private sectorshave focused disproportionately on favorable production environments. This focus hasbeen understandable given the high expected payoffs in these environments, and up untilnow the strategy clearly has paid off. However, at some point a shift in focus will almostcertainly become necessary. With hybrid adoption levels in some states already exceeding90%, the expected returns from further research investment targeted at these states areundoubtedly declining, and eventually it may become appropriate to shift attentionelsewhere.
Addressing the special needs of maize growers located in marginal productionenvironments will not be easy. Experience suggests that it is usually very difficult to breedfor the traits required by these environments, especially early maturity, drought tolerance,and waterlogging tolerance. Even if it is possible to develop materials with these traits,effective demand for commercial seed will often be weak. For these reasons, privatecompanies are unlikely to show much interest in marginal environments, which means thatresponsibility for these environments is likely to fall squarely on the shoulders of the publicsector.
References
Pal, S., R.P. Singh, and M.L. Morris. 1998. Country case study: India. In M.L. Morris (ed.), Maize SeedIndustries in Developing Countries. Boulder, Colorado: Lynne Rienner Publishers andCIMMYT.
Singh, R.P., and S. Pal. 1992. Technological advancement and the state of maize development in India— An appraisal. Agricultural Situation in India 47(4): 245-252.
Singh, R.P., S. Pal, and M.L. Morris. 1995. Maize Research, Development, and Seed Production in India:Contributions of the Public and Private Sectors. CIMMYT Economics Working Paper 95-03.Mexico, D.F.: CIMMYT.
29
Recent Economics Working Papers
95-01 Emerging Roles of the Public and Private Sectors of Maize Seed Industries of theDeveloping WorldM.A. López-Pereira and M.P. Filippello
95-02 Maize Production Practices in Paraguay: Survey Findings and Implications forResearchM.L. Morris and M. Alvarez
95-03 Maize Research, Development, and Seed Production in India: Contributions of thePublic and Private SectorsR.P. Singh, S. Pal, and M. Morris
95-04 Triticale Production and Utilization in Tunisia: Constraints and ProspectsM.E. Saade
96-01 Fertilizer Use and Maize Production in Sub-Saharan AfricaP. Heisey and W. Mwangi
96-02 Understanding Global Trends in the Use of Wheat Diversity and InternationalFlows of Wheat Genetic ResourcesM. Smale and contributors
96-03 Adoption and Impact of High Yielding Wheat Varieties in Northern TunisiaM.E. Saade
97-01 The Contribution of Genetic Resources and Diversity to Wheat Productivity: A Casefrom the Punjab of PakistanJ. Hartell, M. Smale, P.W. Heisey, and B. Senauer
97-02 The Maize Seed Industries of Brazil and Mexico: Past Performance, Current Issues,and Future ProspectsM.A. López-Pereira and Joao Carlos Garcia
97-03 Farmers’ Use of Improved Seed Selection Practices in Mexican Maize: Evidence andIssues from the Sierra de Santa MartaE. Rice, M. Smale, and J.L. Blanco
97-04 Towards Reduced Pesticide Use for Cereal Crops in AsiaP.L. Pingali and R.V. Gerpacio
97-05 Organization and Performance of National Maize Seed Industries:A New Institutionalist PerspectiveM.L. Morris and M. Smale
97-06 Adoption, Management, and Impact of Hybrid Maize Seed in IndiaR.P. Singh and M.L. Morris
30
CIMMYT Research Report
No. 4 Maize Technology in Malawi: A Green Revolution in the Making?P.W. Heisey and M. Smale
CIMMYT World Wheat Facts and Trends
Supplement, 1995Ongoing Research at CIMMYT: Understanding Wheat Genetic Diversity and International
Flows of Genetic Resources
CIMMYT World Wheat Facts and Trends, 1995/96Understanding Global Trends in the Use of Wheat Genetic Diversity and InternationalFlows of Wheat Genetic Resources

International Maize and Wheat Improvement CenterCentro Internacional de Mejoramiento de Maíz y TrigoLisboa 27, Apartado Postal 6-641, 06600 México, D.F., México
ISSN: 0258-8587