Embed Size (px)
Citation preview
Adopted Budget for FY 2015
And
The Four Year Financial Plan FY 2016-2019
Shola Olatoye, Chair
Kyle E. Kimball, Vice Chair
Cecil R. House, General Manager
Richard D. Baron, Board Member
Derric Cephas, Board Member
Beatrice Byrd, Resident Board Member
Victor A. Gonzalez, Resident Board Member
Willie Mae Lewis, Resident Board Member
Richard Couch, Chief Financial Officer
Georgiana Okoroji, Budget Director
FY 2015 Page 2
Left Blank Intentional
FY 2015 Page 3
Table of Contents Summary ................................................................................................................................................................. 5
FY 2014 Accomplishments ............................................................................................................ 8
Budget Overview .................................................................................................................................................. 10
FY 2015 Budget and Financial Plan ....................................................................................................... 11
Operating Budget .................................................................................................................................... 11
Capital Budget ........................................................................................................................................ 13
Budget Gap ............................................................................................................................................. 14
Gap Closing Measures ............................................................................................................................ 18
Future Initiatives ................................................................................................................................. 20
Operating Budget .................................................................................................................................................. 22
Overview ................................................................................................................................................. 23
Operating Budget FY 2015 – FY 2019 ................................................................................................... 25
Operating Revenue .............................................................................................................................. 26
Operating Expenses ............................................................................................................................ 30
Departmental Budget Summary .......................................................................................................... 32
Head Count Plan ................................................................................................................................. 35
Departmental Operating Budgets .......................................................................................................................... 38
NYCHA Mission .................................................................................................................................... 39
Overview ................................................................................................................................................. 39
NYCHA Organizational Chart ................................................................................................................ 40
Key NYCHA Officials ............................................................................................................................ 41
Departmental Details .............................................................................................................................. 42
Chair .................................................................................................................................................... 42
External Affairs ................................................................................................................................... 52
General Manager ................................................................................................................................. 57
Operations ........................................................................................................................................... 61
Administration .................................................................................................................................... 77
Finance ................................................................................................................................................ 95
Information & Technology ............................................................................................................... 110
Community Program & Development .............................................................................................. 115
FY 2015 Page 4
Leased Housing ................................................................................................................................. 130
Supply Management ......................................................................................................................... 133
Capital Projects ................................................................................................................................. 138
Capital Budget .................................................................................................................................................... 147
Overview ............................................................................................................................................... 148
Use of Capital Funds ............................................................................................................................. 149
Other Eligible Costs .............................................................................................................................. 150
Financial Comparison: FY 2014 vs. FY 2015 ...................................................................................... 150
Rollover Policy ................................................................................................................................. 152
Capital Revenue Budget ................................................................................................................... 152
Capital Fund Program (CFP) ............................................................................................................ 152
2015 Initiatives .................................................................................................................................. 153
Capital Projects by Developments ...................................................................................................................... 158
Budget Process .................................................................................................................................................... 182
Overview of the Budget Process ........................................................................................................... 183
Operating Planning Process .................................................................................................................. 183
Capital Planning Process ....................................................................................................................... 184
Financial Management ........................................................................................................................................ 186
Budget Role ...................................................................................................................................... 187
Audit ................................................................................................................................................. 187
Debt ................................................................................................................................................... 189
Risk Finance ...................................................................................................................................... 196
Contract Registration ........................................................................................................................ 196
Fund Structure ..................................................................................................................................................... 197
Fund Structure Summary ...................................................................................................................... 198
Budgets by Fund ............................................................................................................................... 198
Fund Balance .................................................................................................................................... 198
NYCHA Fact Sheet ............................................................................................................................................. 205
Glossary of Terms ............................................................................................................................................... 209

FY 2015 Page 5
Summary
FY 2015 Page 6
The Fiscal Year (FY) 2015 budget along with a multi-year financial plan reflects the New York City
Housing Authority’s (NYCHA) efforts to achieve long-term fiscal stability. This plan consists of actions
within NYCHA’s control to address the realities of sharply diminishing Federal subsidies, escalating non-
discretionary costs and limited State aid to operate Public Housing.
In 2015, NYCHA faces a large budget deficit as a result of the continued diminishment of federal
operating funding and the limited amount of new aid provided by Washington and Albany. Therefore, the
NYCHA Board is taking the steps within its control to achieve long-term fiscal stability. Despite the
actions in this budget, deficits still remain. The Board is committed in taking the additional steps
necessary to close these, and future year gaps, if Albany and Washington do not provide additional
resources.
This budget provides a summary of key data, which includes expenditure detail, financial summary
tables, and narrative overviews related to NYCHA’s operations, programs, and financial policies and
procedures.
Public Housing
Public Housing is the oldest Federal program providing affordable housing for low- and moderate-income
families. New York City opened the Nation’s first Public Housing development in 1935. In the 1970’s,
the Federal effort to house the poor was expanded through the creation of the Section 8 program,
providing rent subsidies that enable very low-income families to lease apartments in the private housing
market. Both programs impose strict limits on the amount of rent that families pay. Operating assistance
is provided by the Federal government and is essential to bridge the gap between what residents pay and
the actual costs of operating the developments.
NYCHA’s conventional Public Housing program is the largest in the nation, As of January 1, 2015, it
comprises 177,666 apartments in 328 developments, and houses 175,747 families with 403,917
authorized residents. Of the population served, 27 percent of NYCHA residents are under age 18, and
over 19 percent are age 62 or more. The average household income is $23,310, and their average rent is
$464/month. (See Fact Sheet on page 162)
Currently there are 88,467 Section 8 apartments rented through the Leased Housing Program, serving
212,586 individuals. There are a total of 28,124 landlords who participate in the Section 8 Program. Units
in the Section 8 Program average $1,200/month rent, with the resident (“Tenant Share”) paying an
average of $300/month and the voucher (“NYCHA Share”) pays $900/month. The average annual
income of Section 8 residents is $15,500. The combined Public Housing and Section 8 Programs occupy
12.1 percent of the City’s rental apartments and serve 7.3 percent of the City population. This would rank
NYCHA as the twenty seventh largest city in the United States.
Section 8 Housing Choice Voucher
The Housing Choice Voucher (HCV) Program, generally referred to as Section 8, assists low-income
families in obtaining safe, decent, and affordable housing in the private market by providing rental
FY 2015 Page 7
subsidy. NYCHA administers the largest Section 8 program in the nation with approximately 89,000
families served through a network of over 29,000 participating landlords.
NYCHA administers the program paying the Department of Housing and Urban Development (HUD)
subsidies to participating landlords on behalf of eligible participating tenants. Program participants
generally pay rent directly to the landlord equal to 30 percent of family income. NYCHA pays the
landlord the difference towards the approved contract rent on the apartment unit, referred to as the
Housing Assistance Payment, or HAP. NYCHA earns an administrative fee from HUD for administering
the Section 8 program.
HUD establishes the total number of authorized vouchers for a Public Housing authority. Annual HAP
subsidies are determined by the number of vouchers under lease and housing assistance payments made
the prior year, adjusted for inflation and congressional appropriations. Rental subsidy payments are
primarily influenced by changes in local housing market costs and family income. Additionally, while
HUD requires programs to maintain positive reserves balances, it may recapture reserves balances
deemed excessive.
Therefore, the number of vouchers that NYCHA can prospectively administer depends on current year
appropriation and funding availability, changes in landlord rents, changes in family incomes, and the
balance of HAP reserves to draw upon to fund payments in excess of current year subsidy. Program
administration costs are primarily determined by labor costs and mandated program compliance activities
including annual eligibility recertification of participants and inspection of landlord apartments.
Administration of the HCV Program requires prudent stewardship over annual funding resources and
program reserves.
Diminished Federal Operating Assistance
Since FY 2001, NYCHA has been forced to utilize its reserves to fund $1.05 billion of expenses as a
result of an insufficient federal funding level. In FY 2014, for example, NYCHA received only 89 percent
of the funding based on the HUD allocation formula.
FY 2015 also assumes last year’s proration at 89 percent will continue with an expected loss of at
approximately $115 million.
Assistance from the City of New York
Mayor de Blasio and NYCHA's new administration have been made aware of the challenges NYCHA is
facing to meet its mission; to continue providing affordable and safe housing. The Authority contends
with an aging infrastructure averaging 50 to 60 years old. Steady and continued federal disinvestment
since 2001 have resulted in a staggering $1 billion deficit and significant pent-up capital needs, ranging
from boilers to rooftops. The mayor has devoted unprecedented attention and historic support to NYCHA.
This support includes a $210.5 million plan to make NYCHA neighborhoods safer. This investment
consists of $122 million of City funds to relieve NYCHA from City obligations, so that money can be
FY 2015 Page 8
used for repairs and maintenance, $50 million for physical improvements to enhance security, $1.5
million for exterior lighting at 15 developments, $21.4 million for the civilianization of 200 police
officers; and $15.6 million to expand key programs to help build stronger individuals, families and
communities.
NYCHA formed a public-private partnership, the Triborough Preservation Partners, which will provide
$80 million in capital work for 875 units in Section 8 housing. The Section 8 housing properties are
subsidized by Housing Assistance Payments from HUD. The steady reductions in HUD funding since
2001 have made it virtually impossible for NYCHA to keep up with critical repairs at all of its properties.
In addition, six project-based Section 8 developments are ineligible for federal capital funding. This
scarcity of funding has taken its toll – all told, the six developments need about $48 million of capital
work over the next five years, and about $113 million over the next 15 years. Leveraging tax-exempt
bond financing, provided through the Housing Development Corporation (HDC) and Low Income
Housing Tax Credit (LIHTC) equity, NYCHA will be able to generate a return of approximately $158
million in FY 2014 and $100 million in subsequent years. These vital funds helped close NYCHA's 2014
operating deficit and will contribute to urgent capital needs at our Public Housing developments.
Capital Assistance
The Federal Public Housing Capital Fund is the primary source of dollars for major capital
improvements. Funding for capital repairs continues to be reduced. In FY 2001, NYCHA received $420
million in capital assistance. For FY 2015, the Authority anticipates an allocation of $296 million or 30
percent less than it received 14 years ago.
Under HUD’s Capital Fund Financing Program (CFFP), NYCHA may borrow private capital to make
improvements and pledge, subject to the availability of appropriations, a portion of future year annual
Capital funds for debt service. Borrowing capacity under the CFFP is limited so that annual debt service
may not exceed 33 percent of annual federal capital grant awards. Bond proceeds are required to be
expended over a four year period. NYCHA is using net proceeds to rehabilitate building envelopes,
principally for the remediation of Local Law 11 violations, as well as the installation of new roofs at up to
38 developments across all five boroughs. Local Law 11 applies to exterior walls of buildings that are six
or more stories in height and addresses the dangers associated with deteriorating building facades.
NYCHA anticipates annual debt service of $60 million inclusive of the debt service on NYCHA’s CFFP
Series A & B bonds. To date, NYCHA has obligated 99.6 percent equivalent to $498 million of the $500
million net proceeds.
FY 2014 Accomplishments
Despite financial challenges, NYCHA continues to focus on its mission while addressing resident needs.
With support from the current Administration and with an emphasis on safety and service levels, the
following initiatives have been implemented.
FY 2015 Page 9
Safety and Service Level
Work Order Reduction Initiative
Recognizing funding issues, New York City provided relief on payment obligation for NYPD, of which
$40 million was allocated to address a backlog of approximately 32 thousand work orders primarily for
painting and tiling of apartments. With a focus on service improvement, NYCHA was able to reduce the
average response time for a routine maintenance request to 9 days, down from 79 days, and decrease
skilled trade work orders to 28 days, down from 56 days the previous year.
Appliance Replacement Initiative
NYCHA dedicated approximately $8 million of the NYPD forgiveness funds for the replacement of
outdated ranges and refrigerators with energy-efficient models.
Light Towers Initiative
In cooperation with the Mayor’s plan to improve safety, temporary exterior lighting was installed at 15
developments with the highest violent crime rate. The current plan has extended to 186 towers at 17
developments. NYC has pledged an additional $1.5 million in order to extend the initiative through
August, 2015.
Homeless Housing Initiative
As part of the Mayor’s initiative to reduce the record level of homelessness in NYC, NYCHA completed
the rehabilitation of 865 apartments, moving families out of homeless shelters and into permanent
apartments. In addition to the 865 families who were moved out of shelters, more than 290 homeless
families received Section 8 vouchers, bringing the total families helped to over eleven hundred.
FY 2015 Initiatives
Within this document a number of initiatives for FY 2015 are explained, including service modifications
to increase efficiencies and reduce costs. The following initiatives specifically address the FY 2015
deficit:
Optimal Property Management Operating Model (OPMOM) Pilot.
Choice Neighborhood Initiative (Choice)
Next Generation NYCHA (NextGenNYCHA)
Section 8 Recapitalization Transactions
Capital Fund Bond Issue
Randolph Houses Mixed Finance Renovation
Information and Technology Initiatives
FY 2015 Page 10
Budget
Overview
FY 2015 Page 11
FY 2015 Budget and Financial Plan
NYCHA is committed to transparency and providing detailed financial information to residents, elected
officials and all stakeholders with an interest in Public Housing. This Budget and Financial Plan provides
detailed information about both the Capital and Operating Budgets.
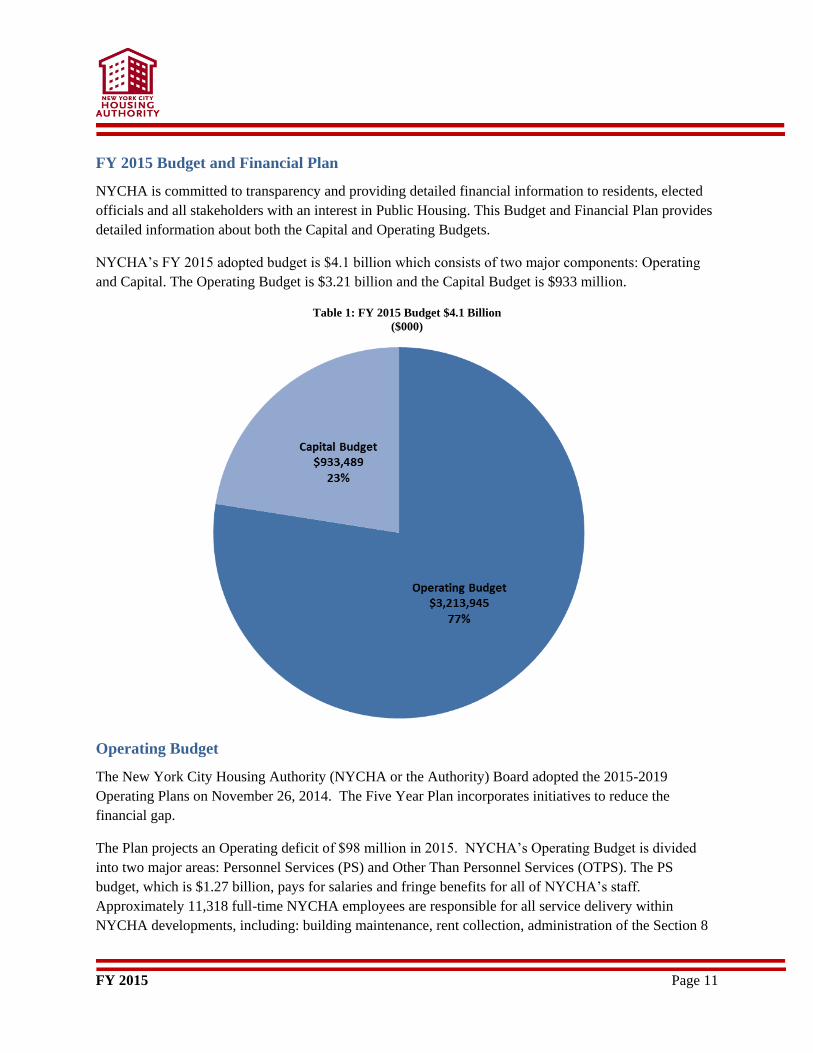
NYCHA’s FY 2015 adopted budget is $4.1 billion which consists of two major components: Operating
and Capital. The Operating Budget is $3.21 billion and the Capital Budget is $933 million.
Table 1: FY 2015 Budget $4.1 Billion
($000)
Operating Budget
The New York City Housing Authority (NYCHA or the Authority) Board adopted the 2015-2019
Operating Plans on November 26, 2014. The Five Year Plan incorporates initiatives to reduce the
financial gap.
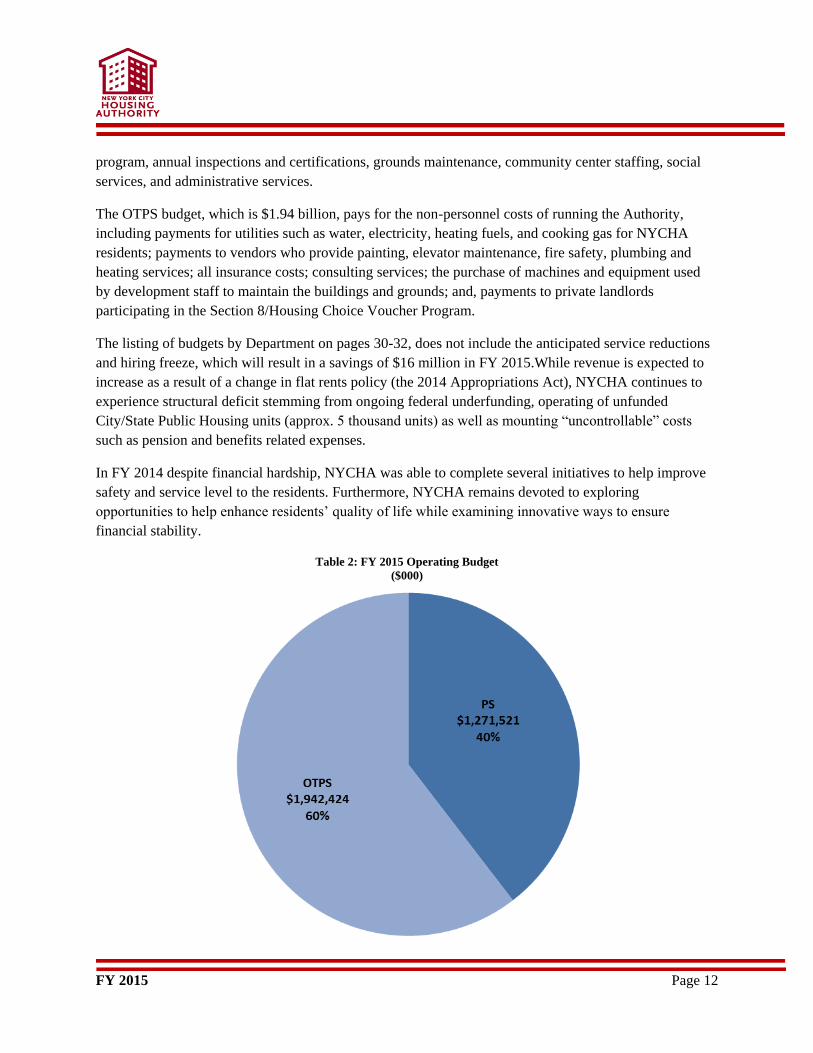
The Plan projects an Operating deficit of $98 million in 2015. NYCHA’s Operating Budget is divided
into two major areas: Personnel Services (PS) and Other Than Personnel Services (OTPS). The PS
budget, which is $1.27 billion, pays for salaries and fringe benefits for all of NYCHA’s staff.
Approximately 11,318 full-time NYCHA employees are responsible for all service delivery within
NYCHA developments, including: building maintenance, rent collection, administration of the Section 8
FY 2015 Page 12
program, annual inspections and certifications, grounds maintenance, community center staffing, social
services, and administrative services.
The OTPS budget, which is $1.94 billion, pays for the non-personnel costs of running the Authority,
including payments for utilities such as water, electricity, heating fuels, and cooking gas for NYCHA
residents; payments to vendors who provide painting, elevator maintenance, fire safety, plumbing and
heating services; all insurance costs; consulting services; the purchase of machines and equipment used
by development staff to maintain the buildings and grounds; and, payments to private landlords
participating in the Section 8/Housing Choice Voucher Program.
The listing of budgets by Department on pages 30-32, does not include the anticipated service reductions
and hiring freeze, which will result in a savings of $16 million in FY 2015.While revenue is expected to
increase as a result of a change in flat rents policy (the 2014 Appropriations Act), NYCHA continues to
experience structural deficit stemming from ongoing federal underfunding, operating of unfunded
City/State Public Housing units (approx. 5 thousand units) as well as mounting “uncontrollable” costs
such as pension and benefits related expenses.
In FY 2014 despite financial hardship, NYCHA was able to complete several initiatives to help improve
safety and service level to the residents. Furthermore, NYCHA remains devoted to exploring
opportunities to help enhance residents’ quality of life while examining innovative ways to ensure
financial stability.
Table 2: FY 2015 Operating Budget
($000)
FY 2015 Page 13
Capital Budget
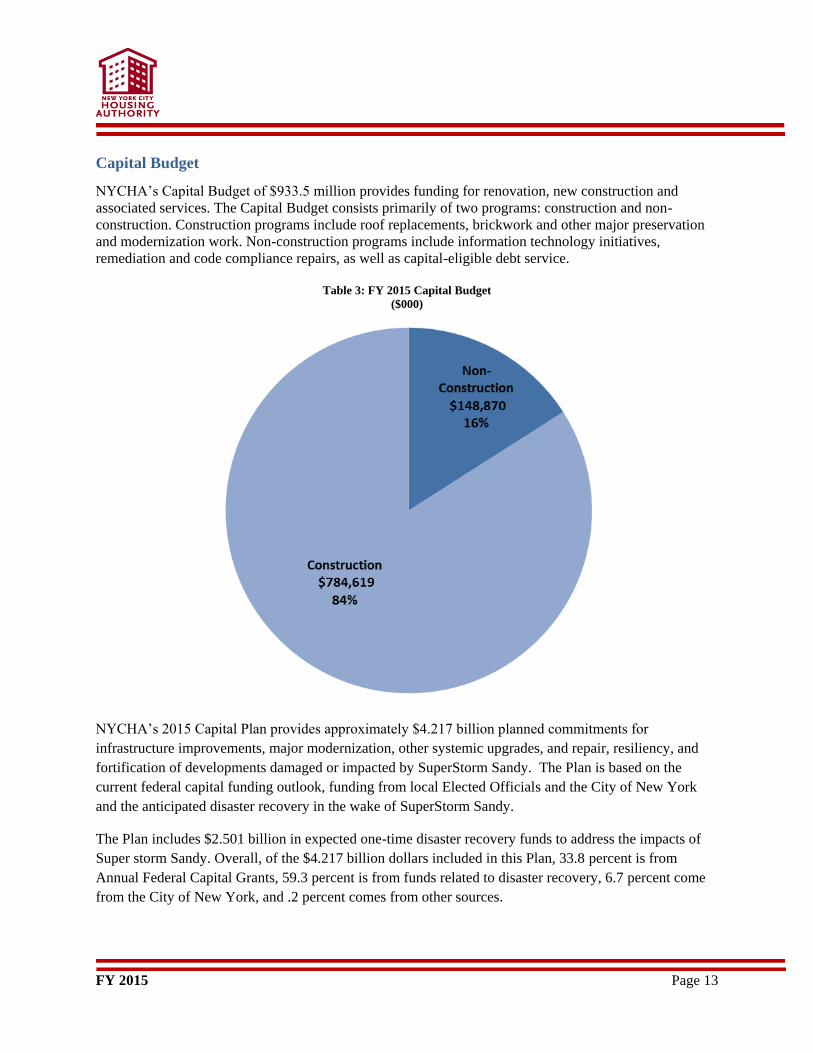
NYCHA’s Capital Budget of $933.5 million provides funding for renovation, new construction and
associated services. The Capital Budget consists primarily of two programs: construction and non-
construction. Construction programs include roof replacements, brickwork and other major preservation
and modernization work. Non-construction programs include information technology initiatives,
remediation and code compliance repairs, as well as capital-eligible debt service.
Table 3: FY 2015 Capital Budget
($000)
NYCHA’s 2015 Capital Plan provides approximately $4.217 billion planned commitments for
infrastructure improvements, major modernization, other systemic upgrades, and repair, resiliency, and
fortification of developments damaged or impacted by SuperStorm Sandy. The Plan is based on the
current federal capital funding outlook, funding from local Elected Officials and the City of New York
and the anticipated disaster recovery in the wake of SuperStorm Sandy.
The Plan includes $2.501 billion in expected one-time disaster recovery funds to address the impacts of
Super storm Sandy. Overall, of the $4.217 billion dollars included in this Plan, 33.8 percent is from
Annual Federal Capital Grants, 59.3 percent is from funds related to disaster recovery, 6.7 percent come
from the City of New York, and .2 percent comes from other sources.
FY 2015 Page 14
Budget Gap
Although in 2014 NYCHA was able to achieve structural balance, a number of factors such as reductions
in federal funds, implementation delays, and increases in non- discretionary costs have created an
Operating deficit of $98 million in FY2015 and further reduced much needed capital investments.
Federal Funding Decline
Adding to the deficit this year is a funding shortfall by the Federal government. Funding for the operating
subsidy is based on congressional appropriation. Over the past five years, national appropriations have
been insufficient to meet actual needs. Furthermore, NYCHA has experienced a cumulative federal
capital grant funding loss of $1.16 billion since 2001.
Federal capital grants for infrastructure improvements and major rehabilitation declined steadily over the
last ten years, jeopardizing the preservation of the Public Housing asset. Moreover, as capital needs of
aging buildings remain unmet, operating costs such as maintenance and repairs have increased further
straining the operating budget.
Federal Operating Funding Loss
HUD’s Public Housing operating fund provides subsidies to Public Housing Authorities (PHAs)
nationwide to operate and maintain Public Housing in local communities. Federal subsidies account for
nearly 44 percent of NYCHA’s General Fund revenues (with the remaining balance primarily tenant
rents) and 98 percent of NYCHA’s Section 8 HCV Program revenues. If NYCHA were to be awarded
100 percent of total eligibility, there would be no operating deficit in 2015. In fact, NYCHA would have
additional resources for critically needed frontline staff, such as maintenance workers, caretakers, and
skilled trade persons to support the residents’ needs. However, appropriations have generally fallen short
of the funding levels required to fully fund Public Housing operations in accordance with HUD’s
eligibility formula. Additionally, while HUD’s formula takes location into account, New York City has
long advocated that the system is inequitable when one considers the City’s uniquely high construction
and employment costs in comparison to authorities across the US.
FY 2015 Page 15
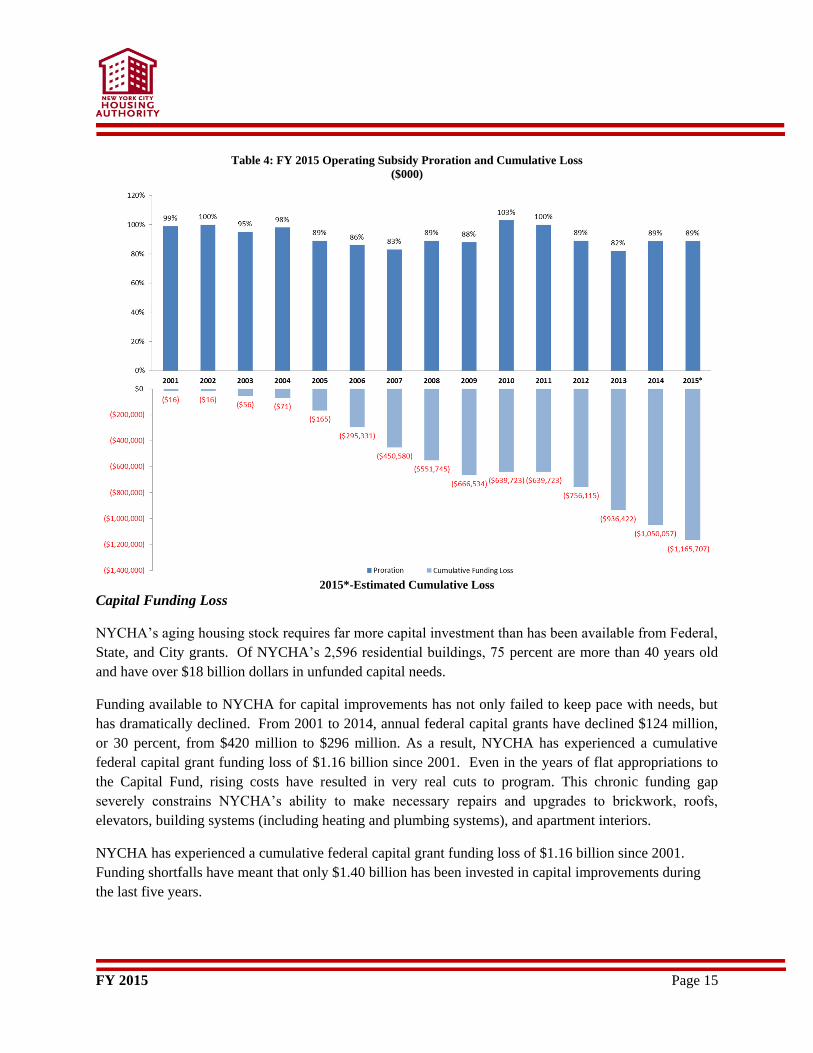
Table 4: FY 2015 Operating Subsidy Proration and Cumulative Loss
($000)
2015*-Estimated Cumulative Loss
Capital Funding Loss
NYCHA’s aging housing stock requires far more capital investment than has been available from Federal,
State, and City grants. Of NYCHA’s 2,596 residential buildings, 75 percent are more than 40 years old
and have over $18 billion dollars in unfunded capital needs.
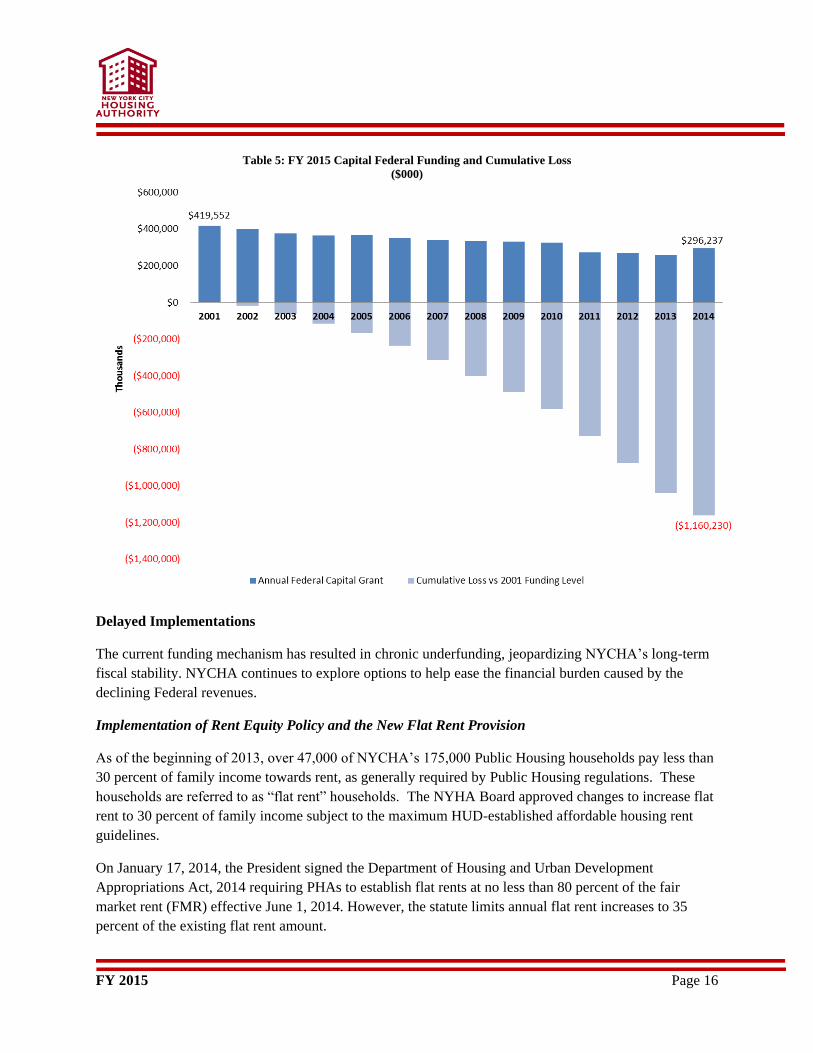
Funding available to NYCHA for capital improvements has not only failed to keep pace with needs, but
has dramatically declined. From 2001 to 2014, annual federal capital grants have declined $124 million,
or 30 percent, from $420 million to $296 million. As a result, NYCHA has experienced a cumulative
federal capital grant funding loss of $1.16 billion since 2001. Even in the years of flat appropriations to
the Capital Fund, rising costs have resulted in very real cuts to program. This chronic funding gap
severely constrains NYCHA’s ability to make necessary repairs and upgrades to brickwork, roofs,
elevators, building systems (including heating and plumbing systems), and apartment interiors.
NYCHA has experienced a cumulative federal capital grant funding loss of $1.16 billion since 2001.
Funding shortfalls have meant that only $1.40 billion has been invested in capital improvements during
the last five years.
FY 2015 Page 16
Table 5: FY 2015 Capital Federal Funding and Cumulative Loss
($000)
Delayed Implementations
The current funding mechanism has resulted in chronic underfunding, jeopardizing NYCHA’s long-term
fiscal stability. NYCHA continues to explore options to help ease the financial burden caused by the
declining Federal revenues.
Implementation of Rent Equity Policy and the New Flat Rent Provision
As of the beginning of 2013, over 47,000 of NYCHA’s 175,000 Public Housing households pay less than
30 percent of family income towards rent, as generally required by Public Housing regulations. These
households are referred to as “flat rent” households. The NYHA Board approved changes to increase flat
rent to 30 percent of family income subject to the maximum HUD-established affordable housing rent
guidelines.
On January 17, 2014, the President signed the Department of Housing and Urban Development
Appropriations Act, 2014 requiring PHAs to establish flat rents at no less than 80 percent of the fair
market rent (FMR) effective June 1, 2014. However, the statute limits annual flat rent increases to 35
percent of the existing flat rent amount.
FY 2015 Page 17
These changes in rent are expected to yield an average annual 1.2 percent compound growth rate in
projected Dwelling Rent over the Plan period, from $997 million in 2015 to $1.045 billion in 2019.
Support for Unsubsidized Units
NYCHA owns and operates 21 developments originally built by the City and State of New York
(City/State Developments) with approximately 20,100 housing units that have been historically unfunded.
NYCHA was able to secure funding for nearly 12,000 of these units via Federalization. In addition, HUD
authorized the conversion of 8,400 units into Project-Based Section 8 funded units through the 2008
Voluntary Conversion Plan (VCP). Out of the 8,400 units covered by the VCP, nearly 3,500 units will be
converted into the Section 8 funding model by the end of 2014.
Current Plan assumes NYCHA continues its conversion efforts for the remaining units (approx. 5
thousand) by transitioning an additional 230 units in 2015 and 100 units annually for 2016-2019. It is
expected that revenue will increase from $49 million in 2015 to $60 million in 2019, as shown in the
Section 8 Phased Conversion budget line.
Contract-Based Section 8 Properties
By leveraging tax-exempt bond financing provided through HDC and Low Income Housing Tax Credit
(LIHTC) equity, the Authority will be able to invest approximately $80 million in capital work at six
project-based Section 8 properties, bringing them up to a state of good repair and adding other elements
such as new interior apartment renovations, resiliency measures and energy efficiency. Additionally, the
transaction will generate a return to NYCHA of approximately $158 million in FY 2014 and $100 million
in subsequent years to help reduce the funding gap and invest in capital work throughout the Public
Housing portfolio.
FY 2015 Page 18
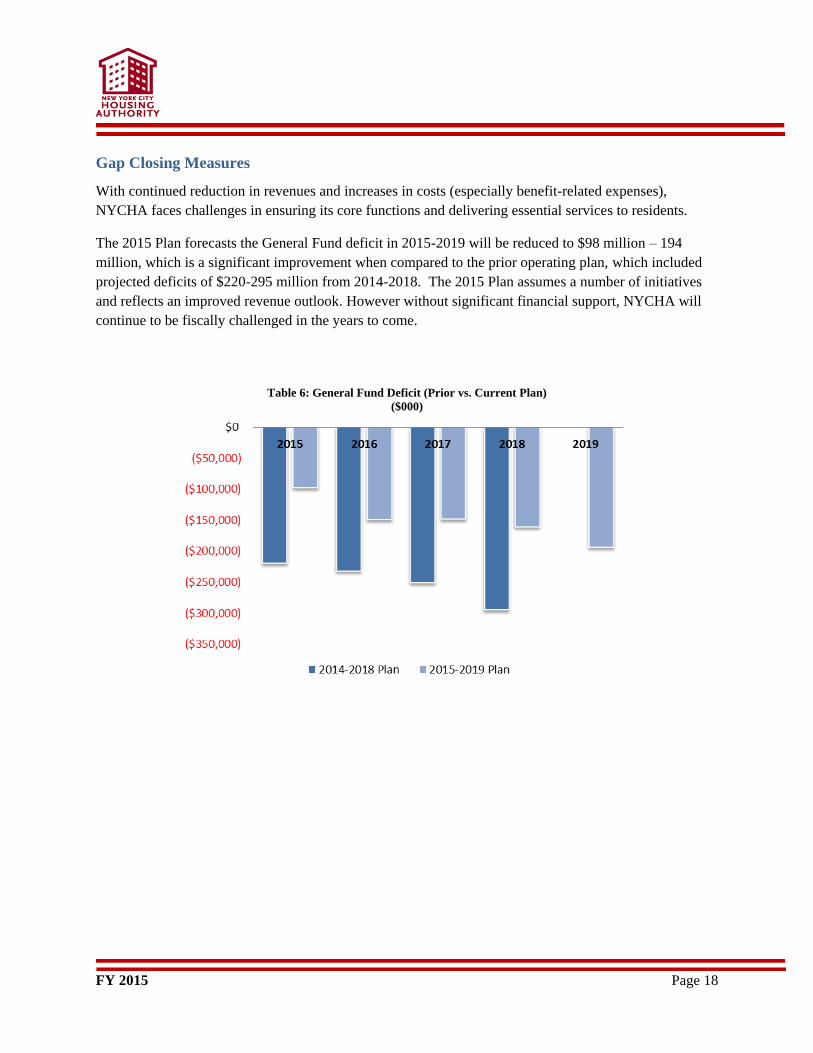
Gap Closing Measures
With continued reduction in revenues and increases in costs (especially benefit-related expenses),
NYCHA faces challenges in ensuring its core functions and delivering essential services to residents.
The 2015 Plan forecasts the General Fund deficit in 2015-2019 will be reduced to $98 million – 194
million, which is a significant improvement when compared to the prior operating plan, which included
projected deficits of $220-295 million from 2014-2018. The 2015 Plan assumes a number of initiatives
and reflects an improved revenue outlook. However without significant financial support, NYCHA will
continue to be fiscally challenged in the years to come.
Table 6: General Fund Deficit (Prior vs. Current Plan)
($000)
FY 2015 Page 19
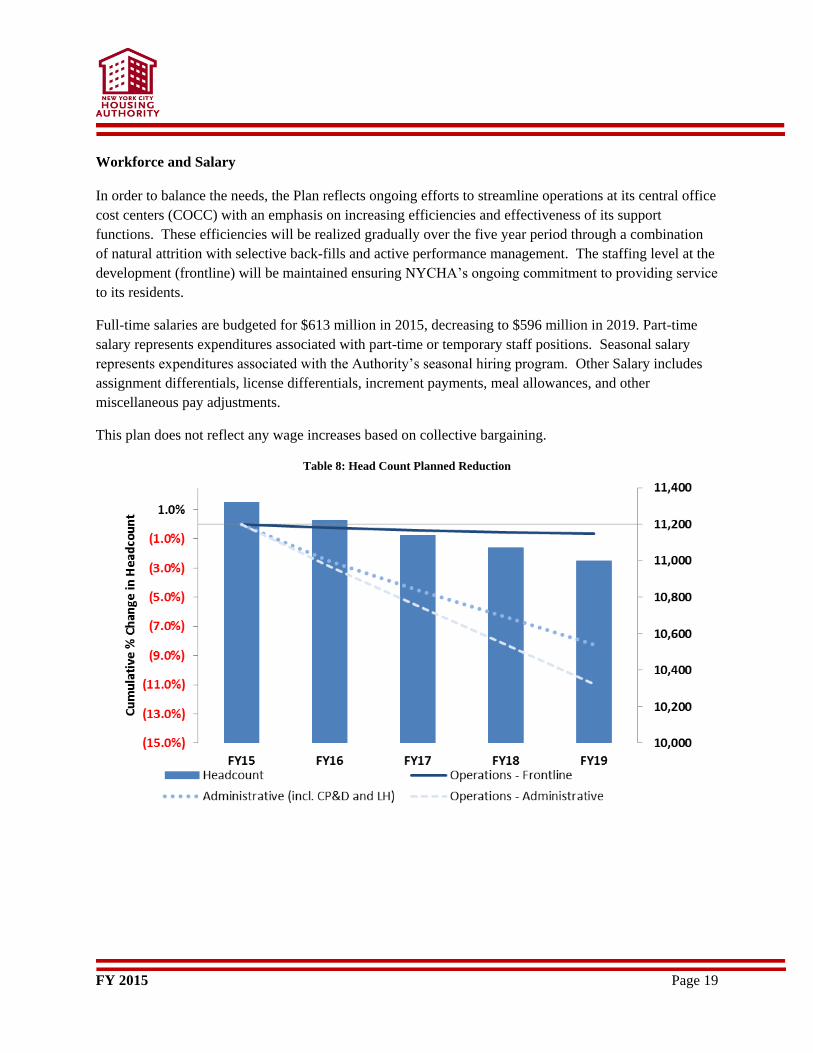
Workforce and Salary
In order to balance the needs, the Plan reflects ongoing efforts to streamline operations at its central office
cost centers (COCC) with an emphasis on increasing efficiencies and effectiveness of its support
functions. These efficiencies will be realized gradually over the five year period through a combination
of natural attrition with selective back-fills and active performance management. The staffing level at the
development (frontline) will be maintained ensuring NYCHA’s ongoing commitment to providing service
to its residents.
Full-time salaries are budgeted for $613 million in 2015, decreasing to $596 million in 2019. Part-time
salary represents expenditures associated with part-time or temporary staff positions. Seasonal salary
represents expenditures associated with the Authority’s seasonal hiring program. Other Salary includes
assignment differentials, license differentials, increment payments, meal allowances, and other
miscellaneous pay adjustments.
This plan does not reflect any wage increases based on collective bargaining.
Table 8: Head Count Planned Reduction
FY 2015 Page 20
Future Initiatives
While the focus has been addressing existing issues, progress will be limited if measures are not taken to
both improve NYCHA’s operations and culture. In recognizing the need, NYCHA is exploring ways to
leverage both internal and external partnerships to transform NYCHA. While difficult to quantify,
benefits will be realized via measures and metrics which are being designed as part of these ongoing
initiatives.
Optimal Property Management Operating Model (OPMOM) Pilot
The Optimal Property Management Operating Model (OPMOM) aims to maximize customer service
through efficiency and quality of service. This pilot program will shift decision making from the central
office to local property management. Under OPMOM, Property Managers will build their own budgets
and purchase materials and services from central office and vendors on an as-needed basis, leaving more
resources available for frontline operations. In collaboration with residents and staff, Property Managers
will also identify additional budget priorities, boosting customer satisfaction. Employees in the OPMOM
pilot developments will receive enhanced training and support to provide better service to residents. By
decentralizing decision making, NYCHA expects to see more efficiency and innovation with decisions
tailored for the specific conditions at each development. OPMOM will launch in 18 developments in
January 2015 and, if successful, eventually be implemented throughout the five boroughs. The initial
participating developments are: Howard, Seth Low, Langston Hughes, Unity Plaza, Van Dyke,
Brownsville, Tilden, Woodson, East River, Jefferson, Wagner, Lincoln, Wilson, Mill Brook, Patterson,
Mott Haven, Mitchel, and Melrose Houses.
Choice Neighborhood Initiative (Choice)
NYCHA’s Choice Neighborhoods Initiative Transformation Plan is focused in Mott Haven located in the
southernmost section of the Bronx. Mott Haven is in one of the poorest congressional districts in the
country and is plagued by deteriorating housing, low educational achievement, few job prospects, and
high crime. Unfortunately, these difficult challenges have come to define the neighborhood and its
residents.
NYCHA embarked on a comprehensive planning process to reverse these trends using planning grant
funds. Early on, ten neighborhood challenges were identified by the community and elevated as the key
issues. Over the course of the 2-year planning period, we focused on addressing these concerns. The
result is a comprehensive transformation plan which will change the trajectory of Mott Haven.
FY 2015 Page 21
The key Identified Issues:
NYCHA developments are in disrepair
The affordable housing supply is limited
Parks are underutilized because of security concerns
All children are not school ready and are not testing close to grade level
Students are not prepared for 21st century jobs
Residents’ skills are mismatched with the current needs of the economy, and limited job training
opportunities are available for growth-sector industries
Limited jobs in the neighborhood make it difficult to connect to workforce opportunities
Local small businesses need support to grow
Rates of chronic diseases are very high in Mott Haven, and residents with chronic disease need
targeted and consistent support
Mott Haven has among the highest violent crime rates in the city, particularly gun crimes
The presence of Public Housing prevented a full-scale abandonment of the neighborhood in the 1970s and
the construction of new Public Housing in the 1970s and 1980s helped to revitalize the area. Public
Housing preservation will help to ensure that new generations of residents benefit from the stability and
security that permanently affordable housing provides. And in many ways, it is why the neighborhood
revitalization is deeply connected to Public Housing. This is why preserving the existing Public Housing
stock is the core of the transformation plan. Furthermore, NYCHA residents, consisting of a third of the
population, have long standing roots in the neighborhood, which sustain and support the surrounding
community.
Alongside residents, we named the Choice Neighborhoods Initiative Transformation Plan “Make Mott
Haven…” The premise is that through a transparent and inclusive process, together we can make the
community better. “Make Mott Haven…” is a call to action for the residents, local organizations,
government and businesses. No longer can organizations operate in silos or residents accept a
deteriorating neighborhood. All of the stakeholders will come together to be part of the solution. The plan
is a comprehensive roadmap for an expanded and comprehensive array of capital and human development
programs, pursuing a substantial increase in private and public investment, and enlarging the circle of
partners funding.
Next Generation NYCHA (NextGenNYCHA)
Next Generation NYCHA is a multi-faceted, long-term, strategic investment and planning process that
will explore creative ways of how Public Housing can be sustained for the next generation of New
Yorkers. It intends to be an inclusive process that will seek input from NYCHA residents, administrators
and managers, and community partners and residents. The plan will address how NYCHA looks,
operates and is financed.
FY 2015 Page 22
Operating
Budget
FY 2015 Page 23
Overview
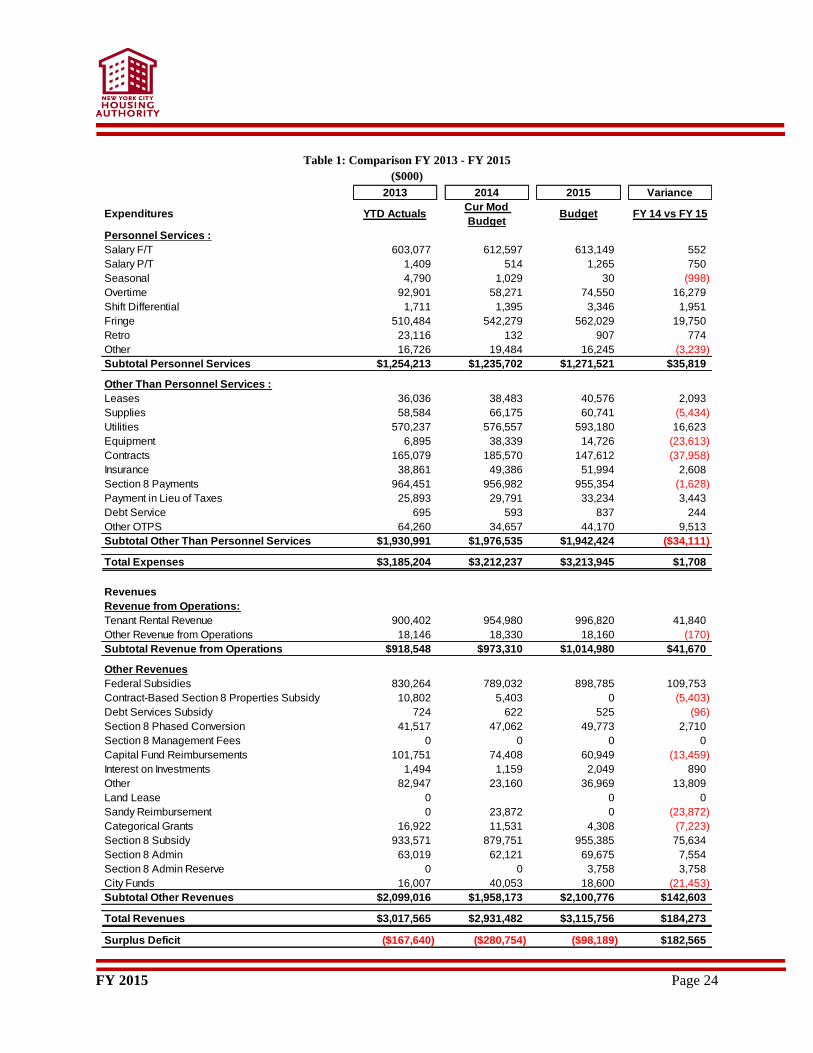
The operating budget for FY 2015 is $3.2 billion. This includes a $1.7 million expense increase over the
FY 2014 current modified budget. The budget provides $0.6 million in additional funds to cover the
expenses of shifting Central Office position to Operations front line and skill trades positions. The plan
also includes an increase of $16.2 million in overtime to capture true expenditure patterns and
implementation of control measures to manage and better utilize overtime spending. The FY 2015 budget
includes cost savings measures aimed at closing the budget deficit. The Budget also includes anticipated
service reductions and hiring freeze, which will result in a savings of $16 million.
Table 1 highlights NYCHA’s actual revenues and expenses for FY 2013, the current modified budget for
FY 2014 and the FY 2015 budget by account type. It also indicates the variance between the current
modified FY 2014 budget and the FY 2015 budget.
FY 2015 Page 24
Table 1: Comparison FY 2013 - FY 2015
($000)
2013 2014 2015 Variance
Expenditures YTD ActualsCur Mod
BudgetBudget FY 14 vs FY 15
Personnel Services :
Salary F/T 603,077 612,597 613,149 552
Salary P/T 1,409 514 1,265 750
Seasonal 4,790 1,029 30 (998)
Overtime 92,901 58,271 74,550 16,279
Shift Differential 1,711 1,395 3,346 1,951
Fringe 510,484 542,279 562,029 19,750
Retro 23,116 132 907 774
Other 16,726 19,484 16,245 (3,239)
Subtotal Personnel Services $1,254,213 $1,235,702 $1,271,521 $35,819
Other Than Personnel Services :
Leases 36,036 38,483 40,576 2,093
Supplies 58,584 66,175 60,741 (5,434)
Utilities 570,237 576,557 593,180 16,623
Equipment 6,895 38,339 14,726 (23,613)
Contracts 165,079 185,570 147,612 (37,958)
Insurance 38,861 49,386 51,994 2,608
Section 8 Payments 964,451 956,982 955,354 (1,628)
Payment in Lieu of Taxes 25,893 29,791 33,234 3,443
Debt Service 695 593 837 244
Other OTPS 64,260 34,657 44,170 9,513
Subtotal Other Than Personnel Services $1,930,991 $1,976,535 $1,942,424 ($34,111)
Total Expenses $3,185,204 $3,212,237 $3,213,945 $1,708
Revenues
Revenue from Operations:
Tenant Rental Revenue 900,402 954,980 996,820 41,840
Other Revenue from Operations 18,146 18,330 18,160 (170)
Subtotal Revenue from Operations $918,548 $973,310 $1,014,980 $41,670
Other Revenues
Federal Subsidies 830,264 789,032 898,785 109,753
Contract-Based Section 8 Properties Subsidy 10,802 5,403 0 (5,403)
Debt Services Subsidy 724 622 525 (96)
Section 8 Phased Conversion 41,517 47,062 49,773 2,710
Section 8 Management Fees 0 0 0 0
Capital Fund Reimbursements 101,751 74,408 60,949 (13,459)
Interest on Investments 1,494 1,159 2,049 890
Other 82,947 23,160 36,969 13,809
Land Lease 0 0 0
Sandy Reimbursement 0 23,872 0 (23,872)
Categorical Grants 16,922 11,531 4,308 (7,223)
Section 8 Subsidy 933,571 879,751 955,385 75,634
Section 8 Admin 63,019 62,121 69,675 7,554
Section 8 Admin Reserve 0 0 3,758 3,758
City Funds 16,007 40,053 18,600 (21,453)
Subtotal Other Revenues $2,099,016 $1,958,173 $2,100,776 $142,603
Total Revenues $3,017,565 $2,931,482 $3,115,756 $184,273
Surplus Deficit ($167,640) ($280,754) ($98,189) $182,565
FY 2015 Page 25
2015 2016 2017 2018 2019
Expenditures Budget Budget Budget Budget Budget
Personnel Services :
Salary F/T 613,149 607,598 603,084 599,349 595,588
Salary P/T 1,265 1,265 1,265 1,265 1,265
Seasonal 30 30 30 30 30
Overtime 74,550 52,501 52,501 52,501 52,501
Shift Differential 3,346 3,346 3,346 3,346 3,346
Fringe 562,029 575,689 594,052 613,557 634,425
Retro 907 907 907 907 907
Other 16,245 16,245 16,245 16,245 16,245
Subtotal Personnel Services $1,271,521 $1,257,580 $1,271,429 $1,287,199 $1,304,306
Other Than Personnel Services :
Leases 40,576 41,805 42,852 43,965 46,017
Supplies 60,741 60,230 60,230 60,230 60,223
Utilities 593,180 610,430 616,500 635,060 656,760
Equipment 14,726 14,691 13,331 13,369 13,369
Contracts 147,612 216,171 216,683 217,235 217,031
Insurance 51,994 54,321 56,740 59,256 61,871
Section 8 Payments 955,354 949,009 954,603 948,664 943,813
Payment in Lieu of Taxes 33,234 33,585 34,210 33,156 31,762
Debt Service 837 733 628 534 455
Other OTPS 44,170 44,185 44,230 44,280 44,197
Subtotal Other Than Personnel Services $1,942,424 $2,025,160 $2,040,007 $2,055,750 $2,075,499
Total Expenses $3,213,945 $3,282,740 $3,311,436 $3,342,949 $3,379,805
Revenues
Revenue from Operations:
Tenant Rental Revenue 996,820 1,020,785 1,036,147 1,040,697 1,045,307
Other Revenue from Operations 18,160 19,653 20,258 20,675 21,105
Subtotal Revenue from Operations $1,014,980 $1,040,438 $1,056,405 $1,061,373 $1,066,412
Other Revenues
Federal Subsidies 898,785 909,824 922,917 946,734 946,734
Contract-Based Section 8 Properties Subsidy 0 0 0 0 0
Debt Services Subsidy 525 438 360 285 230
Section 8 Phased Conversion 49,773 53,524 55,733 57,996 60,312
Section 8 Management Fees 0 0 0 0 0
Capital Fund Reimbursements 60,949 60,035 59,778 59,778 59,778
Interest on Investments 2,049 3,235 4,717 5,930 7,412
Other 36,969 37,434 37,626 37,919 38,283
Land Lease 0 0 0 0 0
Sandy Reimbursement 0 0 0 0 0
Categorical Grants 4,308 3,725 3,725 3,725 3,175
Section 8 Subsidy 955,385 893,965 890,282 895,538 853,791
Section 8 Admin 69,675 59,953 59,341 58,240 57,101
Section 8 Admin Reserve 3,758 0 0 0 0
City Funds 18,600 8,550 0 0 0
Subtotal Other Revenues $2,100,776 $2,030,682 $2,034,478 $2,066,144 $2,026,816
Total Revenues $3,115,756 $3,071,119 $3,090,883 $3,127,517 $3,093,228
Surplus Deficit ($98,189) ($211,621) ($220,552) ($215,432) ($286,577)
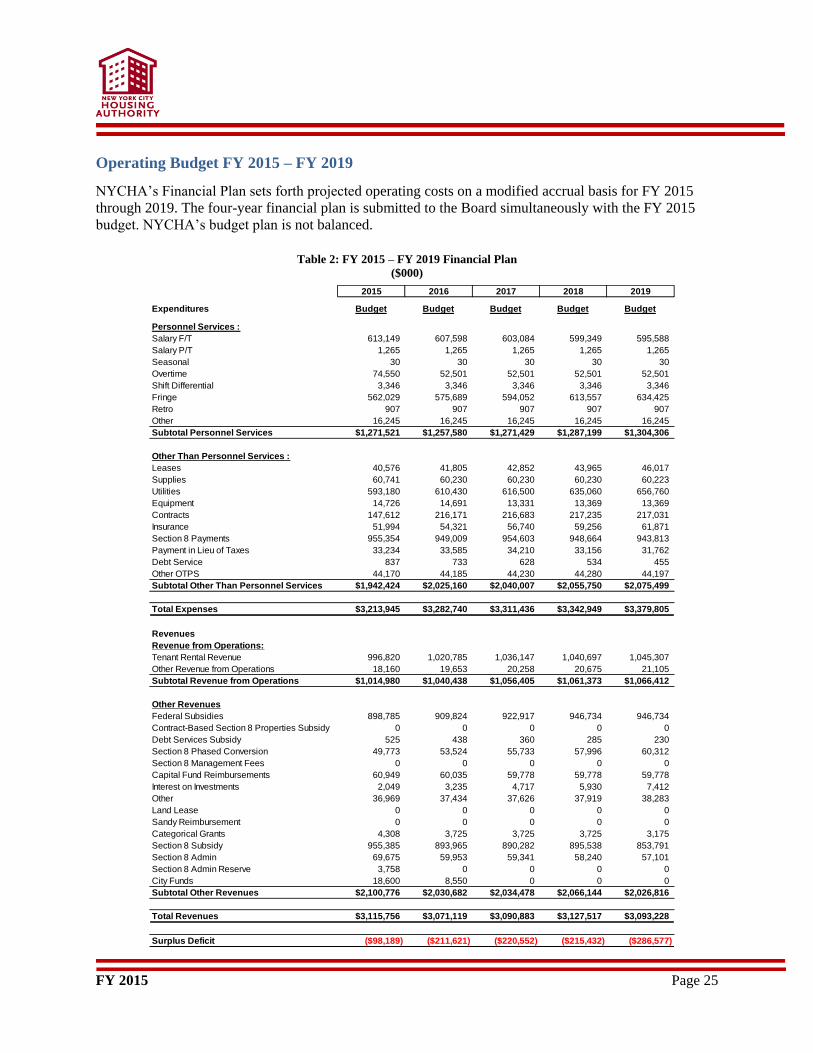
Operating Budget FY 2015 – FY 2019
NYCHA’s Financial Plan sets forth projected operating costs on a modified accrual basis for FY 2015
through 2019. The four-year financial plan is submitted to the Board simultaneously with the FY 2015
budget. NYCHA’s budget plan is not balanced.
Table 2: FY 2015 – FY 2019 Financial Plan
($000)
FY 2015 Page 26
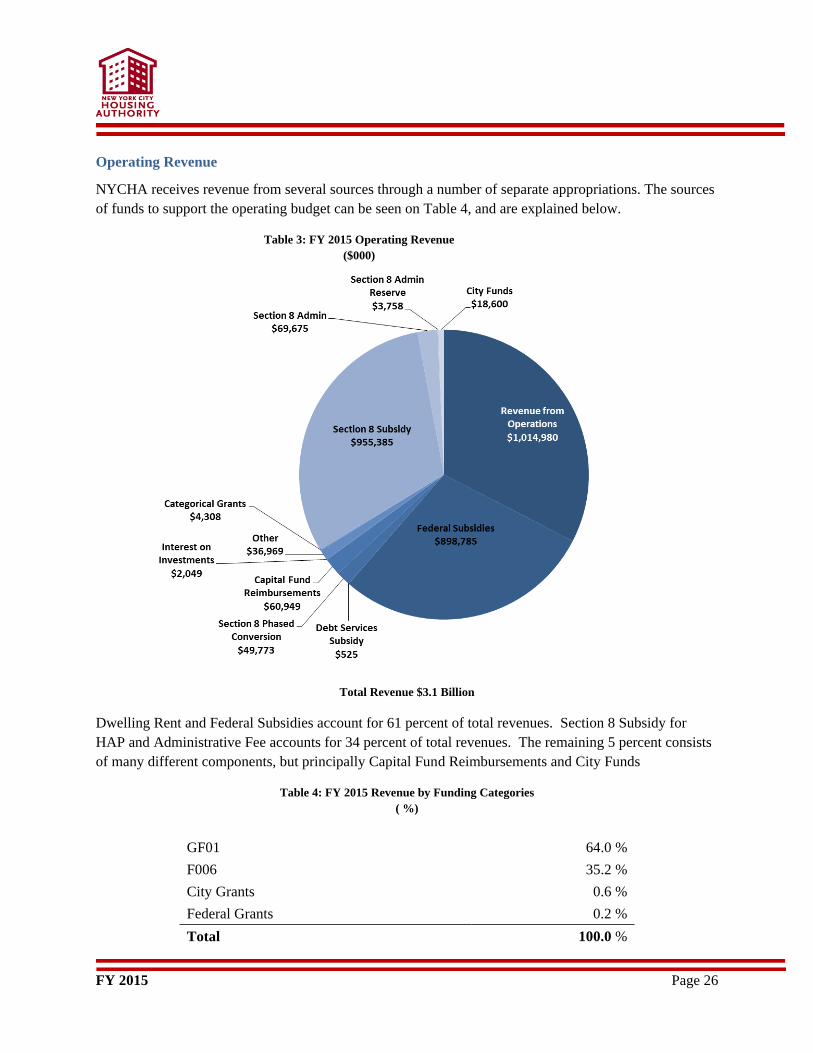
Operating Revenue
NYCHA receives revenue from several sources through a number of separate appropriations. The sources
of funds to support the operating budget can be seen on Table 4, and are explained below.
Table 3: FY 2015 Operating Revenue
($000)
Total Revenue $3.1 Billion
Dwelling Rent and Federal Subsidies account for 61 percent of total revenues. Section 8 Subsidy for
HAP and Administrative Fee accounts for 34 percent of total revenues. The remaining 5 percent consists
of many different components, but principally Capital Fund Reimbursements and City Funds
Table 4: FY 2015 Revenue by Funding Categories
( %)
GF01 64.0 %
F006 35.2 %
City Grants 0.6 %
Federal Grants 0.2 %
Total 100.0 %
FY 2015 Page 27
Tenant Rental Revenue
Projected rent paid to NYCHA by residents represents 32 percent of total revenues in 2015. Rent
projections are modeled at the property level based on data that includes the number of occupied units,
average base rents, and collection losses.
Federal subsidies for Public Housing are budgeted under Other Revenues. Accordingly, it is important to
note that Tenant Rental Revenue contributes less than half of the total revenues used to cover the
Authority’s Public Housing expenditures reflected in the General Fund.
This Plan projects Tenant Rental Revenue to increase from $997 million in 2015 to $ 1.045 billion in
2019, a compound growth rate of 1 percent.
Other Revenue from Operations
Other Revenue from Operations consists of ancillary fees, primarily from residents, including sales and
services charges, parking fees and appliance surcharges intended to defray a portion of the cost of excess
utility consumption. Other Revenue from Operations is projected to increase from $18 million in 2015 to
$21 million in 2019. The projected increase is primarily attributable to growing excess utility charges and
increasing parking fees. Parking fees are projected to rise due to the elimination of the lower non-reserved
pricing option as NYCHA converts more of its parking lots to reserved-only pricing following painting
and numbering of parking lots.
Federal Subsidies
This Plan projects federal operating subsidy to be $899 million for the year 2015 increasing to $947
million in 2019. The Operating subsidy assessment is based on many factors including the number of
eligible units, project expense levels, utility expense levels, and formula income, which in turn, is based
on Tenant Rental Revenue. While this assessment determines eligibility level, additional assumptions
must be made to determine future appropriations and proration levels which averaged 91 percent for the
past decade. NYCHA has based its 2015 budget on the 2014 appropriation of 89 percent. In 2015, the
Authority would be eligible for $1.014 billion but is estimated to only receive $899 million, a shortfall of
$115 million. For years 2016-2019, the Plan also assumes an operating subsidy proration of 89 percent.
Contract-Based Section 8 Properties Subsidy
NYCHA owns and operates six developments that exclusively contain project-based Section 8
units. These properties are expected to be sold by the end of 2014 and therefore no subsidy is assumed in
the FY2015 – FY2019 financial plan.
Section 8 Phased Conversions
Under a 2008 voluntary conversion plan approved by HUD, NYCHA was authorized to convert to
Section 8 assistance up to 8,400 Public Housing units in the former City/State Developments which
previously received no dedicated funding. The Plan assumes approximately 3,500 units will be converted
FY 2015 Page 28
by year-end 2014 generating an estimated $46 million of subsidy. The approximately 4,900 remaining
units have yet to be converted to receive Section 8 assistance and remain without a dedicated funding
source.
Securing dedicated federal funding for these remaining unfunded housing units is critical. Each unfunded
housing unit operates with an implied structural deficit as the tenant rent alone is insufficient to cover the
operating costs. NYCHA estimates that the loss in subsidy from the 4,900 unconverted units is
approximately $70 million annually.
This Plan reflects an initiative to convert 230 units in 2015 and 100 units annually for 2016 to 2019 with
revenue increasing from approximately $50 million in 2015 to approximately $60 million in 2019.
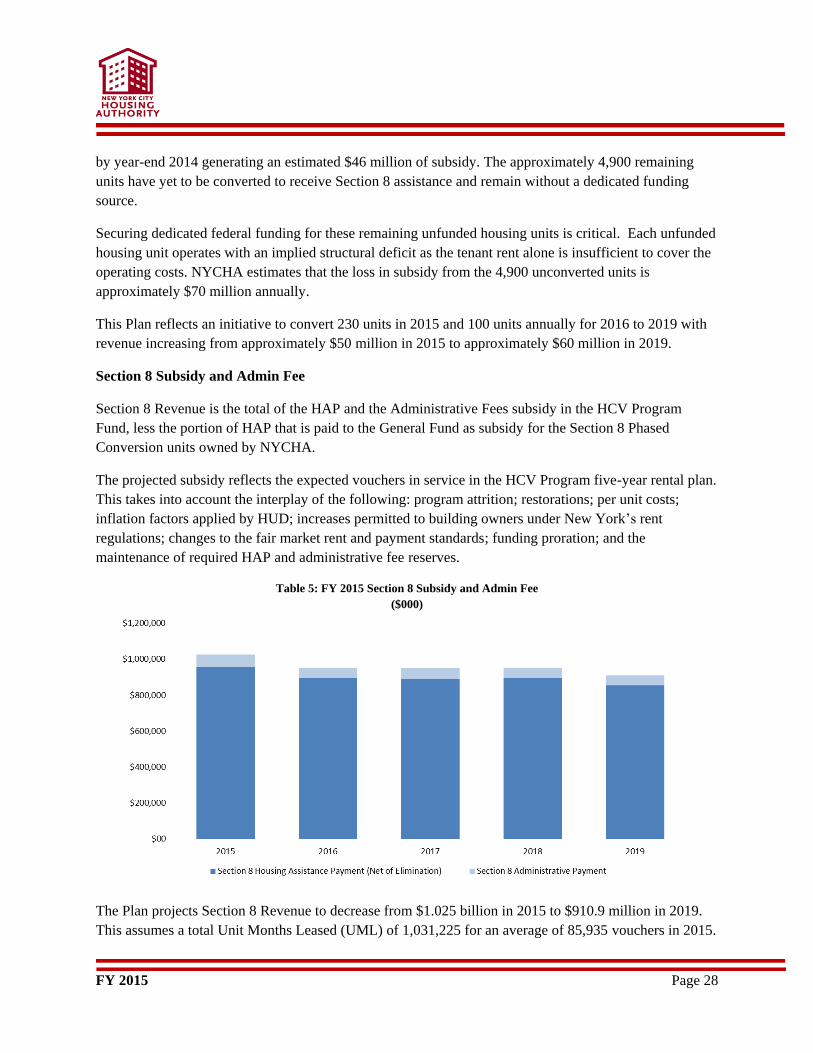
Section 8 Subsidy and Admin Fee
Section 8 Revenue is the total of the HAP and the Administrative Fees subsidy in the HCV Program
Fund, less the portion of HAP that is paid to the General Fund as subsidy for the Section 8 Phased
Conversion units owned by NYCHA.
The projected subsidy reflects the expected vouchers in service in the HCV Program five-year rental plan.
This takes into account the interplay of the following: program attrition; restorations; per unit costs;
inflation factors applied by HUD; increases permitted to building owners under New York’s rent
regulations; changes to the fair market rent and payment standards; funding proration; and the
maintenance of required HAP and administrative fee reserves.
Table 5: FY 2015 Section 8 Subsidy and Admin Fee
($000)
The Plan projects Section 8 Revenue to decrease from $1.025 billion in 2015 to $910.9 million in 2019.
This assumes a total Unit Months Leased (UML) of 1,031,225 for an average of 85,935 vouchers in 2015.
FY 2015 Page 29
Categorical Grants
NYCHA receives grant awards from Federal, State, City, and private sources to fund specific community
development and benefits programs. The Plan reflects only grants awarded, and does not reflect
anticipated awards. Categorical grants fund for 2015-2019 are budgeted at $4.3 million in 2015 and
decreasing to $3.2 million in 2019.
Capital Fund Reimbursements
Capital Fund Reimbursements are reimbursements from the federal capital program to the operating
program for capital-related costs incurred in the operating budget.
This line includes the 10 percent management fee, which dropped to a lower percentage to address a
much needed rehab. NYCHA is permitted to charge against capital fund grants to cover Capital Program
administration costs funded from the operating budget. Also, this line includes the reimbursement of
direct costs of frontline staff involved in designing and managing capital projects; central office
allocations of budgeted information technology capital expenditures for projects that benefit NYCHA’s
frontline and central support functions; capital replacement reserves of NYCHA’s mixed-finance
portfolios; the Painter’s Apprentice Program; vehicles; and additional Capital Project Departments heads
and backfills.
Capital Fund Reimbursements are projected to be $60.9 million in 2015, $60.0 million in 2016, and $59.8
million in the years 2017-2019.
Interest on Investments
Interest on Investments represents expected earnings on cash and investments, excluding expected returns
on self-insurance funds since these earnings are netted against insurance costs. This revenue is projected
to increase from $2.049 million in 2015 to $7.412 million in 2019, reflecting higher portfolio balances
and expectation of modest increases in yields over the planning period.
City Funds
Funds from the City of New York to assist the Authority absorb the impact of the Federal underfunding.
The budgeted amount for 2015 is $18.6 million.
Other Non-Operating Revenues
NYCHA generates ancillary revenues from third parties from its property assets, including commercial
storefront leases, rooftop leases (i.e., to mobile telecommunications providers), and others. This Plan
projects Other Non-Operating Revenues to increase from $37 million in 2015 to $38.3 million in 2019.
The increase is primarily driven by storefront rentals, oversight fees relating to ground rental, and
sublease income from underutilized office space.
FY 2015 Page 30
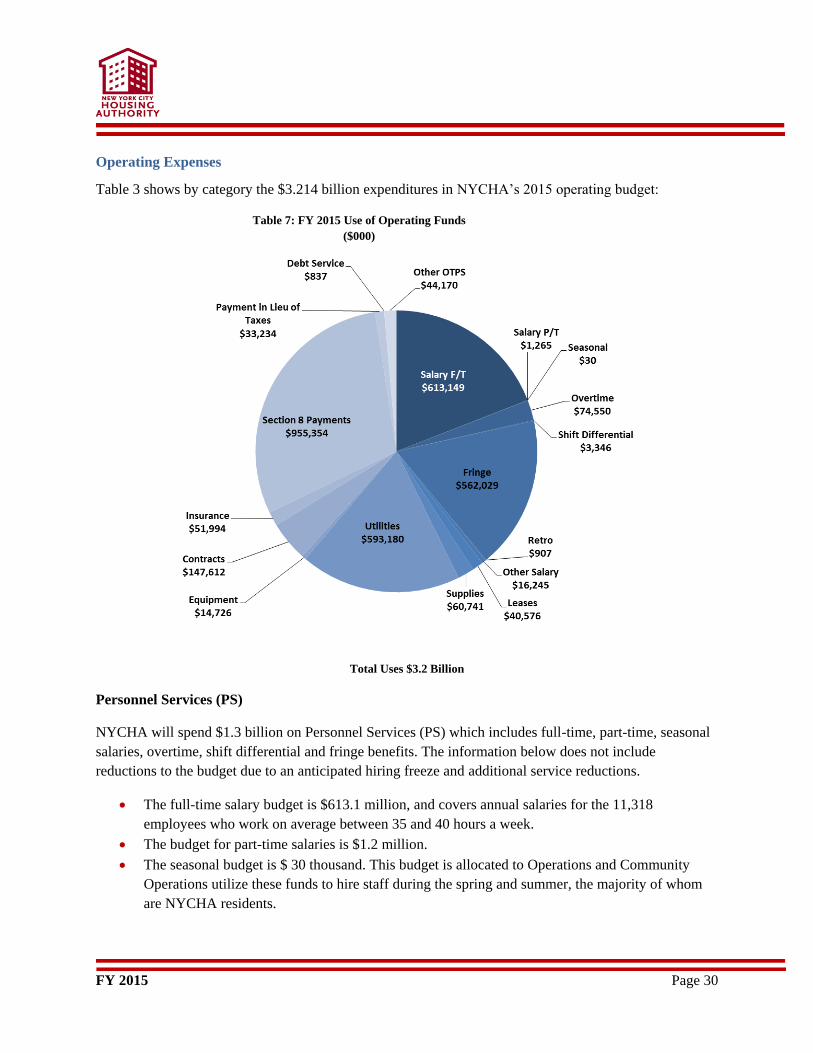
Operating Expenses
Table 3 shows by category the $3.214 billion expenditures in NYCHA’s 2015 operating budget:
Table 7: FY 2015 Use of Operating Funds
($000)
Total Uses $3.2 Billion
Personnel Services (PS)
NYCHA will spend $1.3 billion on Personnel Services (PS) which includes full-time, part-time, seasonal
salaries, overtime, shift differential and fringe benefits. The information below does not include
reductions to the budget due to an anticipated hiring freeze and additional service reductions.
The full-time salary budget is $613.1 million, and covers annual salaries for the 11,318
employees who work on average between 35 and 40 hours a week.
The budget for part-time salaries is $1.2 million.
The seasonal budget is $ 30 thousand. This budget is allocated to Operations and Community
Operations utilize these funds to hire staff during the spring and summer, the majority of whom
are NYCHA residents.
FY 2015 Page 31
The fringe benefits budget is $562 million, and covers the benefits associated with personnel. The
fringe benefits budget covers Workers’ Compensation, Social Security, health insurance, pension,
welfare, annuity, retiree health insurance, retiree welfare and unemployment costs.
The overtime budget is $74.5 million which pays for scheduled and unscheduled overtime.
The budget for longevity and service differentials is $16.2 million.
The shift differential budget is $3.3 million and reflects trade staff that work evening shifts.
The retro budget is $907 thousand.
Other than Personnel Service (OTPS)
NYCHA will spend $1.9 billion for Other Than Personnel Services (OTPS) which includes leases,
supplies, equipment, utilities, contracts, insurance, Section 8 payments, payments in lieu of taxes and debt
service.
The budget for Section 8 payments is $955.4 million and provides funding for payments to
landlords who provide private housing to families in the Section 8 program. Under this federally-
funded program, families pay 30 percent of their income for rent and NYCHA pays the difference
in rent up to a maximum amount.
The utilities budget of $593.2 million includes fuels, cooking gas, electricity and water Authority-
wide.
The contracts budget is $147.6 million, and includes funding for the contracts used for painting,
elevator maintenance, fire safety, plumbing and the purchase of windows and doors; payments to
the Department for the Aging (DFTA) for managing senior centers.
The budget for leases is $40.6 million, and represents the leasing of various borough and
administrative offices throughout the City.
The insurance budget is $52 million, and is used to pay tort claims and premiums; for multiple
insurance coverage such as property insurance.
The budget for payment in lieu of taxes (PILOT) is $33.2 million, and represents payments to the
City of New York. NYCHA’s properties are exempt from paying local real estate taxes.
The budget for supplies is $60.7 million and represents goods and materials purchased for the
daily maintenance of the developments, such as cleaning and janitorial supplies. It also includes
office supplies such as paper, pens, as well as the supplies for resident-oriented programming
such as basketballs and art supplies.
The equipment budget is $14.7 million and is used to purchase equipment for developments as
well as offices and includes items such as drills, snow blowers, electric saws, appliances,
computers and vehicles.
The remaining budget of $45.0 million funds miscellaneous items such as Section 8 Port-in
expenses, bank fees, debt service, postage, membership subscriptions and cash grants that are
paid to resident associations.
FY 2015 Page 32
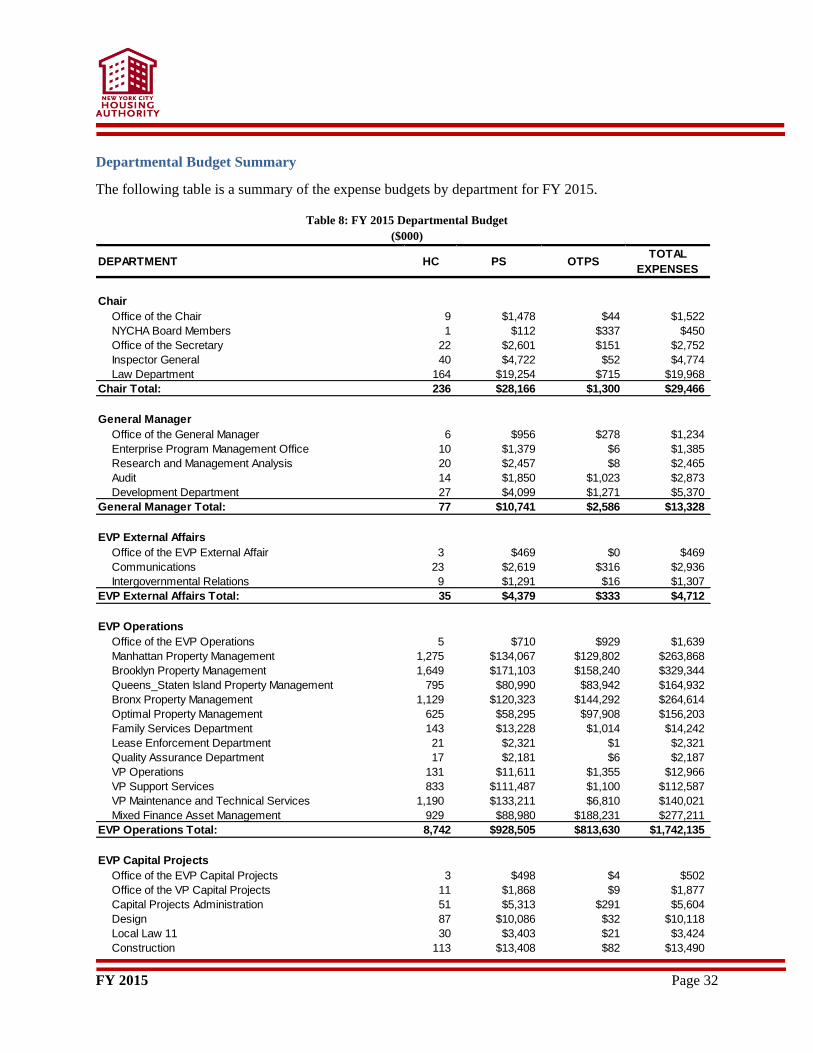
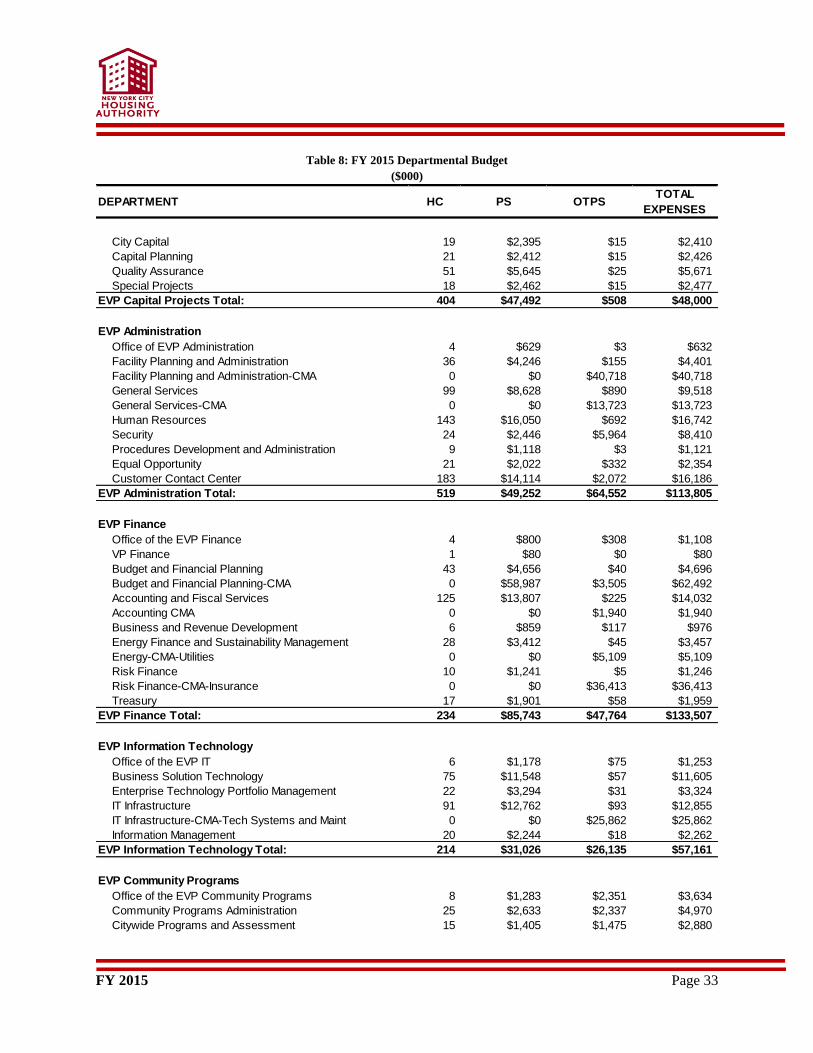
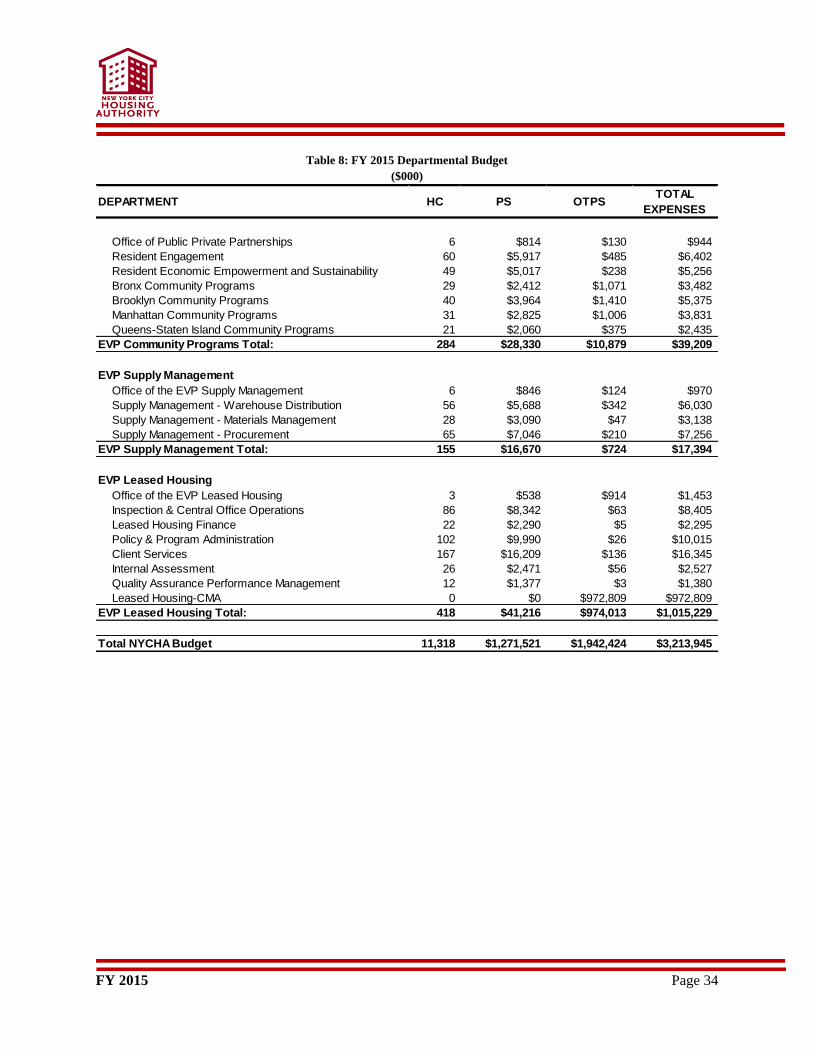
Departmental Budget Summary
The following table is a summary of the expense budgets by department for FY 2015.
Table 8: FY 2015 Departmental Budget
($000)
DEPARTMENT HC PS OTPSTOTAL
EXPENSES
Chair
Office of the Chair 9 $1,478 $44 $1,522
NYCHA Board Members 1 $112 $337 $450
Office of the Secretary 22 $2,601 $151 $2,752
Inspector General 40 $4,722 $52 $4,774
Law Department 164 $19,254 $715 $19,968
Chair Total: 236 $28,166 $1,300 $29,466
General Manager
Office of the General Manager 6 $956 $278 $1,234
Enterprise Program Management Office 10 $1,379 $6 $1,385
Research and Management Analysis 20 $2,457 $8 $2,465
Audit 14 $1,850 $1,023 $2,873
Development Department 27 $4,099 $1,271 $5,370
General Manager Total: 77 $10,741 $2,586 $13,328
EVP External Affairs
Office of the EVP External Affair 3 $469 $0 $469
Communications 23 $2,619 $316 $2,936
Intergovernmental Relations 9 $1,291 $16 $1,307
EVP External Affairs Total: 35 $4,379 $333 $4,712
EVP Operations
Office of the EVP Operations 5 $710 $929 $1,639
Manhattan Property Management 1,275 $134,067 $129,802 $263,868
Brooklyn Property Management 1,649 $171,103 $158,240 $329,344
Queens_Staten Island Property Management 795 $80,990 $83,942 $164,932
Bronx Property Management 1,129 $120,323 $144,292 $264,614
Optimal Property Management 625 $58,295 $97,908 $156,203
Family Services Department 143 $13,228 $1,014 $14,242
Lease Enforcement Department 21 $2,321 $1 $2,321
Quality Assurance Department 17 $2,181 $6 $2,187
VP Operations 131 $11,611 $1,355 $12,966
VP Support Services 833 $111,487 $1,100 $112,587
VP Maintenance and Technical Services 1,190 $133,211 $6,810 $140,021
Mixed Finance Asset Management 929 $88,980 $188,231 $277,211
EVP Operations Total: 8,742 $928,505 $813,630 $1,742,135
EVP Capital Projects
Office of the EVP Capital Projects 3 $498 $4 $502
Office of the VP Capital Projects 11 $1,868 $9 $1,877
Capital Projects Administration 51 $5,313 $291 $5,604
Design 87 $10,086 $32 $10,118
Local Law 11 30 $3,403 $21 $3,424
Construction 113 $13,408 $82 $13,490
FY 2015 Page 33
Table 8: FY 2015 Departmental Budget
($000)
DEPARTMENT HC PS OTPSTOTAL
EXPENSES
City Capital 19 $2,395 $15 $2,410
Capital Planning 21 $2,412 $15 $2,426
Quality Assurance 51 $5,645 $25 $5,671
Special Projects 18 $2,462 $15 $2,477
EVP Capital Projects Total: 404 $47,492 $508 $48,000
EVP Administration
Office of EVP Administration 4 $629 $3 $632
Facility Planning and Administration 36 $4,246 $155 $4,401
Facility Planning and Administration-CMA 0 $0 $40,718 $40,718
General Services 99 $8,628 $890 $9,518
General Services-CMA 0 $0 $13,723 $13,723
Human Resources 143 $16,050 $692 $16,742
Security 24 $2,446 $5,964 $8,410
Procedures Development and Administration 9 $1,118 $3 $1,121
Equal Opportunity 21 $2,022 $332 $2,354
Customer Contact Center 183 $14,114 $2,072 $16,186
EVP Administration Total: 519 $49,252 $64,552 $113,805
EVP Finance
Office of the EVP Finance 4 $800 $308 $1,108
VP Finance 1 $80 $0 $80
Budget and Financial Planning 43 $4,656 $40 $4,696
Budget and Financial Planning-CMA 0 $58,987 $3,505 $62,492
Accounting and Fiscal Services 125 $13,807 $225 $14,032
Accounting CMA 0 $0 $1,940 $1,940
Business and Revenue Development 6 $859 $117 $976
Energy Finance and Sustainability Management 28 $3,412 $45 $3,457
Energy-CMA-Utilities 0 $0 $5,109 $5,109
Risk Finance 10 $1,241 $5 $1,246
Risk Finance-CMA-Insurance 0 $0 $36,413 $36,413
Treasury 17 $1,901 $58 $1,959
EVP Finance Total: 234 $85,743 $47,764 $133,507
EVP Information Technology
Office of the EVP IT 6 $1,178 $75 $1,253
Business Solution Technology 75 $11,548 $57 $11,605
Enterprise Technology Portfolio Management 22 $3,294 $31 $3,324
IT Infrastructure 91 $12,762 $93 $12,855
IT Infrastructure-CMA-Tech Systems and Maint 0 $0 $25,862 $25,862
Information Management 20 $2,244 $18 $2,262
EVP Information Technology Total: 214 $31,026 $26,135 $57,161
EVP Community Programs
Office of the EVP Community Programs 8 $1,283 $2,351 $3,634
Community Programs Administration 25 $2,633 $2,337 $4,970
Citywide Programs and Assessment 15 $1,405 $1,475 $2,880
FY 2015 Page 34
Table 8: FY 2015 Departmental Budget
($000)
DEPARTMENT HC PS OTPSTOTAL
EXPENSES
Office of Public Private Partnerships 6 $814 $130 $944
Resident Engagement 60 $5,917 $485 $6,402
Resident Economic Empowerment and Sustainability 49 $5,017 $238 $5,256
Bronx Community Programs 29 $2,412 $1,071 $3,482
Brooklyn Community Programs 40 $3,964 $1,410 $5,375
Manhattan Community Programs 31 $2,825 $1,006 $3,831
Queens-Staten Island Community Programs 21 $2,060 $375 $2,435
EVP Community Programs Total: 284 $28,330 $10,879 $39,209
EVP Supply Management
Office of the EVP Supply Management 6 $846 $124 $970
Supply Management - Warehouse Distribution 56 $5,688 $342 $6,030
Supply Management - Materials Management 28 $3,090 $47 $3,138
Supply Management - Procurement 65 $7,046 $210 $7,256
EVP Supply Management Total: 155 $16,670 $724 $17,394
EVP Leased Housing
Office of the EVP Leased Housing 3 $538 $914 $1,453
Inspection & Central Office Operations 86 $8,342 $63 $8,405
Leased Housing Finance 22 $2,290 $5 $2,295
Policy & Program Administration 102 $9,990 $26 $10,015
Client Services 167 $16,209 $136 $16,345
Internal Assessment 26 $2,471 $56 $2,527
Quality Assurance Performance Management 12 $1,377 $3 $1,380
Leased Housing-CMA 0 $0 $972,809 $972,809
EVP Leased Housing Total: 418 $41,216 $974,013 $1,015,229
Total NYCHA Budget 11,318 $1,271,521 $1,942,424 $3,213,945
FY 2015 Page 35
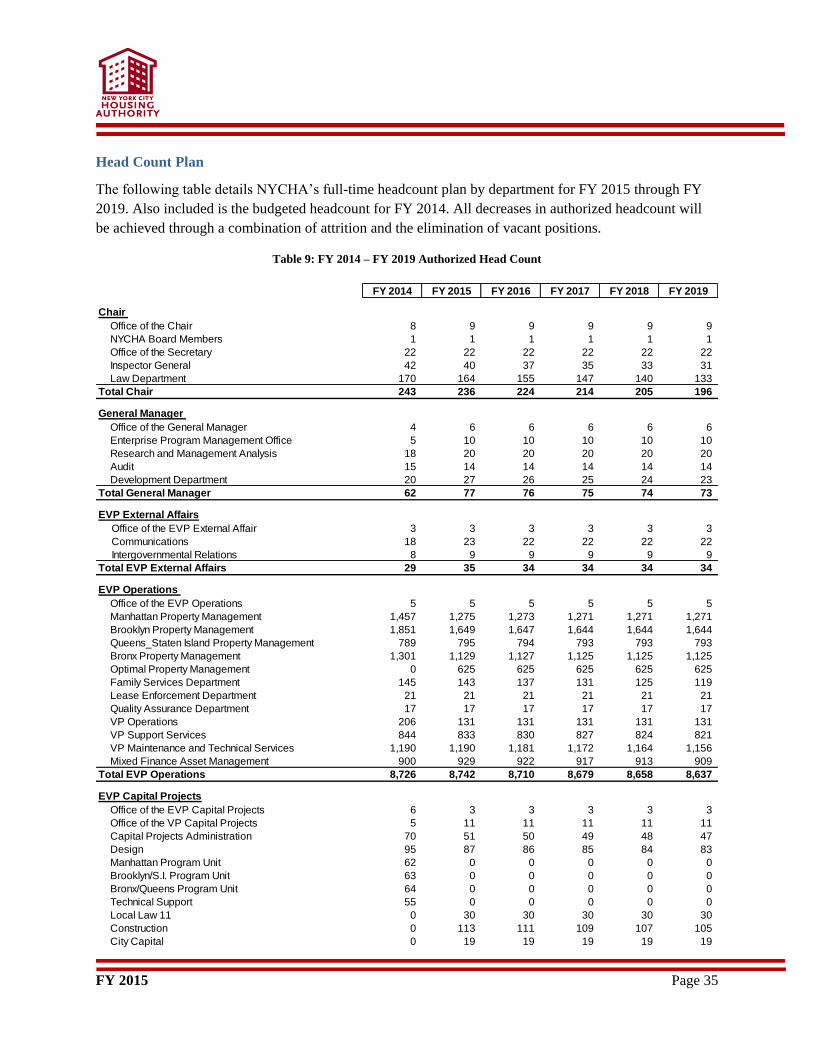
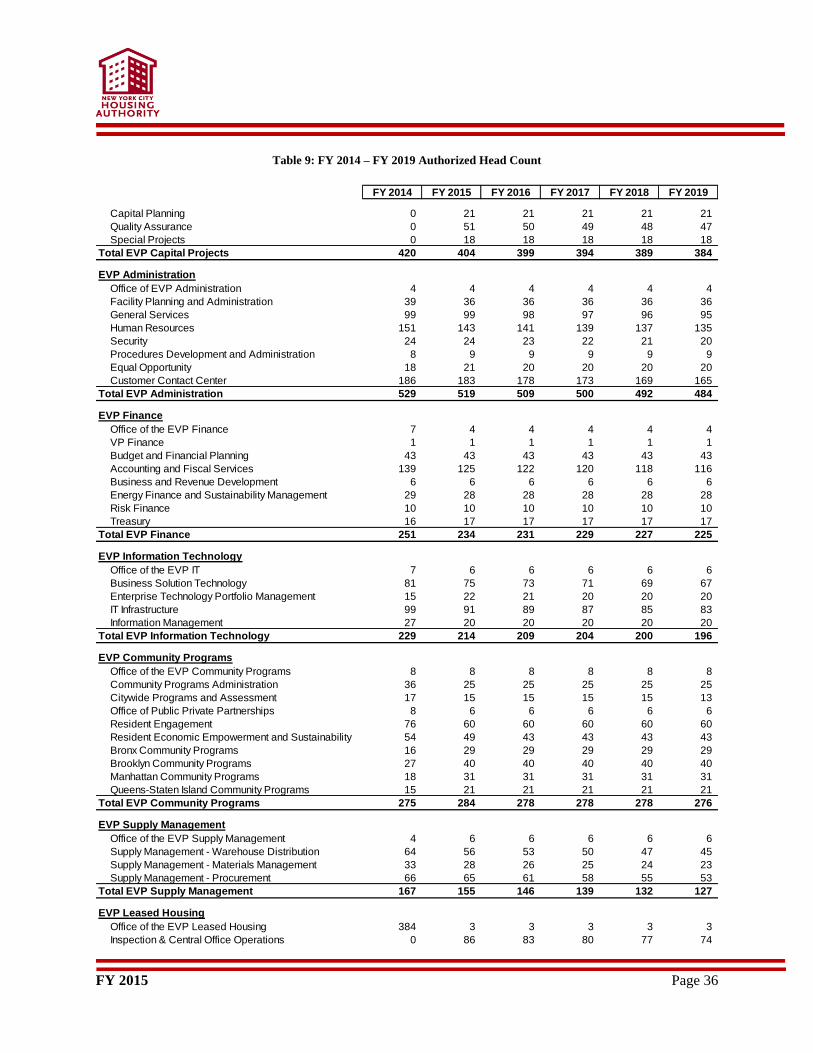
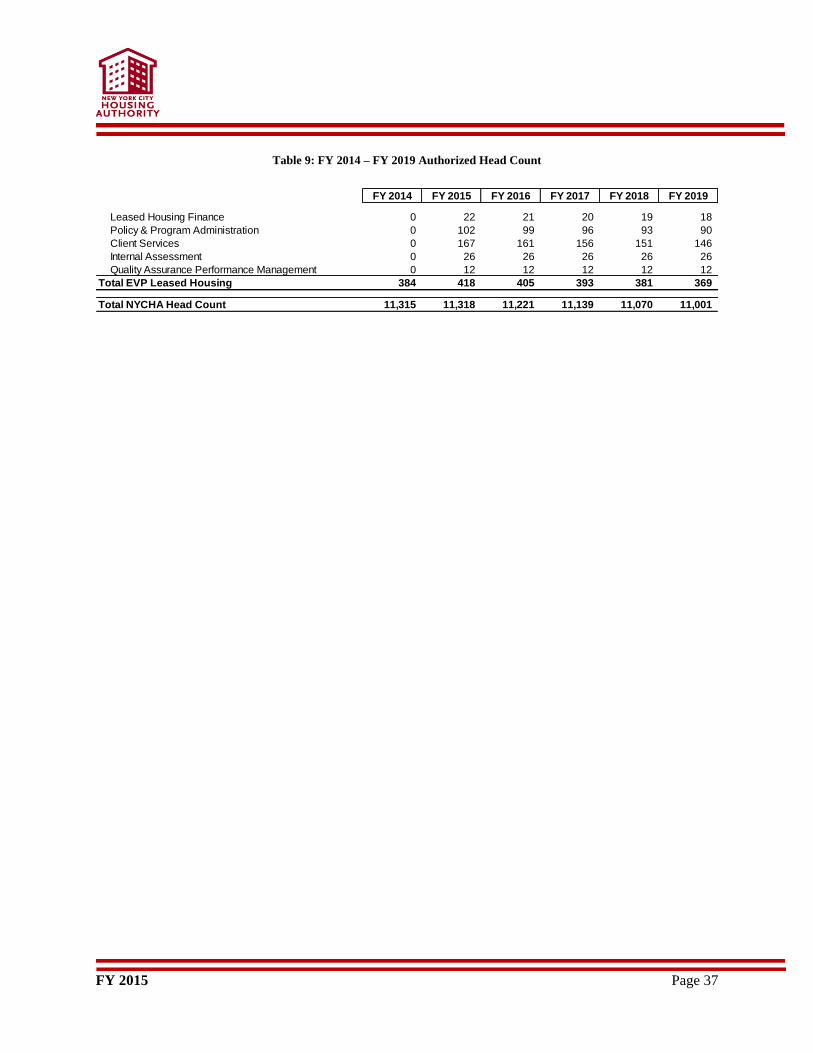
Head Count Plan
The following table details NYCHA’s full-time headcount plan by department for FY 2015 through FY
2019. Also included is the budgeted headcount for FY 2014. All decreases in authorized headcount will
be achieved through a combination of attrition and the elimination of vacant positions.
Table 9: FY 2014 – FY 2019 Authorized Head Count
FY 2014 FY 2015 FY 2016 FY 2017 FY 2018 FY 2019
Chair
Office of the Chair 8 9 9 9 9 9
NYCHA Board Members 1 1 1 1 1 1
Office of the Secretary 22 22 22 22 22 22
Inspector General 42 40 37 35 33 31
Law Department 170 164 155 147 140 133
Total Chair 243 236 224 214 205 196
General Manager
Office of the General Manager 4 6 6 6 6 6
Enterprise Program Management Office 5 10 10 10 10 10
Research and Management Analysis 18 20 20 20 20 20
Audit 15 14 14 14 14 14
Development Department 20 27 26 25 24 23
Total General Manager 62 77 76 75 74 73
EVP External Affairs
Office of the EVP External Affair 3 3 3 3 3 3
Communications 18 23 22 22 22 22
Intergovernmental Relations 8 9 9 9 9 9
Total EVP External Affairs 29 35 34 34 34 34
EVP Operations
Office of the EVP Operations 5 5 5 5 5 5
Manhattan Property Management 1,457 1,275 1,273 1,271 1,271 1,271
Brooklyn Property Management 1,851 1,649 1,647 1,644 1,644 1,644
Queens_Staten Island Property Management 789 795 794 793 793 793
Bronx Property Management 1,301 1,129 1,127 1,125 1,125 1,125
Optimal Property Management 0 625 625 625 625 625
Family Services Department 145 143 137 131 125 119
Lease Enforcement Department 21 21 21 21 21 21
Quality Assurance Department 17 17 17 17 17 17
VP Operations 206 131 131 131 131 131
VP Support Services 844 833 830 827 824 821
VP Maintenance and Technical Services 1,190 1,190 1,181 1,172 1,164 1,156
Mixed Finance Asset Management 900 929 922 917 913 909
Total EVP Operations 8,726 8,742 8,710 8,679 8,658 8,637
EVP Capital Projects
Office of the EVP Capital Projects 6 3 3 3 3 3
Office of the VP Capital Projects 5 11 11 11 11 11
Capital Projects Administration 70 51 50 49 48 47
Design 95 87 86 85 84 83
Manhattan Program Unit 62 0 0 0 0 0
Brooklyn/S.I. Program Unit 63 0 0 0 0 0
Bronx/Queens Program Unit 64 0 0 0 0 0
Technical Support 55 0 0 0 0 0
Local Law 11 0 30 30 30 30 30
Construction 0 113 111 109 107 105
City Capital 0 19 19 19 19 19
FY 2015 Page 36
Table 9: FY 2014 – FY 2019 Authorized Head Count
FY 2014 FY 2015 FY 2016 FY 2017 FY 2018 FY 2019
Capital Planning 0 21 21 21 21 21
Quality Assurance 0 51 50 49 48 47
Special Projects 0 18 18 18 18 18
Total EVP Capital Projects 420 404 399 394 389 384
EVP Administration
Office of EVP Administration 4 4 4 4 4 4
Facility Planning and Administration 39 36 36 36 36 36
General Services 99 99 98 97 96 95
Human Resources 151 143 141 139 137 135
Security 24 24 23 22 21 20
Procedures Development and Administration 8 9 9 9 9 9
Equal Opportunity 18 21 20 20 20 20
Customer Contact Center 186 183 178 173 169 165
Total EVP Administration 529 519 509 500 492 484
EVP Finance
Office of the EVP Finance 7 4 4 4 4 4
VP Finance 1 1 1 1 1 1
Budget and Financial Planning 43 43 43 43 43 43
Accounting and Fiscal Services 139 125 122 120 118 116
Business and Revenue Development 6 6 6 6 6 6
Energy Finance and Sustainability Management 29 28 28 28 28 28
Risk Finance 10 10 10 10 10 10
Treasury 16 17 17 17 17 17
Total EVP Finance 251 234 231 229 227 225
EVP Information Technology
Office of the EVP IT 7 6 6 6 6 6
Business Solution Technology 81 75 73 71 69 67
Enterprise Technology Portfolio Management 15 22 21 20 20 20
IT Infrastructure 99 91 89 87 85 83
Information Management 27 20 20 20 20 20
Total EVP Information Technology 229 214 209 204 200 196
EVP Community Programs
Office of the EVP Community Programs 8 8 8 8 8 8
Community Programs Administration 36 25 25 25 25 25
Citywide Programs and Assessment 17 15 15 15 15 13
Office of Public Private Partnerships 8 6 6 6 6 6
Resident Engagement 76 60 60 60 60 60
Resident Economic Empowerment and Sustainability 54 49 43 43 43 43
Bronx Community Programs 16 29 29 29 29 29
Brooklyn Community Programs 27 40 40 40 40 40
Manhattan Community Programs 18 31 31 31 31 31
Queens-Staten Island Community Programs 15 21 21 21 21 21
Total EVP Community Programs 275 284 278 278 278 276
EVP Supply Management
Office of the EVP Supply Management 4 6 6 6 6 6
Supply Management - Warehouse Distribution 64 56 53 50 47 45
Supply Management - Materials Management 33 28 26 25 24 23
Supply Management - Procurement 66 65 61 58 55 53
Total EVP Supply Management 167 155 146 139 132 127
EVP Leased Housing
Office of the EVP Leased Housing 384 3 3 3 3 3
Inspection & Central Office Operations 0 86 83 80 77 74
FY 2015 Page 37
Table 9: FY 2014 – FY 2019 Authorized Head Count
FY 2014 FY 2015 FY 2016 FY 2017 FY 2018 FY 2019
Leased Housing Finance 0 22 21 20 19 18
Policy & Program Administration 0 102 99 96 93 90
Client Services 0 167 161 156 151 146
Internal Assessment 0 26 26 26 26 26
Quality Assurance Performance Management 0 12 12 12 12 12
Total EVP Leased Housing 384 418 405 393 381 369
Total NYCHA Head Count 11,315 11,318 11,221 11,139 11,070 11,001
FY 2015 Page 38
Departmental
Operating
Budgets
FY 2015 Page 39
NYCHA Mission
The New York City Housing Authority (NYCHA) provides decent and affordable housing in a safe and
secure living environment for low-and moderate-income residents throughout the five boroughs. NYCHA
also administers a citywide Section 8 Leased Housing Program in rental apartments. In order to fulfill this
mission, NYCHA must preserve its aging housing stock through timely maintenance and modernization
of its developments. While continuing this effort, NYCHA works to enhance the quality of life by
offering residents social services that give them opportunities to participate in a multitude of community,
educational, and recreational programs, as well as job readiness and training initiatives.
Overview
This section provides detailed budget information by Department. In most cases, Departments are
overseen by an Executive Vice President (EVP). Each EVP is responsible for a portfolio of Departments
and offices within a specific area. This section includes Departmental missions and responsibilities. The
budgets for all of NYCHA’s 82 Budget Responsibility Groups (BRGs) are listed by account type. In
addition, changes from the prior year are identified. The Departments are grouped by their EVP in this
section, and the Organizational Chart provides an overview of NYCHA.
Departmental budgets do not include the anticipated service reductions and hiring freeze.
FY 2015 Page 40
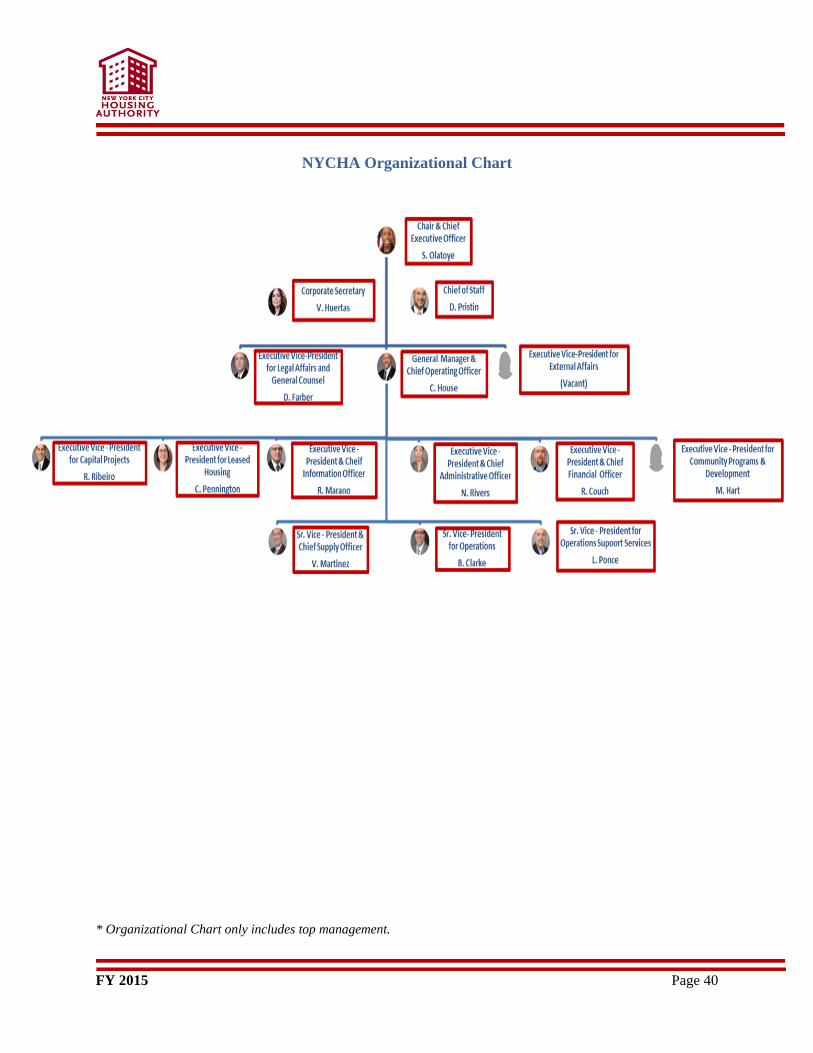
NYCHA Organizational Chart
* Organizational Chart only includes top management.
FY 2015 Page 41
Key NYCHA Officials
The Board (Chair, Vice-Chair, Member)
The NYCHA board comprises of seven members appointed by the mayor. The mayor designates three
Members, two of whom are appointed by the Mayor for five-year terms, and the Chair, who is appointed
by the Mayor and reports to the Mayor, as the governing Board of NYCHA. One member is designated to
be the Vice-Chair, and in the event of a vacancy in the office of the Chair or when the Chair is absent or
unable to act, the Vice-Chair assumes his/her duties and powers.
The Board Members are responsible for voting on contracts, resolutions, policies, motions, rules, and
regulations at no fewer than ten regularly scheduled meetings per year.
The Chair presides at Board meetings, directs the business and affairs of the Authority, and is responsible
for the execution of all policies, resolutions, motions, and rules and regulations adopted by the Board.
Additionally, he/she issues and promulgates official orders, and makes rules and regulations for the
conduct, management, and operation of the Authority, and signs and executes on behalf of the Authority
all leases, deeds, contracts and commitments of the Authority.
The following departments and offices report directly to the Chair: the Office of the Secretary, the Office
of the Inspector General, the Law Department, NYCHA Board Members, and Vice President for
Development and Executive Vice President (EVP) for External Affairs.
General Manager
Principal executive administrator of the Authority, the General Manager (GM) assists the Chair in the
supervision of the business affairs of the Authority and is responsible for the execution of all orders, rules,
and regulations made or approved by the Board.
The GM directly supervises the following: EVP for Administration, EVP for Capital Projects, EVP for
Community Operations, EVP for Finance, EVP for Operations, Chief Information Officer, the EVP for
Supply Management, and the EVP for Leased Housing.
FY 2015 Page 42
Departmental Details
Chair
(Office of the Chair)
Overview/ Mission statement
The Chairman presides at all meetings of the Board, directs the business and affairs of the Authority, is
responsible for the execution of all policies, resolutions, motions, and rules and regulations adopted by
the Board. Additionally, he/she issues and promulgates official orders, and makes rules and regulations
for the conduct, management, and operation of the Authority, and signs and executes on behalf of the
Authority all leases, deeds, contracts, and commitments of the Authority.
The following Departments and offices report directly to the Chair:
Office of the Corporate Secretary
Office of the Inspector General
Office of Legal Affairs and General Councils (Law Department)
NYCHA Board Members
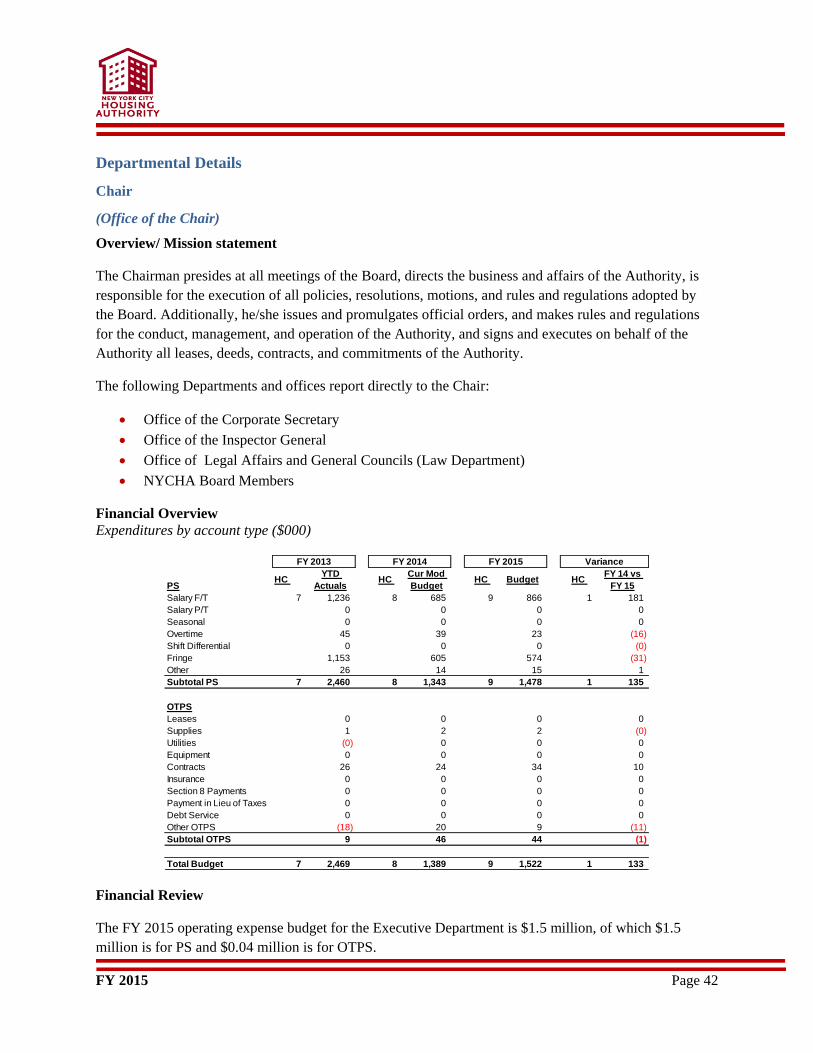
Financial Overview
Expenditures by account type ($000)
Financial Review
The FY 2015 operating expense budget for the Executive Department is $1.5 million, of which $1.5
million is for PS and $0.04 million is for OTPS.
PSHC
YTD
ActualsHC
Cur Mod
BudgetHC Budget HC
FY 14 vs
FY 15
Salary F/T 7 1,236 8 685 9 866 1 181
Salary P/T 0 0 0 0
Seasonal 0 0 0 0
Overtime 45 39 23 (16)
Shift Differential 0 0 0 (0)
Fringe 1,153 605 574 (31)
Other 26 14 15 1
Subtotal PS 7 2,460 8 1,343 9 1,478 1 135
OTPS
Leases 0 0 0 0
Supplies 1 2 2 (0)
Utilities (0) 0 0 0
Equipment 0 0 0 0
Contracts 26 24 34 10
Insurance 0 0 0 0
Section 8 Payments 0 0 0 0
Payment in Lieu of Taxes 0 0 0 0
Debt Service 0 0 0 0
Other OTPS (18) 20 9 (11)
Subtotal OTPS 9 46 44 (1)
Total Budget 7 2,469 8 1,389 9 1,522 1 133
FY 2013 FY 2014 FY 2015 Variance
FY 2015 Page 43
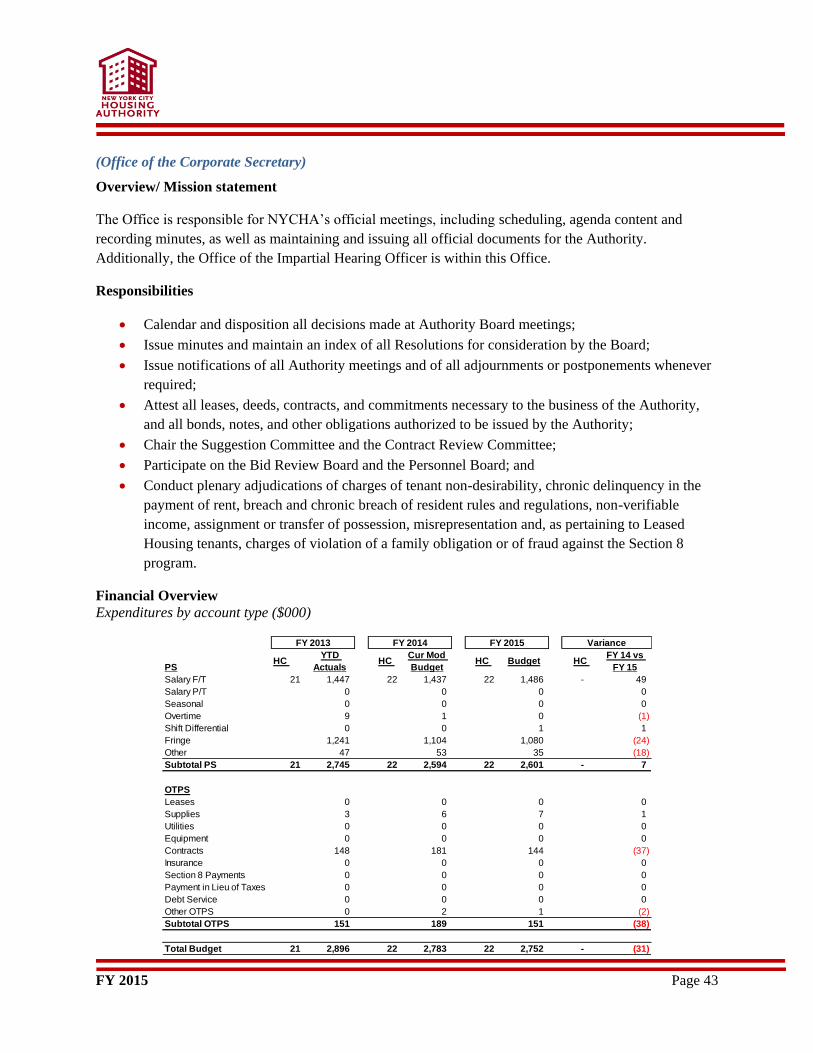
(Office of the Corporate Secretary)
Overview/ Mission statement
The Office is responsible for NYCHA’s official meetings, including scheduling, agenda content and
recording minutes, as well as maintaining and issuing all official documents for the Authority.
Additionally, the Office of the Impartial Hearing Officer is within this Office.
Responsibilities
Calendar and disposition all decisions made at Authority Board meetings;
Issue minutes and maintain an index of all Resolutions for consideration by the Board;
Issue notifications of all Authority meetings and of all adjournments or postponements whenever
required;
Attest all leases, deeds, contracts, and commitments necessary to the business of the Authority,
and all bonds, notes, and other obligations authorized to be issued by the Authority;
Chair the Suggestion Committee and the Contract Review Committee;
Participate on the Bid Review Board and the Personnel Board; and
Conduct plenary adjudications of charges of tenant non-desirability, chronic delinquency in the
payment of rent, breach and chronic breach of resident rules and regulations, non-verifiable
income, assignment or transfer of possession, misrepresentation and, as pertaining to Leased
Housing tenants, charges of violation of a family obligation or of fraud against the Section 8
program.
Financial Overview
Expenditures by account type ($000)
PSHC
YTD
ActualsHC
Cur Mod
BudgetHC Budget HC
FY 14 vs
FY 15
Salary F/T 21 1,447 22 1,437 22 1,486 - 49
Salary P/T 0 0 0 0
Seasonal 0 0 0 0
Overtime 9 1 0 (1)
Shift Differential 0 0 1 1
Fringe 1,241 1,104 1,080 (24)
Other 47 53 35 (18)
Subtotal PS 21 2,745 22 2,594 22 2,601 - 7
OTPS
Leases 0 0 0 0
Supplies 3 6 7 1
Utilities 0 0 0 0
Equipment 0 0 0 0
Contracts 148 181 144 (37)
Insurance 0 0 0 0
Section 8 Payments 0 0 0 0
Payment in Lieu of Taxes 0 0 0 0
Debt Service 0 0 0 0
Other OTPS 0 2 1 (2)
Subtotal OTPS 151 189 151 (38)
Total Budget 21 2,896 22 2,783 22 2,752 - (31)
FY 2013 FY 2014 FY 2015 Variance
FY 2015 Page 44
Financial Review
The FY 2015 operating expense budget for the Office of the Corporate Secretary is $2.8 million, of which
$2.6 million is for PS and $0.2 million is for OTPS.
The PS budget reflects a net increase of $0.01 million due to:
Collective bargaining increases for various unions that were added to the full-time budget in the
amount,
The OTPS budget reflects a net decrease of $0.038 million due to:
The reduction in contracts of $0.04 million and $0.002 million in other OTPS.
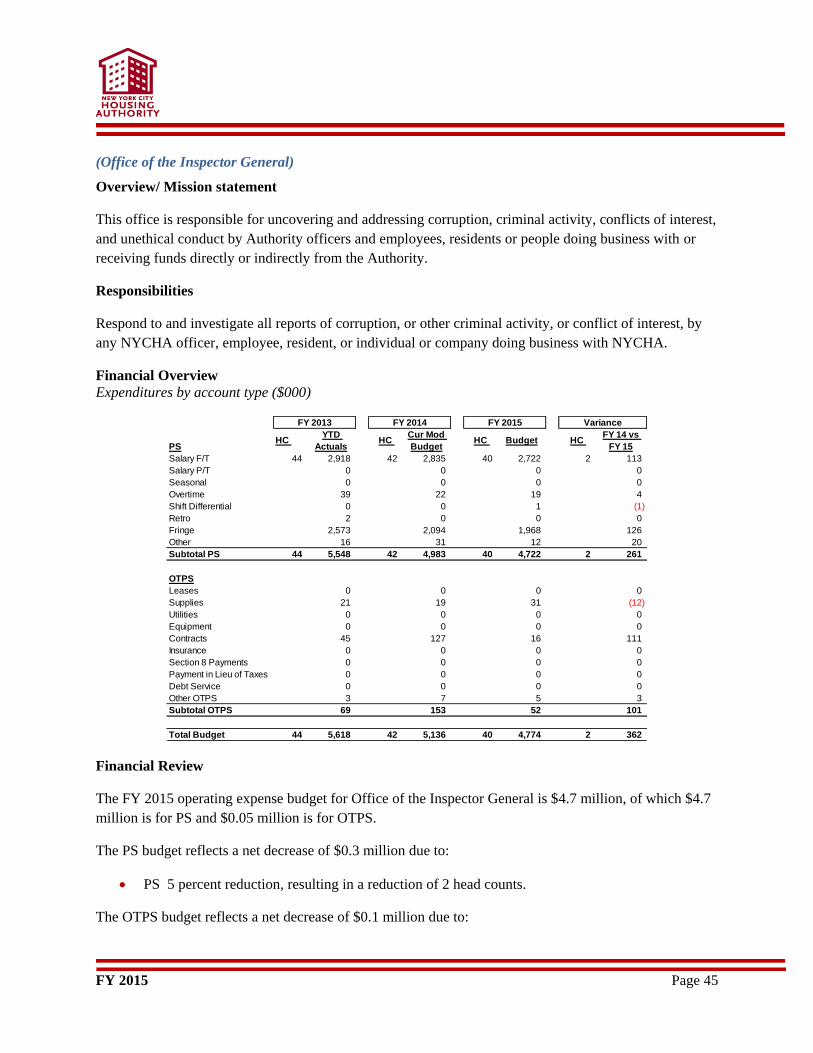
FY 2015 Page 45
(Office of the Inspector General)
Overview/ Mission statement
This office is responsible for uncovering and addressing corruption, criminal activity, conflicts of interest,
and unethical conduct by Authority officers and employees, residents or people doing business with or
receiving funds directly or indirectly from the Authority.
Responsibilities
Respond to and investigate all reports of corruption, or other criminal activity, or conflict of interest, by
any NYCHA officer, employee, resident, or individual or company doing business with NYCHA.
Financial Overview
Expenditures by account type ($000)
Financial Review
The FY 2015 operating expense budget for Office of the Inspector General is $4.7 million, of which $4.7
million is for PS and $0.05 million is for OTPS.
The PS budget reflects a net decrease of $0.3 million due to:
PS 5 percent reduction, resulting in a reduction of 2 head counts.
The OTPS budget reflects a net decrease of $0.1 million due to:
PSHC
YTD
ActualsHC
Cur Mod
BudgetHC Budget HC
FY 14 vs
FY 15
Salary F/T 44 2,918 42 2,835 40 2,722 2 113
Salary P/T 0 0 0 0
Seasonal 0 0 0 0
Overtime 39 22 19 4
Shift Differential 0 0 1 (1)
Retro 2 0 0 0
Fringe 2,573 2,094 1,968 126
Other 16 31 12 20
Subtotal PS 44 5,548 42 4,983 40 4,722 2 261
OTPS
Leases 0 0 0 0
Supplies 21 19 31 (12)
Utilities 0 0 0 0
Equipment 0 0 0 0
Contracts 45 127 16 111
Insurance 0 0 0 0
Section 8 Payments 0 0 0 0
Payment in Lieu of Taxes 0 0 0 0
Debt Service 0 0 0 0
Other OTPS 3 7 5 3
Subtotal OTPS 69 153 52 101
Total Budget 44 5,618 42 5,136 40 4,774 2 362
FY 2013 FY 2014 FY 2015 Variance
FY 2015 Page 46
2 percent reduction in discretionary accounts, resulting in the reduction in contracts of $0.11
million and $0.003 million in other OTPS.
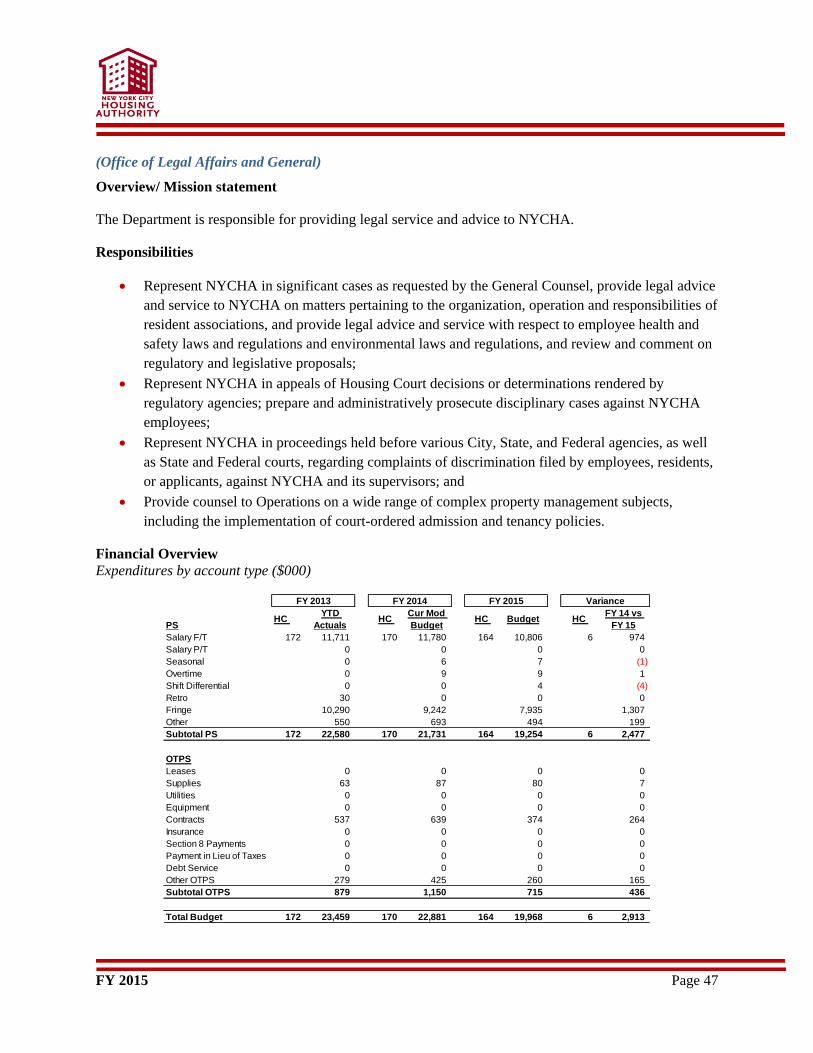
FY 2015 Page 47
(Office of Legal Affairs and General)
Overview/ Mission statement
The Department is responsible for providing legal service and advice to NYCHA.
Responsibilities
Represent NYCHA in significant cases as requested by the General Counsel, provide legal advice
and service to NYCHA on matters pertaining to the organization, operation and responsibilities of
resident associations, and provide legal advice and service with respect to employee health and
safety laws and regulations and environmental laws and regulations, and review and comment on
regulatory and legislative proposals;
Represent NYCHA in appeals of Housing Court decisions or determinations rendered by
regulatory agencies; prepare and administratively prosecute disciplinary cases against NYCHA
employees;
Represent NYCHA in proceedings held before various City, State, and Federal agencies, as well
as State and Federal courts, regarding complaints of discrimination filed by employees, residents,
or applicants, against NYCHA and its supervisors; and
Provide counsel to Operations on a wide range of complex property management subjects,
including the implementation of court-ordered admission and tenancy policies.
Financial Overview
Expenditures by account type ($000)
PSHC
YTD
ActualsHC
Cur Mod
BudgetHC Budget HC
FY 14 vs
FY 15
Salary F/T 172 11,711 170 11,780 164 10,806 6 974
Salary P/T 0 0 0 0
Seasonal 0 6 7 (1)
Overtime 0 9 9 1
Shift Differential 0 0 4 (4)
Retro 30 0 0 0
Fringe 10,290 9,242 7,935 1,307
Other 550 693 494 199
Subtotal PS 172 22,580 170 21,731 164 19,254 6 2,477
OTPS
Leases 0 0 0 0
Supplies 63 87 80 7
Utilities 0 0 0 0
Equipment 0 0 0 0
Contracts 537 639 374 264
Insurance 0 0 0 0
Section 8 Payments 0 0 0 0
Payment in Lieu of Taxes 0 0 0 0
Debt Service 0 0 0 0
Other OTPS 279 425 260 165
Subtotal OTPS 879 1,150 715 436
Total Budget 172 23,459 170 22,881 164 19,968 6 2,913
FY 2013 FY 2014 FY 2015 Variance

FY 2015 Page 48
Financial Review
The FY 2015 operating expense budget for the Office of Legal Affairs and General is $19.9 million, of
which $19.3 million is for PS and $0.7 million is for OTPS.
The PS budget reflects a net decrease of $2.48 million due to:
PS 5 percent reduction which resulted in a 6 HC reduction in the department.
The OTPS budget reflects a net decrease of $0.436 million due to:
The 2 percent OTPS reduction in discretionary accounts;
Reduction of contracts of $0.26 million;
Reduction of other OTPS of $0.17 million
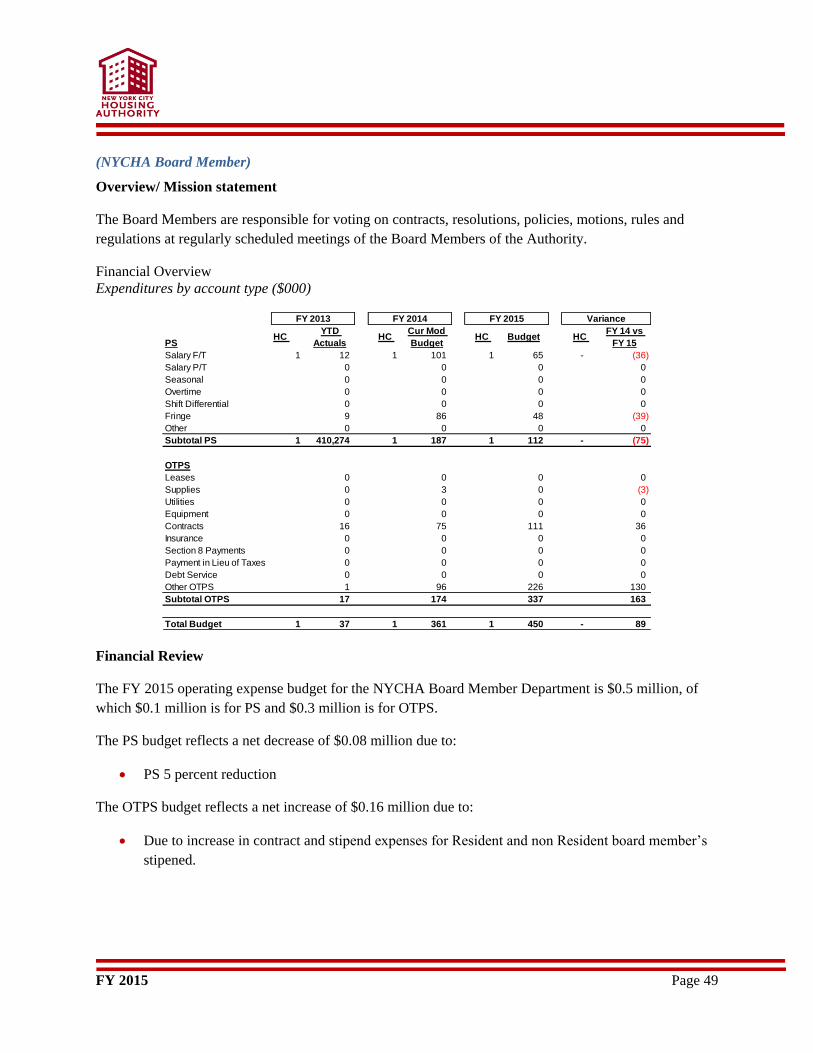
FY 2015 Page 49
(NYCHA Board Member)
Overview/ Mission statement
The Board Members are responsible for voting on contracts, resolutions, policies, motions, rules and
regulations at regularly scheduled meetings of the Board Members of the Authority.
Financial Overview
Expenditures by account type ($000)
Financial Review
The FY 2015 operating expense budget for the NYCHA Board Member Department is $0.5 million, of
which $0.1 million is for PS and $0.3 million is for OTPS.
The PS budget reflects a net decrease of $0.08 million due to:
PS 5 percent reduction
The OTPS budget reflects a net increase of $0.16 million due to:
Due to increase in contract and stipend expenses for Resident and non Resident board member’s
stipened.
PSHC
YTD
ActualsHC
Cur Mod
BudgetHC Budget HC
FY 14 vs
FY 15
Salary F/T 1 12 1 101 1 65 - (36)
Salary P/T 0 0 0 0
Seasonal 0 0 0 0
Overtime 0 0 0 0
Shift Differential 0 0 0 0
Fringe 9 86 48 (39)
Other 0 0 0 0
Subtotal PS 1 410,274 1 187 1 112 - (75)
OTPS
Leases 0 0 0 0
Supplies 0 3 0 (3)
Utilities 0 0 0 0
Equipment 0 0 0 0
Contracts 16 75 111 36
Insurance 0 0 0 0
Section 8 Payments 0 0 0 0
Payment in Lieu of Taxes 0 0 0 0
Debt Service 0 0 0 0
Other OTPS 1 96 226 130
Subtotal OTPS 17 174 337 163
Total Budget 1 37 1 361 1 450 - 89
FY 2013 FY 2014 FY 2015 Variance
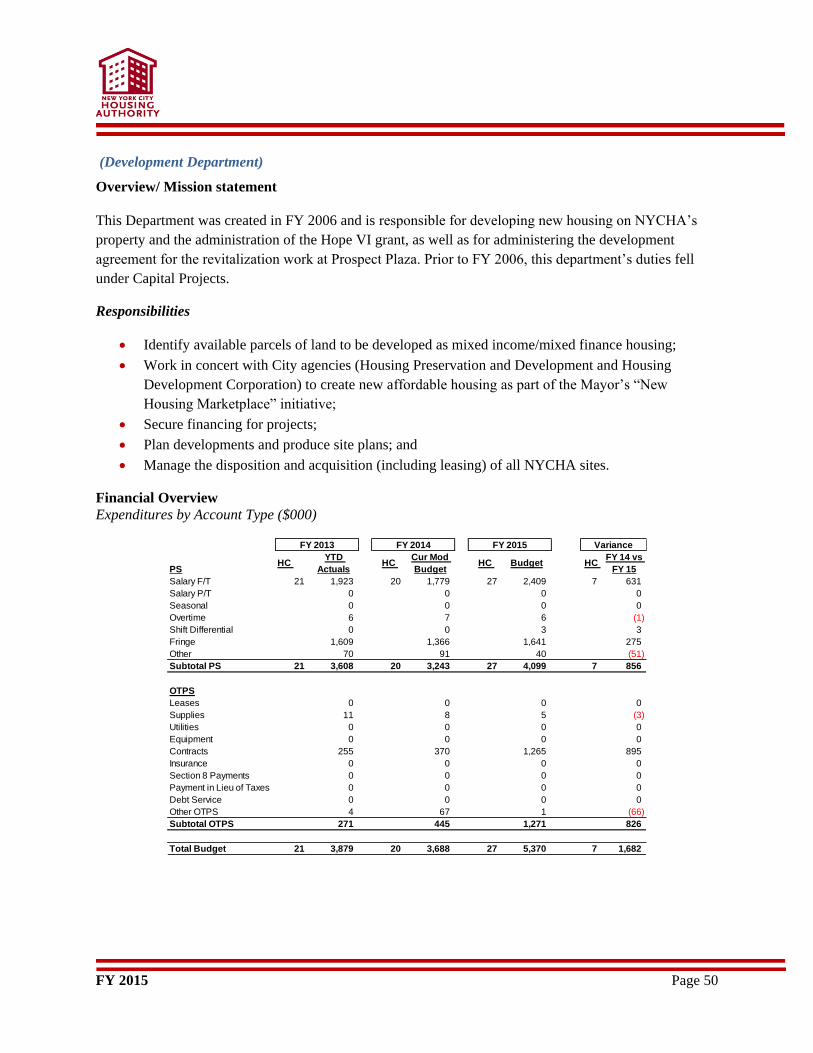
FY 2015 Page 50
(Development Department)
Overview/ Mission statement
This Department was created in FY 2006 and is responsible for developing new housing on NYCHA’s
property and the administration of the Hope VI grant, as well as for administering the development
agreement for the revitalization work at Prospect Plaza. Prior to FY 2006, this department’s duties fell
under Capital Projects.
Responsibilities
Identify available parcels of land to be developed as mixed income/mixed finance housing;
Work in concert with City agencies (Housing Preservation and Development and Housing
Development Corporation) to create new affordable housing as part of the Mayor’s “New
Housing Marketplace” initiative;
Secure financing for projects;
Plan developments and produce site plans; and
Manage the disposition and acquisition (including leasing) of all NYCHA sites.
Financial Overview
Expenditures by Account Type ($000)
PSHC
YTD
ActualsHC
Cur Mod
BudgetHC Budget HC
FY 14 vs
FY 15
Salary F/T 21 1,923 20 1,779 27 2,409 7 631
Salary P/T 0 0 0 0
Seasonal 0 0 0 0
Overtime 6 7 6 (1)
Shift Differential 0 0 3 3
Fringe 1,609 1,366 1,641 275
Other 70 91 40 (51)
Subtotal PS 21 3,608 20 3,243 27 4,099 7 856
OTPS
Leases 0 0 0 0
Supplies 11 8 5 (3)
Utilities 0 0 0 0
Equipment 0 0 0 0
Contracts 255 370 1,265 895
Insurance 0 0 0 0
Section 8 Payments 0 0 0 0
Payment in Lieu of Taxes 0 0 0 0
Debt Service 0 0 0 0
Other OTPS 4 67 1 (66)
Subtotal OTPS 271 445 1,271 826
Total Budget 21 3,879 20 3,688 27 5,370 7 1,682
FY 2013 FY 2014 FY 2015 Variance
FY 2015 Page 51
Financial Review
The FY 2015 operating expense budget for the Development Department is $5.4 million, of which $4.1
million is for PS and $1.3 million is for OTPS.
The PS budget reflects a net increase of $0.86 million due to:
Auhtorized a increase of 7 Heads in order for the department to fullfill its mission and
proporperly fund NEXTGen iniative.
The OTPS budget reflects a net increase of $0.8 million due to:
Increased contract lines to fund NEXTGen initaives
Increased contract lines to fund consulatants,lawyers and financial advisors to underwrite and
close deals.
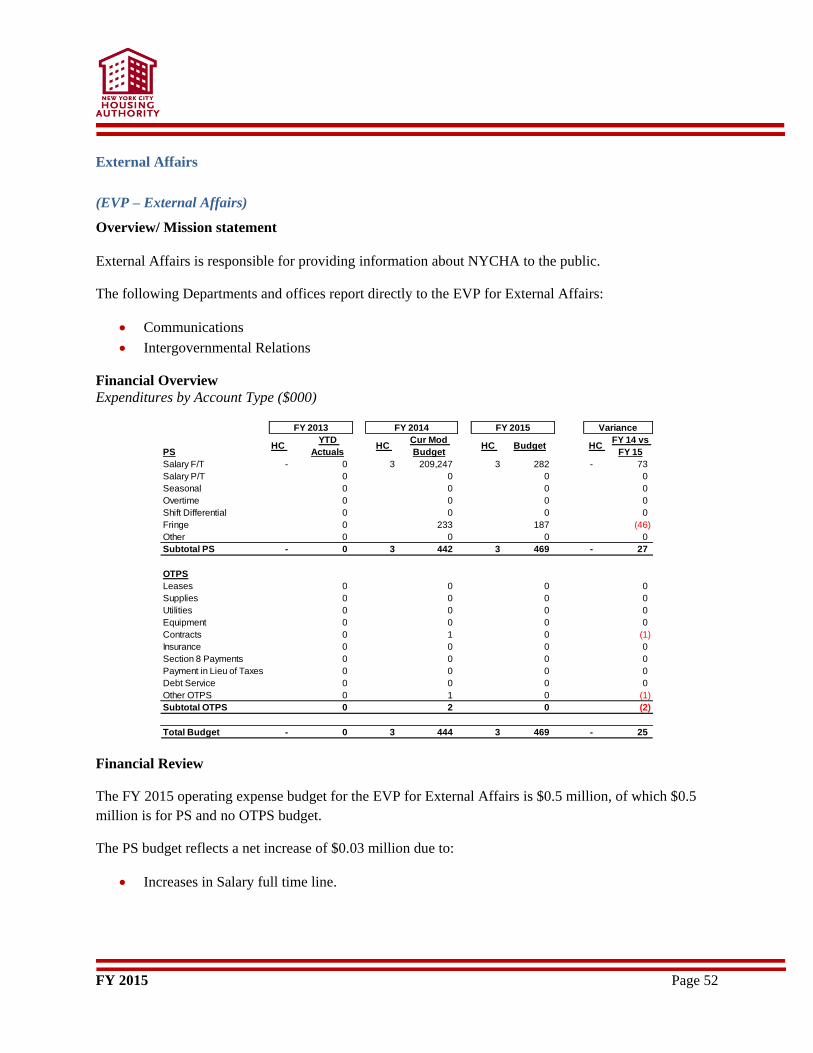
FY 2015 Page 52
External Affairs
(EVP – External Affairs)
Overview/ Mission statement
External Affairs is responsible for providing information about NYCHA to the public.
The following Departments and offices report directly to the EVP for External Affairs:
Communications
Intergovernmental Relations
Financial Overview
Expenditures by Account Type ($000)
Financial Review
The FY 2015 operating expense budget for the EVP for External Affairs is $0.5 million, of which $0.5
million is for PS and no OTPS budget.
The PS budget reflects a net increase of $0.03 million due to:
Increases in Salary full time line.
PSHC
YTD
ActualsHC
Cur Mod
BudgetHC Budget HC
FY 14 vs
FY 15
Salary F/T - 0 3 209,247 3 282 - 73
Salary P/T 0 0 0 0
Seasonal 0 0 0 0
Overtime 0 0 0 0
Shift Differential 0 0 0 0
Fringe 0 233 187 (46)
Other 0 0 0 0
Subtotal PS - 0 3 442 3 469 - 27
OTPS
Leases 0 0 0 0
Supplies 0 0 0 0
Utilities 0 0 0 0
Equipment 0 0 0 0
Contracts 0 1 0 (1)
Insurance 0 0 0 0
Section 8 Payments 0 0 0 0
Payment in Lieu of Taxes 0 0 0 0
Debt Service 0 0 0 0
Other OTPS 0 1 0 (1)
Subtotal OTPS 0 2 0 (2)
Total Budget - 0 3 444 3 469 - 25
FY 2013 FY 2014 FY 2015 Variance
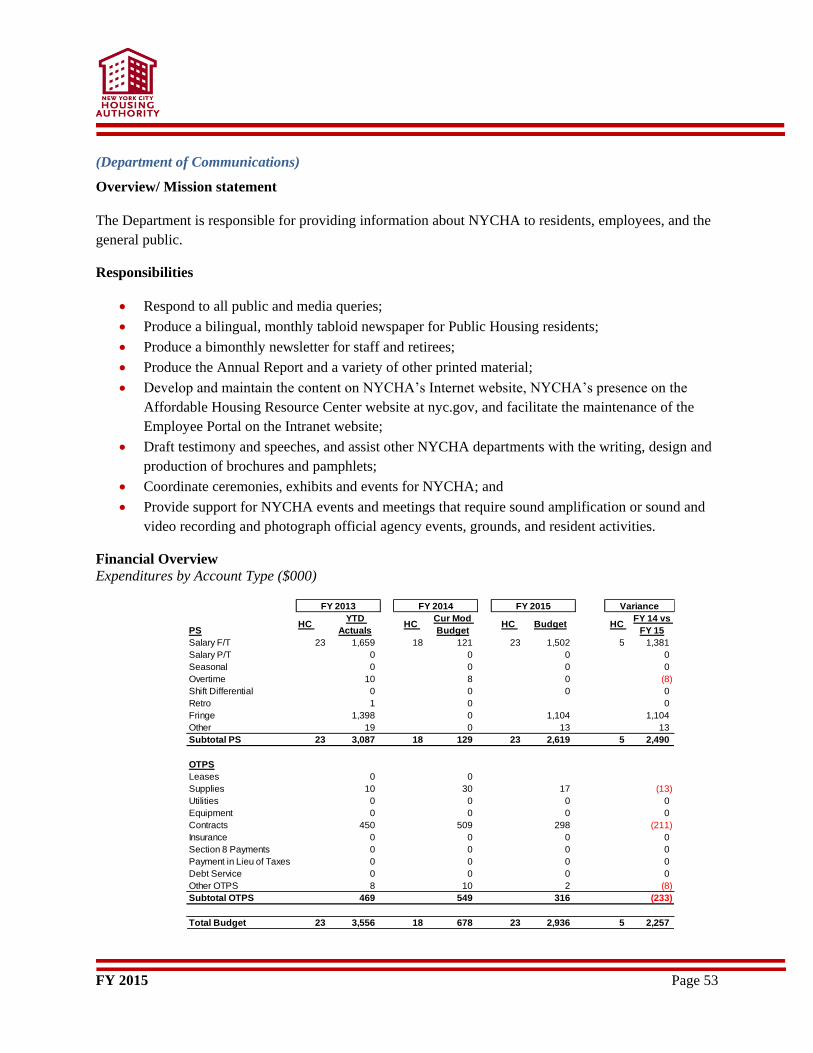
FY 2015 Page 53
(Department of Communications)
Overview/ Mission statement
The Department is responsible for providing information about NYCHA to residents, employees, and the
general public.
Responsibilities
Respond to all public and media queries;
Produce a bilingual, monthly tabloid newspaper for Public Housing residents;
Produce a bimonthly newsletter for staff and retirees;
Produce the Annual Report and a variety of other printed material;
Develop and maintain the content on NYCHA’s Internet website, NYCHA’s presence on the
Affordable Housing Resource Center website at nyc.gov, and facilitate the maintenance of the
Employee Portal on the Intranet website;
Draft testimony and speeches, and assist other NYCHA departments with the writing, design and
production of brochures and pamphlets;
Coordinate ceremonies, exhibits and events for NYCHA; and
Provide support for NYCHA events and meetings that require sound amplification or sound and
video recording and photograph official agency events, grounds, and resident activities.
Financial Overview
Expenditures by Account Type ($000)
PSHC
YTD
ActualsHC
Cur Mod
BudgetHC Budget HC
FY 14 vs
FY 15
Salary F/T 23 1,659 18 121 23 1,502 5 1,381
Salary P/T 0 0 0 0
Seasonal 0 0 0 0
Overtime 10 8 0 (8)
Shift Differential 0 0 0 0
Retro 1 0 0
Fringe 1,398 0 1,104 1,104
Other 19 0 13 13
Subtotal PS 23 3,087 18 129 23 2,619 5 2,490
OTPS
Leases 0 0
Supplies 10 30 17 (13)
Utilities 0 0 0 0
Equipment 0 0 0 0
Contracts 450 509 298 (211)
Insurance 0 0 0 0
Section 8 Payments 0 0 0 0
Payment in Lieu of Taxes 0 0 0 0
Debt Service 0 0 0 0
Other OTPS 8 10 2 (8)
Subtotal OTPS 469 549 316 (233)
Total Budget 23 3,556 18 678 23 2,936 5 2,257
FY 2013 FY 2014 FY 2015 Variance
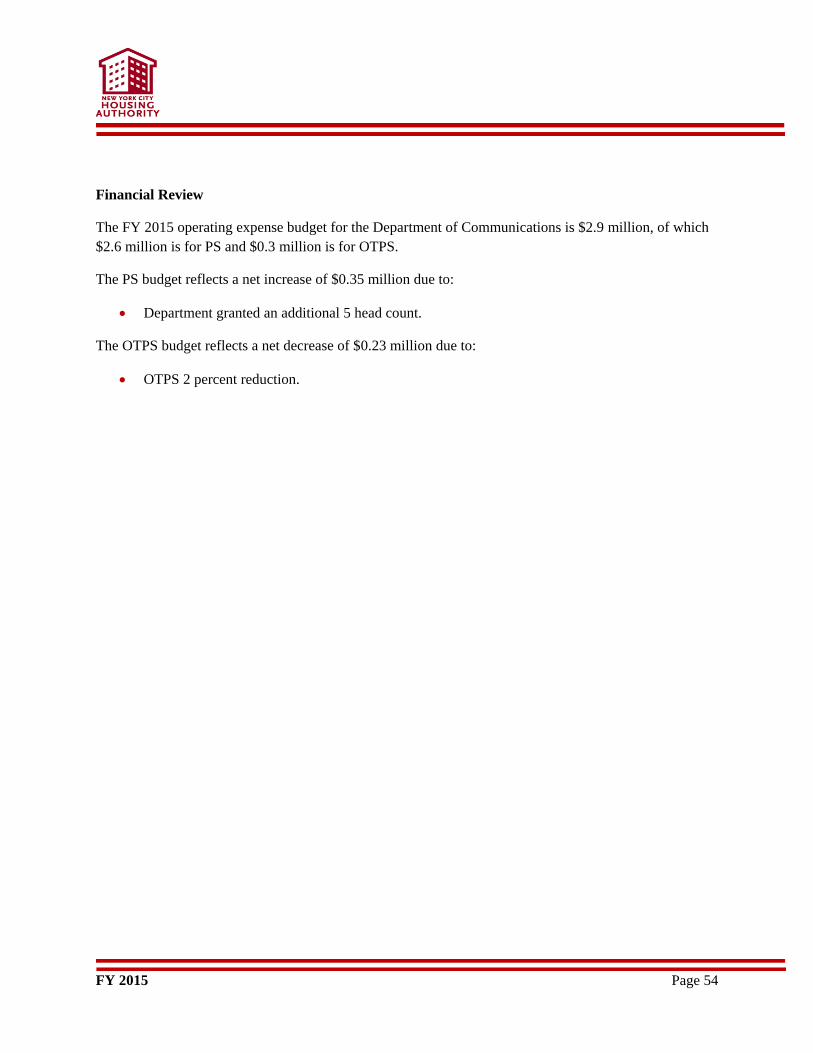
FY 2015 Page 54
Financial Review
The FY 2015 operating expense budget for the Department of Communications is $2.9 million, of which
$2.6 million is for PS and $0.3 million is for OTPS.
The PS budget reflects a net increase of $0.35 million due to:
Department granted an additional 5 head count.
The OTPS budget reflects a net decrease of $0.23 million due to:
OTPS 2 percent reduction.
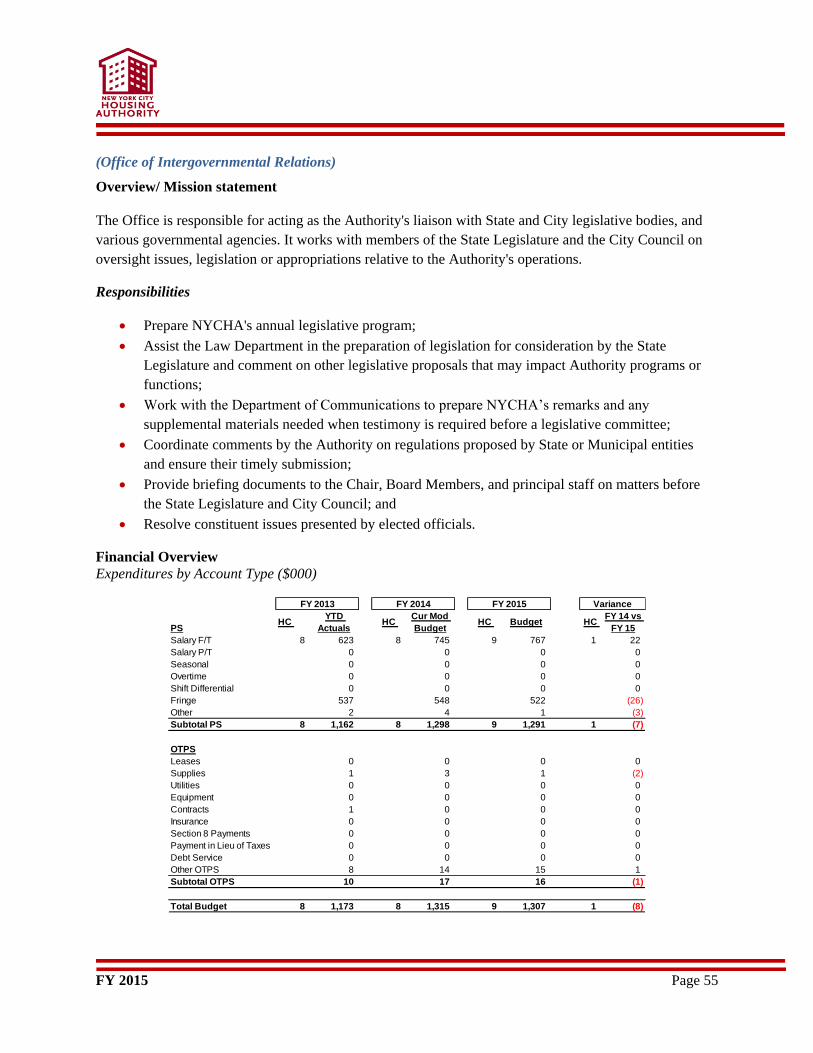
FY 2015 Page 55
(Office of Intergovernmental Relations)
Overview/ Mission statement
The Office is responsible for acting as the Authority's liaison with State and City legislative bodies, and
various governmental agencies. It works with members of the State Legislature and the City Council on
oversight issues, legislation or appropriations relative to the Authority's operations.
Responsibilities
Prepare NYCHA's annual legislative program;
Assist the Law Department in the preparation of legislation for consideration by the State
Legislature and comment on other legislative proposals that may impact Authority programs or
functions;
Work with the Department of Communications to prepare NYCHA’s remarks and any
supplemental materials needed when testimony is required before a legislative committee;
Coordinate comments by the Authority on regulations proposed by State or Municipal entities
and ensure their timely submission;
Provide briefing documents to the Chair, Board Members, and principal staff on matters before
the State Legislature and City Council; and
Resolve constituent issues presented by elected officials.
Financial Overview
Expenditures by Account Type ($000)
PSHC
YTD
ActualsHC
Cur Mod
BudgetHC Budget HC
FY 14 vs
FY 15
Salary F/T 8 623 8 745 9 767 1 22
Salary P/T 0 0 0 0
Seasonal 0 0 0 0
Overtime 0 0 0 0
Shift Differential 0 0 0 0
Fringe 537 548 522 (26)
Other 2 4 1 (3)
Subtotal PS 8 1,162 8 1,298 9 1,291 1 (7)
OTPS
Leases 0 0 0 0
Supplies 1 3 1 (2)
Utilities 0 0 0 0
Equipment 0 0 0 0
Contracts 1 0 0 0
Insurance 0 0 0 0
Section 8 Payments 0 0 0 0
Payment in Lieu of Taxes 0 0 0 0
Debt Service 0 0 0 0
Other OTPS 8 14 15 1
Subtotal OTPS 10 17 16 (1)
Total Budget 8 1,173 8 1,315 9 1,307 1 (8)
FY 2013 FY 2014 FY 2015 Variance

FY 2015 Page 56
Financial Review
The FY 2015 operating expense budget for the Office of Intergovernmental Relations is $1.3 million, of
which $1.3 million is for PS and $0.02 million is for OTPS.
The PS budget reflects a net decrease of $.01 million due to:
Department granted an additional 1 head count.
Other PS account was impacted by 5 percent reduction in PS accounts.
The OTPS budget reflects a net decrease of $0.01 million due to:
OTPS 2 percent reduction.
FY 2015 Page 57
General Manager
(EVP for General Manager)
Overview/ Mission Statement
The General Manager (GM) is the principal executive administrator of the Authority, and is responsible
for the execution of all orders, rules and regulations made or approved by the Authority. EVPs act for the
GM when required, and work with the GM in the day-to-day operation and administration of the business
of the Authority. Each EVP is responsible for a portfolio of Departments and offices within a specific
cluster or area.
The following report to the GM:
EVP for Audits
EVP for Operations;
EVP for Community Operations;
EVP for Administration;
EVP for Capital Projects;
EVP for Finance/CFO;
Chief Information Officer/CIO; and
EVP for Leased Housing.
Financial Overview
Expenditures by Account Type ($000)
PSHC
YTD
ActualsHC
Cur Mod
BudgetHC Budget HC
FY 14 vs
FY 15
Salary F/T 5 502 4 437 6 576 2 138
Salary P/T 0 0 0 0
Seasonal 0 0 0 0
Overtime 8 22 0 (22)
Shift Differential 0 0 0 0
Fringe 441 308 380 72
Other 3 3 0 (51)
Subtotal PS 5 954 4 770 6 956 2 137
OTPS
Leases 0 0 0 0
Supplies 1 5 1 (4)
Utilities 0 0 0 0
Equipment 0 0 0 0
Contracts 67 87 91 3
Insurance 0 0 0 0
Section 8 Payments 0 0 0 0
Payment in Lieu of Taxes 0 0 0 0
Debt Service 0 0 0 0
Other OTPS 127 191 186 (5)
Subtotal OTPS 195 283 278 (5)
Total Budget 5 1,149 4 1,054 6 1,234 2 132
FY 2013 FY 2014 FY 2015 Variance
FY 2015 Page 58
Financial Review
The FY 2015 operating expense budget for General Manager is $1.2 million, of which $0.9 million is for
PS and $0.3 million is for OTPS.
The PS budget reflects a net increase of $0.14 million due to:
2 Additional Head counts were budgeted
Other PS accounts have been impacted by a 5 percent Reduction.
The OTPS budget reflects a net decrease of $0.005 million due to:
OTPS accounts have been impacted by 2 percent reduction
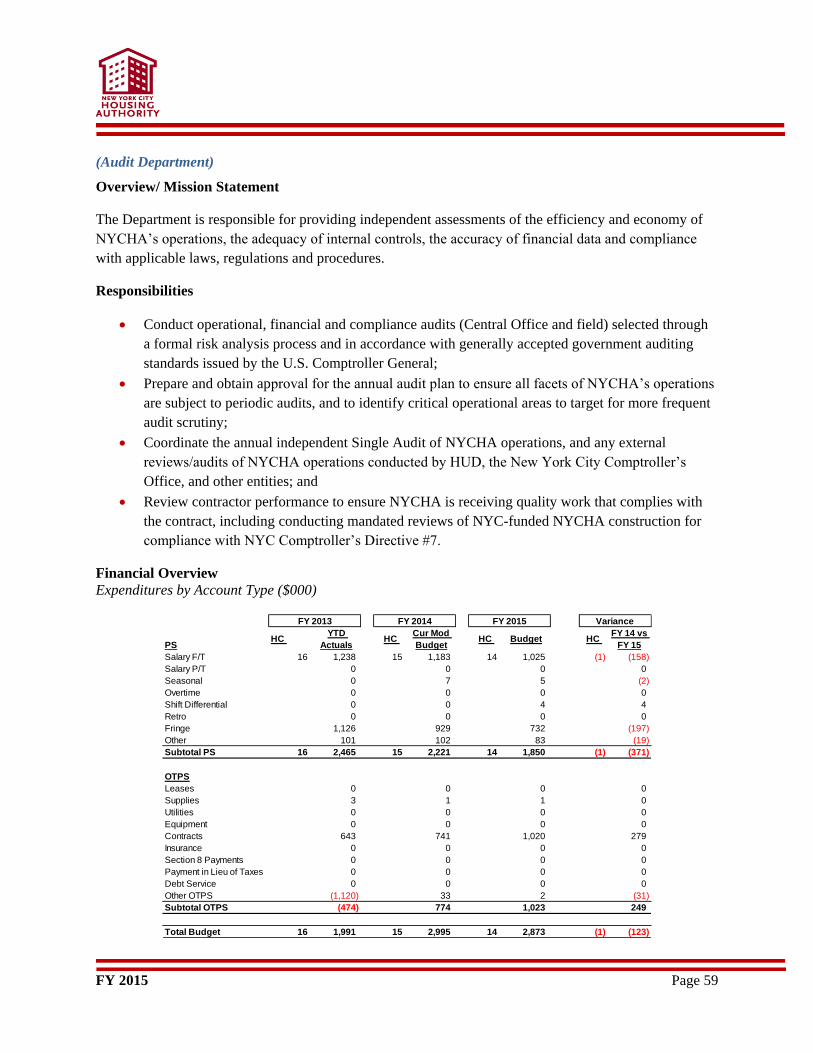
FY 2015 Page 59
(Audit Department)
Overview/ Mission Statement
The Department is responsible for providing independent assessments of the efficiency and economy of
NYCHA’s operations, the adequacy of internal controls, the accuracy of financial data and compliance
with applicable laws, regulations and procedures.
Responsibilities
Conduct operational, financial and compliance audits (Central Office and field) selected through
a formal risk analysis process and in accordance with generally accepted government auditing
standards issued by the U.S. Comptroller General;
Prepare and obtain approval for the annual audit plan to ensure all facets of NYCHA’s operations
are subject to periodic audits, and to identify critical operational areas to target for more frequent
audit scrutiny;
Coordinate the annual independent Single Audit of NYCHA operations, and any external
reviews/audits of NYCHA operations conducted by HUD, the New York City Comptroller’s
Office, and other entities; and
Review contractor performance to ensure NYCHA is receiving quality work that complies with
the contract, including conducting mandated reviews of NYC-funded NYCHA construction for
compliance with NYC Comptroller’s Directive #7.
Financial Overview
Expenditures by Account Type ($000)
PSHC
YTD
ActualsHC
Cur Mod
BudgetHC Budget HC
FY 14 vs
FY 15
Salary F/T 16 1,238 15 1,183 14 1,025 (1) (158)
Salary P/T 0 0 0 0
Seasonal 0 7 5 (2)
Overtime 0 0 0 0
Shift Differential 0 0 4 4
Retro 0 0 0 0
Fringe 1,126 929 732 (197)
Other 101 102 83 (19)
Subtotal PS 16 2,465 15 2,221 14 1,850 (1) (371)
OTPS
Leases 0 0 0 0
Supplies 3 1 1 0
Utilities 0 0 0 0
Equipment 0 0 0 0
Contracts 643 741 1,020 279
Insurance 0 0 0 0
Section 8 Payments 0 0 0 0
Payment in Lieu of Taxes 0 0 0 0
Debt Service 0 0 0 0
Other OTPS (1,120) 33 2 (31)
Subtotal OTPS (474) 774 1,023 249
Total Budget 16 1,991 15 2,995 14 2,873 (1) (123)
FY 2013 FY 2014 FY 2015 Variance
FY 2015 Page 60
Financial Review
The FY 2015 operating expense budget for the Audit Department is $2.9 million, of which $1.9 million is
for PS and $1.0 million is for OTPS.
The PS budget reflects a net decrease of $0.4 million due to:
PS 5 percent reduction
The OTPS budget reflects a net increase of $0.3 million due to:
An increase in contracts of $0.3 million due to an increase in the expected price to perform audits.
(Strategic Priorities)
Overview/ Mission Statement
The Strategic Priorities Department was newly created and its mission is to assist the organization in
identifying and addressing opportunities for improvements that will help NYCHA strengthen its delivery
of services.
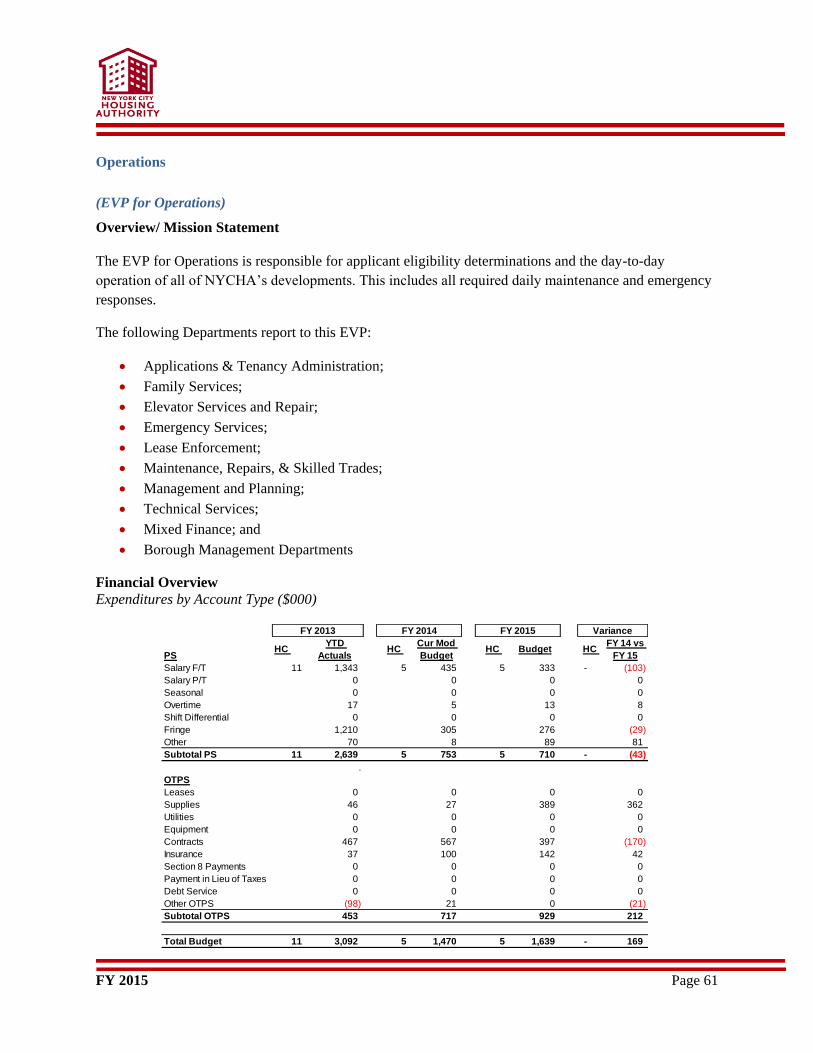
FY 2015 Page 61
Operations
(EVP for Operations)
Overview/ Mission Statement
The EVP for Operations is responsible for applicant eligibility determinations and the day-to-day
operation of all of NYCHA’s developments. This includes all required daily maintenance and emergency
responses.
The following Departments report to this EVP:
Applications & Tenancy Administration;
Family Services;
Elevator Services and Repair;
Emergency Services;
Lease Enforcement;
Maintenance, Repairs, & Skilled Trades;
Management and Planning;
Technical Services;
Mixed Finance; and
Borough Management Departments
Financial Overview
Expenditures by Account Type ($000)
PSHC
YTD
ActualsHC
Cur Mod
BudgetHC Budget HC
FY 14 vs
FY 15
Salary F/T 11 1,343 5 435 5 333 - (103)
Salary P/T 0 0 0 0
Seasonal 0 0 0 0
Overtime 17 5 13 8
Shift Differential 0 0 0 0
Fringe 1,210 305 276 (29)
Other 70 8 89 81
Subtotal PS 11 2,639 5 753 5 710 - (43)
.
OTPS
Leases 0 0 0 0
Supplies 46 27 389 362
Utilities 0 0 0 0
Equipment 0 0 0 0
Contracts 467 567 397 (170)
Insurance 37 100 142 42
Section 8 Payments 0 0 0 0
Payment in Lieu of Taxes 0 0 0 0
Debt Service 0 0 0 0
Other OTPS (98) 21 0 (21)
Subtotal OTPS 453 717 929 212
Total Budget 11 3,092 5 1,470 5 1,639 - 169
FY 2013 FY 2014 FY 2015 Variance

FY 2015 Page 62
Financial Review
The FY 2015 operating expense budget for the EVP for Operations is $1.6 million, of which $0.7 million
is for PS and $0.9 million is for OTPS.
FY 2015 Page 63
(Application & Tenancy Administration)
Overview/ Mission Statement
The Applications and Tenancy Administration Department (ATAD) determines the eligibility of
applicants for Public Housing and Section 8 programs. The Department also processes inter- and intra-
development transfer requests and manages the relocation of residents at developments undergoing major
modernization activity. ATAD is responsible for: providing a sufficient number of certified applications
to meet the rental needs of management and the Leased Housing Department, maintaining the waiting list
for Public Housing and Section 8 programs, administering the Public Housing Tenant Selection and
Assignment Plan (TSAP), determining the eligibility of applicants to Public Housing and Section 8
programs, assisting management staff with questions and issues arising from the use of HUD's Enterprise
Income Verification system (EIV) and certifying EIV users semi-annually.
Responsibilities
Maintaining the applicant waiting list for Public Housing and Section 8 programs.
Providing a sufficient number of certified applications to meet the rental needs of Public Housing
and Section 8.
Process and maintain Public Housing transfers; liaison to Property Management regarding
applicants and transfers.
Administering the Public Housing Tenant Selection and Assignment Plan (TSAP)
Assisting management staff with questions and issues arising from the use of HUD’s Enterprise
Income Verification system (EIV) and certifying EIV users semi-annually
Relocation division
Vacancy review
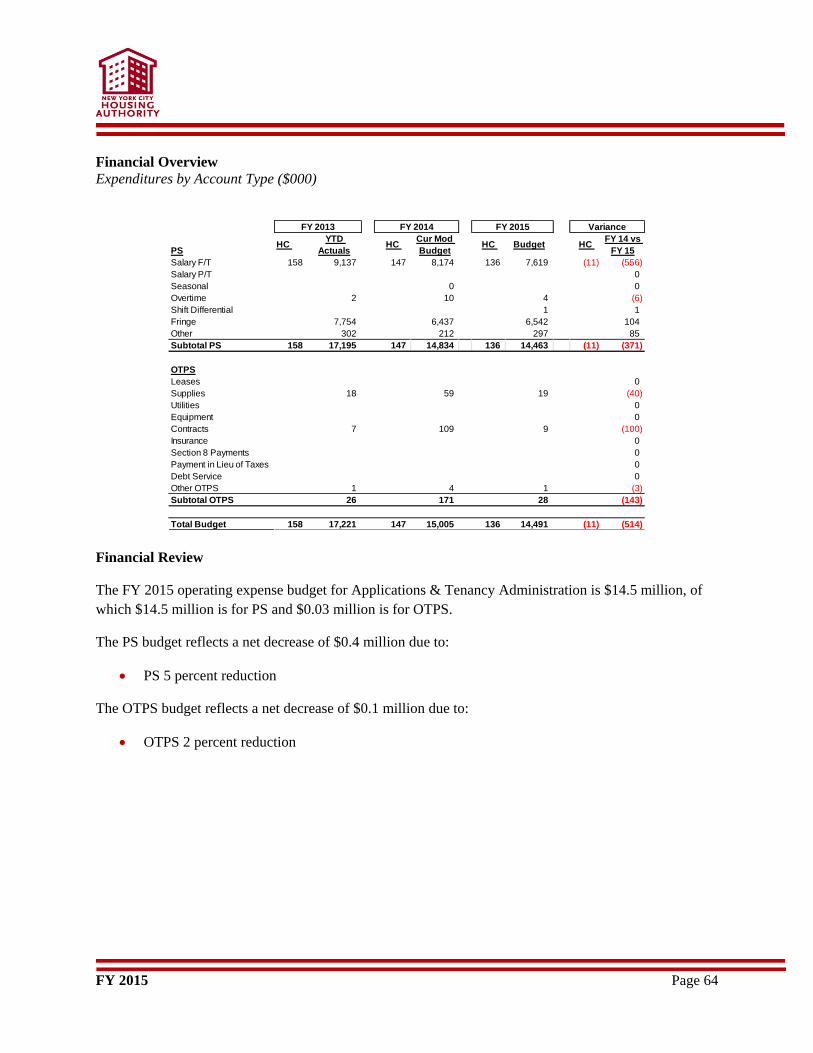
FY 2015 Page 64
Financial Overview
Expenditures by Account Type ($000)
Financial Review
The FY 2015 operating expense budget for Applications & Tenancy Administration is $14.5 million, of
which $14.5 million is for PS and $0.03 million is for OTPS.
The PS budget reflects a net decrease of $0.4 million due to:
PS 5 percent reduction
The OTPS budget reflects a net decrease of $0.1 million due to:
OTPS 2 percent reduction
PSHC
YTD
ActualsHC
Cur Mod
BudgetHC Budget HC
FY 14 vs
FY 15
Salary F/T 158 9,137 147 8,174 136 7,619 (11) (556)
Salary P/T 0
Seasonal 0 0
Overtime 2 10 4 (6)
Shift Differential 1 1
Fringe 7,754 6,437 6,542 104
Other 302 212 297 85
Subtotal PS 158 17,195 147 14,834 136 14,463 (11) (371)
OTPS
Leases 0
Supplies 18 59 19 (40)
Utilities 0
Equipment 0
Contracts 7 109 9 (100)
Insurance 0
Section 8 Payments 0
Payment in Lieu of Taxes 0
Debt Service 0
Other OTPS 1 4 1 (3)
Subtotal OTPS 26 171 28 (143)
Total Budget 158 17,221 147 15,005 136 14,491 (11) (514)
FY 2013 FY 2014 FY 2015 Variance
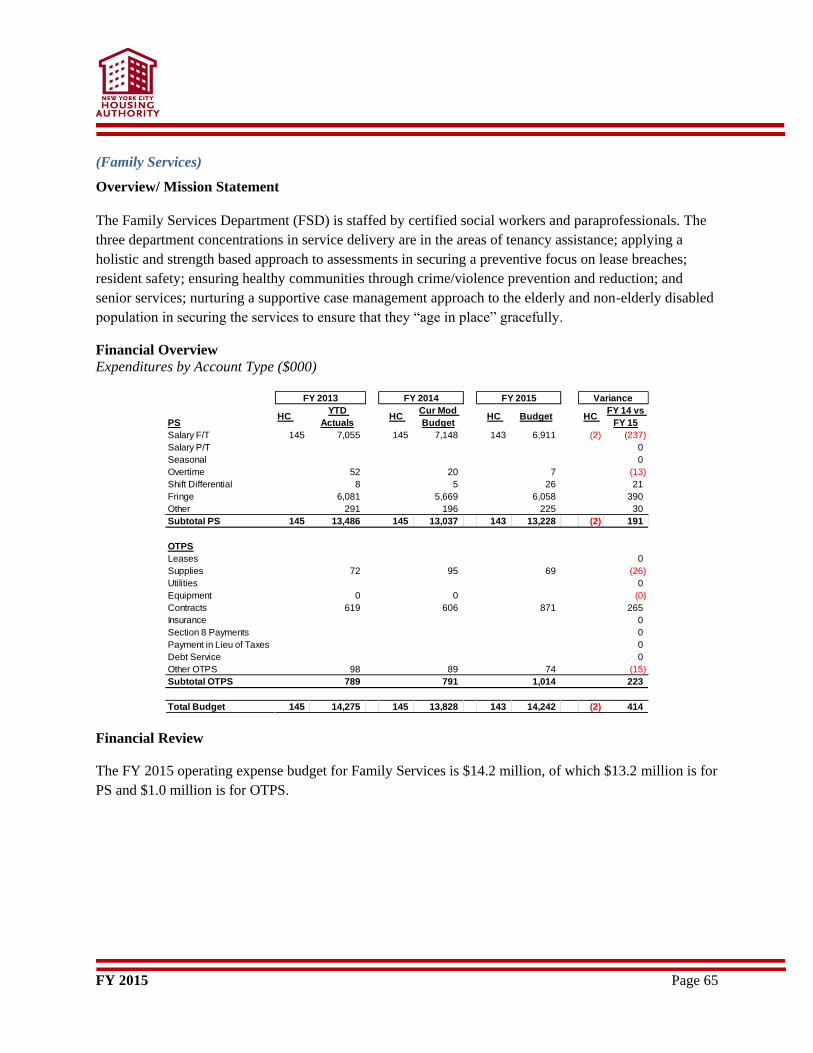
FY 2015 Page 65
(Family Services)
Overview/ Mission Statement
The Family Services Department (FSD) is staffed by certified social workers and paraprofessionals. The
three department concentrations in service delivery are in the areas of tenancy assistance; applying a
holistic and strength based approach to assessments in securing a preventive focus on lease breaches;
resident safety; ensuring healthy communities through crime/violence prevention and reduction; and
senior services; nurturing a supportive case management approach to the elderly and non-elderly disabled
population in securing the services to ensure that they “age in place” gracefully.
Financial Overview
Expenditures by Account Type ($000)
Financial Review
The FY 2015 operating expense budget for Family Services is $14.2 million, of which $13.2 million is for
PS and $1.0 million is for OTPS.
PSHC
YTD
ActualsHC
Cur Mod
BudgetHC Budget HC
FY 14 vs
FY 15
Salary F/T 145 7,055 145 7,148 143 6,911 (2) (237)
Salary P/T 0
Seasonal 0
Overtime 52 20 7 (13)
Shift Differential 8 5 26 21
Fringe 6,081 5,669 6,058 390
Other 291 196 225 30
Subtotal PS 145 13,486 145 13,037 143 13,228 (2) 191
OTPS
Leases 0
Supplies 72 95 69 (26)
Utilities 0
Equipment 0 0 (0)
Contracts 619 606 871 265
Insurance 0
Section 8 Payments 0
Payment in Lieu of Taxes 0
Debt Service 0
Other OTPS 98 89 74 (15)
Subtotal OTPS 789 791 1,014 223
Total Budget 145 14,275 145 13,828 143 14,242 (2) 414
FY 2013 FY 2014 FY 2015 Variance
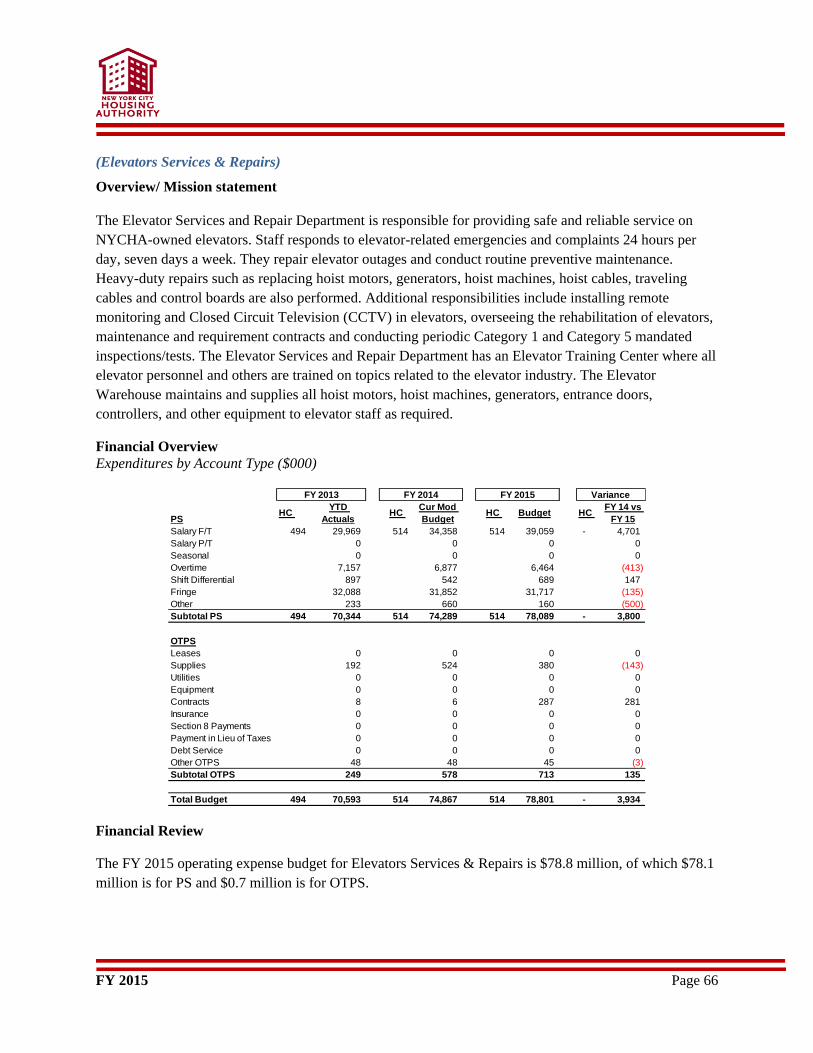
FY 2015 Page 66
(Elevators Services & Repairs)
Overview/ Mission statement
The Elevator Services and Repair Department is responsible for providing safe and reliable service on
NYCHA-owned elevators. Staff responds to elevator-related emergencies and complaints 24 hours per
day, seven days a week. They repair elevator outages and conduct routine preventive maintenance.
Heavy-duty repairs such as replacing hoist motors, generators, hoist machines, hoist cables, traveling
cables and control boards are also performed. Additional responsibilities include installing remote
monitoring and Closed Circuit Television (CCTV) in elevators, overseeing the rehabilitation of elevators,
maintenance and requirement contracts and conducting periodic Category 1 and Category 5 mandated
inspections/tests. The Elevator Services and Repair Department has an Elevator Training Center where all
elevator personnel and others are trained on topics related to the elevator industry. The Elevator
Warehouse maintains and supplies all hoist motors, hoist machines, generators, entrance doors,
controllers, and other equipment to elevator staff as required.
Financial Overview
Expenditures by Account Type ($000)
Financial Review
The FY 2015 operating expense budget for Elevators Services & Repairs is $78.8 million, of which $78.1
million is for PS and $0.7 million is for OTPS.
PSHC
YTD
ActualsHC
Cur Mod
BudgetHC Budget HC
FY 14 vs
FY 15
Salary F/T 494 29,969 514 34,358 514 39,059 - 4,701
Salary P/T 0 0 0 0
Seasonal 0 0 0 0
Overtime 7,157 6,877 6,464 (413)
Shift Differential 897 542 689 147
Fringe 32,088 31,852 31,717 (135)
Other 233 660 160 (500)
Subtotal PS 494 70,344 514 74,289 514 78,089 - 3,800
OTPS
Leases 0 0 0 0
Supplies 192 524 380 (143)
Utilities 0 0 0 0
Equipment 0 0 0 0
Contracts 8 6 287 281
Insurance 0 0 0 0
Section 8 Payments 0 0 0 0
Payment in Lieu of Taxes 0 0 0 0
Debt Service 0 0 0 0
Other OTPS 48 48 45 (3)
Subtotal OTPS 249 578 713 135
Total Budget 494 70,593 514 74,867 514 78,801 - 3,934
FY 2013 FY 2014 FY 2015 Variance
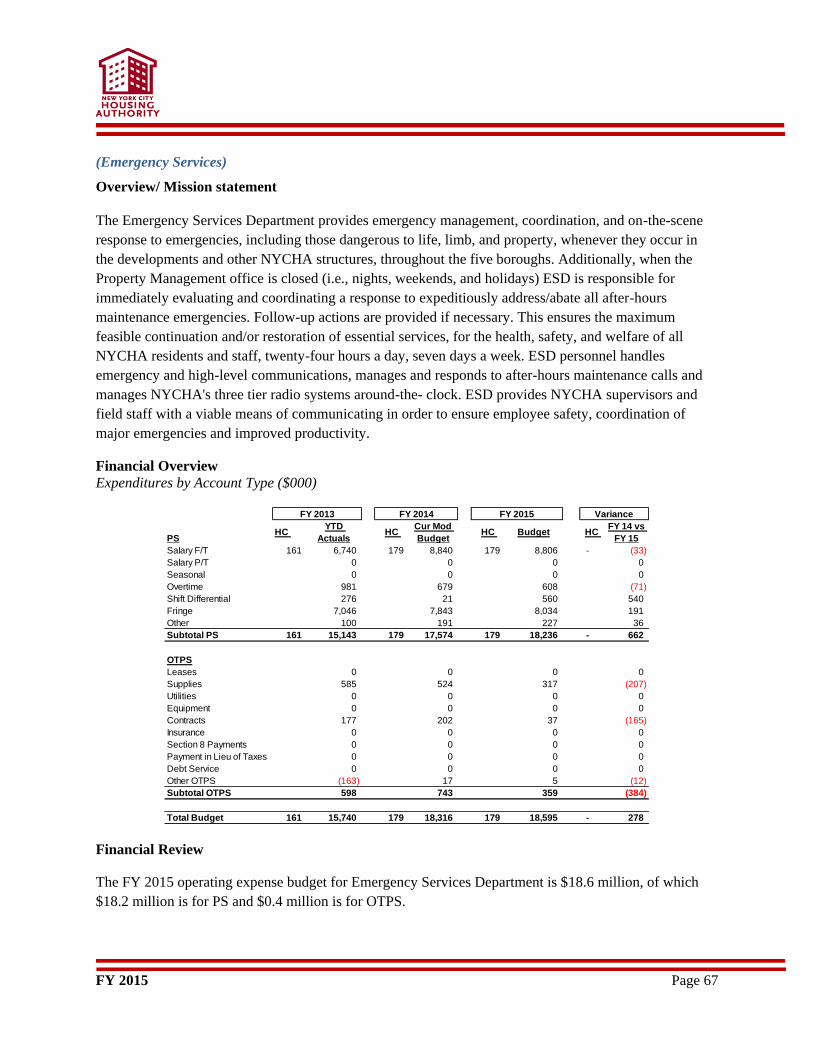
FY 2015 Page 67
(Emergency Services)
Overview/ Mission statement
The Emergency Services Department provides emergency management, coordination, and on-the-scene
response to emergencies, including those dangerous to life, limb, and property, whenever they occur in
the developments and other NYCHA structures, throughout the five boroughs. Additionally, when the
Property Management office is closed (i.e., nights, weekends, and holidays) ESD is responsible for
immediately evaluating and coordinating a response to expeditiously address/abate all after-hours
maintenance emergencies. Follow-up actions are provided if necessary. This ensures the maximum
feasible continuation and/or restoration of essential services, for the health, safety, and welfare of all
NYCHA residents and staff, twenty-four hours a day, seven days a week. ESD personnel handles
emergency and high-level communications, manages and responds to after-hours maintenance calls and
manages NYCHA's three tier radio systems around-the- clock. ESD provides NYCHA supervisors and
field staff with a viable means of communicating in order to ensure employee safety, coordination of
major emergencies and improved productivity.
Financial Overview
Expenditures by Account Type ($000)
Financial Review
The FY 2015 operating expense budget for Emergency Services Department is $18.6 million, of which
$18.2 million is for PS and $0.4 million is for OTPS.
PSHC
YTD
ActualsHC
Cur Mod
BudgetHC Budget HC
FY 14 vs
FY 15
Salary F/T 161 6,740 179 8,840 179 8,806 - (33)
Salary P/T 0 0 0 0
Seasonal 0 0 0 0
Overtime 981 679 608 (71)
Shift Differential 276 21 560 540
Fringe 7,046 7,843 8,034 191
Other 100 191 227 36
Subtotal PS 161 15,143 179 17,574 179 18,236 - 662
OTPS
Leases 0 0 0 0
Supplies 585 524 317 (207)
Utilities 0 0 0 0
Equipment 0 0 0 0
Contracts 177 202 37 (165)
Insurance 0 0 0 0
Section 8 Payments 0 0 0 0
Payment in Lieu of Taxes 0 0 0 0
Debt Service 0 0 0 0
Other OTPS (163) 17 5 (12)
Subtotal OTPS 598 743 359 (384)
Total Budget 161 15,740 179 18,316 179 18,595 - 278
FY 2013 FY 2014 FY 2015 Variance
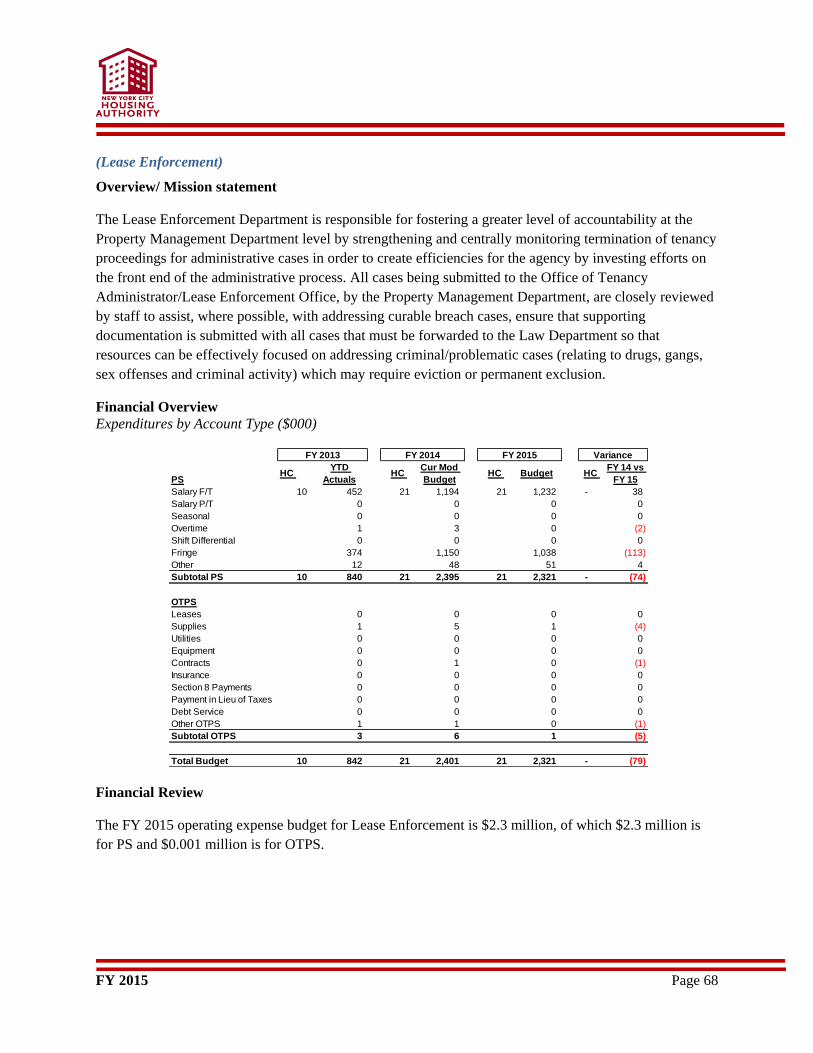
FY 2015 Page 68
(Lease Enforcement)
Overview/ Mission statement
The Lease Enforcement Department is responsible for fostering a greater level of accountability at the
Property Management Department level by strengthening and centrally monitoring termination of tenancy
proceedings for administrative cases in order to create efficiencies for the agency by investing efforts on
the front end of the administrative process. All cases being submitted to the Office of Tenancy
Administrator/Lease Enforcement Office, by the Property Management Department, are closely reviewed
by staff to assist, where possible, with addressing curable breach cases, ensure that supporting
documentation is submitted with all cases that must be forwarded to the Law Department so that
resources can be effectively focused on addressing criminal/problematic cases (relating to drugs, gangs,
sex offenses and criminal activity) which may require eviction or permanent exclusion.
Financial Overview
Expenditures by Account Type ($000)
Financial Review
The FY 2015 operating expense budget for Lease Enforcement is $2.3 million, of which $2.3 million is
for PS and $0.001 million is for OTPS.
PSHC
YTD
ActualsHC
Cur Mod
BudgetHC Budget HC
FY 14 vs
FY 15
Salary F/T 10 452 21 1,194 21 1,232 - 38
Salary P/T 0 0 0 0
Seasonal 0 0 0 0
Overtime 1 3 0 (2)
Shift Differential 0 0 0 0
Fringe 374 1,150 1,038 (113)
Other 12 48 51 4
Subtotal PS 10 840 21 2,395 21 2,321 - (74)
OTPS
Leases 0 0 0 0
Supplies 1 5 1 (4)
Utilities 0 0 0 0
Equipment 0 0 0 0
Contracts 0 1 0 (1)
Insurance 0 0 0 0
Section 8 Payments 0 0 0 0
Payment in Lieu of Taxes 0 0 0 0
Debt Service 0 0 0 0
Other OTPS 1 1 0 (1)
Subtotal OTPS 3 6 1 (5)
Total Budget 10 842 21 2,401 21 2,321 - (79)
FY 2013 FY 2014 FY 2015 Variance
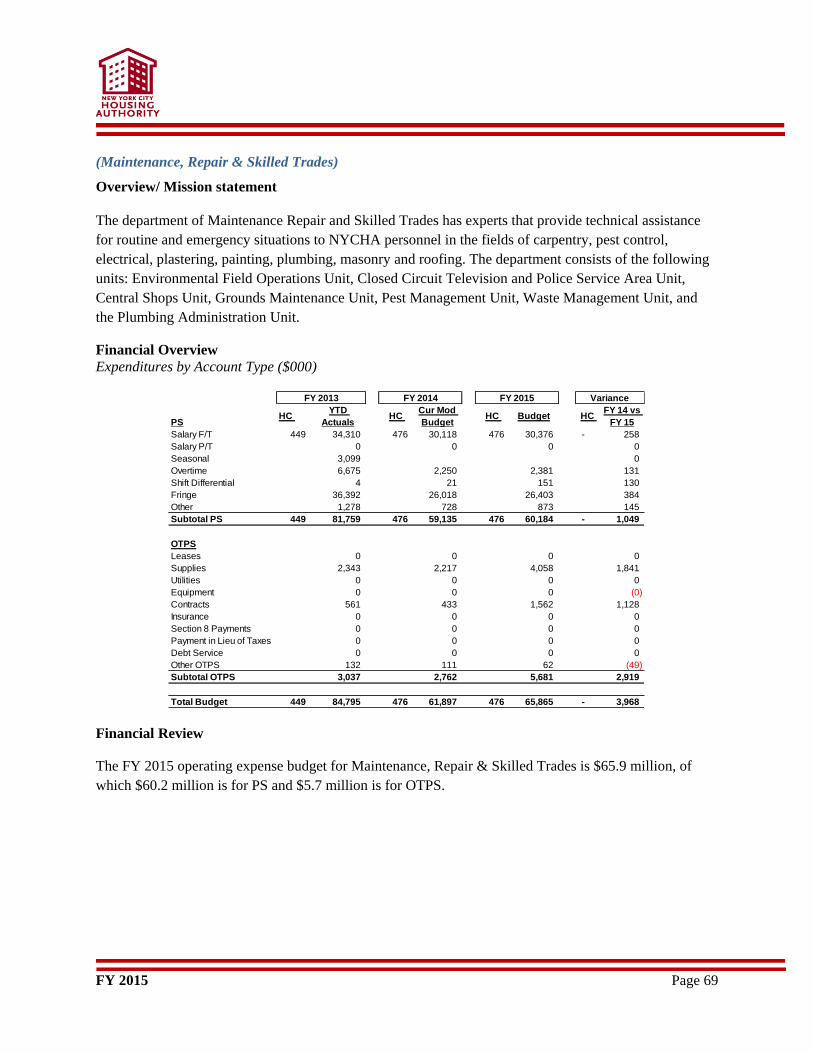
FY 2015 Page 69
(Maintenance, Repair & Skilled Trades)
Overview/ Mission statement
The department of Maintenance Repair and Skilled Trades has experts that provide technical assistance
for routine and emergency situations to NYCHA personnel in the fields of carpentry, pest control,
electrical, plastering, painting, plumbing, masonry and roofing. The department consists of the following
units: Environmental Field Operations Unit, Closed Circuit Television and Police Service Area Unit,
Central Shops Unit, Grounds Maintenance Unit, Pest Management Unit, Waste Management Unit, and
the Plumbing Administration Unit.
Financial Overview
Expenditures by Account Type ($000)
Financial Review
The FY 2015 operating expense budget for Maintenance, Repair & Skilled Trades is $65.9 million, of
which $60.2 million is for PS and $5.7 million is for OTPS.
PSHC
YTD
ActualsHC
Cur Mod
BudgetHC Budget HC
FY 14 vs
FY 15
Salary F/T 449 34,310 476 30,118 476 30,376 - 258
Salary P/T 0 0 0 0
Seasonal 3,099 0
Overtime 6,675 2,250 2,381 131
Shift Differential 4 21 151 130
Fringe 36,392 26,018 26,403 384
Other 1,278 728 873 145
Subtotal PS 449 81,759 476 59,135 476 60,184 - 1,049
OTPS
Leases 0 0 0 0
Supplies 2,343 2,217 4,058 1,841
Utilities 0 0 0 0
Equipment 0 0 0 (0)
Contracts 561 433 1,562 1,128
Insurance 0 0 0 0
Section 8 Payments 0 0 0 0
Payment in Lieu of Taxes 0 0 0 0
Debt Service 0 0 0 0
Other OTPS 132 111 62 (49)
Subtotal OTPS 3,037 2,762 5,681 2,919
Total Budget 449 84,795 476 61,897 476 65,865 - 3,968
FY 2013 FY 2014 FY 2015 Variance
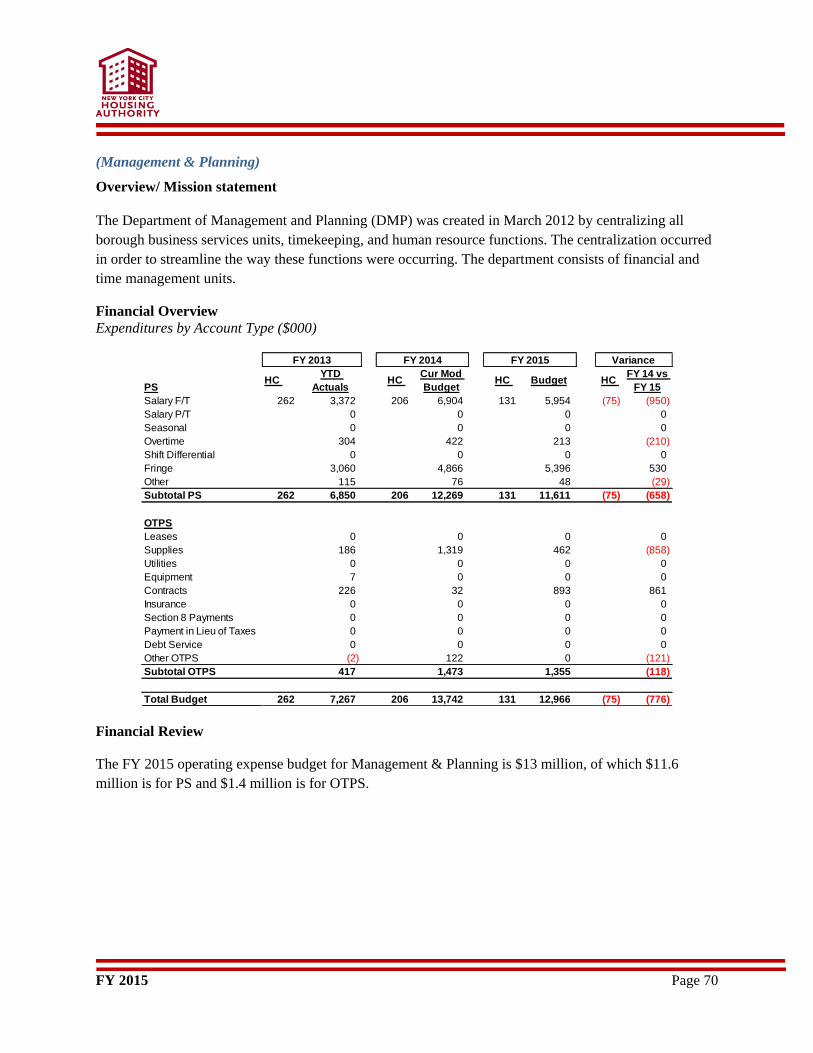
FY 2015 Page 70
(Management & Planning)
Overview/ Mission statement
The Department of Management and Planning (DMP) was created in March 2012 by centralizing all
borough business services units, timekeeping, and human resource functions. The centralization occurred
in order to streamline the way these functions were occurring. The department consists of financial and
time management units.
Financial Overview
Expenditures by Account Type ($000)
Financial Review
The FY 2015 operating expense budget for Management & Planning is $13 million, of which $11.6
million is for PS and $1.4 million is for OTPS.
PSHC
YTD
ActualsHC
Cur Mod
BudgetHC Budget HC
FY 14 vs
FY 15
Salary F/T 262 3,372 206 6,904 131 5,954 (75) (950)
Salary P/T 0 0 0 0
Seasonal 0 0 0 0
Overtime 304 422 213 (210)
Shift Differential 0 0 0 0
Fringe 3,060 4,866 5,396 530
Other 115 76 48 (29)
Subtotal PS 262 6,850 206 12,269 131 11,611 (75) (658)
OTPS
Leases 0 0 0 0
Supplies 186 1,319 462 (858)
Utilities 0 0 0 0
Equipment 7 0 0 0
Contracts 226 32 893 861
Insurance 0 0 0 0
Section 8 Payments 0 0 0 0
Payment in Lieu of Taxes 0 0 0 0
Debt Service 0 0 0 0
Other OTPS (2) 122 0 (121)
Subtotal OTPS 417 1,473 1,355 (118)
Total Budget 262 7,267 206 13,742 131 12,966 (75) (776)
FY 2013 FY 2014 FY 2015 Variance
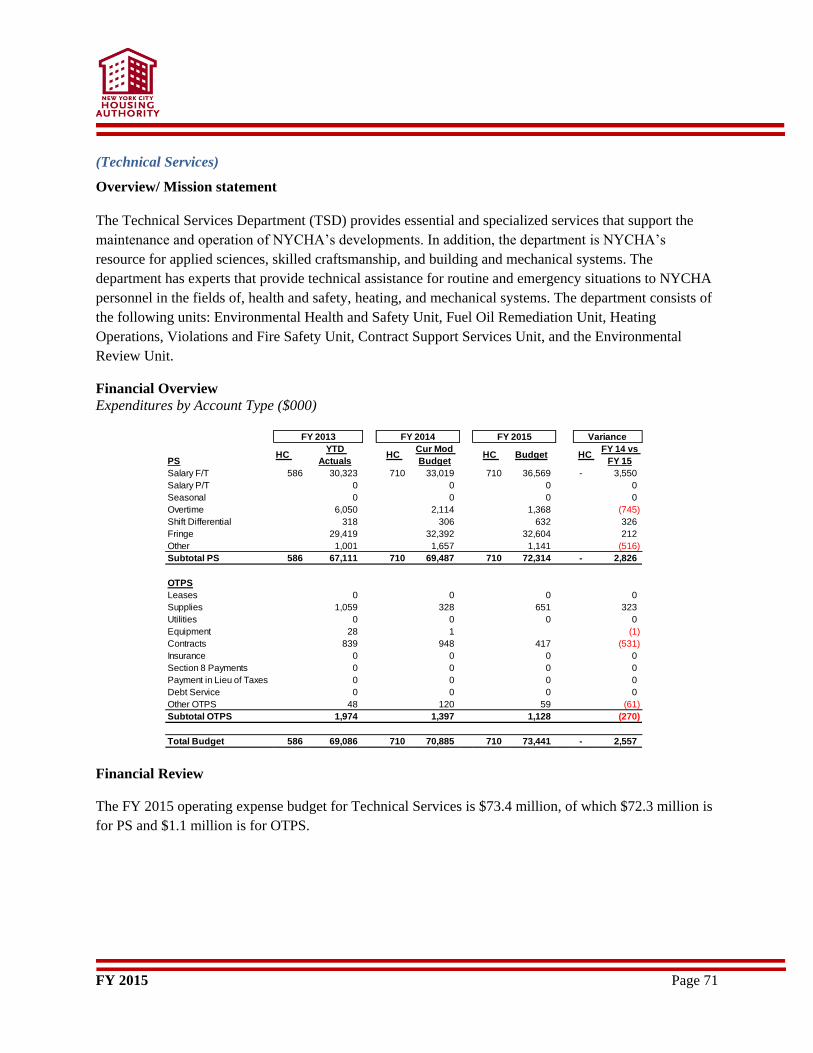
FY 2015 Page 71
(Technical Services)
Overview/ Mission statement
The Technical Services Department (TSD) provides essential and specialized services that support the
maintenance and operation of NYCHA’s developments. In addition, the department is NYCHA’s
resource for applied sciences, skilled craftsmanship, and building and mechanical systems. The
department has experts that provide technical assistance for routine and emergency situations to NYCHA
personnel in the fields of, health and safety, heating, and mechanical systems. The department consists of
the following units: Environmental Health and Safety Unit, Fuel Oil Remediation Unit, Heating
Operations, Violations and Fire Safety Unit, Contract Support Services Unit, and the Environmental
Review Unit.
Financial Overview
Expenditures by Account Type ($000)
Financial Review
The FY 2015 operating expense budget for Technical Services is $73.4 million, of which $72.3 million is
for PS and $1.1 million is for OTPS.
PSHC
YTD
ActualsHC
Cur Mod
BudgetHC Budget HC
FY 14 vs
FY 15
Salary F/T 586 30,323 710 33,019 710 36,569 - 3,550
Salary P/T 0 0 0 0
Seasonal 0 0 0 0
Overtime 6,050 2,114 1,368 (745)
Shift Differential 318 306 632 326
Fringe 29,419 32,392 32,604 212
Other 1,001 1,657 1,141 (516)
Subtotal PS 586 67,111 710 69,487 710 72,314 - 2,826
OTPS
Leases 0 0 0 0
Supplies 1,059 328 651 323
Utilities 0 0 0 0
Equipment 28 1 (1)
Contracts 839 948 417 (531)
Insurance 0 0 0 0
Section 8 Payments 0 0 0 0
Payment in Lieu of Taxes 0 0 0 0
Debt Service 0 0 0 0
Other OTPS 48 120 59 (61)
Subtotal OTPS 1,974 1,397 1,128 (270)
Total Budget 586 69,086 710 70,885 710 73,441 - 2,557
FY 2013 FY 2014 FY 2015 Variance
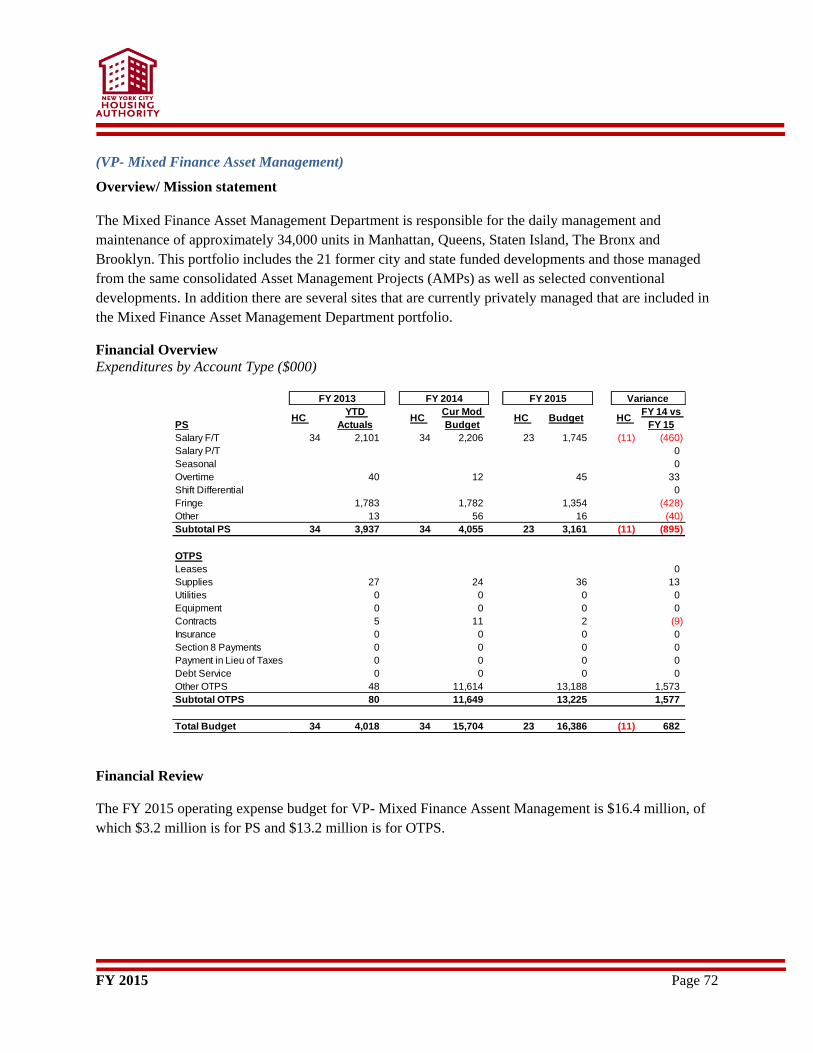
FY 2015 Page 72
(VP- Mixed Finance Asset Management)
Overview/ Mission statement
The Mixed Finance Asset Management Department is responsible for the daily management and
maintenance of approximately 34,000 units in Manhattan, Queens, Staten Island, The Bronx and
Brooklyn. This portfolio includes the 21 former city and state funded developments and those managed
from the same consolidated Asset Management Projects (AMPs) as well as selected conventional
developments. In addition there are several sites that are currently privately managed that are included in
the Mixed Finance Asset Management Department portfolio.
Financial Overview
Expenditures by Account Type ($000)
Financial Review
The FY 2015 operating expense budget for VP- Mixed Finance Assent Management is $16.4 million, of
which $3.2 million is for PS and $13.2 million is for OTPS.
PSHC
YTD
ActualsHC
Cur Mod
BudgetHC Budget HC
FY 14 vs
FY 15
Salary F/T 34 2,101 34 2,206 23 1,745 (11) (460)
Salary P/T 0
Seasonal 0
Overtime 40 12 45 33
Shift Differential 0
Fringe 1,783 1,782 1,354 (428)
Other 13 56 16 (40)
Subtotal PS 34 3,937 34 4,055 23 3,161 (11) (895)
OTPS
Leases 0
Supplies 27 24 36 13
Utilities 0 0 0 0
Equipment 0 0 0 0
Contracts 5 11 2 (9)
Insurance 0 0 0 0
Section 8 Payments 0 0 0 0
Payment in Lieu of Taxes 0 0 0 0
Debt Service 0 0 0 0
Other OTPS 48 11,614 13,188 1,573
Subtotal OTPS 80 11,649 13,225 1,577
Total Budget 34 4,018 34 15,704 23 16,386 (11) 682
FY 2013 FY 2014 FY 2015 Variance
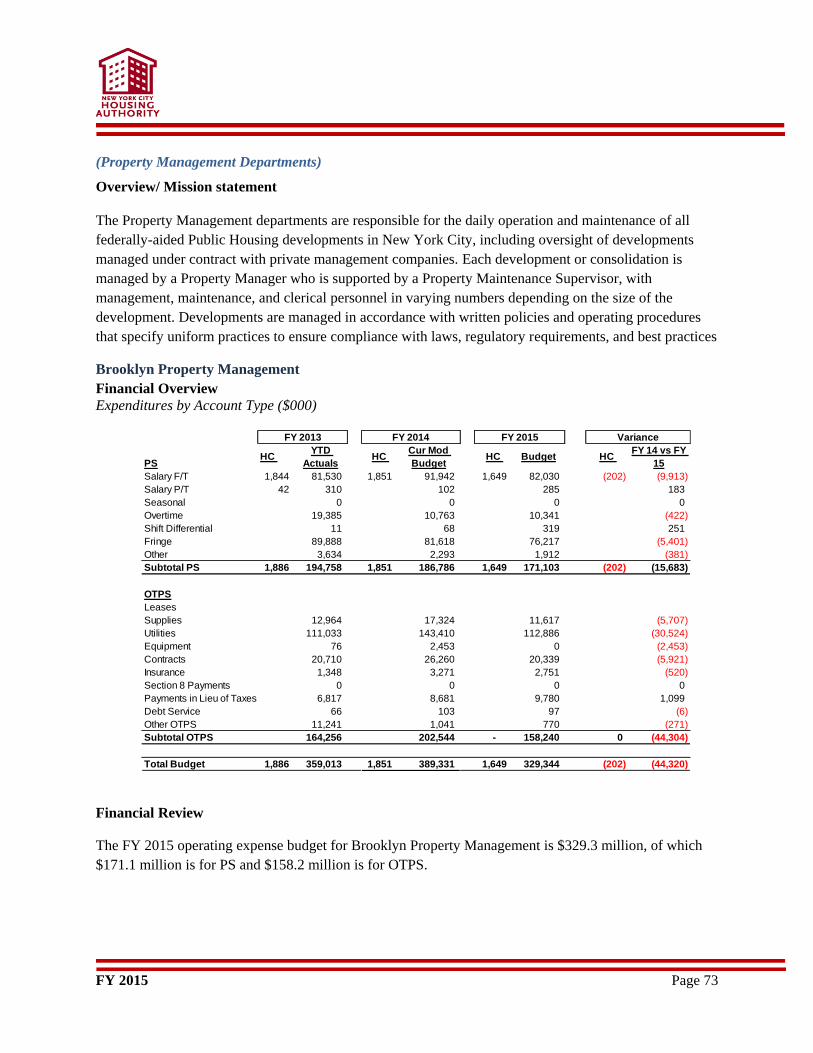
FY 2015 Page 73
(Property Management Departments)
Overview/ Mission statement
The Property Management departments are responsible for the daily operation and maintenance of all
federally-aided Public Housing developments in New York City, including oversight of developments
managed under contract with private management companies. Each development or consolidation is
managed by a Property Manager who is supported by a Property Maintenance Supervisor, with
management, maintenance, and clerical personnel in varying numbers depending on the size of the
development. Developments are managed in accordance with written policies and operating procedures
that specify uniform practices to ensure compliance with laws, regulatory requirements, and best practices
Brooklyn Property Management
Financial Overview
Expenditures by Account Type ($000)
Financial Review
The FY 2015 operating expense budget for Brooklyn Property Management is $329.3 million, of which
$171.1 million is for PS and $158.2 million is for OTPS.
PSHC
YTD
ActualsHC
Cur Mod
BudgetHC Budget HC
FY 14 vs FY
15
Salary F/T 1,844 81,530 1,851 91,942 1,649 82,030 (202) (9,913)
Salary P/T 42 310 102 285 183
Seasonal 0 0 0 0
Overtime 19,385 10,763 10,341 (422)
Shift Differential 11 68 319 251
Fringe 89,888 81,618 76,217 (5,401)
Other 3,634 2,293 1,912 (381)
Subtotal PS 1,886 194,758 1,851 186,786 1,649 171,103 (202) (15,683)
OTPS
Leases
Supplies 12,964 17,324 11,617 (5,707)
Utilities 111,033 143,410 112,886 (30,524)
Equipment 76 2,453 0 (2,453)
Contracts 20,710 26,260 20,339 (5,921)
Insurance 1,348 3,271 2,751 (520)
Section 8 Payments 0 0 0 0
Payments in Lieu of Taxes 6,817 8,681 9,780 1,099
Debt Service 66 103 97 (6)
Other OTPS 11,241 1,041 770 (271)
Subtotal OTPS 164,256 202,544 - 158,240 0 (44,304)
Total Budget 1,886 359,013 1,851 389,331 1,649 329,344 (202) (44,320)
FY 2013 FY 2014 FY 2015 Variance
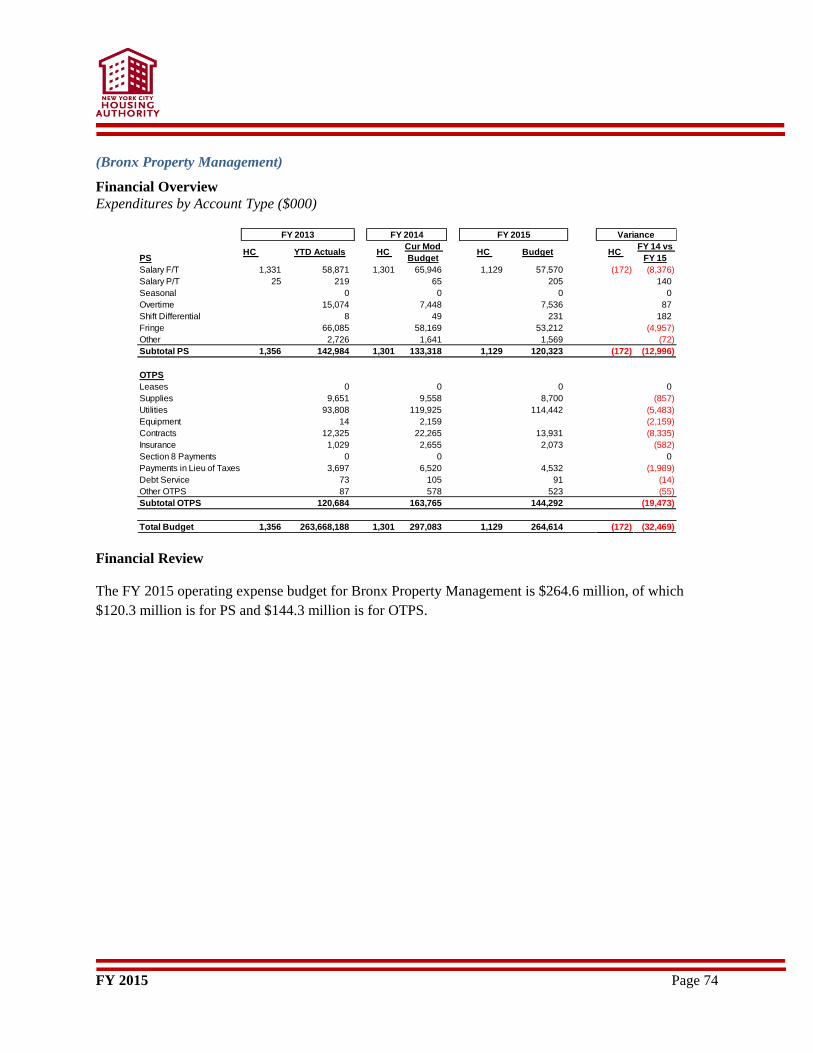
FY 2015 Page 74
(Bronx Property Management)
Financial Overview
Expenditures by Account Type ($000)
Financial Review
The FY 2015 operating expense budget for Bronx Property Management is $264.6 million, of which
$120.3 million is for PS and $144.3 million is for OTPS.
PSHC YTD Actuals HC
Cur Mod
BudgetHC Budget HC
FY 14 vs
FY 15
Salary F/T 1,331 58,871 1,301 65,946 1,129 57,570 (172) (8,376)
Salary P/T 25 219 65 205 140
Seasonal 0 0 0 0
Overtime 15,074 7,448 7,536 87
Shift Differential 8 49 231 182
Fringe 66,085 58,169 53,212 (4,957)
Other 2,726 1,641 1,569 (72)
Subtotal PS 1,356 142,984 1,301 133,318 1,129 120,323 (172) (12,996)
OTPS
Leases 0 0 0 0
Supplies 9,651 9,558 8,700 (857)
Utilities 93,808 119,925 114,442 (5,483)
Equipment 14 2,159 (2,159)
Contracts 12,325 22,265 13,931 (8,335)
Insurance 1,029 2,655 2,073 (582)
Section 8 Payments 0 0 0
Payments in Lieu of Taxes 3,697 6,520 4,532 (1,989)
Debt Service 73 105 91 (14)
Other OTPS 87 578 523 (55)
Subtotal OTPS 120,684 163,765 144,292 (19,473)
Total Budget 1,356 263,668,188 1,301 297,083 1,129 264,614 (172) (32,469)
FY 2013 FY 2014 FY 2015 Variance
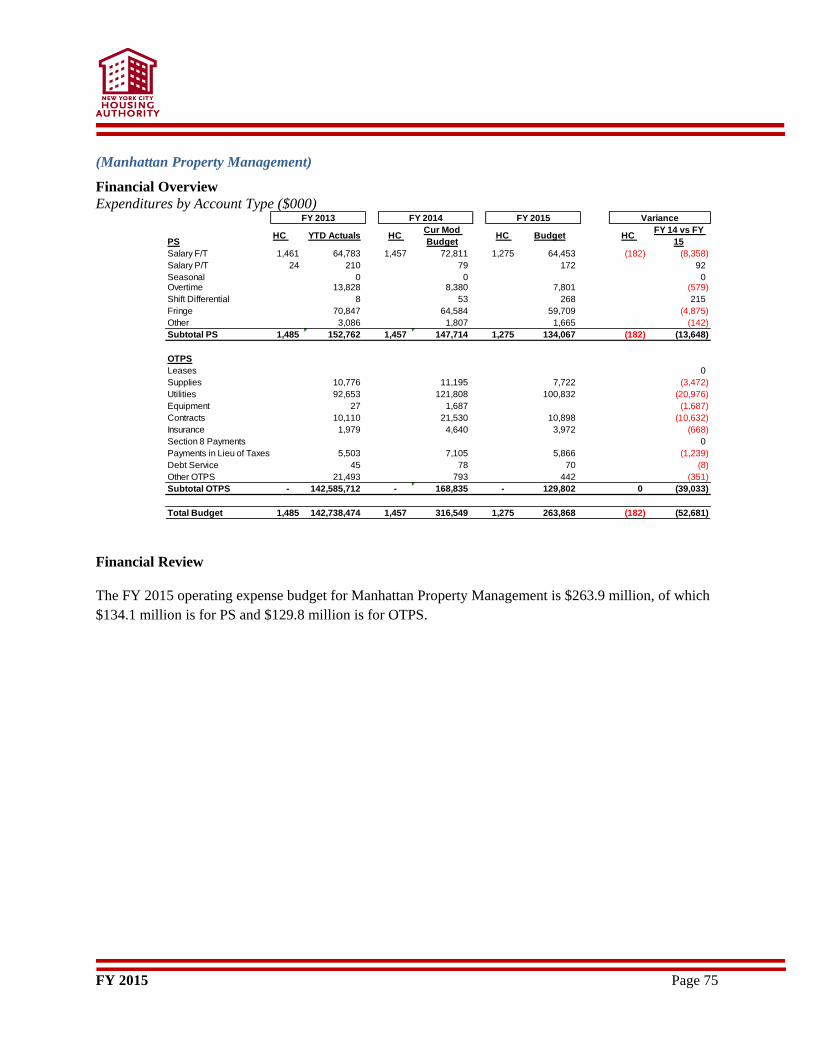
FY 2015 Page 75
(Manhattan Property Management)
Financial Overview
Expenditures by Account Type ($000)
Financial Review
The FY 2015 operating expense budget for Manhattan Property Management is $263.9 million, of which
$134.1 million is for PS and $129.8 million is for OTPS.
PSHC YTD Actuals HC
Cur Mod
BudgetHC Budget HC
FY 14 vs FY
15
Salary F/T 1,461 64,783 1,457 72,811 1,275 64,453 (182) (8,358)
Salary P/T 24 210 79 172 92
Seasonal 0 0 0Overtime 13,828 8,380 7,801 (579)
Shift Differential 8 53 268 215
Fringe 70,847 64,584 59,709 (4,875)
Other 3,086 1,807 1,665 (142)
Subtotal PS 1,485 152,762 1,457 147,714 1,275 134,067 (182) (13,648)
OTPS
Leases 0
Supplies 10,776 11,195 7,722 (3,472)
Utilities 92,653 121,808 100,832 (20,976)
Equipment 27 1,687 (1,687)
Contracts 10,110 21,530 10,898 (10,632)
Insurance 1,979 4,640 3,972 (668)
Section 8 Payments 0
Payments in Lieu of Taxes 5,503 7,105 5,866 (1,239)
Debt Service 45 78 70 (8)
Other OTPS 21,493 793 442 (351)
Subtotal OTPS - 142,585,712 - 168,835 - 129,802 0 (39,033)
Total Budget 1,485 142,738,474 1,457 316,549 1,275 263,868 (182) (52,681)
FY 2013 FY 2014 FY 2015 Variance
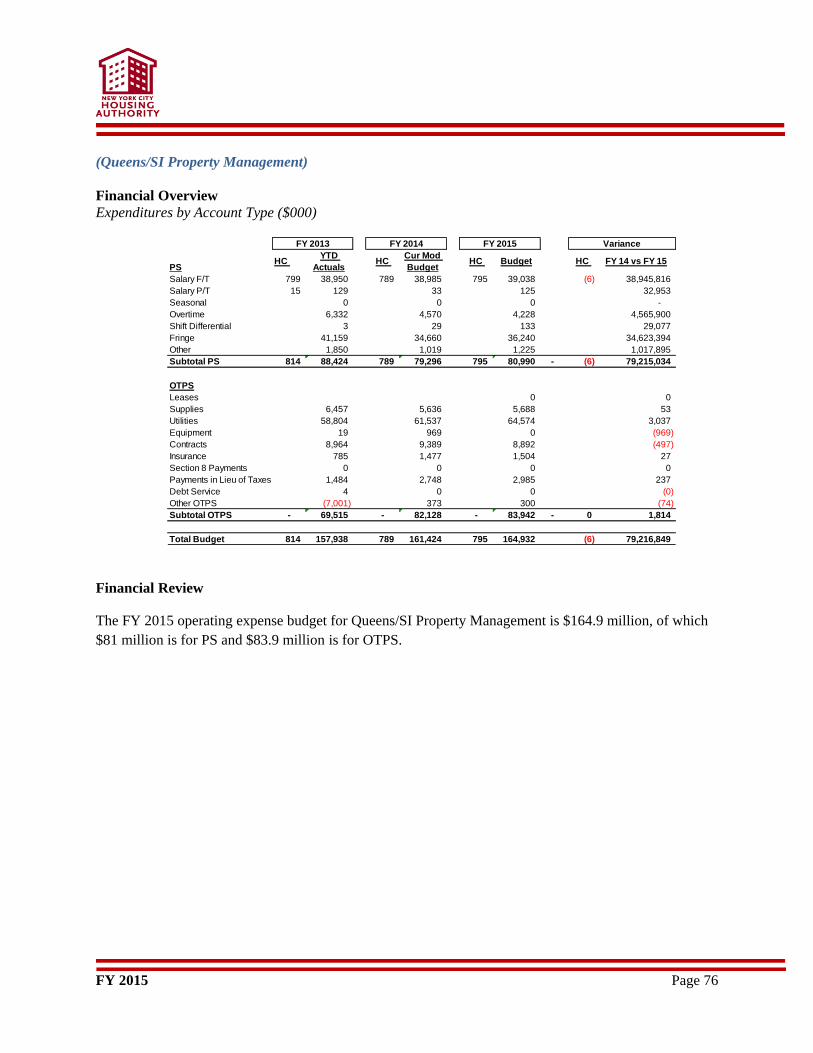
FY 2015 Page 76
(Queens/SI Property Management)
Financial Overview
Expenditures by Account Type ($000)
Financial Review
The FY 2015 operating expense budget for Queens/SI Property Management is $164.9 million, of which
$81 million is for PS and $83.9 million is for OTPS.
PSHC
YTD
ActualsHC
Cur Mod
BudgetHC Budget HC FY 14 vs FY 15
Salary F/T 799 38,950 789 38,985 795 39,038 (6) 38,945,816
Salary P/T 15 129 33 125 32,953
Seasonal 0 0 0 -
Overtime 6,332 4,570 4,228 4,565,900
Shift Differential 3 29 133 29,077
Fringe 41,159 34,660 36,240 34,623,394
Other 1,850 1,019 1,225 1,017,895
Subtotal PS 814 88,424 789 79,296 795 80,990 - (6) 79,215,034
OTPS
Leases 0 0
Supplies 6,457 5,636 5,688 53
Utilities 58,804 61,537 64,574 3,037
Equipment 19 969 0 (969)
Contracts 8,964 9,389 8,892 (497)
Insurance 785 1,477 1,504 27
Section 8 Payments 0 0 0 0
Payments in Lieu of Taxes 1,484 2,748 2,985 237
Debt Service 4 0 0 (0)
Other OTPS (7,001) 373 300 (74)
Subtotal OTPS - 69,515 - 82,128 - 83,942 - 0 1,814
Total Budget 814 157,938 789 161,424 795 164,932 (6) 79,216,849
FY 2013 FY 2014 FY 2015 Variance
FY 2015 Page 77
Administration
(EVP for Administration)
Overview/ Mission statement
The EVP for Administration is responsible for the provision of administrative services to the Authority.
The Departments in this area are responsible for providing the staff, training, materials, space and services
necessary for the Authority to function. These centralized services are provided through the Departments
and offices that report to this EVP.
The following Departments report to this EVP:
Office of Facility Planning & Administration;
General Services;
Human Resources;
Office of Security;
Procedural and Development & Administration;
Customer Operations;
Equal Opportunity;
Customer Contact Center;
Research and Management Analysis;
Enterprise Program Management; and
Emergency Preparedness.
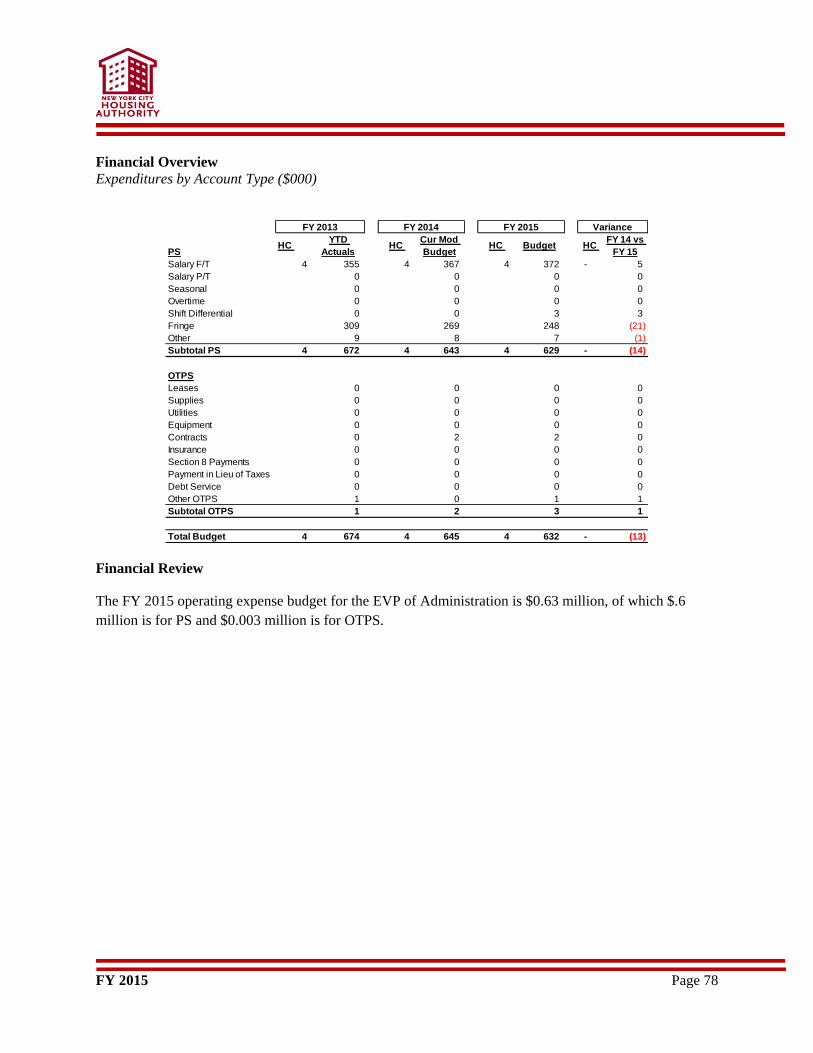
FY 2015 Page 78
Financial Overview
Expenditures by Account Type ($000)
Financial Review
The FY 2015 operating expense budget for the EVP of Administration is $0.63 million, of which $.6
million is for PS and $0.003 million is for OTPS.
PSHC
YTD
ActualsHC
Cur Mod
BudgetHC Budget HC
FY 14 vs
FY 15
Salary F/T 4 355 4 367 4 372 - 5
Salary P/T 0 0 0 0
Seasonal 0 0 0 0
Overtime 0 0 0 0
Shift Differential 0 0 3 3
Fringe 309 269 248 (21)
Other 9 8 7 (1)
Subtotal PS 4 672 4 643 4 629 - (14)
OTPS
Leases 0 0 0 0
Supplies 0 0 0 0
Utilities 0 0 0 0
Equipment 0 0 0 0
Contracts 0 2 2 0
Insurance 0 0 0 0
Section 8 Payments 0 0 0 0
Payment in Lieu of Taxes 0 0 0 0
Debt Service 0 0 0 0
Other OTPS 1 0 1 1
Subtotal OTPS 1 2 3 1
Total Budget 4 674 4 645 4 632 - (13)
FY 2013 FY 2014 FY 2015 Variance
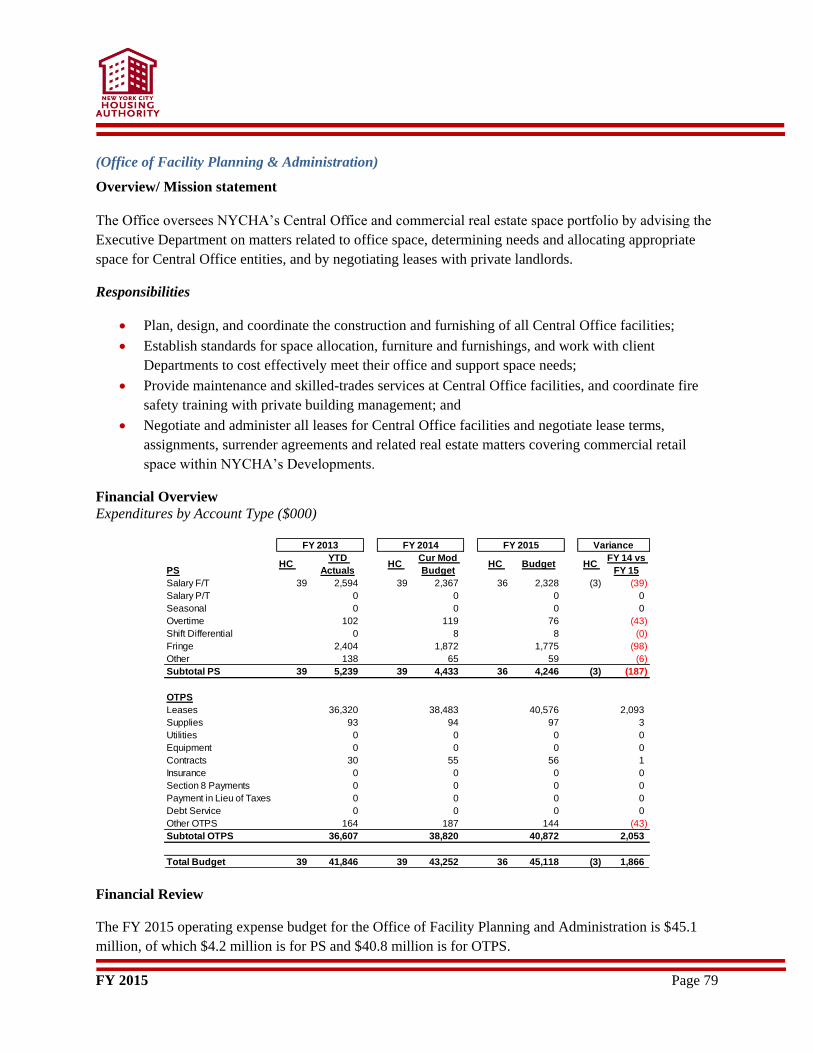
FY 2015 Page 79
(Office of Facility Planning & Administration)
Overview/ Mission statement
The Office oversees NYCHA’s Central Office and commercial real estate space portfolio by advising the
Executive Department on matters related to office space, determining needs and allocating appropriate
space for Central Office entities, and by negotiating leases with private landlords.
Responsibilities
Plan, design, and coordinate the construction and furnishing of all Central Office facilities;
Establish standards for space allocation, furniture and furnishings, and work with client
Departments to cost effectively meet their office and support space needs;
Provide maintenance and skilled-trades services at Central Office facilities, and coordinate fire
safety training with private building management; and
Negotiate and administer all leases for Central Office facilities and negotiate lease terms,
assignments, surrender agreements and related real estate matters covering commercial retail
space within NYCHA’s Developments.
Financial Overview
Expenditures by Account Type ($000)
Financial Review
The FY 2015 operating expense budget for the Office of Facility Planning and Administration is $45.1
million, of which $4.2 million is for PS and $40.8 million is for OTPS.
PSHC
YTD
ActualsHC
Cur Mod
BudgetHC Budget HC
FY 14 vs
FY 15
Salary F/T 39 2,594 39 2,367 36 2,328 (3) (39)
Salary P/T 0 0 0 0
Seasonal 0 0 0 0
Overtime 102 119 76 (43)
Shift Differential 0 8 8 (0)
Fringe 2,404 1,872 1,775 (98)
Other 138 65 59 (6)
Subtotal PS 39 5,239 39 4,433 36 4,246 (3) (187)
OTPS
Leases 36,320 38,483 40,576 2,093
Supplies 93 94 97 3
Utilities 0 0 0 0
Equipment 0 0 0 0
Contracts 30 55 56 1
Insurance 0 0 0 0
Section 8 Payments 0 0 0 0
Payment in Lieu of Taxes 0 0 0 0
Debt Service 0 0 0 0
Other OTPS 164 187 144 (43)
Subtotal OTPS 36,607 38,820 40,872 2,053
Total Budget 39 41,846 39 43,252 36 45,118 (3) 1,866
FY 2013 FY 2014 FY 2015 Variance
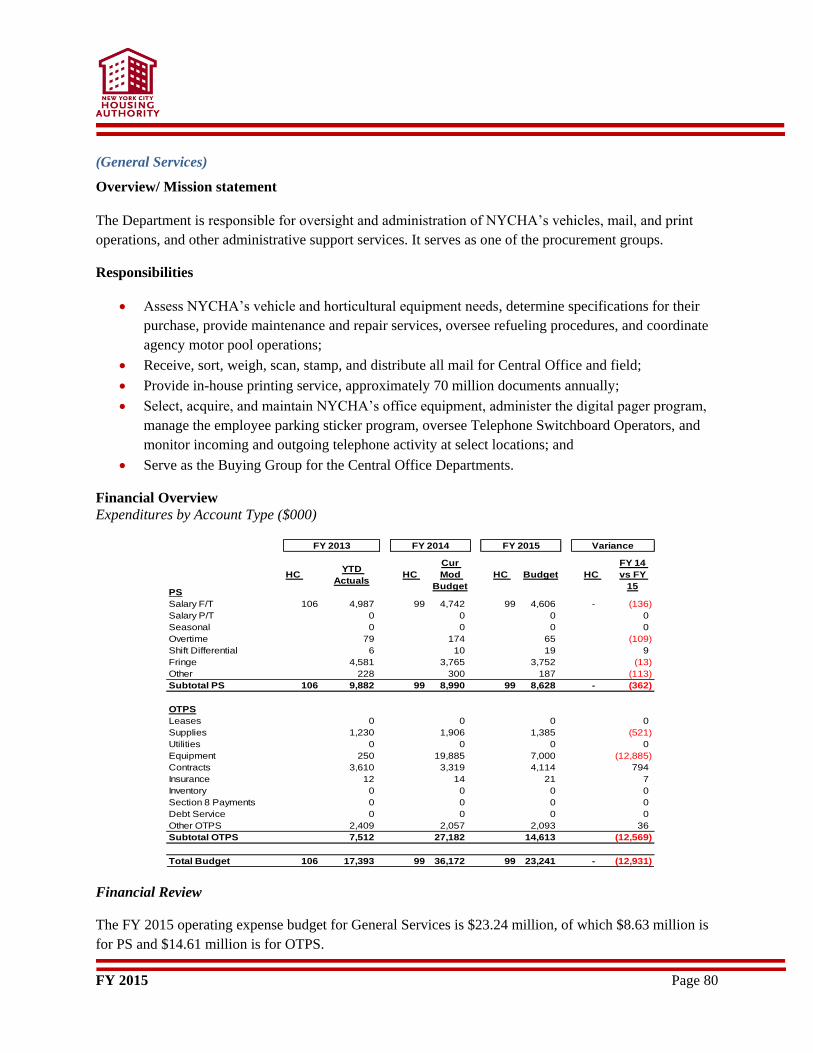
FY 2015 Page 80
(General Services)
Overview/ Mission statement
The Department is responsible for oversight and administration of NYCHA’s vehicles, mail, and print
operations, and other administrative support services. It serves as one of the procurement groups.
Responsibilities
Assess NYCHA’s vehicle and horticultural equipment needs, determine specifications for their
purchase, provide maintenance and repair services, oversee refueling procedures, and coordinate
agency motor pool operations;
Receive, sort, weigh, scan, stamp, and distribute all mail for Central Office and field;
Provide in-house printing service, approximately 70 million documents annually;
Select, acquire, and maintain NYCHA’s office equipment, administer the digital pager program,
manage the employee parking sticker program, oversee Telephone Switchboard Operators, and
monitor incoming and outgoing telephone activity at select locations; and
Serve as the Buying Group for the Central Office Departments.
Financial Overview
Expenditures by Account Type ($000)
Financial Review
The FY 2015 operating expense budget for General Services is $23.24 million, of which $8.63 million is
for PS and $14.61 million is for OTPS.
PS
HC YTD
ActualsHC
Cur
Mod
Budget
HC Budget HC
FY 14
vs FY
15
Salary F/T 106 4,987 99 4,742 99 4,606 - (136)
Salary P/T 0 0 0 0
Seasonal 0 0 0 0
Overtime 79 174 65 (109)
Shift Differential 6 10 19 9
Fringe 4,581 3,765 3,752 (13)
Other 228 300 187 (113)
Subtotal PS 106 9,882 99 8,990 99 8,628 - (362)
OTPS
Leases 0 0 0 0
Supplies 1,230 1,906 1,385 (521)
Utilities 0 0 0 0
Equipment 250 19,885 7,000 (12,885)
Contracts 3,610 3,319 4,114 794
Insurance 12 14 21 7
Inventory 0 0 0 0
Section 8 Payments 0 0 0 0
Debt Service 0 0 0 0
Other OTPS 2,409 2,057 2,093 36
Subtotal OTPS 7,512 27,182 14,613 (12,569)
Total Budget 106 17,393 99 36,172 99 23,241 - (12,931)
FY 2013 FY 2014 FY 2015 Variance
FY 2015 Page 81
(Human Resources)
Overview/ Mission statement
The Human Resources Department is responsible for recruiting and providing all Authority locations with
qualified employees. The Department advises on personnel development, policy, and issues. Together
with the Executive Department, it oversees NYCHA’s labor relations and represents the agency with the
Civil Service Commission, the NYC Department of Citywide Administrative Services (DCAS) and the
NYC Office of Labor Relations (OLR).
Responsibilities
Interview, investigate, qualify and process all applicants for appointment and promotion;
Liaison with DCAS for issues regarding job titles, job qualifications and requirements, salary
structures, processing civil service appointments and on matters relating to City exams;
Process health insurance and Management Benefits Fund (MBF) enrollments, changes and
terminations, including payment of all MBF and retirees health insurance benefits;
Administer NYCHA’s time and leave policies, monitor the automated timekeeping system,
maintain all employee personnel records (active and former employees), oversee the Workers’
Compensation and Unemployment Insurance programs; and
Review requests for terminations and General Trials; administer the Local Hearing Process, place
newly appointed and promoted employees on probation, ensure that employees enroll in the
City’s pension program as required by law, provide retirement counseling, and administer special
programs (i.e. blood donation and internships).

FY 2015 Page 82
Financial Overview
Expenditures by Account Type ($000)
Financial Review
The FY 2015 operating expense budget for Human Resources is $16.7 million, of which $16 million is
for PS and $0.7 million is for OTPS.
PSHC
YTD
ActualsHC
Cur Mod
BudgetHC Budget HC
FY 14 vs
FY 15
Salary F/T 155 9,767 159 9,761 143 8,848 16 913
Salary P/T 0 0 0 0
Seasonal 0 0 0 0
Overtime 67 78 74 4
Shift Differential 1 3 14 (11)
Retro 54 0 0 0
Fringe 8,705 7,422 6,673 750
Other 491 530 442 89
Subtotal PS 155 19,085 159 17,795 143 16,050 16 1,745
OTPS
Leases 0 0 0 0
Supplies 134 185 88 97
Utilities 0 0 0 0
Equipment 0 0 0 0
Contracts 573 581 396 185
Insurance 0 0 0 0
Inventory 0 0 0 0
Section 8 Payments 0 0 0 0
Payment in Lieu of Taxes 0 0 0 0
Debt Service 0 0 0 0
Other OTPS 415 401 208 194
Subtotal OTPS 1,121 1,167 692 476
Total Budget 155 20,206 159 18,962 143 16,742 16 2,220
FY 2013 FY 2014 FY 2015 Variance
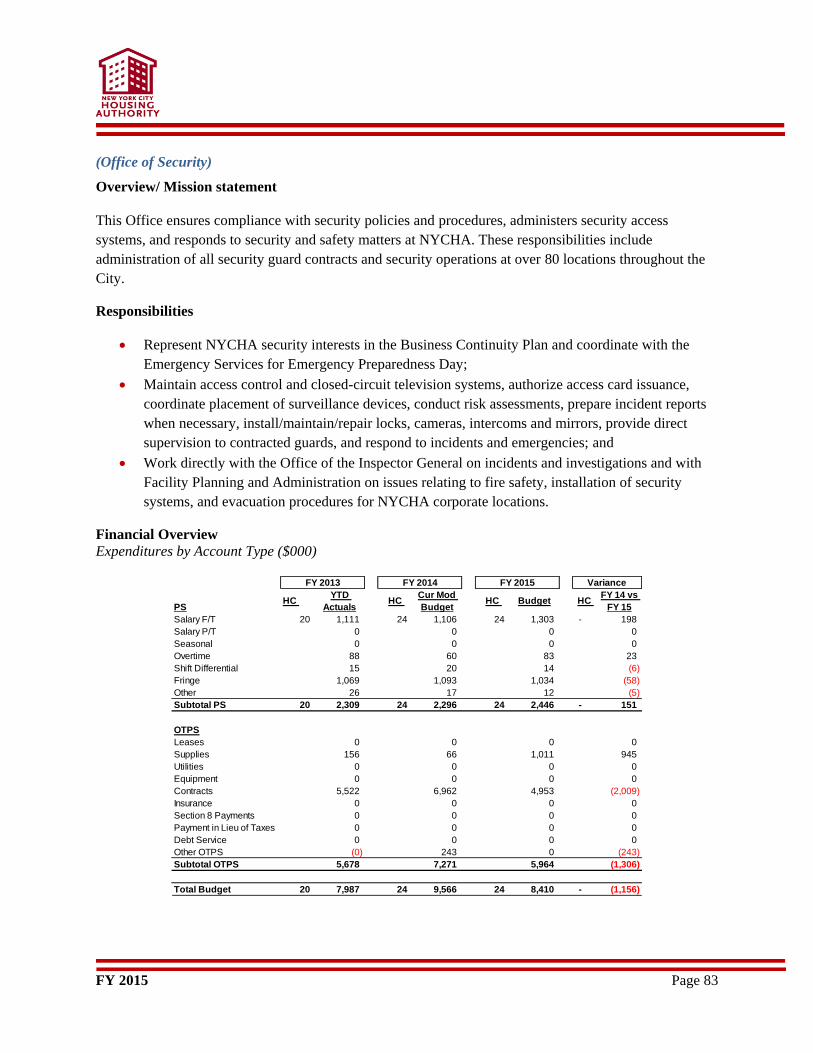
FY 2015 Page 83
(Office of Security)
Overview/ Mission statement
This Office ensures compliance with security policies and procedures, administers security access
systems, and responds to security and safety matters at NYCHA. These responsibilities include
administration of all security guard contracts and security operations at over 80 locations throughout the
City.
Responsibilities
Represent NYCHA security interests in the Business Continuity Plan and coordinate with the
Emergency Services for Emergency Preparedness Day;
Maintain access control and closed-circuit television systems, authorize access card issuance,
coordinate placement of surveillance devices, conduct risk assessments, prepare incident reports
when necessary, install/maintain/repair locks, cameras, intercoms and mirrors, provide direct
supervision to contracted guards, and respond to incidents and emergencies; and
Work directly with the Office of the Inspector General on incidents and investigations and with
Facility Planning and Administration on issues relating to fire safety, installation of security
systems, and evacuation procedures for NYCHA corporate locations.
Financial Overview
Expenditures by Account Type ($000)
PSHC
YTD
ActualsHC
Cur Mod
BudgetHC Budget HC
FY 14 vs
FY 15
Salary F/T 20 1,111 24 1,106 24 1,303 - 198
Salary P/T 0 0 0 0
Seasonal 0 0 0 0
Overtime 88 60 83 23
Shift Differential 15 20 14 (6)
Fringe 1,069 1,093 1,034 (58)
Other 26 17 12 (5)
Subtotal PS 20 2,309 24 2,296 24 2,446 - 151
OTPS
Leases 0 0 0 0
Supplies 156 66 1,011 945
Utilities 0 0 0 0
Equipment 0 0 0 0
Contracts 5,522 6,962 4,953 (2,009)
Insurance 0 0 0 0
Section 8 Payments 0 0 0 0
Payment in Lieu of Taxes 0 0 0 0
Debt Service 0 0 0 0
Other OTPS (0) 243 0 (243)
Subtotal OTPS 5,678 7,271 5,964 (1,306)
Total Budget 20 7,987 24 9,566 24 8,410 - (1,156)
FY 2013 FY 2014 FY 2015 Variance

FY 2015 Page 84
Financial Review
The FY 2015 operating expense budget for the Office of Security is $8.4 million, of which $2.4 million is
for PS and $6 million is for OTPS.
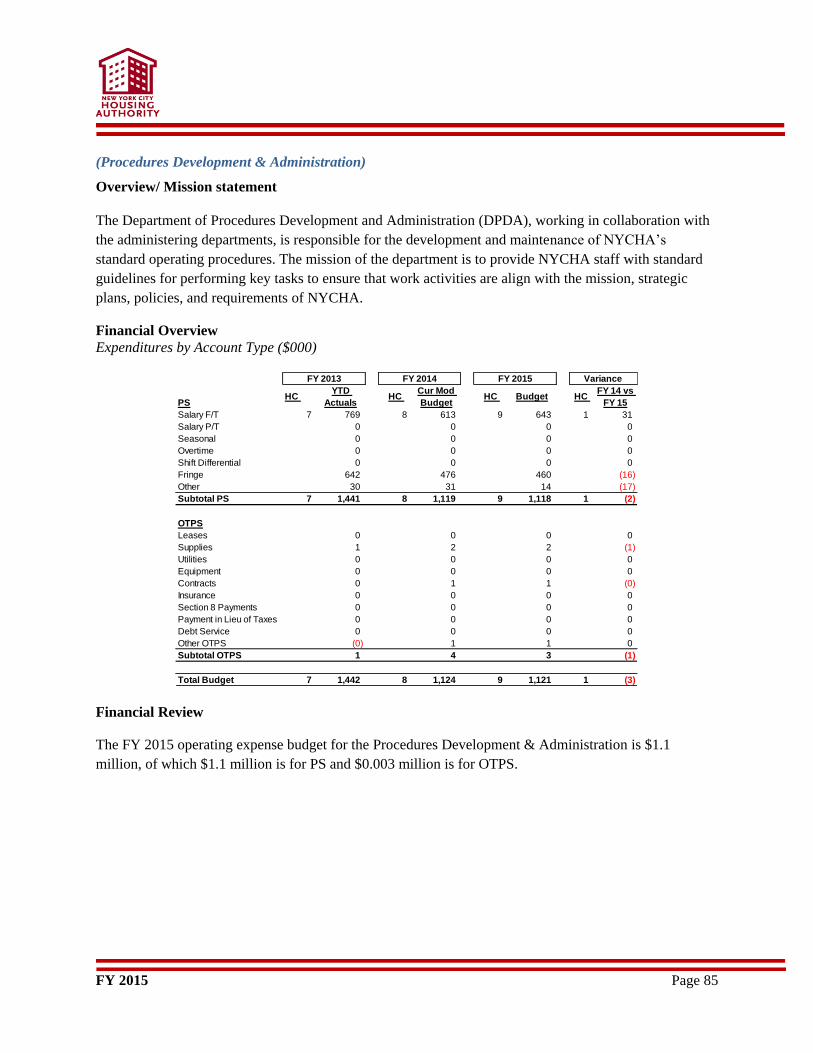
FY 2015 Page 85
(Procedures Development & Administration)
Overview/ Mission statement
The Department of Procedures Development and Administration (DPDA), working in collaboration with
the administering departments, is responsible for the development and maintenance of NYCHA’s
standard operating procedures. The mission of the department is to provide NYCHA staff with standard
guidelines for performing key tasks to ensure that work activities are align with the mission, strategic
plans, policies, and requirements of NYCHA.
Financial Overview
Expenditures by Account Type ($000)
Financial Review
The FY 2015 operating expense budget for the Procedures Development & Administration is $1.1
million, of which $1.1 million is for PS and $0.003 million is for OTPS.
PSHC
YTD
ActualsHC
Cur Mod
BudgetHC Budget HC
FY 14 vs
FY 15
Salary F/T 7 769 8 613 9 643 1 31
Salary P/T 0 0 0 0
Seasonal 0 0 0 0
Overtime 0 0 0 0
Shift Differential 0 0 0 0
Fringe 642 476 460 (16)
Other 30 31 14 (17)
Subtotal PS 7 1,441 8 1,119 9 1,118 1 (2)
OTPS
Leases 0 0 0 0
Supplies 1 2 2 (1)
Utilities 0 0 0 0
Equipment 0 0 0 0
Contracts 0 1 1 (0)
Insurance 0 0 0 0
Section 8 Payments 0 0 0 0
Payment in Lieu of Taxes 0 0 0 0
Debt Service 0 0 0 0
Other OTPS (0) 1 1 0
Subtotal OTPS 1 4 3 (1)
Total Budget 7 1,442 8 1,124 9 1,121 1 (3)
FY 2013 FY 2014 FY 2015 Variance
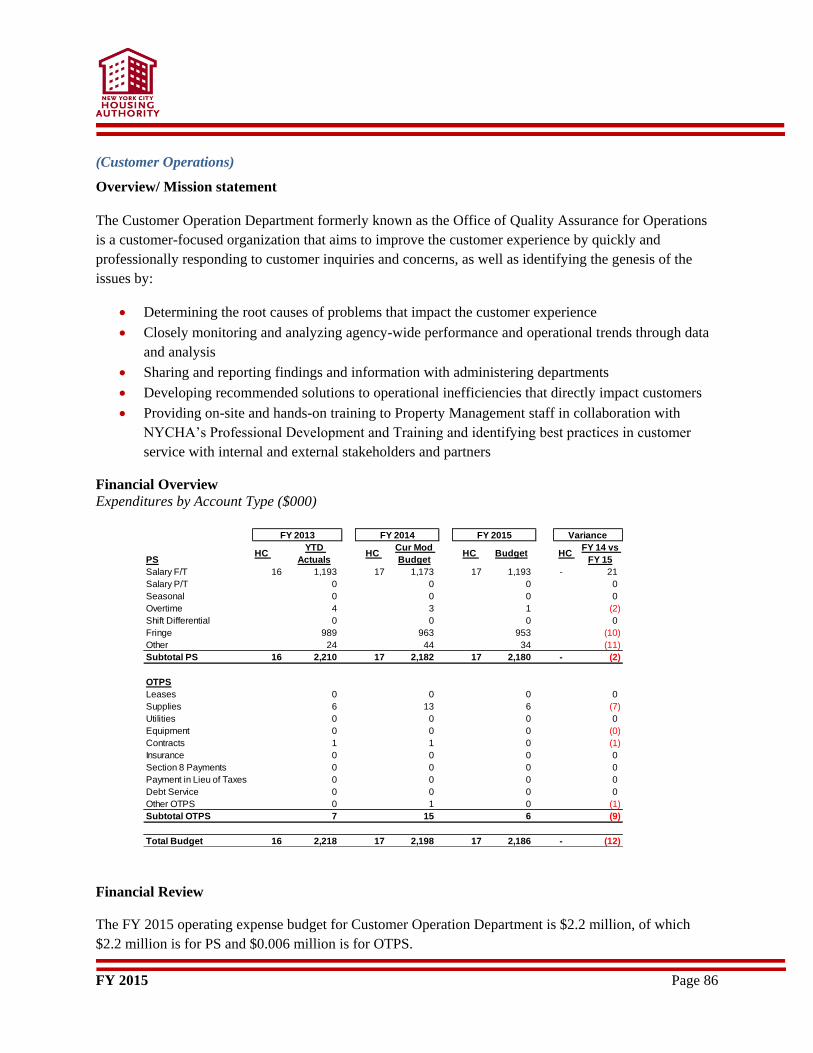
FY 2015 Page 86
(Customer Operations)
Overview/ Mission statement
The Customer Operation Department formerly known as the Office of Quality Assurance for Operations
is a customer-focused organization that aims to improve the customer experience by quickly and
professionally responding to customer inquiries and concerns, as well as identifying the genesis of the
issues by:
Determining the root causes of problems that impact the customer experience
Closely monitoring and analyzing agency-wide performance and operational trends through data
and analysis
Sharing and reporting findings and information with administering departments
Developing recommended solutions to operational inefficiencies that directly impact customers
Providing on-site and hands-on training to Property Management staff in collaboration with
NYCHA’s Professional Development and Training and identifying best practices in customer
service with internal and external stakeholders and partners
Financial Overview
Expenditures by Account Type ($000)
Financial Review
The FY 2015 operating expense budget for Customer Operation Department is $2.2 million, of which
$2.2 million is for PS and $0.006 million is for OTPS.
PSHC
YTD
ActualsHC
Cur Mod
BudgetHC Budget HC
FY 14 vs
FY 15
Salary F/T 16 1,193 17 1,173 17 1,193 - 21
Salary P/T 0 0 0 0
Seasonal 0 0 0 0
Overtime 4 3 1 (2)
Shift Differential 0 0 0 0
Fringe 989 963 953 (10)
Other 24 44 34 (11)
Subtotal PS 16 2,210 17 2,182 17 2,180 - (2)
OTPS
Leases 0 0 0 0
Supplies 6 13 6 (7)
Utilities 0 0 0 0
Equipment 0 0 0 (0)
Contracts 1 1 0 (1)
Insurance 0 0 0 0
Section 8 Payments 0 0 0 0
Payment in Lieu of Taxes 0 0 0 0
Debt Service 0 0 0 0
Other OTPS 0 1 0 (1)
Subtotal OTPS 7 15 6 (9)
Total Budget 16 2,218 17 2,198 17 2,186 - (12)
FY 2013 FY 2014 FY 2015 Variance
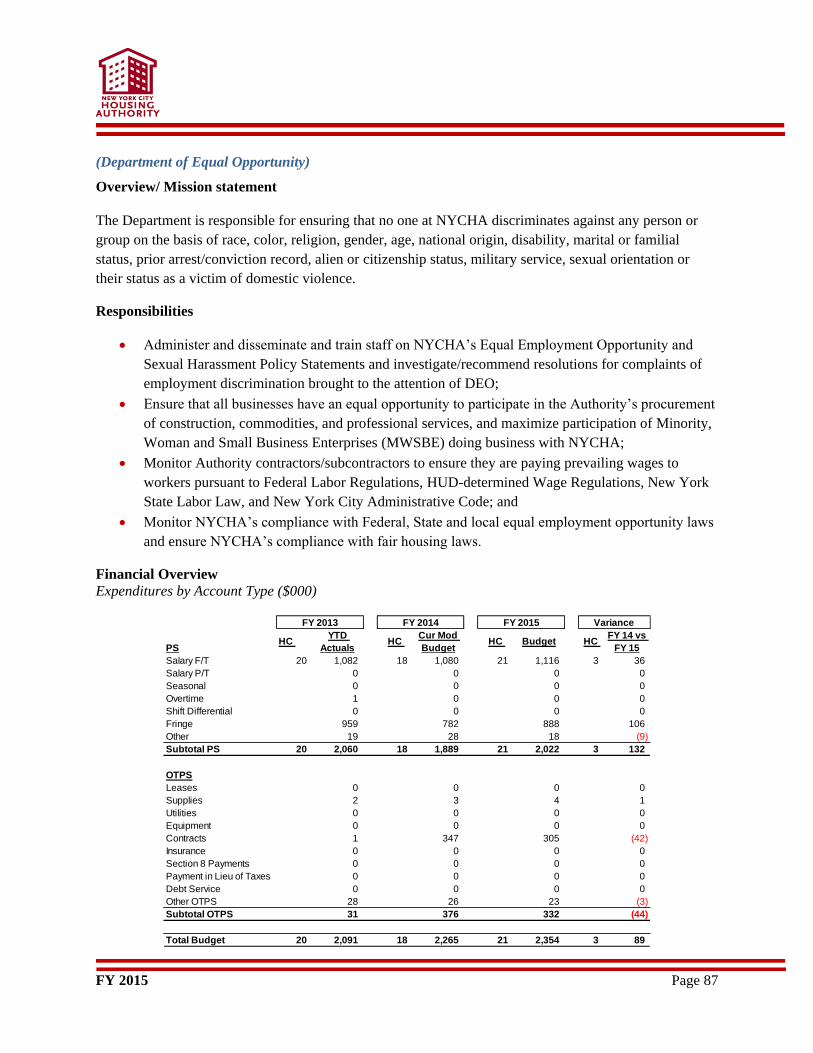
FY 2015 Page 87
(Department of Equal Opportunity)
Overview/ Mission statement
The Department is responsible for ensuring that no one at NYCHA discriminates against any person or
group on the basis of race, color, religion, gender, age, national origin, disability, marital or familial
status, prior arrest/conviction record, alien or citizenship status, military service, sexual orientation or
their status as a victim of domestic violence.
Responsibilities
Administer and disseminate and train staff on NYCHA’s Equal Employment Opportunity and
Sexual Harassment Policy Statements and investigate/recommend resolutions for complaints of
employment discrimination brought to the attention of DEO;
Ensure that all businesses have an equal opportunity to participate in the Authority’s procurement
of construction, commodities, and professional services, and maximize participation of Minority,
Woman and Small Business Enterprises (MWSBE) doing business with NYCHA;
Monitor Authority contractors/subcontractors to ensure they are paying prevailing wages to
workers pursuant to Federal Labor Regulations, HUD-determined Wage Regulations, New York
State Labor Law, and New York City Administrative Code; and
Monitor NYCHA’s compliance with Federal, State and local equal employment opportunity laws
and ensure NYCHA’s compliance with fair housing laws.
Financial Overview
Expenditures by Account Type ($000)
PSHC
YTD
ActualsHC
Cur Mod
BudgetHC Budget HC
FY 14 vs
FY 15
Salary F/T 20 1,082 18 1,080 21 1,116 3 36
Salary P/T 0 0 0 0
Seasonal 0 0 0 0
Overtime 1 0 0 0
Shift Differential 0 0 0 0
Fringe 959 782 888 106
Other 19 28 18 (9)
Subtotal PS 20 2,060 18 1,889 21 2,022 3 132
OTPS
Leases 0 0 0 0
Supplies 2 3 4 1
Utilities 0 0 0 0
Equipment 0 0 0 0
Contracts 1 347 305 (42)
Insurance 0 0 0 0
Section 8 Payments 0 0 0 0
Payment in Lieu of Taxes 0 0 0 0
Debt Service 0 0 0 0
Other OTPS 28 26 23 (3)
Subtotal OTPS 31 376 332 (44)
Total Budget 20 2,091 18 2,265 21 2,354 3 89
FY 2013 FY 2014 FY 2015 Variance

FY 2015 Page 88
Financial Review
The FY 2015 operating expense budget for Department of Equal Opportunity is $2.4 million, of which
$2 million is for PS and $0.3 million is for OTPS.
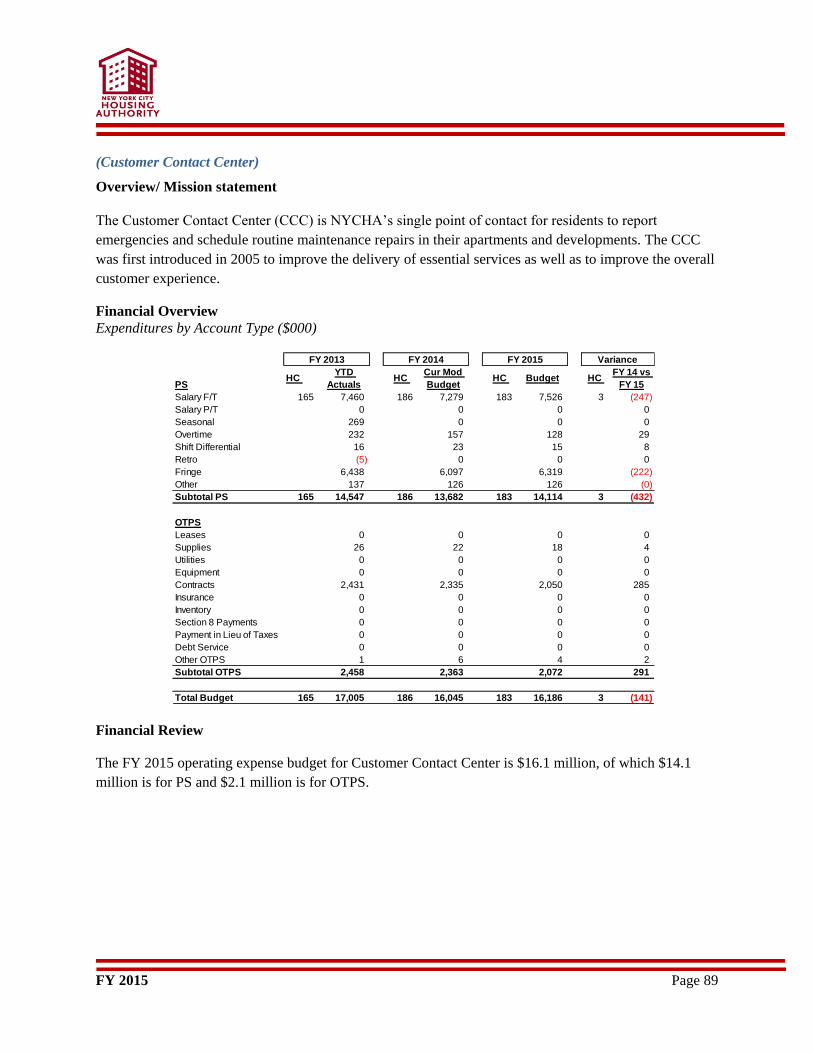
FY 2015 Page 89
(Customer Contact Center)
Overview/ Mission statement
The Customer Contact Center (CCC) is NYCHA’s single point of contact for residents to report
emergencies and schedule routine maintenance repairs in their apartments and developments. The CCC
was first introduced in 2005 to improve the delivery of essential services as well as to improve the overall
customer experience.
Financial Overview
Expenditures by Account Type ($000)
Financial Review
The FY 2015 operating expense budget for Customer Contact Center is $16.1 million, of which $14.1
million is for PS and $2.1 million is for OTPS.
PSHC
YTD
ActualsHC
Cur Mod
BudgetHC Budget HC
FY 14 vs
FY 15
Salary F/T 165 7,460 186 7,279 183 7,526 3 (247)
Salary P/T 0 0 0 0
Seasonal 269 0 0 0
Overtime 232 157 128 29
Shift Differential 16 23 15 8
Retro (5) 0 0 0
Fringe 6,438 6,097 6,319 (222)
Other 137 126 126 (0)
Subtotal PS 165 14,547 186 13,682 183 14,114 3 (432)
OTPS
Leases 0 0 0 0
Supplies 26 22 18 4
Utilities 0 0 0 0
Equipment 0 0 0 0
Contracts 2,431 2,335 2,050 285
Insurance 0 0 0 0
Inventory 0 0 0 0
Section 8 Payments 0 0 0 0
Payment in Lieu of Taxes 0 0 0 0
Debt Service 0 0 0 0
Other OTPS 1 6 4 2
Subtotal OTPS 2,458 2,363 2,072 291
Total Budget 165 17,005 186 16,045 183 16,186 3 (141)
FY 2013 FY 2014 FY 2015 Variance
FY 2015 Page 90
(Research and Management Analysis)
Overview/ Mission statement
The Department is responsible for providing analytic and research support to NYCHA’s Executives as
well as for producing HUD-mandated plans and reports.
Responsibilities
Coordinate Authority Productivity Tracking System (APTS) activities, a bi-monthly review of
key indicators by NYCHA's Board and senior-level managers of data and reports in order to
assess operations and target areas that require greater efficiency;
Conduct site visits prior to PHAS inspections to identify and address deficiencies which may
seriously impact a Development’s score;
Work with Borough Management personnel, development managers, superintendents, skilled-
trades personnel and others to ensure success on the assessment scoring;
Maintains historical data files on NYCHA residents and developments;
Provide descriptive statistical analyses of tenant-related data files, development data, waiting list
attributes, crime statistics, NYC Housing and Vacancy Survey Data, and Census Data;
Prepare NYCHA’s Tenant Data Book, Development Data Book, Property Directory, and Official
Map; and
Coordinate and prepare narrative and data included in NYCHA’s Annual and Five Year Plans,
the Bi-Annual Mayor’s Management Reports, and the Department of City Planning’s Annual
Consolidated Plan Symposiums and Public Hearings.

FY 2015 Page 91
Financial Overview
Expenditures by Account Type ($000)
Financial Review
The FY 2015 operating expense budget for Research and Management Analysis is $2.5 million, of which
$2.5 million is for PS and $0.01 million is for OTPS.
PSHC
YTD
ActualsHC
Cur Mod
BudgetHC Budget HC
FY 14 vs
FY 15
Salary F/T 17 1,366 20 1,497 20 1,422 - (74)
Salary P/T 3 0 0 0
Seasonal 0 0 0 0
Overtime 0 0 0 0
Shift Differential 0 0 0 0
Fringe 1,190 1,129 1,004 (125)
Other 51 32 31 (1)
Subtotal PS 17 2,609 20 2,657 20 2,457 - (200)
OTPS
Leases 0 0 0 0
Supplies 4 4 4 0
Utilities 0 0 0 0
Equipment 0 0 0 0
Contracts 86 21 3 (18)
Insurance 0 0 0 0
Section 8 Payments 0 0 0 0
Payment in Lieu of Taxes 0 0 0 0
Debt Service 0 0 0 0
Other OTPS 1 2 1 (1)
Subtotal OTPS 91 27 8 (19)
Total Budget 17 2,700 20 2,684 20 2,465 - (219)
FY 2013 FY 2014 FY 2015 Variance
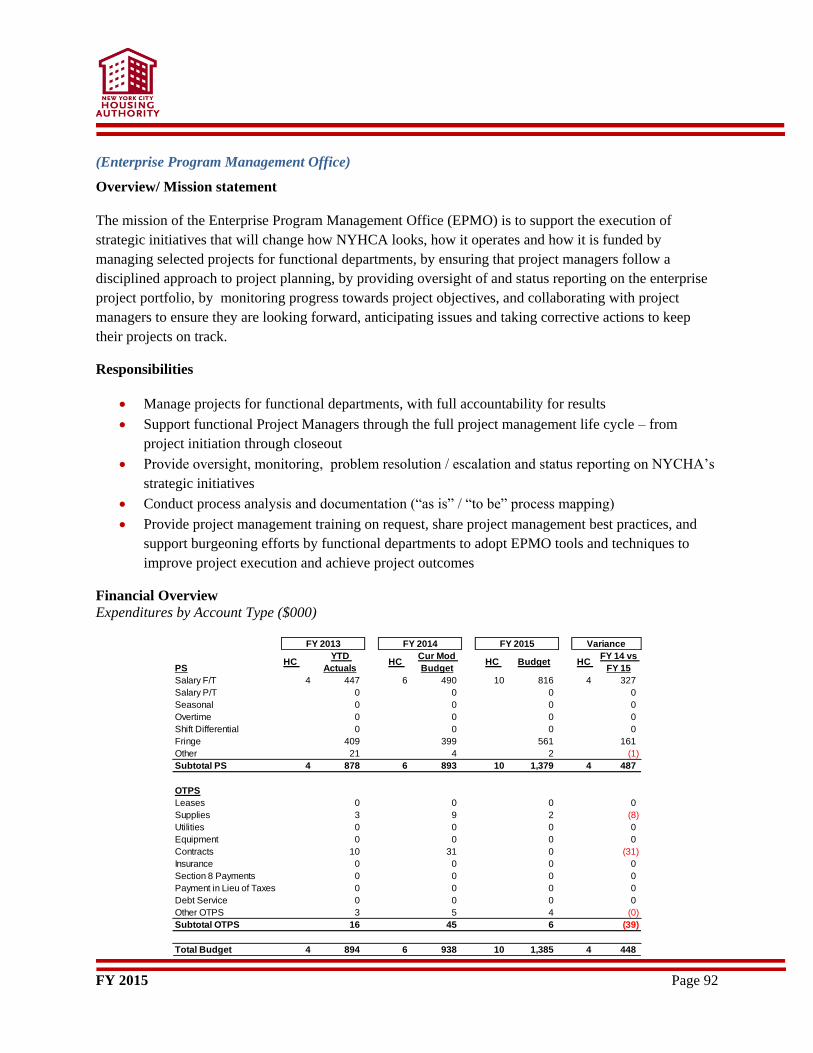
FY 2015 Page 92
(Enterprise Program Management Office)
Overview/ Mission statement
The mission of the Enterprise Program Management Office (EPMO) is to support the execution of
strategic initiatives that will change how NYHCA looks, how it operates and how it is funded by
managing selected projects for functional departments, by ensuring that project managers follow a
disciplined approach to project planning, by providing oversight of and status reporting on the enterprise
project portfolio, by monitoring progress towards project objectives, and collaborating with project
managers to ensure they are looking forward, anticipating issues and taking corrective actions to keep
their projects on track.
Responsibilities
Manage projects for functional departments, with full accountability for results
Support functional Project Managers through the full project management life cycle – from
project initiation through closeout
Provide oversight, monitoring, problem resolution / escalation and status reporting on NYCHA’s
strategic initiatives
Conduct process analysis and documentation (“as is” / “to be” process mapping)
Provide project management training on request, share project management best practices, and
support burgeoning efforts by functional departments to adopt EPMO tools and techniques to
improve project execution and achieve project outcomes
Financial Overview
Expenditures by Account Type ($000)
PSHC
YTD
ActualsHC
Cur Mod
BudgetHC Budget HC
FY 14 vs
FY 15
Salary F/T 4 447 6 490 10 816 4 327
Salary P/T 0 0 0 0
Seasonal 0 0 0 0
Overtime 0 0 0 0
Shift Differential 0 0 0 0
Fringe 409 399 561 161
Other 21 4 2 (1)
Subtotal PS 4 878 6 893 10 1,379 4 487
OTPS
Leases 0 0 0 0
Supplies 3 9 2 (8)
Utilities 0 0 0 0
Equipment 0 0 0 0
Contracts 10 31 0 (31)
Insurance 0 0 0 0
Section 8 Payments 0 0 0 0
Payment in Lieu of Taxes 0 0 0 0
Debt Service 0 0 0 0
Other OTPS 3 5 4 (0)
Subtotal OTPS 16 45 6 (39)
Total Budget 4 894 6 938 10 1,385 4 448
FY 2013 FY 2014 FY 2015 Variance
FY 2015 Page 93
Financial Review
The FY 2015 operating expense budget for Enterprise Program Management is $1.4 million, of which
$1.4 million is for PS and $0.01 million is for OTPS.
FY 2015 Page 94
(Emergency Preparedness)
Overview/ Mission statement
The Emergency Preparedness Department was founded in 2015 and is responsible for supporting
NYCHA operations in disaster response, recovery and mitigation efforts through the provision of
leadership and guidance on development, implementation and maintenance of NYCHA’s disaster
response strategies and plans. NYCHA Emergency Preparedness will develop a network of relationships
among peer leaders across the City, State and Federal agencies and external stakeholders, including CBOs
and community groups. The Director will provide leadership and guidance on the development of
emergency response procedures; establishment of protocols for communicating with NYCHA’s
employees, residents, and stakeholders in times of emergencies; and determine staff development needs.
Additional department responsibilities include planning, organizing, evaluating, and directing the
implementation of NYCHA’s portfolio of emergency preparedness and disaster recovery programs and
procedures.
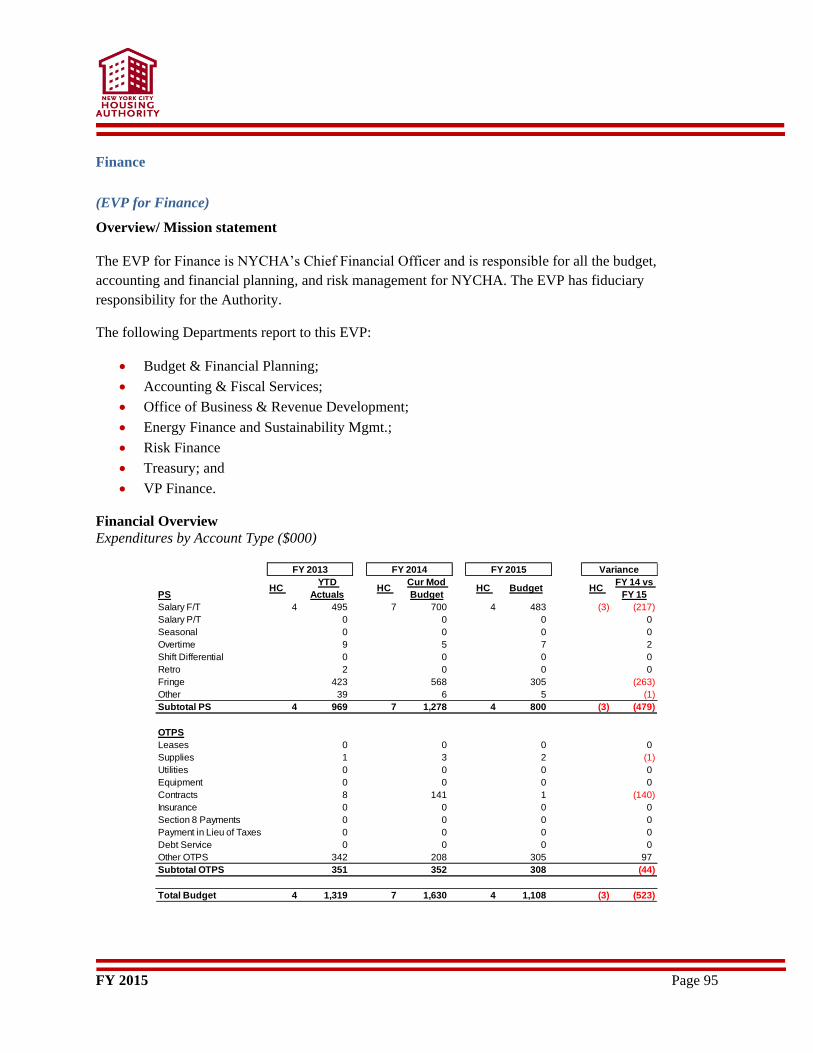
FY 2015 Page 95
Finance
(EVP for Finance)
Overview/ Mission statement
The EVP for Finance is NYCHA’s Chief Financial Officer and is responsible for all the budget,
accounting and financial planning, and risk management for NYCHA. The EVP has fiduciary
responsibility for the Authority.
The following Departments report to this EVP:
Budget & Financial Planning;
Accounting & Fiscal Services;
Office of Business & Revenue Development;
Energy Finance and Sustainability Mgmt.;
Risk Finance
Treasury; and
VP Finance.
Financial Overview
Expenditures by Account Type ($000)
PSHC
YTD
ActualsHC
Cur Mod
BudgetHC Budget HC
FY 14 vs
FY 15
Salary F/T 4 495 7 700 4 483 (3) (217)
Salary P/T 0 0 0 0
Seasonal 0 0 0 0
Overtime 9 5 7 2
Shift Differential 0 0 0 0
Retro 2 0 0 0
Fringe 423 568 305 (263)
Other 39 6 5 (1)
Subtotal PS 4 969 7 1,278 4 800 (3) (479)
OTPS
Leases 0 0 0 0
Supplies 1 3 2 (1)
Utilities 0 0 0 0
Equipment 0 0 0 0
Contracts 8 141 1 (140)
Insurance 0 0 0 0
Section 8 Payments 0 0 0 0
Payment in Lieu of Taxes 0 0 0 0
Debt Service 0 0 0 0
Other OTPS 342 208 305 97
Subtotal OTPS 351 352 308 (44)
Total Budget 4 1,319 7 1,630 4 1,108 (3) (523)
FY 2013 FY 2014 FY 2015 Variance

FY 2015 Page 96
Financial Review
The FY 2015 operating expense budget for the EVP for Finance is $1.1 million, of which $ 0.8 million is
for PS and $0.3 million is for OTPS.
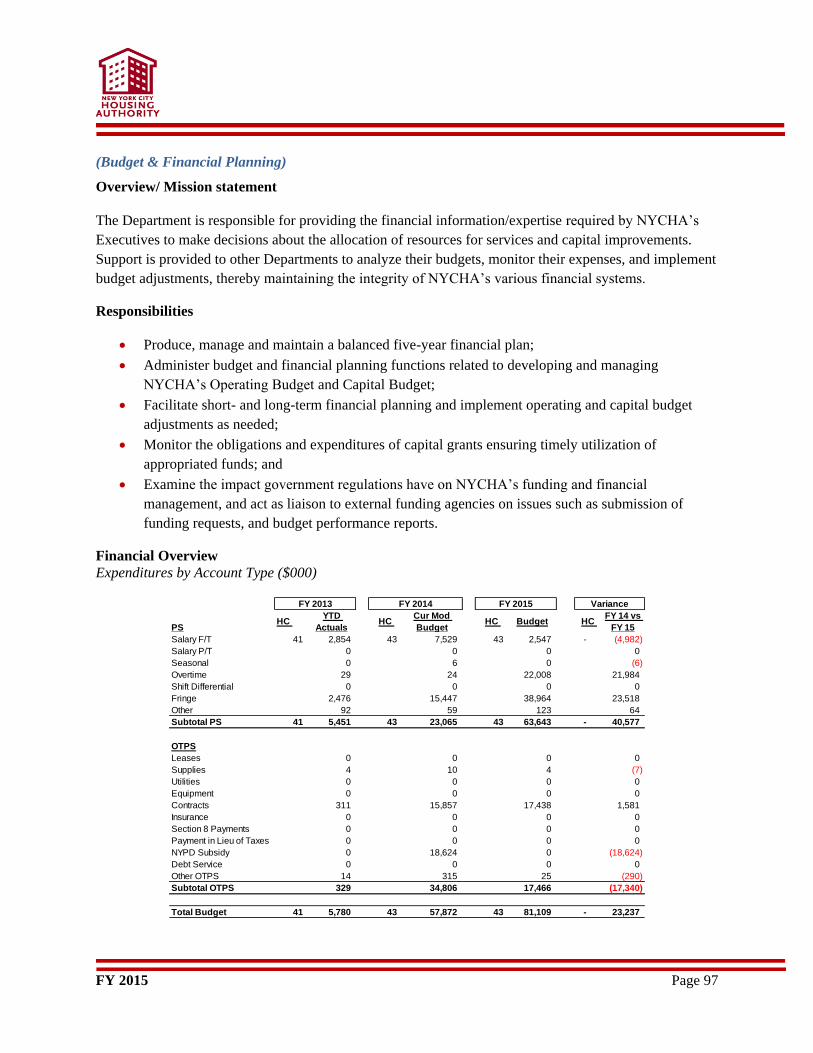
FY 2015 Page 97
(Budget & Financial Planning)
Overview/ Mission statement
The Department is responsible for providing the financial information/expertise required by NYCHA’s
Executives to make decisions about the allocation of resources for services and capital improvements.
Support is provided to other Departments to analyze their budgets, monitor their expenses, and implement
budget adjustments, thereby maintaining the integrity of NYCHA’s various financial systems.
Responsibilities
Produce, manage and maintain a balanced five-year financial plan;
Administer budget and financial planning functions related to developing and managing
NYCHA’s Operating Budget and Capital Budget;
Facilitate short- and long-term financial planning and implement operating and capital budget
adjustments as needed;
Monitor the obligations and expenditures of capital grants ensuring timely utilization of
appropriated funds; and
Examine the impact government regulations have on NYCHA’s funding and financial
management, and act as liaison to external funding agencies on issues such as submission of
funding requests, and budget performance reports.
Financial Overview
Expenditures by Account Type ($000)
PSHC
YTD
ActualsHC
Cur Mod
BudgetHC Budget HC
FY 14 vs
FY 15
Salary F/T 41 2,854 43 7,529 43 2,547 - (4,982)
Salary P/T 0 0 0 0
Seasonal 0 6 0 (6)
Overtime 29 24 22,008 21,984
Shift Differential 0 0 0 0
Fringe 2,476 15,447 38,964 23,518
Other 92 59 123 64
Subtotal PS 41 5,451 43 23,065 43 63,643 - 40,577
OTPS
Leases 0 0 0 0
Supplies 4 10 4 (7)
Utilities 0 0 0 0
Equipment 0 0 0 0
Contracts 311 15,857 17,438 1,581
Insurance 0 0 0 0
Section 8 Payments 0 0 0 0
Payment in Lieu of Taxes 0 0 0 0
NYPD Subsidy 0 18,624 0 (18,624)
Debt Service 0 0 0 0
Other OTPS 14 315 25 (290)
Subtotal OTPS 329 34,806 17,466 (17,340)
Total Budget 41 5,780 43 57,872 43 81,109 - 23,237
FY 2013 FY 2014 FY 2015 Variance
FY 2015 Page 98
Financial Review
The FY 2015 operating expense budget for the Department of Budget and Financial Planning is $81.1
million, of which $63.6 million is for PS and $17.5 million is for OTPS.
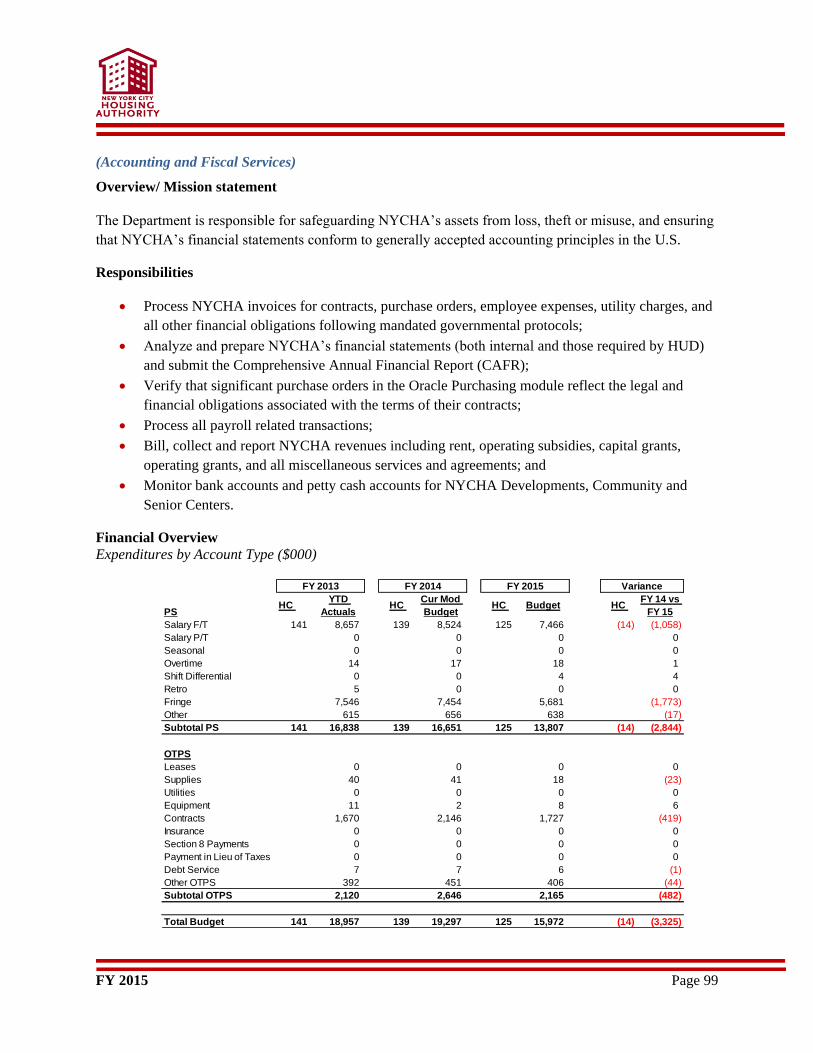
FY 2015 Page 99
(Accounting and Fiscal Services)
Overview/ Mission statement
The Department is responsible for safeguarding NYCHA’s assets from loss, theft or misuse, and ensuring
that NYCHA’s financial statements conform to generally accepted accounting principles in the U.S.
Responsibilities
Process NYCHA invoices for contracts, purchase orders, employee expenses, utility charges, and
all other financial obligations following mandated governmental protocols;
Analyze and prepare NYCHA’s financial statements (both internal and those required by HUD)
and submit the Comprehensive Annual Financial Report (CAFR);
Verify that significant purchase orders in the Oracle Purchasing module reflect the legal and
financial obligations associated with the terms of their contracts;
Process all payroll related transactions;
Bill, collect and report NYCHA revenues including rent, operating subsidies, capital grants,
operating grants, and all miscellaneous services and agreements; and
Monitor bank accounts and petty cash accounts for NYCHA Developments, Community and
Senior Centers.
Financial Overview
Expenditures by Account Type ($000)
PSHC
YTD
ActualsHC
Cur Mod
BudgetHC Budget HC
FY 14 vs
FY 15
Salary F/T 141 8,657 139 8,524 125 7,466 (14) (1,058)
Salary P/T 0 0 0 0
Seasonal 0 0 0 0
Overtime 14 17 18 1
Shift Differential 0 0 4 4
Retro 5 0 0 0
Fringe 7,546 7,454 5,681 (1,773)
Other 615 656 638 (17)
Subtotal PS 141 16,838 139 16,651 125 13,807 (14) (2,844)
OTPS
Leases 0 0 0 0
Supplies 40 41 18 (23)
Utilities 0 0 0 0
Equipment 11 2 8 6
Contracts 1,670 2,146 1,727 (419)
Insurance 0 0 0 0
Section 8 Payments 0 0 0 0
Payment in Lieu of Taxes 0 0 0 0
Debt Service 7 7 6 (1)
Other OTPS 392 451 406 (44)
Subtotal OTPS 2,120 2,646 2,165 (482)
Total Budget 141 18,957 139 19,297 125 15,972 (14) (3,325)
FY 2013 FY 2014 FY 2015 Variance

FY 2015 Page 100
Financial Review
The FY 2015 operating expense budget for Accounting and Fiscal Services is $16 million, of which $13.8
million is for PS and $2.2 million is for OTPS.
FY 2015 Page 101
(Office of Business & Revenue Development)
Overview/ Mission statement
The Office of Business and Revenue Development identifies and develops new opportunities to generate
additional income for NYCHA. The office works with NYCHA’s established budget and financial
planning process to identify, promote, and leverage revenue-generating initiatives.
Responsibilities
Design, coordinate and execute new business (revenue-generating) initiatives on behalf of
NYCHA
Assess and monitor current revenue-generating program activities and initiatives managed by
departments throughout NYCHA
Assist departments to identify market opportunities for their revenue-producing services
Establish objective standards and protocols for current and new revenue-generating programs
Assist departments to develop plans to implement revenue-generating activities
Develop private sector relationships to promote business opportunities and foster growth of
NYCHA’s revenue-generating initiatives
Financial Overview
Expenditures by Account Type ($000)
PSHC
YTD
ActualsHC
Cur Mod
BudgetHC Budget HC
FY 14 vs
FY 15
Salary F/T 6 492 6 493 6 503 - 10
Salary P/T 0 0 0 0
Seasonal 0 0 0 0
Overtime 0 0 0 0
Shift Differential 0 0 0 0
Fringe 428 359 344 (15)
Other 8 8 11 3
Subtotal PS 6 928 6 860 6 859 - (1)
OTPS
Leases 0 0 0 0
Supplies 1 1 1 0
Utilities 0 0 0 0
Equipment 0 0 0 0
Contracts 539 23 102 79
Insurance 0 0 0 0
Section 8 Payments 0 0 0 0
Payment in Lieu of Taxes 0 0 0 0
Debt Service 0 0 0 0
Other OTPS 1 2 14 12
Subtotal OTPS 541 25 117 92
Total Budget 6 1,469 6 885 6 976 - 91
FY 2013 FY 2014 FY 2015 Variance
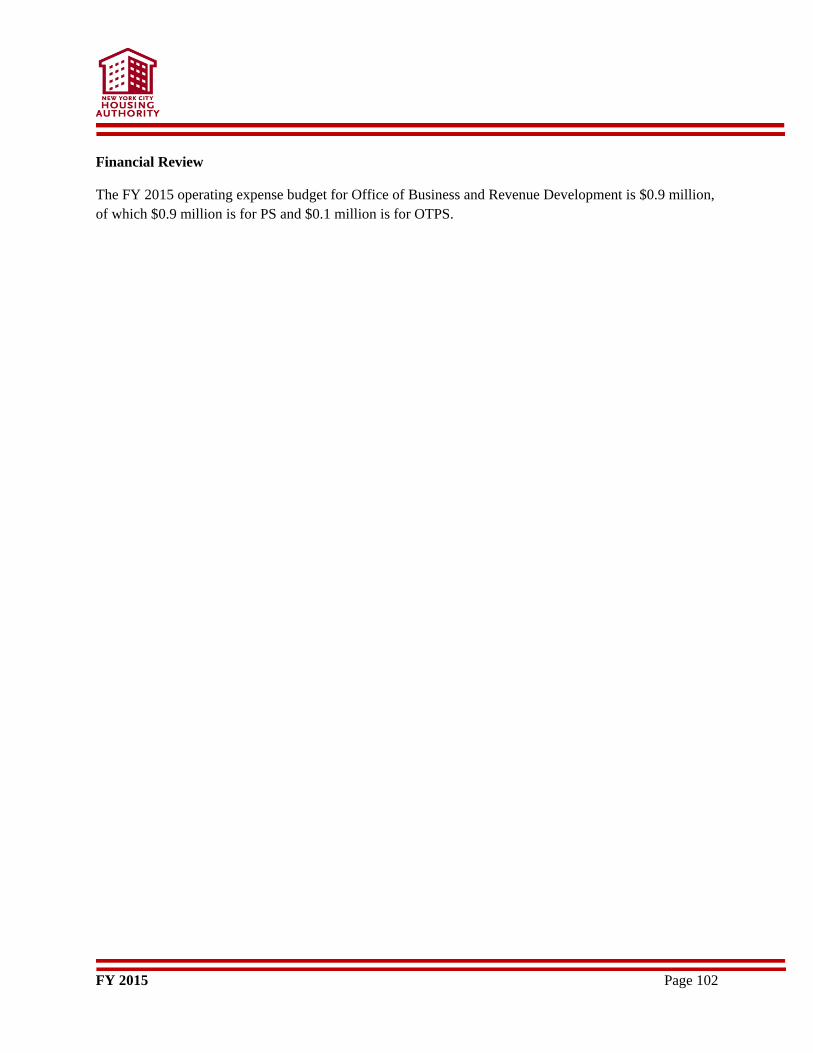
FY 2015 Page 102
Financial Review
The FY 2015 operating expense budget for Office of Business and Revenue Development is $0.9 million,
of which $0.9 million is for PS and $0.1 million is for OTPS.
FY 2015 Page 103
(Energy Finance and Sustainability Management)
Overview/ Mission statement
The Department is responsible for developing programs to keep NYCHA’s energy costs as low as
possible by: reducing energy consumption through implementation of conservation programs; introducing
new energy-efficient technologies; improving field operational productivity; and contracting for
NYCHA’s energy needs in the most cost-effective manner.
Responsibilities
Negotiate with suppliers for the purchase of heating/cooking gas, and manage payment of
monthly invoices relating to use of electricity, cooking gas, heating gas and fuel oil;
Conduct assessments and evaluations, monitor energy systems and investigate new energy
initiatives to conserve energy;
Test energy options at developments of various sizes with differing energy needs;
Develop performance contracts to leverage third-party financing for the installation of energy
conservation measures;
Plan and implement building technologies that reduce energy consumption;
Collect, organize and interpret monthly data and cumulative expenditure reports on utility
payments involving gas, oil, electricity, steam; and
Examine trend analyses, cost payback and consumption patterns and provides data entry of
monthly fuel oil consumption and price into NYCHA’s Energy Management Information System.
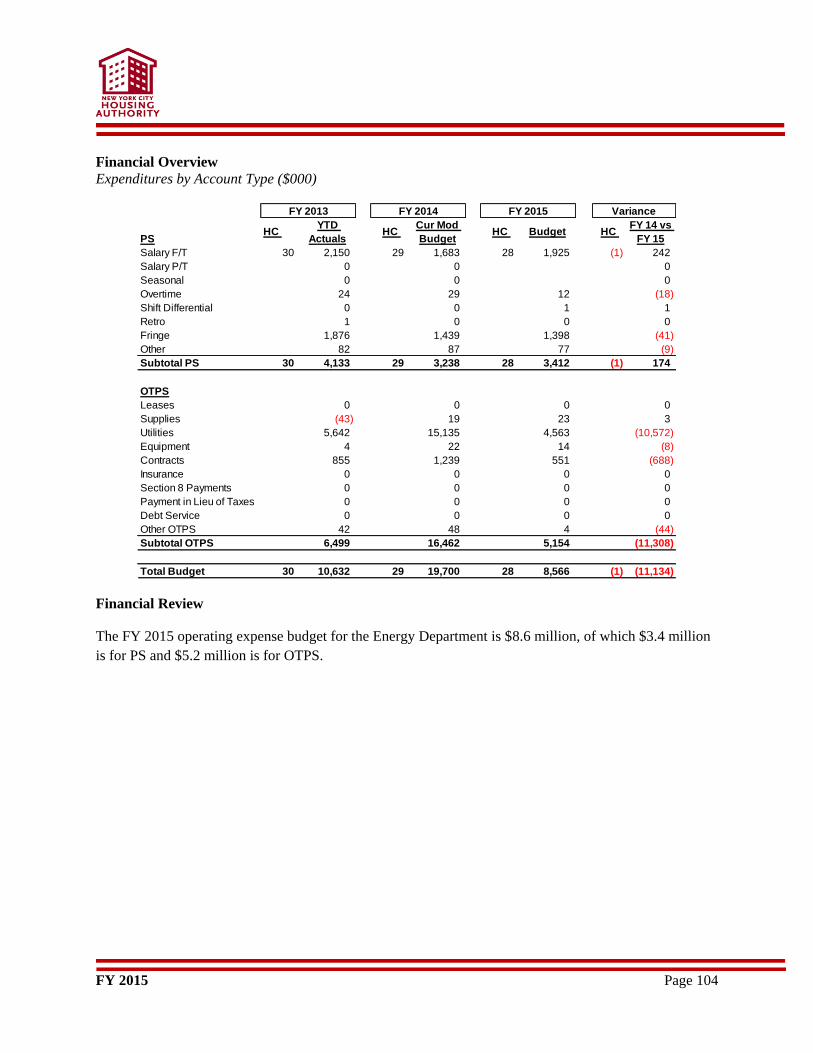
FY 2015 Page 104
Financial Overview
Expenditures by Account Type ($000)
Financial Review
The FY 2015 operating expense budget for the Energy Department is $8.6 million, of which $3.4 million
is for PS and $5.2 million is for OTPS.
PSHC
YTD
ActualsHC
Cur Mod
BudgetHC Budget HC
FY 14 vs
FY 15
Salary F/T 30 2,150 29 1,683 28 1,925 (1) 242
Salary P/T 0 0 0
Seasonal 0 0 0
Overtime 24 29 12 (18)
Shift Differential 0 0 1 1
Retro 1 0 0 0
Fringe 1,876 1,439 1,398 (41)
Other 82 87 77 (9)
Subtotal PS 30 4,133 29 3,238 28 3,412 (1) 174
OTPS
Leases 0 0 0 0
Supplies (43) 19 23 3
Utilities 5,642 15,135 4,563 (10,572)
Equipment 4 22 14 (8)
Contracts 855 1,239 551 (688)
Insurance 0 0 0 0
Section 8 Payments 0 0 0 0
Payment in Lieu of Taxes 0 0 0 0
Debt Service 0 0 0 0
Other OTPS 42 48 4 (44)
Subtotal OTPS 6,499 16,462 5,154 (11,308)
Total Budget 30 10,632 29 19,700 28 8,566 (1) (11,134)
FY 2013 FY 2014 FY 2015 Variance
FY 2015 Page 105
(Risk Finance)
Overview/ Mission statement
This Division is responsible for NYCHA’s loss control activities, including managing the self-insurance
programs.
Responsibilities
Oversee the workers' compensation third-party administrator (TPA);
Manage the claim process and approve medical payments to providers and the TPA;
Work with the Safety Committee to reduce NYCHA's loss exposures and hazards;
Procure excess insurance, and the services of insurance brokers, consultants, actuaries, outside
auditors and third-party administrators;
Prepare financial analyses of insurance data;
Review tort legal fee invoices and settlements, analyze reserve to payments, and manage cash
allocations to the self-insurance funds; and
Verify that all NYCHA contractors and lessees have the requisite insurance coverage, and
review/update these requirements in the General Terms and Conditions section of applicable
contracts, leases and agreements.
Financial Overview
Expenditures by Account Type ($000)
PSHC
YTD
ActualsHC
Cur Mod
BudgetHC Budget HC
FY 14 vs
FY 15
Salary F/T 9 708 10 712 10 711 - (1)
Salary P/T 0 0 0 0
Seasonal 0 22 2 (19)
Overtime 0 0 0 0
Shift Differential 0 0 4 4
Fringe 598 527 510 (18)
Other 20 16 15 (2)
Subtotal PS 9 1,325 10 1,278 10 1,241 - (37)
OTPS
Leases 0 0 0 0
Supplies 4 4 1 (2)
Utilities 0 0 0 0
Equipment 0 0 0 0
Contracts 0 1 2 0
Insurance 31,334 34,207 36,413 2,206
Section 8 Payments 0 0 0 0
Payment in Lieu of Taxes 0 0 0 0
Debt Service 0 0 0 0
Other OTPS 7 2 2 (0)
Subtotal OTPS 31,345 34,214 36,418 2,203
Total Budget 9 32,670 10 35,492 10 37,659 - 2,167
FY 2013 FY 2014 FY 2015 Variance

FY 2015 Page 106
Financial Review
The FY 2015 operating expense budget for Risk Finance is $37.7 million, of which $1.2 million is for PS
and $36.4 million is for OTPS.
FY 2015 Page 107
(Treasury)
Overview/ Mission statement
The Treasury Department is responsible for managing and monitoring cash flow and investments to
assure the ongoing availability of adequate cash to meet NYCHA’s daily operating and capital
expenditure requirements. Funds not earmarked for near-term use are invested in HUD-approved
securities with consideration for maximum yield and minimum risk. A cash flow tracking report is
utilized for forecasting anticipated cash flows to optimize the investment decision-making process.
Responsibilities
The department has primary responsibility for opening and closing NYCHA bank accounts and for
monitoring bank account balances to ensure collateral coverage for deposit balances. The department
issues and administers branded and Automated Teller Machine (ATM) debit cards for special program
expenditures for NYCHA developments, community centers and senior centers, and for petty cash.
The department arranges for printing and distribution of vendor and Section 8 landlord checks and
manages NYCHA’s check fraud avoidance functions through a positive pay system and related internal
controls, which has resulted in an excellent record of preventing fraudulent activity. The department
arranges for pick-up and distribution of employee payroll checks and direct deposit advices.
Cash Management Section
Monitors and assesses NYCHA’s daily cash flow
Initiates wire transfers and arranges for the preparation of related recording entries which
reconcile NYCHA’s daily cash position
Arranges for the opening and closing of NYCHA bank accounts.
Treasury Investments Section
Invests NYCHA’s funds in compliance with HUD guidelines and internal control procedures
Monitors and reconciles NYCHA’s fiscal agent obligations and manages the investment of
tenant security deposits on an annual basis.
Treasury Operations Section
Represents a core operating area that ensures the strict control of operating procedures and
policies within Treasury
Monitors and ensures maximum security and appropriate use of confidential financial data
Monitors compliance with audit principles regarding the separation of cash management and
investment responsibilities, and the maintenance of proper documentation and authorization
for all Treasury activities.
Manages check fraud avoidance functions, including the transmission of daily check issuance
and cancellation files to the paying bank through a “positive pay” system and elaborate
internal controls.
Monitors and adjusts required collateral coverage for NYCHA bank account cash deposits on
a daily basis.
FY 2015 Page 108
The Check Distribution Unit within Treasury Operations arranges for the printing and
distribution of daily vendor checks and monthly Section 8 landlord checks and advices.
Financial Overview
Expenditures by Account Type ($000)
Financial Review
The FY 2015 operating expense budget for Treasury is $2.0 million, of which $1.9 million is for PS and
$0.06 million is for OTPS.
PSHC
YTD
ActualsHC
Cur Mod
BudgetHC Budget HC
FY 14 vs
FY 15
Salary F/T 16 1,102 16 1,044 17 1,067 1 23
Salary P/T 0 0 0 0
Seasonal 0 0 0 0
Overtime 0 0 0 (0)
Shift Differential 0 0 0 0
Fringe 951 775 773 (3)
Other 76 67 62 (6)
Subtotal PS 16 2,130 16 1,887 17 1,901 1 14
OTPS
Leases 0 0 0 0
Supplies 42 48 48 0
Utilities 0 0 0 0
Equipment 0 0 0 0
Contracts 8 9 10 1
Insurance 0 0 0 0
Section 8 Payments 0 0 0 0
Payment in Lieu of Taxes 0 0 0 0
Debt Service 0 0 0 0
Other OTPS (0) 2 1 (2)
Subtotal OTPS 50 59 58 (1)
Total Budget 16 2,180 16 1,946 17 1,960 1 14
FY 2013 FY 2014 FY 2015 Variance
FY 2015 Page 109
(VP Finance)
Overview/ Mission statement
Provide leadership and strategic guidance to New York City Housing Authority’s Department of Budget
and Financial Planning and the Accounting and Fiscal Services Department.
Financial Overview
Expenditures by Account Type ($000)
Financial Review
The FY 2015 operating expense budget for VP for Finance is $.08 million, of which $0.08 million is for
PS .
PSHC
YTD
ActualsHC
Cur Mod
BudgetHC Budget HC
FY 14 vs
FY 15
Salary F/T 1 148 1 23 1 43 - 21
Salary P/T 0 0 0 0
Seasonal 0 0 0 0
Overtime 0 3 0 (3)
Shift Differential 0 0 0 0
Fringe 131 103 37 (67)
Other 0 0 0 0
Subtotal PS 1 280 1 129 1 80 - (49)
OTPS
Leases 0 0 0 0
Supplies 0 1 0 (1)
Utilities 0 0 0 0
Equipment 0 0 0 0
Contracts 0 2 0 (2)
Insurance 0 0 0 0
Section 8 Payments 0 0 0 0
Payment in Lieu of Taxes 0 0 0 0
Debt Service 0 0 0 0
Other OTPS 0 0 0 (0)
Subtotal OTPS 0 3 0 (3)
Total Budget 1 280 1 132 1 80 - (52)
FY 2013 FY 2014 FY 2015 Variance
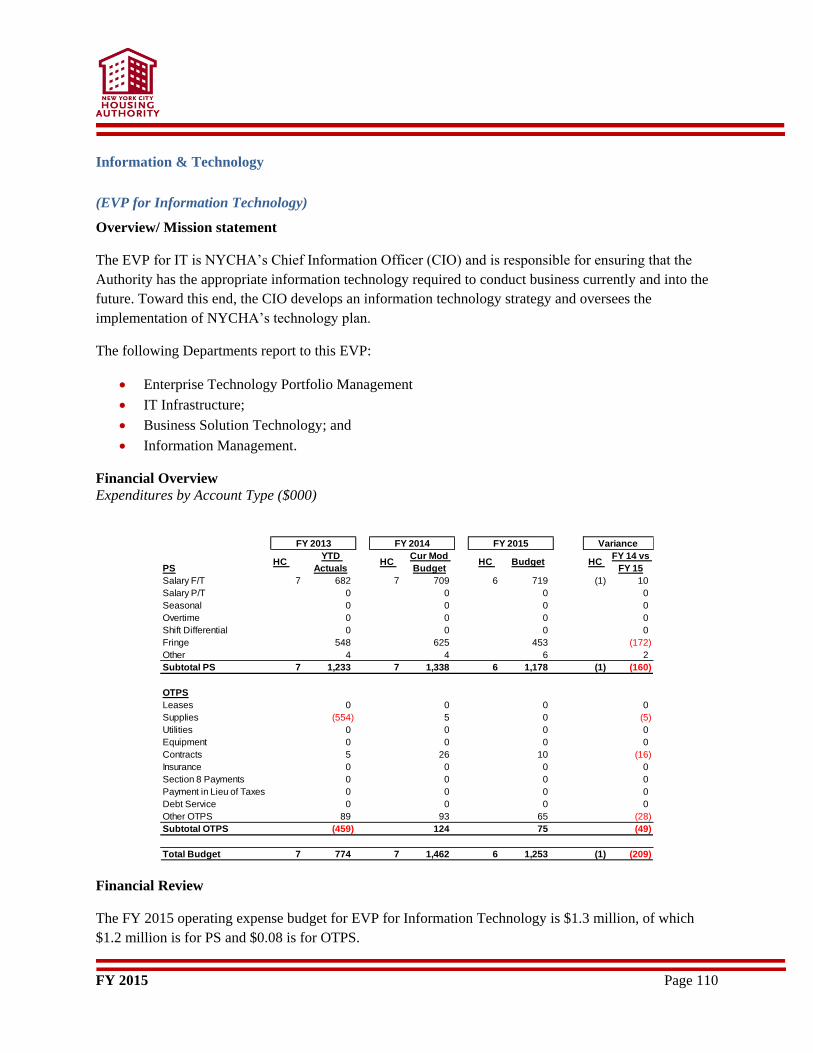
FY 2015 Page 110
Information & Technology
(EVP for Information Technology)
Overview/ Mission statement
The EVP for IT is NYCHA’s Chief Information Officer (CIO) and is responsible for ensuring that the
Authority has the appropriate information technology required to conduct business currently and into the
future. Toward this end, the CIO develops an information technology strategy and oversees the
implementation of NYCHA’s technology plan.
The following Departments report to this EVP:
Enterprise Technology Portfolio Management
IT Infrastructure;
Business Solution Technology; and
Information Management.
Financial Overview
Expenditures by Account Type ($000)
Financial Review
The FY 2015 operating expense budget for EVP for Information Technology is $1.3 million, of which
$1.2 million is for PS and $0.08 is for OTPS.
PSHC
YTD
ActualsHC
Cur Mod
BudgetHC Budget HC
FY 14 vs
FY 15
Salary F/T 7 682 7 709 6 719 (1) 10
Salary P/T 0 0 0 0
Seasonal 0 0 0 0
Overtime 0 0 0 0
Shift Differential 0 0 0 0
Fringe 548 625 453 (172)
Other 4 4 6 2
Subtotal PS 7 1,233 7 1,338 6 1,178 (1) (160)
OTPS
Leases 0 0 0 0
Supplies (554) 5 0 (5)
Utilities 0 0 0 0
Equipment 0 0 0 0
Contracts 5 26 10 (16)
Insurance 0 0 0 0
Section 8 Payments 0 0 0 0
Payment in Lieu of Taxes 0 0 0 0
Debt Service 0 0 0 0
Other OTPS 89 93 65 (28)
Subtotal OTPS (459) 124 75 (49)
Total Budget 7 774 7 1,462 6 1,253 (1) (209)
FY 2013 FY 2014 FY 2015 Variance
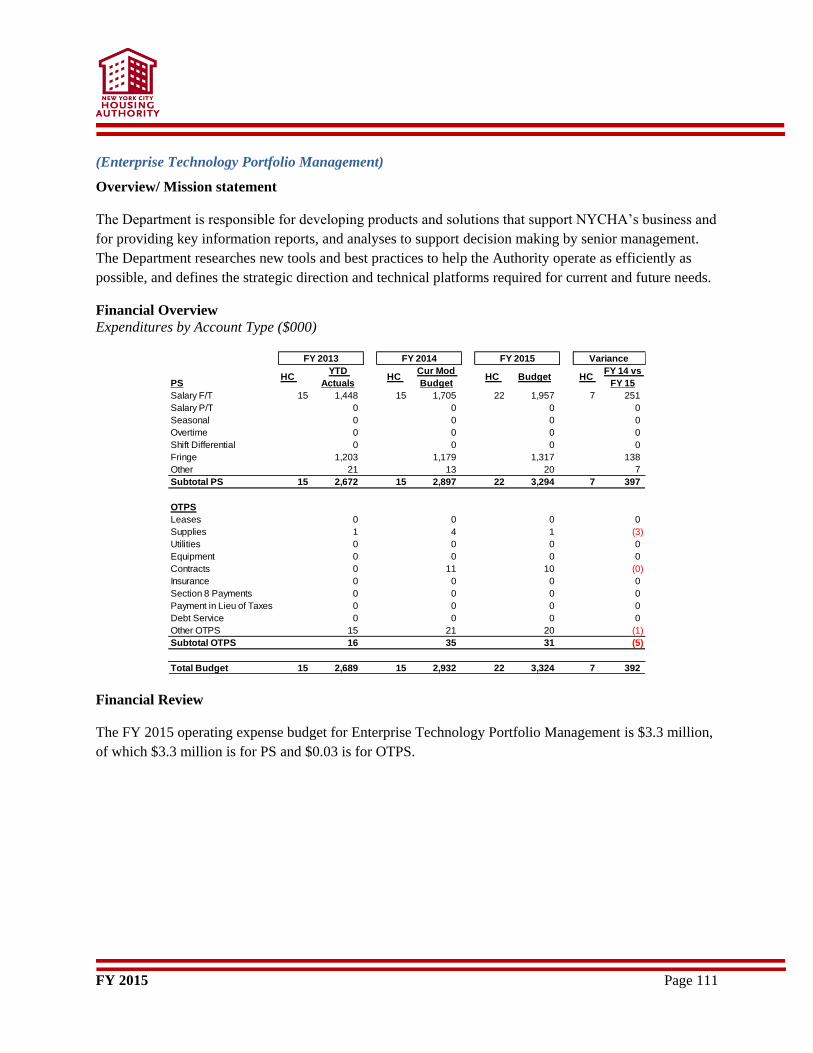
FY 2015 Page 111
(Enterprise Technology Portfolio Management)
Overview/ Mission statement
The Department is responsible for developing products and solutions that support NYCHA’s business and
for providing key information reports, and analyses to support decision making by senior management.
The Department researches new tools and best practices to help the Authority operate as efficiently as
possible, and defines the strategic direction and technical platforms required for current and future needs.
Financial Overview
Expenditures by Account Type ($000)
Financial Review
The FY 2015 operating expense budget for Enterprise Technology Portfolio Management is $3.3 million,
of which $3.3 million is for PS and $0.03 is for OTPS.
PSHC
YTD
ActualsHC
Cur Mod
BudgetHC Budget HC
FY 14 vs
FY 15
Salary F/T 15 1,448 15 1,705 22 1,957 7 251
Salary P/T 0 0 0 0
Seasonal 0 0 0 0
Overtime 0 0 0 0
Shift Differential 0 0 0 0
Fringe 1,203 1,179 1,317 138
Other 21 13 20 7
Subtotal PS 15 2,672 15 2,897 22 3,294 7 397
OTPS
Leases 0 0 0 0
Supplies 1 4 1 (3)
Utilities 0 0 0 0
Equipment 0 0 0 0
Contracts 0 11 10 (0)
Insurance 0 0 0 0
Section 8 Payments 0 0 0 0
Payment in Lieu of Taxes 0 0 0 0
Debt Service 0 0 0 0
Other OTPS 15 21 20 (1)
Subtotal OTPS 16 35 31 (5)
Total Budget 15 2,689 15 2,932 22 3,324 7 392
FY 2013 FY 2014 FY 2015 Variance
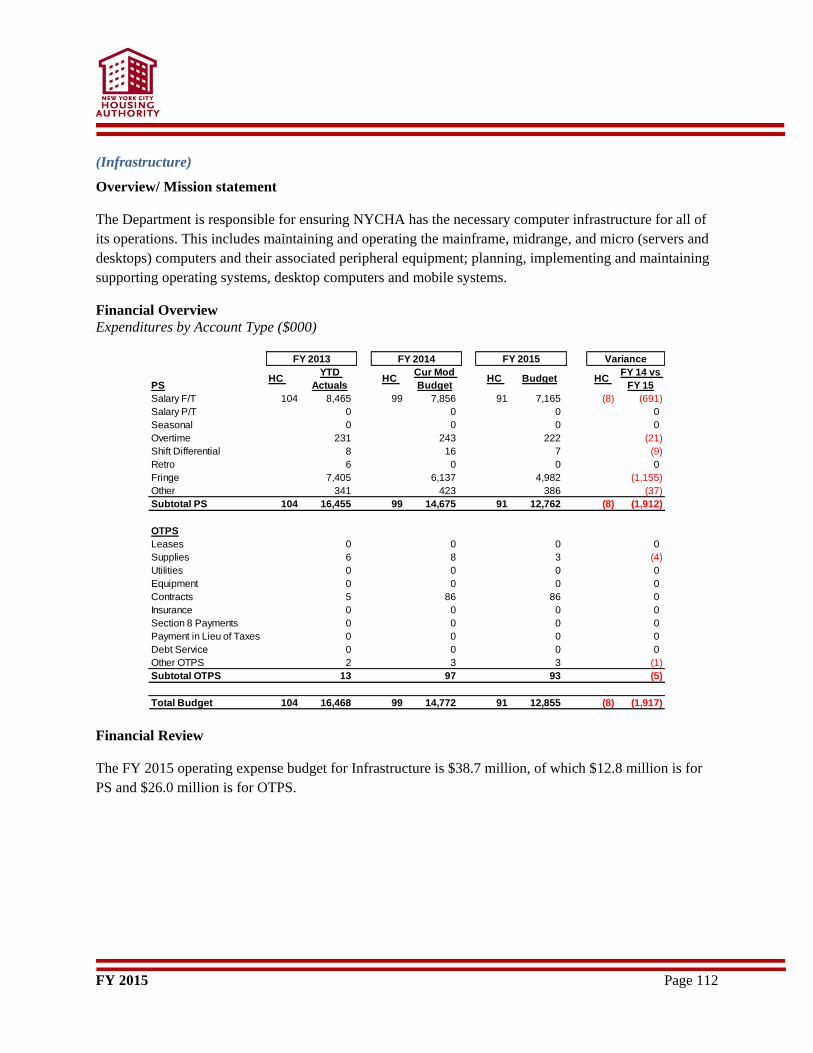
FY 2015 Page 112
(Infrastructure)
Overview/ Mission statement
The Department is responsible for ensuring NYCHA has the necessary computer infrastructure for all of
its operations. This includes maintaining and operating the mainframe, midrange, and micro (servers and
desktops) computers and their associated peripheral equipment; planning, implementing and maintaining
supporting operating systems, desktop computers and mobile systems.
Financial Overview
Expenditures by Account Type ($000)
Financial Review
The FY 2015 operating expense budget for Infrastructure is $38.7 million, of which $12.8 million is for
PS and $26.0 million is for OTPS.
PSHC
YTD
ActualsHC
Cur Mod
BudgetHC Budget HC
FY 14 vs
FY 15
Salary F/T 104 8,465 99 7,856 91 7,165 (8) (691)
Salary P/T 0 0 0 0
Seasonal 0 0 0 0
Overtime 231 243 222 (21)
Shift Differential 8 16 7 (9)
Retro 6 0 0 0
Fringe 7,405 6,137 4,982 (1,155)
Other 341 423 386 (37)
Subtotal PS 104 16,455 99 14,675 91 12,762 (8) (1,912)
OTPS
Leases 0 0 0 0
Supplies 6 8 3 (4)
Utilities 0 0 0 0
Equipment 0 0 0 0
Contracts 5 86 86 0
Insurance 0 0 0 0
Section 8 Payments 0 0 0 0
Payment in Lieu of Taxes 0 0 0 0
Debt Service 0 0 0 0
Other OTPS 2 3 3 (1)
Subtotal OTPS 13 97 93 (5)
Total Budget 104 16,468 99 14,772 91 12,855 (8) (1,917)
FY 2013 FY 2014 FY 2015 Variance
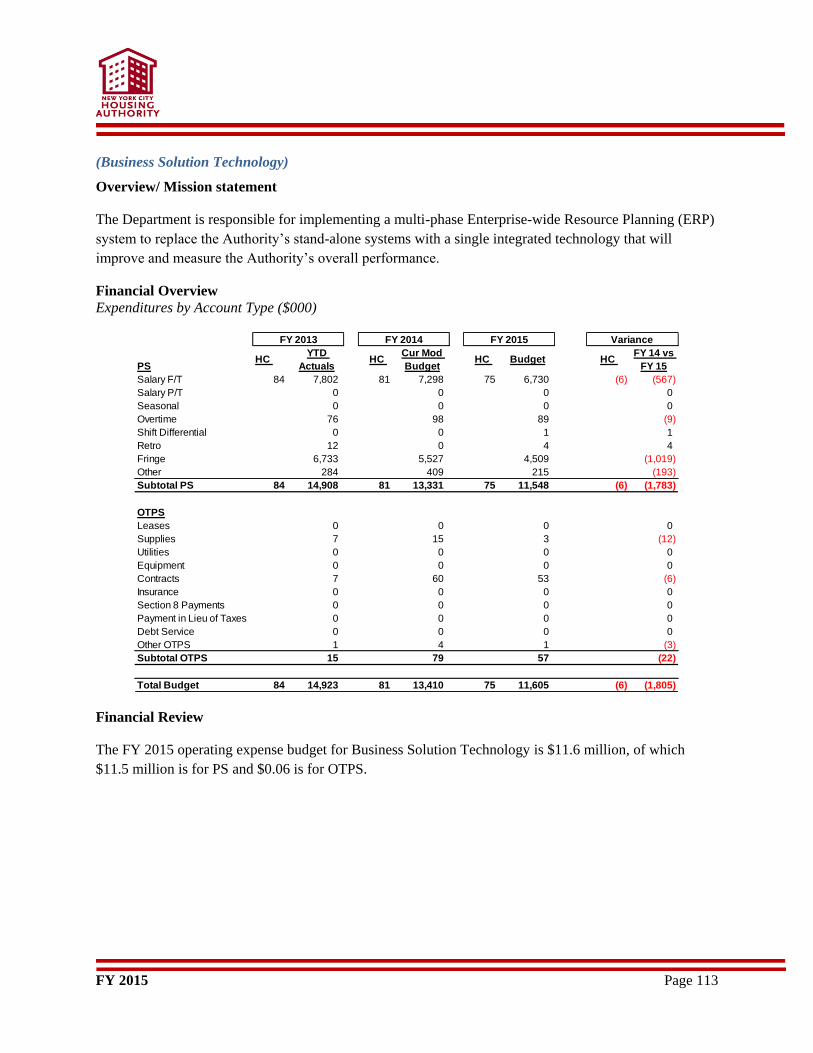
FY 2015 Page 113
(Business Solution Technology)
Overview/ Mission statement
The Department is responsible for implementing a multi-phase Enterprise-wide Resource Planning (ERP)
system to replace the Authority’s stand-alone systems with a single integrated technology that will
improve and measure the Authority’s overall performance.
Financial Overview
Expenditures by Account Type ($000)
Financial Review
The FY 2015 operating expense budget for Business Solution Technology is $11.6 million, of which
$11.5 million is for PS and $0.06 is for OTPS.
PSHC
YTD
ActualsHC
Cur Mod
BudgetHC Budget HC
FY 14 vs
FY 15
Salary F/T 84 7,802 81 7,298 75 6,730 (6) (567)
Salary P/T 0 0 0 0
Seasonal 0 0 0 0
Overtime 76 98 89 (9)
Shift Differential 0 0 1 1
Retro 12 0 4 4
Fringe 6,733 5,527 4,509 (1,019)
Other 284 409 215 (193)
Subtotal PS 84 14,908 81 13,331 75 11,548 (6) (1,783)
OTPS
Leases 0 0 0 0
Supplies 7 15 3 (12)
Utilities 0 0 0 0
Equipment 0 0 0 0
Contracts 7 60 53 (6)
Insurance 0 0 0 0
Section 8 Payments 0 0 0 0
Payment in Lieu of Taxes 0 0 0 0
Debt Service 0 0 0 0
Other OTPS 1 4 1 (3)
Subtotal OTPS 15 79 57 (22)
Total Budget 84 14,923 81 13,410 75 11,605 (6) (1,805)
FY 2013 FY 2014 FY 2015 Variance
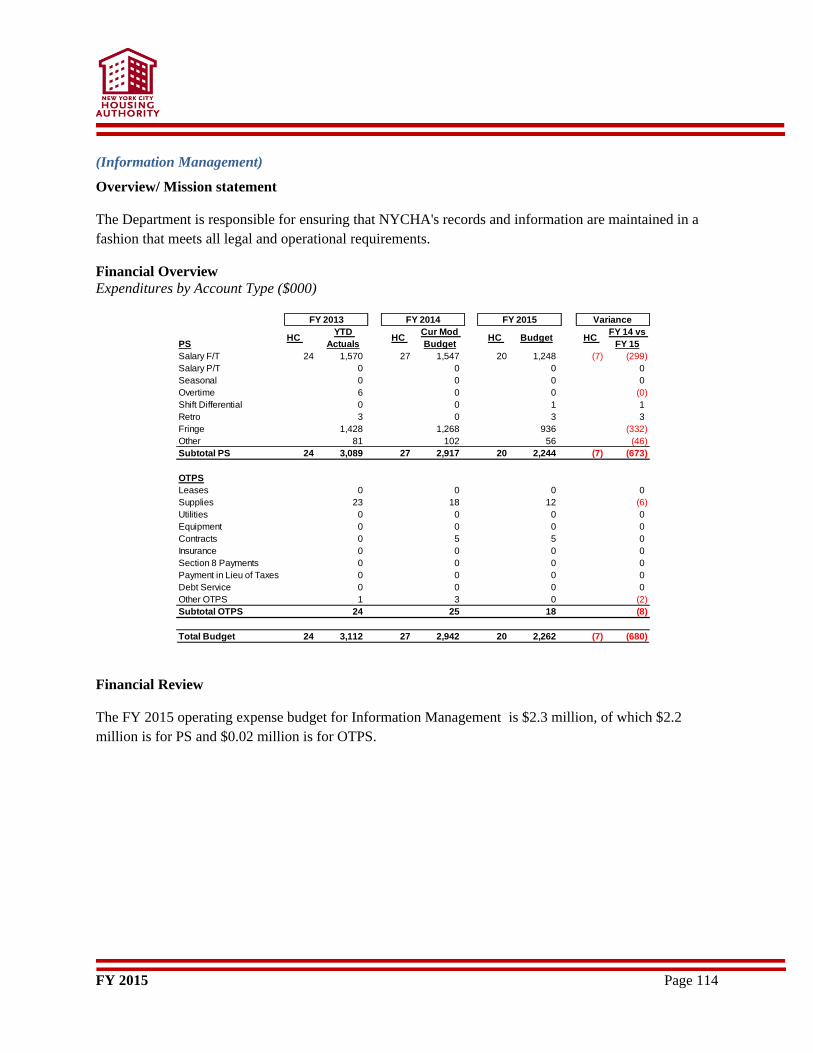
FY 2015 Page 114
(Information Management)
Overview/ Mission statement
The Department is responsible for ensuring that NYCHA's records and information are maintained in a
fashion that meets all legal and operational requirements.
Financial Overview
Expenditures by Account Type ($000)
Financial Review
The FY 2015 operating expense budget for Information Management is $2.3 million, of which $2.2
million is for PS and $0.02 million is for OTPS.
PSHC
YTD
ActualsHC
Cur Mod
BudgetHC Budget HC
FY 14 vs
FY 15
Salary F/T 24 1,570 27 1,547 20 1,248 (7) (299)
Salary P/T 0 0 0 0
Seasonal 0 0 0 0
Overtime 6 0 0 (0)
Shift Differential 0 0 1 1
Retro 3 0 3 3
Fringe 1,428 1,268 936 (332)
Other 81 102 56 (46)
Subtotal PS 24 3,089 27 2,917 20 2,244 (7) (673)
OTPS
Leases 0 0 0 0
Supplies 23 18 12 (6)
Utilities 0 0 0 0
Equipment 0 0 0 0
Contracts 0 5 5 0
Insurance 0 0 0 0
Section 8 Payments 0 0 0 0
Payment in Lieu of Taxes 0 0 0 0
Debt Service 0 0 0 0
Other OTPS 1 3 0 (2)
Subtotal OTPS 24 25 18 (8)
Total Budget 24 3,112 27 2,942 20 2,262 (7) (680)
FY 2013 FY 2014 FY 2015 Variance
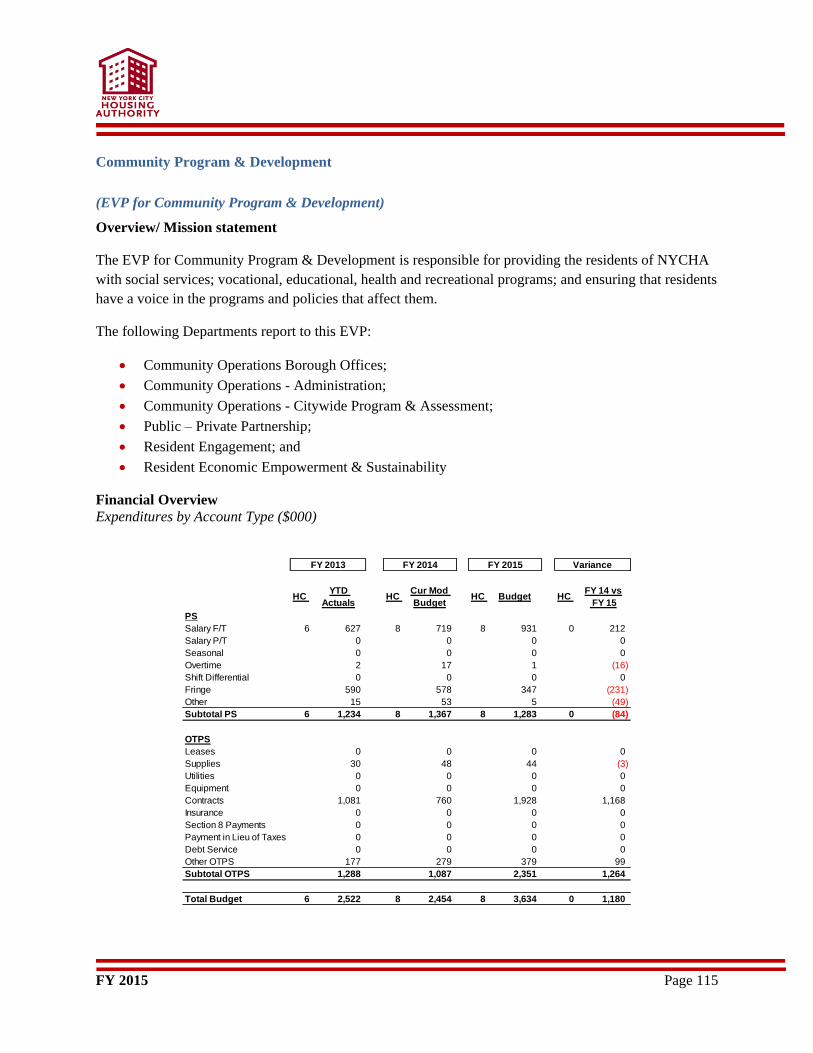
FY 2015 Page 115
Community Program & Development
(EVP for Community Program & Development)
Overview/ Mission statement
The EVP for Community Program & Development is responsible for providing the residents of NYCHA
with social services; vocational, educational, health and recreational programs; and ensuring that residents
have a voice in the programs and policies that affect them.
The following Departments report to this EVP:
Community Operations Borough Offices;
Community Operations - Administration;
Community Operations - Citywide Program & Assessment;
Public – Private Partnership;
Resident Engagement; and
Resident Economic Empowerment & Sustainability
Financial Overview
Expenditures by Account Type ($000)
PS
HC YTD
ActualsHC
Cur Mod
BudgetHC Budget HC
FY 14 vs
FY 15
Salary F/T 6 627 8 719 8 931 0 212
Salary P/T 0 0 0 0
Seasonal 0 0 0 0
Overtime 2 17 1 (16)
Shift Differential 0 0 0 0
Fringe 590 578 347 (231)
Other 15 53 5 (49)
Subtotal PS 6 1,234 8 1,367 8 1,283 0 (84)
OTPS
Leases 0 0 0 0
Supplies 30 48 44 (3)
Utilities 0 0 0 0
Equipment 0 0 0 0
Contracts 1,081 760 1,928 1,168
Insurance 0 0 0 0
Section 8 Payments 0 0 0 0
Payment in Lieu of Taxes 0 0 0 0
Debt Service 0 0 0 0
Other OTPS 177 279 379 99
Subtotal OTPS 1,288 1,087 2,351 1,264
Total Budget 6 2,522 8 2,454 8 3,634 0 1,180
FY 2013 FY 2014 FY 2015 Variance

FY 2015 Page 116
Financial Review
The FY 2015 operating expense budget for EVP for Community Program & Development is $3.6 million,
of which $1.3 million is for PS and $2.4 million is for OTPS.
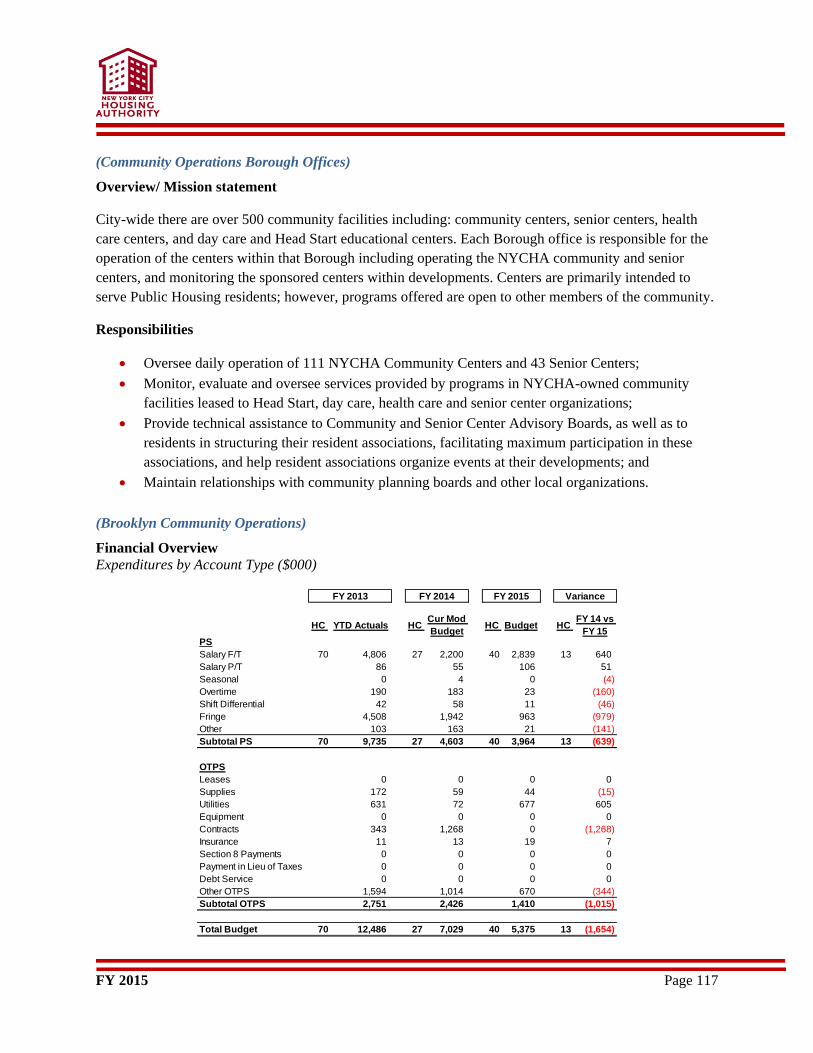
FY 2015 Page 117
(Community Operations Borough Offices)
Overview/ Mission statement
City-wide there are over 500 community facilities including: community centers, senior centers, health
care centers, and day care and Head Start educational centers. Each Borough office is responsible for the
operation of the centers within that Borough including operating the NYCHA community and senior
centers, and monitoring the sponsored centers within developments. Centers are primarily intended to
serve Public Housing residents; however, programs offered are open to other members of the community.
Responsibilities
Oversee daily operation of 111 NYCHA Community Centers and 43 Senior Centers;
Monitor, evaluate and oversee services provided by programs in NYCHA-owned community
facilities leased to Head Start, day care, health care and senior center organizations;
Provide technical assistance to Community and Senior Center Advisory Boards, as well as to
residents in structuring their resident associations, facilitating maximum participation in these
associations, and help resident associations organize events at their developments; and
Maintain relationships with community planning boards and other local organizations.
(Brooklyn Community Operations)
Financial Overview
Expenditures by Account Type ($000)
PS
HC YTD Actuals HC Cur Mod
BudgetHC Budget HC
FY 14 vs
FY 15
Salary F/T 70 4,806 27 2,200 40 2,839 13 640
Salary P/T 86 55 106 51
Seasonal 0 4 0 (4)
Overtime 190 183 23 (160)
Shift Differential 42 58 11 (46)
Fringe 4,508 1,942 963 (979)
Other 103 163 21 (141)
Subtotal PS 70 9,735 27 4,603 40 3,964 13 (639)
OTPS
Leases 0 0 0 0
Supplies 172 59 44 (15)
Utilities 631 72 677 605
Equipment 0 0 0 0
Contracts 343 1,268 0 (1,268)
Insurance 11 13 19 7
Section 8 Payments 0 0 0 0
Payment in Lieu of Taxes 0 0 0 0
Debt Service 0 0 0 0
Other OTPS 1,594 1,014 670 (344)
Subtotal OTPS 2,751 2,426 1,410 (1,015)
Total Budget 70 12,486 27 7,029 40 5,375 13 (1,654)
FY 2013 FY 2014 FY 2015 Variance

FY 2015 Page 118
Financial Review
The FY 2015 operating expense budget for Brooklyn Community Operations is $5.4 million, of which
$4.0 million is for PS and $1.4 million is for OTPS.
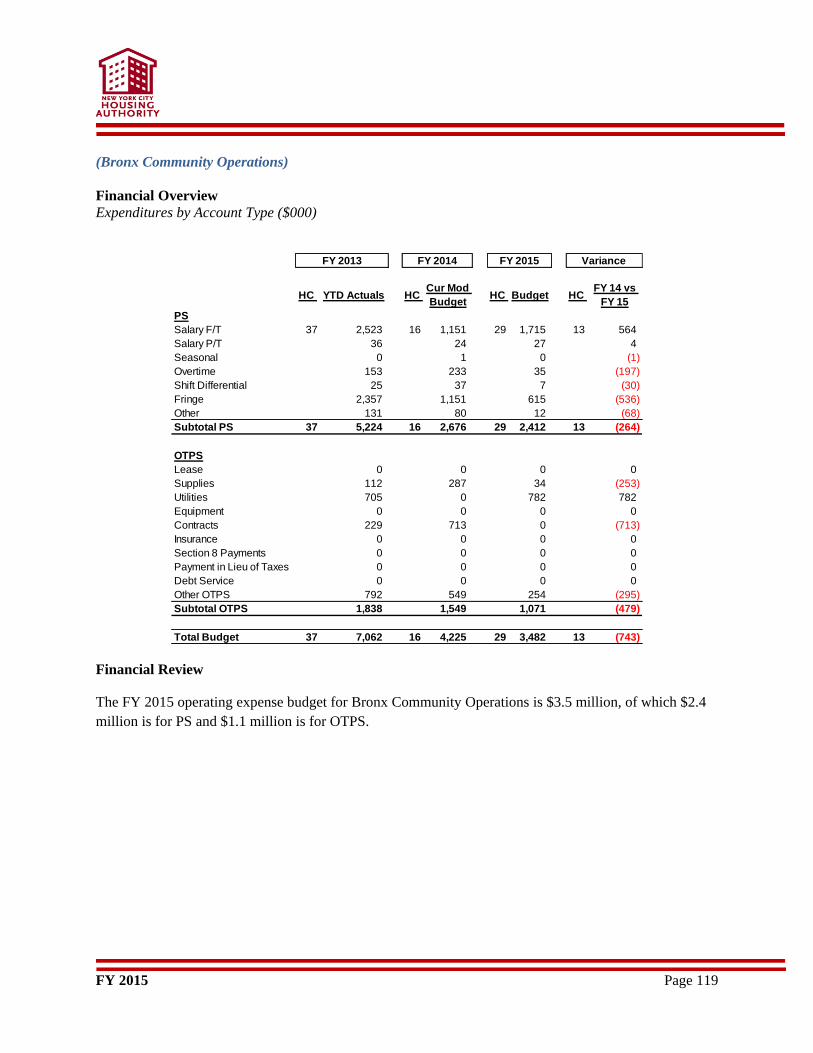
FY 2015 Page 119
(Bronx Community Operations)
Financial Overview
Expenditures by Account Type ($000)
Financial Review
The FY 2015 operating expense budget for Bronx Community Operations is $3.5 million, of which $2.4
million is for PS and $1.1 million is for OTPS.
PS
HC YTD Actuals HC Cur Mod
BudgetHC Budget HC
FY 14 vs
FY 15
Salary F/T 37 2,523 16 1,151 29 1,715 13 564
Salary P/T 36 24 27 4
Seasonal 0 1 0 (1)
Overtime 153 233 35 (197)
Shift Differential 25 37 7 (30)
Fringe 2,357 1,151 615 (536)
Other 131 80 12 (68)
Subtotal PS 37 5,224 16 2,676 29 2,412 13 (264)
OTPS
Lease 0 0 0 0
Supplies 112 287 34 (253)
Utilities 705 0 782 782
Equipment 0 0 0 0
Contracts 229 713 0 (713)
Insurance 0 0 0 0
Section 8 Payments 0 0 0 0
Payment in Lieu of Taxes 0 0 0 0
Debt Service 0 0 0 0
Other OTPS 792 549 254 (295)
Subtotal OTPS 1,838 1,549 1,071 (479)
Total Budget 37 7,062 16 4,225 29 3,482 13 (743)
FY 2013 FY 2014 FY 2015 Variance
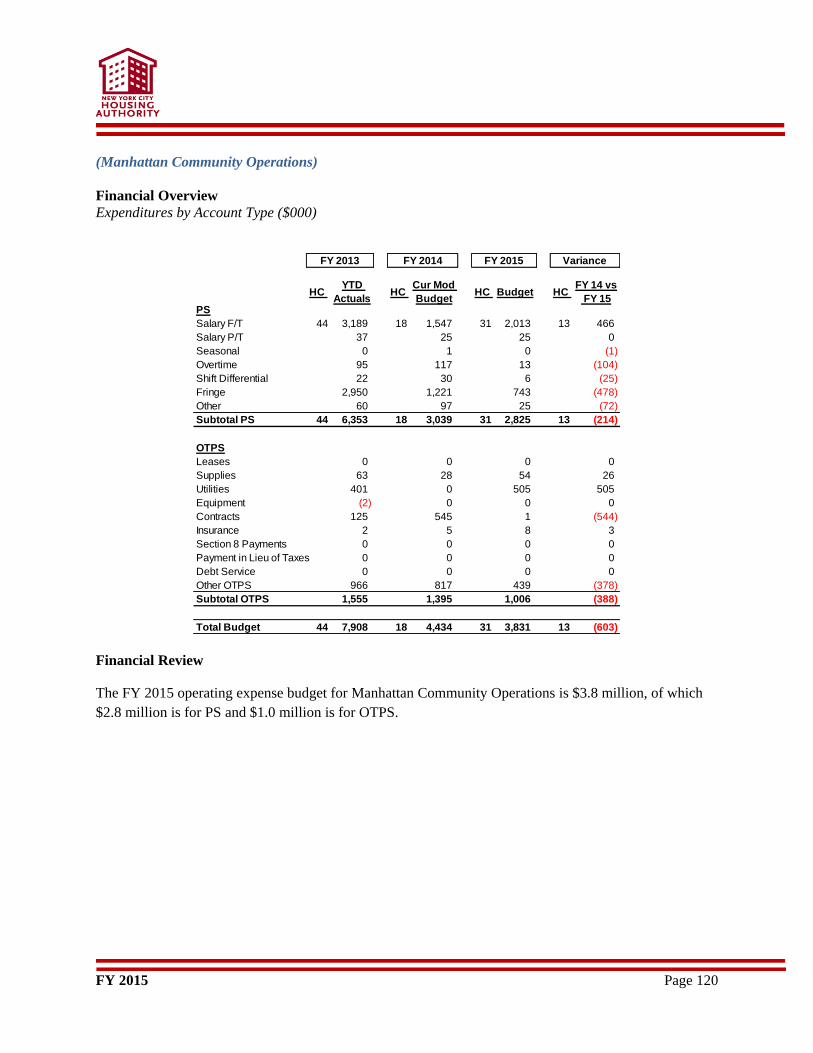
FY 2015 Page 120
(Manhattan Community Operations)
Financial Overview
Expenditures by Account Type ($000)
Financial Review
The FY 2015 operating expense budget for Manhattan Community Operations is $3.8 million, of which
$2.8 million is for PS and $1.0 million is for OTPS.
PS
HC YTD
ActualsHC
Cur Mod
BudgetHC Budget HC
FY 14 vs
FY 15
Salary F/T 44 3,189 18 1,547 31 2,013 13 466
Salary P/T 37 25 25 0
Seasonal 0 1 0 (1)
Overtime 95 117 13 (104)
Shift Differential 22 30 6 (25)
Fringe 2,950 1,221 743 (478)
Other 60 97 25 (72)
Subtotal PS 44 6,353 18 3,039 31 2,825 13 (214)
OTPS
Leases 0 0 0 0
Supplies 63 28 54 26
Utilities 401 0 505 505
Equipment (2) 0 0 0
Contracts 125 545 1 (544)
Insurance 2 5 8 3
Section 8 Payments 0 0 0 0
Payment in Lieu of Taxes 0 0 0 0
Debt Service 0 0 0 0
Other OTPS 966 817 439 (378)
Subtotal OTPS 1,555 1,395 1,006 (388)
Total Budget 44 7,908 18 4,434 31 3,831 13 (603)
FY 2013 FY 2014 FY 2015 Variance
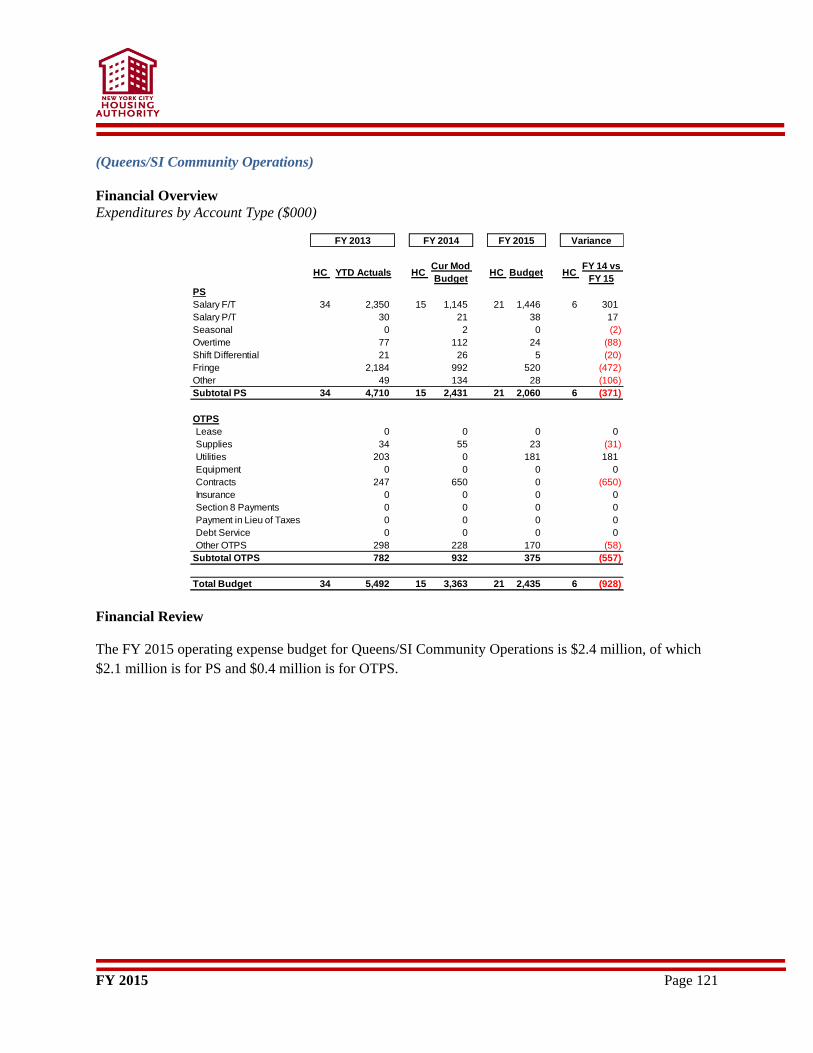
FY 2015 Page 121
(Queens/SI Community Operations)
Financial Overview
Expenditures by Account Type ($000)
Financial Review
The FY 2015 operating expense budget for Queens/SI Community Operations is $2.4 million, of which
$2.1 million is for PS and $0.4 million is for OTPS.
PS
HC YTD Actuals HC Cur Mod
BudgetHC Budget HC
FY 14 vs
FY 15
Salary F/T 34 2,350 15 1,145 21 1,446 6 301
Salary P/T 30 21 38 17
Seasonal 0 2 0 (2)
Overtime 77 112 24 (88)
Shift Differential 21 26 5 (20)
Fringe 2,184 992 520 (472)
Other 49 134 28 (106)
Subtotal PS 34 4,710 15 2,431 21 2,060 6 (371)
OTPS
Lease 0 0 0 0
Supplies 34 55 23 (31)
Utilities 203 0 181 181
Equipment 0 0 0 0
Contracts 247 650 0 (650)
Insurance 0 0 0 0
Section 8 Payments 0 0 0 0
Payment in Lieu of Taxes 0 0 0 0
Debt Service 0 0 0 0
Other OTPS 298 228 170 (58)
Subtotal OTPS 782 932 375 (557)
Total Budget 34 5,492 15 3,363 21 2,435 6 (928)
FY 2013 FY 2014 FY 2015 Variance
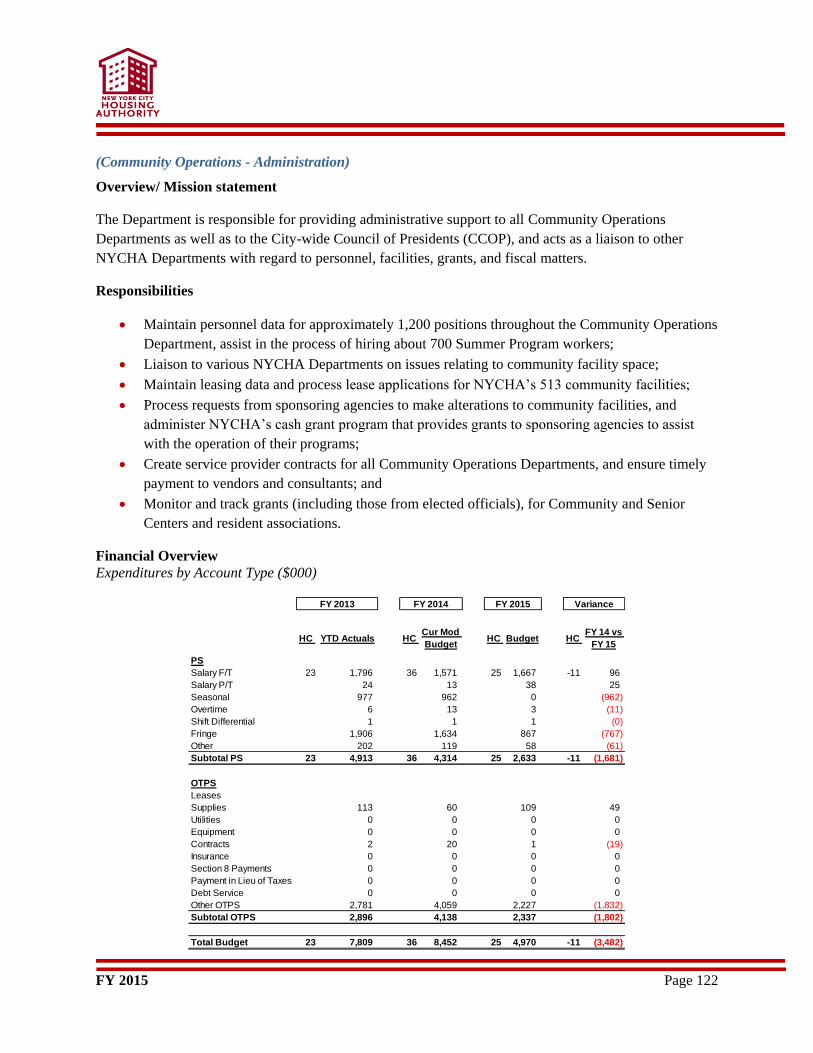
FY 2015 Page 122
(Community Operations - Administration)
Overview/ Mission statement
The Department is responsible for providing administrative support to all Community Operations
Departments as well as to the City-wide Council of Presidents (CCOP), and acts as a liaison to other
NYCHA Departments with regard to personnel, facilities, grants, and fiscal matters.
Responsibilities
Maintain personnel data for approximately 1,200 positions throughout the Community Operations
Department, assist in the process of hiring about 700 Summer Program workers;
Liaison to various NYCHA Departments on issues relating to community facility space;
Maintain leasing data and process lease applications for NYCHA’s 513 community facilities;
Process requests from sponsoring agencies to make alterations to community facilities, and
administer NYCHA’s cash grant program that provides grants to sponsoring agencies to assist
with the operation of their programs;
Create service provider contracts for all Community Operations Departments, and ensure timely
payment to vendors and consultants; and
Monitor and track grants (including those from elected officials), for Community and Senior
Centers and resident associations.
Financial Overview
Expenditures by Account Type ($000)
PS
HC YTD Actuals HC Cur Mod
BudgetHC Budget HC
FY 14 vs
FY 15
Salary F/T 23 1,796 36 1,571 25 1,667 -11 96
Salary P/T 24 13 38 25
Seasonal 977 962 0 (962)
Overtime 6 13 3 (11)
Shift Differential 1 1 1 (0)
Fringe 1,906 1,634 867 (767)
Other 202 119 58 (61)
Subtotal PS 23 4,913 36 4,314 25 2,633 -11 (1,681)
OTPS
Leases
Supplies 113 60 109 49
Utilities 0 0 0 0
Equipment 0 0 0 0
Contracts 2 20 1 (19)
Insurance 0 0 0 0
Section 8 Payments 0 0 0 0
Payment in Lieu of Taxes 0 0 0 0
Debt Service 0 0 0 0
Other OTPS 2,781 4,059 2,227 (1,832)
Subtotal OTPS 2,896 4,138 2,337 (1,802)
Total Budget 23 7,809 36 8,452 25 4,970 -11 (3,482)
FY 2013 FY 2014 FY 2015 Variance

FY 2015 Page 123
Financial Review
The FY 2015 operating expense budget for Community Operations – Administration is $5.0 million, of
which $2.6 million is for PS and $2.3 million is for OTPS.
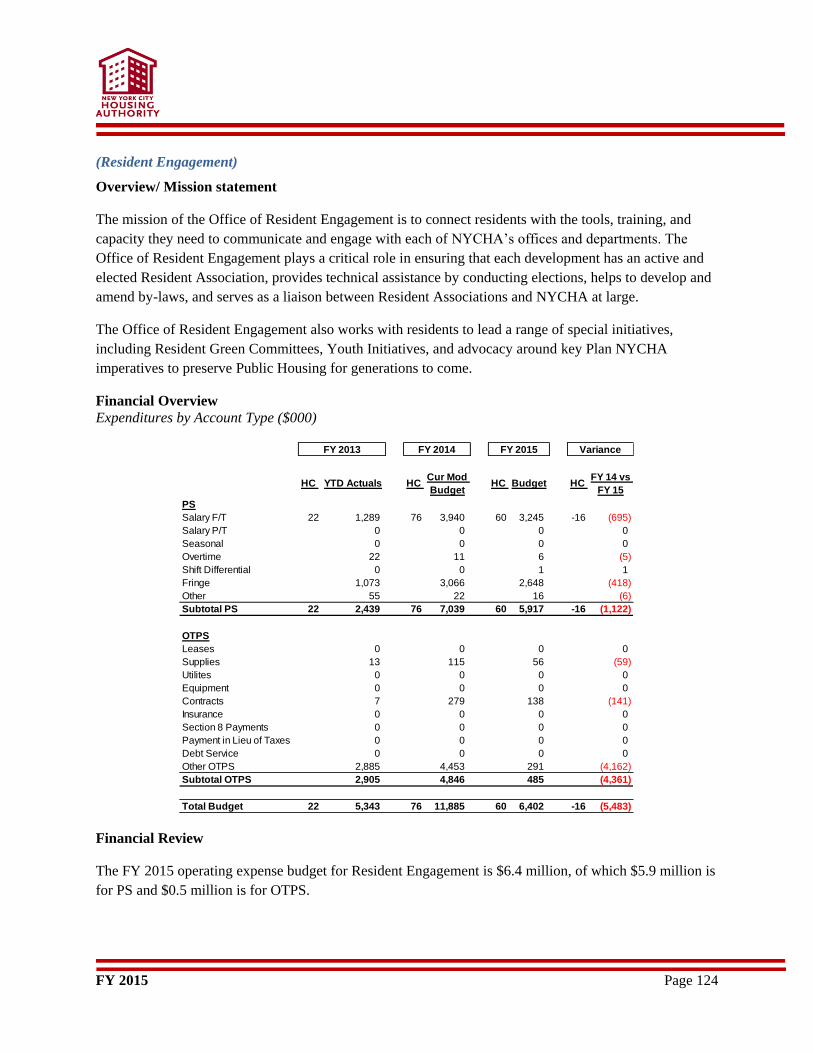
FY 2015 Page 124
(Resident Engagement)
Overview/ Mission statement
The mission of the Office of Resident Engagement is to connect residents with the tools, training, and
capacity they need to communicate and engage with each of NYCHA’s offices and departments. The
Office of Resident Engagement plays a critical role in ensuring that each development has an active and
elected Resident Association, provides technical assistance by conducting elections, helps to develop and
amend by-laws, and serves as a liaison between Resident Associations and NYCHA at large.
The Office of Resident Engagement also works with residents to lead a range of special initiatives,
including Resident Green Committees, Youth Initiatives, and advocacy around key Plan NYCHA
imperatives to preserve Public Housing for generations to come.
Financial Overview
Expenditures by Account Type ($000)
Financial Review
The FY 2015 operating expense budget for Resident Engagement is $6.4 million, of which $5.9 million is
for PS and $0.5 million is for OTPS.
PS
HC YTD Actuals HC Cur Mod
BudgetHC Budget HC
FY 14 vs
FY 15
Salary F/T 22 1,289 76 3,940 60 3,245 -16 (695)
Salary P/T 0 0 0 0
Seasonal 0 0 0 0
Overtime 22 11 6 (5)
Shift Differential 0 0 1 1
Fringe 1,073 3,066 2,648 (418)
Other 55 22 16 (6)
Subtotal PS 22 2,439 76 7,039 60 5,917 -16 (1,122)
OTPS
Leases 0 0 0 0
Supplies 13 115 56 (59)
Utilites 0 0 0 0
Equipment 0 0 0 0
Contracts 7 279 138 (141)
Insurance 0 0 0 0
Section 8 Payments 0 0 0 0
Payment in Lieu of Taxes 0 0 0 0
Debt Service 0 0 0 0
Other OTPS 2,885 4,453 291 (4,162)
Subtotal OTPS 2,905 4,846 485 (4,361)
Total Budget 22 5,343 76 11,885 60 6,402 -16 (5,483)
FY 2013 FY 2014 FY 2015 Variance
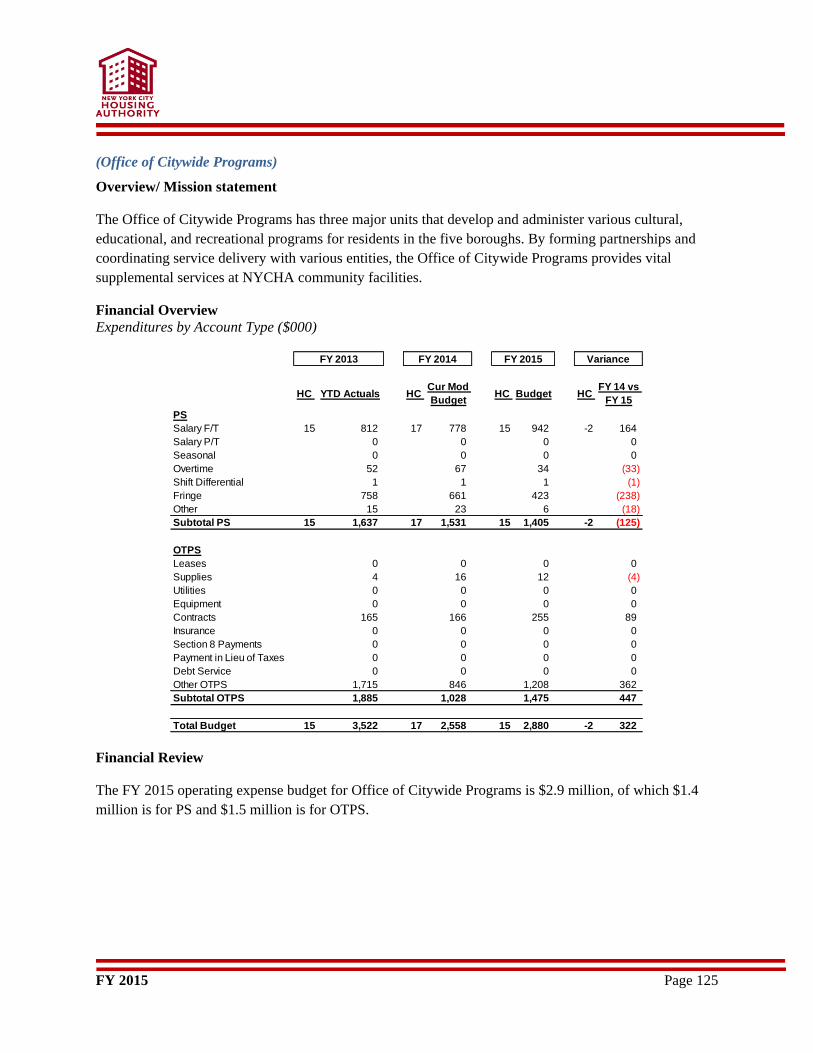
FY 2015 Page 125
(Office of Citywide Programs)
Overview/ Mission statement
The Office of Citywide Programs has three major units that develop and administer various cultural,
educational, and recreational programs for residents in the five boroughs. By forming partnerships and
coordinating service delivery with various entities, the Office of Citywide Programs provides vital
supplemental services at NYCHA community facilities.
Financial Overview
Expenditures by Account Type ($000)
Financial Review
The FY 2015 operating expense budget for Office of Citywide Programs is $2.9 million, of which $1.4
million is for PS and $1.5 million is for OTPS.
PS
HC YTD Actuals HC Cur Mod
BudgetHC Budget HC
FY 14 vs
FY 15
Salary F/T 15 812 17 778 15 942 -2 164
Salary P/T 0 0 0 0
Seasonal 0 0 0 0
Overtime 52 67 34 (33)
Shift Differential 1 1 1 (1)
Fringe 758 661 423 (238)
Other 15 23 6 (18)
Subtotal PS 15 1,637 17 1,531 15 1,405 -2 (125)
OTPS
Leases 0 0 0 0
Supplies 4 16 12 (4)
Utilities 0 0 0 0
Equipment 0 0 0 0
Contracts 165 166 255 89
Insurance 0 0 0 0
Section 8 Payments 0 0 0 0
Payment in Lieu of Taxes 0 0 0 0
Debt Service 0 0 0 0
Other OTPS 1,715 846 1,208 362
Subtotal OTPS 1,885 1,028 1,475 447
Total Budget 15 3,522 17 2,558 15 2,880 -2 322
FY 2013 FY 2014 FY 2015 Variance
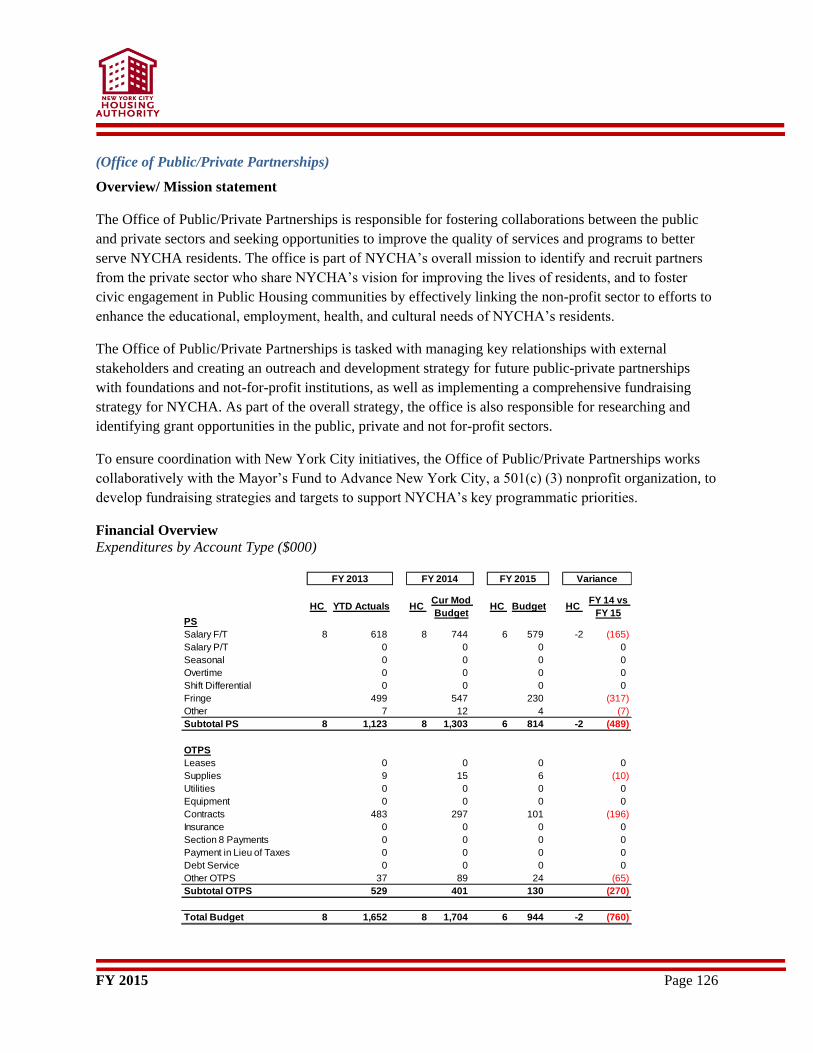
FY 2015 Page 126
(Office of Public/Private Partnerships)
Overview/ Mission statement
The Office of Public/Private Partnerships is responsible for fostering collaborations between the public
and private sectors and seeking opportunities to improve the quality of services and programs to better
serve NYCHA residents. The office is part of NYCHA’s overall mission to identify and recruit partners
from the private sector who share NYCHA’s vision for improving the lives of residents, and to foster
civic engagement in Public Housing communities by effectively linking the non-profit sector to efforts to
enhance the educational, employment, health, and cultural needs of NYCHA’s residents.
The Office of Public/Private Partnerships is tasked with managing key relationships with external
stakeholders and creating an outreach and development strategy for future public-private partnerships
with foundations and not-for-profit institutions, as well as implementing a comprehensive fundraising
strategy for NYCHA. As part of the overall strategy, the office is also responsible for researching and
identifying grant opportunities in the public, private and not for-profit sectors.
To ensure coordination with New York City initiatives, the Office of Public/Private Partnerships works
collaboratively with the Mayor’s Fund to Advance New York City, a 501(c) (3) nonprofit organization, to
develop fundraising strategies and targets to support NYCHA’s key programmatic priorities.
Financial Overview
Expenditures by Account Type ($000)
PS
HC YTD Actuals HC Cur Mod
BudgetHC Budget HC
FY 14 vs
FY 15
Salary F/T 8 618 8 744 6 579 -2 (165)
Salary P/T 0 0 0 0
Seasonal 0 0 0 0
Overtime 0 0 0 0
Shift Differential 0 0 0 0
Fringe 499 547 230 (317)
Other 7 12 4 (7)
Subtotal PS 8 1,123 8 1,303 6 814 -2 (489)
OTPS
Leases 0 0 0 0
Supplies 9 15 6 (10)
Utilities 0 0 0 0
Equipment 0 0 0 0
Contracts 483 297 101 (196)
Insurance 0 0 0 0
Section 8 Payments 0 0 0 0
Payment in Lieu of Taxes 0 0 0 0
Debt Service 0 0 0 0
Other OTPS 37 89 24 (65)
Subtotal OTPS 529 401 130 (270)
Total Budget 8 1,652 8 1,704 6 944 -2 (760)
FY 2013 FY 2014 FY 2015 Variance

FY 2015 Page 127
Financial Review
The FY 2015 operating expense budget for Office of Public/Private Partnerships is $0.9 million, of which
$0.8 million is for PS and $0.1 million is for OTPS.
FY 2015 Page 128
(Resident Economic Empowerment & Sustainability)
Overview/ Mission statement
The Office of Resident Economic Empowerment and Sustainability (REES) develops and implements
programs, policies, and collaborations to measurably support increased economic opportunities for
residents with a focus on employment and advancement, financial literacy and asset building, adult
education and training, and business development.
In alignment with Plan NYCHA, NYCHA’s roadmap to preserving Public Housing in New York City,
REES coordinates and facilitates greater access to economic opportunity for NYCHA residents by
creating partnerships with high-quality economic opportunity service providers. REES executes its work
through an outcome-driven resident economic opportunity platform, the Zone Model, which is focused on
service coordination, strategic partnerships, leveraging localized external resources and services. This
multi-pronged approach includes:
Collaborating with economic opportunity service providers around outcome-focused projects
Providing additional capacity and technical assistance to economic opportunity service providers
to better support NYCHA residents in reaching their goals
Driving additional public and private investment into Public Housing neighborhoods to support
outcomes for NYCHA residents including supporting the replication of proven economic
opportunity models where resources don’t currently exist as well as testing new approaches
Building a learning community across New York City that develops expertise around supporting
Public Housing residents to reach their economic goals. The learning community within and
across NYCHA
Zones will test, implement, iterate and replicate best practices in collaboration with residents and
other Stakeholders. Discoveries, best practices, and challenges will be codified and shared across
the network.
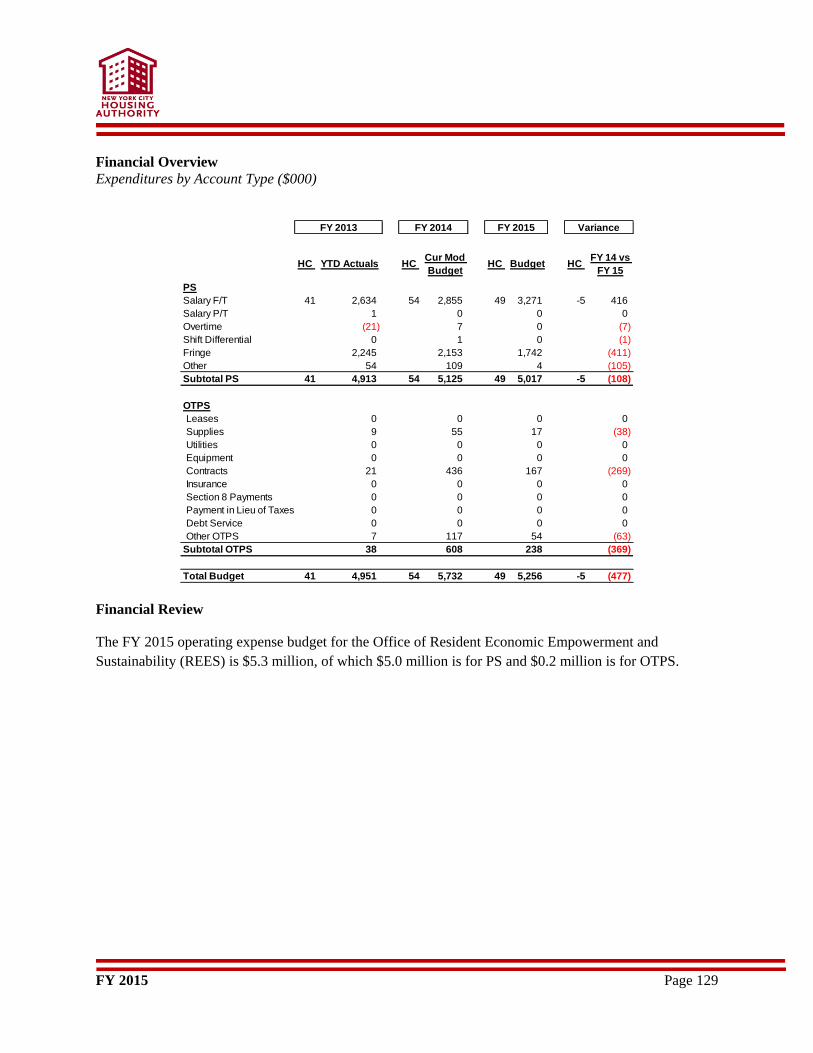
FY 2015 Page 129
Financial Overview
Expenditures by Account Type ($000)
Financial Review
The FY 2015 operating expense budget for the Office of Resident Economic Empowerment and
Sustainability (REES) is $5.3 million, of which $5.0 million is for PS and $0.2 million is for OTPS.
PS
HC YTD Actuals HC Cur Mod
BudgetHC Budget HC
FY 14 vs
FY 15
Salary F/T 41 2,634 54 2,855 49 3,271 -5 416
Salary P/T 1 0 0 0
Overtime (21) 7 0 (7)
Shift Differential 0 1 0 (1)
Fringe 2,245 2,153 1,742 (411)
Other 54 109 4 (105)
Subtotal PS 41 4,913 54 5,125 49 5,017 -5 (108)
OTPS
Leases 0 0 0 0
Supplies 9 55 17 (38)
Utilities 0 0 0 0
Equipment 0 0 0 0
Contracts 21 436 167 (269)
Insurance 0 0 0 0
Section 8 Payments 0 0 0 0
Payment in Lieu of Taxes 0 0 0 0
Debt Service 0 0 0 0
Other OTPS 7 117 54 (63)
Subtotal OTPS 38 608 238 (369)
Total Budget 41 4,951 54 5,732 49 5,256 -5 (477)
FY 2013 FY 2014 FY 2015 Variance
FY 2015 Page 130
Leased Housing
(EVP for Leased Housing)
Overview/ Mission statement
The newly created EVP for Leased Housing (LHD) administers NYCHA’s Housing Choice Voucher
Program (Section 8). Under this federally-funded program, NYCHA makes rent subsidy payments to
eligible families authorized to lease privately-owned apartments that meet prescribed Housing Quality
Standards (HQS).
The Section 8 Program provides a rent subsidy, allowing families to pay a reasonable share of the rent
with government subsidies making up the difference, up to a maximum amount called the payment
standard. The subsidy paid to the landlord (or the housing assistance payment) is usually the difference
between thirty percent of the household’s total adjusted gross income and the contract rent approved by
NYCHA for the apartment.
The following Departments report to this EVP:
Inspections and Central Office;
Leased Housing Finance;
Internal Assessment ;
Quality Assurance & Performance Management;
Policy & Program Administration and
Client Services
Responsibilities
Inspections and Central Office :
At the Waters Place office staff are responsible for annual, transfer and special HQS
scheduling and inspections, owner certification of repairs, rent abatements, terminations,
and Public Housing assessments. At the Central Office locations staff are responsible for
fraud, repayment collections, EIV deceased tenants, OIG case research, City/State (LLC)
Inspections scheduling and compliance, portability billing and ports annual
recertification, eviction review unit, Landlord extranet oversight and landlord customer
services, and Project Based Voucher (PVB) contract administration,
Leased Housing Finance:
This unit is responsible oversight of all revenue and expenses analysis for LHD, monthly
HAP payments to owners, QC review of payment adjustments, check run preparation,
change of ownership, voided checks, payment suspensions monitoring, direct deposit,
program forecasts and utilization performance reports, cost allocations, Financial
Management (FMC) reporting, liaison with HR handling all personnel changes, new
vendor creation, ports billing and receivables,
FY 2015 Page 131
Internal Assessment
This unit is responsible for scheduling and performing annual inspections for Public
Housing units.
Quality Assurance & Performance Management:
This unit is responsible for quality assurance reviews, Section 8 Management Assessment
Program (SEMAP) monitoring and reporting, HUD submissions and corrections,
business process redesign, ad hoc QC reviews, statistical reporting, newsletter
publication, department procedures revisions and maintenance, QC training, project
management for systems upgrades, and audit coordination for HUD and Ernst & Young.
Policy & Program Administration:
The policy and administration group at the Church Street location is responsible for
oversight of Section 8 policy review, administrative plan, Legal Department liaison, and
Reasonable Accommodation coordination services. The Brooklyn and Queens offices
are responsible for customer service, briefings and transfers, terminations review,
emergency and routine transfer requests review, customer correspondence, new program
admissions, criminal background check processing, restorations to the program, Court
Unit which responds to subpoenas and court appearances, port out requests, Veteran
Affairs Supportive Housing (VASH) coordination, unclassified documents processing,
tenant service requests and informal conferences.
Client Services:
Responsible for scheduling and completion of annual client recertification, owner rent
increase requests, commissioner’s orders, major capital improvements and J51’s, rent
reasonableness reviews, tenant briefings and transfers, interim adjustments, terminations
customer service, and informal conferences.
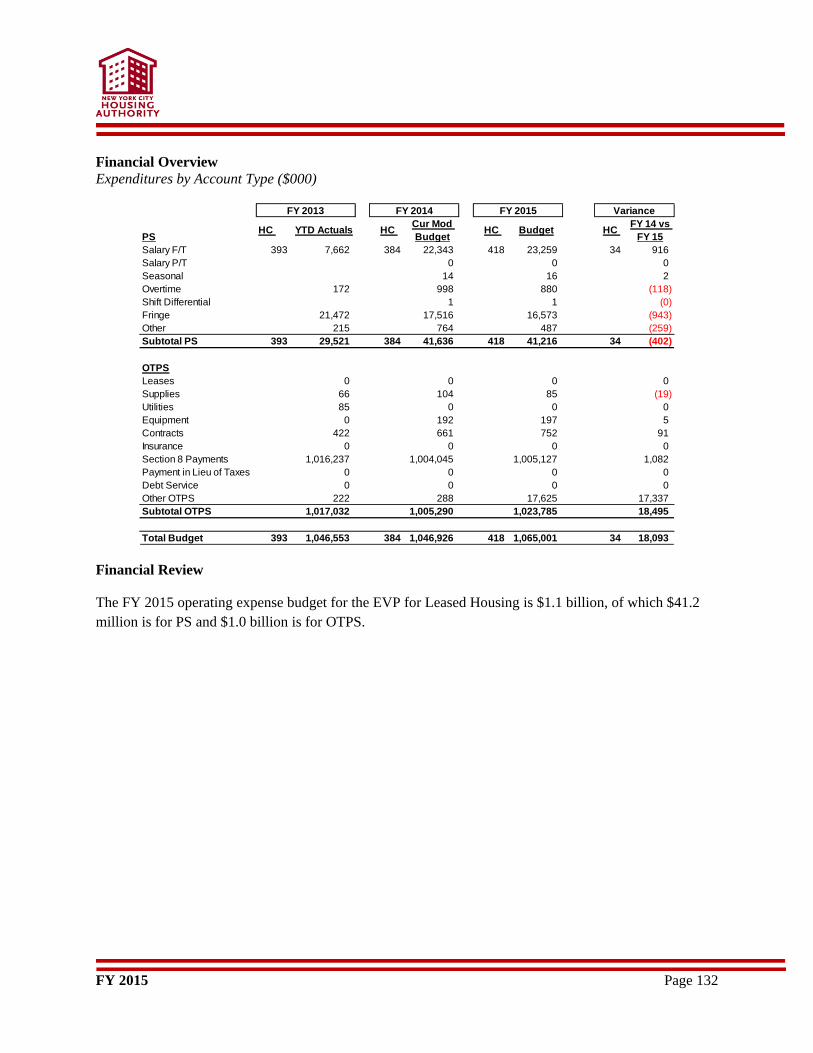
FY 2015 Page 132
Financial Overview
Expenditures by Account Type ($000)
Financial Review
The FY 2015 operating expense budget for the EVP for Leased Housing is $1.1 billion, of which $41.2
million is for PS and $1.0 billion is for OTPS.
PSHC YTD Actuals HC
Cur Mod
BudgetHC Budget HC
FY 14 vs
FY 15
Salary F/T 393 7,662 384 22,343 418 23,259 34 916
Salary P/T 0 0 0
Seasonal 14 16 2
Overtime 172 998 880 (118)
Shift Differential 1 1 (0)
Fringe 21,472 17,516 16,573 (943)
Other 215 764 487 (259)
Subtotal PS 393 29,521 384 41,636 418 41,216 34 (402)
OTPS
Leases 0 0 0 0
Supplies 66 104 85 (19)
Utilities 85 0 0 0
Equipment 0 192 197 5
Contracts 422 661 752 91
Insurance 0 0 0 0
Section 8 Payments 1,016,237 1,004,045 1,005,127 1,082
Payment in Lieu of Taxes 0 0 0 0
Debt Service 0 0 0 0
Other OTPS 222 288 17,625 17,337
Subtotal OTPS 1,017,032 1,005,290 1,023,785 18,495
Total Budget 393 1,046,553 384 1,046,926 418 1,065,001 34 18,093
FY 2013 FY 2014 FY 2015 Variance
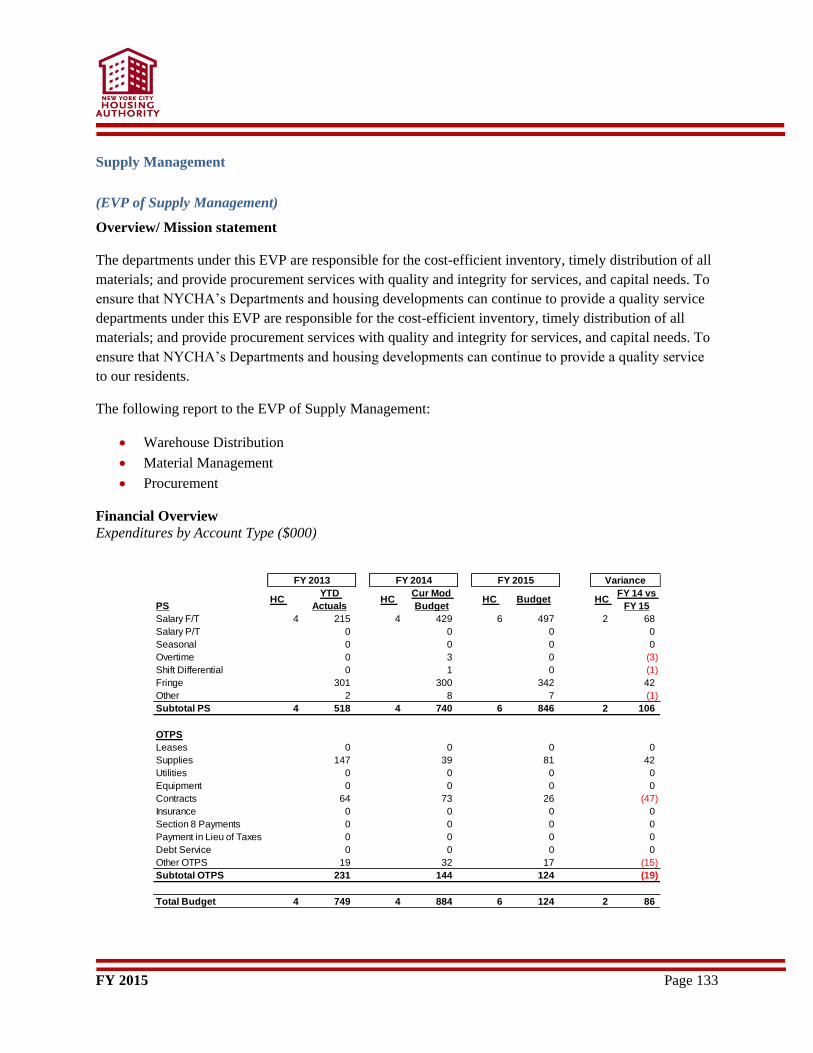
FY 2015 Page 133
Supply Management
(EVP of Supply Management)
Overview/ Mission statement
The departments under this EVP are responsible for the cost-efficient inventory, timely distribution of all
materials; and provide procurement services with quality and integrity for services, and capital needs. To
ensure that NYCHA’s Departments and housing developments can continue to provide a quality service
departments under this EVP are responsible for the cost-efficient inventory, timely distribution of all
materials; and provide procurement services with quality and integrity for services, and capital needs. To
ensure that NYCHA’s Departments and housing developments can continue to provide a quality service
to our residents.
The following report to the EVP of Supply Management:
Warehouse Distribution
Material Management
Procurement
Financial Overview
Expenditures by Account Type ($000)
PSHC
YTD
ActualsHC
Cur Mod
BudgetHC Budget HC
FY 14 vs
FY 15
Salary F/T 4 215 4 429 6 497 2 68
Salary P/T 0 0 0 0
Seasonal 0 0 0 0
Overtime 0 3 0 (3)
Shift Differential 0 1 0 (1)
Fringe 301 300 342 42
Other 2 8 7 (1)
Subtotal PS 4 518 4 740 6 846 2 106
OTPS
Leases 0 0 0 0
Supplies 147 39 81 42
Utilities 0 0 0 0
Equipment 0 0 0 0
Contracts 64 73 26 (47)
Insurance 0 0 0 0
Section 8 Payments 0 0 0 0
Payment in Lieu of Taxes 0 0 0 0
Debt Service 0 0 0 0
Other OTPS 19 32 17 (15)
Subtotal OTPS 231 144 124 (19)
Total Budget 4 749 4 884 6 124 2 86
FY 2013 FY 2014 FY 2015 Variance
FY 2015 Page 134
Financial Review
The FY 2015 operating expense budget for the EVP for Supply Management is $0.1 million, of which
$0.9 million is for PS and $0.1 million is for OTPS.
The PS budget reflects a net increase of $0.1 million due to:
2 Additional Head Count Budgeted
The OTPS budget reflects a net decrease of $0.2 million due to:
OTPS reduction of 2 percent
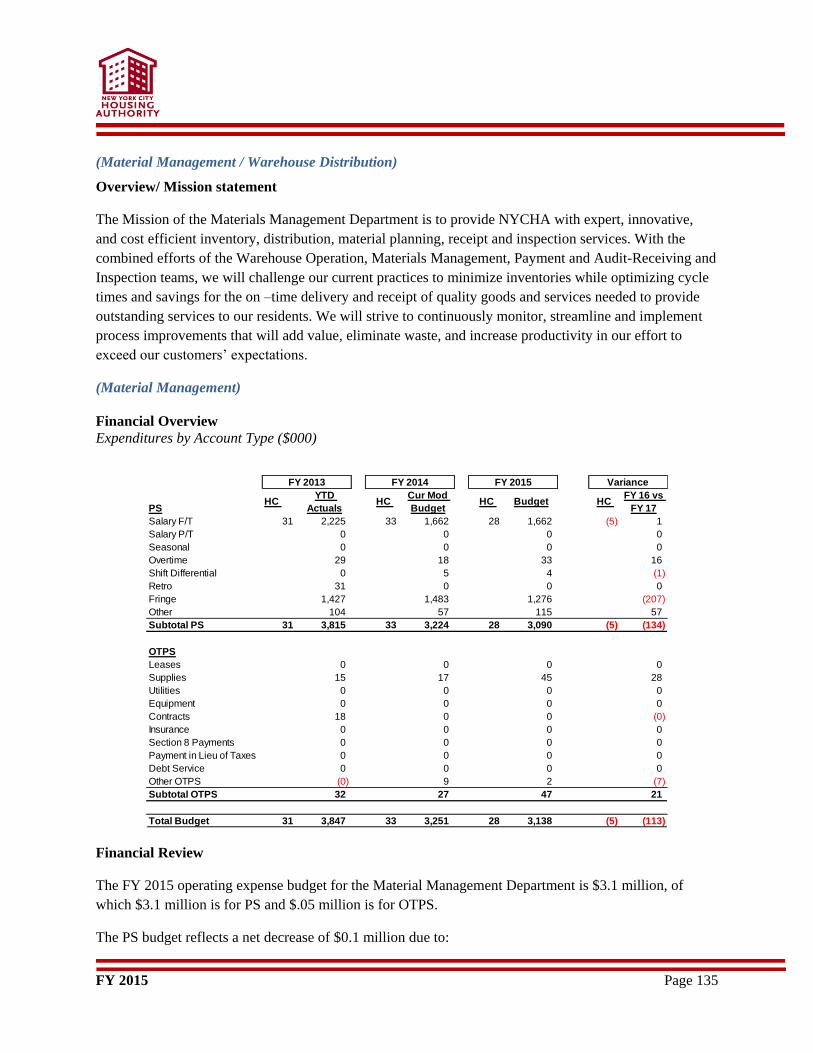
FY 2015 Page 135
(Material Management / Warehouse Distribution)
Overview/ Mission statement
The Mission of the Materials Management Department is to provide NYCHA with expert, innovative,
and cost efficient inventory, distribution, material planning, receipt and inspection services. With the
combined efforts of the Warehouse Operation, Materials Management, Payment and Audit-Receiving and
Inspection teams, we will challenge our current practices to minimize inventories while optimizing cycle
times and savings for the on –time delivery and receipt of quality goods and services needed to provide
outstanding services to our residents. We will strive to continuously monitor, streamline and implement
process improvements that will add value, eliminate waste, and increase productivity in our effort to
exceed our customers’ expectations.
(Material Management)
Financial Overview Expenditures by Account Type ($000)
Financial Review
The FY 2015 operating expense budget for the Material Management Department is $3.1 million, of
which $3.1 million is for PS and $.05 million is for OTPS.
The PS budget reflects a net decrease of $0.1 million due to:
PSHC
YTD
ActualsHC
Cur Mod
BudgetHC Budget HC
FY 16 vs
FY 17
Salary F/T 31 2,225 33 1,662 28 1,662 (5) 1
Salary P/T 0 0 0 0
Seasonal 0 0 0 0
Overtime 29 18 33 16
Shift Differential 0 5 4 (1)
Retro 31 0 0 0
Fringe 1,427 1,483 1,276 (207)
Other 104 57 115 57
Subtotal PS 31 3,815 33 3,224 28 3,090 (5) (134)
OTPS
Leases 0 0 0 0
Supplies 15 17 45 28
Utilities 0 0 0 0
Equipment 0 0 0 0
Contracts 18 0 0 (0)
Insurance 0 0 0 0
Section 8 Payments 0 0 0 0
Payment in Lieu of Taxes 0 0 0 0
Debt Service 0 0 0 0
Other OTPS (0) 9 2 (7)
Subtotal OTPS 32 27 47 21
Total Budget 31 3,847 33 3,251 28 3,138 (5) (113)
FY 2013 FY 2014 FY 2015 Variance
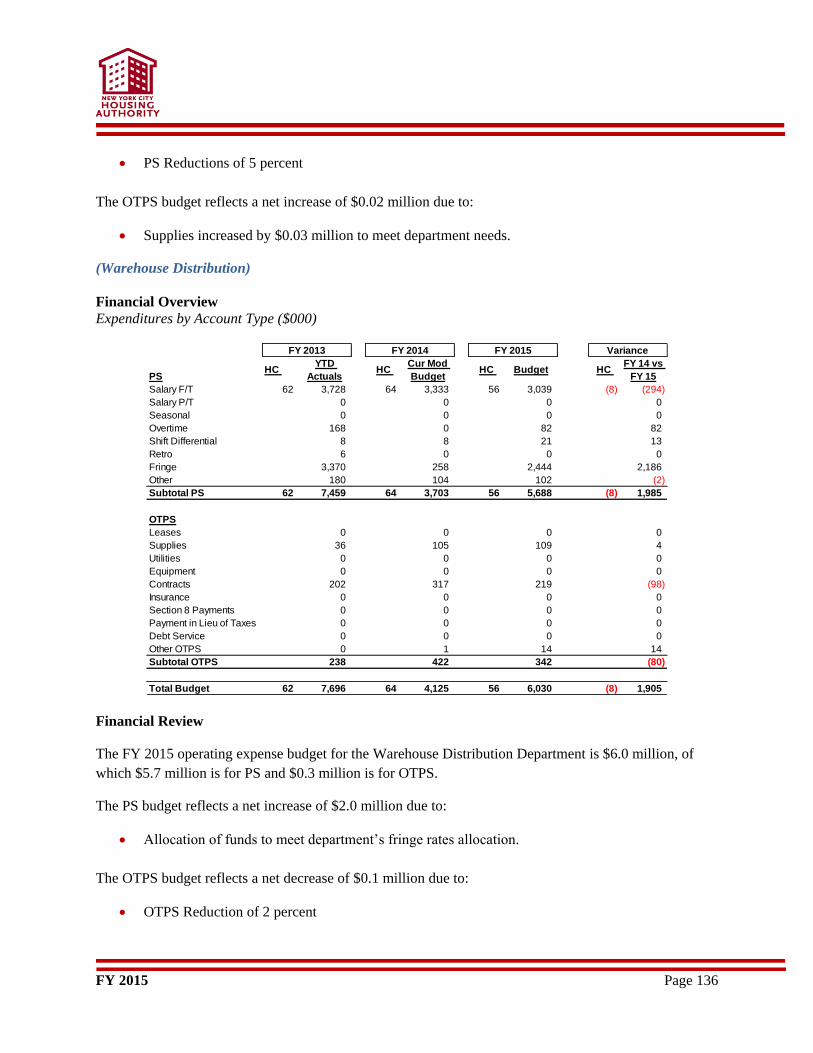
FY 2015 Page 136
PS Reductions of 5 percent
The OTPS budget reflects a net increase of $0.02 million due to:
Supplies increased by $0.03 million to meet department needs.
(Warehouse Distribution)
Financial Overview
Expenditures by Account Type ($000)
Financial Review
The FY 2015 operating expense budget for the Warehouse Distribution Department is $6.0 million, of
which $5.7 million is for PS and $0.3 million is for OTPS.
The PS budget reflects a net increase of $2.0 million due to:
Allocation of funds to meet department’s fringe rates allocation.
The OTPS budget reflects a net decrease of $0.1 million due to:
OTPS Reduction of 2 percent
PSHC
YTD
ActualsHC
Cur Mod
BudgetHC Budget HC
FY 14 vs
FY 15
Salary F/T 62 3,728 64 3,333 56 3,039 (8) (294)
Salary P/T 0 0 0 0
Seasonal 0 0 0 0
Overtime 168 0 82 82
Shift Differential 8 8 21 13
Retro 6 0 0 0
Fringe 3,370 258 2,444 2,186
Other 180 104 102 (2)
Subtotal PS 62 7,459 64 3,703 56 5,688 (8) 1,985
OTPS
Leases 0 0 0 0
Supplies 36 105 109 4
Utilities 0 0 0 0
Equipment 0 0 0 0
Contracts 202 317 219 (98)
Insurance 0 0 0 0
Section 8 Payments 0 0 0 0
Payment in Lieu of Taxes 0 0 0 0
Debt Service 0 0 0 0
Other OTPS 0 1 14 14
Subtotal OTPS 238 422 342 (80)
Total Budget 62 7,696 64 4,125 56 6,030 (8) 1,905
FY 2013 FY 2014 FY 2015 Variance
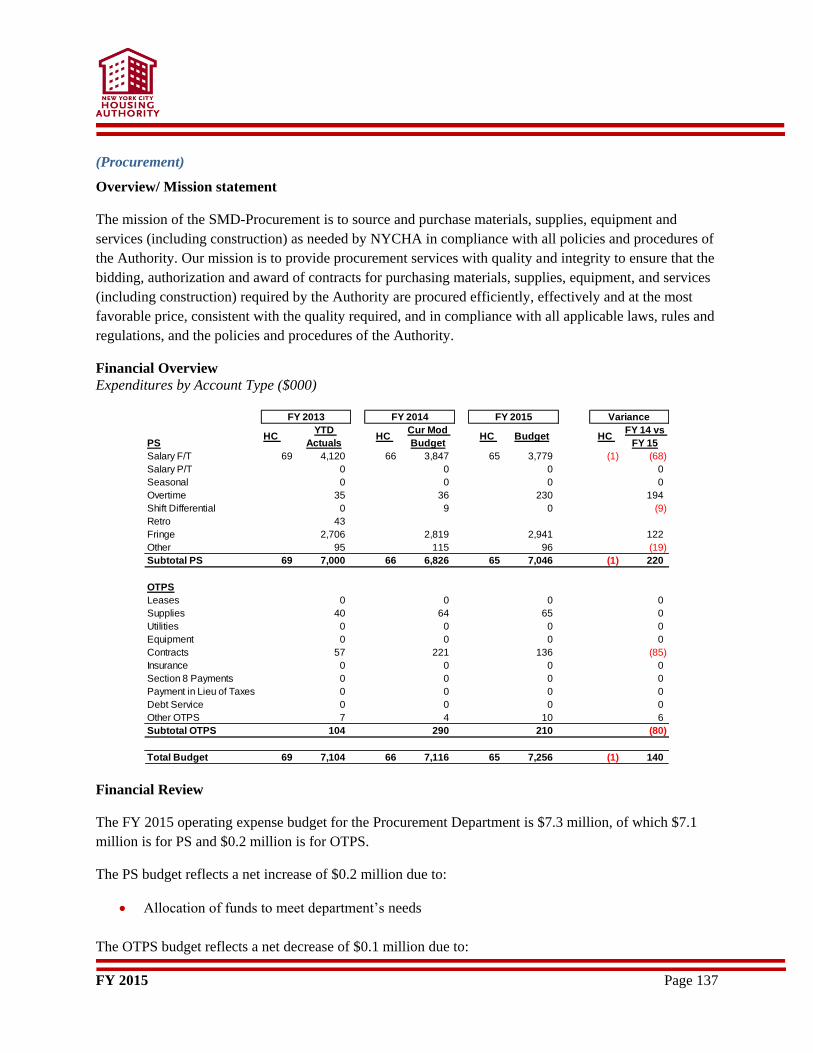
FY 2015 Page 137
(Procurement)
Overview/ Mission statement
The mission of the SMD-Procurement is to source and purchase materials, supplies, equipment and
services (including construction) as needed by NYCHA in compliance with all policies and procedures of
the Authority. Our mission is to provide procurement services with quality and integrity to ensure that the
bidding, authorization and award of contracts for purchasing materials, supplies, equipment, and services
(including construction) required by the Authority are procured efficiently, effectively and at the most
favorable price, consistent with the quality required, and in compliance with all applicable laws, rules and
regulations, and the policies and procedures of the Authority.
Financial Overview
Expenditures by Account Type ($000)
Financial Review
The FY 2015 operating expense budget for the Procurement Department is $7.3 million, of which $7.1
million is for PS and $0.2 million is for OTPS.
The PS budget reflects a net increase of $0.2 million due to:
Allocation of funds to meet department’s needs
The OTPS budget reflects a net decrease of $0.1 million due to:
PSHC
YTD
ActualsHC
Cur Mod
BudgetHC Budget HC
FY 14 vs
FY 15
Salary F/T 69 4,120 66 3,847 65 3,779 (1) (68)
Salary P/T 0 0 0 0
Seasonal 0 0 0 0
Overtime 35 36 230 194
Shift Differential 0 9 0 (9)
Retro 43
Fringe 2,706 2,819 2,941 122
Other 95 115 96 (19)
Subtotal PS 69 7,000 66 6,826 65 7,046 (1) 220
OTPS
Leases 0 0 0 0
Supplies 40 64 65 0
Utilities 0 0 0 0
Equipment 0 0 0 0
Contracts 57 221 136 (85)
Insurance 0 0 0 0
Section 8 Payments 0 0 0 0
Payment in Lieu of Taxes 0 0 0 0
Debt Service 0 0 0 0
Other OTPS 7 4 10 6
Subtotal OTPS 104 290 210 (80)
Total Budget 69 7,104 66 7,116 65 7,256 (1) 140
FY 2013 FY 2014 FY 2015 Variance
FY 2015 Page 138
OTPS Reduction of 2 percent.
Capital Projects
(EVP of Capital Projects)
Overview/ Mission statement
The Capital Projects Division (CPD), in conjunction with NYCHA’s Budget and Financial Planning
Department and Property Management Department develops a Public Housing Annual (PHA) Plan, as
well as a Five-Year Capital Plan, and plays a vital role in NYCHA’s mission to preserve its significant
housing stock and community facilities through cost-effective modernization and development activities.
CPD is responsible for delivering capital projects safely, on-time, within budget, and in accordance with
the work quality dictated by the contract documents.
The following report to the EVP of Capital Projects:
VP for Capital Projects
Construction
Local Law 11
VP for Quality Assurance
Administration
Quality Assurance
VP for Capital Planning and Design
Capital Panning
Office of Design
VP for Disaster Recovery
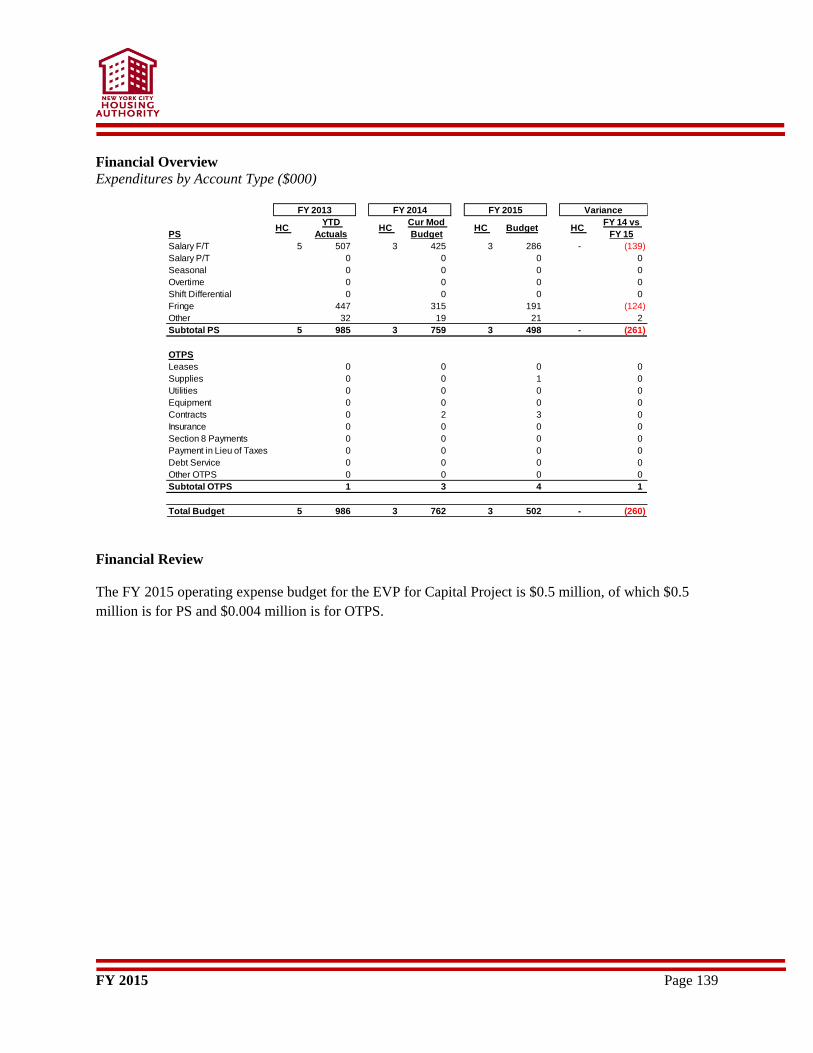
FY 2015 Page 139
Financial Overview
Expenditures by Account Type ($000)
Financial Review
The FY 2015 operating expense budget for the EVP for Capital Project is $0.5 million, of which $0.5
million is for PS and $0.004 million is for OTPS.
PSHC
YTD
ActualsHC
Cur Mod
BudgetHC Budget HC
FY 14 vs
FY 15
Salary F/T 5 507 3 425 3 286 - (139)
Salary P/T 0 0 0 0
Seasonal 0 0 0 0
Overtime 0 0 0 0
Shift Differential 0 0 0 0
Fringe 447 315 191 (124)
Other 32 19 21 2
Subtotal PS 5 985 3 759 3 498 - (261)
OTPS
Leases 0 0 0 0
Supplies 0 0 1 0
Utilities 0 0 0 0
Equipment 0 0 0 0
Contracts 0 2 3 0
Insurance 0 0 0 0
Section 8 Payments 0 0 0 0
Payment in Lieu of Taxes 0 0 0 0
Debt Service 0 0 0 0
Other OTPS 0 0 0 0
Subtotal OTPS 1 3 4 1
Total Budget 5 986 3 762 3 502 - (260)
FY 2013 FY 2014 FY 2015 Variance
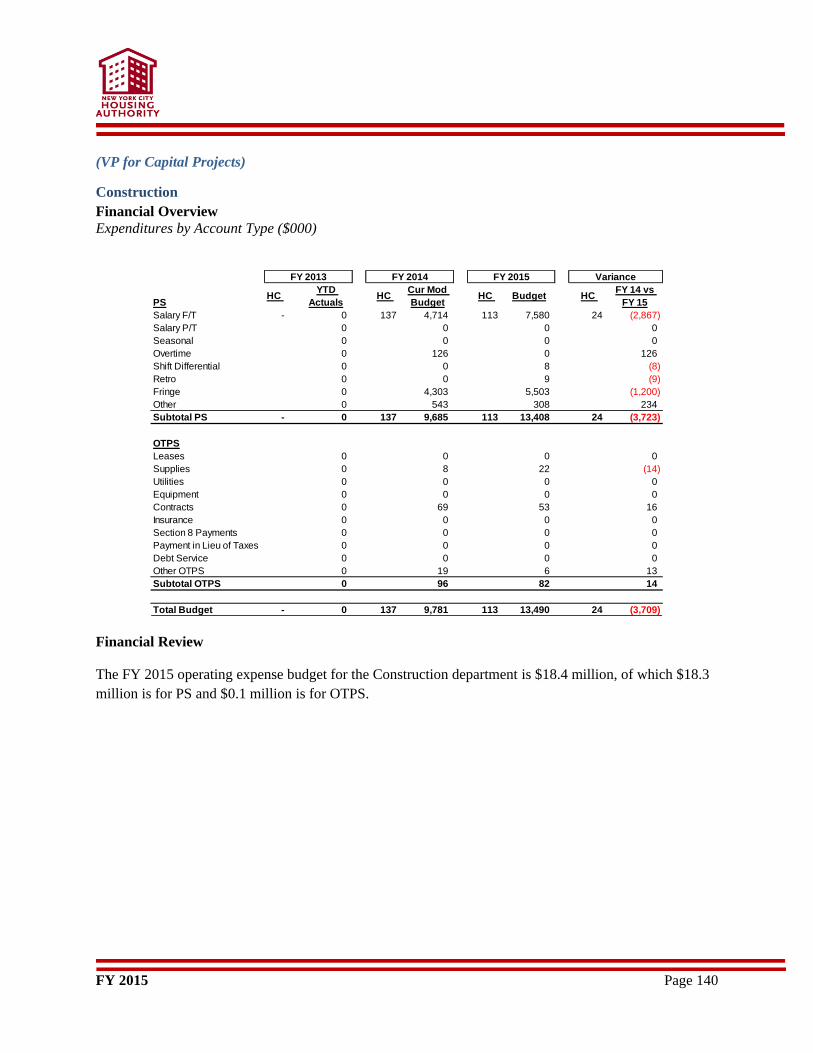
FY 2015 Page 140
(VP for Capital Projects)
Construction
Financial Overview
Expenditures by Account Type ($000)
Financial Review
The FY 2015 operating expense budget for the Construction department is $18.4 million, of which $18.3
million is for PS and $0.1 million is for OTPS.
PSHC
YTD
ActualsHC
Cur Mod
BudgetHC Budget HC
FY 14 vs
FY 15
Salary F/T - 0 137 4,714 113 7,580 24 (2,867)
Salary P/T 0 0 0 0
Seasonal 0 0 0 0
Overtime 0 126 0 126
Shift Differential 0 0 8 (8)
Retro 0 0 9 (9)
Fringe 0 4,303 5,503 (1,200)
Other 0 543 308 234
Subtotal PS - 0 137 9,685 113 13,408 24 (3,723)
OTPS
Leases 0 0 0 0
Supplies 0 8 22 (14)
Utilities 0 0 0 0
Equipment 0 0 0 0
Contracts 0 69 53 16
Insurance 0 0 0 0
Section 8 Payments 0 0 0 0
Payment in Lieu of Taxes 0 0 0 0
Debt Service 0 0 0 0
Other OTPS 0 19 6 13
Subtotal OTPS 0 96 82 14
Total Budget - 0 137 9,781 113 13,490 24 (3,709)
FY 2013 FY 2014 FY 2015 Variance
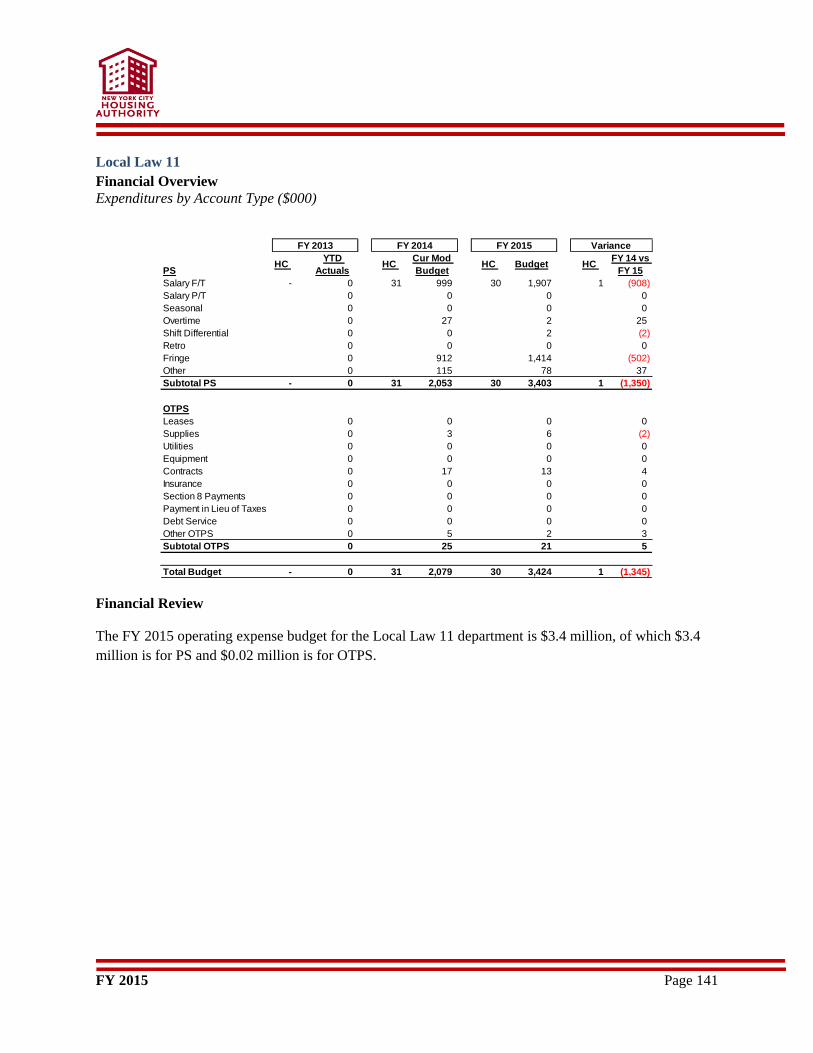
FY 2015 Page 141
Local Law 11
Financial Overview
Expenditures by Account Type ($000)
Financial Review
The FY 2015 operating expense budget for the Local Law 11 department is $3.4 million, of which $3.4
million is for PS and $0.02 million is for OTPS.
PSHC
YTD
ActualsHC
Cur Mod
BudgetHC Budget HC
FY 14 vs
FY 15
Salary F/T - 0 31 999 30 1,907 1 (908)
Salary P/T 0 0 0 0
Seasonal 0 0 0 0
Overtime 0 27 2 25
Shift Differential 0 0 2 (2)
Retro 0 0 0 0
Fringe 0 912 1,414 (502)
Other 0 115 78 37
Subtotal PS - 0 31 2,053 30 3,403 1 (1,350)
OTPS
Leases 0 0 0 0
Supplies 0 3 6 (2)
Utilities 0 0 0 0
Equipment 0 0 0 0
Contracts 0 17 13 4
Insurance 0 0 0 0
Section 8 Payments 0 0 0 0
Payment in Lieu of Taxes 0 0 0 0
Debt Service 0 0 0 0
Other OTPS 0 5 2 3
Subtotal OTPS 0 25 21 5
Total Budget - 0 31 2,079 30 3,424 1 (1,345)
FY 2013 FY 2014 FY 2015 Variance
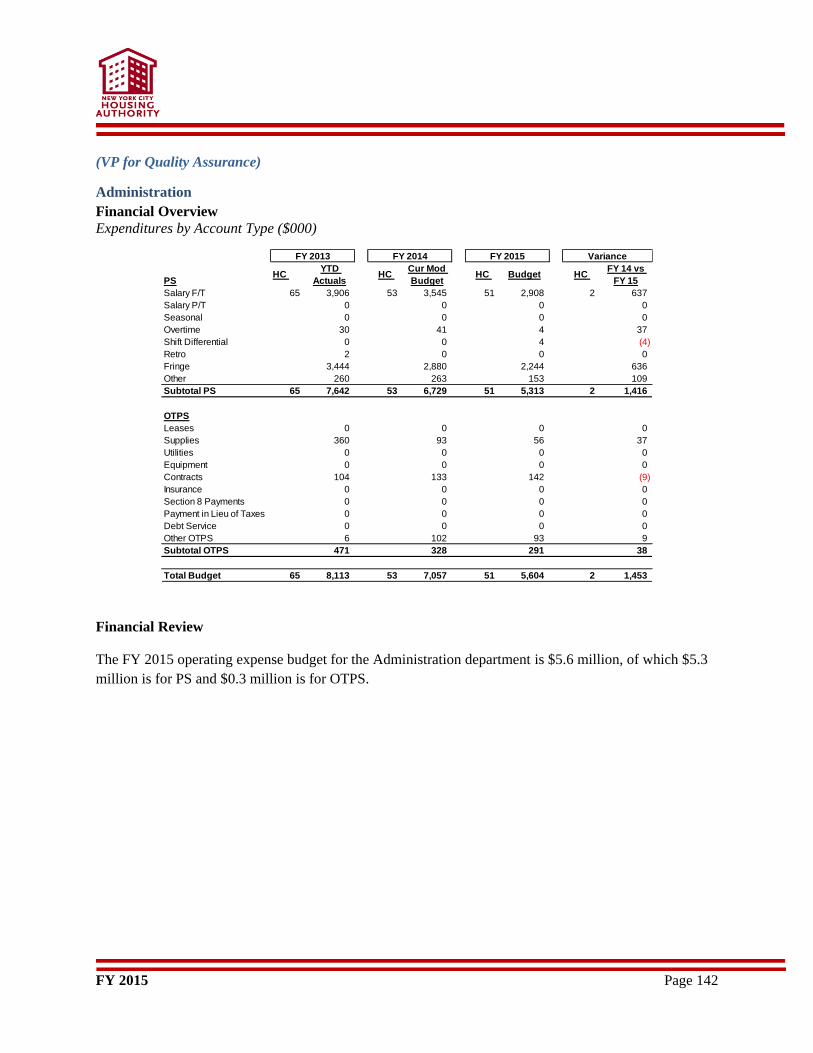
FY 2015 Page 142
(VP for Quality Assurance)
Administration
Financial Overview
Expenditures by Account Type ($000)
Financial Review
The FY 2015 operating expense budget for the Administration department is $5.6 million, of which $5.3
million is for PS and $0.3 million is for OTPS.
PSHC
YTD
ActualsHC
Cur Mod
BudgetHC Budget HC
FY 14 vs
FY 15
Salary F/T 65 3,906 53 3,545 51 2,908 2 637
Salary P/T 0 0 0 0
Seasonal 0 0 0 0
Overtime 30 41 4 37
Shift Differential 0 0 4 (4)
Retro 2 0 0 0
Fringe 3,444 2,880 2,244 636
Other 260 263 153 109
Subtotal PS 65 7,642 53 6,729 51 5,313 2 1,416
OTPS
Leases 0 0 0 0
Supplies 360 93 56 37
Utilities 0 0 0 0
Equipment 0 0 0 0
Contracts 104 133 142 (9)
Insurance 0 0 0 0
Section 8 Payments 0 0 0 0
Payment in Lieu of Taxes 0 0 0 0
Debt Service 0 0 0 0
Other OTPS 6 102 93 9
Subtotal OTPS 471 328 291 38
Total Budget 65 8,113 53 7,057 51 5,604 2 1,453
FY 2013 FY 2014 FY 2015 Variance
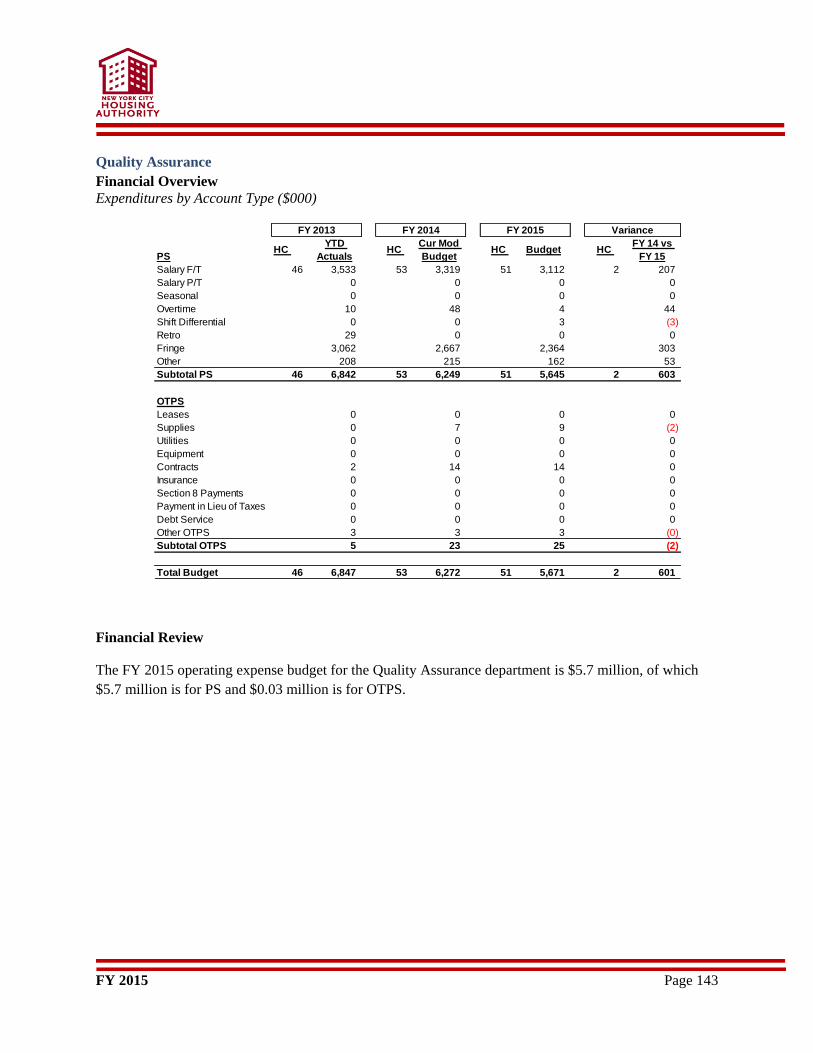
FY 2015 Page 143
Quality Assurance
Financial Overview
Expenditures by Account Type ($000)
Financial Review
The FY 2015 operating expense budget for the Quality Assurance department is $5.7 million, of which
$5.7 million is for PS and $0.03 million is for OTPS.
PSHC
YTD
ActualsHC
Cur Mod
BudgetHC Budget HC
FY 14 vs
FY 15
Salary F/T 46 3,533 53 3,319 51 3,112 2 207
Salary P/T 0 0 0 0
Seasonal 0 0 0 0
Overtime 10 48 4 44
Shift Differential 0 0 3 (3)
Retro 29 0 0 0
Fringe 3,062 2,667 2,364 303
Other 208 215 162 53
Subtotal PS 46 6,842 53 6,249 51 5,645 2 603
OTPS
Leases 0 0 0 0
Supplies 0 7 9 (2)
Utilities 0 0 0 0
Equipment 0 0 0 0
Contracts 2 14 14 0
Insurance 0 0 0 0
Section 8 Payments 0 0 0 0
Payment in Lieu of Taxes 0 0 0 0
Debt Service 0 0 0 0
Other OTPS 3 3 3 (0)
Subtotal OTPS 5 23 25 (2)
Total Budget 46 6,847 53 6,272 51 5,671 2 601
FY 2013 FY 2014 FY 2015 Variance
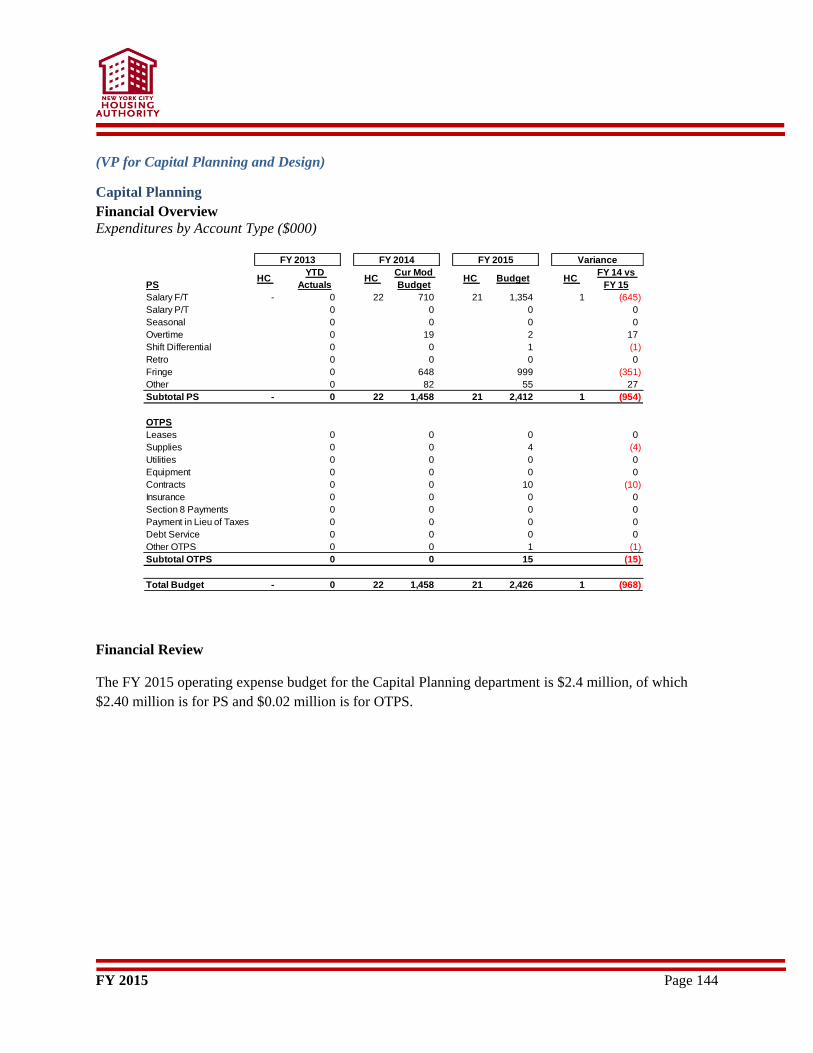
FY 2015 Page 144
(VP for Capital Planning and Design)
Capital Planning
Financial Overview
Expenditures by Account Type ($000)
Financial Review
The FY 2015 operating expense budget for the Capital Planning department is $2.4 million, of which
$2.40 million is for PS and $0.02 million is for OTPS.
PSHC
YTD
ActualsHC
Cur Mod
BudgetHC Budget HC
FY 14 vs
FY 15
Salary F/T - 0 22 710 21 1,354 1 (645)
Salary P/T 0 0 0 0
Seasonal 0 0 0 0
Overtime 0 19 2 17
Shift Differential 0 0 1 (1)
Retro 0 0 0 0
Fringe 0 648 999 (351)
Other 0 82 55 27
Subtotal PS - 0 22 1,458 21 2,412 1 (954)
OTPS
Leases 0 0 0 0
Supplies 0 0 4 (4)
Utilities 0 0 0 0
Equipment 0 0 0 0
Contracts 0 0 10 (10)
Insurance 0 0 0 0
Section 8 Payments 0 0 0 0
Payment in Lieu of Taxes 0 0 0 0
Debt Service 0 0 0 0
Other OTPS 0 0 1 (1)
Subtotal OTPS 0 0 15 (15)
Total Budget - 0 22 1,458 21 2,426 1 (968)
FY 2013 FY 2014 FY 2015 Variance
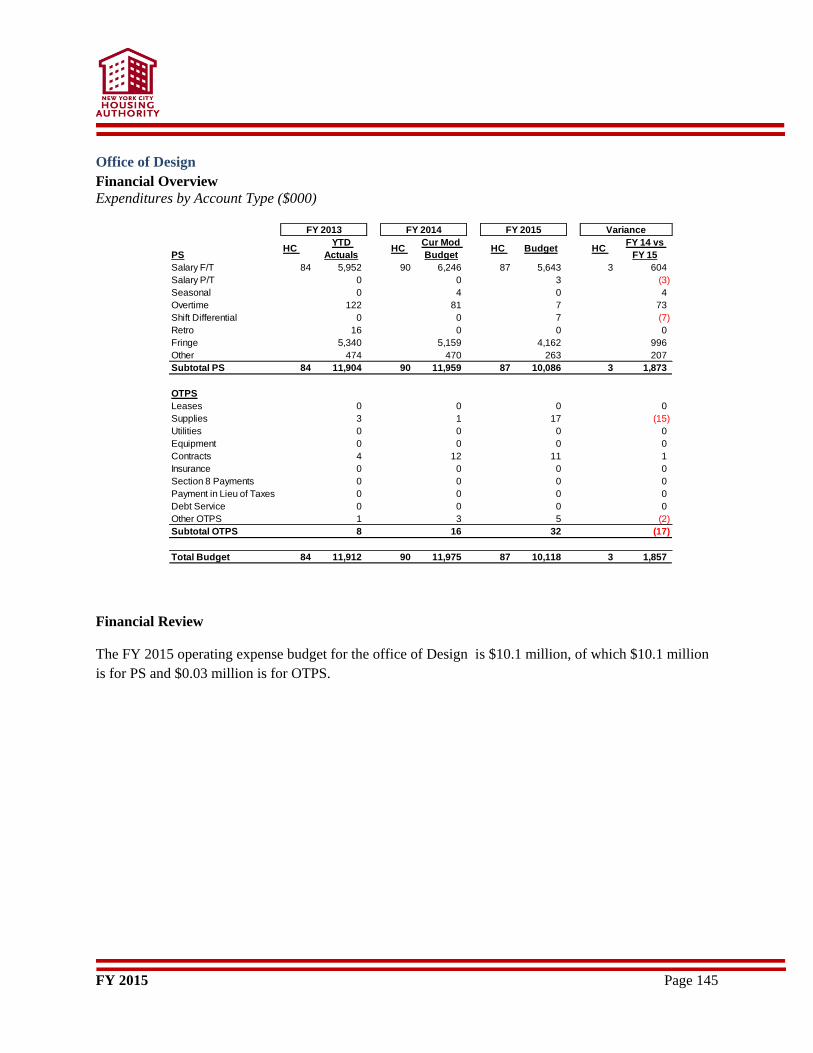
FY 2015 Page 145
Office of Design
Financial Overview
Expenditures by Account Type ($000)
Financial Review
The FY 2015 operating expense budget for the office of Design is $10.1 million, of which $10.1 million
is for PS and $0.03 million is for OTPS.
PSHC
YTD
ActualsHC
Cur Mod
BudgetHC Budget HC
FY 14 vs
FY 15
Salary F/T 84 5,952 90 6,246 87 5,643 3 604
Salary P/T 0 0 3 (3)
Seasonal 0 4 0 4
Overtime 122 81 7 73
Shift Differential 0 0 7 (7)
Retro 16 0 0 0
Fringe 5,340 5,159 4,162 996
Other 474 470 263 207
Subtotal PS 84 11,904 90 11,959 87 10,086 3 1,873
OTPS
Leases 0 0 0 0
Supplies 3 1 17 (15)
Utilities 0 0 0 0
Equipment 0 0 0 0
Contracts 4 12 11 1
Insurance 0 0 0 0
Section 8 Payments 0 0 0 0
Payment in Lieu of Taxes 0 0 0 0
Debt Service 0 0 0 0
Other OTPS 1 3 5 (2)
Subtotal OTPS 8 16 32 (17)
Total Budget 84 11,912 90 11,975 87 10,118 3 1,857
FY 2013 FY 2014 FY 2015 Variance
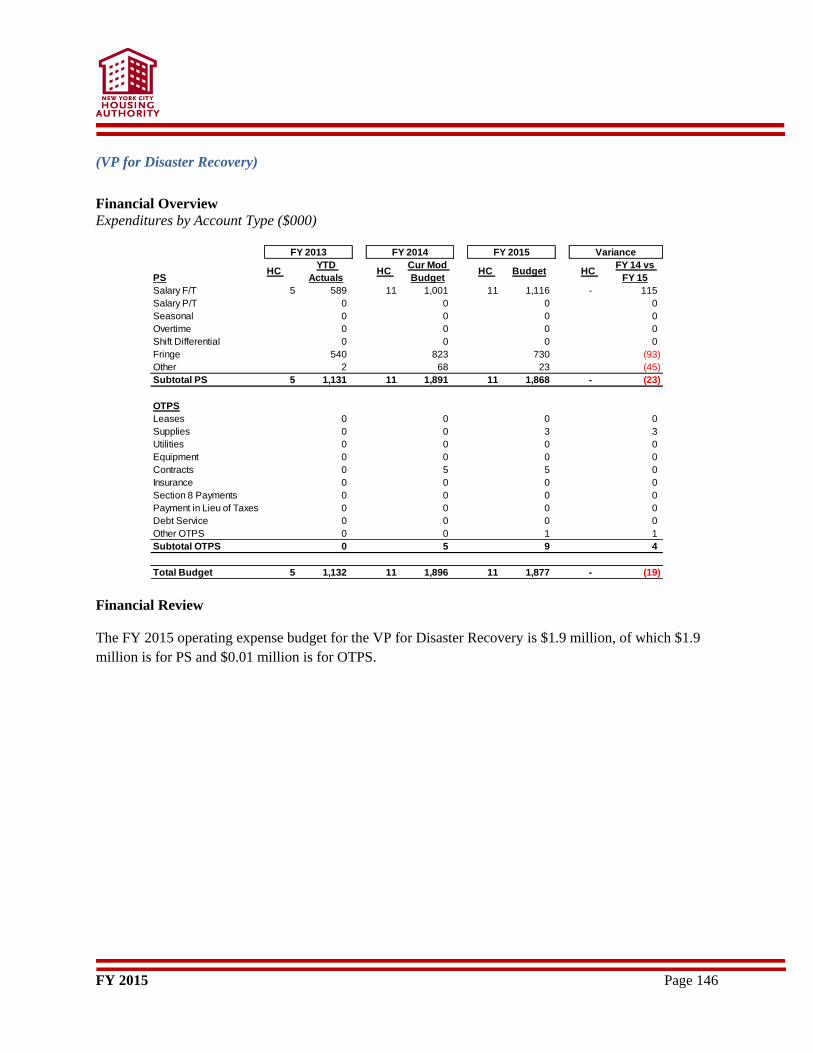
FY 2015 Page 146
(VP for Disaster Recovery)
Financial Overview
Expenditures by Account Type ($000)
Financial Review
The FY 2015 operating expense budget for the VP for Disaster Recovery is $1.9 million, of which $1.9
million is for PS and $0.01 million is for OTPS.
PSHC
YTD
ActualsHC
Cur Mod
BudgetHC Budget HC
FY 14 vs
FY 15
Salary F/T 5 589 11 1,001 11 1,116 - 115
Salary P/T 0 0 0 0
Seasonal 0 0 0 0
Overtime 0 0 0 0
Shift Differential 0 0 0 0
Fringe 540 823 730 (93)
Other 2 68 23 (45)
Subtotal PS 5 1,131 11 1,891 11 1,868 - (23)
OTPS
Leases 0 0 0 0
Supplies 0 0 3 3
Utilities 0 0 0 0
Equipment 0 0 0 0
Contracts 0 5 5 0
Insurance 0 0 0 0
Section 8 Payments 0 0 0 0
Payment in Lieu of Taxes 0 0 0 0
Debt Service 0 0 0 0
Other OTPS 0 0 1 1
Subtotal OTPS 0 5 9 4
Total Budget 5 1,132 11 1,896 11 1,877 - (19)
FY 2013 FY 2014 FY 2015 Variance
FY 2015 Page 147
Capital
Budget
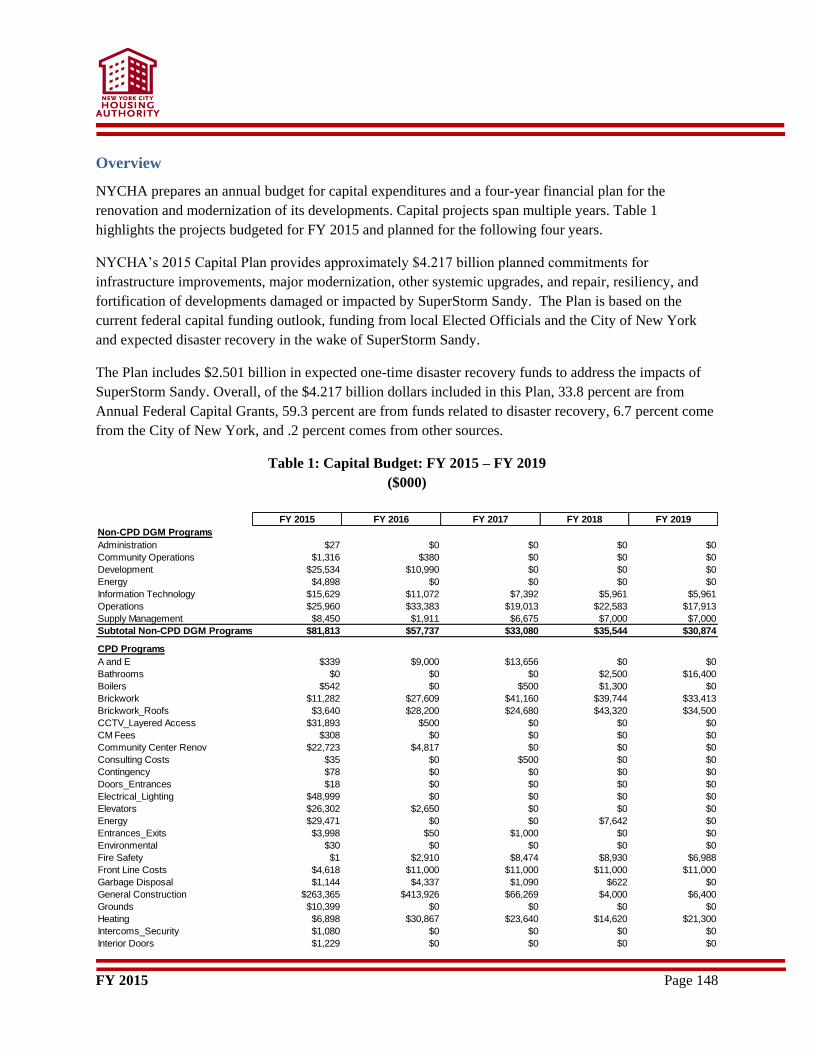
FY 2015 Page 148
Overview
NYCHA prepares an annual budget for capital expenditures and a four-year financial plan for the
renovation and modernization of its developments. Capital projects span multiple years. Table 1
highlights the projects budgeted for FY 2015 and planned for the following four years.
NYCHA’s 2015 Capital Plan provides approximately $4.217 billion planned commitments for
infrastructure improvements, major modernization, other systemic upgrades, and repair, resiliency, and
fortification of developments damaged or impacted by SuperStorm Sandy. The Plan is based on the
current federal capital funding outlook, funding from local Elected Officials and the City of New York
and expected disaster recovery in the wake of SuperStorm Sandy.
The Plan includes $2.501 billion in expected one-time disaster recovery funds to address the impacts of
SuperStorm Sandy. Overall, of the $4.217 billion dollars included in this Plan, 33.8 percent are from
Annual Federal Capital Grants, 59.3 percent are from funds related to disaster recovery, 6.7 percent come
from the City of New York, and .2 percent comes from other sources.
Table 1: Capital Budget: FY 2015 – FY 2019
($000)
FY 2015 FY 2016 FY 2017 FY 2018 FY 2019
Non-CPD DGM Programs
Administration $27 $0 $0 $0 $0
Community Operations $1,316 $380 $0 $0 $0
Development $25,534 $10,990 $0 $0 $0
Energy $4,898 $0 $0 $0 $0
Information Technology $15,629 $11,072 $7,392 $5,961 $5,961
Operations $25,960 $33,383 $19,013 $22,583 $17,913
Supply Management $8,450 $1,911 $6,675 $7,000 $7,000
Subtotal Non-CPD DGM Programs $81,813 $57,737 $33,080 $35,544 $30,874
CPD Programs
A and E $339 $9,000 $13,656 $0 $0
Bathrooms $0 $0 $0 $2,500 $16,400
Boilers $542 $0 $500 $1,300 $0
Brickwork $11,282 $27,609 $41,160 $39,744 $33,413
Brickwork_Roofs $3,640 $28,200 $24,680 $43,320 $34,500
CCTV_Layered Access $31,893 $500 $0 $0 $0
CM Fees $308 $0 $0 $0 $0
Community Center Renov $22,723 $4,817 $0 $0 $0
Consulting Costs $35 $0 $500 $0 $0
Contingency $78 $0 $0 $0 $0
Doors_Entrances $18 $0 $0 $0 $0
Electrical_Lighting $48,999 $0 $0 $0 $0
Elevators $26,302 $2,650 $0 $0 $0
Energy $29,471 $0 $0 $7,642 $0
Entrances_Exits $3,998 $50 $1,000 $0 $0
Environmental $30 $0 $0 $0 $0
Fire Safety $1 $2,910 $8,474 $8,930 $6,988
Front Line Costs $4,618 $11,000 $11,000 $11,000 $11,000
Garbage Disposal $1,144 $4,337 $1,090 $622 $0
General Construction $263,365 $413,926 $66,269 $4,000 $6,400
Grounds $10,399 $0 $0 $0 $0
Heating $6,898 $30,867 $23,640 $14,620 $21,300
Intercoms_Security $1,080 $0 $0 $0 $0
Interior Doors $1,229 $0 $0 $0 $0
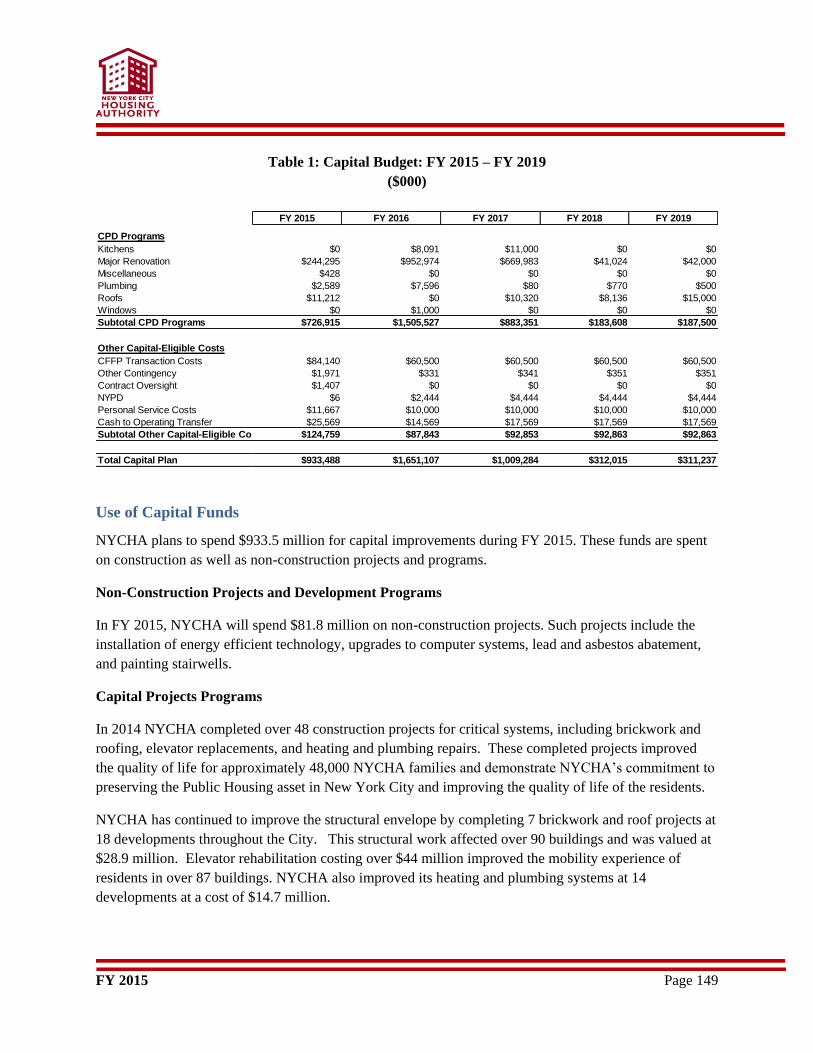
FY 2015 Page 149
Table 1: Capital Budget: FY 2015 – FY 2019
($000)
Use of Capital Funds
NYCHA plans to spend $933.5 million for capital improvements during FY 2015. These funds are spent
on construction as well as non-construction projects and programs.
Non-Construction Projects and Development Programs
In FY 2015, NYCHA will spend $81.8 million on non-construction projects. Such projects include the
installation of energy efficient technology, upgrades to computer systems, lead and asbestos abatement,
and painting stairwells.
Capital Projects Programs
In 2014 NYCHA completed over 48 construction projects for critical systems, including brickwork and
roofing, elevator replacements, and heating and plumbing repairs. These completed projects improved
the quality of life for approximately 48,000 NYCHA families and demonstrate NYCHA’s commitment to
preserving the Public Housing asset in New York City and improving the quality of life of the residents.
NYCHA has continued to improve the structural envelope by completing 7 brickwork and roof projects at
18 developments throughout the City. This structural work affected over 90 buildings and was valued at
$28.9 million. Elevator rehabilitation costing over $44 million improved the mobility experience of
residents in over 87 buildings. NYCHA also improved its heating and plumbing systems at 14
developments at a cost of $14.7 million.
FY 2015 FY 2016 FY 2017 FY 2018 FY 2019
CPD Programs
Kitchens $0 $8,091 $11,000 $0 $0
Major Renovation $244,295 $952,974 $669,983 $41,024 $42,000
Miscellaneous $428 $0 $0 $0 $0
Plumbing $2,589 $7,596 $80 $770 $500
Roofs $11,212 $0 $10,320 $8,136 $15,000
Windows $0 $1,000 $0 $0 $0
Subtotal CPD Programs $726,915 $1,505,527 $883,351 $183,608 $187,500
Other Capital-Eligible Costs
CFFP Transaction Costs $84,140 $60,500 $60,500 $60,500 $60,500
Other Contingency $1,971 $331 $341 $351 $351
Contract Oversight $1,407 $0 $0 $0 $0
NYPD $6 $2,444 $4,444 $4,444 $4,444
Personal Service Costs $11,667 $10,000 $10,000 $10,000 $10,000
Cash to Operating Transfer $25,569 $14,569 $17,569 $17,569 $17,569
Subtotal Other Capital-Eligible Costs $124,759 $87,843 $92,853 $92,863 $92,863
Total Capital Plan $933,488 $1,651,107 $1,009,284 $312,015 $311,237
FY 2015 Page 150
As part of the collaborative effort in the Re-Vision of Prospect Plaza, approximately $11 million in
demolition work was performed. The redevelopment of Prospect Plaza is expected to yield a mix of
housing types, open space, and community and retail facilities.
In FY 2015, NYCHA will spend $726.9 million to preserve its physical infrastructure; a list of all
construction capital projects is available in, Capital Projects by Development starting on page 122.
The Brickwork and Concrete budget of $16.6 million is for brickwork replacement at
approximately thirty-four developments.
The Community Center Construction budget of $23 million includes the upgrading of electrical,
lighting, and security systems; and the replacement of vinyl asbestos tile at various community
centers.
The General Construction budget of $278.9 is for SuperStorm Sandy renovations, the removal of
sidewalk sheds, apartment renovations, and handicap accessibility.
The Major Renovation budget of $260 million is for major rehabilitations at Randolph Houses
($15.7M), Sotomayor Houses ($23.3M), and major rehabilitations at developments damaged by
SuperStorm Sandy.
The Electrical/Lighting budget of $49.6 million is for electrical and lighting system upgrades
throughout NYCHA developments.
The Elevators budget of $27.5 million is for elevator system upgrades at approximately 28
developments.
The Energy budget of $33.4 million is for instantaneous hot water heaters throughout NYCHA
developments.
The CCTV Layered Access budget of $31.9 million, funded exclusively with City Capital funds
represents upgrades and replacements of CCTV/LAC throughout NYCHA developments.
The Heating budget of $13.5 million is for the upgrading of heating systems throughout NYCHA
developments.
Other Eligible Costs
In FY 2015, NYCHA will spend $121.4 million for other eligible capital costs. Costs under this category
consist of the following:
Debt service payments resulting from NYCHA’s bond issuance;
Management Fees; and
Transfer to Operating.
Financial Comparison: FY 2014 vs. FY 2015
Table 2 provides NYCHA’s actual capital expenditures for FY 2013, the Adopted Budget for FY 2014
and the FY 2015 Budget by project type. It also compares NYCHA’s Adopted Capital Budget for FY
2014, total $2.5 billion with the FY 2015, of $933.5 million. The difference is due to a $36.9 million
reduction in Federal and City funds.
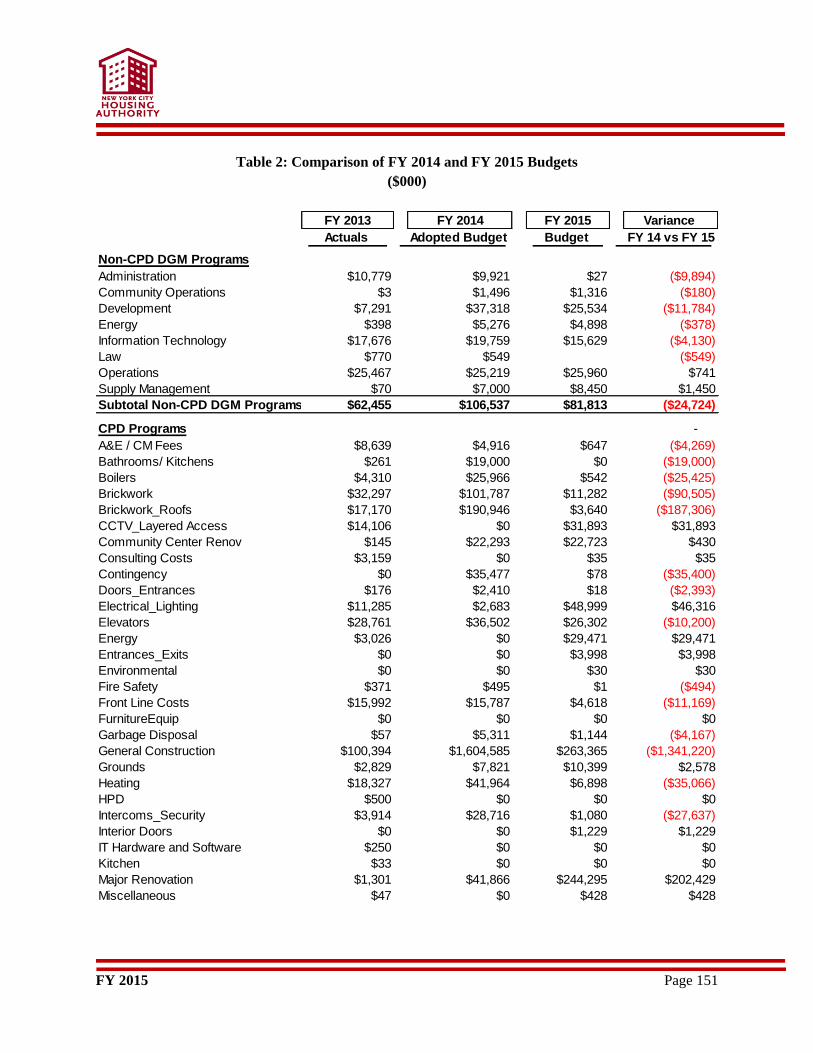
FY 2015 Page 151
Table 2: Comparison of FY 2014 and FY 2015 Budgets
($000)
FY 2013 FY 2014 FY 2015 Variance
Actuals Adopted Budget Budget FY 14 vs FY 15
Non-CPD DGM Programs
Administration $10,779 $9,921 $27 ($9,894)
Community Operations $3 $1,496 $1,316 ($180)
Development $7,291 $37,318 $25,534 ($11,784)
Energy $398 $5,276 $4,898 ($378)
Information Technology $17,676 $19,759 $15,629 ($4,130)
Law $770 $549 ($549)
Operations $25,467 $25,219 $25,960 $741
Supply Management $70 $7,000 $8,450 $1,450
Subtotal Non-CPD DGM Programs $62,455 $106,537 $81,813 ($24,724)-
CPD Programs -
A&E / CM Fees $8,639 $4,916 $647 ($4,269)
Bathrooms/ Kitchens $261 $19,000 $0 ($19,000)
Boilers $4,310 $25,966 $542 ($25,425)
Brickwork $32,297 $101,787 $11,282 ($90,505)
Brickwork_Roofs $17,170 $190,946 $3,640 ($187,306)
CCTV_Layered Access $14,106 $0 $31,893 $31,893
Community Center Renov $145 $22,293 $22,723 $430
Consulting Costs $3,159 $0 $35 $35
Contingency $0 $35,477 $78 ($35,400)
Doors_Entrances $176 $2,410 $18 ($2,393)
Electrical_Lighting $11,285 $2,683 $48,999 $46,316
Elevators $28,761 $36,502 $26,302 ($10,200)
Energy $3,026 $0 $29,471 $29,471
Entrances_Exits $0 $0 $3,998 $3,998
Environmental $0 $0 $30 $30
Fire Safety $371 $495 $1 ($494)
Front Line Costs $15,992 $15,787 $4,618 ($11,169)
FurnitureEquip $0 $0 $0 $0
Garbage Disposal $57 $5,311 $1,144 ($4,167)
General Construction $100,394 $1,604,585 $263,365 ($1,341,220)
Grounds $2,829 $7,821 $10,399 $2,578
Heating $18,327 $41,964 $6,898 ($35,066)
HPD $500 $0 $0 $0
Intercoms_Security $3,914 $28,716 $1,080 ($27,637)
Interior Doors $0 $0 $1,229 $1,229
IT Hardware and Software $250 $0 $0 $0
Kitchen $33 $0 $0 $0
Major Renovation $1,301 $41,866 $244,295 $202,429
Miscellaneous $47 $0 $428 $428
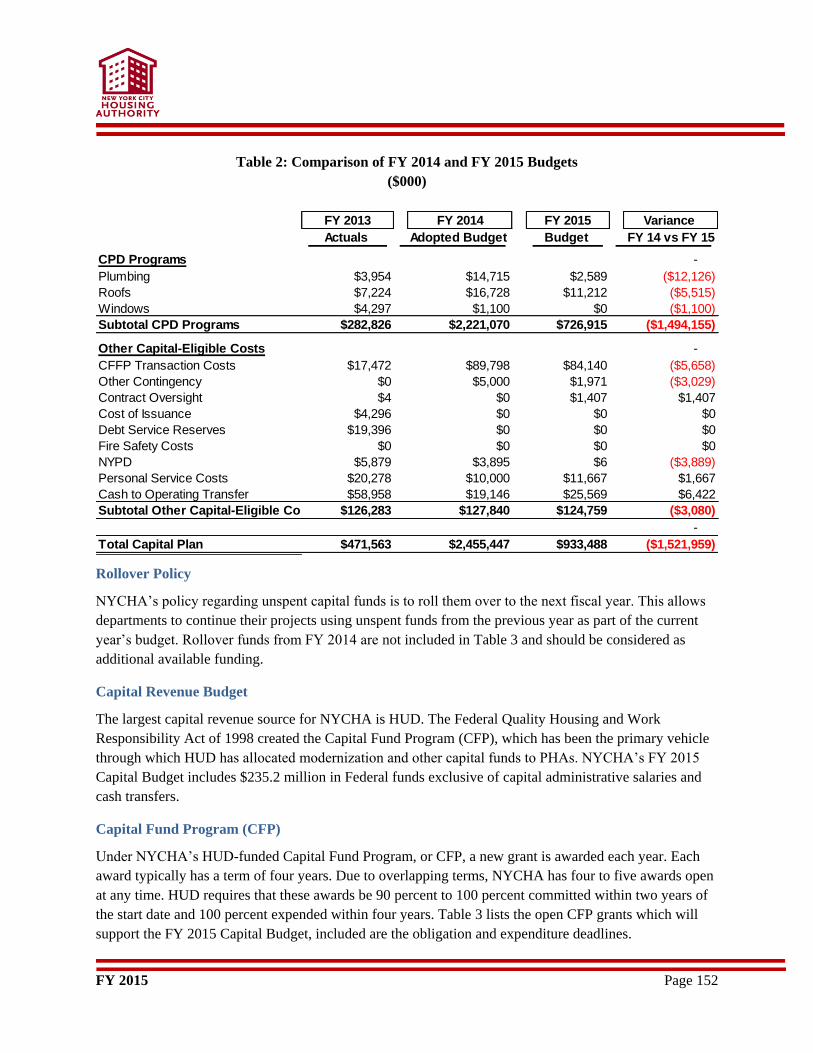
FY 2015 Page 152
Table 2: Comparison of FY 2014 and FY 2015 Budgets
($000)
Rollover Policy
NYCHA’s policy regarding unspent capital funds is to roll them over to the next fiscal year. This allows
departments to continue their projects using unspent funds from the previous year as part of the current
year’s budget. Rollover funds from FY 2014 are not included in Table 3 and should be considered as
additional available funding.
Capital Revenue Budget
The largest capital revenue source for NYCHA is HUD. The Federal Quality Housing and Work
Responsibility Act of 1998 created the Capital Fund Program (CFP), which has been the primary vehicle
through which HUD has allocated modernization and other capital funds to PHAs. NYCHA’s FY 2015
Capital Budget includes $235.2 million in Federal funds exclusive of capital administrative salaries and
cash transfers.
Capital Fund Program (CFP)
Under NYCHA’s HUD-funded Capital Fund Program, or CFP, a new grant is awarded each year. Each
award typically has a term of four years. Due to overlapping terms, NYCHA has four to five awards open
at any time. HUD requires that these awards be 90 percent to 100 percent committed within two years of
the start date and 100 percent expended within four years. Table 3 lists the open CFP grants which will
support the FY 2015 Capital Budget, included are the obligation and expenditure deadlines.
FY 2013 FY 2014 FY 2015 Variance
Actuals Adopted Budget Budget FY 14 vs FY 15
CPD Programs -
Plumbing $3,954 $14,715 $2,589 ($12,126)
Roofs $7,224 $16,728 $11,212 ($5,515)
Windows $4,297 $1,100 $0 ($1,100)
Subtotal CPD Programs $282,826 $2,221,070 $726,915 ($1,494,155)-
Other Capital-Eligible Costs -
CFFP Transaction Costs $17,472 $89,798 $84,140 ($5,658)
Other Contingency $0 $5,000 $1,971 ($3,029)
Contract Oversight $4 $0 $1,407 $1,407
Cost of Issuance $4,296 $0 $0 $0
Debt Service Reserves $19,396 $0 $0 $0
Fire Safety Costs $0 $0 $0 $0
NYPD $5,879 $3,895 $6 ($3,889)
Personal Service Costs $20,278 $10,000 $11,667 $1,667
Cash to Operating Transfer $58,958 $19,146 $25,569 $6,422
Subtotal Other Capital-Eligible Costs $126,283 $127,840 $124,759 ($3,080)
-
Total Capital Plan $471,563 $2,455,447 $933,488 ($1,521,959)
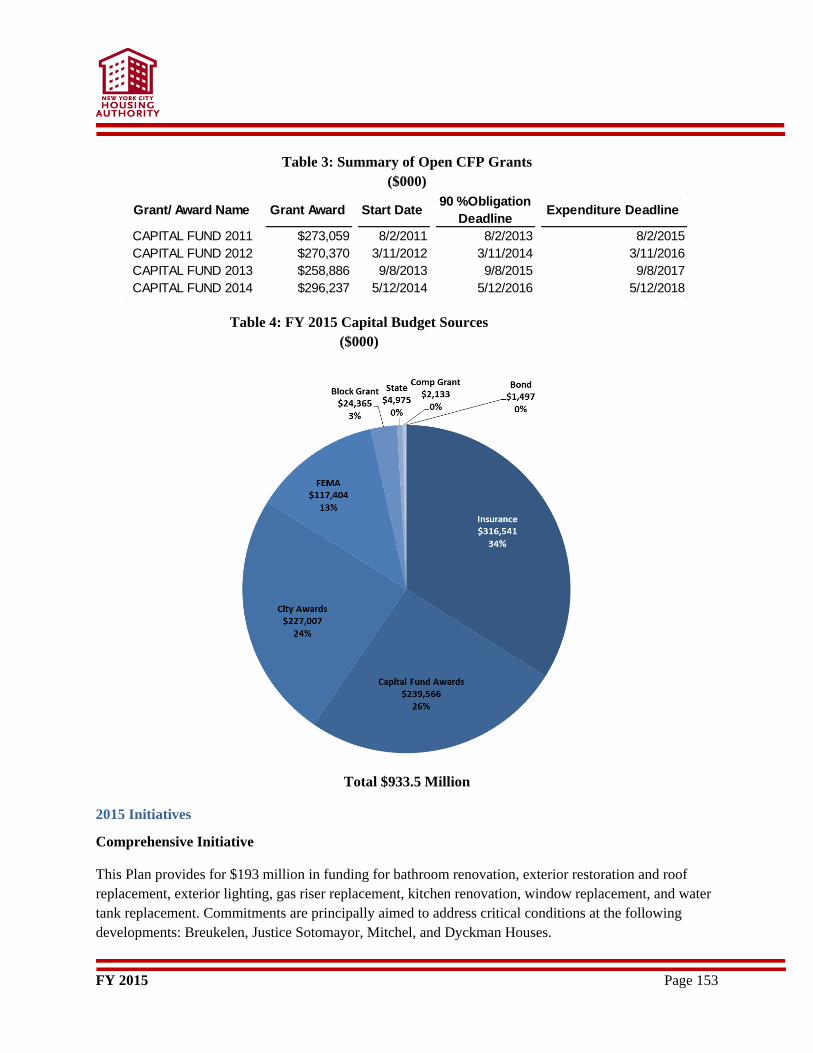
FY 2015 Page 153
Table 3: Summary of Open CFP Grants
($000)
Table 4: FY 2015 Capital Budget Sources
($000)
Total $933.5 Million
2015 Initiatives
Comprehensive Initiative
This Plan provides for $193 million in funding for bathroom renovation, exterior restoration and roof
replacement, exterior lighting, gas riser replacement, kitchen renovation, window replacement, and water
tank replacement. Commitments are principally aimed to address critical conditions at the following
developments: Breukelen, Justice Sotomayor, Mitchel, and Dyckman Houses.
Grant/ Award Name Grant Award Start Date 90 %Obligation
Deadline Expenditure Deadline
CAPITAL FUND 2011 $273,059 8/2/2011 8/2/2013 8/2/2015
CAPITAL FUND 2012 $270,370 3/11/2012 3/11/2014 3/11/2016
CAPITAL FUND 2013 $258,886 9/8/2013 9/8/2015 9/8/2017
CAPITAL FUND 2014 $296,237 5/12/2014 5/12/2016 5/12/2018
FY 2015 Page 154
Heating & Plumbing
With escalating energy expenses, and boilers and ancillary heating systems reaching and exceeding their
useful lives, NYCHA must invest in energy retrofit and upgrades. This Plan provides $118 million for
heating and plumbing work (including $82 million for the replacement of 11 boilers in a critical state of
repair); $16 million for gas riser replacements that will help reduce gas supply outages, as well as
underground steam main replacements that will reduce heating system failures.
Brick & Roof Work
This Plan provides for $296 million in funding for exterior restoration and roof replacement.
Commitments are principally aimed at remediating Local Law 11 violations ($44M) and mitigating the
safety hazard of deteriorated brick facades. The associated roof work will make the building envelopes
weather tight to prevent future deterioration of the brick facades. Among the developments to be
remedied are: Queensbridge North and South ($62M), Albany ($24M), and Parkside ($24M).
SuperStorm Sandy Projects
Approximately 271 buildings across 34 of the NYCHA developments were damaged to some extent by
Sandy. As with any major disaster the Sandy recovery efforts during the initial period after the storm
were focused on interim repairs to meet immediate needs. Planning then began for long-term or
“permanent repairs”. This planning includes a thorough assessment of the damage, determining the
source and amount of funding that will be available to address the damage, detailed design of the repair
efforts, and procurement contractors to perform the work. Another important aspect of the planning
process is to identify those actions that can be taken to mitigate the potential for similar damage in the
case of a future storm event.
City Capital
City Capital funding is provided to NYCHA by Elected Officials for projects in their districts. Funds are
provided by Borough Presidents, the City Council, and the Mayor. The Borough President and City
Council funding are unique compared to other capital funding in that the elected official’s approval is
required in order for funds to be repurposed. In addition the City’s Office of Management and Budget
must approve any changes. Elected officials are not aware of the total cost for most construction projects.
As a result, some of their projects are under-funded, thus needing the elected official to allocate more
capital dollars or repurpose the funds from another project.
Some of the additional challenges within the City Capital portfolio include:
Projects where construction bids exceed allocations;
Projects that receive an allocation for a specific phase when other steps must occur first (i.e.
demolition must occur before redevelopment); and
Projects that have unexpended balances which need to be repurposed by the City Council or
Borough President.
FY 2015 Page 155
NYCHA’s current City Capital funding is approximately $282.7 million for 2015 through 2019. This
funding includes $42.6 million for exterior lighting, $37.4 million for roof replacement, and $32.4 million
for closed circuit television / layered access.
The Capital Projects Division (CPD) has recently reorganized and formed a City Capital Unit dedicated
specifically to managing these projects. CPD is creating detailed schedules and exploring alternative
contract delivery models to expedite the projects process. CPD also now produces a Quarterly Status
Report for the City Council. Additionally, NYCHA has transferred smaller City Capital projects from
CPD to Operations to facilitate quicker service delivery of City Capital projects.
Capital Fund Bond Issue
Under HUD’s Capital Fund Financing Program (CFFP), NYCHA may borrow private capital to make
improvements and pledge, subject to the availability of appropriations, a portion of future year annual
Capital funds for debt service. Borrowing capacity under the CFFP is limited so that annual debt service
may not exceed 33 percent of annual federal capital grant awards. Bond proceeds are required to be
expended over a four year period. NYCHA is using net proceeds to rehabilitate building envelopes,
principally for the remediation of Local Law 11 violations, as well as install new roofs at up to 38
developments across all five boroughs. Local Law 11 applies to exterior walls of buildings that are six or
more stories in height and addresses the dangers associated with deteriorating building facades. NYCHA
anticipates annual debt service of $60 million inclusive of the debt service on NYCHA’s CFFP Series A
& bonds. To date, NYCHA has obligated 99.6 percent or $498 million of the $500 million net proceeds.
Randolph Houses Mixed Finance Renovation
The Plan includes an investment of $40 million in a mixed finance transaction in partnership with
Housing Preservation and Development (HPD) and Housing Development Corp. (HDC) to perform a
major renovation of Randolph Houses on West 114th Street in Harlem. The development includes 36
five-story walkup tenement buildings dating from the 1890s that came into NYCHA ownership in the
1970s.
In the late 1990s, NYCHA determined that major renovation work was needed to make Randolph Houses
viable and began to transfer residents to other facilities to begin construction. However, by 2007
NYCHA had concluded the costs of the rehabilitation were prohibitive and initiated a Section 18
demolition application to replace Randolph Houses with two new Public Housing buildings. Through this
process, the State Historic Preservation Office (SHPO) determined the development was part of a State
and National Register eligible historic district and that alternatives to demolition should be fully explored.
In September 2010, NYCHA engaged a team of architects to examine the feasibility of preserving and
rehabilitating the buildings.
NYCHA’s preferred design alternative yields a total of approximately 316 dwelling units of which 147
will be Public Housing constructed in two phases. SHPO approved this renovation plan in January 2011.
FY 2015 Page 156
NYCHA selected a developer in October 2012, and construction began in March 2014 with Public
Housing units expected to be available for occupancy in last quarter of 2015.
Information Technology
Strategic Solutions
Information Technology (IT) will continue to be pro-active in exploring emerging technologies to
facilitate innovation in products and services, using information and technology to drive value into and
from the customer experience.
Some of these initiatives are as follows:
Review options for a Cloud-based datacenter and virtualized applications solutions. This could
provide the capabilities for systems to operate faster with improved business continuity and
manageability at a reduced maintenance cost. It can also improve agility and response time by
providing the capability to rapidly adjust resources to meet fluctuating and unpredictable business
demands.
Enable Public Housing residents to submit Annual Review information through a secure online
portal using a computer. Public Housing residents will also be able to view the status of current
annual review documents, receive instant notification of their submission, identify missing
documents, and upload supporting documents at their convenience. This will improve overall
cycle time for processing annual reviews and increase customer satisfaction through an easier
more user-friendly process.
Enhance NYCHA’s current rent collection system and document approach to a long term solution
to re-engineer the Rent Collection Process.
Continue the enhancement of NYCHA’s maintenance and asset management system (Maximo) to
establish an improved integration of NYCHA’s physical plant asset data into Maximo, the work
order maintenance system.
Expand the current mobile inspection options.
Upgrade Internet and Intranet sites to provide robust data communications platform that will
support faster on-line transactions. This will address key customer needs, as well as bringing
NYCHA into compliance with federal website standards.
Upgrade various business support and infrastructure systems which will provide added business
functionality such as:
Implementing a multi-language option on the current Leased Housing Self Service Portal.
Replacing the current Law Department invoicing and case management system.
Supporting NYCHA’s efforts to maximize customer service and resident engagement the
Optimal Property Management Operating Model (OPMOM) initiative.
Upgrade current Resident Economic Empowerment and Sustainability (REES) system to
an eService solution that is envisioned as an integrated solution supporting NYCHA's
FY 2015 Page 157
new Zone Model. This will increase staff efficiency and facilitate the exchange of
program data between REES and other NYCHA departments and external stakeholders.
Reviewing IT’s Disaster Recovery (DR) policies, procedures and processes related to
preparing for recovery or continuation of the technology infrastructure which is vital to
NYCHA after a natural or human induced disaster. The Business Continuity/Disaster
Recovery will focus primarily on the IT systems that support critical business functions.
FY 2015 Page 158
Capital Projects
by Developments
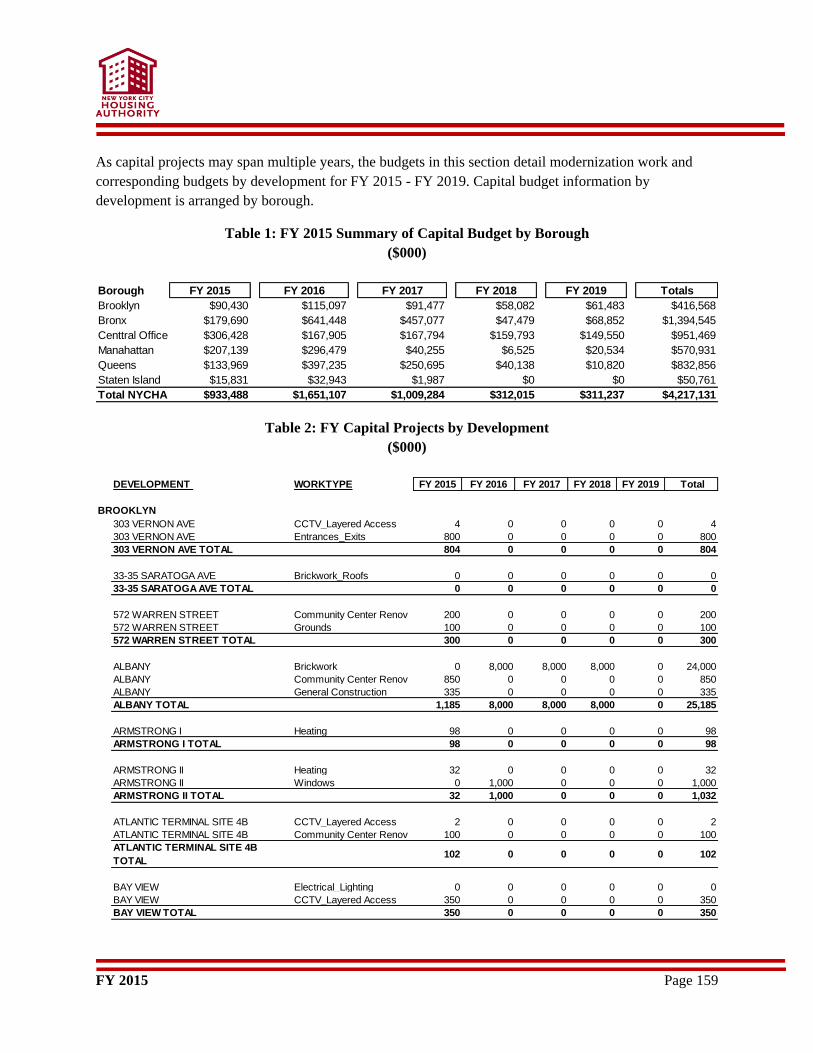
FY 2015 Page 159
As capital projects may span multiple years, the budgets in this section detail modernization work and
corresponding budgets by development for FY 2015 - FY 2019. Capital budget information by
development is arranged by borough.
Table 1: FY 2015 Summary of Capital Budget by Borough
($000)
Table 2: FY Capital Projects by Development
($000)
Borough FY 2015 FY 2016 FY 2017 FY 2018 FY 2019 Totals
Brooklyn $90,430 $115,097 $91,477 $58,082 $61,483 $416,568
Bronx $179,690 $641,448 $457,077 $47,479 $68,852 $1,394,545
Centtral Office $306,428 $167,905 $167,794 $159,793 $149,550 $951,469
Manahattan $207,139 $296,479 $40,255 $6,525 $20,534 $570,931
Queens $133,969 $397,235 $250,695 $40,138 $10,820 $832,856
Staten Island $15,831 $32,943 $1,987 $0 $0 $50,761
Total NYCHA $933,488 $1,651,107 $1,009,284 $312,015 $311,237 $4,217,131
DEVELOPMENT WORKTYPE FY 2015 FY 2016 FY 2017 FY 2018 FY 2019 Total
303 VERNON AVE CCTV_Layered Access 4 0 0 0 0 4
303 VERNON AVE Entrances_Exits 800 0 0 0 0 800
303 VERNON AVE TOTAL 804 0 0 0 0 804
33-35 SARATOGA AVE Brickwork_Roofs 0 0 0 0 0 0
33-35 SARATOGA AVE TOTAL 0 0 0 0 0 0
572 WARREN STREET Community Center Renov 200 0 0 0 0 200
572 WARREN STREET Grounds 100 0 0 0 0 100
572 WARREN STREET TOTAL 300 0 0 0 0 300
ALBANY Brickwork 0 8,000 8,000 8,000 0 24,000
ALBANY Community Center Renov 850 0 0 0 0 850
ALBANY General Construction 335 0 0 0 0 335
ALBANY TOTAL 1,185 8,000 8,000 8,000 0 25,185
ARMSTRONG I Heating 98 0 0 0 0 98
ARMSTRONG I TOTAL 98 0 0 0 0 98
ARMSTRONG II Heating 32 0 0 0 0 32
ARMSTRONG II Windows 0 1,000 0 0 0 1,000
ARMSTRONG II TOTAL 32 1,000 0 0 0 1,032
ATLANTIC TERMINAL SITE 4B CCTV_Layered Access 2 0 0 0 0 2
ATLANTIC TERMINAL SITE 4B Community Center Renov 100 0 0 0 0 100
ATLANTIC TERMINAL SITE 4B
TOTAL102 0 0 0 0 102
BAY VIEW Electrical_Lighting 0 0 0 0 0 0
BAY VIEW CCTV_Layered Access 350 0 0 0 0 350
BAY VIEW TOTAL 350 0 0 0 0 350
BROOKLYN
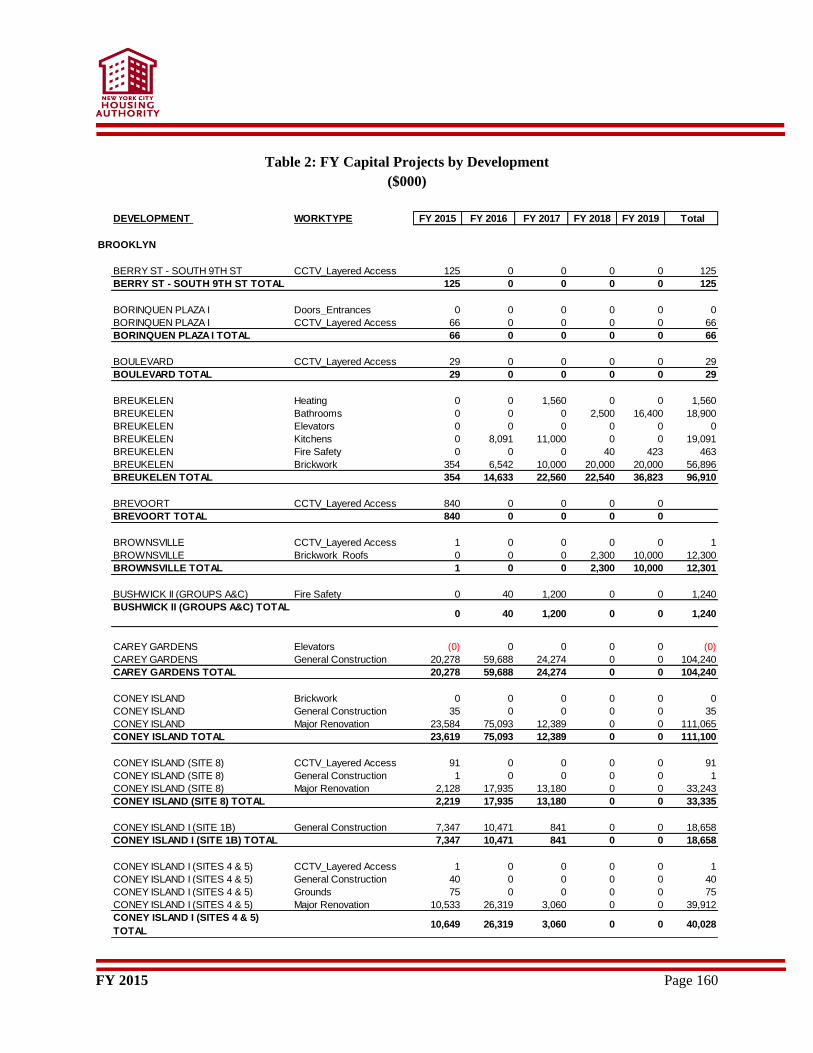
FY 2015 Page 160
Table 2: FY Capital Projects by Development
($000)
DEVELOPMENT WORKTYPE FY 2015 FY 2016 FY 2017 FY 2018 FY 2019 Total
BERRY ST - SOUTH 9TH ST CCTV_Layered Access 125 0 0 0 0 125
BERRY ST - SOUTH 9TH ST TOTAL 125 0 0 0 0 125
BORINQUEN PLAZA I Doors_Entrances 0 0 0 0 0 0
BORINQUEN PLAZA I CCTV_Layered Access 66 0 0 0 0 66
BORINQUEN PLAZA I TOTAL 66 0 0 0 0 66
BOULEVARD CCTV_Layered Access 29 0 0 0 0 29
BOULEVARD TOTAL 29 0 0 0 0 29
BREUKELEN Heating 0 0 1,560 0 0 1,560
BREUKELEN Bathrooms 0 0 0 2,500 16,400 18,900
BREUKELEN Elevators 0 0 0 0 0 0
BREUKELEN Kitchens 0 8,091 11,000 0 0 19,091
BREUKELEN Fire Safety 0 0 0 40 423 463
BREUKELEN Brickwork 354 6,542 10,000 20,000 20,000 56,896
BREUKELEN TOTAL 354 14,633 22,560 22,540 36,823 96,910
BREVOORT CCTV_Layered Access 840 0 0 0 0
BREVOORT TOTAL 840 0 0 0 0
BROWNSVILLE CCTV_Layered Access 1 0 0 0 0 1
BROWNSVILLE Brickwork_Roofs 0 0 0 2,300 10,000 12,300
BROWNSVILLE TOTAL 1 0 0 2,300 10,000 12,301
BUSHWICK II (GROUPS A&C) Fire Safety 0 40 1,200 0 0 1,240
BUSHWICK II (GROUPS A&C) TOTAL0 40 1,200 0 0 1,240
CAREY GARDENS Elevators (0) 0 0 0 0 (0)
CAREY GARDENS General Construction 20,278 59,688 24,274 0 0 104,240
CAREY GARDENS TOTAL 20,278 59,688 24,274 0 0 104,240
CONEY ISLAND Brickwork 0 0 0 0 0 0
CONEY ISLAND General Construction 35 0 0 0 0 35
CONEY ISLAND Major Renovation 23,584 75,093 12,389 0 0 111,065
CONEY ISLAND TOTAL 23,619 75,093 12,389 0 0 111,100
CONEY ISLAND (SITE 8) CCTV_Layered Access 91 0 0 0 0 91
CONEY ISLAND (SITE 8) General Construction 1 0 0 0 0 1
CONEY ISLAND (SITE 8) Major Renovation 2,128 17,935 13,180 0 0 33,243
CONEY ISLAND (SITE 8) TOTAL 2,219 17,935 13,180 0 0 33,335
CONEY ISLAND I (SITE 1B) General Construction 7,347 10,471 841 0 0 18,658
CONEY ISLAND I (SITE 1B) TOTAL 7,347 10,471 841 0 0 18,658
CONEY ISLAND I (SITES 4 & 5) CCTV_Layered Access 1 0 0 0 0 1
CONEY ISLAND I (SITES 4 & 5) General Construction 40 0 0 0 0 40
CONEY ISLAND I (SITES 4 & 5) Grounds 75 0 0 0 0 75
CONEY ISLAND I (SITES 4 & 5) Major Renovation 10,533 26,319 3,060 0 0 39,912
CONEY ISLAND I (SITES 4 & 5)
TOTAL10,649 26,319 3,060 0 0 40,028
BROOKLYN
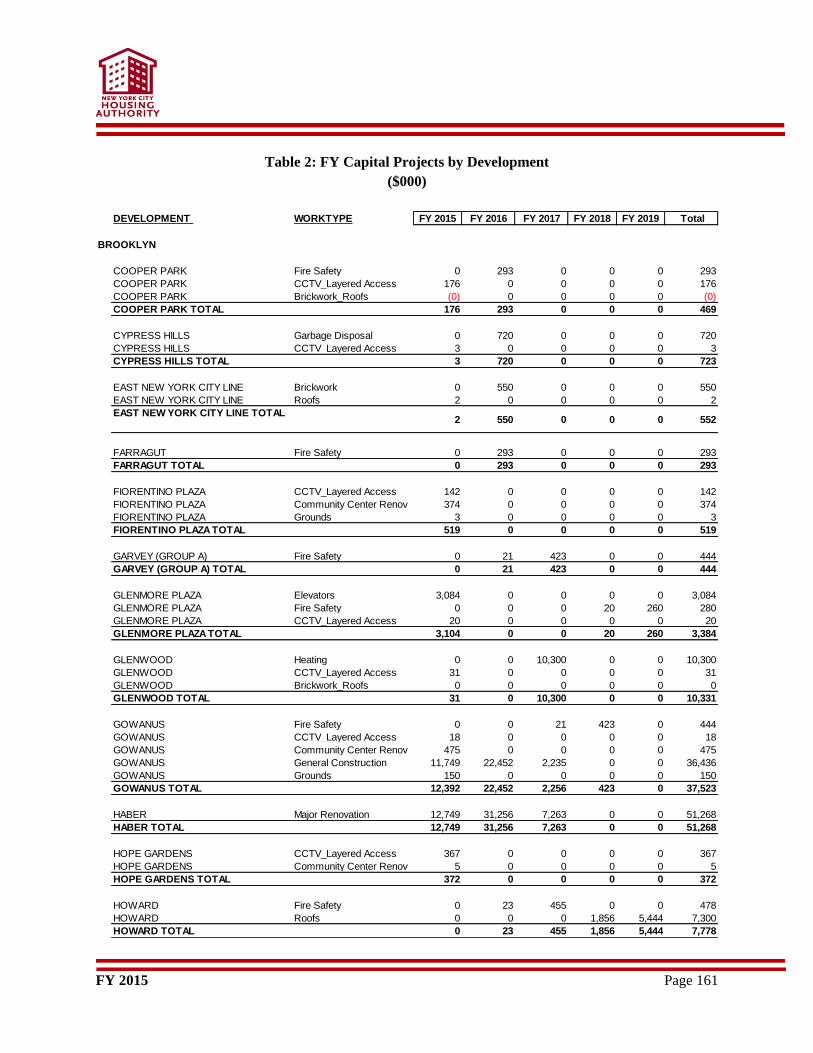
FY 2015 Page 161
Table 2: FY Capital Projects by Development
($000)
DEVELOPMENT WORKTYPE FY 2015 FY 2016 FY 2017 FY 2018 FY 2019 Total
COOPER PARK Fire Safety 0 293 0 0 0 293
COOPER PARK CCTV_Layered Access 176 0 0 0 0 176
COOPER PARK Brickwork_Roofs (0) 0 0 0 0 (0)
COOPER PARK TOTAL 176 293 0 0 0 469
CYPRESS HILLS Garbage Disposal 0 720 0 0 0 720
CYPRESS HILLS CCTV_Layered Access 3 0 0 0 0 3
CYPRESS HILLS TOTAL 3 720 0 0 0 723
EAST NEW YORK CITY LINE Brickwork 0 550 0 0 0 550
EAST NEW YORK CITY LINE Roofs 2 0 0 0 0 2
EAST NEW YORK CITY LINE TOTAL2 550 0 0 0 552
FARRAGUT Fire Safety 0 293 0 0 0 293
FARRAGUT TOTAL 0 293 0 0 0 293
FIORENTINO PLAZA CCTV_Layered Access 142 0 0 0 0 142
FIORENTINO PLAZA Community Center Renov 374 0 0 0 0 374
FIORENTINO PLAZA Grounds 3 0 0 0 0 3
FIORENTINO PLAZA TOTAL 519 0 0 0 0 519
GARVEY (GROUP A) Fire Safety 0 21 423 0 0 444
GARVEY (GROUP A) TOTAL 0 21 423 0 0 444
GLENMORE PLAZA Elevators 3,084 0 0 0 0 3,084
GLENMORE PLAZA Fire Safety 0 0 0 20 260 280
GLENMORE PLAZA CCTV_Layered Access 20 0 0 0 0 20
GLENMORE PLAZA TOTAL 3,104 0 0 20 260 3,384
GLENWOOD Heating 0 0 10,300 0 0 10,300
GLENWOOD CCTV_Layered Access 31 0 0 0 0 31
GLENWOOD Brickwork_Roofs 0 0 0 0 0 0
GLENWOOD TOTAL 31 0 10,300 0 0 10,331
GOWANUS Fire Safety 0 0 21 423 0 444
GOWANUS CCTV_Layered Access 18 0 0 0 0 18
GOWANUS Community Center Renov 475 0 0 0 0 475
GOWANUS General Construction 11,749 22,452 2,235 0 0 36,436
GOWANUS Grounds 150 0 0 0 0 150
GOWANUS TOTAL 12,392 22,452 2,256 423 0 37,523
HABER Major Renovation 12,749 31,256 7,263 0 0 51,268
HABER TOTAL 12,749 31,256 7,263 0 0 51,268
HOPE GARDENS CCTV_Layered Access 367 0 0 0 0 367
HOPE GARDENS Community Center Renov 5 0 0 0 0 5
HOPE GARDENS TOTAL 372 0 0 0 0 372
HOWARD Fire Safety 0 23 455 0 0 478
HOWARD Roofs 0 0 0 1,856 5,444 7,300
HOWARD TOTAL 0 23 455 1,856 5,444 7,778
BROOKLYN
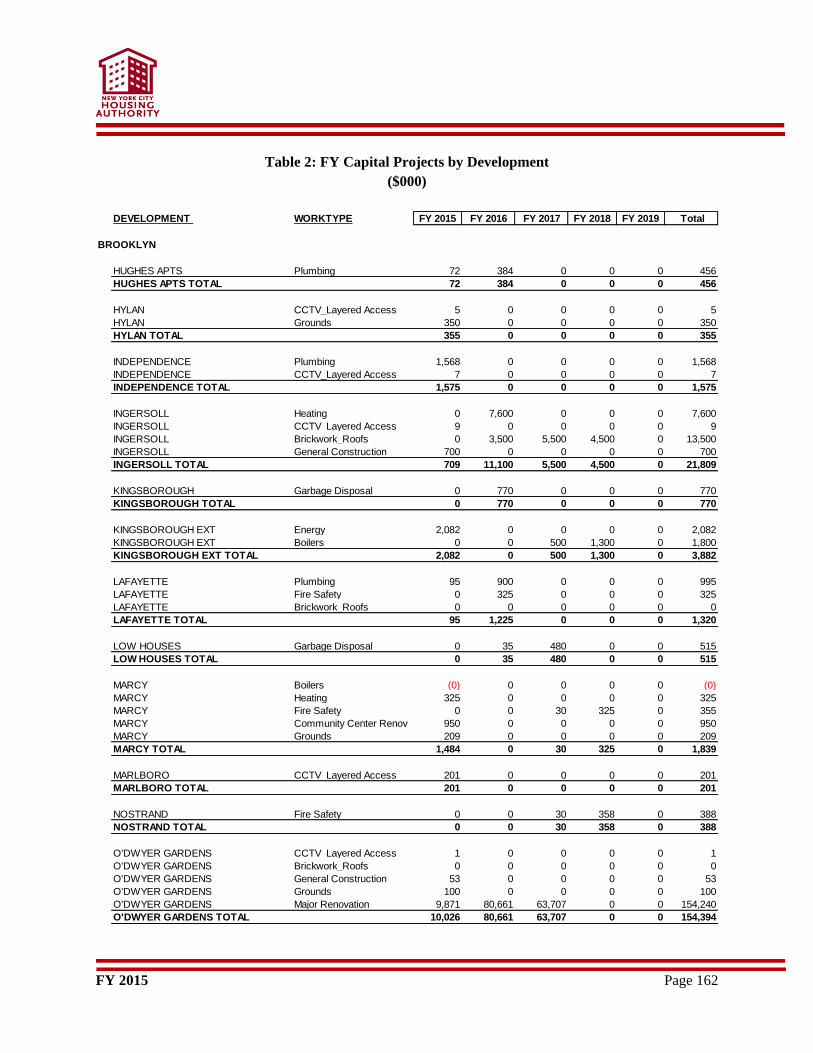
FY 2015 Page 162
Table 2: FY Capital Projects by Development
($000)
DEVELOPMENT WORKTYPE FY 2015 FY 2016 FY 2017 FY 2018 FY 2019 Total
HUGHES APTS Plumbing 72 384 0 0 0 456
HUGHES APTS TOTAL 72 384 0 0 0 456
HYLAN CCTV_Layered Access 5 0 0 0 0 5
HYLAN Grounds 350 0 0 0 0 350
HYLAN TOTAL 355 0 0 0 0 355
INDEPENDENCE Plumbing 1,568 0 0 0 0 1,568
INDEPENDENCE CCTV_Layered Access 7 0 0 0 0 7
INDEPENDENCE TOTAL 1,575 0 0 0 0 1,575
INGERSOLL Heating 0 7,600 0 0 0 7,600
INGERSOLL CCTV_Layered Access 9 0 0 0 0 9
INGERSOLL Brickwork_Roofs 0 3,500 5,500 4,500 0 13,500
INGERSOLL General Construction 700 0 0 0 0 700
INGERSOLL TOTAL 709 11,100 5,500 4,500 0 21,809
KINGSBOROUGH Garbage Disposal 0 770 0 0 0 770
KINGSBOROUGH TOTAL 0 770 0 0 0 770
KINGSBOROUGH EXT Energy 2,082 0 0 0 0 2,082
KINGSBOROUGH EXT Boilers 0 0 500 1,300 0 1,800
KINGSBOROUGH EXT TOTAL 2,082 0 500 1,300 0 3,882
LAFAYETTE Plumbing 95 900 0 0 0 995
LAFAYETTE Fire Safety 0 325 0 0 0 325
LAFAYETTE Brickwork_Roofs 0 0 0 0 0 0
LAFAYETTE TOTAL 95 1,225 0 0 0 1,320
LOW HOUSES Garbage Disposal 0 35 480 0 0 515
LOW HOUSES TOTAL 0 35 480 0 0 515
MARCY Boilers (0) 0 0 0 0 (0)
MARCY Heating 325 0 0 0 0 325
MARCY Fire Safety 0 0 30 325 0 355
MARCY Community Center Renov 950 0 0 0 0 950
MARCY Grounds 209 0 0 0 0 209
MARCY TOTAL 1,484 0 30 325 0 1,839
MARLBORO CCTV_Layered Access 201 0 0 0 0 201
MARLBORO TOTAL 201 0 0 0 0 201
NOSTRAND Fire Safety 0 0 30 358 0 388
NOSTRAND TOTAL 0 0 30 358 0 388
O'DWYER GARDENS CCTV_Layered Access 1 0 0 0 0 1
O'DWYER GARDENS Brickwork_Roofs 0 0 0 0 0 0
O'DWYER GARDENS General Construction 53 0 0 0 0 53
O'DWYER GARDENS Grounds 100 0 0 0 0 100
O'DWYER GARDENS Major Renovation 9,871 80,661 63,707 0 0 154,240
O'DWYER GARDENS TOTAL 10,026 80,661 63,707 0 0 154,394
BROOKLYN
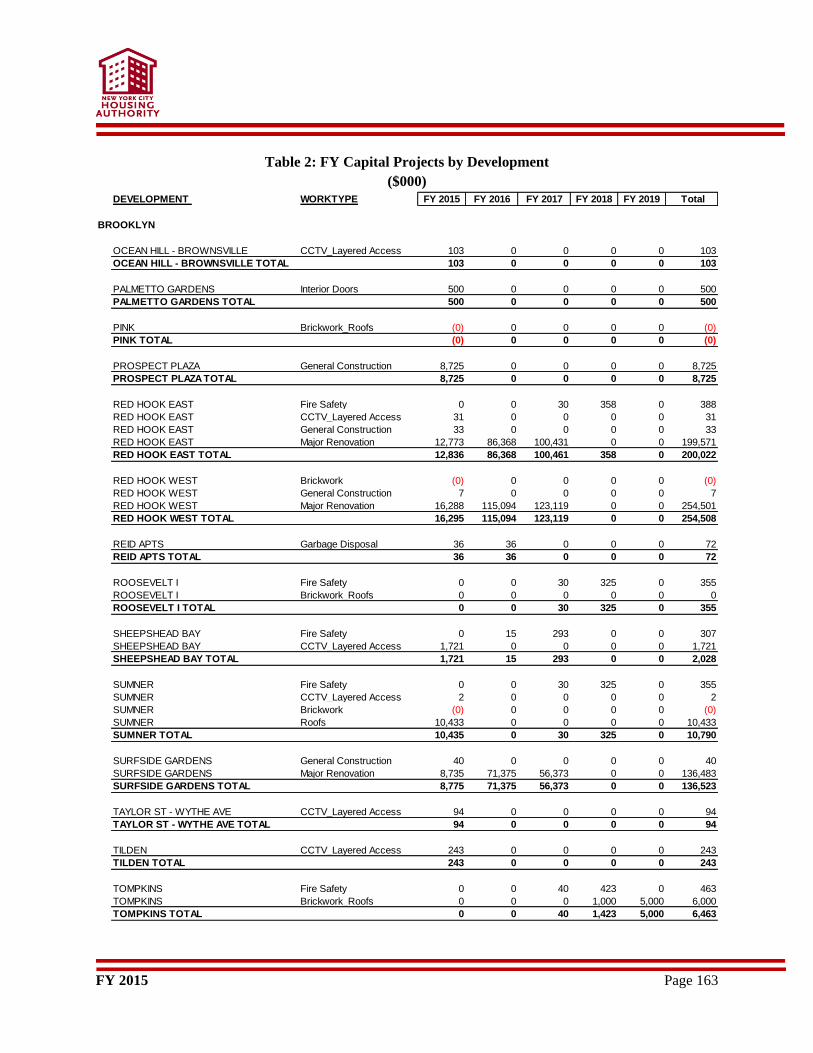
FY 2015 Page 163
Table 2: FY Capital Projects by Development
($000)
DEVELOPMENT WORKTYPE FY 2015 FY 2016 FY 2017 FY 2018 FY 2019 Total
OCEAN HILL - BROWNSVILLE CCTV_Layered Access 103 0 0 0 0 103
OCEAN HILL - BROWNSVILLE TOTAL 103 0 0 0 0 103
PALMETTO GARDENS Interior Doors 500 0 0 0 0 500
PALMETTO GARDENS TOTAL 500 0 0 0 0 500
PINK Brickwork_Roofs (0) 0 0 0 0 (0)
PINK TOTAL (0) 0 0 0 0 (0)
PROSPECT PLAZA General Construction 8,725 0 0 0 0 8,725
PROSPECT PLAZA TOTAL 8,725 0 0 0 0 8,725
RED HOOK EAST Fire Safety 0 0 30 358 0 388
RED HOOK EAST CCTV_Layered Access 31 0 0 0 0 31
RED HOOK EAST General Construction 33 0 0 0 0 33
RED HOOK EAST Major Renovation 12,773 86,368 100,431 0 0 199,571
RED HOOK EAST TOTAL 12,836 86,368 100,461 358 0 200,022
RED HOOK WEST Brickwork (0) 0 0 0 0 (0)
RED HOOK WEST General Construction 7 0 0 0 0 7
RED HOOK WEST Major Renovation 16,288 115,094 123,119 0 0 254,501
RED HOOK WEST TOTAL 16,295 115,094 123,119 0 0 254,508
REID APTS Garbage Disposal 36 36 0 0 0 72
REID APTS TOTAL 36 36 0 0 0 72
ROOSEVELT I Fire Safety 0 0 30 325 0 355
ROOSEVELT I Brickwork_Roofs 0 0 0 0 0 0
ROOSEVELT I TOTAL 0 0 30 325 0 355
SHEEPSHEAD BAY Fire Safety 0 15 293 0 0 307
SHEEPSHEAD BAY CCTV_Layered Access 1,721 0 0 0 0 1,721
SHEEPSHEAD BAY TOTAL 1,721 15 293 0 0 2,028
SUMNER Fire Safety 0 0 30 325 0 355
SUMNER CCTV_Layered Access 2 0 0 0 0 2
SUMNER Brickwork (0) 0 0 0 0 (0)
SUMNER Roofs 10,433 0 0 0 0 10,433
SUMNER TOTAL 10,435 0 30 325 0 10,790
SURFSIDE GARDENS General Construction 40 0 0 0 0 40
SURFSIDE GARDENS Major Renovation 8,735 71,375 56,373 0 0 136,483
SURFSIDE GARDENS TOTAL 8,775 71,375 56,373 0 0 136,523
TAYLOR ST - WYTHE AVE CCTV_Layered Access 94 0 0 0 0 94
TAYLOR ST - WYTHE AVE TOTAL 94 0 0 0 0 94
TILDEN CCTV_Layered Access 243 0 0 0 0 243
TILDEN TOTAL 243 0 0 0 0 243
TOMPKINS Fire Safety 0 0 40 423 0 463
TOMPKINS Brickwork_Roofs 0 0 0 1,000 5,000 6,000
TOMPKINS TOTAL 0 0 40 1,423 5,000 6,463
BROOKLYN
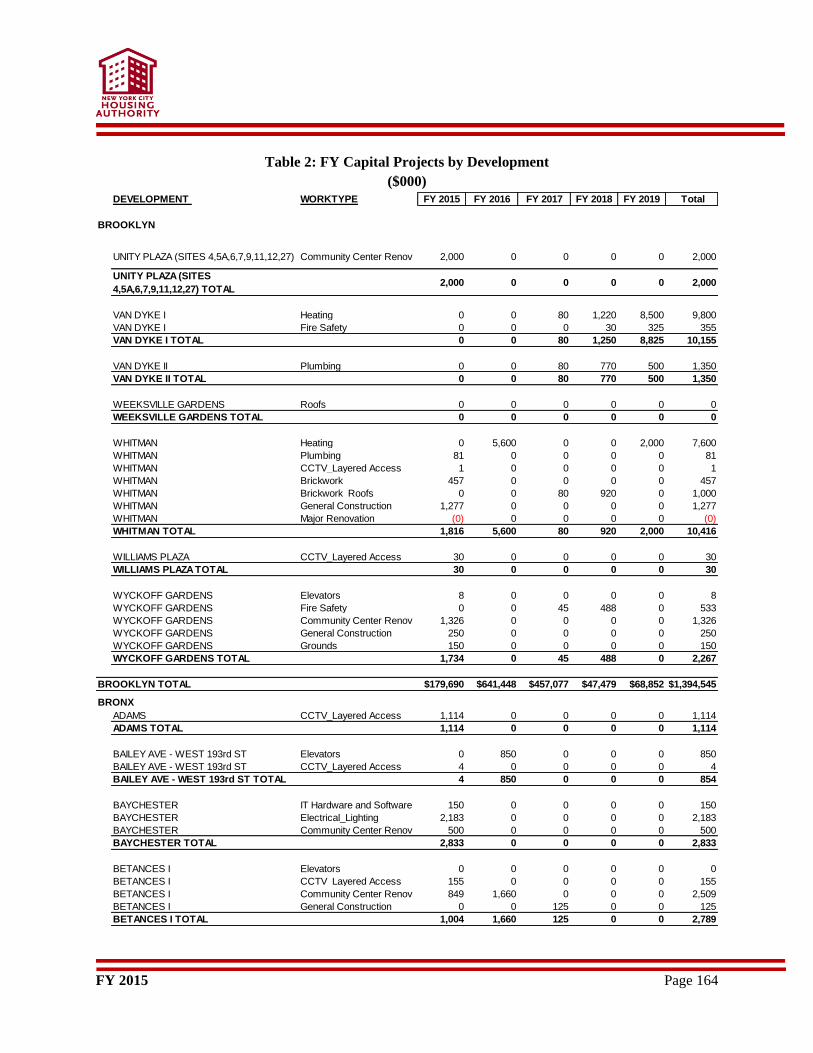
FY 2015 Page 164
Table 2: FY Capital Projects by Development
($000)
DEVELOPMENT WORKTYPE FY 2015 FY 2016 FY 2017 FY 2018 FY 2019 Total
UNITY PLAZA (SITES 4,5A,6,7,9,11,12,27) Community Center Renov 2,000 0 0 0 0 2,000
UNITY PLAZA (SITES
4,5A,6,7,9,11,12,27) TOTAL2,000 0 0 0 0 2,000
VAN DYKE I Heating 0 0 80 1,220 8,500 9,800
VAN DYKE I Fire Safety 0 0 0 30 325 355
VAN DYKE I TOTAL 0 0 80 1,250 8,825 10,155
VAN DYKE II Plumbing 0 0 80 770 500 1,350
VAN DYKE II TOTAL 0 0 80 770 500 1,350
WEEKSVILLE GARDENS Roofs 0 0 0 0 0 0
WEEKSVILLE GARDENS TOTAL 0 0 0 0 0 0
WHITMAN Heating 0 5,600 0 0 2,000 7,600
WHITMAN Plumbing 81 0 0 0 0 81
WHITMAN CCTV_Layered Access 1 0 0 0 0 1
WHITMAN Brickwork 457 0 0 0 0 457
WHITMAN Brickwork_Roofs 0 0 80 920 0 1,000
WHITMAN General Construction 1,277 0 0 0 0 1,277
WHITMAN Major Renovation (0) 0 0 0 0 (0)
WHITMAN TOTAL 1,816 5,600 80 920 2,000 10,416
WILLIAMS PLAZA CCTV_Layered Access 30 0 0 0 0 30
WILLIAMS PLAZA TOTAL 30 0 0 0 0 30
WYCKOFF GARDENS Elevators 8 0 0 0 0 8
WYCKOFF GARDENS Fire Safety 0 0 45 488 0 533
WYCKOFF GARDENS Community Center Renov 1,326 0 0 0 0 1,326
WYCKOFF GARDENS General Construction 250 0 0 0 0 250
WYCKOFF GARDENS Grounds 150 0 0 0 0 150
WYCKOFF GARDENS TOTAL 1,734 0 45 488 0 2,267
BROOKLYN TOTAL $179,690 $641,448 $457,077 $47,479 $68,852 $1,394,545
BROOKLYN
BRONX
ADAMS CCTV_Layered Access 1,114 0 0 0 0 1,114
ADAMS TOTAL 1,114 0 0 0 0 1,114
BAILEY AVE - WEST 193rd ST Elevators 0 850 0 0 0 850
BAILEY AVE - WEST 193rd ST CCTV_Layered Access 4 0 0 0 0 4
BAILEY AVE - WEST 193rd ST TOTAL 4 850 0 0 0 854
BAYCHESTER IT Hardware and Software 150 0 0 0 0 150
BAYCHESTER Electrical_Lighting 2,183 0 0 0 0 2,183
BAYCHESTER Community Center Renov 500 0 0 0 0 500
BAYCHESTER TOTAL 2,833 0 0 0 0 2,833
BETANCES I Elevators 0 0 0 0 0 0
BETANCES I CCTV_Layered Access 155 0 0 0 0 155
BETANCES I Community Center Renov 849 1,660 0 0 0 2,509
BETANCES I General Construction 0 0 125 0 0 125
BETANCES I TOTAL 1,004 1,660 125 0 0 2,789
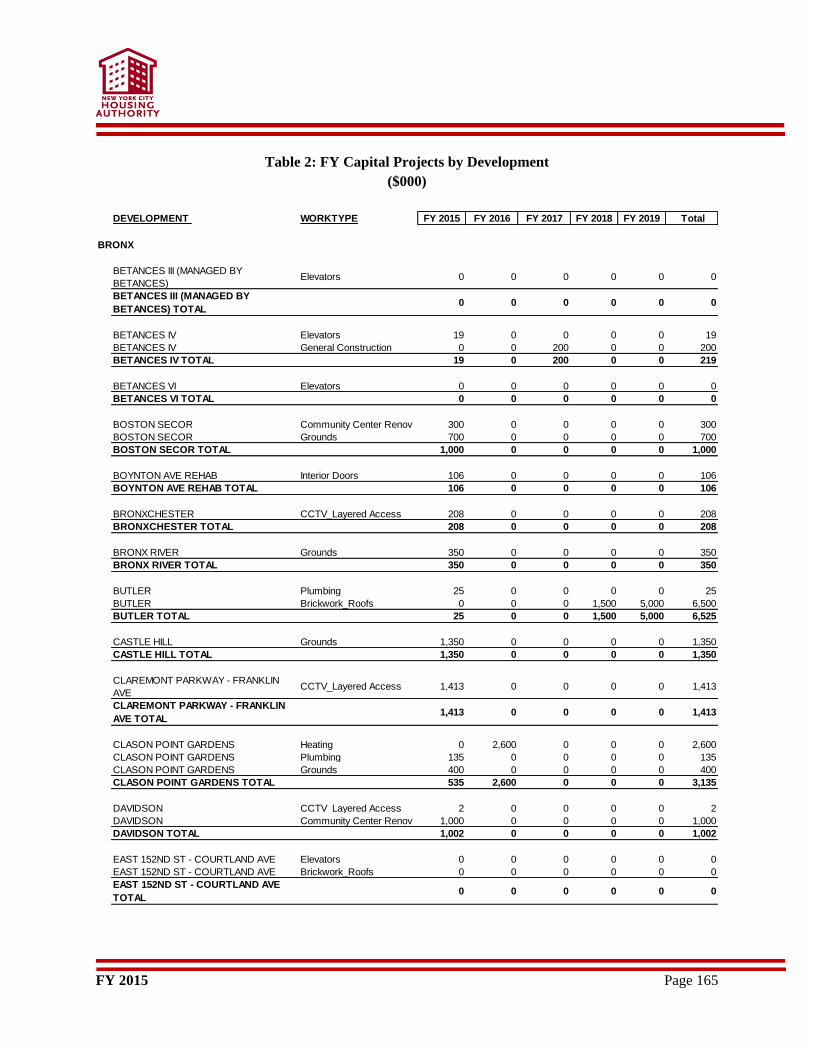
FY 2015 Page 165
Table 2: FY Capital Projects by Development
($000)
DEVELOPMENT WORKTYPE FY 2015 FY 2016 FY 2017 FY 2018 FY 2019 Total
BRONX
BETANCES III (MANAGED BY
BETANCES)Elevators 0 0 0 0 0 0
BETANCES III (MANAGED BY
BETANCES) TOTAL0 0 0 0 0 0
BETANCES IV Elevators 19 0 0 0 0 19
BETANCES IV General Construction 0 0 200 0 0 200
BETANCES IV TOTAL 19 0 200 0 0 219
BETANCES VI Elevators 0 0 0 0 0 0
BETANCES VI TOTAL 0 0 0 0 0 0
BOSTON SECOR Community Center Renov 300 0 0 0 0 300
BOSTON SECOR Grounds 700 0 0 0 0 700
BOSTON SECOR TOTAL 1,000 0 0 0 0 1,000
BOYNTON AVE REHAB Interior Doors 106 0 0 0 0 106
BOYNTON AVE REHAB TOTAL 106 0 0 0 0 106
BRONXCHESTER CCTV_Layered Access 208 0 0 0 0 208
BRONXCHESTER TOTAL 208 0 0 0 0 208
BRONX RIVER Grounds 350 0 0 0 0 350
BRONX RIVER TOTAL 350 0 0 0 0 350
BUTLER Plumbing 25 0 0 0 0 25
BUTLER Brickwork_Roofs 0 0 0 1,500 5,000 6,500
BUTLER TOTAL 25 0 0 1,500 5,000 6,525
CASTLE HILL Grounds 1,350 0 0 0 0 1,350
CASTLE HILL TOTAL 1,350 0 0 0 0 1,350
CLAREMONT PARKWAY - FRANKLIN
AVECCTV_Layered Access 1,413 0 0 0 0 1,413
CLAREMONT PARKWAY - FRANKLIN
AVE TOTAL1,413 0 0 0 0 1,413
CLASON POINT GARDENS Heating 0 2,600 0 0 0 2,600
CLASON POINT GARDENS Plumbing 135 0 0 0 0 135
CLASON POINT GARDENS Grounds 400 0 0 0 0 400
CLASON POINT GARDENS TOTAL 535 2,600 0 0 0 3,135
DAVIDSON CCTV_Layered Access 2 0 0 0 0 2
DAVIDSON Community Center Renov 1,000 0 0 0 0 1,000
DAVIDSON TOTAL 1,002 0 0 0 0 1,002
EAST 152ND ST - COURTLAND AVE Elevators 0 0 0 0 0 0
EAST 152ND ST - COURTLAND AVE Brickwork_Roofs 0 0 0 0 0 0
EAST 152ND ST - COURTLAND AVE
TOTAL0 0 0 0 0 0
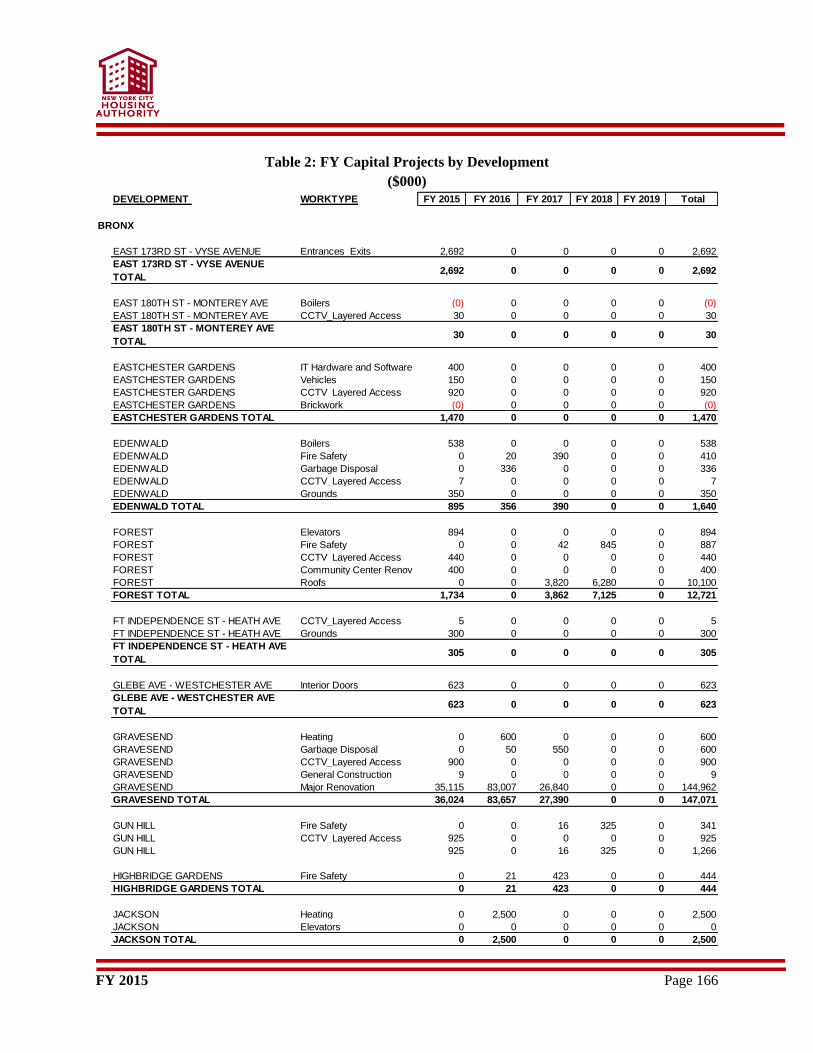
FY 2015 Page 166
Table 2: FY Capital Projects by Development
($000)
DEVELOPMENT WORKTYPE FY 2015 FY 2016 FY 2017 FY 2018 FY 2019 Total
BRONX
EAST 173RD ST - VYSE AVENUE Entrances_Exits 2,692 0 0 0 0 2,692
EAST 173RD ST - VYSE AVENUE
TOTAL2,692 0 0 0 0 2,692
EAST 180TH ST - MONTEREY AVE Boilers (0) 0 0 0 0 (0)
EAST 180TH ST - MONTEREY AVE CCTV_Layered Access 30 0 0 0 0 30
EAST 180TH ST - MONTEREY AVE
TOTAL30 0 0 0 0 30
EASTCHESTER GARDENS IT Hardware and Software 400 0 0 0 0 400
EASTCHESTER GARDENS Vehicles 150 0 0 0 0 150
EASTCHESTER GARDENS CCTV_Layered Access 920 0 0 0 0 920
EASTCHESTER GARDENS Brickwork (0) 0 0 0 0 (0)
EASTCHESTER GARDENS TOTAL 1,470 0 0 0 0 1,470
EDENWALD Boilers 538 0 0 0 0 538
EDENWALD Fire Safety 0 20 390 0 0 410
EDENWALD Garbage Disposal 0 336 0 0 0 336
EDENWALD CCTV_Layered Access 7 0 0 0 0 7
EDENWALD Grounds 350 0 0 0 0 350
EDENWALD TOTAL 895 356 390 0 0 1,640
FOREST Elevators 894 0 0 0 0 894
FOREST Fire Safety 0 0 42 845 0 887
FOREST CCTV_Layered Access 440 0 0 0 0 440
FOREST Community Center Renov 400 0 0 0 0 400
FOREST Roofs 0 0 3,820 6,280 0 10,100
FOREST TOTAL 1,734 0 3,862 7,125 0 12,721
FT INDEPENDENCE ST - HEATH AVE CCTV_Layered Access 5 0 0 0 0 5
FT INDEPENDENCE ST - HEATH AVE Grounds 300 0 0 0 0 300
FT INDEPENDENCE ST - HEATH AVE
TOTAL305 0 0 0 0 305
GLEBE AVE - WESTCHESTER AVE Interior Doors 623 0 0 0 0 623
GLEBE AVE - WESTCHESTER AVE
TOTAL623 0 0 0 0 623
GRAVESEND Heating 0 600 0 0 0 600
GRAVESEND Garbage Disposal 0 50 550 0 0 600
GRAVESEND CCTV_Layered Access 900 0 0 0 0 900
GRAVESEND General Construction 9 0 0 0 0 9
GRAVESEND Major Renovation 35,115 83,007 26,840 0 0 144,962
GRAVESEND TOTAL 36,024 83,657 27,390 0 0 147,071
GUN HILL Fire Safety 0 0 16 325 0 341
GUN HILL CCTV_Layered Access 925 0 0 0 0 925
GUN HILL 925 0 16 325 0 1,266
HIGHBRIDGE GARDENS Fire Safety 0 21 423 0 0 444
HIGHBRIDGE GARDENS TOTAL 0 21 423 0 0 444
JACKSON Heating 0 2,500 0 0 0 2,500
JACKSON Elevators 0 0 0 0 0 0
JACKSON TOTAL 0 2,500 0 0 0 2,500
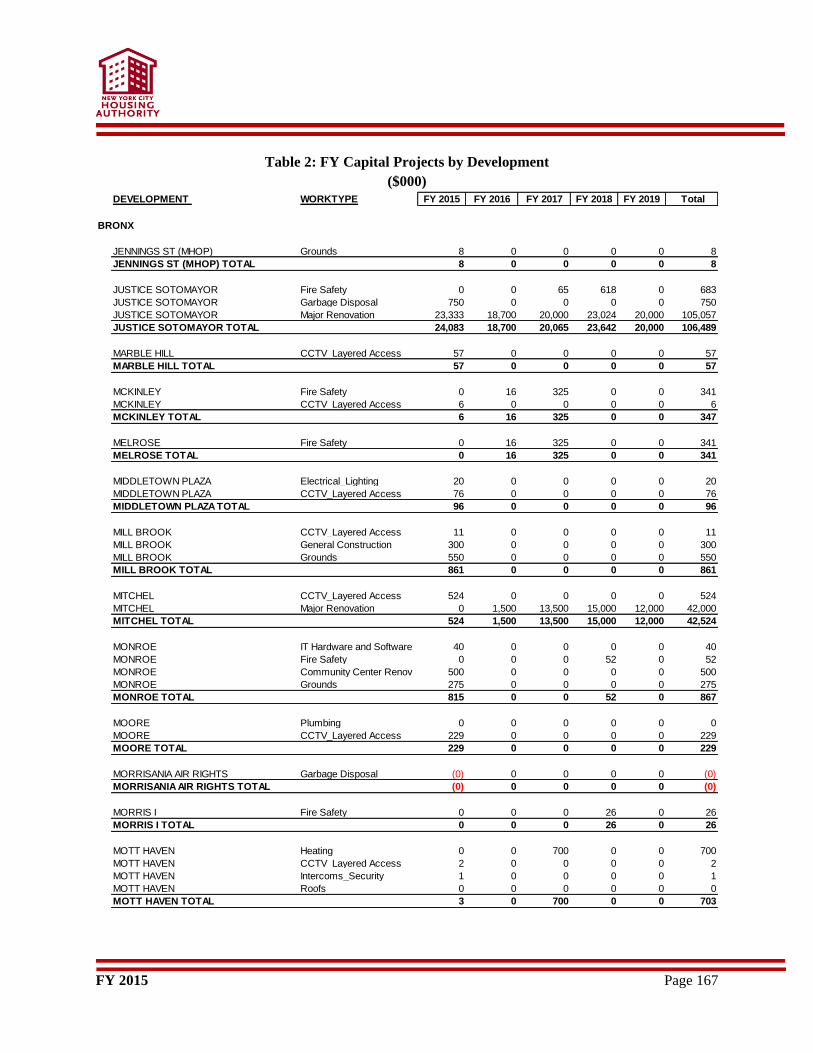
FY 2015 Page 167
Table 2: FY Capital Projects by Development
($000)
DEVELOPMENT WORKTYPE FY 2015 FY 2016 FY 2017 FY 2018 FY 2019 Total
BRONX
JENNINGS ST (MHOP) Grounds 8 0 0 0 0 8
JENNINGS ST (MHOP) TOTAL 8 0 0 0 0 8
JUSTICE SOTOMAYOR Fire Safety 0 0 65 618 0 683
JUSTICE SOTOMAYOR Garbage Disposal 750 0 0 0 0 750
JUSTICE SOTOMAYOR Major Renovation 23,333 18,700 20,000 23,024 20,000 105,057
JUSTICE SOTOMAYOR TOTAL 24,083 18,700 20,065 23,642 20,000 106,489
MARBLE HILL CCTV_Layered Access 57 0 0 0 0 57
MARBLE HILL TOTAL 57 0 0 0 0 57
MCKINLEY Fire Safety 0 16 325 0 0 341
MCKINLEY CCTV_Layered Access 6 0 0 0 0 6
MCKINLEY TOTAL 6 16 325 0 0 347
MELROSE Fire Safety 0 16 325 0 0 341
MELROSE TOTAL 0 16 325 0 0 341
MIDDLETOWN PLAZA Electrical_Lighting 20 0 0 0 0 20
MIDDLETOWN PLAZA CCTV_Layered Access 76 0 0 0 0 76
MIDDLETOWN PLAZA TOTAL 96 0 0 0 0 96
MILL BROOK CCTV_Layered Access 11 0 0 0 0 11
MILL BROOK General Construction 300 0 0 0 0 300
MILL BROOK Grounds 550 0 0 0 0 550
MILL BROOK TOTAL 861 0 0 0 0 861
MITCHEL CCTV_Layered Access 524 0 0 0 0 524
MITCHEL Major Renovation 0 1,500 13,500 15,000 12,000 42,000
MITCHEL TOTAL 524 1,500 13,500 15,000 12,000 42,524
MONROE IT Hardware and Software 40 0 0 0 0 40
MONROE Fire Safety 0 0 0 52 0 52
MONROE Community Center Renov 500 0 0 0 0 500
MONROE Grounds 275 0 0 0 0 275
MONROE TOTAL 815 0 0 52 0 867
MOORE Plumbing 0 0 0 0 0 0
MOORE CCTV_Layered Access 229 0 0 0 0 229
MOORE TOTAL 229 0 0 0 0 229
MORRISANIA AIR RIGHTS Garbage Disposal (0) 0 0 0 0 (0)
MORRISANIA AIR RIGHTS TOTAL (0) 0 0 0 0 (0)
MORRIS I Fire Safety 0 0 0 26 0 26
MORRIS I TOTAL 0 0 0 26 0 26
MOTT HAVEN Heating 0 0 700 0 0 700
MOTT HAVEN CCTV_Layered Access 2 0 0 0 0 2
MOTT HAVEN Intercoms_Security 1 0 0 0 0 1
MOTT HAVEN Roofs 0 0 0 0 0 0
MOTT HAVEN TOTAL 3 0 700 0 0 703
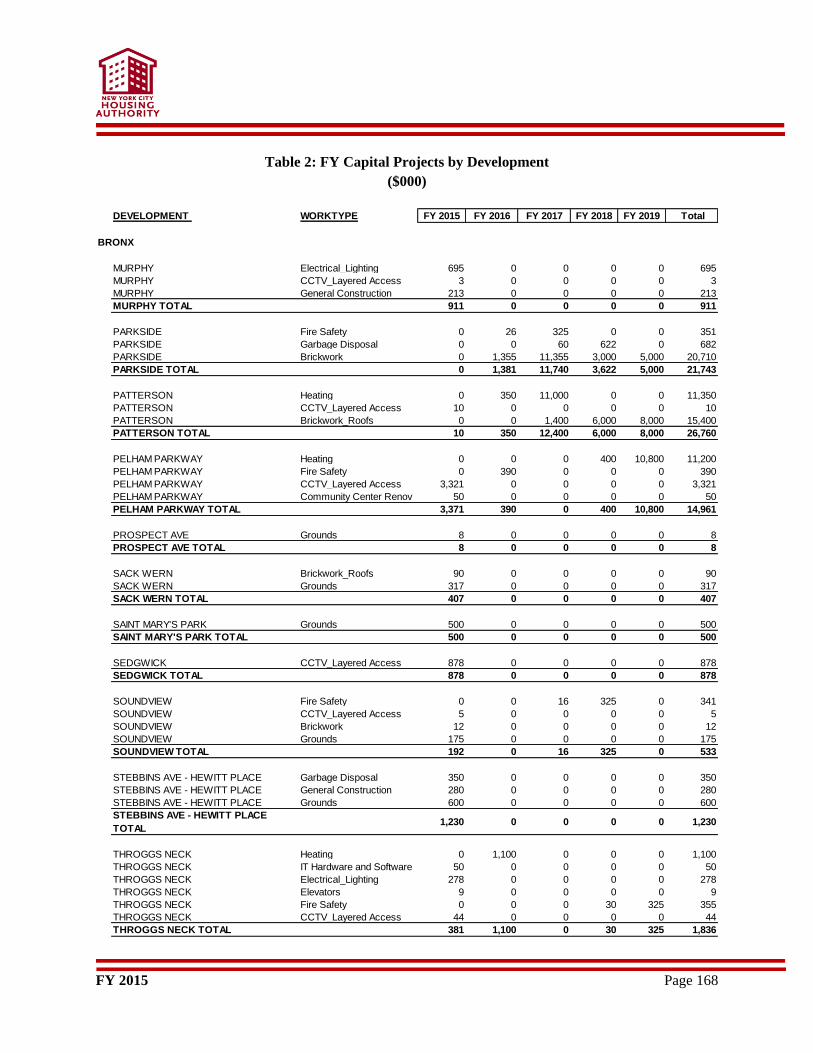
FY 2015 Page 168
Table 2: FY Capital Projects by Development
($000)
DEVELOPMENT WORKTYPE FY 2015 FY 2016 FY 2017 FY 2018 FY 2019 Total
BRONX
MURPHY Electrical_Lighting 695 0 0 0 0 695
MURPHY CCTV_Layered Access 3 0 0 0 0 3
MURPHY General Construction 213 0 0 0 0 213
MURPHY TOTAL 911 0 0 0 0 911
PARKSIDE Fire Safety 0 26 325 0 0 351
PARKSIDE Garbage Disposal 0 0 60 622 0 682
PARKSIDE Brickwork 0 1,355 11,355 3,000 5,000 20,710
PARKSIDE TOTAL 0 1,381 11,740 3,622 5,000 21,743
PATTERSON Heating 0 350 11,000 0 0 11,350
PATTERSON CCTV_Layered Access 10 0 0 0 0 10
PATTERSON Brickwork_Roofs 0 0 1,400 6,000 8,000 15,400
PATTERSON TOTAL 10 350 12,400 6,000 8,000 26,760
PELHAM PARKWAY Heating 0 0 0 400 10,800 11,200
PELHAM PARKWAY Fire Safety 0 390 0 0 0 390
PELHAM PARKWAY CCTV_Layered Access 3,321 0 0 0 0 3,321
PELHAM PARKWAY Community Center Renov 50 0 0 0 0 50
PELHAM PARKWAY TOTAL 3,371 390 0 400 10,800 14,961
PROSPECT AVE Grounds 8 0 0 0 0 8
PROSPECT AVE TOTAL 8 0 0 0 0 8
SACK WERN Brickwork_Roofs 90 0 0 0 0 90
SACK WERN Grounds 317 0 0 0 0 317
SACK WERN TOTAL 407 0 0 0 0 407
SAINT MARY'S PARK Grounds 500 0 0 0 0 500
SAINT MARY'S PARK TOTAL 500 0 0 0 0 500
SEDGWICK CCTV_Layered Access 878 0 0 0 0 878
SEDGWICK TOTAL 878 0 0 0 0 878
SOUNDVIEW Fire Safety 0 0 16 325 0 341
SOUNDVIEW CCTV_Layered Access 5 0 0 0 0 5
SOUNDVIEW Brickwork 12 0 0 0 0 12
SOUNDVIEW Grounds 175 0 0 0 0 175
SOUNDVIEW TOTAL 192 0 16 325 0 533
STEBBINS AVE - HEWITT PLACE Garbage Disposal 350 0 0 0 0 350
STEBBINS AVE - HEWITT PLACE General Construction 280 0 0 0 0 280
STEBBINS AVE - HEWITT PLACE Grounds 600 0 0 0 0 600
STEBBINS AVE - HEWITT PLACE
TOTAL1,230 0 0 0 0 1,230
THROGGS NECK Heating 0 1,100 0 0 0 1,100
THROGGS NECK IT Hardware and Software 50 0 0 0 0 50
THROGGS NECK Electrical_Lighting 278 0 0 0 0 278
THROGGS NECK Elevators 9 0 0 0 0 9
THROGGS NECK Fire Safety 0 0 0 30 325 355
THROGGS NECK CCTV_Layered Access 44 0 0 0 0 44
THROGGS NECK TOTAL 381 1,100 0 30 325 1,836
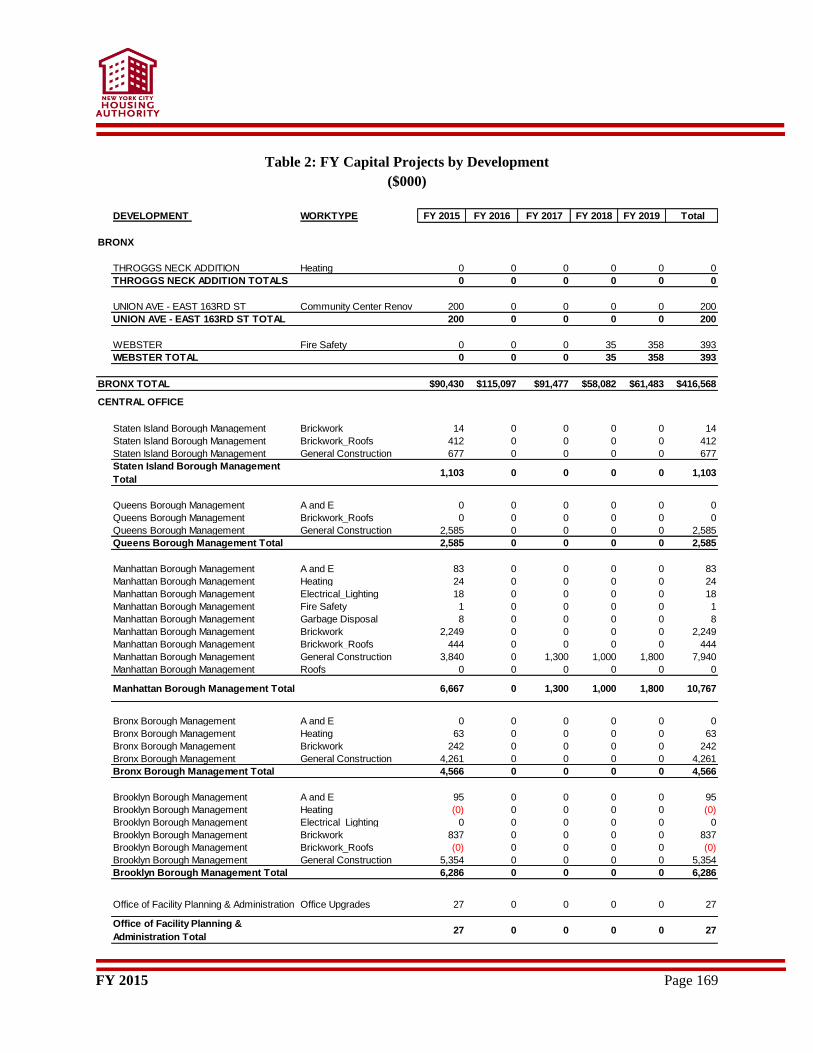
FY 2015 Page 169
Table 2: FY Capital Projects by Development
($000)
DEVELOPMENT WORKTYPE FY 2015 FY 2016 FY 2017 FY 2018 FY 2019 Total
BRONX
THROGGS NECK ADDITION Heating 0 0 0 0 0 0
THROGGS NECK ADDITION TOTALS 0 0 0 0 0 0
UNION AVE - EAST 163RD ST Community Center Renov 200 0 0 0 0 200
UNION AVE - EAST 163RD ST TOTAL 200 0 0 0 0 200
WEBSTER Fire Safety 0 0 0 35 358 393
WEBSTER TOTAL 0 0 0 35 358 393
BRONX TOTAL $90,430 $115,097 $91,477 $58,082 $61,483 $416,568
Staten Island Borough Management Brickwork 14 0 0 0 0 14
Staten Island Borough Management Brickwork_Roofs 412 0 0 0 0 412
Staten Island Borough Management General Construction 677 0 0 0 0 677
Staten Island Borough Management
Total1,103 0 0 0 0 1,103
Queens Borough Management A and E 0 0 0 0 0 0
Queens Borough Management Brickwork_Roofs 0 0 0 0 0 0
Queens Borough Management General Construction 2,585 0 0 0 0 2,585
Queens Borough Management Total 2,585 0 0 0 0 2,585
Manhattan Borough Management A and E 83 0 0 0 0 83
Manhattan Borough Management Heating 24 0 0 0 0 24
Manhattan Borough Management Electrical_Lighting 18 0 0 0 0 18
Manhattan Borough Management Fire Safety 1 0 0 0 0 1
Manhattan Borough Management Garbage Disposal 8 0 0 0 0 8
Manhattan Borough Management Brickwork 2,249 0 0 0 0 2,249
Manhattan Borough Management Brickwork_Roofs 444 0 0 0 0 444
Manhattan Borough Management General Construction 3,840 0 1,300 1,000 1,800 7,940
Manhattan Borough Management Roofs 0 0 0 0 0 0
Manhattan Borough Management Total 6,667 0 1,300 1,000 1,800 10,767
Bronx Borough Management A and E 0 0 0 0 0 0
Bronx Borough Management Heating 63 0 0 0 0 63
Bronx Borough Management Brickwork 242 0 0 0 0 242
Bronx Borough Management General Construction 4,261 0 0 0 0 4,261
Bronx Borough Management Total 4,566 0 0 0 0 4,566
Brooklyn Borough Management A and E 95 0 0 0 0 95
Brooklyn Borough Management Heating (0) 0 0 0 0 (0)
Brooklyn Borough Management Electrical_Lighting 0 0 0 0 0 0
Brooklyn Borough Management Brickwork 837 0 0 0 0 837
Brooklyn Borough Management Brickwork_Roofs (0) 0 0 0 0 (0)
Brooklyn Borough Management General Construction 5,354 0 0 0 0 5,354
Brooklyn Borough Management Total 6,286 0 0 0 0 6,286
Office of Facility Planning & Administration Office Upgrades 27 0 0 0 0 27
Office of Facility Planning &
Administration Total27 0 0 0 0 27
CENTRAL OFFICE
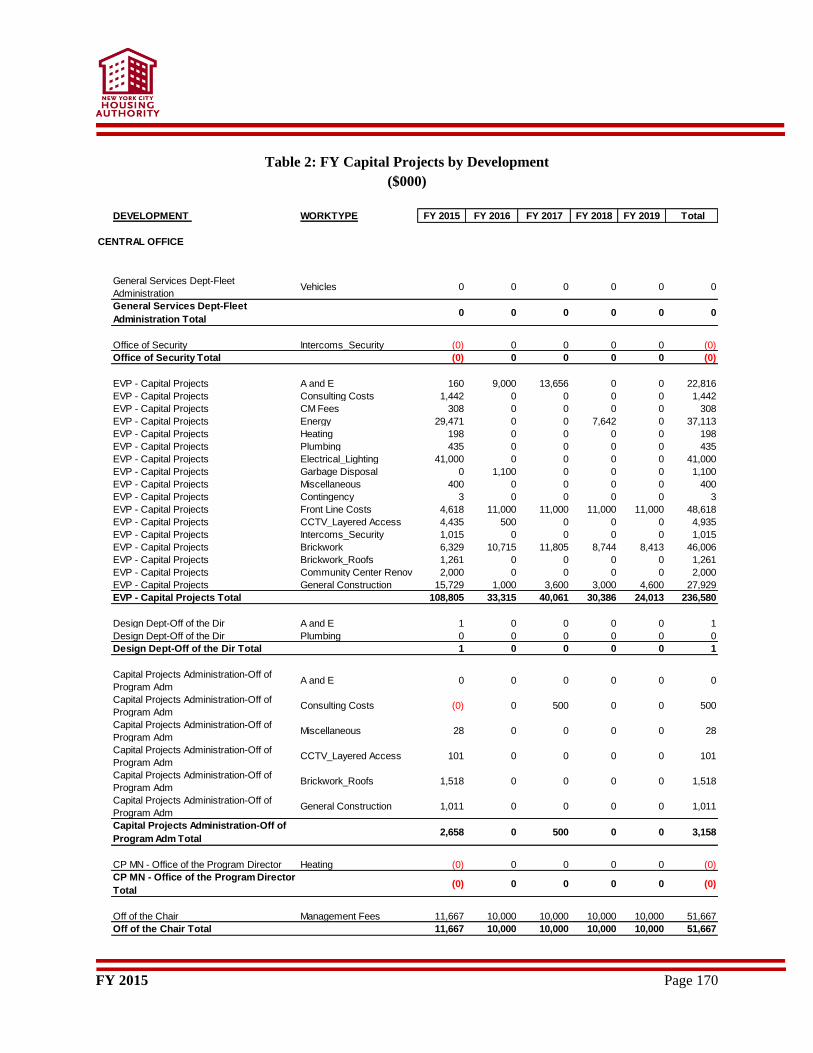
FY 2015 Page 170
Table 2: FY Capital Projects by Development
($000)
DEVELOPMENT WORKTYPE FY 2015 FY 2016 FY 2017 FY 2018 FY 2019 Total
General Services Dept-Fleet
AdministrationVehicles 0 0 0 0 0 0
General Services Dept-Fleet
Administration Total0 0 0 0 0 0
Office of Security Intercoms_Security (0) 0 0 0 0 (0)
Office of Security Total (0) 0 0 0 0 (0)
EVP - Capital Projects A and E 160 9,000 13,656 0 0 22,816
EVP - Capital Projects Consulting Costs 1,442 0 0 0 0 1,442
EVP - Capital Projects CM Fees 308 0 0 0 0 308
EVP - Capital Projects Energy 29,471 0 0 7,642 0 37,113
EVP - Capital Projects Heating 198 0 0 0 0 198
EVP - Capital Projects Plumbing 435 0 0 0 0 435
EVP - Capital Projects Electrical_Lighting 41,000 0 0 0 0 41,000
EVP - Capital Projects Garbage Disposal 0 1,100 0 0 0 1,100
EVP - Capital Projects Miscellaneous 400 0 0 0 0 400
EVP - Capital Projects Contingency 3 0 0 0 0 3
EVP - Capital Projects Front Line Costs 4,618 11,000 11,000 11,000 11,000 48,618
EVP - Capital Projects CCTV_Layered Access 4,435 500 0 0 0 4,935
EVP - Capital Projects Intercoms_Security 1,015 0 0 0 0 1,015
EVP - Capital Projects Brickwork 6,329 10,715 11,805 8,744 8,413 46,006
EVP - Capital Projects Brickwork_Roofs 1,261 0 0 0 0 1,261
EVP - Capital Projects Community Center Renov 2,000 0 0 0 0 2,000
EVP - Capital Projects General Construction 15,729 1,000 3,600 3,000 4,600 27,929
EVP - Capital Projects Total 108,805 33,315 40,061 30,386 24,013 236,580
Design Dept-Off of the Dir A and E 1 0 0 0 0 1
Design Dept-Off of the Dir Plumbing 0 0 0 0 0 0
Design Dept-Off of the Dir Total 1 0 0 0 0 1
Capital Projects Administration-Off of
Program AdmA and E 0 0 0 0 0 0
Capital Projects Administration-Off of
Program AdmConsulting Costs (0) 0 500 0 0 500
Capital Projects Administration-Off of
Program AdmMiscellaneous 28 0 0 0 0 28
Capital Projects Administration-Off of
Program AdmCCTV_Layered Access 101 0 0 0 0 101
Capital Projects Administration-Off of
Program AdmBrickwork_Roofs 1,518 0 0 0 0 1,518
Capital Projects Administration-Off of
Program AdmGeneral Construction 1,011 0 0 0 0 1,011
Capital Projects Administration-Off of
Program Adm Total2,658 0 500 0 0 3,158
CP MN - Office of the Program Director Heating (0) 0 0 0 0 (0)
CP MN - Office of the Program Director
Total(0) 0 0 0 0 (0)
Off of the Chair Management Fees 11,667 10,000 10,000 10,000 10,000 51,667
Off of the Chair Total 11,667 10,000 10,000 10,000 10,000 51,667
CENTRAL OFFICE
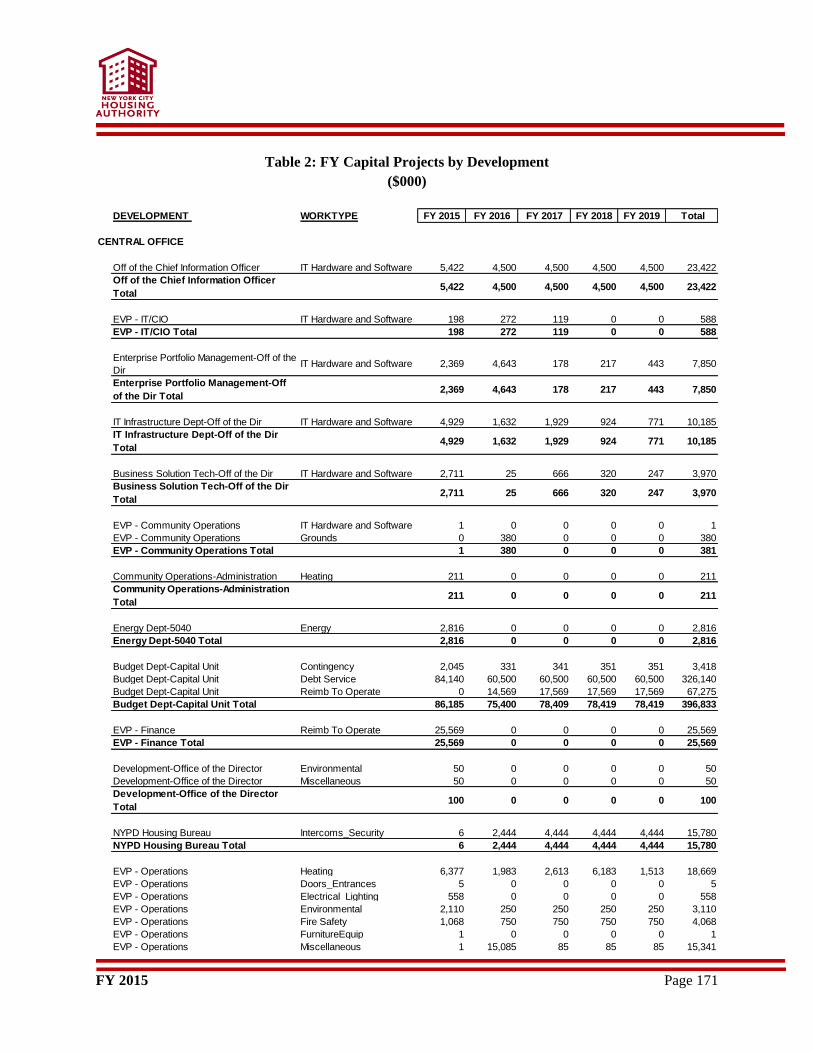
FY 2015 Page 171
Table 2: FY Capital Projects by Development
($000)
DEVELOPMENT WORKTYPE FY 2015 FY 2016 FY 2017 FY 2018 FY 2019 Total
Off of the Chief Information Officer IT Hardware and Software 5,422 4,500 4,500 4,500 4,500 23,422
Off of the Chief Information Officer
Total5,422 4,500 4,500 4,500 4,500 23,422
EVP - IT/CIO IT Hardware and Software 198 272 119 0 0 588
EVP - IT/CIO Total 198 272 119 0 0 588
Enterprise Portfolio Management-Off of the
DirIT Hardware and Software 2,369 4,643 178 217 443 7,850
Enterprise Portfolio Management-Off
of the Dir Total2,369 4,643 178 217 443 7,850
IT Infrastructure Dept-Off of the Dir IT Hardware and Software 4,929 1,632 1,929 924 771 10,185
IT Infrastructure Dept-Off of the Dir
Total4,929 1,632 1,929 924 771 10,185
Business Solution Tech-Off of the Dir IT Hardware and Software 2,711 25 666 320 247 3,970
Business Solution Tech-Off of the Dir
Total2,711 25 666 320 247 3,970
EVP - Community Operations IT Hardware and Software 1 0 0 0 0 1
EVP - Community Operations Grounds 0 380 0 0 0 380
EVP - Community Operations Total 1 380 0 0 0 381
Community Operations-Administration Heating 211 0 0 0 0 211
Community Operations-Administration
Total211 0 0 0 0 211
Energy Dept-5040 Energy 2,816 0 0 0 0 2,816
Energy Dept-5040 Total 2,816 0 0 0 0 2,816
Budget Dept-Capital Unit Contingency 2,045 331 341 351 351 3,418
Budget Dept-Capital Unit Debt Service 84,140 60,500 60,500 60,500 60,500 326,140
Budget Dept-Capital Unit Reimb To Operate 0 14,569 17,569 17,569 17,569 67,275
Budget Dept-Capital Unit Total 86,185 75,400 78,409 78,419 78,419 396,833
EVP - Finance Reimb To Operate 25,569 0 0 0 0 25,569
EVP - Finance Total 25,569 0 0 0 0 25,569
Development-Office of the Director Environmental 50 0 0 0 0 50
Development-Office of the Director Miscellaneous 50 0 0 0 0 50
Development-Office of the Director
Total100 0 0 0 0 100
NYPD Housing Bureau Intercoms_Security 6 2,444 4,444 4,444 4,444 15,780
NYPD Housing Bureau Total 6 2,444 4,444 4,444 4,444 15,780
EVP - Operations Heating 6,377 1,983 2,613 6,183 1,513 18,669
EVP - Operations Doors_Entrances 5 0 0 0 0 5
EVP - Operations Electrical_Lighting 558 0 0 0 0 558
EVP - Operations Environmental 2,110 250 250 250 250 3,110
EVP - Operations Fire Safety 1,068 750 750 750 750 4,068
EVP - Operations FurnitureEquip 1 0 0 0 0 1
EVP - Operations Miscellaneous 1 15,085 85 85 85 15,341
CENTRAL OFFICE
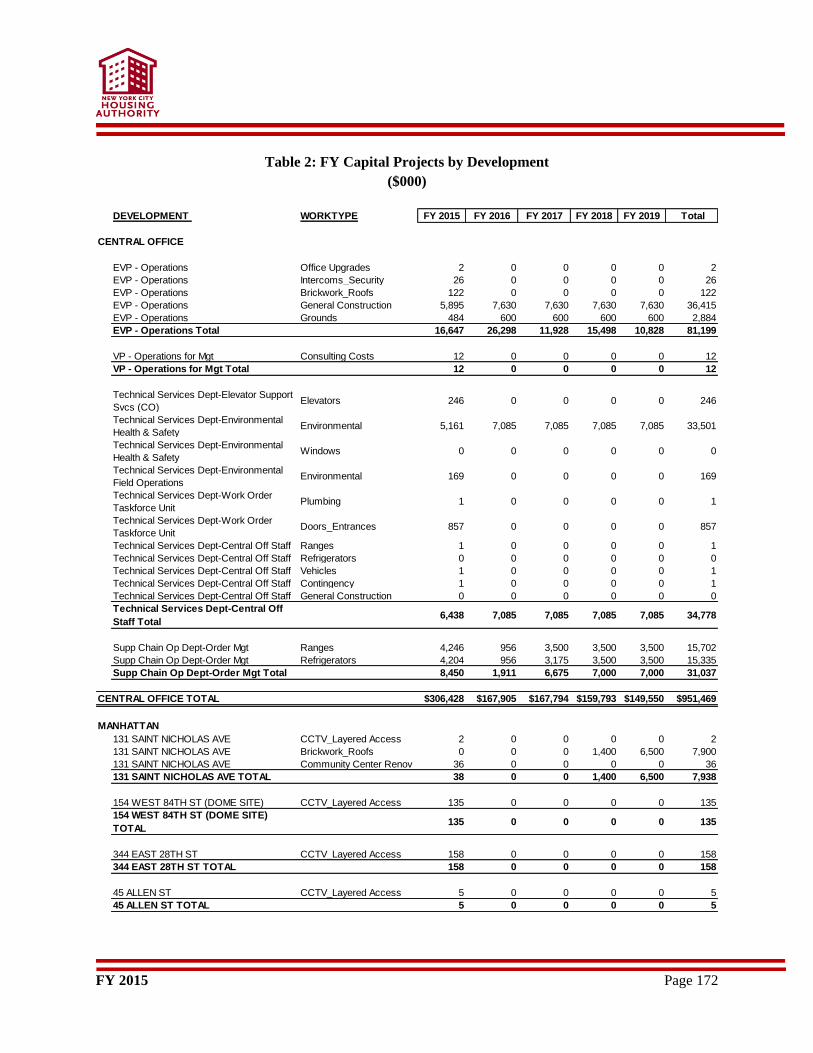
FY 2015 Page 172
Table 2: FY Capital Projects by Development
($000)
DEVELOPMENT WORKTYPE FY 2015 FY 2016 FY 2017 FY 2018 FY 2019 Total
EVP - Operations Office Upgrades 2 0 0 0 0 2
EVP - Operations Intercoms_Security 26 0 0 0 0 26
EVP - Operations Brickwork_Roofs 122 0 0 0 0 122
EVP - Operations General Construction 5,895 7,630 7,630 7,630 7,630 36,415
EVP - Operations Grounds 484 600 600 600 600 2,884
EVP - Operations Total 16,647 26,298 11,928 15,498 10,828 81,199
VP - Operations for Mgt Consulting Costs 12 0 0 0 0 12
VP - Operations for Mgt Total 12 0 0 0 0 12
Technical Services Dept-Elevator Support
Svcs (CO)Elevators 246 0 0 0 0 246
Technical Services Dept-Environmental
Health & SafetyEnvironmental 5,161 7,085 7,085 7,085 7,085 33,501
Technical Services Dept-Environmental
Health & SafetyWindows 0 0 0 0 0 0
Technical Services Dept-Environmental
Field OperationsEnvironmental 169 0 0 0 0 169
Technical Services Dept-Work Order
Taskforce UnitPlumbing 1 0 0 0 0 1
Technical Services Dept-Work Order
Taskforce UnitDoors_Entrances 857 0 0 0 0 857
Technical Services Dept-Central Off Staff Ranges 1 0 0 0 0 1
Technical Services Dept-Central Off Staff Refrigerators 0 0 0 0 0 0
Technical Services Dept-Central Off Staff Vehicles 1 0 0 0 0 1
Technical Services Dept-Central Off Staff Contingency 1 0 0 0 0 1
Technical Services Dept-Central Off Staff General Construction 0 0 0 0 0 0
Technical Services Dept-Central Off
Staff Total6,438 7,085 7,085 7,085 7,085 34,778
Supp Chain Op Dept-Order Mgt Ranges 4,246 956 3,500 3,500 3,500 15,702
Supp Chain Op Dept-Order Mgt Refrigerators 4,204 956 3,175 3,500 3,500 15,335
Supp Chain Op Dept-Order Mgt Total 8,450 1,911 6,675 7,000 7,000 31,037
CENTRAL OFFICE TOTAL $306,428 $167,905 $167,794 $159,793 $149,550 $951,469
131 SAINT NICHOLAS AVE CCTV_Layered Access 2 0 0 0 0 2
131 SAINT NICHOLAS AVE Brickwork_Roofs 0 0 0 1,400 6,500 7,900
131 SAINT NICHOLAS AVE Community Center Renov 36 0 0 0 0 36
131 SAINT NICHOLAS AVE TOTAL 38 0 0 1,400 6,500 7,938
154 WEST 84TH ST (DOME SITE) CCTV_Layered Access 135 0 0 0 0 135
154 WEST 84TH ST (DOME SITE)
TOTAL135 0 0 0 0 135
344 EAST 28TH ST CCTV_Layered Access 158 0 0 0 0 158
344 EAST 28TH ST TOTAL 158 0 0 0 0 158
45 ALLEN ST CCTV_Layered Access 5 0 0 0 0 5
45 ALLEN ST TOTAL 5 0 0 0 0 5
CENTRAL OFFICE
MANHATTAN
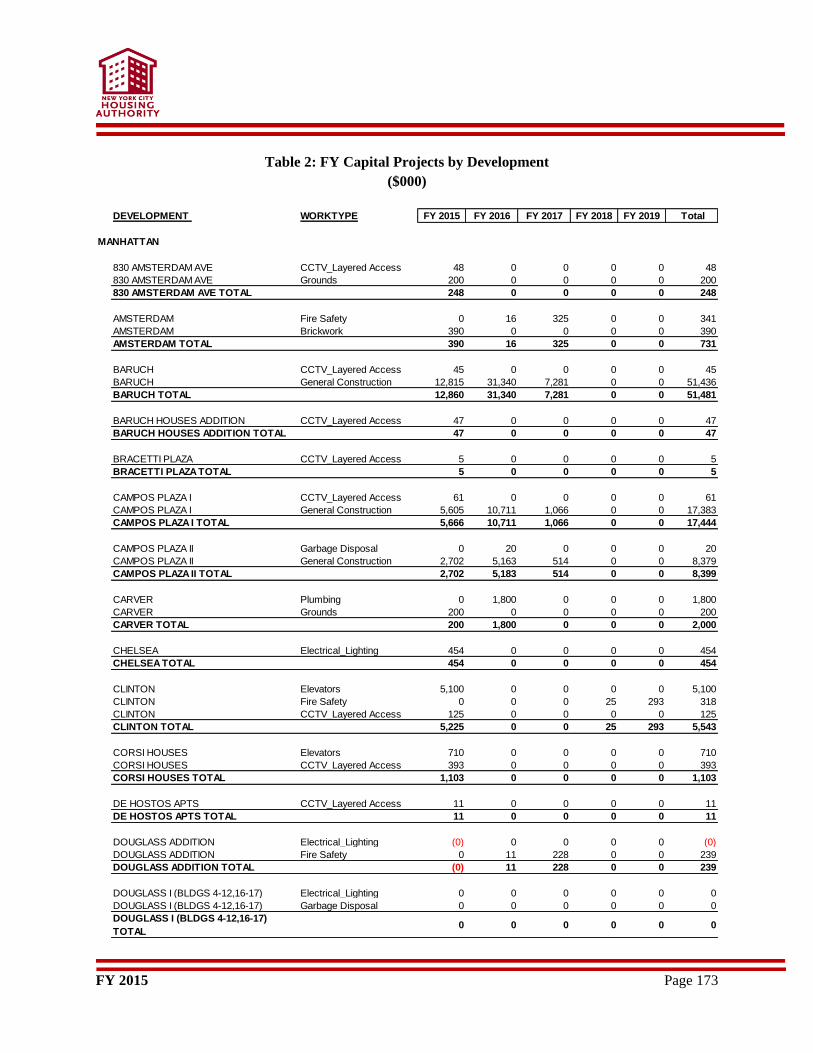
FY 2015 Page 173
Table 2: FY Capital Projects by Development
($000)
DEVELOPMENT WORKTYPE FY 2015 FY 2016 FY 2017 FY 2018 FY 2019 Total
830 AMSTERDAM AVE CCTV_Layered Access 48 0 0 0 0 48
830 AMSTERDAM AVE Grounds 200 0 0 0 0 200
830 AMSTERDAM AVE TOTAL 248 0 0 0 0 248
AMSTERDAM Fire Safety 0 16 325 0 0 341
AMSTERDAM Brickwork 390 0 0 0 0 390
AMSTERDAM TOTAL 390 16 325 0 0 731
BARUCH CCTV_Layered Access 45 0 0 0 0 45
BARUCH General Construction 12,815 31,340 7,281 0 0 51,436
BARUCH TOTAL 12,860 31,340 7,281 0 0 51,481
BARUCH HOUSES ADDITION CCTV_Layered Access 47 0 0 0 0 47
BARUCH HOUSES ADDITION TOTAL 47 0 0 0 0 47
BRACETTI PLAZA CCTV_Layered Access 5 0 0 0 0 5
BRACETTI PLAZA TOTAL 5 0 0 0 0 5
CAMPOS PLAZA I CCTV_Layered Access 61 0 0 0 0 61
CAMPOS PLAZA I General Construction 5,605 10,711 1,066 0 0 17,383
CAMPOS PLAZA I TOTAL 5,666 10,711 1,066 0 0 17,444
CAMPOS PLAZA II Garbage Disposal 0 20 0 0 0 20
CAMPOS PLAZA II General Construction 2,702 5,163 514 0 0 8,379
CAMPOS PLAZA II TOTAL 2,702 5,183 514 0 0 8,399
CARVER Plumbing 0 1,800 0 0 0 1,800
CARVER Grounds 200 0 0 0 0 200
CARVER TOTAL 200 1,800 0 0 0 2,000
CHELSEA Electrical_Lighting 454 0 0 0 0 454
CHELSEA TOTAL 454 0 0 0 0 454
CLINTON Elevators 5,100 0 0 0 0 5,100
CLINTON Fire Safety 0 0 0 25 293 318
CLINTON CCTV_Layered Access 125 0 0 0 0 125
CLINTON TOTAL 5,225 0 0 25 293 5,543
CORSI HOUSES Elevators 710 0 0 0 0 710
CORSI HOUSES CCTV_Layered Access 393 0 0 0 0 393
CORSI HOUSES TOTAL 1,103 0 0 0 0 1,103
DE HOSTOS APTS CCTV_Layered Access 11 0 0 0 0 11
DE HOSTOS APTS TOTAL 11 0 0 0 0 11
DOUGLASS ADDITION Electrical_Lighting (0) 0 0 0 0 (0)
DOUGLASS ADDITION Fire Safety 0 11 228 0 0 239
DOUGLASS ADDITION TOTAL (0) 11 228 0 0 239
DOUGLASS I (BLDGS 4-12,16-17) Electrical_Lighting 0 0 0 0 0 0
DOUGLASS I (BLDGS 4-12,16-17) Garbage Disposal 0 0 0 0 0 0
DOUGLASS I (BLDGS 4-12,16-17)
TOTAL0 0 0 0 0 0
MANHATTAN
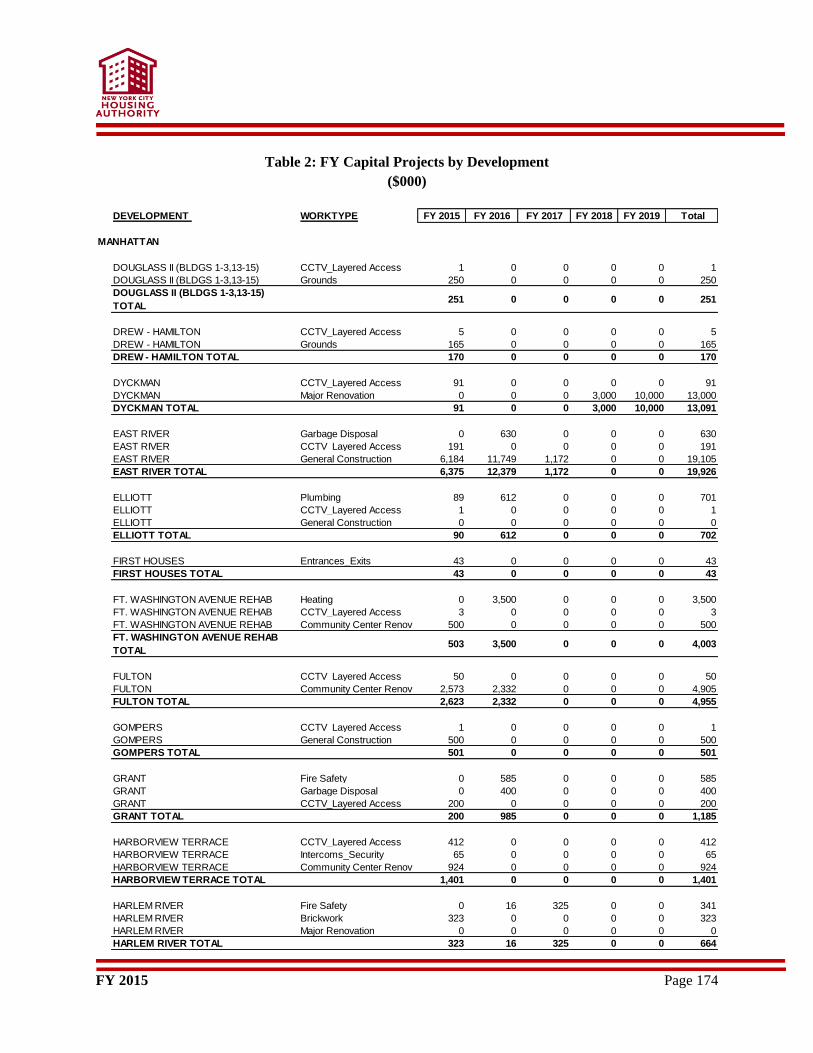
FY 2015 Page 174
Table 2: FY Capital Projects by Development
($000)
DEVELOPMENT WORKTYPE FY 2015 FY 2016 FY 2017 FY 2018 FY 2019 Total
DOUGLASS II (BLDGS 1-3,13-15) CCTV_Layered Access 1 0 0 0 0 1
DOUGLASS II (BLDGS 1-3,13-15) Grounds 250 0 0 0 0 250
DOUGLASS II (BLDGS 1-3,13-15)
TOTAL251 0 0 0 0 251
DREW - HAMILTON CCTV_Layered Access 5 0 0 0 0 5
DREW - HAMILTON Grounds 165 0 0 0 0 165
DREW - HAMILTON TOTAL 170 0 0 0 0 170
DYCKMAN CCTV_Layered Access 91 0 0 0 0 91
DYCKMAN Major Renovation 0 0 0 3,000 10,000 13,000
DYCKMAN TOTAL 91 0 0 3,000 10,000 13,091
EAST RIVER Garbage Disposal 0 630 0 0 0 630
EAST RIVER CCTV_Layered Access 191 0 0 0 0 191
EAST RIVER General Construction 6,184 11,749 1,172 0 0 19,105
EAST RIVER TOTAL 6,375 12,379 1,172 0 0 19,926
ELLIOTT Plumbing 89 612 0 0 0 701
ELLIOTT CCTV_Layered Access 1 0 0 0 0 1
ELLIOTT General Construction 0 0 0 0 0 0
ELLIOTT TOTAL 90 612 0 0 0 702
FIRST HOUSES Entrances_Exits 43 0 0 0 0 43
FIRST HOUSES TOTAL 43 0 0 0 0 43
FT. WASHINGTON AVENUE REHAB Heating 0 3,500 0 0 0 3,500
FT. WASHINGTON AVENUE REHAB CCTV_Layered Access 3 0 0 0 0 3
FT. WASHINGTON AVENUE REHAB Community Center Renov 500 0 0 0 0 500
FT. WASHINGTON AVENUE REHAB
TOTAL503 3,500 0 0 0 4,003
FULTON CCTV_Layered Access 50 0 0 0 0 50
FULTON Community Center Renov 2,573 2,332 0 0 0 4,905
FULTON TOTAL 2,623 2,332 0 0 0 4,955
GOMPERS CCTV_Layered Access 1 0 0 0 0 1
GOMPERS General Construction 500 0 0 0 0 500
GOMPERS TOTAL 501 0 0 0 0 501
GRANT Fire Safety 0 585 0 0 0 585
GRANT Garbage Disposal 0 400 0 0 0 400
GRANT CCTV_Layered Access 200 0 0 0 0 200
GRANT TOTAL 200 985 0 0 0 1,185
HARBORVIEW TERRACE CCTV_Layered Access 412 0 0 0 0 412
HARBORVIEW TERRACE Intercoms_Security 65 0 0 0 0 65
HARBORVIEW TERRACE Community Center Renov 924 0 0 0 0 924
HARBORVIEW TERRACE TOTAL 1,401 0 0 0 0 1,401
HARLEM RIVER Fire Safety 0 16 325 0 0 341
HARLEM RIVER Brickwork 323 0 0 0 0 323
HARLEM RIVER Major Renovation 0 0 0 0 0 0
HARLEM RIVER TOTAL 323 16 325 0 0 664
MANHATTAN
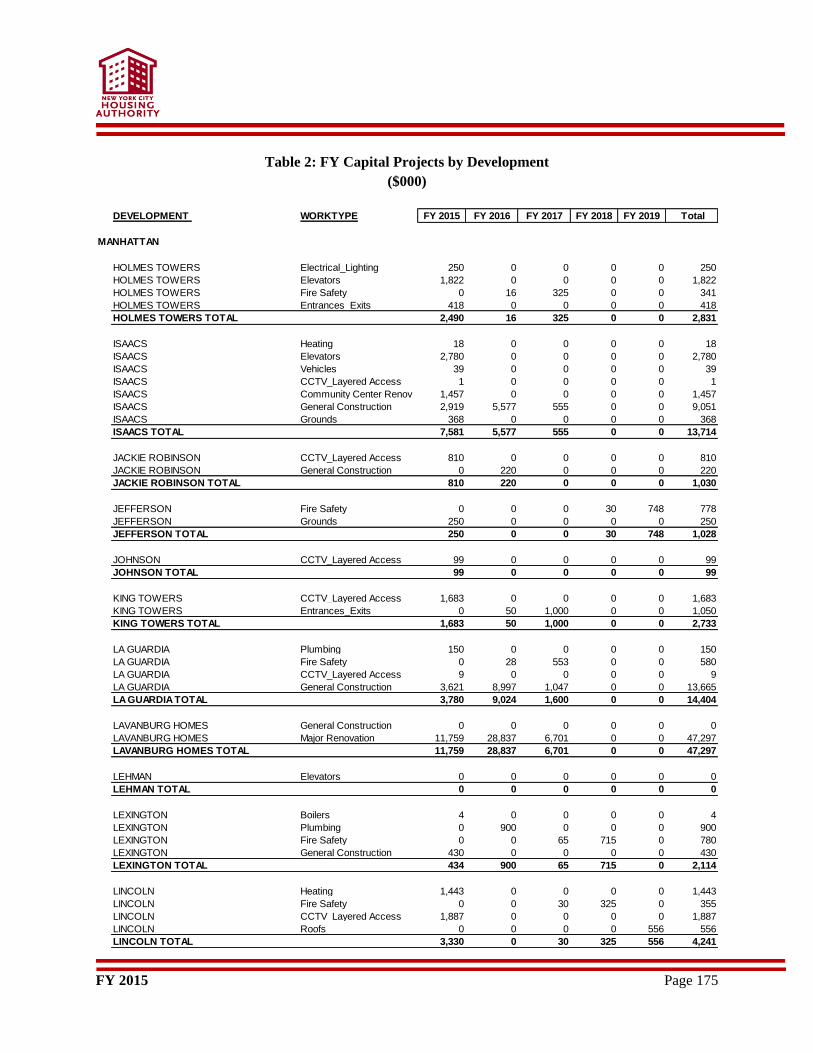
FY 2015 Page 175
Table 2: FY Capital Projects by Development
($000)
DEVELOPMENT WORKTYPE FY 2015 FY 2016 FY 2017 FY 2018 FY 2019 Total
HOLMES TOWERS Electrical_Lighting 250 0 0 0 0 250
HOLMES TOWERS Elevators 1,822 0 0 0 0 1,822
HOLMES TOWERS Fire Safety 0 16 325 0 0 341
HOLMES TOWERS Entrances_Exits 418 0 0 0 0 418
HOLMES TOWERS TOTAL 2,490 16 325 0 0 2,831
ISAACS Heating 18 0 0 0 0 18
ISAACS Elevators 2,780 0 0 0 0 2,780
ISAACS Vehicles 39 0 0 0 0 39
ISAACS CCTV_Layered Access 1 0 0 0 0 1
ISAACS Community Center Renov 1,457 0 0 0 0 1,457
ISAACS General Construction 2,919 5,577 555 0 0 9,051
ISAACS Grounds 368 0 0 0 0 368
ISAACS TOTAL 7,581 5,577 555 0 0 13,714
JACKIE ROBINSON CCTV_Layered Access 810 0 0 0 0 810
JACKIE ROBINSON General Construction 0 220 0 0 0 220
JACKIE ROBINSON TOTAL 810 220 0 0 0 1,030
JEFFERSON Fire Safety 0 0 0 30 748 778
JEFFERSON Grounds 250 0 0 0 0 250
JEFFERSON TOTAL 250 0 0 30 748 1,028
JOHNSON CCTV_Layered Access 99 0 0 0 0 99
JOHNSON TOTAL 99 0 0 0 0 99
KING TOWERS CCTV_Layered Access 1,683 0 0 0 0 1,683
KING TOWERS Entrances_Exits 0 50 1,000 0 0 1,050
KING TOWERS TOTAL 1,683 50 1,000 0 0 2,733
LA GUARDIA Plumbing 150 0 0 0 0 150
LA GUARDIA Fire Safety 0 28 553 0 0 580
LA GUARDIA CCTV_Layered Access 9 0 0 0 0 9
LA GUARDIA General Construction 3,621 8,997 1,047 0 0 13,665
LA GUARDIA TOTAL 3,780 9,024 1,600 0 0 14,404
LAVANBURG HOMES General Construction 0 0 0 0 0 0
LAVANBURG HOMES Major Renovation 11,759 28,837 6,701 0 0 47,297
LAVANBURG HOMES TOTAL 11,759 28,837 6,701 0 0 47,297
LEHMAN Elevators 0 0 0 0 0 0
LEHMAN TOTAL 0 0 0 0 0 0
LEXINGTON Boilers 4 0 0 0 0 4
LEXINGTON Plumbing 0 900 0 0 0 900
LEXINGTON Fire Safety 0 0 65 715 0 780
LEXINGTON General Construction 430 0 0 0 0 430
LEXINGTON TOTAL 434 900 65 715 0 2,114
LINCOLN Heating 1,443 0 0 0 0 1,443
LINCOLN Fire Safety 0 0 30 325 0 355
LINCOLN CCTV_Layered Access 1,887 0 0 0 0 1,887
LINCOLN Roofs 0 0 0 0 556 556
LINCOLN TOTAL 3,330 0 30 325 556 4,241
MANHATTAN
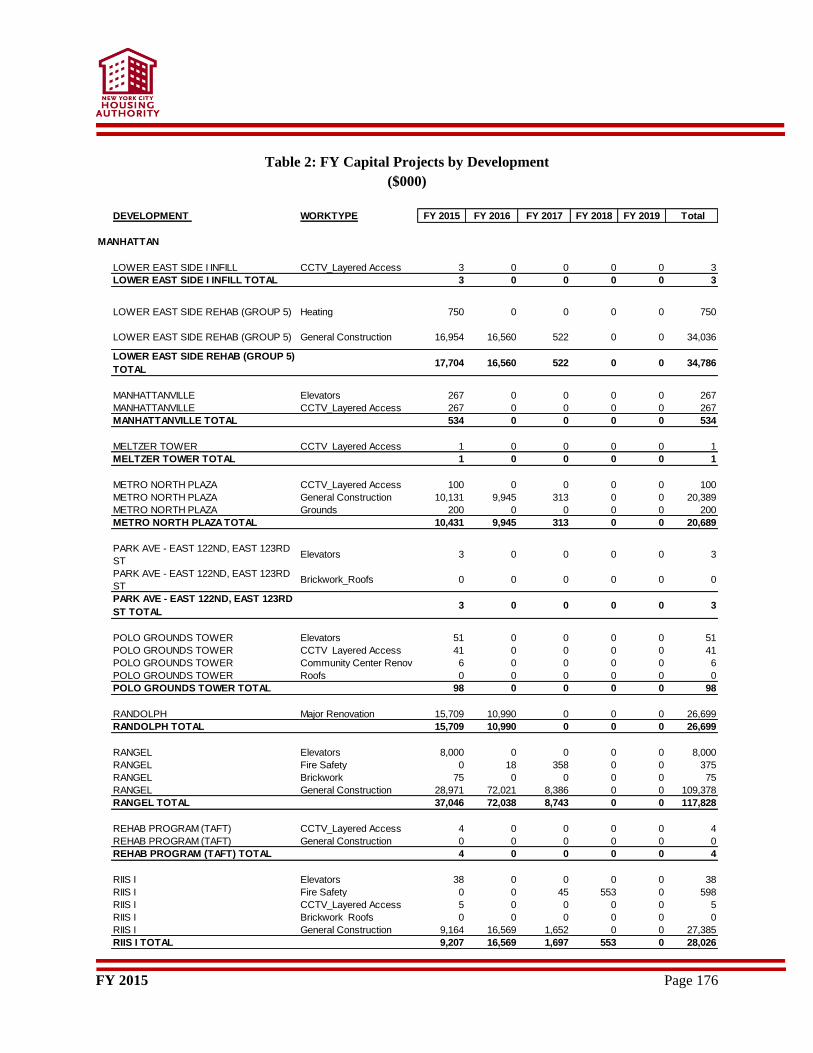
FY 2015 Page 176
Table 2: FY Capital Projects by Development
($000)
DEVELOPMENT WORKTYPE FY 2015 FY 2016 FY 2017 FY 2018 FY 2019 Total
LOWER EAST SIDE I INFILL CCTV_Layered Access 3 0 0 0 0 3
LOWER EAST SIDE I INFILL TOTAL 3 0 0 0 0 3
LOWER EAST SIDE REHAB (GROUP 5) Heating 750 0 0 0 0 750
LOWER EAST SIDE REHAB (GROUP 5) General Construction 16,954 16,560 522 0 0 34,036
LOWER EAST SIDE REHAB (GROUP 5)
TOTAL17,704 16,560 522 0 0 34,786
MANHATTANVILLE Elevators 267 0 0 0 0 267
MANHATTANVILLE CCTV_Layered Access 267 0 0 0 0 267
MANHATTANVILLE TOTAL 534 0 0 0 0 534
MELTZER TOWER CCTV_Layered Access 1 0 0 0 0 1
MELTZER TOWER TOTAL 1 0 0 0 0 1
METRO NORTH PLAZA CCTV_Layered Access 100 0 0 0 0 100
METRO NORTH PLAZA General Construction 10,131 9,945 313 0 0 20,389
METRO NORTH PLAZA Grounds 200 0 0 0 0 200
METRO NORTH PLAZA TOTAL 10,431 9,945 313 0 0 20,689
PARK AVE - EAST 122ND, EAST 123RD
STElevators 3 0 0 0 0 3
PARK AVE - EAST 122ND, EAST 123RD
STBrickwork_Roofs 0 0 0 0 0 0
PARK AVE - EAST 122ND, EAST 123RD
ST TOTAL3 0 0 0 0 3
POLO GROUNDS TOWER Elevators 51 0 0 0 0 51
POLO GROUNDS TOWER CCTV_Layered Access 41 0 0 0 0 41
POLO GROUNDS TOWER Community Center Renov 6 0 0 0 0 6
POLO GROUNDS TOWER Roofs 0 0 0 0 0 0
POLO GROUNDS TOWER TOTAL 98 0 0 0 0 98
RANDOLPH Major Renovation 15,709 10,990 0 0 0 26,699
RANDOLPH TOTAL 15,709 10,990 0 0 0 26,699
RANGEL Elevators 8,000 0 0 0 0 8,000
RANGEL Fire Safety 0 18 358 0 0 375
RANGEL Brickwork 75 0 0 0 0 75
RANGEL General Construction 28,971 72,021 8,386 0 0 109,378
RANGEL TOTAL 37,046 72,038 8,743 0 0 117,828
REHAB PROGRAM (TAFT) CCTV_Layered Access 4 0 0 0 0 4
REHAB PROGRAM (TAFT) General Construction 0 0 0 0 0 0
REHAB PROGRAM (TAFT) TOTAL 4 0 0 0 0 4
RIIS I Elevators 38 0 0 0 0 38
RIIS I Fire Safety 0 0 45 553 0 598
RIIS I CCTV_Layered Access 5 0 0 0 0 5
RIIS I Brickwork_Roofs 0 0 0 0 0 0
RIIS I General Construction 9,164 16,569 1,652 0 0 27,385
RIIS I TOTAL 9,207 16,569 1,697 553 0 28,026
MANHATTAN
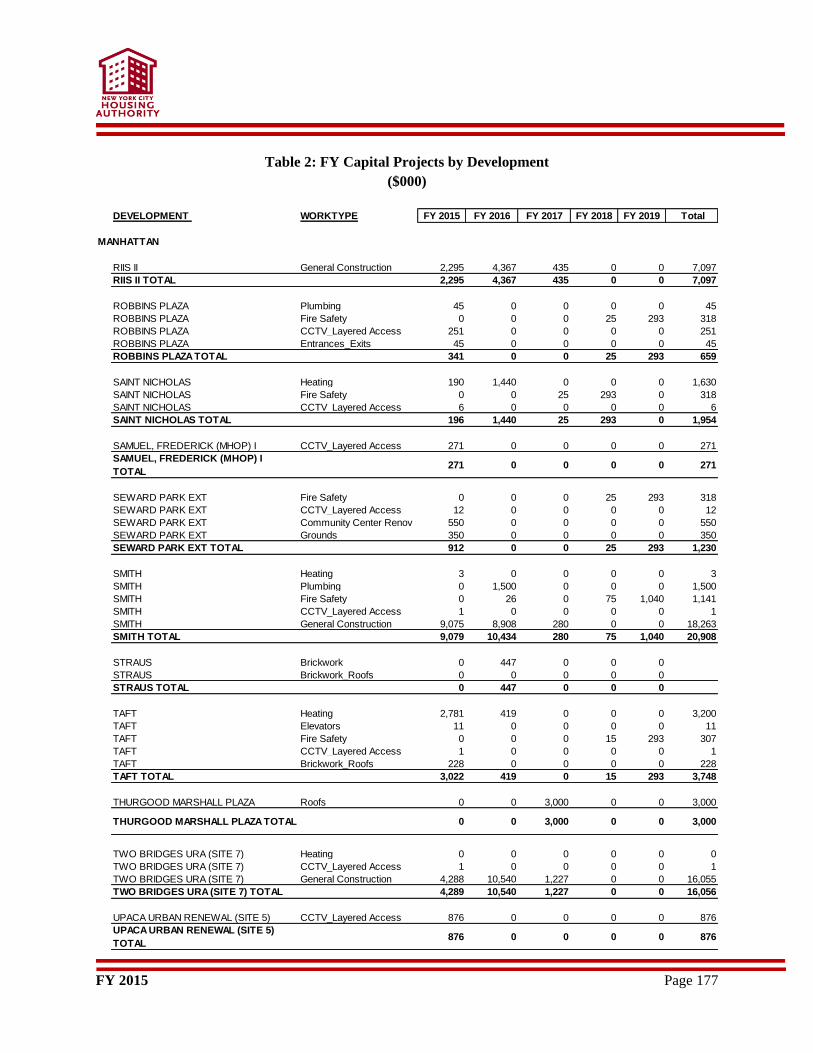
FY 2015 Page 177
Table 2: FY Capital Projects by Development
($000)
DEVELOPMENT WORKTYPE FY 2015 FY 2016 FY 2017 FY 2018 FY 2019 Total
RIIS II General Construction 2,295 4,367 435 0 0 7,097
RIIS II TOTAL 2,295 4,367 435 0 0 7,097
ROBBINS PLAZA Plumbing 45 0 0 0 0 45
ROBBINS PLAZA Fire Safety 0 0 0 25 293 318
ROBBINS PLAZA CCTV_Layered Access 251 0 0 0 0 251
ROBBINS PLAZA Entrances_Exits 45 0 0 0 0 45
ROBBINS PLAZA TOTAL 341 0 0 25 293 659
SAINT NICHOLAS Heating 190 1,440 0 0 0 1,630
SAINT NICHOLAS Fire Safety 0 0 25 293 0 318
SAINT NICHOLAS CCTV_Layered Access 6 0 0 0 0 6
SAINT NICHOLAS TOTAL 196 1,440 25 293 0 1,954
SAMUEL, FREDERICK (MHOP) I CCTV_Layered Access 271 0 0 0 0 271
SAMUEL, FREDERICK (MHOP) I
TOTAL271 0 0 0 0 271
SEWARD PARK EXT Fire Safety 0 0 0 25 293 318
SEWARD PARK EXT CCTV_Layered Access 12 0 0 0 0 12
SEWARD PARK EXT Community Center Renov 550 0 0 0 0 550
SEWARD PARK EXT Grounds 350 0 0 0 0 350
SEWARD PARK EXT TOTAL 912 0 0 25 293 1,230
SMITH Heating 3 0 0 0 0 3
SMITH Plumbing 0 1,500 0 0 0 1,500
SMITH Fire Safety 0 26 0 75 1,040 1,141
SMITH CCTV_Layered Access 1 0 0 0 0 1
SMITH General Construction 9,075 8,908 280 0 0 18,263
SMITH TOTAL 9,079 10,434 280 75 1,040 20,908
STRAUS Brickwork 0 447 0 0 0
STRAUS Brickwork_Roofs 0 0 0 0 0
STRAUS TOTAL 0 447 0 0 0
TAFT Heating 2,781 419 0 0 0 3,200
TAFT Elevators 11 0 0 0 0 11
TAFT Fire Safety 0 0 0 15 293 307
TAFT CCTV_Layered Access 1 0 0 0 0 1
TAFT Brickwork_Roofs 228 0 0 0 0 228
TAFT TOTAL 3,022 419 0 15 293 3,748
THURGOOD MARSHALL PLAZA Roofs 0 0 3,000 0 0 3,000
THURGOOD MARSHALL PLAZA TOTAL 0 0 3,000 0 0 3,000
TWO BRIDGES URA (SITE 7) Heating 0 0 0 0 0 0
TWO BRIDGES URA (SITE 7) CCTV_Layered Access 1 0 0 0 0 1
TWO BRIDGES URA (SITE 7) General Construction 4,288 10,540 1,227 0 0 16,055
TWO BRIDGES URA (SITE 7) TOTAL 4,289 10,540 1,227 0 0 16,056
UPACA URBAN RENEWAL (SITE 5) CCTV_Layered Access 876 0 0 0 0 876
UPACA URBAN RENEWAL (SITE 5)
TOTAL876 0 0 0 0 876
MANHATTAN
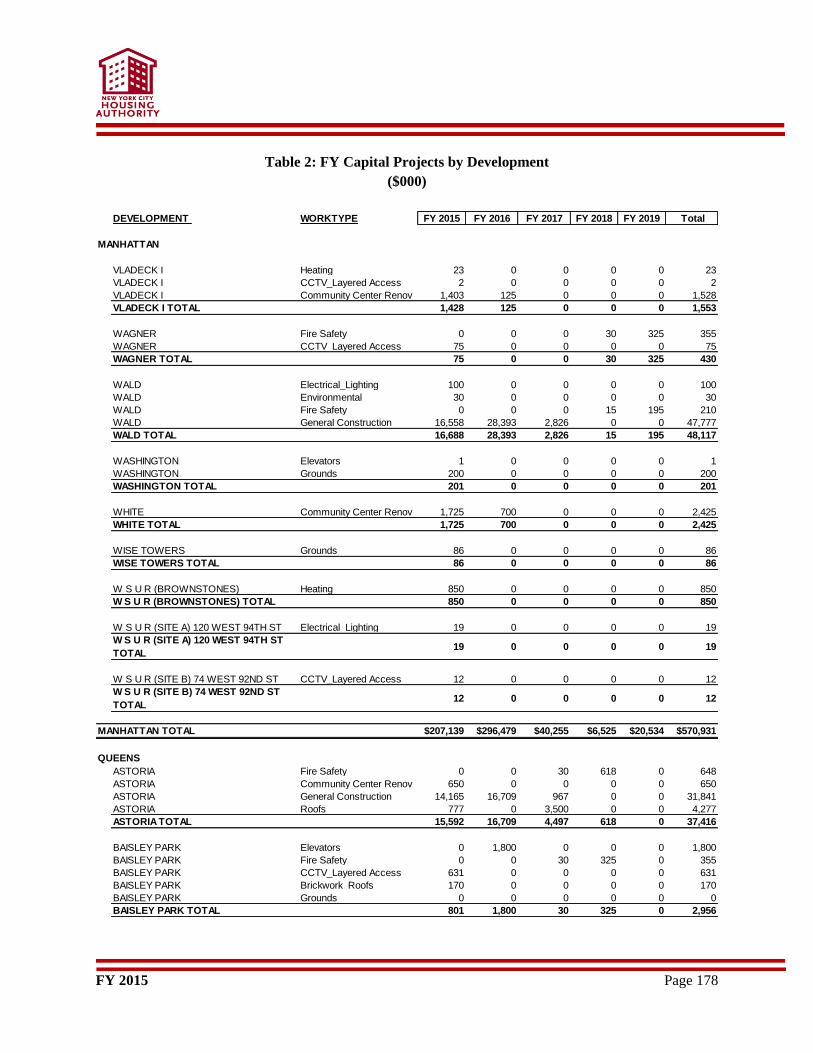
FY 2015 Page 178
Table 2: FY Capital Projects by Development
($000)
DEVELOPMENT WORKTYPE FY 2015 FY 2016 FY 2017 FY 2018 FY 2019 Total
VLADECK I Heating 23 0 0 0 0 23
VLADECK I CCTV_Layered Access 2 0 0 0 0 2
VLADECK I Community Center Renov 1,403 125 0 0 0 1,528
VLADECK I TOTAL 1,428 125 0 0 0 1,553
WAGNER Fire Safety 0 0 0 30 325 355
WAGNER CCTV_Layered Access 75 0 0 0 0 75
WAGNER TOTAL 75 0 0 30 325 430
WALD Electrical_Lighting 100 0 0 0 0 100
WALD Environmental 30 0 0 0 0 30
WALD Fire Safety 0 0 0 15 195 210
WALD General Construction 16,558 28,393 2,826 0 0 47,777
WALD TOTAL 16,688 28,393 2,826 15 195 48,117
WASHINGTON Elevators 1 0 0 0 0 1
WASHINGTON Grounds 200 0 0 0 0 200
WASHINGTON TOTAL 201 0 0 0 0 201
WHITE Community Center Renov 1,725 700 0 0 0 2,425
WHITE TOTAL 1,725 700 0 0 0 2,425
WISE TOWERS Grounds 86 0 0 0 0 86
WISE TOWERS TOTAL 86 0 0 0 0 86
W S U R (BROWNSTONES) Heating 850 0 0 0 0 850
W S U R (BROWNSTONES) TOTAL 850 0 0 0 0 850
W S U R (SITE A) 120 WEST 94TH ST Electrical_Lighting 19 0 0 0 0 19
W S U R (SITE A) 120 WEST 94TH ST
TOTAL19 0 0 0 0 19
W S U R (SITE B) 74 WEST 92ND ST CCTV_Layered Access 12 0 0 0 0 12
W S U R (SITE B) 74 WEST 92ND ST
TOTAL12 0 0 0 0 12
MANHATTAN TOTAL $207,139 $296,479 $40,255 $6,525 $20,534 $570,931
ASTORIA Fire Safety 0 0 30 618 0 648
ASTORIA Community Center Renov 650 0 0 0 0 650
ASTORIA General Construction 14,165 16,709 967 0 0 31,841
ASTORIA Roofs 777 0 3,500 0 0 4,277
ASTORIA TOTAL 15,592 16,709 4,497 618 0 37,416
BAISLEY PARK Elevators 0 1,800 0 0 0 1,800
BAISLEY PARK Fire Safety 0 0 30 325 0 355
BAISLEY PARK CCTV_Layered Access 631 0 0 0 0 631
BAISLEY PARK Brickwork_Roofs 170 0 0 0 0 170
BAISLEY PARK Grounds 0 0 0 0 0 0
BAISLEY PARK TOTAL 801 1,800 30 325 0 2,956
QUEENS
MANHATTAN
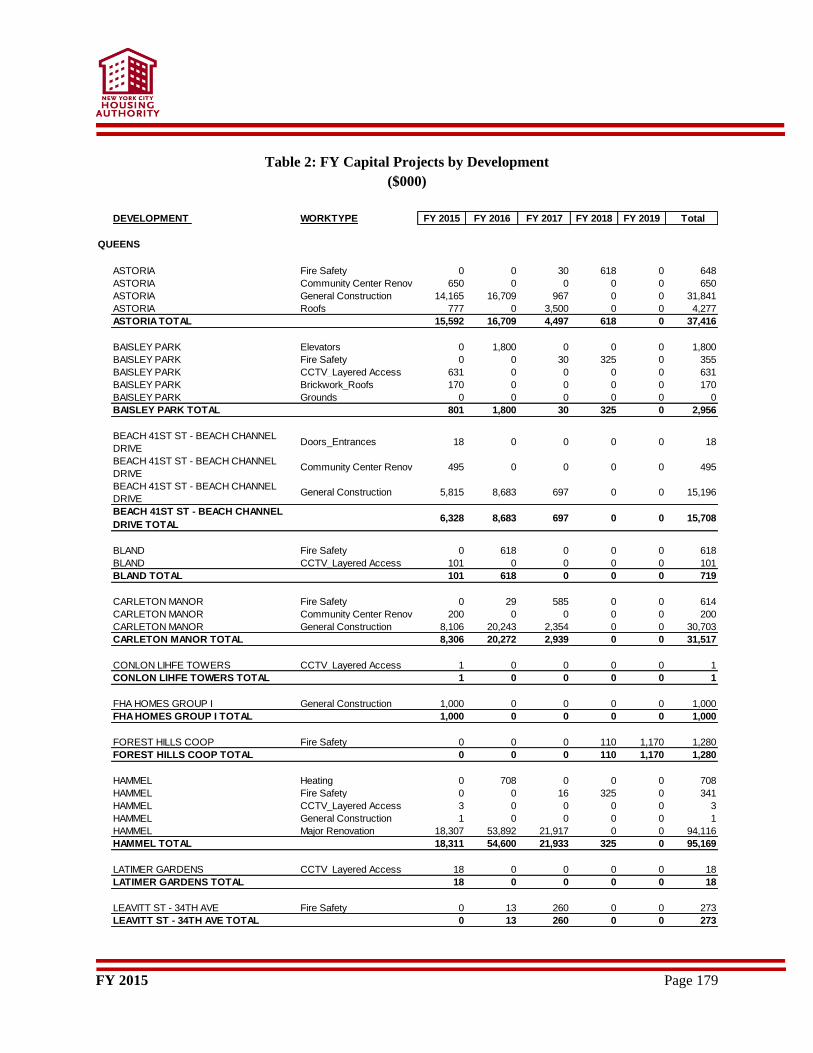
FY 2015 Page 179
Table 2: FY Capital Projects by Development
($000)
DEVELOPMENT WORKTYPE FY 2015 FY 2016 FY 2017 FY 2018 FY 2019 Total
ASTORIA Fire Safety 0 0 30 618 0 648
ASTORIA Community Center Renov 650 0 0 0 0 650
ASTORIA General Construction 14,165 16,709 967 0 0 31,841
ASTORIA Roofs 777 0 3,500 0 0 4,277
ASTORIA TOTAL 15,592 16,709 4,497 618 0 37,416
BAISLEY PARK Elevators 0 1,800 0 0 0 1,800
BAISLEY PARK Fire Safety 0 0 30 325 0 355
BAISLEY PARK CCTV_Layered Access 631 0 0 0 0 631
BAISLEY PARK Brickwork_Roofs 170 0 0 0 0 170
BAISLEY PARK Grounds 0 0 0 0 0 0
BAISLEY PARK TOTAL 801 1,800 30 325 0 2,956
BEACH 41ST ST - BEACH CHANNEL
DRIVEDoors_Entrances 18 0 0 0 0 18
BEACH 41ST ST - BEACH CHANNEL
DRIVECommunity Center Renov 495 0 0 0 0 495
BEACH 41ST ST - BEACH CHANNEL
DRIVEGeneral Construction 5,815 8,683 697 0 0 15,196
BEACH 41ST ST - BEACH CHANNEL
DRIVE TOTAL6,328 8,683 697 0 0 15,708
BLAND Fire Safety 0 618 0 0 0 618
BLAND CCTV_Layered Access 101 0 0 0 0 101
BLAND TOTAL 101 618 0 0 0 719
CARLETON MANOR Fire Safety 0 29 585 0 0 614
CARLETON MANOR Community Center Renov 200 0 0 0 0 200
CARLETON MANOR General Construction 8,106 20,243 2,354 0 0 30,703
CARLETON MANOR TOTAL 8,306 20,272 2,939 0 0 31,517
CONLON LIHFE TOWERS CCTV_Layered Access 1 0 0 0 0 1
CONLON LIHFE TOWERS TOTAL 1 0 0 0 0 1
FHA HOMES GROUP I General Construction 1,000 0 0 0 0 1,000
FHA HOMES GROUP I TOTAL 1,000 0 0 0 0 1,000
FOREST HILLS COOP Fire Safety 0 0 0 110 1,170 1,280
FOREST HILLS COOP TOTAL 0 0 0 110 1,170 1,280
HAMMEL Heating 0 708 0 0 0 708
HAMMEL Fire Safety 0 0 16 325 0 341
HAMMEL CCTV_Layered Access 3 0 0 0 0 3
HAMMEL General Construction 1 0 0 0 0 1
HAMMEL Major Renovation 18,307 53,892 21,917 0 0 94,116
HAMMEL TOTAL 18,311 54,600 21,933 325 0 95,169
LATIMER GARDENS CCTV_Layered Access 18 0 0 0 0 18
LATIMER GARDENS TOTAL 18 0 0 0 0 18
LEAVITT ST - 34TH AVE Fire Safety 0 13 260 0 0 273
LEAVITT ST - 34TH AVE TOTAL 0 13 260 0 0 273
QUEENS
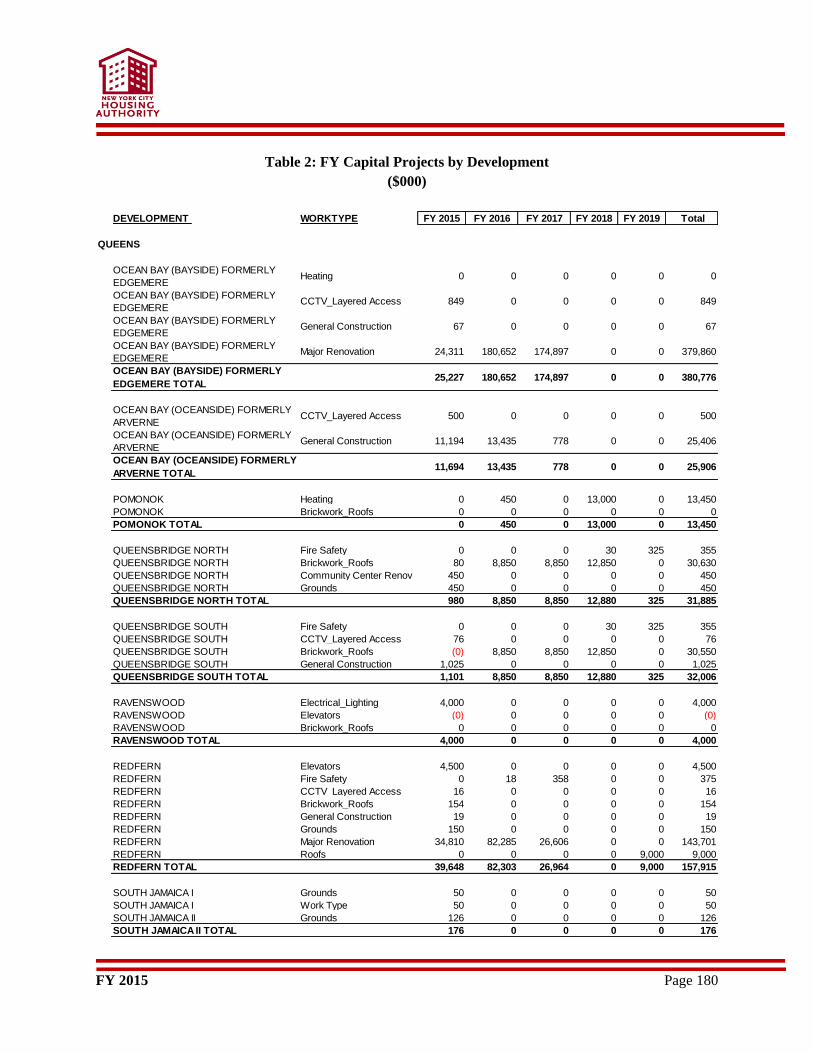
FY 2015 Page 180
Table 2: FY Capital Projects by Development
($000)
DEVELOPMENT WORKTYPE FY 2015 FY 2016 FY 2017 FY 2018 FY 2019 Total
OCEAN BAY (BAYSIDE) FORMERLY
EDGEMEREHeating 0 0 0 0 0 0
OCEAN BAY (BAYSIDE) FORMERLY
EDGEMERECCTV_Layered Access 849 0 0 0 0 849
OCEAN BAY (BAYSIDE) FORMERLY
EDGEMEREGeneral Construction 67 0 0 0 0 67
OCEAN BAY (BAYSIDE) FORMERLY
EDGEMEREMajor Renovation 24,311 180,652 174,897 0 0 379,860
OCEAN BAY (BAYSIDE) FORMERLY
EDGEMERE TOTAL25,227 180,652 174,897 0 0 380,776
OCEAN BAY (OCEANSIDE) FORMERLY
ARVERNECCTV_Layered Access 500 0 0 0 0 500
OCEAN BAY (OCEANSIDE) FORMERLY
ARVERNEGeneral Construction 11,194 13,435 778 0 0 25,406
OCEAN BAY (OCEANSIDE) FORMERLY
ARVERNE TOTAL11,694 13,435 778 0 0 25,906
POMONOK Heating 0 450 0 13,000 0 13,450
POMONOK Brickwork_Roofs 0 0 0 0 0 0
POMONOK TOTAL 0 450 0 13,000 0 13,450
QUEENSBRIDGE NORTH Fire Safety 0 0 0 30 325 355
QUEENSBRIDGE NORTH Brickwork_Roofs 80 8,850 8,850 12,850 0 30,630
QUEENSBRIDGE NORTH Community Center Renov 450 0 0 0 0 450
QUEENSBRIDGE NORTH Grounds 450 0 0 0 0 450
QUEENSBRIDGE NORTH TOTAL 980 8,850 8,850 12,880 325 31,885
QUEENSBRIDGE SOUTH Fire Safety 0 0 0 30 325 355
QUEENSBRIDGE SOUTH CCTV_Layered Access 76 0 0 0 0 76
QUEENSBRIDGE SOUTH Brickwork_Roofs (0) 8,850 8,850 12,850 0 30,550
QUEENSBRIDGE SOUTH General Construction 1,025 0 0 0 0 1,025
QUEENSBRIDGE SOUTH TOTAL 1,101 8,850 8,850 12,880 325 32,006
RAVENSWOOD Electrical_Lighting 4,000 0 0 0 0 4,000
RAVENSWOOD Elevators (0) 0 0 0 0 (0)
RAVENSWOOD Brickwork_Roofs 0 0 0 0 0 0
RAVENSWOOD TOTAL 4,000 0 0 0 0 4,000
REDFERN Elevators 4,500 0 0 0 0 4,500
REDFERN Fire Safety 0 18 358 0 0 375
REDFERN CCTV_Layered Access 16 0 0 0 0 16
REDFERN Brickwork_Roofs 154 0 0 0 0 154
REDFERN General Construction 19 0 0 0 0 19
REDFERN Grounds 150 0 0 0 0 150
REDFERN Major Renovation 34,810 82,285 26,606 0 0 143,701
REDFERN Roofs 0 0 0 0 9,000 9,000
REDFERN TOTAL 39,648 82,303 26,964 0 9,000 157,915
SOUTH JAMAICA I Grounds 50 0 0 0 0 50
SOUTH JAMAICA I Work Type 50 0 0 0 0 50
SOUTH JAMAICA II Grounds 126 0 0 0 0 126
SOUTH JAMAICA II TOTAL 176 0 0 0 0 176
QUEENS
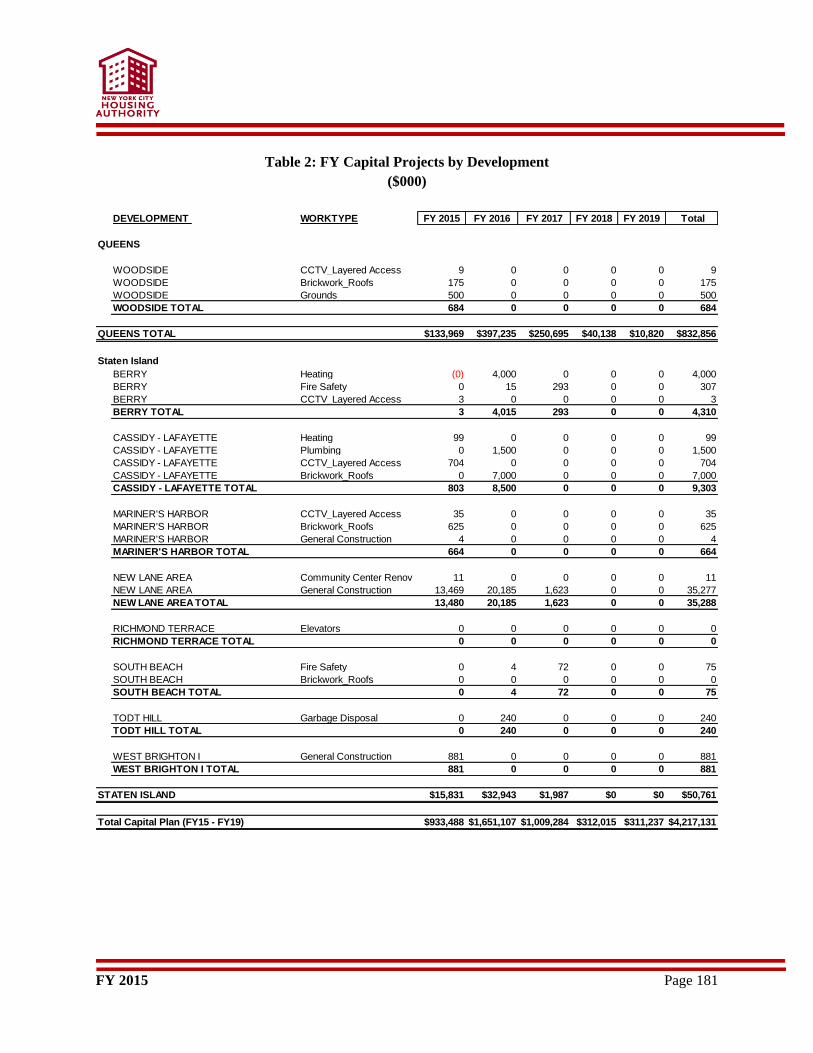
FY 2015 Page 181
Table 2: FY Capital Projects by Development
($000)
DEVELOPMENT WORKTYPE FY 2015 FY 2016 FY 2017 FY 2018 FY 2019 Total
WOODSIDE CCTV_Layered Access 9 0 0 0 0 9
WOODSIDE Brickwork_Roofs 175 0 0 0 0 175
WOODSIDE Grounds 500 0 0 0 0 500
WOODSIDE TOTAL 684 0 0 0 0 684
QUEENS TOTAL $133,969 $397,235 $250,695 $40,138 $10,820 $832,856
BERRY Heating (0) 4,000 0 0 0 4,000
BERRY Fire Safety 0 15 293 0 0 307
BERRY CCTV_Layered Access 3 0 0 0 0 3
BERRY TOTAL 3 4,015 293 0 0 4,310
CASSIDY - LAFAYETTE Heating 99 0 0 0 0 99
CASSIDY - LAFAYETTE Plumbing 0 1,500 0 0 0 1,500
CASSIDY - LAFAYETTE CCTV_Layered Access 704 0 0 0 0 704
CASSIDY - LAFAYETTE Brickwork_Roofs 0 7,000 0 0 0 7,000
CASSIDY - LAFAYETTE TOTAL 803 8,500 0 0 0 9,303
MARINER'S HARBOR CCTV_Layered Access 35 0 0 0 0 35
MARINER'S HARBOR Brickwork_Roofs 625 0 0 0 0 625
MARINER'S HARBOR General Construction 4 0 0 0 0 4
MARINER'S HARBOR TOTAL 664 0 0 0 0 664
NEW LANE AREA Community Center Renov 11 0 0 0 0 11
NEW LANE AREA General Construction 13,469 20,185 1,623 0 0 35,277
NEW LANE AREA TOTAL 13,480 20,185 1,623 0 0 35,288
RICHMOND TERRACE Elevators 0 0 0 0 0 0
RICHMOND TERRACE TOTAL 0 0 0 0 0 0
SOUTH BEACH Fire Safety 0 4 72 0 0 75
SOUTH BEACH Brickwork_Roofs 0 0 0 0 0 0
SOUTH BEACH TOTAL 0 4 72 0 0 75
TODT HILL Garbage Disposal 0 240 0 0 0 240
TODT HILL TOTAL 0 240 0 0 0 240
WEST BRIGHTON I General Construction 881 0 0 0 0 881
WEST BRIGHTON I TOTAL 881 0 0 0 0 881
STATEN ISLAND $15,831 $32,943 $1,987 $0 $0 $50,761
Total Capital Plan (FY15 - FY19) $933,488 $1,651,107 $1,009,284 $312,015 $311,237 $4,217,131
QUEENS
Staten Island
FY 2015 Page 182
Budget Process
FY 2015 Page 183
Overview of the Budget Process
Annual Budget
Each year the General Manager shall prepare an annual budget for the forthcoming fiscal year that will be
presented to NYCHA’s Board. The General Manager will work with the Board in setting strategic
objectives, update the Authority’s long range planning document, and prepare both an operating and
capital budget. The Capital Budget and Operating Budgets shall include proposed expenditures for current
operations during the ensuing fiscal year and the method of financing such expenditures.
Budget Process
The Department of Budget and Financial Planning (DBFP) is designated by NYCHA’s Board to be the
coordinator of the budget process. Each year the financial plan seeks to respond to the demands and needs
of NYCHA within the context of a changing financial environment in a way that reflects the Board’s
vision and NYCHA’s overall policy.
NYCHA’s budget procedures build on previous budgets by utilizing incremental budgeting and enabling
changes to the current budget which are reflected in the financial plan’s out-years. This facilitates long-
term planning and allows for incremental adjustments to the baseline, which easily demonstrates the
effect of spending decisions.
At the conclusion of the budget process, DBFP produces a budget and four-year financial plan that:
Reflects the priorities and policy of the Board;
Evaluates Department’s budget line item requests;
Incorporates the balancing of revenues and expenditures; and
Monitor the implementation of the budget.
The Department of Budget and Financial Planning is also responsible for producing and publishing a
Board approved and ratified budget.
NYCHA’s fiscal year commences on the first day of January of each year and terminates at midnight on
the ensuing thirty first day of December. DBFP initiates the budget process by establishing the budget
calendar.
Operating Planning Process
The Budget exercise operates between July and December and leads to an update of the current fiscal
year’s budget and the adoption of NYCHA’s Budget and the Four-Year Financial Plan for the upcoming
years.
With updated forecasts from funding agencies and several months of NYCHA spending history, the
Budget Department reforecasts NYCHA’s financial condition, and provides an update to the Board. The
Board again directs adjustments to the BRGs’ funding level. Revised financial targets are then distributed
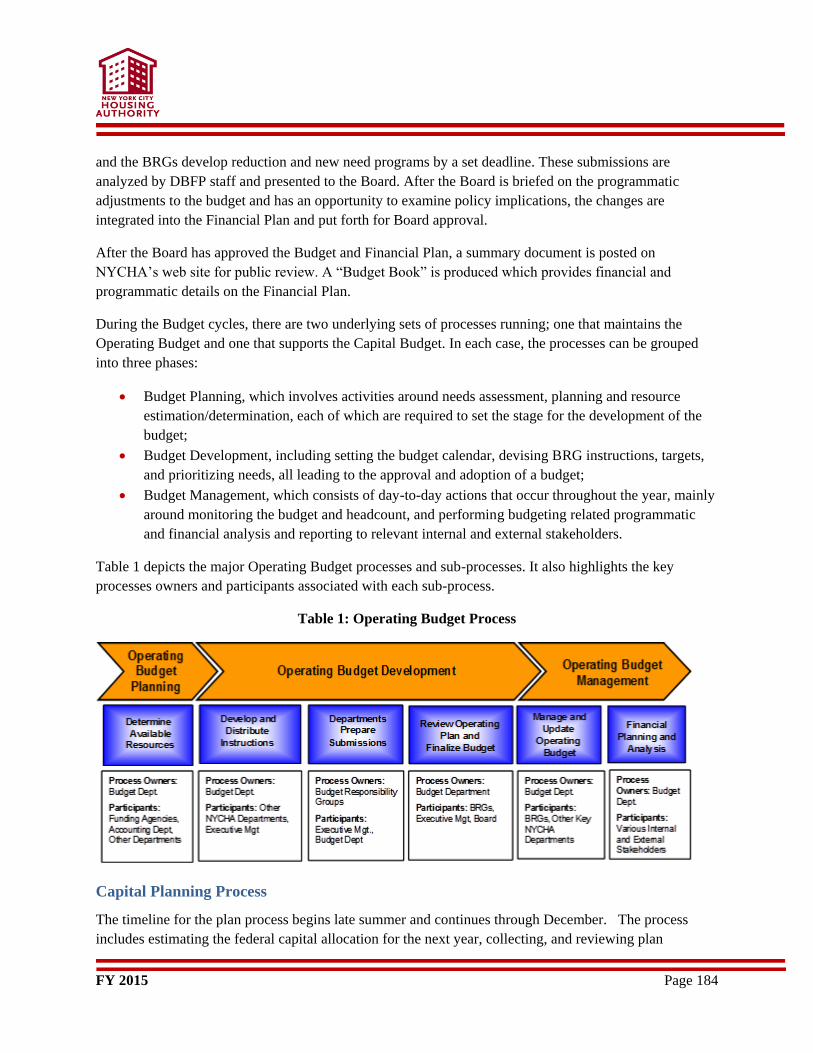
FY 2015 Page 184
and the BRGs develop reduction and new need programs by a set deadline. These submissions are
analyzed by DBFP staff and presented to the Board. After the Board is briefed on the programmatic
adjustments to the budget and has an opportunity to examine policy implications, the changes are
integrated into the Financial Plan and put forth for Board approval.
After the Board has approved the Budget and Financial Plan, a summary document is posted on
NYCHA’s web site for public review. A “Budget Book” is produced which provides financial and
programmatic details on the Financial Plan.
During the Budget cycles, there are two underlying sets of processes running; one that maintains the
Operating Budget and one that supports the Capital Budget. In each case, the processes can be grouped
into three phases:
Budget Planning, which involves activities around needs assessment, planning and resource
estimation/determination, each of which are required to set the stage for the development of the
budget;
Budget Development, including setting the budget calendar, devising BRG instructions, targets,
and prioritizing needs, all leading to the approval and adoption of a budget;
Budget Management, which consists of day-to-day actions that occur throughout the year, mainly
around monitoring the budget and headcount, and performing budgeting related programmatic
and financial analysis and reporting to relevant internal and external stakeholders.
Table 1 depicts the major Operating Budget processes and sub-processes. It also highlights the key
processes owners and participants associated with each sub-process.
Table 1: Operating Budget Process
Capital Planning Process
The timeline for the plan process begins late summer and continues through December. The process
includes estimating the federal capital allocation for the next year, collecting, and reviewing plan
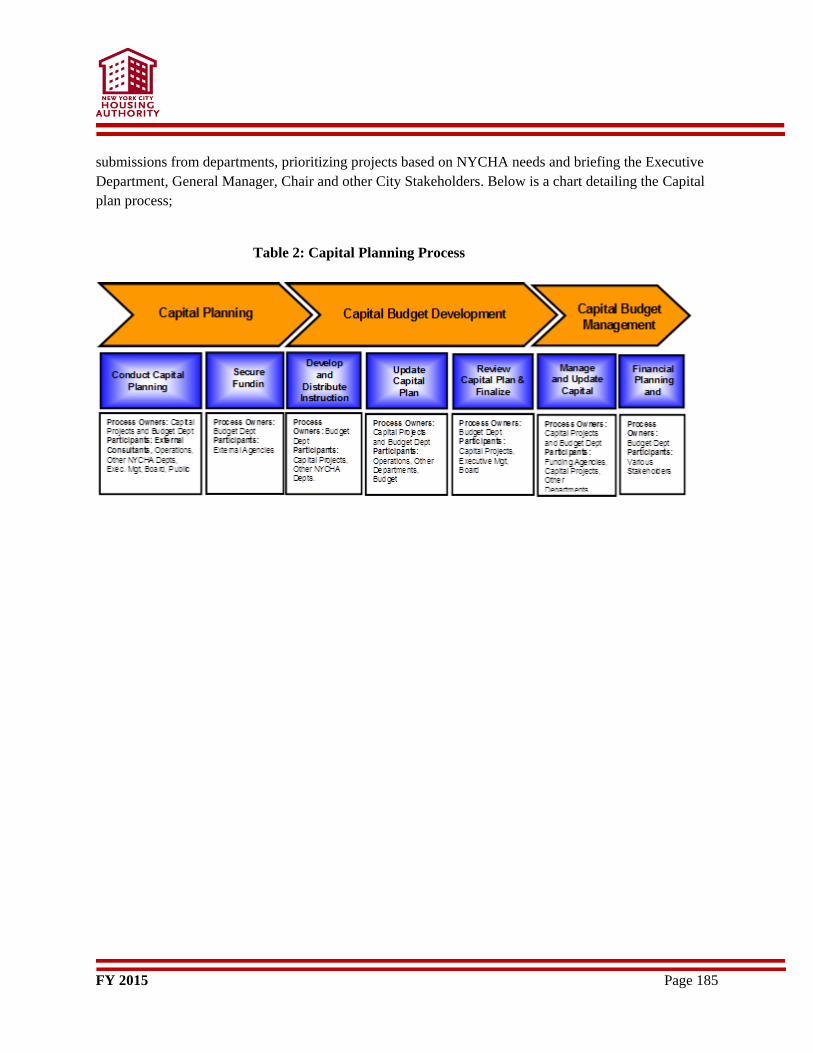
FY 2015 Page 185
submissions from departments, prioritizing projects based on NYCHA needs and briefing the Executive
Department, General Manager, Chair and other City Stakeholders. Below is a chart detailing the Capital
plan process;
Table 2: Capital Planning Process
FY 2015 Page 186
Financial
Management
FY 2015 Page 187
NYCHA’s financial management policies provide a basic framework for overall fiscal management. The
policies represent a foundation to address changing circumstance and conditions, assist in the decision-
making process and provide the guidelines for evaluating financial activities for future initiatives.
The financial management policies reflect long-standing principles and practices, which have enabled
NYCHA to maintain its financial stability. It is intended that the policies be reviewed annually so that the
guidelines represent a realistic, framework for public policy decisions.
The information that follows provides a summary of financial management policies for the following
areas:
Budget;
Audit;
Debt;
Cash Management;
Risk Finance; and
Contract Registration.
Budget Role
Budget
The Authority has instituted an Agency-wide departmental budgeting structure. Departmental budgeting
provides NYCHA departments with increased responsibilities in the development and monitoring of the
Operating and Capital Budgets. Departments are primarily responsible for determining their current and
anticipated needs and will work with the Budget Department to review and incorporate those needs into
an annual Board approved budget. In addition, departments are empowered to display fiscal responsibility
and accountability in the periodical monitoring of actual departmental revenues and expenditures against
the annual budget.
In conjunction with Agency-wide departmental budgeting structure, NYCHA’s budget process reflects
the Board’s vision and NYCHA’s policy direction as well as its response to change in needs, demands,
and opportunities. The budget process occurs twice a year with a pre-defined budget calendar. It
incorporates departmental input in planning, development, and management of NYCHA’s budget.
Audit
Internal Audit
The Authority has established an internal Audit Department to provide independent and objective analysis
of NYCHA operations. In carrying out its responsibilities, internal audit reviews:
The adequacy of Authority controls;
The degree of compliance to regulatory requirements and internal procedures; and
FY 2015 Page 188
The efficiency and economy of its operations.
Audits are performed in accordance with an annual audit plan that is approved by the Authority’s Audit
Committee. The Audit Department has unrestricted access to Authority documents, records, and staff to
maintain an independent perspective. The Director of Audit reports directly to the Audit Committee and
administratively to the Executive Vice President for Policy, Planning, and Management Analysis.
Audit Committee
In June 2003, the Authority’s Board of Directors (“Board”) approved the establishment of a five-member
Audit Committee. Until 2013, the Vice Chair on the Board was the Audit Committee Chair and the Audit
Committee consisted of the one full time NYCHA employee and five other non-NYCHA members. In
2013, the New York State legislature enacted an amendment to the State statute, Public Housing Law
Section 402, which changed the composition of the Board and eliminated a full-time Vice Chair position.
As a result, the Audit Committee now consists of five highly accomplished executives from outside
NYCHA with a diverse range of expertise in areas including finance, information technology,
performance management, construction, and real estate, which makes the Authority unique among the
nation’s PHAs. It underscores the Board’s commitment to the importance of accountability and corporate
governance in its operations. Per its Board-approved Charter, the Audit Committee is charged with
assisting the Board in overseeing the integrity of financial reporting, the adequacy of internal controls,
and compliance with statutory and regulatory requirements.
The Audit Committee oversees the work of the Audit Department and actively monitors all internal audits
and external audits performed by the Independent Auditor and other external agencies as well as
management’s corrective action and implementation plans to all audit findings. The Audit Committee
promotes continuous reviews of NYCHA’s internal control framework and also approves the annual and
risk assessment audit plan prepared by the Audit Director. The risk assessment is continuously monitored
and revised as needed to meet the changing risks to which the Authority may be exposed.
External Audit
NYCHA is required by statute to have an independent Auditor annually conduct a Single Audit of its
operations including opining on its internal controls over financial reporting and compliance to Federal
award programs. In addition, the Authority requires that an Independent Auditor annually audit its
financial statements. The Independent Auditor shall have broad experiences in auditing large local
government agencies in compliance with relevant federal rules and regulations such as the Single Audit
Act.
In addition to the above audits, the Authority operations are monitored and audited by the United States
Department of Housing and Urban Development (HUD).
FY 2015 Page 189
Debt
NYCHA has no legal debt limit. HUD is the primary source for operating and capital improvement
revenues, and secures the Authority’s debt.
HDC Loans
On September 10, 2013, the Authority entered into a Loan Agreement with the New York City Housing
Development Corporation (“HDC”); borrowing approximately $701 million of bond proceeds issued
under the Capital Fund Grant Revenue Bond Program at a weighted average interest rate 4.8 percent. The
face amount of the bonds consisted of $185,785,000 of Series 2013A bonds (“Series A bonds”) and
$470,300,000 of Series 2013 B (“Series B bonds”). The Series B bonds had two sub-series: Series 2013
B-1 $348,130,000 and Series 2013 B-2 $122,170,000. The bond premiums were $15,020,118 and
$29,695,129 on the Series A bonds and Series B bonds, respectively. The proceeds of the face amount of
these bonds were loaned to the Authority by HDC in the principal amounts of $185,785,000 and
$470,300,000 for the Series A bonds and Series B bonds, respectively
The Series 2013A bonds proceeds were issued at a weighted average rate of 4.4 percent and were used
together with other available funds in the prior Series 2005A bond program as an advance refund of the
remaining balance of the pre-existing Series 2005A bonds and to reduce the existing debt. The bond
proceeds of the new Series 2013A bonds were deposited in an irrevocable trust with an escrow agent to
provide for all remaining debt service payments on the 2005A Series bonds. The advance refunding
resulted in a difference between the reacquisition price and the net carrying amount of the old debt of
$10,388,000. This difference, a deferred amount on refunding, is being amortized through the year 2025
using the effective-interest method. The Authority completed the advance refunding to reduce total debt
service payments over the next 11 years by $7.0 million and to obtain an economic gain of $2.9 million.
The Series 2013 B bond proceeds were issued at a weighted average rate of 5.0 percent and is available to
be used to fund acquisition, construction or rehabilitation, and make capital improvement at up to 39
specified Authority developments. Capital improvements primarily include “building envelope” work on
roofs, brickwork, and windows, etc. The proceeds of these bonds that have been loaned to the Authority
by HDC were placed in escrow accounts with the Trustee banks. The Authority will draw down funds
from the Trustee by means of capital fund requisitions as work is completed.
Certificates of Indebtedness
The State of New York has loaned the Authority funds to finance the construction of State-aided
developments from proceeds of State Housing Bonds issued. The Authority has acknowledged its
indebtedness for such loans by issuance of Certificates of Indebtedness. Debt service requirements are
met by funds provided by HUD and the State of New York.
FY 2015 Page 190
Mortgage Loans
As part of the Authority’s March 16, 2010 mixed-finance transactions (see Note 22), HDC issued bonds
totaling $477,455,000. The bonds issued by HDC were comprised of seven different series as follows:
$23,590,000 2009 Series L-1, $68,000,000 2009 Series L-2, $150,000,000 2010 Series B (Bridge Bonds),
$140,000,000 2011 Series A (Bridge Bonds), $25,325,000 2010 Series A-1, $3,000,000 2010 Series A-2
(Fixed-Rate Taxable Bonds), and $67,540,000 2012 Series A (Index Floating Rate).
The bond proceeds were used to provide financing in the form of mortgage loans to LLC I and LLC II.
Of the seven different series of bonds issued as part of the mixed-finance transactions, 2009 Series L-1,
2010 Series A-1, and 2010 Series A-2 were outstanding as of December 31, 2013, with 2009 Series L-2,
2010 Series B, 2011 Series A, and 2012 Series A being paid off in 2013. In September 2013 all three
remaining loans were converted from construction to permanent loans, and principal and interest are
payable monthly.
For LLC I, the proceeds from the mortgage issued in connection with the $23,590,000 2009 Series L-1
Bonds were used to finance the acquisition of the developments. These mortgage loans are secured by the
net operating income of the respective development’s Section 8 rental revenue.
The LLC II financing structure for rehabilitation provided private activity bond proceeds from a long-
term bond issue of $25,325,000 2010 Series A-1 Bonds. Similarly, acquisition funds were provided from
the proceeds of the $3,000,000 2010 Series A-2 Bonds
Equipment Purchase/Lease Agreement
In January 2013, HUD approved a 13 year $18,045,000 Energy Performance Contract (“EPC”) Plan to
upgrade or repair boilers, instantaneous hot water heaters, apartment temperature sensors, and upgrade
computerized heating automated systems at six (6) developments, and upgrade an apartment convector at
one of these six developments. With this EPC approval, NYCHA entered into an $18,045,000 Equipment
Purchase/Lease Agreement with Bank of America, maturing in 2026, to purchase and finance the
equipment necessary to execute the EPC plan. This EPC plan will free up approximately $15 million in
Federal Capital Funds that were previously earmarked for boiler replacement projects at these six
developments, thereby enabling NYCHA to use these funds for other capital improvements pursuant to
NYCHA’s Five Year Capital Plan.
The table on the following page provides information about the change in long term debt over the past
year for the Authority and its blended component units ($ in thousands):
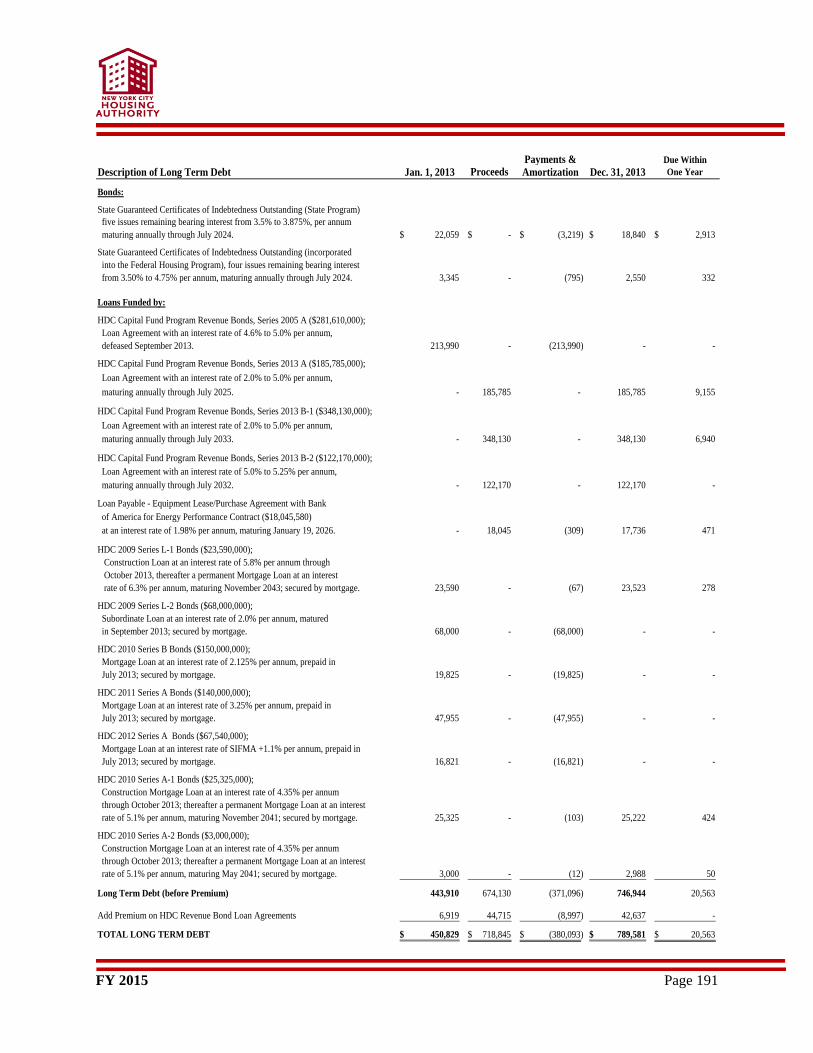
FY 2015 Page 191
Payments & Due Within
Description of Long Term Debt Jan. 1, 2013 Proceeds Amortization Dec. 31, 2013 One Year
Bonds:
State Guaranteed Certificates of Indebtedness Outstanding (State Program)
five issues remaining bearing interest from 3.5% to 3.875%, per annum
maturing annually through July 2024. 22,059$ -$ (3,219)$ 18,840$ 2,913$
State Guaranteed Certificates of Indebtedness Outstanding (incorporated
into the Federal Housing Program), four issues remaining bearing interest
from 3.50% to 4.75% per annum, maturing annually through July 2024. 3,345 - (795) 2,550 332
Loans Funded by:
HDC Capital Fund Program Revenue Bonds, Series 2005 A ($281,610,000);
Loan Agreement with an interest rate of 4.6% to 5.0% per annum,
defeased September 2013. 213,990 - (213,990) - -
HDC Capital Fund Program Revenue Bonds, Series 2013 A ($185,785,000);
Loan Agreement with an interest rate of 2.0% to 5.0% per annum,
maturing annually through July 2025. - 185,785 - 185,785 9,155
HDC Capital Fund Program Revenue Bonds, Series 2013 B-1 ($348,130,000);
Loan Agreement with an interest rate of 2.0% to 5.0% per annum,
maturing annually through July 2033. - 348,130 - 348,130 6,940
HDC Capital Fund Program Revenue Bonds, Series 2013 B-2 ($122,170,000);
Loan Agreement with an interest rate of 5.0% to 5.25% per annum,
maturing annually through July 2032. - 122,170 - 122,170 -
Loan Payable - Equipment Lease/Purchase Agreement with Bank
of America for Energy Performance Contract ($18,045,580)
at an interest rate of 1.98% per annum, maturing January 19, 2026. - 18,045 (309) 17,736 471
HDC 2009 Series L-1 Bonds ($23,590,000);
Construction Loan at an interest rate of 5.8% per annum through
October 2013, thereafter a permanent Mortgage Loan at an interest
rate of 6.3% per annum, maturing November 2043; secured by mortgage. 23,590 - (67) 23,523 278
HDC 2009 Series L-2 Bonds ($68,000,000);
Subordinate Loan at an interest rate of 2.0% per annum, matured
in September 2013; secured by mortgage. 68,000 - (68,000) - -
HDC 2010 Series B Bonds ($150,000,000);
Mortgage Loan at an interest rate of 2.125% per annum, prepaid in
July 2013; secured by mortgage. 19,825 - (19,825) - -
HDC 2011 Series A Bonds ($140,000,000);
Mortgage Loan at an interest rate of 3.25% per annum, prepaid in
July 2013; secured by mortgage. 47,955 - (47,955) - -
HDC 2012 Series A Bonds ($67,540,000);
Mortgage Loan at an interest rate of SIFMA +1.1% per annum, prepaid in
July 2013; secured by mortgage. 16,821 - (16,821) - -
HDC 2010 Series A-1 Bonds ($25,325,000);
Construction Mortgage Loan at an interest rate of 4.35% per annum
through October 2013; thereafter a permanent Mortgage Loan at an interest
rate of 5.1% per annum, maturing November 2041; secured by mortgage. 25,325 - (103) 25,222 424
HDC 2010 Series A-2 Bonds ($3,000,000);
Construction Mortgage Loan at an interest rate of 4.35% per annum
through October 2013; thereafter a permanent Mortgage Loan at an interest
rate of 5.1% per annum, maturing May 2041; secured by mortgage. 3,000 - (12) 2,988 50
Long Term Debt (before Premium) 443,910 674,130 (371,096) 746,944 20,563
Add Premium on HDC Revenue Bond Loan Agreements 6,919 44,715 (8,997) 42,637 -
TOTAL LONG TERM DEBT 450,829$ 718,845$ (380,093)$ 789,581$ 20,563$
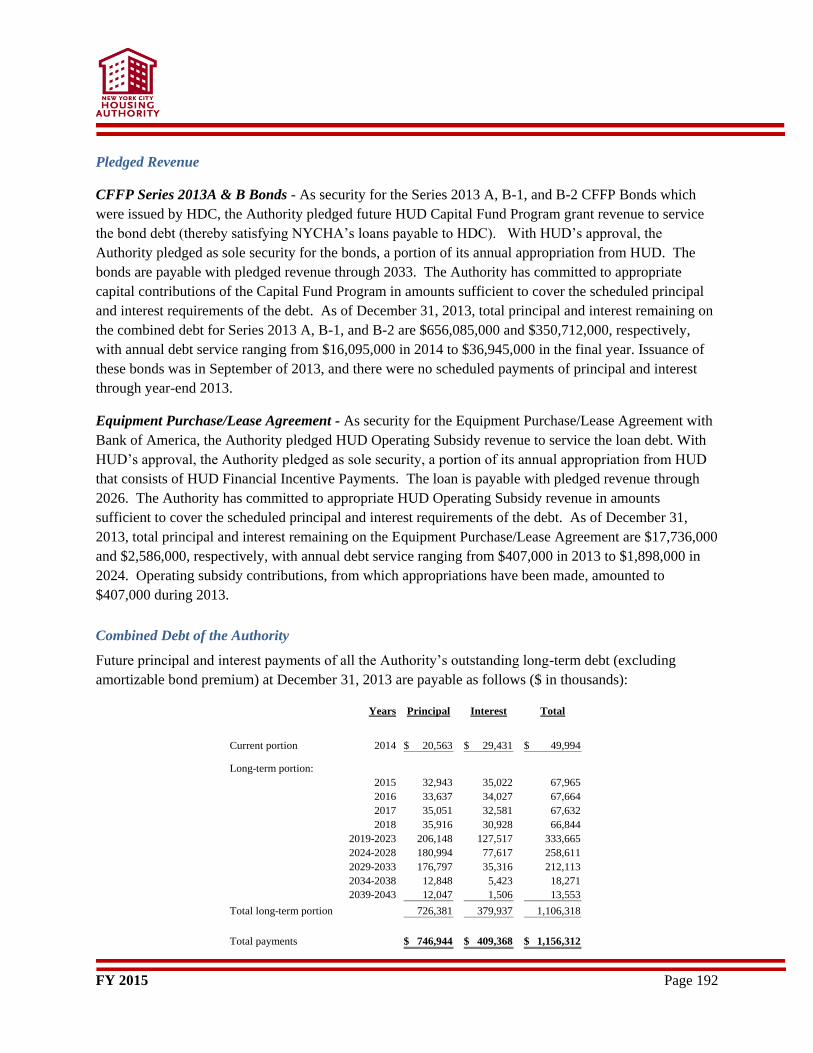
FY 2015 Page 192
Pledged Revenue
CFFP Series 2013A & B Bonds - As security for the Series 2013 A, B-1, and B-2 CFFP Bonds which
were issued by HDC, the Authority pledged future HUD Capital Fund Program grant revenue to service
the bond debt (thereby satisfying NYCHA’s loans payable to HDC). With HUD’s approval, the
Authority pledged as sole security for the bonds, a portion of its annual appropriation from HUD. The
bonds are payable with pledged revenue through 2033. The Authority has committed to appropriate
capital contributions of the Capital Fund Program in amounts sufficient to cover the scheduled principal
and interest requirements of the debt. As of December 31, 2013, total principal and interest remaining on
the combined debt for Series 2013 A, B-1, and B-2 are $656,085,000 and $350,712,000, respectively,
with annual debt service ranging from $16,095,000 in 2014 to $36,945,000 in the final year. Issuance of
these bonds was in September of 2013, and there were no scheduled payments of principal and interest
through year-end 2013.
Equipment Purchase/Lease Agreement - As security for the Equipment Purchase/Lease Agreement with
Bank of America, the Authority pledged HUD Operating Subsidy revenue to service the loan debt. With
HUD’s approval, the Authority pledged as sole security, a portion of its annual appropriation from HUD
that consists of HUD Financial Incentive Payments. The loan is payable with pledged revenue through
2026. The Authority has committed to appropriate HUD Operating Subsidy revenue in amounts
sufficient to cover the scheduled principal and interest requirements of the debt. As of December 31,
2013, total principal and interest remaining on the Equipment Purchase/Lease Agreement are $17,736,000
and $2,586,000, respectively, with annual debt service ranging from $407,000 in 2013 to $1,898,000 in
2024. Operating subsidy contributions, from which appropriations have been made, amounted to
$407,000 during 2013.
Combined Debt of the Authority
Future principal and interest payments of all the Authority’s outstanding long-term debt (excluding
amortizable bond premium) at December 31, 2013 are payable as follows ($ in thousands):
Years Principal Interest Total
Current portion 2014 20,563$ 29,431$ 49,994$
Long-term portion:
2015 32,943 35,022 67,965
2016 33,637 34,027 67,664
2017 35,051 32,581 67,632
2018 35,916 30,928 66,844
2019-2023 206,148 127,517 333,665
2024-2028 180,994 77,617 258,611
2029-2033 176,797 35,316 212,113
2034-2038 12,848 5,423 18,271
2039-2043 12,047 1,506 13,553
Total long-term portion 726,381 379,937 1,106,318
Total payments 746,944$ 409,368$ 1,156,312$
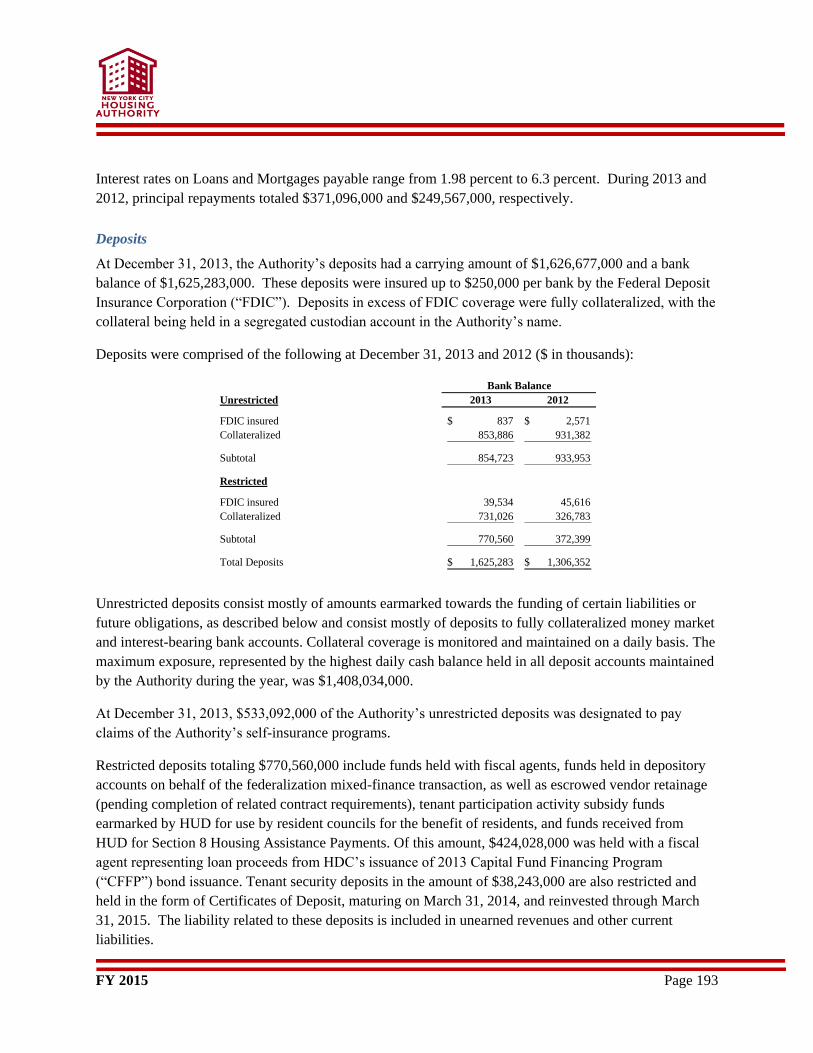
FY 2015 Page 193
Interest rates on Loans and Mortgages payable range from 1.98 percent to 6.3 percent. During 2013 and
2012, principal repayments totaled $371,096,000 and $249,567,000, respectively.
Deposits
At December 31, 2013, the Authority’s deposits had a carrying amount of $1,626,677,000 and a bank
balance of $1,625,283,000. These deposits were insured up to $250,000 per bank by the Federal Deposit
Insurance Corporation (“FDIC”). Deposits in excess of FDIC coverage were fully collateralized, with the
collateral being held in a segregated custodian account in the Authority’s name.
Deposits were comprised of the following at December 31, 2013 and 2012 ($ in thousands):
Bank Balance
Unrestricted 2013 2012
FDIC insured 837$ 2,571$
Collateralized 853,886 931,382
Subtotal 854,723 933,953
Restricted
FDIC insured 39,534 45,616
Collateralized 731,026 326,783
Subtotal 770,560 372,399
Total Deposits 1,625,283$ 1,306,352$
Unrestricted deposits consist mostly of amounts earmarked towards the funding of certain liabilities or
future obligations, as described below and consist mostly of deposits to fully collateralized money market
and interest-bearing bank accounts. Collateral coverage is monitored and maintained on a daily basis. The
maximum exposure, represented by the highest daily cash balance held in all deposit accounts maintained
by the Authority during the year, was $1,408,034,000.
At December 31, 2013, $533,092,000 of the Authority’s unrestricted deposits was designated to pay
claims of the Authority’s self-insurance programs.
Restricted deposits totaling $770,560,000 include funds held with fiscal agents, funds held in depository
accounts on behalf of the federalization mixed-finance transaction, as well as escrowed vendor retainage
(pending completion of related contract requirements), tenant participation activity subsidy funds
earmarked by HUD for use by resident councils for the benefit of residents, and funds received from
HUD for Section 8 Housing Assistance Payments. Of this amount, $424,028,000 was held with a fiscal
agent representing loan proceeds from HDC’s issuance of 2013 Capital Fund Financing Program
(“CFFP”) bond issuance. Tenant security deposits in the amount of $38,243,000 are also restricted and
held in the form of Certificates of Deposit, maturing on March 31, 2014, and reinvested through March
31, 2015. The liability related to these deposits is included in unearned revenues and other current
liabilities.
FY 2015 Page 194
Investments
At December 31, 2013 and 2012 there were no investments of unrestricted funds, since all unrestricted
funds were held in money market and interest-bearing bank accounts.
At December 31, 2013, $83,990,000 of restricted funds was held by various Trustees (fiscal agents)
relating to both mixed-finance transactions and HDC’s 2013 Capital Fund Financing Program bond
issuance. This amount was comprised of $83,664,000 in restricted investments and $326,000 in restricted
cash equivalents.
Of the $83,664,000 in restricted investments held with fiscal agents, there was $1,595,000 in debt service
reserves invested on behalf of obligations related to the mixed-finance transactions, and the remaining
$82,069,000 consisted of available proceeds from loans issued on behalf of the 2013 Capital Fund
Financing Program to NYCHA which were invested in debt service reserve accounts and loan fund
accounts.
Restricted investments consist of the following at December 31, 2013 and 2012 ($ in thousands):
Restricted 2013 2012
U.S. Agency Securities 52,245$ -
Guaranteed Investment Contracts 29,824 3,670
NYC General Obligation Taxable Bond Series G-2 1,595 1,626
Repurchase Agreements 326 36,513
Discount Notes - 2,419
Total restricted investments, including cash equivalents 83,990 44,228
Less amount reported as restricted cash equivalents 326 36,513
Restricted investments 83,664$ 7,715$
The maturities of the Authority’s investments at December 31, 2013 were ($ in thousands):
Investment Type Investment Maturities
Restricted Total <1 year 1-5 years >5 years
U.S. Agency Securities 52,245$ -$ 52,245$ -$
Guaranteed Investment Contracts 29,824 - - 29,824
NYC General Obligation Taxable
Bond Series G-2 1,595 - 1,595 -
Repurchase Agreements 326 326 - -
Total 83,990$ 326$ 53,840$ 29,824$
At December 31, 2013, the Authority’s weighted average term to maturity for restricted investments is
8.39 years. The Authority determines maturity levels based upon current available interest rates,
FY 2015 Page 195
expectations for future rates and the appropriate amount of liquidity needed for operations. HUD policy
allows for investments with maturities up to three years and the Authority has received a HUD waiver to
invest long-term reserves up to seven years.
Policies governing investments
The Authority has adopted the HUD investment policy outlined in HUD Notice PIH-2002-13 (HA), as its
formal investment policy. In accordance with its Annual Contributions Contract (the “ACC”) with HUD,
the Authority is required to comply with this HUD notice. These guidelines require the Authority to
deposit funds in accordance with the terms of a General Depository Agreement, which must be in a form
approved by HUD and executed between the Authority and the depository, and restricts the Authority’s
investments to HUD–authorized securities, such as those issued by the U.S. Treasury, U.S. Government
Agencies, and their instrumentalities, and requires that all investments be held in a segregated custody
account in the name of the Authority.
The Authority’s current investment strategy involves a consideration of the basic risks of fixed-income
investing, including interest rate risk, market risk, credit risk, re-investment risk and structural risk. In
managing these risks, the primary factors considered are safety of principal, yield, liquidity, maturity, and
administrative costs.
Interest rate risk
Interest rate risk is the risk that changes in interest rates will adversely affect the fair value of the
Authority’s investment portfolio. In accordance with the Authority’s investment policy, interest rate risk
is mitigated by an investment program utilizing mostly U.S. Treasury securities, or securities issued by
U.S. Government Agencies and their instrumentalities. The Authority utilizes a detailed, forecasting and
reporting mechanism with the objective that securities are held full-term and never need to be sold prior
to maturity, unless as part of a re-investment strategy or to ensure the safety of invested principal.
Credit Risk
It is the Authority’s policy to limit its investments mostly to HUD-authorized investments issued by the
U.S. Government, a government agency or by a government-sponsored agency. The Authority’s policy is
to invest mostly in Federal Agency and U.S. Treasury securities which are AA and AAA rated by
Standard and Poor’s or Moody’s, or in fully collateralized money market and interest-bearing bank
accounts at banks rated A or better by Moody’s, Fitch or S&P. Depository bank accounts maintaining
federal funds are fully collateralized by Treasury and/or Federal Agency securities.
Concentration of Credit Risk
The Authority strives to invest in only AA and AAA rated Federal Agency and/or U.S. Treasury
securities. Therefore, the Authority’s policy does not place a limit on investments with any one issuer.
The Authority’s cash deposits are maintained in fully collateralized money market and fully collateralized
interest-bearing bank accounts. Consequently, the Authority does not limit deposits to any one bank.
FY 2015 Page 196
Nevertheless, the Authority strives to diversify holdings in cash and cash equivalents, whenever possible,
to further minimize any potential concentration of credit risk.
Custodial credit risk
The Authority maintains a perfected security interest in the collateral held on its behalf at the custodial
agents. Custodial credit risk is the risk that the Authority will not be able to recover its collateral held by a
third-party custodian, in the event that the custodian defaults. The Authority has no custodial credit risk
due to the Authority’s perfected security interest in its collateral in a segregated custodian account, which
is registered in the Authority’s name. The Authority’s policy requires that securities shall be maintained
in a third-party custodian account and the manner of collateralization shall provide the Authority with a
continuing perfected security interest in the collateral for the full term of the deposit, in accordance with
applicable laws and Federal regulations. Such collateral shall, at all times, have a market value at least
equal to the amount of deposits so secured.
Risk Finance
The Authority maintains a risk management program to protect its assets and minimize its exposure to
potential losses. The Authority utilizes a combination of self-insurance (workers’ compensation and
general liability) and commercial insurance to cover potential liabilities. A third-party administrator
provides investigation, processing and loss control services for workers’ compensation.
The Authority’s risk management program minimizes its exposure to potential losses. The Risk Finance
Department’s risk control efforts were developed to support the Authority’s insurance program and to
guard the health and safety of the Authority’s staff. These efforts produce positive results as injury rates
continue to decline. Risk Finance chairs the Authority’s Safety Committee and manages the Employee
Safety Program which is multi-faceted. The Office of Safety & Security was created in 2012. This office
embraces a broader safety strategy through the collaborative efforts of various stakeholders both inside
and outside the Authority. Mitigation of hazards is addressed through proper identification of high injury
rate locations. “Multiple Accident Focus Groups” help address safe work practices. The Safety
Committee communicates operational changes required to senior management.
Contract Registration
All contracting activity and associated accounting are performed in the financial systems as part of the
Authority’s new contract registration process, and in conjunction with NYCHA’s departmental budgets
implemented in September 2003. This process requires that contracts must be registered in the financial
system before final execution and must have budgetary approval. This means that work to be performed
under the contract cannot commence until registration is completed. It ensures that sufficient funding
exists to support the obligation associated with the contract, provides a central repository for contract
documentation necessary to maintain an audit trail supporting the general ledger, and ensures the
accuracy of accounting and funds available information posted in the Oracle financial system.
FY 2015 Page 197
Fund
Structure
FY 2015 Page 198
Fund Structure Summary
The Authority’s basic financial statements consist of a single enterprise fund, which includes the
following programs:
Federal Low Rent Housing Program (Conventional Public Housing);
City/State Housing Program (Conventional Public Housing);
Housing Choice Voucher Program (Section 8);
Section 8 Rental New Construction Program (Project-Based);
Capital Fund Program; and
Other Grant Programs.
Excluding the Capital Fund Program, these funds collectively comprise NYCHA’s Operating Budget.
The Authority maintains its accounting records by program.
Budgets by Fund
Budgets and headcounts are maintained by funding source. Funding sources are monies which support
specific programs. NYCHA’s operating budget is categorized into four major funding sources:
General Fund, (GF01) which includes conventional Public Housing (Federal, State and City
units) and NYCHA’s Section 8 project-based developments;
Section 8 (F006), which includes revenues and expenses incurred by the administration of this
federal program;
Grants, which includes competitive grants received by NYCHA; and
Elimination used offset inter-fund revenues.
Fund Balance
For budgetary purposes, “fund balance” refers to a balanced budget (i.e. existing resources that are used
to supplement current revenues and similar items to cover current expenditures). NYCHA budgets on a
cash basis. The following tables show beginning and ending cash from FY 2013- FY 2015. Going into FY
2015, NYCHA has a $98.2 million deficit in its general fund. All other funding sources are balanced.
Table 1 lists headcounts associated by funding sources from FY 2015 - FY 2019. Table 2 shows the
beginning and ending cash flows from FY 2013 – FY 2015. Tables 3 - 7 list FY 2015 through FY 2019
by line item for each major funding source.
Table 1: FY 2015 –FY 2019 Head Count
By Funding
2015 2016 2017 2018 2019
General Fund 10,603 10,610 10,629 10,572 10,517
Section 8 497 483 471 459 447
Grants 218 128 39 39 37
Total 11,318 11,221 11,139 11,070 11,001
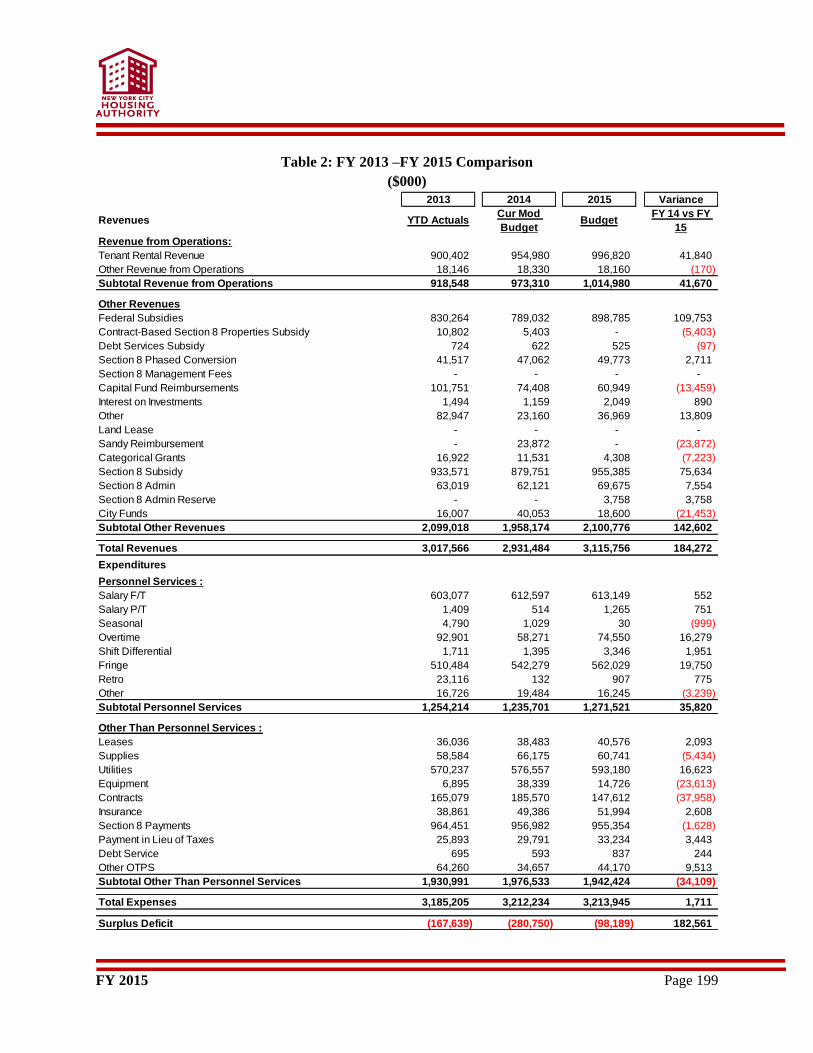
FY 2015 Page 199
Table 2: FY 2013 –FY 2015 Comparison
($000)
2013 2014 2015 Variance
Revenues YTD ActualsCur Mod
BudgetBudget
FY 14 vs FY
15
Revenue from Operations:
Tenant Rental Revenue 900,402 954,980 996,820 41,840
Other Revenue from Operations 18,146 18,330 18,160 (170)
Subtotal Revenue from Operations 918,548 973,310 1,014,980 41,670
Other Revenues
Federal Subsidies 830,264 789,032 898,785 109,753
Contract-Based Section 8 Properties Subsidy 10,802 5,403 - (5,403)
Debt Services Subsidy 724 622 525 (97)
Section 8 Phased Conversion 41,517 47,062 49,773 2,711
Section 8 Management Fees - - - -
Capital Fund Reimbursements 101,751 74,408 60,949 (13,459)
Interest on Investments 1,494 1,159 2,049 890
Other 82,947 23,160 36,969 13,809
Land Lease - - - -
Sandy Reimbursement - 23,872 - (23,872)
Categorical Grants 16,922 11,531 4,308 (7,223)
Section 8 Subsidy 933,571 879,751 955,385 75,634
Section 8 Admin 63,019 62,121 69,675 7,554
Section 8 Admin Reserve - - 3,758 3,758
City Funds 16,007 40,053 18,600 (21,453)
Subtotal Other Revenues 2,099,018 1,958,174 2,100,776 142,602
Total Revenues 3,017,566 2,931,484 3,115,756 184,272
Expenditures
Personnel Services :
Salary F/T 603,077 612,597 613,149 552
Salary P/T 1,409 514 1,265 751
Seasonal 4,790 1,029 30 (999)
Overtime 92,901 58,271 74,550 16,279
Shift Differential 1,711 1,395 3,346 1,951
Fringe 510,484 542,279 562,029 19,750
Retro 23,116 132 907 775
Other 16,726 19,484 16,245 (3,239)
Subtotal Personnel Services 1,254,214 1,235,701 1,271,521 35,820
Other Than Personnel Services :
Leases 36,036 38,483 40,576 2,093
Supplies 58,584 66,175 60,741 (5,434)
Utilities 570,237 576,557 593,180 16,623
Equipment 6,895 38,339 14,726 (23,613)
Contracts 165,079 185,570 147,612 (37,958)
Insurance 38,861 49,386 51,994 2,608
Section 8 Payments 964,451 956,982 955,354 (1,628)
Payment in Lieu of Taxes 25,893 29,791 33,234 3,443
Debt Service 695 593 837 244
Other OTPS 64,260 34,657 44,170 9,513
Subtotal Other Than Personnel Services 1,930,991 1,976,533 1,942,424 (34,109)
Total Expenses 3,185,205 3,212,234 3,213,945 1,711
Surplus Deficit (167,639) (280,750) (98,189) 182,561
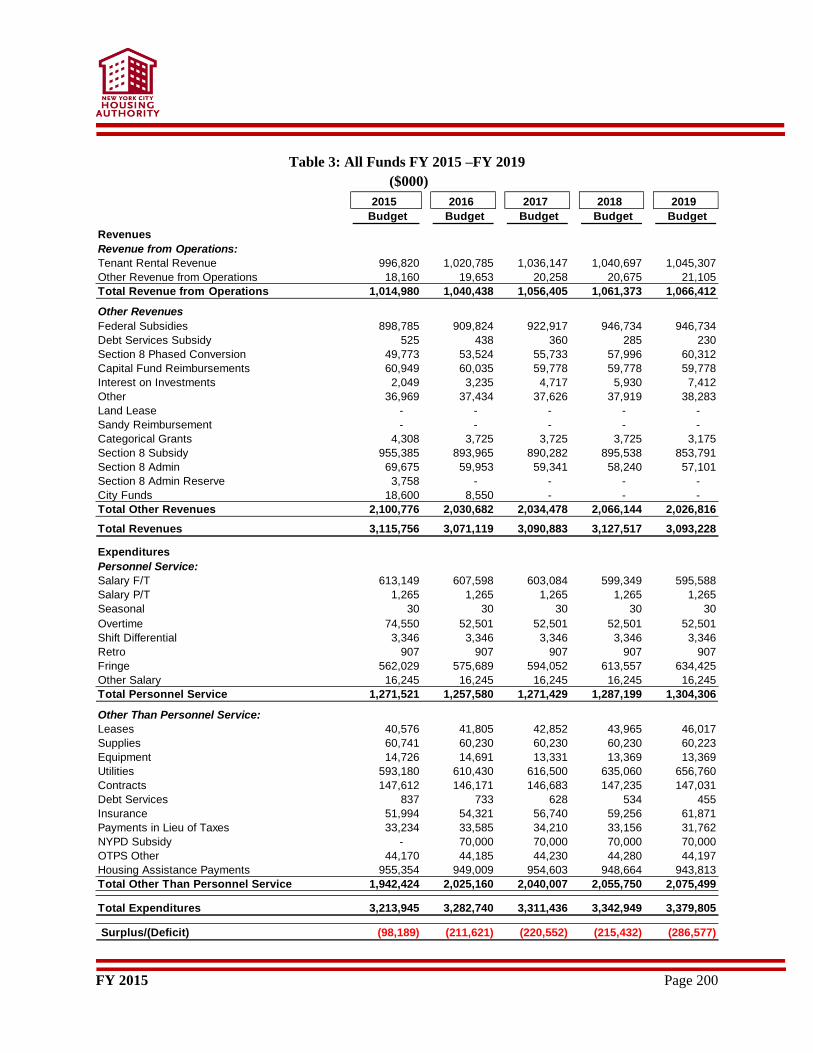
FY 2015 Page 200
Table 3: All Funds FY 2015 –FY 2019
($000)
2015 2016 2017 2018 2019
Budget Budget Budget Budget Budget
Revenues
Revenue from Operations:
Tenant Rental Revenue 996,820 1,020,785 1,036,147 1,040,697 1,045,307
Other Revenue from Operations 18,160 19,653 20,258 20,675 21,105
Total Revenue from Operations 1,014,980 1,040,438 1,056,405 1,061,373 1,066,412
Other Revenues
Federal Subsidies 898,785 909,824 922,917 946,734 946,734
Debt Services Subsidy 525 438 360 285 230
Section 8 Phased Conversion 49,773 53,524 55,733 57,996 60,312
Capital Fund Reimbursements 60,949 60,035 59,778 59,778 59,778
Interest on Investments 2,049 3,235 4,717 5,930 7,412
Other 36,969 37,434 37,626 37,919 38,283
Land Lease - - - - -
Sandy Reimbursement - - - - -
Categorical Grants 4,308 3,725 3,725 3,725 3,175
Section 8 Subsidy 955,385 893,965 890,282 895,538 853,791
Section 8 Admin 69,675 59,953 59,341 58,240 57,101
Section 8 Admin Reserve 3,758 - - - -
City Funds 18,600 8,550 - - -
Total Other Revenues 2,100,776 2,030,682 2,034,478 2,066,144 2,026,816
Total Revenues 3,115,756 3,071,119 3,090,883 3,127,517 3,093,228
Expenditures
Personnel Service:
Salary F/T 613,149 607,598 603,084 599,349 595,588
Salary P/T 1,265 1,265 1,265 1,265 1,265
Seasonal 30 30 30 30 30
Overtime 74,550 52,501 52,501 52,501 52,501
Shift Differential 3,346 3,346 3,346 3,346 3,346
Retro 907 907 907 907 907
Fringe 562,029 575,689 594,052 613,557 634,425
Other Salary 16,245 16,245 16,245 16,245 16,245
Total Personnel Service 1,271,521 1,257,580 1,271,429 1,287,199 1,304,306
Other Than Personnel Service:
Leases 40,576 41,805 42,852 43,965 46,017
Supplies 60,741 60,230 60,230 60,230 60,223
Equipment 14,726 14,691 13,331 13,369 13,369
Utilities 593,180 610,430 616,500 635,060 656,760
Contracts 147,612 146,171 146,683 147,235 147,031
Debt Services 837 733 628 534 455
Insurance 51,994 54,321 56,740 59,256 61,871
Payments in Lieu of Taxes 33,234 33,585 34,210 33,156 31,762
NYPD Subsidy - 70,000 70,000 70,000 70,000
OTPS Other 44,170 44,185 44,230 44,280 44,197
Housing Assistance Payments 955,354 949,009 954,603 948,664 943,813
Total Other Than Personnel Service 1,942,424 2,025,160 2,040,007 2,055,750 2,075,499
Total Expenditures 3,213,945 3,282,740 3,311,436 3,342,949 3,379,805
Surplus/(Deficit) (98,189) (211,621) (220,552) (215,432) (286,577)
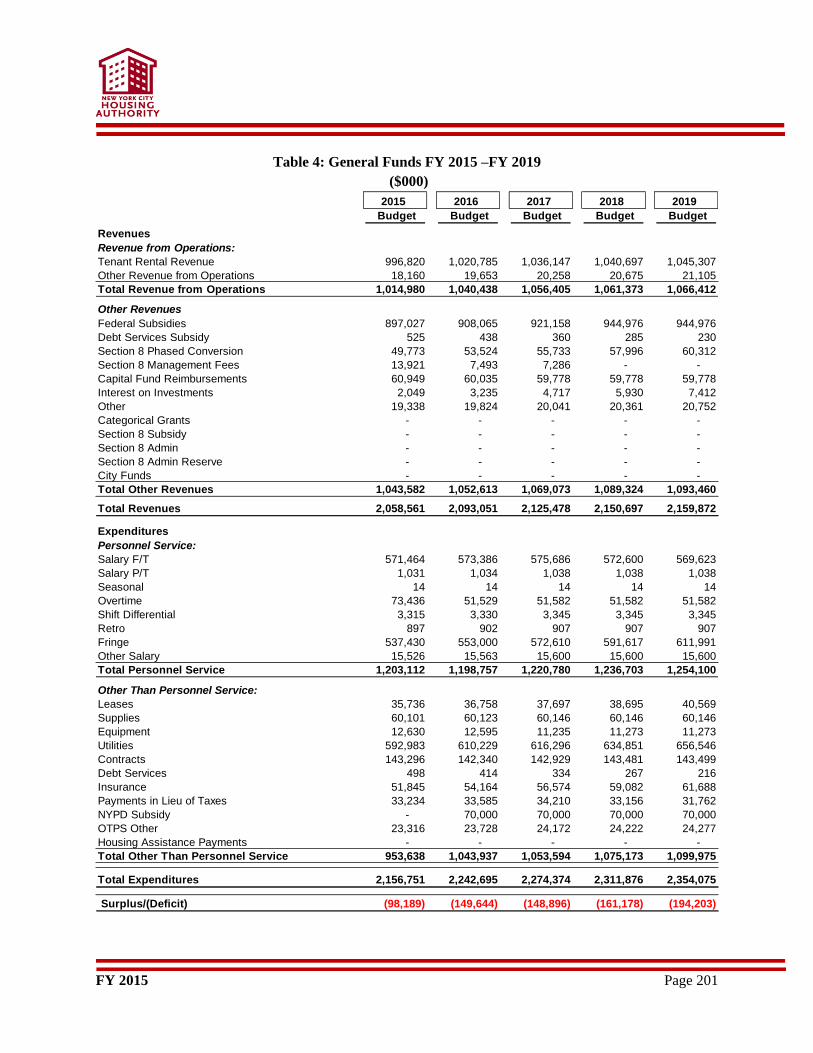
FY 2015 Page 201
Table 4: General Funds FY 2015 –FY 2019
($000)
2015 2016 2017 2018 2019
Budget Budget Budget Budget Budget
Revenues
Revenue from Operations:
Tenant Rental Revenue 996,820 1,020,785 1,036,147 1,040,697 1,045,307
Other Revenue from Operations 18,160 19,653 20,258 20,675 21,105
Total Revenue from Operations 1,014,980 1,040,438 1,056,405 1,061,373 1,066,412
Other Revenues
Federal Subsidies 897,027 908,065 921,158 944,976 944,976
Debt Services Subsidy 525 438 360 285 230
Section 8 Phased Conversion 49,773 53,524 55,733 57,996 60,312
Section 8 Management Fees 13,921 7,493 7,286 - -
Capital Fund Reimbursements 60,949 60,035 59,778 59,778 59,778
Interest on Investments 2,049 3,235 4,717 5,930 7,412
Other 19,338 19,824 20,041 20,361 20,752
Categorical Grants - - - - -
Section 8 Subsidy - - - - -
Section 8 Admin - - - - -
Section 8 Admin Reserve - - - - -
City Funds - - - - -
Total Other Revenues 1,043,582 1,052,613 1,069,073 1,089,324 1,093,460
Total Revenues 2,058,561 2,093,051 2,125,478 2,150,697 2,159,872
Expenditures
Personnel Service:
Salary F/T 571,464 573,386 575,686 572,600 569,623
Salary P/T 1,031 1,034 1,038 1,038 1,038
Seasonal 14 14 14 14 14
Overtime 73,436 51,529 51,582 51,582 51,582
Shift Differential 3,315 3,330 3,345 3,345 3,345
Retro 897 902 907 907 907
Fringe 537,430 553,000 572,610 591,617 611,991
Other Salary 15,526 15,563 15,600 15,600 15,600
Total Personnel Service 1,203,112 1,198,757 1,220,780 1,236,703 1,254,100
Other Than Personnel Service:
Leases 35,736 36,758 37,697 38,695 40,569
Supplies 60,101 60,123 60,146 60,146 60,146
Equipment 12,630 12,595 11,235 11,273 11,273
Utilities 592,983 610,229 616,296 634,851 656,546
Contracts 143,296 142,340 142,929 143,481 143,499
Debt Services 498 414 334 267 216
Insurance 51,845 54,164 56,574 59,082 61,688
Payments in Lieu of Taxes 33,234 33,585 34,210 33,156 31,762
NYPD Subsidy - 70,000 70,000 70,000 70,000
OTPS Other 23,316 23,728 24,172 24,222 24,277
Housing Assistance Payments - - - - -
Total Other Than Personnel Service 953,638 1,043,937 1,053,594 1,075,173 1,099,975
Total Expenditures 2,156,751 2,242,695 2,274,374 2,311,876 2,354,075
Surplus/(Deficit) (98,189) (149,644) (148,896) (161,178) (194,203)
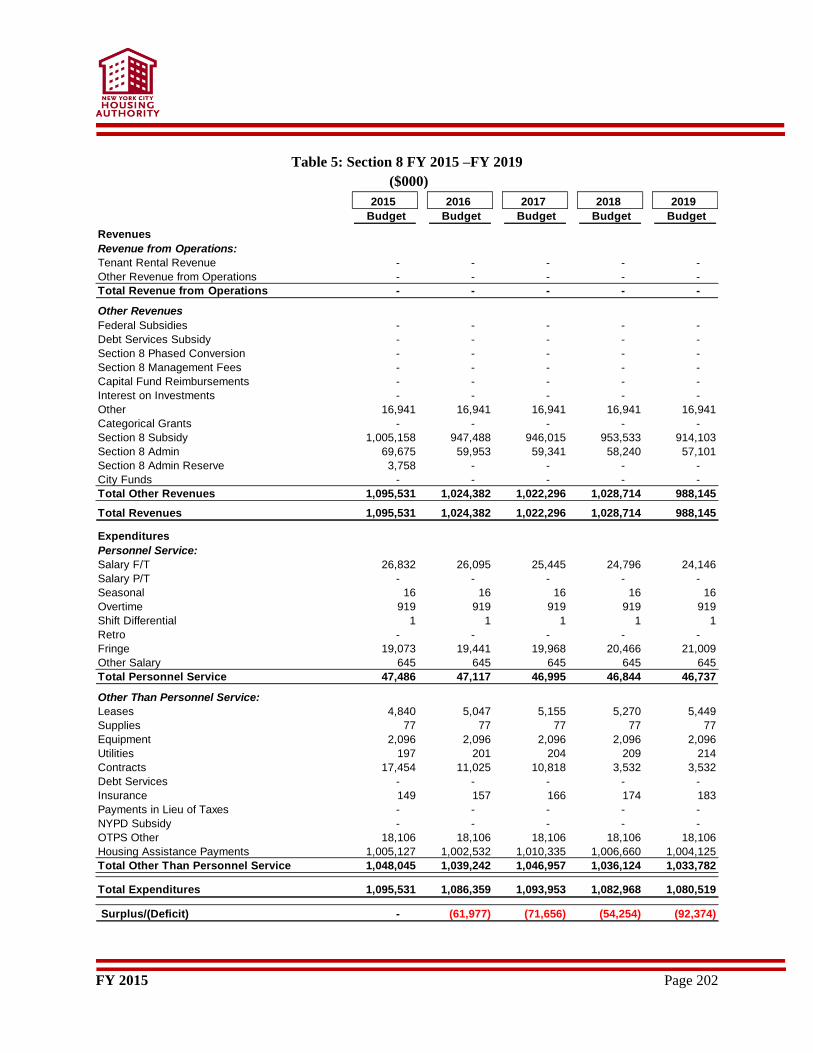
FY 2015 Page 202
Table 5: Section 8 FY 2015 –FY 2019
($000)
2015 2016 2017 2018 2019
Budget Budget Budget Budget Budget
Revenues
Revenue from Operations:
Tenant Rental Revenue - - - - -
Other Revenue from Operations - - - - -
Total Revenue from Operations - - - - -
Other Revenues
Federal Subsidies - - - - -
Debt Services Subsidy - - - - -
Section 8 Phased Conversion - - - - -
Section 8 Management Fees - - - - -
Capital Fund Reimbursements - - - - -
Interest on Investments - - - - -
Other 16,941 16,941 16,941 16,941 16,941
Categorical Grants - - - - -
Section 8 Subsidy 1,005,158 947,488 946,015 953,533 914,103
Section 8 Admin 69,675 59,953 59,341 58,240 57,101
Section 8 Admin Reserve 3,758 - - - -
City Funds - - - - -
Total Other Revenues 1,095,531 1,024,382 1,022,296 1,028,714 988,145
Total Revenues 1,095,531 1,024,382 1,022,296 1,028,714 988,145
Expenditures
Personnel Service:
Salary F/T 26,832 26,095 25,445 24,796 24,146
Salary P/T - - - - -
Seasonal 16 16 16 16 16
Overtime 919 919 919 919 919
Shift Differential 1 1 1 1 1
Retro - - - - -
Fringe 19,073 19,441 19,968 20,466 21,009
Other Salary 645 645 645 645 645
Total Personnel Service 47,486 47,117 46,995 46,844 46,737
Other Than Personnel Service:
Leases 4,840 5,047 5,155 5,270 5,449
Supplies 77 77 77 77 77
Equipment 2,096 2,096 2,096 2,096 2,096
Utilities 197 201 204 209 214
Contracts 17,454 11,025 10,818 3,532 3,532
Debt Services - - - - -
Insurance 149 157 166 174 183
Payments in Lieu of Taxes - - - - -
NYPD Subsidy - - - - -
OTPS Other 18,106 18,106 18,106 18,106 18,106
Housing Assistance Payments 1,005,127 1,002,532 1,010,335 1,006,660 1,004,125
Total Other Than Personnel Service 1,048,045 1,039,242 1,046,957 1,036,124 1,033,782
Total Expenditures 1,095,531 1,086,359 1,093,953 1,082,968 1,080,519
Surplus/(Deficit) - (61,977) (71,656) (54,254) (92,374)
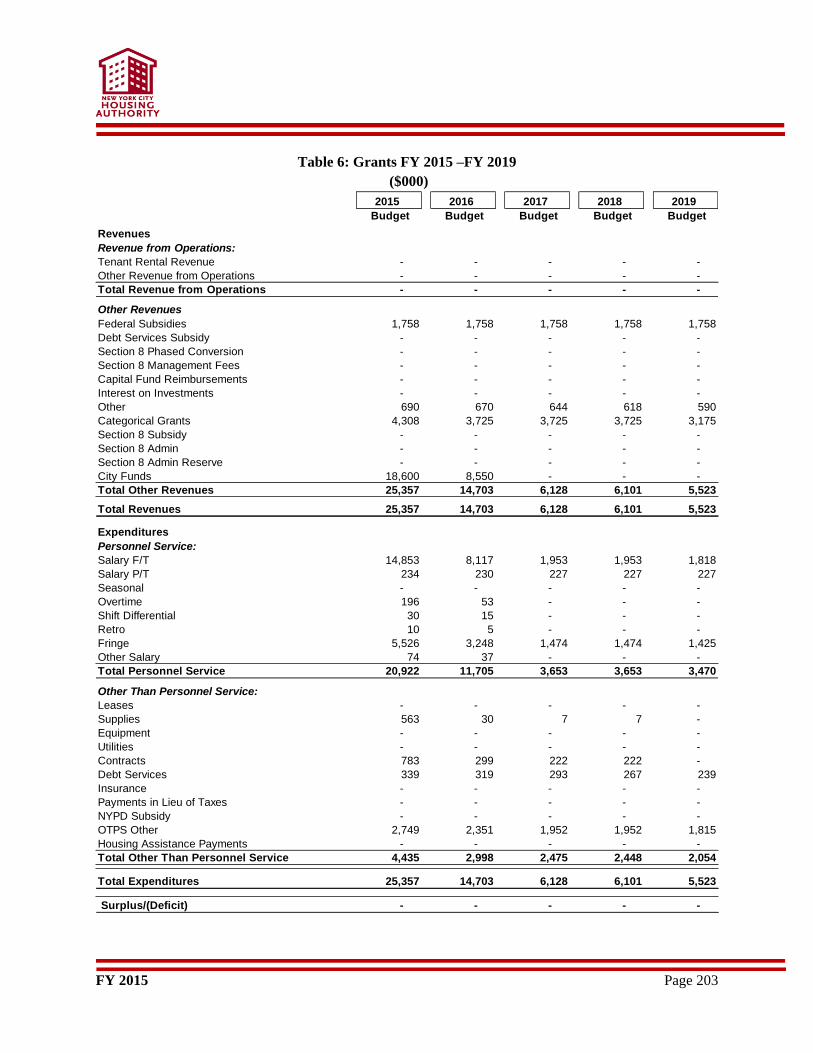
FY 2015 Page 203
Table 6: Grants FY 2015 –FY 2019
($000)
2015 2016 2017 2018 2019
Budget Budget Budget Budget Budget
Revenues
Revenue from Operations:
Tenant Rental Revenue - - - - -
Other Revenue from Operations - - - - -
Total Revenue from Operations - - - - -
Other Revenues
Federal Subsidies 1,758 1,758 1,758 1,758 1,758
Debt Services Subsidy - - - - -
Section 8 Phased Conversion - - - - -
Section 8 Management Fees - - - - -
Capital Fund Reimbursements - - - - -
Interest on Investments - - - - -
Other 690 670 644 618 590
Categorical Grants 4,308 3,725 3,725 3,725 3,175
Section 8 Subsidy - - - - -
Section 8 Admin - - - - -
Section 8 Admin Reserve - - - - -
City Funds 18,600 8,550 - - -
Total Other Revenues 25,357 14,703 6,128 6,101 5,523
Total Revenues 25,357 14,703 6,128 6,101 5,523
Expenditures
Personnel Service:
Salary F/T 14,853 8,117 1,953 1,953 1,818
Salary P/T 234 230 227 227 227
Seasonal - - - - -
Overtime 196 53 - - -
Shift Differential 30 15 - - -
Retro 10 5 - - -
Fringe 5,526 3,248 1,474 1,474 1,425
Other Salary 74 37 - - -
Total Personnel Service 20,922 11,705 3,653 3,653 3,470
Other Than Personnel Service:
Leases - - - - -
Supplies 563 30 7 7 -
Equipment - - - - -
Utilities - - - - -
Contracts 783 299 222 222 -
Debt Services 339 319 293 267 239
Insurance - - - - -
Payments in Lieu of Taxes - - - - -
NYPD Subsidy - - - - -
OTPS Other 2,749 2,351 1,952 1,952 1,815
Housing Assistance Payments - - - - -
Total Other Than Personnel Service 4,435 2,998 2,475 2,448 2,054
Total Expenditures 25,357 14,703 6,128 6,101 5,523
Surplus/(Deficit) - - - - -
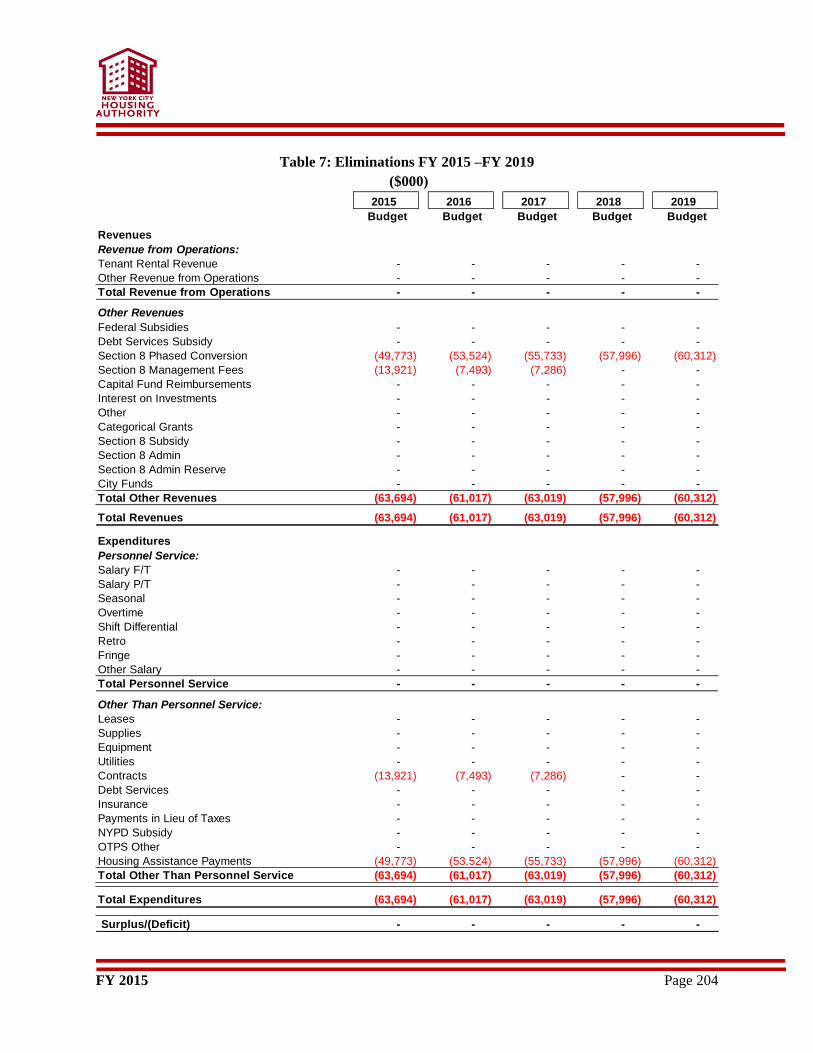
FY 2015 Page 204
Table 7: Eliminations FY 2015 –FY 2019
($000)
2015 2016 2017 2018 2019
Budget Budget Budget Budget Budget
Revenues
Revenue from Operations:
Tenant Rental Revenue - - - - -
Other Revenue from Operations - - - - -
Total Revenue from Operations - - - - -
Other Revenues
Federal Subsidies - - - - -
Debt Services Subsidy - - - - -
Section 8 Phased Conversion (49,773) (53,524) (55,733) (57,996) (60,312)
Section 8 Management Fees (13,921) (7,493) (7,286) - -
Capital Fund Reimbursements - - - - -
Interest on Investments - - - - -
Other - - - - -
Categorical Grants - - - - -
Section 8 Subsidy - - - - -
Section 8 Admin - - - - -
Section 8 Admin Reserve - - - - -
City Funds - - - - -
Total Other Revenues (63,694) (61,017) (63,019) (57,996) (60,312)
Total Revenues (63,694) (61,017) (63,019) (57,996) (60,312)
Expenditures
Personnel Service:
Salary F/T - - - - -
Salary P/T - - - - -
Seasonal - - - - -
Overtime - - - - -
Shift Differential - - - - -
Retro - - - - -
Fringe - - - - -
Other Salary - - - - -
Total Personnel Service - - - - -
Other Than Personnel Service:
Leases - - - - -
Supplies - - - - -
Equipment - - - - -
Utilities - - - - -
Contracts (13,921) (7,493) (7,286) - -
Debt Services - - - - -
Insurance - - - - -
Payments in Lieu of Taxes - - - - -
NYPD Subsidy - - - - -
OTPS Other - - - - -
Housing Assistance Payments (49,773) (53,524) (55,733) (57,996) (60,312)
Total Other Than Personnel Service (63,694) (61,017) (63,019) (57,996) (60,312)
Total Expenditures (63,694) (61,017) (63,019) (57,996) (60,312)
Surplus/(Deficit) - - - - -
FY 2015 Page 205
NYCHA Fact
Sheet
FY 2015 Page 206
FY 2015 Page 207
FY 2015 Page 208

FY 2015 Page 209
Glossary of
Terms
FY 2015 Page 210
Accounts - The lowest level within the Authority’s chart of accounts that identifies the expenditure type.
Examples of accounts are: supplies, equipment, contracts, travel, and utilities.
Accrual - An accounting expense recognized in the books before it is paid for. A Negative Un-Liquidated
Actual represents an accrual set up for the goods or services received in the prior Fiscal Year but not yet
paid.
Action Plan - A plan of actions to be funded by the Authority over a period for five years to make the
necessary physical and management improvements identified in the PHA’s Comprehensive Plan. The
Five-Year Action Plan is based upon HUD’s and the PHA’s best estimates of the funding reasonably
expected to become available. It is updated annually to reflect a rolling five-year base.
Annual Contributions Contract (ACC) - A contract under the United States Housing Act of 1937, as
amended, between HUD and the Authority containing the terms and conditions under which the
Department assists the Authority in providing decent, safe, and sanitary housing for low-income families.
Annual Statement - A work statement submitted to HUD covering the first year of the Five-Year action
Plan. It sets forth the major work categories and costs by development for the Federal Fiscal Year (FFY)
grant, and provides a summary of costs by development account as well as implementation schedules for
obligation and expenditure of the funds.
Amortized - Payment of a debt or credit by regular intervals over a specific period of time.
Board - NYCHA’s governing body that are responsible for voting on contracts, resolutions, policies,
motions, rules, and regulations at regularly scheduled meetings of the Members of the Authority.
Budget - Proposed plan of revenue and expenditures over a given period of time.
Budget Calendar - The schedule of key dates or milestones that the Authority follows in the preparation
and adoption of the budget.
Budget Development - The process for preparing, modifying, and adopting a budget.
Budget Hierarchy - Communicates the roles and responsibilities of the Budget Responsibility Groups
(BRGs), as well as the workflow for review and approval.
Budget Instructions - Technical instructions and policy guidelines to follow when completing the
financial planning exercises.
Budget Management - The monitoring and modification of an existing or planned budget.
Budget Planning - Involves the estimating of the agency’s available resources, matching the available
resources to the agency’s operating and capital needs, and determining if appropriate financial measures
are being taken.
FY 2015 Page 211
Budget Responsibility Group (BRG) - A department or office that is managed by a director or an
equivalent managerial title that is responsible for budgeting for the activities of a responsibility center or a
group of responsibility centers.
Capital Fund Program (CFP) - Formerly the Comprehensive Grant Program (CGP) is a HUD program
which provides fungible modernization and reconstruction funds on a formula basis to the Housing
Authorities with 250 or more Public Housing units.
Capital Projects - The purchase of land, renovations or construction of a building or facility.
Chair - Appointed by the Mayor, the Chair presides at all Board meetings, directs the business and affairs
of the Authority, and is responsible for the execution of all policies, resolutions, motions, rules, and
regulations adopted by the Board.
Chart of Accounts - The complete listing of all accounts listed in the General Ledger that Accounting
tracks. Each account is accompanied by a reference number which indicates the account type. Such
categories include revenues and expenses.
Commitment (Encumbrance) - The total value of encumbered funds associated with requisitions, or
standard or planned purchase orders submitted but not yet approved.
Comprehensive Plan - A plan prepared by the Authority and approved by HUD setting forth all of the
physical and management needs of the Authority and its housing developments. It indicates the relative
urgency of needs, with cost estimates and includes the PHA’s Action Plan. The Plan may be revised, as
necessary, but must be revised at least every sixth year. It is the focal point of the PHA’s modernization
strategy.
Consolidation - A group of developments that is managed by one office.
Conveyed Unit - A unit where modernization work has been approved before the transfer of the title to
the homeowner. The Authority may complete the work even if the title to the unit is subsequently
conveyed before the work is completed. The costs of work are eligible under the Capital Fund Program
regulations.
Department - A basic organizational unit that is functionally unique in its delivery of services.
Department of Budget and Financial Planning (DBFP) - The Department of Budget and Financial
Planning serves and an Authority-wide resource on functional and technical matter relating to budget
planning, development, and management. DBFP advises BRGs in the monitoring of expenses, the
progress of service delivery, and the implementation of budget adjustments. This department also
provides ongoing training on budget-related Oracle applications and workshops seminars on advanced
analytical techniques. There are three major divisions: Operating Budget Division, Capital Budget
Division, and Budget Control and Coordination Division.
FY 2015 Page 212
Executive Vice President (EVP) - The EVPs functions are to act for the General Manager, when
required, and to work with the General Manager in the day-to-day operation and administration of the
business of the Authority.
Development - A low-income housing project that consists of a building or group of buildings housing
NYCHA residents. Each has a unique name and responsibility center number.
Director - Supervises the activities and daily operations of the department. The director implements
NYCHA policy and procedures in his/her department.
Division - Organizational component of a department.
Expenses - Represents the total cost of operations during a period, regardless of the timing of related
expenses.
Federal Fiscal Year (FFY) - October 1 - September 30.
Field Office (FO) - The local HUD office with which the Authority transacts its low-income housing
business. In addition, the Field Office reviews the Comprehensive Plan, including the Five-Year Action
Plan, in accordance with statutory/regulatory criteria and notifies the Authority in writing of approval or
disapproval.
Fiscal Year - For NYCHA, it is the same as the calendar year. This 12-month period begins with January
1, and ends on December 31.
Fund - A fiscal and accounting tool with a self-balancing set of accounts to record revenue and
expenditures.
Fund Balance - The excess of an entity’s assets over its liabilities.
Funding Source - Identifies a specific pool of funds or revenue source.
Funds Available - Represents the difference between the Budget and the Total Actual and Total
Encumbrances.
Fundability - A concept which permits the Authority to substitute any work item from the latest
approved Five-Year Action Plan to any previously approved CFP Annual Statement, and to move work
items among approved modernization budgets without prior HUD approval.
Gap Sheet - A tool used by DBFP during the financial plan exercise. It lists all deficits that exist upon
entering the budget process and includes any projected changes to those deficits.
General Ledger (G/L) - The General Ledger is the official accounting record for all Authority
transactions.
FY 2015 Page 213
General Manager (GM) - The General Manager is the principal executive administrator of the
Authority. The GM assists the Chair in the supervision of the business affairs of the Authority and is
responsible for the proper execution of all orders, rules and regulations made or approved by the
Authority.
Grant - A contribution by a government or other organization to support a particular function. Grants
may be classified as categorical or block, depending upon the amount of discretion allowed by the
grantee.
Grants - The Oracle module used by Capital that allows the Authority to maintain a five-year capital
plan. It is intended as the means for collection and storage of capital project financial information.
Hard Costs - The physical improvement costs in the development accounts 1450-1475, which include
Account 1450 Site Improvements, Account 1460 Dwelling Structures, Account 1465 Dwelling
Equipment, Account 1470 Non-Dwelling Structure, and Account 1475 Non-Dwelling Equipment. These
are costs directly associated with the construction of a development, including labor, materials, overhead,
profit, and contingencies.
Headcount (HC) - The Authority’s full-time headcount plan accounts for all authorized employees that
can be sustained by the amount of projected revenue, as approved by the Board, and broken down by
department for current year as well as for out years.
Housing Choice Voucher (HCVP/ Section 8) - A rent subsidy allowing families to pay a reasonable
share of income for rent with the government making up the difference up to a specified limit.
Housing Development Corporation (HDC) - A corporate government agency constituted as a public
benefit corporation and established in 1971. HDC encourages the investment of private capital through
low-interest mortgage loans and provides safe and sanitary dwellings for families and persons whose
housing needs cannot be met by unassisted private enterprise. Through the issuance of bonds and notes,
HDC provides construction and/or permanent financing for multifamily residential housing.
Housing and Urban Development (HUD) - United States Department of Housing and Urban
Development provides funds to promote homeownership, support community development, and increase
access to affordable housing free from discrimination.
Human Resource Administration (HRA) - An agency with New York City government that delivers
social services that enable individuals and families to achieve their highest level of self-reliance.
Liquidated Actual (Actuals) - The total funds paid to vendors for received and invoiced goods or
services.
Modernization Program - The Authority’s program for carrying out capital modernization and
reconstruction projects in order to keep the developments in a state of good repair, as set forth in the
Annual Statement.
FY 2015 Page 214
New Needs - All costs associated with a purchase of goods or services, or additional costs of existing
goods or services.
New York City Housing Authority (NYCHA) - Provides decent and affordable housing in a safe and
secure living environment for low and moderate income residents throughout the five boroughs.
New York City Office of Management and Budget (OMB) - In assisting the Mayor with developing
and implementing the City's budget, OMB monitors and forecasts the revenues and expenditures of the
City. It analyzes the economy, evaluates agencies' management improvement initiatives, including
information technology purchases, and conducts value engineering reviews of capital projects and, in
cooperation with the Office of the Comptroller for the City of New York, issues bonds and notes in the
public credit markets.
Obligation (Encumbrance) - The total unexpended balance of encumbered funds associated with
approved requisitions and standard or planned purchase orders.
Operating Budget - Authorized expenditures for on-going day-to-day services; e.g. maintenance,
materials, supplies, etc.
Other Than Personnel Services (OTPS) - The OTPS budget pays for the non-personnel costs of running
the Authority, including payments for utilities such as water, electricity, heating fuels, and cooking gas
for NYCHA residents, payments to outside contractors who provide painting, elevator maintenance, fire
safety, plumbing and heating services, all insurance costs, consulting services, the purchase of machines
and equipment used by development staff to maintain the buildings and grounds, and payments to private
landlords participating in the Section 8/Housing Choice Voucher Program.
Parent Fixed Asset Accounts (Equipment Accounts) - A reporting tool which allows a BRG to view
the Budget, Encumbrances, and Actual for equipment accounts. For example:
GF01 3240000 164000300 Budget
GF01 3240000 990400300 Encumbrances & Actual
PGF1 P324000 PFA4000300 PFA
Parent/Child Relationship - Describes the relationship between the Management Office and the
developments within a consolidation. For example:
GF01 B100300 4301200000 Consolidation
GF01 B000300 4301200000 Child
FY 2015 Page 215
Program/Phase - Unique identifier used primarily to specify Grant Year for Funding Source.
Program to Eliminate the Gap (PEG) - A financial package of ideas to close a given financial deficit.
They can be classified as expense reductions, revenue increases, legislative/regulatory changes, or
management initiatives to improve productivity.
Project - A budget line item identifier used for external reporting and billing purposes.
Personnel Action Request (PAR) - A form submitted by BRGs to change salaries and add staff. This
form is required for filling a vacancy.
Personnel Services (PS) - The PS budget includes salaries and fringe benefits for all of NYCHA’s staff.
Approximately 14,000 NYCHA employees are responsible for all service delivery within NYCHA’s
developments, including building maintenance, rent collection, administration of the Section 8 program,
annual inspections and certifications, grounds maintenance, community center staffing, social services,
and administrative services.
Project Organization Expenditure Type Task Awards (POETA) - Tool used by the Oracle Grants
Module. It includes detailed award information which incorporates information from the Chart of
Accounts.
Public Sector Budgeting (PSB) - The Oracle application that is used to create and maintain the operating
budget and financial plan processes.
Responsibility Center (RC) - A Development or Department where expenses will be budgeted and
recorded.
Revenues - Funds received from various sources and treated as income that the Authority uses to finance
expenditures.
Revision - The PSB tool used between financial planning exercises that allows the modification of the
current year budget only.
Risk Management - An organized attempt to protect a government’s assets against accidental loss in the
most economical method.
Service Package - A worksheet tool used to identify portions of a budget. It is used to modify the
approved baseline budget during the semi-annual financial planning exercises.
Soft Costs - The non-physical improvement or non-brick and mortar costs which exclude any costs in the
development accounts 1450-1475. These are the non-construction costs incurred in the development of a
project (e.g. third party expenses such as design and legal fees, taxes, insurance, construction, loan debt
service, developer overhead and profit.)
FY 2015 Page 216
Tenant Participation Activities (TPA) - According to HUD, $25 per unit per year is allocated to fund
resident participation activities such as training and outreach programs.
Un-Liquidated Actual (Actuals) - Represents the total funds expensed for received and invoiced goods
or services.
Vice Chair (of NYCHA) - One member of the Authority’s Board is designated to be the Vice-Chair, and
in the event of a vacancy in the office of the Chair or when the Chair is absent or unable to act, the Vice-
Chair assumes his/her duties and powers.
Worksheet - The PSB tool used in semi-annual financial planning exercises that will allow adjustments
to the current and/or out years of the plan.