Embed Size (px)
Citation preview

Adopted BudgetFiscal Year 2015-2016
June 10, 2015

Table of Contents FY 2015-2016 Adopted Budget
i
Introduction
General Manager’s Message ........................................................................................ 1 Resolution Adopting the General Fund Operating and Capital Budget ....................... 3
Overview of Operating Budget
FY 15-16 Adopted Operating and Capital Budget Summary ...................................... 9 FY 2014 to FY 2024 10-Year Forecast ...................................................................... 10 FY14-15 Mid-Year Budget vs. FY15-16 Adopted Revenue Budget Chart ............... 13 Percent Share of Operating Expenses by Use of Funds Chart ................................... 14 FY14-15 Mid-Year vs. FY15-16 Adopted Operating Expense Budget Chart ........... 15 FY14-15 Mid-Year vs. FY15-16 Adopted Budget by Department Chart .................. 16 General Fund Operating Expense Budget by Department ......................................... 17 Alameda Contra Costa Transit District Organization Chart ...................................... 18 Assumptions for Revenues and Expenses Budget FY 2015-16 ................................. 19 Adopted Budget FY 2015-16 - Position Count by Department ................................. 27 Adopted Budget FY 2015-16 - Position Summary - Count by Type ......................... 28 FY 15-16 Authorized New Positions ......................................................................... 29 FY 15-16 Operating Revenue Projections .................................................................. 30 Adopted Operating Expense Budget by Account FY 2015-16 .................................. 31
Strategic Plan
The Strategic Planning Process and Annual Budget Development Process .............. 39 Fares & System Maps
Passenger and Service Portrait ................................................................................... 49

Table of Contents FY 2015-2016 Adopted Budget
ii
Service Area Maps ..................................................................................................... 52
Overview of Departments 1. Board of Directors ........................................................................................ 59
Board of Directors Org Chart ................................................................ 61 Board of Directors Department at a Glance .......................................... 62 Board of Directors Department Budget Worksheet ............................. 63
2. District Secretary ......................................................................................... 65 District Secretary Org Chart .................................................................. 67 District Secretary Department at a Glance ............................................ 68 District Secretary Department Budget Worksheet ............................... 69 District Secretary Department Positions ............................................... 70
3. General Manager ......................................................................................... 71
GM Org Chart ....................................................................................... 73 Department at a Glance ......................................................................... 74 Department Budget Worksheet ............................................................ 75 Department Positions ............................................................................ 76
4. General Counsel ........................................................................................... 77
General Counsel Org Chart ................................................................... 79 Department at a Glance ......................................................................... 80 Department Budget Worksheet ............................................................ 81 Department Positions ............................................................................ 82
5. Operations .................................................................................................... 83
Operations Org Chart ............................................................................ 85 Department at a Glance ......................................................................... 86

Table of Contents FY 2015-2016 Adopted Budget
iii
Department Budget Worksheet ............................................................ 87 Department Positions ............................................................................ 91
Transportation ........................................................................................ 95 Department at a Glance ...................................................................... 97
Department Budget Worksheet ......................................................... 98 Department Positions ....................................................................... 100
Maintenance .......................................................................................... 101
Department at a Glance .................................................................... 103 Total Maintenance Budget Worksheet ............................................ 104 Fleet Maintenance Budget Worksheet ............................................ 108 Facilities Maintenance Budget Worksheet ...................................... 111 Department Positions ....................................................................... 113
6. Planning, Engineering & Construction.................................................... 115 Org Chart ............................................................................................. 117 Department at a Glance ....................................................................... 118 Department Budget Worksheet .......................................................... 119 Department Positions .......................................................................... 121
7. Information Services .................................................................................. 123 Org Chart ............................................................................................. 125 Department at a Glance ....................................................................... 126 Department Budget Worksheet .......................................................... 127 Department Positions .......................................................................... 129
8. Administrative Services ............................................................................. 131 Org Chart ............................................................................................. 133 Department at a Glance ....................................................................... 134 Department Budget Worksheet .......................................................... 135 Department Positions .......................................................................... 137

Table of Contents FY 2015-2016 Adopted Budget
iv
9. Finance and District Overhead ................................................................. 139 Org Chart ............................................................................................. 141 Department at a Glance ....................................................................... 142 Department Budget Worksheet .......................................................... 143 Department Positions .......................................................................... 146 District Overhead Department at a Glance .......................................... 148 District Overhead Department Budget Worksheet ............................. 149
10. Retirement ................................................................................................ 153 Org Chart ............................................................................................. 155 Department at a Glance ....................................................................... 156 Department Budget Worksheet .......................................................... 157 Department Positions .......................................................................... 158
Adopted Capital Budget FY 2015-16 FY 2015-16 Adopted Capital Budget ....................................................................... 163 FY 2015-16 Adopted Budget Funding Priorities ..................................................... 164 Funding Sources ....................................................................................................... 166 Existing Capital Program Overview ......................................................................... 169

INTRODUCTION


1

2

3

4
FY 2015-16AdoptedBudget
6/10/2015
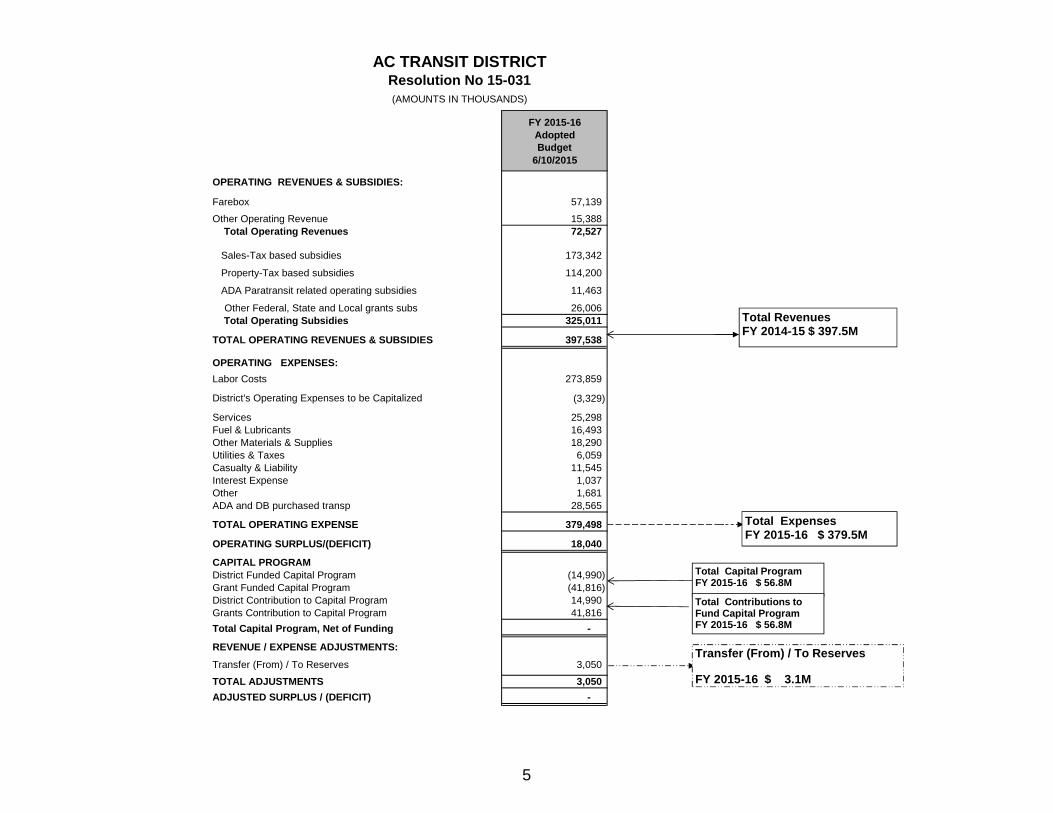
OPERATING REVENUES & SUBSIDIES:
Farebox 57,139
Other Operating Revenue 15,388 Total Operating Revenues 72,527
Sales-Tax based subsidies 173,342
Property-Tax based subsidies 114,200
ADA Paratransit related operating subsidies 11,463
Other Federal, State and Local grants subs 26,006 Total Operating Subsidies 325,011
TOTAL OPERATING REVENUES & SUBSIDIES 397,538
OPERATING EXPENSES: Labor Costs 273,859
District's Operating Expenses to be Capitalized (3,329)
Services 25,298 Fuel & Lubricants 16,493 Other Materials & Supplies 18,290 Utilities & Taxes 6,059 Casualty & Liability 11,545 Interest Expense 1,037 Other 1,681 ADA and DB purchased transp 28,565
TOTAL OPERATING EXPENSE 379,498
OPERATING SURPLUS/(DEFICIT) 18,040
CAPITAL PROGRAMDistrict Funded Capital Program (14,990) Grant Funded Capital Program (41,816) District Contribution to Capital Program 14,990 Grants Contribution to Capital Program 41,816 Total Capital Program, Net of Funding -
REVENUE / EXPENSE ADJUSTMENTS:
Transfer (From) / To Reserves 3,050
TOTAL ADJUSTMENTS 3,050 ADJUSTED SURPLUS / (DEFICIT) -
AC TRANSIT DISTRICTResolution No 15-031(AMOUNTS IN THOUSANDS)
Total Revenues FY 2014-15 $ 397.5M
Total Expenses FY 2015-16 $ 379.5M
Transfer (From) / To Reserves
FY 2015-16 $ 3.1M
Total Capital ProgramFY 2015-16 $ 56.8M
Total Contributions to Fund Capital ProgramFY 2015-16 $ 56.8M
5


OVERVIEW


FY 2013-14 FY 2014-15 FY 2015-2016
Actuals Forecast Adopted Budget
Compared to 2014-15 Forecast % Change
CONSOLIDATEDRevenuesOperating 68,992 67,549 72,527 4,978 7.4%Subsidies 277,849 281,337 325,011 43,674 15.5%Total Revenues $346,841 $348,886 $397,538 $48,652 13.9%
Operating ExpensesSalaries and Wages 105,636 116,025 130,867 14,842 12.8%Pension 39,859 39,780 45,502 5,722 14.4%Fringe Benefits - Other 88,908 86,583 97,489 10,906 12.6%Total Labor Costs $234,403 $242,388 $273,859 $31,471 13.0%
Districts' Operating Expenses Capitalized (2,879) (2,300) (3,329) (1,029) 44.7%Services 21,711 22,582 25,298 2,716 12.0%Fuel and Lubricants 17,359 15,276 16,493 1,217 8.0%Other Materials and Supplies 14,993 14,124 18,290 4,166 29.5%Utilities and Taxes 6,245 5,731 6,059 328 5.7%Casualty and Liability 7,115 9,937 11,545 1,608 16.2%Interest Expenses 1,240 1,096 1,037 (59) -5.4%ADA and DB Purchased Transportation 26,080 27,982 28,565 583 2.1%Other Expenses 1,002 2,613 1,681 (932) -35.7%Total Operating Expenses $327,269 $339,429 $379,498 $40,069 11.8%
Capital Improvement $2,489 $6,700 $14,990 8,290 123.7%
Total Expenses $329,758 $346,129 $394,488 48,359 14.0%
Net Increase (Decrease) to Cash Reserves $17,083 $2,757 $3,050 293 10.6%
Cash Reserve As A Percentage of Operating Expenses 14.6% 14.9% 14.1%
Variance
AC TRANSITFY 2015-16 BUDGET DEVELOPMENT PROCESS
ADOPTED OPERATING BUDGET
9

FY 2013-14 FY 2014-15 FY 2015-2016 FY 2016-2017 FY 2017-2018 FY 2018-2019 FY 2019-2020 FY 2020-2021 FY 2021-2022 FY 2022-2023 FY 2023-2024
Actuals Forecast Adopted BudgetCONSOLIDATEDRevenuesOperating 68,992 67,549 72,527 77,503 78,155 80,723 80,866 83,679 83,973 86,898 87,204 Subsidies 277,849 281,337 325,011 340,724 347,562 359,771 356,547 362,641 377,987 381,463 391,997 Total Revenues $346,841 $348,886 $397,538 $418,227 $425,717 $440,494 $437,413 $446,320 $461,960 $468,361 $479,201
Operating ExpensesSalaries and Wages 105,636 116,025 130,867 $134,793 $138,837 $143,002 $147,292 $151,711 $156,262 $160,950 $165,778Fringe Benefits 128,767 126,363 142,992 149,358 152,641 156,266 156,417 160,477 164,338 168,481 172,623 Total Labor Costs $234,403 $242,388 $273,859 $284,151 $291,478 $299,268 $303,709 $312,188 $320,600 $329,431 $338,402
District's Operating Expenses Capitalized (2,879) (2,300) (3,329) ($3,362) ($2,800) ($2,300) ($2,323) ($2,346) ($2,370) ($2,393) ($2,417)Services 21,711 22,582 25,298 25,930 26,579 27,243 27,924 28,622 29,338 30,071 30,823 Fuel and Lubricants 17,359 15,276 16,493 $16,147 $15,887 $15,797 $15,882 $16,147 $16,597 $17,238 $18,075Other Materials and Supplies 14,993 14,124 18,290 $17,947 $17,646 $17,487 $17,424 $17,160 $16,789 $16,459 $16,120Utilities and Taxes 6,245 5,731 6,059 $6,210 $6,366 $6,525 $6,688 $6,855 $7,027 $7,202 $7,382Casualty and Liability 7,115 9,937 11,545 $11,834 $12,129 $12,433 $12,744 $13,062 $13,389 $13,723 $14,066Interest Expenses 1,240 1,096 1,037 978 919 860 801 742 683 624 565 ADA and DB Purchased Transportation 26,080 27,982 28,565 29,279 30,011 30,761 31,530 32,319 33,127 33,955 34,804 Other Expenses 1,002 2,613 1,681 $1,723 $1,766 $1,810 $1,856 $1,902 $1,949 $1,998 $2,048Operating Cost for D3 Opening - - - 1,545 1,591 1,639 1,688 1,739 1,791 1,845 1,900 New Service - - - 7,000 7,175 7,354 7,538 7,727 7,920 8,118 8,321 BRT Operating Costs $0 $0 $0 $0 $2,625 $3,500 $3,500 $3,535 $3,588 $3,642 $3,696Total Operating Expenses $327,269 $339,429 $379,498 $399,382 $411,372 $422,378 $428,962 $439,651 $450,427 $461,912 $473,786
Capital Improvement $2,489 $6,700 $14,990 $18,000 $10,000 $10,000 $10,000 $10,000 $10,000 $10,000 $10,000
Total Expenses $329,758 $346,129 $394,488 $417,382 $421,372 $432,378 $438,962 $449,651 $460,427 $471,912 $483,786
Net Increase (Decrease) to Cash Reserves $17,083 $2,757 $3,050 $845 $4,345 $8,116 ($1,549) ($3,331) $1,532 ($3,551) ($4,584)
Cash Reserve as a Percentage of Operating Expenses 14.6% 14.9% 14.1% 13.7% 14.3% 15.9% 15.3% 14.1% 14.1% 13.0% 11.7%
-----Forecast-----
AC TRANSITFY 2015-16 BUDGET DEVELOPMENT PROCESS
ADOPTED OPERATING BUDGET
10

Operating Budget


FY14/15 Mid Year Revenue Budget vs. FY15/16 Adopted Revenue Budget
16%
4%
18%
11%7%
3%
1%
23%
8%
3%4%
1% 1%
FY14/15 Mid Year BudgetFarebox
Other Operating Revenue
Transportation Develop. Act (TDA)
AB 1107
Measure B
State Transit Assistance (STA)
Measure J
Property Taxes
Measure AA/BB/VV
Total ADA related Subsidies
RM2 subsidies, DB local assistance
Measure BB
Other Subsidies
14%
4%
16%
10%
7%2%1%
21%
7%
3% 4%
8%3%
FY15/16 Adopted BudgetFarebox
Other Operating Revenue
Transportation Develop. Act (TDA)
AB 1107
Measure B
State Transit Assistance (STA)
Measure J
Property Taxes
Measure AA/BB/VV
Total ADA related Subsidies
RM2 subsidies, DB local assistance
Measure BB
Other Subsidies
13

0%
5%
10%
15%
20%
25%
30%
35%
40%
45%
50%
55%
60%
65%
70%
75%
80%
85%
90%
95%
100%
FY14/15 Mid Year Budget FY15/16 Adopted Budget
AC TransitPercent Share of Operating Expenses by Use of Funds
Other Expenses
ADA and DB purchased transp
Interest Expenses
Casualty and Liability
Utilities and Taxes
Other Materials and Supplies
Fuel and Lubricants
Services
Labor Costs, net of capitalized labor
14

FY14/15 Mid Year Operating Expense Budget vs. FY15/16 Adopted Operating Expense Budget
70.0%
6.9%
5.3%
4.4%
1.8%
2.9%
0.3%
7.6%
0.8%
FY14/15 Mid Year Budget
Labor Costs, net of capitalizedlaborServices
Fuel and Lubricants
Other Materials and Supplies
Utilities and Taxes
Casualty and Liability
Interest Expenses
ADA and DB purchased transp
Other Expenses
71.3%
6.7%
4.3%
4.8%
1.6%
3.0%
0.3%
7.5%
0.4%
FY15/16 Adopted Budget
Labor Costs, net of capitalizedlaborServices
Fuel and Lubricants
Other Materials and Supplies
Utilities and Taxes
Casualty and Liability
Interest Expenses
ADA and DB purchased transp
Other Expenses
15

Department FY14/15 Mid Year Budget % of Total Department
FY15/16 Adopted Budget
% of Total
Board Of Directors 248,132 0.1% Board Of Directors 405,500 0.1%District Overhead 19,524,953 5.7% District Overhead 10,146,983 2.7%District Secretary 463,281 0.1% District Secretary 569,676 0.2%Finance 13,127,128 3.8% Finance 15,661,088 4.1%General Manager 1,705,189 0.5% General Manager 2,764,732 0.7%Information Services 13,642,726 4.0% Information Services 16,009,416 4.2%Office of the General Counsel 13,354,170 3.9% Office of the General Counsel 15,536,332 4.1%Operations 237,715,003 69.2% Operations 270,880,357 71.4%Administrative Services 8,151,981 2.4% Administrative Services 9,354,316 2.5%Planning, Engineering & Construction 35,488,858 10.3% Planning, Engineering & Construction 38,169,356 10.1%Retirement Dptm. 85,864 0.0% Retirement Dptm. 0 0.0%
343,507,255$ 100.0% 379,497,757$ 100.0%
FY14/15 Mid Year Budget vs. FY15/16 Adopted Budget by Department
0.1%
5.7%
0.1% 3.8%
0.5%
4.0%
3.9%
69.2%
2.4% 10.3%
FY14/15 Mid Year BudgetBoard Of Directors
District Overhead
District Secretary
Finance
General Manager
Information Services
Office of the General Counsel
Operations
Administrative Services
Planning, Engineering &ConstructionRetirement Dptm.
0.1% 2.7% 0.2%
4.1%0.7% 4.2%
4.1%
71.4%
2.5% 10.1%
FY15/16 Adopted BudgetBoard Of Directors
District Overhead
District Secretary
Finance
General Manager
Information Services
Office of the General Counsel
Operations
Administrative Services
Planning, Engineering &ConstructionRetirement Dptm.
16

Department FYE 13/14 Actuals FY14/15 Mid‐Year Budget FY15/16 Adopted Budget
Administrative Services 7,253,664 8,151,981 9,354,316
Board Of Directors 232,482 248,132 405,500
District Overhead 22,725,257 19,524,923 10,146,983
District Secretary 353,965 463,281 569,676
Finance 12,408,498 13,127,128 15,661,088
General Manager 1,660,026 1,705,189 2,764,732
Information Services 12,434,362 13,642,726 16,009,416
Office of the General Counsel 12,268,733 13,354,170 15,536,332
Operations 227,042,772 237,715,003 270,880,357
Planning, Engineering & Construction 30,811,738 35,488,858 38,169,356
Retirement 76,520 85,864 0
Grand Total 327,268,134 343,507,255 379,497,757
AC TransitGeneral Fund Operating Expense Budget
(All operating expenses in nominal costs, in $)
17
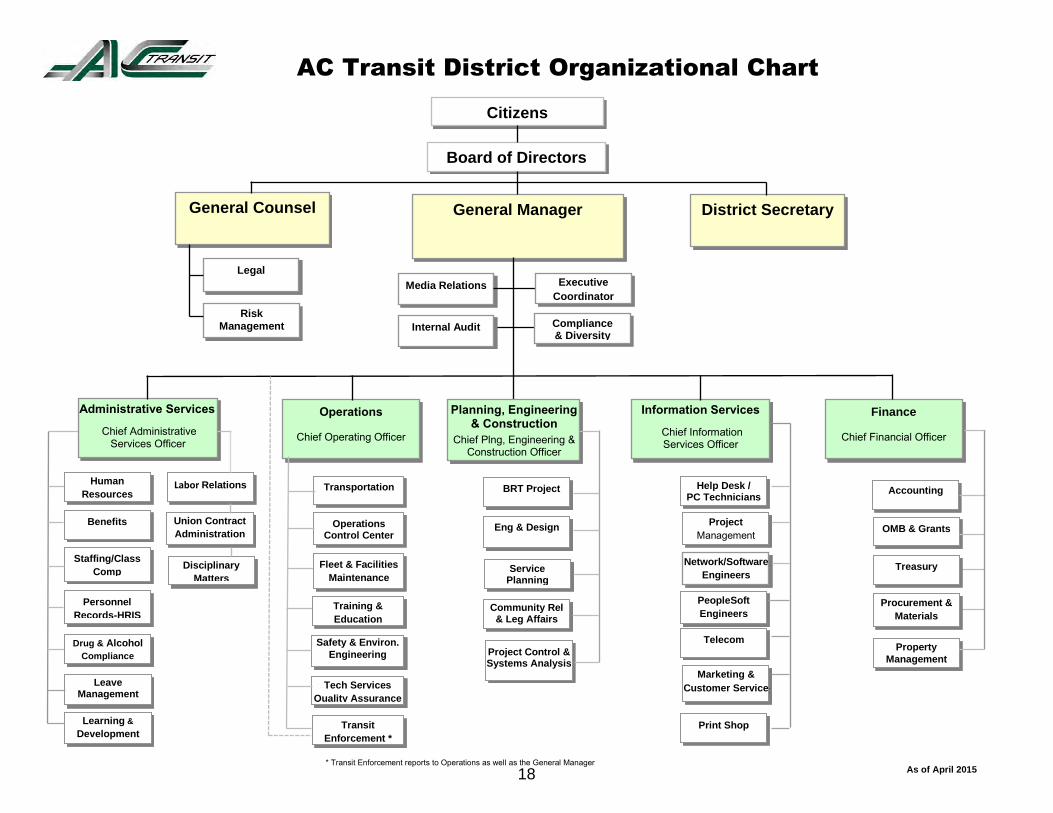
AC Transit District Organizational Chart
As of April 2015
Citizens
Board of Directors
General Manager
District Secretary
General Counsel
Finance
Chief Financial Officer
OMB & Grants Benefits
Learning &
Development
Staffing/Class
Comp
Personnel
Records-HRIS
Leave
Management
Help Desk / PC Technicians
Legal
Accounting
Information Services
Chief Information Services Officer
Administrative Services
Chief Administrative Services Officer
Community Rel & Leg Affairs
Risk
Management
Treasury
Network/Software
Engineers
PeopleSoft
Engineers
Eng & Design
BRT Project
Service Planning
Operations
Chief Operating Officer
Internal Audit
Telecom
Marketing &
Customer Service
Drug & Alcohol
Compliance
Procurement &
Materials
Property
Management
Media Relations
Project Management
Planning, Engineering & Construction
Chief Plng, Engineering & Construction Officer
Project Control & Systems Analysis
Print Shop
Compliance & Diversity
Executive
Coordinator
Labor Relations Human
Resources
Union Contract
Administration
Disciplinary
Matters
Safety & Environ.
Engineering
Training &
Education
Tech Services
Quality Assurance
Transportation
Operations Control Center
Fleet & Facilities
Maintenance
Transit
Enforcement *
* Transit Enforcement reports to Operations as well as the General Manager
18
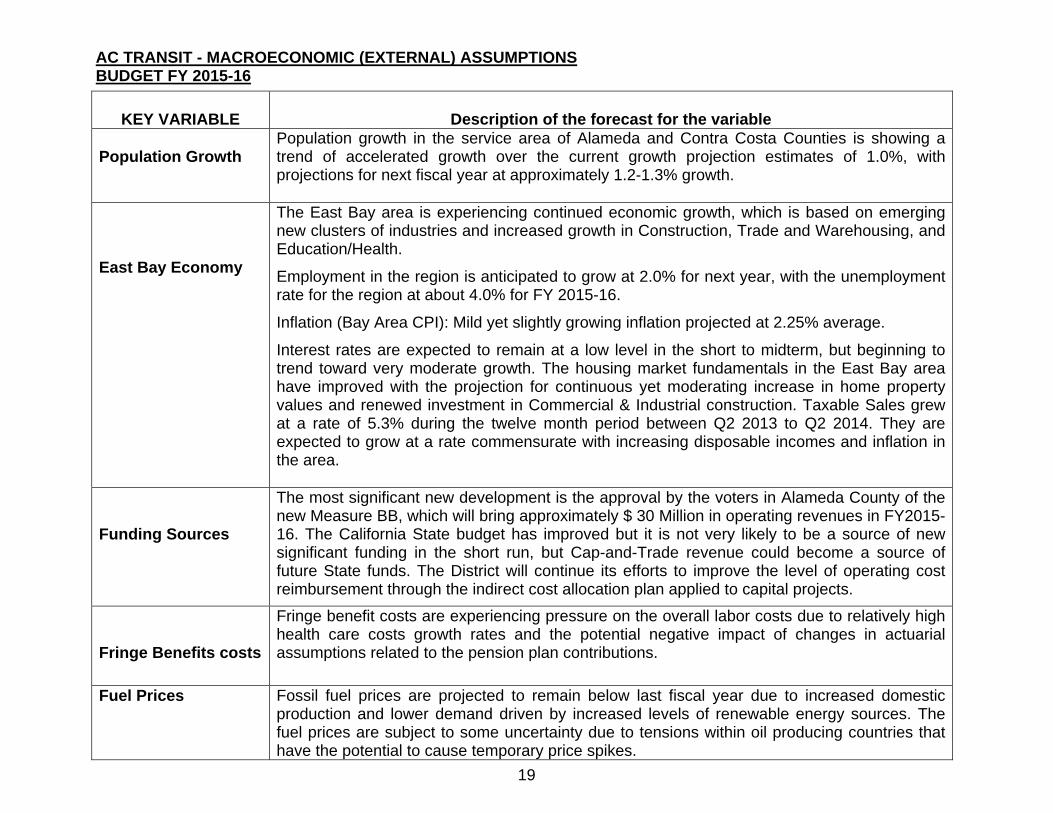
AC TRANSIT - MACROECONOMIC (EXTERNAL) ASSUMPTIONS BUDGET FY 2015-16
KEY VARIABLE
Description of the forecast for the variable
Population Growth
Population growth in the service area of Alameda and Contra Costa Counties is showing a trend of accelerated growth over the current growth projection estimates of 1.0%, with projections for next fiscal year at approximately 1.2-1.3% growth.
East Bay Economy
The East Bay area is experiencing continued economic growth, which is based on emerging new clusters of industries and increased growth in Construction, Trade and Warehousing, and Education/Health.
Employment in the region is anticipated to grow at 2.0% for next year, with the unemployment rate for the region at about 4.0% for FY 2015-16.
Inflation (Bay Area CPI): Mild yet slightly growing inflation projected at 2.25% average.
Interest rates are expected to remain at a low level in the short to midterm, but beginning to trend toward very moderate growth. The housing market fundamentals in the East Bay area have improved with the projection for continuous yet moderating increase in home property values and renewed investment in Commercial & Industrial construction. Taxable Sales grew at a rate of 5.3% during the twelve month period between Q2 2013 to Q2 2014. They are expected to grow at a rate commensurate with increasing disposable incomes and inflation in the area.
Funding Sources
The most significant new development is the approval by the voters in Alameda County of the new Measure BB, which will bring approximately $ 30 Million in operating revenues in FY2015-16. The California State budget has improved but it is not very likely to be a source of new significant funding in the short run, but Cap-and-Trade revenue could become a source of future State funds. The District will continue its efforts to improve the level of operating cost reimbursement through the indirect cost allocation plan applied to capital projects.
Fringe Benefits costs
Fringe benefit costs are experiencing pressure on the overall labor costs due to relatively high health care costs growth rates and the potential negative impact of changes in actuarial assumptions related to the pension plan contributions.
Fuel Prices Fossil fuel prices are projected to remain below last fiscal year due to increased domestic production and lower demand driven by increased levels of renewable energy sources. The fuel prices are subject to some uncertainty due to tensions within oil producing countries that have the potential to cause temporary price spikes.
19

ASSUMPTIONS Adopted Budget FY 2015-16
REVENUES
Description of the operating internal assumptions Operating: Total Farebox
The farebox recovery ratio is expected to continue at about 20% as the favorable trend in ridership growth persists. The adopted budget includes an increase in farebox collections to reflect this trend, with ridership growth expected to be around 4%. The increased ridership is also due to the new Measure BB funded Service Enhancement Plan.
Operating: Contract Services
This line item reflects the continuation of revenue associated with fare media agreements for service contracted with UC Berkeley, City of Oakland, and others. It includes the projected effect of a new bus bridge service contract for BART and the impact of a pilot project to provide late night bus service for BART that expires in December 2015.
Operating: BART Transfer
Reflects the revenues based on the existing BART Feeder Service Agreement.
Operating: Interest Income
Staff has projected the continuation of low level of yield returns on the Repos and Agencies that have been the traditional short-term investment vehicles allowed by existing policy. A revised investment strategy will include increased investments in 3-18 month Certificate of Deposits that will produce higher returns.
Operating: Advertising
Projection considers additional revenue coming from the variable component of the contract due to slightly better sales of ad space due to the improving regional economy and a favorable negotiation of the renewal of the advertising contract.
Operating: Other Revenue
Parking citation tickets have stabilized based upon the new focus of the transit police units. Other revenues included in the projection will remain around average historical levels.
Operating: Rental income
Reflects the expected lease income to be received from tenants at the 66th Avenue facility.
20
ASSUMPTIONS Adopted Budget FY 2015-16
Sales Tax-based Subsidies: TDA
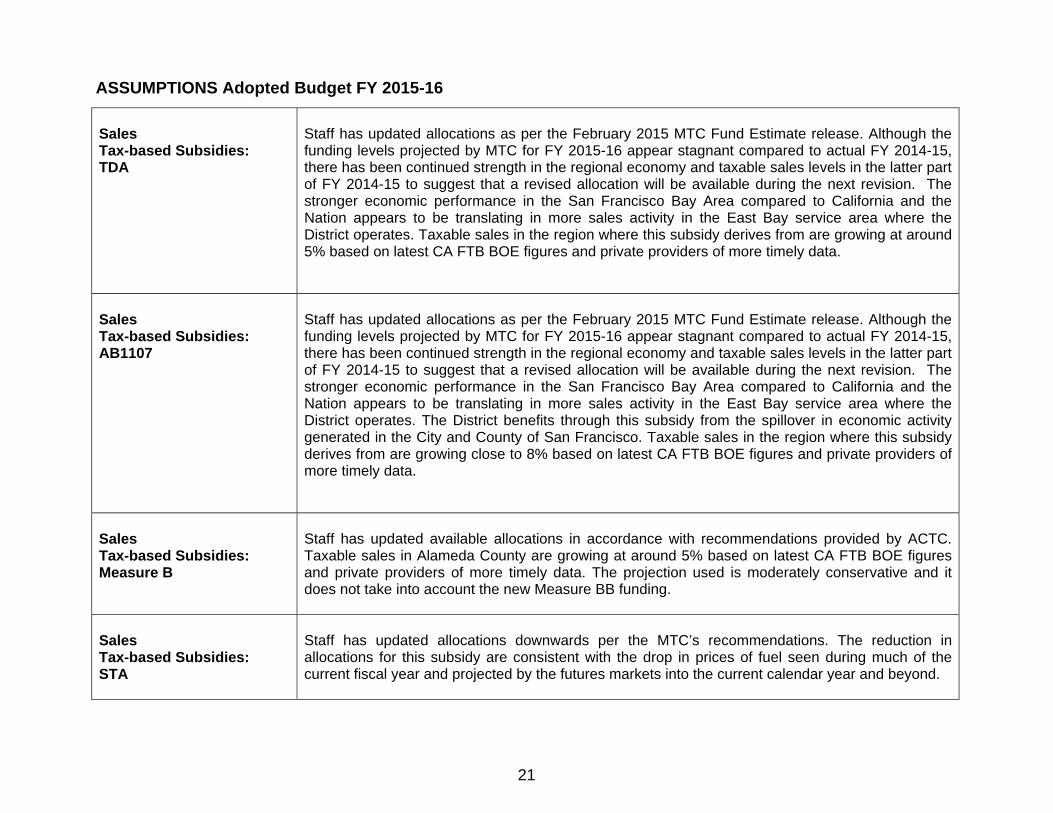
Staff has updated allocations as per the February 2015 MTC Fund Estimate release. Although the funding levels projected by MTC for FY 2015-16 appear stagnant compared to actual FY 2014-15, there has been continued strength in the regional economy and taxable sales levels in the latter part of FY 2014-15 to suggest that a revised allocation will be available during the next revision. The stronger economic performance in the San Francisco Bay Area compared to California and the Nation appears to be translating in more sales activity in the East Bay service area where the District operates. Taxable sales in the region where this subsidy derives from are growing at around 5% based on latest CA FTB BOE figures and private providers of more timely data.
Sales Tax-based Subsidies: AB1107
Staff has updated allocations as per the February 2015 MTC Fund Estimate release. Although the funding levels projected by MTC for FY 2015-16 appear stagnant compared to actual FY 2014-15, there has been continued strength in the regional economy and taxable sales levels in the latter part of FY 2014-15 to suggest that a revised allocation will be available during the next revision. The stronger economic performance in the San Francisco Bay Area compared to California and the Nation appears to be translating in more sales activity in the East Bay service area where the District operates. The District benefits through this subsidy from the spillover in economic activity generated in the City and County of San Francisco. Taxable sales in the region where this subsidy derives from are growing close to 8% based on latest CA FTB BOE figures and private providers of more timely data.
Sales Tax-based Subsidies: Measure B
Staff has updated available allocations in accordance with recommendations provided by ACTC. Taxable sales in Alameda County are growing at around 5% based on latest CA FTB BOE figures and private providers of more timely data. The projection used is moderately conservative and it does not take into account the new Measure BB funding.
Sales Tax-based Subsidies: STA
Staff has updated allocations downwards per the MTC’s recommendations. The reduction in allocations for this subsidy are consistent with the drop in prices of fuel seen during much of the current fiscal year and projected by the futures markets into the current calendar year and beyond.
21

ASSUMPTIONS Adopted Budget FY 2015-16
Sales Tax-based Subsidies: Measure J
The projection is based on the estimated allocation to be submitted by the Contra Costa County Authority. It equals the proceeds from the Measure J allocation process.
Property Tax-based Subsidies (inc. Measure VV)
The adopted budget assumes certain growth factors based on input from data received from the Alameda County Assessors’ Office for this subsidy. The base Property tax subsidy is experiencing increases in collections due to moderate activity in the real estate markets and price increases for residential and nonresidential properties in the current year. The base Property Tax subsidy is projected to continue this trend into FY 2015-16. Staff is confident that the estimated tax receipts are moderately optimistic. Measure VV subsidies are fixed at a combined $96.00 per parcel. The total budgeted figure reflects existing parcels in the area and is expected to show growth caused by the resurgence in permits and building completions during FY 2014-15 and FY 2015-16.
ADA related Subsidies
Staff has updated the allocations as per the February 2015 MTC Fund Estimate release. The ADA Paratransit Lease revenue is assumed to grow moderately during the period.
Other Grants and Subsidies
Fixed allocations or commitments and other subsidies from reimbursable labor expenses and the indirect cost allocation plan. The most significant pieces are:
RM2 subsidy for several routes, including Dumbarton Bridge, which sums up to $ 13.6 Million.
Oakland Unified School District allocation of $ 2.0 Million to be used to partially fund the full cost of school service in the OUSD area provided by the District.
A new cycle of Lifeline state funding, which would yield receipts of $ 7.0 million for the District.
Finally, the effect of reimbursable labor costs related to staff’s time used in developing capital assets projects, approximately $ 3.3 Million.
Measure BB
Initial proceeds equivalent to a quarter of the annual receipts associated with the recently approved measure in Alameda County, starting in April 2015
22

ASSUMPTIONS Adopted Budget FY 2015-16
OPERATING EXPENSES
Description of the operating internal assumptions
Labor Costs
The adopted budget full time equivalent positions for FY 2015-16 are 2,040 positions. The staffing level includes staffing necessary to implement part of the new Measure BB funded service enhancement initiatives, as well as to increase the effectiveness and efficiency of service support for existing service levels and critical supervisory staff required to improve the efficacy and efficiency of service. Total Platform hours for FY 2015-16 is projected to be 2.0 million hours, which represents 1.87 million Revenue Vehicle Service Hours. Total Salaries and Wages figures for FY 2015-16 include changes from the last contract agreements with the District’s unions, projected changes in compensation for unrepresented staff, the full year impact of 26 positions added at Mid-Year in FY2014-15, and the cost of 73 new positions authorized to be added as part of the FY2015-16 budget development cycle. The majority of these positions are related to support service enhancement or existing services, and also are in some cases related to grant-funded capital projects. Total fringe benefits expenses have been higher than total net salaries and wages since FY 2009-10. The increased cost is due to increased annual amortization costs for the unfunded actuarial accrual liability of the District’s Pension Contribution expenses, plus the high cost of medical, dental and vision care premiums. The FY 2015-16 adopted budget for health care premiums reflects the recent rate increases for medical premiums in the range of 4-5% quoted by vendors and still subject to agreement by Staff and the Board. The Pension Contribution figure reflects a potential increase in the amount paid by the District which is an initial estimate on the matter associated with the longevity of the retiree population, which will be addressed in an actuarial review. The cost of workers’ compensation insurance is projected to show an increase. Staff is taking action on this matter and has designed a plan currently in implementation to foster and enforce a Safety and Wellness culture, which should reduce the number of accidents and improve operational efficiencies at the same time. Paid Time Off expenses as a percent of Gross Salaries and Wages is projected to remain stable at approximately 18% of net reported salaries and wages. Other fringe benefits will vary according to changes in salaries and wages, by virtue of the contract language, by experience, or inflation.
23

ASSUMPTIONS Adopted Budget FY 2015-16
Services
Services expenses budget has been increased by $ 1.6 million from FY 2014-15 Mid-Year Budget levels at around $ 25.3 Million. Major services expenses are the following:
Security Services, $ 10.2 Million, increased to account for additional service enhancement levels due to the implementation of Measure BB funded service, as well as wage increases in the Alameda and Contra Costa Sheriff’s contracts, and the contract with Cypress.
Certain professional, technical and maintenance contractual services, particularly in the Information Services and Technology, Maintenance, Human Resources, Finance and Planning and Development departments, for a total of $ 8.6 Million
Outside Training Services, $ 0.7 Million, a level associated with the strategic priority designed to improve the productivity and technical capabilities of the entire workforce on a number of systems, tools and techniques.
Clipper expenses associated with the costs of the Clipper program, not funded by MTC of about $ 1.0 Million
Outside Attorney Fees, to account for final resolution on claims and ongoing litigation.
Claims Administration of about $ 1.3 Million for the management of claims Districtwide
Outside Repair Services contracted mostly by the Maintenance department at around $ 0.9 Million
Management Service fees, mostly Tax administration services performed by the counties on the District’s behalf, and other fees, $ 0.5 Million
Other Services includes the cost of the contractor providing services to the regional RTC card, $ 0.4 million which is reimbursed by 75% to AC Transit for being the Lead Agency of the program
Fuel and Lubricants
The FY2015-16 adopted budget shows a reduction in diesel fuel of approximately $ 2.9 million, caused by lower diesel fuel prices. Staff projected annual price trends per futures for the derivative most commonly used to price diesel fuel, plus a factor to account for potential geopolitical disruptions. The number of miles operated has been set at 24.4 million Total Operated Miles, which includes mileage associated with the Measure BB funded enhanced service, and the new bus bridge BART contract. The increase in service mileage causes an increase in the fuel budget of approximately $ 0.9 million. Current yields in terms of miles per gallon are better than previously budgeted levels and are expected to remain stable in the short run, if not continue improving due to the systematic introduction of the new fleet and better maintenance performance.
24

ASSUMPTIONS Adopted Budget FY 2015-16
Other Materials and Supplies
Fleet reliability and operating performance are assumed to remain constant with a mix of newer buses that are counteracted by the impact of increased maintenance needs of the remaining fleet as it continues age. The Operations area is continuing a Maintenance Improvement Plan rolled out in late 2012. This initiative is generating labor productivity improvements, better control of bus part costs per mile, reduced levels in stock of parts and supplies and improved fleet mechanical reliability. Meanwhile, the FY2015-16 budget shows increases associated with the new Measure BB funded service enhancement program, which are cost out based upon the cost of bus parts due to the utilization of a retired 10 bus Van Hool fleet, since no new revenue vehicles will be delivered until the 3rd or 4th quarter of the new fiscal year.
Utilities and Taxes
Telecommunication expenses are projected to increase due to the expansion of service and operational requirements. Electricity and Gas expenses are showing a slight increase due to rate changes. Water usage is expected to remain at around the same levels but rates are showing a large increase caused by the severe drought in the state. On the other hand, Use taxes expenses project the need for a lower budget mostly due to the decline in prices of diesel fuel and the commensurate lower bills on purchases of this very important supply category.
Casualty and Liability costs
The adopted budget shows an increase in the cost of insurance premiums. Ongoing demographic changes in the service area that continue adding a more senior population to the ridership base, the addition of substantial service levels, the future launch of BRT service, the retirement of the District’s more experienced and senior drivers, and other factors, represent a potentially increasingly source of exposure that could impact the District’s finances.
Interest Expense
This item includes the costs related to the following financing transactions: The cost of the Certificates Of Participation (COPS) debt service related to the general office
building, The financing costs associated with Certificates Of Participation (COPS) related to the
acquisition of the new Financial and Human Resources (FHR) system, and, Interest expenses associated with the Certificates Of Participation (COPS) issued to finance the
acquisition of the 66th Avenue facility.
25

ASSUMPTIONS Adopted Budget FY 2015-16
ADA Consortium and Dumbarton Bridge Purchased Transportation Costs
The ADA Consortium line item represents the District share (69%) of the total costs of operating the joint venture with BART to provide specialized Paratransit services. The sudden increase in demand and associated higher billable hours seen since May 2014 and the respective costs charged to the Consortia have prompted Staff to expect the cost of this program to increase by $ 1.8 million compared to the FY1415 Mid-Year budget. The Dumbarton Bridge Purchased Transportation costs are basically funded in their entirety by revenues specifically allocated by MTC; so even though the respective costs are projected to increase by approximately $ 0.7 million, it represents a cost neutral proposition from the General Fund perspective as RM2 revenues allocated by MTC would also increase by the same magnitude.
Other Expenses
These expenses include items that were also projected based on specific programs and activities by each of the operating departments. The most significant allocations were related to: Leases and rental of certain equipment used in transportation activities and office management Travel and meeting costs that are under the direct supervision of the General Manager Dues, subscriptions, employee incentives and other miscellaneous operating costs
District Funded Capital Program
Staff will discuss the Capital Budget program assumptions in a separate section.
26

FY2015/16 Authorized Positions by Department6/10/2015
DepartmentAuthorized FTEs
FY13/14Authorized FTEs
FY14/15 @ Mid‐YearAuthorized FTEs
FY15/16
General Manager 8 9 9
District Secretary 2 3 3
Office of the General Counsel 14 13 13
Operations 514 527 544
Planning, Engineering & Construction 55 52 57
Information Services 35 55 60
Administrative Services 30 32 35
Finance 73 77 80
Retirement 3 3 3
Non‐Operators Total 734 771 804
Operators 1136 1196 1236
Total Positions 1870 1967 2040
* FTE ‐ Full Time Equivalent
27

Operators 1136 1196 1236
Maintenance 377 397 406
Clerical 55 51 52
Salaried 302 323 346
Total 1870 1967 2040
* FTE - Full Time Equivalent
AC Transit FY2015/16 Budget Development ProcessPosition Summary
Authorized FTEs FY13/14
Authorized FTEs FY14/15 @ Mid‐Year
Authorized FTEs FY15/16
28

FY15/16 Authorized New Positions
Department Position TitlePosition
Bargaining Unit
Authorized FTEs Tied to New
Service
Authorized FTEs Tied to Existing
ServiceTotal Authorized
FTEs
General Manager Administrative Coordinator AFSCME 1 1 Total General Manager ‐ 1 1
Operations Administrative Assistant AFSCME 1 1 Asst Director of Transportation Unrep'd 1 1 Asst Transp Superintendent AFSCME 1 1 Facilities Maintenance Suprvsr AFSCME 1 1 Janitor ATU 3 3 Journey Level Mechanic ATU 3 3 Manager of Safety & Envorinmental Engineering Unrep'd 1 1 Operators ATU 40 40 Senior Electronic Technician IBEW 1 1 Service Employee ATU 2 2 Training Instructor AFSCME 2 2 Transportation Supervisor AFSCME 1 1
Total Operations 55 2 57 Planning, Engineering & Construction Project Controls Administrator AFSCME 1 1
Senior Project Manager Unrep'd 1 1 Senior Schedule Analyst ATU 1 1 Service Planning Manager AFSCME 1 1
Total Planning, Engineering & Construction 1 3 4 Information Services Enterprise Software Engineer AFSCME 1 1
Mktg. & Community Rel. Mgr. AFSCME 1 1 Network/Server Administrator AFSCME 1 1 Public Info Systems Coord AFSCME 1 1 Sr Database Administrator AFSCME 1 1
Total Information Services ‐ 5 5 Administrative Services Human Resources Analyst AFSCME 1 1
Senior Administrative Asst. AFSCME 1 1 Senior Human Resources Analyst AFSCME 1 1
Total Administrative Services ‐ 3 3 Finance Senior Capital Planning Specialist AFSCME 2 2
Senior Contract Specialist AFSCME 1 1 Total Finance ‐ 3 3
FY15/16 Total Authorized Positions 56 17 73
FY15/16 Total Authorized Positions by Bargaining Unit ATU 49 ‐ 49 AFSCME 4 16 20 IBEW 1 ‐ 1 Unrep'd 2 1 3 Total Positions 56 17 73
29

FY 2013-14 FY 2014-15 FY 2015-2016
ActualsMid-Year Budget
Adopted Budget
Compared to 2014-15 Mid-
Year % ChangeREVENUES AND SUBSIDIESOperating1.a Farebox 53,296 55,650 57,139 1,489 2.7%1.b Contract Services 5,608 5,600 8,026 2,426 43.3%2 BART Transfers 6,322 3,600 3,402 (198) -5.5%3 Interest Income 64 70 160 90 128.6%4 Advertising 1,822 1,977 2,000 23 1.2%5 Other Revenue 1,440 1,640 1,450 (190) -11.6%6 Rental Income 440 350 350 - 0.0%7 Total Operating Revenues $68,992 $68,887 $72,527 $3,640 5.3%
Subsidies8 Transportation Develop. Act (TDA) 57,959 61,028 64,000 2,972 4.9%9 AB 1107 36,912 38,143 41,000 2,857 7.5%10 Measure B 24,327 26,000 27,040 1,040 4.0%11 Measure BB - 4,853 30,196 25,343 522.2%12 State Transit Assistance (STA) 12,309 8,585 6,439 (2,146) -25.0%13 Measure J 3,940 4,475 4,667 192 4.3%14 Property Taxes 76,564 80,842 84,700 3,858 4.8%15 Measure AA/BB/VV 29,244 29,241 29,500 259 0.9%16 ADA Paratransit Fund (inc. fares) 6,271 5,812 6,000 188 3.2%17 Federal Assistance (ADA) 7,899 4,107 3,987 (120) -2.9%18 ADA Paratransit Vehicles 1,433 1,476 1,476 - 0.0%19 Supplemental Service 2,225 2,225 2,000 (225) -10.1%20 Labor Reimbursement - 1,950 3,329 1,379 70.7%21 RM2 subsidies, DB local assistance 14,741 12,600 13,677 1,077 8.5%22 Lifeline STA JARC, AB664 4,025 7,000 7,000 23 Total Subsidies $277,849 $281,337 $325,011 $43,675 15.5%24 Total Revenues and Subsidies $346,841 $350,224 $397,538 $47,314 13.5%
($ Thous 000's)
Variance
AC TRANSITFY 2015-16 ADOPTED OPERATING REVENUE BUDGET
30

FY15/16 Budget DevelopmentTotal District6/10/2015
Category Account Account Name FYE 13/14 ActualsFY14/15 Mid‐Year
BudgetFY15/16 Adopted
BudgetS&W 50101 Operators Regular Time 49,472,402 52,508,209 59,653,517
50105 Operators Premium Time 8,128,476 8,426,264 9,088,52450106 Operators Holiday Time 928,825 1,021,372 1,034,46050110 Maintenance Regular Time 17,627,919 19,987,428 21,850,16450115 Maintenance Overtime 805,397 1,290,349 1,339,11650116 Maintenance Holiday Time 145,485 184,656 156,26250120 Clerical Regular Time 3,684,546 2,953,953 3,200,79550125 Clerical Overtime 320,165 235,179 387,35050126 Clerical Holiday Time 42,752 37,428 38,91950130 Salaried Regular Time 24,064,510 28,020,752 32,460,53350135 Salaried Overtime 381,365 351,183 372,01050136 Salaried Holiday Time 34,289 96,000 47,12050140 NBO Training Regular Time 882,000 1,166,40050145 NBO Training Overtime 30,000 72,90050150 Indirect Cost Account 0
S&W Total 105,636,131 116,024,773 130,868,069Fringe Benefits 128,766,849 126,363,253 142,989,366Services 50301 Management Service Fees 570,518 447,000 532,000
50305 Advertising Production Costs 0 20,00050307 CLIPPER Expenses 908,000 1,000,000 1,000,00050308 Professional and Technical Services 4,442,596 5,889,808 6,214,53150309 Richmond Parkway 26,550 50,000 50,00050315 Claims Administration 1,207,139 1,255,543 1,330,54350317 Outside Attorney 850,752 865,000 865,00050320 Physicals 133,512 41,041 18,00050330 Non‐Lawyer Legal 56,031 75,000 65,00050335 Audit Fees 250,000 250,000 250,00050340 Temporary Help 955,374 57,850 133,00050342 Outside Repair Services 556,967 772,647 812,09750345 Contract Maintenance Services 1,912,265 2,325,857 2,599,45750350 Custodial Services 7,936 1,500 1,50050355 Security Services 9,399,405 9,582,665 10,194,713
31
FY15/16 Budget DevelopmentTotal District6/10/2015
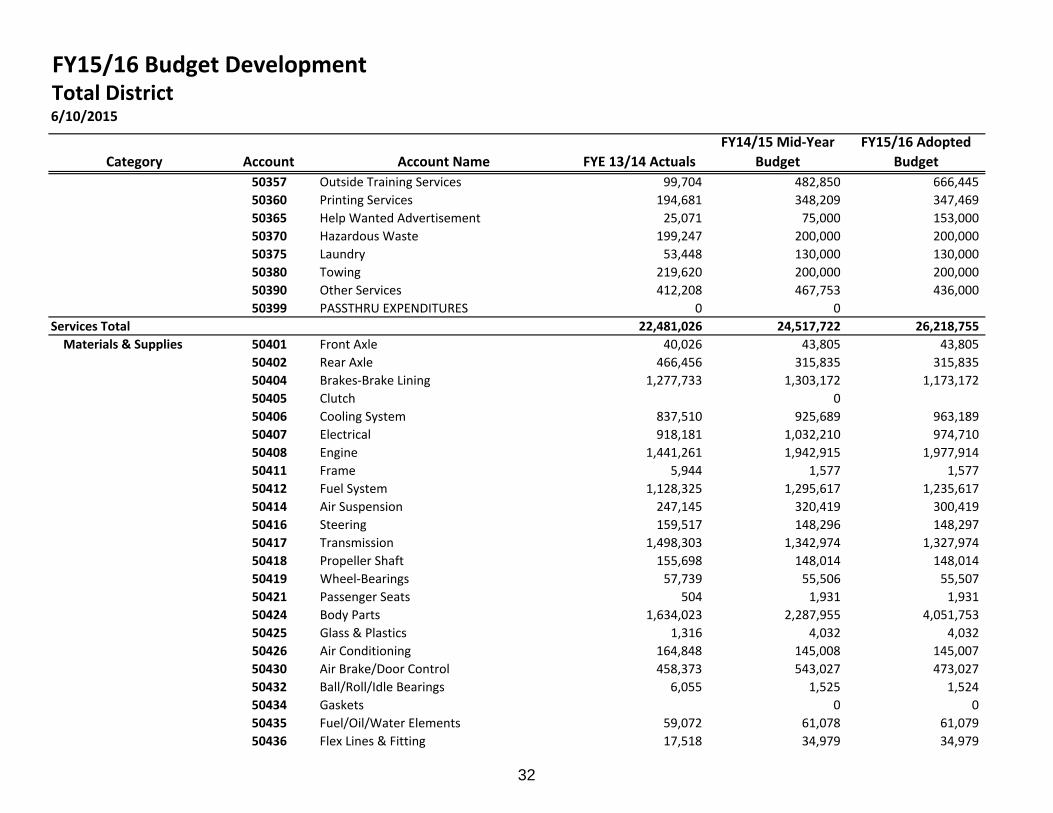
Category Account Account Name FYE 13/14 ActualsFY14/15 Mid‐Year
BudgetFY15/16 Adopted
Budget50357 Outside Training Services 99,704 482,850 666,44550360 Printing Services 194,681 348,209 347,46950365 Help Wanted Advertisement 25,071 75,000 153,00050370 Hazardous Waste 199,247 200,000 200,00050375 Laundry 53,448 130,000 130,00050380 Towing 219,620 200,000 200,00050390 Other Services 412,208 467,753 436,00050399 PASSTHRU EXPENDITURES 0 0
Services Total 22,481,026 24,517,722 26,218,755Materials & Supplies 50401 Front Axle 40,026 43,805 43,805
50402 Rear Axle 466,456 315,835 315,83550404 Brakes‐Brake Lining 1,277,733 1,303,172 1,173,17250405 Clutch 050406 Cooling System 837,510 925,689 963,18950407 Electrical 918,181 1,032,210 974,71050408 Engine 1,441,261 1,942,915 1,977,91450411 Frame 5,944 1,577 1,57750412 Fuel System 1,128,325 1,295,617 1,235,61750414 Air Suspension 247,145 320,419 300,41950416 Steering 159,517 148,296 148,29750417 Transmission 1,498,303 1,342,974 1,327,97450418 Propeller Shaft 155,698 148,014 148,01450419 Wheel‐Bearings 57,739 55,506 55,50750421 Passenger Seats 504 1,931 1,93150424 Body Parts 1,634,023 2,287,955 4,051,75350425 Glass & Plastics 1,316 4,032 4,03250426 Air Conditioning 164,848 145,008 145,00750430 Air Brake/Door Control 458,373 543,027 473,02750432 Ball/Roll/Idle Bearings 6,055 1,525 1,52450434 Gaskets 0 050435 Fuel/Oil/Water Elements 59,072 61,078 61,07950436 Flex Lines & Fitting 17,518 34,979 34,979
32
FY15/16 Budget DevelopmentTotal District6/10/2015
Category Account Account Name FYE 13/14 ActualsFY14/15 Mid‐Year
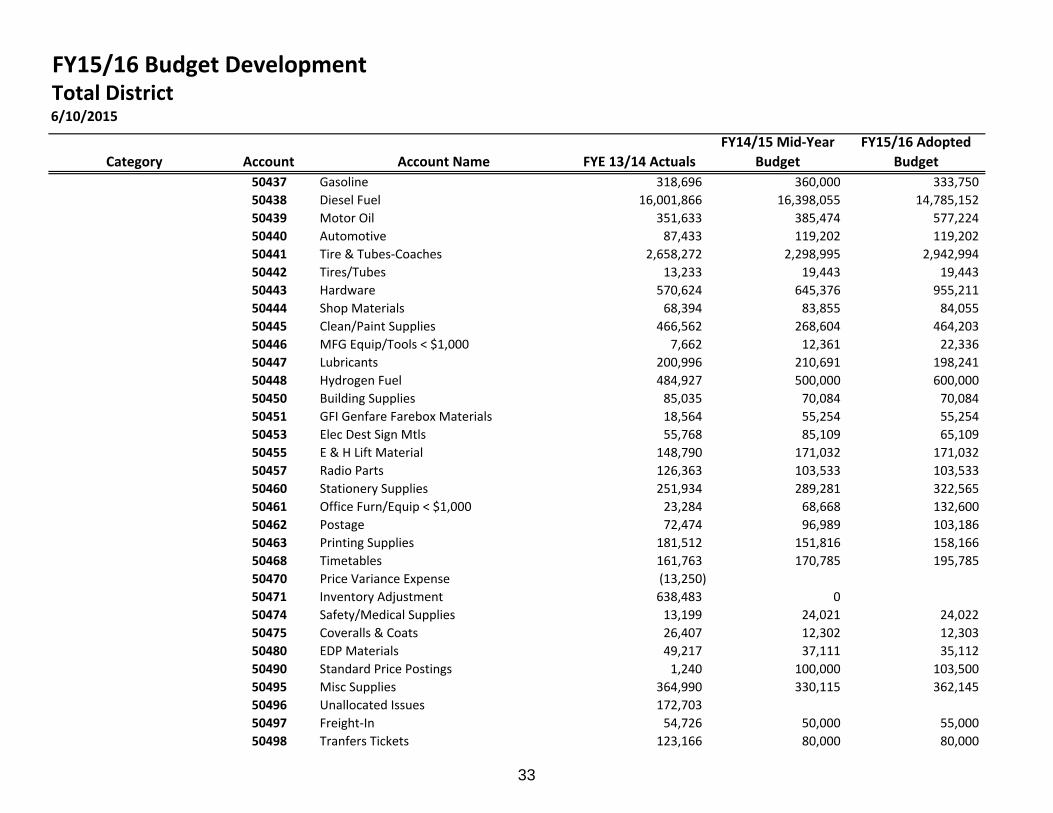
BudgetFY15/16 Adopted
Budget50437 Gasoline 318,696 360,000 333,75050438 Diesel Fuel 16,001,866 16,398,055 14,785,15250439 Motor Oil 351,633 385,474 577,22450440 Automotive 87,433 119,202 119,20250441 Tire & Tubes‐Coaches 2,658,272 2,298,995 2,942,99450442 Tires/Tubes 13,233 19,443 19,44350443 Hardware 570,624 645,376 955,21150444 Shop Materials 68,394 83,855 84,05550445 Clean/Paint Supplies 466,562 268,604 464,20350446 MFG Equip/Tools < $1,000 7,662 12,361 22,33650447 Lubricants 200,996 210,691 198,24150448 Hydrogen Fuel 484,927 500,000 600,00050450 Building Supplies 85,035 70,084 70,08450451 GFI Genfare Farebox Materials 18,564 55,254 55,25450453 Elec Dest Sign Mtls 55,768 85,109 65,10950455 E & H Lift Material 148,790 171,032 171,03250457 Radio Parts 126,363 103,533 103,53350460 Stationery Supplies 251,934 289,281 322,56550461 Office Furn/Equip < $1,000 23,284 68,668 132,60050462 Postage 72,474 96,989 103,18650463 Printing Supplies 181,512 151,816 158,16650468 Timetables 161,763 170,785 195,78550470 Price Variance Expense (13,250)50471 Inventory Adjustment 638,483 050474 Safety/Medical Supplies 13,199 24,021 24,02250475 Coveralls & Coats 26,407 12,302 12,30350480 EDP Materials 49,217 37,111 35,11250490 Standard Price Postings 1,240 100,000 103,50050495 Misc Supplies 364,990 330,115 362,14550496 Unallocated Issues 172,70350497 Freight‐In 54,726 50,000 55,00050498 Tranfers Tickets 123,166 80,000 80,000
33

FY15/16 Budget DevelopmentTotal District6/10/2015
Category Account Account Name FYE 13/14 ActualsFY14/15 Mid‐Year
BudgetFY15/16 Adopted
BudgetMaterials & Supplies 50499 Warranties (65,360) 0 0
Materials & Supplies Total 34,296,855 35,153,718 36,590,568Utilities 50501 Telephone 613,319 713,000 897,000
50505 Electric & Gas 1,501,108 1,250,000 1,275,00050510 Water 278,704 175,000 220,00050515 Biogas 321,611 300,000 300,00050520 Scavenger Services 183,819 176,507 176,507
Utilities Total 2,898,562 2,614,507 2,868,507Liability 50601 Insurance Premium 3,959,830 4,800,000 6,200,000
50605 Loss Recoveries (535,148) 0 (530,000)50641 Casualty/Liability Costs 3,211,229 4,500,000 5,000,00050642 Property Damage 479,288 700,000 875,000
Liability Total 7,115,199 10,000,000 11,545,000Taxes 50701 Property Taxes 2,790 26,700 12,100
50702 Assessment Fee 325,662 332,722 373,99050705 Vehicle License and Registration 8,418 13,040 13,84050710 Fuel and Lubricant Taxes 153,925 170,000 150,00050715 Use Tax 2,738,478 2,791,863 2,501,84850720 Hazardous Waste Tax 6,053 10,000 10,00050725 Permits 110,619 129,000 129,000
Taxes Total 3,345,944 3,473,325 3,190,778Purchased Transportation 50802 Purchased Transport ‐ ADA Consortium 22,283,216 22,573,513 24,497,960
50803 ADA Consortium‐Other 137,612 138,000 67,51150804 Paratransit Miscellaneous Expenses 687,544 900,000 900,00050806 Dumbarton Purchased Transportation 2,971,981 2,599,000 3,100,000
Purchased Transportation Total 26,080,353 26,210,513 28,565,471Miscellaneous 50901 Dues and Subscriptions 432,544 379,200 441,151
50905 Travel and Meetings 167,068 318,088 348,33050910 BART Tickets 325 600 75050915 Bridge/Tunnel/Hwy Tolls 2,457 7,000 7,00050920 Fines & Penalties 81 0 050925 Bad Debt (286)
34

FY15/16 Budget DevelopmentTotal District6/10/2015
Category Account Account Name FYE 13/14 ActualsFY14/15 Mid‐Year
BudgetFY15/16 Adopted
BudgetMiscellaneous 50930 Employee Incentive 32,905 101,000 101,000
50940 Election of Directors 1,343,00050945 Cash Over & Short 0 500 50050955 Vendor Discounts 9,888 20,000 20,00050960 Ad/Promo Media Fees 133,393 130,500 359,20050970 Bank Charges 36,476 50,000 50,00050990 Other Miscellaneous Expenses (53,054) 100 8,60050991 Misc Marketing Expense (0) 0
Miscellaneous Total 761,797 2,349,988 1,336,531Expense Transfer 51001 Remanufactured Inventory (1,945,188) (1,875,000) (1,800,000)
51002 Functional Expense Reclassifications (770,136) (754,576) (927,526)51005 Labor Contra to Capital (2,878,576) (2,000,000) (3,329,154)
Expense Transfer Total (5,593,899) (4,629,576) (6,056,680)Interest Expense 51105 Interest Expense 1,239,902 1,139,943 1,037,043
51115 Discount Amortization 0Interest Expense Total 1,239,902 1,139,943 1,037,043Leases and Rentals 51201 Leases and Rentals 149,867 289,089 344,349
Leases and Rentals Total 149,867 289,089 344,349(Gain)/Loss On Sale of Asse 51610 (Gain)/Loss On Sale of Assets 89,549 0 0
(Gain)/Loss On Sale of Assets Total 89,549 0 0Grand Total 327,268,134 343,507,255 379,497,757
35


STRATEGIC
PLAN


STRATEGIC PLANNING AND ANNUAL BUDGET DEVELOPMENT PROCESS OVERVIEW The Board adopted a budget development calendar on November 12, 2014, and adopted a Mid‐Year budget for both Operating and Capital activity for the current fiscal year on January 28, 2015. The mid‐year budget is the current projection of revenue trends and operating costs. Staff also presented in Staff Report 15‐033 the next steps in the development process for the budget, which included the following:
Ensure strategic budget priorities are included in the Short Range Transit Plan (SRTP), Establish goals and objectives to achieve District priorities in FY 2015‐16, Update Key Performance Indicators (KPI) to measure progress towards achievement of the goals and objectives. In addition, staff presented Staff Report 15‐033 on April 27, 2015 on the draft operating budget. The Goals and Objectives provided in this report are based upon the performance management model established for the District. Executive strategy sessions were established to develop organizational goals of the agency, including conducting a SWOT analysis that identified the strengths, weaknesses, opportunities and threats related with achieving the goals and objectives. A new mission statement was established along with five overarching organizational goals. AC Transit Mission Statement Connecting our communities with safe, reliable, sustainable service ... we'll get you there. AC Transit's Organizational Goals 1. Provide Quality & Reliable Service 2. Effective Communication, Messaging & Marketing
a. Enhance Image & Branding b. Internal & External
3. Utilize Financial Resources Efficiently & Effectively a. Capital Projects b. Operational
39

4. Create a Safety Culture 5. Attract & Retain a High Quality Workforce
a. Employee Productivity & Accountability A list of goals and objectives are included in the FY 2014‐15 budget review processes and incorporated in the final approved budget book. The executive management team reviews the goals and objectives with their staff each year and makes adjustments to ensure the new goals reflect the current work plan and are realistic and achievable for the new fiscal year. The specific FY 2015‐16 goals and objectives for the District are defined below:
AC TRANSIT DISTRICT GOALS AND OBJECTIVES District Goal 1: Provide Quality and Reliable Service Reduce Cancelled Assignments and Reduce Outlate assignments to: <125 system wide outlates and cancellations based upon monthly division average by end of June 30, 2016. Improve Bus Cleanliness to: 8.1 out of 10 rating by end of June 30, 2016. Improve Mean Miles Between Road Calls: 5,400 miles by the end of June 30, 2016. Improve On‐Time Performance by improved scheduling and supervision: to 72% by end of June 2016. Improve Operator Courtesy as evidenced by reduced complaints: 5% reduction in complaints by end of June 2016. Improve Scheduling Efficiencies: 10% reduction in specialty school service by end of June 30, 2016. Reduce absenteeism to: 5% reduction from current absenteeism rates by end of June 30, 2016. Reduce Missed Trips to: 275 average system wide per month by end of June 30, 2016.
40

Conduct baseline Customer Satisfaction Study of current rider base and receive final report by June 30, 2016. Increase responsiveness by establishing a minimum Service Level Agreement with response to 60% of customer issues for tickets where feedback is requested within 10 calendar days. Increase Ridership with improved service quality by 3% by June 2016. Develop, update and maintain project schedule for all capital projects, work breakdown. Structure and schedule specification documents by September 2015. Establish standard workflows to enable better collaboration among various internal departments, with completion of process rollout session and process flow data chart definition by October 2015. Implement Flex Service in low‐density areas to replace ineffective and infrequent fixed‐route service, with implementation of the line 275 Flex Service Pilot by December 2015. Implement COA service expansion proposals with Measure BB revenues, with half of all recommendations by June 2016. District Goal 2: Create a Safety Culture Improve District Emergency Response efforts, as follows: • Improve Deputy Sheriff response time to crimes in progress by 5%. • Implement new System Security Plan by August 2015. Implement Safety Security Management Plan by December 2015. Improve system security by implementing security enhancements, as follows: • Tip Now application to help reduce Crime Indicators on buses by 4% by June 2016. • Conduct vulnerability assessment of all Divisions by August 2015.
41

Reduce Worker's Compensation costs, as follows: • Bring in‐house Worker's Compensation legal work. • Focus on early resolution of Worker's Compensation claims by Oct. 2015. Reduce employee injuries and workers compensation costs by 5% by June 2016, as follows: • Implement a FIT test for selecting Bus Operator candidates by October 2015. • Install Automatic External Defibrillators (AEDs) by October 2015. • Implement a pilot injury‐reduction incentive program in Maintenance by October 2015. Reduce collision rate per 100,000 miles to: • 4.0 by the end of June 2016 • Implement drive risk monitoring technology as a pilot program by July 2015. Reduce passenger accidents/incidents per 100,000 miles to: • 3.25 by June 2016 • Implement drive risk monitoring technology as a pilot program by July 2015. District Goal 3: Utilize Financial Resources Efficiently and Effectively Development and implementation of new budget development system, with initiation of a statement of work and procurement by June 2016. Develop streamlined approach to District procurement processes to ensure an average procurement cycle of 180 days or less for most procurements. Monitor developments with the Affordable HealthCare Act, particularly exposure to "Cadillac Tax", and develop tax reporting by December 2015 and complete measurements by September 2015.
42

Implement a new Employee Development program to provide new learning opportunities, with rollout of employee development program by September 2015. Reduce the Pay to Platform hours by 1% to provide additional operating efficiencies. Control overtime expenditures at 5% below budgeted levels. Manage employees on long‐term leave to ensure best practice for return to work is followed, with Implementation of a return to work program by September 2015. Increase farebox revenue with increased ridership by 3% by June 2016. Increase Clipper penetration rate with a review of the fare policy and implementation of marketing efforts to increase Clipper penetration by 3%. Control Paratransit operating costs through capitalization measures and improving productivity. • Reduce cost/passenger by 2%. • Increase productivity 2% by June 2016. District Goal 4: Attract and Retain a High Quality Workforce Improve the diversity of the District's workforce with improved adherence to the EEO plan by June 2015. Establish a compensation program for unrepresented employees based on pay for performance, with program implementation to be completed by June 2016. Establish a performance feedback system (in addition to current goal setting processes) for AFSCME employees by December 2015.
43

Increase employee effectiveness with development of resources for new employees with materials and procedures in place by September 2015. Implement Hay Study with revisions to pay and classifications with revisions to pay and classifications as determined by the Board. New performance review process implemented as part of the performance management process implemented by September 2015. District Goal 5: Effective Communication, Messaging and Marketing Enhance AC Transit's image among external audiences as measured by a 15% improvement in perception as determined by a public survey. Follow‐up to Baseline survey conducted in Spring 2015 with future surveys every two years. Continue bi‐monthly newsletter to improve internal and external communications. Publish GM eNewsletter, On the Move bi‐monthly throughout the year. Evaluate EasyPass pricing matrix and policies, establish criteria and make recommendations to Board by September 2015. Host District Town Halls to update public officials on AC Transit's programs, projects and operations, with completion of five (5) Town Halls by March 2016. Outreach to area Chambers of Commerce, with attendance at 50 Chamber meetings and/or events by April 2016. Visit state and federal legislative representatives, with 16 meetings with legislators by May 2016. Develop and produce FY 15‐16 Legislative Funding Book, with completion of legislative funding priority book by November 2016. Implement the updated Title VI program and policies submitted to FTA in 2014. Implement 1/2 of the program elements by June 30, 2016 in order to meet FTA compliance of the program by the next triennial update in Fall2017.
44

Improve Stakeholder relationships and communications. Conduct a transit workshop for local officials and stakeholders.
AC TRANSIT DISTRICT MAJOR PROGRAMS
The FY 2015‐16 will provide the District with additional opportunities to improve our services with the continuation, implementation, and completion of several major programs, as follows:
Major Projects
Commence construction of the new OCC Complete construction on the D2 Hydrogen Maintenance Bay Complete the transition to Daily Ops using HASTUS Complete the refurbishment of the D6 parking lot Complete the refurbishment of the D2 parking lot Commence Construction of the GO Glass & Glazing Refurbishment Commence Construction of the GO Structural Repairs Complete the Rehabilitation of the Board Room Complete the Elevator Modernization at three of the four facilities Commission the D4 Hydrogen Electrolyzer Complete the Design of the Line 97 Adaptive Signals Project Improve service reliability along the Hesperian Corridor. Procure and install upgraded Bus Washers and Bus Lifts. Complete A&E plans and initiate construction on D3 rehabilitation. Complete design for D4 rehabilitation. Complete design and start construction of Contra Costa College, Richmond Parkway and San Leandro BART Transit
Centers. Initiate implementation of Ellipse Upgrade.
45
Initiate implementation of CAD/AVL Modernization. BRT‐ Complete construction for Utility Relocation (Package 1). BRT‐Complete construction for Fruitvale bypass and parking mitigation lots (Package 2). BRT‐Major roadway construction (Package 3). Initiate work per planned construction zones to minimize impacts to
corridor. BRT‐Procurement for BRT buses advanced with selection of manufacturer. Develop a new public website that is responsive to customer and internal business needs, adaptive to all platforms,
and that includes revamped maps and schedules. Department managers and frontline employees will continue to focus on the District’s commitment to achieving departmental goals, key performance indicators, and specific targets during the budget period. Staff will generate specific Goals and Objectives as part of the Performance Management Process with specific targets and timelines for achievement that will guide the long term and short term initiatives that will assure the sustainability of the mission of the District. These goals and objectives will be aligned with the Short Range Transit Plan (the District's long‐term vision strategy document) and the Annual Budget short‐term operating planning process. Staff's goal is for a process that will not only help produce a "balanced budget" today, but most importantly, will produce a transformational change in the way the District creates value for all Stakeholders of the District, securing long term sustainable finances, sustainable environmental benefits and sustainable positive social effects to the East Bay community, the taxpayers, the employees and all other Stakeholders associated with the District. The proposal to adopt performance goals and measures will not only meet long standing planning requirements established by MTC, but it will also put the District on par with other large public transit operators that have adopted similar programs focused on performance. It will also put the District in good standing to receive new federal revenues, in accordance with the key tenets in MAP‐21 performance requirements.
46

FARES &
SERVICE MAPS


Introduction Passenger and Service Portrait
Service Area
364 square miles
13 cities plus adjacent unincorporated communities including service to downtown San Francisco via the Bay Bridge and Foster City and San Mateo via the San Mateo Bridge
Service Levels
105 bus lines (as of December 2014)
Serving 25 BART stations
Approximately 5,600 bus stops
586 Buses
19.2 million revenue service miles driven annually Passenger Trips
55.4 million trips annually (FY 2013/2014)
187,468 passengers each weekday (October 2013)
Demographics
15% under 20 years of age
28% between the ages of 20-29
16% between the ages of 30-39
14% between the ages of 40-49
15% between the ages of 50-59
11% over 60 years of age Service Usage Per Passenger
40% don’t own automobiles
43% of all trips are work related
22% of all trips are school related
Fare Structure
Local (Effective July 1, 2014)
Cash Fare Adults
Single Ride $2.10 Day Pass $5.00
Youth (5-18) / Senior / Disabled Single Ride $1.05 Day Pass $2.50
Clipper Cash Adults
Single Ride $2.00 Day Pass $5.00
Youth (5-18) / Senior / Disabled Single Ride $1.00 Day Pass $2.50
Local Clipper Passes Clipper Adult 31-Day Pass $75.00
Clipper Youth 31-Day Pass $20.00
Clipper Senior/Disabled Pass $20.00
Transbay (Effective July 1, 2014)
Cash Fare Adults $4.20
Youth (5-18) / Senior / Disabled $2.10
Transbay Clipper Passes
Adult 31-Day $151.20
49

Introduction Passenger and Service Portrait
Fixed Route Accessibility Regional Transit Connections All coaches are equipped with passenger lifts/ramps and
have a kneeling feature.
Coaches equipped with automated voice announcement system
Reduced fares are available for certified eligible individuals with a disability, seniors and youth
14-Member Accessibility Advisory Committee appointed by the Board of Directors.
AC Transit connects with the following fixed route services in the
Bay Area:
San Francisco Bay Area Rapid Transit District Rail Service
(BART)
Dumbarton Bridge Bus Service (Dumbarton Express)
Union City Transit
San Francisco Municipal Railway (MUNI)
San Mateo County Transit District (SamTrans)
Santa Clara Valley Transportation Authority
SolTrans (BART Link)
Western Contra Costa Transit Authority (WCCTA) and
Martinez Link
Capital Corridor/Amtrak
Altamont Commuter Express (ACE)
Golden Gate Transit
Caltrain
Fairfield and Suisun Transit (FAST)
Napa VINE
Emery Go Round
San Leandro LINKS San Francisco Bay Ferry (from Alameda & Oakland to San
Francisco & South San Francisco)
Americans with Disabilities Act (ADA) Mandated Paratransit Shared-ride Paratransit service is available from the East
Bay Paratransit Consortium (BART and AC Transit) for persons who are unable to use regular bus or train service.
16 member Service Review Advisory Committee represents individuals with a disability, seniors and health and human services organizations
Website: www.eastbayparatransit.org
E-mail: [email protected]
Information for Hearing or Visually Impaired Public Information is available in accessible formats
including Braille, audio tape, computer diskettes, and large print.
“711” through the California Relay Service is available for route information and to make service comments.
Website: www.actransit.org
50
Introduction Passenger and Service Portrait
Locations Important Telephone Numbers / Contact Information AC Transit has eight facilities, seven of which are operating facilities and one (*) of which offer customer services to the public, including Clipper and pass sales and trip-planning assistance.
General Office/Customer Service * 1600 Franklin Street Oakland, California Training and Education Center 20234 Mack Street Hayward, California Emeryville Operating Division (#2) 1177 47th Street Emeryville, California Richmond Division "Inactive" (#3) 2016 MacDonald Avenue Richmond, CA 94801-3356 East Oakland Operating Division (#4) 1100 Seminary Avenue Oakland, California Central Maintenance Facility and Stores Facility (#5) 10626 East 14th Street Oakland, California Hayward Operating Division (#6) 1758 Sabre Street Hayward, California TT - Transbay Terminal First and Missions Streets San Francisco, CA 94105
Customer Relations Ticket Office District Secretary Main Media Relations Telephone Device for the Deaf (TDD) Transit Information Website Customer Feedback:
(510) 891-4700 (510) 891-4706 (510) 891-7284 (510) 891-4777 (510) 891-4745 Dial “711” ( through the California Relay Service) Dial “511” www.actransit.org www.actransit.org/feedback
51

San FranciscoOakland
Berkeley
Richmond
Alameda
Hayward
Newark Fremont
Castro ValleySan Leandro
Milpitas
Orinda
El Cerrito
Redwood City
San Mateo
Palo Alto
Union City
LegendTrunk
Water
®AC Transit Route Structure - Trunk Routes, 2015
0 5 102.5Miles
Sources:TeleAtlas & AC Transit Scheduling System Prepared by Service Development, AC Transit,May, 2015
52
San FranciscoOakland
Berkeley
Richmond
Alameda
Hayward
Newark Fremont
Castro ValleySan Leandro
Milpitas
Orinda
El Cerrito
Redwood City
San Mateo
Palo Alto
Union City
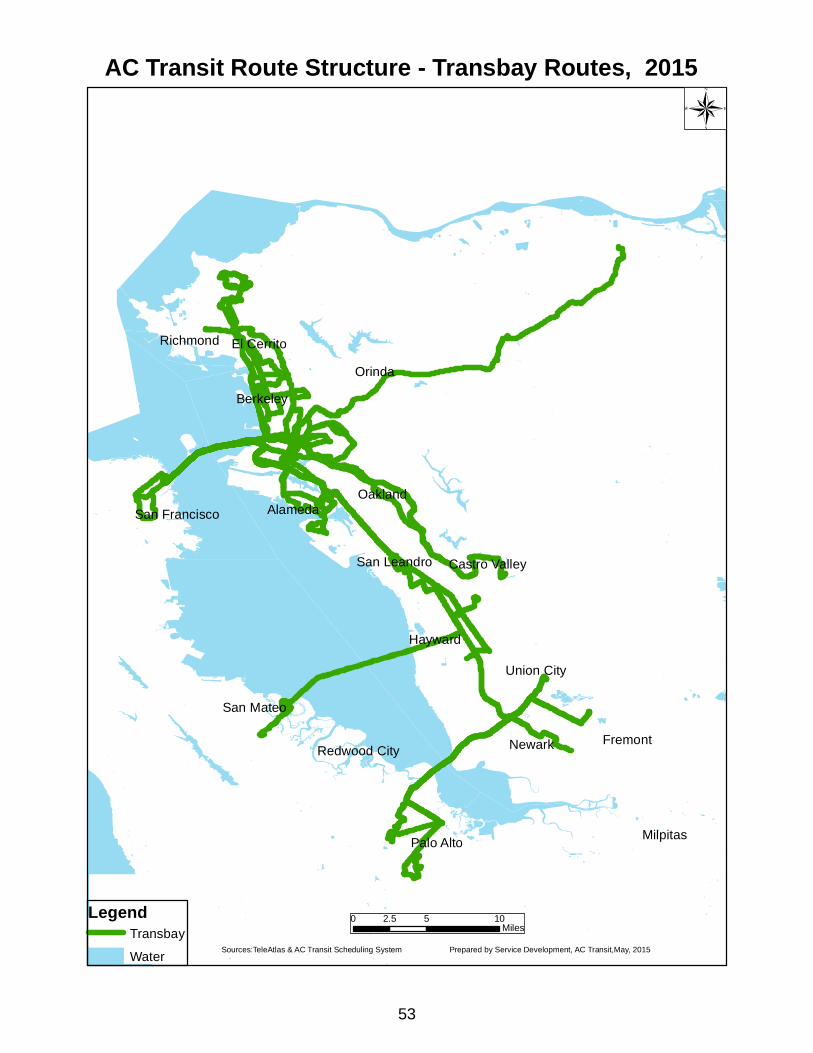
®AC Transit Route Structure - Transbay Routes, 2015
0 5 102.5Miles
Sources:TeleAtlas & AC Transit Scheduling System Prepared by Service Development, AC Transit,May, 2015
LegendTransbay
Water
53

San FranciscoOakland
Berkeley
Richmond
Alameda
Hayward
Newark Fremont
Castro ValleySan Leandro
Milpitas
Orinda
El Cerrito
Redwood City
San Mateo
Palo Alto
Union City
®AC Transit Route Structure - School/Supplementary Routes (600 series only), 2015
0 5 102.5Miles
Sources:TeleAtlas & AC Transit Scheduling System Prepared by Service Development, AC Transit,May, 2015
LegendSupplementary
Water
54

San FranciscoOakland
Berkeley
Richmond
Alameda
Hayward
Newark Fremont
Castro ValleySan Leandro
Milpitas
Orinda
El Cerrito
Redwood City
San Mateo
Palo Alto
Union City
®AC Transit Route Structure - Owl Service Routes, 2015
0 5 102.5Miles
Sources:TeleAtlas & AC Transit Scheduling System Prepared by Service Development, AC Transit,May, 2015
LegendOwl
Water
55
San FranciscoOakland
Berkeley
Richmond
Alameda
Hayward
Newark Fremont
Castro ValleySan Leandro
Milpitas
Orinda
El Cerrito
Redwood City
San Mateo
Palo Alto
Union City
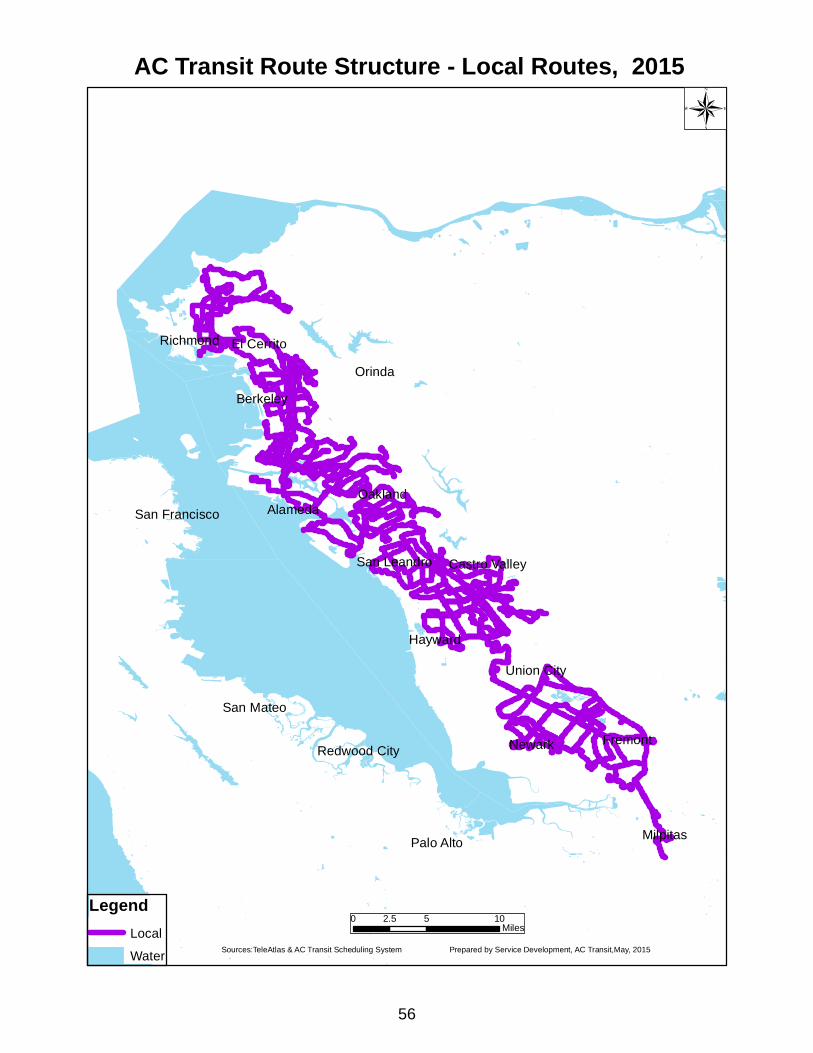
LegendLocal
Water
®AC Transit Route Structure - Local Routes, 2015
0 5 102.5Miles
Sources:TeleAtlas & AC Transit Scheduling System Prepared by Service Development, AC Transit,May, 2015
56

Overview of Departments


BOARD OF
DIRECTORS


AC Transit District Board of Directors
Organizational
Chart
As of April 2015
Citizens
Ward I
Joe Wallace Director (exp. 2016)
Ward II
Greg Harper Director (exp. 2016)
Ward III
Elsa Ortiz Vice President
(exp. 2018)
Ward IV
Mark Williams Director (exp. 2018)
Ward V
Jeff Davis Director (exp. 2018)
At Large H.E. Christian
Peeples President
(exp. 2016)
At Large
Joel B. Young Director (exp. 2018)
General Counsel
Denise C. Standridge
General Manager
Kathleen Kelly (Interim)
District Secretary
Linda A. Nemeroff
61

DEPARTMENT FUNCTION
OPERATING BUDGET
Labor Costs
Mgmt/Tech/Office support - 95,000 - 96,000
Net Salaries and Wages - 95,000 - 96,000
Fringe Benefits costs 93,932 95,000
Total Labor Costs - 188,932 - 191,000
Non-Labor CostsStationary Supplies & Postage 1,500 2,000 Travel & Meetings 39,200 75,000 Printing Services 1,500 1,500 Dues & Subscriptions 1,000 1,000 Professional & Technical Services 15,000 25,000 Executive Search Services - 100,000 Office Furn/Equip < $1,000 1,000 10,000
Total Non-Labor Costs 59,200 214,500
Total Operating Budget 248,132 405,500
FY 2015-16
BOARD OF DIRECTORS
FY 2014-15
Mid Year Working Headcount
Mid Year Working Budget
The Alameda-Contra Costa Transit District is governed by a seven member Board of Directors independently elected by the voters of the district. Five directors represent specific geographic areas known as wards and two represent the entire district at-large. The Board of Directors is, by statute, a policy-making body. Under California law, the Board shall supervise and regulate every transit facility owned and operated by the district; including the fixing of rates, rentals, charges, and classifications, and the making and enforcement of rules, regulations, contracts, practices, and schedules, for or in connection with any transit facility owned or controlled by the District. The Board of Directors regularly holds business meetings that are open to the public and appoints the District’s three officers: the General Manager, General Counsel and District Secretary, who serve at the pleasure of the Board.
Authorized Headcount Adopted Budget
62

FY15/16 Budget DevelopmentBoard of Directors6/10/2015
Category Account Account Name FYE 13/14 ActualsFY14/15 Mid‐Year
BudgetFY15/16 Adopted
BudgetS&W 50130 Salaried Regular Time 94,359 95,000 96,000
S&W Total 94,359 95,000 96,000Fringe Benefits 89,511 93,932 95,000Services 50308 Professional and Technical Services 12,641 15,000 125,000
50360 Printing Services 190 1,500 1,500Services Total 12,832 16,500 126,500Materials & Supplies 50460 Stationery Supplies 1,350 1,000 1,500
50461 Office Furn/Equip < $1,000 0 1,000 10,00050462 Postage 0 500 500
Materials & Supplies Total 1,350 2,500 12,000Miscellaneous 50901 Dues and Subscriptions 173 1,000 1,000
50905 Travel and Meetings 34,257 39,200 75,00050940 Election of Directors 0
Miscellaneous Total 34,430 40,200 76,000Grand Total 232,482 248,132 405,500
63


DISTRICT
SECRETARY


Office of the District Secretary
As Of March 2015
Alameda-Contra Costa Transit District
Citizens
Assistant District Secretary
Kathleen Eichmeier
Board of Directors
District Secretary
Linda A. Nemeroff
Executive Administrative Assistant
(1)
67

DEPARTMENT FUNCTION
OPERATING BUDGET
Labor CostsMgmt/Tech/Office support 3 260,428 3 285,026
Net Salaries and Wages 3 260,428 3 285,026
Fringe Benefits costs 191,053 251,150
Total Labor Costs 3 451,481 3 536,176
Non-Labor CostsPrinting Services 800 1,000 Stationary Supplies 2,000 2,500 Office Furniture / Equipment 1,000 20,000 Travel & Meetings 5,000 6,000 Other Activities and Programs 3,000 4,000
Total Non-Labor Costs 11,800 33,500
Total Operating Budget 463,281 569,676
FY 2015-16
DISTRICT SECRETARY
FY 2014-15
Mid Year Working
Headcount
Mid Year Working Budget
The Office of the District Secretary is a service department on which the Board of Directors, district departments and the public rely for information regarding the legislative history of the District. The District Secretary provides administrative support to the Board of Directors, is the custodian of all books, records, and proceedings of the Board and its committees. As one of the key staff for Board of Directors meetings, the District Secretary prepares agendas, verifies legal notices have been posted or published, makes the necessary arrangements to facilitate effective meetings, and is entrusted with the responsibility of recording the decisions which constitute the record of the Board’s proceedings. Additionally, the District Secretary manages and exercises authority over budgets, is the District’s elections official, serves as the District’s filing officer under its Conflict of Interest Code, and provides a wide variety of administrative functions and services.
Authorized Headcount Adopted Budget
68

FY15/16 Budget DevelopmentDistrict Secretary6/10/2015
Category Account Account Name FYE 13/14 ActualsFY14/15 Mid‐Year
BudgetFY15/16 Adopted
BudgetS&W 50130 Salaried Regular Time 195,244 260,428 285,026
S&W Total 195,244 260,428 285,026Fringe Benefits 155,185 191,053 251,150Services 50308 Professional and Technical Services 1,768 2,500 3,500
50360 Printing Services 70 800 1,000Services Total 1,838 3,300 4,500Materials & Supplies 50460 Stationery Supplies 1,118 2,000 2,500
50461 Office Furn/Equip < $1,000 1,000 20,000Materials & Supplies Total 1,118 3,000 22,500Miscellaneous 50901 Dues and Subscriptions 579 500 500
50905 Travel and Meetings 0 5,000 6,000Miscellaneous Total 579 5,500 6,500Expense Transfer 51005 Labor Contra to Capital 0
Expense Transfer Total 0Grand Total 353,965 463,281 569,676
69

FY2015/16 Authorized Positions by Department6/10/2015
Department Pay Group Job Title
Authorized FTEs FY14/15 @ Mid‐Year
Authorized FTEs FY15/16
District Secretary Salaried Assistant District Secretary 1 1 District Secretary 1 1 Executive Administrative Asst. 1 1
Salaried Total 3 3 District Secretary Total 3 3
70

GENERAL MANAGER


Office of the General Manager
As Of April 2015(2)
Board of Directors
General Manager
Kathleen Kelly (Interim)
Executive Coordinator
(1)
Compliance & Diversity
(EEO & Contracts) (3)
Media Relations
(1)
Internal Audit
(2)
73
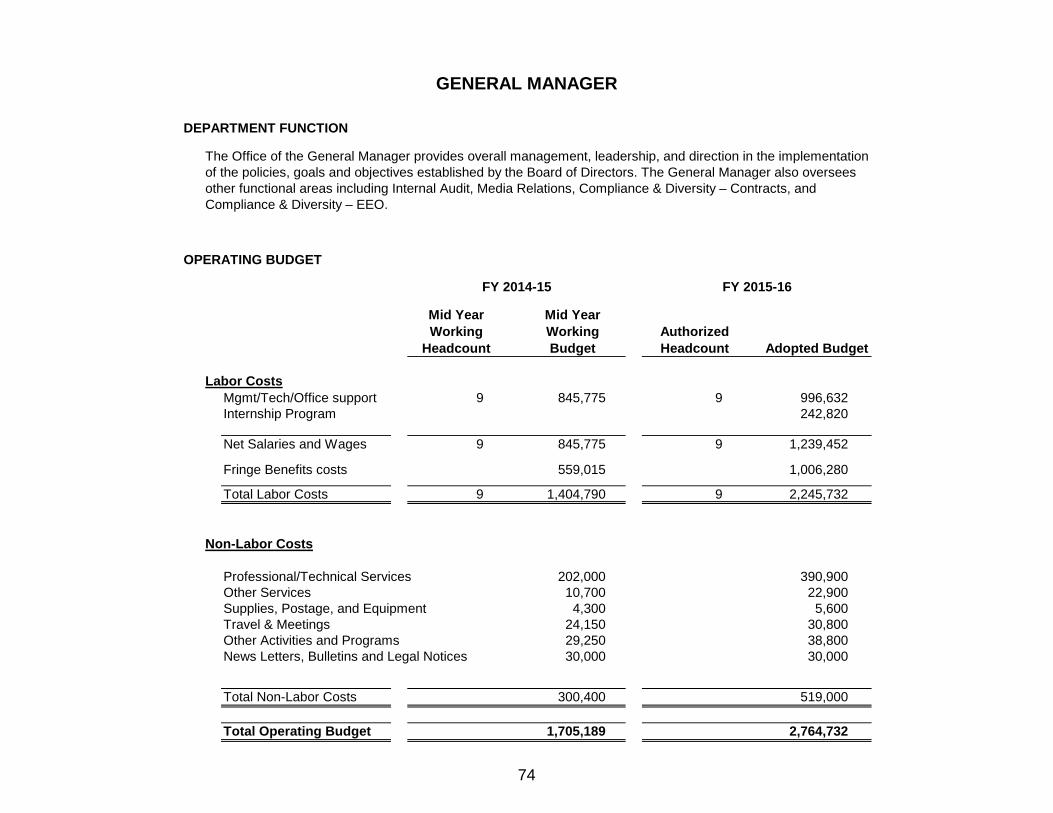
DEPARTMENT FUNCTION
OPERATING BUDGET
Labor CostsMgmt/Tech/Office support 9 845,775 9 996,632 Internship Program 242,820
Net Salaries and Wages 9 845,775 9 1,239,452
Fringe Benefits costs 559,015 1,006,280
Total Labor Costs 9 1,404,790 9 2,245,732
Non-Labor Costs
Professional/Technical Services 202,000 390,900 Other Services 10,700 22,900 Supplies, Postage, and Equipment 4,300 5,600 Travel & Meetings 24,150 30,800 Other Activities and Programs 29,250 38,800 News Letters, Bulletins and Legal Notices 30,000 30,000
Total Non-Labor Costs 300,400 519,000
Total Operating Budget 1,705,189 2,764,732
GENERAL MANAGER
FY 2014-15
Adopted Budget
The Office of the General Manager provides overall management, leadership, and direction in the implementation of the policies, goals and objectives established by the Board of Directors. The General Manager also oversees other functional areas including Internal Audit, Media Relations, Compliance & Diversity – Contracts, and Compliance & Diversity – EEO.
FY 2015-16
Mid Year Working
Headcount
Mid Year Working Budget
Authorized Headcount
74
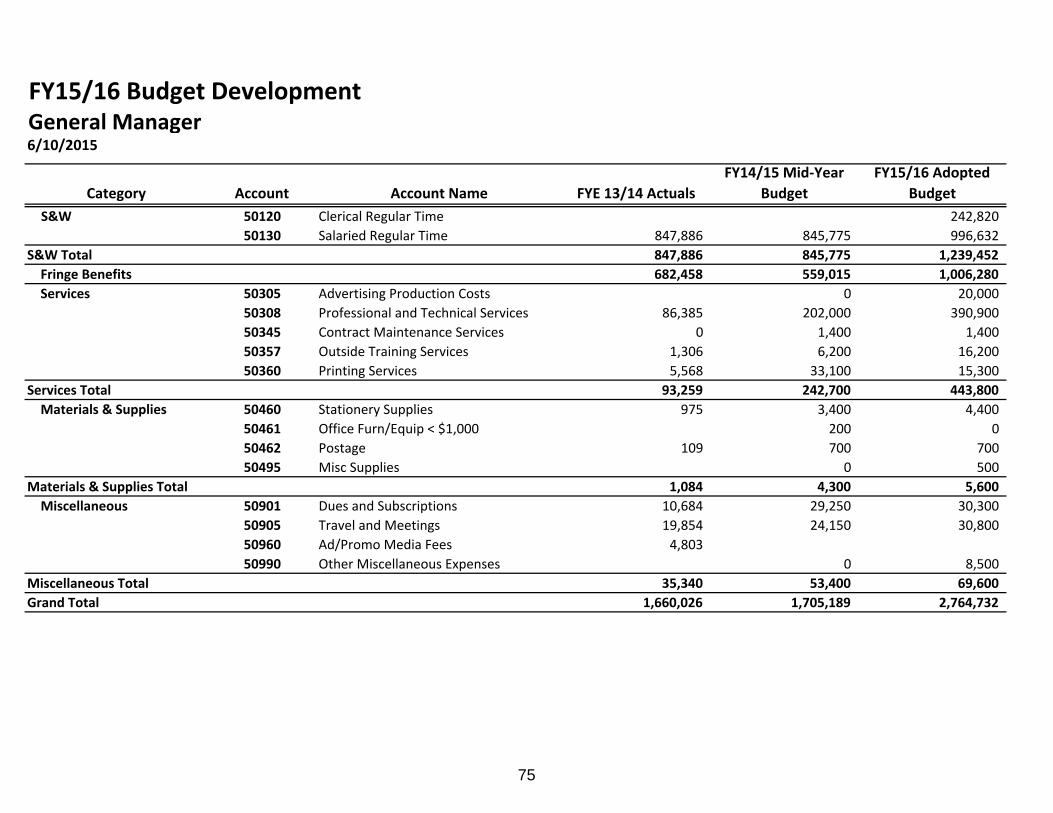
FY15/16 Budget DevelopmentGeneral Manager6/10/2015
Category Account Account Name FYE 13/14 ActualsFY14/15 Mid‐Year
BudgetFY15/16 Adopted
BudgetS&W 50120 Clerical Regular Time 242,820
50130 Salaried Regular Time 847,886 845,775 996,632S&W Total 847,886 845,775 1,239,452Fringe Benefits 682,458 559,015 1,006,280Services 50305 Advertising Production Costs 0 20,000
50308 Professional and Technical Services 86,385 202,000 390,90050345 Contract Maintenance Services 0 1,400 1,40050357 Outside Training Services 1,306 6,200 16,20050360 Printing Services 5,568 33,100 15,300
Services Total 93,259 242,700 443,800Materials & Supplies 50460 Stationery Supplies 975 3,400 4,400
50461 Office Furn/Equip < $1,000 200 050462 Postage 109 700 70050495 Misc Supplies 0 500
Materials & Supplies Total 1,084 4,300 5,600Miscellaneous 50901 Dues and Subscriptions 10,684 29,250 30,300
50905 Travel and Meetings 19,854 24,150 30,80050960 Ad/Promo Media Fees 4,80350990 Other Miscellaneous Expenses 0 8,500
Miscellaneous Total 35,340 53,400 69,600Grand Total 1,660,026 1,705,189 2,764,732
75

FY2015/16 Authorized Positions by Department6/10/2015
Department Pay Group Job Title
Authorized FTEs FY14/15 @ Mid‐Year
Authorized FTEs FY15/16
General Manager Salaried Administrative Coordinator ‐ 1 Contracts Compliance Admin 1 1 EEO Program Administrator 1 1 Executive Coordinator 1 1 General Manager 1 1 HR Administrator (Investigations) 1 1 Internal Audit Manager 1 1 Internal Auditor 1 1 Media Affairs Manager 1 1 Senior Advisor 1 ‐
Salaried Total 9 9 General Manager Total 9 9
76

GENERAL COUNSEL


Office of the General Counsel
As Of March 2015
Citizens
Board of Directors
General Counsel
Denise Standridge
Attorney II (2)
Executive Coordinator Anne Fudge
Risk Administration/Claims
Legal Department
Attorney III (1)
Sr. Legal Assistant (3)
Claims & Liability Administrator (1)
Sr. Claims Representative (2)
Admin Assistant (1)
Sr. Secretary (1)
79
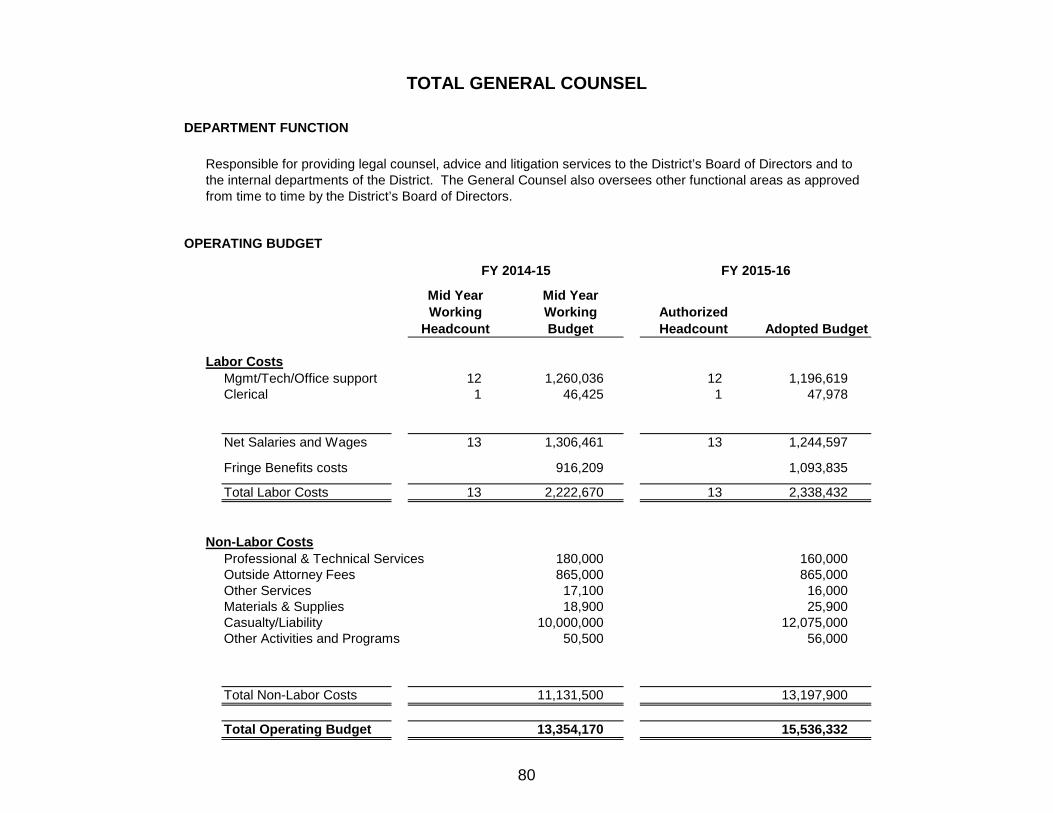
DEPARTMENT FUNCTION
OPERATING BUDGET
Labor CostsMgmt/Tech/Office support 12 1,260,036 12 1,196,619 Clerical 1 46,425 1 47,978
Net Salaries and Wages 13 1,306,461 13 1,244,597
Fringe Benefits costs 916,209 1,093,835
Total Labor Costs 13 2,222,670 13 2,338,432
Non-Labor CostsProfessional & Technical Services 180,000 160,000 Outside Attorney Fees 865,000 865,000 Other Services 17,100 16,000 Materials & Supplies 18,900 25,900 Casualty/Liability 10,000,000 12,075,000 Other Activities and Programs 50,500 56,000
Total Non-Labor Costs 11,131,500 13,197,900
Total Operating Budget 13,354,170 15,536,332
TOTAL GENERAL COUNSEL
FY 2014-15
Adopted Budget
Responsible for providing legal counsel, advice and litigation services to the District’s Board of Directors and to the internal departments of the District. The General Counsel also oversees other functional areas as approved from time to time by the District’s Board of Directors.
FY 2015-16
Mid Year Working
Headcount
Mid Year Working Budget
Authorized Headcount
80

FY15/16 Budget DevelopmentGeneral Counsel6/10/2015
Category Account Account Name FYE 13/14 ActualsFY14/15 Mid‐Year
BudgetFY15/16 Adopted
BudgetS&W 50120 Clerical Regular Time 49,169 46,425 47,978
50130 Salaried Regular Time 1,051,277 1,260,036 1,196,61950135 Salaried Overtime 62
S&W Total 1,100,508 1,306,461 1,244,597Fringe Benefits 839,003 916,209 1,093,835Services 50308 Professional and Technical Services 113,399 180,000 160,000
50317 Outside Attorney 828,393 865,000 865,00050330 Non‐Lawyer Legal 0 10,00050357 Outside Training Services 3,010 6,600 16,00050360 Printing Services 1,098 500
Services Total 945,900 1,062,100 1,041,000Materials & Supplies 50460 Stationery Supplies 6,296 17,900 17,900
50461 Office Furn/Equip < $1,000 0 0 6,50050462 Postage 1,494 1,000 1,500
Materials & Supplies Total 7,790 18,900 25,900Liability 50601 Insurance Premium 3,959,830 4,800,000 6,200,000
50641 Casualty/Liability Costs 4,690,000 4,500,000 5,000,00050642 Property Damage 700,000 700,000 875,000
Liability Total 9,349,830 10,000,000 12,075,000Miscellaneous 50901 Dues and Subscriptions 35,310 40,500 44,000
50905 Travel and Meetings 6,722 10,000 12,000Miscellaneous Total 42,032 50,500 56,000Expense Transfer 51005 Labor Contra to Capital (16,330)
Expense Transfer Total (16,330)Grand Total 12,268,733 13,354,170 15,536,332
81

FY2015/16 Authorized Positions by Department6/10/2015
Department Pay Group Job Title
Authorized FTEs FY14/15 @ Mid‐Year
Authorized FTEs FY15/16
Office of the General Counsel Clerical Senior Secretary (Union) 1 1 Clerical Total 1 1 Salaried Administrative Assistant 1 1
Attorney II 1 2 Attorney III 2 1 Claims & Liability Admin 1 1 Executive Coordinator 1 1 General Counsel 1 1 Legal Assistant 1 ‐ Senior Claims Representative 2 2 Senior Legal Assistant 2 3
Salaried Total 12 12 Office of the General Counsel Total 13 13
82

OPERATIONS


Operations
As Of March 2015
Chief Operating Officer
James D. Pachan
Training & Education
Mike Flocchini, Manager
Transportation
Christopher Beach, Dir.
Transportation Supervisors (45)
Sr. Admin. Asst. (1)
Division 2 Transp.
Denise Henderson, Supt.
Assistant Supt. (2)
Transit Off Mgr. (1)
Chief Dispatcher (1) (5 Dispatchers)
(1 Division Clerk) (1 Timekeeper)
Division 4 Transp.
Karen Teaster, Supt.
Chief Dispatcher (1) (5 Dispatchers)
(1 Division Clerk) (1 Timekeeper)
Assistant Supt. (2)
Chief Dispatcher (1) (5 Dispatchers)
(1 Division Clerk) (1 Timekeeper)
Transportation Joe Tating, Asst Mgr.
Train Instructors (6)
Assistant Supt. Transbay Term. (1)
Fleet & Facilities Maintenance
Salvador Llamas, Dir.
Maint Supernt - D2 Chris Durant
Sr. Maint Suprv (1)
Maint Suprv. (6)
Maint Supernt - D6 Ewell Crigger
Maint Supernt - D4
(Vacant)
Sr. Maint Suprv. (1)
Maint Suprv. (6)
Admin. Coord – CMF (1)
Technical Services / Quality Assurance
Stuart Hoffman, Manager
Maint Tech Serv. Supv. (2)
Maint. Tech Service Supv.
(Warranty Admin) (1) (1)
Maint. Trainer (4)
Apprent Mentor (Assign)
Senior Supervisor (2)
Fac Maint Suprv (3)
Ld Timekeeper (1)
Sr. Admin. Clerk (1)
Sr. Admin. Asst (1)
Div. Sr. Clerk (4)
Facility Maintenance Rick Wrzesinski, Mgr.
Sr. Maint Suprv. (1)
Maint Suprv. (6)
Senior Electronic Technician (18)
Elect Systems Suprv Ernie Orozco
Asst Supt Acdnt Rev (1)
Maint Trainer (2)
Executive Administrative Assistant Maisha Maxwell (.5)
Transp. Asst. Supervisors (8 pt)
Sr. Typist Clerk (1)
Mail Clerk (1)
Operations Control Center
Joseph Robinson, Supt.
Maint Suprv. (3)
Transit Enforcement
Kerry Jackson, Manager
Maintenance
J. Souza, Asst Mgr.
Division 6 Transp.
(Vacant)
Transit Office Mgr.(1)
Alameda Sheriffs Contract
Sr. Admin. Clrk (1)
Maint. Superint-CMF Dave Miller
Tech Serv Supv. (Quality Assurance)
(1)
Safety Admin. (1)
Safety Rep. (1)
Safety & Environmental Engineering
Wahid Amiri, Manager
Management Analyst Blossom Albuquerque (1)
Transit Off Mgr. (1)
Assistant Supt. (2)
Contra Costa Sheriffs Contract
Security Service Contract
Elect Support Worker (1)
Supervisor Acdnt Rev (1)
Ops Data Sys Admin (1)
Asst. Dir. Maint Roland Fecteau
85

DEPARTMENT FUNCTION
OPERATING BUDGET
Labor Costs
Mgmt/Tech/Office support 131 10,917,410 139 12,230,568Clerical 33 2,167,388 33 2,381,413New Bus Operators in Training - 912,000 - 1,239,300Maintenance 363 19,679,902 372 21,348,040Operators 1196 61,955,845 1236 69,776,501 Net Salaries and Wages 1723 95,632,546 1780 106,975,822
Fringe Benefits costs 96,176,079 115,388,715
Total Labor Costs 1723 191,808,625 1780 222,364,537
Non-Labor CostsProfessional & Tech Svcs 752,362 586,825 Physicals 23,041 - Security Services 9,577,665 10,191,713 Maintenance Apprenticeship 37,000 72,000 Hazardous Waste 200,000 200,000 Other Services 1,894,636 2,118,390 Bus Parts 11,203,790 13,471,886 Tires & Tubes 2,318,438 2,962,437 Fuel & Lubes 17,262,731 15,815,328 Hydrogen Fuel 500,000 600,000 Other Materials & Supplies 1,142,383 1,394,283 Employee Incentives 50,000 50,000 Vehicle Licence & Registration 9,440 9,440 Permits 129,000 129,000 Biogas 300,000 300,000 Leases and Rentals 249,089 303,349 Other Activities and Programs 256,805 311,169
Total Non-Labor Costs 45,906,378 48,515,820
Total Operating Budget 237,715,003 270,880,357
OPERATIONS
The Operations Department includes Transportation, Maintenance, Training and Education, Operations Control Center, Environmental Engineering, Technical Services, and Protective Services departments within Transit Operations. The Operations Department monitors performance of our service using Key Performance Indicators and focuses on continual improvement in the service provided to our customers.
FY 2014-15 FY 2015-16Mid Year Working
HeadcountMid Year
Working BudgetAuthorized Headcount Adopted Budget
86

FY15/16 Budget DevelopmentOperations Rollup6/10/2015
Category Account Account Name FYE 13/14 ActualsFY14/15 Mid‐Year
BudgetFY15/16 Adopted
BudgetS&W 50101 Operators Regular Time 49,475,072 52,508,209 59,653,517
50105 Operators Premium Time 8,128,476 8,426,264 9,088,52450106 Operators Holiday Time 928,825 1,021,372 1,034,46050110 Maintenance Regular Time 16,402,835 18,219,897 19,852,66250115 Maintenance Overtime 732,136 1,275,349 1,339,11650116 Maintenance Holiday Time 145,485 184,656 156,26250120 Clerical Regular Time 2,658,829 1,914,781 1,975,14450125 Clerical Overtime 287,682 215,179 367,35050126 Clerical Holiday Time 42,481 37,428 38,91950130 Salaried Regular Time 9,427,688 10,515,227 11,845,18950135 Salaried Overtime 321,209 306,183 339,51050136 Salaried Holiday Time 32,497 96,000 45,86950140 NBO Training Regular Time 882,000 1,166,40050145 NBO Training Overtime 30,000 72,90050150 Indirect Cost Account 0
S&W Total 88,583,214 95,632,546 106,975,822Fringe Benefits 94,841,454 96,176,079 115,388,715Services 50308 Professional and Technical Services 450,037 752,362 654,175
50320 Physicals 116,444 23,041 050340 Temporary Help 0 3,000 3,00050342 Outside Repair Services 537,083 696,147 766,79750345 Contract Maintenance Services 587,395 783,457 885,45750350 Custodial Services 7,936 1,500 1,50050355 Security Services 9,396,819 9,577,665 10,191,71350357 Outside Training Services 22,820 37,000 72,00050360 Printing Services 27,210 80,532 64,28650370 Hazardous Waste 199,247 200,000 200,00050375 Laundry 53,448 130,000 130,00050380 Towing 219,620 200,000 200,000
Services Total 11,618,059 12,484,704 13,168,928Materials & Supplies 50401 Front Axle 31,800 43,805 43,805
87
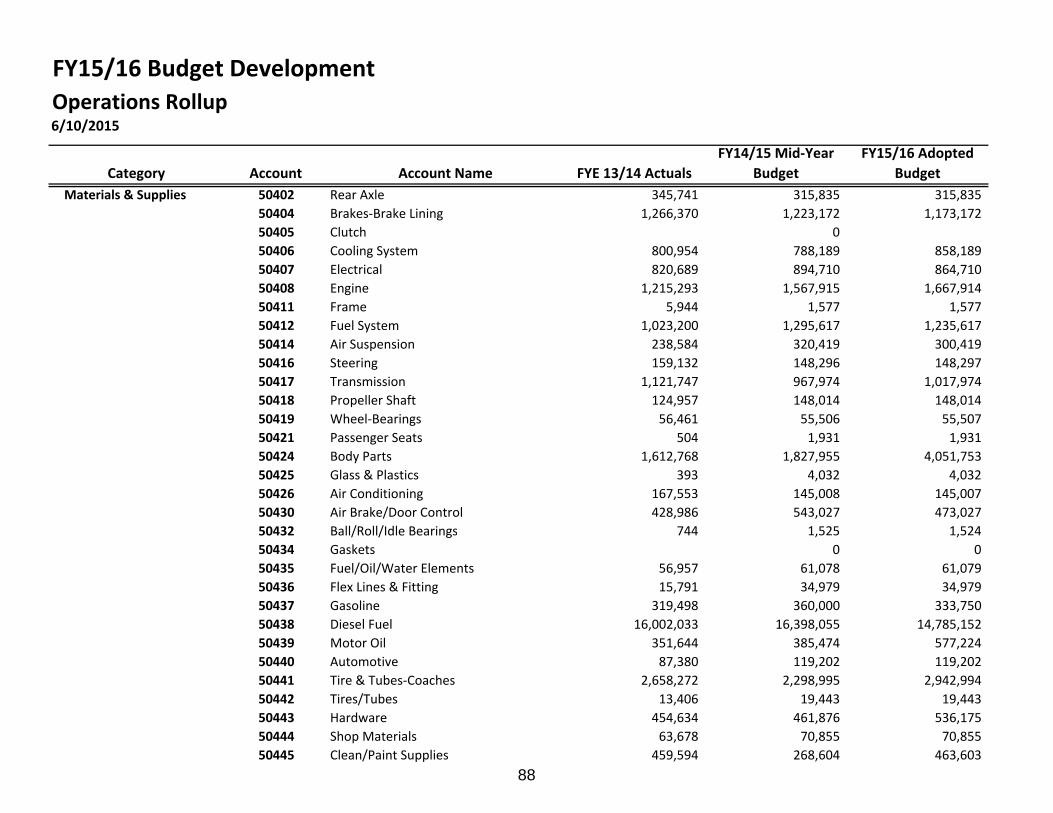
FY15/16 Budget DevelopmentOperations Rollup6/10/2015
Category Account Account Name FYE 13/14 ActualsFY14/15 Mid‐Year
BudgetFY15/16 Adopted
BudgetMaterials & Supplies 50402 Rear Axle 345,741 315,835 315,835
50404 Brakes‐Brake Lining 1,266,370 1,223,172 1,173,17250405 Clutch 050406 Cooling System 800,954 788,189 858,18950407 Electrical 820,689 894,710 864,71050408 Engine 1,215,293 1,567,915 1,667,91450411 Frame 5,944 1,577 1,57750412 Fuel System 1,023,200 1,295,617 1,235,61750414 Air Suspension 238,584 320,419 300,41950416 Steering 159,132 148,296 148,29750417 Transmission 1,121,747 967,974 1,017,97450418 Propeller Shaft 124,957 148,014 148,01450419 Wheel‐Bearings 56,461 55,506 55,50750421 Passenger Seats 504 1,931 1,93150424 Body Parts 1,612,768 1,827,955 4,051,75350425 Glass & Plastics 393 4,032 4,03250426 Air Conditioning 167,553 145,008 145,00750430 Air Brake/Door Control 428,986 543,027 473,02750432 Ball/Roll/Idle Bearings 744 1,525 1,52450434 Gaskets 0 050435 Fuel/Oil/Water Elements 56,957 61,078 61,07950436 Flex Lines & Fitting 15,791 34,979 34,97950437 Gasoline 319,498 360,000 333,75050438 Diesel Fuel 16,002,033 16,398,055 14,785,15250439 Motor Oil 351,644 385,474 577,22450440 Automotive 87,380 119,202 119,20250441 Tire & Tubes‐Coaches 2,658,272 2,298,995 2,942,99450442 Tires/Tubes 13,406 19,443 19,44350443 Hardware 454,634 461,876 536,17550444 Shop Materials 63,678 70,855 70,85550445 Clean/Paint Supplies 459,594 268,604 463,603
88

FY15/16 Budget DevelopmentOperations Rollup6/10/2015
Category Account Account Name FYE 13/14 ActualsFY14/15 Mid‐Year
BudgetFY15/16 Adopted
Budget50446 MFG Equip/Tools < $1,000 7,662 12,361 12,36150447 Lubricants 201,685 210,691 198,24150448 Hydrogen Fuel 484,927 500,000 600,00050450 Building Supplies 84,146 70,084 70,08450451 GFI Genfare Farebox Materials 17,758 55,254 55,25450453 Elec Dest Sign Mtls 55,164 85,109 65,10950455 E & H Lift Material 145,106 168,532 168,53250457 Radio Parts 126,069 103,533 103,53350460 Stationery Supplies 106,463 101,735 103,56150461 Office Furn/Equip < $1,000 1,032 0 8,50050462 Postage 1,292 1,839 1,84050463 Printing Supplies 387 1,566 1,56650468 Timetables 10,264 30,785 30,78550474 Safety/Medical Supplies 14,579 24,021 24,02250475 Coveralls & Coats 24,671 12,302 12,30350480 EDP Materials 2,003 2,611 2,61250495 Misc Supplies 312,391 273,851 332,87150499 Warranties (71,552) 0 0
Materials & Supplies Total 31,428,755 32,427,340 34,243,934Utilities 50505 Electric & Gas 6,000 25,000
50510 Water 0 25,00050515 Biogas 321,611 300,000 300,00050520 Scavenger Services 183,819 176,507 176,507
Utilities Total 505,431 482,507 526,507Liability 50605 Loss Recoveries 0
50641 Casualty/Liability Costs 0 0 050642 Property Damage 0 0
Liability Total 0 0 0Taxes 50701 Property Taxes 9,300 9,300
50705 Vehicle License and Registration 8,418 9,440 9,44050715 Use Tax 0 1,848 1,848
89

FY15/16 Budget DevelopmentOperations Rollup6/10/2015
Category Account Account Name FYE 13/14 ActualsFY14/15 Mid‐Year
BudgetFY15/16 Adopted
BudgetTaxes 50720 Hazardous Waste Tax 6,053 10,000 10,000
50725 Permits 109,771 129,000 129,000Taxes Total 124,241 159,589 159,588Miscellaneous 50901 Dues and Subscriptions 6,762 14,920 15,284
50905 Travel and Meetings 24,246 31,230 41,23050915 Bridge/Tunnel/Hwy Tolls 2,457 7,000 7,00050920 Fines & Penalties 81 0 050930 Employee Incentive 32,905 50,000 50,000
Miscellaneous Total 66,451 103,150 113,514Expense Transfer 51005 Labor Contra to Capital (131,636) 0 0
Expense Transfer Total (131,636) 0 0Interest Expense 51105 Interest Expense 0 0
Interest Expense Total 0 0Leases and Rentals 51201 Leases and Rentals 113,351 249,089 303,349
Leases and Rentals Total 113,351 249,089 303,349(Gain)/Loss On Sale of Asse 51610 (Gain)/Loss On Sale of Assets (106,547) 0 0
(Gain)/Loss On Sale of Assets Total (106,547) 0 0Grand Total 227,042,772 237,715,003 270,880,357
90

FY2015/16 Authorized Positions by Department6/10/2015
Department Pay Group Job Title
Authorized FTEs FY14/15 @ Mid‐Year
Authorized FTEs FY15/16
Operations Clerical Chief Dispatcher 3 3 Dispatcher 15 15 Div Senior Clerk/Maintenance 4 4 Division Clerk 3 3 Lead Timekeeper 1 1 Mail Clerk 1 1 Senior Administrative Clerk 2 2 Senior Typist Clerk 1 1 Timekeeper 3 3
Clerical Total 33 33 Maintenance Apprentice Mechanic 16 16
Apprentice Mentor 1 1 Body Mechanic B 1 1 Body/Frame Mechanic 3 3 Electrician 4 4 Electronic Support Worker 1 1 Facilities Maintenance Trainer 1 1 Frame/Body Mechanic 1 1 Hvac Technician 2 2 Janitor 13 16 Journey Facil Mtce Mechanic 9 9 Journey Level Mechanic 129 132 Lift Mechanic 5 5 Machinist 4 4 Maintenance Trainer 6 6 Mechanic A / Unit Room 14 14 Painter A 3 3 Pre‐Apprentice Mechanic ‐ OTC 3 3 Qualified Temp Service Emp 7 7
91

FY2015/16 Authorized Positions by Department6/10/2015
Department Pay Group Job Title
Authorized FTEs FY14/15 @ Mid‐Year
Authorized FTEs FY15/16
Qualified Temporary Janitor 2 2 Senior Body Mechanic 26 26 Senior Electronic Technician 19 20 Service Employee 80 82 Small & Med Duty Veh Mechanic 4 4 Upholsterer A 5 5 Waste Clean Up Worker 1 1 Welder/Sheetmetal Mechanic A 1 1 Welder/Sheetmetal Mechanic AA 1 1 Yard Scrubber Equipt Operator 1 1
Maintenance Total 363 372 Salaried Administrative Assistant 1
Administrative Coordinator 1 1 Assistant Director of Maintenance 1 1 Assistant Director of Transportation ‐ 1 Asst Transp Superintendent 8 9 Chief Operating Officer 1 1 Director of Maintenance 1 1 Director of Safety and Security ‐ 1 Director of Transportation 1 1 Electronic Systems Supervisor 1 1 Facilities Maintenance Manager 1 1 Facilities Maintenance Suprvsr 3 4 Maintenance Superintendent 4 4 Maintenance Supervisor 21 21 Maintenance Technical Supervsr 4 4 Management Analyst 1 1 Mgr of Safety & Envrnmtal Engr 1 2 Ops Data Syst Administrator 1 1
92

FY2015/16 Authorized Positions by Department6/10/2015
Department Pay Group Job Title
Authorized FTEs FY14/15 @ Mid‐Year
Authorized FTEs FY15/16
Protective Services Manager 1 ‐ Safety Administrator 1 1 Safety Representative 1 1 Senior Administrative Asst. 2 2 Senior Maintenance Supervisor 3 3 Sr. Transportation Supervisor 2 2 Technical Services Manager 1 1 Training & Education Asst Mgr 2 2 Training And Education Mgr 1 1 Training Instructor 6 8 Transit Office Manager 3 3 Transportation Superintendent 4 4 Transportation Supervisor 46 47 Transportation Supervisor Asst 8 8
Salaried Total 131 139 Bus Operators Total 1,196 1,236
Operations Total 1,723 1,780
93

94

Transportation
95

96

DEPARTMENT FUNCTION
OPERATING BUDGET
Labor Costs
Mgmt/Tech/Office support 17 1,435,021 19 1,534,294Clerical 29 1,930,184 29 2,131,954Maintenance - - - - Operators 1196 61,955,845 1236 69,776,501Net Salaries and Wages 1242 65,321,050 1284 73,442,748
Fringe Benefits costs 68,464,575 81,340,350
Total Labor Costs 1242 133,785,625 1284 154,783,098
Non-Labor Costs
Physicals 23,041 - Vehicle Licence & Registration 8,000 8,000 Materials and Supplies 90,084 98,584 Other Activities and Programs 11,887 12,251
Total Non-Labor Costs 133,012 118,835
Total Operating Budget 133,918,635 154,901,933
FY 2015-16
TRANSPORTATION
FY 2014-15Mid Year Working
HeadcountMid Year
Working Budget
The Transportation Department is responsible for the delivery of transit service to the public, including supervision of full-time and part-time operators, revenue vehicle control, and the dispatching of the District's bus fleet at three operating facilities.
Authorized Headcount Adopted Budget
97

FY15/16 Budget DevelopmentTotal Transportation6/10/2015
Category Account Account Name FYE 13/14 ActualsFY14/15 Mid‐Year
BudgetFY15/16 Adopted
BudgetS&W 50101 Operators Regular Time 49,475,072 52,508,209 59,653,517
50105 Operators Premium Time 8,128,476 8,426,264 9,088,52450106 Operators Holiday Time 928,825 1,021,372 1,034,46050110 Maintenance Regular Time 9,55050120 Clerical Regular Time 1,651,549 1,684,577 1,737,12950125 Clerical Overtime 233,857 208,179 360,00050126 Clerical Holiday Time 36,732 37,428 34,82550130 Salaried Regular Time 1,270,648 1,415,038 1,495,29450135 Salaried Overtime 25,193 19,983 39,000
S&W Total 61,759,901 65,321,049 73,442,748Fringe Benefits 67,114,222 68,464,575 81,340,350Services 50320 Physicals 102,185 23,041 0
50360 Printing Services 3,845 7,201 7,201Services Total 106,031 30,242 7,201Materials & Supplies 50404 Brakes‐Brake Lining 0
50407 Electrical 132 0 050443 Hardware 37 (0) 050444 Shop Materials 3,448 0 050445 Clean/Paint Supplies 9,405 12,608 12,60850451 GFI Genfare Farebox Materials 0 30 3050460 Stationery Supplies 41,060 41,928 41,92850461 Office Furn/Equip < $1,000 0 8,50050462 Postage 1,259 1,200 1,20050463 Printing Supplies 250 1,150 1,15050468 Timetables 13,077 28,000 28,00050474 Safety/Medical Supplies 21 9 950475 Coveralls & Coats 110 0 050495 Misc Supplies 5,204 5,159 5,159
Materials & Supplies Total 74,004 90,084 98,584
98

FY15/16 Budget DevelopmentTotal Transportation6/10/2015
Category Account Account Name FYE 13/14 ActualsFY14/15 Mid‐Year
BudgetFY15/16 Adopted
BudgetLiability 50641 Casualty/Liability Costs 0 0 0
50642 Property Damage 0 0Liability Total 0 0 0Taxes 50705 Vehicle License and Registration 7,849 8,000 8,000
Taxes Total 7,849 8,000 8,000Miscellaneous 50901 Dues and Subscriptions 4,125 4,616 4,980
50905 Travel and Meetings 70 7050920 Fines & Penalties 81 0 0
Miscellaneous Total 4,206 4,686 5,050Expense Transfer 51005 Labor Contra to Capital (3,121) 0 0
Expense Transfer Total (3,121) 0 0Interest Expense 51105 Interest Expense 0 0
Interest Expense Total 0 0Grand Total 129,063,092 133,918,635 154,901,933
99

FY2015/16 Authorized Positions by Department6/10/2015
Department Pay Group Job Title
Authorized FTEs FY14/15 @ Mid‐
Year Authorized FTEs
FY15/16
Transportation Clerical Chief Dispatcher 3 3 Dispatcher 15 15 Division Clerk 3 3 Lead Timekeeper 1 1 Mail Clerk 1 1 Senior Administrative Clerk 2 2 Senior Typist Clerk 1 1 Timekeeper 3 3
Clerical Total 29 29 Asst Transp Superintendent 8 9 Assistant Director of Transportation ‐ 1 Director of Transportation 1 1 Senior Administrative Asst. 1 1 Transit Office Manager 3 3 Transportation Superintendent 4 4
Salaried Total 17 19 Bus Operators Total 1,196 1,236
Transportation Total 1,242 1,284
100

Maintenance
101

102
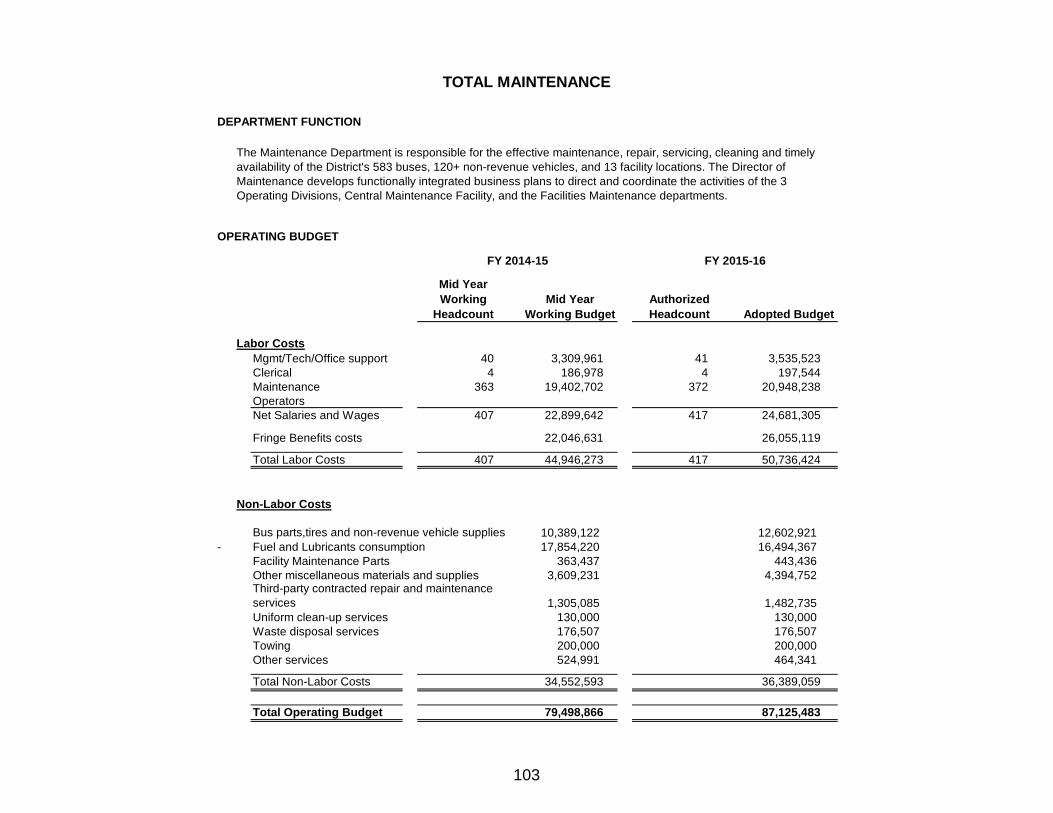
DEPARTMENT FUNCTION
OPERATING BUDGET
Labor CostsMgmt/Tech/Office support 40 3,309,961 41 3,535,523Clerical 4 186,978 4 197,544Maintenance 363 19,402,702 372 20,948,238OperatorsNet Salaries and Wages 407 22,899,642 417 24,681,305
Fringe Benefits costs 22,046,631 26,055,119
Total Labor Costs 407 44,946,273 417 50,736,424
Non-Labor Costs
10,389,122 12,602,921 - Fuel and Lubricants consumption 17,854,220 16,494,367
Facility Maintenance Parts 363,437 443,436 Other miscellaneous materials and supplies 3,609,231 4,394,752
1,305,085 1,482,735 Uniform clean-up services 130,000 130,000 Waste disposal services 176,507 176,507 Towing 200,000 200,000 Other services 524,991 464,341
Total Non-Labor Costs 34,552,593 36,389,059
Total Operating Budget 79,498,866 87,125,483
Bus parts,tires and non-revenue vehicle supplies
Third-party contracted repair and maintenance services
TOTAL MAINTENANCE
Authorized Headcount Adopted Budget
FY 2014-15
Mid Year Working
HeadcountMid Year
Working Budget
The Maintenance Department is responsible for the effective maintenance, repair, servicing, cleaning and timely availability of the District's 583 buses, 120+ non-revenue vehicles, and 13 facility locations. The Director of Maintenance develops functionally integrated business plans to direct and coordinate the activities of the 3 Operating Divisions, Central Maintenance Facility, and the Facilities Maintenance departments.
FY 2015-16
103

FY15/16 Budget DevelopmentTotal Maintenance6/10/2015
Category Account Account Name FYE 13/14 ActualsFY14/15 Mid‐Year
BudgetFY15/16 Adopted
BudgetS&W 50110 Maintenance Regular Time 16,027,735 17,942,697 19,453,140
50115 Maintenance Overtime 730,886 1,275,349 1,339,11650116 Maintenance Holiday Time 145,117 184,656 155,98250120 Clerical Regular Time 203,862 179,978 186,10050125 Clerical Overtime 18,458 7,000 7,35050126 Clerical Holiday Time 5,558 0 4,09450130 Salaried Regular Time 3,124,042 3,283,961 3,535,52350136 Salaried Holiday Time 0 26,00050150 Indirect Cost Account 0
S&W Total 20,255,658 22,899,642 24,681,305Fringe Benefits 22,025,555 22,046,631 26,055,119Services 50308 Professional and Technical Services 120,550 167,350 0
50320 Physicals 14,259 0 050342 Outside Repair Services 478,352 581,147 658,79750345 Contract Maintenance Services 576,895 723,938 823,93850357 Outside Training Services 19,415 25,000 25,00050360 Printing Services 5,256 9,129 9,12950375 Laundry 53,448 130,000 130,00050380 Towing 219,620 200,000 200,000
Services Total 1,487,794 1,836,564 1,846,864Materials & Supplies 50401 Front Axle 31,800 43,805 43,805
50402 Rear Axle 345,505 315,835 315,83550404 Brakes‐Brake Lining 1,265,453 1,223,172 1,173,17250405 Clutch 050406 Cooling System 800,911 788,146 858,14650407 Electrical 819,701 894,710 864,71050408 Engine 1,215,293 1,567,915 1,667,91450411 Frame 5,944 1,577 1,57750412 Fuel System 1,023,068 1,295,617 1,235,61750414 Air Suspension 238,584 320,419 300,419
104

FY15/16 Budget DevelopmentTotal Maintenance6/10/2015
Category Account Account Name FYE 13/14 ActualsFY14/15 Mid‐Year
BudgetFY15/16 Adopted
Budget50416 Steering 159,132 148,296 148,29750417 Transmission 1,121,529 967,974 1,017,97450418 Propeller Shaft 124,957 148,014 148,01450419 Wheel‐Bearings 56,032 55,506 55,50750421 Passenger Seats 504 1,931 1,93150424 Body Parts 1,611,295 1,826,919 4,050,71750425 Glass & Plastics 393 4,032 4,03250426 Air Conditioning 167,553 145,008 145,00750430 Air Brake/Door Control 428,583 543,027 473,02750432 Ball/Roll/Idle Bearings 744 1,525 1,52450434 Gaskets 0 050435 Fuel/Oil/Water Elements 56,957 61,078 61,07950436 Flex Lines & Fitting 15,791 34,979 34,97950437 Gasoline 319,498 360,000 333,75050438 Diesel Fuel 16,002,033 16,398,055 14,785,15250439 Motor Oil 351,644 385,474 577,22450440 Automotive 87,380 119,202 119,20250441 Tire & Tubes‐Coaches 2,658,272 2,298,995 2,942,99450442 Tires/Tubes 13,406 19,443 19,44350443 Hardware 447,593 430,145 485,14450444 Shop Materials 60,167 70,821 70,82150445 Clean/Paint Supplies 445,408 253,203 448,20350446 MFG Equip/Tools < $1,000 5,430 5,136 5,13650447 Lubricants 201,665 210,691 198,24150448 Hydrogen Fuel 484,927 500,000 600,00050450 Building Supplies 80,072 62,584 62,58450451 GFI Genfare Farebox Materials 17,758 55,224 55,22450453 Elec Dest Sign Mtls 55,164 85,109 65,10950455 E & H Lift Material 144,758 167,917 167,91850457 Radio Parts 126,069 103,533 103,533
105
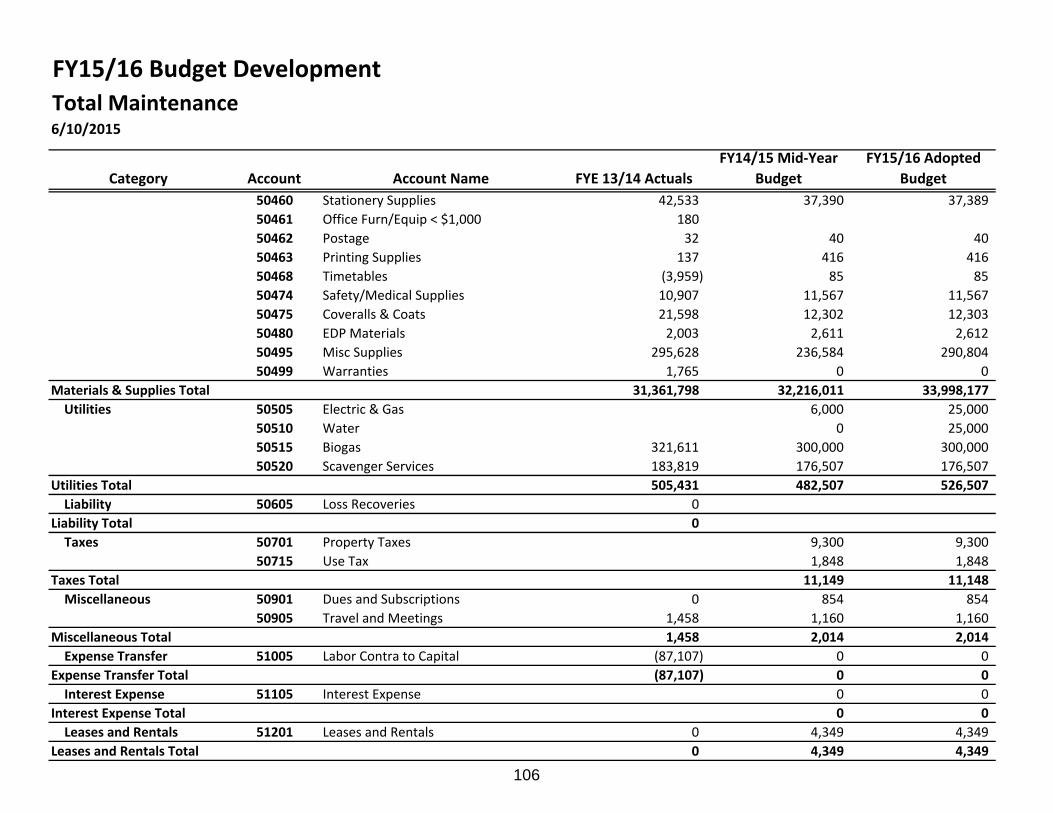
FY15/16 Budget DevelopmentTotal Maintenance6/10/2015
Category Account Account Name FYE 13/14 ActualsFY14/15 Mid‐Year
BudgetFY15/16 Adopted
Budget50460 Stationery Supplies 42,533 37,390 37,38950461 Office Furn/Equip < $1,000 18050462 Postage 32 40 4050463 Printing Supplies 137 416 41650468 Timetables (3,959) 85 8550474 Safety/Medical Supplies 10,907 11,567 11,56750475 Coveralls & Coats 21,598 12,302 12,30350480 EDP Materials 2,003 2,611 2,61250495 Misc Supplies 295,628 236,584 290,80450499 Warranties 1,765 0 0
Materials & Supplies Total 31,361,798 32,216,011 33,998,177Utilities 50505 Electric & Gas 6,000 25,000
50510 Water 0 25,00050515 Biogas 321,611 300,000 300,00050520 Scavenger Services 183,819 176,507 176,507
Utilities Total 505,431 482,507 526,507Liability 50605 Loss Recoveries 0
Liability Total 0Taxes 50701 Property Taxes 9,300 9,300
50715 Use Tax 1,848 1,848Taxes Total 11,149 11,148Miscellaneous 50901 Dues and Subscriptions 0 854 854
50905 Travel and Meetings 1,458 1,160 1,160Miscellaneous Total 1,458 2,014 2,014Expense Transfer 51005 Labor Contra to Capital (87,107) 0 0
Expense Transfer Total (87,107) 0 0Interest Expense 51105 Interest Expense 0 0
Interest Expense Total 0 0Leases and Rentals 51201 Leases and Rentals 0 4,349 4,349
Leases and Rentals Total 0 4,349 4,349
106
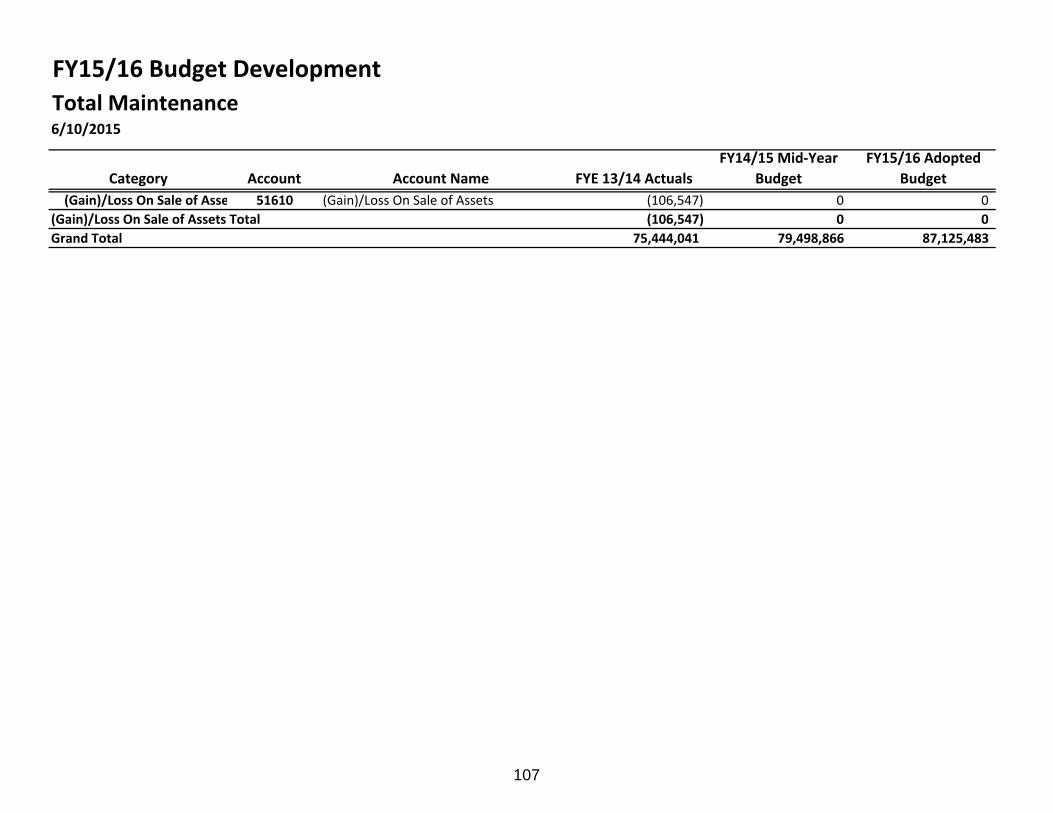
FY15/16 Budget DevelopmentTotal Maintenance6/10/2015
Category Account Account Name FYE 13/14 ActualsFY14/15 Mid‐Year
BudgetFY15/16 Adopted
Budget(Gain)/Loss On Sale of Asse 51610 (Gain)/Loss On Sale of Assets (106,547) 0 0
(Gain)/Loss On Sale of Assets Total (106,547) 0 0Grand Total 75,444,041 79,498,866 87,125,483
107

FY15/16 Budget DevelopmentFleet Maintenance6/10/2015
Category Account Account Name FYE 13/14 ActualsFY14/15 Mid‐Year
BudgetFY15/16 Adopted
BudgetS&W 50110 Maintenance Regular Time 14,422,607 16,251,473 17,491,677
50115 Maintenance Overtime 660,548 1,154,722 1,212,45850116 Maintenance Holiday Time 143,771 183,603 154,95650120 Clerical Regular Time 202,481 179,978 186,10050125 Clerical Overtime 18,458 6,000 6,30050126 Clerical Holiday Time 5,558 0 4,09450130 Salaried Regular Time 2,409,024 2,475,280 2,589,36850136 Salaried Holiday Time 0 26,00050150 Indirect Cost Account 0
S&W Total 17,862,447 20,277,056 21,644,952Fringe Benefits 19,678,916 19,687,344 22,987,196Services 50320 Physicals 0 0 0
50342 Outside Repair Services 20,324 55,838 55,83850345 Contract Maintenance Services 174,370 248,540 248,54050360 Printing Services 1,868 3,797 3,797
Services Total 196,561 308,175 308,175Materials & Supplies 50401 Front Axle 31,800 43,805 43,805
50402 Rear Axle 345,505 315,835 315,83550404 Brakes‐Brake Lining 1,265,453 1,223,172 1,173,17250405 Clutch 050406 Cooling System 800,896 788,115 858,11450407 Electrical 818,995 894,516 864,51650408 Engine 1,215,293 1,567,915 1,667,91450411 Frame 5,944 1,577 1,57750412 Fuel System 1,023,146 1,295,617 1,235,61750414 Air Suspension 238,584 320,419 300,41950416 Steering 159,132 148,296 148,29750417 Transmission 1,121,529 967,974 1,017,97450418 Propeller Shaft 124,957 148,014 148,014
108

FY15/16 Budget DevelopmentFleet Maintenance6/10/2015
Category Account Account Name FYE 13/14 ActualsFY14/15 Mid‐Year
BudgetFY15/16 Adopted
Budget50419 Wheel‐Bearings 56,032 55,506 55,50750421 Passenger Seats 504 1,931 1,93150424 Body Parts 1,611,097 1,826,792 4,050,59050425 Glass & Plastics 393 4,032 4,03250426 Air Conditioning 167,553 145,008 145,00750430 Air Brake/Door Control 428,583 543,027 473,02750432 Ball/Roll/Idle Bearings 744 1,525 1,52450434 Gaskets 0 050435 Fuel/Oil/Water Elements 56,957 61,078 61,07950436 Flex Lines & Fitting 15,774 34,969 34,97050437 Gasoline 319,498 360,000 333,75050438 Diesel Fuel 16,000,920 16,398,055 14,785,15250439 Motor Oil 351,644 381,000 572,75050440 Automotive 87,380 119,202 119,20250441 Tire & Tubes‐Coaches 0 31,063 31,06250442 Tires/Tubes 13,406 19,443 19,44350443 Hardware 109,991 144,949 144,94850444 Shop Materials 57,336 70,821 70,82150445 Clean/Paint Supplies 424,322 253,203 423,20350446 MFG Equip/Tools < $1,000 5,430 5,136 5,13650447 Lubricants 188,928 207,000 194,55050448 Hydrogen Fuel 484,927 500,000 600,00050450 Building Supplies 13,720 5,173 5,17350451 GFI Genfare Farebox Materials 17,754 54,608 54,60750453 Elec Dest Sign Mtls 55,164 85,109 65,10950455 E & H Lift Material 144,758 167,770 167,77150457 Radio Parts 126,069 103,533 103,53350460 Stationery Supplies 35,187 25,855 25,85450461 Office Furn/Equip < $1,000 180
109
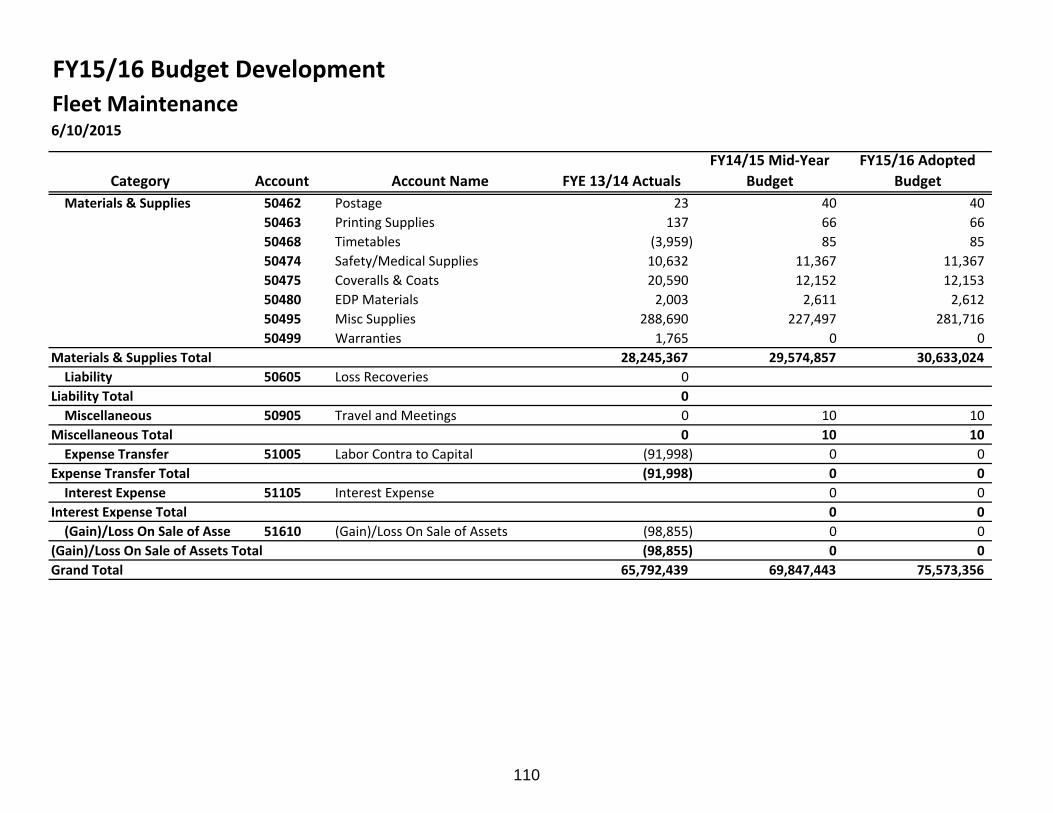
FY15/16 Budget DevelopmentFleet Maintenance6/10/2015
Category Account Account Name FYE 13/14 ActualsFY14/15 Mid‐Year
BudgetFY15/16 Adopted
BudgetMaterials & Supplies 50462 Postage 23 40 40
50463 Printing Supplies 137 66 6650468 Timetables (3,959) 85 8550474 Safety/Medical Supplies 10,632 11,367 11,36750475 Coveralls & Coats 20,590 12,152 12,15350480 EDP Materials 2,003 2,611 2,61250495 Misc Supplies 288,690 227,497 281,71650499 Warranties 1,765 0 0
Materials & Supplies Total 28,245,367 29,574,857 30,633,024Liability 50605 Loss Recoveries 0
Liability Total 0Miscellaneous 50905 Travel and Meetings 0 10 10
Miscellaneous Total 0 10 10Expense Transfer 51005 Labor Contra to Capital (91,998) 0 0
Expense Transfer Total (91,998) 0 0Interest Expense 51105 Interest Expense 0 0
Interest Expense Total 0 0(Gain)/Loss On Sale of Asset 51610 (Gain)/Loss On Sale of Assets (98,855) 0 0
(Gain)/Loss On Sale of Assets Total (98,855) 0 0Grand Total 65,792,439 69,847,443 75,573,356
110

FY15/16 Budget DevelopmentFacilities Maintenance6/10/2015
Category Account Account Name FYE 13/14 ActualsFY14/15 Mid‐Year
BudgetFY15/16 Adopted
BudgetS&W 50110 Maintenance Regular Time 1,503,576 1,552,624 1,815,210
50115 Maintenance Overtime 68,854 120,627 126,65850116 Maintenance Holiday Time 1,346 1,054 1,02750120 Clerical Regular Time 1,38150125 Clerical Overtime 0 1,000 1,05050130 Salaried Regular Time 339,389 354,977 443,13150150 Indirect Cost Account 0
S&W Total 1,914,547 2,030,281 2,387,075Fringe Benefits 1,894,079 1,923,589 2,434,810Services 50308 Professional and Technical Services 20,550 167,350 0
50342 Outside Repair Services 370,404 375,309 452,95950345 Contract Maintenance Services 158,379 175,398 175,39850360 Printing Services 592 332 332
Services Total 549,926 718,389 628,689Materials & Supplies 50406 Cooling System 15 32 32
50407 Electrical 702 194 19450408 Engine 0 050412 Fuel System (78) 0 050424 Body Parts 102 127 12750436 Flex Lines & Fitting 18 9 950437 Gasoline 050438 Diesel Fuel 1,112 0 050439 Motor Oil 0 4,474 4,47450443 Hardware 337,188 285,196 340,19650444 Shop Materials 2,826 0 050445 Clean/Paint Supplies 21,057 0 25,00050447 Lubricants 12,737 3,691 3,69150450 Building Supplies 66,353 57,411 57,41150451 GFI Genfare Farebox Materials 0 617 61750455 E & H Lift Material 0 147 147
111

FY15/16 Budget DevelopmentFacilities Maintenance6/10/2015
Category Account Account Name FYE 13/14 ActualsFY14/15 Mid‐Year
BudgetFY15/16 Adopted
BudgetMaterials & Supplies 50460 Stationery Supplies 424 2,750 2,750
50462 Postage 950463 Printing Supplies 0 350 35050474 Safety/Medical Supplies 250 200 20050475 Coveralls & Coats 1,008 150 15050495 Misc Supplies 6,876 8,088 8,088
Materials & Supplies Total 450,596 363,437 443,436Utilities 50505 Electric & Gas 6,000 25,000
50510 Water 0 25,00050515 Biogas 321,611 300,000 300,00050520 Scavenger Services 183,819 176,507 176,507
Utilities Total 505,431 482,507 526,507Taxes 50701 Property Taxes 9,300 9,300
50715 Use Tax 1,848 1,848Taxes Total 11,149 11,148Miscellaneous 50901 Dues and Subscriptions 0 854 854
Miscellaneous Total 0 854 854Expense Transfer 51005 Labor Contra to Capital (214) 0 0
Expense Transfer Total (214) 0 0Interest Expense 51105 Interest Expense 0 0
Interest Expense Total 0 0Leases and Rentals 51201 Leases and Rentals 0 4,349 4,349
Leases and Rentals Total 0 4,349 4,349Grand Total 5,314,364 5,534,555 6,436,869
112

FY2015/16 Authorized Positions by Department6/10/2015
Department Pay Group Job Title
Authorized FTEs FY14/15 @ Mid‐
Year Authorized FTEs
FY15/16
Fleet & Facilities Maintenance Clerical Div Senior Clerk/Maintenance 4 4 Clerical Total 4 4 Maintenance Apprentice Mechanic 16 16
Apprentice Mentor 1 1 Body Mechanic B 1 1 Body/Frame Mechanic 3 3 Electrician 4 4 Electronic Support Worker 1 1 Facilities Maintenance Trainer 1 1 Frame/Body Mechanic 1 1 Hvac Technician 2 2 Janitor 13 16 Journey Facil Mtce Mechanic 9 9 Journey Level Mechanic 129 132 Lift Mechanic 5 5 Machinist 4 4 Maintenance Trainer 6 6 Mechanic A / Unit Room 14 14 Painter A 3 3 Pre‐Apprentice Mechanic ‐ OTC 3 3 Qualified Temp Service Emp 7 7 Qualified Temporary Janitor 2 2 Senior Body Mechanic 26 26 Senior Electronic Technician 19 20 Service Employee 80 82 Small & Med Duty Veh Mechanic 4 4 Upholsterer A 5 5 Waste Clean Up Worker 1 1
113

FY2015/16 Authorized Positions by Department6/10/2015
Department Pay Group Job Title
Authorized FTEs FY14/15 @ Mid‐
Year Authorized FTEs
FY15/16
Welder/Sheetmetal Mechanic A 1 1 Welder/Sheetmetal Mechanic AA 1 1 Yard Scrubber Equipt Operator 1 1
Maintenance Total 363 372 Salaried Administrative Coordinator 1 1
Assistant Director of Maintenance 1 1 Director of Maintenance 1 1 Electronic Systems Supervisor 1 1 Facilities Maintenance Manager 1 1 Facilities Maintenance Suprvsr 3 4 Maintenance Superintendent 4 4 Maintenance Supervisor 21 21 Maintenance Technical Supervsr 4 4 Senior Maintenance Supervisor 3 3
Salaried Total 40 41 Fleet & Facilities Maintenance Total 407 417
114

PLANNING,
ENGINEERING & CONSTRUCTION


Planning, Engineering & Construction
As of April 2015
Chief Planning, Engineering & Construction Officer
(Vacant)
Engineering & Design
Dennis Butler, Dir.Cap Prj
BRT Project
David Wilkins, Director
Legislative Affairs & Community Relations
Beverly Greene, Director
Sr. Project Manager (3)
Project Manager (3)
Sr. Project Manager (2)
Project Manager (1)
Executive Administrative Assistant (.5) Vacant (.5)
Service Planning
Robert del Rosario, Director
Administrative Coordinator (1)
Schedule Implement.
Transit Schedules Manager
Traffic Engineer (1)
Planning Data Administrator (2)
Long Range Planning Trans Planning Manager
External Affairs Representative (3)
Traffic/Schedule Administrator (1)
Accessible Services Specialist (1)
Sr. Transportation Planner (2)
Sr. Transportation Planner (3)
Transportation Planner (2)
Sr. Admin. Assistant (1)
Service Planning/GIS
Bus Stop Maint Worker (4)
Scheduling Data Administrator (1)
Transit Projects Supervisor (1)
Sr. Schedule Analyst (3)
Sr. Typist Clerk (1)
Project Controls & Systems Analysis
John Haenftling, Director
Manager of Systems Analysis
Statistical Data & Info Analyst (1)
Project Coordinator (2)
Project Controls Administrator (1)
Sr. Admin Assistant (1)
Accessible Services Manager
Transportation Planner (1)
117
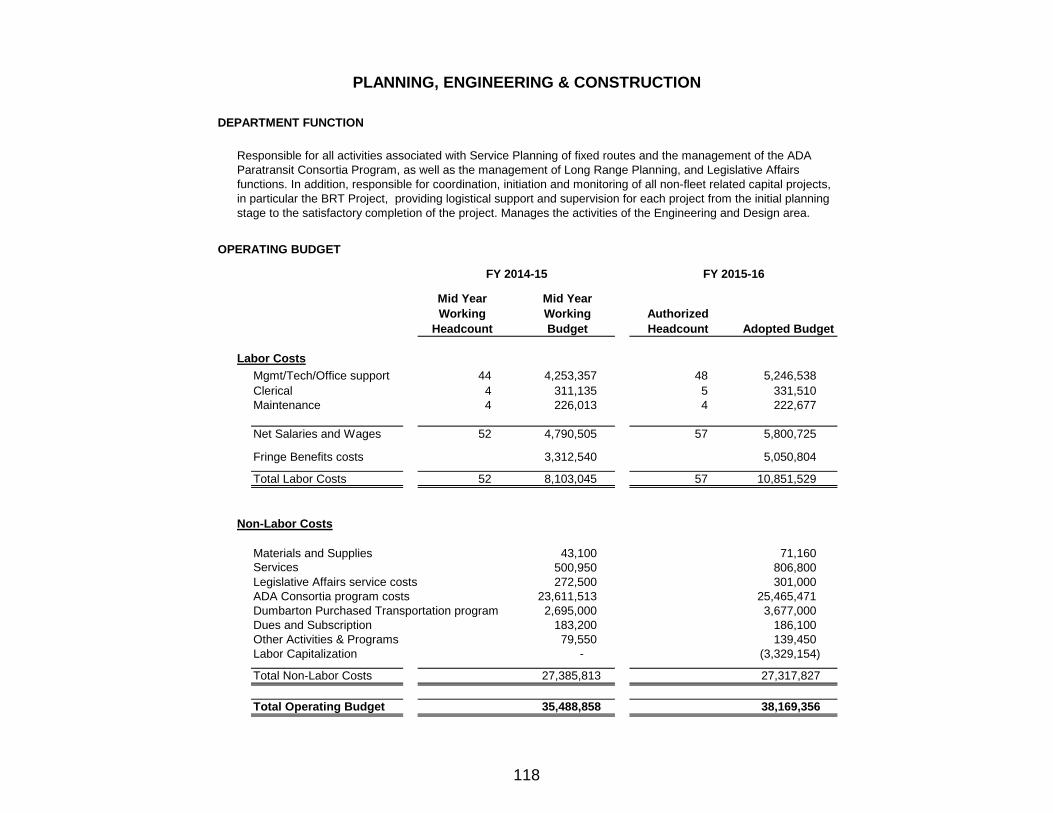
DEPARTMENT FUNCTION
OPERATING BUDGET
Labor CostsMgmt/Tech/Office support 44 4,253,357 48 5,246,538 Clerical 4 311,135 5 331,510 Maintenance 4 226,013 4 222,677
Net Salaries and Wages 52 4,790,505 57 5,800,725
Fringe Benefits costs 3,312,540 5,050,804
Total Labor Costs 52 8,103,045 57 10,851,529
Non-Labor Costs
Materials and Supplies 43,100 71,160 500,950 806,800
Legislative Affairs service costs 272,500 301,000 ADA Consortia program costs 23,611,513 25,465,471 Dumbarton Purchased Transportation program 2,695,000 3,677,000 Dues and Subscription 183,200 186,100 Other Activities & Programs 79,550 139,450 Labor Capitalization - (3,329,154)
Total Non-Labor Costs 27,385,813 27,317,827
Total Operating Budget 35,488,858 38,169,356
Services
PLANNING, ENGINEERING & CONSTRUCTION
Authorized Headcount Adopted Budget
FY 2014-15
Mid Year Working
Headcount
Mid Year Working Budget
Responsible for all activities associated with Service Planning of fixed routes and the management of the ADA Paratransit Consortia Program, as well as the management of Long Range Planning, and Legislative Affairs functions. In addition, responsible for coordination, initiation and monitoring of all non-fleet related capital projects, in particular the BRT Project, providing logistical support and supervision for each project from the initial planning stage to the satisfactory completion of the project. Manages the activities of the Engineering and Design area.
FY 2015-16
118

FY15/16 Budget DevelopmentPlanning, Engineering & Construction6/10/2015
Category Account Account Name FYE 13/14 ActualsFY14/15 Mid‐Year
BudgetFY15/16 Adopted
BudgetS&W 50110 Maintenance Regular Time 81,083 211,013 222,677
50115 Maintenance Overtime 3,508 15,00050120 Clerical Regular Time 321,685 291,135 311,51050125 Clerical Overtime 21,839 20,000 20,00050130 Salaried Regular Time 3,356,867 4,253,357 5,236,53850135 Salaried Overtime 810 0 10,00050150 Indirect Cost Account 0
S&W Total 3,785,793 4,790,505 5,800,725Fringe Benefits 3,002,477 3,312,540 5,050,804Services 50301 Management Service Fees 185,000 0 80,000
50308 Professional and Technical Services 28,403 413,500 841,00050340 Temporary Help 3,907 34,850 35,00050342 Outside Repair Services 94 6,000 3,00050345 Contract Maintenance Services 34,009 125,000 160,00050357 Outside Training Services 20,819 107,550 160,00050360 Printing Services 52,808 86,550 130,800
Services Total 325,039 773,450 1,409,800Materials & Supplies 50407 Electrical 0
50443 Hardware 14,252 104,000 293,30050446 MFG Equip/Tools < $1,000 9,97550455 E & H Lift Material 2,123 2,500 2,50050460 Stationery Supplies 10,864 18,150 20,05050461 Office Furn/Equip < $1,000 4,032 8,000 12,00050462 Postage 336 1,200 3,02550463 Printing Supplies 0 250 30050468 Timetables 80250495 Misc Supplies 499 5,000 5,010
Materials & Supplies Total 32,908 139,100 346,160Utilities 50515 Biogas 0
119

FY15/16 Budget DevelopmentPlanning, Engineering & Construction6/10/2015
Category Account Account Name FYE 13/14 ActualsFY14/15 Mid‐Year
BudgetFY15/16 Adopted
BudgetUtilities Total 0Taxes 50725 Permits 848
Taxes Total 848Purchased Transportation 50802 Purchased Transport ‐ ADA Consortium 22,283,216 22,573,513 24,497,960
50803 ADA Consortium‐Other 137,612 138,000 67,51150804 Paratransit Miscellaneous Expenses 687,544 900,000 900,00050806 Dumbarton Purchased Transportation 2,971,981 2,599,000 3,100,000
Purchased Transportation Total 26,080,353 26,210,513 28,565,471Miscellaneous 50901 Dues and Subscriptions 36,116 183,200 186,100
50905 Travel and Meetings 16,583 48,950 33,50050910 BART Tickets 325 600 75050960 Ad/Promo Media Fees 21,165 30,000 105,20050990 Other Miscellaneous Expenses 0
Miscellaneous Total 74,188 262,750 325,550Expense Transfer 51005 Labor Contra to Capital (2,487,574) 0 (3,329,154)
Expense Transfer Total (2,487,574) 0 (3,329,154)Leases and Rentals 51201 Leases and Rentals 0
Leases and Rentals Total 0(Gain)/Loss On Sale of Asse 51610 (Gain)/Loss On Sale of Assets (2,294)
(Gain)/Loss On Sale of Assets Total (2,294)Grand Total 30,811,738 35,488,858 38,169,356
120

FY2015/16 Authorized Positions by Department6/10/2015
Department Pay Group Job Title
Authorized FTEs FY14/15 @ Mid‐Year
Authorized FTEs FY15/16
Planning, Engineering & Construction Clerical Senior Schedule Analyst 3 4 Senior Typist Clerk 1 1
Clerical Total 4 5 Maintenance Bus Stop Maintenance Worker 4 4 Maintenance Total 4 4 Salaried Accessible Services Manager 1 1
Accessible Services Specialist 1 1 Administrative Coordinator 1 1 Chief Planning, Eng & Construction Officer 1 1 Dir of Legis Aff & Comm Rel 1 1 Dir of Prj Ctrl & Sys Analysis 1 1 Director of Bus Rapid Transit 1 1 Director of Capital Projects 1 1 Director of Srvc Devl&Planning 1 1 Executive Administrative Asst. 1 1 External Affairs Rep 2 3 Manager of Systems Analysis 1 1 Planning Data Administrator 2 2 Project Controls Administrator 1 2 Project Coordinator 2 2 Project Manager 4 4 Scheduling Data Administrator 1 1 Senior Administrative Asst. 1 1 Senior Project Manager 5 6 Senior Transportation Planner 5 5 Service Planning Manager ‐ 1 Sr. Administrative Assistant 1 1 Statistical Data& Info Analyst 1 1 Traffic & Schedules Admin. 1 1
121

FY2015/16 Authorized Positions by Department6/10/2015
Department Pay Group Job Title
Authorized FTEs FY14/15 @ Mid‐Year
Authorized FTEs FY15/16
Traffic Engineer 1 1 Transit Projects Supervisor 1 1 Transit Schedules Manager 1 1 Transportation Planner 3 3 Transportation Planning Mgr 1 1
Salaried Total 44 48 Planning, Engineering & Construction Total 52 57
122

INFORMATION
SERVICES


Information Services
As of May 2015
Ala meda-Contra Costa Transit District
Chief Information Services Officer
Tom O’Neill
Project Coordinator (1)
Customer Services Manager
Telephone Info Center (Contract)
Administrative Coordinator
(2)
Customer Service Clerk (4),
Lead Clerk (1)
Customer Service
Supervisor (1)
Graphic Arts Computer Typesetter
Printer
Printing Press Operator
Bindery Worker
Marketing & Communications
Director
Marketing & Community Rels
Manager
Marketing Administrator
(4)
Admin Coordinator
Sr. Marketing Rep (2)
Public Info Systems
Coordinator
Public Info Systems Assistant
Print Shop Supervisor
Tele-
communications
Telecom Administrator
(1)
Telecom Coordinator
(1)
Project Management
Information Systems
Project Manager (1)
Project Manager
(1)
Enterprise Network Engineer
(1)
Enterprise Network
Engineering
Network/Serv. Engineer
(2)
Computer Op Support Center
Sr. Network/ PC Analyst
(1)
Network/PC Analyst
(5)
Help Desk Coordinator
(1)
Computer Ops Administrator
(1)
PeopleSoft
ERP Support
Sr. PeopleSoft Engineer
(5)
Software
Engineering
Systems & Software
Development Director
Database Administrator
(4)
Software Engineers
(3)
125

DEPARTMENT FUNCTION
OPERATING BUDGET
Labor CostsMgmt/Tech/Office support 46 4,034,552 51 4,867,670 Clerical 5 294,493 5 237,350 Maintenance 4 178,681 4 189,690
Net Salaries and Wages 55 4,507,726 60 5,294,711
Fringe Benefits costs 3,273,477 4,858,106
Total Labor Costs 55 7,781,203 60 10,152,817
Non-Labor CostsProfessional & Technical Services 2,511,520 1,900,000 Contract Maintenance Services 1,401,000 1,547,600 Temporary Help 20,000 95,000 RTC Contract - Cordoba + Cubic 412,753 412,000 ACC Call Center 276,000 276,000 Other Services 203,000 222,350 Materials & Supplies 497,750 535,450 Telecommunications 713,000 897,000 Other Activities and Programs 176,500 321,200 Print Shop chargebacks (350,000) (350,000)
Total Non-Labor Costs 5,861,523 5,856,600
Total Operating Budget 13,642,726 16,009,416
INFORMATION SERVICES
FY 2014-15
Mid Year Working
HeadcountMid Year
Working Budget
The Chief Information Services Officer is responsible for the Technology, Marketing & Communications, and Customer Service departments. The Technology department builds and maintains AC Transit's data centers and voice & data network, deploys and supports enterprise and desktop computer hardware & software, and manages all wired and wireless telecommunications services. The Marketing & Communications department is responsible for our external communications and messaging: the EasyPass program: public information including displays, publications, the website and 511.org: and includes the Print Shop. The Customer Service department operates the Customer Service Center, supervises the contracted Customer Call Center, investigates customer commendations, complaints & inquiries, supports the Clipper program, and produces and distributes EasyPasses.
Authorized Headcount Adopted Budget
FY 2015-16
126

FY15/16 Budget DevelopmentInformation Services6/10/2015
Category Account Account Name FYE 13/14 ActualsFY14/15 Mid‐Year
BudgetFY15/16 Adopted
BudgetS&W 50110 Maintenance Regular Time 189,088 178,681 189,690
50115 Maintenance Overtime 1,242 050120 Clerical Regular Time 318,277 294,493 237,35050125 Clerical Overtime 6,910 050130 Salaried Regular Time 3,390,064 4,034,552 4,867,67050135 Salaried Overtime 7,115 050136 Salaried Holiday Time 37050150 Indirect Cost Account 0
S&W Total 3,913,066 4,507,726 5,294,711Fringe Benefits 2,986,002 3,273,477 4,858,106Services 50308 Professional and Technical Services 2,380,506 2,787,520 2,176,000
50340 Temporary Help 526,468 20,000 95,00050342 Outside Repair Services 19,790 30,500 38,80050345 Contract Maintenance Services 1,285,861 1,401,000 1,547,60050355 Security Services 2,587 5,000 3,00050357 Outside Training Services 49,909 55,000 75,00050360 Printing Services 98,351 112,500 105,55050390 Other Services 355,908 412,753 412,000
Services Total 4,719,381 4,824,273 4,452,950Materials & Supplies 50406 Cooling System 115 0
50407 Electrical 87 050424 Body Parts 57 050443 Hardware 100,837 77,000 72,10050444 Shop Materials 6 0 20050445 Clean/Paint Supplies 614 0 60050447 Lubricants 18 050450 Building Supplies 3 050451 GFI Genfare Farebox Materials 350460 Stationery Supplies 67,091 61,000 89,150
127

FY15/16 Budget DevelopmentInformation Services6/10/2015
Category Account Account Name FYE 13/14 ActualsFY14/15 Mid‐Year
BudgetFY15/16 Adopted
BudgetMaterials & Supplies 50461 Office Furn/Equip < $1,000 2,224 9,000 14,000
50462 Postage 3,528 5,250 7,30050463 Printing Supplies 177,420 150,000 156,30050468 Timetables 151,780 140,000 165,00050474 Safety/Medical Supplies 2950475 Coveralls & Coats 74 050480 EDP Materials 47,214 30,000 28,00050495 Misc Supplies 20,840 25,500 2,800
Materials & Supplies Total 571,939 497,750 535,450Utilities 50501 Telephone 613,319 713,000 897,000
Utilities Total 613,319 713,000 897,000Miscellaneous 50901 Dues and Subscriptions 315 2,500 2,500
50905 Travel and Meetings 15,008 40,000 40,20050930 Employee Incentive 1,000 1,00050945 Cash Over & Short 0 500 50050960 Ad/Promo Media Fees 97,739 92,500 236,00050991 Misc Marketing Expense (0) 0
Miscellaneous Total 113,062 136,500 280,200Expense Transfer 51002 Functional Expense Reclassifications (327,991) (350,000) (350,000)
51005 Labor Contra to Capital (190,933) 0Expense Transfer Total (518,923) (350,000) (350,000)Leases and Rentals 51201 Leases and Rentals 36,516 40,000 41,000
Leases and Rentals Total 36,516 40,000 41,000Grand Total 12,434,362 13,642,726 16,009,416
128

FY2015/16 Authorized Positions by Department6/10/2015
Department Pay Group Job Title
Authorized FTEs FY14/15 @ Mid‐Year
Authorized FTEs FY15/16
Information Services Clerical Customer Service Clerk 4 4 Lead Customer Service Clerk 1 1
Clerical Total 5 5 Maintenance Bindery Worker 1 1
Graphic Arts/Comput Typesetter 1 1 Printer 1 1 Printing Press Operator 1 1
Maintenance Total 4 4 Salaried Administrative Coordinator 3 3
Chief Information Services Officer 1 1 Computer Operations Administrator 1 1 Customer Services Manager 1 1 Customer Services Supervisor 1 1 Database Administrator 4 4 Director of Systems and Software Development ‐ 1 Enterprise Network Engineer 1 1 Enterprise Software Engineer 1 1 Help Desk Coordinator 1 1 Information Systems ProjectMgr 1 1 Marketing Administrator 4 4 Mktg. & Community Rel. Mgr. 1 2 Mrkt'g & Communicatns Director 1 1 Network/PC Analyst 5 5 Network/Server Administrator ‐ 1 Network/Server Engineer 2 2 Print Shop Supervisor 1 1 Project Coordinator 1 1 Project Manager 1 1 Public Info Systems Coord 1 2
129

FY2015/16 Authorized Positions by Department6/10/2015
Department Pay Group Job Title
Authorized FTEs FY14/15 @ Mid‐Year
Authorized FTEs FY15/16
Public Information SystemsAsst 1 1 Senior Database Administrator ‐ 1 Senior PeopleSoft Engineer 5 5 Software Engineer 3 3 Sr. Marketing Representative 2 2 Sr. Network/PC Analyst 1 1 Telecomm Administrator 1 1 Telecommunications Coord. 1 1
Salaried Total 46 51 Information Services Total 55 60
130

ADMINISTRATIVE
SERVICES


Administrative Services
As of April 2015
Chief Administrative Services Officer Thomas Prescott (Acting)
Sr. Admin. Assistant
Labor Relations Director (vacant)
Human Resources Manager
Duc Le
Human Resources Manager
Elisabeth West
Workers Comp Drug & Alcohol Benefits Labor Relations
Staffing
HRIS/Records
HR Administrator
Administrative Coordinator
Transportation Supervisor
Sr. HR Administrator
HR Analyst
Sr. Admin Assist
Sr. HR Analyst
HR Administrator
HR Analyst (2)
Sr. HRIS Analyst
HR Administrator
Sr. HRIS Analyst
Sr. Admin. Assistant
Labor Relations Administrator
HR Assistant (vacant)
Sr. Admin Clerk (2)
Sr.HR Analyst
Sr. Admin. Clerk
Class/Comp
Sr. Admin. Assistant
Training & Development
Sr. HR
Sr.HR Administrator
HR Assistant
HR Assistant
Sr.HR Administrator
Labor Relations Representative
Leave Management
HR Analyst
133
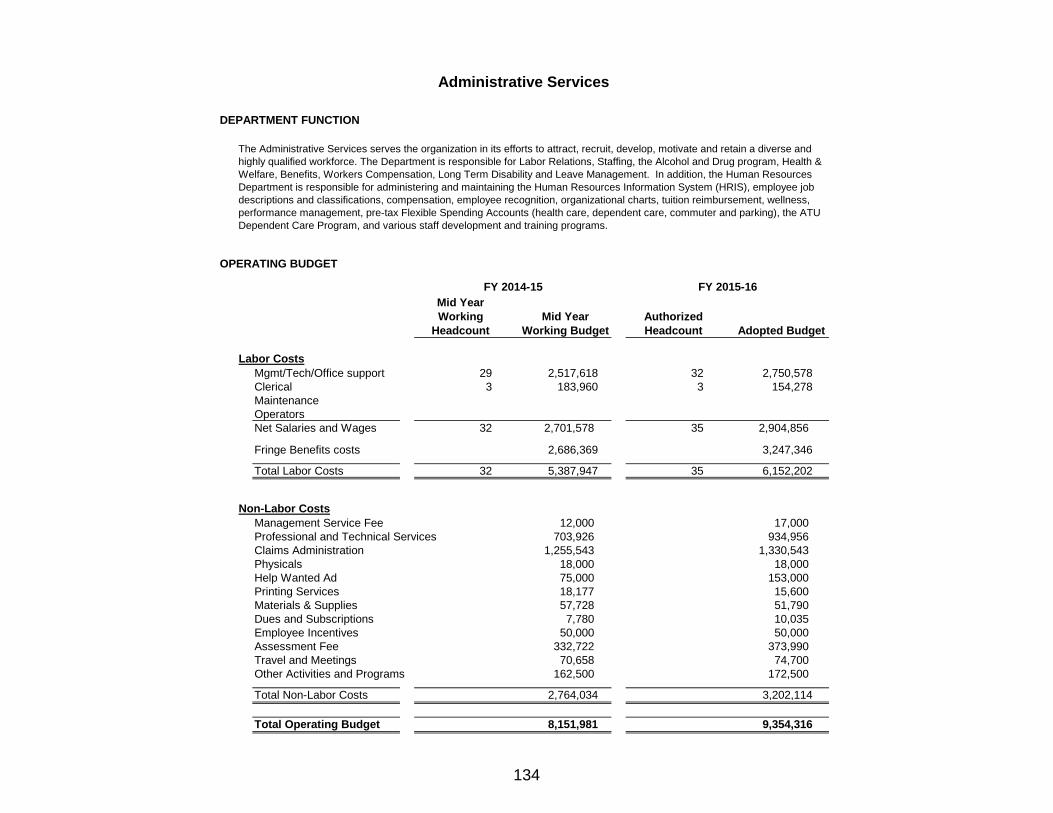
DEPARTMENT FUNCTION
OPERATING BUDGET
Labor CostsMgmt/Tech/Office support 29 2,517,618 32 2,750,578Clerical 3 183,960 3 154,278MaintenanceOperators Net Salaries and Wages 32 2,701,578 35 2,904,856
Fringe Benefits costs 2,686,369 3,247,346
Total Labor Costs 32 5,387,947 35 6,152,202
Non-Labor CostsManagement Service Fee 12,000 17,000 Professional and Technical Services 703,926 934,956 Claims Administration 1,255,543 1,330,543 Physicals 18,000 18,000 Help Wanted Ad 75,000 153,000 Printing Services 18,177 15,600 Materials & Supplies 57,728 51,790 Dues and Subscriptions 7,780 10,035 Employee Incentives 50,000 50,000 Assessment Fee 332,722 373,990 Travel and Meetings 70,658 74,700 Other Activities and Programs 162,500 172,500
Total Non-Labor Costs 2,764,034 3,202,114
Total Operating Budget 8,151,981 9,354,316
Adopted Budget
FY 2015-16
Administrative Services
FY 2014-15Mid Year Working
HeadcountMid Year
Working Budget
The Administrative Services serves the organization in its efforts to attract, recruit, develop, motivate and retain a diverse and highly qualified workforce. The Department is responsible for Labor Relations, Staffing, the Alcohol and Drug program, Health & Welfare, Benefits, Workers Compensation, Long Term Disability and Leave Management. In addition, the Human Resources Department is responsible for administering and maintaining the Human Resources Information System (HRIS), employee job descriptions and classifications, compensation, employee recognition, organizational charts, tuition reimbursement, wellness, performance management, pre-tax Flexible Spending Accounts (health care, dependent care, commuter and parking), the ATU Dependent Care Program, and various staff development and training programs.
Authorized Headcount
134
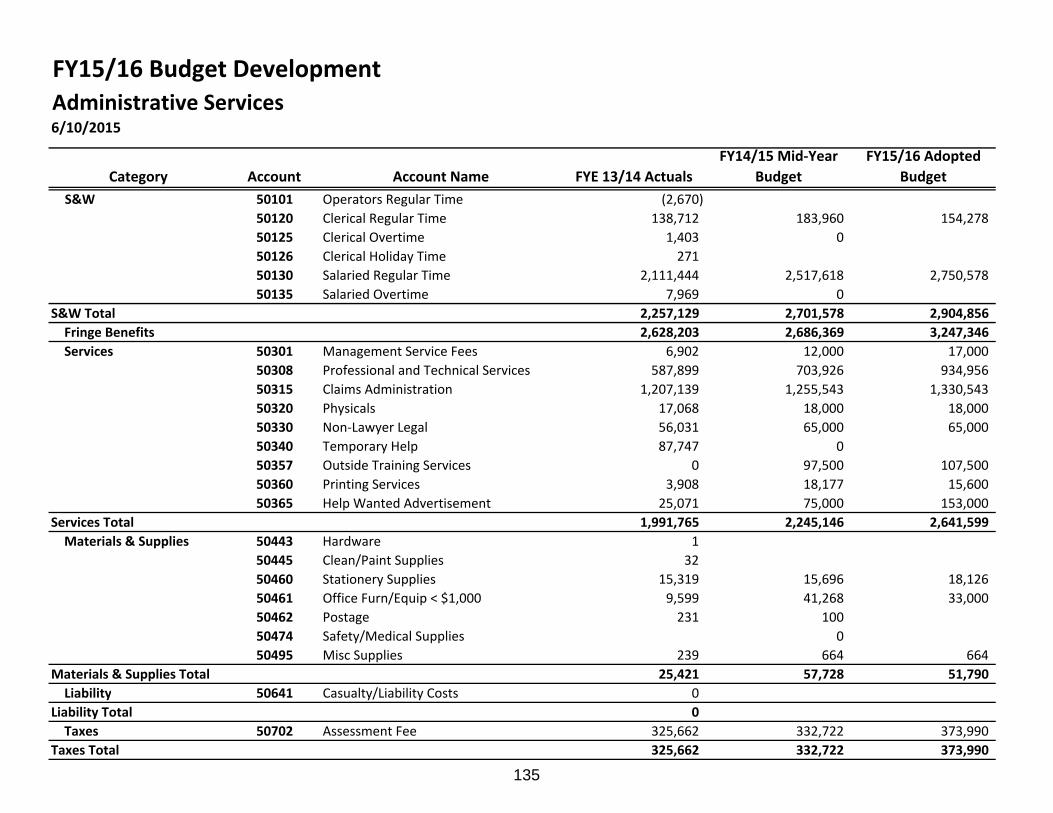
FY15/16 Budget DevelopmentAdministrative Services6/10/2015
Category Account Account Name FYE 13/14 ActualsFY14/15 Mid‐Year
BudgetFY15/16 Adopted
BudgetS&W 50101 Operators Regular Time (2,670)
50120 Clerical Regular Time 138,712 183,960 154,27850125 Clerical Overtime 1,403 050126 Clerical Holiday Time 27150130 Salaried Regular Time 2,111,444 2,517,618 2,750,57850135 Salaried Overtime 7,969 0
S&W Total 2,257,129 2,701,578 2,904,856Fringe Benefits 2,628,203 2,686,369 3,247,346Services 50301 Management Service Fees 6,902 12,000 17,000
50308 Professional and Technical Services 587,899 703,926 934,95650315 Claims Administration 1,207,139 1,255,543 1,330,54350320 Physicals 17,068 18,000 18,00050330 Non‐Lawyer Legal 56,031 65,000 65,00050340 Temporary Help 87,747 050357 Outside Training Services 0 97,500 107,50050360 Printing Services 3,908 18,177 15,60050365 Help Wanted Advertisement 25,071 75,000 153,000
Services Total 1,991,765 2,245,146 2,641,599Materials & Supplies 50443 Hardware 1
50445 Clean/Paint Supplies 3250460 Stationery Supplies 15,319 15,696 18,12650461 Office Furn/Equip < $1,000 9,599 41,268 33,00050462 Postage 231 10050474 Safety/Medical Supplies 050495 Misc Supplies 239 664 664
Materials & Supplies Total 25,421 57,728 51,790Liability 50641 Casualty/Liability Costs 0
Liability Total 0Taxes 50702 Assessment Fee 325,662 332,722 373,990
Taxes Total 325,662 332,722 373,990
135
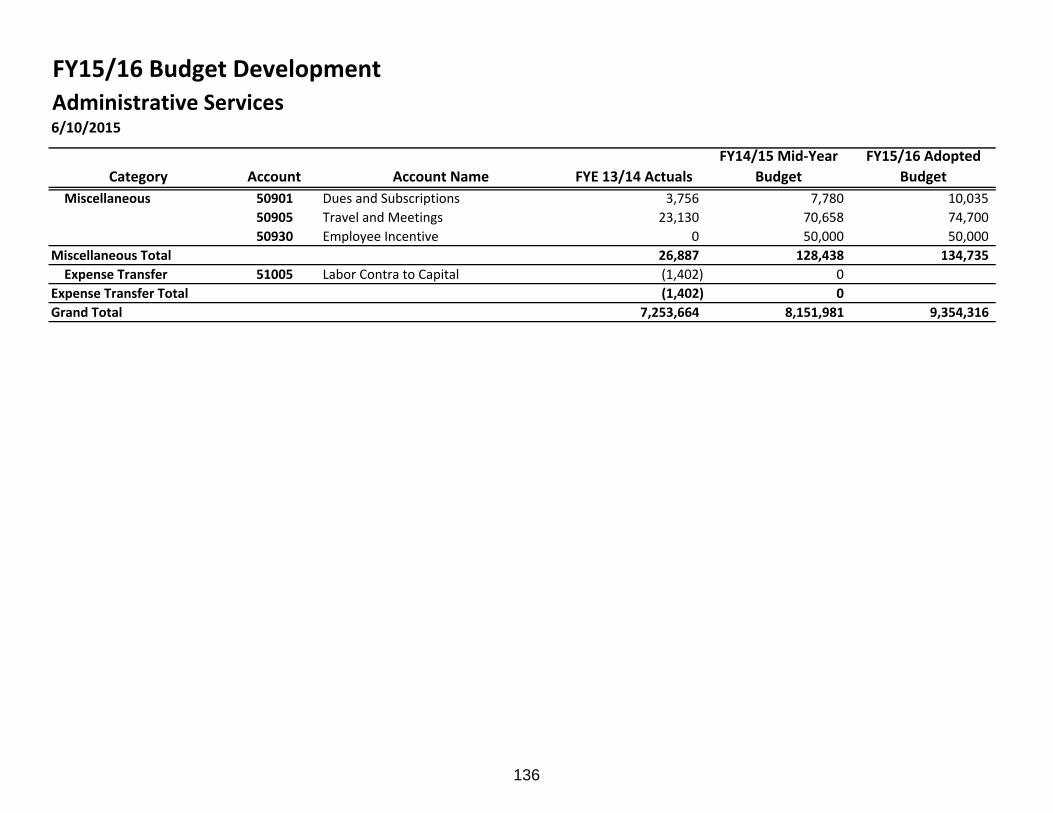
FY15/16 Budget DevelopmentAdministrative Services6/10/2015
Category Account Account Name FYE 13/14 ActualsFY14/15 Mid‐Year
BudgetFY15/16 Adopted
BudgetMiscellaneous 50901 Dues and Subscriptions 3,756 7,780 10,035
50905 Travel and Meetings 23,130 70,658 74,70050930 Employee Incentive 0 50,000 50,000
Miscellaneous Total 26,887 128,438 134,735Expense Transfer 51005 Labor Contra to Capital (1,402) 0
Expense Transfer Total (1,402) 0Grand Total 7,253,664 8,151,981 9,354,316
136

FY2015/16 Authorized Positions by Department6/10/2015
Department Pay Group Job Title
Authorized FTEs FY14/15 @ Mid‐Year
Authorized FTEs FY15/16
Administrative Services Clerical Senior Administrative Clerk 3 3 Clerical Total 3 3 Salaried Administrative Coordinator 1 1
Chief Administrative Services Officer 1 1 Director of Labor Relations 1 1 Human Resources Administrator 3 3 Human Resources Analyst 4 5 Human Resources Assistant 3 2 Human Resources Manager 2 2 Labor Relations Representative 1 1 Labor Relatns Administrator 1 1 Senior Administrative Asst. 4 5 Senior Human Resources Analyst 2 4 Sr HR Info Systems Analyst 2 2 Sr Human Resources Admin 3 3 Transportation Supervisor 1 1
Salaried Total 29 32 Administrative Services Total 32 35
137


FINANCE & DISTRICT
OVERHEAD


Finance
As of May 2015
Chief Financial Officer (Vacant)
Executive Administrative Assistant
Treasury
Sue Lee, Manager
Accounting
Ralph Martini, Controller
OMB - Grants Donald Eckert, Director of
Mgmt & Budget
Sr. Payroll Specialist (1)
Payroll Section Payroll Manager (1)
Accounting Section
Financial Reports Unit
Sr. Financial Analyst (2)
Accounts Payable Sr. Financial Analyst (1)
General Accounting Treasury Administrator (1)
Treasury Operations Support Section
Senior Clerk (1)
Financial Analyst (1)
Financial Analyst (1)
Grants Accounting Fixed Assets
Principal Financial Analyst (1)
Administrative Coordinator
Principal Financial Analyst (1)
Payroll Specialist (5)
Sr. Financial Analyst (2)
Sr. Financial Analyst (1)
Sr. Accounts Clerk (2)
Sr. Financial Analyst (2)
Property Management (Vacant)
Real Estate Manager
Procurement & Materials Jon Medwin, Director of Procurement & Materials
Sr. Buyer (2)
Contracts Specialist (7)
Materials Superintendent
Materials Supervisor (1)
Inventory Control Clerk
(5)
Parts Clerk (19)
Sr. Typist Clerk (1)
Buyer (1)
Contract Services Manager
Procurement Systems
Coordinator (1)
Shipping & Recvng Clerk
(2)
Purchasing Manager
Budget Manager
Grants Manager
Sr. Capital Planning Spec (1)
Sr. Clerk (1)
141

DEPARTMENT FUNCTION
OPERATING BUDGET
Labor CostsMgmt/Tech/Office support 46 3,994,089 49 4,901,268 Clerical 5 223,159 5 231,714 Maintenance 26 1,377,838 26 1,585,135
Net Salaries and Wages 77 5,595,086 80 6,718,117
Fringe Benefits costs 4,365,742 6,124,226
Total Labor Costs 77 9,960,828 80 12,842,343
Non-Labor CostsProfessional & Technical Services 793,000 889,000 Audit Fees 250,000 250,000 Stationary Supplies 68,400 64,378 Postage 86,400 88,321 Transfers Tickets Passes 80,000 80,000 Other Materials & Supplies 668,300 203,535 Bank Charges 50,000 50,000 Other Activities and Programs 170,200 193,510 Clipper 1,000,000 1,000,000
Total Non-Labor Costs 3,166,300 2,818,744
Total Operating Budget 13,127,128 15,661,088
Authorized Headcount
FINANCE
Adopted Budget
Responsible for oversight of the financial operations of the agency including, but not limited to, financial accounting and reporting, budget development and administration, preparation of long-term and short-term financial plans, cash management and debt financing structure, financial compliance reporting, payroll administration, procurement and materials management.
FY 2015-16
Mid Year Working
HeadcountMid Year
Working Budget
FY 2014-15
142

FY15/16 Budget DevelopmentFinance6/10/2015
Category Account Account Name FYE 13/14 ActualsFY14/15 Mid‐Year
BudgetFY15/16 Adopted
BudgetS&W 50110 Maintenance Regular Time 954,913 1,377,838 1,585,135
50115 Maintenance Overtime 68,510 050120 Clerical Regular Time 197,874 223,159 231,71450125 Clerical Overtime 2,33250130 Salaried Regular Time 3,297,009 3,949,089 4,877,51850135 Salaried Overtime 44,200 45,000 22,50050136 Salaried Holiday Time 1,422 0 1,25150150 Indirect Cost Account 0
S&W Total 4,566,260 5,595,086 6,718,117Fringe Benefits 4,218,366 4,365,742 6,124,226Services 50307 CLIPPER Expenses 908,000 1,000,000 1,000,000
50308 Professional and Technical Services 674,018 793,000 889,00050335 Audit Fees 250,000 250,000 250,00050340 Temporary Help 337,252 050342 Outside Repair Services 3,50050345 Contract Maintenance Services 5,000 5,000 5,00050357 Outside Training Services 1,840 23,000 69,74550360 Printing Services 2,330 12,050 12,43350390 Other Services 56,300 55,000 24,000
Services Total 2,234,740 2,138,050 2,253,678Materials & Supplies 50401 Front Axle 649 0
50402 Rear Axle (940) 050404 Brakes‐Brake Lining 9,429 80,00050406 Cooling System 3,480 050407 Electrical 7,649 050408 Engine 2,589 050411 Frame 050412 Fuel System (542) 050414 Air Suspension 6,295 050416 Steering (287) 0
143

FY15/16 Budget DevelopmentFinance6/10/2015
Category Account Account Name FYE 13/14 ActualsFY14/15 Mid‐Year
BudgetFY15/16 Adopted
Budget50417 Transmission 7,070 050418 Propeller Shaft (847) 050419 Wheel‐Bearings 1,278 050424 Body Parts 19,108 460,00050425 Glass & Plastics 92350426 Air Conditioning (2,788) 050430 Air Brake/Door Control 1,717 050432 Ball/Roll/Idle Bearings 21 050435 Fuel/Oil/Water Elements 2,089 050436 Flex Lines & Fitting 3 050437 Gasoline (803)50438 Diesel Fuel (167)50439 Motor Oil (11)50440 Automotive 52 050442 Tires/Tubes (174) 050443 Hardware 704 2,500 53,63650444 Shop Materials 4,605 13,000 13,00050445 Clean/Paint Supplies 5,773 050447 Lubricants (763) 050450 Building Supplies 832 050451 GFI Genfare Farebox Materials 80350453 Elec Dest Sign Mtls 604 050455 E & H Lift Material 1,561 050457 Radio Parts 294 050460 Stationery Supplies 41,511 68,400 64,37850461 Office Furn/Equip < $1,000 6,397 8,200 28,60050462 Postage 65,486 86,400 88,32150463 Printing Supplies 3,706 050468 Timetables (1,084) 050470 Price Variance Expense (13,250)
144

FY15/16 Budget DevelopmentFinance6/10/2015
Category Account Account Name FYE 13/14 ActualsFY14/15 Mid‐Year
BudgetFY15/16 Adopted
BudgetMaterials & Supplies 50471 Inventory Adjustment 638,483 0
50474 Safety/Medical Supplies (1,456) 050475 Coveralls & Coats 1,662 050480 EDP Materials 0 4,500 4,50050490 Standard Price Postings 1,240 100,000 103,50050495 Misc Supplies 7,231 100 30050496 Unallocated Issues 172,70350498 Tranfers Tickets 123,166 80,000 80,00050499 Warranties 6,192 0
Materials & Supplies Total 1,122,194 903,100 436,234Taxes 50705 Vehicle License and Registration 0 3,600 4,400
Taxes Total 0 3,600 4,400Miscellaneous 50901 Dues and Subscriptions 45,492 14,550 21,432
50905 Travel and Meetings 27,268 48,900 34,90050930 Employee Incentive 050960 Ad/Promo Media Fees 9,687 8,000 18,00050970 Bank Charges 36,476 50,000 50,00050990 Other Miscellaneous Expenses 328 100 100
Miscellaneous Total 119,250 121,550 124,432Expense Transfer 51005 Labor Contra to Capital (50,702) 0
Expense Transfer Total (50,702) 0(Gain)/Loss On Sale of Asse 51610 (Gain)/Loss On Sale of Assets 198,390
(Gain)/Loss On Sale of Assets Total 198,390Grand Total 12,408,498 13,127,128 15,661,088
145

FY2015/16 Authorized Positions by Department6/10/2015
Department Pay Group Job Title
Authorized FTEs FY14/15 @ Mid‐Year
Authorized FTEs FY15/16
Finance Clerical Senior Account Clerk 2 2 Senior Clerk 2 2 Senior Typist Clerk 1 1
Clerical Total 5 5 Maintenance Inventory Control Clerk 5 5
Parts Clerk 19 19 Shipping/Receiving Clerk 2 2
Maintenance Total 26 26 Salaried Administrative Coordinator 1 1
Budget Manager 1 1 Buyer 1 1 Chief Financial Officer 1 1 Contracts Services Manager 1 1 Contracts Specialist 7 7 Controller 1 1 Director of Mgmt and Budget 1 1 Executive Administrative Asst. 1 1 Financial Analyst 2 2 Manager Capital Planning & Grants ‐ 1 Materials Superintendent 1 1 Materials Supervisor 1 1 Payroll Manager 1 1 Payroll Specialist 5 4 Payroll Supervisor ‐ 1 Principal Financial Analyst 2 2 Procurement & Matrls Director 1 1 Procurement Systems Coord 1 1 Purchasing Manager 1 1 Real Estate Manager 1 1
146

FY2015/16 Authorized Positions by Department6/10/2015
Department Pay Group Job Title
Authorized FTEs FY14/15 @ Mid‐Year
Authorized FTEs FY15/16
Senior Capital Planning Spec. 2 2 Senior Contract Specialist ‐ 2 Senior Financial Analyst 1 1 Senior Payroll Specialist 1 1 Sr Fin Analyst‐Budget 1 1 Sr Fin Analyst‐Fin Reporting 5 5 Sr Fin Analyst‐FixedAssetGrnts 1 1 Sr. Buyer 2 2 Treasury Administrator 1 1 Treasury Manager 1 1
Salaried Total 46 49 Finance Total 77 80
147

DEPARTMENT FUNCTION
OPERATING BUDGET
Labor CostsMgmt/Tech/Office support - - - - Clerical - - - - Maintenance - - - - Operators - - - - Net Salaries and Wages - - - -
Fringe Benefits costs 14,588,066 5,607,140
Total Labor Costs - 14,588,066 - 5,607,140
Non-Labor CostsManagement Service Fees 435,000 435,000 Professional and Technical Services 40,000 40,000 Outside Training Services 150,000 150,000 Other Services 102,500 50,000 Elections 1,343,000 - Materials and Supplies 1,100,000 910,000 Utilities 1,419,000 1,445,000 Net Remanufactured Inventory (1,875,000) (1,800,000) Labor Contra to Capital (2,000,000) - Loss Recoveries - (530,000) Taxes 2,977,414 2,652,800 Interest Expense 1,139,943 1,037,043 Other Program & Activities 105,000 150,000
Total Non-Labor Costs 4,936,857 4,539,843
Total Operating Budget 19,524,923 10,146,983
Adopted Budget
FY 2015-16
DISTRICT OVERHEAD
FY 2014-15
Mid Year Working
Headcount
Mid Year Working Budget
Administrative expenses not associated with any single program or department and which are incurred in the day-to-day operation of the District, i.e., utilities, taxes, interest, etc., are classed together under the category of District Overhead.
Authorized Headcount
148

FY15/16 Budget DevelopmentDistrict Overhead6/10/2015
Category Account Account Name FYE 13/14 ActualsFY14/15 Mid‐Year
BudgetFY15/16 Adopted
BudgetS&W 50101 Operators Regular Time 0
50110 Maintenance Regular Time 050130 Salaried Regular Time 050150 Indirect Cost Account 0
S&W Total 0 0Fringe Benefits 19,100,234 14,588,066 5,607,140Services 50301 Management Service Fees 378,616 435,000 435,000
50308 Professional and Technical Services 107,538 40,000 40,00050309 Richmond Parkway 26,550 50,000 50,00050317 Outside Attorney 22,35950342 Outside Repair Services 0 40,00050345 Contract Maintenance Services 0 10,00050357 Outside Training Services 150,000 150,00050360 Printing Services 2,063 2,50050390 Other Services 0 050399 PASSTHRU EXPENDITURES 0 0
Services Total 537,126 727,500 675,000Materials & Supplies 50401 Front Axle 7,577 0
50402 Rear Axle 121,656 050404 Brakes‐Brake Lining 1,934 050406 Cooling System 32,961 137,500 105,00050407 Electrical 89,756 137,500 110,00050408 Engine 223,379 375,000 310,00050412 Fuel System 105,668 050414 Air Suspension 2,266 050416 Steering 673 050417 Transmission 369,368 375,000 310,00050418 Propeller Shaft 31,587 050424 Body Parts 2,091 0
149

FY15/16 Budget DevelopmentDistrict Overhead6/10/2015
Category Account Account Name FYE 13/14 ActualsFY14/15 Mid‐Year
BudgetFY15/16 Adopted
Budget50426 Air Conditioning 83 050430 Air Brake/Door Control 27,670 050432 Ball/Roll/Idle Bearings 5,290 050435 Fuel/Oil/Water Elements 2550436 Flex Lines & Fitting 1,724 050437 Gasoline 050439 Motor Oil 050443 Hardware 194 050444 Shop Materials 105 050445 Clean/Paint Supplies 550 050447 Lubricants 56 050450 Building Supplies 54 050463 Printing Supplies 050474 Safety/Medical Supplies 47 050475 Coveralls & Coats 050495 Misc Supplies 23,790 25,000 20,00050497 Freight‐In 54,726 50,000 55,000
Materials & Supplies Total 1,103,232 1,100,000 910,000Utilities 50505 Electric & Gas 1,501,108 1,244,000 1,250,000
50510 Water 278,704 175,000 195,000Utilities Total 1,779,812 1,419,000 1,445,000Liability 50605 Loss Recoveries (535,148) 0 (530,000)
50641 Casualty/Liability Costs (1,478,771)50642 Property Damage (220,712)
Liability Total (2,234,631) 0 (530,000)Taxes 50701 Property Taxes 2,790 17,400 2,800
50710 Fuel and Lubricant Taxes 153,925 170,000 150,00050715 Use Tax 2,738,478 2,790,014 2,500,000
Taxes Total 2,895,193 2,977,414 2,652,800
150

FY15/16 Budget DevelopmentDistrict Overhead6/10/2015
Category Account Account Name FYE 13/14 ActualsFY14/15 Mid‐Year
BudgetFY15/16 Adopted
BudgetMiscellaneous 50901 Dues and Subscriptions 293,357 85,000 130,000
50925 Bad Debt (286)50940 Election of Directors 1,343,00050955 Vendor Discounts 9,888 20,000 20,00050990 Other Miscellaneous Expenses (53,381) 0
Miscellaneous Total 249,577 1,448,000 150,000Expense Transfer 51001 Remanufactured Inventory (1,945,188) (1,875,000) (1,800,000)
51005 Labor Contra to Capital (0) (2,000,000)Expense Transfer Total (1,945,188) (3,875,000) (1,800,000)Interest Expense 51105 Interest Expense 1,239,902 1,139,943 1,037,043
51115 Discount Amortization 0Interest Expense Total 1,239,902 1,139,943 1,037,043Leases and Rentals 51201 Leases and Rentals 0 0
Leases and Rentals Total 0 0Grand Total 22,725,257 19,524,923 10,146,983
151


RETIREMENT


Retirement
As Of May 2015
Retirement System Administrator
(1)
Retirement Board
Retirement System Manager
Hugo Wildmann
Retirement System Assistant
(1)
155

DEPARTMENT FUNCTION
OPERATING BUDGET
Labor CostsMgmt/Tech/Office support 3 289,670 3 308,763
Net Salaries and Wages 3 289,670 3 308,763
Fringe Benefits costs 200,771 266,763
Total Labor Costs 3 490,441 3 575,526
Non-Labor CostsPrinting Services - 1,000 Stationary Supplies - 1,000 Functional Expense Reclass (404,576) (577,526)
Total Non-Labor Costs (404,576) (575,526)
Total Operating Budget 85,864 0
FY 2015-16
RETIREMENT
FY 2014-15
Mid Year Working
Headcount
Mid Year Working Budget
The AC Transit Employees’ Retirement System provides retirement, disability, and death benefits to former employees of AC Transit and their beneficiaries. The Retirement Plan is administered by the Retirement Board, an independent public entity responsible for the general management of the Plan. The daily operations are administered by the Retirement System Manager.
Authorized Headcount Adopted Budget
156

FY15/16 Budget DevelopmentRetirement6/10/2015
Category Account Account Name FYE 13/14 ActualsFY14/15 Mid‐Year
BudgetFY15/16 Adopted
BudgetS&W 50130 Salaried Regular Time 292,673 289,670 308,763
S&W Total 292,673 289,670 308,763Fringe Benefits 223,957 200,771 266,763Services 50360 Printing Services 1,086 0 1,000
Services Total 1,086 0 1,000Materials & Supplies 50460 Stationery Supplies 949 1,000
Materials & Supplies Total 949 1,000Expense Transfer 51002 Functional Expense Reclassifications (442,145) (404,576) (577,526)
Expense Transfer Total (442,145) (404,576) (577,526)Grand Total 76,520 85,864 0
157
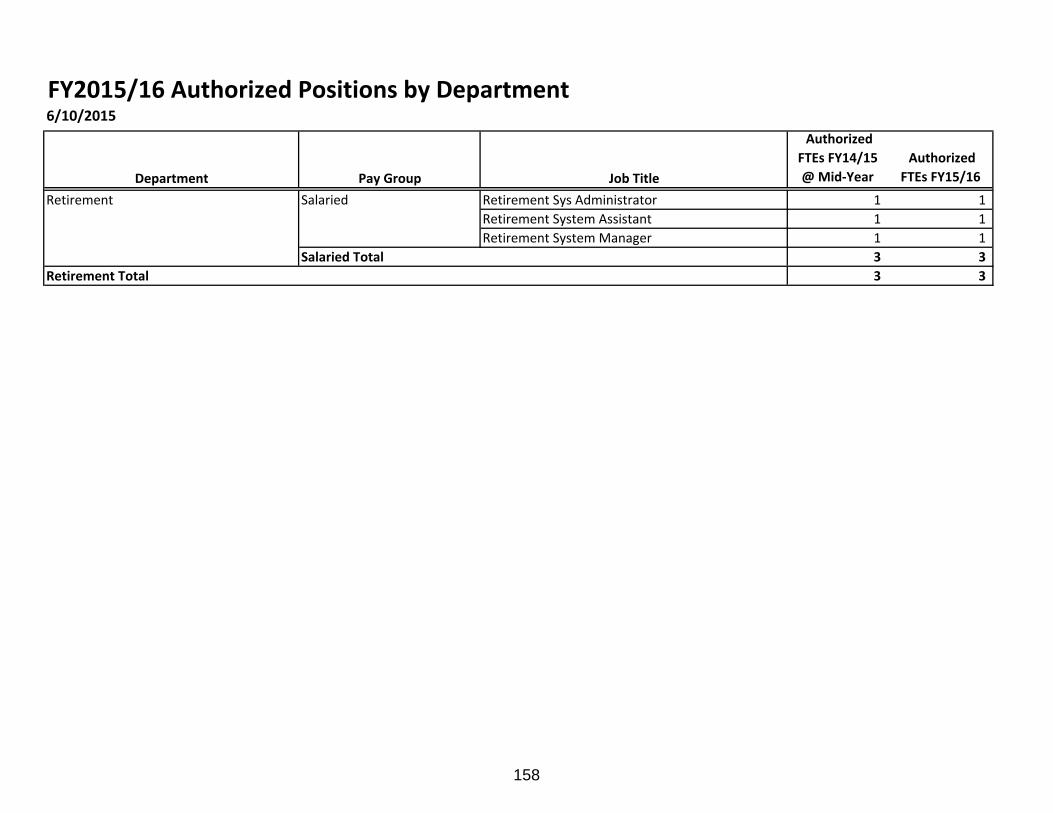
FY2015/16 Authorized Positions by Department6/10/2015
Department Pay Group Job Title
Authorized FTEs FY14/15 @ Mid‐Year
Authorized FTEs FY15/16
Retirement Salaried Retirement Sys Administrator 1 1 Retirement System Assistant 1 1 Retirement System Manager 1 1
Salaried Total 3 3 Retirement Total 3 3
158

CAPITAL
PLAN


Capital Budget


FY 2016 ADOPTED CAPITAL BUDGET
Category Project Description District Federal State Local Grand Total
Vehicles (29) 60ft Artic Diesels 1,443,042 19,226,130 4,299,828 24,969,000 Vehicles (37) 40ft Urban Diesels 3,922,000 13,130,190 17,052,190 Vehicles Expansion Bus Equipment 500,000 500,000 Vehicles Non Revenue Fleet Replacement 450,000 450,000
Facilities DistrictWide Upgrade Aboveground Oil Tanks 1,050,000 1,050,000 Facilities Operator Restroom Upgrades 57,000 57,000 Facilities New Operator Restrooms 250,000 250,000 Facilities D4 Rehabilitation (Pre-Design only in FY2016) 1,000,000 1,000,000 Facilities New infrastructure for DEF 100,000 100,000 Facilities TEC Auditorium AV Refresh 50,000 50,000 Facilities GO Boiler Replacement 70,000 70,000 Facilities Ardenwood Parking Plan/Implementation 140,000 140,000 Facilities Facilities Equipment Replace 200,000 200,000 Facilities Finance Equipment Replace 10,000 10,000 Facilities Emergency Facilities Maintenance 200,000 200,000 Facilities (Adjustment) GO Garage/Parking Gates - Construction 132,000 132,000 Facilities (Adjustment) GO Customer Service Renovation - Construction 110,000 110,000 Facilities (Adjustment) Boardroom Renovation (Construction) 260,000 260,000 Facilities (Adjustment) GO-Space Plan/Design Augment 100,000 100,000 Facilities (Adjustment) D3 Rehab Construction 12,330,000 12,330,000
Technology IS-Replace Badge readers 150,000 150,000 Technology IS-LAN Core Equip Upgrade 270,000 270,000 Technology Internal Firewalls 95,000 95,000 Technology DistWide Fiber Infrastructure 210,000 210,000 Technology Planning & Budgeting System 1,200,000 1,200,000 Technology Rebuild AC Transit Web Site 245,000 245,000 Technology IS-Equipment Replacements 160,000 160,000 Technology (Adjustment) CAD/AVL Replacement (7,189,110) (7,189,110)
Corridors South County Corridors Line 97 487,803 5,000,000 160,000 5,647,803 Corridors (Adjustment) Line 51 Bus Emitters and Related Equipment 400,000 400,000
Deferral D4,D6-New Guard Shack (55,000) (55,000) Deferral GO-Relocate Guard Desk Phase 1 (133,789) (133,789) Deferral D4-Transportation Building/Chiller Replace (2,999,966) (2,999,966) Completions Completed Projects (224,078) (224,078)
TOTAL 14,989,902 37,356,320 4,299,828 160,000 56,806,050
Federal $37,356,320
66%
State$4,299,828
8%
Local$160,0000.3%
District $14,989,902
26%
FY 2016 Final Capital Budget by Fund Source
163

FY 2015‐16 Adopted Budget Funding Priorities Fleet Replacement & Expansion ($43.0 million) – This Capital Budget Category consists of revenue and non‐revenue vehicle replacements, and vehicle expansion. Revenue vehicle replacements are the District’s top priority to ensure efficient and effective service to its many riders. FY 2015‐16 vehicle procurements include the replacement of (29) 60‐foot Van Hool articulated buses and (37) 40‐foot Van Hool urban diesel buses. The District also needs to purchase equipment (fareboxes and other electronics) required to outfit ten buses (kept from retirement) to serve as part of a temporary expansion fleet. The equipment will be later transferred to new expansion buses which are scheduled for purchase in FY 2016‐17. Facilities ($16.1 million) – This Capital Budget Category consists of facilities rehabilitations and upgrades at various divisions. In planning for the FY 2015‐16 capital budget, staff decided to focus on comprehensive rehabilitations of the operating facilities instead of piecemeal component projects wherever possible. If a request for the rehabilitations of a particular component (e.g. the roof) of a facility does not require immediate attention for safety or other reasons, scope is assumed as part of the next comprehensive facility rehab. The work at D3 provided a basis for this planning, and staff has selected Seminary Division 4 as the next facility for rehabilitation, followed tentatively by the Division 6 facility, Division 2 facility, Central Maintenance Facility, and the General Office.
The major projects recommended include funding for the construction phase of the Division 3 Re‐opening, beginning the design phase of a future rehabilitation of the Division 4 facility, and assessment and remedy of regulatory compliance issues with above‐ground storage tanks. Two more rehabilitation projects (GO Garage/Parking Gates, GO Customer Service Renovation) only programmed for design also get construction funding. Two other existing projects (GO Boardroom Renovation, GO Space Plan/Design) require more funds to complete construction. As per the above discussion on comprehensive rehabilitations, the specific projects programmed at the various facilities were deemed necessary to complete before incorporation into a comprehensive rehabilitation. The proposed budget also funds the addition of badge access and minor renovations at three existing operator restroom facilities, and funds design and construction of one new restroom facility.
Technology ($2.3 million) – This Capital Budget Category consists of important technology projects and Information Services equipment replacement, including several projects that replace and upgrade aging network and server equipment. A project to rebuild the District’s website on a modern platform will make the website more mobile‐friendly and more accessible to disabled individuals, as well as enabling better integration with internal District systems to assist Procurement, reporting, and Human Resources. Also included is selection and implementation of a planning and budgeting system for the yearly operating budget. Corridors ($6.0 million) – This Capital Budget Category consists of efficiency and reliability enhancements to operating corridors. It includes $5.6 million for the South County Corridors Line 97 project, which is over 92% funded by federal and local grants, with AC Transit contributing the remaining $457,803.
164

Adjustments – The Capital Budget includes several adjustments to existing capital projects. The facilities adjustments were covered in the above section. There is one corridor project, the Line 51 Corridor Delay Reduction and Sustainability Project that requires additional funds to equip more buses with Transit Signal Priority equipment to increase operational flexibility and maximize the gains from the project investments. The major adjustment is for the CAD/AVL project to return all of its programmed District Capital funds ($7.2 million) for other uses due to very favorable bid results.
165

Federal Funding Sources
Fund Source Fund Source Description Amount
FTA Section 5307
A program authorized by Moving Ahead for Progress in the 21st Century (MAP-21), the Urbanized Area Formula Fund Program (49 U.S.C. 5307) makes Federal resources available to urbanized areas and to States for transit capital, operating assistance, and for transportation related planning. The Federal Transit Administration (FTA) administers the program. The Metropolitan Transportation Commission (MTC) programs these funds to the 12 urbanized areas in the region through its Transit Capital Priorities process. MTC’s 15-year Core Capacity Challenge Grant Program, adopted in December 2013 through Resolution 4123, will allow AC Transit access to federal funds for capital projects that achieve regional state of good repair and transit expansion goals including vehicle replacement and expansion, and facility rehabilitation and replacement.
$32,356,320
FHWA/FTA CMAQ
A program authorized by SAFETEA-LU, the Congestion Mitigation and Air Quality Improvement Program (CMAQ) provides funding for capital and operating projects and programs in air quality nonattainment and maintenance areas for ozone, carbon monoxide (CO), and particulate matter, which reduce transportation related emissions.
$5,000,000
Total Federal Funds $37,356,320
166
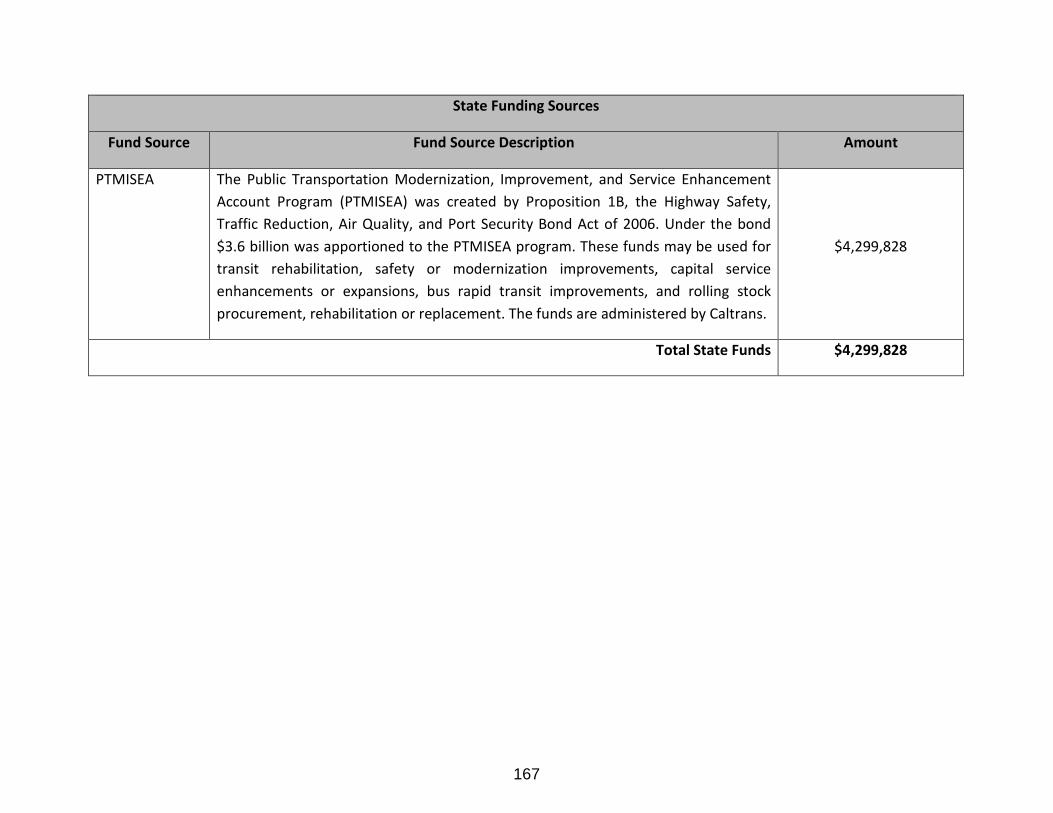
State Funding Sources
Fund Source Fund Source Description Amount
PTMISEA The Public Transportation Modernization, Improvement, and Service Enhancement Account Program (PTMISEA) was created by Proposition 1B, the Highway Safety, Traffic Reduction, Air Quality, and Port Security Bond Act of 2006. Under the bond $3.6 billion was apportioned to the PTMISEA program. These funds may be used for transit rehabilitation, safety or modernization improvements, capital service enhancements or expansions, bus rapid transit improvements, and rolling stock procurement, rehabilitation or replacement. The funds are administered by Caltrans.
$4,299,828
Total State Funds $4,299,828
167

Local and Regional Funding Sources
Fund Source Fund Source Description Amount
Transportation For Clean Air
Administered by the Bay Area Air Quality Management District (BAAQMD), the Transportation For Clean Air grants come from a $4 surcharge on motor vehicles registered within the San Francisco Bay Area. The TFCA program funds projects that reduce on‐road motor vehicle emissions. Sixty percent of TFCA funds are awarded directly by the BAAQMD through a competitive grant program known as the Regional Fund. The remaining forty percent (40%) of TFCA funds are forwarded to the designated agency within each Bay Area county. In Alameda County, that agency is the Alameda County Transportation Commission (ACTC). In Contra Costa County, that agency is the Contra Costa Transportation Authority (CCTA).
$160,000
District Could include in‐kind staff time, benefits, and indirect costs, and in some cases, unrestricted operating funds. District funds also include Alameda and Contra Costa property taxes.
$14,989,902
Total Local and Regional Funds $15,149,902
168

EXISTING CAPITAL PROGRAM STATUS OVERVIEW
Category ID Project Project Manager Approved Budget Current Budget Amount Spent % Spent
BRT Various BRT Project Development Wilkins, David 8,635,708 8,635,708 8,635,708 100%
BRT 2001 BRT Right Of Way/TPA Wilkins, David 3,191,250 3,191,250 3,135,400 98%
BRT 2002 BRT Preliminary Design Wilkins, David 5,275,052 5,275,052 5,275,052 100%
BRT 2003 BRT Final Design, Plans & Spec Wilkins, David 15,987,658 15,987,658 15,982,232 100%
BRT 2004 BRT Construction Wilkins, David 100,400,000 100,400,000 11,510,682 11%
BRT 2005 BRT Vehicles & Equipment Wilkins, David 2,580,000 2,580,000 - 0%
BRT 2006 BRT Proj Mgt/Constr Mgt Wilkins, David 41,916,504 41,916,504 11,791,356 28%
Corridor 2042 Line 51 Corridor TPI Buller, Wilmer 11,125,445 11,125,445 10,368,699 93%
Corridor 2054 San Leandro BART Terminal Callaway, Joe 4,250,026 4,250,026 657,085 15%
Environmental 2028 Hazmat Berms & Awnings Amiri, Wahid 554,600 554,600 275 0%
Environmental 2091 D4-Environmental Cleanup Amiri, Wahid 200,000 200,000 123,664 62%
Facilities 1808 D2 Storm Drains Callaway, Joe 1,389,035 1,389,035 147,441 11%
Facilities 1856 State of Good Repair Asset Mgmt Broadbent, Patricia 6,166,225 6,166,229 1,078,151 17%
Facilities 2010 Re-Work GO Office Config Hienzsch, Magnus 100,000 100,000 23,331 23%
Facilities 2011 GO-Fire Code Compliance Michels, Craig 234,020 234,020 156,221 67%
Facilities 2012 Boardroom Audiovisual Refresh Hienzsch, Magnus 450,000 450,000 220,978 49%
Facilities 2023 D6-Reroof Mack Bldg Hienzsch, Magnus 1,208,000 1,208,000 - 0%
Facilities 2025 D6-Pavement Rehabilitation Michels, Craig 500,000 500,000 80,564 16%
Facilities 2026 D2- Replace concrete at Fuel Island Callaway, Joe 209,000 209,000 559 0%
Facilities 2027 D2-Hydrogen Maintenance Bay Callaway, Joe 858,477 858,477 117,456 14%
Facilities 2032 Finance Equipment Replacement Clinton, Lewis 10,000 10,000 - 0%
Facilities 2044 D4-Garage Deck Repair,Phase 1 Hienzsch, Magnus 532,000 532,000 51,034 10%
Facilities 2049 Relocate Guard Desk Phase 1 Hienzsch, Magnus 134,000 134,000 211 0%
Facilities 2056 D2-Trans Bldg Roof Repl/Equip Michels, Craig 655,000 655,000 88,137 13%
Facilities 2058 D4-Trans.Bldg./Chiller Replace Hienzsch, Magnus 3,030,000 3,030,000 30,034 1%
Facilities 2059 D2/OCC Fire Suppression System Amiri, Wahid 31,250 31,250 - 0%
Facilities 2063 SGR GO Projects Hienzsch, Magnus 169,000 169,000 117,113 69%
Facilities 2064 Richmond Parkway TC Rehab Hass, Michael 3,020,000 3,020,000 56,245 2%
Facilities 2065 Dist.Wide Pigeon Abatement Wrzesinski, Richard 140,000 140,000 11,106 8%
Facilities 2072 GO-Rpl Garage/Parking Gates Michels, Craig 64,750 64,750 21,973 34%
Facilities 2073 GO-Replace 'Total Doors' Hienzsch, Magnus 68,644 68,644 2,392 3%
Facilities 2077 D4, D6-New Guard Shack TBD 55,000 55,000 - 0%
Facilities 2079 Emergency Facility Repairs Michels, Craig 300,000 300,000 167,225 56%
Facilities 2080 Maintenance Equip Replacement Llamas, Salvador 120,000 120,000 83,869 70%
Facilities 2082 Contra Costa College TC Rehab Hass, Michael 825,000 825,000 42,497 5%
Facilities 2089 Bus Washer Rehabs Callaway, Joe 3,000,000 3,000,000 3,053 0%
Facilities 2090 External Painting of Divisions Wrzesinski, Richard 700,000 700,000 - 0%
Facilities 2094 Lift & Hoist Replacement Callaway, Joe 1,500,000 1,500,000 36,213 2%
Facilities 2095 D3 Rehabilitation Hass, Michael 18,000,000 5,463,979 2,144,240 12%
Facilities 2096 OCC Relocation Michels, Craig 3,000,000 3,000,000 486,964 16%
Facilities 2102 GO-Fire pipe corrosion repair Michels, Craig 290,000 290,000 - 0%
Facilities 2103 TEC Parking Lot Gate Michels, Craig 330,000 330,000 352 0%
Facilities 2104 Automated Extnl Defibrillator Amiri, Wahid 120,000 120,000 86,803 72%
Facilities 10011 District-wide Elevator Modern. Michels, Craig 3,155,050 3,155,050 2,806,669 89%
Facilities 10016 D2/D6-Study Parking Structures Callaway, Joe 76,000 76,000 74,828 98%
Facilities 10033 District-Wide Weatherproofing Hienzsch, Magnus 128,555 128,555 128,555 100%
Facilities 10036 GO Weatherization Hienzsch, Magnus 5,155,567 5,155,567 1,890,987 37%
IS 1829 Internal Text Messaging Signs Amiri, Wahid 1,474,515 1,474,515 1,340,409 91%
IS 1861 Real Time Bus/Communications Lewis-Williams, Sandra 38,708,751 37,906,764 2,228,944 6%
IS 2029 IS-Claims System Krishnan, Sai 143,000 143,000 44,540 31%
IS 2033 NextBus Replacement Newhouse, Stephen 120,000 120,000 83,622 70%
IS 2081 IS-Equipment Replacement Carvalho, Michael 185,000 185,000 175,191 95%
IS 2105 IS-EMC SAN Replacement Carvalho, Michael 750,000 750,000 635,970 85%
169

Category ID Project Project Manager Approved Budget Current Budget Amount Spent % Spent
IS 2106 IS-Upgrade PSoft Version 9.2 Krishnan, Sai 970,000 970,000 - 0%
IS 10019 Hastus Integrated Operations Broadbent, Patricia 3,515,000 3,515,000 2,712,668 77%
Other 2055 Spectrum Ridership Growth Wake, Victoria 2,036,232 2,036,232 1,019,494 50%
Other 2078 Major Corridor Study Cunradi, James 460,000 460,000 443,951 97%
Other 2093 TJPA Capital Contribution Andrichak, Christopher 25,463,047 25,463,047 2,149,596 8%
Other 2109 Mobility Marketing through 211 Wake, Victoria 300,000 300,000 - 0%
Vehicles 2016 SGR Bus Campaign Repairs Llamas, Salvador 1,037,500 1,037,500 105,208 10%
Vehicles 2034 Replace Non-Vehicles Vehicles Hoffman, Stuart 300,000 300,000 281,656 94%
Vehicles 2040 Replace Fareboxes Lewis-Williams, Sandra 11,801,685 11,801,685 11,771,857 100%
Vehicles 2050 30' VH Exhaust System Install Hoffman, Stuart 1,685,803 1,685,803 1,685,803 100%
Vehicles 2068 (27) 60-ft Hybrid Artic (BRT) Hoffman, Stuart 25,124,902 25,124,902 - 0%
Vehicles 2098 Cut-Away 24' Buses Hoffman, Stuart 1,192,632 1,192,632 1,190,536 100%
Vehicles 2108 15 x 40' Expansion Buses Hoffman, Stuart 7,413,025 7,413,025 7,404,980 100%
Vehicles 2112 65 x 40' Urban Buses Hoffman, Stuart 36,768,940 36,768,940 36,708,529 100%
Vehicles 2113 16 X 40' Dumbarton Buses Hoffman, Stuart 10,041,581 10,041,581 7,838,939 78%
ZEBA 1701 Oakland Hydrogen Fueling Facility Callaway, Joe 13,235,714 13,235,714 12,935,403 98%
ZEBA 1703 Fuel Cell Bus O&M Callaway, Joe 1,993,486 1,993,486 1,230,073 62%
ZEBA 1704 Marketing and Outreach - ZEBA Llamas, Salvador 447,262 447,262 348,437 78%
TOTAL 426,373,183 413,035,180 161,335,454 38%
Federal48%
State35%
Local9%
District8%
Existing Capital Program Funding Summary
170


Alameda-Contra Costa Transit District1600 Franklin StreetOakland, CA 94612
Call 511Visit actransit.org
AC Transit Budget Department•May 2015