Embed Size (px)
Citation preview

2004 Regional Transportation PlanAdopted April 2004

ProgressVision
Southern California Association of Governments
818 West 7th Street, 12th Floor, Los Angeles, California 90017-3435 213. 236.1800 www.scag.ca.gov
Mission Statement
Leadership, vision and progress whichpromote economic growth, personal well-being, and livable communities forall Southern Californians.
The Association will accomplish this Mission by:
� Developing long-range regional plans andstrategies that provide for efficient movementof people, goods and information; enhanceeconomic growth and international trade; andimprove the environment and quality of life.
� Providing quality information services andanalysis for the region.
� Using an inclusive decision-making processthat resolves conflicts and encourages trust.
� Creating an educational and work environ-ment that cultivates creativity, initiative, and opportunity.
Regional Council MembersOFFICERS:
President: Councilmember Bev Perry, Brea
First Vice President: Councilmember Ron Roberts, Temecula
Second Vice President: Supervisor Hank Kuiper, Imperial County
Past President: Councilmember Ronald Bates, Los Alamitos
Imperial County: Hank Kuiper, Imperial County • Jo Shields, Brawley
Los Angeles County: Yvonne Brathwaite Burke, Los Angeles County •
Zev Yaroslavsky, Los Angeles County • Harry Baldwin, San Gabriel • Paul
Bowlen, Cerritos • Tony Cardenas, Los Angeles • Margaret Clark,
Rosemead • Gene Daniels, Paramount • Mike Dispenza, Palmdale • Judy
Dunlap, Inglewood • Eric Garcetti, Los Angeles • Wendy Greuel, Los
Angeles • Frank Gurulé, Cudahy • James Hahn, Los Angeles • Janice Hahn,
Los Angeles • Isadore Hall, Compton • Sandra Jacobs, El Segundo • Tom
LaBonge, Los Angeles • Bonnie Lowenthal, Long Beach • Martin Ludlow,
Los Angeles • Keith McCarthy, Downey • Llewellyn Miller, Claremont •
Cindy Miscikowski, Los Angeles • Paul Nowatka, Torrance • Pam
O’Connor, Santa Monica • Alex Padilla, Los Angeles • Bernard Parks, Los
Angeles • Jan Perry, Los Angeles • Beatrice Proo, Pico Rivera • Ed Reyes,
Los Angeles • Greig Smith, Los Angeles • Dick Stanford, Azusa • Tom
Sykes, Walnut • Paul Talbot, Alhambra • Sidney Tyler, Pasadena • Tonia
Reyes Uranga, Long Beach • Antonio Villaraigosa, Los Angeles • Dennis
Washburn, Calabasas • Jack Weiss, Los Angeles • Bob Yousefian,
Glendale • Dennis P. Zine, Los Angeles
Orange County: Chris Norby, Orange County • Ronald Bates, Los
Alamitos • Lou Bone, Tustin • Art Brown, Buena Park • Richard Chavez,
Anaheim • Debbie Cook, Huntington Beach • Cathryn DeYoung, Laguna
Niguel • Richard Dixon, Lake Forest • Alta Duke, La Palma • Bev Perry,
Brea • Tod Ridgeway, Newport Beach
Riverside County: Marion Ashley, Riverside County • Thomas Buckley,
Lake Elsinore • Bonnie Flickinger, Moreno Valley • Ron Loveridge,
Riverside • Greg Pettis, Cathedral City • Ron Roberts, Temecula
San Bernardino County: Paul Biane, San Bernardino County • Bill
Alexander, Rancho Cucamonga • Edward Burgnon, Town of Apple Valley •
Lawrence Dale, Barstow • Lee Ann Garcia, Grand Terrace • Susan
Longville, San Bernardino • Gary Ovitt, Ontario • Deborah Robertson,
Rialto
Ventura County: Judy Mikels, Ventura County • Glen Becerra, Simi
Valley • Carl Morehouse, San Buenaventura • Toni Young, Port Hueneme
Orange County Transportation Authority: Charles Smith, Orange
County
Riverside County Transportation Commission: Robin Lowe, Hemet
Ventura County Transportation Commission: Bill Davis, Simi Valley
Rev. 3.9.04
Leadership
Funding: The preparation of this report was financed in part through grants from the United StatesDepartment of Transportation – Federal Highway Administration and the Federal Transit Administration –under provisions of the Transportation Equity Act for the 21st Century (TEA-21). Additional financialassistance was provided by the California State Department of Transportation.


2004 Regional Transportation Plan2004 Regional Transportation PlanAdopted April 2004
Southern CaliforniaAssociation of Governments


TTaabbllee ooff CCoonntteennttss
i
PageEXECUTIVE SUMMARY...................................................................................................... 1
CHAPTER 1 A NEW DESTINATION.................................................................................. 13
Why Update the Plan? .................................................................................... 13Purpose and Need .......................................................................................... 14Our Successes ............................................................................................... 14What Adjustments Do We Need to Make? ........................................................... 19Our Planning Approach.................................................................................... 27
CHAPTER 2 TRANSPORTATION PLANNING CHALLENGES AND TRENDS ........................... 35
The Shape and Pattern of Future Growth ............................................................ 35Meeting our TDM Goals.................................................................................... 53Unprecedented Demand on Our System.............................................................. 54Transportation Finance Challenges..................................................................... 66Meeting our Air Quality Commitments................................................................. 77
CHAPTER 3 OUR VISION............................................................................................... 79
Regional Goals ............................................................................................... 79Guiding Policies.............................................................................................. 80Performance Expectations................................................................................ 80
CHAPTER 4 POTENTIAL SOLUTIONS .............................................................................. 83
System Management: Getting the Most Out of the System..................................... 85Transportation Demand Management ................................................................. 90Thinking Out of the Box: Land-Use −Transportation Connection.............................. 94Strategic System Expansion/Capital Investments................................................... 96Transportation Finance: Meeting Our Needs........................................................ 140Recommended Funding Strategies to Implement SCAG’s RTP.................................. 142
CHAPTER 5 PLAN PERFORMANCE: HOW WILL THE PLAN PERFORM?.............................. 149
System/Investment Performance....................................................................... 149Mobility Benefits Attributable to the Use of Land-Use Strategies............................... 166Economic Impact Analysis................................................................................. 166Transportation Conformity Analysis..................................................................... 169Environmental Justice...................................................................................... 170
CHAPTER 6 IMPLEMENTING OUR PLANS AND MONITORING OUR PROGRESS ................. 181
Securing the Planned Funding........................................................................... 181Embracing System Management and Operation .................................................... 186Integrating the Growth Vision Strategy ............................................................... 186Implementing the RTP..................................................................................... 189Monitoring Our Progress .................................................................................. 191
CHAPTER 7 BEYOND THE PLAN...................................................................................... 195
Corridor Preservation ...................................................................................... 195Unconstrained Projects – Our Unmet Needs......................................................... 199
GLOSSARY ....................................................................................................................... 201

Table of Contents
ii
LIST OF EXHIBITS
PageCHAPTER 1
Exhibit 1.1: SCAG Region and Surrounding Areas ......................................................... 15Exhibit 1.2: Tribal Governments................................................................................ 31
CHAPTER 2Exhibit 2.1: 2000 Population .................................................................................... 41Exhibit 2.2: 2030 Population .................................................................................... 43Exhibit 2.3: Population Increase 2000 to 2030............................................................. 45Exhibit 2.4: 2000 Employment .................................................................................. 47Exhibit 2.5: 2030 Employment .................................................................................. 49Exhibit 2.6: Employment Increase 2000 to 2030 .......................................................... 51Exhibit 2.7: Commercial Service Airports..................................................................... 67
CHAPTER 4Exhibit 4.1: 2030 High Occupancy Vehicle (HOV) Lane System........................................ 101Exhibit 4.2: 2030 Mixed Flow Improvements ............................................................... 103Exhibit 4.3: 2000 Activity Centers.............................................................................. 111Exhibit 4.4: 2030 Activity Centers.............................................................................. 113Exhibit 4.5: 2030 Transit Corridor System................................................................... 115Exhibit 4.6: 2030 User Fee-Backed Capacity Improvements............................................ 119Exhibit 4.7: 2030 Mainline Freight Rail System Improvements......................................... 123Exhibit 4.8: 2030 Grade Separations.......................................................................... 127Exhibit 4.9: Maglev System...................................................................................... 133
CHAPTER 5Exhibit 5.1: 2000 Base Year Freeway Speed PM Peak.................................................... 153Exhibit 5.2: 2030 Baseline Freeway Speed PM Peak ..................................................... 155Exhibit 5.3: 2030 Plan Freeway Speed PM Peak .......................................................... 157
CHAPTER 7Exhibit 7.1: Post 2030 Long Range Corridors ............................................................... 197

Table of Contents
iii
LIST OF FIGURES
CHAPTER 1 PageFigure 1.1: PILUT Process ....................................................................................... 29
CHAPTER 2Figure 2.1: Travel Supply, Demand, and Population Trends............................................ 54Figure 2.2: Productivity Results Aggregated by Time Period ........................................... 55Figure 2.3: Regional Transit Usage Trends.................................................................. 56Figure 2.4: Regional Per Capita Transit Ridership ......................................................... 57Figure 2.5: SCAG Region Truck Travel Trends.............................................................. 60Figure 2.6: Historical Air Passenger Volume, 1960-2002 ................................................ 65Figure 2.7: SCAG Regional Baseline Revenues............................................................. 70Figure 2.8: SCAG Regional Revenues, County Shares.................................................... 70Figure 2.9: Percentage Change in VMT, Personal Income, Population & Transportation Revenue Since 1970, Statewide Totals ........................................................ 73Figure 2.10: SCAG Regional Revenues, Local Sources ..................................................... 74
CHAPTER 4Figure 4.1: RTP Projects and Strategies Structure ........................................................ 83Figure 4.2: System Management Philosophy................................................................ 84Figure 4.3: California/Mexico Distribution of Trucks ...................................................... 126Figure 4.4: Historical Increase in State Gas Tax ........................................................... 144
CHAPTER 5Figure 5.1: SCAG Regional Performance Analysis – Average Daily Speed........................... 151Figure 5.2: SCAG Regional Performance Analysis – Average Daily Delay............................ 151Figure 5.3: SCAG Regional Performance Analysis – Average Daily Delay per Capita............. 152Figure 5.4: SCAG Regional Performance Analysis – Average Daily Heavy Duty Truck Delays.. 152Figure 5.5: SCAG Regional Performance Analysis – Auto and Transit Accessibility................ 159Figure 5.6: SCAG Regional Performance Analysis – Improvements in Highway System Productivity................................................................................. 162Figure 5.7: SCAG Regional Performance Analysis – Preservation Expenditures thru 2030...... 162Figure 5.8: SCAG Regional Performance Analysis – Annual Costs Per Capita for System Preservation ......................................................................................... 163Figure 5.9: SCAG Regional Performance Analysis – Accident Rates................................... 164Figure 5.10: SCAG Regional Performance Analysis – RTP Total Mobility Benefits and Portions Attributable to the Growth Visioning Strategy ................................... 166Figure 5.11: SCAG Region Historical and Projected Annual Compound Employment Growth Rates......................................................................................... 167Figure 5.12: 2004 RTP Expenditure by Income Category ................................................. 171Figure 5.13: Share of 2004 RTP Expenditures by Ethnic/Racial Category............................. 172Figure 5.14: Share of System Usage, Tax Paid & Auto Travel Time Savings......................... 173Figure 5.15: Share of System Usage, Tax Paid & Transit Travel Time Savings...................... 173Figure 5.16: Share of System Usage, Tax Paid & Auto Travel Distance Savings .................... 174Figure 5.17: Comparison of Accessibility Improvements by Travel Mode for Income Quintiles.. 174Figure 5.18: Regional Ethnic Composition Compared with Ethnic Composition in Aviation Noise Areas (2030) ...................................................................... 175
Figure 5.19: Income Distribution Between SCAG Region & Aviation Noise Areas (2030).......... 176Figure 5.20: Ethnic Composition SCAG Region vs. Highway Noise Areas (2030) 177Figure 5.21: Income Distribution: SCAG Region vs. Highway Noise Areas (2030) 177Figure 5.22: Percentage Improvement in 2030 Air Pollutant Emissions for Income Groups (Plan vs. Baseline)........................................................................ 178Figure 5.23: Percentage Improvements in 2030 Air Pollutant Emissions for Ethnic Groups (Plan vs. Baseline (No Project) ........................................................ 179Figure 5.24 Percentage Increases in 2030 Pollutant Emissions for Income Groups ............... 180Figure 5.25 Percentage Increases in 2030 Pollutant Emissions for Racial/Ethnic Groups ........ 180

Table of Contents
iv
LIST OF TABLES
PageEXECUTIVE SUMMARY
Table 1: Highway & Arterial Improvements.............................................................. 6
CHAPTER 1Table 1.1: Regional Plan Task Forces and Key Transportation Subcommittees.................... 28
Table 1.2: Stakeholders in the Development of the 2004 RTP......................................... 30
CHAPTER 2Table 2.1: 2030 Population, Households, Employment .................................................. 40Table 2.2: Transit Service Utilization in the SCAG Region ............................................... 58Table 2.3: Transit Subsidy in the SCAG Region ............................................................ 59Table 2.4: East-West Rail Demand Forecast ................................................................ 61Table 2.5: Historical Air Cargo Tonnage ..................................................................... 62Table 2.6: Baseline Revenue Sources......................................................................... 69Table 2.7: Committed Regional Expenses by County..................................................... 71Table 2.8: Committed Regional Expenses ................................................................... 71Table 2.9: 2004 RTP Baseline Regional Balance by County............................................. 72
CHAPTER 3Table 3.1: Performance Indicator, Measures and Outcome............................................. 82
CHAPTER 4Table 4.1: ITS Capital Investments............................................................................ 85Table 4.2: Investment in System Preservation ............................................................. 86Table 4.3: CMPs in the SCAG Region ......................................................................... 89Table 4.4: TDM Investments.................................................................................... 90Table 4.5: HOV Projects.......................................................................................... 98Table 4.6: HOV Connector Projects............................................................................ 98Table 4.7: Mixed Flow Projects................................................................................. 100Table 4.8: Planned / Potential Toll Corridor Projects...................................................... 105Table 4.9: Investments in Arterials ............................................................................ 106Table 4.10: Transit Corridor Projects .......................................................................... 108Table 4.11: Planned / Potential Additional Toll Corridors ................................................. 117Table 4.12: Truck Climbing Lane Projects.................................................................... 118Table 4.13: 2004 RTP Regional Maglev Milestones......................................................... 131Table 4.14: Existing Conditions and the Regional Aviation Plan ........................................ 135Table 4.15: Aviation-Related Economic Benefits............................................................ 136Table 4.16: Air Cargo Demand – 2030 Regional Aviation Plan .......................................... 138Table 4.17: 2004 RTP Revenue Sources...................................................................... 147Table 4.18: 2004 RTP Regional Checkbook by County.................................................... 147
CHAPTER 5Table 5.1: RTP Goals and Related Performance Outcomes ............................................. 149Table 5.2: Variability of Travel Time: Hypothetical Illustration........................................ 160Table 5.3: SCAG Regional Performance Analysis – Improvements in Travel Time Reliability... 161Table 5.4: SCAG Regional Performance Analysis – Benefit Cost Results............................. 165
CHAPTER 7Table 7.1: Post-2030 Long-Range Corridors ................................................................. 196

EExecutivexecutiveSSummaryummary

1DESTINATION 2030
2004 Regional Transportation Plan
EEXXEECCUUTTIIVVEE SSUUMMMMAARRYY
DESTINATION 2030 is the Draft 2004 Regional Transportation Plan (RTP) for the six countyRegion in Southern California including Los Angeles, Orange, San Bernardino, Riverside,Ventura and Imperial home to 17 million people. The Regional Transportation Plan (RTP) isthe culmination of a three-year effort with a focus on improving the balance between land useand the current as well as future transportation systems. The Southern California Associationof Governments (SCAG) is required to develop, maintain and update the RTP on a three yearcycle.
DESTINATION 2030 is a multi-modal Plan representing our vision for a better transportationsystem, integrated with the best possible growth pattern for the Region over the Plan horizonof 2030. The Plan provides the basic policy and program framework for long term investmentin our vast regional transportation system in a coordinated, cooperative and continuousmanner. Transportation investments in the SCAG Region that receive State or federaltransportation funds must be consistent with the RTP and must be included in the RegionalTransportation Improvement Program (RTIP) when ready for funding.
A New Destination
Since the adoption of the 2001 RTP in April of 2001, there have been several newdevelopments in the Region that must be reflected in the updated RTP; some are positive andsome are not. On the positive side, several new initiatives proposed in the 2001 RTP havecome to fruition, including passage of Proposition 42 (which dedicates revenues generatedfrom the gasoline sales tax for transportation purposes) and the extension of the half-centsales tax measure in Riverside County. A 20−mile segment of the 28.2−mile State Route 210extension, a major addition to our freeway system, became operational. The new Metro GoldLine began light rail service between downtown Los Angeles and Pasadena. Because rapidbus corridors proved to be highly effective, the implementation of several new corridors wasexpedited in Los Angeles County.
On the negative side, the State budget crisis, which became evident after the 2001 RTP, hasdirectly threatened funds designated for the Traffic Congestion Relief Program (TCRP). Thishas not only jeopardized the timely implementation of critical transportation projects, but alsohas required SCAG to take a fresh look at its regional priorities and take a more proactive rolein securing future funding needs. Also, the events of September 11, 2001 (9/11), haveseverely impacted transportation planning, especially in the arena of aviation.
In the process of updating the 2001 RTP, SCAG found that by changing the distribution ofgrowth within the Region for future years, there were dramatic effects on the performance ofthe transportation system. In fact, by reducing population and employment estimates by 1million, along with a reallocation of jobs to Los Angeles County from elsewhere in the Region,analysis showed dramatic improvements in air quality as well as mobility. As a result, SCAG

Executive Summary
2 DESTINATION 2030
initiated a comprehensive growth visioning process called Southern California COMPASS, aninnovative effort to develop broad consensus on growth and land-use issues affecting thefuture of the Region. This led to the development of a growth vision for the Region that bestfits the existing and proposed regional transportation infrastructure, while respecting natural aswell as policy constraints that are inherent in the Region. A notable feature of the growthvisioning effort has been to engage the public in transportation planning in an interactiveprocess to arrive at a shared conception of the Region’s future.
In order to develop this vision and meet all the challenges the Region faces in acomprehensive and coordinated manner, SCAG developed an integrated planning processcalled Planning for Integrated Land-Use and Transportation (PILUT) to update the 2004 RTP.The idea was to integrate the transportation planning, growth visioning, and State-requiredEnvironmental Impact Report (EIR) analysis into a single, unified process. This integrationhelped eliminate redundancy, ensure close coordination, and optimize the use of SCAG’slimited planning resources.
Based on extensive public input, in May 2003, SCAG’s Community, Economic and HumanDevelopment Committee directed staff to evaluate five growth scenarios. Three of the fivescenarios involve technical adjustments to projections based on local input and otherconsiderations. The other two scenarios, called PILUT I and PILUT II, represent major policyshifts that would include much closer integration of land-use plans with transportationinvestments, while remaining consistent with the general plans of the many jurisdictions withinthe SCAG Region.
PILUT I proposes intensification of land-use in urbanized parts of the Region to accommodatefuture growth so that more of our scarce undeveloped land is preserved at the same time theexisting transportation system is utilized more effectively, particularly our public transit system.
PILUT II proposes accommodating future growth by encouraging the movement of people andjobs to outlying areas such as north Los Angeles and San Bernardino Counties, and easternRiverside County (Coachella Valley) so that we can achieve better balance between jobs andhousing and minimize the need for long commute trips.
The result of this visioning process is a hybrid growth scenario that incorporates elements ofPILUT I and II based on a set of principles developed by the Growth Visioning subcommittee.Accordingly, the proposed growth vision has been developed as follows: utilizing infill whereappropriate to revitalize underutilized development sites; focusing growth along transitcorridors and nodes; providing housing opportunities near major job centers; providinghousing opportunities to match changing demographics; preserving natural open space;incorporating the decentralized aviation strategy proposed in the Plan; densifying newtransportation corridors proposed in the Plan; and respecting the local input and feedbackprocess in the development of the growth distribution.

Executive Summary
2004 Regional Transportation Plan 3
n Goals, Policies and Performance Measures
DESTINATION 2030 is a performance-based transportation plan, as were the 2001 RTP andthe 1998 RTP. The goals of the Plan, as summarized in Chapter 3, are to maximize mobilityand accessibility, ensure safety and reliability, preserve our transportation system, maximizeproductivity of our system, protect the environment and encourage land-use and growthpatterns that complement our transportation system. The associated policies were developedto guide the development of the 2004 RTP further and reflect the transportation priorities ofthe Region. Performance measures described in Chapter 3 were developed to ensure that theadopted goals are achieved through the implementation of the 2004 RTP.
Our Challenges
Our challenges relative to developing a sound transportation plan can be broadly divided intothree categories: 1) addressing growth in population, employment and households; 2)preserving, expanding and wisely utilizing our infrastructure; and 3) funding our Plan.
If recent population, household, and employment trends continue in the future, by 2030 theRegion will be home to 22.9 million residents and 10.2 million jobs. This represents apopulation increase of 38 percent, or 6.3 million people, between 2000 and 2030 and anincrease in employment of 36 percent, or 2.7 million jobs. This forecast is slightly differentfrom the regional growth presented in the 2001 Regional Transportation Plan in that bothhousehold and population growth are expected to be less than previously forecast.
n Unprecedented Demand on Our System
Each major mode in our transportation system faces challenges meeting the growth that iscoming our way. While population more than doubled from 1960 to 2000, our freeway capacityincreased by less than 30 percent. Consequently, our Region’s congestion has increaseddramatically, affecting both person travel and goods movement. For year 2000, total dailydelay due to congestion is estimated to be 2.2 million person hours. If current trends persist,this delay is expected to more than double to 5.2 million person hours of daily delay by 2030.Moreover, our infrastructure is aging and requires more investment in maintenance andpreservation.
Both industry and residents are served by a vast transportation network that includes over9,000 lane miles of freeway, more than 42,000 lane miles of arterials, several large publictransit systems, four major airports (including the world’s fifth largest), as well as by the twolargest cargo-handling ports in the United States, which combined constitute the third-largestport complex in the world. Yet the Region’s transportation system has not kept up withpopulation and transportation demand.

Executive Summary
4 DESTINATION 2030
The Region has invested heavily in transit in the past thirty years and yet the transit ridershiphas not increased proportionately. It is evident that transit service utilization in the Region isnot optimal compared to similar regions in the nation as described in Chapter 2.
n Crisis in Transporting Goods
The Southern California region is facing a crisis in transporting goods, characterized by adramatic growth in rail and truck traffic, scarce financial resources, and the high costs ofinfrastructure improvements. Forecasts of greater regional population and employment, andprojections of increasing international and domestic trade volumes, all lead to worseningcongestion and the potential of gridlock occurring within the Region’s surface transportationsystem. Almost all of the short-haul and significant share of medium- and long-haul movementof goods occurs by truck. Severe congestion due to truck traffic is expected to worsen in theRegion’s major transportation corridors.
Airports play an important role in goods movement, as air cargo is transported in eitherpassenger aircraft belly-holds or in dedicated freight aircraft used primarily for high-value,time-sensitive shipments. In 2002, the Region’s airports handled 2.6 million tons of air cargo.Regional air cargo has grown at an average annual rate of 6.6 percent since 1965. LosAngeles International and Ontario International are the major cargo-handling airports,transporting about 96 percent of all regional air cargo, with LAX alone accounting for 75percent of the traffic. Ontario air cargo traffic has increased seven-fold since 1979, while LAXhas doubled the amount of air cargo handled in the same period. Burbank, John Wayne andLong Beach handle substantially less cargo.
n Passenger Aviation
The SCAG Region has 57 public use airports, including six commercial service airports, 45general aviation, two recently closed military air bases (one certified as a commercial serviceairport), two commuter airports and two joint-use facilities.
In all, some 78 million annual passengers (MAP) were served in the Region in 2002, almostdouble the number served in 1980. The level of air passenger demand is forecast to doubleagain before 2030. While none of the individual airports is the largest in the U.S., the Region’sairports taken together make Southern California the busiest of all regions in the country.
The need to accommodate future growth is clear and the economic costs of doing nothing aresubstantial. For every one million regional air passengers, it is estimated that there is apositive regional economic impact of $620 million (in 1998 dollars) and 4,475 jobs. In addition,the number of jobs created by air cargo and freight movement in the region is enormous andvital to the overall health of the regional economy.
Executive Summary
2004 Regional Transportation Plan 5
n Running Out of Financial Options
The baseline revenue estimate for the six-county SCAG Region is $120 billion over the 29-year time horizon of the 2004 RTP. Local sources comprise 75 percent of the overall revenueforecast, with State sources totaling 15 percent and federal sources making up 10 percent.On the other hand, the Region’s total committed costs to maintain and operate the system aswell as complete projects already committed, add up to $115 billion. The remaining balanceprovides a very small cushion with which to pursue transportation improvements critical tomaintaining the Region’s mobility and accommodating future growth.
OUR PLAN
Given the challenges we face, the SCAG RTP relies on a number of strategies to address theRegion’s transportation needs. These include an increased focus on operational, managementand preservation strategies; land-use integration with transportation investments; strategicsystem expansion investments; and innovative financing mechanisms. This comprehensiveapproach is referred to as System Management.
n Preservation – Protecting Our Infrastructure
A key aspect of System Management is protecting our investment in the current transportationinfrastructure. The Region has invested billions of dollars in developing its multi-modaltransportation system and must protect these investments for current and future generations.The Plan proposes setting aside $6.5 billion in additional funding for infrastructurepreservation.
n Operational Strategies – Getting the Most Out of Our Existing System
In addition to preserving the system, the Region has a responsibility to get the most out of thecurrent system. This is especially true for the State Highway System, which loses a significantpart of its productivity during extreme congestion due to weaving, merging, accidents, andother factors. Small physical improvements (e.g., auxiliary lanes that extend the mergingrange) and technology deployments (e.g., advanced ramp metering) offer us affordablesolutions to restore some of this lost productivity. These technology deployments are oftenreferred to as Intelligent Transportation Systems, or ITS. The combination of operations-related investments reduces delays and the duration of congestion, and improves safety andthe predictability of travel time. The Plan proposes an increase of $2.3 billion for operationalstrategies that improve the productivity of the multimodal transportation system through 2030.This level of funding represents less than one percent of the overall RTP expenditures, but isexpected to produce benefits that are almost an order of magnitude higher.

Executive Summary
6 DESTINATION 2030
n Transportation Demand Management
Transportation Demand Management (TDM) is the all-inclusive term given to a variety ofmeasures used to improve the efficiency of the existing transportation system by managingtravel demand. An Individual’s travel behavior may be influenced by mode, reliability,frequency, route, time and costs, support programs/facilities, perceived personal security andsafety, and education.
TDM strategies that encourage the use of alternative modes of transportation to the singleoccupant vehicle include rideshare (carpools and vanpools), transit (bus and rail), and non-motorized modes (bicycles and walking). The Plan includes $1.25 billion in TDM investmentsthrough 2030.
n Strategic System Expansion / Capital Investments
DESTINATION 2030 is a multi-modal Plan which proposes a balanced investment in all of theRegion’s modes so that the system performs at the highest level possible.
n Highways and Arterials
The 2004 RTP contains approximately $13 billion in highway and arterial improvementprojects in addition to already-committed or programmed projects. A summary of expenditureby each category is provided in the following table.
Table 1
The Plan also proposes a number of high occupancy toll (HOT) lane facilities, including acapacity enhancement parallel to SR-91 to address east-west congestion in the RiversideCounty area. While additional work is in progress through the Community and EnvironmentalTransportation Acceptability Process (CETAP) to identify and study the feasibility of specificalignments in this corridor, this Plan acknowledges the need for additional capacity in thiscorridor. Specific mode and project definition will also build on the Major Investment Study(MIS) recently initiated by the Orange County Transportation Authority (OCTA). Any corridor

Executive Summary
2004 Regional Transportation Plan 7
improvements are primarily anticipated to be implemented with user-fee−backed fundingmechanisms.
Arterial roads account for over 90 percent of the total road network and already carry over 50percent of total traffic. As it becomes more difficult to add lanes to existing freeways or buildnew freeways, maximizing the potential capacity of arterials becomes an attractive option toincreasing overall system capacity in already-developed areas. The Strategic ArterialImprovement concept could involve a combination of widening, signal prioritization and otherIntelligent Transportation Systems (ITS) deployment and grade separation at critical high-volume intersections to enhance the flow speed and capacity of the arterial. In addition to thespecific arterial improvements identified under the Smart Street Improvement Program, thisPlan proposes a significant increase in funding for arterial improvements and capacityenhancements.
n Public Transportation System
The goals of public transportation services are to ensure mobility for people without access forautomobiles and to provide attractive alternatives for drive-alone motorists or discretionaryriders. Strategies include a significant increase in service availability, major expansion in theuse of bus rapid transit (BRT) and some restructuring of services to ensure efficient utilizationof available capacity. The Plan invests an additional $5.5 billion in local bus service, includingservice for the elderly and disabled, as well as bus stops and transit centers. The Plan alsoincludes an additional $3 billion in new transit corridors, including new light and heavy raillines.
Bus Rapid TransitBus rapid transit is designed to provide fast, high-quality bus service, operating in mixed trafficor in dedicated guide-ways, utilizing low-floor buses, taking advantage of signal priority atintersections, boarding and alighting passengers through streamlined processes, andimproving bus stop spacing at planned stations. BRT combines the flexibility of bus systemswith some of the features of rail transit. It uses specially identified buses stopping only atmajor intersections/destinations.
Metrolink Commuter RailMetrolink is the regional commuter rail service that operates in six Southern Californiacounties. Southern California Regional Rail Authority (SCRRA) provides and maintainsMetrolink services and facilities. The Metrolink system consists of 53 stations, with one in SanDiego County. It carries over 36,000 passenger trips and operates 143 train trips perweekday. The Plan invests an additional $1.8 billion towards long-range capital improvementsthat will, when fully implemented, effectively double the Metrolink System’s passenger-carrying capacity. The long-range capital plan includes selective double tracking on criticalroute segments, switching and signal improvements, communication system improvements,new rolling stock, rolling stock storage/maintenance facilities, new stations and enhancementsto existing stations. Plans also include future service expansion on the Redlands and SanJacinto branch lines.

Executive Summary
8 DESTINATION 2030
Land-Use – Transit CoordinationThe regional transit program calls for increased and better coordination between transit andland-use planning. The Region must develop and adopt a long-term strategy for integratingthe planning of commercial, residential and recreational land-uses with the transportationsystem as well as increasing land-use intensities in areas with frequent transit services andgood access. This integration would complement and maximize the use of the Region’s transitsystem resulting in increased ridership, reduced congestion, and improved air quality.
Transit-Oriented DevelopmentThe regional transit program calls for the local and regional transit and planning agencies topromote transit-oriented developments (TOD) cooperatively along the major transit corridors.Transit-oriented development is a land-use planning tool that promotes pedestrian-friendlyenvironments and supports transit use. It improves transit accessibility, promotes compactland patterns, walkable environments, and reduced auto use.
Transit CentersA network of transit-based centers and corridors, supported by infill development, maximizesthe use of existing infrastructure, supports transit ridership, reduces air pollution andpreserves green space and undeveloped areas.
To encourage the use of transit and ridesharing further, new transit centers and park-and-ridefacilities will be constructed in areas that provide access to the freeway HOV network, transitcorridors and express buses. Existing transit centers can be upgraded for multi-modal usesthat support restructured transit services.
n Goods Movement Strategies
The SCAG model projects an increase of over 110 percent in truck vehicle miles traveled(VMT) by 2030. Other sources estimate the growth to be more than 200 percent by that time.Regional strategies to address these capacity needs are discussed below.
Roadway Improvements to Address Truck DemandOne strategy focuses on the concept of adding capacity to a corridor that has a high share oftruck traffic. SCAG envisions working with local and subregional representatives to expandcorridors along alignments extending from the San Pedro Bay ports, through the East-WestCorridor and out to strategic distribution points northeast or southwest of urbanized areas. ThePlan allocates a total of $16.5 billion in funding for these improvements. Given the financialconstraints in the Region, the development of this strategy is proceeding with the assumptionthat all capital construction and yearly operating costs associated with this system must besupported through the collection of user fees.

Executive Summary
2004 Regional Transportation Plan 9
Regional Rail Capacity Improvement ProgramThe regional rail capacity improvement program recommended by SCAG would be financedwith a revenue stream raised on corridor traffic hauled by the Union Pacific and BurlingtonNorthern Santa Fe Railroads. It is also recommended that discussions take place with otherWest Coast ports regarding a similar revenue approach to minimize any potential for cargodiversion.
In order to collect and distribute funds throughout the corridor for eligible capital improvementprojects, it is envisioned in concept that SCAG create a subsidiary agency. The role of thisagency, here referred to as the Southern California Railroad Infrastructure Financing Authority(SCRIFA), would be limited to issuing and servicing debt, administering the revenue collectionprocess, and distributing money for approved projects to the railroads and other implementingagencies. Similar agencies should be created for administering funds for rail projects in otherregions along the West Coast.
The proposed capacity improvements would include a total investment of $3.4 billion inSouthern California: $1.2 billion for railroad infrastructure projects and approximately $2.2billion in grade separation projects.
n Maglev System
The Intra-Regional High Speed Rail System, using magnetic levitation (Maglev) technology,would ultimately facilitate the development of a regional airport system, and connect to majoractivity and multi-modal transportation centers in Los Angeles, Riverside, San Bernardino, andOrange Counties. Without a regional airport in El Toro, the Region needs to furtherdecentralize its future growth in air passenger traffic and air cargo to regional airports in thenorthern, eastern and southern portions of the Region. Therefore, the Maglev systembecomes more important and critical to the success of SCAG’s decentralized regional aviationsystem.
The proposed system will be deployed through a public-private partnership. Its costs,estimated at $29.4 billion, will be funded through bonds and loans to be repaid through theproject-generated revenues. It is anticipated that no operating subsidies will be required.
n Aviation
DESTINATION 2030 proposes a new decentralized aviation plan called the “Regional AviationPlan.” This Plan would accommodate a total regional passenger aviation demand of 170million annual passengers (MAP). Under the Regional Aviation Plan, rather than relying onexpanding existing urban airports, the future demand for air travel will be largely served byusing available capacity at airfields located in the Inland Empire and north Los AngelesCounty, where projected population growth will be best served. This plan calls for constrainingthe LAX at 78 MAP, increasing the Ontario International Airport to 30 MAP, and a newpassenger airport at Palmdale that will accommodate 12.8 MAP.

Executive Summary
10 DESTINATION 2030
Cooperation between airport authorities is necessary to ensure efficient usage of capacity.Cooperation between airports would be accomplished through the integration of airport masterplans, and the development of memoranda of understanding and contractual agreementsbetween airports. These agreements would also identify complementary roles and marketniches between airports to increase synergy in the system and maximize utilization ofavailable airport capacities throughout the Region. For example, Los Angeles World Airports(LAWA) would play a key role in integrating master plans for the three airports it operates,namely LAX, Ontario and Palmdale.
Ground AccessThe recommended aviation strategy will have localized ground access impacts at a number ofairports. Particularly, the Regional Aviation Plan will result in dramatic increases in airportactivities (people as well as cargo) at Ontario, Palmdale and a number of other airports. Anumber of freeway and arterial improvements and transit strategies are proposed in the Planto address the ground access issues as part of the overall transportation investment in theRegion. Specific ground access improvements proposed in the Plan are identified in theTechnical Appendix to the RTP.
n Transportation Finance: Meeting Our Needs
Critical and integral to this Plan is the development of a funding strategy that will result inadditional funding over and beyond the baseline funds identified earlier. The development ofthe funding strategy is based on a set of guiding principles adopted by the Highway andFinance Task Force. These principles are:
v Maximize available resources
v Ensure revenue is adequate to maintain air quality conformity
v Enhance regional and local choice in the selection of projects for funding
v Identify revenue sources that are reasonable and consistent with current funding practicesand long-term trends in transportation finance
Within the framework of these principles, the Highway and Transportation Finance TaskForce, along with various other SCAG committees, engaged in extensive debates concerningthe adequacy and feasibility of various revenue options available to respond to the SCAGRegion’s funding shortfall. On the basis of the Task Force’s actions and policy direction, thefollowing funding strategies for the 2004 RTP were developed:

Executive Summary
2004 Regional Transportation Plan 11
Funding Strategies
v Protect and strengthen existing transportation revenues, specifically Proposition 42
v Continue or impose local transportation sales taxes where necessary and support theamendment of the State Constitution to allow 55 percent voter approval for localtransportation sales taxes
v Maximize motor vehicle fuel user-fee revenue through pay-as-you-go and debt financing(assuming an adjustment to the motor vehicle fuel excise tax rate to maintain historicalpurchasing power)
v Review methods for collecting revenues from alternative fuel vehicles
In addition to these strategies, currently, the San Bernardino Associated Governments(SANBAG) is considering the feasibility of a development mitigation fee program in addition tothe County’s Measure I renewal program (sales tax extension program). Initial revenueestimates for some approaches identified for further analyses indicate that about $1.5 billioncould be generated for arterials and interchanges in San Bernardino County.
The Plan also proposes public-private partnership arrangements incorporating user fees tosupport a number of region-wide initiatives including the Maglev system and major corridorenhancements.
In total, the baseline revenue along with the new public and private funding strategiesgenerates $213 billion for the 2004 RTP. Approximately $151 billion is generated from publicsources (existing, renewal, and increase initiatives) and about $62 billion is derived fromprivate/other funding sources.
n System Performance
DESTINATION 2030 is one of the best performing plans that SCAG has ever developed. Thepreferred strategy of the Plan demonstrates superior performance over the Baseline, or No-Project option, for every single performance criterion, including mobility, accessibility,reliability, safety and the environment. The performance is the result of the proposed growthvision and well-targeted investment strategy that complement growth. The Plan, if fullyimplemented, will result in maintaining average freeway speed and delay per capita at almostcurrent levels (Base Year 2000) in 2030 despite the population growth. In terms of cost-effectiveness, every dollar invested in the Plan will yield $3.25 in benefit. The preliminaryregional emissions analysis has produced a positive conformity finding for the Region.

Executive Summary
12 DESTINATION 2030
Conclusion
DESTINATION 2030 provides a comprehensive and multi-modal regional transportation Planthat is responsive to public input, local government input, and county transportationcommission input. The Plan meets the State and federal requirements and it reflects a visionfor the Region that balances land-use with transportation investments in a way that iscomplementary to existing investments. In addition, the RTP addresses the goals andobjectives established by SCAG and is assessed based upon a number of key performancemeasures. In light of significant funding issues within the Region over the duration of the Plan,innovative funding concepts have been developed that would enable the Region to invest inprograms and projects that will meet the Region’s transportation needs over the next 27 years.The collaboration needed to develop a consensus on DESTINATION 2030 wasunprecedented and reflects the growing realization that we must better integrate transportationand land-use planning in ways that reflect public desires for maintaining the high quality of lifethat Southern Californians expect and deserve.

CChapterhapter 11A New Destination

13DESTINATION 2030
2004 Regional Transportation Plan
CCHHAAPPTTEERR 11 AA NNEEWW DDEESSTTIINNAATTIIOONN
The Southern California Association of Governments (SCAG), the federallydesignatedMetropolitan Planning Organization (MPO) for six counties in Southern California, presentsDestination 2030, the update of the Regional Transportation Plan (RTP). Destination 2030establishes a transportation vision for an area that includes Los Angeles, Orange, SanBernardino, Riverside, Ventura and Imperial Counties, and is home to 17 million people. ThePlan is the culmination of a three-year effort focusing on improving the balance betweenregionwide land-uses, and the current and future transportation system. Exhibit 1.1 shows themajor transportation infrastructure in the SCAG Region as well as the neighboring jurisdictionsof San Diego, Santa Barbara and Kern Counties.
Why Update the Plan?
Both the State1 and the federal2 governments require through their Metropolitan PlanningRegulations that metropolitan areas update their Plans on a three-year cycle if the U.S.Environmental Protection Agency (EPA) designates them as non-attainment or maintenanceareas for air quality. The SCAG Region has non-attainment designations for multiple airpollutants.
Meeting EPA requirements is not the only reason the transportation plan requires updating ona regular basis. Plans must be dynamic and reflect current local conditions. As the economy,demographics, finances, and other factors change, SCAG has a responsibility to modify itstransportation plan for the region.
Just consider some factors that have changed since the adoption of the RTP in 2001:
v Population statistics from the 2000 Census became available after the 2001 RTP wasadopted. The growth forecast must be adjusted to reflect this new information.
v The transportation funding structure has changed with the passage of Proposition 42 andextension of the ½-cent sales tax Measure A in Riverside County. Transportation revenueforecasts must be updated to reflect population growth and the new funding realities.
v The State’s budget crisis, which became evident after adoption of the 2001 RTP, hasfurther impacted funding through the indefinite suspension of the TransportationCongestion Relief Program (TCRP). The funding for projects must be changed to reflectbudget actions to date.
1 California Government Code Section 65080 et seq.2 23 U.S. Code, Sections 134 and 135 et seq.

Chapter 1
14 DESTINATION 2030
v The South Coast Air Quality Management District (SCAQMD) recently adopted its 2003Air Quality Management Plan (AQMP). The RTP must be updated to reflect new motorvehicle emission budgets and emission factors from the California Air Resources Board(CARB). Also, the current ozone AQMP for Ventura County and the Southeast DesertModified area have been replaced with the 2003 ozone AQMPs.
v The events of September 11, 2001 (9/11), have severely impacted passenger and cargoaviation. In addition, voters in Orange County have decided to forgo the construction of acommercial aviation airport at El Toro. The Regional Aviation Strategy must be updated toreflect these changes.
v The Plan must also be changed to reflect other shifts in regional priorities determined bySCAG and the County Transportation Commissions (CTCs), such as greater emphasis onBus Rapid Transit corridors and a scaling down of the CenterLine light rail project inOrange County.
Purpose and Need
The purpose of the 2004 RTP is to present a Plan built on regional consensus that is flexibleand recognizes the unique nature of the Region, yet also meets federal and Staterequirements. The RTP must meet a number of requirements, one of which is that it cover aperiod of at least 20 years into the future. The 2004 RTP addresses the transportation needsfrom 2004 to 2030.
Transportation investments in the SCAG Region that receive federal transportation funds mustbe consistent with the RTP and must be included in the Regional Transportation ImprovementProgram (RTIP) when ready for funding. As the programming document for funds, the RTIPcomplements the corresponding years of the RTP and must be updated every two years.SCAG’s RTIP is a six-year program and is coordinated with the State TransportationImprovement Program (STIP) every two years.
Our Successes
Since the adoption of the 2001 RTP in April 2001, we have made progress in a number ofareas. The following sections briefly describe our successes in implementing the Plan.
n Transportation Funding Initiatives
When the SCAG Regional Council adopted the 2001 RTP, a commitment was made to fund a$144 billion program of transportation improvements in the six-county Southern CaliforniaRegion. A funding strategy was included with the Plan to ensure that the necessary revenuewould honor the Regional Council’s commitment.

Chapter 1
2004 Regional Transportation Plan 15
INSERT EXHIBIT 1.1 - MAP OF REGION GOES HERE.


Chapter 1
2004 Regional Transportation Plan 17
Two elements of the 2001 RTP funding strategy have already been implemented:
v The dedication of revenues derived from the State sales tax on gasoline for transportationpurposes (Proposition 42)
v Riverside County’s reauthorization of its local sales tax (Measure A)
The Passage of Proposition 42In June 2000, the Transportation Congestion Relief Program (TCRP) was enacted inCalifornia (AB 2928). This program commits gasoline sales tax revenues for specified Stateand local transportation purposes through fiscal year (FY) 2008. Prior to enacting the TCRP,revenues from the sales tax on gasoline were deposited into the State’s General Fund.
SCAG’s 2001 RTP funding strategy proposed to permanently dedicate the State portion ofgasoline sales tax revenues to transportation. Accordingly, SCAG sponsored two pieces oflegislation to implement the proposal: AB 227 (Longville) and ACA 9 (Dutra).
As part of the 2002 State budget negotiations, the key provisions of AB 227 and ACA 9 wereamended into a budget trailer vehicle, ACA 4 (Dutra). ACA 4 was a constitutional amendmentplaced on the March 2002 statewide primary ballot as Proposition 42. The measure wasapproved by an overwhelming margin −69 percent of voters−“ensuring” to a certain degreethat the State gasoline sales tax revenues will continue to be used for transportation purposesin the future (beginning in FY2009 – beyond the TCRP funding period). SCAG estimates thatProposition 42 revenues will total about $3.3 billion (constant 2002 dollars) for the Regionduring the time frame of the 2004 RTP (2004−2030). This estimate is somewhat conservativegiven the relative uncertainties of this funding source as evidenced recently by the diversionprovisions exercised by the governor and the State Legislature to address the State budgetdeficit.
The Extension of Riverside County’s Measure AIn November 2002, Riverside County secured approval by county voters to reauthorize theirlocal sales tax measure. Riverside County obtained nearly 70 percent voter approval tocontinue the half-cent sales tax for an additional 30 years (2009–2039). The extendedmeasure will provide an additional $3 billion to the county (in constant 2002 dollars). Therevenues generated from the tax will fund projects included in the county’s approvedtransportation expenditure plan and incorporated into the 2004 RTP.
n Plan Implementation
Since the adoption of the 2001 RTP, several regionally significant projects have beencompleted and put into operation, including the following notable examples:

Chapter 1
18 DESTINATION 2030
v By November 2002, 20 miles of the new 28.2-mile State Route 210 were completed,providing three mixed-flow and one HOV lane in each direction between La Verne in LosAngeles County and Fontana in San Bernardino County.
v In July 2003, the new Metro Gold Line began light rail service between downtown LosAngeles and Pasadena.
v In 2002, four new Metrolink commuter rail stations opened in Laguna Niguel/MissionViejo, Tustin, North Main Corona, and Montalvo (City of Ventura), bringing the total to 53stations.
v In May 2001, 3.3 miles of High Occupancy Vehicle (HOV) lanes were opened onInterstate 605 between South St. and the Los Angeles/Orange County line.
v In February 2002, a 7.8-mile southbound HOV lane was opened on Interstate 405between U.S. 101 and Waterford Street in Westwood.
v In December 2002, Bus Rapid Transit service in Los Angeles County was initiated onSouth Broadway and Vermont Avenue, joining the existing service on Whittier/Wilshireand Ventura Boulevard.
v In June 2003, two additional Bus Rapid Transit lines were initiated on Florence Avenueand Van Nuys Boulevard in Los Angeles.
v Since 2001, incremental implementation of transit restructuring has occurred regionwide.
In addition, SCAG, in cooperation and collaboration with our transportation partners, initiatedand completed a number of regionally significant special studies that have provided input tothe 2004 RTP. Some of these initiatives are:
1. Major corridor studies, including US-101, I-710, I-15, SR-60 and I-52. Completed Feasibility Study of Initial Operating Segment (IOS) of Maglev System3. Decentralized Aviation Strategy4. Regional Truck Count Study5. Railroad and truck improvement strategies6. COMPASS: SCAG’s Growth Visioning Initiative

Chapter 1
2004 Regional Transportation Plan 19
What Adjustments Do We Need to Make?
The following section briefly highlights the adjustments made to the 2001 RTP in developingthe 2004 RTP.
n Adjustments to the Growth Forecast
SCAG updates the growth forecasts used for every RTP. The 2004 RTP growth forecastupdates the 2001 RTP growth forecast for the Region and 14 subregions, and is developed infive-year increments from 2000 to 2030. A major distinction between the 2001 growth forecast(adopted in April 2001) and the 2004 growth forecast is a change in the forecast horizon yearfrom 2025 to 2030.
The 2004 RTP growth forecast depicts more accurately the long-term demographic andeconomic picture of the SCAG Region, by incorporating recently available information frominternational, federal and State statistical agencies, along with subregions and localjurisdictions.
The 2000 Census confirmed that the SCAG Region continues to grow at a moderate level andhas become more ethnically diverse. During the 1990s, natural growth declined due to alower fertility rate. While international migration to the Region has leveled in recent years,domestic migration has fluctuated with employment growth. In the early 1990s, during aneconomic recession, more people migrated to other parts of the nation than to the SCAGRegion. Since the mid-1990s, the economic recovery is visible and more people are migratingto the Region. In 2000, the regional unemployment rate was 4.9 percent, the lowest recordedrate in the Region’s history.
Since 2000, population and economic growth have shown unprecedented patterns. Eventhough the unemployment rate has increased from 4.9 percent to 6.1 percent, domesticmigration to the SCAG Region continues. However, much of this is reflected in statisticallylarger households rather than in the formation of new households. The ratio of new residentsto new households is roughly 7 to 1. The average persons-per-household ratio in the SCAGRegion has increased from 3.07 in 2000 to 3.16 in 2003.
The recent demographic and employment growth patterns provide a basis for updating the2001 RTP growth forecast. The assumptions about the Region’s share of the State’semployment growth, labor force participation rate, worker-to-job ratio, natural unemploymentrate, components of population growth (natural increases and net migration), and householdformation levels are updated to develop reasonable and accurate growth rates and regionaldistributions and an internally consistent growth forecast.
The forecast for the 2004 RTP growth forecast plays an important role in projecting futuretravel demand and air quality in the SCAG Region. The forecast at the small area levels areupdated based on the local input process. After reviewing local input using parameters suchas historical/future trend of household size and jobs-to-household ratio, SCAG produces a

Chapter 1
20 DESTINATION 2030
Baseline (No-Project) forecast, achieving a smooth, reasonable, and consistent pattern offuture growth rates and distribution and the relationship between households and employmentfor input to the forecast database.
A number of factors have warranted adjustment to the growth forecast, including newlyavailable Census 2000 data, the need to better reflect an aging population trend, and neweconomic realities that are closely tied to population growth and the State’s overall fiscalcondition.
n Incorporating a Growth Vision
During the assembly of the 2001 RTP, SCAG adjusted the socioeconomic projections basedon newly available data and recent trends observed at that time. The results of thoseadjustments, when analyzed through the transportation model, were surprising. SCAG foundthat by changing the distribution of growth within the Region, there were noticeable effects onthe performance of the transportation system. In fact, a reduction in employment andpopulation of 1 million, and a reallocation of jobs to housing-rich areas from elsewhere in theRegion, reduced reactive organic gases (ROG) by 8 tons, vehicle miles traveled (VMT) by 4.4percent, and hours of delay by 21 percent.
Out of this, SCAG embarked on a Growth Visioning effort that included the formation of astanding subcommittee and the creation of a work plan aimed at building regional consensuson growth. This section describes SCAG’s Growth Visioning Program that has played a vitalrole in the 2004 RTP.
The Importance of Growth and Development PatternsThe growing challenge of meeting future transportation needs, combined with limited newinfrastructure resources, means that SCAG must find more creative solutions to ensuremobility in the future. As described above, SCAG learned through the completion of the 2001RTP that growth and development patterns have a dramatic effect on the performance of thetransportation system. In particular, the distributions of people, housing units, and jobs havean effect on transportation in the following ways:
1. Mode split – The more people (housing units) there are within ½ mile of rail or ¼ mile ofbus service, the more people are likely to take transit. In addition, the more there is mixed-use development, the more non-motorized (bicycle and pedestrian) trips are generated.
2. Trip length – The more people are located near employment, amenities, or services, theshorter their trips will be.
Therefore, SCAG and its stakeholders determined that the Region must take advantage ofthese potential benefits related to urban form and development patterns.

Chapter 1
2004 Regional Transportation Plan 21
Potential Growth PatternsThe SCAG Region is defined by natural and artificial constraints that, in large part, determinethe shape of development. Oceans, mountains, national forests and various protected openspace and wilderness areas skirt the Region. The potential for variation in the Region’s futuregrowth and development patterns and the subsequent impacts on existing and emergingurban form are enormous. The region’s future is not predestined either by status quodevelopment templates or by present-day plans.
In the beginning of the Growth Visioning process, SCAG sketched various potential futuresusing a “what if” scenario-building approach. The results identified seven major variations infuture growth including:
1. Compaction2. Dispersion3. Jobs / Housing Balance4. Spokes and Rings5. Centers6. Commute Sheds7. Watersheds / Natural Systems
The examination of these “sketch” scenarios helped SCAG to conceptualize the ways in whichthe Region might develop, and the systems around which future growth might be organized.Ultimately, SCAG identified compaction, a pattern whereby future growth is concentrated inexisting developed areas with substantial infill and redevelopment, and dispersion, wherebyfuture growth is mostly on greenfield on the periphery of the Region, as the basic dichotomyfacing the Region. All other potential growth patterns were, essentially, variations atsubregional levels on one or the other of these themes.
In order to integrate a growth vision with the transportation investment decisions, SCAGinitiated an integrated planning process called PILUT (Planning for Integrated Land-Use andTransportation). In so doing, two “book-end” scenarios were created which were, in fact,detailed articulations of the compaction and dispersion themes. The first scenario, calledPILUT I, or InFill, is an attempt to maximize urban infill, intensification, and redevelopment.The second scenario, PILUT II, or “Fifth Ring,” allocates growth to newly developed areas onthe periphery of the Region. Each scenario was built as fully as possible, including completesets of socioeconomic data with the same control totals at the regional level. Further, eachscenario includes new transportation investments to fit the types of development. In simpleterms, PILUT I/InFill focuses on transit improvements, while PILUT II/Fifth Ring focuses onnew roads.
Having created two distinct scenarios, with growth distributions and infrastructure, eachscenario was tested via the SCAG transportation model. SCAG concluded that both PILUT Iand PILUT II performed very well in terms of emissions, trips, and delay, but represented quitea shift away from status quo development.

Chapter 1
22 DESTINATION 2030
Working with its committees and task forces, SCAG was able to identify portions of eachscenario that performed well in the transportation model, considered the constraints of localGeneral Plans at the county and regional level, and were consistent with SCAG’s GrowthVisioning Principles. In mixing and matching these features, SCAG created the Growth VisionAlternative, which is the basis of this Plan.
Predominant Development Patterns Threaten Our Region’s FutureOn January 9, 2003, while scenarios for the Plan were being created and analyzed, SCAGreleased the annual State of the Region report. The report found that the Region’s position isslipping in nearly every performance category related to socioeconomic well-being, includingincome and educational attainment. Among 17 major metropolitan areas nationwide, theRegion ranks 16th or worse in many of the categories examined, including attainment of highschool degrees, per-capita income, persons in poverty, and children in poverty. With furtherinvestigation, SCAG concluded that the Region has been failing to fully exploit its variouseconomic advantages, notably its positions as a major international shipping and logisticscenter and as a center for entertainment and media.
At the same time, the predominant development pattern, which encourages auto-dependencyand segregated land-uses, has continued to erode the Region’s quality of life. By relegatingthe bulk of the Region’s new housing to outlying bedroom communities, the ratio ofsubregional jobs to housing has worsened, lengthening commutes, taking commuters’ timeaway from communities and families, and degrading mobility and air quality. SCAG’s NewEconomy and Jobs/Housing Balance Report concluded that the ability to maintain pleasantand livable communities is a major factor in fueling investment, particularly in the neweconomy and entertainment fields.
In short, the Region’s current and historic development pattern is a double-edged sword. Theexisting transportation system cannot perform well given predicted levels of growth, and theRegion loses its ability to compete for old economy jobs in trade and shipping as well as neweconomy jobs.
Measuring Public Opinion – Emerging Regional ConsensusWhat emerged from the analysis was an obvious, yet daunting challenge. It was clear toSCAG that the Region must improve its transportation performance and reverse its economicdecline. To do that, the Region has to evolve in some dramatic ways that include creating amore urban template for future growth.
SCAG designed the COMPASS project (the public name for the Growth Visioning effort) witha special emphasis on public involvement. COMPASS was not intended to give residents theopportunity to react positively or negatively to solutions proposed by SCAG. Rather,COMPASS was designed to give residents the ability to create the solutions themselves.SCAG held 11 COMPASS workshops around the Region, involving over 900 participants.The workshops were based around a mapping exercise that allowed participants to design theRegion’s future by placing chips representing future development on a map.

Chapter 1
2004 Regional Transportation Plan 23
Through the outreach, it became evident that residents accept this Region’s challenges andare prepared to embrace a future Southern California that looks different from the present. Ofparticular note, COMPASS participants showed a preference for higher-density mixed-usedevelopment and for transit, and de-emphasized the building of new single-family suburbs. Inshort, Southern Californians proposed the very solutions that are expected to work.
The workshop results are the principal barometer of public input to the COMPASS program.SCAG has corroborated those results through various other formats including random pollingand a website survey. With the input of literally thousands of residents, SCAG is prepared toconclude that many Southern Californians will accept future development that features higherdensities, infill development, mixed-use land, and increased transit use. The emerging visionfor the future offers varied choices for different types of places and developments.
Creating a Feasible Land-Use/Transportation PlanThe analysis of PILUT scenarios I and II, along with the emerging public “vision” created bythe workshops, provides a working conceptualization of a growth pattern that could performwell and be acceptable. However, in order to create an RTP, a realistic vision must bepresented.
In developing the Growth Vision Alternative for this RTP, the COMPASS/Growth Visioningteam relied on various measures that ensure feasibility. Foremost among these measures wasmaintaining consistency with local General Plans through 2010. This measure ensures avision that conforms to the aggregate of planning in the Region. Additionally, the assumptionof increased urbanization and intensification, bound to be the most controversial aspect of theland-use measures, is tempered in the Growth Vision Alternative in various ways. Forexample, existing single-family neighborhoods are left intact while the majority of new, denserdevelopment is centered on major arterials and other transportation corridors. Further, theGrowth Vision Alternative assumes a conservative level of transportation finance availability.This is discussed in detail in Chapter 4.
The Growth Vision Alternative represents a programmatic best fit of visionary and realisticplanning for the Region. SCAG found that it has significant performance benefits over both thepreliminary schematic scenarios, and over a traditional transportation approach without land-use measures. Beyond the system performance, though, this approach will create high-quality, livable communities that will improve the Region’s position within the national andinternational marketplace.
Nevertheless, the Region will face significant challenges in assuring that its actual growth anddevelopment fit the pattern laid out in this RTP. SCAG intends to pursue various measuresand programmatic approaches to promote consistency. Specific approaches will be discussedfurther in Chapter 4.

Chapter 1
24 DESTINATION 2030
n Adjustments to the Aviation Strategy
The 2001 RTP was adopted just months before the September 2001 terrorist attacks. Theunprecedented upheaval in the aviation industry caused by the attacks was exacerbated bythe recent economic downturn that placed added pressures on airlines and airports strugglingto cope with an entirely new operating environment. In addition, new security requirementsand traveler concerns have changed air traveler behavior in choosing airports and airlines.
Besides these changes, aviation planning for the 2004 RTP has responded to a number ofsignificant events at the Region’s airports that have implications for overall regional airportcapacity, including:
v In the spring of 2002, the voters of Orange County rejected the development of acommercial airport at Marine Corps Air Station El Toro.
v John Wayne Airport amended its Settlement Agreement, which raised its legallyenforceable maximum capacity from 8.4 million air passengers (MAP) to 10.8 MAPthrough the year 2015.
v Los Angeles World Airports (LAWA) recently unveiled its LAX Master Plan Alternative D,putting a theoretical capacity limit on LAX at 78 MAP, which is consistent with the 2001RTP, but has ground access improvements and remote terminal development that need tobe evaluated.
v Ontario International Airport’s master plan is underway, but there is significant oppositionto the airport serving more than the theoretical runway capacity of 30 MAP.
v LAWA has initiated a new Master Plan for the Palmdale Airport.
v Regional airports in the Inland Empire have successfully marketed their facilities and aredeveloping aggressive multi-modal infrastructure programs.
v Although not prohibiting future air passenger service, March Inland Port is focusing onincreased military activity and promotion of air cargo services.
v Regional growth forecasts indicate a continued trend towards heavy regional aviationdemand with a doubling of passenger traffic by 2030.
v The Southern California Regional Airport Authority disbanded in June of 2003.
n Adjustment to the Revenue Forecast
Under the guidance of the Highway and Transportation Finance Task Force, the financialmodel has been updated. Several adjustments have been made to the previous forecast.

Chapter 1
2004 Regional Transportation Plan 25
v Changing the new base year from 1997 to 2002. FY2002 is the starting point for theupdated forecast, with an ending year of 2030. This is in contrast to the previous financialforecast in which the time horizon was from 1997 to 2025.
v Expressing revenues in constant 2002 dollars. This allows future revenues to be matchedwith costs, which are typically expressed in constant dollars.
v Including a beginning balance of prior year revenues in the forecast. This adds to theconsistency between local county transportation commission forecasts and the Plan, andimproves the matching of revenues with RTP projects.
v Adjusting sales tax revenues to better reflect current economic conditions in the shorttermand modifying longer-term forecasts further. Modifications were made in consultation withthe local county transportation commissions.
v Including a portion of gas tax subvention revenues to support some regionally significantarterial improvement activities. Gas tax subventions refer to the share of State gas taxrevenues that are apportioned directly to cities and counties for use on the street and roadsystem.
v Adding Proposition 42 revenues to the baseline revenue scenario due to the March 2002ballot results. This measure dedicates the State gasoline sales tax revenues fortransportation purposes in the future (beginning in FY2009beyond the TCRP fundingperiod).
v Incorporating Riverside County’s new sales tax extension funds Measure A, as renewedby the voters in November 2002.
v Including Riverside County’s Transportation Uniform Mitigation Fee (TUMF) initiative inthe baseline revenue forecastprojected to generate nearly $3 billion in revenues duringthe time frame of the 2004 RTP. Western Riverside County cities and the County ofRiverside approved a developer fee on new construction (TUMF) to help pay for arterialimprovements and new transportation corridors.
n Adjustments to Plans and Programs
A number of events have occurred since the adoption of the 2001 RTP that require revisionsto some of the transportation investments included in the 2004 RTP. These adjustmentsensure that the RTP accurately reflects current conditions and stays current with localtransportation planning decisions, including those of the county transportation commissions.
Recent Voter ActionsIn November 2002, Riverside County voters approved the extension of their Measure Atransportation sales tax, which dedicates funding towards a specific list of projects and

Chapter 1
26 DESTINATION 2030
programs. These projects and programs have been incorporated into the 2004 RTP. In June2003, voters in the City of Irvine rejected the CenterLine light-rail route to the IrvineTransportation Center. This prompted the Orange County Transportation Authority (OCTA) toshorten the planned light rail line and select a new southern terminus at John Wayne Airport.
State Budget CrisisReductions in funding for transportation projects resulting from the State budget crisis haveprompted delays in project construction. Further, there is considerable uncertainty as to whenthe State fiscal situation will improve and how future State budgets will influence transportationfunding.
State Route 91 Express Lanes PurchasedIn January 2003, OCTA purchased the SR-91 Express Lanes for $207.5 million. Thiseliminated the non-compete provision that prevented OCTA, RCTC and Caltrans from addingcapacity to the freeway corridor, either by adding or extending carpool lanes or mixed flowlanes.
Metro Bus Rapid Transit Expansion ProgramThe success of the Los Angeles County Metropolitan Transportation Authority’s (LACMTA)Bus Rapid Transit demonstration program has prompted the agency to accelerateimplementation of its proposed additional corridors. Since the adoption of the 2001 RTP, fournew bus rapid transit lines have been initiated ahead of schedule, namely the SouthBroadway, Vermont, Florence, and Van Nuys corridors in Los Angeles County. These four jointhe existing Bus Rapid Transit service on Wilshire/Whittier and Ventura Boulevard. The entireexpansion program is now expected to be completed by 2009.
San Fernando Valley North-South CorridorA recent study completed by LACMTA has identified improvements for the San FernandoValley North-South Corridor, including a series of Bus Rapid Transit service improvementsand potential peak period lanes and off-street transitways.
Community and Environmental Transportation Acceptability Process (CETAP)CorridorsAn innovative effort was launched in Riverside County in 2000 to integrate transportation,community, environmental and land-use initiatives into the future transportation plans forRiverside County. The CETAP project has resulted in a number of consensus decisions thatrequire updates to the 2001 RTP. In February 2003, the Riverside County TransportationCommission (RCTC) selected the preferred alternative for the Winchester/Temecula Corridor.This alternative consists of the widening of the existing I-215 and I-15 freeways. In June 2003,the RCTC Board approved the preferred alternative for the Hemet/Lake Elsinore Corridor.This alternative consists of improvements to the Ramona Expressway/Cajalco Road corridorsouth of Lake Matthews.

Chapter 1
2004 Regional Transportation Plan 27
Our Planning Approach
This section provides an overview of the planning requirements and planning approach indevelopment of the 2004 RTP.
n Overview of Federal Requirements
Under TEA-21, the U.S. Department of Transportation (USDOT) requires that MPOs preparelong-range transportation plans. In federally designated non-attainment and maintenanceareas for air quality, these plans must be updated every three years. SCAG adopted the 2001RTP in April 2001. The 2004 RTP is an update to the 2001 RTP, and it replaces the 2001 RTPin its entirety.
The federal requirements for metropolitan transportation plans include the following keyprovisions:
v Plans must be developed through an open and inclusive process that ensures public inputand seeks out and considers the needs of those traditionally underserved by existingtransportation systems.
v Plans must be for a period of not less than 20 years into the future.
v Plans must reflect the most recent assumptions for population, travel, land-use,congestion, vehicle fleet mix, speeds, employment and economic activity.
v Plans must be financially constrained and revenue assumptions must be reasonable inthat they can be expected to be available during the time frame of the Plan.
v Plans must conform to the applicable State Implementation Plans (SIPs) for air quality.
v Plans must consider seven planning factors and strategies, in the local context, as follows:
1. Support the economic vitality of the United States, the individual states andmetropolitan areas, especially by enabling global competitiveness, productivity andefficiency
2. Increase the safety and security of the transportation system for motorized and non-motorized users
3. Increase the accessibility and mobility options available to people and for freight4. Protect and enhance the environment, promote energy conservation and improve
quality of life5. Enhance the integration and connectivity of the transportation system, across and
between modes throughout the state, for people and freight6. Promote efficient system management and operation7. Emphasize the preservation of the existing transportation system

Chapter 1
28 DESTINATION 2030
n Overview of State Requirements
The State, whose requirements largely mirror the federal requirements, has adopted extensiveRTP guidelines. Key additional State requirements are briefly discussed below.Transportation plans must comply with the California Environmental Quality Act (CEQA) andthe Draft 2004 RTP will meet those requirements. In addition, the first five years of Plans mustbe consistent with the five-year STIP as incorporated into the SCAG RTIP. Further, the Stateguidelines call for program-level performance measures that include objective criteria thatreflect the goals and objectives of the RTP. The State guidelines also require regional Plans tocover three specific areas: a policy element, an action element and a financial element. Thepolicy element of this RTP is presented in Chapter 3 of this document (Our Vision). The actionand financial elements are described in Chapter 4 (Potential Solutions) and Chapter 6(Implementing Our Plans).
n SCAG’s 2004 RTP Update Process
This RTP focuses on linkages between land-use and transportation investment decisions.Severe funding constraints, coupled withdifficulty in demonstrating transportationconformity as the Region moves closer to theattainment year for the federal air qualitystandards, require SCAG to develop creativesolutions to the Region’s transportationchallenges.
To address the challenges faced by theRegion as well as update the RTP on theschedule required by the USDOT, SCAGinitiated a bottom-up collaborative planningprocess that included over 10 task forces andnumerous subcommittees. Task force mem-bers included hundreds of local and regionalofficials, representatives of federal and Stateagencies and representatives of communitygroups and environmental organizations. A list of the task forces and key committees that hada specific role in developing recommend-ations in the 2004 RTP is presented in Table 1.1. Acomplete list of the task forces and subcommittees is provided in the Technical Appendix.
Using this input structure, SCAG developed an integrated planning process called Planning forIntegrated Land-Use and Transportation (PILUT) to update the 2004 RTP. PILUT integratesthe transportation planning, growth visioning, and the State-required Environmental ImpactReport (EIR) analysis into a single, unified process. The objective is to eliminate redundancy,ensure close coordination, and optimize the use of available resources. The PILUT processrequires that a single set of alternatives be developed and evaluated that meet the EIR
Regional Plan Task Forcesand Key Transportation
Subcommittees
• Aviation
• Goods Movement
• Highway and Transportation Finance
• Maglev
• Regional Transportation DemandManagement
• Regional Transit
• Plans & Programs Technical AdvisoryCommittee (TAC)
• Forecast
• Growth Visioning Subcommittee
Table 1.1

Chapter 1
2004 Regional Transportation Plan 29
requirements and at the same time are meaningful and informative alternatives fortransportation implementation.
Figure 1.1 depicts the PILUT process used in evaluating and narrowing the alternativesleading to the preferred strategy described in the 2004 RTP.
Figure 1.1
n Transportation Planning in the SCAG Region
SCAG, as the designated MPO, is responsible for developing, coordinating, monitoring andupdating the RTP for the six-county Region in Southern California. SCAG develops the RTP incoordination and consultation with the county transportation commissions, subregionalcouncils of governments (COGs), transit operators and other transportation stakeholders.This section summarizes the planning environment and discusses how SCAG integrates theplanning activities of each of the counties in the Region to ensure a balanced, multi-modalPlan that meets regional as well as county-specific goals.
Each of the six counties in the SCAG Region has a transportation commission or authoritywith the exception of Imperial County, where the Imperial Valley Association of Governments(IVAG) serves as the countywide transportation agency. These agencies are charged withimplementing countywide transportation planning activities, allocating locally generatedtransportation revenues and, in some cases, operating of transit services.

Chapter 1
30 DESTINATION 2030
In addition, there are 14 subregions within the SCAG Region. The subregions are groups ofneighboring cities and communities (sometimes comprising an entire county) that worktogether to identify, prioritize and seek transportation funding for needed investments in theirrespective areas.
The SCAG Region also comprises all orpart of seven air quality non-attainmentor maintenance areas in five air basins.Federal law requires that transportationand air quality planning are coordinatedin these non-attainment and main-tenance areas.
In addition, the SCAG Region includesall of Caltrans Districts 7, 8 and 12, andthe Imperial County portion of District11.
Table 1.2 lists key stakeholders in thedevelopment of the 2004 RTP.
n Public Outreach
As the MPO, SCAG is required toimplement a public involvement processto provide complete information, timelypublic notice and full public access tokey decisions and to support early andcontinuing public involvement indeveloping its regional plans3. SCAGformally adopted a Public ParticipationProgram in September 1993. Further,Title VI of the Civil Rights Act of 1964and associated regulations and policies,including President Clinton’s 1994Executive Order 12898 on Environ-mental Justice, seek to assure thatminority and low-income populationsare involved in the planning process.
3 23 CFR of the federal metropolitan planning regulations
Stakeholders in the Developmentof the 2004 RTP
Southern California Association of Governments
County Transportation Commissions / Agencies Los Angeles Orange San Bernardino Riverside Ventura Imperial
Subregional Councils of Governments (COGs) Arroyo Verdugo Cities Coachella Valley Association of Governments Gateway Cities COG Imperial Valley Association of Governments Las Virgenes-Malibu-Conejo COG City of Los Angeles North Los Angeles County Orange County COG San Bernardino Associated Governments San Gabriel Valley COG South Bay Cities COG Ventura County COG Western Riverside County COG Westside Cities COG
Local and County Governments
Other Operators and Implementing Agencies Caltrans Airport Authorities Port Authorities Transit / Rail Operators
Transportation Corridor Agencies
Resource / Regulating Agencies USDOT (FHWA, FTA, FAA, FRA) US EPA Caltrans CA Air Resources Board CA EPA Air Districts
Other private, non-profit organizations, interest groups, andTribal Governments (See Exhibit 1.2)
Table 1. 2

Chapter 1
2004 Regional Transportation Plan 31
Insert Exhibit 1.2 Map of Tribal Governments


Chapter 1
2004 Regional Transportation Plan 33
To fulfill these expectations, SCAG has used a combination of methods to stimulate publicinvolvement. For the development of the 2004 RTP, the following public outreach methodshave been used:
v Presentations on the RTP to established organizations on the RTP throughout the Region
v Specific public workshops on the RTP throughout the Region
v Posting of all public outreach events via an Outreach calendar on the SCAG website
v Direct outreach to minority and low-income populations
v Developing written and visual material to communicate the status and content of the RTP,including fact sheets and presentations. A public comment form used throughout theoutreach program (in person at public meetings and online)
v SCAG’s website, featuring a section dedicated to the 2004 RTP, including public meetingnotices and the latest written information on the RTP
v Outreach to media including newspaper editorial boards, local television and radiostations, and ethnic media
v Selected radio and television appearances by senior SCAG staff
In addition to these targeted outreach efforts, all regular and special meetings of the RTP taskforces, the Transportation and Communications Committee and the SCAG Regional Councilare publicly noticed and opportunities for public comment are provided. Specific publiccomments on the RTP are being recorded and considered by SCAG in the development of the2004 RTP.


CChapterhapter 22Transportation PlanningChallenges and Trends

35DESTINATION 2030
2004 Regional Transportation Plan
CCHHAAPPTTEERR 22 TTRRAANNSSPPOORRTTAATTIIOONN PPLLAANNNNIINNGGCCHHAALLLLEENNGGEESS AANNDD TTRREENNDDSS
This chapter describes factors that pose significant transportation challenges in the SCAGRegion.
The Shape and Pattern of Future Growth
n The Centrifugal Force of Growth in the Region
The population in the SCAG Region is more than 17 million in 2003 and represents 6 percentof the national population. About 1 in 17 persons in the United States lives in the six-countySCAG Region. The nation’s second-largest metropolitan area, the Region grew by 1.9 millionpersons, or 13 percent, during the 1990s. The ring of counties around Los Angeles postedhefty population growth rates during the last decade. Riverside grew 32 percent to 1.6 million,San Bernardino 20.5 percent to 1.7 million, and Orange 18.1 percent to 2.8 million. Alloutstripped growth rates in Los Angeles County—up 7.4 percent to 9.5 million. Even a modestgrowth rate in Los Angeles County accounted for slightly over one-third of the Region’spopulation growth over the last decade.
The California Department of Finance estimated that the population in the SCAG Regionincreased at a compounded annual rate of 2.1 percent between April 2000 and January 2002,slightly higher than the rate for the State as a whole. In 2002, while gaining about 330,000people, the Region lost 22,000 jobs and had a slight decline in per capita income. Theunemployment rate in the Region (6.1 percent) was higher than the national average (5.8percent) but lower than the State average (6.7 percent).
Over the next 25 years, the regional Baseline (No-Project) projections of growth foreseeanother 6 million people added to this large and diversifying area. Children of existingresidents fuel this population growth and are mostly of Hispanic and Asian ethnicity.Immigrants are attracted here because of jobs and the hope for a better life. Nearly one inthree persons living in the Region is foreign born. At the same time, a huge “Baby Boom”population group will retire and set the stage for an unprecedented transfer of wealth, market-buying power, and demand preferences. As racial minorities and immigrants move to thesuburbs, and as older majority households retire, more diverse lifestyle needs may emerge,and this may shift historical development patterns.
The Los Angeles Basin, north Orange County and coastal areas of the Region are job-richand densely populated where a large segment of the middle class households is priced out ofthe housing market. As a result, many are forced to seek affordable homes in the outlyingareas. This trend, if left unabated, would lead to urbanization of outlying deserts and mountain

Chapter 2
36 DESTINATION 2030
areas, aggravating transportation congestion, and at the same time, affecting the Region’s airquality and ecological balance. Steady development over the years has pushed averagedensity levels in this widespread Region above those found in any other metropolitan area inthe nation. This is challenging assumptions about how to accommodate expected futuregrowth, where it will occur and whether it can be reoriented to achieve a higher quality of life.
DemographicsAlthough Whites make up a two-thirds majority in the nation as a whole, there is no racial orethnic majority in California or in the Region. In 2000, Hispanics comprised 41 percent of theRegion’s population, followed by Whites at 39 percent, Asians at 14 percent and Blacks at 7percent.
Population growth resulted from large net increases in three population groups: aging “BabyBoomers,” their young childrenthe echo-boomersand immigrants, mostly from Mexico,Central America and Southeast Asia. The national increase through births accounted for mostof the population gain in the Region, as births over deaths accounted for two-thirds ofpopulation gain.
Housing and HouseholdsAt the same time, nearly 400,000 housing units were added between 1990 and 2000. Thisbrought the housing stock in the Region up to 5.7 million units, but it was not enough. Onlyone unit was built for every five persons added to the Region. Population growth exceededhousehold growth and the average persons per unit rose from 2.94 in 1990 to 3.07 in 2000.This was in sharp contrast to a decade-to-decade drop in household size experienced by thenation overall.
Nevertheless, housing construction gains were in line with the net job increase in the Region.Southern California added a half million jobs over the last decade. Consequently, 1.3 jobswere added for every housing unit. The job-to-housing unit ratio was also 1.04 jobs for everyhousing unit in the year 2000. Population growth outpaced household, housing, and jobgrowth.
The decline of median household income and the larger household size of the immigrantpopulation, combined with the undersupply of new housing units, shaped the housingperformance outcome of the last decade. When comparing homeownership in the nine largestmetropolitan regions in the nation, the Region’s homeownership rate of 55 percent in 2000ranked eighth, above only the New York region. Among the largest metropolitan regions,Southern California had the highest percentage of owner and renter households with housingcosts greater than 30 percent of the household income. Contrary to the decreasing trend atthe national level, the percentage of housing considered crowded increased in every county inthe Region from 1990 to 2000. Almost 20 percent of the households in the Region lived incrowded housing in 2000, compared to only 6 percent for the nation.
Per capita income and average payroll levels per job have declined in Southern California asmeasured against other major metropolitan areas in the country during the last decade. The

Chapter 2
2004 Regional Transportation Plan 37
Region lost ground to other major metro areas in terms of both relative economic performanceand competitiveness as measured by per capita, median and poverty income levels. Forinstance, median income dropped over the decade, falling from $47,760 in 1990 (afteradjusting for year 2000 dollars) to $45,903, or a drop of 4 percent. Poverty levels haveincreased steadily over the past 30 years in the Region, rising from about 10 percent in 1970to nearly 16 percent in 2000. During the last decade, median home values in California andthe most populous areas of the Region have risen due to construction activity laggingpopulation growth, low inventory and historically low interest rates. Median home values inCalifornia now exceed the $350,000 mark, which is more than double the national median.
Among the nine largest metropolitan areas,the SCAG Region also has the lowest averagepayroll per job. When comparing per capitaincome among the 17 largest metropolitanregions in the nation, the Region dropped fromthe fourth highest in 1970, to 7th in 1990 and16th in 2002. Median household incomedeclined during the last decade, contrary tothe improving trends in the State and thenation.
Based on the 2000 Census, close to one in sixpersons of all ages and one in five childrenunder 18 in Southern California are in poverty.During the 1990s, poverty rates for bothmeasures increased significantly in the Regionwhile decreasing at the national level. Amongthe nine largest metropolitan regions in thenation, the SCAG Region had the highestpoverty rate among persons of all ages, andamong children under 18. Unlike SouthernCalifornia, many of the largest metropolitanregions reduced poverty rates during the1990s, particularly for children under 18.
Mobility and Air QualitySince 1990, the Region has consistently ranked as the most congested metropolitan region inthe nation. However, there were some positive signs. During the 1990s, the growth rate ofvehicle miles traveled (VMT) dropped sharply from the 1980s. Transit use increased by 20percent, higher than the population growth of 13 percent during the 1990s. However, prior tothis gain, transit usage declined by more than 10 percent during the latter part of the 1980s.The overall pattern of mode of transportation to work choice remained essentially unchanged.In 2000, Southern California had the highest carpooling share to work among the nine largestmetropolitan regions in the nation.
The SCAG Region At-A-Glance
n 38,000 square miles connected by
9,000 lane miles of freeway
n More than 17 million people living in 6counties and 188 cities – 2002
n More than 5.7 million housing units
n No ethnic majority
n More than 7 million jobs
n Ninth largest economy in the world
n LAX , fifth largest airport in the world
n Los Angeles and Long Beach Ports
largest maritime port system in the
U.S.
n Regional Median Home Price
$328,000 in August 2003
n 2003 Median Family Income of nearly$50,300/yr (HUD)

Chapter 2
38 DESTINATION 2030
During the 1990s, the Region achieved consistent improvements in the number of daysexceeding federal or State standards for ozone and carbon monoxide. The Region exceededthe federal one-hour standard for ozone during 40 days in 2000 compared to 130 days in1990. However, in 2002, the number of days exceeding the federal one-hour standard forozone increased to 49 days from 36 days in 2001. The number of days for health advisoryalso increased from 15 to 18 days between 2001 and 2002. Available data for 2003 indicatedthat it would be even worse than in 2002.
n The Regional Baseline (No Project) Growth Projection for 2030
Baseline (No-Project) growth represents a trend projection that assumes continuation ofexisting land-use policies, and completion of regional transportation projects that are alreadycommitted for funding. This projection excludes consideration of growth proposed in this RTP,and projects that are proposed in the Plan over and beyond the committed projects, includingMaglev and other corridor improvement projects. By 2030, the Region will have 22.9 millionpersons by adding 6.3 million persons and will reach 10.2 million jobs by adding 2.7 millionjobs. This level of population growth is expected to yield 2.1 million additional households inthe Region at an average of 3 persons per household.
In contrast to the 2001 RTP, baseline growth forecast, employment and household growth areexpected to drop while population growth is increased. These adjustments are based onrecent trends and the local input and review process.
The components of population growth are net migration (people who move here versus thosewho move away) and natural increase (births minus deaths). Net migration is comprised ofboth domestic and international migration. The Region is expected to experience a net loss indomestic migration, but this will be more than offset by international immigration. As theRegion grows, it will become older and less diverse. Hispanics will assume the role of themajority ethnic group, with a representation of 51 percent of the Region’s population. Theaging population and lower birth rates, especially among Hispanic women, will moderate thenumber of persons per household.
The population in the Region will become older because of aging “baby boomers.” Thepopulation aged 65 and older will grow four-and-a-half times faster than the working agegroups (15−64) between 2000 and 2030. The older age group percentage of the totalpopulation will nearly double, rising from 10 percent in 2000 to 17 percent in 2030. Themedian age will rise from 32.3 years in 2000 to 36.1 in 2030.
The number of persons per household will remain high in 2030 as upward pressures fromincreasing Asian and Hispanic populations with relatively large households (especially recentimmigrants) overwhelm the downward pressures exerted by aging “baby boomers” and lowerbirth rates.
The demographic changes will affect the size and makeup of the labor force. Due to theretirement of “baby boomers,” the Region may experience severe shortages of skilled labor.

Chapter 2
2004 Regional Transportation Plan 39
If this is not made up by domestic migration, then more foreign immigration will be needed. Alarge portion of new residents will be recent immigrants or children of recent immigrants. Theskills of the new labor force will probably not match the requirements of the new jobs. Long-term strategies should be considered, including appropriate and enhanced educationalopportunities and a phased retirement system.
Shifting demographic patterns will also influence travel behavior. Recent immigrants tend touse transit much more than other population groups. Urban density levels may also increasesince foreign-born residents urbanize less land. Many SCAG Region foreign-born, Hispanic,and Asian residents have modest incomes, larger household sizes, and tend to double up inexisting areas, thereby increasing population density. The socioeconomic characteristics andlifestyle choices associated with immigration are consistent with a more compact urban form.
Jobs will be created across all employment sectors. The largest gains will be in low-wage, low-skill service sector jobs as the shift in the Region from manufacturing jobs to service sectorjobs continues. Between 2000 and 2030, service sector jobs will lead in total growth andcomprise the largest share of total jobs. The makeup of service sector jobs will also change,with employment opportunities ranging from the fast food sector to investment banking.
Workforce housing affordability and availability issues have affected quality of life in theRegion. Not enough housing has been built to accommodate population growth. There is alsoan imbalance in the location of jobs and houses. The insufficient housing in job-rich urbanareas supported existing trends in urban sprawl, longer commute patterns, congestedfreeways and worsening air quality. Homeownership rates in the Region are lower than in therest of the country and lower in coastal areas than in the inland valley and desert areas.
During the 1970s and 1980s, many achieved the dream of suburban homeownership.However, there were also some negative consequences of suburban development. Inparticular, racial and social disparities and environmental problems became more visible.Chief among these were air quality problems and worsening congestion.
Table 2.1 summarizes Baseline (No-Project) growth versus the Plan Forecast for the Draft2004 RTP for each subregion in terms of population, households, and employment. For adescription of the Plan Forecast, please refer to Chapter 4.

Chapter 2
40 DESTINATION 2030
Table 2. 1

Chapter 2
2004 Regional Transportation Plan 41
EXHIBIT 2.1 2000 POPULATION


43DESTINATION 2030
2004 Regional Transportation Plan
EXHIBIT 2.2: 2030 POPULATION


45DESTINATION 2030
2004 Regional Transportation Plan
EXHIBIT 2.3: POPULATION CHANGE 2000 TO 2030


47DESTINATION 2030
2004 Regional Transportation Plan
EXHIBIT 2.4: 2000 EMPLOYMENT


49DESTINATION 2030
2004 Regional Transportation Plan
EXHIBIT 2.5 2030 EMPLOYMENT


Chapter 2
53DESTINATION 2030
2004 Regional Transportation Plan
EXHIBIT 2.6 EMPLOYMENT CHANGE 2000 TO 2030


Chapter 2
2004 Regional Transportation Plan 53
Meeting Our TDM Goals
The 2001 RTP envisioned coupling transit and non-motorized travel with ridesharing(carpooling and vanpooling) and encouraging people to work at home (e-commuting,telecommuting, teleworking, and building home-based businesses) to stem the tide of solodriving and the overall growth in vehicle miles of travel (VMT).
The 2002 State of the Region report indicates that the Region’s performance is mixed. VMTalmost doubled between 1980 and 2000. Total transit boardings increased 7 percent over1999 (up continuously since 1995), while annual bus miles decreased by one million in LosAngeles County. The average journey to work travel time increased in every SCAG countywith a regional average increase from 26 to 29 minutes. Finally, the transportation to workmode of choice in the Region remained essentially unchanged during the 1990s with 72percent of workers driving to work alone.
Within the Region, Los Angeles County has the lowest rate of workers who drive alone towork, while Orange and Ventura Counties have the highest rates. San Bernardino, Riversideand Imperial Counties showed noticeable improvements in reducing the Single OccupancyVehicle (SOV) commute. In fact, the three inland counties had a higher rate of workers whocarpooled to work than the three coastal counties.
Biking and walking primarily constitute non-motorized transportation. Bikeways and pedestrianpaths can play a significant role in meeting the transportation needs of our Region at the locallevel. Particularly, non-motorized transportation plays a bigger role in the densely populatedmixed land-use area and corridors.
Non-motorized transportation, by its very nature, would be more effective at a local level incommunities that are densely populated and have a good mix of land-uses, includingcommercial, residential and institutional. Non-motorized transportation mainly serves as arecreational mode at the regional level. Unless substantial investments in non-motorizedtransportation are coordinated with other modes and facilities, it would be very difficult to gaina significant increase in mode share of the work trips for non-motorized transportation in 2030.
The Region’s bikeways encourage non-motorized commutes, serve as recreational facilitiesand provide inexpensive, environmentally friendly transportation opportunities. More than2,000 miles of Class I and II bikeways exist just between Los Angeles and Orange Counties.In addition, the Region is served by an extensive network of mountain bike trails, which arealso designated for hiking and horseback riding. A Class I bikeway has a right-of-waycompletely separated from any street or highway for bicycle travel. A Class II bikeway has astriped lane for one-way bicycle travel on a street or highway.
According to the 1990 Census, biking and walking accounted for approximately 0.7 and 3.0percent of total work trips, respectively. SCAG’s State of the Commute report indicates thatbiking and walking have hovered around 0.5 and 1.5 percent, respectively, in the 1990s.

Chapter 2
54 DESTINATION 2030
Bicycling and walking are important elements of an integrated, intermodal transportationsystem. Constructing sidewalks; installing bicycle parking at transit centers; teaching childrento ride and walk safely; installing curb cuts and ramps for wheelchairs; constructing exclusivebike lanes and striping bike lanes; and building trails contribute to national and regionaltransportation goals of safety, mobility, economic growth and trade and enhancement ofcommunities and the natural environment. The following strategies are recommended toimprove bicycle and pedestrian movement.
v Collect and monitor bicyclist- and pedestrian-related accident datav Utilize GIS and mapping tools to prioritize high-accident locationsv Develop appropriate streetscape and arterial boulevard improvementsv Promote effective public parking plansv Adopt bicyclist-/pedestrian-friendly local zoning, land-use and development permit
conditionsv Fund and build infrastructure improvements to provide improved bicyclist/pedestrian
accessibility, mobility and personal safety and security
It appears that progress is being made in the rideshare area. Among the nine largestmetropolitan regions in the nation, the SCAG Region had the highest share of workers whocarpooled to work in 2000. However, the rate of growth for teleworkers has slowed during the1990s. Also, more has to be learned about how the current economic downturn affects home-based business viability and the resulting impact of additional commute trips.
Unprecedented Demand on Our System
The growth described in the following section is likely to place unprecedented demand on oursystem, which is already overburdened by the current level of demand. This section describesthe challenges that ourtransportation system will facein accommodating that futuregrowth.
n Highways and Arterials
Both industry and residents areserved by a vast transportationnetwork that includes over 9,000lane miles of freeway, more than42,000 lane miles of arterials,several large public transit systems,four major airports (including theworld’s fifth largest), as well as thelargest maritime ports system in theUnited States. Yet the Region’s
Figure 2.1

Chapter 2
2004 Regional Transportation Plan 55
transportation system has not kept pace with population and transportation demand. Figure2.1 illustrates this point. While population more than doubled from year 1960 to year 2000, ourState highway miles increased by less than 30 percent.
Consequently, our Region’s congestion has increased dramatically, affecting both persontravel and goods movement. The vast majority of trips (99 percent) rely on the highway andarterial network regardless of whether they are made using automobiles, buses, vanpools,trucks or bikes. The regional and local highway system faces mounting congestion that affectspersonal mobility, freight movement and air quality. The preservation, management andselective expansion of this system are crucial to maintaining the Region’s economic vitalityand quality of life.
For year 2000, total daily delay from congestion was estimated to be 2.2 million person-hours.If current trends persist, this delay is expected to more than double to 5.4 million person-hours. Reasons for delay and congestion vary and include merging, weaving, accidents,weather, special events, and lane closures, among others. However, these reasons are allintricately linked to overall highway productivity. The roadway system loses its productivitywhen it is unable to serve the number of vehicles that it is designed to serve. This occurs atmajor interchanges (or accident locations) that are often referred to as bottlenecks. Theresulting productivity loss of the system occurs only during peak demand periods. So in effect,when demand is highest, system capacity actually decreases. Figure 2.2 presents the resultsof an analysis based on real traffic counts around the Region’s freeway system to estimate thelost productivity in the SCAG Region for the morning and afternoon peak demand periods aswell as mid-day and night periods. The “Lost Lane Miles” shows the equivalent lost capacitydue to the lost productivity the system experiences. The PM Peak productivity loss of almost380 lane miles represents an investment of almost $8 billion if the Region were to replacethem with expansion projects. Fortunately, there are less expensive strategies to recapturethis lost productivity in an efficient manner. These are discussed in Chapter 4.
Figure 2.2

Chapter 2
56 DESTINATION 2030
n Public Transportation
Starting in the early 1980s, the Region, and Los Angeles County in particular, embarked on anaggressive path of transit system development. Many of these projects (e.g., Metro Blue Line,Red Line, and Metrolink) have been completed and now provide meaningful choices to theresidents of this Region.
Yet even these critical projects did not reduce demand on our arterial and freeway systems.Figure 2.3 demonstrates this point. It shows the trend of transit usage in the Region from year1985 to year 2000. Note that transit ridership has been increasing significantly since 1995, inlarge part due to the completion of the aforementioned transit systems. Yet the total transitridership in the Region is only slightly above the ridership in 1985. Transit ridership increasessince 1995, once normalized with overall population growth, are somewhat less impressive.Figure 2.4 shows transit trips per capita over the same period. Note that the overall increase intransit trips per capita per year is less than the total transit trips in the previous figure. In fact,on a per capita basis, the Region’s transit ridership is still lower than 1985 levels.
Figure 2.3

Chapter 2
2004 Regional Transportation Plan 57
Figure 2.4
Recent strategies are showing promise. This is especially true for Bus Rapid Transit projectsin Los Angeles County. During July 2000, because of new Bus Rapid Transit routes, MetroBus ridership reached its highest point in more than six years, averaging over 1.25 millionboarding patrons, compared to 1 million carried a year earlier.
Similar to highways and arterials, the productivity of transit services is not optimal. Table 2.2shows the average utilization of the different transit services in the Region. As the tableshows, transit utilization as measured by available seat miles is generally less than 50 percent(except for light rail in Los Angeles). It is clear that transit around the world never approaches100 percent utilization. In fact, the table would look different if only peak utilization werepresented. However, such data are not available. Table 2.2 demonstrates the potential forimprovements through strategies that increase ridership for current and/or restructured transitservices.

Chapter 2
58 DESTINATION 2030
Table 2.2
Another challenge facing transit service in the SCAG Region is the need to coordinate morethan 40 transit agencies. Many residents use more than one service and the coordinationamong these services is critical. Coordination includes schedule and fare payment methods.Moreover, residents that want to use transit to travel between counties find few choices, withMetrolink commuter rail being the most well-known service. Promising initiatives such as the“GOVENTURA Smartcard” and the Universal Fare Card in Los Angeles allow transit users touse the same payment method regardless of which transit service they use.
The cost of transit is also placing a large burden on the Region’s finances. Subsidizing transitis common across the nation and around the world. There are no significant transit operatorsthat are self-sufficient and do not require some level of subsidy. However, the SCAG Region’ssubsidy levels can be reduced, especially given the fiscal environment facing the Region.Table 2.3 summarizes the subsidy levels for transit in the Region, which ranged between 22percent and 47 percent in year 2000 for the five counties that provide significant transitservices. To pay for these subsidies, every person in the Region pays between $12 and $77annually now. Strategies to reduce transit subsidies include increasing ridership, increasingrevenues, or a combination of both. The Region, to the extent possible, must be mindful not toreduce overall transit ridership in an effort to improve subsidy levels.

Chapter 2
2004 Regional Transportation Plan 59
Table 2.3
n Goods Movement
The Southern California Region is facing a crisis in goods movement transportation,characterized by dramatic growth in rail and truck traffic, limited transportation funding, andhigh infrastructure improvement costs. Forecasts of greater regional population andemployment, and projections of increasing international and domestic trade volumes, all leadto worsening congestion and the potential of gridlock on the Region’s surface transportationsystem.
Truck TravelAlmost all of the short-haul and a significant share of medium- and long-haul movement ofgoods occurs by truck. Most trucks share our roadway network with other vehicular traffic.SCAG’s Heavy Duty Truck Model (HDT) estimates that this network carried 795,000 averagedaily trips in 2002. This equates with 25,500,000 of vehicle miles traveled (VMT). Projectedregional truck VMT is shown in Figure 2.5. Examples of freeways with heavy truck volumeinclude the I-710, SR-60 and I-15:
v At SR-60 east of Azusa Avenue in Los Angeles County, average daily truck volumeexceeded 31,000 trips, which is almost 14 percent of total daily traffic.
v At SR-60 east of Euclid in San Bernardino County, truck volume totaled 36,000 trips,almost 18 percent of total traffic.
v Through Cajon Pass, I-15 north of SR-138 carries over 14,200 trucks per day (13 percentof total traffic), with the majority being 5-axle trucks (indicative of large-load, long-haultrucking).
v Along I-15 just south of the I-10 interchange, average daily truck volume totaled over25,000 trips, which is almost 17 percent of total daily traffic.

Chapter 2
60 DESTINATION 2030
Figure 2. 5
Freight Railway SystemThe freight railway system is critical to the SCAG Region. Rail transportation services forgoods movement are provided in the SCAG Region along five principal rail alignments. Thesealignments are owned by the two Class 1 railroads operating in the Region: the Union PacificRailroad (UP) and the Burlington Northern Santa Fe (BNSF). The majority of freight railoperations moves along the mainlines of each railroad—the San Bernardino Subdivisionbetween Barstow and downtown Los Angeles for BNSF, and the Los Angeles Subdivision andAlhambra Subdivision for UP. The BNSF San Bernardino Subdivision includes 46.4 miles ofdouble track; 16.6 miles have triple tracks; and 1.5 miles are covered by four main tracks. TheUP Los Angeles subdivision includes 12.4 miles of single track with sidings (additional trackthat allows a train to move to one side so other trains may pass), 42.3 miles of double track(3.1 miles shared with BNSF), and 4.2 miles of triple track (on a portion of route shared withBNSF). The UP Alhambra line has 38.6 miles of single track with siding, and 21.9 miles ofdouble track (Los Angeles-Inland Empire Railroad Mainline Advanced Planning Study,October 2002).
To facilitate freight railway services, improve safety, and reduce travel time for personmovement, the Region invested in an ambitious large-scale grade separation project over thepast decade. The Alameda Corridor, which opened in April 2002, provides grade separationalong an existing at-grade railway that connects the Ports of Long Beach and Los Angeles torail yards in downtown Los Angeles. The corridor provides grade separations at 200 street-railintersections, reducing vehicle-train delay an estimated 90 percent. Other benefits include a90 percent reduction in noise and vibration, a 28 percent reduction in railroad emissions, anda 54 percent reduction in emissions from automobiles and trucks idling at railroad crossings.Cargo transport has been expedited as train speed has doubled and travel time to downtownLos Angeles reduced.

Chapter 2
2004 Regional Transportation Plan 61
Table 2.4 shows that the east-west freight and passenger rail demand between Los Angelesand the Inland Empire is projected to more than double. This calls for additional railwayimprovements to accommodate this future demand.
Table 2.4
Maritime Ports and WaterwaysInternational trade through the Los Angeles Customs District is expected to nearly triple on anannual basis from $230 billion to $661 billion between the years 2000 and 2020. Thedeepwater ports of Los Angeles and Long Beach constitute a significant portion of the tradeactivities in this district, and, together with the third regional port of Hueneme, handle 80percent of California’s and 35 percent of the nation’s waterborne international trade. Theseports are planning to invest $6 billion over the next 25 years on an ambitious infrastructuredevelopment program that will include widening arterial streets, upgrading freeway ramps,separating railroad grades from roadways, expanding rail yards, and adding intelligenttransportation systems (ITS) to improve ground access management.
The competitive position of the Region’s ports is very strong. As of 2002, these portsaccounted for about 62 percent of total West Coast container traffic, rising from 51 percentnine years earlier. The San Pedro Bay (SPB) Ports possess between one-third and one-half ofthe West Coast container terminal capacity. These ports are served by almost half of the railintermodal terminal capacity devoted to handling international container traffic to and fromWest Coast ports.
Approximately 44 percent of the total 1996 Asia-to-U.S. container cargo routed through WestCoast ports terminated in California or Nevada, yet only about 17 percent was expected to doso based on these states’ share of total continental U.S. population (and based on theassumed East Coast share of Asian trade). That is, traffic to/from California and Nevada wastwo-and-one-half times the amount expected based on population. A smaller value assumed

Chapter 2
62 DESTINATION 2030
for the East Coast ports’ share would drive the value of this multiplier even higher. It is simplynot plausible that all of this cargo was consumed or produced in these two states.
One explanation for this seeming anomaly is that much of the import traffic “terminating” inCalifornia actually underwent “value-added” transformation ranging from insertion of hangersin garments to use as assembly components in larger manufactured goods. Thesetransformed goods, along with cargo that is loaded into trucks or domestic containers for re-shipment to other regions after processing in a distribution center, are subsequently shippedelsewhere in the U.S. as domestic freight and contribute to this traffic shift. Such re-shipmentsput pressure on the Region’s transportation system. The Region is, therefore, subsidizingother states by enduring incremental congestion and pavement deterioration from truckmovements that are “passing through” at ever-increasing rates.
AirportsAirports play an important role in goods movement, as air cargo is transported either inpassenger aircraft belly-holds or in dedicated freight aircraft used primarily for high-value, timesensitive shipments. In 2002, 2.6 million tons of air cargo were handled by the Region’sairports.
Air Cargo TerminalsRegional air cargo has grown at an average annual rate of 6.6 percent since 1965. LosAngeles International (LAX) and Ontario International (ONT) are the major cargo-handlingairports, transporting about 96 percent of all regional air cargo, with LAX alone accounting for75 percent of the traffic. ONT air cargo traffic has increased by seven times since 1979, whileLAX has doubled in the same period. Bob Hope, John Wayne, Long Beach and Palm Springshandle substantially less cargo. The air cargo trend since 1975 is shown in Table 2.5.
Table 2.5

Chapter 2
2004 Regional Transportation Plan 63
LAX is the primary cargo airport. Cargo facilities operated by airlines and cargo shippersoccupy two million square feet of building space on about 200 acres of land. The total landarea of LAX (including parking) is 3,500 acres. A significant number of off-airport freight-forwarding facilities are also located in proximity to the airport. The majority of air cargopasses through LAX primarily because shippers are able to rely on commercial passenger aircarriers for spot or contracted cargo transport. Approximately 38 percent of LAX air cargo iscarried in the bellies of passenger aircraft, part of a gradual decline as more cargo is moved todedicated air freighters, which now account for 62 percent of LAX air freight.
More than 70 percent of all air cargo in the Region is now shipped on dedicated freighteraircraft, as compared to 59 percent in 1994. The continuing shift of cargo from the belly-holdsof passenger planes to dedicated all-cargo freighters has enhanced the ability of theseairports to serve cargo.
However, because of the large number of cities served by passenger airlines out of LAX,cargo shippers are able to offer worldwide service without having to operate dedicatedfreighters.
ONT handled 21 percent of regional air cargo in 2002. Owned by the City of Los Angeles andoperated by Los Angeles World Airports (LAWA), ONT occupies 1,463 acres and is wellsituated within the regional ground transportation system. United Parcel Service (UPS)operates an express package service hub out of ONT. Ninety-eight percent of air cargo ishandled through dedicated air freighters.
The air cargo industry was significantly impacted by the September 2001 terrorist attacks. TheTransportation Security Administration (TSA) mandated that U.S. mail over 16 ounces couldno longer be carried in the belly compartments of passenger aircraft. This restriction, as wellas a recent tightening of the “known shipper” requirement, has limited the amount of air cargocarried on passenger aircraft.
Another key issue is surface congestion. With the majority of regional air cargo served by onlytwo airports, the ability of the already crowded surface transportation infrastructure toaccommodate the air cargo demand is limited. To complicate matters, the San Diego Regionsends two-thirds of its air cargo to SCAG regional airports for shipping. Orange County, whichgenerates 30 percent of regional air cargo, serves less than three percent of this amount.
The impact on ground transportation of freight movement to and from the airports issignificant. The focus of new commercial airports such as March, Southern California Logisticsand San Bernardino International on initially serving freight helps to relieve the pressure onLAX and ONT and serves the goal of decentralizing regional air services.

Chapter 2
64 DESTINATION 2030
n Aviation
The SCAG Region has 57 public use airports, including six commercial service airports, 45general aviation, two recently closed military air bases (one certified as a commercial serviceairport, the other focusing on cargo), two commuter airports and two joint-use facilities.
In all, some 78 million annual passengers (MAP) were served in the Region in 2002, almostdouble the number served in 1980, as shown in Figure 2.6. The level of air passengerdemand is forecast to double again before 2030.
The Region’s aviation operational activity, including general aviation and military, makesSouthern California the busiest of all regions in the country. There are eight airport governingbodies responsible for planning their individual airports in the proposed ten-airport system.These airports are:
• Bob Hope (BUR) • Ontario International (ONT)*• John Wayne (SNA) • Palm Springs (PSP)• Los Angeles International (LAX)* • Palmdale Regional (PMD)*• Long Beach (LGB) • San Bernardino International (SBD)• March Inland Port (MAR) • Southern California Logistics (SCL)
* Operated by Los Angeles World Airports
Currently, six commercial service airports handle the majority of passenger air traffic: BobHope, John Wayne/Orange County, Long Beach, Los Angeles International, OntarioInternational and Palm Springs. Limited commercial service exists at Oxnard and ImperialCounty airports. Passengers are currently concentrated at the urban airports with LAX servingalmost 72 percent of the regional total. This air service concentration at LAX creates severeairport ground access problems. With worsening highway congestion in the future, LAX willbecome increasingly difficult to access for international passengers and air cargo.
Both the recent recession and the impacts of September 11, 2001, are still being felt in theaviation industry. The terrorist acts fundamentally changed the way airports think aboutsecurity and safety, while the recession changed the way business travelers purchased airtravel. After this time, the number of regional air travelers dropped dramatically. Starting in2002, airports in the Region started to show signs of recovery. Smaller regional airports likeBob Hope, Ontario and John Wayne are almost at, or have exceeded, pre−September 11passenger numbers. LAX has not completely recovered. International travel suffered the mostfrom September 11 and, more recently, from the outbreak of the SARS disease in Asia.These events have slowed passenger activity at LAX.

Chapter 2
2004 Regional Transportation Plan 65
Figure 2 6
The urban airports will reach their physical or legal capacity within the forecast period. Theairports are all encroached by neighboring land-uses and have little room to expand withoutgenerating significant environmental impacts and community opposition. While the urbanairports are all constrained, the suburban airports all have capacity, which is available to serveprojected regional growth in demand.
The economic costs of doing nothing are substantial. For every one million regional airpassengers, it is estimated that there is a positive regional economic impact of $620 million (in1998 dollars) and 4,475 jobs. SCAG estimates that under a fully constrained aviation system,only 141 million passengers would be served in 2030.

Chapter 2
66 DESTINATION 2030
Transportation Finance Challenges
n Baseline Revenue versus Committed Expenses
Baseline RevenuesThe development of the financial plan for the 2004 RTP has been under the direction of theSCAG Highway and Transportation Finance Task Force, composed of local elected officialsand local agency staff. After reviewing the economic and growth assumptions governing thevarious transportation revenue sources, the Task Force approved several existing revenuesources, comprising local, State and federal funds for roadways and transit, as the baselineforecast for the 2004 RTP. The baseline forecast extends existing transportation fundingsources to the year 2030 and does not include assumptions about future increases in tax ratesnor does it include extensions of tax measures beyond their expiration date unless approvedthrough recent ballot initiatives.
As Table 2.6 summarizes, an evaluation of these existing sources for the six-county SCAGRegion yielded a baseline revenue estimate of $120 billion over the 29-year (2002 through2030) time horizon of the 2004 RTP. The forecast is presented by revenue source for the fullRTP period in constant 2002 dollars.
This baseline estimate reflects SCAG’s “low” revenue scenario in light of the current economicenvironment coupled with the continuing decline in transportation funds. The financial forecastwas devised in the format of a revenue range (low, medium, and high) to serve as a basis forfurther modifications. The Transportation and Communications Committee, as well as theHighway and Transportation Finance Task Force, approved the “low” revenue scenario to usefor analytical and planning purposes in the 2004 RTP.

Chapter 2
2004 Regional Transportation Plan 67
INSERT EXHIBIT 2.7 REGIONAL AVIATION SYSTEM


Chapter 2
2004 Regional Transportation Plan 69
Table 2.6

Chapter 2
70 DESTINATION 2030
Figure 2.7
Local sources comprise 75 percent of the overall baseline revenue forecast, with Statesources totaling 15 percent and federal sources making up 10 percent (Figure 2.7). While theforecast falls well short of funding all needed transportation projects in the Region, it providesa benchmark from which additional funding needs can be identified for the improvementsrecommended in the RTP. On a county-by-county basis, Los Angeles County’s share of theoverall revenues is about 63 percent, or $76.0 billion, followed by Orange County at 17percent, or $20.5 billion (Figure 2.8). Riverside County’s share is 10 percent, or $12.1 billion.San Bernardino County’s share is 7 percent at $8.0 billion, Ventura County is 2 percent, or$2.7 billion, and Imperial County is 1 percent of the regional revenues at $1.0 billion.
Figure 2.8

Chapter 2
2004 Regional Transportation Plan 71
Committed ExpensesThe major categories of committed expenses include short-term capital projects currentlyprogrammed in the 2002 RTIP; operation and maintenance estimates for highways, thearterial system, and transit; as well as current debt service payments and debt issuesanticipated by the local CTCs during the 2004 RTP time frame.
Table 2.7
Tables 2.7 and 2.8 summarize the Region’s committed expenses during the time framecovered by the 2004 RTP. All committed expenses and revenue forecasts from 2002 through2030 are adjusted to constant 2002 dollars using a percent factor.
Table 2.8
As the SCAG Region’s transportation system ages, the ongoing costs to maintain the existinginfrastructure require an increasing share of future transportation resources. As noted inTable 2.8, about 66 percent, or $76 billion, of total expenditures are committed to operating,maintaining and rehabilitating the Region’s highway, transit, and arterial network. Thisestimate, however, is based upon historical and current levels of expenditures rather than

Chapter 2
72 DESTINATION 2030
needs. Operations and maintenance (O&M) costs are estimated to be substantially greaterwhen considering the full needs of the Region’s transportation system. This issue isaddressed in Chapter 4.
Funding ShortfallTable 2.9 illustrates the scope of the potential financial situation utilizing the “low” revenuescenario. SCAG’s policy committees and task forces approved the “low” baseline revenuescenario to be utilized for analytical and planning purposes, recognizing the need toacknowledge more conservative revenue estimates than what may be currently reflected inthe financial plans of the county transportation commissions. In light of recent declines intransportation funding and the uncertainty of future funding, SCAG’s use of the “low” revenuescenario for long-range planning is fiscally responsible and indicative of regional concerns.Some of these concerns are discussed further as ongoing fiscal challenges, highlighting somemajor assumptions incorporated into the “low” baseline revenue scenario. Further, it should benoted that the “net balance” available in some counties does not represent a “surplus.” Rather,this “net balance” is what is available to cover recommended RTP projects.
Table 2.9
The SCAG Region will require additional revenues to properly operate and maintain theexisting transportation system and to fund proposed long-term RTP investments. SCAGanticipates that additional funds would be derived from maintaining the Region’s traditionaltransportation revenue sources, which might otherwise be lost or diminished in the years tocome (e.g., gas tax revenues and local sales tax revenues). Additionally, SCAG anticipatesthat innovative financing strategies, such as public-private partnerships, will be needed to

Chapter 2
2004 Regional Transportation Plan 73
implement the improvements recommended in the 2004 RTP. Further discussion of SCAG’spublic and private funding strategies can be found in Chapter 4.
Ongoing Fiscal Challenges Reflected in the Baseline Revenue ForecastThe development of the 2004 RTP continues to involve the identification and analyses ofpotential fiscal challenges impacting the flow of transportation revenues to the SCAG Region,particularly given current economic uncertainties. The following briefly describes both existingissues as well as near- and long-term activities assumed to impact transportation revenuessubstantially for the “low” revenue scenario.
Decline of Gas Tax Revenues Due to InflationFor the past 30 years, transportation revenue in California has generally not kept pace withthe State’s evolving demographic characteristics. Indicators such as vehicle miles traveled,population, and personal income growth have all outpaced the rate of transportation revenuegrowth. Figure 2.9, below, shows how gas tax revenues have fluctuated in real-dollar terms(adjusted for inflation) in relation to the steady growth in the demographic indicators. Thepassage of local “self-help” transportation sales taxes in the late 1980s and early 1990s havegreatly improved funding for transportation. Nevertheless, gas tax revenues continue todecline in value due to inflation.
Figure 2.9

Chapter 2
74 DESTINATION 2030
Sunset of Existing Local Transportation Sales TaxesLocal sales taxes have provided nearly half of the local share of transportation funding in theRegion. While Los Angeles County has two permanent sales taxes for transportation andRiverside County more recently managed to gain voter approval for a 30-year extension, themeasures in Imperial, Orange, and San Bernardino Counties expire in the next seven to nineyears. If the voters do not renew these sales taxes, the expiration of these taxes will have aprofoundly negative impact on the ability of these counties to fund ongoing maintenance andoperations, let alone transportation improvements.
Despite the success of Riverside County, similar measures in other California counties havefailed to receive the two-thirds voter approval required for extension. Subject to Proposition218 and in accordance with a California State Supreme Court decision, a two-thirds approvalby county voters is required to reauthorize, increase, and/or impose new local sales taxes fortransportation. These (half-cent) sales taxes are in addition to the sales and use tax leviedstatewide, and are generally imposed upon the same transactions and items subject to thestatewide sales and use tax.
Figure 2.10
Loss of Revenues from Reduced Gasoline Consumption to Meet Air QualityMandatesDuring the period of the 2004 RTP, technological advancements, along with State and federalair quality mandates placed on the SCAG Region, may result in a motor vehicle fleet thatconsumes considerably less gasoline or relies on alternative energy sources. This woulderode the revenues generated by gasoline sales and diminish the gas tax as a reliable sourceof revenue for transportation. Other factors, such as scarcity or dependency on foreignsources, may also affect the availability of petroleum-based fuel. In recognition of difficultiesin developing cost-competitive alternative fuel vehicles, a sizeable alternative fuel vehiclemarket will not likely appear in the immediate future. Nevertheless, the long-term implicationsrequire further research and analysis.

Chapter 2
2004 Regional Transportation Plan 75
An Aging Society That Could Consume Fewer Taxable ItemsModest changes in the rate of economic growth can have substantial implications fortransportation revenues under the existing tax structure. Additionally, growth projections arecritical in identifying funding possibilities and making infrastructure investment decisions.SCAG continues to research and monitor the regional planning implications of long-termeconomic and demographic trends.
SCAG’s recent research effort has highlighted the potential impacts from the aging “babyboom” generation. Explosive growth in the elderly population is projected to occur between2010 and 2030. This could have significant impacts on labor force growth and the overalleconomy. Historical and current trends indicate that as consumers age, both their level ofspending and the way they allocate their spending changes. Seniors generally spend less,especially on taxable items. Because of loss of sales tax revenues from the aging population,there is a potential for further declines in transportation revenues. Significant shifts indemographics will also influence future demand for transportation infrastructure andappropriate levels of investment.
Escalation of Operations and Maintenance NeedsThe demand for travel is expected to grow at least as fast as the population. Operations andmaintenance expenditures must keep pace with these needs. At the same time, costsassociated with operating and maintaining the existing transportation system continue to risedue to an aging system. If ongoing operations and maintenance needs are not met in a timelymanner, the costs of these activities will continue to increase as the system deterioratesfurther. Balancing revenues and costs is further complicated by the need to repair highwayand transit systems concurrent with the need for additional and significant new capitalinvestments.
As noted above, the consequences of deferred maintenance have led to significantly higherlife-cycle costs. Inevitably, continued deferral of required maintenance and rehabilitation leadsto an eroding infrastructure. Should the Region’s transportation system be allowed todeteriorate further, an intolerable decline in mobility and safety would resultmeaning morecongestion, delays, and accidents.
State Budget Crisis and the State Highway Account ShortfallCalifornia’s budget crisis may continue to have significant impacts on transportation fundingfor the SCAG Region. Many transportation projects will be affected, including TransportationCongestion Relief Program (TCRP) project commitments, the STIP, State Transit Assistance(STA) for transit operators, and associated formula funding allocations for local streets androads. Additionally, the State Highway Account (SHA) cash balance is projected to fall belowplanned levels primarily from lower-than-expected truck weight fee revenues and gas taxreceipts.
Released in November of 2003, the 2004 STIP Fund Estimate, covering the five-year periodfrom FY2005 through FY2009, indicates that there will be no new programming capacitythrough FY2009 above those projects already programmed in the 2002 STIP. A number of

Chapter 2
76 DESTINATION 2030
factors, including the delay in the reauthorization of the federal transportation bill and theprojected impact of ethanol on federal revenues to the State, contribute to the uncertainfunding situation.
At around the same time in November, the governor proposed mid-year reductions totransportation programs statewide, exacerbating the funding situation. More recently, thegovernor released his FY2005 Budget proposal. In addition to the mid-year reductions, theproposal includes further adjustments, namely by retaining Proposition 42 funds in theGeneral Fund. The mid-year and budget year proposals would reduce transportation fundingby about $2 billion statewide through FY2005 in order to aid the General Fund.
SCAG has been working with the Region’s partner transportation agencies to analyze the fullpotential impact of the State budget shortfall on transportation funding. SCAG continues towork diligently to monitor and assess the current budget situation and intends to incorporateany adjustments to the 2004 RTP as may be necessary when the budget is finalized.
Transportation Equity Act for the 21st Century (TEA-21) ReauthorizationEstablished by Congress in 1991 with the Intermodal Surface Transportation Efficiency Act(ISTEA) and renewed in 1998 through the Transportation Equity Act for the 21st Century(TEA-21), the reauthorization of TEA-21 will be the third iteration of recent federal surfacetransportation authorizing legislation. TEA-3 will have a significant, yet unknown, impact onthe availability of transportation funding in the SCAG Region.
On May 14, 2003, President Bush released his reauthorization proposal known as the Safe,Accountable, Flexible, and Efficient Transportation Equity Act of 2003, or SAFETEA at afunding level of $247 billion over six years – later modified to $256 billion over six years by thePresident’s FY2005 budget. Although the House Transportation and Infrastructure Committeeinitially called for a $375 billion measure based on the U.S. Department of Transportation’sConditions and Performance Report, more recently, House leaders have been consideringlower funding levels to find a compromise between the Senate-passed level and thepresident’s proposal. On February 12, 2004, the Senate voted (76-21) to approve S1072,which would fund $318 billion for highways, transit and safety programs over six years.
The earlier, five-month extension of TEA-21, which Congress enacted last year, expiredFebruary 29, 2004. The second extension is set to expire April 30, 2004. As thereauthorization debates continue and TEA-3 becomes finalized, appropriate modificationswould need to be made to the 2004 RTP financial plan.

Chapter 2
2004 Regional Transportation Plan 77
Meeting Our Air Quality Commitments
The SCAG Region has experienced cleaner and healthier air quality over the past twodecades, from collaborative efforts over the years to reduce emissions from stationary andmobile sources. However, even with these efforts, much of the Region continues to exceedthe National Ambient Air Quality Standards (NAAQS) and large portions of Southern Californiastill have the worst air quality in the nation.
Most of the SCAG Region is classified as non-attainment for some criteria pollutants. TheSouth Coast Air Basin (SCAB), being the worst, is classified as an “extreme” non-attainmentarea for ozone, and is required to meet the federal 1-hour ozone standard by 2010. The SCABis also classified as a “serious” non-attainment area for particulates (PM10), and is required tomeet the PM10 standards by 2006. In addition, the new federal standards for 8-hour ozoneand fine particulate matter (PM2.5), currently in the process of being implemented, will requiresignificant emission reductions beyond those required to attain the existing standards.
Previous air quality plans underestimated the air emissions inventory and targets. Themagnitude of the required emissions reductions reported in the 2003 South Coast Air QualityManagement Plan (SCAQMP) is far greater than that reported in previous air quality plans.This mainly results from improvements in air quality modeling and a better understanding ofmotor vehicle emissions. The emissions target, also known as the “carrying capacity,” hastightened and the mobile source emissions inventory has increased. This all equates to aneed for greater emissions reductions. However, it is important to note that the increase inrequired emissions reductions does not mean that measured air pollution in the Region hasincreased.
There are only a few years remaining to identify and achieve the emissions reductionsrequired for attainment. Failure to implement an adequate State Implementation Plan (SIP)could result in federal sanctions, such as a ban on approval of new highway projects and aloss of highway funding, as well as more stringent emissions offsets for stationary sources.
At this time, the responsible agencies have not been able to identify the needed emissionsreductions to meet attainment of the federal standards. This emissions reduction shortfallpresents quite a challenge to the Region, as most of the substantial and feasible emissionsreductions have already been implemented. To put it bluntly, the Region is starving foremissions reduction strategies, and there is an urgent need for new and innovative solutions.
Under Section 182(e)(5) of the federal Clean Air Act, extreme ozone non-attainment areas areallowed to allocate emissions reductions to long-term, unidentified measures such asanticipated future technologies, commonly referred to as “black box” measures. However,reliance on the “black box” measures will cease in the near future, as measures need to beidentified by 2007 and emissions reductions achieved by 2010.

Chapter 2
78 DESTINATION 2030
Many challenges lie ahead as the Region continues to grow. This is most evident from theseverity of the 2003 ozone season. On July 11, 2003, the SCAB experienced its first Stage 1ozone alert since 1998. This type of alert warns even healthy residents to curtail outdooractivities. The severity of the 2003 ozone season has been attributed to meteorologicalconditions, regional socioeconomic growth and the recent upsurge in the operation of sportutility vehicles (SUVs).
Given the challenges that lie ahead, increased public awareness and a reinvigoratedcollaborative effort from all agencies and stakeholders is critical to bring this Region intoattainment with the federal air quality standards. SCAG’s contribution to this collaborativeeffort is essential, as emissions reductions from goods movement, marine ports, aviation andland-use will become increasingly important in the next few years.

CChapterhapter 33Our Vision

79DESTINATION 2030
2004 Regional Transportation Plan
CCHHAAPPTTEERR 33 OOUURR VVIISSIIOONN
Regional Goals
Building on the substantial efforts that went into the development of the 1998 and 2001 RTPs,the revised goals reflect the Region’s focus on a balanced approach to transportation planningand decision-making:
The goals are in no particular order and demonstrate the need to balance many priorities inthe most cost-effective manner. These priorities are identified in the following:
v The Region’s vast investments in multi-modal transportation infrastructure must beprotected. This infrastructure is maturing and requires attention and maintenance. TheRegion cannot afford to replace the existing infrastructure and must protect it for futuregenerations.
v A maturing system dictates an increased operational focus that leverages technology tomaximize the system’s productivity. This same investment will also minimize thevariations of travel time, and increase reliability, due to incidents, weather, and otherfactors. The Region cannot expand the transportation system significantly, so the existingsystem must be utilized to its fullest, maximizing its reliability. The vitality of the Region’seconomy is inextricably linked to efficient and reliable transportation.
v Air quality for the Region’s residents must be improved and meet federal regulations. Notdoing so would undermine the health of our population and risk losing billions of federalfunding to the Region.
v The investments in the RTP must address travel safety and modal balance; recognize theimportance of providing safe travel choices; meet the needs of transit dependents and the
1 Maximize mobility and accessibility for all people and goods in the Region
2 Ensure travel safety and reliability for all people and goods in the Region
3 Preserve and ensure a sustainable regional transportation system
4 Maximize the productivity of our transportation system
5 Protect the environment, improve air quality and promote energy efficiency
6 Encourage Land-use and growth patterns that complement our transportation investments
Adopted 2004 RTP Goals

Chapter 3
80 DESTINATION 2030
goods movement community; and provide connections among the highway system, ports,and airports.
v For the first time, the RTP also integrates land-use policies as a means to influencetransportation performance and the economy. Without such integration, transportationneeds in the future will significantly outpace the ability to pay for them.
v The RTP must address all these priorities and more in the most cost-effective manner sothat mobility and accessibility is maximized for people and goods.
Guiding Policies
The following policies were adopted by the SCAG Regional Council to guide the developmentof the 2004 RTP further and reflect the transportation priorities for the Region:
Performance Expectations
As directed by the first policy, performance measures play a critical role in the development ofthe RTP. Performance measures quantify regional goals and provide a way to evaluateprogress over time.
This is SCAG’s third performance-based RTP. Starting in 1998, SCAG was the firstMetropolitan Planning Organization (MPO) to rely extensively on performance measurement
1 Transportation investments shall be based on SCAG’s adopted Regional Performance Indicators.
2 Ensuring safety, adequate maintenance, and efficiency of operations on the existing multi-modal transportation system will be RTP priorities and will be balanced against the need for system expansion investments.
3 RTP land use and growth strategies that differ from currently expected trends will require a collaborative implementation program that identifies required actions and policies by all affected agencies and subregions.
4 HOV gap closures that significantly increase transit and rideshare usage will be supported and encouraged, subject to Policy #1.
5 Progress monitoring on all aspects of the Plan, including timely implementation of projects, programs, and strategies, will be an important and integral component of the Plan.
Adopted 2004 RTP Policies

Chapter 3
2004 Regional Transportation Plan 81
as a means to identify the most effective investments for the Region. The performanceindicators for the 2004 RTP represent an evolution that builds on earlier successes and addsspecificity and technical depth to the original indicators.
Assessing the degree to which the impacts of the 2004 RTP investments meet the regionalgoals requires complex technical analysis. Performance measurement is a critical part of thisanalysis, and is used for estimating the potential impacts of investments. The same measureswill be used to monitor progress in meeting the performance expectations of the RTP. Thismonitoring allows the Region to correct the course over time as lessons are learned and newtrends are established.
For the 2004 RTP, one or more performance indicators for most goals were developed,tested, and evaluated. The resulting indicators shown in Table 3.1 ensure that the RTPaddresses and follows all of its goals and policies.
The fact that the 2004 RTP uses many performance indicators reflects the delicate balancingact needed for this diverse Region. However, the overall benefit-cost indicator shown in thetable aggregates most of the indicators and communicates the return on the cumulative 2004RTP investments. Finally, the RTP development effort evaluated the overall distribution ofbenefits on the different population segments in the Region. This analysis is presented inChapter 5.

Chapter 3
82 DESTINATION 2030
Table 3.1

83DESTINATION 2030
2004 Regional Transportation Plan
CCHHAAPPTTEERR 44 PPOOTTEENNTTIIAALL SSOOLLUUTTIIOONNSS
This chapter describes key plans and programs that address the challenges outlined inChapter 2 and the recommended funding strategy to meet the Region’s needs and implementthe 2004 RTP.
The structure of proposed projects and strategies that constitute the 2004 RTP is depicted inFigure 4.1. The Plan can be viewed as multiple layers, or tiers, of transportation projects andstrategies, beginning first with the existing transportation system and ending with the proposedPlan improvements. While the RTP includes all of these tiers, it is useful to examine themindependently for analysis purposes. These tiers are described as follows:
v Baseline (No Project) represents a future scenario in which only projects in the 2002Regional Transportation Improvement Program (RTIP) that have State and federalenvironmental clearance by December 2002 are assumed to be completed. The Baselinealso assumes a future in which there are no changes in land-use from established generalplans. The Baseline functions as the “No Project” alternative used in the RTP ProgramEnvironmental Impact Report and provides a useful reference point, as it represents afuture without the proposed RTP. The full listing of Baseline projects is contained in theTechnical Appendix.
v Tier 2 describes the remainingprojects in the 2002 RTIP thatare not included in theBaseline scenario. These arerecognized as committed pro-jects, and the RTP gives themfirst-funding priority after theBaseline. The full listing of Tier2 projects is contained in theTechnical Appendix.
v Plan represents the final layerof transportation improve-ments, above and beyond Tier2. These projects and strate-gies represent the focus of thischapter, and are discussed in detail. The full listing of Plan projects is contained in theTechnical Appendix.
From the long-range planning standpoint, Baseline (No Project) and Tier 2 projects areconsidered as fully committed. These two tiers combined form the bulk of the short-range
Figure 4.1

Chapter 4
84 DESTINATION 2030
portion of the Plan, primarily addressing the first ten years of the Plan. These includehundreds of projects and strategies, including the following highlights:
v Investments of $57.7 billion in transit operations and maintenance.
v Investments of $18.3 billion in roadway operations and maintenance.
v Major transit corridors, including the Metro Orange Line in the San Fernando Valley,Eastside Light Rail, Exposition Light Rail to Santa Monica, Wilshire Transitway, Centerlinein Orange County, and San Jacinto commuter rail extension in Riverside County.
v Rapid bus expansion on 26 lines, including South Broadway, Vermont, Florence, VanNuys, Sepulveda, Santa Monica, Western, San Fernando, and many others.
v HOV expansion and gap closures on SR-14 near Palmdale, I-5 in the San FernandoValley, I-405 on the Westside, I-5 and I-605 connecting Los Angeles and OrangeCounties, I-10 and SR-60 in the San Gabriel Valley, SR-22 in Orange County, SR-60 andI-215 in Riverside County, and I-215 in San Bernardino.
v HOV connectors at the I-5/SR-14, SR-57/SR-60, and SR-55/I-405 interchanges.
v Mixed flow expansion on SR-23, SR-118, and US-101 in Ventura County, I-5 connectingLos Angeles and Orange Counties, I-15 and US-395 in the High Desert area of SanBernardino, and SR-60 and SR-74 in Riverside County.
v Toll road extension and widenings in Orange County.
v Brawley Bypass and other expressway improvements in Imperial County on SR-7, SR-98,and SR-111.
A complete project listing forthese categories is providedas part of the RTP TechnicalAppendix. The real discre-tion that the RTP processhas is over the projects andstrategies beyond Tier 2.These projects are repre-sented by the small triangleon top of the pyramid.Therefore, the focus of thischapter is solely on projectsand strategies that are inthis category, which arediscussed in the remainderof this chapter.
Figure 4.2

Chapter 4
2004 Regional Transportation Plan 85
System Management: Getting the Most out of the System
Given the challenges described in Chapter 2, the 2004 RTP relies on a number of strategiesthat range from an increased focus on operational strategies to land-use integration, and tostrategic system expansion investments. This comprehensive approach is referred to asSystem Management.
The 2004 RTP has embraced this philosophy to maximize returns on expected transportationinvestments. This philosophy is depicted in Figure 4.2. As this figure shows, system expansion(depicted by the top of the triangle) is no longer the primary transportation investment toprovide improved mobility. Use of a synergistic portfolio of strategies is required today and inthe future. System management relies on more comprehensive data and advanced tools tohelp identify the most cost-effective investments in the areas of preservation, demandmanagement, transportation management systems, physical operational improvements, andsystem expansion. We must preserve our aging infra-structure, get the most out of our currentmultimodal system, and strategically expand it to maximize the return on our scarceinvestments. This is a focus of the 2004 RTP. Investments in Intelligent TransportationSystems (ITS) technology and system integration to achieve system management goals areidentified in Table 4.1.
Table 4.1
Preservation – Protecting Our InfrastructureA key aspect of System Management is protecting our investment in the current transportationinfrastructure. The Region has invested billions of dollars in developing its multi-modaltransportation system and must protect these investments for current and future generations.
This RTP sets aside $6.5 billion of the additional funds identified for infrastructurepreservation. Table 4.2 presents the incremental preservation investments over and beyondthe Baseline by county. Note that the incremental preservation investments shown in Table4.2 are directed to arterials and the State Highway System only, which depend on diminishinggasoline tax receipts. Therefore, additional funding is needed to address diminishing tax

Chapter 4
86 DESTINATION 2030
receipts and the needs of the Region’s aging infrastructure. Transit preservation funding isnot projected to decline, and adds up to over $20 billion of committed expenditures through2030.
Table 4.2
Operational Strategies – Getting the Most Out of Our Existing SystemThe Region has the responsibility to get the most out of its available system. The Regionmust maximize the productivity of its transportation system. This is especially true for theState Highway System.
For example, due to intensive weaving and merging at freeway interchanges, our freewaysystem performs at significantly less than optimal productivity on many of its segments.These productivity losses are strongly related to the bottlenecks we all experience on a dailybasis.
Accidents lead to similar, if not more extensive, productivity losses for similar reasons. Closedlanes also lead to weaving and merging that reduce the system’s productivity.
Fortunately, the combination of small physical improvements (e.g., auxiliary lanes that extendthe merging range) and technology deployments (e.g., advanced ramp metering) offer usaffordable solutions to restore some of this lost productivity. These technology deploymentsare often referred to as Intelligent Transportation Systems, or ITS.
The combination of operational investments reduces delays and the duration of congestion,and improves the predictability of travel time.
These types of investments are currently being embraced around the State and the country.The associated investments are modest in comparison with almost any other type ofinvestment, and this RTP funds them at higher levels than at any time in the past. Primarycategories for operations spending include:

Chapter 4
2004 Regional Transportation Plan 87
v Flow-improving infrastructure modifications – also referred to as physical operationalimprovements that reduce the concentration of weaving and merging. These includeauxiliary lanes, freeway interchange modifications, ramp widening, HOV-to-HOVconnectors and drop ramps for HOV that help carpoolers avoid weaving across thefreeway to get to the carpool lanes.
v Freeway service patrol to facilitate removal of stalled vehicles.
v Transportation management systems, including:
1. Incident management systems that help identify accidents as they occur and clearthem faster.
2. Traveler information systems that are tailored for travelers at home and duringtheir trip to inform them of traffic conditions, bus and train arrival times, alternativerouting, and the best time for travel. Reliable and timely traveler informationcomplements efforts for Transportation Demand Management (TDM) strategies.
3. Ramp metering systems that, depending on traffic conditions, manage the flow ofvehicles onto freeways and reduce the impact of merging and weaving.
4. Arterial signal management systems that manage the timing of signals tomaximize throughput and minimize delays and provide priority to transit providers(e.g., bus, light rail).
In the future, ITS technologies will automate transit fare collection and parking payments; usevehicle location systems to track trains and buses to give users “real time” arrival anddeparture information; as well as use onboard systems to detect and avoid collisions.
Within the SCAG Region and San Diego County is the Southern California ITS PriorityCorridor, which is one of the four corridors of national significance identified for early ITSdeployment by Congress under the Intermodal Surface Transportation Efficiency Act (ISTEA).The ITS plan for this corridor includes major local elements developed by three public-privatecommittees, including LA-Ventura, Orange County and the Inland Empire. The Plancoordinates architecture, standards and institutional issues and also provides the frameworkfor deploying an integrated ITS.
In all, the RTP assigns an incremental $2.3 billion through 2030 to operational strategies thatimprove the productivity of the transportation system. This includes $0.9 billion for ITS and$1.4 billion for interchange and auxiliary lane projects. The total amount represents just onepercent of the overall RTP expenditures, but is expected to produce benefits that are almostan order of magnitude higher. However, to ensure that these investments are targeted andprogrammed properly, SCAG will work closely with its subregional partners, other regionalagencies and the State to develop a framework that elevates the priority of these investments.
Another important operational issue is safety. Improving safety will not only save lives, butalso improve mobility and air quality by reducing incidents on the Region’s transportationsystem. The Plan emphasizes physical improvements to the system to make it safer byinvesting in safety improvements such as the extension or addition of auxiliary or merginglanes. This will allow a safer transition in traffic flow.

Chapter 4
88 DESTINATION 2030
Congestion Management System (CMS)In compliance with the Federal requirements the Metropolitan Planning Regulations CMS isan integral part of the regional transportation planning process, including the RegionalTransportation Plan (RTP) and the Regional Transportation Improvement Program (RTIP).There are five Congestion Management Agencies (CMAs)4 in the SCAG Region and eachdevelops the respective Congestion Management Plan (CMP) for its county. The degree ofurbanization varies from one county to another and so does the magnitude of congestion. AllCMPs share the same goal of reducing congestion and applying congestion relief strategies,but with different priorities in selecting the related strategies. Therefore, each CMP differs inform and local procedure. By State statute, all CMPs perform the same functions outlinedbelow and are consistent with the federal CMS requirements.
v Highway Performance - Each CMA monitors the performance of an identified highwaysystem. This allows each county to track how this system and its individual componentsare performing against established standards, and how performance changes over time.
v MultiModal Performance - In addition to highway performance, each CMP contains anelement to evaluate the performance of other transportation modes including transit.
v Transportation Demand Management (TDM) - Each CMP contains a TDM componentgeared to reducing travel demand and promoting alternative transportation methods.
v Land-Use Programs and Analysis - Each CMP incorporates a program for analyzing theimpacts of local land-use decisions on the regional transportation system.
v Capital Improvement Program (CIP) - Using data and performance measuresdeveloped through the activities identified above, each CMP develops a CIP. Thisbecomes the first step in developing the county TIP. Under State law, projects fundedthrough the Regional Transportation Improvement Program (RTIP) must first be containedin the county CMP.
v Deficiency Plan – Despite the above-stated efforts, when unacceptable levels ofcongestion occurs, the respective CMP contains a set of provisions for a “deficiency plan”to address the problems. A deficiency plan can be developed for specific problem areasor on a countywide-system basis. Projects implemented through the deficiency plan must,by statute, have both mobility and air quality benefits. In many cases, the deficiency plancaptures the benefits of the transportation projects which occur beyond the SCAG RTIP,such as non-federally funded/non-regionally significant projects.
In compliance with the federal CMS requirements, SCAG works with the county CMAs todevelop a CMS process for the Region. Under State law, the Congestion ManagementPrograms (CMPs) are prepared and maintained by the respective CMAs (see Table 4.3).CMP activities and resulting data are updated on a biennial basis by each CMA and suppliedto SCAG and the respective air quality management district.
4 The county transportation commissions of Los Angeles, Orange, Riverside, San Bernardino and Ventura are also the CMAs for thesecounties.
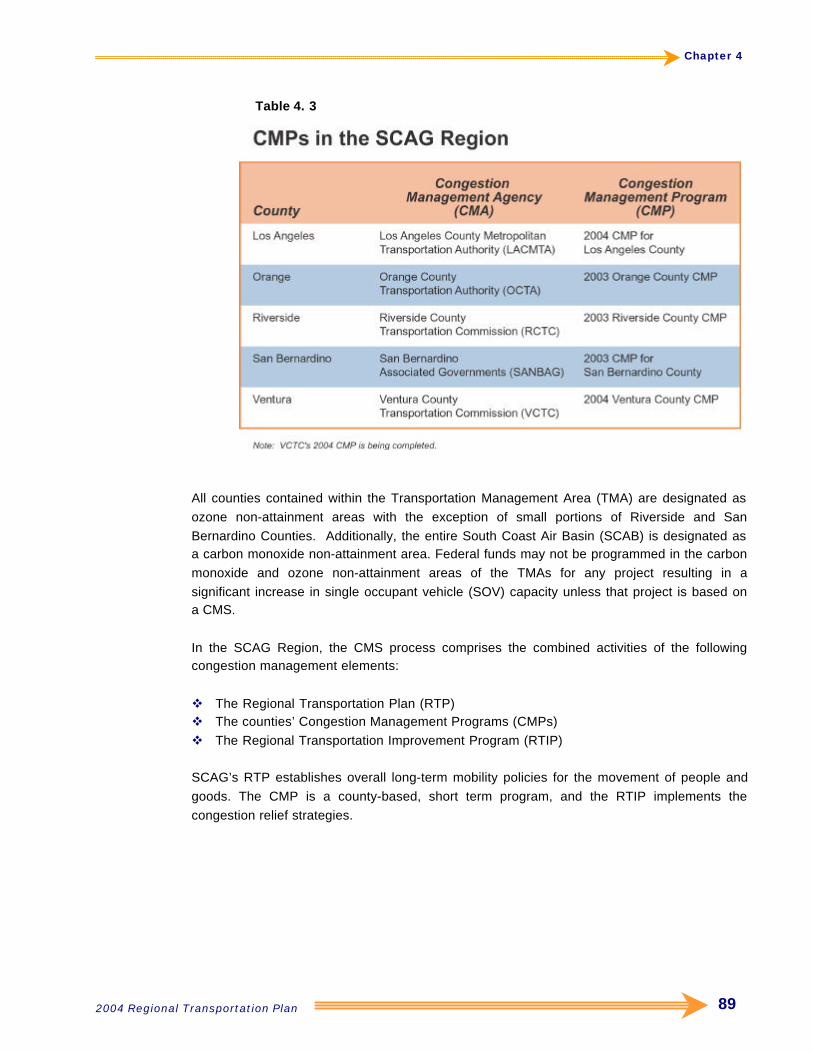
Chapter 4
2004 Regional Transportation Plan 89
Table 4. 3
All counties contained within the Transportation Management Area (TMA) are designated asozone non-attainment areas with the exception of small portions of Riverside and SanBernardino Counties. Additionally, the entire South Coast Air Basin (SCAB) is designated asa carbon monoxide non-attainment area. Federal funds may not be programmed in the carbonmonoxide and ozone non-attainment areas of the TMAs for any project resulting in asignificant increase in single occupant vehicle (SOV) capacity unless that project is based ona CMS.
In the SCAG Region, the CMS process comprises the combined activities of the followingcongestion management elements:
v The Regional Transportation Plan (RTP)v The counties’ Congestion Management Programs (CMPs)v The Regional Transportation Improvement Program (RTIP)
SCAG’s RTP establishes overall long-term mobility policies for the movement of people andgoods. The CMP is a county-based, short term program, and the RTIP implements thecongestion relief strategies.

Chapter 4
90 DESTINATION 2030
Transportation Demand Management
Transportation Demand Management (TDM) is the all-inclusive term given to a variety ofmeasures used to improve the efficiency of the existing transportation system by managingtravel demand. An individual’s travel behavior may be influenced by mode, reliability,frequency, route, time and costs, support programs/facilities, perceived personal security andsafety, and education. This section and additional information contained in Appendix D-2,comprise the TDM element of the 2004 RTP.
TDM strategies that encourage the use of alternative modes of transportation to the singleoccupant vehicle include: rideshare (i.e., carpools, vanpools), transit (i.e., bus, rail), and non-motorized modes (i.e., bicycles, walking). Additional TDM strategies include alternative work-schedule programs, such as compressed work-week programs (e.g., 9/80 or 4/40 programs),flextime (e.g., variable work-hour schedules), work-at-home (e.g., home-based businesses/self-employed full time) and parking management (e.g., parking pricing).
The potential effectiveness of TDM in 2030 depends largely on social and institutionalcommitments that cause individual travelers to choose a mode of travel other than drivingalone and funding (e.g., investing in marketing and incentives that change travel behavior). Ifwe were to do nothing beyond our current efforts, the Region would not sustain the currentlevels of ridesharing, non-motorized and telework/telecommute/work-at-home, let aloneexpand them over the 2004 RTP period. The Region recognizes the importance of TDMstrategies and includes a significant level of funding to meet the TDM goals as summarized inTable 4.4.
Table 4.4

Chapter 4
2004 Regional Transportation Plan 91
n Increasing Rideshare (Carpool and Vanpool)
Carpool Market ShareIn order to sustain the existing rideshare market share and to increase the number ofcarpools and vanpools, the Region must increase investments in TDM. Just a one percentdrop in the carpooling rate translates into more than 40,000 additional vehicles on ourfreeways and surface streets daily, resulting in an annual increase of 300 million vehicle-milesof travel.
Key RTP recommendations to maintain and increase the existing rideshare market andincrease the number of carpools annually include:
v Program public funds in the RTIP to help maintain the public sector share of the existingrideshare market and to increase the number of carpoolers by 8,000 annually.
v Provide “seamless” intra- and intercounty carpool services to the regional traveler.
v Maintain the existing carpool market share and increase ridesharing rates.
v Support funding for education and outreach to all employers and to the general public inorder to increase awareness and participation in ridesharing.
v Together with county transportation commissions, SCAG will work to further refine existingrideshare tracking, documentation and reporting methods, so as to improve the Region’sability to effectively demonstrate timely implementation of TCMs as required by theFederal Transportation Conformity Rule, as well as to improve reporting on annualaverage TDM investments and to enhance their effectiveness.
The cost of meeting our carpool and vanpool goals (described in the following section) isapproximately $10 million on an annual basis. The proposed funding identified in Table 4.4 isconsistent with this need. To meet the Region’s goals, SCAG will work closely with the countytransportation commissions to ensure that an adequate level of funding for TDM strategies isprogrammed, and that appropriate methods of measuring, monitoring and reporting theeffectiveness of rideshare programs are developed and deployed.
VanpoolingVanpooling is considered one of the most cost-effective rideshare strategies for long-distancecommuters. The effectiveness of vanpooling is based on its ability to reduce vehicle trips andvehicle-miles of travel. Within the SCAG Region, there are approximately 1,400 vanpools (a30 percent reduction from the 2001 RTP) in operation, carrying an average of 10 riders andtraveling approximately 35 miles per one-way trip. Vanpool programs are operated primarilyby the private sector, utilizing minimal public subsidy.
Vanpools and transit markets may complement one another. Both can serve trips fromsuburban communities into central areas or other suburban activity centers. However,vanpools also can serve low-density residential communities, where transit service may not beefficient. Additionally, vanpools can service those traveling on reverse commutes, wheretransit service may not be cost-effective.

Chapter 4
92 DESTINATION 2030
There are several situations that favor vanpool applications:
v The presence of HOV facilities, freeway and/or arterials
v Limited or high-cost parking around the destination site or both
v Preferential parking, variable work hours and guaranteed ride-home programs forvanpoolers at work sites
v Limited or non-existent conventional or demand-responsive transit service
Key RTP recommendations to expand vanpooling in the Region include:
v Formalize and expand partnerships among public and private sector stakeholders toimprove delivery of vanpool services regionally
v Increase the number of commuter vanpools from 1,400 to 5,000 through more effectivemarketing and the provision of non-monetary public sector incentives
v Establish a dedicated funding source for planning and implementing vanpool programsand services
v Expand the provision of vanpool services in the Region through an increase in dedicatedpublic-sector staffing and resources
v Facilitate a regionally coordinated marketing strategy among the public and privatesectors to enhance vanpool programs, increase ridership and improve outreach efforts
n Increasing Work-at-Home (Telework/Telecommute and Home-Based Businesses)
Increasing the number of workers who work at home (self-employed, home-based businessowners) or who telework/telecommute (wage and salary employees conducting some or all oftheir work from home) decreases home-based work trips, vehicle-miles of travel, congestionand vehicle emissions. This strategy is generally the result of employer-based decisions.
The 2001 RTP assumed that 2.3 percent and 4.7 percent of all work trips would be reduceddue to telecommute and work-at-home in 2010 and 2025, respectively. Recently, the Bureauof Labor Statistics (BLS) documented that 15 percent of the nation’s workforce (home-basedbusinesses and wage and salary employees) report they work at home; 4 percent are self-employed in home businesses and do not commute to work; and 2.5 percent telecommute(2001-Bureau of Labor Statistics Population Survey). In the SCAG Region, according to theAssociation’s 2002 Telework Survey, approximately 3.2 percent of the Region’s wage andsalary workers telework/telecommute from home instead of commuting to their primary placeof employment.
National and regional surveys of those who telecommute indicate that it is a lack of supportand trust from “management,” rather than the provision of equipment or the desire of workers

Chapter 4
2004 Regional Transportation Plan 93
to telecommute, that hampers the growth of telecommuting. The 2004 RTP, therefore,recommends the following actions:
v Formalize and expand partnerships among public and private sector stakeholders toincrease opportunities for wage and salary workers regionally to telecommute in lieu ofdaily commuting
v Promote achievement of a 4−5 percent telework/telecommute goal to increaseopportunities for wage and salary workers regionally to telecommute in lieu of dailycommuting
n Decreasing Discretionary Trips and Spreading Demand to Non-Peak Periods
Decreasing discretionary person and vehicle trips, especially during peak commute periods,and emphasizing the use of non-motorized modes offers opportunities to reduce demand andto improve the efficiency of the transportation system when the highest level of travel demandnormally occurs.
Non-work, discretionary trips made during rush hours exacerbate demand for scarcetransportation resources and could be better accommodated if shifted to non-peak periods ofthe day. The key issue is that providers of medical, shopping, school, recreation and relatedservices often provide services during business hours that overlap commute periods. The2004 RTP recommends the following:
v Explore the opportunity to develop and to disseminate educational programs at the countyand community level that promote consumers’ use of non-motorized travel modes for non-work trips made during commute hours
v Explore partnerships among public and private sector providers of medical, shopping,school, recreation and related services and programs to identify alternative modes oftravel to their establishments and to evaluate their ability to offer consumer servicesduring non-commute hours
n Non-Motorized Transportation
Given the constraints on resources and our emphasis on land-use, the Plan recognizes theimportance of non-motorized transportation as an important and integral part of the 2004 RTP.Reinforcing the importance, the Plan proposes over $733 million in investments on non-motorized transportation over the Plan horizon, which is higher than proposed in any Plan inthe past. The proposed funding for non-motorized transportation can be used to implementbikeway expansion projects, create a bicycle-, and pedestrian-friendly transportationenvironment, induce mixed-use development that promotes biking and walking, and conductpublic safety education for bicyclists and pedestrians. The proposed funding level on a county-by-county basis is depicted in Table 4.4.

Chapter 4
94 DESTINATION 2030
Thinking Out of the Box: Land Use-Transportation Connection
n Reality-Based Vision
As discussed in Chapter 1, SCAG and its stakeholders have embarked on an ambitiousgrowth visioning effort that demonstrates the value of land-use and transportation planningintegration. The lessons learned from the two bookend scenariosPILUT I and PILUTIIand the COMPASS public workshops were incorporated into the development of apragmatic land-use growth alternative recommended for the RTP.
The following tenets were developed, through the body of work produced within the GrowthVisioning program, to be used as the foundation of the Growth Vision RTP Alternative:
v Using infill where appropriate to revitalize underutilized development sites
The Growth Vision Alternative accommodates future growth, makes efficient use of ourexisting and planned infrastructure and maintains or improves quality of life. The use ofinfill in aging and underutilized sites provides a means of accommodating growth,revitalizing neighborhoods, districts or communities, and makes efficient use of theexisting infrastructure.
v Focusing growth along transit corridors and nodes to utilize available capacity
Many existing corridors lack the residential and commercial density to adequately supportnon-auto transit uses. By intensifying these corridors with people-scaled, mixed-usedevelopments, the existing transit system can more fully realize its potential foraccommodating additional trips, taking strain off systems that are already at or over-capacity. This also creates vibrant, walkable communities capable of further reducing thereliance on autos for a variety of trips.
v Providing housing opportunities near job centers, and job opportunities, whenappropriate, in housing-rich communities
Balancing the location of jobs and housing is an important strategy in meeting regionalgoals of relieving congestion, reducing commute times and trips, encouraging alternatemodes of transportation and improving air quality. The Growth Vision Alternative achievesthese goals via an infill strategy by co-locating job and housing centers in targeted livablecommunities suitable for accommodating additional growth.
v Providing housing opportunities to match changing demographics
Changing demographics will have an impact on the Region’s economic future. The large“baby-boom” cohort will begin retiring after 2010. Other changes on the horizon includeincreased immigrant (younger) population, increased household size and lower per capita

Chapter 4
2004 Regional Transportation Plan 95
income. These changes necessitate variation in housing types offered as well asamenities to serve the changing population.
v Ensuring adequate access to open space
Demographic trends, the need for adequate job opportunities and shelter, and theRegion’s historical development pattern set the stage for competing quality-of-lifedemands. Development patterns in the Growth Vision Alternative emphasize focusinggrowth in appropriate centers and corridors that make the most efficient use of developedland and minimize encroachment on public open space. This should improve access toexisting large-scale and neighborhood-scale open space (e.g., pocket parks).
v Changing land-use to correspond to the implementation of a decentralized regionalaviation strategy and its consequent short- and long-term job creation
The decentralized aviation strategy creates a significant number of high-paying jobs in theshort and longer term. The Growth Vision Alternative responds to this by creating theopportunity for well-balanced communities to support the additional workforce.
v Changing land-use to correspond to the implementation of regionally significantmajor transportation projects and their consequent short- and long-term jobcreation
New regionally significant infrastructure, such as highways, rail expansion and Maglev, isplanned to serve future housing and job centers in the high desert areas of Los Angelesand San Bernardino Counties and eastern Riverside County. Planned shifts of goodsdistribution functions to these areas also create long-term employment benefits.
v Incorporating the local input and feedback on future growth received from 90percent of the jurisdictions in the SCAG Region
Ninety percent of the 188 jurisdictions participated during extensive public outreach over atwo-year period for the development of the RTP Growth Forecast. This technical input andlocal expertise was critical in developing the RTP. The Growth Vision Alternativerespects local input through 2010 with adjustments occurring only after a ramp-upperiod intended to establish consensus on an implementation strategy.
The Growth Vision Alternative was developed through significant work efforts by literallythousands of regional stakeholders. Inputs include: the analyses of the initial five scenariosapproved by the Community, Economic and Human Development Committee (and dozens ofiterations leading to these five); the COMPASS Growth Visioning program, including publicworkshops, focus groups, public opinion polling, and regional growth principles; and growthcapacity, economic and redevelopment analyses. This Alternative is intended to represent atargeted distribution of population, households and employment to best meet the 2004 RTPgoals approved by the Regional Council.
Chapter 4
96 DESTINATION 2030
By incorporating the best features of PILUT I and PILUT II in conjunction with a decentralizedairport demand strategy, regionally significant transportation infrastructure improvements,significant local government outreach contributions, and the COMPASS workshops, theGrowth Vision Alternative achieves key strategies such as concentration of employment inmixed-use centers, regional jobs-housing balance and intercounty transit. It also maximizesmobility and accessibility within the anticipated 2030 transportation systems and improves airquality by encouraging mixed-use growth patterns that complement and enhance our currentand planned transportation investments.
Strategic System Expansion / Capital Investments
This section describes strategic system expansions for each mode that are critical tomaintaining and improving mobility, accessibility, and air quality for all residents of the Regionin the face of the growth that will occur over the Plan period as described in Chapter 2.
n Highways and Arterials
If we were to do nothing beyond completing committed (Baseline) projects by the year 2030,the Region’s freeway network mixed-flow lane capacity would increase by less than 10percent and the arterial system capacity would increase by about 7 percent. On the otherhand, the High Occupancy Vehicle, or Diamond Lane network, will nearly double in terms oflane miles by 2030. SCAG recognizes that these three types of facilities will continue toprovide the means for most travelers to get to their desired destinations.
Highway and Arterial InvestmentsThe 2004 RTP contains approximately $13.1 billion in highway and arterial improvementprojects in addition to already-committed or programmed projects. Major categories of theproposed improvements include HOV gap closures, HOV connectors, mixed-flowimprovements, toll lanes and high-occupancy toll (HOT) lanes as well as strategic arterialimprovements. The 2004 RTP is based on input from the 2001 RTP and priorities submittedby the county commissions and the subregions. The proposed projects and strategies arebased on a performance framework established for the 2004 RTP and support the underlyingGrowth Vision developed through the consensus process. The following provides a briefdescription of individual categories of improvements proposed in the Plan.
The Highway and Finance Task Force adopted a set of guiding principles in developing thehighway improvement strategies. These principles are:
v Projects that enhance safety and security
v Projects that fill significant gaps in the freeway and HOV system (examples from the 2001RTP include the SR-710 gap closure, SR-210 extension, I-10 HOV lane, and the I-605HOV lane)

Chapter 4
2004 Regional Transportation Plan 97
v Projects that relieve significant bottlenecks (examples include truck climbing lanes, mixedflow widening and reconfigurations like the I-215 in San Bernardino, mixed flow continuityprojects, and completion of the HOV lanes on I-405 through the Sepulveda Pass)
v Projects that support improved operational performance (examples include auxiliary lanesand interchange improvements such as better ramps)
v Projects that improve system connectivity
v Projects that improve access to airports, cargo facilities, and intermodal centers
v Projects that maximize efficient use of existing capacity, such as Traffic ManagementCenters, ramp metering, signal synchronization and other ITS
v Projects to maintain and preserve the current investment in the highway system
v Advancing long-range study corridors from the 2001 RTP in high-demand and/or high-growth areas, based upon the findings of the RSTIS process
v Projects that support land-use goals
HOV Gap ClosureThe completion of the HOV system will be an important step towards meeting future traveldemand. A number of HOV projects proposed in the 2001 RTP have already beenprogrammed in the current RTIP. Table 4.5 provides a summary of HOV gap closure projects5
proposed in the 2004 RTP beyond the Baseline and Tier 2 that are regionally significant.
5 Although not listed here, the RTP includes toll road projects in Orange County that are considered as “HOV projects and their pricingalternatives” in the 2003 Air Quality Management Plan. These improvements to the San Joaquin, Eastern, and Foothill toll roads inOrange County are Tier 2 projects and are depicted in Exhibit 4.6 and the Technical Appendix.

Chapter 4
98 DESTINATION 2030
Table 4.5
HOV ConnectorsHOV connectors are an important element of the regional HOV system. The connectors areconstructed with drop ramps to the HOV lane along the freeway median to minimize weavingconflicts and maintain speeds. A number of HOV connectors are identified in the 2030Baseline (No Project). The 2001 RTP identified several HOV freeway-to-freeway connectorprojects. Specific investments in HOV connectors are justified to maximize overall systemperformance. Table 4.6 provides a summary of HOV connector projects identified in the 2004RTP as part of the constrained projects beyond the Baseline (No Project) and Tier 2. Exhibit4.1 depicts the existing HOV system as well as the proposed HOV projects.
Table 4.6

Chapter 4
2004 Regional Transportation Plan 99
Mixed FlowGaps in the freeway network create traffic bottlenecks during peak use. Several new mixed-flow freeway lanes are proposed to close gaps, increase capacity in certain congestedcommuter corridors and address county-to-county travel (especially from population-rich toemployment-rich areas). Several routes are under consideration in the Four Corners area,where Los Angeles, Orange, Riverside and San Bernardino Counties converge.
SCAG, Caltrans and Riverside and Orange Counties are exploring methods to approach newcorridor development in an environmentally sensitive manner. Regionally significant mixed-flow improvements, proposed in the 2004 RTP beyond the Baseline projects, are shown inTable 4.7. These projects also reflect strategic improvements needed to accommodate ourgrowth vision for 2030. Proposed mixed flow improvements are depicted in Exhibit 4.2.
Additionally, SCAG’s Transportation and Communications Committee approved considerationof the following corridor improvement alternatives in the Plan:
US-101 CorridorPotential capacity enhancements will be considered within the existing right-of-way orrequiring minimum right-of-way acquisition on the segment from the 101/134/170 interchangeto the 23/101 interchange at the Ventura County line. This will be based upon the results offurther analysis. Consideration will be given to extensive Transportation System Management(TSM) and transit options, as appropriate, identified in the corridor study, as well as prioritynear- and midterm TSM and transit options, as appropriate and identified by the City of LosAngeles Community Advisory process for all portions of the 101 Corridor. The study of longterm east-west travel in the 101/San Fernando Valley Corridor will be continued as well asfurther study of improvements to system connectivity and potential operational improvementsto key freeway-to-freeway interchanges.
I-710 CorridorThe RTP recognizes the I-710 Transportation Corridor (SR-60 to the Port of Long Beach) as aregionally significant transportation corridor as identified in the adopted State of Purpose andNeed of the I-710 Major Corridor Study. While additional work is in progress to identifyfeasibility improvements in the corridor, the Plan identifies existing commitments to replace theGerald Desmond Bridge as part of the financially constrained Plan, and the need to providethe equivalent of at least two lanes of additional capacity in each direction to move goods andpeople throughout the corridor. It is anticipated that a Locally Preferred Strategy, based uponthe I-710 Major Corridor Study (Alternative B-TSM/TDM) and a hybrid of the MCA AlternativesC, D & E will be adopted by the I-710 Major Corridor Study Oversight Policy Committee, withthe concurrence of the Los Angeles County Metropolitan Transportation Authority, Caltrans,SCAG and the Federal Highway Administration. SCAG will amend, as necessary, the 2004RTP to include improvements as recommended, conditioned upon community acceptance,available funding, and regional air quality conformity requirements. Additional public fundingand/or innovative funding may be needed to fully fund the Locally Preferred Strategy.

Chapter 4
100 DESTINATION 2030
Table 4.7

Chapter 4
2004 Regional Transportation Plan 101
INSERT EXHIBIT 4.1: (HOV IMPROVEMENTS)

Chapter 4
102 DESTINATION 2030
INSERT EXHIBIT 4.2: (MIXED FLOW IMPROVEMENTS)
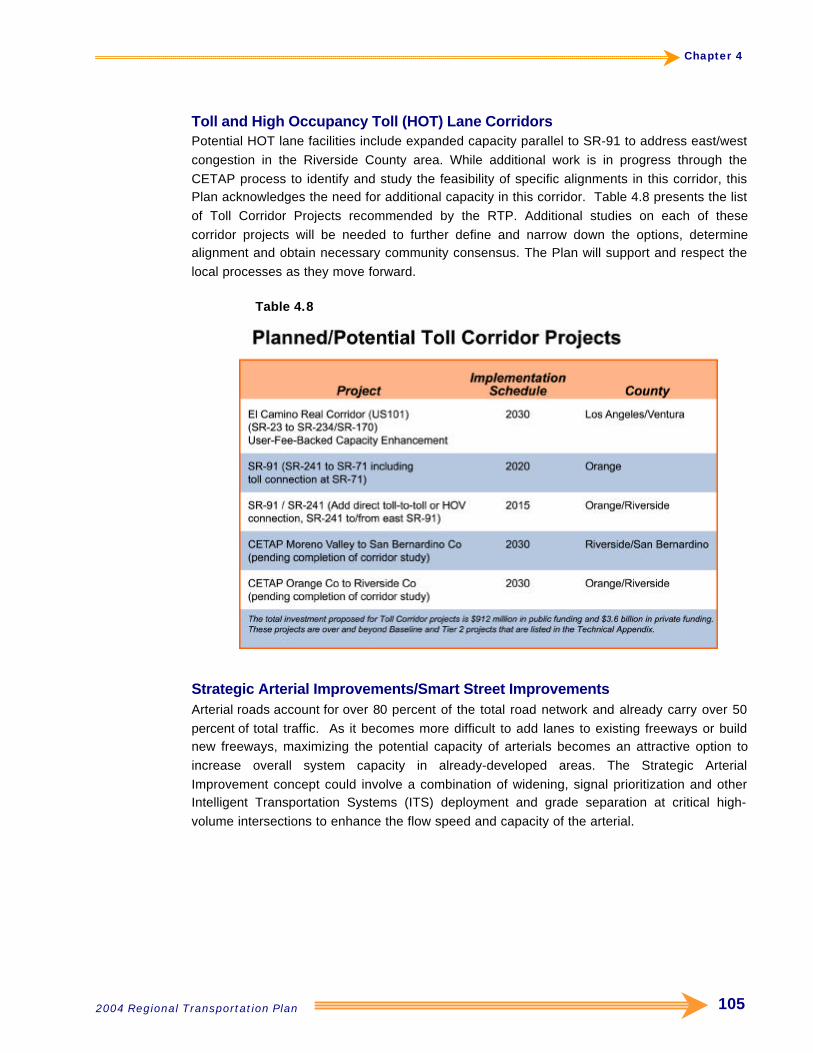
Chapter 4
2004 Regional Transportation Plan 105
Toll and High Occupancy Toll (HOT) Lane CorridorsPotential HOT lane facilities include expanded capacity parallel to SR-91 to address east/westcongestion in the Riverside County area. While additional work is in progress through theCETAP process to identify and study the feasibility of specific alignments in this corridor, thisPlan acknowledges the need for additional capacity in this corridor. Table 4.8 presents the listof Toll Corridor Projects recommended by the RTP. Additional studies on each of thesecorridor projects will be needed to further define and narrow down the options, determinealignment and obtain necessary community consensus. The Plan will support and respect thelocal processes as they move forward.
Table 4.8
Strategic Arterial Improvements/Smart Street ImprovementsArterial roads account for over 80 percent of the total road network and already carry over 50percent of total traffic. As it becomes more difficult to add lanes to existing freeways or buildnew freeways, maximizing the potential capacity of arterials becomes an attractive option toincrease overall system capacity in already-developed areas. The Strategic ArterialImprovement concept could involve a combination of widening, signal prioritization and otherIntelligent Transportation Systems (ITS) deployment and grade separation at critical high-volume intersections to enhance the flow speed and capacity of the arterial.

Chapter 4
106 DESTINATION 2030
Arterial ImprovementsIn addition to the specific arterial improvements identified under the Smart Street ImprovementProgram, this Plan proposes a significant increase in funding for arterial improvements andcapacity enhancements. Table 4.9 summarizes the recommended 2004 RTP investments inarterials by county. A complete list of eligible arterial improvements is contained in theTechnical Appendix.
Table 4.9
SoundwallsSoundwalls are a regional issue associated primarily with freeway improvements. Federal andState laws require construction of noise barriers along freeways under the Community NoiseAbatement Program and as part of new freeway construction projects and freewaywidening/capacity enhancement projects on existing freeways. Accordingly, all new freewayconstruction or existing freeway widening costs include soundwall costs.
n Public Transportation System
Public transportation services comprise a major portion of the Regional Mobility Strategy. Thegoals of public transportation services are to ensure mobility for people without access toautomobiles and to provide attractive alternatives for drive-alone motorists or discretionaryriders. The public transportation strategies and programs presented in the 2004 RTP weredeveloped with these goals in mind. The Plan invests $5.5 billion in local bus service,including service for the elderly and disabled, as well as bus stops and transit centers.
Strategies include a significant increase in service availability, major expansion in the use ofbus rapid transit, and some restructuring of service to ensure efficient utilization of availablecapacity. New rapid bus lines will be implemented on heavily traveled corridors and many buslines will be added or restructured to feed into the existing and proposed urban and commuter

Chapter 4
2004 Regional Transportation Plan 107
rail system. Table 4.10 presents a list of the major transit investments recommended. Acomplete list is presented in the Technical Appendix.
Exhibit 4.5 depicts proposed transit corridor development superimposed on the existingsystem.
Bus Rapid TransitBus rapid transit (BRT) is designed to provide fast, high-quality bus service. BRT operates inmixed traffic or in dedicated guide-ways, utilizing low-floor buses, taking advantage of signalpriority at intersections, boarding and alighting passengers through streamlined processes,and improving bus stop spacing at planned stations. BRT combines the routing flexibility ofbus systems with some of the features of rail transit such as limited stops and streamlinedboarding and alighting procedures. It uses specially identified buses stopping only at majorintersections/destinations.
The proposed transit program recommends building on the success of existing BRT lines andincludes a major expansion of bus rapid transit services throughout the Region. The proposedfinancially constrained bus rapid transit corridors are designed to connect major activitycenters and create a multi-modal system that serves Southern California residents. Severalproposed corridors link current bus routes to existing Metrolink stations and urban rail lines.BRT service for these corridors will be more frequent during peak periods. In addition to there-routing of bus lines, the deployment of shuttles and circulators would feed into the currenttransit network. These circulators can be very effective when deployed in niche markets.
Metrolink Commuter RailMetrolink is the regional commuter rail service that operates in five Southern Californiacounties. Southern California Regional Rail Authority (SCRRA) provides and maintainsMetrolink services and facilities. SCRRA is a joint powers authority consisting of the LosAngeles Metropolitan Transportation Authority (MTA), Orange County Transportation Authority(OCTA), Riverside County Transportation Commission (RCTC), San Bernardino AssociatedGovernments (SANBAG) and the Ventura County Transportation Commission (VCTC). TheMetrolink system consists of 53 stations. It carries over 36,000 passenger trips and operates143 trains per weekday.
The Plan invests $1.8 billion in long-range capital improvements that, when fully implemented,will effectively double the Metrolink System’s passenger-carrying capacity. The long-rangecapital plan includes selective double tracking on critical route segments, switching and signalimprovements, communication system improvements, new rolling stock, rolling stockstorage/maintenance facilities, new stations and enhancements to existing stations. Plans alsoinclude future service expansion on the Redlands and San Jacinto branch lines.

Chapter 4
108 DESTINATION 2030
Table 4.10
Land-Use – Transit CoordinationThe regional transit program calls for increased and better coordination between transit andland-use planning. The Region must develop and adopt a long-term strategy for integratingthe planning of commercial, residential and recreational land-uses with the transportationsystem as well as increasing land-use intensities in areas with higher transit services andaccess. This integration would complement and maximize the use of the Region’s transitsystem resulting in increased ridership, reduced congestion, and improved air quality.
The Region must focus on encouraging local jurisdictions to include more mixed uses neartransit services and facilities. It is mutually beneficial and necessary for transit agencies andlocal governments to communicate regularly regarding new developments. It is essential fortransit operators to be involved in the development review process to ensure the same statureis given to transit services as other public services and infrastructure such as police, fire,

Chapter 4
2004 Regional Transportation Plan 109
sewers and storm drains. Participation of local and regional transit agencies in the approvalprocess for new developments is strongly encouraged to ensure that transit needs areincluded in development plans.
Transit-Oriented DevelopmentThe regional transit program calls for the local and regional transit and planning agencies topromote transit-oriented developments cooperatively along the major transit corridors. Transit-oriented development (TOD) is a land-use planning tool that promotes pedestrian-friendlyenvironments and supports transit use/ridership. It improves transit accessibility, compact landpatterns, walking-friendly environments, and reduced auto use. The TOD emphasis is on theestablishment of high-density housing and commercial land-uses around bus and rail stations.TOD includes pedestrian- and non-motorized−friendly streets, mixed-use developments withretail, commercial spaces and schools; as well as parking management and ridesharingordinances that reduce the amount of land needed for automobile use and parking.
Transit CentersBalanced local land-use and transportation policies can reduce auto travel and support morepedestrian, mixed-use and transit-oriented developments throughout the Region. Transitfacilities, services and centers are best when they are customer-friendly, community-oriented,and well designed. A network of transit-based centers and corridors, supported by infilldevelopment, maximizes the use of existing infrastructure, supports transit ridership, reducesautomobile air pollution and preserves green space and undeveloped areas. Exhibit 4.3depicts major activity centers in the Region today and Exhibit 4.4 depicts potential activitycenters in 2030. The RTP supports development of a flexible transit system enabling a strongtransit linkage between such activity centers.
To encourage the use of transit and ridesharing further, new transit centers and park-and-ridefacilities will be constructed in areas that provide access to the freeway HOV network, transitcorridors and express buses. Existing transit centers can be upgraded for multi-modal usesthat support restructured transit services.
RecommendationsIn addition to specific improvements to our public transportation system identified in this Plan,the following are specific recommendations and actions identified by the Regional TransitTask Force for the 2004 RTP:
Reduce Transit Travel Timev Implement transit priority service in congested corridors.v Maximize transit use of High Occupancy Vehicle (HOV) facilities.v Improve on-time performance of transit services and/or adjust schedules to reflect actual
travel times.v Provide real-time electronic wait time signs at transit stops, and real-time transit schedule
and route information on the Internet.
Create Integrated Regional Transit Systemv Create seamless service for passengers traveling across jurisdictional boundaries in the
Region.

Chapter 4
110 DESTINATION 2030
v Fare structures must be designed so that the transit customer is not penalized whentransferring between vehicles, modes or carriers.
v Structure local collector and distributor transit service to efficiently support line-haul transitcorridors and rail systems.
v Provide outstanding intermodal connections between transit service/facilities and bicycle,pedestrian, auto and intercity transportation.
v Market transit services at the community level through local outreach activities withcommercial and residential organizations.
Coordinate Transit with Land-Usev Preserve adequate rights-of-way for future transit service in new or expanding corridors.v Encourage local jurisdictions to implement transit-oriented development.v Encourage local jurisdictions to locate higher densities and commercial land-uses close to
corridors that can be well served by transit.v Encourage local jurisdictions to orient buildings toward the street and locate off-street
parking to the side or rear of buildings.v Improve pedestrian access to bus stops and transit centers. Pedestrian access must be
direct (not requiring out-of-direction travel), safe and attractive. Techniques to provide safecrossing of streets and roads at bus stop locations must be provided. Auto/transit conflictsshould be minimized.
v Work with local jurisdictions to maintain existing and create additional park-and-ridefacilities.
v Provide educational opportunities for planners to better understand the needs andbenefits of transit and for the general public to better visualize and appreciate transit-supportive land-use.
v Explore potential changes to the California Environmental Quality Act, CongestionManagement Program and other legislation; and work with other public agenciesthroughout the State to advocate for changes that will require no increase in vehicle tripsor maintain/increase transit mode split for major developments.
Support Innovative Financing Strategiesv Support local revenue sources such as new and/or extended sales tax measures.v Encourage fees to support transit in development agreements and as conditions of
approval for new development.v Encourage in lieu or other fees for transit in exchange for increasing floor area ratios or
reducing parking requirements.v Consider differentiated transit fares (e.g., reduced fare on off-peak trips, fares based on
zones traveled).v Encourage employer-based incentives.v Leverage local, State, and federal funds for transit investments to the greatest extent
possible.
Chapter 4
2004 Regional Transportation Plan 111
INSERT EXHIBIT 4.3: 2000 ACTIVITY CENTERS

Chapter 4
112 DESTINATION 2030
INSERT EXHIBIT 4.4 : 2030 ACTIVITY CENTERS

Chapter 4
2004 Regional Transportation Plan 113
INSERT EXHIBIT 4.5: TRANSIT SYSTEM IMPROVEMENTS


Chapter 4
2004 Regional Transportation Plan 117
n Goods Movement
Challenges relative to goods movement were described in Chapter 2. The focus of this sectionis to describe goods movement projects and strategies beyond Baseline and Tier 2 that areintended to address those challenges.
Roadway Improvements to Address Truck DemandIn the domain of Goods Movement, the regional transportation system will be challenged toaccommodate more than double the truck trips, according to modeling of total truck VMT by2030. The 2004 RTP acknowledges the need for strategies to accommodate future growth intruck traffic. While specific strategy and alignment determinations need further evaluation andconsensus building, the Plan assumes corridor improvement needs for a number of corridorssummarized in Table 4.11. These corridors are depicted in Exhibit 4.6 as part of the user-fee−backed capacity improvement corridors.
One strategy being explored is the concept of dedicated facilities to accommodate trucktraffic. This system would comprise upwards of 140 center-lane miles of dedicated facilitiesalong alignments extending from the San Pedro Bay ports, through the East-West Corridorand out to strategic distribution points northeast or southwest of the urbanized areas. Theseprojects will continue to be studied for the ultimate selection of locally preferred strategies.The Plan will support and respect the local processes as they move forward. However, morespecificity is required to include these projects in the regional travel demand model.Therefore, these projects are modeled as two truck lanes in each direction for the 2004 RTP.These assumptions will be replaced by the preferred alternatives upon conclusion of the localprocesses, as necessary.
Table 4.11
Conceptual planning efforts have demonstrated that, given the volume of truck traffic alongthese alignments and an estimated capital development cost of approximately $16.5 billion, aper-mile toll ranging from between $0.38 to $0.80, and averaging $0.56 over a thirty-yearfinancing period, would be sufficient to support financing for the development and operation ofthis system. Applicable to existing and forecast volumes of truck traffic within this nationallysignificant trade corridor, it is envisioned here that this toll would be imposed and administeredby a regionally controlled Corridor Authority in concept. This authority would be instituted

Chapter 4
118 DESTINATION 2030
conceptually as a “joint-powers authority” in a fashion analogous to that of the TransportationCorridor Agencies established in Orange County, and would similarly adhere to existingCaltrans and labor relations contracting protocols.
The development of a regional system of user-supported, dedicated facilities offers a viableand potentially self-financing solution for mitigating congestion and reducing mobile sourceemissions arising from surface transportation operations in Southern California. This alsoensures the safe, reliable, and efficient movement of goods essential to the nation’s economy.The general motoring public would benefit significantly in terms of congestion relief, and enjoygreater operational safety and system reliability. Together with improved regional air quality,these environmental and safety advantages suggest that a significant level of publicinvolvement in the realization of facilities would be warranted.
SCAG will complement its original State Route 60 Study, which evaluated the preliminaryfeasibility of a dedicated truck facility. Additional major investment studies of key regionalgoods movement corridors are underway for the I-710 and I-15, and the East-West Corridor(SR-210, I-210, I-10, SR-60, and SR-91). Combining insights gained from this set of studies,an outline of the best solutions to address the future growth of truck traffic in the Region canbe discerned and allow for a preliminary analysis to ascertain what level of user-supportedrevenue contribution would be necessary to finance development of such a system. Theproposed toll corridors or user-fee−backed capacity improvements are depicted in Exhibit 4.6.SCAG’s existing policy opposes Long Combination Vehicles (LCVs) on non-designatedfacilities. LCVs include tractor-trailer combinations with two or more trailers that weigh morethan eighty thousand pounds.
Truck Climbing LanesIn addition to the dedicated facilities, the Plan also proposes adding a number of truckclimbing lane improvements to the Region’s highway system. The proposed truck climbinglanes above and beyond the currently committed projects identified in Baseline and Tier 2 arelisted in Table 4.12. Truck climbing lanes are additional lanes located on the outside of thefreeway in an uphill direction, which permit slower-moving trucks to operate at their own pacewithout reducing the speed of mixed-flow traffic.
Table 4.12

Chapter 4
2004 Regional Transportation Plan 119
INSERT EXHIBIT 4.6: USER-FEE BACKED CAPACITY IMPROVEMENTS


Chapter 4
2004 Regional Transportation Plan 121
Truck Stakeholder Input and ParticipationStakeholder input and participation was solicited in three ways: through the Goods MovementAdvisory Committee (GMAC), Technical Advisory Committees, and meetings with individualorganizations. The GMAC, which meets monthly at SCAG, includes representatives from theCalifornia Trucking Association (CTA) and provided stakeholders with the opportunity toreview strategies proposed in the RTP to address truck demand. SCAG also establishedTechnical Advisory Committees to solicit input for specific truck studies, such as the Truck-Rail and Truck Count studies. Finally, SCAG representatives met with representatives fromthe CTA as well as shippers and receivers to discuss truck capacity improvement strategies.
Regional Rail Capacity Improvement ProgramRegional rail operations, serving both freight and passengers, are facing the very realprospect of a crippling level of congestion within just a few years’ time. This section details astrategy that would provide an institutional and financial structure permitting publicparticipation in the development of regional rail capacity. At its core, this strategy is designedto take advantage of the interest rate differential between private sector financial instrumentsand public sector tax-credit bonds to leverage the revenue streams’ potential of eligibleinfrastructure investment opportunities. As so far developed, this strategy would enable thelevel of investment necessary in the Region’s East-West Corridor for rail capacityimprovements, $1.2 billion, as well as providing a mechanism for the funding of local railmitigation measures totaling $2.2 billion.
Given the projected growth in freight and passenger railroad traffic, the Region faces a seriousshortfall in mainline track and intermodal rail yard capacity. The mainlines east of downtownLos Angeles will reach capacity before the end of the decade and will need to be triple-trackedor even quadruple-tracked in some segments. There is also a need to build an estimated 130highway-rail grade separations east of downtown Los Angeles. Other critical bottlenecks, suchas the rail-to-rail crossing at Colton Junction and the two-track limitation of the Badger Bridgecrossing of the Cerritos Channel, will need to be addressed. Additional track extensions,centralized traffic control, storage tracks and other yard improvements in the port area will alsohave to be constructed. Failure to build these improvements could jeopardize economicgrowth, environmental quality, and national security.
Conceptual Planning of Rail System ImprovementsWith the existing maximum capacity of 50 trains per day per line, a recent SCAG studyshowed that both BNSF and UP railroads would have track capacity shortfalls on certain linesegments by 2010, barring any major improvements.
SCAG examined possible capacity improvements to the East-West Corridor rail lines. Theobjective was to devise a set of improvements that would maintain present levels of systemdelay with the number and types of rail operations forecast for 2010 and 2030 traffic levels.This exercise determined that there was a set of capital improvements and operating optionsthat would allow the system to perform at its present level of service while accommodating theforecast increase in both freight and passenger rail operations.
Chapter 4
122 DESTINATION 2030
Financial StrategyThe regional rail capacity improvement program recommended by SCAG would be financedwith a revenue stream raised on corridor traffic hauled by UP and BNSF. It is alsorecommended that discussions take place with other West Coast ports regarding a similarrevenue approach to minimize any potential for cargo diversion.
This revenue stream will provide a pool of capital for investment in the improvement program.The investment will be made along the regional mainline rail alignments. The movement of agreater volume of goods through the mainline system will require local congestion mitigation,thus the improvement program provides funding for grade separations.
In order to collect and distribute funds throughout the corridor for eligible capital improvementprojects, it is envisioned in concept that a special agency be created. SCAG would have acritical role in the formulation of this agency. The role of this agency, here referred to as theSouthern California Railroad Infrastructure Financing Authority (SCRIFA), conceptually wouldbe limited to issuing and servicing debt, administering the revenue stream collection process,and distributing money for approved projects to the railroads and to implementing agencies.
SCRIFA would work with project sponsors to seek grant funding for capital and operatingpurposes, and would also seek federal loans and issue revenue bonds. Eligible capacityimprovement projects in the corridor would include:
v Freight railroad infrastructure (tracks, signals, yards, rail-to-rail grade separations, andother freight rail facilities)
v Commuter rail facilitiesv Grade separations of highway-rail crossings
The UP and the BNSF would jointly agree on the priority of alternative freight railroadinfrastructure projects. The railroads and the SCRRA (Metrolink) would determine priorities forimproving commuter rail operations. SCRIFA, in consultation with all stakeholders, woulddetermine priorities for grade separation investments.
The proposed capacity improvements would include a total investment of $3.4 billion inSouthern California: $1.2 billion for railroad infrastructure projects and approximately $2.2billion in grade separation projects. These capacity improvement projects would be financedby a revenue stream garnered from containers transiting the corridor. SCRIFA would accept aspecific revenue stream designed to cover projected debt service and administrative costs.
National CoordinationSouthern California recognizes the national precedence of this rail financing methodology, andis working with representatives of the FHWA and other regional planning agencies that areexploring similar initiatives in the Northwest, Mid-West, and Mid-Atlantic regions of the nation.This interregional collaboration and federal coordination will work to ensure that federallegislative and funding programs are structured in a fashion that permits each region toaddress their particular priorities within a uniform national framework.

Chapter 4
2004 Regional Transportation Plan 123
INSERT EXHIBIT 4.7: MAINLINE FRIEGHT SYSTEM IMPROVEMENTS

Chapter 4
2004 Regional Transportation Plan 125
Rail Stakeholder Input and ParticipationStakeholder input and participation was solicited in three ways: through the Goods MovementAdvisory Committee (GMAC), Technical Advisory Committees, and meetings with individualorganizations. The GMAC, which meets monthly at SCAG, consists of representatives fromboth the Burlington Northern and Santa Fe and Union Pacific railroads and providedstakeholders with the opportunity to review strategies proposed in the RTO to address freightrail demand. SCAG also established Technical Advisory Committees to solicit input for specificrail studies, such as the Los Angeles-Inland Empire Railroads Mainline Advanced PlanningStudy. Finally, SCAG representatives met with representatives from the railroads and otherentities including the Alameda Corridor East Construction Authority and ONTRAC to discussfreight rail capacity improvement strategies.
San Diego and Imperial County Railroad ReopeningThere is an effort to revive the line, which will operate from San Diego into Mexico but isclosed off from Imperial County in the Carrizo Gorge area. Those involved in the resurrectionsay that by December, tracks could again become a key freight line between San Diego andImperial Counties. It is an effort some local officials say could be beneficial to the ImperialCounty economy because it would make the county a much stronger chain in the State’s andnation’s transportation links.
Once complete, the line will carve a path for freight trains from San Diego into Mexico andback into the United States where the line flows through Carrizo Gorge into Imperial County.The rail line will end at U.S. Gypsum’s Plaster City, where it will meet the Union Pacificrailroad, which flows east deeper into Imperial County and toward Arizona and destinationseast.
A look even further into the future could have the rail line provide passenger tourist servicesthrough the scenic Carrizo Gorge. In the more distant future, that line or a splinter line couldbe built as a straight line between San Diego and Imperial County without entering Mexico andcould open the door to commuter service.
Border CrossingsCalifornia’s exports increased 17 percent during the first year of NAFTA (1995). In 1999,Mexico became California’s top export trade market. California’s total trade was over $30billion in 2002. Trucks transport 98 percent of this trade. Over three-fourths of this trade hasorigins and destinations beyond San Diego and Imperial Valley.
Truck crossings are primarily processed at Otay Mesa (San Diego County) and Calexico East(Imperial County) Port of Entries (POEs). Currently, the average daily traffic of trucks travelinginto California is 36,000. In 2003, two million trucks traveled northbound/southbound acrossthe California/Baja California border. Figure 4.3 depicts the major truck distributions for theCalifornia/Mexico truck movements. The Plan allocated almost $500 million to NAFTA networkprojects in Imperial County. Several projects are included in the Baseline and Tier 2 (e.g., SR-111, SR-7 from SR-98 to I-8, SR-78 / SR-111, I-8/Imperial Avenue, SR-98 from SR-111 to SR-7, SR-98 from Kloke Road to SR-111). In addition, the Plan allocates funding for the SR-115NAFTA network project over and beyond Baseline and Tier 2.

Chapter 4
126 DESTINATION 2030
Figure 4.3
Source: Imperial Valley Association of Governments (IVAG)

Chapter 4
2004 Regional Transportation Plan 127
INSERT: EXHIBIT 4.8 GRADE SEPARATIONS


Chapter 4
2004 Regional Transportation Plan 129
Marine PortsThe ports of Los Angeles, Long Beach and Hueneme are planning to invest $6 billion over thenext 25 years on an ambitious infrastructure development program including $4 billion overthe next 10 to 15 years for infrastructure improvement projects being sought by the San PedroBay ports. This program will include widening arterial streets, upgrading freeway ramps,separating railroad grade crossings, expanding rail yards, and adding intelligent transportationsystems (ITS) to improve ground access management.
Inland PortConceptually, inland ports serve as cargo facilitation centers, where a number of import,export, manufacturing, packing, warehousing, forwarding, customs, and other activities(including Foreign Trade or Enterprise Zones) could take place on site or in near proximity.
Such facilities are being studied and will be considered further for development in SanBernardino, in Victorville at the Southern California Logistics Airport, in Barstow and in MarchInland Port. These facilities will function as inland sorting and depository centers for oceanand domestic containers, possibly transported via dedicated rail or truck facilities. At one ofthese inland ports, containers or trailers can be assembled and sorted into line-haul trainsdestined for locations outside of the Region. Conversely, shipments arriving on westboundtrains could be broken down and sorted for short-haul train delivery within the Region and tothe ports. Each of these possible locations will be the subject of further study.
n Maglev System
The Regional High Speed Rail Maglev System will ultimately facilitate the development of aregional airport system, and connect to major activity and multi-modal transportation centers inLos Angeles, Riverside, San Bernardino, and Orange Counties. Without a regional airport inEl Toro, the Region needs to further decentralize its future growth in air passenger traffic andair cargo to its regional airports in the northern and eastern portions of the Region. Therefore,the Maglev system becomes more important and critical to the success of SCAG’sdecentralized regional aviation system.
The Maglev system is the name for an elevated monorail using the world’s most advancedtechnology to move people and goods at a very high speed (up to 310 mph), with a highdegree of safety, comfort, and reliability; and it is environmentally friendly. For the past fouryears, SCAG has been studying the feasibility of deploying four Maglev corridors in theRegion:
v Los Angeles Airport (LAX) to March Inland Port in Riverside County (Moreno Valley)v LAX to Palmdalev Los Angeles Union Passenger Terminal (LAUPT) to Orange County (Anaheim)v LAX to Orange County (Irvine Transportation Center)

Chapter 4
130 DESTINATION 2030
In 2002, the Western States Maglev Alliance was formed between SCAG and the California-Nevada Super Speed Train Commission and was approved by the Regional Council. As aresult of this alliance, the Plan supports continued analysis of the proposed Las Vegas toAnaheim Maglev segment that passes through Barstow (see Exhibit 4.9).
The SCAG Interregional High Speed Rail system will ultimately grow to cover over 275 milesof Maglev corridors in the SCAG Region, and will move up to 500,000 riders a day. When fullydeployed, the Maglev system could complement the regional State highway transportationsystem. The Maglev program also envisions a longer-term connection to San Diego and othersouthern airports in the SCAG Region6, a connection between San Bernardino and Palmdalevia a high desert alignment and interlining with the proposed California State High Speed RailSystem. The California State High Speed Rail Authority has been commissioned to dopreliminary development work on several north/south corridors. SCAG has supported theAntelope and San Joaquin Valley corridors (Resolution #96-357-1-B). The State of Californiashould coordinate all high-speed rail-planning activities with SCAG and other stakeholderswithin the State, especially with regard to Maglev, aviation, environment, growth, access,finance and community development.
Three phases have been developed to implement the Maglev deployment program:
v Phase I, Pre-Deployment Analysis, was completed in October 2003 and includes right-of-way assessment on the freeway system and railroad corridors, assessment of ridershipand interaction with other transportation systems, LAUPT capacity analysis, stakeholderoutreach, financial feasibility, public/private partnership, technology transfer, andidentification of an Initial Operating Segment (IOS).
v Phase 2, Preliminary Engineering, will focus on defining the project to prepare preliminaryengineering for the purpose of environmental assessment and analysis (EIR/EIS) forpublic/private investment.
v Phase 3, Project Deployment Strategy, will complete the investment quality analysisnecessary to take the deployment program to the private market. This phase will includean investment-grade ridership and revenue forecast, operation plans, a detailed financialplan, and creation of a public/private consortium for project deployment.
In December 2002, SCAG’s Regional Council approved the deployment of a 56-mile IOS ofthe Maglev system that would connect West Los Angeles via LAUPT to Ontario Airport. It is acomponent of a 92-mile corridor between LAX and March Inland Port in Riverside County. Inselecting the IOS, SCAG considered the RTP performance measures, stakeholder supportand environmental issues. At the same time, SCAG’s Regional Council approved the advanceplanning of the LAX to Palmdale corridor and Los Angeles to Orange County corridor (OrangeLine). It is anticipated that the IOS is expected to be implemented by the private sector by2018.
6 SCAG will undertake a future study to determine the feasibility of extending Maglev services to the southernmost regions of California toconnect regional airports in San Diego, Palm Springs, Imperial County and March Inland Port.

Chapter 4
2004 Regional Transportation Plan 131
The feasibility studies for the four corridors demonstrated that the Maglev system could beconstructed and deployed through a public-private partnership structure administered througha public agency, a joint powers authority (JPA), or a public nonprofit (PNP) format using anumber of innovative and traditional funding mechanisms. The system would be financedthrough tax-exempt bonds and Federal Transportation Infrastructure Finance and InnovativeAct (TIFIA) program loans that would be repaid through the project-generated revenues. Nooperating subsidies will be required.
The Maglev Deployment will move SCAG’s Region forward through investment in criticalinfrastructure that will quickly improve surface transportation, enhance goods movement andrevitalize the Southland’s economy. The initiative is a short- to medium-term fix that will injectover $26 billion into SCAG’s regional economy between the years 2005 and 2018. TheMaglev Deployment for the IOS will create approximately 92,000 jobs in the SCAG Region fora total private investment of $5.5 billion. JPA formation for the IOS and LAX to other corridorsis in process.
The completion of the privately funded Maglev projects beyond 2018 will result inimprovements in productivity, quality of life, and mobility, and will enhance the SouthernCalifornia economy. The project milestones are summarized in Table 4.13 and depicted onthe map in Exhibit 4.9.
Table 4.13
Chapter 4
132 DESTINATION 2030
Next Steps
v Prepare preliminary engineering for the IOS for the purpose of preparation of the federalEnvironmental Impact Statement (EIS) and/or State Environmental Impact Report (EIR) toa level necessary for public/private investment.
v Form a Joint Powers Authority (JPA) for the IOS, and market projects to public/privatestakeholders.
v Secure federal, State and local funds by 2010 to complete deployment of the IOS andcoalesce community support for operation of the IOS.
v Seek legislative support at the regional, State and federal levels for the Maglevdeployment.

Chapter 4
2004 Regional Transportation Plan 133
INSERT EXHIBIT 4.9: MAP OF MAGLEV


Chapter 4
2004 Regional Transportation Plan 135
n Aviation
SCAG has updated its regional growth forecast and has developed a new aviation demandforecast and plan that maximizes airport efficiency on a regional scale. The demand numbersby airport are shown in Table 4.14 in terms of million annual passengers (MAP).
Table 4.14
Under the Regional Aviation Plan, there is a forecast regional demand of 170 millionpassengers in 2030, which results in an economic benefit of $18 billion and 131,000 jobs overa constrained system, as shown in Table 4.15. The 170.0 MAP forecast to 2030 represents a4.2 percent average annual passenger increase from 2003 levels. The reasons include:
1. The Regional Aviation Plan, in its decentralization of international service from LAX toOntario and Palmdale airports, will create a significant amount of demand by placing thatservice closer to populations in fast-growing areas and generating additional economicactivity in those areas.
2. Maglev will also create additional demand by virtue of increasing the speed andpredictability of the airport access trips.
3. The Region’s position as a gateway to the Pacific Rim is expected to capture increasinginternational travel to and from Asia.
4. The forecast 2030 plan horizon will capture the “baby boomer” retirement. Retirees travelat greater-than-average rates.
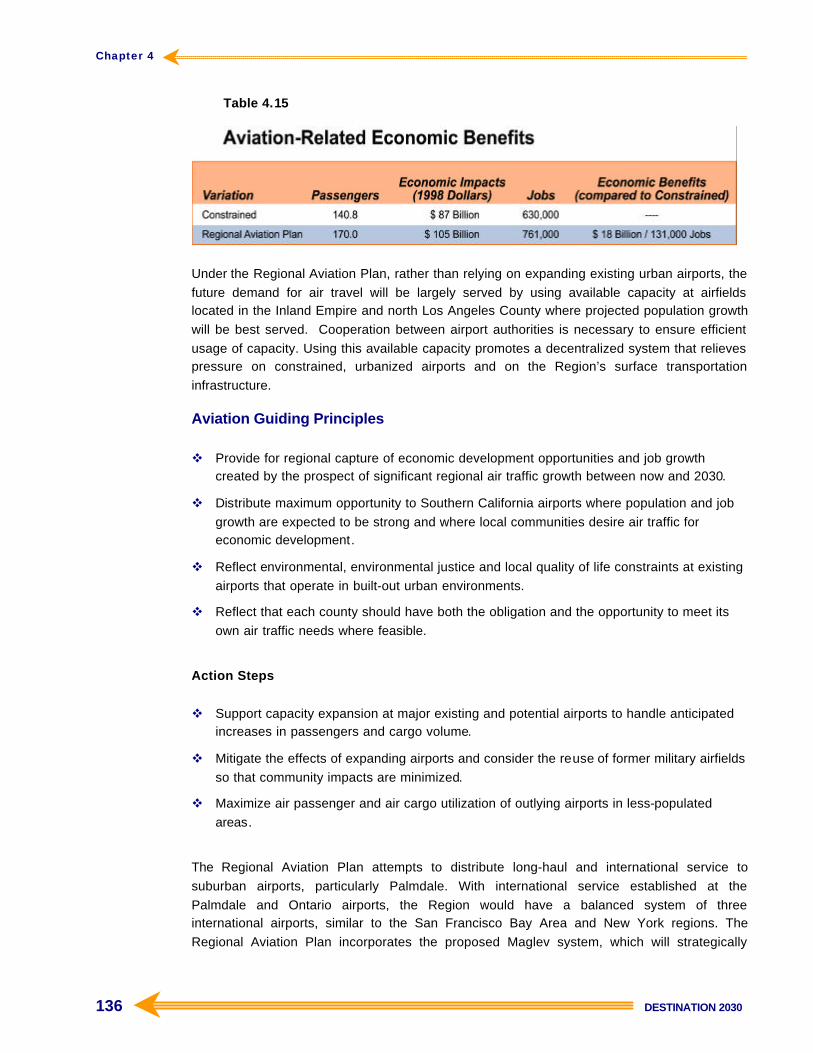
Chapter 4
136 DESTINATION 2030
Table 4.15
Under the Regional Aviation Plan, rather than relying on expanding existing urban airports, thefuture demand for air travel will be largely served by using available capacity at airfieldslocated in the Inland Empire and north Los Angeles County where projected population growthwill be best served. Cooperation between airport authorities is necessary to ensure efficientusage of capacity. Using this available capacity promotes a decentralized system that relievespressure on constrained, urbanized airports and on the Region’s surface transportationinfrastructure.
Aviation Guiding Principles
v Provide for regional capture of economic development opportunities and job growthcreated by the prospect of significant regional air traffic growth between now and 2030.
v Distribute maximum opportunity to Southern California airports where population and jobgrowth are expected to be strong and where local communities desire air traffic foreconomic development.
v Reflect environmental, environmental justice and local quality of life constraints at existingairports that operate in built-out urban environments.
v Reflect that each county should have both the obligation and the opportunity to meet itsown air traffic needs where feasible.
Action Steps
v Support capacity expansion at major existing and potential airports to handle anticipatedincreases in passengers and cargo volume.
v Mitigate the effects of expanding airports and consider the reuse of former military airfieldsso that community impacts are minimized.
v Maximize air passenger and air cargo utilization of outlying airports in less-populatedareas.
The Regional Aviation Plan attempts to distribute long-haul and international service tosuburban airports, particularly Palmdale. With international service established at thePalmdale and Ontario airports, the Region would have a balanced system of threeinternational airports, similar to the San Francisco Bay Area and New York regions. TheRegional Aviation Plan incorporates the proposed Maglev system, which will strategically

Chapter 4
2004 Regional Transportation Plan 137
connect the major airports and augment a balanced distribution of aviation demand andservices in the Region.
The 170.0 total MAP served by the Regional Aviation Plan in 2030 is slightly higher than the167.3 MAP that was forecast to be served by the 2001 adopted aviation plan by 2025. Givena lower aviation demand forecast resulting from the events of September 11, 2001, and therecent economic downturn, it can be concluded that the new assumptions and conceptsincorporated into the Regional Aviation Plan alleviate the substantial loss of capacityassociated with eliminating El Toro from the regional system.
The authority for the implementation of SCAG’s regional aviation plan currently rests withindividual airports. While SCAG forecasts Bob Hope Airport to reach an estimated physicalcapacity of 10.7 MAP, the facility believes there is less airside and ground access capacitythan what SCAG's forecast indicates. The March Joint Powers Authority has indicated itspriorities are: 1) increased military activity; and 2) air cargo. SCAG projections assumecommercial air passenger service not yet contemplated by the March Joint PowersCommission. SCAG has a longstanding policy to give priority to military and national defenseneeds. SCAG will continue to work with the airports after the adoption of the 2004 RTP toresolve these issues.
SCAG will also, after the adoption of this RTP, study the feasibility of an international airport inImperial County connected to San Diego County and the Inland Empire via Maglev. Theproposed airport would serve San Diego County demand as well as eastern portions of theSCAG Region.
Under SCAG's Regional Aviation Plan, air cargo service becomes more decentralized. LAX,while serving greater amounts of air cargo, will handle only 27 percent of regional air cargocompared to 75 percent. Southern California Logistics Airport becomes a multi-modal freight -handling facility. In all, March Inland Port, Palmdale, San Bernardino International, andSouthern California Logistics go from serving no air cargo to serving a combined 44 percent ofthe regional total. These projections are summarized in Table 4.16.
Cooperation between airports would be accomplished through the integration of airport masterplans and the development of contractual agreements between airports. Also, theseagreements would identify complementary roles and market niches between airports, toincrease synergy in the system and maximize utilization of available airport capacities in theRegion. For example, Los Angeles World Airports (LAWA) would play a key role in integratingmaster plans for the three airports it operates, LAX, Ontario and Palmdale.
The Regional Aviation Plan requires that an airport “Consortium” be developed throughmemoranda of understanding between all of the airports in the regional system. Theagreements will establish a common framework for coordinating all airport master planningand facility construction consistent with an adopted Regional Aviation Plan. The Consortiumwould focus on on-airport operations and facilities, and would not have power of eminentdomain.

Chapter 4
138 DESTINATION 2030
Table 4.16
The Regional Aviation Plan is assumed to spur the growth of corporate aviation at bothsuburban air carrier airports, and general aviation airports in both urban and suburbanlocations. The creation of more robust flight portfolios at suburban airports is expected toincrease the inducement of “catalytic” demand in the Inland Empire and North Los AngelesCounty.
However, without Maglev, the Regional Aviation Plan would serve only a total of 155.0 MAP,or a loss of 15 MAP to the system (the system would also lose 266,000 tons of air cargowithout Maglev, since some cargo would be transported to suburban airports via Maglev).Maglev also increases the market reach of these airports, by drawing passengers from urbancore locations who can quickly access the suburban airports via Maglev to catch their desiredflights. Maglev is vital to the implementation of the Regional Aviation Plan. The ability ofairports to “broker” airlines to provide long-haul and international service to suburban airportswill be dependent on the ability to quickly transport long-haul and international travelers atthese airports to their destinations around the Region. The Plan requires that the airportConsortium work closely with the Maglev Joint Powers Authority to ensure systemsintegration.
The Regional Aviation Plan will be carried out by an implementation plan containing thefollowing elements:
v LAWA will develop an “Integrated Metropolitan Airport System Plan.” This plan will detailhow LAX, Ontario and Palmdale will work with each other and other regional airports in

Chapter 4
2004 Regional Transportation Plan 139
efficiently meeting regional aviation demand as defined in the RTP Regional AviationPlan.
v LAWA will provide needed financial support to Palmdale and Ontario airports to constructnew facilities and establish long-haul and international service through attractive pricingarrangements and other inducements.
v Palmdale will become a limited international airport, making all of LAWA’s commercialairports international airports.
v LAWA will broker cooperation from airlines to provide more robust flight portfolios atPalmdale and Ontario, including long-haul and international service.
v Agreements between LAWA and non-LAWA airports will be developed to promote furtherdecentralization of the regional aviation system. Different roles and market niches forairports will be defined, so as to reduce competition and increase cooperation andcoordination between airports, and maximize utilization of available airport capacities inthe Region.
v The agreements will establish a common framework for a regional “Airport Consortium”that will coordinate all airport master planning and facility construction consistent with anadopted Regional Aviation Plan.
v The Regional Airport Consortium will coordinate with the Maglev Joint Powers Authority toensure seamless Maglev connections to airports, and increase air passenger ridership viaMaglev through integrated fares and other market tools.
Phasing of Implementation Plan
Very short term (to 2006):
v LAWA finalizes integrated Metropolitan Airport System Master Plan that integrates masterplans for LAX, Ontario and Palmdale, and coordinates with plans for other airports in theRegion.
Short term (2006 to 2010):v LAWA initiates discussions with airlines to broker services at Palmdale and Ontario. This
will include start-up commuter and short-haul service at Palmdale, and expansion of long-haul and international service at Ontario.
v LAWA and non-LAWA airports initiate discussions to coordinate service and definecomplementary roles and market niches between airports.
Medium term (2010 to 2020):v LAX approaches capacity constraints.v LAWA coordinates with airlines to expand long-haul and international service at Ontario
Airport and initiates discussions on methods to establish long-haul and internationalservice at Palmdale Airport.

Chapter 4
140 DESTINATION 2030
v LAWA and non-LAWA Inland airports finalize Memoranda of Understanding andcontractual agreements for forming a Regional Airport Consortium.
v Ontario Airport expands terminal facilities.v The LAX to March Inland Port Maglev segment is completed.v March Inland Port begins passenger service, reaches 1.7 MAP (2015).
Long term (2020 to 2030):v Palmdale Airport constructs new international terminal facilities.v LAWA finalizes agreements with airlines to bring long-haul and international service to
Palmdale.v LAX to Palmdale Airport Maglev segment is completed.v LAX to Irvine Maglev segment is completed.v Union Station to Central Orange County Maglev segment is completed.v March Inland Port reaches 4 MAP (2025).
Very long term (after 2030):v March Inland Port reaches 8 MAP (2030).v Orange County to San Bernardino Maglev segment completed.v San Bernardino to Victorville, Victorville to Palmdale, and March Inland Port to San Diego
Maglev segments are completed.
Ground AccessThe Regional Aviation Plan will have localized ground access impacts at a number of airports.Particularly, the Regional Aviation Plan will result in a dramatic increase in airport activities(people as well as cargo) at Ontario, Palmdale and a number of other airports. Analysis showsthat airport traffic impacts are concentrated near airport areas but that background congestionaffects both airports and local communities. A number of freeway and arterial improvementsand transit strategies are proposed in the Plan to address the ground access issues as part ofthe overall transportation investment in the Region. Specific ground access improvementsproposed in the Plan are identified in the Technical Appendix.
Transportation Finance: Meeting Our Needs
SCAG forecasts funding shortfalls over the 2004 RTP period. Numerous factors, including theexpiration of local sales tax measures; declining gas tax revenues due to inflation, fuelefficiency and the introduction of alternative fuel vehicles; increasing operations andmaintenance/rehabilitation costs; and the State’s budget deficit, account for the SCAGRegion’s financial predicament. The Region would not be able to provide capacityenhancements beyond the short-term commitments without developing a strategy to generateadditional transportation revenues.

Chapter 4
2004 Regional Transportation Plan 141
n Federal Policies Concerning Funding Strategies
Federal policies require the use of revenue sources that are “reasonably expected to beavailable.” The regulations further indicate that “proposed new revenues and/or new revenuesources to cover shortfalls shall be identified, including strategies for ensuring their availabilityfor proposed investments.”
The SCAG Region’s funding strategies focus on continuing to maintain and protect revenuestreams that the Region could potentially lose in the years to come. SCAG’s funding strategiesprovide sufficient revenue to fund the program of projects proposed in the 2004 RTP. Further,the strategies provide sufficient revenue to fund high-priority projects that ensure the SCAGRegion remains in compliance with air quality conformity requirements.
n State Policies Concerning Funding Strategies
The State of California also establishes policies governing the preparation of the RegionalTransportation Plan. These policies were formulated in Senate Bill 45 (Chapter 622, Statutesof 1997) and in guidelines adopted by the California Transportation Commission. With regardto the funding element of the RTP, State policies require that financial plans be constrainedand represent a “realistic projection of available revenues.” Further, State guidelines permitthe inclusion of new funding consistent with the overall policies and program of investmentsrecommended in the RTP.
n Guiding Principles for the Development of Funding Strategies
To facilitate the development of the 2004 RTP funding strategies, the Highway andTransportation Finance Task Force, along with the Transportation and CommunicationCommittee, adopted a set of guiding principles. The guiding principles are as follows:
v Maximize available resourcesv Ensure revenue is adequate to maintain conformityv Enhance regional and local choice in the selection of projects for fundingv Identify revenue sources that are reasonable and consistent with current funding practices
and long-term trends in transportation finance

Chapter 4
142 DESTINATION 2030
Recommended Funding Strategies to Implement SCAG’s RTP
Within the framework of the aforementioned guiding principles, the Highway andTransportation Finance Task Force, along with various other SCAG committees, engaged inextensive debates concerning the adequacy and feasibility of various revenue optionsavailable to respond to the SCAG Region’s funding shortfall. On the basis of the Task Force’sactions and policy direction, the following funding strategies for the 2004 RTP weredeveloped:
n Public Funding Strategy
Protect / Strengthen Existing Transportation RevenuesIn the 2001 RTP, an important strategy was the commitment of sales tax revenues fromgasoline to transportation purposes. Proposition 42, approved by the voters in March 2002,provides that these funds will be available for transportation purposes. However, a caveatplaced in the State Constitution allows this revenue to be diverted to the State’s General Fundif the governor recommends such an action and the Legislature agrees by a two-thirds vote.
The diversion provision introduces considerable uncertainty in the availability of revenue,resulting in a reluctance to commit the funds to long-term transportation projects. To rectifythis situation and to ensure that the Proposition 42 revenue is available when needed, theConstitution should be amended to remove this provision. This would make the sales tax ongasoline a truly viable revenue source.
Clearly, the need to stabilize transportation funding is more critical than ever in light of thegovernor’s recent mid-year and budget year proposals to use transportation revenues foraddressing General Fund problems. General Fund shortfalls will likely continue in future years,necessitating immediate action to remove the suspension provision in the State Constitution.
Additionally, Caltrans has reported that revenue assumptions made in the 2002 STIP FundEstimate were overly optimistic. More recent projections indicate that the State HighwayAccount (SHA) cash balance will fall below planned levels primarily due to lower-than-expected truck weight fee revenues and gas tax receipts. Although Chapter 719, Statutes of2003 (SB1055), increased fees as of January 1, 2004, to correct for the decline in truck weightfee revenues, there still remains considerable uncertainty regarding federal funding levels.The 2004 STIP Fund Estimate assumes a reduction in federal funding as a result ofCalifornia’s switch from MTBE to ethanol-blended gasoline. Current federal law taxes ethanol-blended gasoline at a lower rate and a portion of the revenue is directed into the FederalGeneral Fund. As states like California switch to ethanol and contribute less to the FederalHighway Trust Fund, federal transportation revenues are expected to decline substantially.California will receive less in federal transportation funding unless the tax on ethanol isadjusted. Caltrans estimates that the ethanol conversion will cost California approximately$2.8 billion in federal revenues over the five-year STIP period.

Chapter 4
2004 Regional Transportation Plan 143
Continue Local Transportation Sales Taxes Where Necessary/Allow 55 percentVoter Approval for Local Transportation Sales TaxesThis was a component of the funding strategy in the 2001 RTP. Since the adoption of thatPlan, Riverside County voters approved a thirty-year extension of its local transportation salestax, which will provide the county with about $3 billion through 2030. Successful extensions oflocal transportation sales taxes in San Bernardino and Imperial Counties are forecast toprovide an additional $4.3 billion in revenue through 2030.
Chapter 785, Statutes of 2003 (SB314), authorizes the LACMTA to place on the ballot beforeLos Angeles County voters another half-cent sales tax for transportation. This tax would belimited to a period of six-and-a-half years or less and is anticipated to generate about $4billion for specified Los Angeles County transportation-related capital projects and programs.Refer to Technical Appendix B for capital projects and programs as described in Chapter 785,Statutes of 2003 (SB314). The implementation schedules that are currently assumed forthese specified projects are contingent upon the passage of this sales tax measure. Tofacilitate the passage of these taxes, the State Constitution should be amended to allowpassage with a 55 percent majority instead of the currently required two-thirds majority.Several Constitutional Amendments have been introduced in the 2003-2004 session of theState Legislature that would provide for such a change.
With relatively positive public opinion poll findings, the Ventura County TransportationCommission (VCTC) is now examining the possibility of imposing a half-cent sales taxmeasure for transportation purposes in Ventura County. SCAG continues to monitor VCTC’sefforts and intends to incorporate projected revenue estimates resulting from the sales taxinitiative along with the specified projects upon further availability of information and progress.
Maximize Motor Vehicle Fuel User Fee Revenue Through Pay-As-You-Go andDebt Financing (Assuming an Adjustment to the Gas Tax Rate to MaintainHistorical Purchasing Power)An important element in the 2001 RTP’s revenue strategy was a five-cents-per-gallon increasein the motor vehicle fuel tax in 2010 and an additional penny annually between 2011 and2015, for a total increase of ten cents. For the 2004 RTP, it is proposed that a portion of therevenue stream from that increase be committed to the issuance of debt to raise up-frontrevenues to fund RTP projects. The remaining portion of the revenue generated from theincremental increase in the State gas tax could be utilized for direct pay-as-you-go projects.Additionally, GARVEE bond financing (Grant Anticipation Revenue Vehicles) would beemployed wherever feasible, pledging future federal funds to accelerate the 2004 RTP projectdevelopment process.
This proposal would require State implementation legislation. However, with the existingauthorization of debt financing using federal fuel tax revenue (GARVEEs), the federalgovernment has already established a precedent that the State of California should follow.
State transportation revenues are collected primarily from the State motor vehicle fuel excisetax. The current State fuel excise tax was last increased between 1990 and 1994, when it wasdoubled from nine cents to 18 cents per gallon. If an assumption were made that theLegislature would provide for a similar increase sixteen years later in 2010, the revenue

Chapter 4
144 DESTINATION 2030
stream for the RTP would be enhanced. As a matter of historical reference, the gas tax wasfirst imposed at two cents per gallon in 1923. Subsequently, the tax rate increased as shownin Figure 4.4. In light of past legislative actions to adjust the tax rate, it is reasonable toassume further rate adjustments during the 2004 RTP time horizon.
Figure 4.4
Review Methods for Collecting Revenues from Alternative Fuel VehiclesThe fuel tax component of SCAG’s public funding strategy seeks to offset the decline ingasoline tax revenues from inflation, fuel efficiency and alternative fuels. It includes the optionto further study the implementation of a revenue raising mechanism on alternative fuelvehicles should the market penetration rate of such vehicles be substantial.
It is clearly important to understand that the Region’s transportation revenue estimates areaffected by the actual market penetration rate of alternative-fuel and fuel-efficient vehiclesover the Plan period. If the penetration rate remains very low, the gasoline tax revenue losswould be minimal. However, it is likely that sources of energy for the motor vehicle fleet willbecome quite diverse and fuel efficiency of engines can be expected to increase during thetime frame of the 2004 RTP (horizon year 2030). Recognizing this, SCAG will seek funding inthe federal transportation reauthorization legislation to conduct research on alternativetransportation user fee collection mechanisms for various fuel/vehicle engine combinations.
n Development Mitigation Fee
Currently, the San Bernardino Associated Governments (SANBAG) is considering thefeasibility of a development mitigation fee in addition to the County’s Measure I renewalprogram (sales tax extension program). A Development Mitigation Committee was formed todetermine whether there is a need for additional mitigation of the impacts of privatedevelopment on regional transportation facilities. Upon further study, the committee willrecommend to the SANBAG Board of Directors the most appropriate approach to

Chapter 4
2004 Regional Transportation Plan 145
development mitigation, as deemed necessary. Initial revenue estimates for some approachesidentified for further analyses indicate that about $1.5 billion could be generated for arterials,grade separations, and interchanges in San Bernardino County.
n Private / Innovative Funding Strategy
Consider the Feasibility of HOT Lanes for New FacilitiesGiven limited public funds to support transportation infrastructure development, highoccupancy toll (HOT) lanes would be considered for some new facilities. Projected tollrevenues could be substantial based upon some initial analyses of corridors within the SCAGRegion.
Pursue User-Fee −Supported Project Financing for Major Regional InvestmentsWhere ApplicableThere are several one-of-a-kind major regional projects proposed in the 2004 RTP, includingthe proposed Maglev system, special purpose facilities, and freight railroad systemimprovements. These proposals are to be debt financed and backed by user charges. Theproposed debt financing instruments, including tax-exempt revenue bonds and tax creditbonds, facilitate public-private partnershipsmost critical to addressing some of the Region’sinfrastructure funding issues.
In recognizing that limited public resources are available to address many large-scaletransportation projects in the Region, this strategy simply provides that the Region willconsider the feasibility of using innovative public-private partnership arrangements to developtransportation infrastructure where such financing strategies are applicable. These financingarrangements are most applicable where we have identified projects capable of generatingtheir own streams of revenues to offset capital development, operations and maintenance aswell as any associated debt service costs.
Potential financing structures identified for the three proposed projects include:
Special Purpose Facility Financing
v Total development cost for a regional system of 140 miles including potentially the I-710corridor, the East-West Corridor, and the I-15 corridor, is estimated to be $16.5 billion.
v Net revenues generated from tolls would be leveraged to issue tax-exempt revenuebonds.
v Capital financing instruments may include a combination of senior-lien tax-exemptrevenue bonds and federal credit enhancement in the form of loans (at 33% total eligiblecapital costTIFIA).
v For the preliminary financial analysis, tolls were assumed to be imposed at an averagerate of $0.56 per mile.

Chapter 4
146 DESTINATION 2030
Regional Rail Capacity Project Financingv Total development cost for this component is estimated to be $3.4 billion ($1.2 billion for
capacity improvements and $2.2 billion for grade separations).
v The financial analysis relies upon taking advantage of the interest rate differential betweenprivate sector financing costs and tax-credit bonds, a public financing mechanism thatwould substitute federal tax credits for interest payments.
v It is assumed that a revenue stream equivalent averaging $5.39 per TEU would begenerated to finance the program.
Maglev Project Financingv The cost for this initial operating segment (IOS) is estimated to be $5.5 billion.
v The financing structure for this project relies upon the issuance of tax-exempt revenuebonds and TIFIA loans.
v An average charge of $0.37 per passenger mile would be needed to finance the project.
n Funding Components and SCAG’s Regional Checkbook
Table 4.17 itemizes each new funding component. The components, taken together, make upthe SCAG Region’s public and private funding strategies in developing a financially feasibleand comprehensive 2004 RTP. Furthermore, Table 4.18 outlines SCAG’s regional checkbookfor the 2004 RTP.

Chapter 4
2004 Regional Transportation Plan 147
Table 4.17
Table 4.18


CChapterhapter 55Plan Performance: HowWill the Plan Perform?

149DESTINATION 2030
2004 Regional Transportation Plan
CCHHAAPPTTEERR 55 PPLLAANN PPEERRFFOORRMMAANNCCEE:: HHOOWW WWIILLLLTTHHEE PPLLAANN PPEERRFFOORRMM??
System / Investment Performance
This chapter summarizes how well the 2004 RTP performs in meeting its adopted goals andsatisfying State and federal requirements. For instance, the California TransportationCommission (CTC), following State and federal laws, requires that SCAG use “program level”transportation system performance measures that reflect goals adopted by the SCAGRegional Council. Table 5.1 summarizes these adopted goals and their related performanceoutcomes. One or more performance measures were developed for each of these outcomesto quantify the Plan’s performance.
Table 5.1

Chapter 5
150 DESTINATION 2030
The RTP’s Technical Advisory Committee (TAC) was charged with guiding the developmentand application of performance measures to ensure that the best performing set ofimprovement strategies was presented in the 2004 RTP. The TAC members represent thecounty transportation commissions, subregional Councils of Government, Caltrans districts, airdistricts, California Air Resources Board, Federal Department of Transportation, andenvironmental and transportation advocacy groups. The TAC evaluated numerous scenariosand presented its recommendation to SCAG’s Regional Council. The selected strategy ispresented in this Plan and this chapter shows the performance results for the 2004 RTP.
n Plan Investment Performance
This section provides detailed information on each of the performance outcomes and relatedmeasures approved by the Regional Council for inclusion in the 2004 RTP. The basic conceptfor each criterion is to compare the performance of the Plan (2030) to both the Base Year(2000) and the Baseline (No-Project) scenario for 2030. The analysis is based upon the SCAGregional travel demand model.
MobilityThe mobility performance outcome relies on two commonly used measures: speed and delay.Speed and delay were computed using SCAG’s regional travel demand model with results asfollows:
v Speed is the average speed experienced by travelers regardless of mode in miles perhour (mph).
v Delay is the difference between the actual travel time and travel time that would beexperienced if a person traveled at the legal speed limit. This measure is reported asperson-hours of delay, which is presented here as a total and as delay per capita. Thelatter normalizes the results with the expected population growth during the Plan period(i.e., through 2030).
Figure 5.1 compares the speeds of the three scenarios. It shows that the Plan improvesaverage daily speeds by 10 percent compared to the Baseline (No-Project) and representsonly a half-mile-per-hour decline over Base Year results.

Chapter 5
Regional Transportation Plan 151
Figure 5.1
Figure 5.2 compares delay results and shows that the Plan reduces total daily person delay bymore than 40 percent compared to the Baseline (No-Project) and an increase of 50 percentover the Base Year condition. This increase reflects the growth in the Region and theresulting incremental travel.
Figure 5.2

Chapter 5
152 DESTINATION 2030
Figure 5.3 compares average daily delay per capita, which is a measure that takes intoaccount that there will be more people traveling on the Region’s transportation system by2030. The results tell a different story. Whereas total delay for the Plan increases by 50percent over Base Year conditions, it actually remains almost constant on a per capita basis.
Figure 5.3
Finally, Figure 5.4 compares average daily Heavy Duty Truck delays, which shows animprovement of over 30 percent compared to the Baseline (No-Project). This is an importantstatistic given the Plan’s emphasis on the logistics industry and its importance to the regionaleconomy.
Figure 5.4
Exhibits 5.1, 5.2, and 5.3 depict regional PM peak (3 p.m. to 7 p.m.) freeway speeds for BaseYear 2000, Baseline (No-Project) in 2030, and Plan in 2030, respectively.

Chapter 5
Regional Transportation Plan 153
INSERT EXHIBIT 5.1: 2000 BASE YEAR FREEWAY SPEED PM PEAK


Chapter 5
Regional Transportation Plan 155
INSERT EXHIBIT 5.2: 2030 BASELINE (NO PROJECT) PM PEAK FREEWAY SPEED


Chapter 5
Regional Transportation Plan 157
INSERT EXHIBIT 5.3: 2030 PLAN PM PEAK FREEWAY SPEED


Chapter 5
2004 Regional Transportation Plan 159
AccessibilityAccessibility measures how well the transportation system provides people access toopportunities. Opportunities can include jobs, education, medical care, recreation, shopping,or other activities that help improve people’s lives.
For the 2004 RTP, accessibility is defined as the percentage of the population who can travelbetween work and home within 45 minutes during the PM peak period. Access to employmentis used as a reasonable proxy for access to all opportunities, since work trips make up a largepercentage of total trips during commute periods. Figure 5.5 compares the Plan to Base Yearand Baseline (No-Project), and presents the percent of work trips completed within 45 minutesfor both automobiles and transit.
The figure clearly shows that the Plan not only improves accessibility compared to theBaseline (No-Project), but it actually shows an improvement compared to Base Yearconditions for both auto and transit. This is primarily due to the Land-Use Integration strategy,which intensifies densities and focuses development close to work and along major transitcorridors. Yet, transit accessibility still performs significantly worse than auto accessibility,which is a problem that will continue to challenge transportation planners and decision-makersin the Region.
Figure 5.5

Chapter 5
160 DESTINATION 2030
ReliabilityThe reliability outcome reflects the degree to which travelers experience variations in their triptimes from day to day. As such, it captures the relative predictability of the public’s travel time.Unlike mobility (which measures how quickly the transportation system is moving people) andaccessibility (which addresses how good the system is in providing access to opportunities,primarily jobs), reliability focuses on how much mobility and accessibility vary from day to day.
The reliability measure is calculated by using the statistical concept of the standard deviation.The indicator is computed by dividing the standard deviation of travel time for a given trip bythe average travel time of that trip, measured over many days and weeks. Table 5.2 showshow a traveler can use this indicator depending on the importance of arriving on time. Forexample, if a person’s morning commute takes on average 26 minutes, but varies 15 percentfrom day to day, then he or she must plan the trip to account for additional time. Table 5.2 alsoshows that if this person wants to be 99 percent confident that he or she arrives on time, he orshe must plan for 38 minutes of travel instead of 26.
Table 5.2
This indicator is relatively new in transportation planning and operations, and exact models tocompute and forecast it are not available. However, by using existing travel time data andresearch results, it is possible to estimate Plan impacts on reliability. Table 5.3 presents theseresults, which reflect the benefits derived from the investments that help respond more quicklyand effectively to traffic accidents or provide traveler information. However, it is critical tocontinue to monitor this measure and improve the tools to forecast the impacts of suchinvestments in future SCAG planning cycles.

Chapter 5
2004 Regional Transportation Plan 161
Table 5.3
ProductivityThe productivity outcome reflects the degree to which the transportation system performsduring peak demand conditions. It is a system efficiency measure. The productivity indicatoris defined as the percent utilization during peak demand conditions.
As an example, freeways are typically designed to carry 2,000 vehicles per lane per hour.However, in many locations on the Region’s freeway system, vehicles weaving and merging inand out of traffic cause bottlenecks, which lead to significant reductions in capacity utilization.Again, using freeways as an example, the carrying capacity of a freeway lane can drop by asmuch as 50 percent, allowing only 1,000 vehicles per hour to pass. In effect, the system“loses” capacity, which can be estimated in terms of lost lane-miles.
Figure 5.6 summarizes the current estimate for productivity losses on the Region’s freewaysystem and the expected improvements due to Plan investments. Maximizing the system’sproductivity is a critical goal of this RTP and the overall system management approach aims torecapture lost productivity.
Note that the Plan improves productivity by committing to investments in State Highwayoperations discussed in Chapter 4. Transit productivity will also improve through increasedridership, which maximizes the number of seats occupied during peak demand conditions.

Chapter 5
162 DESTINATION 2030
Figure 5.6
PreservationThe preservation outcome reflects how well the Region is taking care of its multi-modaltransportation infrastructure. Figure 5.7 presents the total preservation costs through the year2030 for State Highways, arterials, and transit. The total cost for all three categories through2030 adds up to more than $40 billion.
It is important to note that truck traffic adds significantly to pavement preservation costs.Furthermore, truck volume growth in the Region is expected to outpace population growth.Yet the Region’s economic well-being depends on its transportation and logistics industry.Therefore, it is important to monitor truck traffic on major corridors and revisit the StateHighways preservation expenditures to ensure that the Region’s system remains in adequatecondition and that the logistics industry remains vibrant.
Figure 5.7

Chapter 5
2004 Regional Transportation Plan 163
An average annual cost per capita is a useful measure to understand and consider thegrowing costs of maintaining the Region’s aging infrastructure. The indicator reflects theburden or responsibility placed on every person in the Region annually to preserve thetransportation system. As can be seen in Figure 5.8, these costs increase by about 1/3 overthe duration of the Plan.
Figure 5.8
SafetyImproving safety by minimizing accidents is a critical outcome of the RTP. The safetyindicators used to measure and track safety-related performance are:
v Fatalities per million personsv Injuries per million personsv Property damage accidents per million persons
State and regional transportation agencies dedicate funds to projects that specifically addresssafety deficiencies. However, it is not possible to predict the reduction in accident ratesresulting from these investments. Hence, the safety results presented here are estimatedbased on current accident rate trends for the different modes applied to projected levels ofsystem use by mode. They represent a conservative estimate for safety benefits.

Chapter 5
164 DESTINATION 2030
Figure 5.9 compares safety indicators for the Base Year, Baseline (No-Project), and Planscenarios. The overall improvement is estimated based on overall accident rates by mode(e.g., auto, bus, and rail) and facility (e.g., freeways and principal arterials).
Figure 5.9
SCAG Regional Performance Analysis Accident Rates
SustainabilityA transportation system is sustainable if it maintains its overall performance over time with thesame costs for its users. Sustainability, therefore, reflects how our decisions today affectfuture generations. The indicator for sustainability is the total inflation-adjusted cost per capitato maintain overall system performance at current conditions.
The performance measures presented in this chapter show that the planned transportationsystem in 2030 will perform approximately as well as it does today. However, the overall costof the Plan represents a $20 per capita per year increase to cover preservation and operationsinvestments.
Note that despite this incremental cost, the Plan performs extremely well given the expectedpopulation and travel growth in the Region.
Cost-EffectivenessCost-effectiveness reflects the degree to which transportation expenditures in the Plan yieldbenefits that the transportation users experience. It attempts to measure how much “bang forthe buck” is received from the Plan. The indicator for cost-effectiveness is the benefit-costratio. Benefits are divided into several categories as follows:

Chapter 5
2004 Regional Transportation Plan 165
v Delay savingsv Safety improvementsv Air quality improvementsv Reductions in vehicle operating costs
For each of these categories, models are used to estimate the benefits of the Plan comparedto Baseline (No-Project). The benefits are converted into dollars, added together, and dividedby the total incremental costs of the Plan’s transportation improvements. Table 5.4summarizes the results of the benefit-cost analysis.
Table 5.4

Chapter 5
166 DESTINATION 2030
Mobility Benefits Attributable to the Land-Use Strategies
Significant mobility improvements result from the Growth Vision approach of focusingdevelopment in centers and along transportation corridors, promoting transit-orienteddevelopment, attempting to achieve a job-housing balance, as well as using other strategies.Compared to Baseline (No-Project), the Plan reduces VMT by 15 million vehicle miles, ofwhich almost 35 percent result from incorporating land-use strategies in support oftransportation investments (see Figure 5.10). Notable benefits are also achieved in reducingvehicle hours traveled (-12 percent) and vehicle hours of delay (-8 percent).
Figure 5.10
Economic Impact Analysis
n Decline in Employment Growth Rate
The 2004 RTP growth forecast foresees a sharp and unprecedented decline in growth rate,and change and makeup of the labor force in the Regionparticularly after 2010 as a largenumber of “Baby Boomers” start to reach retirement age. The share of total population andhouseholds of elderly and retired persons in the Region is projected to double from today.These households are more likely to be headed by non-minority (i.e., non-Hispanic Whites)householders. “Baby Boomers” born between 1946 and 1964 will change the shape of ourpopulation structure from a pyramid, with fewer older persons at the top, to a column withretired and working-aged populations being similar in size.

Chapter 5
2004 Regional Transportation Plan 167
Unlike the 1960 to 2000 period, the Region will not have a large labor force to support a muchsmaller retired population. Instead, the Region will experience a situation where a smallerlabor force made up of minority households will be supporting a large retired population madeup of non-minority households. The minority groups today account for 90 percent of futurepopulation growth. These minority households, increased by immigration, will be larger,consist of multiple generations and be headed by younger individuals in the workforce. Laborforce size and employment growth will be sensitive to these changes in demographics.
During the 2000−2030 forecast period, employment growth will be constrained by the size ofthe anticipated labor force. A major challenge for the Region will be to prepare and matchyounger workers with future jobs. Matching needed skills and education levels with new andespecially better-paying future jobs will affect migration trends and immigration levels. Theseimpacts will be felt most after 2010.
While the Region, during the last 40 years (1960−2000), expanded its job base at an annualcompound growth rate of 2.4 percent, the SCAG Region’s job growth rate is now projected tobe only 0.74 percent during the 20-year period between 2010 and 2030 (Figure 5.11).
Figure 5.11
This is about one-third of what was achieved in prior decades. The projected employmentgrowth trends after 2010 suggest an imbalance between the size of the labor force, the retiredpopulation that employed workers must support, and the amount of job growth that can beachieved. As a result, the regional economy is expected to face tremendous downwardpressure and may not be able to produce the jobs, wealth and prosperity that it did in priordecades. The economic health of the Region is tied to job growth, particularly the creation of
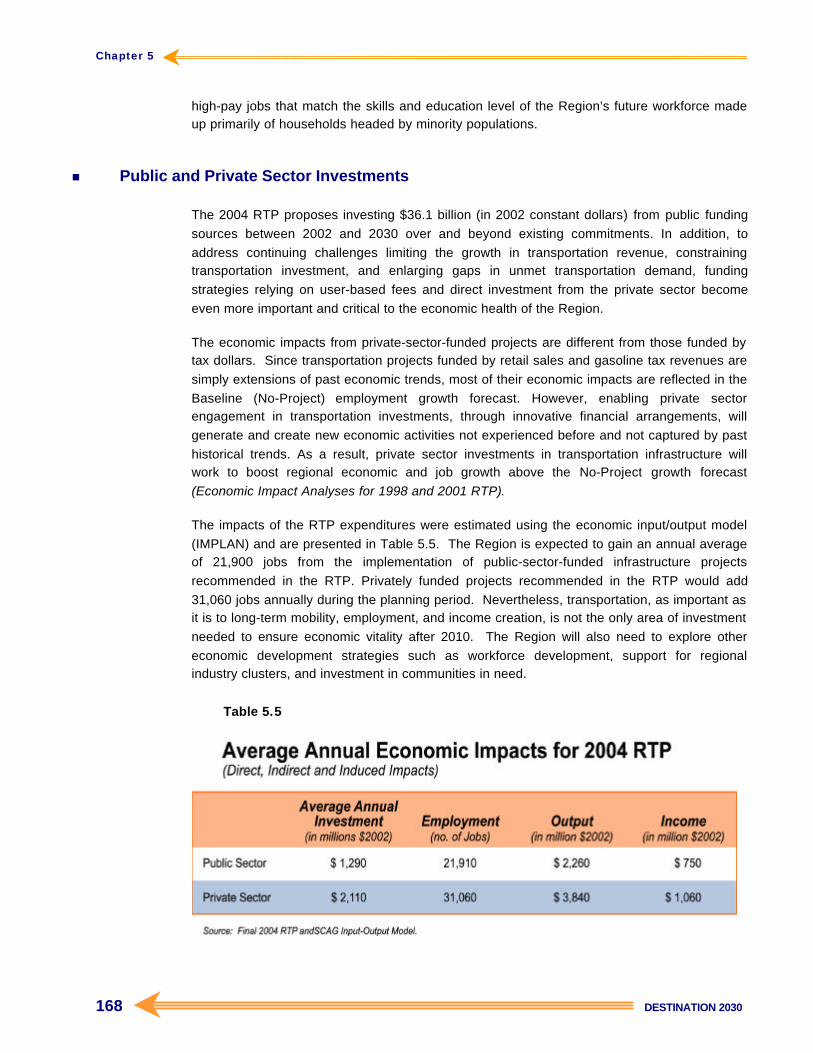
Chapter 5
168 DESTINATION 2030
high-pay jobs that match the skills and education level of the Region’s future workforce madeup primarily of households headed by minority populations.
n Public and Private Sector Investments
The 2004 RTP proposes investing $36.1 billion (in 2002 constant dollars) from public fundingsources between 2002 and 2030 over and beyond existing commitments. In addition, toaddress continuing challenges limiting the growth in transportation revenue, constrainingtransportation investment, and enlarging gaps in unmet transportation demand, fundingstrategies relying on user-based fees and direct investment from the private sector becomeeven more important and critical to the economic health of the Region.
The economic impacts from private-sector-funded projects are different from those funded bytax dollars. Since transportation projects funded by retail sales and gasoline tax revenues aresimply extensions of past economic trends, most of their economic impacts are reflected in theBaseline (No-Project) employment growth forecast. However, enabling private sectorengagement in transportation investments, through innovative financial arrangements, willgenerate and create new economic activities not experienced before and not captured by pasthistorical trends. As a result, private sector investments in transportation infrastructure willwork to boost regional economic and job growth above the No-Project growth forecast(Economic Impact Analyses for 1998 and 2001 RTP).
The impacts of the RTP expenditures were estimated using the economic input/output model(IMPLAN) and are presented in Table 5.5. The Region is expected to gain an annual averageof 21,900 jobs from the implementation of public-sector-funded infrastructure projectsrecommended in the RTP. Privately funded projects recommended in the RTP would add31,060 jobs annually during the planning period. Nevertheless, transportation, as important asit is to long-term mobility, employment, and income creation, is not the only area of investmentneeded to ensure economic vitality after 2010. The Region will also need to explore othereconomic development strategies such as workforce development, support for regionalindustry clusters, and investment in communities in need.
Table 5.5

Chapter 5
2004 Regional Transportation Plan 169
n Improving Economic Vitality after 2010
The 2004 RTP boosts regional employment economic vitality after 2010 through transportationinfrastructure investments funded through the private sector and backed by user fees. Debtfinance strategies backed by these fees can be readily applied to goods movement projects,the IOS of Maglev, and others. The innovative finance strategy of private sector investmentswill enable the Region to pool $26.2 billion. This regional strategy, if successful, will become apowerful economic development tool that will generate jobs, increase per capita wealth andrestore economic competitiveness and social equity. In the long run, private sectorinfrastructure investments can revitalize the SCAG Region’s economy and enhance its globaleconomic position. It addresses the gap between projected and needed additional job growthafter 2010. Moreover, the economic benefits from private investments of this magnitude willnot be confined to the SCAG Region; positive State and national economic impacts will alsobe generated.
Transportation Conformity Analysis
In the federally designated non-attainment and maintenance areas, the MPO (SCAG) isrequired to make a conformity finding before approving the 2004 RTP. The SCAG Region issituated in one or more federal non-attainment areas, with the exception of a less-populatedarea in the eastern portion of Riverside County.
The 2004 RTP must comply with the Environmental Protection Agency’s (EPA) TransportationConformity Rule and all associated court cases. Additionally, it must conform to the goals andobjectives of the applicable State Implementation Plans (approved by EPA) developed forimproving the air quality in the SCAG Region. The 2004 RTP must pass the following testsand analyses to meet all requirements for conformity finding:
v Regional Emission Analysisv Timely Implementation of Transportation Control Measures (TCMs) Analysisv Financial Constraint Analysisv Interagency Consultation and Public Involvement Analysis
n Regional Emissions AnalysisThe regional emissions analysis should be conducted by non-attainment area/by pollutant andshould conform to the applicable emissions budgets. The applicable emissions budgets arethose approved and found to be adequate for conformity determination by EPA. In theabsence of applicable emissions budgets, the regional emission tests for conformity findingare based on the build/no-build scenario. The regional emissions analysis produced a positiveconformity finding for the Region.

Chapter 5
170 DESTINATION 2030
n Timely Implementation of TCMs AnalysisAll TCM projects subject to reporting must be fully funded and on schedule to pass theanalysis. In the SCAG Region, there are two areas for which the ozone SIPS contain TCMs.
v The ozone AQMP/SIP for the SCAB area (TCM categories: HOV measures, transit andsystem management measures, and information-based transportation strategies)
v The ozone AQMP/SIP for the Ventura County portion of SCCAB (TCM strategies:ridesharing, non-motorized, traffic-flow improvements, land-use, and transit)
Reporting on timely implementation of TCMS for conformity finding is based on the TCMslisted in the 2002 Regional Transportation Improvement Program (RTIP). For the conformityfinding of the 2004 RTP, the CTCs in the SCAB area and Ventura County provide SCAG withthe status of all TCM projects listed in the first two years of the 2002 RTIP.
n Financial Constraint AnalysisThe 2004 RTP is financially constrained and is financed by federal, State and local sources.Detailed information on the financial analysis is included in the Technical Appendix.
n Interagency Consultation and Public InvolvementThe 2004 RTP was circulated for a public review and comment period. Throughout itsdevelopment, the 2004 RTP has been discussed at meetings of various policy committees,task forces, technical advisory committees, and conformity and subregional working groups. Apublic hearing was held on January 15, 2004, prior to SCAG’s Regional Council approving the2004 RTP in April 2004.
Detailed information and analysis on the transportation conformity of the 2004 RTP areincluded in the Technical Appendix.
Environmental Justice
Environmental justice requirements applicable to SCAG’s transportation plans stem from TitleVI of the Civil Rights Act of 1964, President Clinton’s 1994 Executive Order 12898 onEnvironmental Justice, related DOT and FHWA orders, and federal planning regulations. Inaccordance with these laws and regulations, SCAG seeks to ensure that the RTP’s benefitsand burdens are distributed equitably across groups based on race, income, age anddisability.
SCAG’s environmental justice program includes two main elements: public outreach andanalysis. Our public outreach efforts are intended to assure that all members of the publichave an opportunity to participate meaningfully in the planning process. These efforts includetargeted outreach to minority and low-income communities throughout the Region to assure

Chapter 5
2004 Regional Transportation Plan 171
that their concerns are heard and addressed. SCAG’s 2004 RTP examines severalperformance measures to determine if there is a disproportionate negative impact of the Planon any income, ethnic, or age group. If inequities are found, they should be mitigated(although they can be justified if there is no less-discriminatory alternative or if any alternativewould pose an extraordinary financial cost).
n Environmental Justice Analysis Results
The performance results in the following section are based on comparison of conditions withthe Plan to conditions without the Plan (referred to as Baseline [No-Project]). Households aredivided into quintiles, or five equally sized groups based on income. Quintile 1 refers to thelowest fifth of households in terms of annual income, Quintile 5 to the highest fifth.
Distribution of Plan ExpendituresSCAG analyzed the distribution of Plan expenditures based on mode usage information byincome quintile. This analysis showed that 57 percent of total public expenditures under thePlan would be spent on modes most commonly used by the lower three income quintiles, orthe lowest 60 percent of the population in terms of income (see Figure 5.12).
Figure 5.12
Using Public Use Microdata Samples (PUMS) from 2000 U.S. Census data, SCAG was alsoable to determine mode usage by racial and ethnic category. This data was also comparedwith Plan expenditures by mode. As shown in Figure 5.13, for most ethnic and racialcategories, the shares of Plan investments are similar to the shares of system usage. ForHispanics, the share of Plan expenditures (50 percent) is substantially greater than thisgroup’s share of system usage (34 percent), while for African-Americans, the share of Planexpenditures (9 percent) also exceeds their share of system usage (6 percent).

Chapter 5
172 DESTINATION 2030
Figure 5.13
Share of Benefits and BurdensSCAG analyzed the share of Plan burdens, in the form of federal, State and local sales andgasoline taxes paid, in comparison with the share of Plan benefits, in the form of travel timeand distance savings by several modes.
For auto travel, the share of time savings for most income groups is roughly comparable totheir share of taxes paid and their share of transportation system usage (see Figure 5.14).The lowest income quintile does not enjoy benefits quite up to the level of their tax share orusage for travel by auto, but this deficit is compensated for by a large share of time savingswhen using transit (see Figure 5.15). The highest income quintile pays a larger share of taxes(37 percent) than it receives in time savings benefits for travel by auto (30 percent). Benefitsin terms of time savings on transit are heavily concentrated in the two lowest income quintiles(53 percent of all time savings).
SCAG also computed savings in terms of person-miles traveled, or PMT. These resultsindicate that the share of driving distance savings, like that for time savings, generallyresembles the share of usage and taxes paid (see Figure 5.16). This is another way ofestimating the benefits of land-use strategieslocating homes nearer to work places andintensifying land-usereflected in the Plan.

Chapter 5
2004 Regional Transportation Plan 173
Figure 5.14
Figure 5.15

Chapter 5
174 DESTINATION 2030
Figure 5.16
Accessibility to Jobs and ServicesThe investments in the 2004 RTP will improve accessibility to jobs and services for all theRegion’s residents. Improvements for auto travel are fairly consistent across all incomequintiles and racial/ethnic categories, ranging from a low of 12.9 percent for Quintile 1 to ahigh of about 12 percent for the higher income quintiles (see Figure 5.17). Increases inaccessibility via low-cost transitbuses and urban railare comparable, and are clearlygreater for the lower income groups. Improvements in accessibility by all forms of transitlow-cost, plus Metrolink commuter rail and Maglevaverage 12 percent and are slightlyhigher for the lower income groups than for the upper ones.
Figure 5.17
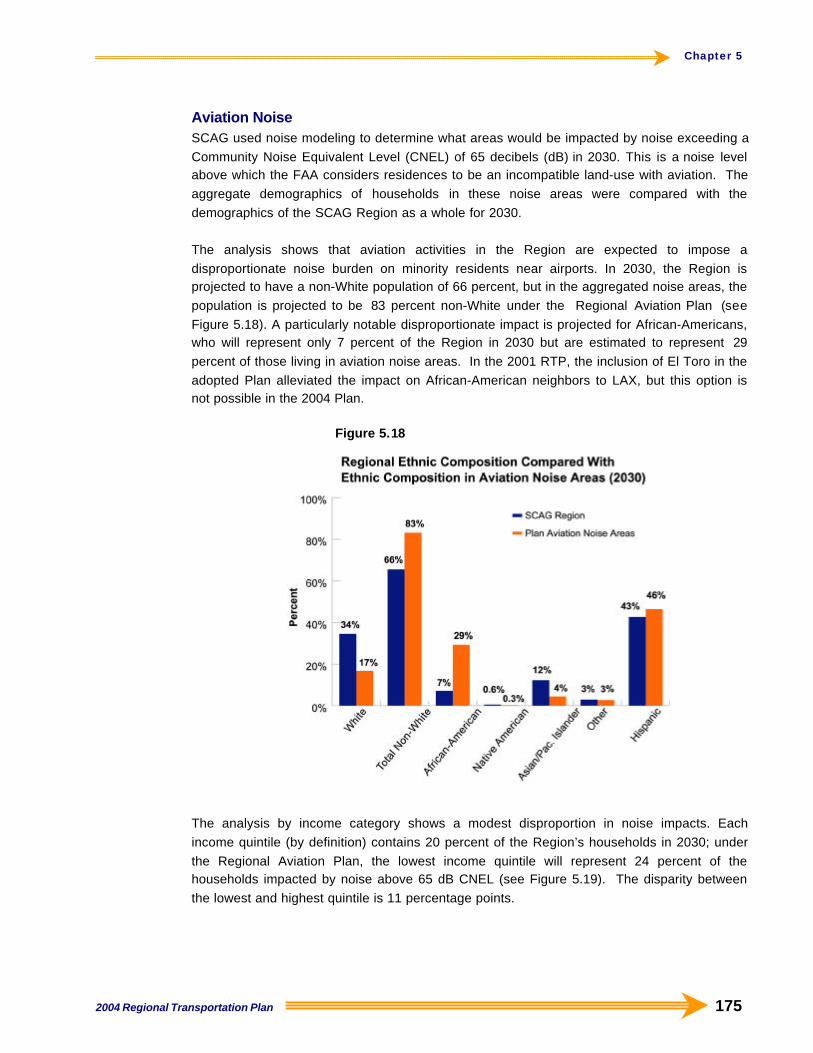
Chapter 5
2004 Regional Transportation Plan 175
Aviation NoiseSCAG used noise modeling to determine what areas would be impacted by noise exceeding aCommunity Noise Equivalent Level (CNEL) of 65 decibels (dB) in 2030. This is a noise levelabove which the FAA considers residences to be an incompatible land-use with aviation. Theaggregate demographics of households in these noise areas were compared with thedemographics of the SCAG Region as a whole for 2030.
The analysis shows that aviation activities in the Region are expected to impose adisproportionate noise burden on minority residents near airports. In 2030, the Region isprojected to have a non-White population of 66 percent, but in the aggregated noise areas, thepopulation is projected to be 83 percent non-White under the Regional Aviation Plan (seeFigure 5.18). A particularly notable disproportionate impact is projected for African-Americans,who will represent only 7 percent of the Region in 2030 but are estimated to represent 29percent of those living in aviation noise areas. In the 2001 RTP, the inclusion of El Toro in theadopted Plan alleviated the impact on African-American neighbors to LAX, but this option isnot possible in the 2004 Plan.
Figure 5.18
The analysis by income category shows a modest disproportion in noise impacts. Eachincome quintile (by definition) contains 20 percent of the Region’s households in 2030; underthe Regional Aviation Plan, the lowest income quintile will represent 24 percent of thehouseholds impacted by noise above 65 dB CNEL (see Figure 5.19). The disparity betweenthe lowest and highest quintile is 11 percentage points.

Chapter 5
176 DESTINATION 2030
Figure 5.19
Highway NoiseSCAG used highway noise modeling to determine what roadway segments in the Regionwould experience a perceptible increase in noise levels between the base year (2000) and thePlan year (2030). The aggregate demographics of households within 150 feet of either size ofthese roadway segments were determined and compared with regional demographics. Thisanalysis indicates a moderate disproportionate impact: in 2030, the Region will be 66 percentnon-White, but in roadway noise areas, the proportion is 72 percent non-White, a disparity of 6percentage points (see Figure 5.20). Of the various ethnic groups affected, Hispanics areprojected to experience the greatest disparity (about 4 percentage points). There is a similarmoderate disproportionate impact across income groups, with the lowest quintile representing23 percent of the households in highway noise areas in 2030 compared to 20 percent ofhouseholds in the Region as a whole (see Figure 5.21). There is a difference of 6 percentagepoints between the lowest and highest income quintilesa moderate but notable disparity.
It is important to realize that disproportionate highway noise impacts are also found in thebase year 2000, and in fact, the disparities are projected to be less severe in 2030 than theyare today. The identification of these impacts at the regional level highlights the importance ofsoundwalls and similar noise mitigation measures for individual transportation projects.

Chapter 5
2004 Regional Transportation Plan 177
Figure 5. 20
Figure 5.21

Chapter 5
178 DESTINATION 2030
Air Pollutant EmissionsSCAG estimated the changes in emissions that would be experienced by various income andethnic groups under the 2004 RTP. Since SCAG does not have the tools to estimate airquality resulting from the dispersion of emitted air pollutants, the analysis was based onemissions estimates for pollutants that have localized health effects: CO and PM10. Analysiswas also conducted for the PM10 exhaust emissions from heavy-duty vehicles: an indicator fordiesel toxic air contaminants. The results were computed based on the average emissions atthe Traffic Analysis Zone (TAZ) level (estimated by SCAG’s Direct Travel Impact Model), andweighted according to the population of each ethnic or income group in that TAZ.
The results show that all income and ethnic groups, as well as disabled and elderly (over 65)populations, will benefit overall from improvements in CO and PM10 emissions when the RTPconditions are compared to the Baseline (No-Project) conditions (see Figures 5.22 and 5.23).As the figures show, improvements are in the range of 7 to 11 percent overall (with variationsdue to the different weighing factors).
Figure 5.22

Chapter 5
2004 Regional Transportation Plan 179
Figure 5.23
Since not all areas will experience reduced emissions under the Plan, SCAG also analyzedthe distribution in areas where emissions are projected to increas e. These results show thatthe increase in emissions exposure is approximately the same across income groups (seeFigure 5.24) and racial/ethnic groups (see Figure 5.25).

Chapter 5
180 DESTINATION 2030
Figure 5.24
Figure 5.25

CChapterhapter 66Implementing Our Plans &Monitoring Our Progress

181DESTINATION 2030
2004 Regional Transportation Plan
CCHHAAPPTTEERR 66 IIMMPPLLEEMMEENNTTIINNGG OOUURR PPLLAANNSS AANNDDMMOONNIITTOORRIINNGG OOUURR PPRROOGGRREESSSS
This section discusses how SCAG, as the MPO for the six-county Region, monitors theimplementation of the 2004 RTP and monitors its progress in achieving its stated goals andsystem performance.
As discussed in Chapter 2, the 2004 RTP comes at a time of great challenges. SCAG and itspartners believe they have addressed these challenges from a planning perspective.However, as with any plan, its success or failure depends on execution.
SCAG intends to continue its longstanding role as the monitoring agency for Planimplementation in all its facets.
Securing the Planned Funding
When establishing funding strategies for the 2004 RTP, current policies of the State andfederal governments must be taken into account. State government policies are especiallyimportant in that the State can provide revenues directly or it can authorize various local andregional transportation funding programs. With the enactment of Senate Bill 45 (Chapter 622,Statutes of 1997), the State restructured its transportation policies governing transportationplanning and investments. Because of this legislation, transportation investment priorities wereto be established at the regional and county level. To support this effort, 75 percent of theState revenue for the construction of transportation projects was allocated to the Region. Inaccordance with the regional emphasis of SB45, the objective of SCAG’s proposed fundingstrategy is to create a predictable stream of revenue for new transportation projects whileensuring local/regional control over the prioritization of the projects.
n Action Plan for Implementing Funding Strategy
To realize the SCAG Region’s proposed program of transportation funding, several activitiesmust be undertaken. The following provides a list of some actions to be taken:

Chapter 6
182 DESTINATION 2030
Milestone Action Years
1 Undertake a regionwide, multiyear public awarenessprogram to familiarize decision-makers with the issues beingaddressed in the RTP and the importance of the fundingstrategies to regional mobility, economic well-being and thequality of life.
Ongoing
2 Initiate one-on-one communications with State and federallegislators representing the Region, to explain the long-termtransportation requirements of the Region and the fundingoptions needed to address these requirements.
Ongoing
3 Create a regional partnership involving SCAG, the CountyTransportation Commissions, the subregions and privateinterests to advocate the implementation of the fundingstrategies.
2003-2005
SCAG believes that these three actions provide the framework for a multiyear implementationprogram. The funding components of the program would likely be implemented over the nextfive to ten years and would require the formation of coalitions both within the SouthernCalifornia Region and throughout the State. Each funding proposal has its own set ofconditions that will influence implementation. Recognizing this, SCAG proposes the followingactions:
Join with the “self-help” counties and other groups to obtain authorization for aless than two-thirds vote requirement to continue the local transportation salestax programs.Local sales taxes have become a central feature of transportation funding over the last twodecades in the SCAG Region and elsewhere in California. The objective is to obtain passageof a Constitutional Amendment that would reduce the approval requirement from two-thirdsvote for a local sales tax measure to a 55 percent majority. There is statewide consensuswithin the transportation community that this is necessary. Current legislative initiativesincluding ACA 7 (Dutra) and SCA 2 (Torlakson) would reduce the vote threshold requirementto 55 percent for transportation sales taxes. SCA 2, however, would require that 25 percent ofthe funds be dedicated to smart-growth projects.
It should be noted that despite the existing two-thirds voter approval requirement, somecounties in the SCAG Region are planning to pursue reauthorization of their respective salestaxes. The process for pursuing reauthorization of the sales tax measures in the SCAGRegion would entail a series of important actions including:

Chapter 6
2004 Regional Transportation Plan 183
Milestone Action(s)
1 Establishing a Measure Renewal Committee
2 Campaign Finance
3 Marketing/Public Awareness Surveys
4 Expenditure Plan
5 Local Consensus
6 Ballot Measure by County CTC/Extension of Local Sales Tax
Development Mitigation Strategy.In coordination with the Measure I renewal effort in San Bernardino County, steps havealready been taken to consider the feasibility of integrating a development mitigation programthat would generate revenues for regional arterials and interchanges in San BernardinoCounty. More recent polls (January 2003) indicated support by a majority of county voters toconsider mechanisms for ensuring that new development pays a portion of the cost of newtransportation improvements. Accordingly, an Ad Hoc Development Mitigation Committee wasformed to consider a development mitigation strategy associated with the Measure I renewalprogram. Further study is required.
Adjust the fuel excise tax rate to maintain historical purchasing power. Further,maximize fuel tax revenue through pay-as-you-go and debt financing.To ensure adequate revenues for the 2004 RTP, SCAG proposes a five-cent gas tax increasein 2010 with an additional penny per year until 2015. By the year 2010, it also will have beenabout 16 years since the motor vehicle fuel tax was last increased in California. Clearly, therewill be a statewide interest in increasing fuel tax revenues to offset the continuing decline inthe revenue’s purchasing power.
Further, it is proposed that a portion of the revenue stream from the increase in the gas tax becommitted to the issuance of debt to accelerate RTP project development (assisting theRegion to secure and maintain conformity). The remaining portion of the revenue generatedfrom the incremental increase in the gas tax could be utilized for direct pay-as-you-go projects.For this to occur, it will be necessary for the State to pass enabling legislation authorizing theissuance of debt guaranteed by future gas tax revenues. Alternatively, the Legislature couldauthorize the Region to impose a local gas tax/user fee for funding projects along withrevenue bond authority. While the Plan anticipates the fuel tax increase to begin in 2010, theactual implementation strategy must begin now. This entails the following actions:
v Developing stakeholder consensus on a statewide and regional funding strategy
v Evaluating the merits of a regional gas tax/user fee measure and the institutionalframework necessary to implement and manage such a regional program

Chapter 6
184 DESTINATION 2030
v Focusing on public education
The above three activities should begin now because there are numerous technical and policyissues that must be addressed prior to introducing the tax/fee measure during the 2007-2009period for imposition between 2010 and 2015. Moreover, there is a need for increasing thepublic’s awareness regarding the transportation investment requirements and revenue needs.
Milestone Action(s) Year(s)
1 Subsequent updates to the Regional TransportationPlan to develop a blueprint program of expenditures
(2005−2009)
2 Develop State/regional consensus (2003−2009)
3 Evaluate whether to pursue State or regional fueltax initiative
(2005)
4 Public education/outreach (2002−2009)
5 Introduce legislation (2007−2009)
6 Adjust the State motor vehicle fuel excise tax/userfees (or regional fuel tax imposition)
(2010−2015)
Pursue user-fee−supported project financing for major regional investmentswhere applicable.The success of pursuing user-fee−supported project financing for our proposed large-scaleprojects, including Maglev, special purpose facilities and the rail capacity improvementprogram, is predicated on the enactment of enabling statutes and administrative actions.SCAG’s initial evaluation of the proposed project-financing program identified three coreobjectives:
v Creating an institutional authority for project implementation and managementv Facilitating access to innovative financing mechanismsv Accelerating State and federal environmental review processes
Institutional Arrangements/Governance and Management StructureThe pursuit of State legislation would be necessary to facilitate the implementation of thisprogram. The legislation would establish an institutional framework for the governance andmanagement of an implementing authority for the user-fee−backed special purpose facilitiesand rail capacity programs. A separate Joint-Powers Authority (JPA) is currently underdevelopment for the proposed Maglev component. In addition to SCAG, the other agenciesinvolved in the institutional structure would include the county transportation commissions,Southern California Regional Rail Authority (SCRRA), Caltrans, and private sector partners.

Chapter 6
2004 Regional Transportation Plan 185
Financing MechanismsAs stipulated in the adopted 2001 RTP and previously in Chapter 4, innovative user-feeapproaches would be employed to finance special purpose facilities, railway capacity, andMaglev projects. The financing structure includes the issuance of tax-exempt revenue bonds,secured by user-fee revenues generated by specific transportation facilities. Additionally,lower-cost federal credit enhancement programs would be utilized. The rail capacityimprovement program would rely on federal legislation authorizing the use of federal tax creditbonds. Already, industry groups are pursuing legislation to amend current tax code provisionsfacilitating the use of private activity bonds including tax credit bonds.
Environmental Streamlining/Accelerated Project Development/Joint EIS.To facilitate project implementation, the objective is to streamline the environmentaldocumentation process by preparing one document that would cover all three projects:Maglev, “special purpose facilities,” and rail improvements. This would be advantageous inanalyzing corridor impacts. In the best case scenario, an EIR/EIS (or three simultaneousdocuments) would require about two years to prepare, with 6 months to prepare preliminaryengineering and a minimum of a year and a half to complete the environmental document(s).
Milestone Action(s) Year(s)1 Continue stakeholder meetings (regional,
statewide, and national)2003−2004
2 Initiate media and public outreach campaign 2003−2004
3 Develop State and federal legislation relatingto institutional authority structure and financingmechanisms
2003−2004
4 Introduce legislation to stakeholders fordiscussion and input
2003−2004
5 Secure bill endorsement from local, State, andfederal stakeholders (public and privateinterests)
2003−2004
6 Secure State and federal legislators tointroduce legislation and achieve enactment
2003−2004
These actions need to be pursued aggressively. Also, monitoring the progress of theseactions is an important part of the Planensuring that SCAG will consider creative actions asnecessary through the course of Plan updating. Continued development of new revenuesources for transportation and the expansion of financing techniques depend upon institutionalreadiness. SCAG and the transportation community as a whole must continue to push theenvelope and develop creative means to address our transportation challenges.

Chapter 6
186 DESTINATION 2030
Embracing System Management and Operation
SCAG will take a proactive role in ensuring that the management and operation of the systemis given high priority in the funding plans of the implementing agencies. This will beaccomplished by working closely with our stakeholders in developing expenditure guidelinesthrough existing regional planning and interagency consultation and coordination processes.
Integrating the Growth Vision Strategy
n Action Plan for Implementing Regional Growth Vision Alternative
The SCAG 2004 RTP Preferred Alternative the Growth Vision Alternativeaddresses themandates of transportation planning law through the integration of land-use decisions andtransportation investments. To a greater extent than previous Plans, this integration is centralto the performance of the Plan and, thus, specific action items addressing the implementationof the land-use component have been identified in conjunction with the financial, aviation, andother plans and programs identified in the 2004 RTP.
The previously discussed Growth Vision Alternative Tenets form the framework for theimplementation of the Growth Vision Alternative to meet the system improvement andperformance objectives of the 2004 RTP. Transportation modeling analysis confirms thatthese tenets, if implemented, realize significant regional benefits in the form of transportationcongestion relief and improved air quality. However, the success of the Growth Vision cantake many forms. It is not any one specific action that will define success, but rather thecombination of policies, strategies and efforts by all that share the responsibility of creating theRegion’s future.
To ensure the realization of our Growth Vision, SCAG will continue its Growth Visioning effortsfor at least seven years in order to continue working throughout the Region to accomplishneeded urban form strategies after 2010. There will be two RTP updates prior to 2010 that willallow us to check our progress. We will be able to assess the regional feasibility of fullimplementation during this period.
A first step for the Region is to identify barriers to implementing the vision and develop policystrategies and decisions that guide change at the local, regional, State and federal levels. Asustained effort involving numerous actions is required to foster the level of cooperationneeded by all levels of decision-makers. In particular, engaging those city and countygovernments, subregions, county transportation commissions (CTCs) and other agenciesdirectly responsible for individual land-use and transportation decision-making that haveregional implications is imperative.

Chapter 6
2004 Regional Transportation Plan 187
The following actions, identified by responsible party, are intended to bring about therealization of the Growth Vision Alternative by the Plan’s horizon year of 2030.
Key Growth Vision Alternative Actions - SCAG
1 Continue working through the Growth Visioning program torefine the Vision and identify additional strategies, policies andimplementation tools to realize the Growth Vision Alternative
2007
2 Host a series of “Policy Forums” with regional stakeholders toexplore the directions, policies and partnerships necessary forrealizing the Growth Vision Alternative
2004
3 Utilize the State of the Region report to measure progresstoward quantifiable goals derived from the Growth VisionAlternatives. SCAG will annually monitor progress on growthvision strategies in the plans for inclusion in appropriatereporting on the Plan as a whole.
Ongoing
4 Provide technical assistance and other resources, asappropriate, to leaders/agencies involved in land-use decision-making
Ongoing
5 Support legislation that provides incentives to public andprivate agencies that incorporate the Growth Vision Alternativestrategies into development projects
Ongoing
6 Support federal and State funding initiatives designed topromote mixed-use and multi-modal development
Ongoing
7 Continue exploring strategies to ensure implementation ofregionally significant transportation projects
Ongoing
The following actions seek to establish or enhance coordination and communication withSCAG’s fourteen subregional bodies and six county transportation commissions (CTCs).

Chapter 6
188 DESTINATION 2030
Key Growth Vision Alternative Actions –Transportation Planning Agency Coordination
1 Evaluate projects within the RTP in consideration of the tenetsof the Growth Vision
2005
2 Establish objective transportation performance measures oflocal city and county plans to recognize and measure regionalimpacts
2005
3 Consider an incentive mechanism to showcase and rewardexemplary achievements
2007
4 Encourage coordination and cooperation between SCAG andother regional, subregional, county, State, local and otherlevels of planning
Ongoing
5 Support and pursue legislation and funding that is supportiveof the goals and strategies associated with the Growth VisionAlternative
Ongoing
There are myriad actions that only local governments can take that will ensure the continuedshared benefits of the Growth Vision Alternative. SCAG must seek out partnerships withcities, counties, subregions, and others that have land-use authority to develop locally basedstrategies aimed at achieving regional goals. Through the development and revision ofgeneral plans and related regulations, changes in land-use development can occur thatsupport the goals and strategies of the Plan.
Key Growth Vision Alternative Actions –Local Government
1 Detail specific local actions that support the Plan anddocument impacts and benefits
Ongoing
2 Increase and facilitate the ease of use of various planningtools, such as specific plans, that will aid public and privateagencies in projects that support the goals and strategies ofthe Growth Vision Alternative plan
Ongoing
3 Incorporate in the development of General Plans and inexercising zoning authority redevelopment of underutilizedlow-intensity corridors as higher-density, mixed use arterials
Ongoing
4 Identify and revise regulations, such as variable parkingrequirements for areas well served by transit, that facilitatemixed-use multi-modal corridors
Ongoing
5 Develop policies which foster the development of housing nearemployment centers and appropriate employment activitiesnear housing
Ongoing

Chapter 6
2004 Regional Transportation Plan 189
Key Growth Vision Alternative Actions –Local Government
6 Develop policies that encourage a variety of housing types toaccommodate the Region’s changing demographic andlifestyle needs
Ongoing
7 Encourage design standards that focus on the efficientmovement of pedestrian traffic and other, non-automobile,modes of transit
Ongoing
8 Encourage the preservation of open space within urbanizedareas and on the development fringe of the Region
Ongoing
SCAG cannot implement the Growth Vision alone. Its realization is dependent on the effortsand collaboration of literally thousands of leaders. To this end, SCAG, our membergovernments and other responsible agencies will all need to contribute and work together.The actions identified above provide the necessary foundation to ensure the implementation ofthe 2004 RTP, and achieve its transportation system performance and air quality goals.
Implementing the RTP
n Regional Transportation Improvement Program
Every even-numbered year, SCAG prepares the Regional Transportation ImprovementProgram (RTIP). This document is the short-term implementation tool for the transportationgoals described in the adopted RTP.
The RTIP provides a listing of projects proposed for implementation in the Region during thesix-year period covered by the document. The RTIP projects are described in detail, withfunding amounts allocated by source and fiscal year. RTIP projects are categorized accordingto the transportation system to which they apply: State Highways, Local Highways, or Transit.
One of the first steps in RTP implementation is that during each RTIP development cycle,SCAG provides the County Transportation Commissions (CTCs) and Imperial ValleyAssociation of Governments (IVAG) with RTIP Guidelines. The RTIP Guidelines is the toolused by the counties in the development of their county transportation improvement programs(TIPs).
The RTP non-motorized, rideshare, ITS, and TDM investments were developed inconsultation with the county transportation commissions and the Imperial Valley Association ofGovernments. These TDM investments are annualized in the RTIP Guidelines in order toprovide the county commissions and the Imperial Valley Association of Governments withaverage yearly investments. The investments are reflected in the RTIP Guidelines bycategory, in order to facilitate monitoring and ensure RTP implementation.

Chapter 6
190 DESTINATION 2030
The RTIP Guidelines also contains the RTP constrained project listing. The counties need toprogram these projects for initiation within an appropriate timeframe to ensure that theybecome operational during the time frame indicated in the RTP.
The RTP and RTIP must be financially constrained. The RTIP guidelines provide the RTPfunding forecasts for the programming years associated with the RTIP cycle underdevelopment. The CTC’s and IVAG should program within the RTP forecasts. If a countyprograms more in project costs than can be accommodated by the RTP financial forecasts,then appropriate justification must accompany the county TIP documentation and be acceptedby SCAG prior to TIP approval.
n Regionally Significant Transportation Investment Studies
Within the context of regional transportation planning, the first step toward strategy or programdevelopment is the Regionally Significant Transportation Investment Study (RSTIS) or acorridor feasibility study of alternatives including a National Environmental Policy Act (NEPA)“purpose and need” statement and preliminary environmental documentation.
SCAG, in cooperation with other stakeholders, will approve the initiation and scope of anRSTIS. Before a project can be included in the RTIP for construction, the project must be oneof the alternatives in a completed RSTIS, and must have a completed project initiationdocument and cleared environmental documents. The RSTIS will be included in SCAG’sOverall Work Program.
Regionally significant alternatives must be evaluated by the RTP performance measures inorder to be considered for incorporation in the RTP. RSTIS analyses are currently beingperformed for corridors in the Region, including I-405, SR-57, and SR-91. The 2004 RTPincludes alternative modes and technology (intelligent transportation vehicle and highwaysystems), general alignment, number of lanes, the degree of demand management andoperating characteristics. Furthermore, an RSTIS is required to evaluate the effectivenessand cost-effectiveness of alternatives in attaining local, regional, State and national goals andobjectives. This analysis will consider the direct and indirect costs (of capital, operating andmaintenance and rights-of-way) of alternatives; benefits or impacts of mobility improvements;air quality requirements; social, economic and environmental impacts, including environmentaljustice; safety, operating efficiencies; financing (federal, State and private sources); energyconsumption; and public outreach. The results of the RSTIS will help lead to a decision bySCAG, in cooperation with participating public and private organizations, on the design andscope of the investment for the RTP. The preferred alternative of an RSTIS must meet theperformance and financial criteria established by the RTP, and it must be approved by theRegional Council before being included in the RTP and RTIP.
An RSTIS is eligible for funds authorized under Sections 8, 9 and 26 of the Federal TransitAct, State planning funds, as well as planning and capital funds appropriated under Title 23,United States Code.

Chapter 6
2004 Regional Transportation Plan 191
RSTISs or other analyses are appropriate when regionally significant investments in the RTPdo not have complete environmental analysis, design concept and scope (mode andalignment not fully determined). In cases requiring further analysis, the RTP may stipulateeither a set of assumptions concerning the proposed improvement or no-build conditionpending the completion of a corridor or sub-area analysis. The RTP should have enough detailto provide a plan conformity determination.
Monitoring Our Progress
As the designated MPO for the six-county Region, SCAG monitors transportation plans,projects and programs for consistency with regional plans. SCAG also monitors theperformance of the transportation system. This performance monitoring is especially importantto inform the planning process for future RTPs. We cannot solve our regional transportationproblems until we can identify and measure them.
SCAG is required to prepare the RTP using performance-based measures that will help publicofficials to better analyze transportation options and trade-offs. By examining performance ofthe existing system over time, the RTPA can monitor trends and identify regionaltransportation needs that may be considered in the RTP. Performance measurement helps toclarify the link between transportation decisions and eventual outcomes, thereby improvingdiscussion of planning options and communication with the public. This may also helpdetermine which improvements provide the best means for maximizing the system’sperformance within cost and other constraints.
SCAG has developed performance measures (see Chapters 2 and 5) for the regionaltransportation system. New tools are being developed that will help SCAG to monitor systemperformance over time. The Freeway Performance Measurement System (PeMS) is beingdeveloped and has the ability to measure freeway speeds, delay, and reliability for theregional freeway system. SCAG monitors a number of performance measures through abenchmarking process in the annual State of the Region report.
Transportation planning for the Region requires continually improved information on thecondition and utilization of the transportation system. Special reports are required periodicallyfrom SCAG to show the condition of the highway infrastructure and to monitor the Region’soverall traffic. The Highway Performance Monitoring System (HPMS) is a federally mandatedprogram designed by the Federal Highway Administration (FHWA) to assess the performanceof the nation's highway system. Under the Clean Air Act, SCAG is also required to reportperiodically on vehicle miles traveled in each air basin to determine whether traffic growth isconsistent with the projections on which the State Implementation Plans (SIPs) are based.
The HPMS is one of the components of an Internet-based transportation system currentlyunder development, the Regional Transportation Monitoring System (RTMS). RTMS is thesource for real-time and historical transportation data collected from different local andregional transportation agencies as well as from private data sources. Based on a GISmapping system, RTMS will be the main monitoring system for collection and distribution of

Chapter 6
192 DESTINATION 2030
highway and transit data, local and regional traffic information and activities, as well as hostingthe subregional transportation monitoring programs.
The following sections outline several of the significant tools used by SCAG to monitorregional progress in advancing the 2004 RTP.
n RTIP Database ManagementTo manage the RTIP process efficiently, SCAG has developed an RTIP database. The RTIPdatabase serves as a listing for projects in the RTIP, as well as a mechanism for monitoringproject implementation in the approved RTIP. The RTIP database provides a data repositoryfor tracking proposed transportation projects. Data regarding State, local and transit projectsinclude: project sponsors, project descriptions, tracking numbers, funding sources andprogrammed years, as well as environmental information and proposed project completiondates. The County Transportation Commissions, Imperial Valley Association of Governmentsand SCAG staffs input this data in the RTIP database. Once the SCAG Regional Councilapproves the RTIP, the data are transmitted to Caltrans for incorporation into the statewidedatabase, or California Transportation Improvement Program System (CTIPS).
n Conformity
In federally designated non-attainment or maintenance areas, specific monitoring proceduresand tests for consistency are required under the federal Transportation Conformity Rule. Atthe time of conformity determination, the RTIP must be consistent with the RTP. At any giventime, there is only one federally approved and conforming RTP or RTIP in place as theoperating document. During project implementation, sponsor agencies must implement onlythose projects that are consistent with the conforming RTIP and RTP. The project designconcept and scope must be consistent with those reflected in the conforming RTIP.
The project sponsors must inform SCAG (as the Region’s MPO) of any delay in implementingany Transportation Control Measure (TCM) project that is included in an approved SIP.SCAG must also be informed of any project that is regionally significant and modeled,regardless of funding sources. The Timely Implementation Report and a complete list of TCMsis provided in the Technical Appendix. In association with CTCs and the air districts, SCAGmust report on the timely implementation of TCMs. Additionally, SCAG monitors changesresulting from legal, legislative or election processes that may impact the transportationconformity requirements, the implementation of any TCM or regionally significant project.SCAG informs the sponsor agency of required actions. In the case of TCM projects, thesponsor agency must officially substitute or replace the affected TCM project.
In addition to the federally required Timely Implementation Reports and any other requiredreports, staff will report to its Regional Council on progress in implementing regionallysignificant projects, programs and strategies, as part of the RTIP update process.

Chapter 6
2004 Regional Transportation Plan 193
SCAG's Transportation Conformity Working Group and Modeling Task Force are two officialforums used for interagency consultation. There may be additional ad hoc forums, if needed,to facilitate the required course of action.
n Highway Performance Monitoring System (HPMS)
HPMS is used as a transportation monitoring and management tool to determine theallocation of federal aid funds, to assist in setting policies and to forecast future transportationneeds as it analyzes the transportation system's length, condition and performance.Additionally, HPMS is used to provide data to the Environmental Protection Agency (EPA) toassist in monitoring air quality conformity, and its data are used in support of the BiennialReport to Congress on the Status of the Nation's Highways. In California, the CaliforniaDepartment of Transportation (Caltrans) implements the program annually. SCAG'sresponsibility is to assist Caltrans in collecting data from local jurisdictions. SCAG'sresponsibility also includes distribution, collection and administration of all HPMS surveypackages in the six-county Region.
n VMT, Emission and Congestion Report
Beginning six years after the date of enactment of the Clean Air Act Amendments of 1990, anystate containing serious and worse ozone non-attainment areas, or moderate and/or seriouscarbon monoxide non-attainment areas, is required to demonstrate whether current aggregatevehicle miles traveled (VMT), aggregate vehicle emissions, congestion levels and otherrelevant parameters are consistent with those used for the area's demonstration of attainment.Within the SCAG Region, the South Coast Air Basin (SCAB), the South Central Coast AirBasin (SCCAB) and the three areas within the Southeast Desert are designated as ozonenon-attainment areas. Additionally, SCAB is designated as a non-attainment area for carbonmonoxide. As the Region’s MPO, SCAG is responsible for forecasting and tracking VMT,emissions and congestion, and submitting these reports to the California Air Resources Board(CARB). VMT reports for carbon monoxide non-attainment areas are submitted annually.VMT reports for ozone non-attainment areas are submitted every three years.
n Transit System Performance Assessment
Implementation of the RTP requires changes in the operating practices of transit agencies andintegration of the three tiers of transit into a single functioning system. The process ofintegration is the responsibility of the operators. SCAG will be evaluating the performance ofselected operators to provide feedback and to transfer applicable lessons to other operators inthe Region. Issues to be evaluated include the application of advanced transportationtechnologies applied to the scheduling and routing of transit.

Chapter 6
194 DESTINATION 2030
n Intergovernmental Review
Under federal law, SCAG is designated as the Regional Clearinghouse for review of allsubmitted plans, plan changes, projects and programs for consistency with adopted regionalplans and policies. Regionally significant transportation projects reviewed for consistency withregional plans are defined as: construction or expansion of freeways; State highways;principal arterials; routes that provide primary access to major activity centers, such asamusement parks, regional shopping centers, military bases, airports and ports; goodsmovement routes, including both truck routes and rail lines; intermodal transfer facilities, suchas transit centers, rail stations, airports and ports; and fixed transit routes, such as light andheavy rail and commuter rail. Any project involving transportation improvements is reviewedto determine whether such improvements are included in the RTIP.
n The State of the Region
The annual State of the Region report published by SCAG is intended to help members of thepublic and private sectors analyze the trends and challenges that confront the Region. Thereport tracks a series of indicators on major issues facing the Region including:
v vehicle hours of delay (to measure congestion)
v vehicle miles traveled (which are directly related to mobile source emissions and are alsoimportant in determining the demand for infrastructure improvements)
v daily person trips (both home-to-work and total trips, which are used in regional models tomeasure the amount of travel and forecast trends expected to continue)
v total passenger trips for the major transit operators
v airport activity for the major airports (including passenger traffic, aircraft operations and aircargo)

CChapterhapter 77Beyond the Plan

195DESTINATION 2030
2004 Regional Transportation Plan
CCHHAAPPTTEERR 77 BBEEYYOONNDD TTHHEE PPLLAANN
Corridor Preservation
The Community and Environmental Transportation Acceptability Process (CETAP) underwayin Riverside County has led to the identification of four corridors (two intracounty corridors andtwo intercounty corridors). CETAP long-range corridors previously described in theunconstrained portion of the 1998 Plan are in the constrained portion in the 2001 RTP and arecarried forward to the 2004 RTP. The ultimate goal of the CETAP process is the preservationof rights-of-way to be used for a future transportation project. Ideally, the CETAP effort inRiverside County will encourage other agencies to consider a similar effort since there stillremain large amounts of open space where future corridors will be needed to meettransportation demand.
As Riverside County has shown, it is important to identify and preserve transportationcorridors needed to expand or enhance transportation for future generations. Localgovernments will find it difficult to obtain optimal locations for these corridors unless efforts topreserve them are made early. The American Association of State Highway andTransportation Officials (AASHTO) Report on Corridor Preservation states that early effortsprovide the following benefits:
v prevent inconsistent developmentv minimize or avoid environmental, social and economic impactsv prevent the loss of desirable corridor locationsv allow for the orderly assessment of impactsv permit orderly project developmentv reduce costs
Ideally, the long-range corridors will encourage planners and policy-makers to start preparingstrategies for preserving corridors now. Planning can prevent losing rights-of-way needed fortransportation beyond the year 2030. Thus, rights-of-way preservation is a reasonableconcern, particularly in areas where development may block a long-range corridor. Moreopportunities to capitalize on preservation are available in less-urban areas, where localgovernments have an opportunity to obtain available land for new transportation facilities.
The first step in this kind of planning is to identify potential long-range corridors and determineif there is a need to preserve them. This will require intergovernmental coordination andshould include a funding component. Next, criteria to evaluate and prioritize the selectedcorridors must be developed. Once a corridor is selected, environmental studies will beneeded. Traditional preservation techniques include purchasing land or using governmentstatutes to place a corridor alignment on a general plan land-use map. Other State and federalfunds can be used to assist in acquiring land for long-range corridors.

Chapter 7
196 DESTINATION 2030
The SCAG Region is pursuing a new, environmentally sensitive approach to consideringdevelopment. This approach envisions that transportation options will be developed withenvironmentally sensitive land-uses and habitat issues as part of the planning and designcriteria. It would involve early and active involvement by all stakeholders. The informationsources for long-range corridors include:
v various long-range transportation studiesv recommendations from Caltransv transportation corridor projects expected to be operational after 2030v informal discussions with public agency staff
In addition, the Southwest Passage is included to address the needs for preserving corridorsto move goods and freight. Table 7.1 and Exhibit 7.1 identify Post-2030 Long-RangeCorridors.
Table 7.1

Chapter 7
2004 Regional Transportation Plan 197
INSERT EXHIBIT 7.1: POST 2030 LONG RANGE CORRIDOR MAP


Chapter 7
2004 Regional Transportation Plan 199
Unconstrained Projects – Our Unmet Needs
Beyond the 2004 RTP, it is estimated that there are approximately $100 billion in unmet needsin the Region for capital improvements, as well as unfunded operation and maintenanceneeds due to lack of funding. SCAG, in cooperation and coordination with the stakeholders,maintains a list of capital projects that are financially unconstrained, and are thus called,“Unconstrained Projects.” Conceivably, as the future funding picture changes, some of theseprojects could be advanced to the “constrained” status (based on performance) in future RTPupdates.


GGlossarylossary

201DESTINATION 2030
2004 Regional Transportation Plan
GGlloossssaarryy
AASHTOAmerican Association of State Highway and Transportation Officials – a nonprofit,nonpartisan association representing highway and transportationdepartments in the 50 states, the District of Columbia and Puerto Rico.
ACEAlameda Corridor East – a 35-mile corridor extending through the San GabrielValley between East Los Angeles and Pomona and connecting the AlamedaCorridor to the transcontinental railroad network.
ADA
Americans with Disabilities Act of 1990 – guarantees equal opportunity forindividuals with disabilities in public accommodations, employment, transportation,State and local government services, and telecommunications. It prescribesfederal transportation requirements for transportation providers.
Antelope Valley AQMD Antelope Valley Air Quality Management District – the air pollution control agencyfor the portion of Los Angeles County north of the San Gabriel Mountains.
AQMP Air Quality Management Plan – regional plan for air quality improvement incompliance with federal and State requirements.
ATISAdvanced Traveler Information Systems – technology used to provide travelerswith information, both pre-trip and in-vehicle, so they can better utilize thetransportation system.
ATMS Advanced Transportation Management Systems – technology used to improve theoperations of the transportation network.
AVO Average Vehicle Occupancy – calculated by dividing the total number of travelersby the total number of vehicles.
Base Year The year 2000, used in the RTP performance analysis as a reference point forcurrent conditions.
BaselineFuture scenario in which only projects in the 2002 RTIP that have federalenvironmental clearance by December 2002 are assumed to be completed. TheBaseline functions as the “No-Project” alternative used in the RTP Program EIR.
BLS Bureau of Labor Statistics – the principal fact-finding agency for the federalgovernment in the broad field of labor economics and statistics.
BNSF Burlington Northern and Santa Fe Railway Company.
Bus Rapid TransitBus transit service that seeks to reduce travel time through measures such astraffic signal priority, automatic vehicle location, dedicated bus lanes, limited-stopservice, and faster fare collection policies.
CAA
Clean Air Act (CAA) – 1970 federal act that authorized EPA to establish air qualitystandards to limit levels of pollutants in the air. EPA has promulgated suchstandards (or NAAQS) for six criteria pollutants: sulfur dioxide (SO2), nitrogendioxide (NO2), carbon monoxide (CO), ozone, lead, and particulate matter (PM10).All areas of the United States must maintain ambient levels of these pollutantsbelow the ceilings established by the NAAQS; any area that does not meet thesestandards is a "nonattainment" area. States must develop SIPs to explain howthey will comply with the CAA. The act was amended in 1977 and again in 1990.

Glossary
202 DESTINATION 2030
Caltrans
California Department of Transportation – State agency responsible for the design,construction, maintenance, and operation of the California State Highway System,as well as that portion of the Interstate Highway System within the State'sboundaries.
CARB
California Air Resources Board – State agency responsible for attaining andmaintaining healthy air quality through setting and enforcing emissions standards,conducting research, monitoring air quality, providing education and outreach, andoverseeing/assisting local air quality districts.
Catalytic demand
Additional aviation demand that is created by companies that locate in the proximityof expanding airports with developable land around them, to reduce airport groundaccess time and costs for their employees and clients. Catalytic demand is greatestfor large hub airports, particularly international airports.
CEQA California Environmental Quality Act – State law providing certain environmentalprotections that apply to all transportation projects funded with State funds.
CETAP
Community Environmental and Transportation Acceptability Process – part of theRiverside County Integrated Project that is examining where to locate possiblemajor new multi-modal transportation facilities to serve the current and futuretransportation needs of Western Riverside County, while minimizing impacts oncommunities and the environment.
CMAQCongestion Mitigation and Air Quality Program – federal program initiated byISTEA to provide funding for surface transportation and other related projects thatcontribute to air quality improvements and reduce congestion.
CMS
Congestion Management System (also the federal reference to CaliforniaCongestion Management Program) – a program to reduce congestion on regionalstreets and roads using travel demand reduction and operational managementstrategies.
COCarbon monoxide – a colorless, odorless, poisonous gas formed when carbon infuels is not burned completely. It is a byproduct of highway vehicle exhaust, whichcontributes about 60 percent of all CO emissions nationwide.
COG Council of Governments – under State law, a single or multi-county council createdby a joint powers agreement.
COMPASS / GrowthVisioning
A planning process guided by input from the public and initiated by SCAG todevelop a regional strategy for addressing future growth in Southern California.
Congestion pricing User fee imposed on vehicles during peak demand periods on congestedroadways.
Constant dollars Dollars expended/received in a specific year adjusted for inflation/deflation relativeto another time period.
CorridorIn planning, a broad geographical band that follows a general directional flow orconnects major sources of trips. It may contain a number of streets and highways,and transit lines and routes.
Glossary
2004 Regional Transportation Plan 203
CTCCalifornia Transportation Commission – a nine-member board appointed by thegovernor to oversee and administer State and federal transportation funds andprovide oversight on project delivery.
CTIPSCalifornia Transportation Improvement Program System – a project programmingdatabase system used to efficiently and effectively develop and manage varioustransportation programming documents as required under State and federal law.
Current dollars Actual dollars expended/received in a specific year without adjustments forinflation/deflation.
CVO Commercial Vehicle Operations – management of commercial vehicle activitiesthrough ITS.
Deficiency Plan
Set of provisions contained in a Congestion Management Plan to addresscongestion, when unacceptable levels of congestion occur. Projects implementedthrough the Deficiency Plan must, by statute, have both mobility and air qualitybenefits.
DTIM Direct Travel Impact Model – a vehicle emissions forecasting model.
EDF Environmental Defense Fund – a national nonprofit organization that seeks toprotect the environmental rights of all people, including future generations.
EIR
Environmental Impact Report – an informational document, required under CEQA,which will inform public agency decision-makers and the public generally of: thesignificant environmental effects of a project, possible ways to minimize significanteffects, and reasonable alternatives to the project.
EMFAC Emission Factor – model that estimates on-road motor vehicle emission rates forcurrent year as well as back-casted and forecasted inventories.
EPAEnvironmental Protection Agency – federal agency established to develop andenforce regulations that implement environmental laws enacted by Congress toprotect human health and safeguard the natural environment.
FAAFederal Aviation Administration – federal agency responsible for issuing andenforcing safety regulations and minimum standards, managing air space and airtraffic, and building and maintaining air navigation facilities.
FHWA
Federal Highway Administration – federal agency responsible for administering theFederal-Aid Highway Program, which provides federal financial assistance to theatates to construct and improve the National Highway System, urban and ruralroads, and bridges.
Financially constrained Expenditures are said to be financially constrained if they are within limits ofanticipated revenues.
FRA
Federal Railroad Administration – federal agency created to promulgate andenforce rail safety regulations, administer railroad assistance programs, conductresearch and development in support of improved railroad safety and national railtransportation policy, and consolidate government support of rail transportationactivities.

Glossary
204 DESTINATION 2030
FTA
Federal Transit Administration – the federal agency responsible for administeringfederal transit funds and assisting in the planning and establishment of areawideurban mass transportation systems. As opposed to FHWA funding, most FTAfunds are allocated directly to local agencies, rather than Caltrans.
FTIP
Federal Transportation Improvement Program – a three-year list of alltransportation projects proposed for federal transportation funding within theplanning area of an MPO. (Note: The FTIP is locally referred to as the 2002RTIP.)
FY Fiscal Year – period of time beginning July 1 and ending the following June 30.
GARVEE
Grant Anticipation Revenue Vehicles – a debt financing instrument authorized toreceive federal reimbursement of debt service and related financing costs underSection 122 of Title 23, United States Code. GARVEEs can be issued by a state, apolitical subdivision of a state, or a public authority.
GIS
Geographic Information System – powerful mapping software that links informationabout where things are with information about what things are like. GIS allowsusers to examine relationships between features distributed unevenly over space,seeking patterns that may not be apparent without using advanced techniques ofquery, selection, analysis, and display.
GNPGross National Product – an estimate of the total value of goods and servicesproduced in any specified country in a given year. GNP can be measured as atotal amount or an amount per capita.
Grade crossing A crossing or intersection of highways, railroad tracks, other guideways, orpedestrian walks, or combinations of these at the same level or grade.
HDT Heavy Duty Truck – truck with a gross vehicle weight of 8,500 pounds or more.
Home-based work tripsTrips that go between home and work, either directly or with an intermediate stop.Home-based work trips include telecommuting, working at home and non-motorized transportation work trips.
HOT Lane High Occupancy Toll Lane – an HOV lane that single-occupant drivers can pay todrive in.
HOV LaneHigh Occupancy Vehicle Lane – a lane restricted to vehicles with two (and in somecases three) or more occupants to encourage carpooling. Vehicles includeautomobiles, vans, buses and taxis.
HPMS Highway Performance Monitoring System – a federally mandated programdesigned by FHWA to assess the performance of the nation’s highway system.
HUDU.S. Department of Housing and Urban Development – federal agency chargedwith increasing homeownership, supporting community development, andincreasing access to affordable housing free from discrimination.
ICAPCDImperial County Air Pollution Control District – local air agency mandated by Stateand federal regulations to implement and enforce air pollution rules andregulations.

Glossary
2004 Regional Transportation Plan 205
Infrastructure The basic facilities, equipment, services and installations needed for the growthand functioning of a community.
IOS Initial Operating Segment.
ISTEA
Intermodal Surface Transportation Efficiency Act – signed into federal law onDecember 18, 1991, it provided authorization for highways, highway safety andmass transportation for FYs 1991−1997 and served as the legislative vehicle fordefining federal surface transportation policy.
ITIP Interregional Transportation Improvement Program - the portion of the STIP thatincludes projects selected by Caltrans (25 percent of STIP funds).
ITS
Intelligent Transportation Systems – systems that use modern detection,communications and computing technology to collect data on system operationsand performance, communicate that information to system managers and users,and use that information to manage and adjust the transportation system torespond to changing operating conditions, congestion or accidents. ITS technologycan be applied to arterials, freeways, transit, trucks and private vehicles. ITSinclude Advanced Traveler Information Systems (ATIS), Advanced Public TransitSystems (APTS), Advanced Traffic Management Systems (ATMS), AdvancedVehicle Control Systems (AVCS) and Commercial Vehicle Operations (CVO).
IVAGImperial Valley Association of Governments – Council of Governments for ImperialCounty. IVAG is responsible for short-range transportation planning, including allprojects utilizing federal and State highway and transit funds.
JPA
Joint Powers Authority – two or more agencies that enter into a cooperativeagreement to jointly wield powers that are common to them. JPAs are a vehicle forthe cooperative use of existing governmental powers to finance and provideinfrastructure and/or services in a cost-efficient manner.
LACMTA
Los Angeles County Metropolitan Transportation Authority, more commonlyreferred to as the MTA – agency responsible for planning and funding countywidetransportation improvements, administering the county’s transportation sales taxrevenues, and operating bus and rail transit service.
LAUPT Los Angeles Union Passenger Terminal, also known as Union Station.
LAWALos Angeles World Airports – aviation authority of the City of Los Angeles. LAWAowns and operates Los Angeles International (LAX), Ontario International, VanNuys, and Palmdale airports.
LCVs Longer-Combination Vehicles − includes tractor-trailer combinations with two ormore trailers that weigh more than 80,000 pounds.
LEM
Location Efficient Mortgage – allows people to qualify for larger loan amounts ifthey choose a home in a densely populated community that is well-served by publictransit, and where destinations are located close together so that they can alsowalk and bike instead of driving everywhere.

Glossary
206 DESTINATION 2030
Livable CommunitiesCommunities that are pedestrian- and transit-friendly environments, achievedthrough local government building and design standards and private builders’implementation.
LTF Local Transportation Fund – fund which receives TDA revenues.
MAGLEV Magnetic Levitation high-speed transportation system.
MAP Million Annual Passengers – used to quantify airport activity.
Market incentives
Measures designed to encourage certain actions or behaviors. These includeinducements for the use of carpools, buses and other HOVs in place of single-occupant automobile travel. Examples include HOV lanes, preferential parking,and financial incentives.
MDAB Mojave Desert Air Basin – area defined by State law as comprising the desertportions of Los Angeles, Kern, Riverside, and San Bernardino Counties.
MDAQMD
Mojave Desert Air Quality Management District – local air agency mandated byState and federal regulations to implement and enforce air pollution rules andregulations; encompasses the desert portion of San Bernardino County from thesummit of the Cajon Pass north to the Inyo County Line, as well as the Palo VerdeValley portion of Riverside County.
Measure A Revenues generated from Riverside County’s local half-cent sales tax.
Measure I Revenues generated from San Bernardino County’s local half-cent sales tax.
Metrolink Regional commuter rail system connecting Los Angeles, Orange, Riverside, SanBernardino, and Ventura Counties and operated by SCRRA.
MIS
Major Investment Study – the preliminary study, including preliminaryenvironmental documentation, for choosing alternative transportation projects forfederal transportation funding. An MIS is a requirement, which is conductedcooperatively by the study sponsor and the MPO.
Mixed flow Traffic movement having autos, trucks, buses and motorcycles sharing traffic lanes.
Mode A particular form of travel (e.g., walking, traveling by automobile, traveling by bus ortraveling by train).
Mode split The proportion of total person trips using various specified modes of transportation.
Model A mathematical description of a real-life situation that uses data on past andpresent conditions to make a projection.
MPO Metropolitan Planning Organization – A federally required planning bodyresponsible for transportation planning and project selection in a region.

Glossary
2004 Regional Transportation Plan 207
MTS Metropolitan Transportation System – regional network of roadways and transitcorridors.
Multi-modal A mixture of the several modes of transportation, such as transit, highways, non-motorized, etc.
NAAQSNational Ambient Air Quality Standards – targets established by the U.S.Environmental Protection Agency (EPA) for the maximum contribution of a specificpollutant in the air.
NAFTANorth American Free Trade Agreement – agreement between the governments ofCanada, Mexico, and the United States to eliminate barriers to trade and facilitatethe cross-border movement of goods and services.
NEPA National Environmental Protection Act – federal environmental law that applies toall projects funded with federal funds or requiring review by a federal agency.
NOxNitrogen oxides – a group of highly reactive gases, all of which contain nitrogenand oxygen in varying amounts. NOx is a major component of ozone and smog,and is one of six principal air pollutants tracked by the EPA.
OCTAOrange County Transportation Authority – agency responsible for planning andfunding countywide transportation improvements, administering the county’stransportation sales tax revenues, and operating bus transit service.
OnTrac
Orange-North America Trade Rail Access Corridor – formed in April of 2000 tobuild and support the Orangethorpe Avenue Grade Separation and Trade Corridorproject, a 5-mile-long railroad-lowering project that will completely grade separate11 rail crossings in the cities of Placentia and Anaheim.
OWPOverall Work Program – SCAG develops an OWP annually, describing proposedtransportation planning activities for the upcoming fiscal year, including thoserequired by federal and State law.
PRCPeer Review Committee – an “informal” committee of technical experts usuallyorganized and invited to review and comment on various technical issues andprocesses used in the planning process.
PeMS
Freeway Performance Measurement System – a service provided by the Universityof California, Berkeley, to collect historical and real-time freeway data fromfreeways in the State of California in order to compute freeway performancemeasures.
Person trip A trip made by a person by any mode or combination of modes for any purpose.
PILUTPlanning for Integrated Land-Use and Transportation – planning process initiatedby SCAG to integrate the tasks related to RTP and PEIR development andCOMPASS/Growth Visioning.
PM10
Particulate Matter – a mixture of solid particles and liquid droplets found in the air,10 micrometers or less in size (a micrometer is one-millionth of a meter). Thesecoarse particles are generally emitted from sources such as vehicles traveling onunpaved roads, materials handling, and crushing and grinding operations, as wellas windblown dust.

Glossary
208 DESTINATION 2030
PM2.5
Particulate Matter – a mixture of solid particles and liquid droplets found in the air,2.5 micrometers or less in size (a micrometer is one-millionth of a meter). Thesefine particles result from fuel combustion from motor vehicles, power generation,and industrial facilities, as well as from residential fireplaces and wood stoves.
Proposition 42As of March 2002, placed in the State Constitution those provisions of current lawrequiring the use of State gasoline sales tax revenues for State and localtransportation purposes.
Proposition A Revenues generated from Los Angeles County’s local half-cent sales tax. LosAngeles County has two permanent local sales taxes (Propositions C and A).
Proposition C Revenues generated from Los Angeles County’s local half-cent sales tax. LosAngeles County has two permanent local sales taxes (Propositions C and A).
PSR
Project Study Report – defines and justifies the project’s scope, cost, and schedule.PSRs are prepared for State highway projects and PSR equivalents are preparedfor projects not on the State highway system. Under State law, a PSR or PSRequivalent is required for STIP programming.
PTAPublic Transportation Account – the major State transportation account for masstransportation purposes. Revenues include a portion of the sales tax on gasolineand diesel fuels.
PUCPublic Utilities Commission – regulates privately owned telecommunications,electric, natural gas, water, railroad, rail transit, and passenger transportationcompanies.
Railroad siding A short stretch of railroad track used to store rolling stock or enable trains on thesame line to pass; also called sidetrack.
RCTCRiverside County Transportation Commission – agency responsible for planningand funding countywide transportation improvements and administering thecounty’s transportation sales tax revenues.
Robust flight portfolio Providing a range of flight offerings in different haul length categories includingshort-haul, medium-haul, long-haul and international flights.
RTIPRegional Transportation Improvement Program – refers to the share of capitaloutlay improvement funds controlled by regional agencies (75 percent of STIPfunds). (Note: The FTIP is locally referred to as the 2002 RTIP.)
RTP
Regional Transportation Plan (RTP) – federally required 20-year plan prepared bymetropolitan planning organizations and updated every three years. Includesprojections of population growth and travel demand, along with a specific list ofproposed projects to be funded.
RHNA
Regional Housing Needs Assessment – quantifies the need for housing within eachjurisdiction of the SCAG Region based on population growth projections.Communities then address this need through the process of completing thehousing elements of their general plans.
ROGReactive organic gas – organic compounds assumed to be reactive aturban/regional scales. Those organic compounds that are regulated because theylead to ozone formation.

Glossary
2004 Regional Transportation Plan 209
RSTIS
Regionally Significant Transportation Investment Study -- involves identifying allreasonable transportation options, their costs, and their environmental impacts.RSTIS projects are generally highway or transit improvements that have asignificant impact on the capacity, traffic flow, level of service or mode share at thetransportation corridor or sub-area level.
RSTP
Regional Surface Transportation Program – established by the California StateStatute utilizing federal Surface Transportation Program funds. Approximately 76percent of the State’s RSTP funds must be obligated on projects located within the11 urbanized areas of California with populations of 200,000 or more.
RTMSRegional Transportation Monitoring System – internet-based transportationmonitoring system. The RTMS will be the source for real-time and historicaltransportation data collected from local, regional and private data sources.
SAFETEASafe, Accountable, Flexible, and Efficient Transportation Equity Act of 2003 – Bushadministration’s proposal for the six-year federal transportation reauthorizationprogram (2004−2009).
SANBAG
San Bernardino Associated Governments −SANBAG is the council of governmentsand transportation planning agency for San Bernardino County. SANBAG isresponsible for cooperative regional planning and developing an efficient multi-modal transportation system countywide.
SANDAG San Diego Association of Governments
SB45Senate Bill 45 (Chapter 622, Statutes of 1997, Kopp) – established the currentSTIP process and shifted control of decision-making from the State to the regionallevel.
SCABSouth Coast Air Basin – comprises the non-Antelope Valley portion of Los AngelesCounty, Orange County, Riverside County, and the non-desert portion of SanBernardino County.
SCAGSouthern California Association of Governments – the metropolitan planningorganization (MPO) for six counties including Los Angeles, Orange, SanBernardino, Riverside, Ventura, and Imperial.
SCAQMDSouth Coast Air Quality Management District – the air pollution control agency forOrange County and major portions of Los Angeles, San Bernardino and RiversideCounties in Southern California.
SCCAB South Central Coast Air Basin – comprises San Luis Obispo, Santa Barbara, andVentura Counties.
SCRIFA Southern California Railroad Infrastructure Financing Authority.

Glossary
210 DESTINATION 2030
SCRRA
Southern California Regional Rail Authority – formed in August 1991, the SCRRAplans, designs, constructs and administers the operation of regional passenger raillines (Metrolink) serving the counties of Los Angeles, Orange, Riverside, SanBernardino and Ventura.
SED Socioeconomic Data – population, employment and housing forecast.
SHAState Highway Account – the major State transportation account for highwaypurposes. Revenues include the State excise taxes on gasoline and diesel fueland truck weight fees.
SHOPPState Highway Operation and Protection Program – a four-year capitalimprovement program for rehabilitation, safety, and operational improvements onstate highways.
SIPState Implementation Plan - State air quality plan to ensure compliance with Stateand federal air quality standards. In order to be eligible for federal funding, projectsmust demonstrate conformity with the SIP.
SOXSulfur Oxide – any of several compounds of sulfur and oxygen, formed fromburning fuels such as coal and oil.
SSAB Salton Sea Air Basin – comprises the Coachella Valley portion of Riverside Countyand all of Imperial County.
STAState Transit Assistance – State funding program for mass transit operations andcapital projects. Current law requires that STA receive 50 percent of PTArevenues.
STIP
State Transportation Improvement Program – a four-year capital outlay plan thatincludes the cost and schedule estimates for all transportation projects funded withany amount of State funds. The STIP is approved and adopted by the CTC and isthe combined result of the ITIP and the RTIP.
STP
Surface Transportation Program – provides flexible funding that may be used bystates and localities for projects on any federal-aid highway, bridge projects on anypublic road, transit capital projects, and intracity and intercity bus terminals andfacilities. A portion of funds reserved for rural areas may be spent on rural minorcollectors.
TANNTraveler Advisory News Network – provides real-time traffic and transportationinformation content to communications service providers and consumer mediachannels both nationally and internationally.
TAZ Traffic Analysis Zone – zone system used in travel demand forecasting.
TCM
Transportation Control Measure – a project or program that is designed to reduceemissions or concentrations of air pollutants from transportation sources. TCMsare referenced in the State Implementation Plan (SIP) for the applicable air basinand have priority for programming and implementation ahead of non-TCMs.

Glossary
2004 Regional Transportation Plan 211
TCRP
Traffic Congestion Relief Program – enacted by State legislation in 2000 to provideadditional funding for transportation over a six-year period (later extended to eightyears). The program is funded by a combination of General Fund revenues (one-time) and ongoing revenues from the State sales tax on gasoline. In March 2002voters passed Proposition 42, which permanently dedicated gasoline sales taxrevenues to transportation purposes.
TDA
Transportation Development Act – State law enacted in 1971 that provided a 0.25percent sales tax on all retail sales in each county for transit, bicycle, andpedestrian purposes. In non-urban areas, funds may be used for streets and roadsunder certain conditions.
TDMTransportation Demand Management – strategies that result in more efficient useof transportation resources, such as ridesharing, telecommuting, park and rideprograms, pedestrian improvements, and alternative work schedules.
TEA-21
Transportation Equity Act for the 21st Century – signed into federal law on June 9,1998, TEA-21 authorizes the federal surface transportation programs for highways,highway safety, and transit for the six-year period 1998−2003. TEA-21 builds uponthe initiatives established in ISTEA.
TEU Twenty-feet Equivalent Unit.
Tier 2The set of 2002 RTIP projects that is not included in the Baseline scenario. Tier 2projects are recognized as committed projects and the RTP gives them first-fundingpriority after the Baseline.
TIFIA
Transportation Infrastructure Finance and Innovation Act of 1998 – established anew federal credit program under which the USDOT may provide three forms ofcredit assistancesecured (direct) loans, loan guarantees, and standby lines ofcreditfor surface transportation projects of national or regional significance. Theprogram’s fundamental goal is to leverage federal funds by attracting substantialprivate and other non-federal co-investment in critical improvements to the nation’ssurface transportation system. Sponsors may include state departments oftransportation, transit operators, special authorities, local governments, and privateentities.
TODTransit-Oriented Development – a land-use planning tool that promotes pedestrian-friendly environments and supports transit use and ridership. TOD focuses onhigh-density housing and commercial land-uses around bus and rail stations.
TP & D Transportation Planning and Development Account – a State transit trust fund thatis the funding source for the STA program.
Transit-dependent Individual(s) dependent on public transit to meet private mobility needs (e.g.,unable to drive, not a car owner, not licensed to drive, etc.).
Trantrak RTIP database management system.
TUMFTransportation Uniform Mitigation Fee – ordinance enacted by the RiversideCounty Board of Supervisors and cities to impose a fee on new development tofund related transportation improvements.
UP Union Pacific Railroad.

Glossary
212 DESTINATION 2030
USDOT
U.S. Department of Transportation – federal agency responsible for thedevelopment of transportation policies and programs that contribute to providingfast, safe, efficient, and convenient transportation at the lowest cost consistent withthose and other national objectives, including the efficient use and conservation ofthe resources of the United States. USDOT is comprised of ten operatingadministrations, including FHWA, FTA, FAA, and FRA.
VCTC Ventura County Transportation Commission – agency responsible for planning andfunding countywide transportation improvements.
Vehicle Hours of DelayThe travel time spent on the highway due to congestion. Delay is estimated as thedifference between vehicle hours traveled at a specified free flow speed andvehicle hours traveled at a congested speed.
Vehicle trip The one-way movement of a vehicle between two points.
VMT
Vehicle Miles Traveled – on highways, a measurement of the total miles traveledby all vehicles in the area for a specified time period. It is calculated by the numberof vehicles times the miles traveled in a given area or on a given highway duringthe time period. In transit, the number of vehicle miles operated on a given route orline or network during a specified time period.
VOC
Volatile Organic Compounds – organic gases emitted from a variety of sources,including motor vehicles, chemical plants, refineries, factories, consumer andcommercial products, and other industrial sources. Ozone, the main component ofsmog, is formed from the reaction of VOCs and NOx in the presence of heat andsunlight.

213DESTINATION 2030
2004 Regional Transportation Plan
AACCKKNNOOWWLLEEDDGGEEMMEENNTTSS
SSSCCCAAAGGG MMMaaannnaaagggeeemmmeeennntttMark Pisano, Executive DirectorJim Gosnell, Deputy Executive DirectorBert Becker, Chief Financial OfficerKaren Tachiki, Chief CounselHasan Ikhrata, Director, Planning and PolicyJim Sims, Director, Information ServicesRich Macias, Manager, Transportation Planning & Programs
RRRTTTPPP CCCooorrreee TTTeeeaaammmNaresh Amatya, Lead Senior Planner & Project ManagerAlan Bowser, Senior PlannerAnnie Nam, Senior PlannerAlan Thompson, Senior PlannerPhilip Law, Associate PlannerBernice Villanueva, Associate Planner
SSSpppeeeccciiiaaalll TTThhhaaannnkkksss fffooorrr AAAssssssiiissstttaaannnccceee FFFrrrooommm:::
Zahi Faranesh, Manager, Special Projects ♦ Lynn Harris, Manager, CommunityDevelopment ♦ Sylvia Patsaouras, Manager, Environmental Planning
Mary Jane Abare ♦ Sarah Adams ♦ Catherine Alvarado ♦ Michael Armstrong ♦Rosemary Ayala ♦ Mark Butala ♦ Marjan Calit ♦ Patricia Camacho ♦ JosephCarreras ♦ Simon Choi ♦ Cheryl Collier ♦ Welma Fu ♦ Mark Griffin ♦ Ryan Hall♦Ted Harris ♦ Carolyn Hart ♦ Molly Hoffman ♦ Hsi-Hwa Hu ♦ Guoxiong Huang♦ Robert Huddy ♦ Dale Iwai ♦ James Jacob ♦ Charles Keynejad ♦ Hong Kim ♦Elyse Kusunoki ♦ Deng Bang Lee ♦ Jacob Lieb ♦ Huasha Liu ♦ Rongsheng Luo♦ Jihong McDermott ♦ Jennifer Merrick ♦ David Milner ♦ Javier Minjares ♦Sreedharan Nambisan ♦ Nancy Pfeffer ♦ Catherine Rachal ♦ Don Rhodes ♦Arnold San Miguel ♦ Brett Sears ♦ Julius Taino ♦ Ashwani Vasishth ♦ KurtWalker ♦ Ping Wang ♦ Teresa Wang ♦ Tom Wayson ♦ Frank Wen ♦ PhilbertWong ♦ Lui Kwong Yu ♦ Sina Zarifi ♦ Ying Zhou