Embed Size (px)
Citation preview
LITHUANIAN SPORTS UNIVERSITY
Simona Pajaujien÷
ADOLESCENTS’ BODY IMAGE AND ANALYSIS
OF EFFECTIVENESS OF BODY IMAGE
IMPROVEMENT PROGRAM
Summary of Doctoral Dissertation
Social Sciences, Educational Science (07S), Physical Training, Motor Learning, Sport (S273)
Kaunas 2012
2
Doctoral dissertation was prepared in 2008–2012 at Lithuanian Academy of Physical Education Educational experiment was conducted with the support of Research Council of Lithuania (No MIP-22/2010). Following the decision of the Research Council of Lithuania an academic achievements scholarship was granted for dissertation writing (in 2008–2011). Scientific supervisor Prof. Dr. Rasa JANKAUSKIENö Lithuanian Sports University (Social Sciences, Educational Science – 07S) Scientific consultants: Prof. Dr. Habil. Kęstutis KARDELIS Lithuanian Sports University (Social Sciences, Educational Science – 07S) Prof. Dr. Habil. Romualdas MALINAUSKAS Lithuanian Sports University (Social Sciences, Educational Science – 07S) The dissertation will be defended at the Council of Education of the Lithuanian Sport University. Chairman Prof. Dr. Audron÷ DUMČIENö Lithuanian Sports University (Social Sciences, Educational Science – 07S) Members: Prof. Dr. Habil. Vytautas GUDONIS Šiauliai University (Social Sciences, Education – 07S) Prof. Dr. Habil. Albertas SKURVYDAS Lithuanian Sports University (Biomedical Sciences, Biology – 01B) Prof. Dr. Habil. Marijona BARKAUSKAITö Lithuanian University of Educational Science (Social Sciences, Education – 07S) Prof. Dr. Liudmila RUPŠIENö Klaipeda University (Social Sciences, Education – 07S) Opponents: Prof. Dr. Audronius VILKAS Lithuanian University of Educational Science (Social Sciences, Education – 07S) Assoc. Prof. Dr. Saulius ŠUKYS Lithuanian Sports University (Social Sciences, Educational Science – 07S) The doctoral dissertation will be defended in the open session of the Council of Education Sciences of the Lithuanian Sports University. The defence will take place on December 14th of 2012 at 11 a.m. in auditorium named after Prof. V. Stakionien÷. Address: Sporto 6, LT-44221 Kaunas, Lithuania. The summary of the doctoral dissertation was sent out on the 14th of November, 2012. The doctoral dissertation is available at the library of the Lithuanian Sports University. Address: Sporto 6, LT-44221 Kaunas, Lithuania.
3
LIETUVOS SPORTO UNIVERSITETAS
Simona Pajaujien÷
PAAUGLI Ų POŽIŪRIS Į SAVO KŪNĄ
IR EDUKACIN öS PROGRAMOS POVEIKIS
JO KOREGAVIMUI
Daktaro disertacijos santrauka
Socialiniai mokslai, edukologija (07S) Fizinis lavinimas, judesių mokymas, sportas (S273)
Kaunas 2012
4
Disertacija rengta 2008–2012 metais Lietuvos kūno kultūros akademijoje Edukacinis eksperimentas buvo atliktas remiant Lietuvos mokslo tarybai (Nr. MIP-22/2010). Disertacijos rašymo metu (2008–2011 metais) Lietuvos mokslo tarybos sprendimu už akademinius pasiekimus buvo skiriama doktorantų stipendija. Mokslin÷ vadov÷ Prof. dr. Rasa JANKAUSKIENö Lietuvos sporto universitetas (Socialiniai mokslai, edukologija – 07 S) Konsultantai: Prof. habil. dr. Kęstutis KARDELIS Lietuvos sporto universitetas (Socialiniai mokslai, edukologija – 07 S) Prof. habil. dr. Romualdas MALINAUSKAS Lietuvos sporto universitetas (Socialiniai mokslai, edukologija – 07 S) Disertacija ginama Lietuvos sporto universitete Edukologijos mokslo krypties taryboje. Pirminink ÷ Prof. dr. Audron÷ DUMČIENö Lietuvos sporto universitetas (Socialiniai mokslai, edukologija – 07 S) Nariai: Prof. habil. dr. Vytautas GUDONIS Šiaulių universitetas (Socialiniai mokslai, edukologija – 07S) Prof. dr. habil. Albertas SKURVYDAS Lietuvos sporto universitetas (Biomedicinos mokslai, biologija – 01B) Prof. dr. habil. Marijona BARKAUSKAITö Lietuvos edukologijos universitetas (Socialiniai mokslai, edukologija – 07S) Prof. dr. Liudmila RUPŠIENö Klaip÷dos universitetas (Socialiniai mokslai, edukologija – 07S) Oponentai: Prof. dr. Audronius VILKAS Lietuvos edukologijos universitetas (Socialiniai mokslai, edukologija – 07S) Doc. dr. Saulius ŠUKYS Lietuvos sporto universitetas (Socialiniai mokslai, edukologija – 07S) Disertacija bus ginama viešame Edukologijos mokslo krypties tarybos pos÷dyje 2012 m. gruodžio 14 d. 11 val. Lietuvos sporto universiteto prof. V. Stakionien÷s auditorijoje. Adresas: Sporto g. 6, LT-44221 Kaunas, Lietuva.
5
TABLE OF CONTENTS
INTRODUCTION ............................................................................................. 6
1. MATERIALS AND METHODS ................................................................. 12
1.1. Participants and procedure ................................................................... 12
1.2. Methods of research............................................................................. 15
2. RESULTS .................................................................................................... 21
2.1. Adolescents’ body image and related factors in terms of gender,
body mass index, physical activity and body satisfaction .................... 21
2.2. Internalization of sociocultural ideals towards appearance
in teenagers and its relation with body dissatisfaction,
lifestyle factors and unhealthy weight control behaviour.................... 25
2.3. Unhealthy body weight control behaviour in groups by gender and
physical activity ................................................................................... 30
2.4. Analysis of factors leading to unhealthy weight control outcomes .... 33
2.5. Analysis of the effect of educational body image optimization
program ................................................................................................ 36
CONCLUSIONS.............................................................................................. 40
SUMMARY IN LITHUANIAN ...................................................................... 42
PUBLICATIONS ............................................................................................. 47
ABOUT THE AUTHOR ................................................................................. 51
6
INTRODUCTION
Our children grow and mature in the times, where image and media
attention to a beautiful body is overestimated, and the social pressure for
meeting image expectations influences and affects the development of
immature persons. The less physical characteristics of a person meet social
expectations, the more dissatisfied the person is with his/her body, the lower is
self-esteem, and the bigger is propensity for depression and manipulation with
food (Cash, Pruzinsky, 2004; Tiggemann, 2011).
The prevalence of overweight and obesity among children and teenagers
is one of the most pressing public health problems (Haug et al., 2009;
Rokholm, Baker, Sorensen, 2010; Dumith et al., 2010). In addition to obesity
and eating disorders among teenagers, another great public health concern is
huge dissatisfaction with their bodies, unhealthy weight loss behaviour and
disordered eating. Therefore, recently great attention has been paid to
psychological problems related with negative body image and the interrelations
between eating disorders and physical activity has been analysed. It was found
that dissatisfaction with body image has a negative effect on the physical and
psychological development and health of teenagers. Adolescent dissatisfaction
with appearance is related to low self-esteem that leads to eating disorders or
disordered eating. Such behaviour is harmful to health and causes obesity
(Haines, Neumark-Sztainer, 2006). Poor self-esteem is associated with a higher
likelihood of becoming a victim of bullying (Jankauskiene et al., 2008),
increased risk of suicide and deliberate self-harm (Rodrigues-Cano, Beato-
Fernandes, Llario, 2006; Laskyt÷, 2009).
A large part of modern consumerist society is constantly concerned about
weight loss/gain methods that promise rapid results (O’Dea, 2007; Bauman,
2011; Tereškinas, 2011). Seeking peer recognition and wanting to meet the
society’s expectations young people often exhaust themselves with diets and/or
excessive exercise (O’Dea, 2007; Ojala et al., 2007; Sabbah et al, 2009;
Jankauskien÷, Pajaujien÷, Mickūnien÷, 2010; Tereškinas, 2011). Adolescents
who are overweight or obese suffer from psychosocial stress caused by social
7
pressure to lose weight, have low self-esteem, are often dieting and are more
likely to get depression compared to their peers with normal weight (O’Dea,
2005; Babio et al., 2008; McCabe, Ricciardelli, James, 2010).
The analysis into the effect of obesity and eating disorders prevention
programs in the Western world has revealed that many of them are unsafe
because they lead to higher numbers of teenagers who go on a diet, do weight
control exercises hazardous to health, start smoking, are afraid to gain loss or
develop a fear of food (O’Dea, 2002; O’Dea, 2005). The effect of obesity and
eating disorders prevention programs on children and adolescent lifestyle and
self-esteem has not been studied extensively in Lithuania. A number of studies
of declarative nature have shown that Lithuanian teenagers are wrong in
assessing their weight, e.g. they believe they are larger than they really are and
go on a diet without any reason (Zaborskis et al., 2008), they exercise too little
or not at all (Petronyt÷, 2009; Jankauskien÷ et al., 2011). Obesity and eating
disorders prevention programs are not standardized and are based on parental
understanding of healthy nutrition, physical activity and body weight control.
Unfortunately, this understanding is not always correct.
Successful obesity and eating disorders prevention programs should first
of all aim to reduce the dissatisfaction with personal appearance. In addition to
teaching healthy lifestyle, they should be focused on teaching critical thinking
about the images promoted by the media, developing tolerance to oneself and
others, stress management and most of all on building self-esteem.
Unfortunately, such education in our country is limited to delivering
information about the optimal body weight and healthy nutrition. At best, the
health education process ends with increased knowledge about weight control.
Since no research data about the effectiveness of overweight prevention
programs and changing personal attitude to body image are available, we may
conclude that professional approach to education in this field is inadequate. For
this reason, young people opt to follow pseudo scientific weight control
recommendations on that abound in the media instead of seeking professional
advice. Health educators along with physical education and other teachers must
seek that obesity prevention programs would not induce negative body image,
8
biased judgement of personal body weight, not provoke eating disorders, not
uphold the understanding that dieting, intensive exercising and imbalanced
nutrition is a norm (O’Dea, 2005).
Until now research was mainly focused on disordered eating behaviour,
whereas there are few studies into exercising behaviour to control the body
weight. It is not clear how internalization of sociocultural ideals towards
appearance is related to weight control behaviour and it is unknown how
adolescents behave if they decide to lose weight by exercising. There is a lack
of studies revealing the relationship between adolescent body image and health
perception with the drive for thinness and muscularity in different physical
activities and sports. Besides, studies that evaluate the relations of body
dissatisfaction with physical activity are rather controversial: some studies
claim that physical activity brings more body image satisfaction (Hausenblas,
Fallon, 2006; Campbell, Hausenblas, 2009; Voks et al., 2009), whereas other
studies assert on the contrary (Zabinski et al., 2001; Leone, Sedory, Gray,
2005; McCabe, Ricciardelli, James, 2007).
The above statements prove the relevance of research into the relations
between adolescent body image, physical activity and weight control behaviour
as well as body dissatisfaction prevention. There are very few studies analysing
the said issues from the gender perspective. Therefore the following
problematic issues have been raised in the research:
• How internalization (pressure) of sociocultural ideals towards appearance
is related to self-esteem and body dissatisfaction in adolescents of both genders?
• How body dissatisfaction in adolescents is related with self-esteem,
unhealthy weight control behaviour and lifestyle characteristics?
• Can physical activity protect adolescents from the development of
body image dissatisfaction and its outcomes?
• What should be the contents of contemporary health education
programs aimed for adolescent obesity and eating disorders prevention? Can
health education programs based on building self-esteem and media literacy as
well as cognitive dissonance strategy reduce body dissatisfaction in male and
female adolescents?
9
The research is based on the following theories:
• Tripartite Influence Mode of Body Image and Eating Disturbance
(Thompson, Coovert and Stormer, 1999; Keery, Van den Berg, Thompson,
2004), where it is assumed that body dissatisfaction and the risk of eating
disorders are caused by social and cultural pressure (mass media, peers and
parents), negative psychological condition, comparison of personal image with
beauty standards and attempts to meet image expectations.
• Theory of Social Comparison (Festinger, 1954), assuming that
individuals evaluate their own abilities by comparing themselves to others.
• Theory of Cognitive Dissonance (Festinger, 1957) explaining how
existing cognitions dissonant factors are altered. This theory explains that
people seek cognitive consonance, i.e. they need consistency between
information, thoughts, values, attitudes, emotions and behaviour. If these
components are inconsistent, there is a state of dissonance leading to stress or
physiological excitation. The theory asserts that individuals have a
motivational drive to reduce the dissonance by changing the existing
conditions, i.e. modifying the system of beliefs or reducing the importance of
any element leading to dissonance.
• Social Learning Theory (Rotter, 1954; Bandura, 1977, 1986, 2000)
states that individuals learn from each other by observing, imitating and
modelling (observing others, their behaviour, encrypting information and later
using it in own activities). Observation, imitation and modelling may occur by
directly observing the behaviour of other people, receiving verbal instructions
or watching real and/or symbolic examples of other people seen in mass media.
Five theoretical assumptions were raised from problem questions:
H 1. Internalization of sociocultural ideals towards appearance is more
common among adolescent girls and teenagers with higher body mass index as
well as teenagers with lower self-esteem.
H 2. Teenagers who strive to internalize sociocultural ideals towards
appearance are more often dissatisfied with their body; they lead unhealthy
lifestyle, use unhealthy weight control methods more often and face negative
outcomes of such behaviour more often.
10
H 3. Physical activity is related to higher self-esteem, less body
dissatisfaction and healthier weight control behavior.
H 4. Internalization of sociocultural ideals towards appearance, lower
self-esteem and body dissatisfaction are the main factors leading to unhealthy
weight control.
H 5. A health education program has a positive effect on body image
among adolescents, improves self-esteem, reduces the risk of disordered eating
and improves the knowledge of exercise related weight control.
Research object is body image among adolescents and the effectiveness
of educational program.
Research aim is to determine the characteristics of body image among
adolescents and to investigate the effect of educational program on its
correction.
To solve the problematic issues and verify the hypotheses the primary
research objectives were to:
1. Determine the expression of body image and related factors in groups
by of gender, body mass index and physical activity.
2. Find the relationship between body image and sociocultural, self-
esteem, and unhealthy weight control behaviour factors.
3. Assess the factors that predict unhealthy weight control behaviour
among teenagers.
4. Develop an educational program and evaluate its effectiveness for the
improvement of body image and health literacy in body mass control.
Scientific novelty, theoretical and practical significance of the research
The analysis of body image among teenagers has drawn the attention to
the interaction of particular personal and sociocultural factors in the period of
adolescence. There are very few studies analyzing the said interrelationship
among teenagers of both genders as most of the studies analyze the samples of
female teenagers. Therefore, an innovative issue in this doctoral thesis is
involvement of both genders in the study.
Another innovative aspect of this research is the analysis of body image
11
and related factors in groups of teenagers of different physical activity levels
(not exercising at all, exercising for recreation and training for results). This
analysis will supplement the scientific knowledge about the relation of physical
activity and sports with body image. Little research has been done on physical
activity as a protective weight control factor even in the Western world.
Until now just a few dozens of studies on the effectiveness of controlled
representative health education programs conducted in schools to reduce body
image dissatisfaction among children and teenagers were done globally
(O’Dea, 2007). In our country it is an entirely new project. This study will help
to reveal the effect of the said program on both genders in the period of middle
adolescence (10-11 year old teenagers, mainly girls, were studied in the
majority of educational programs). This program was used to test how it affects
boys because very little studies with boys have been done in the world by now
(O’Dea, 2007).
The conducted study and its scope is the first dissertation of this type in
Lithuania. From theoretical point of view the research work is significant
because, in addition to a detailed data analysis that helped to disclose the
problem of body image and the key characteristics of unhealthy weight loss
behaviour, the study provided the possibility to distinguish the key factors
leading to the development of unhealthy behaviour (outcomes of the factors).
The research results are important for the development of teenager obesity,
eating disorders and unhealthy habits prevention strategies and also for the
preparation and implementation of physical activity promotion and health
education programs. Based on the research results the dissertation proposes
practical recommendations on national, community and personal levels.
Dissertation structure and scope. The thesis consists of introduction,
theoretical backgrounds (literature review), description of research
methodology, presentation and discussion of research results and conclusions
with recommendations. The evidence is presented in 56 tables and illustrated in
21 figures. The reference list consists of 441 sources. 17 annexes include
permits to conduct the survey, sample agreements, permits to use the scales
and tables of research results.
12
1. MATERIALS AND METHODS
1.1. Participants and procedure
Organization of the first survey. The permission to conduct the survey
was given by the Department of Education of Kaunas Municipality. 16
randomly selected schools (N=10) and gymnasiums (N=6) of Kaunas were
contacted, informed about the survey and asked for the permission to conduct
the research. All of them agreed to participate in the study. Two-three 11th
grade classes from each school were chosen randomly to participate in survey.
Participants were informed that participation was voluntary. There were no
refusals to participate in the survey and all the students present at school on
that day were interviewed. All students (N=856) who were asked to participate
in study agreed to fill in the questionnaires. The participants completed the
anonymous questionnaires in the classrooms during a class period. Out of 856
questionnaires 51 were damaged, therefore, the data of 805 adolescents (mean
age – 17.23 (0.6) years, 476 (58.9%) of them were females) were used for the
analysis. The survey sample with 5 per cent error represents the population of
11 grade students from Kaunas (Puk÷nas, 2009).
Organization of the second survey (educational experiment). The
second survey was conducted with the support of the research Council of
Lithuania (No MIP-22/2010) and performed in four stages. Stage I of the
educational experiment was aimed to prepare for the project. Agreements
were made by and between Lithuanian Academy of Physical Education
(LAPE) and Kaunas City Public Health Centres, a permit from Kaunas
Regional Biomedical Research Ethics Committee (No BE-2-62) and a permit
from Kaunas City Department for Education were obtained. Students for the
survey were selected. From the list of 53 educational institutions every third
gymnasium (N=4), secondary school (N=10) and lower secondary education
school (N=2) were selected. Two classes of 9th graders (Class 9b as
experimental group and Class 9c as control group) were interviewed and
13
collaboration agreements were entered into with educational institutions
selected for the survey. In this stage the educational program was designed (20
lessons), handouts for the training of public health specialists and the students
were prepared, the survey questionnaire was developed and the test survey was
conducted. In stage II of the educational experiment the selected school
public health specialists were trained at the academy by LAPE scholars
(16-hour training). At the same time the survey questionnaires were revised
and finalized, consents of students and their parents (guardians) were collected
and the first interviews were held. In stage III of the educational experiment
the educational program was delivered in 9b classes of the selected schools
(two 45-minute lessons per week). As many health education classes were
planned (20 lessons), heads of Kaunas City Education Department and schools
agreed to have these classes delivered by public health specialists during
physical education, biology, ethics or religion classes, or during breaks
between classes, or by substituting an ill teacher, and the like. In stage IV of
the educational experiment the second interview of teenagers who have
finished the health education program was conducted.
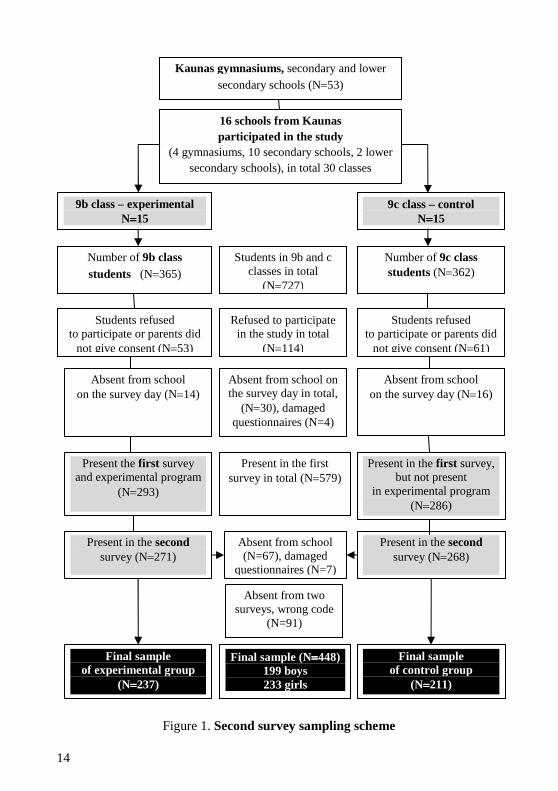
The sampling scheme is presented in Figure 1. There were 727 students
in total in classes selected for the survey. 114 students or their parents did not
give consent to participate in the study or the consents were not returned by the
deadline. 30 students were absent from school on the interviewing day, four
questionnaires were destroyed. Therefore, the sample of the first interviewing
consisted of 579 subjects (293 students from experimental classes and 286
students from control classes). This number sufficiently represents the
population of Kaunas schools 9th graders with 5 per cent error (Puk÷nas, 2009).
In repeated interviewing out of 613 eligible students 67 were absent from
school and 7 questionnaires were damaged. Therefore, 539 subjects were
interviewed (271 students from experimental classes and 268 students from
control classes).
14
Figure 1. Second survey sampling scheme
16 schools from Kaunas participated in the study
(4 gymnasiums, 10 secondary schools, 2 lower secondary schools), in total 30 classes
Kaunas gymnasiums, secondary and lower secondary schools (N=53)
9b class – experimental N====15
9c class – control N====15
Number of 9b class students (N=365)
Number of 9c class students (N=362)
Students refused to participate or parents did
not give consent (N=53)
Students refused to participate or parents did
not give consent (N=61)
Absent from school on the survey day (N=14)
Absent from school on the survey day (N=16)
Present the first survey and experimental program
(N=293)
Present in the first survey, but not present
in experimental program (N=286)
Present in the first survey in total (N=579)
Absent from school on the survey day in total,
(N=30), damaged questionnaires (N=4)
Refused to participate in the study in total
(N=114)
Students in 9b and c classes in total
(N=727)
Final sample of experimental group
(N====237)
Present in the second survey (N=268)
Absent from school (N=67), damaged
questionnaires (N=7)
Present in the second survey (N=271)
Final sample (N====448) 199 boys 233 girls
Final sample of control group
(N====211)
Absent from two surveys, wrong code
(N=91)
15
The final sample was made after the second interviewing, when student
data were entered by respective codes so that the data field would contain only
the subjects who were present in the first and the second interviewing and who
filled in the questionnaires correctly by writing their relevant code. 81 students
were absent from one of the two interviews and 10 questionnaires had a wrong
subject identification code, therefore these questionnaires were removed from
the data field. The final sample for the analysis of health education program
efficiency contained 448 subjects (191 boys and 237 girls). There were 237
students (52.9 %) in the experimental group and 211 (47.1 %) in the control
group (Figure 2). The groups were identical in terms of gender (χ²=2.17; df=1;
p=0.14). The subjects’ age ranged from 14 to 17 years with the average of 15
(0.42) years.
1.2. Methods of research
Methods of the first survey. The first survey was done by asking the
students to fill in specially designed for this survey questionnaires consisting of
different scales and demographic questions.
Sociocultural attitudes towards appearance scale (SATAQ-3,
Thompson et al., 2004) was initially developed to assess media influences on
feminine body image. Original SATAQ has 3 forms with four subscales:
Internalization-General, Pressures, Information, and Internalization-Athlete.
The internal consistency of the Internalization-General subscale (Cronbach
α=0.88) was good. This scale reflects the acceptance (internalization) of media
influence on body image. Internalization-Athlete subscale (Cronbach α=0.78)
reflects the athletic body image idealization. Pressures subscale (Cronbach
α=0.85) reflects media pressure to have a perfect appearance and seek the
behaviour which contributes to achieving this look. Information subscale
(Cronbach α=0.75) describes the importance of media in shaping the standards
of appearance. The scale is composed of the Likert-items with 5 response
options, where 1 means definite disagreement and 5 means definite agreement.
16
The higher the score, the greater is the acceptance or internalization of the
prevailing sociocultural standards for appearance is. The questionnaire was
translated into Lithuanian with the permit of Professor J. K. Thompson by
using a double translation method. SATAQ–3–L questionnaire was validated
in the sample of teenagers (Miežien÷, Jankauskien÷, articles in the press).
Body image was assessed by means of The Multidimensional Body-Self
Relations Questionnaire (MBSRQ-AS, Cash, 2004) Body Areas Satisfaction
subscale (BASS). This scale aims to assess the level of body satisfaction. The
scale consists of nine items listing body areas, muscular development, body
mass and overall appearance. Participants rated each item using a 5 response
options that ranged from 1 to 5. Lower scores indicated lower satisfaction with
body areas (Cronbach α=0.76). The questionnaire was obtained from the
instrument owner T. F. Cash via the database www.body-images.com. The
Lithuanian version of the questionnaire was validated in the study of Miškinyt÷
and Bagdonas (2010).
Body dissatisfaction was assessed by means of the question “Are you
satisfied with your body in general?” with response options ranging from
“entirely satisfied” (1 point) to “entirely dissatisfied” (5 points). Higher scores
show a higher level of body satisfaction. Subjects who selected the response
options “dissatisfied” (4 points) and “entirely dissatisfied” (5 points) were
classified as “body dissatisfied”.
Drive for muscularity was assessed by means of Drive for muscularity
scale (DMS) (McCreary, Sasse, 2000), consisting 15 statements. This scale
represents an individual’s perception that he/she is not muscular enough and
that bulk should be added to his/her body frame, in the form of muscle mass.
Likert items were evaluated in the range from “always” (5 points) to “never”
(0 points). Higher scores represent a bigger drive for muscularity. The scale
with all valued items can be used both for boys and girls (Cronbach α=0.92). A
Muscle Development Behaviours subscale, consisting of 8 statements
illustrating the drive for muscularity behaviour, was additionally used for boys
only in the first survey (Cronbach α=0.90).
Risk of eating disorders (RDE) was assessed by means of Eating
17
Attitude Test (EAT-26, Garner et al., 1982). The EAT is a 26-item scale,
measuring cognitions, emotions, and behaviours associated with anorexia and
bulimia nervosa. Participants rated each item using a 6-point scale that ranges
from 0 (never, rarely, sometimes) to 3 (always). Higher scores reflect stronger
disordered eating attitudes. Subjects who scored above a cut-off score of 20
may have been at risk of eating disorders (Cronbach α=0.90).
Unhealthy weight loss behaviour (UWLB) and unhealthy exercising
behaviour (UEB) was analysed using the instrument specially designed for this
study. For assessing UWLB the teenagers were asked “If you are aiming to
lose or maintain your body weight, which of the following practices have you
had?” There were 9 practices with unhealthy body mass control, such as “I skip
my meals (breakfast, dinner or supper)”, “I use laxatives or diet-pills” etc. UEB
scale comprised six practices reflecting the dominating fallacies related to
physical activity in aiming to control body mass. The individual responses
“strongly disagree” (1) through “strongly agree” (3) were provided in the
Likert-type scale. The higher scores reflect more common unhealthy exercising
behaviour. The scale internal consistency was positive in this sample,
respectively, Cronbach α=0.85 and Cronbach α =0.79.
Subjects, who selected the response option “agree” for at least one of the
listed unhealthy weight loss or exercising behaviours for weight control were
classified as “practice UWLB” and “practice UEB”.
Harmful habits were assessed by means of questions about smoking,
alcohol and drug abuse and abusing frequency from WHO coordinated
international Health Behaviour in School-aged Children (HBSC) study (Currie
et al., 2002; Zaborskis, Vareikiene, 2008). For instance, a question “Have you
consumed alcohol over the last three months?” was given with response
options from “never” to “every day”. Subjects, who admitted consuming at
least one of the following alcoholic drinks: beer, wine or vodka, and other
drinks several times per week or more often, were classified as “drink alcohol”.
Smoking habit was assessed by means of the question “How many cigarettes
per day do you smoke?” with 10 response options ranging from “I do not
smoke” to “3–4 packages a day”. Subjects who admitted smoking several times
18
a week or more often were classified as “Smoking”. Subjects who admitted
taking weed, cannabis, marijuana, breathing glue, solvents or using other drugs
were classified as “using drugs”.
Physical activity (PA) was assessed by means of questions from WHO
coordinated international HBSC study: “Over the past 7 days, on how many
days were you physically active for a total of at least 60 minutes per day?” and
“Over a typical or usual week, on how many days are you physically active for
a total of at least 60 minutes per day?” with response options ranging from “not
a single day” to “seven days a week”. According to the norms recommended
by WHO (WHO, 2010) teenagers should be physically active at least one hour
per day, however only 30 teenagers (3.7 per cent) in our survey met the
recommendations. Therefore, in our survey we regarded physical activity as
sufficient if subjects were physically active five or more days a week
(Petronyt÷, Zaborskis, 2009).
Exercising patterns were assessed by asking what sports or types of
physical activity the subjects do and how often. Vigorous exercising for
athletic results was assessed by means of the question “Do you train for athletic
results and what sport?” Physical activity for recreation and leisure was
assessed by the question “Do you exercise for recreation and leisure?” with
response options: “No” and “Yes. If yes, please specify the type of sport or
physical activity”.
Self-esteem was assessed by means of Rosenberg’s Self-esteem scale
(Rosenberg, 1989) containing 10 statements with 4 response options ranging
from “agree strongly” (4) to “disagree strongly” (1). Higher scores show higher
self-esteem (Cronbach α=0.75). The Lithuanian version of the questionnaire is
used for WHO coordinated international HBSC study (Currie et al., 2002).
Self-rated health was assessed by means of the question: “How do you
rate your health?” with response options from “poor” (1) to “excellent” (4).
Higher scores indicate better health self-rating. The question is taken from
WHO coordinated international HBSC study (Zaborskis, Vareikien÷, 2008).
Body mass index (BMI) (weight (kg)/height (m)²) was calculated using
values of weight and height indicated by the subject. The subjects were
19
grouped into three groups according to WHO (Flegal et al., 2005)
recommendations. The mean BMI of the sample is 20.77 (2.62) kg/m².
Methods of the second survey. In the second survey we used an
educational experiment and interviewing in writing. The students were asked to
fill in a specially designed for this survey questionnaire consisting of different
scales and demographic questions. In addition to the survey instruments
described below, disordered eating and self-esteem questionnaires, described in
the methods of the first survey, were also used.
Drive for thinness was assessed by means of Eating Disorder Inventory-3
(EDI-3; Garner, 2004) Drive for thinness subscale. It consists of 7 Likert items
with response options ranging from “always” (0 or 4 points) to “never” (0 or 4
points) (Cronbach α=0.88). Body image dissatisfaction was assessed by means
of the same inventory’s Body Dissatisfaction Scale, consisting of 10 Likert
items with response options described above (Cronbach α=0.87).
Muscle size satisfaction was assessed by means of Drive for Muscularity
Scale (DMS) (McCreary, Sasse, 2000) Muscularity-Oriented Body Image
Attitudes subscale, consisting of 7 Likert items with response options ranging
from “always” (6) to “never” (1). Higher scoring reflects higher satisfaction
with muscle size. Following the authors’ recommendations, this scale was used
for boys only (Cronbach α=0.75).
Exercising frequency was assessed by means of Leisure Time Exercise
Questionnaire (LTEQ) (Godin, Shephard, 1985). The respondents were asked
to specify low, moderate and vigorous intensity exercising by times per week,
if the subject exercised more than 15 minutes. These times were equalled to
metabolic equivalents (3, 5 and 9 respectively) and scores of all intensity levels
were summed up afterwards.
Knowledge about exercising behaviour for weight control was assessed
by means of a specially designed instrument consisting of five statements
representing the most common false beliefs about physical activity to control
body weight. Statement examples: “Very intensive exercising helps to lose
weight” or “Excessive sweating helps to lose weight”. These Likert-items had
to be evaluated by the level of agreement from 1 (entirely disagree) to 5
20
(entirely agree). Higher scores show poorer knowledge about exercising
behaviour for weight control (Cronbach α=0.89).
Body mass index (BMI) was calculated from the extracts from health
records. According to international recommendations by Cole, Bellizzi, Flegal
and Dietz (2000), boys with BMI ≥ 23.29 kg/m² and girls with BMI ≥
23.94 kg/m² were classified as overweight or obese.
Statistical analysis was done using the Statistical Package for Social
Sciences (SPSS, version 20.0). The structure of inventories subscales was
tested through the exploratory factor analysis. The internal consistency of the
scales and questionnaires was evaluated at Cronbach α level. The results were
expressed as a mean value (M). Chi-square tests examined categorical
frequencies. Value differences in two independent groups were found by
means of Mann-Whitney U test, and differences between values in more than
two groups were found through Kruskal-Wallis H test. Differences between
values in two related samples were found through Wilcoxon Signed Rank Test.
Correlation between variable was found by means of Spearman’s rank
correlation coefficient. Differences with categorical variables were analyzed by
means of χ2 (Chi-square test) criterion. The relation of dependent variables and
independent variables was analyzed through logistic regression by calculating
the confidence interval (OR). The results were considered significant if 1 was
outside the confidence interval. The differences were valued as statistically
significant, if p<0.05 (CI 95%).
21
2. RESULTS
2.1. Adolescents’ body image and related factors in terms of gender, body mass index, physical activity and body satisfaction
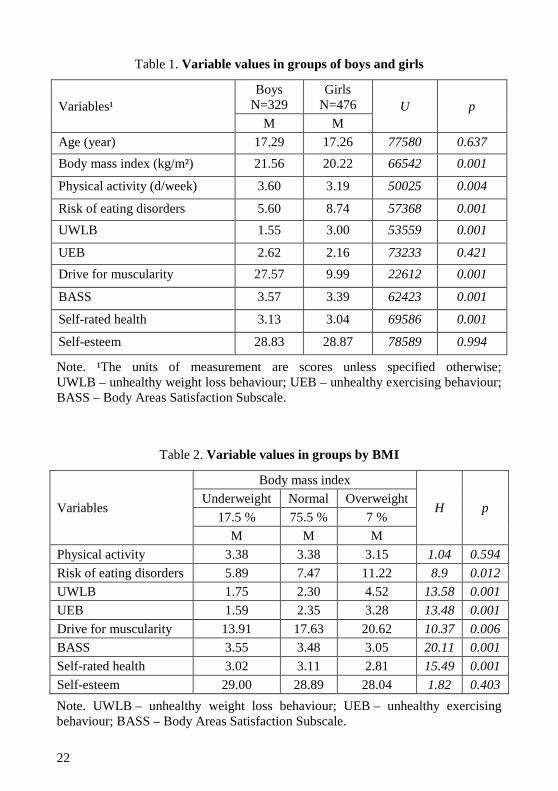
The survey results were first of all analyzed in terms of gender. Reliable
differences were found between almost all variables (Table 1). Mann-Whitney
U test revealed significant variable differences between girls and boys. BMI
was much higher in boys than in girls (p<0.001). As expected, the drive for
muscularity (p<0.001) was much more expressed in boys than in girls. Boys
were more satisfied with their body image (p<0.001) and rated their health
better (p<0.001). Risk of eating disorders was significantly higher among girls
(p<0.001). The survey revealed that incidents of unhealthy weight loss
behaviour were significantly higher among girls (p<0.001), whereas unhealthy
exercising behaviour was more common among boys (p<0.001). No significant
differences between girls and boys were observed in terms of physical activity
and self-esteem.
Later we analysed variables in different groups of BMI. According to
Kruskal-Wallis H test, overweight subjects, more than teenagers with normal
or too low BMI, had a stronger drive for muscularity (p<0.01), more expressed
unhealthy weight loss behaviour (p<0.001) and unhealthy exercising behaviour
(p<0.01) and significantly higher risk of disordered eating (p<0.05) (Table 2).
Underweight teenagers (p<0.001) assessed their body image best of all,
whereas health self-rating was the best among teenagers with normal BMI
(p<0.001). There was no difference between groups by BMI in terms of
physical activity and self-esteem (p>0.05).
22
Table 1. Variable values in groups of boys and girls
Variables¹ Boys
N=329 Girls
N=476 U p M M
Age (year) 17.29 17.26 77580 0.637
Body mass index (kg/m²) 21.56 20.22 66542 0.001
Physical activity (d/week) 3.60 3.19 50025 0.004
Risk of eating disorders 5.60 8.74 57368 0.001
UWLB 1.55 3.00 53559 0.001
UEB 2.62 2.16 73233 0.421
Drive for muscularity 27.57 9.99 22612 0.001
BASS 3.57 3.39 62423 0.001
Self-rated health 3.13 3.04 69586 0.001
Self-esteem 28.83 28.87 78589 0.994
Note. ¹The units of measurement are scores unless specified otherwise; UWLB – unhealthy weight loss behaviour; UEB – unhealthy exercising behaviour; BASS – Body Areas Satisfaction Subscale.
Table 2. Variable values in groups by BMI
Variables
Body mass index
H p Underweight Normal Overweight
17.5 % 75.5 % 7 %
M M M
Physical activity 3.38 3.38 3.15 1.04 0.594
Risk of eating disorders 5.89 7.47 11.22 8.9 0.012
UWLB 1.75 2.30 4.52 13.58 0.001
UEB 1.59 2.35 3.28 13.48 0.001
Drive for muscularity 13.91 17.63 20.62 10.37 0.006
BASS 3.55 3.48 3.05 20.11 0.001
Self-rated health 3.02 3.11 2.81 15.49 0.001
Self-esteem 29.00 28.89 28.04 1.82 0.403
Note. UWLB – unhealthy weight loss behaviour; UEB – unhealthy exercising behaviour; BASS – Body Areas Satisfaction Subscale.
23
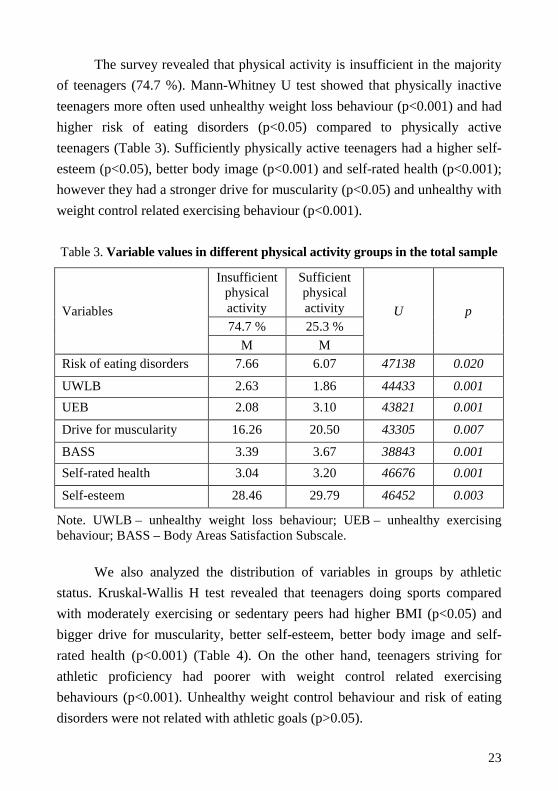
The survey revealed that physical activity is insufficient in the majority
of teenagers (74.7 %). Mann-Whitney U test showed that physically inactive
teenagers more often used unhealthy weight loss behaviour (p<0.001) and had
higher risk of eating disorders (p<0.05) compared to physically active
teenagers (Table 3). Sufficiently physically active teenagers had a higher self-
esteem (p<0.05), better body image (p<0.001) and self-rated health (p<0.001);
however they had a stronger drive for muscularity (p<0.05) and unhealthy with
weight control related exercising behaviour (p<0.001).
Table 3. Variable values in different physical activity groups in the total sample
Variables
Insufficient physical activity
Sufficient physical activity U p
74.7 % 25.3 %
M M
Risk of eating disorders 7.66 6.07 47138 0.020
UWLB 2.63 1.86 44433 0.001
UEB 2.08 3.10 43821 0.001
Drive for muscularity 16.26 20.50 43305 0.007
BASS 3.39 3.67 38843 0.001
Self-rated health 3.04 3.20 46676 0.001
Self-esteem 28.46 29.79 46452 0.003
Note. UWLB – unhealthy weight loss behaviour; UEB – unhealthy exercising behaviour; BASS – Body Areas Satisfaction Subscale.
We also analyzed the distribution of variables in groups by athletic
status. Kruskal-Wallis H test revealed that teenagers doing sports compared
with moderately exercising or sedentary peers had higher BMI (p<0.05) and
bigger drive for muscularity, better self-esteem, better body image and self-
rated health (p<0.001) (Table 4). On the other hand, teenagers striving for
athletic proficiency had poorer with weight control related exercising
behaviours (p<0.001). Unhealthy weight control behaviour and risk of eating
disorders were not related with athletic goals (p>0.05).
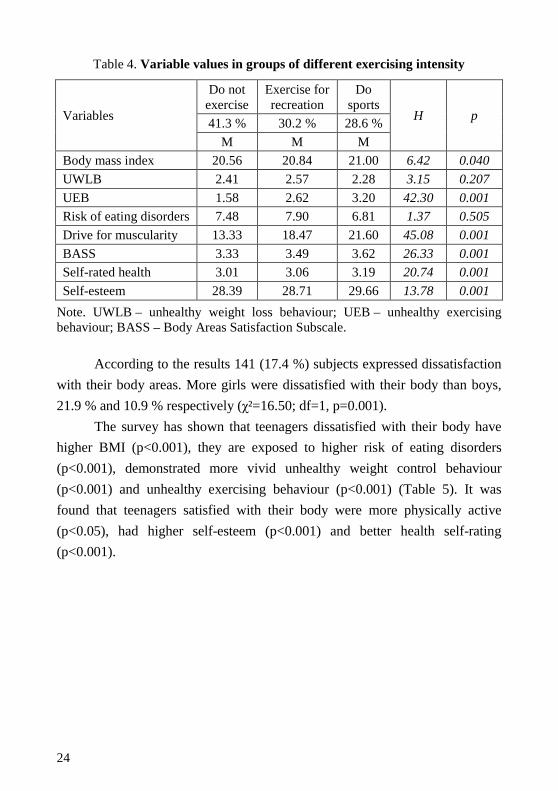
24
Table 4. Variable values in groups of different exercising intensity
Variables
Do not exercise
Exercise for recreation
Do sports
H p 41.3 % 30.2 % 28.6 %
M M M
Body mass index 20.56 20.84 21.00 6.42 0.040
UWLB 2.41 2.57 2.28 3.15 0.207
UEB 1.58 2.62 3.20 42.30 0.001
Risk of eating disorders 7.48 7.90 6.81 1.37 0.505
Drive for muscularity 13.33 18.47 21.60 45.08 0.001
BASS 3.33 3.49 3.62 26.33 0.001
Self-rated health 3.01 3.06 3.19 20.74 0.001
Self-esteem 28.39 28.71 29.66 13.78 0.001
Note. UWLB – unhealthy weight loss behaviour; UEB – unhealthy exercising behaviour; BASS – Body Areas Satisfaction Subscale.
According to the results 141 (17.4 %) subjects expressed dissatisfaction
with their body areas. More girls were dissatisfied with their body than boys,
21.9 % and 10.9 % respectively (χ²=16.50; df=1, p=0.001).
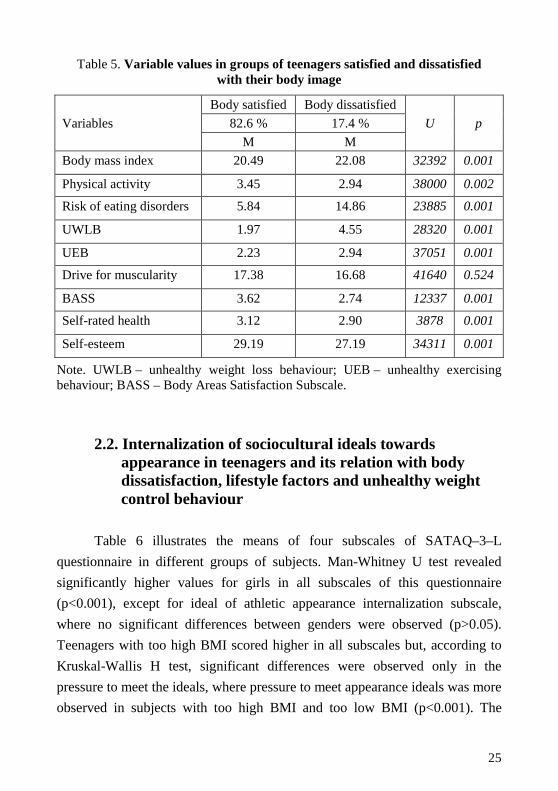
The survey has shown that teenagers dissatisfied with their body have
higher BMI (p<0.001), they are exposed to higher risk of eating disorders
(p<0.001), demonstrated more vivid unhealthy weight control behaviour
(p<0.001) and unhealthy exercising behaviour (p<0.001) (Table 5). It was
found that teenagers satisfied with their body were more physically active
(p<0.05), had higher self-esteem (p<0.001) and better health self-rating
(p<0.001).
25
Table 5. Variable values in groups of teenagers satisfied and dissatisfied with their body image
Variables
Body satisfied Body dissatisfied
U p 82.6 % 17.4 %
M M
Body mass index 20.49 22.08 32392 0.001
Physical activity 3.45 2.94 38000 0.002
Risk of eating disorders 5.84 14.86 23885 0.001
UWLB 1.97 4.55 28320 0.001
UEB 2.23 2.94 37051 0.001
Drive for muscularity 17.38 16.68 41640 0.524
BASS 3.62 2.74 12337 0.001
Self-rated health 3.12 2.90 3878 0.001
Self-esteem 29.19 27.19 34311 0.001
Note. UWLB – unhealthy weight loss behaviour; UEB – unhealthy exercising behaviour; BASS – Body Areas Satisfaction Subscale.
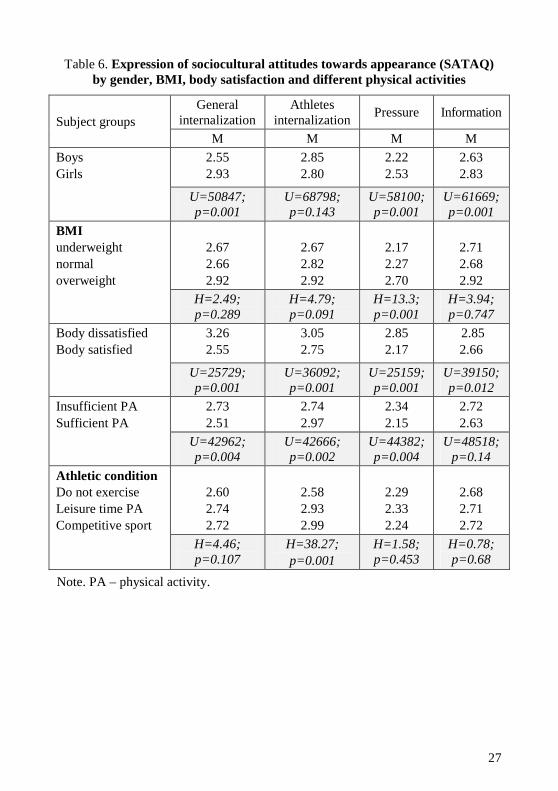
2.2. Internalization of sociocultural ideals towards appearance in teenagers and its relation with body dissatisfaction, lifestyle factors and unhealthy weight control behaviour
Table 6 illustrates the means of four subscales of SATAQ–3–L
questionnaire in different groups of subjects. Man-Whitney U test revealed
significantly higher values for girls in all subscales of this questionnaire
(p<0.001), except for ideal of athletic appearance internalization subscale,
where no significant differences between genders were observed (p>0.05).
Teenagers with too high BMI scored higher in all subscales but, according to
Kruskal-Wallis H test, significant differences were observed only in the
pressure to meet the ideals, where pressure to meet appearance ideals was more
observed in subjects with too high BMI and too low BMI (p<0.001). The
26
results revealed that body dissatisfaction is closely related with social
environment. Teenagers dissatisfied with their body areas scored higher in all
internalization of sociocultural ideals towards appearance subscales.
It was also found that insufficiently physically active teenagers had
more significant internalization of ideals towards appearance (p<0.05) and felt
pressure to meet the ideals (p<0.05), whereas sufficiently physically active
teenagers had higher scores in the scale of internalization of ideals towards
athletic appearance (p<0.05). Internalization of ideals towards athletic
appearance was the most significant among the subjects going for competitive
sports (p<0.001). No significant differences were observed among groups of
different physical activities but the biggest pressure to meet the ideals was
observed in teenagers doing aerobic activities in leisure time (H=13.36;
p=0.01) (Table 6).
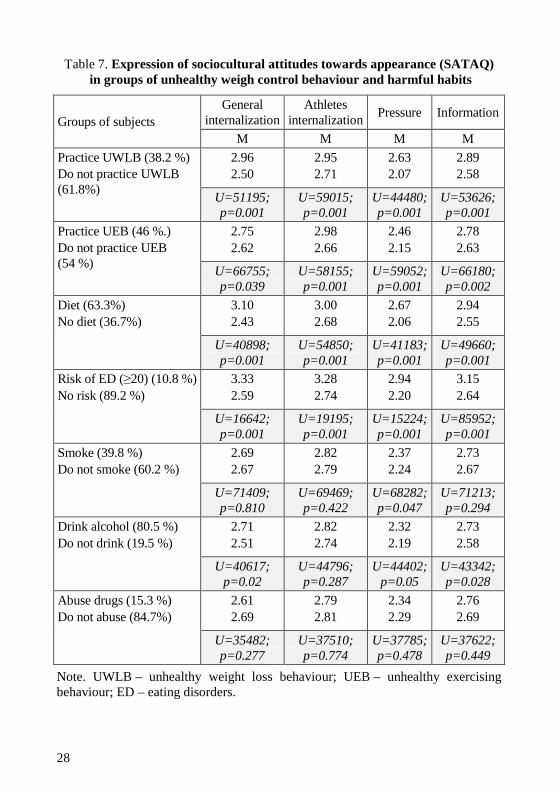
It was found that internalization of ideals towards appearance correlates
with unhealthy weight loss and related exercising behaviour. Subjects who
often fell into unhealthy behaviour groups showed significantly higher
internalization of ideals towards appearance in all four subscales (Table 7).
Students going on diets and students falling into disordered eating risk groups
had a significantly higher internalization of ideals towards appearance in these
subscales. Harmful habits also correlated with internalization of ideals towards
appearance. Smoking and alcohol drinking teenagers more often acknowledged
pressure to meet appearance ideals (p<0.05). Compared to non-drinking
teenagers, alcohol drinking peers expressed higher internalization of ideals
towards appearance (p<0.05), felt more pressure to meet the ideals (p<0.05)
and were more open to information about the ideal appearance (p<0.05). Drug
abuse did not correlate with internalization of ideals towards appearance
(p>0.05).
27
Table 6. Expression of sociocultural attitudes towards appearance (SATAQ) by gender, BMI, body satisfaction and different physical activities
Subject groups General
internalization Athletes
internalization Pressure Information
M M M M
Boys Girls
2.55 2.93
2.85 2.80
2.22 2.53
2.63 2.83
U=50847; p=0.001
U=68798; p=0.143
U=58100; p=0.001
U=61669; p=0.001
BMI underweight normal overweight
2.67 2.66 2.92
2.67 2.82 2.92
2.17 2.27 2.70
2.71 2.68 2.92
H=2.49; p=0.289
H=4.79; p=0.091
H=13.3; p=0.001
H=3.94; p=0.747
Body dissatisfied Body satisfied
3.26 2.55
3.05 2.75
2.85 2.17
2.85 2.66
U=25729; p=0.001
U=36092; p=0.001
U=25159; p=0.001
U=39150; p=0.012
Insufficient PA Sufficient PA
2.73 2.51
2.74 2.97
2.34 2.15
2.72 2.63
U=42962; p=0.004
U=42666; p=0.002
U=44382; p=0.004
U=48518; p=0.14
Athletic condition Do not exercise Leisure time PA Competitive sport
2.60 2.74 2.72
2.58 2.93 2.99
2.29 2.33 2.24
2.68 2.71 2.72
H=4.46; p=0.107
H=38.27; p=0.001
H=1.58; p=0.453
H=0.78; p=0.68
Note. PA – physical activity.
28
Table 7. Expression of sociocultural attitudes towards appearance (SATAQ) in groups of unhealthy weigh control behaviour and harmful habits
Groups of subjects General
internalization Athletes
internalization Pressure Information
M M M M
Practice UWLB (38.2 %) Do not practice UWLB (61.8%)
2.96 2.50
2.95 2.71
2.63 2.07
2.89 2.58
U=51195; p=0.001
U=59015; p=0.001
U=44480; p=0.001
U=53626; p=0.001
Practice UEB (46 %.) Do not practice UEB (54 %)
2.75 2.62
2.98 2.66
2.46 2.15
2.78 2.63
U=66755; p=0.039
U=58155; p=0.001
U=59052; p=0.001
U=66180; p=0.002
Diet (63.3%) No diet (36.7%)
3.10 2.43
3.00 2.68
2.67 2.06
2.94 2.55
U=40898; p=0.001
U=54850; p=0.001
U=41183; p=0.001
U=49660; p=0.001
Risk of ED (≥20) (10.8 %) No risk (89.2 %)
3.33 2.59
3.28 2.74
2.94 2.20
3.15 2.64
U=16642; p=0.001
U=19195; p=0.001
U=15224; p=0.001
U=85952; p=0.001
Smoke (39.8 %) Do not smoke (60.2 %)
2.69 2.67
2.82 2.79
2.37 2.24
2.73 2.67
U=71409; p=0.810
U=69469; p=0.422
U=68282; p=0.047
U=71213; p=0.294
Drink alcohol (80.5 %) Do not drink (19.5 %)
2.71 2.51
2.82 2.74
2.32 2.19
2.73 2.58
U=40617; p=0.02
U=44796; p=0.287
U=44402; p=0.05
U=43342; p=0.028
Abuse drugs (15.3 %) Do not abuse (84.7%)
2.61 2.69
2.79 2.81
2.34 2.29
2.76 2.69
U=35482; p=0.277
U=37510; p=0.774
U=37785; p=0.478
U=37622; p=0.449
Note. UWLB – unhealthy weight loss behaviour; UEB – unhealthy exercising behaviour; ED – eating disorders.
29
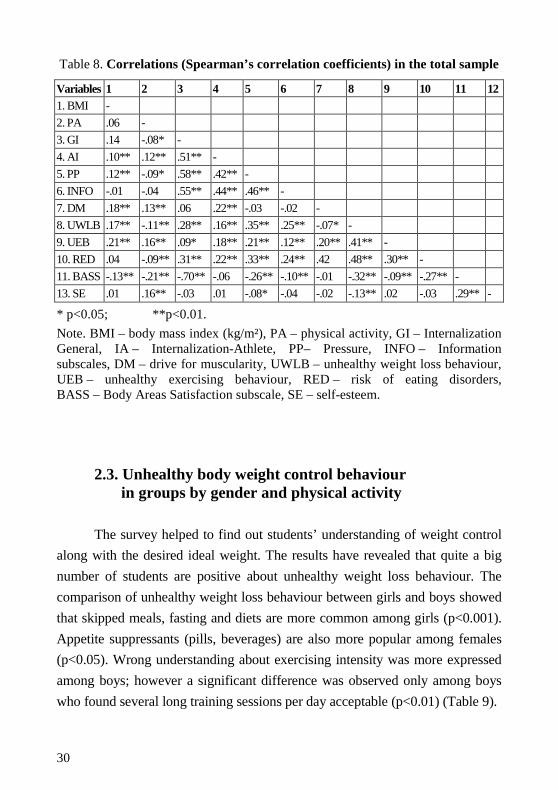
Correlation analysis was used to find out the interrelation of variables
(Table 8). Internalization of ideal appearance and pressure to meet these ideals
directly correlated with BMI (p<0.01), unhealthy weight loss (p<0.01) and
exercising behaviour (p<0.05), risk of eating disorders (p<0.01) and were
inversely related to image (p<0.01) and health rating (p<0.01), however they
were not related with the drive for muscularity (p>0.05). Besides, the pressure
to meet image expectations inversely correlated with self-esteem (p<0.05),
physical activity (p<0.05). Internalization of ideal athletic appearance directly
correlated with BMI (p<0.01) and physical activity (p<0.01), drive for
muscularity (p<0.01), weight loss behaviour (p<0.01) and exercising behaviour
(p<0.01) as well as the risk of eating disorders (p<0.01). Internalization of
ideals towards appearance directly correlated with unhealthy weight loss
(p<0.01) and exercising behaviour (p<0.01), risk of eating disorders (p<0.01)
and lower body satisfaction (p<0.01). Higher drive for muscularity directly
correlated with higher BMI (p<0.01) and physical activity (p<0.01) as well as
internalization of ideal athletic appearance (p<0.01). It was also directly related
with unhealthy exercising behaviour (p<0.01) and indirectly related with
unhealthy weight loss behaviour (p<0.05).
Risk of eating disorders directly correlated with higher values of
internalization of ideals towards appearance of all subscales (p<0.01),
unhealthy weight loss (p<0.01) and exercising behaviour (p<0.01); however it
inversely correlated with physical activity (p<0.01), body satisfaction (p<0.01)
and health rating (p<0.01) (Table 8).
30
Table 8. Correlations (Spearman’s correlation coefficients) in the total sample
Variables 1 2 3 4 5 6 7 8 9 10 11 12 1. BMI -
2. PA .06 -
3. GI .14 -.08* -
4. AI .10** .12** .51** -
5. PP .12** -.09* .58** .42** -
6. INFO -.01 -.04 .55** .44** .46** -
7. DM .18** .13** .06 .22** -.03 -.02 -
8. UWLB .17** -.11** .28** .16** .35** .25** -.07* -
9. UEB .21** .16** .09* .18** .21** .12** .20** .41** -
10. RED .04 -.09** .31** .22** .33** .24** .42 .48** .30** -
11. BASS -.13** -.21** -.70** -.06 -.26** -.10** -.01 -.32** -.09** -.27** -
13. SE .01 .16** -.03 .01 -.08* -.04 -.02 -.13** .02 -.03 .29** -
* p<0.05; **p<0.01.
Note. BMI – body mass index (kg/m²), PA – physical activity, GI – Internalization General, IA – Internalization-Athlete, PP– Pressure, INFO – Information subscales, DM – drive for muscularity, UWLB – unhealthy weight loss behaviour, UEB – unhealthy exercising behaviour, RED – risk of eating disorders, BASS – Body Areas Satisfaction subscale, SE – self-esteem.
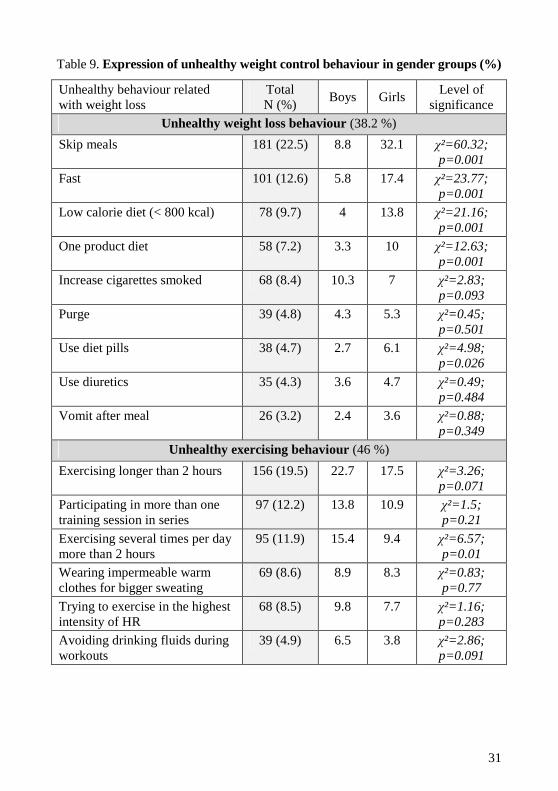
2.3. Unhealthy body weight control behaviour in groups by gender and physical activity
The survey helped to find out students’ understanding of weight control
along with the desired ideal weight. The results have revealed that quite a big
number of students are positive about unhealthy weight loss behaviour. The
comparison of unhealthy weight loss behaviour between girls and boys showed
that skipped meals, fasting and diets are more common among girls (p<0.001).
Appetite suppressants (pills, beverages) are also more popular among females
(p<0.05). Wrong understanding about exercising intensity was more expressed
among boys; however a significant difference was observed only among boys
who found several long training sessions per day acceptable (p<0.01) (Table 9).
31
Table 9. Expression of unhealthy weight control behaviour in gender groups (%)
Unhealthy behaviour related with weight loss
Total N (%)
Boys Girls Level of
significance
Unhealthy weight loss behaviour (38.2 %)
Skip meals 181 (22.5) 8.8 32.1 χ²=60.32; p=0.001
Fast 101 (12.6) 5.8 17.4 χ²=23.77; p=0.001
Low calorie diet (< 800 kcal) 78 (9.7) 4 13.8 χ²=21.16; p=0.001
One product diet 58 (7.2) 3.3 10 χ²=12.63; p=0.001
Increase cigarettes smoked 68 (8.4) 10.3 7 χ²=2.83; p=0.093
Purge 39 (4.8) 4.3 5.3 χ²=0.45; p=0.501
Use diet pills 38 (4.7) 2.7 6.1 χ²=4.98; p=0.026
Use diuretics 35 (4.3) 3.6 4.7 χ²=0.49; p=0.484
Vomit after meal 26 (3.2) 2.4 3.6 χ²=0.88; p=0.349
Unhealthy exercising behaviour (46 %)
Exercising longer than 2 hours 156 (19.5) 22.7 17.5 χ²=3.26; p=0.071
Participating in more than one training session in series
97 (12.2) 13.8 10.9 χ²=1.5; p=0.21
Exercising several times per day more than 2 hours
95 (11.9) 15.4 9.4 χ²=6.57; p=0.01
Wearing impermeable warm clothes for bigger sweating
69 (8.6) 8.9 8.3 χ²=0.83; p=0.77
Trying to exercise in the highest intensity of HR
68 (8.5) 9.8 7.7 χ²=1.16; p=0.283
Avoiding drinking fluids during workouts
39 (4.9) 6.5 3.8 χ²=2.86; p=0.091
32
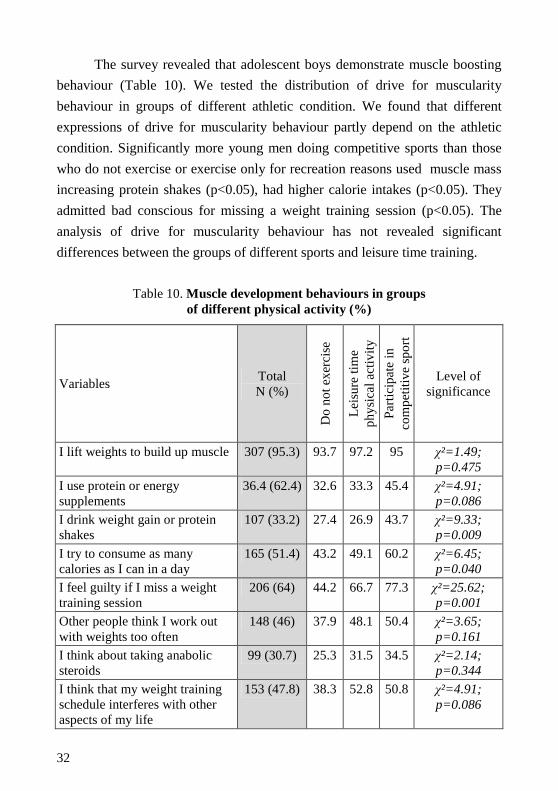
The survey revealed that adolescent boys demonstrate muscle boosting
behaviour (Table 10). We tested the distribution of drive for muscularity
behaviour in groups of different athletic condition. We found that different
expressions of drive for muscularity behaviour partly depend on the athletic
condition. Significantly more young men doing competitive sports than those
who do not exercise or exercise only for recreation reasons used muscle mass
increasing protein shakes (p<0.05), had higher calorie intakes (p<0.05). They
admitted bad conscious for missing a weight training session (p<0.05). The
analysis of drive for muscularity behaviour has not revealed significant
differences between the groups of different sports and leisure time training.
Table 10. Muscle development behaviours in groups of different physical activity (%)
Variables Total N (%)
Do
no
t exe
rcis
e
Lei
sure
tim
e p
hys
ical
act
ivity
Par
ticip
ate
in
com
pet
itive
sp
ort
Level of significance
I lift weights to build up muscle 307 (95.3) 93.7 97.2 95 χ²=1.49; p=0.475
I use protein or energy supplements
36.4 (62.4) 32.6 33.3 45.4 χ²=4.91; p=0.086
I drink weight gain or protein shakes
107 (33.2) 27.4 26.9 43.7 χ²=9.33; p=0.009
I try to consume as many calories as I can in a day
165 (51.4) 43.2 49.1 60.2 χ²=6.45; p=0.040
I feel guilty if I miss a weight training session
206 (64) 44.2 66.7 77.3 χ²=25.62; p=0.001
Other people think I work out with weights too often
148 (46) 37.9 48.1 50.4 χ²=3.65; p=0.161
I think about taking anabolic steroids
99 (30.7) 25.3 31.5 34.5 χ²=2.14; p=0.344
I think that my weight training schedule interferes with other aspects of my life
153 (47.8) 38.3 52.8 50.8 χ²=4.91; p=0.086
33
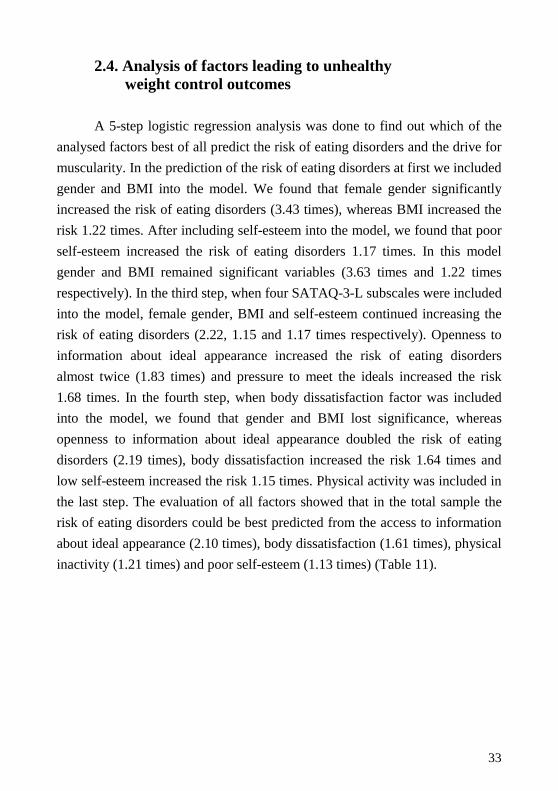
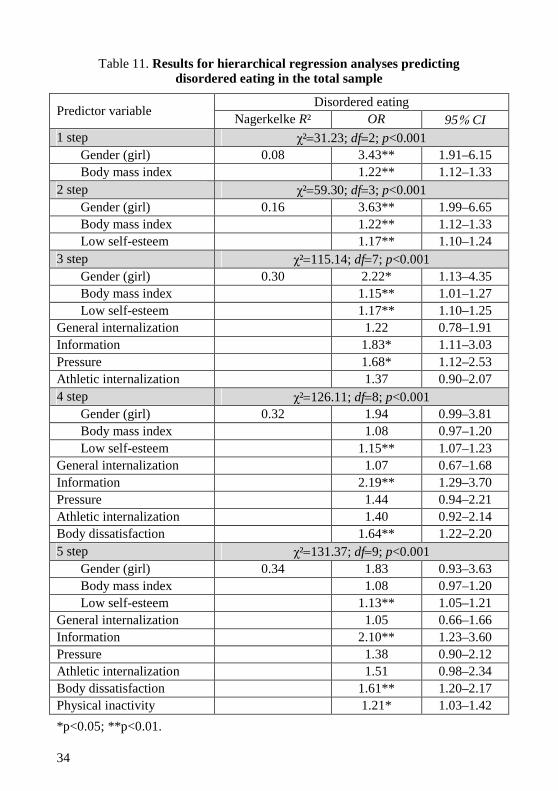
2.4. Analysis of factors leading to unhealthy weight control outcomes
A 5-step logistic regression analysis was done to find out which of the
analysed factors best of all predict the risk of eating disorders and the drive for
muscularity. In the prediction of the risk of eating disorders at first we included
gender and BMI into the model. We found that female gender significantly
increased the risk of eating disorders (3.43 times), whereas BMI increased the
risk 1.22 times. After including self-esteem into the model, we found that poor
self-esteem increased the risk of eating disorders 1.17 times. In this model
gender and BMI remained significant variables (3.63 times and 1.22 times
respectively). In the third step, when four SATAQ-3-L subscales were included
into the model, female gender, BMI and self-esteem continued increasing the
risk of eating disorders (2.22, 1.15 and 1.17 times respectively). Openness to
information about ideal appearance increased the risk of eating disorders
almost twice (1.83 times) and pressure to meet the ideals increased the risk
1.68 times. In the fourth step, when body dissatisfaction factor was included
into the model, we found that gender and BMI lost significance, whereas
openness to information about ideal appearance doubled the risk of eating
disorders (2.19 times), body dissatisfaction increased the risk 1.64 times and
low self-esteem increased the risk 1.15 times. Physical activity was included in
the last step. The evaluation of all factors showed that in the total sample the
risk of eating disorders could be best predicted from the access to information
about ideal appearance (2.10 times), body dissatisfaction (1.61 times), physical
inactivity (1.21 times) and poor self-esteem (1.13 times) (Table 11).
34
Table 11. Results for hierarchical regression analyses predicting disordered eating in the total sample
Predictor variable Disordered eating
Nagerkelke R² OR 95% CI 1 step χ²=31.23; df=2; p<0.001
Gender (girl) 0.08 3.43** 1.91–6.15 Body mass index 1.22** 1.12–1.33
2 step χ²=59.30; df=3; p<0.001 Gender (girl) 0.16 3.63** 1.99–6.65 Body mass index 1.22** 1.12–1.33 Low self-esteem 1.17** 1.10–1.24
3 step χ²=115.14; df=7; p<0.001 Gender (girl) 0.30 2.22* 1.13–4.35 Body mass index 1.15** 1.01–1.27 Low self-esteem 1.17** 1.10–1.25
General internalization 1.22 0.78–1.91 Information 1.83* 1.11–3.03 Pressure 1.68* 1.12–2.53 Athletic internalization 1.37 0.90–2.07 4 step χ²=126.11; df=8; p<0.001
Gender (girl) 0.32 1.94 0.99–3.81 Body mass index 1.08 0.97–1.20 Low self-esteem 1.15** 1.07–1.23
General internalization 1.07 0.67–1.68 Information 2.19** 1.29–3.70 Pressure 1.44 0.94–2.21 Athletic internalization 1.40 0.92–2.14 Body dissatisfaction 1.64** 1.22–2.20 5 step χ²=131.37; df=9; p<0.001
Gender (girl) 0.34 1.83 0.93–3.63 Body mass index 1.08 0.97–1.20 Low self-esteem 1.13** 1.05–1.21
General internalization 1.05 0.66–1.66 Information 2.10** 1.23–3.60 Pressure 1.38 0.90–2.12 Athletic internalization 1.51 0.98–2.34 Body dissatisfaction 1.61** 1.20–2.17 Physical inactivity 1.21* 1.03–1.42
*p<0.05; **p<0.01.
35
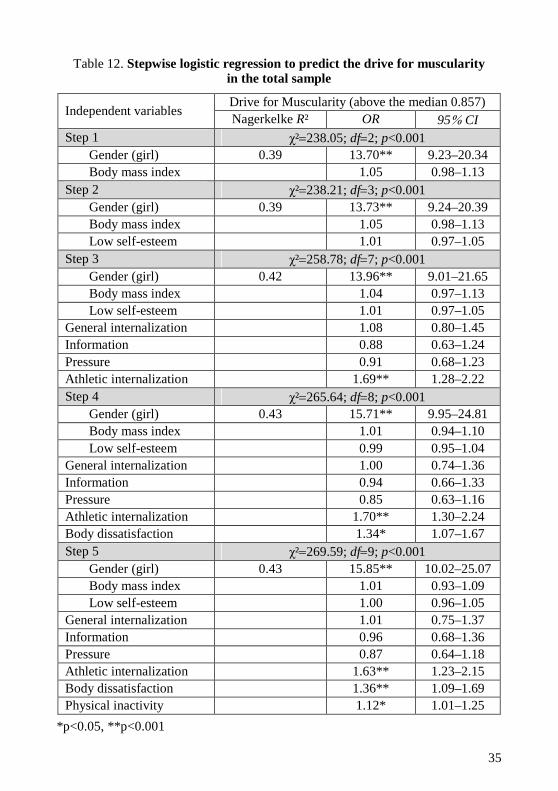
Table 12. Stepwise logistic regression to predict the drive for muscularity in the total sample
Independent variables Drive for Muscularity (above the median 0.857) Nagerkelke R² OR 95% CI
Step 1 χ²=238.05; df=2; p<0.001 Gender (girl) 0.39 13.70** 9.23–20.34 Body mass index 1.05 0.98–1.13
Step 2 χ²=238.21; df=3; p<0.001 Gender (girl) 0.39 13.73** 9.24–20.39 Body mass index 1.05 0.98–1.13 Low self-esteem 1.01 0.97–1.05
Step 3 χ²=258.78; df=7; p<0.001 Gender (girl) 0.42 13.96** 9.01–21.65 Body mass index 1.04 0.97–1.13 Low self-esteem 1.01 0.97–1.05
General internalization 1.08 0.80–1.45 Information 0.88 0.63–1.24 Pressure 0.91 0.68–1.23 Athletic internalization 1.69** 1.28–2.22 Step 4 χ²=265.64; df=8; p<0.001
Gender (girl) 0.43 15.71** 9.95–24.81 Body mass index 1.01 0.94–1.10 Low self-esteem 0.99 0.95–1.04
General internalization 1.00 0.74–1.36 Information 0.94 0.66–1.33 Pressure 0.85 0.63–1.16 Athletic internalization 1.70** 1.30–2.24 Body dissatisfaction 1.34* 1.07–1.67 Step 5 χ²=269.59; df=9; p<0.001
Gender (girl) 0.43 15.85** 10.02–25.07 Body mass index 1.01 0.93–1.09 Low self-esteem 1.00 0.96–1.05
General internalization 1.01 0.75–1.37 Information 0.96 0.68–1.36 Pressure 0.87 0.64–1.18 Athletic internalization 1.63** 1.23–2.15 Body dissatisfaction 1.36** 1.09–1.69 Physical inactivity 1.12* 1.01–1.25
*p<0.05, **p<0.001
36
The same stepwise logistic regression model was used to test the factors
that could predict the drive for muscularity. In the drive for muscularity scale
we found a more intensive drive from the median (0.857), which we aimed to
forecast (Table 12).
The model showed that in the first step masculine gender had the biggest
significance for the drive for muscularity in the total sample (13.7 times). When
self-esteem was added in the second step, gender remained the sole significant
variable predicting the drive for muscularity (13.73 times). When SATAQ-3-L
scales were included into the model in the third step, we saw that masculine
gender remained the strongest factor predicting the drive for muscularity (13.96
times), followed by the internalization of ideals towards athletic appearance
(1.69 times). When body dissatisfaction was included into the model in the
fourth step, the significant factors predicting the drive for muscularity were:
masculine gender (15.71 times), internalization of ideals towards athletic
appearance (1.7 times) and body dissatisfaction (1.34 times). After adding
physical activity in the fifth step and considering all predicting factors, we saw
that masculine gender was the strongest variable that increased the possibility of
the drive for muscularity 15.85 times. Internalization of ideals towards athletic
appearance increased this possibility 1.63 times, followed by body
dissatisfaction (1.36 times) and more intensive physical activity (1.12 times).
2.5. Analysis of the effect of educational body image optimization program
The analysis of the results of second research (educational experiment)
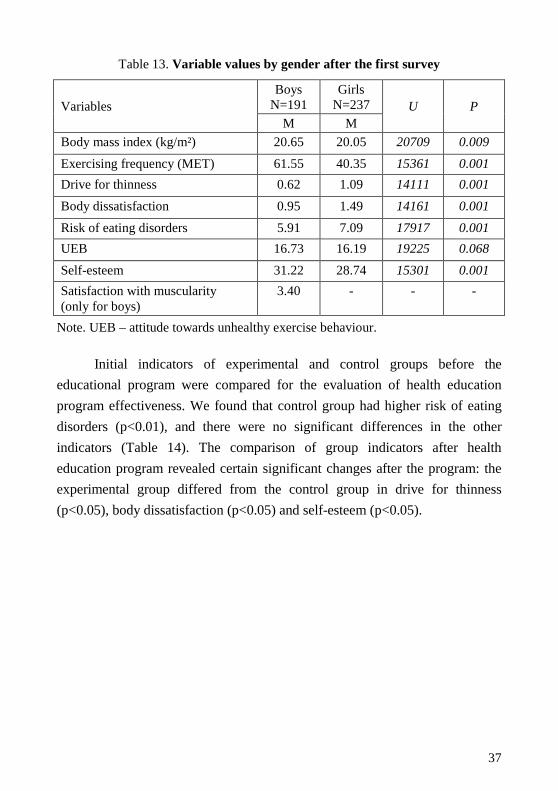
by gender showed significant differences in almost all variables. Girls,
compared to boys, had lower BMI (p<0.01), lower physical activity (p<0.001),
higher drive for thinness (p<0.001), higher body dissatisfaction (p<0.001),
lower self-esteem (p<0.001) and higher risk of eating disorders (p<0.05). There
was no big difference between genders in the approach to unhealthy exercising
behaviour for weight control (p>0.05) (Table 13).
37
Table 13. Variable values by gender after the first survey
Variables Boys
N=191 Girls
N=237 U P M M
Body mass index (kg/m²) 20.65 20.05 20709 0.009
Exercising frequency (MET) 61.55 40.35 15361 0.001
Drive for thinness 0.62 1.09 14111 0.001
Body dissatisfaction 0.95 1.49 14161 0.001
Risk of eating disorders 5.91 7.09 17917 0.001
UEB 16.73 16.19 19225 0.068
Self-esteem 31.22 28.74 15301 0.001
Satisfaction with muscularity (only for boys)
3.40 - - -
Note. UEB – attitude towards unhealthy exercise behaviour.
Initial indicators of experimental and control groups before the
educational program were compared for the evaluation of health education
program effectiveness. We found that control group had higher risk of eating
disorders (p<0.01), and there were no significant differences in the other
indicators (Table 14). The comparison of group indicators after health
education program revealed certain significant changes after the program: the
experimental group differed from the control group in drive for thinness
(p<0.05), body dissatisfaction (p<0.05) and self-esteem (p<0.05).
38
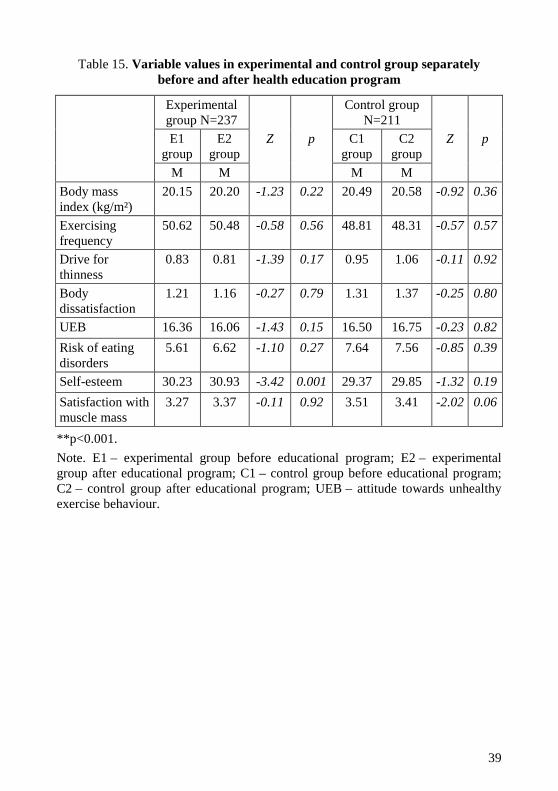
Table 14. Variable values in experimental and control group before and after health education program
Note. E1 – experimental group before educational program; E2 – experimental group after educational program; C1 – control group before educational program; C2 – control group after educational program; UEB – attitude towards unhealthy exercise behaviour.
We also analyzed the effect of the educational program on the
experimental and control groups separately. To evaluate the effect we used
non-parametric statistical hypothesis test by comparing two paired samples and
calculating Wilcoxon Z ratio. We found, that health education program had a
significant effect only for the self-esteem of teenagers in experimental group;
their self-esteem improved (Wilcoxon Z ratio =-3.42; p=0.001), whereas no
statistically significant changes were observed in other measures. As expected,
none of the analyzed variables changed significantly in the control group
(Table 15).
Before experiment
U p
After experiment
U p E1
group N=237
C1 group N=211
E2 group N=237
C2 group N=211
M M M M
Body mass index(kg/m²)
20.07 20.46 22882 0.24 20.14 20.52 22841 0.20
Exercising frequency
50.62 48.81 24633 0.79 50.48 48.31 24440 0.68
Drive for thinness
0.83 0.95 18144 0.08 0.81 1.06 17142 0.003
Body dissatisfaction
1.21 1.31 19022 0.23 1.16 1.37 17018 0.02
UEB 16.36 16.50 20945 0.57 16.06 16.75 20791 0.08
Risk of eating disorders
5.61 7.64 21630 0.01 6.62 7.56 22667 0.09
Self-esteem 30.23 29.37 20069 0.07 30.93 29.85 19284 0.02
Satisfaction with muscle mass
3.27 3.51 4279 0.12 3.37 3.41 4627 0.71
39
Table 15. Variable values in experimental and control group separately before and after health education program
**p<0.001.
Note. E1 – experimental group before educational program; E2 – experimental group after educational program; C1 – control group before educational program; C2 – control group after educational program; UEB – attitude towards unhealthy exercise behaviour.
Experimental group N=237
Z p
Control group N=211
Z p E1 group
E2 group
C1 group
C2 group
M M M M
Body mass index (kg/m²)
20.15 20.20 -1.23 0.22 20.49 20.58 -0.92 0.36
Exercising frequency
50.62 50.48 -0.58 0.56 48.81 48.31 -0.57 0.57
Drive for thinness
0.83 0.81 -1.39 0.17 0.95 1.06 -0.11 0.92
Body dissatisfaction
1.21 1.16 -0.27 0.79 1.31 1.37 -0.25 0.80
UEB 16.36 16.06 -1.43 0.15 16.50 16.75 -0.23 0.82
Risk of eating disorders
5.61 6.62 -1.10 0.27 7.64 7.56 -0.85 0.39
Self-esteem 30.23 30.93 -3.42 0.001 29.37 29.85 -1.32 0.19
Satisfaction with muscle mass
3.27 3.37 -0.11 0.92 3.51 3.41 -2.02 0.06
40
CONCLUSIONS
1. Body image is a problematic issue among teenagers. Body image
dissatisfaction is more common among adolescent girls and teenagers with
higher body mass index and lower physical activity.
Adolescent girls have a more negative body image; they are more likely
to use unhealthy weight control behaviours (and risk of eating disorders) and
are less physically active, whereas adolescent boys have a higher drive for
muscularity and related behaviours.
Underweight teenagers have the best body image. Overweight teenagers
most often use unhealthy weight control behaviours, they smoke more often,
however their physical activity does not differ from their peers with normal
body mass index.
Physically active teenagers have better body image, use unhealthy
weight control behaviours less frequently but have a higher drive for
muscularity.
2. Adolescent girls more than boys internalize sociocultural ideals
towards appearance. Less physically active and overweight teenagers
experience a higher pressure to meet appearance ideals. Internalization of
sociocultural ideals towards appearance among teenagers is related to higher
body dissatisfaction, more frequent unhealthy weight control behaviour, lower
physical activity and more frequent alcohol abuse. The perceived pressure to
meet appearance ideals is related to lower self-esteem, more frequent unhealthy
weight control behaviour and smoking. Internalization of athletic ideal is
related to a higher drive for muscularity.
3. Unhealthy weight control behaviour (risk of eating disorders) can be
best predicted from the access to information about the ideal appearance, body
dissatisfaction, low self-esteem and insufficient physical activity irrespective of
body mass index. The drive for muscularity among teenagers is mostly
predicted by male gender, athletic ideal internalization, body dissatisfaction
and lack of physical activity.
41
4. The educational program developed on the basis of cognitive
dissonance strategy and aimed for raising self-esteem and improving media
literacy had a positive effect on adolescent self-esteem, but it did not have a
significant effect on the changes in body image, drive for thinness, risk of
eating disorders, body weight control and physical activity literacy. The
program content and implementation measures should be corrected by
conducting further research.
42
SUMMARY IN LITHUANIAN
Socialin÷ erdv÷ yra svarbus kūno vaizdo formavimosi komponentas,
susijęs su savo kūno suvokimu (Jackson, 2004). Kuo labiau asmens fiziniai
bruožai nutolę nuo socialinių lūkesčių, tuo labiau asmuo nepatenkintas savo
kūnu, tuo prasčiau save vertina, dažniau linksta į depresiją, dažniau
manipuliuoja maistu (Cash, Pruzinsky, 2004; Tiggemann, 2011). Rūpestis d÷l
nepasitenkinimo savo kūnu turi neigiamą poveikį paauglių fiziniam bei
psichosocialiniam vystymuisi ir sveikatai (Johnson, Wardle, 2005; Shrof,
Thompson, 2006). Paauglių tyrimai atskleidžia, kad nepasitenkinimas savo
kūnu paauglyst÷je yra susijęs su prastesniu savęs vertinimu, sutrikusiu
valgymo elgesiu, neigiamų svorio kontrol÷s būdų taikymu ir did÷jančiu vaikų
bei paauglių antsvorio plitimu (Neumark-Sztainer et al., 2006; Jackson, Chen,
2010). Prastas savęs vertinimas siejamas su dažnesne tikimybe tapti patyčių
auka (Jankauskiene et al., 2008), didesne savižudyb÷s rizika, savęs žalojimu
(Rodriguez-Cano, Beato-Fernandez, Llario, 2006; Laskyt÷, 2009).
Iki šiol atliktuose tyrimuose daugiausia d÷mesio buvo skiriama su
valgymu susijusiam elgesiui analizuoti, o darbų, kurie atskleistų su fiziniu
aktyvumu susijusio elgesio raišką reguliuojant kūno masę, stokojama. N÷ra iki
galo aišku, kiek bendras siekimas atitikti socialinius ir kultūrinius išvaizdos
idealus yra susijęs su svorio mažinimo elgesiu, nežinoma, kaip paaugliai
elgiasi, jei nusprendžia kūno masę mažinti fiziniu aktyvumu. Trūksta tyrimų,
nagrin÷jančių paauglių savęs, savo kūno ir savo sveikatos vertinimo sąsajas su
lieknumo ir raumeningumo siekimu skirtingo fizinio aktyvumo grup÷se ir
sporto šakose. Be to, tyrimai, vertinantys nepasitenkinimo savo kūnu ir fizinio
aktyvumo sąsajas yra gana prieštaringi – vieni tyr÷jai teigia, kad fizinis
aktyvumas susijęs su geresniu savo kūno vertinimu (Hausenblas, Fallon, 2006;
Campbell, Hausenblas, 2009; Voks et al., 2009), kiti aiškina priešingai
(Zabinski et al., 2001; Leone, Sedory, Gray, 2005; McCabe, Ricciardelli,
James, 2007).
Sumin÷ti teiginiai pagrindžia tyrimų, atskleidžiančių sąsajas tarp
paauglių požiūrio į savo kūną, fizinio aktyvumo ir kūno svorio mažinimo
43
elgesio bei nepasitenkinimo savo kūnu prevencijos aktualumą. Stinga darbų,
kuriuose būtų nagrin÷jami šie aspektai tarp abiejų lyčių. Tod÷l mūsų tyrimo
objektas yra paauglių požiūris į savo kūną bei edukacin÷s programos
galimyb÷s jį koreguoti.
Tyrimo tikslas – nustatyti paauglių požiūrio į savo kūną ypatumus ir
edukacin÷s programos poveikį šio požiūrio koregavimui.
Tyrimo uždaviniai:
1. Nustatyti požiūrio į savo kūną ir su juo susijusių veiksnių raišką
lyties, kūno mas÷s indekso bei fizinio aktyvumo grup÷se.
2. Atskleisti požiūrio į savo kūną sąsajas su socialiniais, savęs vertinimo
bei sveikatai žalingo kūno mas÷s reguliavimo veiksniais.
3. Nustatyti veiksnius, labiausiai prognozuojančius paauglių sveikatai
žalingą kūno mas÷s reguliavimą.
4. Sukurti edukacinę programą ir įvertinti jos poveikį paauglių požiūrio į
savo kūną ir su juo susijusių veiksnių bei sveikatos raštingumo kūno mas÷s
reguliavimo srityje kaitai.
Darbo naujumas, mokslin÷ ir praktin ÷ reikšm÷. Naujas šio darbo
aspektas yra tas, kad požiūrio į savo kūną ir su juo susijusių veiksnių raiškos
ypatumai buvo nagrin÷jami skirtingo fizinio aktyvumo paauglių grup÷se. Ši
analiz÷ papildys mokslines žinias, kaip fizinis aktyvumas ir dalyvavimas
sportin÷je veikloje susijęs su savo kūno vertinimu. Fizinis aktyvumas kaip
apsauginis veiksnys mažai buvo tirtas net ir Vakarų šalių tyr÷jų.
Kaip vieną disertacinio darbo naujumų reik÷tų laikyti tai, kad abiejuose
tyrimuose dalyvavo abiejų lyčių paaugliai. Iki šiol visame pasaulyje atlikta vos
kelios dešimtys vaikų ir paauglių nepasitenkinimą savo išvaizda mažinančių
kontroliuojamų ir mokyklose vykdytų reprezentatyvių sveikatos ugdymo
programų efektyvumo tyrimų (O’Dea, 2007). Mūsų šalyje – tai visiškai naujas
projektas. Šis tyrimas pad÷s atskleisti, kokį poveikį minima sveikatos ugdymo
programa turi vidurinio tarpsnio paauglyst÷je abiem lytims (daugumoje
edukacinių programų buvo tiriami 10–11 metų paaugliai, dažniausiai
mergait÷s). Šia programa siekta patikrinti, kaip ji veikia berniukus, nes iki šiol
44
pasaulyje atlikti ir paskelbti vos devyni tyrimai, kuriuose dalyvavo berniukai.
Teoriniu požiūriu darbas yra reikšmingas, nes, be išsamios duomenų
analiz÷s, pad÷jusios atskleisti paauglių požiūrį į savo kūną problematiką ir
nustatyti pagrindinius sveikatai žalingos svorio reguliavimo elgesio ypatumus,
jis taip pat leido išskirti svarbiausius su šio rizikingo elgesio formavimusi
susijusius veiksnius. Gauti tyrimų rezultatai yra svarbūs formuojant paauglių
nutukimo, valgymo sutrikimų ir žalingų įpročių vartojimo prevencijos
strategijas, taip pat rengiant ir įgyvendinant mokinių sveikatos ugdymo
programas. Disertaciniame darbe tyrimo rezultatų pagrindu parengtos praktin÷s
rekomendacijos d÷stomos šalies, bendruomen÷s ir asmens lygmenimis.
IŠVADOS
1. Paauglių požiūris į savo kūną yra problemiškas. Savo kūnu labiau
nepatenkintos merginos nei vaikinai, didesnio kūno mas÷s indekso ir
nepakankamo fizinio aktyvumo paaugliai.
Merginos prasčiau vertina savo išvaizdą, jos dažniau naudoja sveikatai
žalingus kūno mas÷s mažinimo būdus (joms būdingesn÷ valgymo sutrikimų
rizika) ir skiria mažiau laiko fiziniam aktyvumui, o vaikinams būdingesnis
raumeningumo siekimas ir su juo susijęs elgesys.
Geriausiai savo išvaizdą vertina per mažo kūno mas÷s indekso
paaugliai. Antsvorio turintys paaugliai dažniau imasi sveikatai žalingo kūno
mas÷s reguliavimo, dažniau rūko, tačiau jų fizinis aktyvumas nesiskiria nuo
normalios kūno mas÷s bendraamžių.
Pakankamo fizinio aktyvumo paaugliai geriau vertina save ir savo
išvaizdą, rečiau naudoja sveikatai žalingus kūno mas÷s mažinimo būdus, bet
jiems būdinga didesnis raumeningumo siekimas.
2. Merginos labiau negu vaikinai siekia atitikti socialinius išvaizdos
lūkesčius. Per mažo fizinio aktyvumo ir antsvorio turintys paaugliai labiau
spaudžiami atitikti socialinius išvaizdos lūkesčius. Paauglių siekimas atitikti
šiuos lūkesčius yra susijęs su didesniu nepasitenkinimu savo kūnu, dažnesniu
sveikatai žalingu kūno mas÷s reguliavimu, mažesniu fiziniu aktyvumu,
dažnesniu alkoholio vartojimu. Suvokiamas spaudimas atitikti išvaizdos
45
lūkesčius susijęs su prastesniu savęs vertinimu, dažnesniu sveikatai žalingu
kūno mas÷s reguliavimu ir dažnesniu rūkymu. Sportinio idealo siekimas susijęs
su didesniu raumeningumo siekimu.
3. Paauglių sveikatai žalingą kūno mas÷s reguliavimą (valgymo
sutrikimų riziką) labiausiai prognozuoja informacijos apie idealią išvaizdą
gavimas, nepasitenkinimas savo kūnu, žemas savęs vertinimo lygis ir fizinis
pasyvumas nepriklausomai nuo lyties bei kūno mas÷s indekso. Paauglių
raumeningumo siekimą labiausiai prognozuoja vyriškoji lytis, siekimas atitikti
sportinį išvaizdos idealą, nepasitenkinimas savo kūnu ir fizinis pasyvumas.
4. Kognityvinio disonanso strategija, savęs vertinimo k÷limu bei
žiniasklaidos naudojimo priemonių raštingumo didinimu pagrįsta, edukacin÷
programa tur÷jo poveikį paauglių savęs vertinimui, tačiau netur÷jo reikšmingos
įtakos požiūrio į savo kūną, potraukio į liesumą, valgymo sutrikimų rizikos,
raštingumo kūno mas÷s kontrol÷s ir fizinio aktyvumo srityse kaitai. Programos
turinys ir įgyvendinimo priemon÷s tur÷tų būti koreguojami remiantis tolesniais
tyrimais.
46
Author’s contribution. In 2009 Simona Pajaujien÷ conducted a study
with 11th graders in 16 schools of Kaunas: designed a questionnaire, organized
the surveys, entered data into electronic media and performed mathematical-
statistical analysis of the data. In the second study funded by the Lithuanian
Research Council the author contributed to the development of the educational
experimental program, trained public health specialists, who delivered the
program in schools, contributed to the preparation of questionnaires, teaching
material, introduced the study in schools and participated in the surveys.
Simona Pajaujien÷ wrote (contributed as co-author) 11 scientific
publications, introduced results of the study in 10 scientific conferences in
Lithuania and abroad (presentations in three conferences awards in sections),
gives lectures and practical classes for LSU students of Health and Physical
Activity and Training systems (Fitness trainer) study programs. The author is
active promoter and organizer of wellness and physical activities, fitness and
group fitness trainer.
47
PUBLICATIONS
1. Jankauskien÷, R., Pajaujien÷, S. (2011). Disordered eating attitudes and
body shame among athletes, exercisers and sedentary female college
students. The Journal of Sports Medicine and Physical Fitness. Torino :
Edizioni Minerva Medica, 2, 52 (1), 92–101.
2. Pajaujiene, S., Jankauskien÷, R. (2012). Sociocultural ideal internalization,
body dissatisfaction and weight control behaviour among adolescent
athletes and non-athlete adolescents. Does that need education? Ugdymas.
Kūno kultūra. Sportas, 2 (85), 40–47.
3. Pajaujien÷, S., Jankauskien÷, R., Mickūnien÷, R. (2010). Paauglių fizinio
aktyvumo ryšys su valgymo sutrikimų rizika ir požiūriu į sveikatai žalingą
su fiziniu aktyvumu susijusį elgesį. Sveikatos mokslai. Vilnius : Uždaroji
akcin÷ bendrov÷ žurnalas „Sveikata“, 20, 6 (72), 3593–3598.
4. Jankauskien÷, R., Pajaujien÷, S., Mickūnien÷, R. (2010). Studenčių
siekimo atitikti socialinius išvaizdos lūkesčius ryšys su požiūriu į sveikatai
žalingą su valgymu ir fiziniu aktyvumu susijusią elgseną. Visuomen÷s
sveikata. Vilnius : Higienos institutas, 3 (50), 100–109.
5. Pajaujien÷, S., Jankauskien÷, R. (2011). Paauglių vaikinų socialinių-
kultūrinių išvaizdos vertybių pri÷mimas, raumeningumo siekimas:
susijusių veiksnių analiz÷. Sportinį darbingumą lemiantys veiksniai (IV)
[elektroninis išteklius] : mokslinių straipsnių rinkinys. Kaunas : Lietuvos
kūno kultūros akademija, 166–175.
6. Pajaujien÷, S. (2009). Kaip sveikatingumo klubų aplinkoje jaučiasi ir
elgiasi laisvalaikiu sportuojančios moterys? Sporto mokslas. Vilnius :
Lietuvos sporto informacijos centras, 4 (58), 62–69.
7. Pajaujien÷, S., Jankauskien÷, R., Visagurskien÷, K., Vizbarait÷, D.,
Griciūt÷, A. (2011). Ryšys tarp IX klasių berniukų ir mergaičių fizinio
aktyvumo, valgymo sutrikimų rizikos ir požiūrio į mankštinimosi elgseną
mažinant svorį. Sveikatos mokslai. Vilnius : Uždaroji akcin÷ bendrov÷
žurnalas „Sveikata“, 21, 5 (77), 74–80.
48
8. Jankauskien÷, R., Griciūt÷, A., Vizbarait÷, D., Visagurskien÷, K.,
Pajaujien÷, S., Miežien÷, B. (2011). Paauglių kūno vertinimo, nerimo d÷l
socialinio išvaizdos pri÷mimo ir kūno suvokimo ryšys su mankštinimosi
dažniu. Visuomen÷s sveikata. Vilnius : Higienos institutas, 3 (54), 97–106.
9. Visagurskien÷, K., Jankauskien÷, R., Vizbarait÷, D., Pajaujien÷, S.,
Griciūt÷, A. (2012). The relationships between maturation, physical
activity and objectified body consciousness in the sample of adolescents.
Ugdymas. Kūno kultūra. Sportas. Kaunas : Lietuvos kūno kultūros
akademija, 1 (84), 70–76.
10. Griciūt÷, A., Jankauskien÷, R., Visagurskien÷, K., Vizbarait÷, D.,
Pajaujien÷, S. (2011). Sąsajų tarp 9 klasių mokinių psichinio atsparumo ir
fizinio aktyvumo laisvalaikio metu ypatumai. Visuomen÷s sveikata. Vilnius
: Higienos institutas, 3 (54), 87–96.
11. Vizbarait÷, D., Jankauskien÷, R., Griciūt÷, A., Visagurskien÷, K.,
Pajaujien÷, S. (2011). Evaluation of nutrition habits of adolescents in the
aspect of gender and physical activity. Ugdymas. Kūno kultūra. Sportas.
Kaunas : Lietuvos kūno kultūros akademija, 2 (81), 52–58.
Dissertation results approved by giving presentations in national and
international conferences
1. Pajaujien÷, S., Jankauskien÷, R. (2011). Ar socialin÷-kultūrin÷ aplinka ir
nepasitenkinimas savo kūnu gali motyvuoti paauglius sveikesnei
gyvensenai? V nacionalin÷ doktorantų mokslin÷ konferencija „Mokslas –
sveikatai“ [elektroninis išteklius] : 2012 m. balandžio 11 d. :
Konferencijos tezių rinkinys / Lietuvos sveikatos mokslų universitetas.
Kaunas : Lietuvos sveikatos mokslų universitetas, p. 23–24/75.
2. Pajaujien÷, S., Jankauskien÷, R. (2012). Body dissatisfaction and
unhealthy weight control behaviour among athletes and non-athletes
teenagers. Do they need education? Current Issues and New Ideas in Sport
Science [elektroninis išteklius] : 5th Baltic Sport Science Conference :
Abstracts, Kaunas, 18–19 April 2012. Kaunas : Lietuvos kūno kultūros
akademija, p. 160.
49
3. Pajaujien÷, S., Jankauskien÷, R. (2011).. Paauglių vaikinų socialinių-
kultūrinių išvaizdos vertybių pri÷mimas, raumeningumo siekimas:
susijusių veiksnių analiz÷. Sportininkų rengimo valdymas ir sportininkų
darbingumą lemiantys veiksniai : Treniravimo mokslo katedros mokslin÷
konferencija : pranešimų tez÷s, Kaunas, 2011 m. gruodžio 20 d. Kaunas :
Lietuvos kūno kultūros akademija, p. 30–31.
4. Pajaujien÷, S., Jankauskien÷, R. (2011). The relationships between
addictions, exercising, weight reduction behaviour and risk of eating
disorders in the sample of 11th students. Acta Kinesiologiae Universitatis
Tartuensis=Abstracts of the Fourth Baltic Conference in Exercise and
Sport Sciences, Tartu, Estonia, 7–9 April, 2011. Tartu : University of
Tartu., vol. 16 (Supplement), p. 119.
5. Pajaujien÷, S., Jankauskien÷, R. (2010). Paauglių požiūris į valgymą bei
mankštinimąsi kontroliuojant kūno masę. Mokslas – žmonių sveikatai :
3-ioji nacionalin÷ mokslin÷ konferencija : pranešimų tez÷s / Kauno
medicinos universitetas, Kaunas, 2010 m. balandžio 7 d. Kaunas : Kauno
medicinos universitetas, p. 34.
6. Jankauskien÷, R., Pajaujien÷, S. (2010). The relationships between body
image, risk of eating disorders, physical activity and unhealthy physical
activity behaviour in the sample of the 11th graders. 20th IUHPE World
Conference on Health Promotion "Health, Equity and Sustainable
Development" : Abstracts (Parallel and Poster Sessions), Geneva,
Switzerland, 11th–15th July, 2010. b.v., p. 1951.
7. Pajaujien÷, S., Jankauskien÷, R. (2009). Sveikatai žalinga svorio kontrol÷s
ir fizinio aktyvumo elgsena bei risk of eating disorders tarp Kauno miesto
paauglių. Sportininkų rengimo valdymas ir sportininkų darbingumą
lemiantys veiksniai : Individualių sporto šakų katedros mokslin÷
konferencija, skirta LKKA 75-mečiui ir Plaukimo sporto baz÷s 50-mečiui,
Kaunas, 2009 m. gruodžio 4 d. Kaunas : Lietuvos kūno kultūros
akademija, p. 20–21.
8. Pajaujien÷, S., Jankauskien÷, R. (2008). Effect of fitness centres
environment for the behaviour of women engaged in sport and their
50
attitude to their bodies. Sporto mokslo dabartis ir naujosios
id÷jos=Current Issues and New Ideas in Sport Science [elektroninis
išteklius] : II tarptautin÷ mokslin÷ konferencija : pranešimų tez÷s,
Kaunas, 2008 m. spalio 16–17 d. Kaunas : Lietuvos kūno kultūros
akademija, p. 96.
9. Pajaujien÷, S. (2008). Studenčių savo kūno mas÷s vertinimo ir kūno mas÷s
kontrol÷s elgsenos ryšys. Kūno kultūra ir sportas universitete-
2008=Physical Culture and Sport in Universities 2008 : tarptautin÷s
konferencijos pranešimų medžiaga / Kauno technologijos universitetas.
Kaunas : Technologija, p. 169–171.
10. Pajaujien÷, S. (2008). The adequacy of body weight evaluation in women
involved in leisure fitness activity. Acta Kinesiologiae Universitatis
Tartuensis=Abstracts of the First Baltic Conference in Exercise and
Sports Sciences and the First Baltic Conference of Young Scientists in
Exercise and Sport Sciences, Tartu, Estonia, 7–10 May 2008. Tartu :
University of Tartu., vol. 13 (Supplement) p. 47–48.
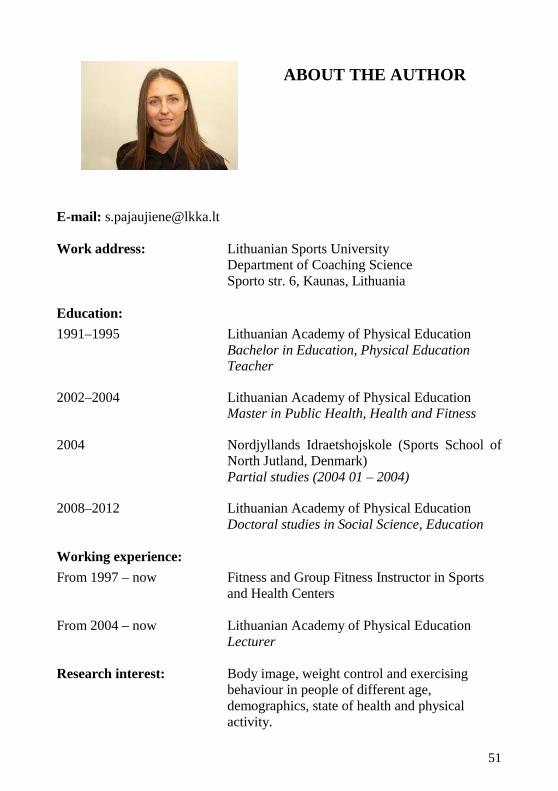
51
ABOUT THE AUTHOR
E-mail: [email protected] Work address: Lithuanian Sports University Department of Coaching Science Sporto str. 6, Kaunas, Lithuania Education:
1991–1995 Lithuanian Academy of Physical Education Bachelor in Education, Physical Education
Teacher 2002–2004 Lithuanian Academy of Physical Education Master in Public Health, Health and Fitness 2004 Nordjyllands Idraetshojskole (Sports School of
North Jutland, Denmark) Partial studies (2004 01 – 2004) 2008–2012 Lithuanian Academy of Physical Education Doctoral studies in Social Science, Education Working experience:
From 1997 – now Fitness and Group Fitness Instructor in Sports and Health Centers
From 2004 – now Lithuanian Academy of Physical Education Lecturer Research interest: Body image, weight control and exercising
behaviour in people of different age, demographics, state of health and physical activity.