Embed Size (px)
Citation preview

HB
S T
rain
ing
- IT
So
luti
ons
PlanWeb Intermediate

PlanWeb Copyright IT Solutions 2006
Page 1
CONTENTS Logging on to the system........................................................................................................................3 The PlanWeb Window.............................................................................................................................5
The Tool Bar........................................................................................................................................6 The Status Bar.....................................................................................................................................6 The Map Window.................................................................................................................................6 The Information Window......................................................................................................................7
Changing the size of the Information Window .................................................................................7 Zooming and Panning .............................................................................................................................9
Zooming with the Toolbar Buttons.......................................................................................................9 Zooming with the Status Bar .............................................................................................................12 Panning with the Toolbar...................................................................................................................13 Panning with the Status Bar ..............................................................................................................14
Using the Information Tools ..................................................................................................................15 Changing the Geoset ............................................................................................................................16 Changing the Base Map........................................................................................................................17 Address Search.....................................................................................................................................19
The Address Picker ...........................................................................................................................20 Copying Search Results to the Clipboard......................................................................................22
Partial Address Search......................................................................................................................24 Wildcard Search ................................................................................................................................26
Working with Layers..............................................................................................................................28 The Annotation Layer ........................................................................................................................28
Adding Annotations........................................................................................................................29 Layer Manager ..................................................................................................................................36
Adding and Removing Map Layers................................................................................................37 Re-ordering Layers ........................................................................................................................39 Layer Properties.............................................................................................................................40
Scale Printing ........................................................................................................................................42 Map Pins ...............................................................................................................................................46 Thematic Mapping.................................................................................................................................48
Creating a Thematic Map ..................................................................................................................48 Modifying a Thematic Map ................................................................................................................50 Removing a Thematic Map ...............................................................................................................51 Types of Thematic Map.....................................................................................................................52
Metadata Search...................................................................................................................................53 Using the Help Screens ........................................................................................................................56 Appendix 1 – Toolbar Buttons...............................................................................................................57

PlanWeb Copyright IT Solutions 2006
Page 2
Appendix 1 – Toolbar Buttons...............................................................................................................58 Selection, Movement and Measurement tools (Green) .................................................................58 Information Tools (Yellow) .............................................................................................................58 Edit and Annotation Tools (Blue) ...................................................................................................59 Window Tools (Purple)...................................................................................................................59 Miscellaneous Tools (Orange).......................................................................................................60
Appendix 2 – The Status Bar ................................................................................................................61
PlanWeb Copyright IT Solutions 2006
Page 3
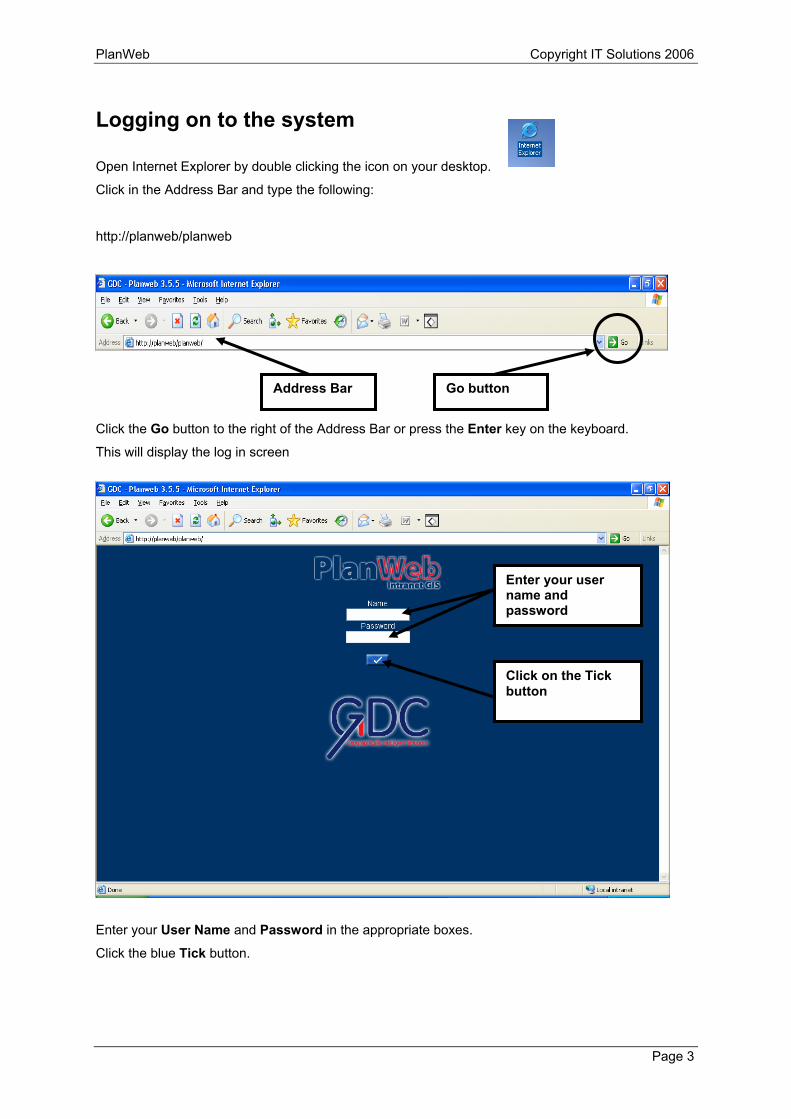
Logging on to the system
Open Internet Explorer by double clicking the icon on your desktop.
Click in the Address Bar and type the following:
http://planweb/planweb
Click the Go button to the right of the Address Bar or press the Enter key on the keyboard.
This will display the log in screen
Enter your User Name and Password in the appropriate boxes.
Click the blue Tick button.
Address Bar Go button
Enter your user name and password
Click on the Tick button

PlanWeb Copyright IT Solutions 2006
Page 4
You will now be asked to select a Geoset. This is a collection of map layers, and each layer contains a specific aspect of the landscape, for example rivers, roads, buildings, street lights and so on. These layers are then laid on top of each other, like OHP transparencies, to show the completed map.
Using Geosets saves you time because you don’t have to open each layer individually and arrange them by hand. Your Administrator will create your Geosets for you.
Select the Geoset you want to display from the drop-down list.
Click the blue Tick button.
Select the Geoset you want to use
Click on the Tick button

PlanWeb Copyright IT Solutions 2006
Page 5
The PlanWeb Window
After a few seconds, the PlanWeb window will display and will look similar to the one shown below:
There are four main components to the PlanWeb window:
Toolbar
Status Bar
Map Window
Information Window
Information Window
Toolbar
Map Window
Status Bar

PlanWeb Copyright IT Solutions 2006
Page 6
The Tool Bar The toolbar is displayed at the top of the screen and consists of 5 colour coded sections. Your Administrator will give you access to the tools you need for your job role, so you may not see the full set of buttons when you log on.
A full description of all the buttons can be found in Appendix 1 at the back of this manual.
The Status Bar The Status Bar is displayed at the bottom of the screen and shows you what is happening in the PlanWeb window. It is updated continuously during the current PlanWeb session. A full description of all the tools can be found in Appendix 2 at the back of this manual.
The Map Window
The Map Window displays all currently selected and visible layers.

PlanWeb Copyright IT Solutions 2006
Page 7
The Information Window The Information Window has fifteen panels (tabs). The information displayed will change according to which panel you are using. For instance, it can display the results of queries, print options and an address search.
Your Administrator will give you access to the panels you need for your job role, so you may not see the full set of panels shown here.
Changing the size of the Information Window You can change the width of the Information Window by using the Window tools on the toolbar.
Click the Maximise button.
The Information Window widens:
Click the Reset button to set the Information Window back to the default size.
Maximise button
Reset button

PlanWeb Copyright IT Solutions 2006
Page 8
To make the Information Window smaller, click the Minimise button.
Note that the map window stays at its original size.
Click the Fit Map button to fit the current map to the space available.
Minimise button Fit Map button

PlanWeb Copyright IT Solutions 2006
Page 9
Zooming and Panning
Zooming with the Toolbar Buttons
When you first log in to PlanWeb, the map is displayed at a preset scale. You can zoom in or out of the window, depending on how much detail you need to see.
To zoom in, click once with the left mouse button on the Zoom In tool.
Note: the Map Tool area on the Status Bar shows the currently select tool.
Click on the area of the map that you want to zoom in to.
Click the Zoom In tool
Click on the point you want to zoom in to
Map tool shows currently selected tool

PlanWeb Copyright IT Solutions 2006
Page 10
The map will be redrawn at a smaller, more detailed scale. The point you clicked will be at the centre of the map window.
You can also select a specific area on the map to zoom in to.
Click once with the left mouse button on the Zoom In tool.
Hold down the left mouse button and drag diagonally to select an area of the map.
Drag diagonally over the area you want to zoom in to
Click the Zoom In tool
PlanWeb Copyright IT Solutions 2006
Page 11
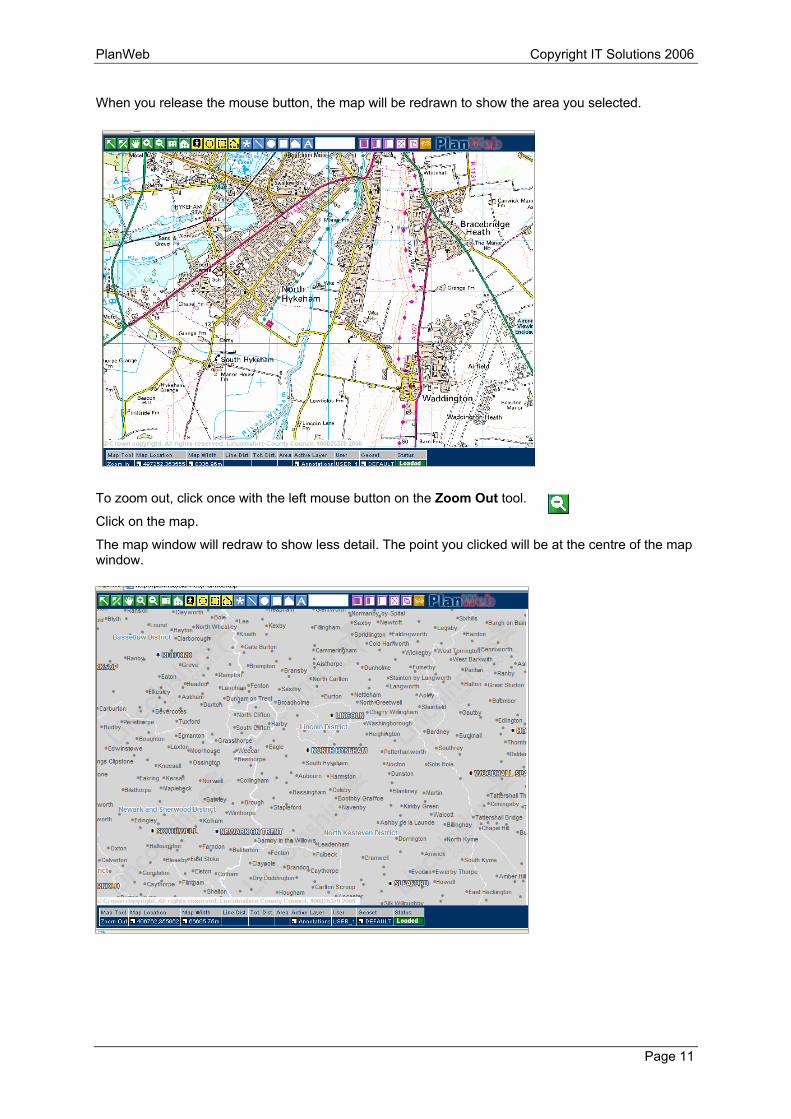
When you release the mouse button, the map will be redrawn to show the area you selected.
To zoom out, click once with the left mouse button on the Zoom Out tool.
Click on the map.
The map window will redraw to show less detail. The point you clicked will be at the centre of the map window.

PlanWeb Copyright IT Solutions 2006
Page 12
Zooming with the Status Bar You can also use the Status Bar to set the level of zoom.
Click the Menu button to the left of the Map Width text.
This will open the Scale Picker window:
Click one of the pre-set map widths, or type a custom width (in metres) in the Option 2 box.
Click the blue Tick button to redraw the map.
Click Menu button
Select a preset map width
Or type a custom width
Click the blue Tick

PlanWeb Copyright IT Solutions 2006
Page 13
Panning with the Toolbar The Pan tool lets you move the map around in the map window so you can view other areas that are not currently displayed.
Click once on the Pan tool with the left mouse button.
Move your mouse over the map – your mouse pointer will look like a four headed arrow.
Hold down your left mouse button and drag the window around the screen.
You will see blank areas around the map as you drag.
When you release your mouse button, the map will be redrawn and the blank areas filled in.
Click the Pan tool
Drag the map window
Map has been moved up and left

PlanWeb Copyright IT Solutions 2006
Page 14
Panning with the Status Bar You can also use the Status Bar to re-centre the map and set the level of zoom.
Click the Menu button to the left of the Map Location text.
The Map Location button shows the X and Y coordinates of the centre of the map window.
This will open the Recentre Map window.
Enter the new map centre coordinates in the Easting/Northing boxes.
You can also reset the map width (in metres) from here if you wish.
Click the blue Tick button to redraw the map.
Click Menu button
Type new coordinates
Type new map width if necessary
Click the blue Tick
PlanWeb Copyright IT Solutions 2006
Page 15
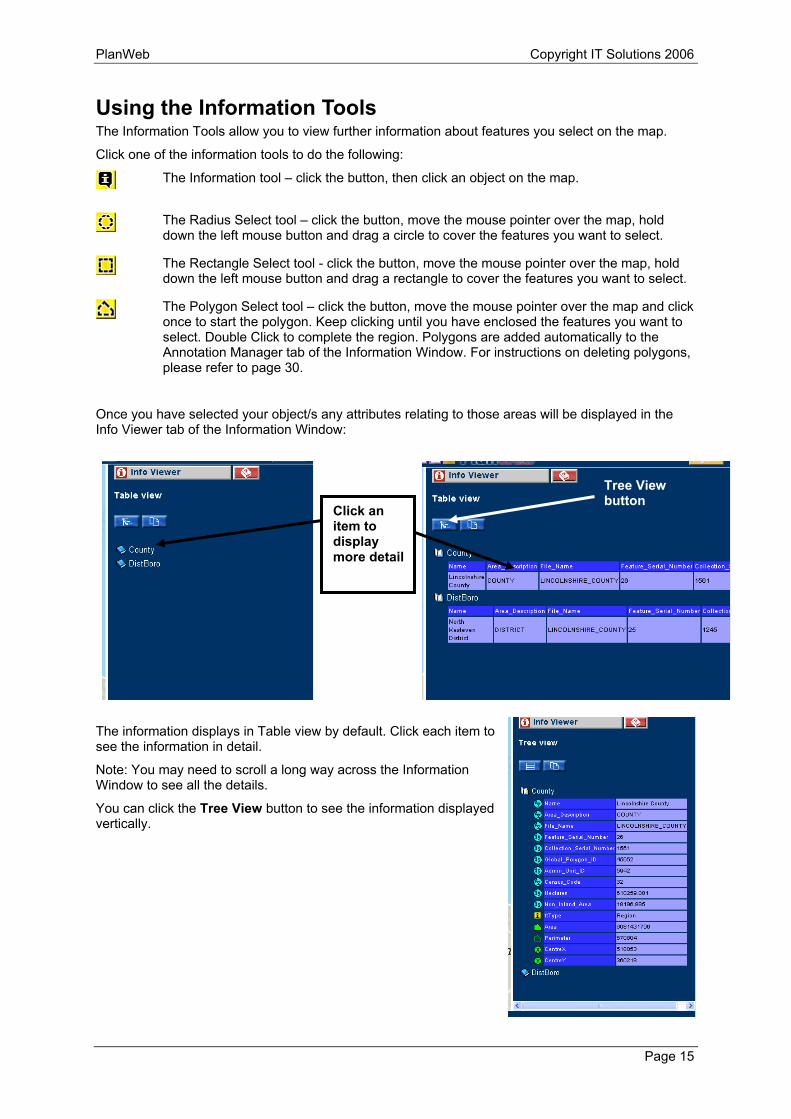
Using the Information Tools The Information Tools allow you to view further information about features you select on the map.
Click one of the information tools to do the following:
The Information tool – click the button, then click an object on the map.
The Radius Select tool – click the button, move the mouse pointer over the map, hold down the left mouse button and drag a circle to cover the features you want to select.
The Rectangle Select tool - click the button, move the mouse pointer over the map, hold down the left mouse button and drag a rectangle to cover the features you want to select.
The Polygon Select tool – click the button, move the mouse pointer over the map and click once to start the polygon. Keep clicking until you have enclosed the features you want to select. Double Click to complete the region. Polygons are added automatically to the Annotation Manager tab of the Information Window. For instructions on deleting polygons, please refer to page 30.
Once you have selected your object/s any attributes relating to those areas will be displayed in the Info Viewer tab of the Information Window:
The information displays in Table view by default. Click each item to see the information in detail.
Note: You may need to scroll a long way across the Information Window to see all the details.
You can click the Tree View button to see the information displayed vertically.
Click an item to display more detail
Tree View button
PlanWeb Copyright IT Solutions 2006
Page 16
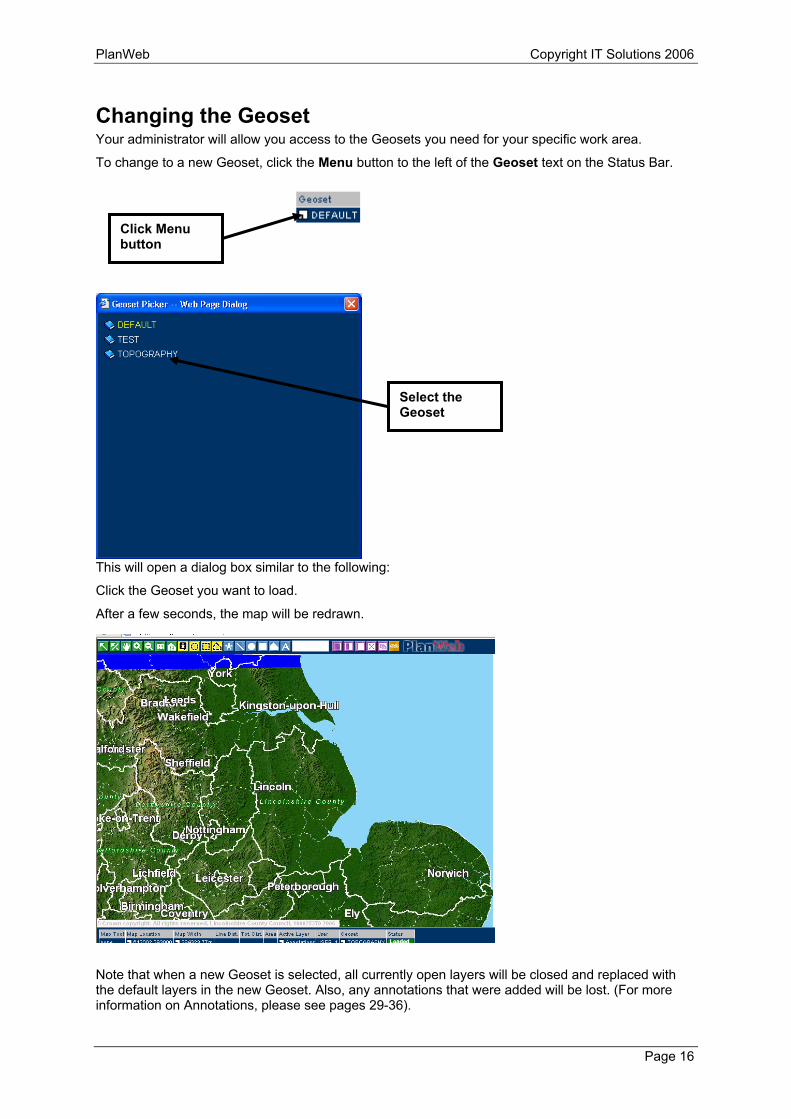
Changing the Geoset Your administrator will allow you access to the Geosets you need for your specific work area.
To change to a new Geoset, click the Menu button to the left of the Geoset text on the Status Bar.
This will open a dialog box similar to the following:
Click the Geoset you want to load.
After a few seconds, the map will be redrawn.
Note that when a new Geoset is selected, all currently open layers will be closed and replaced with the default layers in the new Geoset. Also, any annotations that were added will be lost. (For more information on Annotations, please see pages 29-36).
Click Menu button
Select the Geoset

PlanWeb Copyright IT Solutions 2006
Page 17
Changing the Base Map Base maps are similar to Geosets in that they can be built up from a number of different map layers. Usually, however, they are fairly simple and just consist of a background layer like an aerial photo or a street map.
Unlike when you change a Geoset, when you select a new base map, all map layers that were part of the previous base map are removed but any user-added map layers and annotations are retained.
To change the base map, click the Menu button in the Information Window.
Select Base Map Picker from the list.
Select a new Base Map.
Select Base Map Picker
Click Menu button
Select a new Base map

PlanWeb Copyright IT Solutions 2006
Page 18
After a few seconds, the map will redraw. Note: depending on the current Geoset, you may need to zoom in before the new base map is visible.

PlanWeb Copyright IT Solutions 2006
Page 19
Address Search The Address Search tab in the Information Window is used to find the address of a property. Once the address has been found, the location will be shown in the Map window.
To access the correct tab, click the Menu button at the top of the information window.
Select Address Search from the list.
After a few seconds the Address Search tab will display.
The tab allows you to search in three different ways:
Address Picker
Partial Address Search
Wildcard Search
Click the Menu button
Select Address Search
Three tools are available for searching
PlanWeb Copyright IT Solutions 2006
Page 20
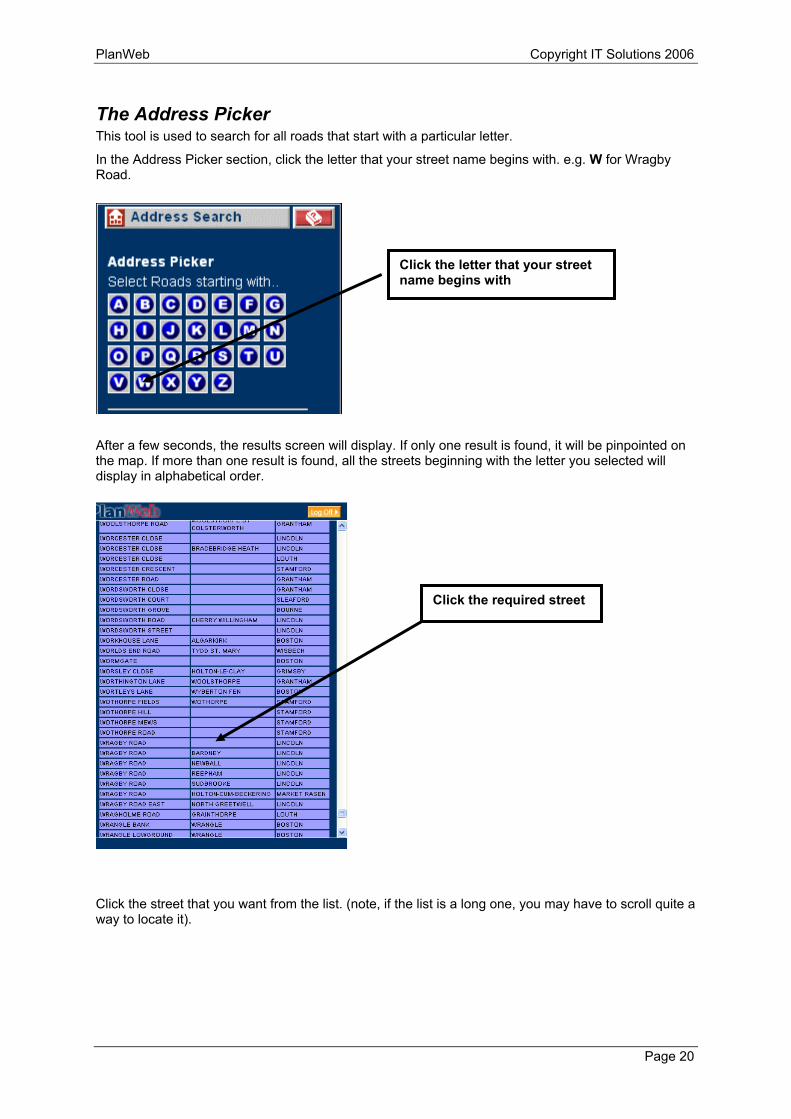
The Address Picker This tool is used to search for all roads that start with a particular letter.
In the Address Picker section, click the letter that your street name begins with. e.g. W for Wragby Road.
After a few seconds, the results screen will display. If only one result is found, it will be pinpointed on the map. If more than one result is found, all the streets beginning with the letter you selected will display in alphabetical order.
Click the street that you want from the list. (note, if the list is a long one, you may have to scroll quite a way to locate it).
Click the letter that your street name begins with
Click the required street

PlanWeb Copyright IT Solutions 2006
Page 21
You will now see a list of addresses on that street. Note that house names are listed before house numbers.
Select the property you want to view. The map will redraw and re-centre on the address you have chosen. Your property will be indicated by a small triangle
Select the property you want to view
Map re-centres on selected property

PlanWeb Copyright IT Solutions 2006
Page 22
Copying Search Results to the Clipboard You can copy the table of search results to the Clipboard if you want to paste them into a program such as Excel.
When the search results screen is displayed, click the Copy to Clipboard button at the top of the Information Window.
A confirmation window will display.
Note: this only copies the visible results shown on screen.
Click the blue Tick button to continue.
Click Copy to Clipboard button
Click blue Tick button to continue

PlanWeb Copyright IT Solutions 2006
Page 23
Start the program that you want to use to view the results.
Click the Paste button.
The image below shows the data pasted into Microsoft Excel.
Close the program when you have finished to return to PlanWeb.

PlanWeb Copyright IT Solutions 2006
Page 24
Partial Address Search If you want to search for something other than a road, e.g. a house number or postal code, the Partial Address Search section allows you to search for any part of a full address.
In the Partial Address Search section, enter your search criteria in the boxes provided.
You don’t have to complete all of the box – for instance, if 12 is entered in the Postcode box, all postcodes that contain that number will be found.
You can select the And option to find addresses that must match all of your criteria
You can select the Or option to find addresses that can match any of your criteria.
Click the blue Tick button to start your search.
After a few seconds, the results screen will display. If only one result is found, it will be pinpointed on the map. If more than one result is found, all the properties that match the criteria you entered will display in alphabetical order.
The information window will display a list of results similar to the following:
Enter your search criteria in the boxes provided
Select And or Or
Click the blue Tick button
Click the address you want to view

PlanWeb Copyright IT Solutions 2006
Page 25
You can copy this list to the clipboard by using the procedures described on pages 21 and 22.
If more than 50 results are found, you will need to use the following navigation buttons to move through the results pages:
Go to first page of results
Go to last page of results
Go to previous page of results
Go to next page of results
If you want to go to a specific page of results, click the binoculars button.
This will open a small window where you can enter your page number.
Click the blue Tick button to display your results
Select the property you want to view. The map will redraw and re-centre on the address you have chosen. Your property will be indicated by a small triangle
Click the red Back button to re-display the Search screen.
Enter the page number then click the blue Tick
Map re-centres on selected property
Click the Back button to return to the Search screen

PlanWeb Copyright IT Solutions 2006
Page 26
Wildcard Search You can search the whole of the address database to find a match for anything that you type into the Wildcard Search box. This is useful if you only know a single word or part of a word in an address.
In the Wildcard Search section, enter your search criteria in the text box.
Click on the blue Tick button to start the search.
After a few seconds, the results screen will display. If only one result is found, it will be pinpointed on the map. If more than one result is found, all the properties that match your criteria will be displayed.
You can copy this list to the clipboard by using the procedures described on pages 21 and 22.
If more than 50 results are found, you will need to use the navigation buttons to move through the results pages.
Enter your search criteria

PlanWeb Copyright IT Solutions 2006
Page 27
Select the property you want to view. The map will redraw and re-centre on the address you have chosen. Your property will be indicated by a small triangle.
Click the red Back button to re-display the Search screen.
Map re-centres on selected property

PlanWeb Copyright IT Solutions 2006
Page 28
Working with Layers A layer generally contains information about a single type of feature. For example, in a standard road map, there may be individual layers for motorways, A roads, B roads, rivers and woodland. The order in which these layers are arranged will affect the way the road map will look. When all the layers are arranged on top of each other in the appropriate order, the result is a complete map. However, if the layers are poorly organised, information can be lost from the map.
The map layers in your Geoset are normally displayed in the most appropriate order, with the most opaque layer displayed at the bottom. However, you can move or hide layers if you wish.
The Annotation Layer The Annotation layer is always the topmost layer and is used as a temporary drawing layer. The Layer also displays the annotations marked as a result of an address search. These annotations cannot be saved.
There are four types of annotations that you can use:
Symbols. Used to mark points in the map window with a designated symbol.
Polylines. Used to create lines or boundaries in the map window.
Regions. Used to create circles, lines or polygons in the map window.
Text tools. Used to create labels in the map window.
Each annotation you add to the Annotation Layer can be viewed on the Annotation Manager tab of the Information Viewer.
To access the correct tab, click the Menu button at the top of the information window.
Click the Menu button
Select Annotation Manager

PlanWeb Copyright IT Solutions 2006
Page 29
You will see a window similar to the following:
Adding Annotations You can only usually only add Annotations to the Annotation Layer. However, if your administrator has given you Edit permissions to a layer, you can use the Line, Region and Point tools on that layer as well.
Points To create a point on the map, select the Add Symbol button from the toolbar.
Click on the area of the map that you want to mark.
A small black star will appear on the map and the properties for the feature you added will display in the Annotation Manger tab of the Information window.
Click the symbol tool then click on the map
Properties for the symbol. These can be edited if you wish.

PlanWeb Copyright IT Solutions 2006
Page 30
Each point annotation you add will have the following options:
Re-centres the map window on this annotation
Removes this annotation from the map window
Allows you to set the size of the annotation. Click in the box below this label and enter the size. The larger the number, the larger the symbol.
Allows you to set the foreground colour of the annotation. Click the colour swatch below this label to open the colour picker. Select the colour you want to use.
Allows you to set the symbol for the annotation. Click the symbol below this text box to open the symbol picker. Select the symbol you want to use.
Allows you to set the background colour of the annotation. Click the colour swatch below this label to open the colour picker. Select the colour you want to use.
Allows you to enter notes about a point annotation. This also helps you identify the different points you have added to the map. Click the box below this label and enter your text.
Once you have made changes to the properties you need to click the blue Tick button at the top of the Information window to accept your changes.
You can remove all annotations by clicking the Delete All Annotations button at the top of the window.
Make any required changes
Click the blue Tick to accept changes
Deletes all annotations

PlanWeb Copyright IT Solutions 2006
Page 31
Lines To create a point on the map, select the Draw Polyline button from the toolbar.
Click on the map to start the line.
Move the mouse on the map. Each additional click will add another section to the line.
Double click on the map to finish.
A black line will appear on the map and the properties for the feature you added will display in the Annotation Manger tab of the Information window.
Each line annotation you add will have the following properties.
Re-centres the map window on this annotation
Removes this annotation from the map window
Allows you to set the style of the line. Click in the box below this label to open the Line Picker. Click the style of line you want to use.
Allows you to set the width of the line. Click in the box below this label to open the width picker. Select the width of line you want to use.
Allows you to set the line colour. Click the colour swatch below this label to open the colour picker. Select the colour you want to use.
Allows you to view the length of the line. You cannot edit this value
Allows you to enter notes about a line annotation. This also helps you identify the different lines you have added to the map. Click the box below this text and enter your text.
Click the blue Tick button at the top of the window to save your changes.
Click the Draw Polyline tool then click on the map. Double click to complete the line
Properties for the symbol. These can be edited if you wish.

PlanWeb Copyright IT Solutions 2006
Page 32
Regions To create a region on the map, select the one of the region tools from the toolbar.
To create a circle, click the Draw Circle tool then hold down the left mouse button and drag diagonally over the map. When you release the mouse button, a you will see a prompt appear to confirm the radius of the circle – you can edit this value if you wish.
Click the blue Tick button to complete.
To create a rectangle, click the Draw Rectangle tool, then hold down the left mouse button and drag diagonally over the map. Release the mouse button when you have finished.
To create a polygon, click the Draw Polygon tool, then click on the map to start the shape. Each additional click will add a new section to the polygon. Double click to finish.
Each region you create will be added to the Annotation Manger tab of the Information window.
Properties for the regions. These can be edited if you wish.
Edit the value displayed if necessary, then click the blue Tick button
Click one of the region tools then add to the map

PlanWeb Copyright IT Solutions 2006
Page 33
Each Region you add will have the following properties:
Re-centres the map window on this annotation
Removes this annotation from the map window
Allows you to set the border style of the region. Click in the box below this label to open the Line Picker. Click the style of line you want to use.
Allows you to set the width of the border. Click in the box below this label to open the width picker. Select the width of border you want to use.
Allows you to set the border colour. Click the colour swatch below this label to open the colour picker. Select the colour you want to use.
Allows you to set the fill pattern for the region. Click the box below this label to open the pattern picker. Select the pattern you want to use
Allows you to set the fill colour for the region. Click the colour swatch below this label to open the colour picker. Select the colour you want to use. Note: if you set the fill pattern to N, the foreground colour will not display
Allows you to view the area of the region. You cannot edit this value
Allows you to enter notes about a region annotation. This also helps you identify the different regions you have added to the map. Click the box below this label and enter your text.
Click the blue Tick button at the top of the window to save your changes.
PlanWeb Copyright IT Solutions 2006
Page 34
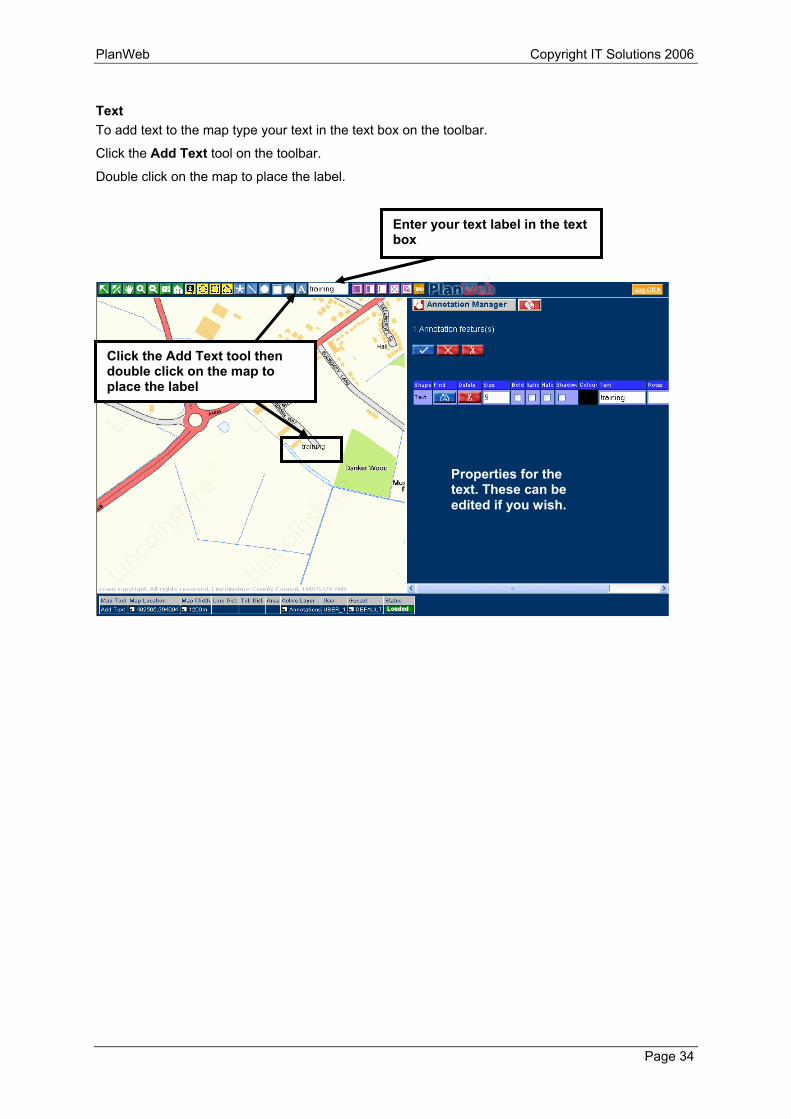
Text To add text to the map type your text in the text box on the toolbar.
Click the Add Text tool on the toolbar.
Double click on the map to place the label.
Enter your text label in the text box
Click the Add Text tool then double click on the map to place the label
Properties for the text. These can be edited if you wish.

PlanWeb Copyright IT Solutions 2006
Page 35
Each text box that you add will have the following properties:
Re-centres the map window on this annotation
Removes this annotation from the map window
Allows you to set the size of the text. Click in the box below this text box and enter the text size. The larger the number, the larger the text.
Allows you to make the text bold. Click the tick box under this label to turn this option on.
Allows you to make the text italic. Click the tick box under this label to turn this option on.
Allows you to add a halo to the text. Click the tick box under this label to turn this option on.
Allows you to add a shadow to the text. Click the tick box under this label to turn this option on.
Allows you to change the colour of the text. Click the colour swatch under this label to open the colour picker. Select the colour you want to use.
Allows you to change the wording of the text. Click the box below this label and enter the new text.
Allows you to enter notes about the text annotation. This also helps you identify the different text annotations you have added to the map. Click the box below this label and enter your text.
Click the blue Tick button at the top of the window to save your changes.
PlanWeb Copyright IT Solutions 2006
Page 36
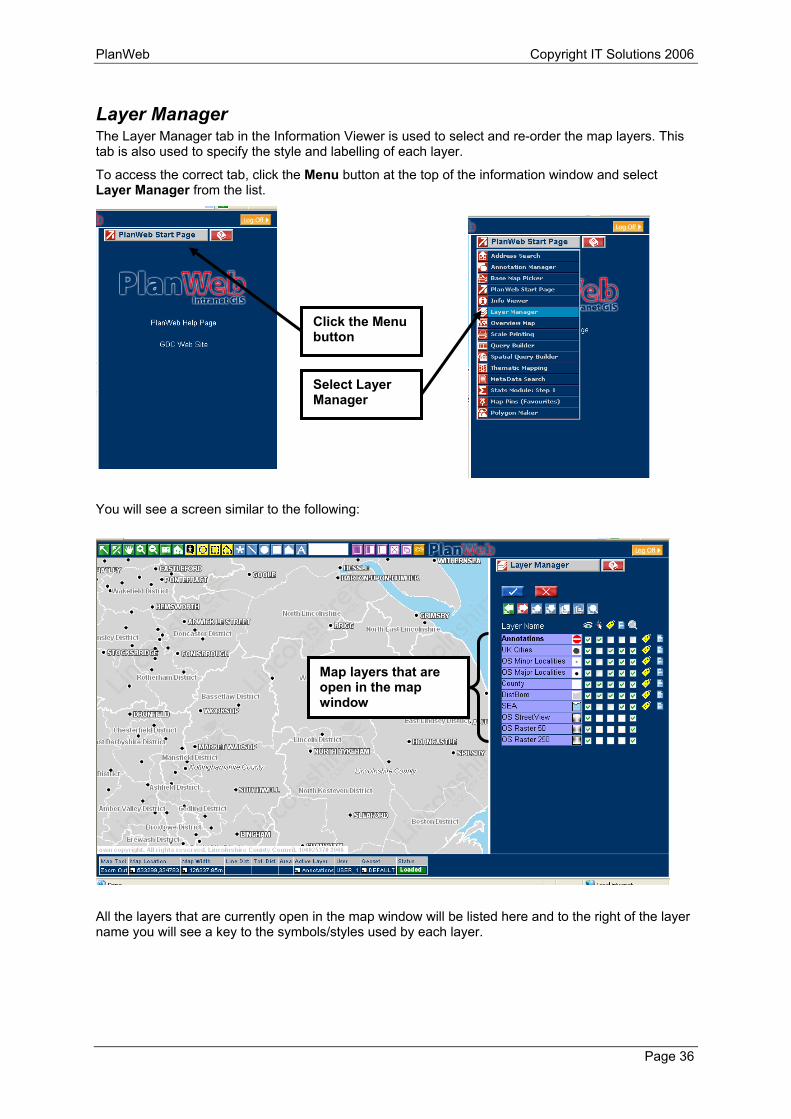
Layer Manager The Layer Manager tab in the Information Viewer is used to select and re-order the map layers. This tab is also used to specify the style and labelling of each layer.
To access the correct tab, click the Menu button at the top of the information window and select Layer Manager from the list.
You will see a screen similar to the following:
All the layers that are currently open in the map window will be listed here and to the right of the layer name you will see a key to the symbols/styles used by each layer.
Click the Menu button
Select Layer Manager
Map layers that are open in the map window
PlanWeb Copyright IT Solutions 2006
Page 37
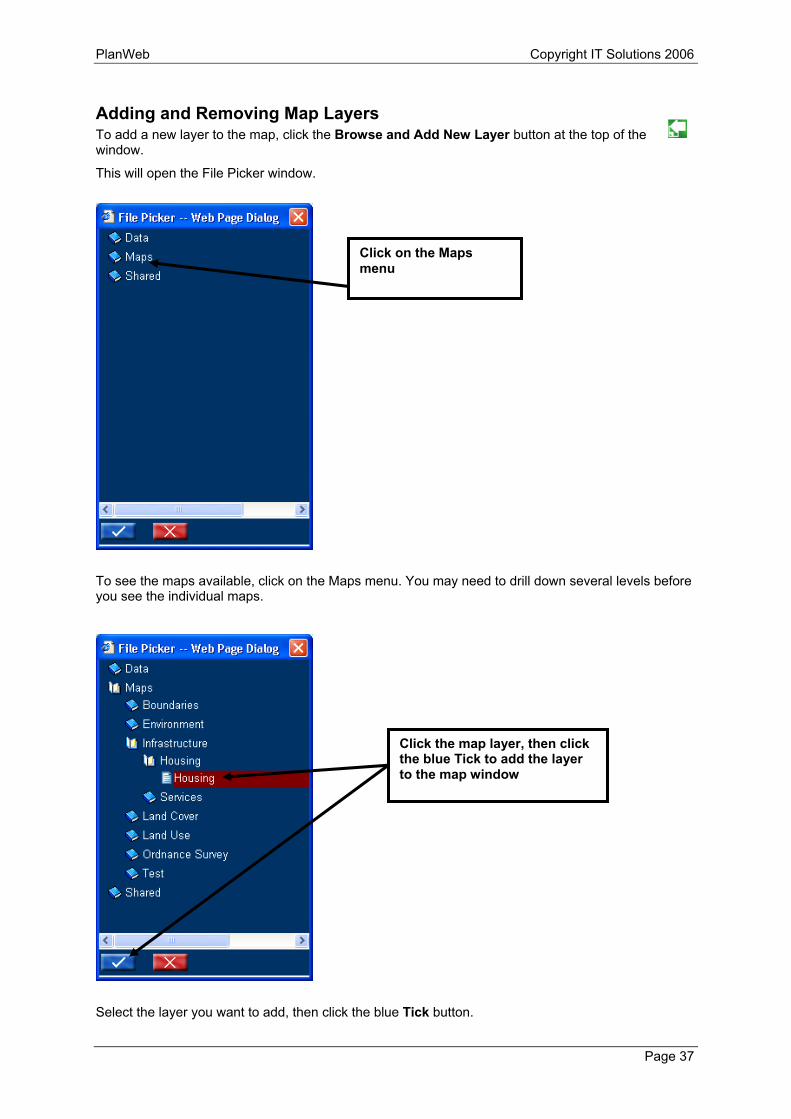
Adding and Removing Map Layers To add a new layer to the map, click the Browse and Add New Layer button at the top of the window.
This will open the File Picker window.
To see the maps available, click on the Maps menu. You may need to drill down several levels before you see the individual maps.
Select the layer you want to add, then click the blue Tick button.
Click on the Maps menu
Click the map layer, then click the blue Tick to add the layer to the map window

PlanWeb Copyright IT Solutions 2006
Page 38
After a few seconds, the map will re-draw and you will see the layer added to the Layer Manager tab of the Information Viewer and the map itself.
To remove a layer, click the layer you want to remove from the Layer Manager window.
Click the Remove Selected Layers button at the top of the window.
Click the blue Tick button at the top of the window. The screen will now redraw and the layer will be removed.
Layer added to Layer Manager and Map
Click the layer, then click the Remove Selected Layers button
Click the blue Tick

PlanWeb Copyright IT Solutions 2006
Page 39
Re-ordering Layers You can change the order of the layers if objects on upper layers are obscuring objects on the lower layers.
Click the layer/s you want to move, then click the Move Selected Layers Up/Down buttons until the layer is in the correct order.
Click the blue Tick button at the top of the window to redraw the map.
Select the layer you want to
Click Move Selected Layers Up/Down button
Click the blue Tick button

PlanWeb Copyright IT Solutions 2006
Page 40
Layer Properties Each layer in the Geoset has a number of tools that can be used to specify how the layer displays in the map window. The tools are displayed as check boxes to the right of each layer in the Layer Manager window.
The tools are as follows:
Layer is visible if box is ticked. Remove the tick to hide the layer. You can use this as an alternative to removing a layer
Layer is selectable in the map window if the box is ticked. If the box is unticked, you will not be able to use the information and selection tools to pick up information from this layer
You can add automatic labels to a layer by ticking the box. You will also need to use the Labelling tool to the right of this layer to specify the labelling style and text. For details on using this tool, please see below.
Display style for objects on this layer can be changed if the box is ticked. You will also need to use the Style Override tool to the right of this layer to specify the formatting you want to use. For details on using this tool, please see page 44.
Your administrator sets the zoom levels at which a layer is visible in the map window. This makes a map look less messy when zoomed out. Uncheck the box if you want to show all objects on the layer regardless of the level of zoom you are using
Labelling Tool To set the label properties for a selected layer, click the Labelling Tool button to the right of the layer. You must also tick the Layer Autolabel box.
This will open the Label Properties window.
Select the field you want to use for your label from the Label Field list.
Specify the formatting you want to use.
Click the blue Tick button to update the map.
The changes are temporary and will be removed when you remove the layer, or end your current session.
Select the field you want to use for the label
Set the formatting you want to use for the label
Click the blue Tick to update the map

PlanWeb Copyright IT Solutions 2006
Page 41
Style Override To modify the way objects on a layer are displayed, click the Style Override button to the right of the layer. You must also tick the Style Override box.
Specify the formatting you want to use for each object type on the layer.
Click the blue Tick button to update the map.
The changes are temporary and will be removed when you remove the layer, or end your current session.
Set the formatting you want to use for each object type on the layer
Click the blue Tick button to update the map

PlanWeb Copyright IT Solutions 2006
Page 42
Scale Printing Maps can be printed or saved as PDF files by using the Scale Printing tab in the Information Viewer window.
Your administrator will provide you with the templates you will need. You can scale the map as required.
Pan and zoom the map until you see the level of detail you require in the map window.
Click the menu button at the top of the Information Viewer window and select Scale Printing from the list.
Pan and zoom the map to the scale required
Click the menu button and select Scale Printing

PlanWeb Copyright IT Solutions 2006
Page 43
The Scale Printing tab will display
Select the template that you want to use. (These are created by your administrator and control page orientation, placement of logo etc.)
The scale of the current map window displays by default. You can edit this manually, or pick from a pre-defined set of scales.
You can re-centre the map by amending the values in the Easting and Northing boxes.
You can adjust the map with if you wish. By default, the field shows how wide (in metres) the area currently displayed in the map window is in real terms.
If you have made any changes, click the blue Tick button to re-draw the map.
The PDF Quality option lets you set the quality of the image. There are four settings: Normal, Good, Very Good and Excellent. The image will be clearer at the highest quality, but the PDF file will be larger.
Add any relevant titles.
Click the blue Print button.
Select a template
Re-scale and re-centre the map if required
Click blue Tick to re-draw the map
Set any other options
Click the blue Print button

PlanWeb Copyright IT Solutions 2006
Page 44
A new window will open that contains a printable version of the map.
Click the Print button if you want to print the map now.
IMPORTANT: The scaling of the map will automatically adjust to fit the paper size. You should select None from the Page Scaling box to ensure the scale of your map is preserved.
Click the OK button to print.
Print button
Save button
Select None
Select OK

PlanWeb Copyright IT Solutions 2006
Page 45
If you want to save the map and print it later, click the Save button.
Select the drive and folder you want to save the file in from the Save In box.
Type a name for your file in the File Name box.
Click the Save button.
Select the drive/folder you want to save the file to
Type the file name
Click the Save button

PlanWeb Copyright IT Solutions 2006
Page 46
Map Pins Map Pins function like bookmarks – they allow you to mark areas of the map so you can quickly locate them. This makes it easier to move around the map window.
To create a map pin, click the menu button at the top of the Information Viewer window and select Map Pins (Favorites) from the list.
Use the Zoom and Pan tools as necessary to display the location you want to mark.
Select Map Pins (Favorites)
Use the zoom and pan tools to display location

PlanWeb Copyright IT Solutions 2006
Page 47
Enter a name for the map pin on the Map Pins tab.
Click the blue Tick button to finish.
The new map pin will now be listed in the Map Pins tab.
The map pin actually stores the Easting/Northing in the centre of the map, together with the map width. The map layers are not saved as part of the map pin, so you can quickly jump to this location regardless of the geoset you are using.
Map pins are saved when you exit your PlanWeb session, so you don’t have to create them each time you log on.
To recall a map pin, click the Locate button to the right of the map pin.
To delete a map pin, click the Delete button to the right of the map pin.
Type a name for the map pin then click the blue Tick button.
New map pin listed
PlanWeb Copyright IT Solutions 2006
Page 48
Thematic Mapping One of the most useful functions of PlanWeb is Thematic Mapping. You can use it to analyse your data and display it in a variety of ways on a map. It enables you to spot patterns and trends that would otherwise be difficult to see.
You can create six different types of thematic maps and assign colours, patterns or symbols according to specific values in your layers. For instance, you can use Ranges to shade a map of your parishes according to population density using a series of graduated colours, with the darkest colour representing the most heavily populated area.
Although thematic maps are primarily used to analyse numeric data, you can also represent text values. The bar and pie charts can be used to analyse more than one field. The other four types can only be used with one field.
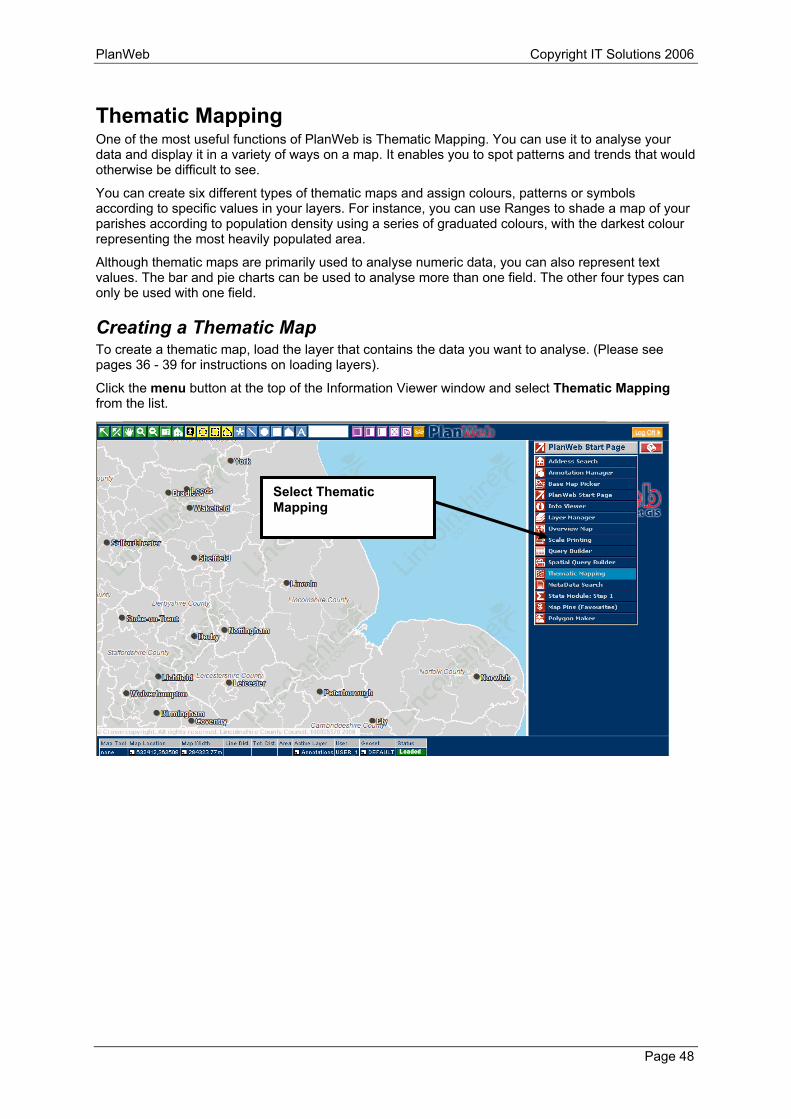
Creating a Thematic Map To create a thematic map, load the layer that contains the data you want to analyse. (Please see pages 36 - 39 for instructions on loading layers).
Click the menu button at the top of the Information Viewer window and select Thematic Mapping from the list.
Select Thematic Mapping

PlanWeb Copyright IT Solutions 2006
Page 49
Select the map layer that contains the data you want to analyse – the list contains all the layers that you have added to the map window.
Select the field that contains the data you want to map.
Select the type of thematic map you want to create. The map types that you see on the list will depend on the contents of the field you are mapping.
Here we are going to shade regions based on population data.
Click the blue Tick button to create the map.
Select the layer you want to analyse
Select the field you want to map
Select the type of map you want to create
Click the blue Tick button

PlanWeb Copyright IT Solutions 2006
Page 50
Modifying a Thematic Map Once you have created your thematic map, you can edit it by clicking the Edit Theme Properties button. The options you see will depend on the type of thematic map you have created.
The example here shows the options for modifying a Ranged thematic map.
Select any required options, then click the blue Tick button to update the map
Edit Theme Properties
Modify the options as required
Click the blue Tick button

PlanWeb Copyright IT Solutions 2006
Page 51
After a few seconds the map will redraw.
Removing a Thematic Map To remove a thematic map, click the Back button at the top of the information window.
Click the Remove Existing Thematic Map button.
Back button
Remove Existing Thematic Map
PlanWeb Copyright IT Solutions 2006
Page 52
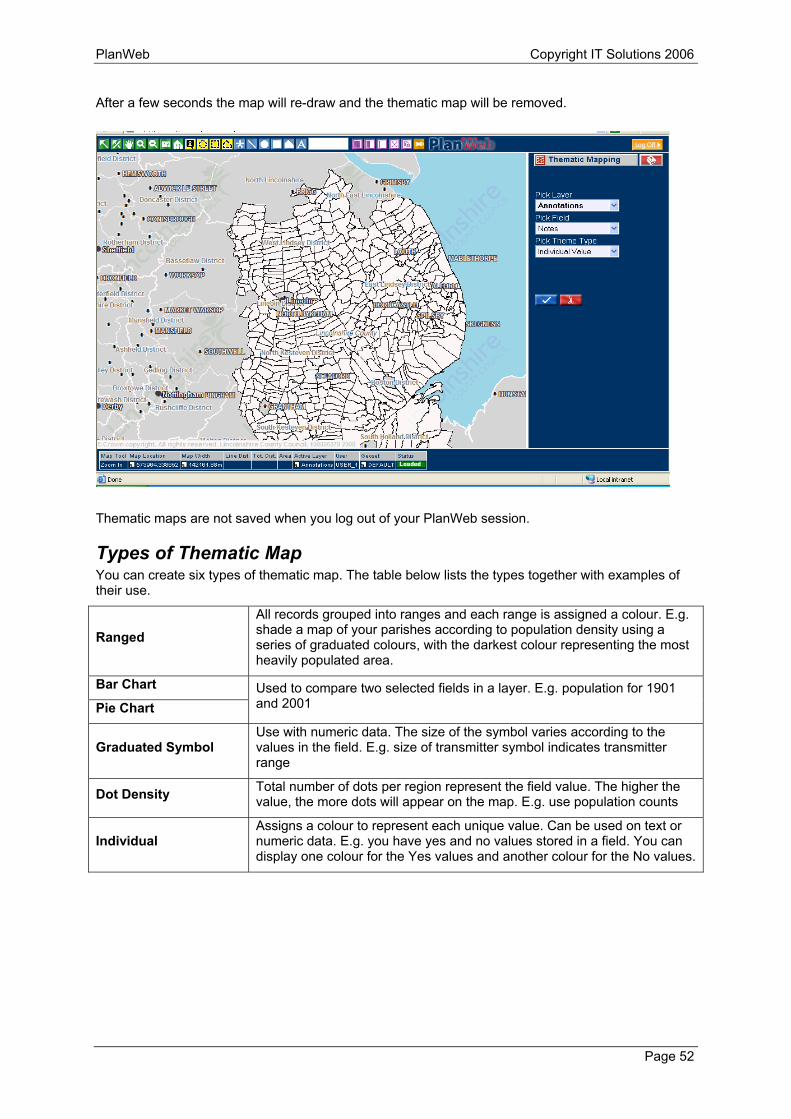
After a few seconds the map will re-draw and the thematic map will be removed.
Thematic maps are not saved when you log out of your PlanWeb session.
Types of Thematic Map You can create six types of thematic map. The table below lists the types together with examples of their use.
Ranged All records grouped into ranges and each range is assigned a colour. E.g. shade a map of your parishes according to population density using a series of graduated colours, with the darkest colour representing the most heavily populated area.
Bar Chart
Pie Chart Used to compare two selected fields in a layer. E.g. population for 1901 and 2001
Graduated Symbol Use with numeric data. The size of the symbol varies according to the values in the field. E.g. size of transmitter symbol indicates transmitter range
Dot Density Total number of dots per region represent the field value. The higher the value, the more dots will appear on the map. E.g. use population counts
Individual Assigns a colour to represent each unique value. Can be used on text or numeric data. E.g. you have yes and no values stored in a field. You can display one colour for the Yes values and another colour for the No values.

PlanWeb Copyright IT Solutions 2006
Page 53
Metadata Search Each map layer can have an associated metadata record which can provide information about the nature and scope of the layer. Your Administrator will add pre-defined keywords to the layer to help you quickly search and load the most appropriate layers to your map window. e.g. you can view and selectively load any map layers that have been tagged with the Environment metadata. You can also type your own search criteria if you wish.
To start the search, click the Menu button at the top of the Information Viewer window and select Metadata Search from the list.
Select a keyword from the list, or type your own search text.
Click the blue Tick button below the search box you have used.
Click the Menu button and select Metadata Search
Select a keyword from the list and click the blue Tick
Or type your own text and click the blue Tick
PlanWeb Copyright IT Solutions 2006
Page 54
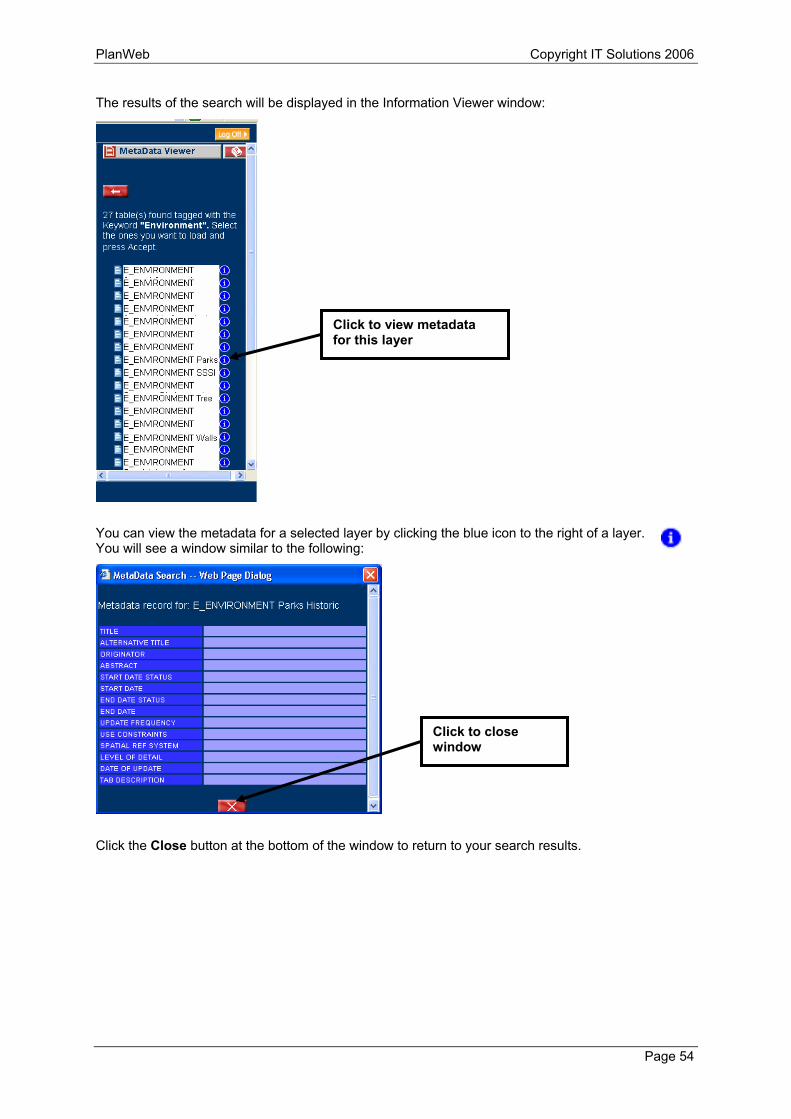
The results of the search will be displayed in the Information Viewer window:
You can view the metadata for a selected layer by clicking the blue icon to the right of a layer. You will see a window similar to the following:
Click the Close button at the bottom of the window to return to your search results.
Click to view metadata for this layer
Click to close window

PlanWeb Copyright IT Solutions 2006
Page 55
Click the layer/s that you want to add to the map window, then click the blue Tick button at the bottom of the Information Viewer window.
Note: the results screen may show layers that you do not have access to. You will be able to view the metadata, but you will not be able to load these layers.
If you want to create a new metadata search, click the Go Back button at the top of the Information viewer window.
Select the layer/s you want to add to the map window
Click the blue Tick
PlanWeb Copyright IT Solutions 2006
Page 56
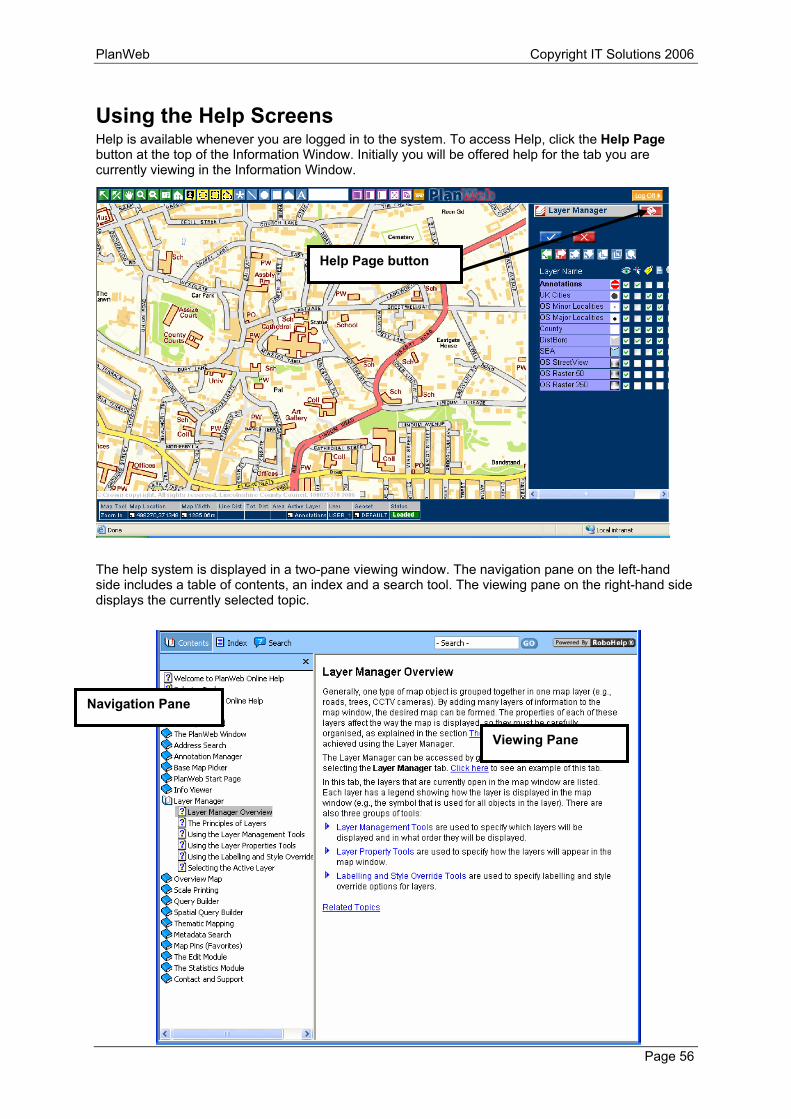
Using the Help Screens Help is available whenever you are logged in to the system. To access Help, click the Help Page button at the top of the Information Window. Initially you will be offered help for the tab you are currently viewing in the Information Window.
The help system is displayed in a two-pane viewing window. The navigation pane on the left-hand side includes a table of contents, an index and a search tool. The viewing pane on the right-hand side displays the currently selected topic.
Help Page button
Navigation Pane
Viewing Pane

PlanWeb Copyright IT Solutions 2006
Page 57
There are three tabs in the navigation pane:
Contents Lets you browse through the help topics section by section. Click a page to display the topic in the viewing pane. This is the default view.
Index Lets you scroll through the index or enter a keyword in the text box at the top of the window. Double click an entry to display the topic in the viewing pane
Search Lets search the help system by typing a word or phrase in the Search box. Click the Go button to start the search. Click an entry in the results list to display the topic in the viewing pane.
Click the Close button at the top of the help window when you are finished.
Close button

PlanWeb Copyright IT Solutions 2006
Page 58
Appendix 1 – Toolbar Buttons Selection, Movement and Measurement tools (Green)
Button Description
Select tool. Highlights objects in the map window
Deselect tool. Used to unselect items that are highlighted.
Pan tool. Used to drag the map around the screen.
Zoom In tool. Used to view a magnified, more detailed map.
Zoom Out tool. Used to view lower magnification, less detailed map.
Line ruler. Used to measure line distances on the map.
Area Ruler. Used to measure the area of polygons.
Information Tools (Yellow)
Button Description
Information tool. Used to view information about a selected object on the map.
Radius Select tool. Used to select all features within a specified radius on the map.
Rectangle Select tool. Used to select all features within a specified rectangle on the map.
Polygon Select tool. Used to select all features within a specified polygon on the map.
PlanWeb Copyright IT Solutions 2006
Page 59
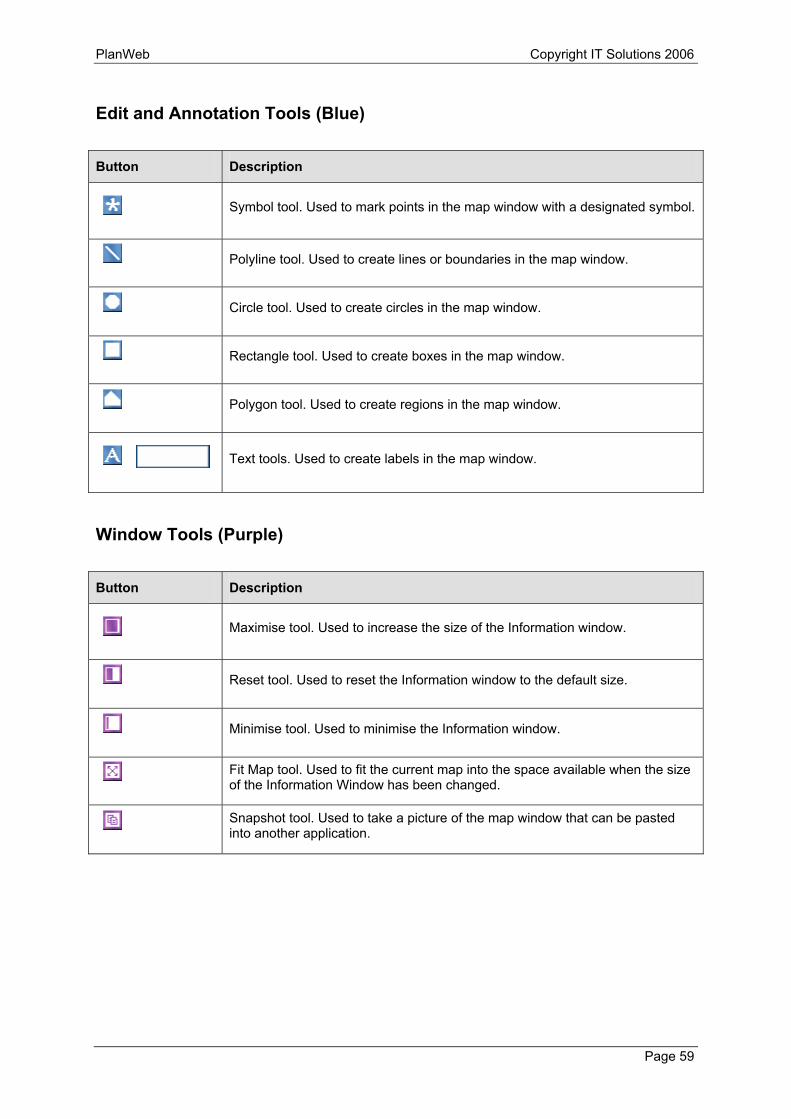
Edit and Annotation Tools (Blue)
Button Description
Symbol tool. Used to mark points in the map window with a designated symbol.
Polyline tool. Used to create lines or boundaries in the map window.
Circle tool. Used to create circles in the map window.
Rectangle tool. Used to create boxes in the map window.
Polygon tool. Used to create regions in the map window.
Text tools. Used to create labels in the map window.
Window Tools (Purple)
Button Description
Maximise tool. Used to increase the size of the Information window.
Reset tool. Used to reset the Information window to the default size.
Minimise tool. Used to minimise the Information window.
Fit Map tool. Used to fit the current map into the space available when the size of the Information Window has been changed.
Snapshot tool. Used to take a picture of the map window that can be pasted into another application.

PlanWeb Copyright IT Solutions 2006
Page 60
Miscellaneous Tools (Orange)
Button Description
Link Module tool. Used to link PlanWeb with other applications. This button is only available when the module has been loaded.
Log Off tool. Used to end your current PlanWeb session.

PlanWeb Copyright IT Solutions 2006
Page 61
Appendix 2 – The Status Bar
Tool Description
Map Tool. Displays the name of the currently selected tool.
Map location. Shows the X and Y coordinates at the centre of the map window, or the location of the mouse pointer in the map window.
Map Width. Shows the width (in metres) of the area currently displayed in the map window.
Line Distance. Shows the length (in metres) of the current line section drawn with the Line Ruler tool.
Total Distance. Shows the length (in metres) of all the sections of the line drawn with the Line Ruler tool.
Area. Shows the area (in square metres) of the last polygon drawn with the Area Ruler tool.
Active Layer. Shows the name of the Active Layer.
User. Shows the name of the user currently logged in.
Geoset. Shows the name of the currently selected Geoset.
Status. Shows the current PlanWeb status. If the screen is in the process of being refreshed, you will see a flashing red icon with the word Loading displayed.

Working in Partnership with Lincolnshire County Council
WHY WASTE TIME...
covering areas you already know?
WOULD YOU LIKE TO…
get the most out of your course?
HOW ABOUT…
a course covering just the areas you need?
All of our courses can be customised to provide an enhanced and cost-effective training experience.
For further information about any of our courses, please contact:
IT Solutions HBS Business Services Roman Way Gateway Park South Hykeham Lincoln LN6 9UH
(01522) 815080
(01522) 516011