Embed Size (px)
Citation preview
AdMob Mobile Metrics ReportAdMob serves ads for more than 4500 mobile web sites. This monthly report offers a snapshot of the data in our network to provide insight into trends in the mobile ecosystem.
April 2008
Email [email protected] to sign up for future reports.
Find previous reports and other resources at www.admob.com/metrics
AdMob Mobile Metrics ReportApril 2008
New this MonthNew format for the report! The re-design is aimed to make it easier to find what you're looking for.
Country and Region growth tracking on the Geographic Distribution of Traffic page.
We had several requests for Smartphone OS breakdown so we've added this section for each country on the Manufacturer and Device Share pages.
Manufacturer share by Operator for our top 5 markets. See this in the Operator Handset Mix pages.
ContentsFeatured in April
Geographic Distribution of Traffic
Global: Manufacturer and Device Share
United States: Manufacturer and Device Share
United States: Operator Handset Mix
India: Manufacturer and Device Share
India: Operator Handset Mix
United Kingdom: Manufacturer and Device Share
United Kingdom: Operator Handset Mix
South Africa: Manufacturer and Device Share
South Africa: Operator Handset Mix
Indonesia: Manufacturer and Device Share
Indonesia: Operator Handset Mix
Methodology
Email [email protected] to sign up for future reports. Find previous reports and other resources at www.admob.com/metrics
AdMob Mobile Metrics ReportApril 2008
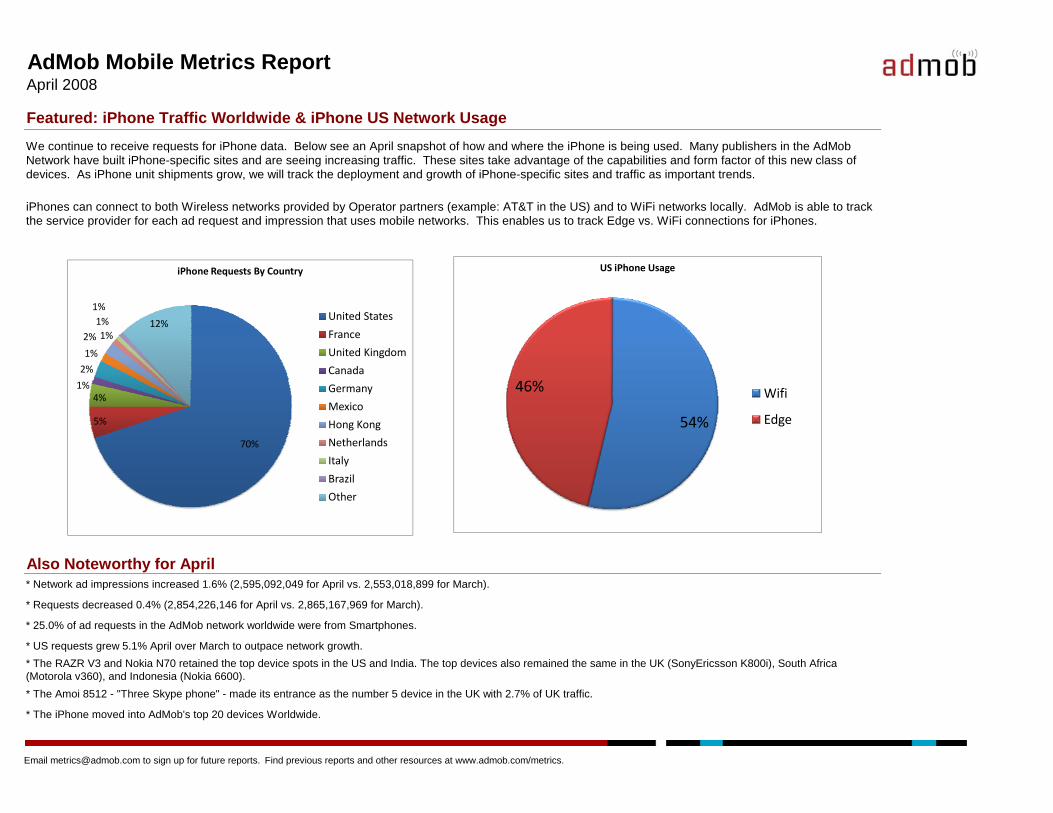
Featured: iPhone Traffic Worldwide & iPhone US Network Usage
We continue to receive requests for iPhone data. Below see an April snapshot of how and where the iPhone is being used. Many publishers in the AdMob Network have built iPhone-specific sites and are seeing increasing traffic. These sites take advantage of the capabilities and form factor of this new class of devices. As iPhone unit shipments grow, we will track the deployment and growth of iPhone-specific sites and traffic as important trends.
iPhones can connect to both Wireless networks provided by Operator partners (example: AT&T in the US) and to WiFi networks locally. AdMob is able to track the service provider for each ad request and impression that uses mobile networks. This enables us to track Edge vs. WiFi connections for iPhones.
2%
1%
2% 1%1%1%
12%
iPhone Requests By Country
United States
France
United Kingdom
Canada
US iPhone Usage
Also Noteworthy for April* Network ad impressions increased 1.6% (2,595,092,049 for April vs. 2,553,018,899 for March).
* Requests decreased 0.4% (2,854,226,146 for April vs. 2,865,167,969 for March).
* 25.0% of ad requests in the AdMob network worldwide were from Smartphones.
* US requests grew 5.1% April over March to outpace network growth.* The RAZR V3 and Nokia N70 retained the top device spots in the US and India. The top devices also remained the same in the UK (SonyEricsson K800i), South Africa (Motorola v360), and Indonesia (Nokia 6600).* The Amoi 8512 - "Three Skype phone" - made its entrance as the number 5 device in the UK with 2.7% of UK traffic.
* The iPhone moved into AdMob's top 20 devices Worldwide.
70%
5%
4%1% Germany
Mexico
Hong Kong
Netherlands
Italy
Brazil
Other
54%
46% Wifi
Edge
Email [email protected] to sign up for future reports. Find previous reports and other resources at www.admob.com/metrics.
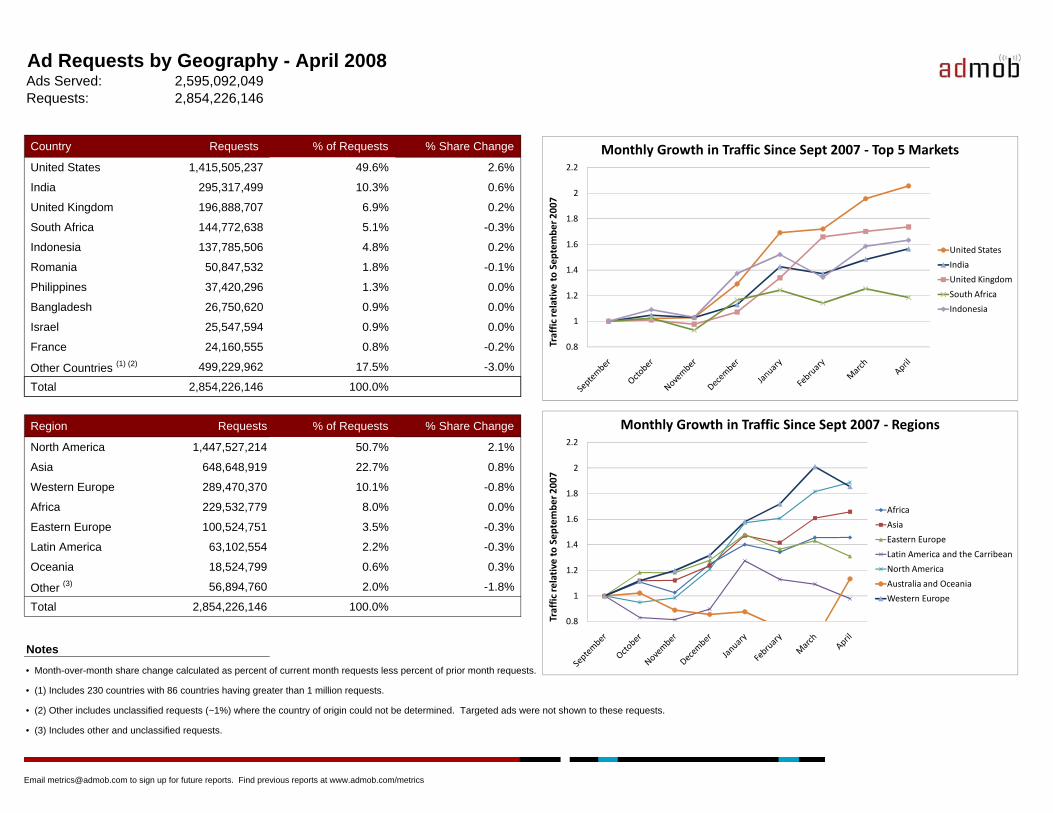
Ad Requests by Geography - April 2008Ads Served: 2,595,092,049 Requests: 2,854,226,146
Country Requests % of Requests % Share Change
United States 1,415,505,237 49.6% 2.6%
India 295,317,499 10.3% 0.6%
United Kingdom 196,888,707 6.9% 0.2%
South Africa 144,772,638 5.1% -0.3%
Indonesia 137,785,506 4.8% 0.2%
Romania 50,847,532 1.8% -0.1%
Philippines 37,420,296 1.3% 0.0%
Bangladesh 26,750,620 0.9% 0.0%
Israel 25,547,594 0.9% 0.0%
France 24,160,555 0.8% -0.2%
Other Countries (1) (2) 499,229,962 17.5% -3.0%
0.8
1
1.2
1.4
1.6
1.8
2
2.2
Traffic re
lative to
Sep
tembe
r 200
7
Monthly Growth in Traffic Since Sept 2007 ‐ Top 5 Markets
United States
India
United Kingdom
South Africa
Indonesia
Total 2,854,226,146 100.0%
Region Requests % of Requests % Share Change
North America 1,447,527,214 50.7% 2.1%
Asia 648,648,919 22.7% 0.8%
Western Europe 289,470,370 10.1% -0.8%
Africa 229,532,779 8.0% 0.0%
Eastern Europe 100,524,751 3.5% -0.3%
Latin America 63,102,554 2.2% -0.3%
Oceania 18,524,799 0.6% 0.3%
Other (3) 56,894,760 2.0% -1.8%
Total 2,854,226,146 100.0%
Notes
• Month-over-month share change calculated as percent of current month requests less percent of prior month requests.
• (1) Includes 230 countries with 86 countries having greater than 1 million requests.
• (2) Other includes unclassified requests (~1%) where the country of origin could not be determined. Targeted ads were not shown to these requests.
• (3) Includes other and unclassified requests.
0.8
1
1.2
1.4
1.6
1.8
2
2.2
Traffic re
lative to
Sep
tembe
r 200
7
Monthly Growth in Traffic Since Sept 2007 ‐ Regions
Africa
Asia
Eastern Europe
Latin America and the Carribean
North America
Australia and Oceania
Western Europe
Email [email protected] to sign up for future reports. Find previous reports at www.admob.com/metrics
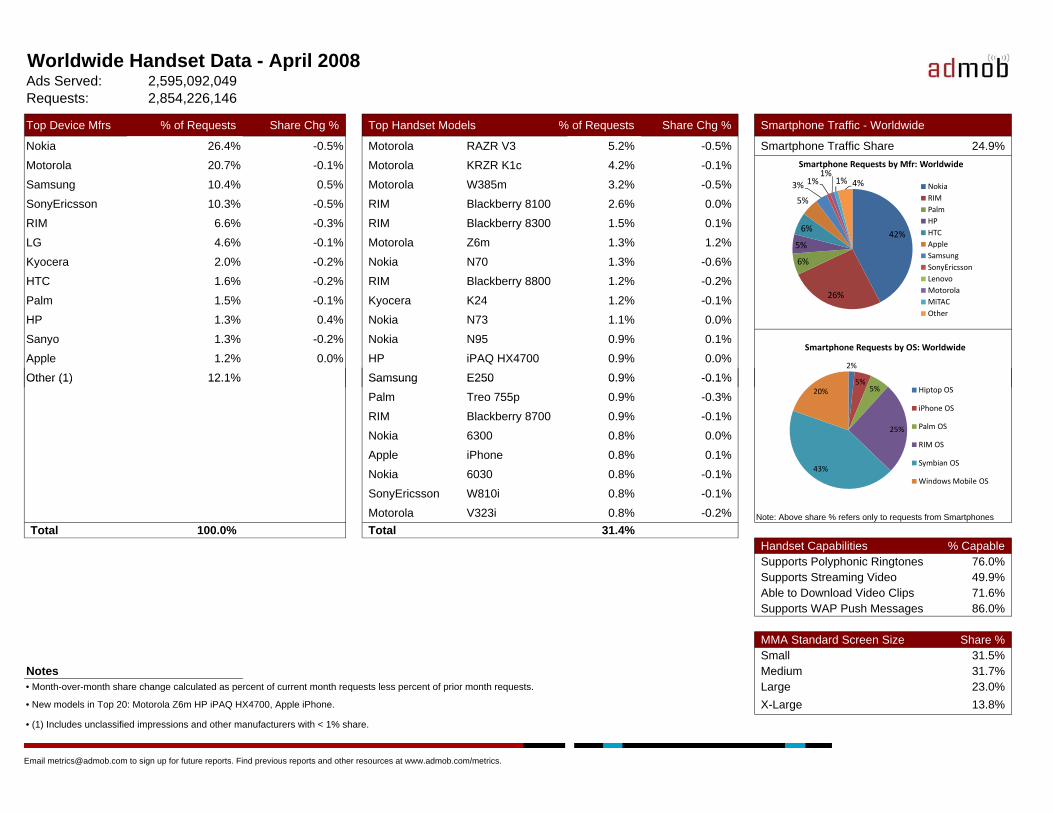
Worldwide Handset Data - April 2008Ads Served: 2,595,092,049 Requests: 2,854,226,146
Top Device Mfrs % of Requests Share Chg % Top Handset Models % of Requests Share Chg % Smartphone Traffic - Worldwide
Nokia 26.4% -0.5% Motorola RAZR V3 5.2% -0.5% Smartphone Traffic Share 24.9%Motorola 20.7% -0.1% Motorola KRZR K1c 4.2% -0.1%Samsung 10.4% 0.5% Motorola W385m 3.2% -0.5%SonyEricsson 10.3% -0.5% RIM Blackberry 8100 2.6% 0.0%RIM 6.6% -0.3% RIM Blackberry 8300 1.5% 0.1%LG 4.6% -0.1% Motorola Z6m 1.3% 1.2%Kyocera 2.0% -0.2% Nokia N70 1.3% -0.6%HTC 1.6% -0.2% RIM Blackberry 8800 1.2% -0.2%Palm 1.5% -0.1% Kyocera K24 1.2% -0.1%HP 1.3% 0.4% Nokia N73 1.1% 0.0%Sanyo 1.3% -0.2% Nokia N95 0.9% 0.1%Apple 1.2% 0.0% HP iPAQ HX4700 0.9% 0.0%Other (1) 12.1% Samsung E250 0.9% -0.1%
42%
26%
6%
5%
6%
5%
3% 1%1%
1% 4%
Smartphone Requests by Mfr: Worldwide
NokiaRIMPalmHPHTCAppleSamsungSonyEricssonLenovoMotorolaMiTACOther
2%
5%
Smartphone Requests by OS: Worldwide
Other (1) 12.1% Samsung E250 0.9% 0.1%Palm Treo 755p 0.9% -0.3%RIM Blackberry 8700 0.9% -0.1%Nokia 6300 0.8% 0.0%Apple iPhone 0.8% 0.1%Nokia 6030 0.8% -0.1%SonyEricsson W810i 0.8% -0.1%Motorola V323i 0.8% -0.2% Note: Above share % refers only to requests from Smartphones
Total 100.0% Total 31.4%Handset Capabilities % CapableSupports Polyphonic Ringtones 76.0%Supports Streaming Video 49.9%Able to Download Video Clips 71.6%Supports WAP Push Messages 86.0%
MMA Standard Screen Size Share %Small 31.5%
Notes Medium 31.7%• Month-over-month share change calculated as percent of current month requests less percent of prior month requests. Large 23.0%• New models in Top 20: Motorola Z6m HP iPAQ HX4700, Apple iPhone. X-Large 13.8%• (1) Includes unclassified impressions and other manufacturers with < 1% share.
5%5%
25%
43%
20% Hiptop OS
iPhone OS
Palm OS
RIM OS
Symbian OS
Windows Mobile OS
Email [email protected] to sign up for future reports. Find previous reports and other resources at www.admob.com/metrics.
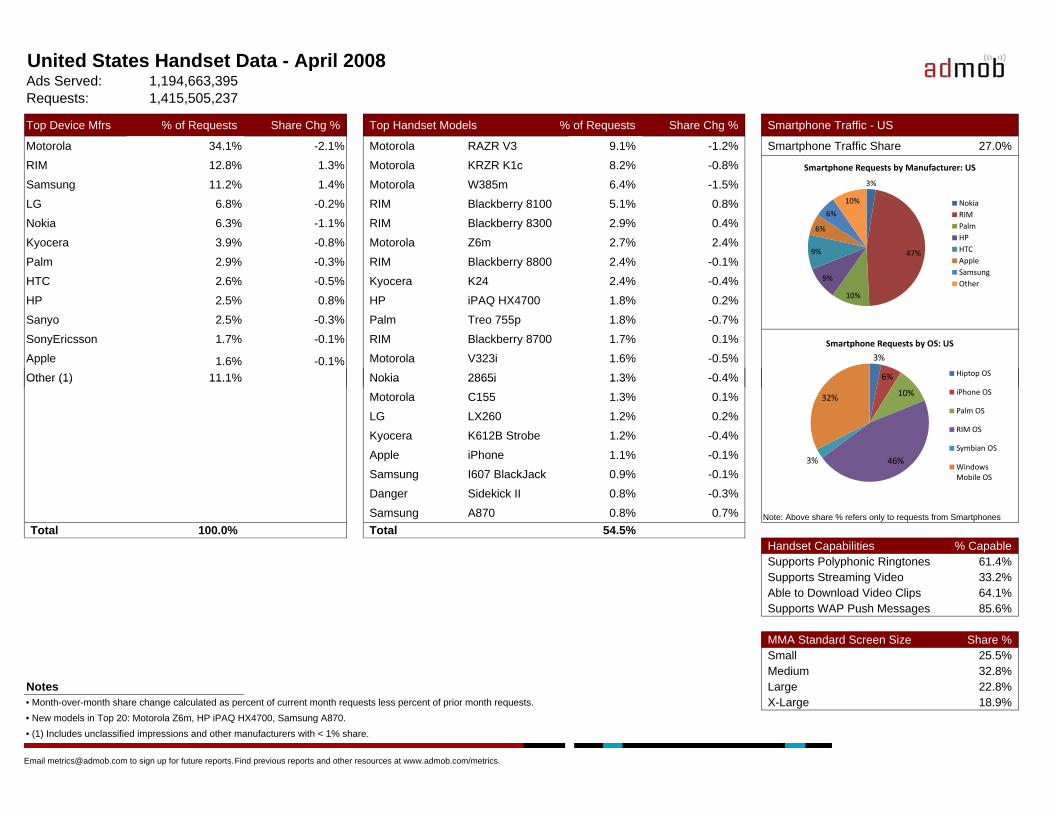
United States Handset Data - April 2008Ads Served: 1,194,663,395 Requests: 1,415,505,237
Top Device Mfrs % of Requests Share Chg % Top Handset Models % of Requests Share Chg % Smartphone Traffic - US
Motorola 34.1% -2.1% Motorola RAZR V3 9.1% -1.2% Smartphone Traffic Share 27.0%RIM 12.8% 1.3% Motorola KRZR K1c 8.2% -0.8%Samsung 11.2% 1.4% Motorola W385m 6.4% -1.5%LG 6.8% -0.2% RIM Blackberry 8100 5.1% 0.8%Nokia 6.3% -1.1% RIM Blackberry 8300 2.9% 0.4%Kyocera 3.9% -0.8% Motorola Z6m 2.7% 2.4%Palm 2.9% -0.3% RIM Blackberry 8800 2.4% -0.1%HTC 2.6% -0.5% Kyocera K24 2.4% -0.4%HP 2.5% 0.8% HP iPAQ HX4700 1.8% 0.2%Sanyo 2.5% -0.3% Palm Treo 755p 1.8% -0.7%SonyEricsson 1.7% -0.1% RIM Blackberry 8700 1.7% 0.1%Apple 1.6% -0.1% Motorola V323i 1.6% -0.5%Other (1) 11.1% Nokia 2865i 1.3% -0.4%
3%
47%
10%
9%
9%
6%
6%
10%
Smartphone Requests by Manufacturer: US
NokiaRIMPalmHPHTCAppleSamsungOther
3%
6%
Smartphone Requests by OS: US
Hiptop OSOther (1) 11.1% Nokia 2865i 1.3% 0.4%Motorola C155 1.3% 0.1%LG LX260 1.2% 0.2%Kyocera K612B Strobe 1.2% -0.4%Apple iPhone 1.1% -0.1%Samsung I607 BlackJack 0.9% -0.1%Danger Sidekick II 0.8% -0.3%Samsung A870 0.8% 0.7% Note: Above share % refers only to requests from Smartphones
Total 100.0% Total 54.5%Handset Capabilities % CapableSupports Polyphonic Ringtones 61.4%Supports Streaming Video 33.2%Able to Download Video Clips 64.1%Supports WAP Push Messages 85.6%
MMA Standard Screen Size Share %Small 25.5%Medium 32.8%
Notes Large 22.8%• Month-over-month share change calculated as percent of current month requests less percent of prior month requests. X-Large 18.9%• New models in Top 20: Motorola Z6m, HP iPAQ HX4700, Samsung A870.• (1) Includes unclassified impressions and other manufacturers with < 1% share.
10%
46%3%
32%iPhone OS
Palm OS
RIM OS
Symbian OS
Windows Mobile OS
Email [email protected] to sign up for future reports. Find previous reports and other resources at www.admob.com/metrics.
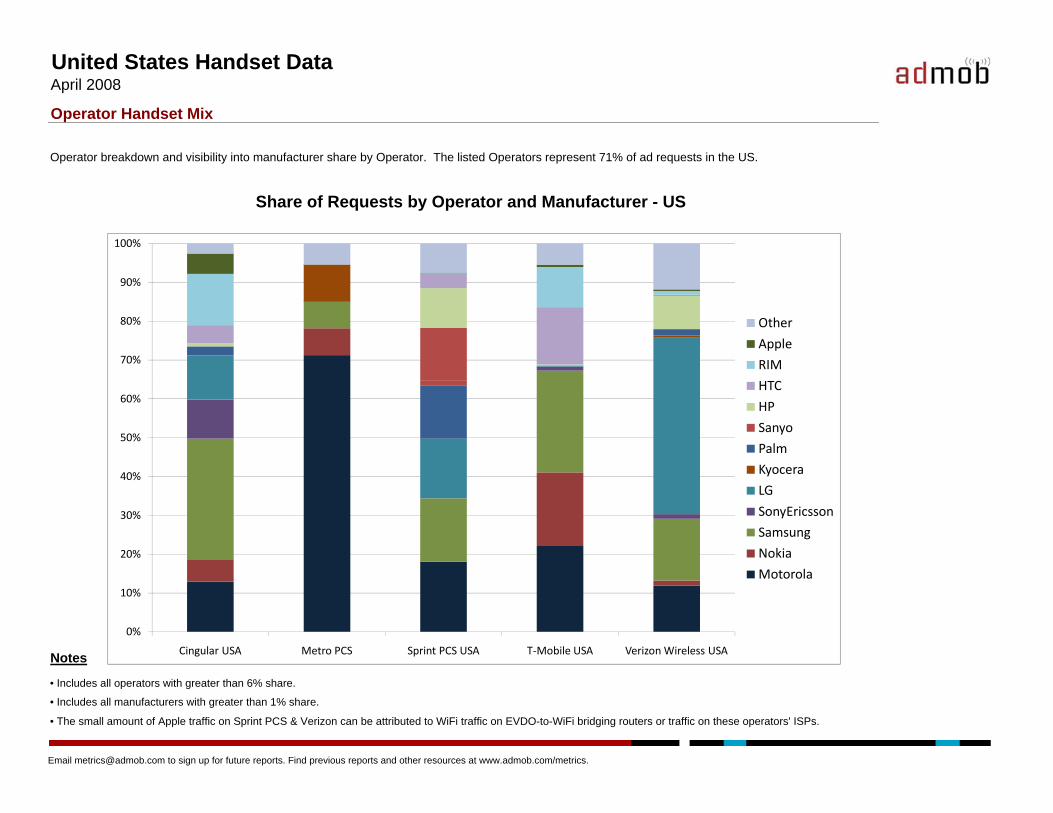
United States Handset DataApril 2008
Operator Handset Mix
Operator breakdown and visibility into manufacturer share by Operator. The listed Operators represent 71% of ad requests in the US.
Share of Requests by Operator and Manufacturer - US
70%
80%
90%
100%
Other
Apple
RIM
Notes
• Includes all operators with greater than 6% share.
• Includes all manufacturers with greater than 1% share.
• The small amount of Apple traffic on Sprint PCS & Verizon can be attributed to WiFi traffic on EVDO-to-WiFi bridging routers or traffic on these operators' ISPs.
0%
10%
20%
30%
40%
50%
60%
Cingular USA Metro PCS Sprint PCS USA T‐Mobile USA Verizon Wireless USA
HTC
HP
Sanyo
Palm
Kyocera
LG
SonyEricsson
Samsung
Nokia
Motorola
Email [email protected] to sign up for future reports. Find previous reports and other resources at www.admob.com/metrics.
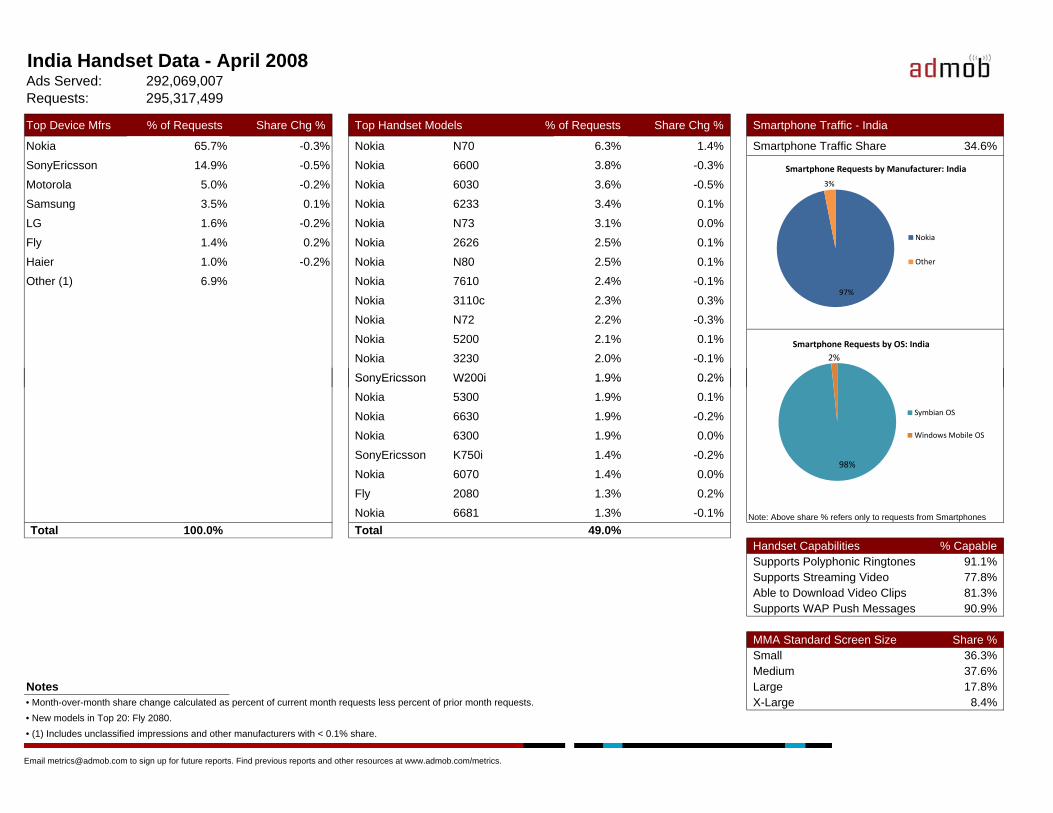
India Handset Data - April 2008Ads Served: 292,069,007 Requests: 295,317,499
Top Device Mfrs % of Requests Share Chg % Top Handset Models % of Requests Share Chg % Smartphone Traffic - India
Nokia 65.7% -0.3% Nokia N70 6.3% 1.4% Smartphone Traffic Share 34.6%SonyEricsson 14.9% -0.5% Nokia 6600 3.8% -0.3%Motorola 5.0% -0.2% Nokia 6030 3.6% -0.5%Samsung 3.5% 0.1% Nokia 6233 3.4% 0.1%LG 1.6% -0.2% Nokia N73 3.1% 0.0%Fly 1.4% 0.2% Nokia 2626 2.5% 0.1%Haier 1.0% -0.2% Nokia N80 2.5% 0.1%Other (1) 6.9% Nokia 7610 2.4% -0.1%
Nokia 3110c 2.3% 0.3%Nokia N72 2.2% -0.3%Nokia 5200 2.1% 0.1%Nokia 3230 2.0% -0.1%SonyEricsson W200i 1.9% 0.2%
97%
3%
Smartphone Requests by Manufacturer: India
Nokia
Other
2%Smartphone Requests by OS: India
SonyEricsson W200i 1.9% 0.2%Nokia 5300 1.9% 0.1%Nokia 6630 1.9% -0.2%Nokia 6300 1.9% 0.0%SonyEricsson K750i 1.4% -0.2%Nokia 6070 1.4% 0.0%Fly 2080 1.3% 0.2%Nokia 6681 1.3% -0.1% Note: Above share % refers only to requests from Smartphones
Total 100.0% Total 49.0%Handset Capabilities % CapableSupports Polyphonic Ringtones 91.1%Supports Streaming Video 77.8%Able to Download Video Clips 81.3%Supports WAP Push Messages 90.9%
MMA Standard Screen Size Share %Small 36.3%Medium 37.6%
Notes Large 17.8%• Month-over-month share change calculated as percent of current month requests less percent of prior month requests. X-Large 8.4%• New models in Top 20: Fly 2080.• (1) Includes unclassified impressions and other manufacturers with < 0.1% share.
98%
Symbian OS
Windows Mobile OS
Email [email protected] to sign up for future reports. Find previous reports and other resources at www.admob.com/metrics.
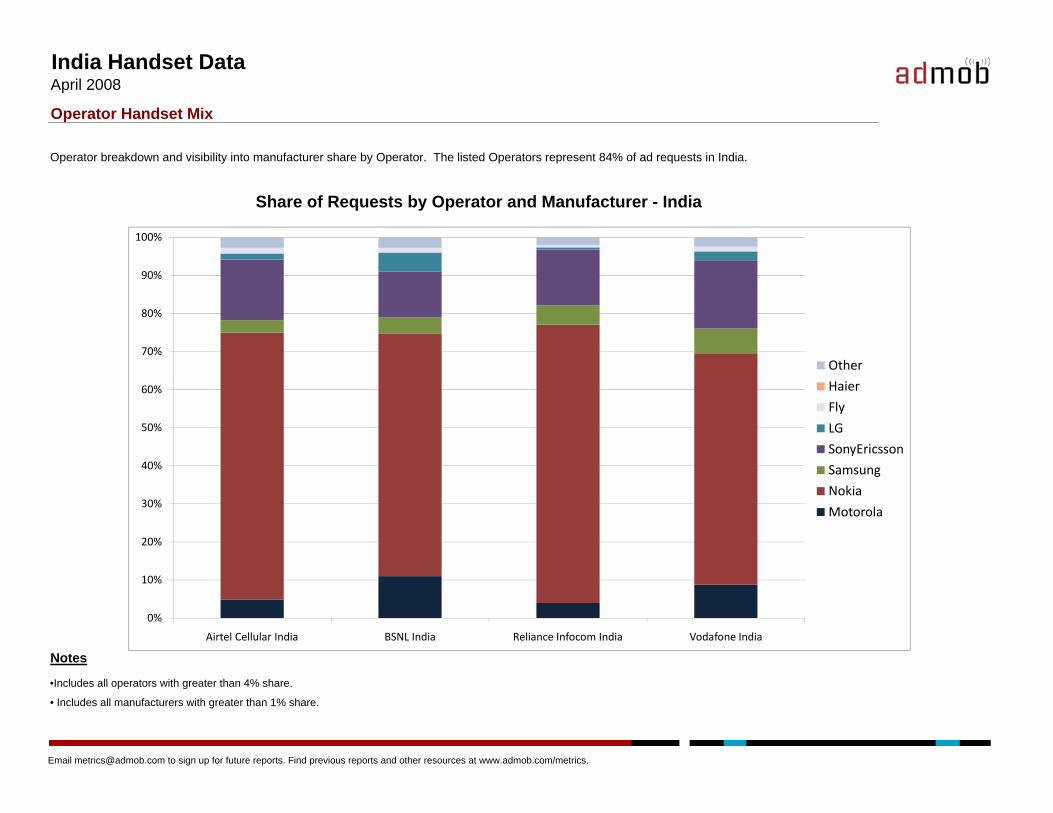
India Handset DataApril 2008
Operator Handset Mix
Operator breakdown and visibility into manufacturer share by Operator. The listed Operators represent 84% of ad requests in India.
Share of Requests by Operator and Manufacturer - India
70%
80%
90%
100%
Other
Notes
•Includes all operators with greater than 4% share.
• Includes all manufacturers with greater than 1% share.
0%
10%
20%
30%
40%
50%
60%
Airtel Cellular India BSNL India Reliance Infocom India Vodafone India
Haier
Fly
LG
SonyEricsson
Samsung
Nokia
Motorola
Email [email protected] to sign up for future reports. Find previous reports and other resources at www.admob.com/metrics.
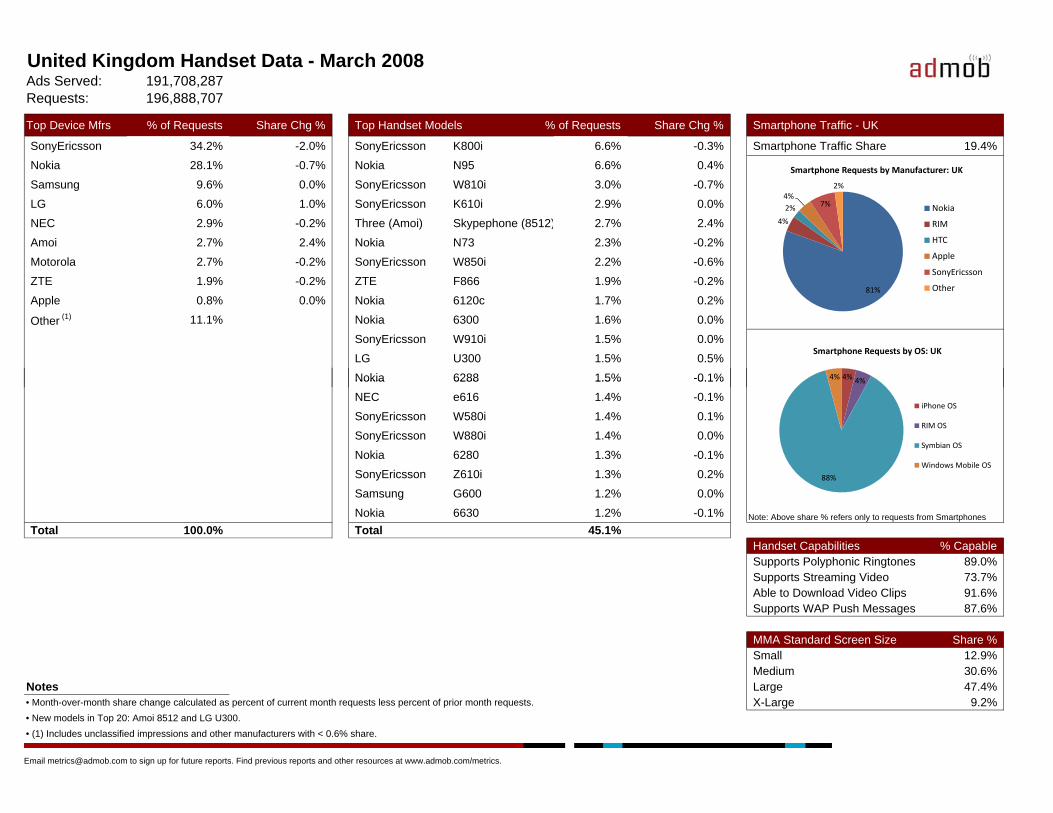
United Kingdom Handset Data - March 2008Ads Served: 191,708,287 Requests: 196,888,707
Top Device Mfrs % of Requests Share Chg % Top Handset Models % of Requests Share Chg % Smartphone Traffic - UK
SonyEricsson 34.2% -2.0% SonyEricsson K800i 6.6% -0.3% Smartphone Traffic Share 19.4%Nokia 28.1% -0.7% Nokia N95 6.6% 0.4%Samsung 9.6% 0.0% SonyEricsson W810i 3.0% -0.7%LG 6.0% 1.0% SonyEricsson K610i 2.9% 0.0%NEC 2.9% -0.2% Three (Amoi) Skypephone (8512) 2.7% 2.4%Amoi 2.7% 2.4% Nokia N73 2.3% -0.2%Motorola 2.7% -0.2% SonyEricsson W850i 2.2% -0.6%ZTE 1.9% -0.2% ZTE F866 1.9% -0.2%Apple 0.8% 0.0% Nokia 6120c 1.7% 0.2%
Other (1) 11.1% Nokia 6300 1.6% 0.0%SonyEricsson W910i 1.5% 0.0%LG U300 1.5% 0.5%Nokia 6288 1.5% -0.1%
81%
4%
2%4%
7%
2%
Smartphone Requests by Manufacturer: UK
Nokia
RIM
HTC
Apple
SonyEricsson
Other
4% 4%4%
Smartphone Requests by OS: UK
Nokia 6288 1.5% 0.1%NEC e616 1.4% -0.1%SonyEricsson W580i 1.4% 0.1%SonyEricsson W880i 1.4% 0.0%Nokia 6280 1.3% -0.1%SonyEricsson Z610i 1.3% 0.2%Samsung G600 1.2% 0.0%Nokia 6630 1.2% -0.1% Note: Above share % refers only to requests from Smartphones
Total 100.0% Total 45.1%Handset Capabilities % CapableSupports Polyphonic Ringtones 89.0%Supports Streaming Video 73.7%Able to Download Video Clips 91.6%Supports WAP Push Messages 87.6%
MMA Standard Screen Size Share %Small 12.9%Medium 30.6%
Notes Large 47.4%• Month-over-month share change calculated as percent of current month requests less percent of prior month requests. X-Large 9.2%• New models in Top 20: Amoi 8512 and LG U300.• (1) Includes unclassified impressions and other manufacturers with < 0.6% share.
4%
88%
iPhone OS
RIM OS
Symbian OS
Windows Mobile OS
Email [email protected] to sign up for future reports. Find previous reports and other resources at www.admob.com/metrics.
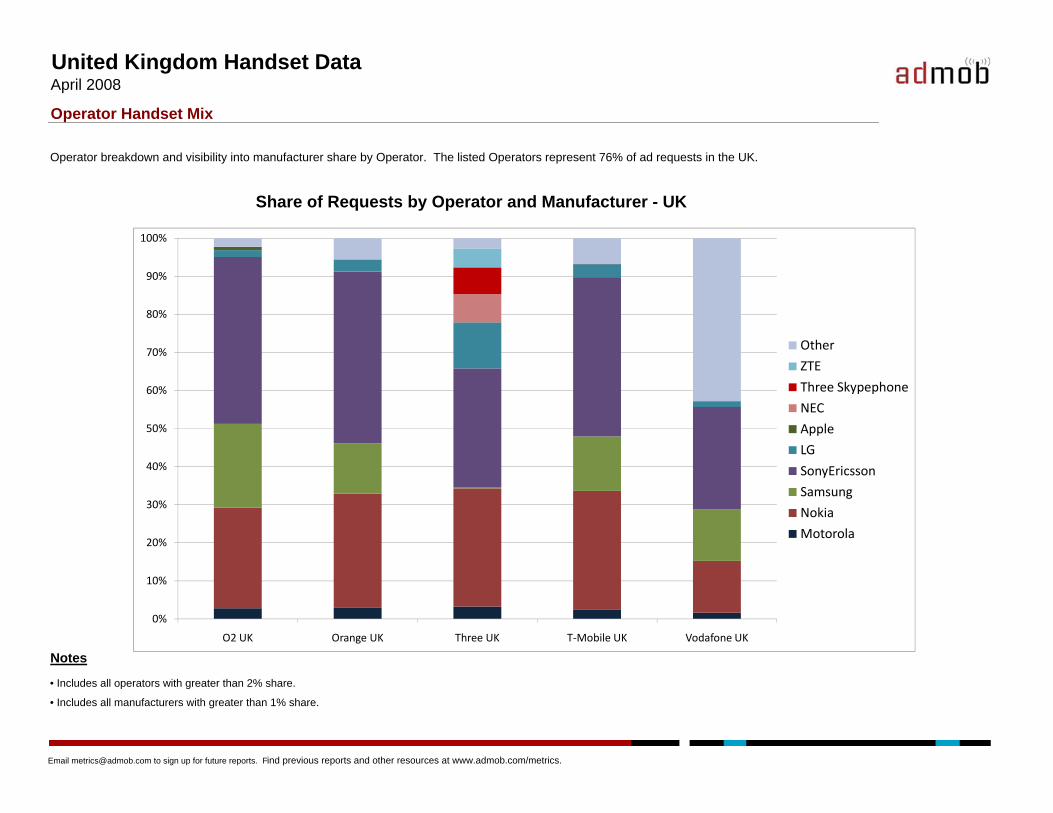
United Kingdom Handset DataApril 2008
Operator Handset Mix
Operator breakdown and visibility into manufacturer share by Operator. The listed Operators represent 76% of ad requests in the UK.
Share of Requests by Operator and Manufacturer - UK
70%
80%
90%
100%
Other
ZTE
Notes
• Includes all operators with greater than 2% share.
• Includes all manufacturers with greater than 1% share.
0%
10%
20%
30%
40%
50%
60%
O2 UK Orange UK Three UK T‐Mobile UK Vodafone UK
Three Skypephone
NEC
Apple
LG
SonyEricsson
Samsung
Nokia
Motorola
Email [email protected] to sign up for future reports. Find previous reports and other resources at www.admob.com/metrics.
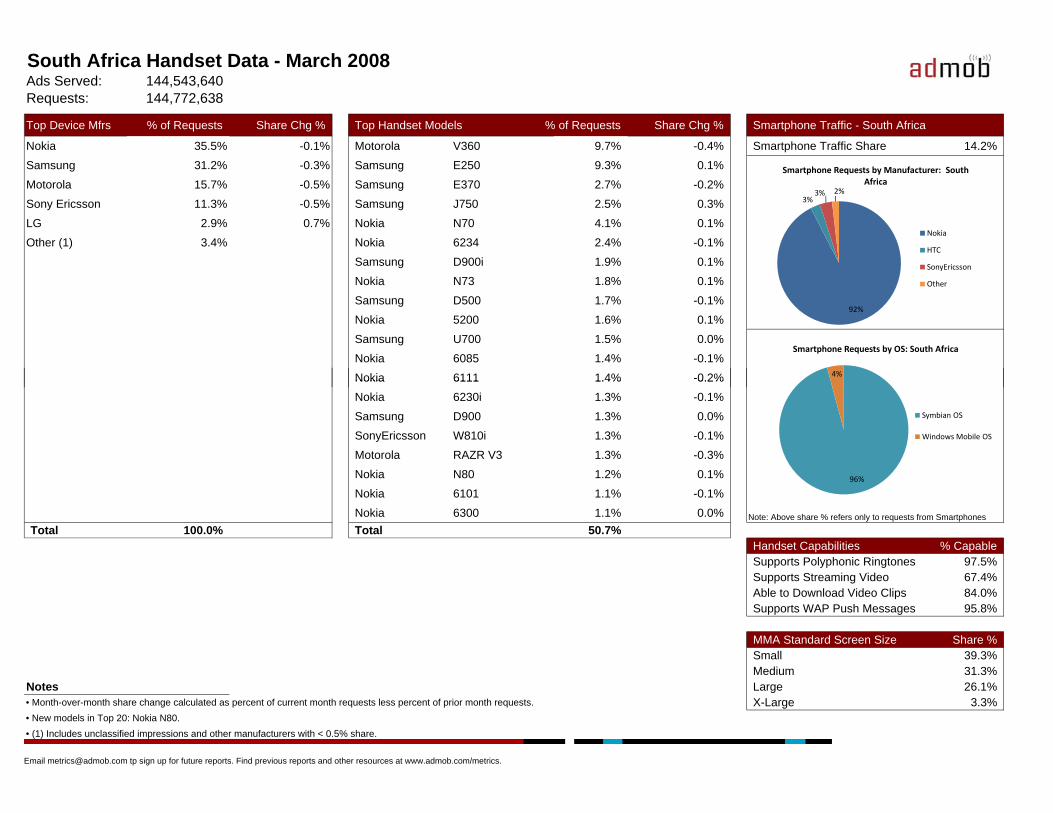
South Africa Handset Data - March 2008Ads Served: 144,543,640 Requests: 144,772,638
Top Device Mfrs % of Requests Share Chg % Top Handset Models % of Requests Share Chg % Smartphone Traffic - South Africa
Nokia 35.5% -0.1% Motorola V360 9.7% -0.4% Smartphone Traffic Share 14.2%Samsung 31.2% -0.3% Samsung E250 9.3% 0.1%Motorola 15.7% -0.5% Samsung E370 2.7% -0.2%Sony Ericsson 11.3% -0.5% Samsung J750 2.5% 0.3%LG 2.9% 0.7% Nokia N70 4.1% 0.1%Other (1) 3.4% Nokia 6234 2.4% -0.1%
Samsung D900i 1.9% 0.1%Nokia N73 1.8% 0.1%Samsung D500 1.7% -0.1%Nokia 5200 1.6% 0.1%Samsung U700 1.5% 0.0%Nokia 6085 1.4% -0.1%Nokia 6111 1.4% -0.2% 4%
Smartphone Requests by OS: South Africa
92%
3%3% 2%
Smartphone Requests by Manufacturer: South Africa
Nokia
HTC
SonyEricsson
Other
Nokia 6111 1.4% 0.2%Nokia 6230i 1.3% -0.1%Samsung D900 1.3% 0.0%SonyEricsson W810i 1.3% -0.1%Motorola RAZR V3 1.3% -0.3%Nokia N80 1.2% 0.1%Nokia 6101 1.1% -0.1%Nokia 6300 1.1% 0.0% Note: Above share % refers only to requests from Smartphones
Total 100.0% Total 50.7%Handset Capabilities % CapableSupports Polyphonic Ringtones 97.5%Supports Streaming Video 67.4%Able to Download Video Clips 84.0%Supports WAP Push Messages 95.8%
MMA Standard Screen Size Share %Small 39.3%Medium 31.3%
Notes Large 26.1%• Month-over-month share change calculated as percent of current month requests less percent of prior month requests. X-Large 3.3%• New models in Top 20: Nokia N80.• (1) Includes unclassified impressions and other manufacturers with < 0.5% share.
96%
Symbian OS
Windows Mobile OS
Email [email protected] tp sign up for future reports. Find previous reports and other resources at www.admob.com/metrics.
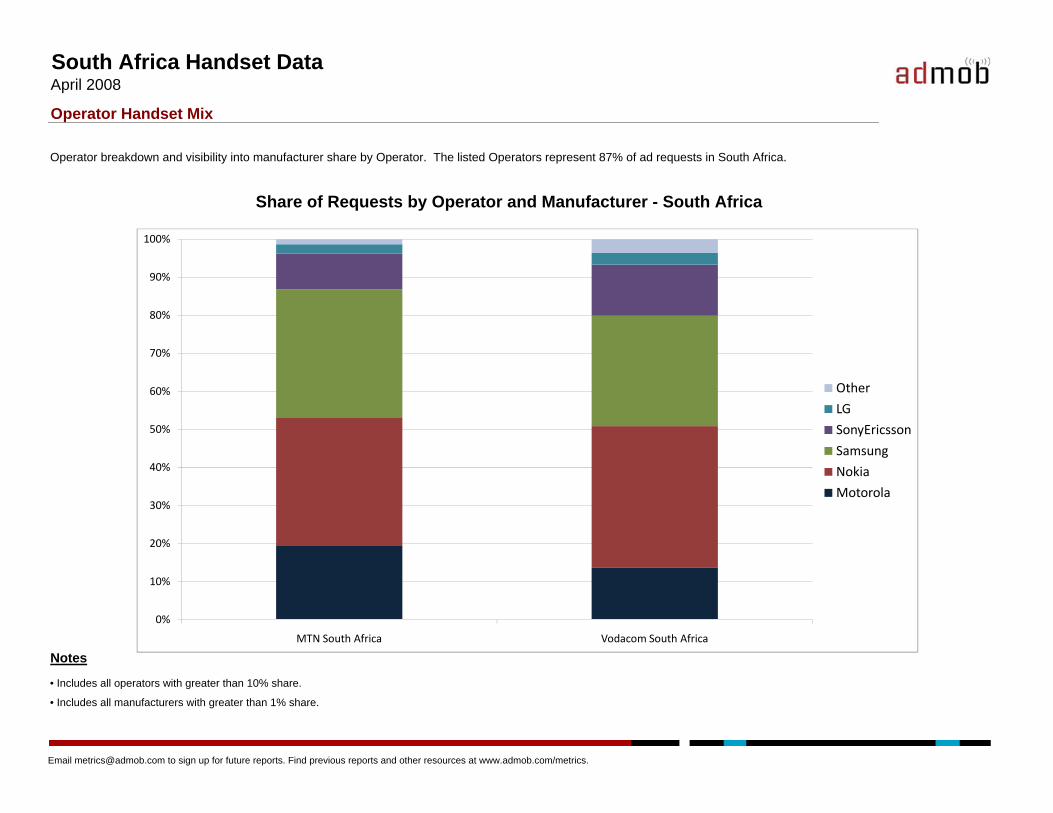
South Africa Handset DataApril 2008
Operator Handset Mix
Operator breakdown and visibility into manufacturer share by Operator. The listed Operators represent 87% of ad requests in South Africa.
Share of Requests by Operator and Manufacturer - South Africa
70%
80%
90%
100%
Notes
• Includes all operators with greater than 10% share.
• Includes all manufacturers with greater than 1% share.
0%
10%
20%
30%
40%
50%
60%
MTN South Africa Vodacom South Africa
Other
LG
SonyEricsson
Samsung
Nokia
Motorola
Email [email protected] to sign up for future reports. Find previous reports and other resources at www.admob.com/metrics.
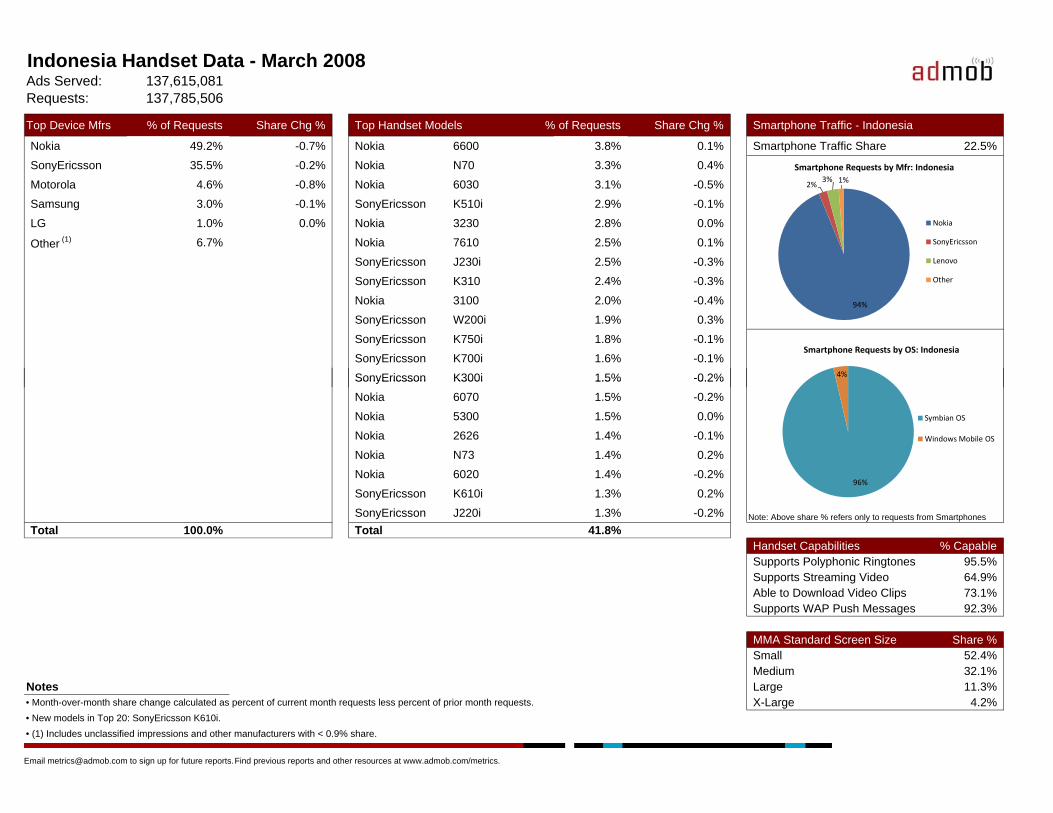
Indonesia Handset Data - March 2008Ads Served: 137,615,081 Requests: 137,785,506
Top Device Mfrs % of Requests Share Chg % Top Handset Models % of Requests Share Chg % Smartphone Traffic - Indonesia
Nokia 49.2% -0.7% Nokia 6600 3.8% 0.1% Smartphone Traffic Share 22.5%SonyEricsson 35.5% -0.2% Nokia N70 3.3% 0.4%Motorola 4.6% -0.8% Nokia 6030 3.1% -0.5%Samsung 3.0% -0.1% SonyEricsson K510i 2.9% -0.1%LG 1.0% 0.0% Nokia 3230 2.8% 0.0%
Other (1) 6.7% Nokia 7610 2.5% 0.1%SonyEricsson J230i 2.5% -0.3%SonyEricsson K310 2.4% -0.3%Nokia 3100 2.0% -0.4%SonyEricsson W200i 1.9% 0.3%SonyEricsson K750i 1.8% -0.1%SonyEricsson K700i 1.6% -0.1%SonyEricsson K300i 1.5% -0.2%
94%
2%3% 1%
Smartphone Requests by Mfr: Indonesia
Nokia
SonyEricsson
Lenovo
Other
4%
Smartphone Requests by OS: Indonesia
SonyEricsson K300i 1.5% 0.2%Nokia 6070 1.5% -0.2%Nokia 5300 1.5% 0.0%Nokia 2626 1.4% -0.1%Nokia N73 1.4% 0.2%Nokia 6020 1.4% -0.2%SonyEricsson K610i 1.3% 0.2%SonyEricsson J220i 1.3% -0.2% Note: Above share % refers only to requests from Smartphones
Total 100.0% Total 41.8%Handset Capabilities % CapableSupports Polyphonic Ringtones 95.5%Supports Streaming Video 64.9%Able to Download Video Clips 73.1%Supports WAP Push Messages 92.3%
MMA Standard Screen Size Share %Small 52.4%Medium 32.1%
Notes Large 11.3%• Month-over-month share change calculated as percent of current month requests less percent of prior month requests. X-Large 4.2%• New models in Top 20: SonyEricsson K610i.• (1) Includes unclassified impressions and other manufacturers with < 0.9% share.
96%
Symbian OS
Windows Mobile OS
Email [email protected] to sign up for future reports. Find previous reports and other resources at www.admob.com/metrics.
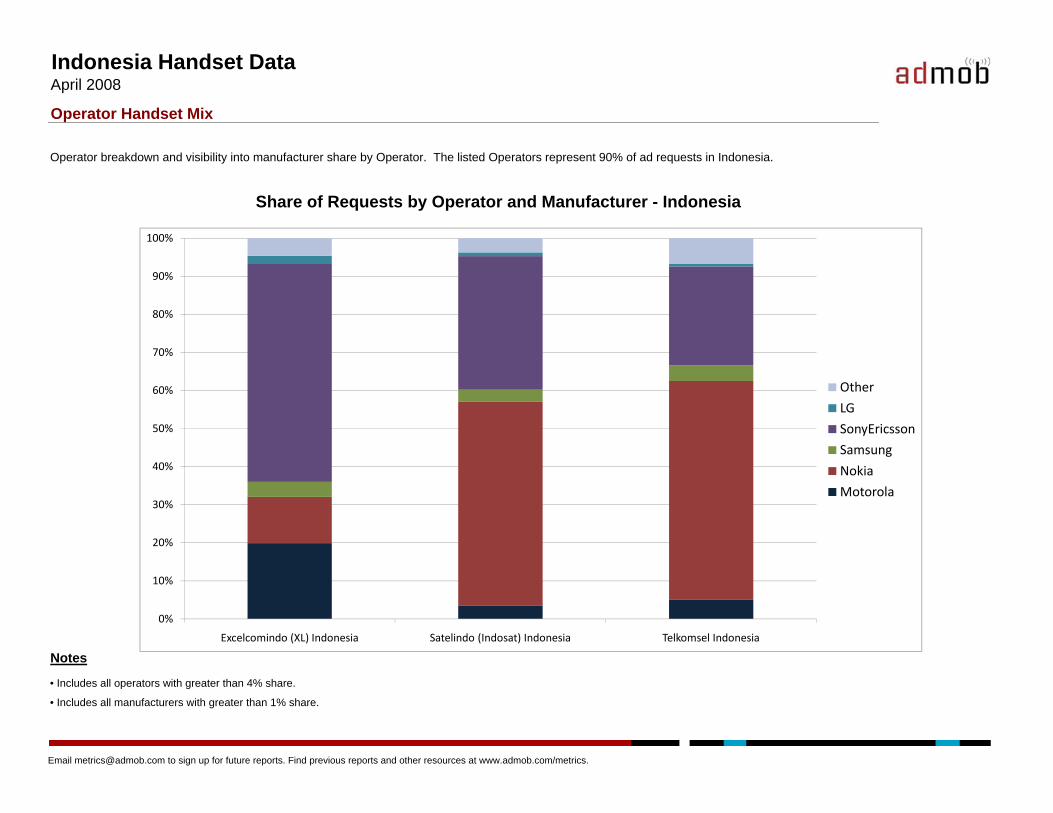
Indonesia Handset DataApril 2008
Operator Handset Mix
Operator breakdown and visibility into manufacturer share by Operator. The listed Operators represent 90% of ad requests in Indonesia.
Share of Requests by Operator and Manufacturer - Indonesia
70%
80%
90%
100%
Notes
• Includes all operators with greater than 4% share.
• Includes all manufacturers with greater than 1% share.
0%
10%
20%
30%
40%
50%
60%
Excelcomindo (XL) Indonesia Satelindo (Indosat) Indonesia Telkomsel Indonesia
Other
LG
SonyEricsson
Samsung
Nokia
Motorola
Email [email protected] to sign up for future reports. Find previous reports and other resources at www.admob.com/metrics.
AdMob Mobile Metrics ReportApril 2008
About AdMobAdMob serves Graphical Banner and Text Link ads on mobile web pages for more than 4,500 publishers. AdMob has served more than 24 billion ads since launching in January 2006, and currently serves more than 2.5 billion ads monthly. For each ad served, AdMob leverages handset and operator data, which enable demographic, device and operator targeting for advertisers.
About AdMob Mobile Metrics
AdMob stores and analyzes the data from every ad request, impression, and click and uses this to optimize ad serving. Every day, we see ad requests from more than 160 countries. We share some of this data for use by the AdMob community. Publishers want to better understand mobile data use by operator and by device to target their content and optimize their site performance. Advertisers want to understand demographics and device capabilities as they plan their campaigns. AdMob’s Mobile Metrics report represents our attempt to provide usage information for the use of the community.
Methodology
For every ad request AdMob analyzes information available in the user’s mobile browser. From this, AdMob determines device capabilities and more using open source tools and a variety of proprietary techniques. The result is a snapshot of the devices viewing the more than 2.5 billion monthly ad requests and impressions that flow through AdMob’s network. We believe this data will be valuable in identifying and tracking trends, evaluating market readiness and more.
Limits of this DataRepresentativeness - AdMob does not claim that this information will be necessarily representative of the mobile internet as a whole or of any particular country-market. AdMob’s traffic is driven by publisher relationships and may be influenced accordingly. Because the data is pulled across ads served on more than 4,500 sites, we feel the data will be useful and may help inform your business decision making.
Ad Request Classification - For some handsets and operator networks, it is difficult to collect full handset data. AdMob categorizes these requests as "unclassified" and does not serve targeted ads to these requests. Unclassified data has been omitted from the handset data in this report. Less than 1% of requests are unclassified by geography and approximately 7% of requests are unclassified by handset.
QuestionsEmail [email protected] to receive future AdMob Mobile Metrics distributions or if you have any questions or feedback for future releases.
Email [email protected] to sign up for future reports. Find previous reports and other resources at www.admob.com/metrics.