Embed Size (px)
Citation preview

ADMINISTRATIVE FACTORS INFLUENCING QUALITY OF
EDUCATION IN PUBLIC SECONDARY SCHOOLS IN KITUI, KISII AND
NAIROBI COUNTIES, KENYA
Asiago Dorcah
A Thesis Submitted in Partial Fulfillment of the Requirements for the Award
of the Degree of Doctor of Education in Educational Administration
University of Nairobi
2018

ii
DECLARATION
This thesis is my original work and has not been presented for award of a degree in
any other University
.......................................................................................................
Asiago Dorcah
E96/83381/2012
This thesis has been submitted for examination with our approval as University
Supervisors
.......................................................................................................
Dr. Jeremiah M. Kalai
Senior Lecturer
Department of Educational Administration and Planning
University of Nairobi
.......................................................................................................
Dr. Loise Gichuhi
Senior Lecturer
Department of Educational Administration and Planning
University of Nairobi

iii
DEDICATION
This work is dedicated to my late father James Asiago and my mother Mary
Mayomi.

iv
ACKNOWLEDGEMENT
I would like to acknowledge the Almighty God for the good health that I enjoyed
during the course of my studies. I also thank the University of Nairobi for giving
me opportunity to undertake my doctorate studies. My supervisors Dr. Jeremiah
Kalai and Dr. Loise Gichuhi, thanks a lot for your patience and constructive
criticism that shaped this work. I acknowledge my husband Joel Ochako for
supporting this work financially and my children Bentah, Lauryn, Crispin and Judy
for their patience and understanding especially when I had to be away for long to
collect data for this study. I appreciate my late father James Asiago who lay the
foundation of education and hard work in me in the early years of my life and my
mother Mary Mayomi who has continually watered the seed of hard work and
patience throughout my life. I also acknowledge the secondary school principals
and teachers in Kisii, Kitui and Nairobi Counties who spared their time to fill the
questionnaires for this study. I am grateful to the Teachers Service Commission for
giving me information on number of teachers in the Counties under study. Much
appreciation to the Ministry of Education for allowing me to have access to
information on Free Day Secondary Education disbursement to schools. To all my
friends, classmates and colleagues at place of work who encouraged me in the
pursuance of this course, I say bravo.

v
TABLE OF CONTENTS
Content Page
Title page…………………………………………………………………………..i
Declaration ......................................................................................................... ii
Dedication.......................................................................................................... iii
Acknowledgement .............................................................................................. iv
Table of Contents ................................................................................................. v
List of Tables .....................................................................................................xii
List of Diagrams ............................................................................................... xvi
Abbreviations and Acronyms ........................................................................... xvii
Abstract ............................................................................................................ xix
CHAPTER ONE
INTRODUCTION
1.1 Background to the Study ................................................................................ 1
1.2 Statement of the Problem ............................................................................. 16
1.3 The Purpose of the Study.............................................................................. 19
1.4 Objectives of the Study ................................................................................ 19
1.5 Research Hypotheses .................................................................................... 19
1.6 Significance of the Study .............................................................................. 21
1.7 Limitations of the Study ............................................................................... 21
1.8 Delimitations of the Study ............................................................................ 21

vi
1.9 Basic Assumptions of the Study ................................................................... 22
1.10 Definition of Significant Terms .................................................................. 22
1.11 Organization of the Study ........................................................................... 23
CHAPTER TWO
REVIEW OF RELATED LITERATURE
2.1 Introduction .................................................................................................. 25
2.2 The Concept of Quality of Education ........................................................... 25
2.3 Physical Facilities and Quality of Education ................................................. 28
2.4 Teacher Motivation and Quality of Education .............................................. 35
2.5 School Financial Resources and Quality of Education .................................. 43
2.6 Teaching and Learning Resources and Quality of Education ........................ 55
2.7 Summary of Related Literature Review ........................................................ 59
2.8 Theoretical Framework ................................................................................ 60
2.9 Conceptual Framework ................................................................................ 61
CHAPTER THREE
RESEARCH METHODOLOGY
3.1 Introduction .................................................................................................. 64
3.2 Research Design ........................................................................................... 64
3.3 Target Population ......................................................................................... 65
3.4 Sample Size and Sampling Procedures ......................................................... 65

vii
3.5 Research Instruments ................................................................................... 68
3.6 Instrument Validity ...................................................................................... 69
3.7 Instrument Reliability ................................................................................... 70
3.8 Data Collection Procedures .......................................................................... 72
3.9 Data Analysis Techniques ............................................................................ 73
3.10 Ethical Considerations ................................................................................ 74
CHAPTER FOUR
DATA ANALYSIS, PRESENTATION, INTERPRETATION AND
DISCUSSION
4.1 Introduction .................................................................................................. 75
4.2 Response Rate .............................................................................................. 75
4.3 Demographic Characteristics of Respondents ............................................... 77
4.3.1 Distribution of Principals and Teachers by Gender .................................... 77
4.3.2 Highest Academic Qualifications of Principals and Teachers ..................... 80
4.3.3 Working Experience of Teachers and Principals ........................................ 82
4.4 Demographic Information of Schools Studied .............................................. 84
4.4.1 Distribution of Schools by Category .......................................................... 84
4.4.2 School Type .............................................................................................. 88
4.4.3 Distribution of Schools by the Number of Streams .................................... 89
4.5 Adequacy of School Physical Facilities and Quality of Education ................ 91
4.5.1 Adequacy of School Physical Facilities in Schools .................................... 91
viii
4.5.2 Bivariate Correlation Between School Physical Facilities and Quality of
Education .................................................................................................. 98
4.5.3 Adequacy of School Physical Facilities and Quality of Education ............ 100
4.5.4 Influence of Adequacy of School Physical Facilities on Quality of Education
................................................................................................................ 104
4.5.4.1 Influence of Adequacy of School Physical Facilities on KCSE Mean Score
............................................................................................................. 106
4.5.4.2 Influence of Adequacy of School Physical Facilities on Transition Rate
............................................................................................................. 109
4.5.4.3 Influence of Adequacy of School Physical Facilities on the Mean Number
of Trophies Won in Co-curricular Activities ......................................... 112
4.6 Teacher Motivation and Quality of Education ............................................ 115
4.6.1 Bivariate Correlation Between Teacher Motivation and Quality of Education
........................................................................................................................ 120
4.6.2 Teacher Motivation Levels and Quality of Education .............................. 122
4.6.3 Influence of Teacher Motivation on Quality of Education ........................ 126
4.6.3.1 Influence of Teacher Motivation on KCSE Mean Score ........................ 129
4.6.3.2 Influence of Teacher Motivation on Student Transition Rate................ 132
4.6.3.3 Influence of Teacher Motivation Levels on Mean Number of Trophies
won by a School in Co-curricular Activities .......................................... 135
4.7 School Financial Resources and Quality of Education ................................ 139
4.7.1 Adequacy of Financial Resources in Schools ........................................... 142
ix
4.7.2 Bivariate Correlation Between School Financial Resources and Quality of
Education ............................................................................................... 144
4.7.3 Relationship Between School Financial Resources and Quality of Education
.............................................................................................................. 146
4.7.4 Influence of School Financial Resources on Quality of Education ........... 150
4.7.4.1 Influence of School Financial Resources on KCSE Mean Score ........... 153
4.7.4.2 Influence of School Financial Resources on Student Transition Rate .... 155
4.7.4.3 Influence of School Financial Resources on Mean Number of Trophies
Won in Co-curricular Activities ............................................................ 158
4.8 Teaching and Learning Resources and Quality of Education ...................... 161
4.8.1 Bivariate Correlation Between Teaching and Learning Resources and
Quality of Education ............................................................................... 164
4.8.2 Adequacy of Teaching and Learning Resources and Quality of Education
........................................................................................................................ 165
4.8.3 Influence of Adequacy of Teaching and Learning Resources on Quality of
Education ............................................................................................... 170
4.8.3.1 Influence of Adequacy of Teaching and Learning Resources on KCSE
Mean Score .......................................................................................... 172
4.8.3.2 Influence of Adequacy of Teaching and Learning Resources on Student
Transition Rate ...................................................................................... 175
4.8.3.3 Influence of Adequacy of Teaching and Learning Resources on Mean
Number of Trophies Won in Co-curricular Activities............................ 177

x
4.9 Joint Influence of Administrative Factors on Quality of Education ............. 180
4.10 Joint Influence of Administrative Factors on KCSE Mean Score .............. 183
4.11 Joint Influence of Administrative Factors on Student Transition Rate ....... 186
4.12 Joint influence of administrative factors on mean number of trophies won in
co-curricular activities .............................................................................. 189
CHAPTER FIVE
SUMMARY, CONCLUSION AND RECOMMENDATIONS
5.1 Introduction ................................................................................................ 193
5.2 Summary of the Study ................................................................................ 193
5.3 Summary of the Major Findings ................................................................. 194
5.3.1 Findings Based on Hypothesis HO1 ........................................................ 194
5.3.2 Findings Based on Hypothesis HO2 ........................................................ 197
5.3.3 Findings Based on Hypothesis HO3 ........................................................ 200
5.3.4 Findings Based on Hypothesis HO4 ........................................................ 203
5.3.5 Contribution of Administrative Factors on Parameters of Quality of
Education.......................................................................................................... 206
5.4 Conclusions of the Study ............................................................................ 209
5.5 Recommendations of the Study .................................................................. 212
5.6 Suggestions for Further Research ............................................................... 214
REFERENCES............................................................................................... 215

xi
APPENDICES
Appendix A: Letter of Introduction to the Respondents .................................... 228
Appendix B: Principal’s Questionnaire ............................................................ 229
Appendix C: Teacher’s Questionnaire .............................................................. 234
Appendix D: Observation Guide ...................................................................... 238
Appendix E: Map of Kisii County .................................................................... 239
Appendix F: Map of Kitui County .................................................................... 240
Appendix G: Map of Nairobi County ............................................................... 241
Appendix H: NACOSTI Research Authorization ............................................. 242
Appendix I: Research Permit ............................................................................ 243
xii
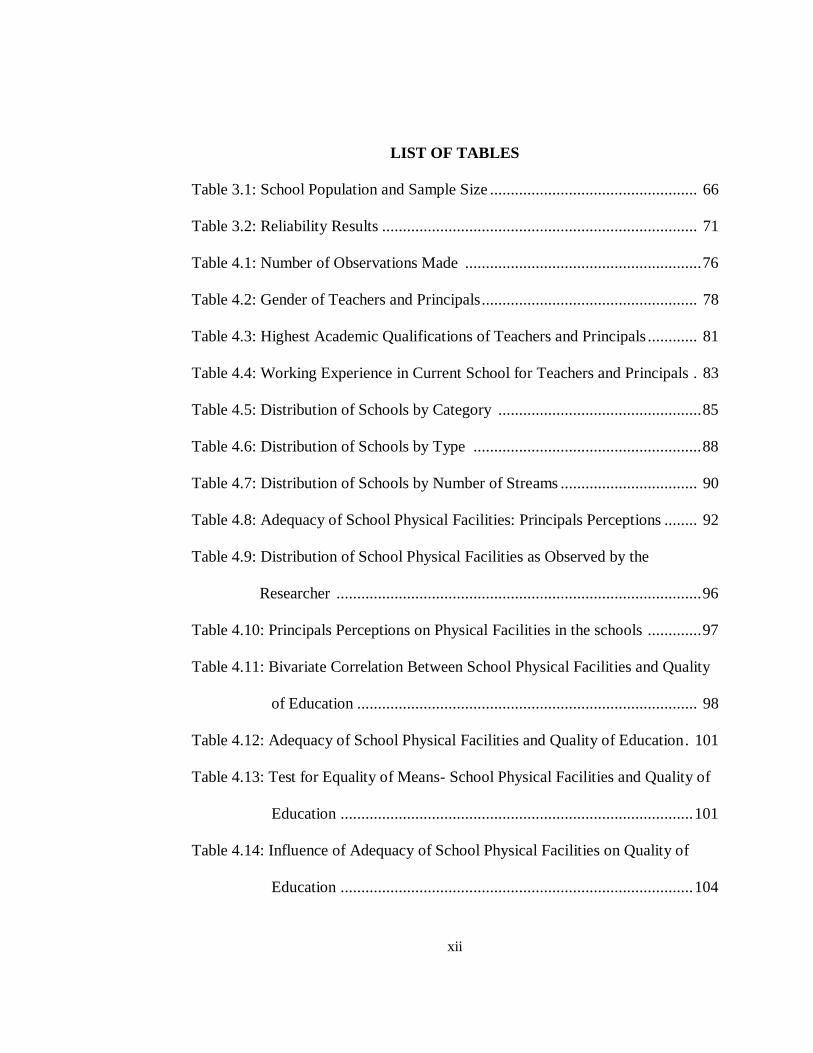
LIST OF TABLES
Table 3.1: School Population and Sample Size .................................................. 66
Table 3.2: Reliability Results ............................................................................ 71
Table 4.1: Number of Observations Made ......................................................... 76
Table 4.2: Gender of Teachers and Principals .................................................... 78
Table 4.3: Highest Academic Qualifications of Teachers and Principals ............ 81
Table 4.4: Working Experience in Current School for Teachers and Principals . 83
Table 4.5: Distribution of Schools by Category ................................................. 85
Table 4.6: Distribution of Schools by Type ....................................................... 88
Table 4.7: Distribution of Schools by Number of Streams ................................. 90
Table 4.8: Adequacy of School Physical Facilities: Principals Perceptions ........ 92
Table 4.9: Distribution of School Physical Facilities as Observed by the
Researcher ........................................................................................ 96
Table 4.10: Principals Perceptions on Physical Facilities in the schools ............. 97
Table 4.11: Bivariate Correlation Between School Physical Facilities and Quality
of Education .................................................................................. 98
Table 4.12: Adequacy of School Physical Facilities and Quality of Education . 101
Table 4.13: Test for Equality of Means- School Physical Facilities and Quality of
Education ..................................................................................... 101
Table 4.14: Influence of Adequacy of School Physical Facilities on Quality of
Education ..................................................................................... 104

xiii
Table 4.15: Influence of Adequacy of School Physical Facilities on KCSE Mean
Score ........................................................................................... 107
Table 4.16: Influence of Adequacy of School Physical Facilities on Student
Transition Rate from Form 1 to 4 ................................................. 110
Table 4.17: Influence of Adequacy of School Physical Facilities on Mean Number
of Trophies Won in Co-curricular Activities ................................ 113
Table 4.18: Teachers Responses on their Level of Motivation ......................... 117
Table 4.19:Teachers Perceptions on their Motivation Levels ........................... 119
Table 4.20: Bivariate Correlation Between Teacher Motivation and Quality of
Education..................................................................................... 121
Table 4.21: Teacher Motivation Levels and Quality of Education .................... 123
Table 4.22: T- test for Equality of Means—Teacher Motivation Levels and
Quality of Education .................................................................... 124
Table 4.23: Influence of Teacher Motivation on Quality of Education ............. 127
Table 4.24: Influence of Teacher Motivation Levels on KCSE Mean Score ..... 130
Table 4.25: Influence of Teacher Motivation Levels on Student Transition Rate
..................................................................................................... 132
Table 4.26: Influence of Teacher Motivation Levels on Mean Number of Trophies
Won in Co-curricular Activities ................................................... 136
Table 4.27: Principals’ Responses on Sources of School Financial Resources 140
Table 4.28: Principals Responses on Adequacy of School Financial Resources
.................................................................................................... 141

xiv
Table 4.29: Bivariate Correlation Between School Financial Resources and
Quality of Education .................................................................... 145
Table 4.30: Adequacy of School Financial Resources and Quality of Education
.................................................................................................... 146
Table 4.31: Test of Equality of Means-School Financial Resources and Quality of
Education ..................................................................................... 148
Table 4.32: Influence of School Financial Resources on Quality of Education. 151
Table 4.33: Influence of School Financial Resources on KCSE Mean Score.... 154
Table 4.34: Influence of School Financial Resources on Student Transition Rate
...................................................................................................... 154
Table 4.35: Influence of School Financial Resources on Mean Number of
Trophies Won in Co-curricular Activities ...................................... 159
Table 4.36: Teachers’ Responses on Adequacy of Teaching and Learning
Resources .................................................................................... 162
Table 4.37: Bivariate Correlation Between Teaching and Learning Resources and
Quality of Education ..................................................................... 164
Table 4.38: Adequacy of Teaching and Learning Resources and Quality of
Education ..................................................................................... 167
Table 4.39: Test for Equality of Means- Teaching and Learning Resources and
Quality of Education .................................................................... 168
Table: 4.40: Influence of Adequacy of Teaching and Learning Resources on
Quality of Education .................................................................... 170

xv
Table 4.41: Influence of Adequacy of Teaching and Learning Resources and
KCSE Mean Score ........................................................................ 173
Table 4.42: Influence of Adequacy of Teaching and Learning Resources on
Student Transition Rate ................................................................ 175
Table 4.43: Influence of Adequacy of Teaching and Learning Resources on the
Mean Number of Trophies Won in Co-curricular Activities 178
Table 4.44: Joint Influence of Administrative Factors on Quality of Education 181
Table 4.45: Joint Influence of Administrative Factors on KCSE Mean Score .. 184
Table 4.46: Joint Influence of Administrative Factors on Student Transition Rate
..................................................................................................... 186
Table 4.47: Joint Influence of Administrative Factors on Mean Number of
Trophies Won in Co-curricular Activities ...................................... 190

xvi
LIST OF DIAGRAMS
Diagram 2.1: Interrelationships of Administrative Factors and Quality of
Education. ................................................................................... 62

xvii
ABBREVIATIONS AND ACRONYMS
AIDS Acquired Immune Deficiency Syndrome
ASAL Arid and Semi - Arid Lands
BA Bachelor of Arts
EFA Education For All
FDSE Free Day Secondary Education
FPE Free Primary Education
HIV Human Immunodeficiency Virus
IGAs Income Generating Activities
INSET In-service Training
KCSE Kenya Certificate of Secondary Education
KNEC Kenya National Examinations Council
MDGs Millennium Development Goals
MEd Master of Education
MoE Ministry of Education
MoEST Ministry of Education Science and Technology
NCDF National Constituency Development Fund
PA Parents Association
PGDE Post Graduate Degree in Education.
PISA Programme for International Assessment
SACMEQ South African Consortium for Monitoring Educational Quality

xviii
SDGs Sustainable Development Goals
SPSS Statistical Package for Social Sciences
TMSS International Mathematics and Science Study
TSC Teachers Service Commission
UNESCO United Nations Educational Scientific and Cultural Organization
UNICEF United Nations Childrens Fund
xix
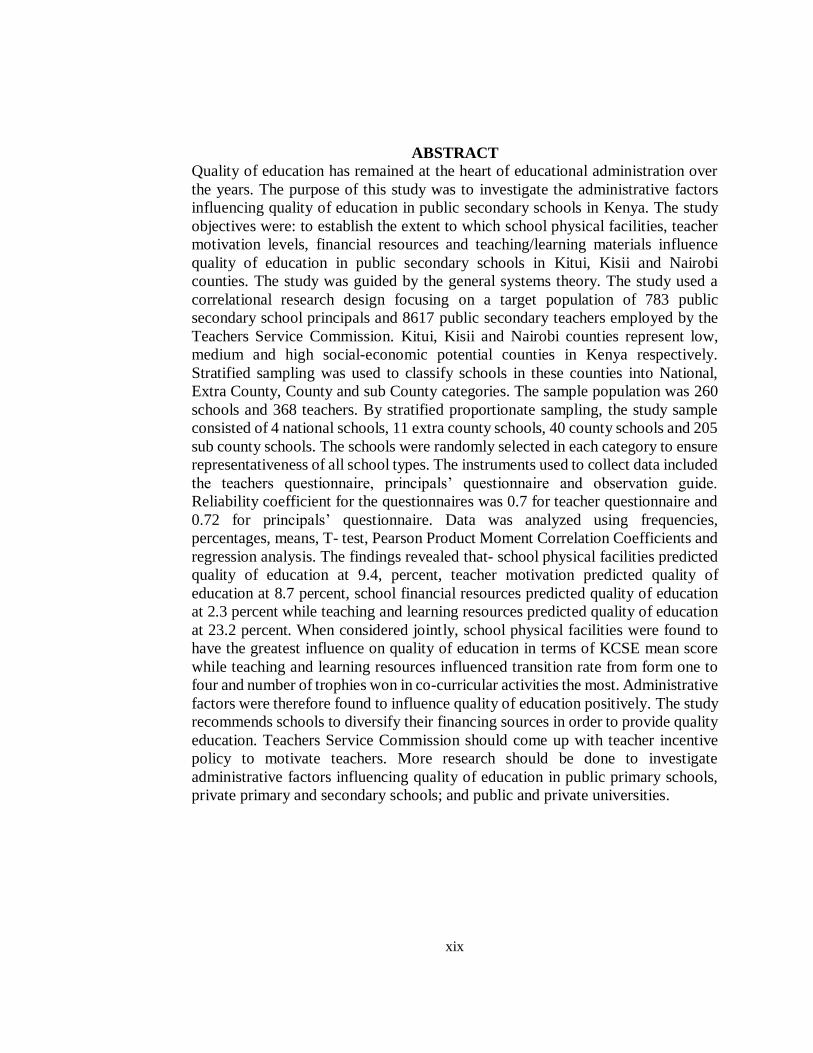
ABSTRACT
Quality of education has remained at the heart of educational administration over
the years. The purpose of this study was to investigate the administrative factors
influencing quality of education in public secondary schools in Kenya. The study
objectives were: to establish the extent to which school physical facilities, teacher
motivation levels, financial resources and teaching/learning materials influence
quality of education in public secondary schools in Kitui, Kisii and Nairobi
counties. The study was guided by the general systems theory. The study used a
correlational research design focusing on a target population of 783 public
secondary school principals and 8617 public secondary teachers employed by the
Teachers Service Commission. Kitui, Kisii and Nairobi counties represent low,
medium and high social-economic potential counties in Kenya respectively.
Stratified sampling was used to classify schools in these counties into National,
Extra County, County and sub County categories. The sample population was 260
schools and 368 teachers. By stratified proportionate sampling, the study sample
consisted of 4 national schools, 11 extra county schools, 40 county schools and 205
sub county schools. The schools were randomly selected in each category to ensure
representativeness of all school types. The instruments used to collect data included
the teachers questionnaire, principals’ questionnaire and observation guide.
Reliability coefficient for the questionnaires was 0.7 for teacher questionnaire and
0.72 for principals’ questionnaire. Data was analyzed using frequencies,
percentages, means, T- test, Pearson Product Moment Correlation Coefficients and
regression analysis. The findings revealed that- school physical facilities predicted
quality of education at 9.4, percent, teacher motivation predicted quality of
education at 8.7 percent, school financial resources predicted quality of education
at 2.3 percent while teaching and learning resources predicted quality of education
at 23.2 percent. When considered jointly, school physical facilities were found to
have the greatest influence on quality of education in terms of KCSE mean score
while teaching and learning resources influenced transition rate from form one to
four and number of trophies won in co-curricular activities the most. Administrative
factors were therefore found to influence quality of education positively. The study
recommends schools to diversify their financing sources in order to provide quality
education. Teachers Service Commission should come up with teacher incentive
policy to motivate teachers. More research should be done to investigate
administrative factors influencing quality of education in public primary schools,
private primary and secondary schools; and public and private universities.

1
CHAPTER ONE
INTRODUCTION
1.1 Background to the Study
Education is one of the major instruments for a country’s economic and social
development. It is the main source of human capital which is essential to sustained
economic growth. Education contributes to reducing poverty and birthrates,
increasing health, strengthening the institutions of civil society and national
capacity building and improving governance (World Bank, 2005; 2007; 2008a).
In particular, secondary education is a crucial tool for generating the opportunities
and benefits of social and economic development (World Bank, 2007). It equips
students with competencies, knowledge and skills necessary and relevant to the
labour market while harnessing their attitude and values to ensure that they become
active and productive citizens of their communities (World Bank, 2007; World
Bank, 2008a).
Furthermore, globalization, the increased importance of knowledge as a driving
force in economic development and the consequent skill-based nature of
technological changes in the workplace are putting pressure on national
governments to modernize their secondary education system in order to produce
graduates who are well prepared for work and for further learning (World Bank,
2007). Consequently, secondary education has therefore become a focus of

2
increasing policy debate especially on issues of quality and relevance in economic
development (World Bank, 2005; World Bank, 2008a).
Many definitions of quality in education exist owing to the complexity and
multifaceted nature of the concept. According to UNICEF (2000), quality education
encompasses learners who are healthy and ready to learn, quality environments that
provide adequate resources and facilities and relevant content that is reflected in
the curriculum along with adequate materials to support acquisition of knowledge
and skills. It also encompasses quality teaching and learning processes that instill
meaningful learning experiences to students and quality outcomes that are linked
to national goals and positive participation in the society. UNESCO (2015a; 2015b)
defines quality education as that which addresses desirable characteristics of
learners, processes, facilities, learning materials, context, governance and
management, and learning outcomes; quality teaching and learning processes and
education inputs to achieve meaningful learning experiences for students. On
learning outcomes, UNESCO is categorical that they should not be limited to
academic achievements only but also include non-cognitive domains like co-
curricular activities and be continually assessed as an integral part of teaching and
learning (UNESCO, 2014; UNESCO, 2015b)
Shekytan (2015) describes education as a system consisting of education inputs like
school buildings, materials, teachers and facilities; interaction process, and

3
outcomes. According to Shektan, education is a system and questions regarding its
quality must focus on each component of the system. Shekytan further observes
that elements of education system are interrelated and a serious deficit in one is
likely to have implications of quality for others. Thus, quality of school buildings,
classrooms, toilets and libraries, the presence of adequate instructional materials
and textbooks and working conditions of teachers influence the ability of teachers
to undertake certain instructional approaches hence quality of student academic
grades (UNESCO, 2015a; UNESCO, 2015b; UNICEF, 2000). The World Bank and
UNESCO list examples of quality of school education indicators as including
students grades in national examinations, completion rates, participation rates,
school leadership, parent participation, school resources, equity, educational
expenditure, class size, teacher incentives, teacher education and training
(UNESCO, 2014; World bank, 2008a).
Despite the complexity of the concept of quality of education, there is consensus
that quality education should focus on healthy learners, desirable learning
environment characterized by adequate resources and facilities, desirable learning
processes and expected learning outcomes that encompass knowledge, skills, and
attitudes that are linked to national goals of education and are essential in positive
participation in the society (Shekytan, 2015; UNESCO, 2015b; UNICEF, 2000).
Further, there is consensus that all elements of quality education are interrelated
and interdependent. There is further concurrence that the definition of quality of

4
education should be left open to change and evolution based on information and
changing contexts, and that continues assessment and improvement can focus on
any or all of these dimensions. There is consensus that quality of education is
primarily realized in the school set up and the school principal is key in its
achievement (Shektan, 2015; UNESCO, 2015a; UNESCO, 2015b; UNICEF,
2000).
Recognizing the important role of education as a main driver of development,
countries world over have continually committed to provision of high quality
education to their citizens at all levels of their education systems (UNESCO, 2014;
UNESCO, 2015a). Indeed, it is the quality, not the quantity of schooling that
explains variation in labour market outcomes between individuals and differences
in economic growth rates between countries (World Bank, 2014a).
However, as more countries achieve universal primary schooling, demand for
education is moving to higher levels and the world is witnessing an explosion of
individuals and families aspirations for secondary education (World Bank, 2005).
The massive demand for secondary education has led to improved access but at the
same time threatened the quality of education offered at this level. Secondary
education has, therefore, become a focus of increasing policy debate and analysis
worldwide especially on the challenge of improving access without compromising
its quality (World Bank, 2005; UNESCO, 2015b). During the World Forum for

5
Education in Incheon, Korea, nations committed with a sense of urgency to a single
renewed education agenda of ensuring inclusive and equitable quality education for
all (UNESCO, 2015b). The forum committed to improving learning outcomes by
strengthening education inputs, processes and evaluation of learning outcomes in
order to measure progress (UNESCO, 2015b). It also committed to empower
teachers, motivate and support them within efficient and effective education
systems. Inspite of these global commitments to provision of quality education,
countries world over are at different levels of attaining quality education.
Finland is a major international leader in the provision of quality secondary
education. It is the world leader in the academic performance of its secondary
school students and has consistently ranked in the very top countries in all
Programmes for International Assessment (PISA) examinations in the past decade
(OECD, 2011). It is renowned for high performance that is remarkably consistent
across schools. The country has the least variation in learning outcomes within
schools and the gap within schools between the top and bottom achieving students
is extraordinarily modest (OECD, 2011). Finnish schools serve students well
irrespective of their family background or socio-economic status and consequently,
the country has become a tourist destination for education and policy makers on
secrets of education success (OECD, 2011).

6
Finland attributes its exemplary performance to a number of interrelated factors.
The schools are small in size with modern buildings that excellently support
students learning, and all school finances are strictly focused on the classroom
(OECD, 2011). The Finnish teaching profession is noble and attracts graduates at
par with medicine and law (OECD, 2011). The teachers hold Master’s degree in
education and their teaching subjects, and their salaries are high as compared to
other European countries. The teachers enjoy fully paid professional development
course each year and other incentives. They also enjoy the trust and respect from
society owed to their success in helping virtually all students to become successful
learners (OECD, 2011).
The United States of America has shown high commitment to provision of quality
education to its youth (Parsons, 2011). According to the Report Card on American
Education and the Comprehensive Facility Assessment Report, if children fail in
class they are likely to fail in life (Leidnar & Myslinski, 2014). According to
Leidnar and Myslink, the obligation of all American States is to ensure that all
children have access to quality education. American school physical facilities,
associated buildings and grounds are well maintained and safe for teachers and
students (Leidnar & Myslinski, 2014; Parsons, 2011). Most schools have
technology infrastructure to support students learning and the facilities excellently
meet the educational needs of school programs housed at the site. In addition,
Students benefit from state funded digital programmes to supplement classroom
7
teaching (Leidnar & Myslinski, 2014; Parsons, 2011). Each American state has set
a minimum academic achievement grade for public schools and adapted education
policy focusing on quality testing and improving teacher quality and accountability
mechanisms. Students from low and middle socio economic backgrounds benefit
from education vouchers, scholarships and free or subsidized lunch. Students in
America record high averages in PISA and International Mathematics and Science
Study (TIMMs) examinations (Leidnar & Myslinsk, 2014; National Centre for
Education Statistics, 2011; OECD, 2012).
Singapore is also a benchmark country for quality education (Sclafan & Lim 2008;
Singapore Ministry of Education 2010; OECD, 2010). The country has utilized
education as the key tool for economic development. The Singaporean government
has successfully matched supply and demand of education and skills, transforming
Singapore from a developing country to a modern industrial economy in a decade
(Singapore Ministry of Education, 2010; OECD, 2010). The government through
the Ministry of Education has consistently focused at raising the quality of
education and helping each child reach his/her fullest potential (Singapore Ministry
of Education, 2010). Consequently, Singapore education system has remained
consistently at or near the top of major world education ranking systems (OECD,
2010; UNESCO, 2011).

8
According to the Singapore Ministry of Education (2010), teacher quality is a key
determinant of quality education. This concurs with OECD (2011) remark that the
quality of an education system cannot exceed the quality of its teachers. Singapore
provides one of the most coherent systems of teacher education in the world
(Sclafani & Lim 2008). The country employs high standards for selecting teachers
and deeply supports them throughout their career. At undergraduate level, students
who aspire to become teachers are financially supported by Singapore Ministry of
Education through tuition fees and they are also given stipend while in college
(Sclafan & Lim 2008). In the job, there are perks and rewards to retain them. On
first posting, teachers are inducted into their new schools and put in structured
mentorship programmes in the schools. Equally, newly appointed school principals
are attached to experienced principals for mentorship and given opportunity to
network, visit overseas education systems and engage in innovation projects.
Singapore has performance based compensation structure that ensures that teachers
are duly recognized for their contributions and motivated towards excellence
(Singapore Ministry of Education, 2010). Based on performance in academics and
co-curricular activities, outstandingly performing teachers get bonuses annually
amounting to their three months’ salary. Awards are also given to individuals or
team contributions to creativity, cost saving, and peer support. The teachers also
receive between four hundred to seven hundred Singapore dollars to spend on
computer training, buying software, subscribing to journals and joining
9
professional organizations. To enhance teacher development, the country has the
leading academy for professional excellence in education. The teachers get more
than one hundred hours to attend professional development courses in the academy
every year. To retain teachers and enable them concentrate in teaching, teachers are
paid salaries competitive to that of engineers in the public service (Sclafan & Lim,
2008). The Singaporean teaching profession is also characterized by faster
promotions that are performance based and high status and recognition for teachers
by the society. Singapore schools have a modern generation facilities that support
a wide range of educational programs and a variety of teaching and learning
resources (OECD, 2011). Singapore ranks second or third in PISA and TIMMS
examinations (OECD, 2010).
Most countries in South Asia and Sub-Saharan Africa have made significant
progress in achieving their quantitative enrollment goals but the quality of
education remains low (World Bank, 2012; 2014a). The regions have the largest
share in student variation in test-scores, and low student attainment in standardized
examinations (World Bank, 2008b; 2014a). According to World Bank reports,
school factors are more important in explaining quality of education in both South
Asia and Sub-Saharan Africa than socio-economic factors (World Bank, 2014a).
School variations arise in presence and performance of teachers in school, quality
of teachers, quantity and quality of school physical facilities, learning/teaching

10
resources , school fees and other charges among other school internal factors
(World Bank, 2005; 2008a; 2008b; 2011a ; 2011b; 2012; 2014a; Veer spoor, 2008).
A study by the World Bank on student learning in South Asia describes learning
outcomes in Pakistan, India, and Bangladesh as low compared to learning outcomes
in East Asia (World Bank, 2014a). Actually, the study terms learning outcomes in
Sri Lanka as being too low. These findings are supported by another study by the
World Bank on human development in South Asia (World Bank, 2014b).
According to the two reports, education in South Asia is characterized by poor
quality of learning environments and poor conditions of facilities. Schools lack
drinking water, toilets, furniture, textbooks, teaching materials and teachers’
guides. Teachers in South Asia are also poorly trained and their masterly of content
is low (World Bank, 2014a). The Training programs in South Asia are short and
opportunities for teaching practice before student graduation are low. The newly
posted teachers in South Asian schools receive little or no support from older
teachers and the teaching profession is highly characterized by low salaries,
massive turnover by teachers to other jobs and high level of teacher absenteeism
from school (World Bank, 2014a; World Bank, 2014b).
A study by the World Bank on the quality of education in Maldives indicate that
education quality is a major challenge facing the country (World Bank, 2012). The
learning outcomes in the secondary schools in Maldives are low as evidenced in

11
summative examinations and teachers lack motivation to effectively engage
learners in class because of low salaries and lack of incentives to improve teacher
and student performance (World Bank, 2012). To enhance learning outcomes in
Maldives, the World Bank suggests professional development of teachers, teacher
induction, teacher motivation and a well- designed incentive system for teachers.
The report also recommends for provision of adequate infrastructure and teaching
resources (World Bank, 2012).
Veerspoor (2008) notes that quality of secondary education in Sub Saharan Africa
is a key ingredient for economic growth in the region. Following the Education for
All (EFA) campaign and the completion of the Millennium Development Goals
(MDGs), there has been tremendous rise in primary school enrollment and
completion of primary school education in Africa and consequent high demand for
secondary education ( Sujewa, 2010; Veerspoor, 2008). This has well translated to
higher secondary school access but on the other hand it has posed a big challenge
on quality. Enrollment rates in secondary schools has outpaced the increase in
resources resulting in shortages of instructional materials, poorly stocked libraries,
and overstretched facilities. Teachers in most African countries are underpaid
forcing them to look for other part time jobs or be in constant search of a better
paying job hence chronic teacher absenteeism. Shortage of classrooms, science
laboratories, libraries characterizes education in the Sub-Saharan Africa. These
challenges have led to low learning outcomes in the region, as evidenced in low
12
scores in standardized examinations. In fact, student performance in international
tests in Sub Saharan Africa is lower than any other part of the world (Veerspoor,
2008).
Mulken, Chapman, Dejaeghere and Leu (2007) carried out a study on recruiting,
retaining, and retraining secondary school teachers in Sub-Sahara Africa. The study
was based on country studies in Ethiopia, Ghana, Guinea, Madagascar, Tanzania,
and Uganda. The study termed quality of secondary education in these countries as
generally low as compared to other developing countries in South Asia and East
Asia. This was blamed on lack of effective policies that focus on high quality
secondary education. According to the study, the quality of educational outcomes
is highly dependent on the quality of the teachers, and quality of teachers is highly
influenced by the existing policies on teacher recruitment and management. The
study observed that most countries in the Sub-Saharan Africa lack strong policies
on attraction and retention of quality teachers. Consequently, their education is
characterized by inefficient teacher recruitment practices, poor teacher preparation
approaches, low teacher salaries, poor working conditions leading to chronic
teacher absenteeism and hence poor student achievement.
Lewin (2008) asserts that poverty as a factor cannot be underestimated in
contributing to low quality of education in the Sub-Saharan Africa. According to
Lewin, secondary school education in the Sub-Saharan Africa is expensive relative

13
to the per capita Gross Domestic Product. Using Benin, Ghana, Zambia. Tanzania,
Rwanda, and Uganda as country case studies, Lewin observes that secondary
schools enroll just a quarter of the region’s secondary school age children and those
enrolled attend school irregularly with less than a third of a cohort completing
secondary school. To mitigate the effects of poverty at school, Lewin advocates for
increased budget allocations to secondary schools, introduction of subsidies and
waivers for those who cannot afford to pay school fees, scholarships for low income
children, fundraising by parents and teachers associations, alumni contributions,
regulation of non-tuition fees and engaging in other school income generating
activities.
A study by Najjumba and Marshall (2013) on quality of education in Uganda
blamed the low student academic achievement on inappropriate pedagogical
practices and insufficient teaching and learning materials. According to the study,
teacher class attendance, school size and availability of toilets and first aid devices
are the leading predictors of student performance. The study did not find significant
relationship between teacher masterly of content and student academic
achievement. Neither did it find a significant relationship between textbooks and
student academic achievement. On the contrary, Veerspoor & Joshi (2013) term the
quality of education in Ethiopia as being unacceptably low and blames it on poor
teacher preparation and poor teacher management at school level. According to
Veerspoor and Joshi, teacher motivation is the most critical element of effective

14
teacher performance however, teachers in Ethiopia lack clear performance goals
and clear incentive system to help them achieve the goals leading to poor student
performance.
In Kenya, provision of quality basic education has been the priority of the
government since independence (Republic of Kenya 1999; 2007; 2010; 2013;
Ministry of Education Science and Technology (MoEST), 2002; 2005; 2014;
Ministry of Education (MoE), 2012; 2017). The introduction of Free Primary
Education (FPE) in 2003 and Free Day Secondary Education (FDSE) in 2008 led
to significant rise in secondary school enrolment in Kenya. Enrollment rose from
1.3 million students in 2008 to 2.8 million students in 2017 (MoEST, 2014; RoK,
2018). Increased enrollment overstretched secondary school resources and
provision of quality education to the rapidly expanding population remained a
challenge in most schools (MoEST, 2005; 2014; MoE, 2012). Kenyan secondary
school students are faced with inadequate learning spaces, high teacher
absenteeism, and low education attainment with 88.5 percent of candidates not
achieving the minimum grade of C+ and above for admission to university (RoK,
2018). Survival rate from form 1 to 4 dropped from 95 percent in 2015 to 91 percent
in 2016 with cohort retention rates of below 90 percent for both boys and girls
(RoK, 2017; RoK, 2018). By 2013, the national average for secondary school
dropout rate was 7.8 percent with some regions recording participation rates below

15
35 percent (KIPPRA, 2013). This implies that dropout rates in some regions is very
high and much of the government resources allocated to schools is wasted.
The national assessment report by the South African Consortium for Monitoring
Educational Quality (SACMEQ), on conditions of schooling and the quality of
education in public primary schools in Kenya indicate that school factors such as
teacher characteristics, school physical facilities and classroom environment
influence quality of education in Kenyan public primary schools to a great extent
(Guantai, Kariuki & Nzomo, 2001; Obiero, Nzomo & Onsomu, 2005; Wasanga,
Ogle & Wambua, 2012). According to the SACMEQ reports, pupils who learn in
permanent built classrooms perform much better academically as compared to
students in dilapidated classrooms. The reports also revealed that pupils in schools
with adequate teaching and learning resources performed better in Mathematics as
compared to pupils in schools with inadequate teaching and learning resources.
The National Assessment System for Monitoring Learner Achievement
(NASMLA) , also attest to the fact that student academic achievements in public
primary schools in Kenya are more influenced by factors such as teacher
characteristics, classroom environment, school environment, school resources and
head teacher characteristics (Kenya National Examinations (KNEC), 2010).

16
Further, the SACMEQ and NASMLA reports indicate that school head teachers,
through the Boards of management and Parents Association undertake major
administrative responsibilities that impact on instructional quality and the overall
management of the school. These include teacher professional support, curriculum
implementation, teacher deployment, acquisition of teaching and learning
materials, school community relationships, and ensuring conducive learning
environment (KNEC, 2010; Wasanga, et al, 2012). Olembo, Wanga, Karagu,
(1992), term these responsibilities as administrative tasks that are accomplished
through the administrative process of planning, organizing, coordinating,
influencing, communicating and evaluating the results. The headmaster, on behalf
of the Board of management, supervises and evaluates the extent to which
education policies and objectives are achieved by the school (Olembo, et al 1992).
This study sought to investigate the administrative factors influencing quality of
education in public secondary schools in Kenya. The study sought to determine the
extent to which adequacy of school physical facilities, teacher motivation levels,
adequacy of school financial resources and teaching and learning materials
influence quality of education in public secondary schools in Kenya.
1.2 Statement of the Problem
Quality of education has become a pertinent issue in both developed and developing
countries. This is based on the fact that the economy of any country is a function of

17
its human capital. Kenya has demonstrated its commitment to provision of quality
education by introducing Free Day Secondary Education in which the government
subsidizes secondary school fees by 22,224 Kenya Shillings per year and
households pay annual boarding fees of 53,554 Kenya shillings for National and
Extra county schools, and 40,535 Kenya shillings for County secondary schools.
Students in Day secondary schools also receive a capitation of 22,224 Kenya
shillings each from the government and parents do not pay any fees for them (MoE,
2017). A large proportion of the subsidy goes to the purchase of teaching and
learning resources such as textbooks, exercise books and science equipment to
enhance quality of education in public secondary schools.
The government has also continued to support provision of school infrastructure
through National Constituency Development Fund (NCDF), Arid and Semi-Arid
Lands (ASAL) and pockets of poverty grants; and school infrastructure upgrader
under vision 2030 flagship project (MoEST, 2014; MoE, 2012). To ensure quality
education, the government trains and employs university graduates who specialize
in two teaching subjects and benefit from a merit based promotion system (MoEST,
2005; MoEST, 2014). Schools are encouraged to generate more resources through
income generating activities, alumni and partnership with private sector (MoEST,
2014; MoE, 2008).

18
Despite the government efforts to provide quality secondary education, student
academic achievement remains low with 88.5 percent of students missing the
minimum university entry grade of C+ (KIPPRA, 2013; MoEST, 2014; RoK,
2018). In 2017, only 11.5 percent of candidates who sat for the Kenya Certificate
of Secondary Examination attained grade C+ and above, qualifying to join
university. This was a drop from 15.6 percent in 2016 (RoK, 2017). The number of
students who scored ‘A’ minus and above declined from 14,754 in 2015, to 4,786
and 2,856 in 2016 and 2017 respectively while the number of students who scored
grade ’D’ plus and below increased significantly to comprise 65 percent of total
KCSE candidature in 2016 and 2017 (KNEC, 2016; RoK, 2017; RoK, 2018).
Survival rate from Form 1 to 4 dropped from 99 percent (100 percent for boys and
97 percent for girls) in 2006, to 95 percent and 91 percent in 2015 and 2016
respectively with cohort retention rates mere below 90 percent for both boys and
girls (Onsomu, Muthaka , Ngware, & Manda, 2006; RoK, 2017; RoK, 2018).
This scenario has raised concern over the future of education in Kenya. Most
studies that have attempted to address quality of education in Kenya have limited
themselves to small administrative units with no consideration of the influence of
socio-economic potential of an area on students’ performance in Kenya Certificate
of Secondary Education (KCSE). This trend prompted the researcher to investigate
the administrative factors influencing quality of education in public secondary
19
schools in Kenya with focus on three counties with varying socio-economic
potentials.
1.3 The Purpose of the Study
The purpose of this study was to investigate the administrative factors influencing
quality of education in public secondary schools in Kenya.
1.4 Objectives of the Study
The study was guided by the following objectives:
i. To determine the extent to which school physical facilities influence quality of
education in public secondary schools in Kitui, Kisii and Nairobi Counties.
ii. To establish the extent to which teacher motivation influences quality of education
in public secondary schools in Kitui, Kisii and Nairobi Counties.
iii. To establish the extent to which school financial resources influence quality of
education in public secondary schools in Kitui, Kisii and Nairobi Counties.
iv. To determine the extent to which teaching and learning resources influence quality
of education in public secondary schools in Kitui, Kisii and Nairobi Counties.
1.5 Research Hypotheses
The study was guided by the following hypotheses:
HO1: There is no statistical significant relationship between school physical
facilities and quality of education in public secondary schools in Kitui, Kisii and
Nairobi Counties.

20
Ha1: There is statistical significant relationship between school physical facilities
and quality of education in public secondary schools in Kitui, Kisii and Nairobi
Counties.
HO2: There is no statistical significant relationship between teacher motivation and
quality of education in public secondary schools in Kitui, Kisii and Nairobi
Counties.
Ha2: There is statistical significant relationship between teacher motivation and
quality of education in public secondary schools in Kitui, Kisii and Nairobi
Counties.
HO3: There is no statistical significant relationship between school financial
resources and quality of education in public secondary schools in Kitui, Kisii and
Nairobi Counties.
Ha3: There is statistical significant relationship between school financial resources
and quality of education in public secondary schools in Kitui, Kisii and Nairobi
Counties.
HO4: There is no statistical significant relationship between teaching and learning
resources and quality of education in public secondary schools in Kitui, Kisii and
Nairobi Counties.
Ha4: There is statistical significant relationship between teaching and learning
resources and quality of education in public secondary schools in Kitui, Kisii and
Nairobi Counties.

21
1.6 Significance of the Study
The study could be significant to the Ministry of Education in that the findings can
be used by national education administrators, planners and policy makers in
allocation of education resources and formation of policies geared towards
achieving quality education. The study could also be significant to secondary
school principals as it addresses the contribution of administrative factors on quality
of education, a process in which they are most influential. The study may give them
an insight on how school resources blend to determine quality of school
programmes. This study could also be useful to private education providers,
sponsors and the school management for it will provide information on standards
to be maintained in provision of quality education. The study findings could add to
the existing knowledge on quality of education in schools. It could also serve as a
basis from which other researchers could carry out further research.
1.7 Limitations of the Study
Quality of education is not a new concept in Kenya. However available literature
on quality of education in public secondary schools in Kenya was insufficient for
comprehensive literature review.
1.8 Delimitations of the Study
The study was delimited to public secondary schools in Kenya. The respondents of
the study were public secondary school principals and teachers since they are privy
22
to study information. The study was restricted to school financial resources, teacher
motivation, learning and teaching resources and school physical facilities as
variables of the study.
1.9 Basic Assumptions of the Study
The study held the following assumptions:
i. That respondents would provide truthful and honest responses.
ii. That all public secondary schools in Kenya are beneficiaries of the Free Tuition
Secondary Education fund.
iii. That provision of adequate and quality physical facilities, learning and teaching
materials; motivated teachers and school financial resources have a significant
influence on quality of education.
1.10 Definition of Significant Terms
Administrative Factors refers to factors or conditions within the direct control of
the school such as school financial resources, teacher motivation, school physical
facilities, and teaching and learning resources that could positively or negatively
influence the quality of education.
Physical Facilities refer to school buildings such as classrooms, halls, dormitories,
libraries, laboratories, stores; playgrounds, swimming pools and other sporting
facilities.

23
Public Secondary Schools refer to day and boarding schools owned and run by
state government in conjunction with parents.
Quality of Education Refers to the worth of an education system as demonstrated
in student performance in national examinations, co-curricular activities, transition
rates, graduation rates, enrollment rates.
Teacher Motivation refers to the willingness, drive, or desire to engage in “good
teaching”, which is further more acted upon. Motivated teachers are professionally
supported and recognized.
Teaching and Learning Resources refers to materials that aid the teaching and
learning processes such as textbooks, laboratory equipment, exercise books,
assessment materials, computers, chalks and sport equipment like balls, drama kits
and musical instruments among others.
Transition Rate refers to the percentage of a cohort of students enrolled in form
one in a school year who are expected to reach form four.
1.11 Organization of the Study
The study was organized into five chapters. Chapter one consisted of the
background to the study, statement of the problem, purpose of the study, objectives
of the study, research hypotheses, significance of the study, limitations of the study,
delimitations of the study, assumptions of the study and definition of the significant
terms. Chapter two dealt with the concept of quality of education, school physical
facilities and quality of education, teacher motivation levels and quality of

24
education, school financial resources and quality of education, teaching and
learning resources and quality of education, summary of literature review,
theoretical framework and conceptual framework. Chapter three consisted of
research design, target population, sample size and sampling procedure, research
instruments, data collection procedures and data analysis techniques. Chapter four
consisted of data analysis, presentation and interpretation. Chapter five consisted
of summary, conclusions, recommendations and suggestions for further research.

25
CHAPTER TWO
REVIEW OF RELATED LITERATURE
2.1 Introduction
This section reviews literature under the following sub-topics. The concept of
quality of education, physical facilities and quality of education, teacher motivation
and quality of education, school financial resources and quality of education,
teaching and learning resources and quality of education, summary of literature
review, theoretical framework and conceptual frame work.
2.2 The Concept of Quality of Education
According to UNICEF (2000), quality education encompasses learners who are
healthy and ready to learn; quality environments that provide adequate resources
and facilities; relevant content reflected in the curriculum and materials to support
acquisition of knowledge and skills; quality teaching and learning processes that
instill meaningful learning experiences to students and quality outcomes that are
linked to national goals and positive participation in society. UNESCO (2015a)
defines quality education as education addressing desirable characteristics of
learners, processes, facilities, learning materials, context, governance and
management, and learning outcomes; quality teaching and learning processes and
education inputs to achieve meaningful learning experiences for students.
According to the UNESCO (2000) and UNICEF (2015a) reports, quality of school
buildings, classrooms, toilets and libraries influence the presence of adequate
26
instructional materials and textbooks, working conditions of teachers and students
and the ability of teachers to undertake certain instructional approaches hence
quality student grades (UNICEF, 2000).
According to OECD (2010), quality of education must be defined on the light of its
role in the development of cognitive skills of learners, nurturing their creative and
emotional growth and helping them acquire the right values and attitudes for
national development. According to the OECD (2010) report, quality education
should also ensure equitable distribution of the learning opportunities without any
form of discrimination. UNESCO (2011) decries the use of academic examinations
as the only indicator of quality of education in developing countries. Quality
education should focus on both formal, non-formal and informal education with an
aim of developing an all-round person (UNESCO, 2005; UNESCO, 2011).
UNICEF (2000), posits that the aim of education is developing a child holistically,
and schools play an important role of planning and offering a variety of learning
experiences in form of formal, non-formal and informal curriculum. A study by
Kapelinyang and Lumumba (2017) found out that student participation in soccer,
athletics and music had a positive influence on their talent identification and
development. The students were also found to have better academic performance
when compared to those who did not participate in co-curricular activities.
According to UNICEF (2000), the school environment should provide varied

27
learning experiences that helps the learner to develop intellectually, socially,
physically and spiritually.
UNESCO (2015) and World Bank, (2008a) emphasize on schools as important
centres of improving quality of education as opposed to policy documents and
strategic plans which may not lead to any real improvements in the schools. The
findings of the World Bank study in South Asia indicate that quality of education
in developing countries is largely influenced by school related factors than socio-
economic factors (OECD, 2011). Schools then must have sufficient financial
human and physical resources to provide quality education; otherwise the
disparities in resources will turn the schools into potential sources of inequities in
distribution of student learning opportunities and educational outcomes (Baker,
2012; OECD, 2011; Savasci & Tomul, 2013; UNESCO, 2015).
According to UNESCO (2002), there is a direct relationship between inputs and
outputs to education. More learning experiences are realized in education systems
with adequate inputs as opposed to systems with inadequate education inputs
(OECD, 2011; Veerspoor, 2008; Saeed & Wain, 2011; World Bank, 2014a). In
Kenya, national assessment reports on conditions of schooling and quality of
education in public primary schools in Kenya indicate that school factors such as
teacher characteristics, school physical facilities and classroom environment
influence quality of education in Kenyan primary schools to a great extent (Guantai,
28
Kariuki, & Nzomo, 2001; Obiero, Nzomo, & Onsomu, 2005; Wasanga, Ogle, &
Wambua, 2012). Although primary and secondary education is classified as basic
education in Kenya, much is yet to be done on quality of education in public
secondary schools in Kenya.
2.3 Physical Facilities and Quality of Education
Quality and adequate school physical facilities are fundamental in teaching,
learning and achievement of students (Saeed & Wain, 2011). Physical facilities set
the stage for learning to occur and influence the working culture of the school
(Kuuskorpi, Kaarima & Gonzalez, 2011). School principals must plan, organize
and coordinate the provision and maintenance of the school buildings and grounds
to ensure quality learning environment (Olembo et al, 1992).
Research shows that classrooms, libraries, laboratories, playgrounds,
administration blocks, staff houses, dormitory halls and sanitary facilities have a
significant positive influence in the performance of the students and their teachers
(Saeed & Wain, 2011). In addition, school physical facilities play a crucial role in
attracting and retaining students and teachers in school (World Bank, 2014a). The
facilities determine access to secondary education as well as transition from
primary to secondary education (World Bank, 2014a). The international leaders in
provision of quality education have invested heavily in school physical
infrastructure (OECD, 2011; Parsons, 2011). In Singapore, schools have facilities

29
that support a wide range of educational programs including use of information
technology in teaching and learning. Schools have classrooms that are upgraded to
the latest standards, media resource libraries, information technology learning
resource rooms and pastoral care rooms. Other facilities include outdoor
amphitheatres, art studios, outside running tracks, indoor running tracks and turf
fields (OECD, 2011). American schools have well maintained buildings that do an
excellent job of meeting the educational needs of school programmes housed at the
sites. The schools are safe for teachers and students and have technology
infrastructure to support teaching and learning (Parsons, 2011).
Jenkinson and Benson (2010) conducted a study to establish barriers to teaching of
physical education in Victorian state secondary and primary schools in Australia.
The study sampled 270 state secondary and primary schools. The respondents were
physical education teachers and students. Data was collected using an online
questionnaire. Respondents were asked to rate the barriers on a scale of one to ten,
with one being the least factor affecting the teaching of physical education and ten
as the most significant barrier. Data was analyzed using means, percentages and
Pearson chi square. Results from both teachers and students indicated that
inadequate facilities like swimming pools, playgrounds were the greatest barrier to
teaching of physical education in both primary and secondary schools in Victorian
state in Australia. The study used descriptive methods only to analyze data. The
present study used both descriptive and inferential statistics like T-test and

30
regression analysis to analyze data and focused on the extent to which physical
facilities influences quality of education in public secondary schools in Kenya.
A study by Bhunia, Shit and Duary (2012) on assessment of school infrastructure
in primary and upper primary level in Medinipur District in India found school
infrastructure to be key in not only improving educational grades but also school
attendance and completion. According to the study, adequate toilets, protective
school fencing wall, library, playgrounds, kitchen and classrooms are the heart of
quality of education. However, the study noted that there was disparity of the
facilities in Menipur district. The North, Central and South Eastern parts of the
District had adequate facilities while North West and South West parts had
inadequate school physical facilities. Academic achievement of learners was found
to be positively correlated to adequacy of school facilities. This study was done in
primary schools in India and the current study filled the gap by studying the extent
of influence of adequacy of school physical facilities in public secondary schools
in Kenya.
Fillardo and Jeffrey (2017) conducted a study on adequacy and equity of school
infrastructure in America. They discovered that public school facilities have broad
benefits not only to students but also to the teachers and school community.
Adequate and quality school facilities like toilets, libraries, staffrooms and offices,
classrooms and science laboratories enhance student academic achievement and

31
help reduce teacher turnover. According to the study, Poor facilities are a barrier to
delivery of education and implementation of education reforms. Adequate school
facilities increase student enrolment, local property value and the confidence of
parents and the community on the school. There was need to have effective school
administrators who are able to engage the community for purposes of generating
ideas on how to acquire and maintain adequate and quality school infrastructure.
Fillardo and Jeffrey (2017) further observed that, there was need for school
administrators to ensure that the school mission, values, and strategic plans include
school physical facilities. The school administrators should regularly train the
students, staff and communities on the use of facilities especially the automated
ones to cut down on maintenance costs. Further, they should sensitize the
community on how they can partner and benefit from the school facilities. The
administrators should inspect the facilities regularly to ensure safety and organize
facilities workshops for both the parents and community. When there is a shared
partnership between parents, civic society, community and government, on behalf
of the students; public school places become transformative and every student
becomes successful. The study was carried out in the United States of America
while the current study sought to establish the extent to which adequacy physical
facilities influence quality of education in public secondary schools in Kenya.

32
Javier and Marcella (2011) carried out a study to investigate whether school
infrastructure and resources do matter on student achievement. The study aimed at
determining the incidence of school infrastructure and resources and its impact on
the performance of primary education in Latin America. Respondents included
180,000 pupils in 3rd and 6th grades of primary education from 3,000 schools, in 15
countries in Latin America. The findings indicated that adequacy of facilities like
laboratories, libraries, sports grounds, music and computer rooms were positively
associated to student academic achievement in math and language. The study was
carried out in public primary schools in Latin America. The present study sought
to establish the extent to which school physical facilities influence quality of
education in public secondary schools in Kenya.
A study by Curveys (2011) to establish the impact of school infrastructure on the
well-being of students in Flemish secondary schools in Belgian region of Flanders
found empirical evidence indicating that students learning in schools with adequate
and quality school physical infrastructure record high academic grades as compared
to students learning in poor quality facilities. The adequacy of school physical
infrastructure was found to affect the performance of technical subjects more than
art subjects. This is because technical subjects need workshops and training rooms.
The study was conducted in Flemish secondary schools in Belgian region. The
current study was carried out in public secondary schools in Kenya.
33
In Kenya, school physical facilities are a major determinant of transition from
primary to secondary school (MoEST, 2014). Student admission to form one is
pegged on available facilities in the existing secondary schools. By 2014, the
transition rate was 77 percent and the country had 7,325 public secondary schools
and 921 private secondary schools (MoEST, 2014). Mwaka and Njogu (2014)
found out that establishment of day schools leads to reduced cost of schooling hence
enhancing access. The Kenya Institute for Public Policy Analysis (KIPPRA) (2009)
had projected an urgent need of 8600 classrooms, new day schools and expansion
of existing infrastructure following introduction of FDSE, and upsurge of primary
school graduates due to Free Primary Education. Although provision of physical
facilities is a responsibility of the parents, the government has continued to support
building of school facilities through NCDF, pockets of poverty grants, and
infrastructure grants to ASAL areas (MoE, 2012). This is meant to improve access
and education quality - major challenges facing Kenya secondary education
(MoEST, 2014).
A study by Kapelinyang and Lumumba (2017), to establish the determinants of
academic performance in public secondary schools in Kapenguria division, Kenya,
found a positive relationship between student participation in co-curricular
activities and their academic performance. However, the Principals lamented the
poor state and inadequacy of co-curricular facilities like play grounds, swimming
pools and sport equipment which tend to limit student participation in co-curricular

34
activities. This study sought to establish the influence of the school physical
facilities on not only co-curricular activities, but also on student academic
performance and transition to next grades in public secondary schools in Kenya.
Odhiambo and Shinali (2015) carried out a study to find out the factors that
determine access and progression in public primary and secondary schools in Narok
North Sub County in Kenya. The study used descriptive research design. By
random sampling, the study selected 24 primary head teachers, 4 secondary school
principals and 3 quality assurance officers to participate in the study. A total of 68
standard eight pupils and 44 form one students were also selected to participate in
the study. Questionnaires and interview guides were used to collect data. Data was
analyzed using percentages and means. From the findings, school physical facilities
are major determinants of access and progression to higher grades in both public
primary and secondary schools in Narok County. About 69 percent of secondary
school principals revealed that their schools had inadequate classrooms,
laboratories and libraries. About 75 percent of primary school head teachers
indicated that their schools had inadequate desks, playgrounds, classrooms and
libraries. The study blamed low quality education in Narok County on inadequate
school physical facilities. The study was descriptive in nature and failed to show
the extent of influence of the physical facilities on quality of education, a gap that
this study intends to fill. It was also limited to a small administrative unit (one sub-
county county) in Narok County, and therefore, the results could not be generalized.

35
Omae, Onderi, and Mwebi (2017) conducted a study on quality implications of
learning infrastructure on performance in secondary education in Kisii County,
Kenya. The study used sequential explanatory design within mixed methods
approach. The study targeted 334 secondary school principals, 334 senior teachers
and 9 education officers. The study used stratified random sampling to select 181
principals and 181senior teachers. Using saturated sampling technique, the study
selected 9 education officers as participants. Data was collected using
questionnaires, interview guides and document analysis. Descriptive and inferential
statistics were used to analyze data. The findings indicate that libraries, science
laboratories, administrative offices, electricity, latrines and classrooms contributed
immensely to student academic achievement. The study was conducted in one
County and used sequential explanatory design while the current study targeted all
public secondary schools in Kenya and used correlational research design.
2.4 Teacher Motivation and Quality of Education
Teacher motivation is currently viewed as the most important variable on learner
motivation (Rogers & Vegas, 2009; Sujewa, 2010). A motivated teacher is one who
not only feels satisfied with his or her job, but also empowered to strive for
excellence and growth in instructional practice (Basil, 2013). It is the responsibility
of the school principal to assess the needs of the teaching staff and advise the school
stake holders on how to satisfy them (Basil, 2013).

36
According to OECD (2011), the quality of any education system cannot exceed the
quality of its teachers. Consequently, world leaders in provision of quality
education have a well-designed incentive system for attracting, developing and
retaining teachers (OECD 2011; Singapore Ministry of Education, 2010; Parsons;
2011). Singapore and Finland remunerate teachers a salary competitive to that of
engineers, lawyers and medical doctors. The teachers enjoy more perks of rewards
and reinforcement based on job performance. Outstanding performers in student
achievement get promotions and annual bonuses amounting to three months salary
and individuals or teams excelling in creativity, cost-saving and peer support are
also rewarded (OECD, 2011; Singapore Ministry of Education, 2010). Singapore
teachers get fully sponsored study leaves and additional money to subscribe to
educational journals or buy educational software (OECD 2011). The teachers are
supported by their schools through teacher mentorship programmes, classroom
observation and fully paid in-service teacher development courses (Sclafani & Lim,
2008; Singapore Ministry of Education, 2010). Whereas Finnish teachers enjoy
high degree of autonomy in their teaching, prestige and recognition from the
society; American states have an established Teacher Incentive Fund (TIF) to
reward high performing teachers and principals (Humphrey, Gallagher, Yee &
Campbell, 2012; OECD, 2011).
In developing countries, most schools are faced with what amounts to teacher crisis
(Bennell & Akyeampong, 2007; Sujeewa, 2010). Schools are characterized by poor

37
teacher pay, declining social status for teachers, and poor working conditions
(Sujewa, 2010). This leads to high level of teacher absenteeism, sub-standard
teaching and loss of teachers to better paying professions (Basil 2013; Sujewa,
2010). A study by Sujewa on teacher motivation in Sri Lanka found a correlation
between Sri Lanka student achievement and motivation of teachers. According to
Sujewa, Sri Lankan teachers experience increased work load, poor teacher pay and
lack of school moral support. This affects student academic performance hence low
quality of education. The findings are consistent with research study conducted by
Basil (2013) on teacher motivation in Public secondary schools in Nyamagana
District in Tanzania. The current study explored the extent to which teacher
motivation levels influence quality of education in public secondary schools in
Kenya.
A study by Lauwerier and Akkari (2015) on quality of basic education in Sub-
Saharan Africa asserts that quality in primary education in Sub-Saharan Africa is
inseparable from the quality of the teachers involved. The study observed that
working conditions of teachers in the Sub Saharan Africa form the heart of any
examination of quality of basic education in the region. According to the study,
teachers in Sub-Saharan Africa work in disadvantageous environments. Their
average class sizes are bigger (1:45) than the rest of the world. The teachers in the
region earn low salaries and most of the schools lack formal teacher incentives.
Other than South Africa, majority of the countries have no career prospects for their

38
teachers and the teaching profession lacks societal respect. The study focused on
quality of education in public primary schools while the focus of the current study
was on quality of education in public secondary schools in Kenya
Lauwerier and Akkari (2015) opined that school heads, together with school
management were the most important players in attainment and maintenance of
quality of education in the Sub-Saharan region. They bear the sole responsibility of
engaging and ensuring that teachers, students, parents and the community have
warm relationships and they work together to ensure that the schools achieve
educational objectives. Warm relationships help keep teachers in school for long
especially in rural areas hence more learning time and better academic
achievements. This study sought to explore the extent to which teacher motivation
influences quality of education in public secondary schools in Kenya.
Mwaura, Mbugua, and Kagema (2017) carried out a study to assess secondary
school teachers participation in co-curricular activities in Kirinyaga central Sub-
county in Kenya. The study aimed at identifying co-curricular activities in public
secondary schools in Kirinyaga central Sub-county and the challenges faced by
teachers as they engage in co-curricular activities. The study used descriptive
survey design and randomly sampled 7 principals and 125 teachers to participate in
the study. Data was collected using questionnaires and interview schedules, and
analyzed using means, frequencies and standard deviations. Findings indicate that

39
sports, drama, music and science related curriculum activities were the common
co-curricular activities in public secondary schools in Kirinyaga Central Sub-
county. Majority of the teachers (77.7%) acknowledged that co- curricular activities
contribute to mental, physical and social development of the learner. However 60.3
percent of the teachers reported to have no intention of participating in co-curricular
activities because the activities are not part of end year teacher appraisals, and
hence have no incentive attached to them at school level and national level.
Teachers did not receive any certification for participating in co-curricular activities
and the activities were not considered for assessment and certification both
internally and nationally. This scenario indicates low quality education as teachers
concentrate on examinable subjects only. The study was limited to one sub-county
in Kirinyaga County hence the findings cannot be generalized. This study sought
to establish the extent to which teacher motivation influences quality of education
in public secondary schools in Kenya.
A study by Save the Children Organization (2011) on teacher motivation linked
higher teacher motivation to high student academic grades. According to the study,
teachers in developing countries need intrinsic and extrinsic motivational supports.
Intrinsic motivational supports like career development, recognition and support,
were found to be more effective in sustaining teacher effort and professionalism in
the long run and more readily enhanced student achievement. However, before the
teacher is motivated to meet his/her intrinsic needs, and hence student needs, his/her

40
basic needs must be met extrinsically through adequate remuneration, performance
based incentives and bonuses, provision of quality and adequate teaching and
learning materials, and a conducive learning environment. Only when these basic
needs of a teacher are met, can then, be possible for higher order needs, which offer
true job satisfaction be realized.
The findings of Save the Children (2011) report revealed that teachers in
developing countries face several challenges in the course of discharging their
duties. The teachers workload was found to be very high and not commensurate
with their salaries. Heavy workload negatively affect the morale of a teacher to
work and make teachers resist applying new teaching methods that are learner
friendly. Teacher salaries, especially in Africa, were found to be very low and
irregularly paid. The study observed that teachers who do not earn enough money
to live on, resort to secondary jobs like private tuition which undermine their
performance in their primary job as a teacher. The study established that teachers
in developing countries also lacked recognition and prestige. Many teachers
indicated that respect for their job had decreased in the eyes of students, parents,
government and the larger society. Teachers earned low salaries compared to civil
servants and could be assigned administrative jobs that are menial in nature like
serving meals and offering security services on school functions. Students joining
the teaching profession came from the lower performing academic tracks in the
education system, making teaching to be viewed as a job for the less skilled or the

41
last resort for the skilled. This scenario demoralized teachers making them view
teaching as a stepping stone to school administration or better jobs elsewhere. The
teachers kept pursuing other courses in anticipation for a better job, thereby missing
more classes, hence lowering quality of education in their schools.
The Save the Children (2011) report also observed that teachers in developing
countries did not participate in formation of education policies. They were viewed
as passive implementers of education reforms. The report recommended for an
establishment of merit awards for best performing teachers and a structured in
service training programme for teachers. Further recommendations require the
schools to partner with the community to start income generating activities to
support teacher incentive programmes. An establishment of a public education
campaign on the importance of teachers was also considered important in restoring
the image of a teacher in the society. These could enhance working conditions of
teachers and boost their morale to offer quality education. The countries that
participated in the study included Uganda, Ethiopia and Egypt, Afghanistan,
Pakistan, Tajikistan, Nepal, Bolivia, Philippines and Nicaragua. This study sought
to establish the extent to which teacher motivation influence quality of education
in public secondary schools in Kenya.
Okumu, Maithya, and Ronoh (2017) carried out a study on the influence of co-
curricular activities on students KCSE academic performance in Nakuru County.
42
According to the study, students who participated in drama had better grades in
KCSE as opposed to students who did not engage in drama. However, the study
found out that 86 percent of the club patrons had no professional training to coach
the students due to lack of funds in the school. Majority of the teachers reported to
have had little support and motivation from the school administration hence making
them reluctant to enroll a big number of students in drama club. This could affect
identification and exploitation of student talent and hence the number of awards
won by a school in co-curricular activities. The study was carried out in one county
(Nakuru) hence limiting generalization of the findings. The current study sought to
investigate the extent to which teacher motivation influences quality of education
in public secondary schools in Kenya.
A study on gender stereotypes in teachers running of co-curricular activities at
Rhodes Park and Silver Springs schools in Zambia established that majority of the
teachers who coach students in co-curricular activities hardly receive incentives
from the school administration (Muninde, 2016). According to the study, only 3 out
of 62 teachers who coached their teams to national levels that year received
certificates to appreciate their effort. This raised their chances of being promoted
to higher positions. The other teachers did not receive even verbal appreciation
from the school. This could affect the morale of the teachers and consequently the
number of students who could participate in co-curricular activities hence few
43
trophies to be won by a school. The study was carried out in Zambia while the
current study was conducted in public secondary schools in Kenya.
Although the supply of teachers in Kenya is higher than the demand and student
teacher ratio is lower than recommended (32:1 instead of 35:1) Kenya experiences
a teacher absenteeism rate of 15 percent of a teacher’s annual working time and a
high teacher turnover to other better paying professions (MoEST, 2014).
Understanding teacher motivation in Kenya may help in understanding its
contribution to provision of quality education.
2.5 School Financial Resources and Quality of Education
Issues of education funding and adequacy of school financial resources have been
highly debated both in developing and developed countries Mascitti-Miller (2013).
Policy makers, tax payers and other education stakeholders do wonder whether
schools that receive the most in terms of financial resources produce most in terms
of student academic performance (Johnson, 2004). According to Mascitti-Miller,
adequacy of school financial resources and student academic achievement are
highly related. Citing an example of America, Mascitti-Miller claims that the
amount of wealth in a school shapes the quality of its education. Research by Miles
and Frank (2008) identified commonalities among high performing schools in
America. According to Miles and Frank, high performing schools have adequate
finances that are focused to offering a variety of programmes that ensure students

44
meet rigorous academic learning standards, create individual student attention and
develop structures for personal relationships between students and teachers. In
addition, the schools allocate more fiscal resources to teacher professional
development, teacher incentives and other motivational activities aimed at retention
of highly effective teachers. This concurs with the findings of the World Bank
(2008a) in Tanzania. According to the World Bank report, Tanzania’s best
performing schools are financially advantaged with support from parents,
educational partners and high budgetary allocations from the government.
On the contrary, Veerspoor (2008) argues that quality school leadership is the most
significant factor in improving educational quality. According to Veerspoor,
quality of education depends primarily on the way schools are managed more than
on the abundance of available resources, and the capacity of schools to improve
teaching and learning is strongly influenced by the quality of the leadership
provided by the head teacher (World Bank, 2008b). Although financial constraints
are real and secondary education is costly, what the available resources are spent
on and how efficiently they are used is as important as the level of resources
available (Veerspoor, 2008). Therefore, head teachers need training on financial
management, strategic planning, and human resource management in order to
effectively mobilize resources and efficiently allocate and use them to achieve
institutional goals (Veerspoor, 2008; World Bank, 2008b).

45
Amos and Koda (2018) carried out a study to find out the contribution of school
based Income Generating Activities (IGAS) on quality of education provision in
secondary schools managed by the catholic diocese of Moshi, Tanzania. The study
was conducted in 12 secondary schools managed by Catholic Diocese of Moshi and
adopted a cross-sectional survey research design. The respondents were 168
students, 72 teachers and 12 principals. Data was collected using questionnaires
and document analysis. Findings revealed that Cash crops, vegetables and poultry
farming were the main school-based IGAs practiced in the secondary schools.
Other IGAs included cattle rearing, school shop, piggery and bakery. The IGAs
helped the schools to have reliable source of food. They provided a balanced diet
for the students, teachers and other staff. The surplus from IGAs was sold and the
money used to cushion the school from financial shocks like non-payment of school
fees by parents. The money helped the schools to motivate students, teachers and
support staff. The IGAs was a reliable source of funds that supported provision of
academic remedial classes for weak students, provision of additional funds to
support co-curricular activities like sport gear and funds for purchasing more
teaching and learning resources.
According to Amos and Koda (2018) Secondary schools that had more IGAs
produced more funds for financing quality education. The schools with more IGAs
performed much better in national examinations as compared to schools with
limited number of IGAs. The IGAs provided practical learning lessons (bakery,

46
entrepreneurship, crop and animal production) to students and enabled the schools
to cope with external financial shocks without necessarily passing down budgetary
adjustments to students` parents. Profit made from school projects was used to
purchase quality teaching and learning materials and development of physical
facilities like science laboratories and libraries. IGAs funds were also used for
installation of solar and generators as sources of power, employing qualified
teachers to supplement existing staff, catering for in-service training of staff
members, building and maintenance of staff and student accommodation and
provision of free education to children from poor families. The schools received
financial support from the Catholic Church as a sponsor and from school Alumni.
The funds supported infrastructure development and children from poor families.
The study was conducted in secondary schools in Tanzania while the current study
explores the influence of adequacy of school financial resources in public
secondary schools in Kenya.
A study by Shahidul, and Karim (2015) on factors contributing to school drop- out
among the girls revealed that school costs especially school fees was the major
reason for girls dropping out of school. According to the study, 47 percent of girls
and 30 percent of boys drop out of elementary and junior secondary school in China
every year due to lack of school fees. The study revealed that 27 percent of boys
and 30 percent of girls in public secondary schools in South Africa drop out of
school every year due to lack of school fees. The study advocates for consideration

47
of school income generating activities as an alternative way of raising more
finances in schools. The current study sought to establish the extent to which school
financial resources influence quality of education in public secondary schools in
Kenya.
In Kenya, the government and households are the main sources for financing
secondary education (MoEST, 2005; MoEST 2014; MoE, 2017). In 2008, the unit
cost of secondary education was estimated at KES 10,265 for day schools and KES
28,892 for boarding schools, exclusive of teachers’ salaries. Findings of the
Mwiraria Task Force led to the current unit cost of 22,244 Kenya shillings for day
schools, 75,798 Kenya shillings for National and Extra county schools, and 62,779
Kenya shillings for County schools (MoEST, 2014; MoE, 2017). The government
remits free tuition capitation grant of KES 22,244 per pupil to all regular secondary
schools, and households are charged school fees of KES 53,554 and KES 40,535,
for students in National and Extra-county schools, and county schools respectively.
In addition, the government pays examination fees for end of course examination
(Kenya Certificate of Secondary Examination (KCSE) for all form four candidates
to the examining body (Kenya National Examinations Council (KNEC). Parents
pay for expenditure items including uniform, transport, boarding expenses,
infrastructure development and other expenses after approval by Board of
Management and County Education Officer (MoEST, 2014; MoE, 2017).

48
Despite the guidelines on fees, secondary schools in Kenya have continued to
charge prohibitive fees and other levies from parents (Republic of Kenya, 1999;
MoEST, 2014; Glennerster, Kremer, Mbithi & Takavarasha, (2011)). Some
national schools charge as high as KES 120,000 per student per year, county and
extra county schools charge as high as KES 93,317 and KES 62,393 respectively
(MoEST, 2014). Bloating of school fees guidelines has led to demonstrations from
all stakeholders against school principals (MoEST, 2014). A study by Orodho
(2014) on education financing mechanisms in Kenya found the government
capitation grant to be grossly inadequate to ensure provision of quality education
in public secondary schools in Kenya.
Nyamwega (2016) raised concern on the amount of time wasted by students who
are sent home for school fees. According to Nyamwega almost all public secondary
schools in Kenya face serious financial difficulties due to failure of parents to pay
school fees. Government subsidy to secondary education is often disbursed late and
is hardly enough to serve students adequately. The principals therefore send
students home for school fees forcing them to waste more learning time and hence
lowering quality of education in the schools. According to Nyamwega, the
government should stop controlling secondary school fees and allow schools to
charge fees in line with the rising cost of living in the country. The study was carried
out Nairobi County as an evaluation of IGAS projects in public secondary schools.
Eleven public secondary schools participated in the study and data was collected

49
using questionnaires and an observation guide. Data was analyzed using
percentages and means, and presented on frequency tables. Findings revealed that
IGAS earned the schools between Kshs 680,000 to Kshs 1,000,000 annually an
indication that IGAS is a profitable venture that schools can rely on to ease the
household contribution to secondary education and increase student retention and
performance. The study did not explore the influence of adequacy of school
financial resources on quality of education, a gap that this study intended to fill.
Nyangaresi, Onderi and Mwebi (2016) carried out a study on the influence of
school IGAS on student retention rates in public secondary schools in Kisii County.
The study was motivated by the effect of social economic status of learners on
secondary school retention rates. The target population was 60 principals, 95 class
teachers, 4267 form four students, 60 bursars and one sub county quality assurance
and standards officer. Simple random sampling was used to obtain 24 principals,
24 bursars, 38 class teachers, and 214 form four students. Purposive sampling was
used to select the quality assurance officer. Data was analyzed using frequencies
and percentages. Findings indicate that public secondary schools in Kisii County
engage in vegetable farming, dairy farming, poultry farming, sugarcane farming,
maize farming and hire of school facilities like halls, school bus and playgrounds
to the school community. The schools also received financial support and
scholarships for needy students from sponsors and private bodies like banks. IGAs
funds contributed enormously to school infrastructure development, easing

50
household support to secondary education. The IGAs funds also catered for
students break-tea, lunch and supper. It also catered for uniform for bright needy
students hence increasing retention rates and academic achievement.
Shavisa, Ndiku and Musasia (2016) carried out a study that sought to determine the
role of student characteristics in dropout rates among secondary school students in
Vihiga County, Kenya. They examined the school factors and social-economic
factors of the students. The study used descriptive survey design. The study
sampled 200 school drop outs using snowball method. Data was collected using a
questionnaire and analyzed using descriptive and inferential statistics. The findings
of the study show that lack of school fees and pressure from other school dropouts
were the leading cause of student dropping out of school in public secondary
schools in Vihiga County in Kenya. Inspite of FDSE, schools continue to charge
other levies like lunch fees, uniform fees and money for supplementary books; a
burden that students from poor families cannot afford to pay hence forcing them to
drop out of school. The study recommended a review of school fees policy and
suggested to have the government pay full school fees for every student irrespective
of the school he/she is attending. The study was limited to one County only (Vihiga
County) and did not seek the views of school principals on the extent to which
adequacy of school financial resources influence quality of education in the
schools. The current study targeted all public secondary schools in Kenya. It used
stratified and random sampling to select principals and teachers as respondents to

51
the study. The study sought to know the extent to which adequacy of financial
resources influence quality of education in public secondary schools in Kenya.
Odundo and Rambo (2013) conducted a study to determine the value added by
income-Generating Activities (IGAS) on the financial performance of public
secondary schools in terms of assets, liability and net worth. Findings revealed that
schools with IGAs were significantly different from non IGAs schools. Schools
with IGAs were wealthier than non-IGAs schools. The IGA schools were 1.9 times
more likely to own as many assets as schools not having IGAs. National schools
and other schools with a big number of students were more associated with IGAs
than newly established schools. These schools are also associated with high
performance in national examinations. The study recommended for formulation of
a policy to regulate IGA projects in schools and initiation of training programs for
school managers on IGA projects.
A study by Ogalo, Simatwa and Okwachi (2013), found school levy default, high
cost of education and child labour to be the main challenges facing school principals
in provision of quality education. Failure of parents to pay school fees promptly led
to delayed purchase of supplementary learning resources and insufficient
programmes to motivate teachers. The principals are left with no option other than
sending students home for school fees, and consequently forcing them to miss class
and others to eventually dropping out of school. The cost of secondary education

52
therefore remains to be a deterrent to access, enrolment and retention in Kenyan
secondary schools (Republic of Kenya, 1999; MoEST, 2005; MoEST, 2014). This
study sought to investigate the extent to which adequacy of school financial
resources influence quality of education in public secondary schools in Kenya.
Omukoba, Simatwa and Ayodo (2011) evidenced that most schools experience
fiscal distress and financial gaps that need school managers to engage in income
generating activities to enable schools to run efficiently. In their study on
contribution of income generating activities to financing secondary school
education in Kenya, a case study of Eldoret municipality, Omukoba et al observed
that the government fees guidelines which principals must adhere to and cost
sharing system still leave a financial gap in the schools. Schools in Eldoret
municipality were found to be engaged in poultry keeping, dairy farming, pig
rearing, fish farming, hire of classrooms during drama competitions, hire of play
grounds, renting out houses to the school staff, and hire of school bus to the
community. The funds collected from IGAS were used by the schools to build more
houses for the staff, build more classrooms, build laboratories, paint the school and
buy more land for expansion of the school. The findings indicated that the IGAS
projects contributed positively to the quality of education in the schools. However,
the study did not focus on the extent to which adequacy of school financial
resources influence students academic performance, transition rates and student

53
participation in co-curriculum activities, a gap that the current study intended to
fill.
Anyango and Orodho (2016) conducted a study to examine the main coping
strategies used in the management of resources in public secondary schools in
Mumias Sub- County. The study adopted a descriptive survey design. Purposive
and simple random sampling techniques were used to sample 25 principals, 200
teachers and 25 chairpersons of PTAs. Data was collected using questionnaires and
interview guides. The study established that most schools in Mumias Sub County
experienced resource constrains ranging from inadequate funding from the
government of Kenya under the Free Day Secondary Education fund and
overworked teachers. The most preferred coping mechanism was implementation
of school income generating activities and use of school Alumni as teachers to
supplement the existing teaching staff. The study did not show the extent to which
the challenges facing public secondary schools like inadequate funds influenced
quality of education, a gap that this study intended to fill.
Lwakasana and Getange (2016) carried out a study to examine the effects of income
generating activities in public secondary schools in Transmara Sub-county, Narok
County, Kenya. .The population for the study comprised of all principals, teachers
and bursars.A combination of purposive and stratified random sampling techniques
were applied to select a sample of 13 principals, 322 teachers and 13 bursars.

54
Questionnaries and interview schedules were the main instruments used to collect
data. The results of the study revealed that funds from income generating activities
eased financial burden on parents, increased enrolment in school, improved
academic performance and was used to motivate both students and teachers. The
income was insufficient to cater for physical facilities and also did not cater for
bursaries for needy students. Based on the findings, the study recommended that
IGAs should be encouraged and enhanced to support the academic programmes. It
further recommended that strategies be put in place to improve the income from
IGAs so that it can cater for needy students and improve physical facilities in
school. Whereas the study dealt with effects of IGAS activities in public secondary
schools in Transmara Sub County, the present study focused on the influence of
adequacy of financial resources derived from diverse sources including IGAS on
quality of education in public secondary schools in Kenya.
A review of Kenyan education system by Glennerster, et al (2011) to inform the
education investment strategy of the Government of Kenya, identified school fees
as the major obstacle to quality education in Public secondary schools in Kenya.
Despite government subsidy to secondary education and increased availability of
bursaries from NCDF, school fees still prevented many students from accessing
and completing secondary education. This is especially important for vulnerable
groups like orphans and the poor. Transition from primary to secondary level was
found to be very low and student performance at KCSE was very poor. Progression

55
rates to the next higher grade was low not because of repetition but dropouts. The
report advocated for merit scholarships for bright students, conditional cash
transfers especially for families of students who attend a minimum of 80 percent of
class hours, distributing vouchers for school uniforms especially for children from
poor families and educating both parents and students on economic returns of
education. These could reduce dropout rates and enhance academic achievement of
students.
2.6 Teaching and Learning Resources and Quality of Education
Teaching and learning resources play an important role in diminishing the effect of
socio-economic features in academic achievement and creating equal opportunities
for students (Savasci & Tomul, 2013). According to Asikhia (2010) adequate well
prepared teaching and learning resources determine the amount of learning that
takes place in a learning setting. Asikhia posits that quality learning materials
motivate students, maintain concentration and make learning more meaningful.
Veerspoor, (2008) argues that shortages of learning materials adversely affect
instructional effectiveness. Veerspoor claims that lack of quality teaching and
learning resources in Sub-Sahara Africa has greatly contributed to low quality of
education in the region. According to Veerspoor, provision of textbooks at the high
school level in developing countries is deplorable. A book to pupil ratio is 1:4 and
in other cases the only text book is on the hands of the teacher who uses it as the
basis for lessons. The World Bank study on students learning in South Asia also

56
emphasizes the significance of textbooks in students learning (World Bank, 2014a).
According to the World Bank report, textbooks have a positive impact in student
learning and they need to be adequate, kept relevant and delivered to schools in
time.
International research has consistently demonstrated the positive effects of
textbooks and other learning materials on student learning. In Greece, Mexico,
Poland, Turkey, Brazil, Lithuania, Indonesia, Serbia, Thailand, Tunisia, Uruguay
and Russian Federation, the school managers maintain that lack of teaching aids or
its poor quality hinder instruction quality (Savisci & Tomul, 2013). In PISA
countries 80 percent of the school managers reported that lack of adequate learning
resources hinder student achievement to a great extent (Ministry of National
Education, 2005; Savasci & Tomul, 2013). A study by the British Columbia
Teachers Federation (BCTF) found a significant relationship between well stocked
libraries and student achievement. According to the study, schools with libraries
with large book collections have higher average test scores than schools that have
libraries with fewer books (BCTF, 2012).
Fostering meaningful learning and motivation among students is a long-standing
concern for all educators. According to Allison (2012), twenty first century
learners expect teachers to create an active learning environment where they can
interact with the material, the instructor and their peers. Studying the effects of

57
multimedia learning materials on student academic achievements and attitudes in
science, Chundang, Singha, Adisak and Punchong (2012), Ercan (2014), and Figen
and Ozlen (2012) found out that multimedia teaching and learning materials
promote more effective learning, motivate learners and leads to higher academic
achievements. According to Figen and Ozlen, multimedia resources improve
student memory, problem solving skills, knowledge transfer and understanding,
and fulfills the need for deeper personal relationships in learning.
Javier and Marcella (2011) carried out a study to investigate whether school
infrastructure and resources do matter. The study aimed at determining the
incidence of school infrastructure and resources and its impact on the performance
of primary education in Latin America. Respondents included 180,000 pupils in 3rd
and 6th grades of primary education from 3000 schools, from 15 countries in Latin
America. The findings indicated that adequacy of textbooks in the library and the
number of computers in a school had the highest effect on student academic
achievement. The study was conducted in primary schools in Latin America. The
present study was conducted in public secondary schools in Kenya.
Shari, Howard and Ellan (2013) conducted a study to establish what works in
education in developing countries. The study observed that use of computers by
learners led to self - learning. According to the study, improving school quality with
additional resources also increased school enrolment by encouraging students to go
58
to school so that they can use the new resources. Findings of the study indicate that
provision of learning materials such as textbooks, posters, flipcharts and
chalkboards helped children follow the learning process easily. Teaching resources
were found to impact positively on student academic achievement, attendance and
dropout rates. This study investigated the extent to which teaching and learning
resources influence quality of education in public secondary schools in Kenya.
In Kenya, low education attainment at secondary school level is partly attributed to
inadequate learning and teaching resources (MoEST, 2005; MoEST, 2014).
Textbook to students ratio stand at 1:3 or higher especially in compulsory subjects
(MoEST, 2014). The government effort to increase its tuition grants to secondary
schools anticipates to reduce the textbook to student ratio to 1:1 (MoEST, 2014).
A review of Kenyan education system by Glennerster, et al (2011) to inform the
education investment strategy of the Government of Kenya found differential
distribution of learning resources to be the major reason for differential
performance of regions in Kenya. According to the report, most schools could not
teach a variety of subjects because they lacked the requisite facilities and resources
for instruction. Offering of technical and science subjects in a school solely
depended on availability of a skilled teacher, the relevant physical facilities, and
teaching and learning resources. Subjects like music, electricity, woodwork, home
science, Art and Design, German, French and Aviation could only be offered by

59
national schools whose capacity to access more teachers, facilities and teaching
resources was higher. The schools could offer a minimum of sixteen examinable
subjects while County and Sub-county schools offer a maximum of 11 examinable
subjects.
2.7 Summary of Related Literature Review
This section has reviewed literature related to quality of education with focus on
school physical facilities, teacher motivation, school financial resources and
teaching and learning materials. Amos and Koda (2018), Anyango and Orodho
(2016), Lwakasana and Getange (2016) Mascitti-Miller (2013), Miles and Frank
(2008), Nyamwega (2016), Nyangaresi, Onderi and Mwebi (2010), and World
Bank (2008a) are in agreement that the amount of financial resources in a school
and students achievement are positively related. On the contrary, Veesrpoor (2008)
and the World Bank (2008b) argue that quality of education in a school depends
primarily on the way schools are managed, than the abundance of available
resources. Existence of these inconsistencies necessitates further research justifying
the need for this study. From the literature reviewed, it is also evident that there is
limited literature on quality of education in Kenya especially on teacher motivation.
The study by Ogallo et al., (2013) on challenges faced by Principals in the provision
of Secondary School education in Kenya was carried out in Nyando and Muhoroni
districts in western Kenya and was limited to social-economic factors of education.
Orodho (2014) also studied quality of education in Kenya with a focus on secondary

60
school financing only. This study investigated the influence of adequacy of school
physical facilities, adequacy of teacher motivation levels, adequacy of school
financial resources and adequacy of teaching and learning resources on quality of
education in public secondary schools in Kenya. The study sought to establish the
extent to which each of these variables influence quality of education both
individually and jointly.
2.8 Theoretical Framework
The study is supported by the systems theory by Von Bertalanffy (1968). According
to Bertalanffy, an organization can be compared to an organism made up of
independent parts each with its own specific function and interrelated
responsibilities. A disturbance of one part, affects the functioning of the whole.
Real systems are open to and interact with their environments, and it is possible to
acquire new properties through emergence, resulting in continual evolution.
The theory is applicable in the study of schools as explained by Okumbe,( 2001).
Okumbe describes a school as an open system that receives learners, transforms
them through teaching into knowledgeable and informed citizens. Indeed, the
quality of learners produced by the school system is highly influenced by the
schools’ financial resources, physical facilities, learning and teaching resources,
student and teacher characteristics. These are influenced by the socio-economic
environment of the school and of parents of the learners. The school and its social-

61
economic environment interact to influence the teaching and learning process and
hence determine the quality of education offered in a school. This theory is
beneficial since open systems are interrelated and interdependent. Continuous
feedback between system inputs and outputs results in more refined output and
more effective organizations. However, the theory fails to specify the nature of
relationships and interdependence between organizations and the environment.
2.9 Conceptual Framework
The diagram shows the interrelationships of administrative factors and quality of
education.

62
Diagram 2.1: Interrelationships of Administrative Factors and Quality of
Education.
Teacher Motivation
Promotions
Status and recognition
Excellence awards
INSET Seminars (sponsored)
Physical facilities
Classrooms
Laboratories
Staff houses
Administrative offices
Toilets and lavatories
Dining halls
Workshops
Dormitories
Kitchen
staffrooms
Teaching and learning
resources
Text books
Exercise books
Assessment materials
Laboratory equipment and
chemicals
Desks and chairs
Duplicating machines
Photocopy machines
Tea
chin
g a
nd
learn
ing p
rocess
Quality of education
KCSE performance
Transition rates
Performance in co-
curricular
activities
Ex
tra
neo
us v
aria
ble
s
S
ocial eco
nom
ic factors
S
tud
ent ap
titud
e
School financial resources
Government grants
School income generating
activities’ funds
Alumni contributions
Parents contributions
Sponsor support
Donations from well wishes

63
The independent variables of the study (inputs) include school financial resources,
physical facilities, learning and teaching resources and teacher motivation. The
inputs influence the quality of education offered in a school (dependent variable)
through the teaching and learning process. Change in the state of any independent
variable affects the dependent variable hence low or high quality of education.

64
CHAPTER THREE
RESEARCH METHODOLOGY
3.1 Introduction
This chapter focused on research methodology that was used to conduct the
research study. The chapter specifically dealt with the research design, target
population, sample size and sampling procedures, research instruments, instrument
validity, instrument reliability, data collection procedures, data analysis techniques
and ethical considerations.
3.2 Research Design
The study adopted the correlational research design. According to Mugenda and
Mugenda (2003), correlational research design explores relationships between
variables and describes in quantifiable terms the degree to which the variables are
related. The design was considered appropriate in this study as it could be used to
explore relationships between the independent variables (adequacy of physical
facilities, teacher motivation levels, adequacy of school financial resources,
adequacy of teaching and learning resources) and the dependent variable (quality
of education), and quantify the degree to which the variables are related. The
researcher collected data using questionnaires, and observation guides in order to
determine whether and to what degree a relationship existed between two or more
variables.
65
3.3 Target Population
Target population is the total group of subjects to whom the study wants to apply
the conclusion from the findings (Mugenda & Mugenda, 2003). The target
population for this study was 783 public secondary school principals and 8617
teachers employed by Teachers Service Commission in those schools yielding a
sample size of 9,400.
3.4 Sample Size and Sampling Procedures
According to Orodho (2005), a sample is a small proportion of the target population
selected using some systematic procedure that is used for selecting a given number
of subjects from a target population as representative of that population. The study
used multistage sampling. According to Kothari and Garg (2014), multistage
sampling is a sampling technique most preferred for studies involving large
geographical areas such as a whole country. It is a method that entails sampling in
stages based on one or more criteria and the first stage involves selecting large
primary sampling units such as states, followed by smaller units like districts, towns
and families. The study used purposive sampling to select three counties to
represent high, medium and low social economic regions in Kenya. Babbie and Earl
(2010) describes purposeful sampling as a technique of sampling based on
researcher’s judgment on the most useful units to the study. Purposeful sampling
technique was therefore considered appropriate in this study since social-economic
potential of a region largely influences quality of education especially academic

66
performance (UNESCO 2005; KIPPRA 2013). Consequently, Kitui (low), Kisii
(medium) and Nairobi (high) counties were sampled based on county poverty
incidence, county human development index and county poverty severity index
(Wiesmann, Kiteme, & Mwangi, 2014; KNBS, 2015). The three counties had 783
public secondary schools hence a population (N) of 783 principals and 8617
teachers yielding population size of 9400 and a sample (n) of 260 principals and
368 teachers, yielding a sample size of 628 (Krejcie & Morgan, 1970). The sample
population and sample size is as shown in Table 3.1;
Table 3.1: School Population and Sample Size
County Population
(N)
Sample (n)
Principals Teachers Principals Teachers
Kitui 364 3991 121 171
Kisii 336 3072 111 131
Nairobi 83 1554 28 66
Total 783 8617 260 368
By stratified sampling, the schools were categorized into national schools, extra
county schools, county schools and sub county schools. Kothari and Garg (2014)
describe stratified sampling as a technique that stratifies a population into non-
overlapping subgroups, especially when the population is not homogenous, for
purposes of representing the peculiarity of each subgroup in the sample. Based on

67
KCSE performance and admission criteria, public secondary schools have been
classified into national schools, extra county schools, county schools and sub
county schools. Thus, the population sample of this study consisted of 11 national
schools, 34 extra county schools, 120 county schools and 618 sub county schools
(MoE Statistics, 2014).
To ensure accurate representation of each strata in the sample, the study used
stratified proportionate sampling. According to Babbie and Earl (2010), stratified
proportionate sampling ensures proper representation of the stratification variables
in the sample. Each sample stratum is proportionate to its population stratum hence
a more accurate representation of all population variables. The sizes of sample
strata were calculated by multiplying the proportion of each stratum in the
population sample and sample size. The sample therefore consisted of 4 national
schools, 11 extra county schools, 40 county schools and 205 sub county schools.
The schools were randomly selected in each category to ensure representativeness
of all school types. All school principals were purposively sampled for
participation.
To ensure representativeness of teachers from all school categories, the total
number of teachers sampled was subjected to stratified proportionate sampling
based on sampled school strata. The proportions of each school stratum in school
sample was multiplied by total number of sampled teachers to give the number of

68
teachers expected to participate from each school stratum. This yielded 6 national
school teachers, 16 extra-county school teachers, 57 county school teachers and
290 sub county school teachers. Random sampling was used to sample the teachers
from each stratum.
3.5 Research Instruments
The purpose of a research instrument in a study is to collect important information
about the population (Mugenda & Mugenda, 2011). The study used questionnaires
and observation guide to collect data. Kothari (2014) terms the questionnaire as the
most popular instrument in collecting data in social research. Two sets of
questionnaires were used namely, the principal’s questionnaire and the teacher’s
questionnaire. The questionnaire items were both structured and unstructured in
order to determine conformity of responses on issues raised on the questionnaire
and to allow respondents to expound and give their opinions on the same. Teachers
and principals’ questionnaires each with items addressing study objectives were
used. Part I of the questionnaires focused on background information of the schools
and respondents, while part II and III covered teacher motivation, school financial
resources, physical facilities, teaching and learning resources and quality of
education. The researcher delivered the questionnaires to respondents and collected
them after two weeks. An observation guide was also used to collect data on
adequacy of school physical facilities in public secondary schools in Kenya.
According to Kothari and Garg (2014), an observation guide enables the study to
69
collect data without interviewing respondents. The data collected shows the current
events in the field and is free from the attitudes, intentions or behavior of the
respondents. The observation guide had a list of school physical facilities that are
likely to influence quality of education such as classrooms, libraries, science
laboratories and toilets. Based on school population, the researcher recorded the
perceived level of adequacy of the school facilities on a five-point Likert scale (1-
not all, 2-less extent, 3- moderate extent, 4- larger extent and 5- more adequate).
3.6 Instrument Validity
Validity is the degree to which results obtained and data analyzed represent the
phenomenon under investigation (Orodho, 2009). It refers to the level of accuracy
that the data obtained in the study represents the study variables. To enhance
validity of the instruments a pre-test (pilot study) was carried out in 26 schools,
drawn from Nyamira County. This represented 10 percent of the sample size of the
study. Mugenda and Mugenda (2003) recommended a sample of 10 - 30 percent as
sufficient for a pilot study. The principals of the 26 schools and a teacher who was
randomly selected in each case, were requested to fill the questionnaires which were
then handed over to the researcher.
Pre-testing helped to assess the clarity of the instrument items so that the items
found to be inadequate could be modified to improve the quality of the research.
To ensure content validity the study captured all objectives in the questionnaires.
70
For construct validity, the study used short, straight forward and close ended
questions that could be easily understood. In addition, the study used a 5-point
Likert scale that operationalized the constructs. The research instruments were
further subjected to criticism from two experts in the Department of Educational
Administration and Planning, University of Nairobi. Items found to be ambiguous,
irrelevant or confusing were removed or reconstructed to convey the intended
meaning.
3.7 Instrument Reliability
Orodho (2005) defines reliability as the measure of the degree to which a research
instrument yields consistent results after repeated trials. Reliability of a research
instrument is its level of internal consistency or stability over time (Borg & Gall,
1989). A measuring instrument is reliable if it produces consistent results
(Kerlinger & Lee, 2000; Kothari, 2011; Miles & Huberman, 1994). According to
Mugenda and Mugenda (2003), the reliability of data collected may be affected by
error due to inaccuracy of the data collection instrument or error due to inaccuracy
in scoring by the researcher, or error related to respondent mood and attitude. To
minimize on these errors and increase the reliability of the collected data, the study
used split half method to test reliability of the questionnaires. The developed
questionnaires were given to respondents in the pilot schools. The questionnaires
were scored manually and collected. The questionnaire items were divided into two
halves (odd number questions (x) and even number questions (y) and their scores

71
computed. A comparison between the scores obtained in the two cases was then
made using Pearson’s Product Moment Correlation formula.
𝑟 = 𝑛∑𝑥𝑦 − (∑𝑥)(∑𝑦)
√[𝑛∑𝑥2 − (∑𝑥)2] [𝑛∑𝑦2 − (∑𝑦)2]
Where
∑x = sum of x scores
∑y = sum of y scores
∑x2 = sum of the squared x scores
∑y2 = sum of the squared y scores
∑xy = sum of the product of paired x and y scores
n = number of paired scores
Correlation score of 0.7 and above was considered high enough to declare the
research instrument reliable (Best & Kahn, 2006). The Pearson reliability
coefficient results are shown in Table 3.2.
Table 3.2: Reliability Results
Instrument Reliability
Principals Questionnaire 0.72
Teachers Questionnaire 0.7
The instruments were therefore considered reliable.
72
3.8 Data Collection Procedures
Before data was collected, a research permit was obtained from the National
Commission for Science, Technology and Innovation (NACOSTI). The study
sought further clearance for carrying out research in Kisii, Kitui and Nairobi
counties from the County Directors of Education (CDEs) and County
Commissioners of these counties. According to Best and Kahn (2006) the person
administering the instrument has an opportunity to establish rapport, explain the
purpose of the study and the meaning of items that may not be clear.
The researcher visited the schools on set dates, consulted with the principals, and
sought permission to observe school physical facilities and administer the
questionnaires. The researcher administered the questionnaires personally and
explained the respondents on how to fill them. The respondents were given a period
of two weeks to fill the questionnaires however, the researcher kept visiting the
schools randomly to give more information and guidance on filling of the
questionnaires. The researcher could pick any questionnaire that was ready for
collection before the lapse of the two weeks. The researcher observed the school
physical facilities during the visits and recorded their adequacy in the observation
schedule. At the end of two weeks, from the date the questionnaires were
administered, the researcher went to the schools to collect the questionnaires.

73
3.9 Data Analysis Techniques
Data analysis is the process of bringing order and meaning to the raw data collected
(Best & Kahn, 2006). The study collected both quantitative and qualitative data
using the teachers questionnaire, principals questionnaire and an observation guide.
Both data were edited for relevance and completeness and then coded. The data
was analyzed by use of descriptive and inferential statistics. Descriptive methods
used include frequencies, percentages and the mean. The descriptive methods of
data analysis were used to describe and explain relationships between facts and
variables of the study. The four hypotheses were majorly analyzed through
inferential research methods. The Pearson Correlations and T-test analysis were
used to test whether there existed a relationship between the dependent and
independent variables. Simple and multiple regression analysis were used to show
the extent to which the independent factors influenced the dependent factor both
singly and jointly. The findings of the study were then presented in tables.
Qualitative data collected from open ended questions was coded and analyzed
quantitatively. The qualitative information was coded, tallied and frequency counts
of all similar responses recorded. The results were reported in frequency tables and
explained based on study objectives. Data analysis was done with the aid of the
Statistical Package for Social Sciences (SPSS), version 21.

74
3.10 Ethical Considerations
According to Mugenda (2011), research ethics should apply in the planning of the
research study, analysis of data collected, dissemination and use of research results.
Therefore, the study ought to address logistical, ethical and human relations issues
to effectively and successfully complete a research project (Orodho, 2009).To
ensure informed consent and voluntary participation of the respondents, the
researcher sought permission from the secondary school principals to collect data
from the institutions. Each respondent was served with a copy of the introduction
letter informing them of the purpose and importance of the study. To ensure
anonymity, the respondents were assured of treatment of their identities with utmost
confidentiality and privacy. They were not required to write their names or names
of their schools on the data collection tools. The study findings were reported using
codes.

75
CHAPTER FOUR
DATA ANALYSIS, PRESENTATION, INTERPRETATION AND
DISCUSSION
4.1 Introduction
This chapter focused on data analysis followed by presentation, and interpretation
of the findings. The study utilized both descriptive and inferential statistics. The
analysis was guided by the following objectives; to determine the extent to which
school physical facilities influence quality of education in public secondary schools
in Kitui, Kisii and Nairobi Counties; to establish the extent to which teacher
motivation influences quality of education in public secondary schools in Kitui,
Kisii and Nairobi Counties; to establish the extent to which school financial
resources influence quality of education in public secondary schools in Kitui, Kisii
and Nairobi Counties, and finally, to determine the extent to which teaching and
learning resources influence quality of education in public secondary schools in
Kitui, Kisii and Nairobi Counties.
4.2 Response Rate
Response rate refers to the number of respondents who returned usable instruments
for the study out of the total number contacted for the study (Mugenda & Mugenda,
2003). The questionnaires were administered on school principals and teachers. The
study also used an observation guide to collect data on adequacy of school physical
facilities such as science laboratories, classrooms, staffrooms and libraries among

76
others. Analysis of data was on the basis of these questionnaires and the observation
guide. The response rate was as shown in Table 4.1.
Table 4.1: Number of Observations Made
Respondents Sample Returned %
Principals 260 226 86.92
Teachers 368 292 79.34
Totals 628 518 82.48
From Table 4.1, 518 out of 628 respondents returned usable research instruments
for this study. This represents 82.48 percent response rate. In particular a response
rate of 86.9 percent for principals, 79.34 percent for teachers is very good response.
Further, 213 out of 260 observation schedules were filled and used to analyze data
hence a return rate of 81.92 percent. The return rate became possible because the
researcher explained the importance of the study to the respondents hence
convincing them to actively participate in the study. The teachers and principals
were given a time limit of two weeks to fill the questionnaires after which the
researcher went round collecting them. The researcher observed the school physical
facilities like classrooms, libraries, kitchen, staffrooms among others, either on the
day of administering the questionnaires or when collecting the questionnaires from
the schools. This was done with permission and assistance from the school

77
administration. The high return rate therefore provided adequate information for
purposes of data analysis and meaningful generalization.
4.3 Demographic Characteristics of Respondents
The study sought demographic information of the respondents. These included
respondents’ gender, highest academic qualifications and years of experience.
The respondents in this study were school principals and teachers. The study chose
them because they were privy to the information sought by the study. Teachers
engage in teaching and other activities related to curriculum implementation, and
are therefore crucial in determining the quality of education offered in a school.
School principals supervise curriculum implementation at school level to ensure
provision of quality education.
4.3.1 Distribution of Principals and Teachers by Gender
The study sought to know the respondents gender because the issue of gender
balance is of great concern in all sectors of the society. The Government of Kenya
has adopted the gender mainstreaming strategy that endeavors to bring deliberate
attention on how women, men, girls and boys can be reached, influenced and
involved in development and leadership positively. This is done by ensuring equal
opportunities among female and male staff members in the areas of recruitment,
promotion, training and working conditions (Republic of Kenya, 2011).
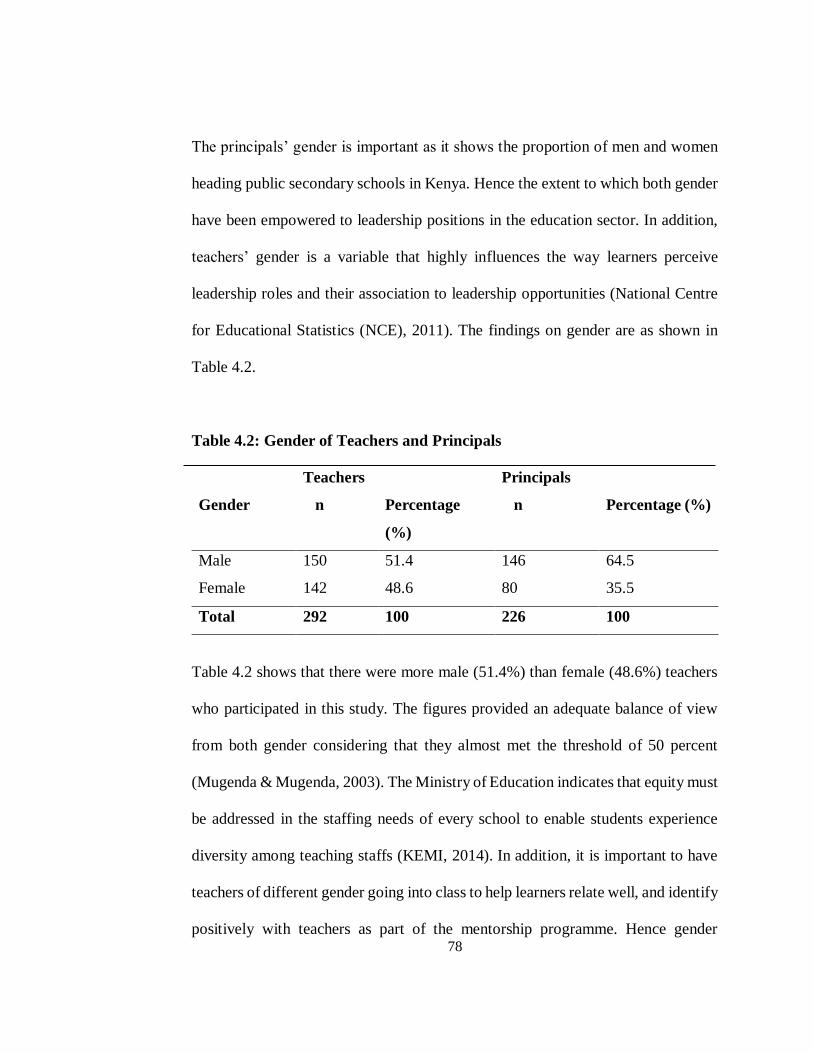
78
The principals’ gender is important as it shows the proportion of men and women
heading public secondary schools in Kenya. Hence the extent to which both gender
have been empowered to leadership positions in the education sector. In addition,
teachers’ gender is a variable that highly influences the way learners perceive
leadership roles and their association to leadership opportunities (National Centre
for Educational Statistics (NCE), 2011). The findings on gender are as shown in
Table 4.2.
Table 4.2: Gender of Teachers and Principals
Teachers Principals
Gender n Percentage
(%)
n Percentage (%)
Male 150 51.4 146 64.5
Female 142 48.6 80 35.5
Total 292 100 226 100
Table 4.2 shows that there were more male (51.4%) than female (48.6%) teachers
who participated in this study. The figures provided an adequate balance of view
from both gender considering that they almost met the threshold of 50 percent
(Mugenda & Mugenda, 2003). The Ministry of Education indicates that equity must
be addressed in the staffing needs of every school to enable students experience
diversity among teaching staffs (KEMI, 2014). In addition, it is important to have
teachers of different gender going into class to help learners relate well, and identify
positively with teachers as part of the mentorship programme. Hence gender

79
balance is a factor that contributes positively to the performance of learners in
school. The result on Table 4.2 agrees with Buckland and Thurlow (1996); Bush
and Heystek (2006); Khewu (2012); and Onderi and Makori (2013) all of whose
studies found a considerable evidence that women are greatly under-represented in
management positions. Jackline (2009) also noted that more male teachers are in
school headship than female teachers.
The findings are inconsistent with Kenya National Policy on Gender and
Development that spells out a policy approach of gender mainstreaming and
empowerment of women (RoK, 2000). According to the policy, it is the right of
women, men, girls and boys to participate in and benefit equally from the
development process where men and women enjoy equal rights, opportunities and
a high quality of life.
According to the gender policy in education, gender, is a variable that has a strong
bearing on the quality of education in Kenya (MoE, 2007). In remote and rural areas
where there is lack of women teachers especially for science, mathematics and
technical subjects, girls have continued to perform poorly in these subjects due to
lack of role models. The Ministry of Education Science and Technology (MoEST,
2015) appeals to school principals to ensure that schools are gender responsive in
order to attract and retain learners especially girls in school hence increasing
completion rates.
80
To address gender disparities in education, the gender policy in education suggests
increased appointment of qualified female education managers and administrators
and gender parity– based recruitment and deployment of teachers and managers
(MoE, 2007). This study has revealed under representation of female school
principals in Kenya despite of the many mixed day and boarding secondary schools
that could be headed by either of the gender.
4.3.2 Highest Academic Qualifications of Principals and Teachers
Academic qualification of secondary school teachers is very important because it
indicates their professional development. According to OECD (2011) report, the
quality of any education system is determined by the quality of its teachers.
Teachers with high academic qualifications are better equipped with both technical,
human and conceptual skills to perform their duties more effectively (Kart, 1995).
Research has further found a positive relationship between teacher qualifications
and student academic achievement (OECD, 2011; MoEST, 2015b).
In Kenya, teachers in public secondary schools possess a minimum of diploma
qualification from Teacher Training Colleges or University. School principals are
experienced teachers who are appointed to head a school on a merit system by the
Teachers Service Commission (RoK, 2012; Rarieya, 2007).This study sought to
know the highest academic qualifications of the principals and teachers. The results
are as shown in Table 4.3.

81
Table 4.3: Highest Academic Qualifications of Teachers and Principals
Highest academic
qualifications
Teachers
(N)
% Principals
(N)
%
Doctorate 1 0.34 0 0
Masters 30 10.27 77 34.2
Bachelors Degree 218 74.7 147 64.9
Diploma 43 14.7 2 0.9
Total 292 100 226 100
From Table 4.3, majority of the teachers and principals have Bachelor’s degree
qualification. This can be explained by the fact that the Teachers Service
Commission (TSC) which is the sole employer of teachers in public secondary
schools in Kenya recruit university graduates who have trained as secondary school
teachers and few teachers from diploma colleges. Table 4.3 also indicates that more
head teachers have pursued Masters Degree as opposed to teachers. This follows
the TSC teacher recruitment procedures that are merit based and confirms
arguments by Odundo (1990) that teachers are becoming more professionally
qualified. Hanushek (2011) asserts that teacher qualification is the single most
significant variable that determines learning outcomes. According to Hanushek,
there is a strong positive relationship between teacher competence and student
achievement. Quality of teachers is reflected in teacher qualifications, training and
experience. Therefore the findings of this study indicate that teachers in Kenyan

82
secondary schools are highly qualified and can be trusted to provide quality
education in their respective schools.
4.3.3 Working Experience of Teachers and Principals
The length of time people spend in a career gives them a better chance to give an
objective view of the situation on the ground. Imonje (2011) observed that teaching
experience is considered in terms of enhancing the mastery and application of
pedagogical skills. Elmuti (2004) posits that effective institutional managers need
not only academic content but also sufficient and lengthy exposure to practical
management of the institutions. According to Elmuti, education managers acquire
technical, human and conceptual skills through learning but they enhance these
skills through experience in their management roles. Staying in a station for a
longer period enhances level of adjustment to the work environment and teamwork
which promotes the culture of unity for purposes of providing high quality
education in an institution. This study sought to establish the length of stay of the
teachers and principals in their present stations. The results are shown in Table 4.4.

83
Table 4.4: Working Experience in Current School for Teachers and Principals
Working experience
Teachers Principals
n % N %
Less than a year 52 17.8 26 11.4
1-5 years 138 47.3 117 51.8
6-10 years 83 28.4 73 32.5
11-15 years 10 3.4 6 2.6
Over 15 years 9 3.1 4 1.8
Total 292 100 226 100
Table 4.4 shows that most of the teachers 138 (47%) have been in their current
stations for a period of between one to five years while over 30 percent of the
teachers have been in the same school for a period exceeding 6 (six) years. This
implies that most of the respondents had adequate and reliable information
pertaining to quality of education in their present stations and the learning outcomes
of each school was influenced to a great extent by the teaching processes and
activities undertaken by the staff in those schools.
For school principals, over 50 percent of them had served in their current stations
for a period of one to five years while more than 35 percent of them had served
their present stations for a period exceeding six years. In Kenya school principals
first serve as ordinary teachers before promotion to headship through a merit-based
interview. Therefore, majority of the principals are experienced and knowledgeable

84
on teaching and learning processes, hence they have an added advantage in guiding
the teaching staff on effective curriculum delivery towards quality learning
outcomes.
According to Olembo et al (1992), the principal is the chief administrator of a
school and the chief influencer of the institution’s education quality. The principal
is responsible for provision and maintenance of school physical facilities,
influencing and motivating teachers and pupils, determining and acquiring school
financial resources, providing learning and teaching resources and assessing
outcomes. Therefore, the more experienced the principal, the higher the quality of
education.
4.4 Demographic Information of Schools Studied
The study sought some demographic background of the schools. These included;
category of the school, school type and number of streams.
4.4.1 Distribution of Schools by Category
According to the Task Force on Secondary School Fees (MoEST, 2014) public
secondary schools are classified as national schools, extra county schools, county
schools and sub county schools. The study sought to determine the proportion of
each category in the sampled counties- Nairobi, Kisii and Kitui counties. The
results are presented in Table 4.5.

85
Table 4.5: Distribution of Schools by Category
School category n %
National 5 2.2
Extra county 20 8.8
County 35 15.4
Sub county 166 73.6
Total 226 100
From Table 4.5 many of the schools (73.7%) are sub county schools. According to
the Taskforce Report on Secondary School Fees, majority of sub county secondary
schools are day schools. The category also comprise of a few boarding schools that
have a day wing. Sub county secondary schools comprise of 65 percent of
secondary school population in Kenya, and admit more than 60 percent of all Kenya
Certificate of Primary Education (KCPE) candidates annually. The day schools
charge no fees however, boarding schools charge lower school fees as compared to
county, extra county and national schools (MoE, 2017). The schools admit bright
students from poor families, orphans and low achievers in KCPE examination.
These schools are built close to primary schools in heavily populated regions and
they serve at least five primary schools in any given locality (MoEST, 2014).
County schools consist of 15.4 percent of all schools in Nairobi, Kisii and Kitui
counties. The schools are former provincial schools whose performance is average

86
and are mostly boarding (MoEST, 2014). The schools admit students from all over
the County based on each sub-county candidature, but they admit at least 20 percent
of the students from the host district. They are centres of excellence in their counties
and they benchmark with extra county and national schools for improved
performance. School fees charged in these schools is lower than that charged in
extra county schools (MoEST, 2014).
The findings on Table 4.5 revealed that 8.8 percent of schools in Nairobi, Kisii and
Kitui counties are extra county schools. These are former extra-provincial schools
that are characterized by high academic performance, promotion of integration and
bench mark standards and supplementing the national schools. The schools admit
students at the ratio of 40 percent nationally; 40 percent from the county and 20
percent from the host district. They are regional academic centres of excellence
(MoEST, 2014).
Table 4.5 also revealed that 2.2 percent of schools in Nairobi, Kisii and Kitui
counties are national schools. National schools are the best performing schools in
Kenya. Most of the schools were established during the colonial period and are
single sex schools (Lucas & Mbiti, 2011). The schools admit the best performers in
KCPE countrywide and are only 18 in number. They are most prestigious schools
that promote cohesiveness and citizenship by admitting students from every part in
Kenya. According to the taskforce in secondary school fees, (2014) the schools

87
charge very high school fees because of the type of meals they give to their students,
and high maintenance costs of the varied and quality learning facilities in the
schools. Since these schools admit learners from every county in Kenya, traveling
costs, together with the high school fees charged increase costs and disadvantage
those students from poor households (MoEST, 2014).The schools offer high quality
education and most top leaders in Kenya are Allumni to them (Lucas & Mbithi,
2011).
A study by Kamau, Rintangu, Muniu, and Amusa (2015) on the effect of
participation in competitive sports on school connectedness of secondary school
students, found a positive relationship between school category and students
psychological connectedness to the school. According to the study, students in
national schools are more connected to their schools than those in other school
categories. The schools are more endowed in terms of sport and academic
infrastructure and students have strong commitment to the schools, taking more
demanding courses and participating in sports hence few cases of delinquency.
Consequently, the students have lower absenteeism rates, low dropout rates, and
fewer cases of drug abuse and violence hence, high quality education.
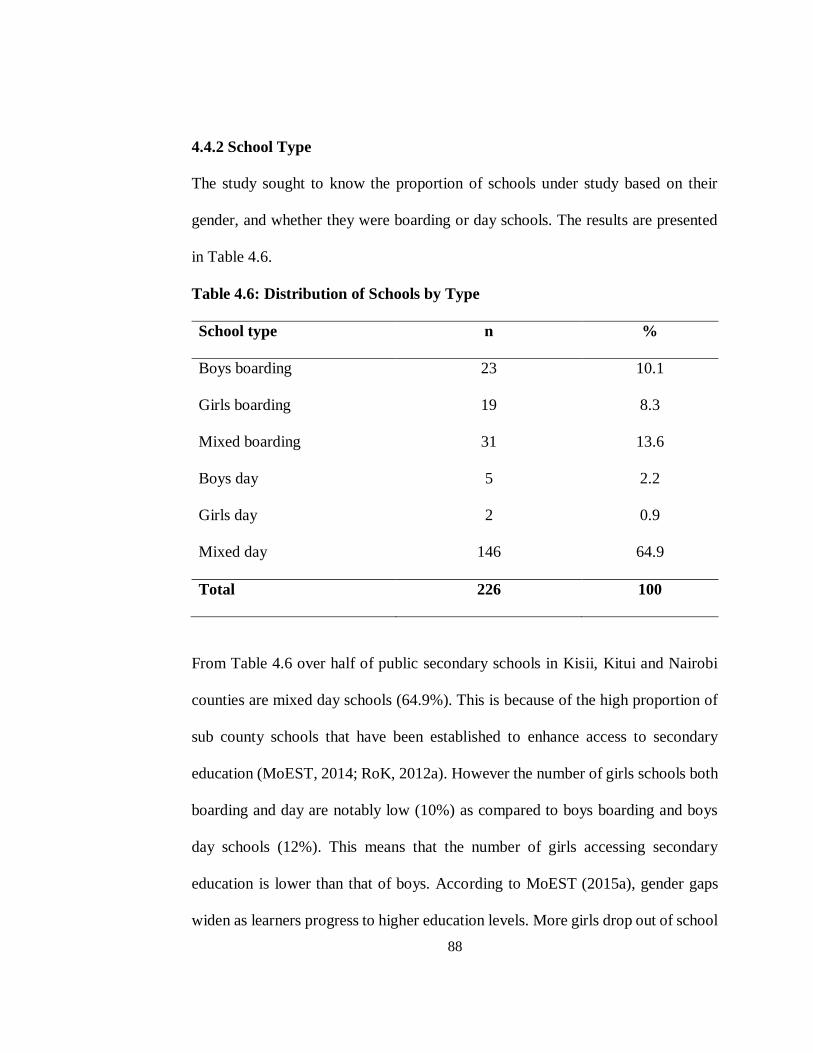
88
4.4.2 School Type
The study sought to know the proportion of schools under study based on their
gender, and whether they were boarding or day schools. The results are presented
in Table 4.6.
Table 4.6: Distribution of Schools by Type
School type n %
Boys boarding 23 10.1
Girls boarding 19 8.3
Mixed boarding 31 13.6
Boys day 5 2.2
Girls day 2 0.9
Mixed day 146 64.9
Total 226 100
From Table 4.6 over half of public secondary schools in Kisii, Kitui and Nairobi
counties are mixed day schools (64.9%). This is because of the high proportion of
sub county schools that have been established to enhance access to secondary
education (MoEST, 2014; RoK, 2012a). However the number of girls schools both
boarding and day are notably low (10%) as compared to boys boarding and boys
day schools (12%). This means that the number of girls accessing secondary
education is lower than that of boys. According to MoEST (2015a), gender gaps
widen as learners progress to higher education levels. More girls drop out of school

89
due to gender roles, cultural factors and economic factors giving the boy child a
better opportunity to dominate higher education.
A study by Kamau et al (2015) found a significant relationship between school type
and students psychological connectedness to the school. According to the study,
students who learn in single sex schools are more connected to their schools than
those who learn in mixed schools. Connectedness to a school was seen to guard
against bullying, risky sexual behavior, fighting, vandalism, truancy, emotional
stress and violence. Therefore, single sex schools are likely to offer high quality
education as compared to mixed schools.
A study by Sang, Koros and Bosire (2013) to analyze dropout levels in public
secondary schools in Kericho District indicated that single sex schools offer more
quality education than mixed schools. According to the study, dropout rates were
higher in mixed schools as compared to single sex schools. Further, dropout rates
were found to be higher in day schools as compared to boarding schools. Therefore,
boarding single sex schools were found to offer more quality education than day
schools and mixed schools.
4.4.3 Distribution of Schools by the Number of Streams
Schools have varied population sizes and this dictates the number of streams in
each school. Therefore the study sought to establish the distribution of streams
among the schools under study. The findings are shown in Table 4.7.

90
Table 4.7: Distribution of Schools by Number of Streams
School number of
streams
n %
1 to 3 streams 198 87.7
4 to 6 streams 19 8.4
Above 6 streams 9 3.9
Total 226 100
From Table 4.7, it is clear that majority (87.7%) of the schools had between one
and three streams. This can be explained by the large proportion of sub-county
schools in the study population (Table 4.5). It is also supported by the government
policy to establish more day schools to enhance access to secondary education
(RoK, 2012a). According to the policy, all secondary schools should have a
minimum of 3 streams in order to relieve parents on the cost of constructing new
secondary schools and ensure efficient utilization of teachers employed by
Teachers Service Commission (MoEST, 2014; RoK, 2012a) hence, quality
education.
A study by Sang, et al (2013) on dropout levels in public secondary schools in
Kericho District revealed that student drop out levels are higher in single streamed
schools as compared to schools with more than one school. In most cases, single
streamed schools are newly established schools which are still struggling to acquire

91
teachers and other physical infrastructure, and students could be moving out to
more established schools in search of quality education.
4.5 Adequacy of School Physical Facilities and Quality of Education
The first objective of this study sought to determine the extent to which adequacy
of school physical facilities influence quality of education in public secondary
schools in Kenya. This objective had a corresponding hypothesis HO1 that stated
that-
H01: there is no significant relationship between adequacy of school physical
facilities and quality of education in public secondary schools in Kenya. The
analysis sought to establish the adequacy of school physical facilities in schools,
relationship between adequacy of the school physical facilities and quality of
education, and the extent to which physical facilities influence quality of education
in public secondary schools in Kenya.
4.5.1 Adequacy of School Physical Facilities in Schools
School physical facilities are fundamental in teaching and learning (Saeed & Wain
2011). According to Kuurskorpi et al (2011), physical facilities set the stage for
learning to occur and also influence the working culture of the school. Physical
facilities also influence student participation in co-curricular activities hence
holistic student development (Kapelinyang & Lumumba, 2017). Based on this, the

92
study sought to establish the levels of adequacy of school physical facilities in
public secondary schools in Kenya. The results are presented in Table 4.8.
Table 4.8: Adequacy of School Physical Facilities: Principals Perceptions
School
Physical
facilities
Not
at
all
Less
adeq
uate
Mode
rate
adequ
ate
More
adeq
uate
Very
adeq
uate
Co
unt
Ro
w
N
%
Coun
t
Ro
w
N
%
Coun
t
Ro
w
N
%
Coun
t
Ro
w
N
%
Coun
t
Ro
w
N
%
Classrooms in
the school
3 1.
3
44 19
.5
133 58
.8
34 15
.0
12 5.
3
The school
laboratories
18 8.
0
82 36
.3
102 45
.1
18 8.
0
6 2.
7
Staff houses 67 29
.6
67 29
.6
78 34
.5
11 4.
9
3 1.
3
Availability of
administrative
offices
9 4.
0
62 27
.4
130 57
.5
22 9.
7
3 1.
3
Toilets and
lavatories
5 2.
2
42 18
.6
125 55
.3
42 18
.6
12 5.
3
Workshops 85 37
.6
82 36
.3
54 23
.9
2 .9 3 1.
3
Students’
accommodation
71 31
.6
63 28
.0
79 35
.1
10 4.
4
2 .9
Sufficient
space within
the staff room
11 4.
9
75 33
.2
119 52
.7
17 7.
5
4 1.
8
Dining area 55 24
.3
69 30
.5
85 37
.6
13 5.
8
4 1.
8
The school’s
kitchen
facilities
2 .9 83 36
.7
115 50
.9
24 10
.6
2 .9
The school’s
playgrounds
11 4.
9
77 34
.1
98 43
.4
36 15
.9
4 1.
8
Library 46 20
.4
81 35
.8
87 38
.5
9 4.
0
3 1.
3

93
From Table 4.8, only 20 percent of the schools have adequate classrooms while 80
percent of the schools have inadequate number of classrooms. On school
laboratories and libraries, 90 percent of the respondents indicated that the schools
have inadequate science laboratories to support learning. Majority of the
respondents reported to have inadequate libraries too. This implies that most of the
schools in the study have large class sizes, high student teacher ratios, overworked
teachers and use of teacher centred methods of learning leading to low quality of
education. The library is one of the predictors of student academic achievement
(BCTF, 2012). It offers conducive atmosphere for private studies and gives learners
access to learning resources. Inadequacy of science laboratories limit practical
learning of science subjects hence poor performance in the science subjects. A
study by Owino, Osman and Yunguyungu (2014) found a positive relationship
between quality of education and school investment in science laboratories.
Schools with adequate and well equipped science laboratories performed well in
sciences in KCSE.
Staff houses are a necessary requirement especially in boarding schools in order to
ensure security of learners. The study established that only 6 percent of the schools
had enough houses for the teachers while 57 percent could house some of the
teaching staff. On administrative offices, 90 percent of the principals indicated that
they have inadequate number of offices for school administration. Teachers houses
and offices influence their stay in school for longer (World Bank, 2014a).

94
According to World Bank report, the facilities help in retaining teachers in school
for long hence increased contact hours with students, leading to more student and
teacher consultation, and therefore, quality learning experiences.
The study found out that only two (2) percent of the schools had sufficient number
of workshops while 38 percent did not have a workshop at all. This implies that
majority of the schools can hardly offer technical subjects like wood work, metal
work, home science and music. Quality education aims at tapping the talent and
potential of every learner. Offering limited range of subjects limits the ability of the
curriculum to identify, exploit and nurture students abilities (UNICEF, 2000).
On playgrounds, the study established that 87 percent of the schools had inadequate
playgrounds for sports, games and leisure. This implied that most of the schools
did not engage students in co-curricular activities like soccer, athletics, netball,
rugby, basketball, and volleyball among others. According to UNICEF (2000),
education should develop the cognitive, psychomotor and affective domain of a
student. Physical education in school helps develop the learner physically,
emotionally and helps in the development of core skills such as communication,
collaboration, critical thinking and leadership (UNESCO, 2015c). Inadequate
playgrounds deny the learners an opportunity to participate in co-curricular
activities, which are essential for full development of their personality.

95
To supplement the principals’ responses on availability of physical facilities in
schools, the researcher used an observation guide to collect data and rate the
adequacy of physical facilities in the schools. In this case, the researcher rated the
responses 1,2,3 (not at all, less extent, moderate extent) on the respondents key of
rating as inadequate; while 4,5 ( large extent and very large extent) responses were
rated as adequate. The findings are shown on Table 4.9.

96
Table 4.9: Distribution of School Physical Facilities as Observed by the
Researcher
Facilities Responses n %
Classrooms
Inadequate 145 68.0
Adequate 68 32.0
Total 213 100
Laboratories
Inadequate 179 84.0
Adequate 34 16.0
Total 213 100
Staff houses
Inadequate 198 93.0
Adequate 15 7.0
Total 213 100
Administrative offices
Inadequate 182 85.45
Adequate 31 14.55
Total 213 100
Toilets and lavatories
Inadequate 171 80.28
Adequate 42 19.72
Total 213 100
Dining halls
Inadequate 197 92.49
Adequate 16 7.51
Total 213 100
Workshops
Inadequate 206 96.71
Adequate 6 3.29
Total 213 100
Dormitories
Inadequate 197 92.49
Adequate 16 7.51
Total 213 100
Kitchen
Inadequate 196 92.0
Adequate 17 8.0
Total 213 100
Staffroom
Inadequate 191 89.67
Adequate 22 10.33
Total 213 100
Library
Inadequate 196 92.0
Adequate 17 8.0
Total 213 100
Playground
Inadequate 170 79.81
Adequate 43 20.19
Total 213 100

97
From Table 4.9 the study established that not a single school had adequate physical
facilities to support teaching and learning. The facilities available were all
inadequate and could not effectively support learning and teaching activities in the
schools. Majority of the schools had inadequate classrooms (68%), inadequate
laboratories (84%), inadequate libraries (92%), toilets and lavatories 80 percent),
and playgrounds (79.8%) among others.
The findings concur with that of Omae (2018) whose study on predictors of quality
education in public secondary schools in Kisii County indicate that most of the
schools had inadequate libraries, science laboratories, toilets, administration offices
and school playgrounds. The study requested the principals to comment on
adequacy of school physical facilities in their schools and the responses are as
shown in Table 4.10.
Table 4.10: Principals Perceptions on Physical Facilities in the schools
Comments Frequency Percent
Have enough physical facilities 15 11.9
Have moderate physical facilities 11 8.7
Need physical facilities 83 65.9
No enough space for expansion 17 13.5
Total 126 100.0

98
From Table 4.10, majority of the principals (65.9 %) indicated that their schools
needed more physical facilities. Only 15 percent of them indicated that they had
enough physical facilities in their schools while 13.5 percent of the school
principals felt that their schools lacked enough space for expansion.
4.5.2 Bivariate Correlation Between School Physical Facilities and Quality of
Education
In order to have deeper understanding on the association between adequacy of
school physical facilities and quality of education, Pearson Correlation was used to
establish whether there existed a relationship between adequacy of the physical
facilities and quality of education. The result is shown in Table 4.11.
Table 4.11: Bivariate Correlation Between School Physical Facilities and
Quality of Education
Correlations
School
Physical
facilities
Quality of
Education
School Physical
facilities
Pearson Correlation 1 0.307**
Sig. (2-tailed) <0.001
N 226 223
Quality of Education
Pearson Correlation
0.307** 1
Sig. (2-tailed) <0.001
N 223 223
**. Correlation is significant at the 0.01 level (2-tailed).

99
From Table 4.11, the correlation coefficient (r) = 0.307 at P<0.001 indicates a
positive relationship between school physical facilities and quality of education.
Since p<0.001, the relationship is statistically significant. This implies that physical
facilities have a positive influence on quality of education. The more adequate the
school physical facilities, the higher the quality of education in a school. Therefore
schools that have adequate classrooms, laboratories, staff houses, toilets and
lavatories, libraries, dormitories, playgrounds, dining and kitchen facilities among
others, are likely to record higher KCSE mean scores, win more trophies in co-
curricular activities and record higher student transition rates between form one
and form four. On the contrary, schools with inadequate facilities (classrooms,
libraries, laboratories, staff houses, toilets and lavatories, playgrounds and
administrative offices among others, are likely to record poor quality of education
(low KCSE mean score, low student transition rates from form one to form four
and low participation in co-curricular activities hence winning few number of
trophies).
Massoni (2011) observes that schools that have co-curricular facilities like
playgrounds encourage students to actively participate in co-curricular activities.
According to Massoni, co-curricular activities keep learners in school hence
ensuring high transition and completion rates. The activities also instill discipline,
patience and resilience that work together to enhance their study behavior and
hence better academic achievement.
100
4.5.3 Adequacy of School Physical Facilities and Quality of Education
The study sought to establish whether there is a significant difference in quality of
education between schools with different levels of adequacy of school physical
facilities. This was meant to answer hypothesis one;
HO1: There is no significant relationship between adequacy of school physical
facilities and quality of education in public secondary schools in Kenya
To answer the hypothesis, the study conducted a T-test to establish whether quality
of education for different schools with different level of availability of physical
facilities is the same. If they were the same, the study concluded that there is no
significant relationship between adequacy of school physical facilities and quality
of education in public secondary schools in Kenya. However if found to be different
across schools, then the study could conclude that there is a relationship between
adequacy of school physical facilities and quality of education, hence proceed to
establish the strength of the relationship.
To establish the variation of quality of education with school physical facilities, the
study classified the five responses (1-not all, 2-less extent, 3-moderate extent, 4-
larger extent and 5-more adequate) into two (1,2,3- inadequate; 4,5 –adequate)
physical facilities. The study then computed the mean quality of education for each
group of physical facilities based on quality of education parameters (KCSE mean
score, transition rate, and school mean trophies won in co- curricular activities).
The result for the means of the two groups is as shown in Table 4.12.
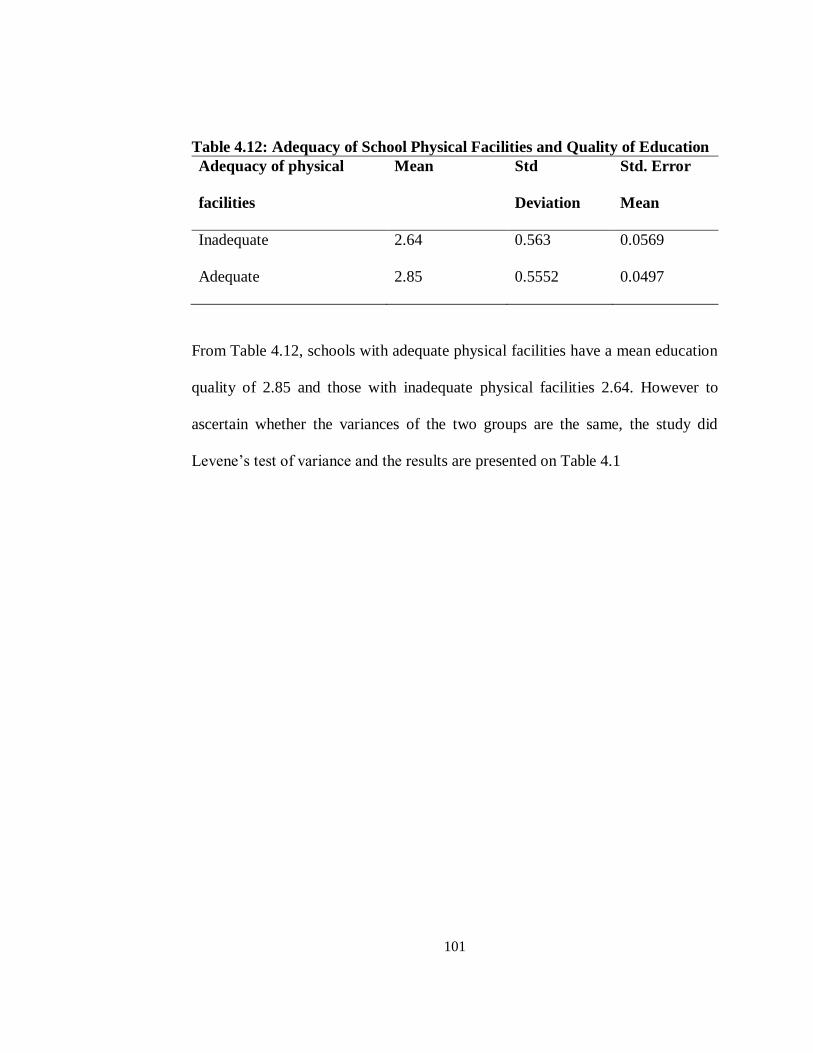
101
Table 4.12: Adequacy of School Physical Facilities and Quality of Education
Adequacy of physical
facilities
Mean Std
Deviation
Std. Error
Mean
Inadequate 2.64 0.563 0.0569
Adequate 2.85 0.5552 0.0497
From Table 4.12, schools with adequate physical facilities have a mean education
quality of 2.85 and those with inadequate physical facilities 2.64. However to
ascertain whether the variances of the two groups are the same, the study did
Levene’s test of variance and the results are presented on Table 4.1

102
Table 4.13: Test for Equality of Means- School Physical Facilities and Quality
of Education
Levene's
Test for
Equality
of
Variances
t-test for
Equality
of Means
F Sig. t df Sig. (2-tailed)
Mean Difference
Std. Error Difference
95%
Confidence Interval of
the
Difference
Lower Upper
Equal
variances
assumed
0.046 0.83 -2.7 221 0.008 -0.20 0.08 -0.35 -0.05
Equal variances
not
assumed
-2.7 207 0.008 -0.20 0.08 -0.35 -0.05
From the Table 4.13, F=0.046 at p=0.83(greater than 0.05) implying that variances
of the two groups (adequate and inadequate) school physical facilities is the same.
From Table 4.13, (T- test), p=0.008 which is less than 0.05, implying that the two
means (2.64 and 2.85) are significantly different. Therefore, schools with adequate
physical facilities such as classrooms, staffrooms, toilets, libraries, dormitories,
workshops and science laboratories have better quality of education (2.85), as
compared to schools with inadequate school physical facilities (2.64). According
to this study, quality of education was measured using KCSE mean score, transition
rate from form one to four and mean trophies won by schools in co-curricular
activities. The findings then imply that schools with adequate physical facilities had
higher KCSE mean score, higher transition rates from form one to four, and

103
performed well in co-curricular activities as opposed to schools with inadequate
physical facilities.
The study has therefore established that there is indeed a statistical significant
difference between schools that have adequate physical facilities and those with
inadequate physical facilities. Schools with adequate physical facilities have higher
quality of education than those with inadequate physical facilities. Thus, the study
rejected the null hypothesis Ho1 and concluded that there is a significant relationship
between adequacy of school physical facilities and quality of education in public
secondary schools in Kenya.
The findings of the study concur with Saeed and Wain (2011) who observed that
adequate school physical facilities positively influence student learning and
academic achievement. Kuurskopi et al (2011), also post that school physical
facilities set the stage for learning to occur and influence the school working
culture. Having established that there is a significant relationship between
adequacy of school physical facilities and quality of education, the study sought to
know the extent to which adequacy of school physical facilities influence quality
of education in public secondary schools in Kenya.
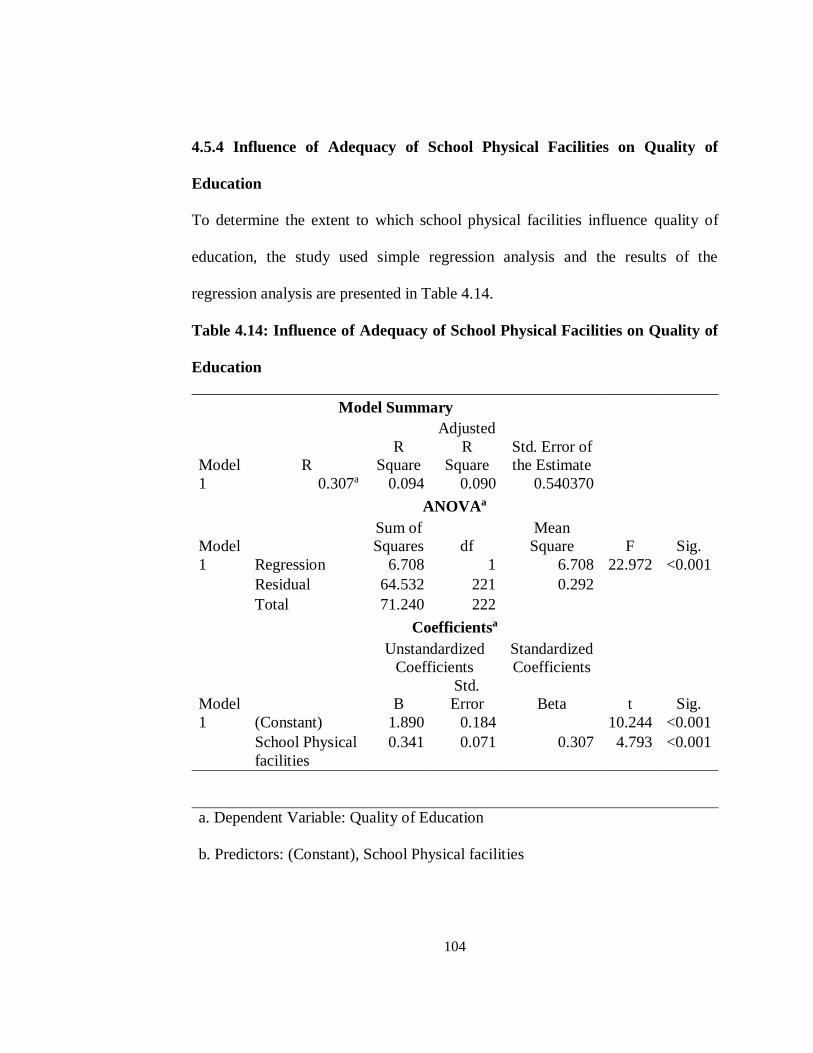
104
4.5.4 Influence of Adequacy of School Physical Facilities on Quality of
Education
To determine the extent to which school physical facilities influence quality of
education, the study used simple regression analysis and the results of the
regression analysis are presented in Table 4.14.
Table 4.14: Influence of Adequacy of School Physical Facilities on Quality of
Education
Model Summary
Model R
R
Square
Adjusted
R
Square
Std. Error of
the Estimate
1 0.307a 0.094 0.090 0.540370
ANOVAa
Model
Sum of
Squares df
Mean
Square F Sig.
1 Regression 6.708 1 6.708 22.972 <0.001
Residual 64.532 221 0.292
Total 71.240 222
Coefficientsa
Model
Unstandardized
Coefficients
Standardized
Coefficients
t Sig. B
Std.
Error Beta
1 (Constant) 1.890 0.184 10.244 <0.001
School Physical
facilities
0.341 0.071 0.307 4.793 <0.001
a. Dependent Variable: Quality of Education
b. Predictors: (Constant), School Physical facilities
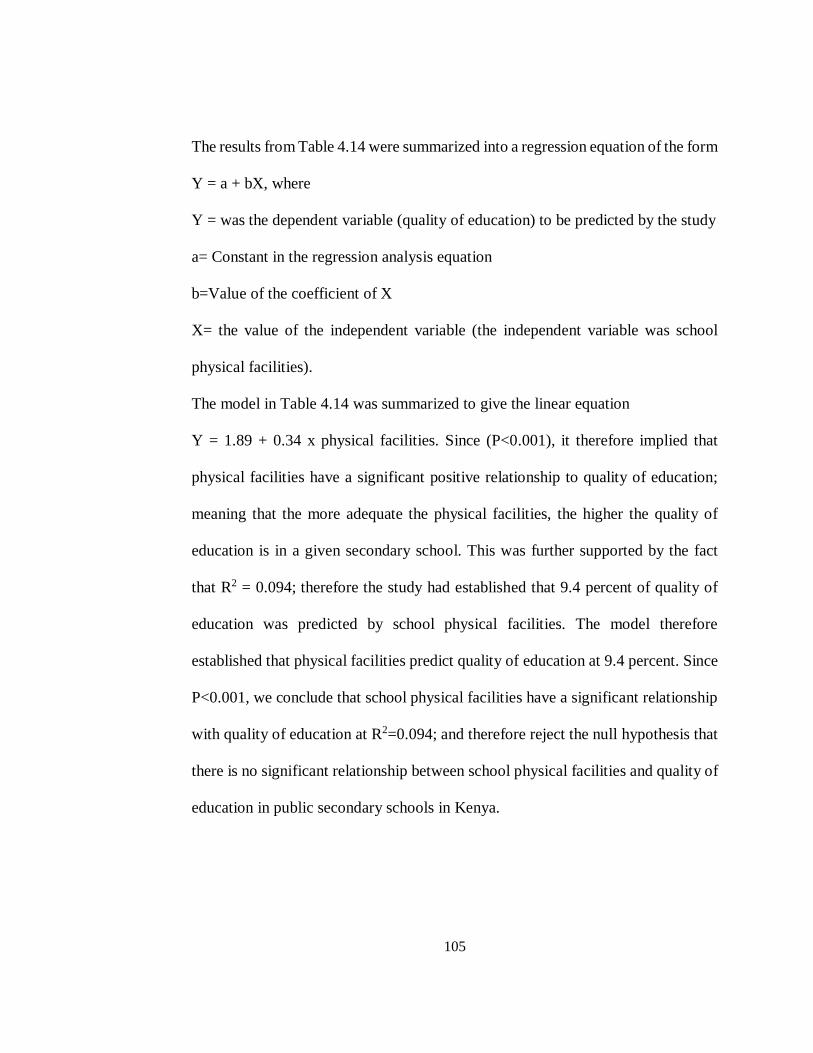
105
The results from Table 4.14 were summarized into a regression equation of the form
Y = a + bX, where
Y = was the dependent variable (quality of education) to be predicted by the study
a= Constant in the regression analysis equation
b=Value of the coefficient of X
X= the value of the independent variable (the independent variable was school
physical facilities).
The model in Table 4.14 was summarized to give the linear equation
Y = 1.89 + 0.34 x physical facilities. Since (P<0.001), it therefore implied that
physical facilities have a significant positive relationship to quality of education;
meaning that the more adequate the physical facilities, the higher the quality of
education is in a given secondary school. This was further supported by the fact
that R2 = 0.094; therefore the study had established that 9.4 percent of quality of
education was predicted by school physical facilities. The model therefore
established that physical facilities predict quality of education at 9.4 percent. Since
P<0.001, we conclude that school physical facilities have a significant relationship
with quality of education at R2=0.094; and therefore reject the null hypothesis that
there is no significant relationship between school physical facilities and quality of
education in public secondary schools in Kenya.

106
The findings agree with that of Saeed and Wain, (2011) whose research found out
that classrooms, libraries, laboratories, playgrounds, administration blocks, staff
houses, dormitories, and sanitary facilities have a positive influence in the
performance of the students and teachers.
Since quality of education was a product of school KCSE mean score, transition
rate within classes (between form 1 to 4) and number of trophies won by students
in co-curricular and extra-curricular activities, the study sought to know the extent
of influence of physical facilities on each of these factors of quality of education.
4.5.4.1 Influence of Adequacy of School Physical Facilities on KCSE Mean
Score
The study used KCSE mean score as one of the indicators of quality of education.
To determine the extent to which physical facilities influence KCSE mean score,
the study used simple regression analysis and the result was presented in Table
4.15.

107
Table 4.15: Influence of Adequacy of School Physical Facilities on KCSE Mean
Score
Model Summary
Model R R Square
Adjusted
R
Square
Std. Error of
the Estimate
1 0.381a 0.145 0.141 1.266447
ANOVAa
Model
Sum of
Squares df
Mean
Square F Sig.
1 Regression 56.701 1 56.701 35.352 <0.001
Residual 333.609 208 1.604
Total 390.310 209
Coefficientsa
Model
Unstandardized
Coefficients
Standardized
Coefficients
t Sig. B
Std.
Error Beta
1 (Constant) 2.448 0.451 5.430 <0.001
School
Physical
facilities
1.030 0.173 0.381 5.946 <0.001
a. Dependent Variable: Y_Mean KCSE score
b. Predictors: (Constant), School Physical facilities
The model in Table 4.15 was summarized into a regression equation of the form
Y=a+bX where Y is the dependent variable (KCSE mean score), a- is the constant

108
of regression analysis, b - the value of the coefficient of the independent variable
and X, the value of the independent variable. The independent variable was school
physical facilities. Thus the regression analysis equation becomes, Y = 2.448 +
1.030 x physical facilities. Since P<0.001, the findings clearly revealed that school
physical facilities have a positive significant relationship with school KCSE mean
score at R2 = 0.145.The model therefore revealed that school physical facilities
predict KCSE mean score at 14.5 percent. Implying that there is a statistical
significant relationship between school physical facilities and schools KCSE mean
score. The more adequate the physical facilities, the higher the school KCSE mean
score and the less adequate the physical facilities, the lower the school KCSE mean
score.
In this study, KCSE mean score was used as one of the indicators of quality of
education. Since the significance level was P<0.001, then the null hypothesis that
hypothesized that there is no significant relationship between school physical
facilities and quality of education is rejected. The study concluded that there is a
significant relationship between adequacy of school physical facilities and quality
of education; since 14.5 percent of school KCSE mean score was predicted by
school physical facilities.

109
The findings concur with Bhunia et al (2012) whose study on assessment of school
infrastructure in primary schools in Medinipur District in India found adequacy of
school physical facilities to be positively correlated to academic achievement of
learners. According to the study, adequate science laboratories, libraries, toilets,
protective school fencing wall, playgrounds, and classrooms are at the heart of
quality of education. The facilities attract learners to school, enhance the learning
process and influence their retention in school. A study by Curveys (2011) to
establish the impact of school infrastructure on the well-being of students in
Flemish secondary schools in Belgian region of Flanders found empirical evidence
indicating that students learning in schools with adequate and quality school
infrastructure record high academic grades as compared to students learning in
inadequate, poor quality facilities. Inadequacy of school infrastructure such as
workshops and science laboratories affected the performance of technical and
science subjects more than art subjects. This is because technical subjects need
workshops and training rooms; while science practical lessons must be undertaken
in an equipped science laboratory.
4.5.4.2 Influence of Adequacy of School Physical Facilities on Transition Rate
The study used student transition rate (within secondary school level) from form
one to form four as another indicator of quality of education. The focus was on
2013-2016 cohort in the sampled schools. According to World Bank (2009), a
school system is internally efficient when it takes the least possible time to produce

110
a twelveth grade graduate. Repetition and school dropout leads to wastage hence
low internal efficiency. Low internal efficiency is, therefore, an indicator of low
quality of education. School principals were asked to indicate the number of
students who have successfully transited from form 1 to form 4 (2013-2016) cohort
upon which transition rates were calculated. To determine the extent to which
school physical facilities influence transition rates of students between grades, the
study used simple regression analysis and the results were presented in Table 4.16.
Table 4.16: Influence of Adequacy of School Physical Facilities on Student
Transition Rate from Form 1 to 4
Model Summary
Model R R Square
Adjusted
R
Square
Std. Error of
the Estimate
1 0.158a 0.025 0.020 32.4019
ANOVAa
Model
Sum of
Squares df
Mean
Square F Sig.
1 Regression 5632.603 1 5632.603 5.365 0.022
Residual 220475.030 210 1049.881
Total 226107.633 211
Coefficientsa
Model
Unstandardized
Coefficients
Standardized
Coefficients
t Sig. B
Std.
Error Beta
1 (Constant) 60.095 11.393 5.274 <0.001
.School
Physical
facilities
10.164 4.388 0.158 2.316 0.022
a. Dependent Variable: Transition Rate
b. Predictors: (Constant), School Physical facilities

111
From Table 4.16, the model was summarized into a regression equation of the form
Y=a+bX where Y is the dependent variable (transition rate), a- is the constant of
regression analysis, b - the value of the coefficient of the independent variable and
X, the value of the independent variable. The independent variable in this case was
adequacy of school physical facilities. Thus the regression analysis equation
becomes Y= 60.095 + 10.164 x physical facilities. Since the significance level
(P=0.022), the study concluded that there is a statistical significant relationship
between students transition rate from form one to form four and school physical
facilities. The more adequate the school physical facilities, the higher the transition
rate. Schools with adequate classrooms, science laboratories , libraries, staff
houses, toilets and lavatories, dining halls, workshops, staffrooms and playgrounds
were more likely to attract and retain more students from form one to form four
than schools with inadequate physical facilities. A unit increase in school physical
facilities translated to 10.164 unit increase in student transition rate.
Further, since R2 =0.025 implies that physical facilities predicted transition rate at
2.5 percent. Meaning that school physical facilities have a significant relationship
to students transition rates within secondary school level. In this study, transition
rate was used as one of the indicators of quality education and therefore the study
has established the existence of a statistical significant relationship between
physical facilities and transition rate. Thus there is a statistical significant
relationship between school physical facilities and quality of education.

112
The findings are consistent with those of the World Bank (2014b) who found out
that school physical facilities play a crucial role in attracting and retaining students
and teachers in school. The facilities determine access to secondary education and
the educational programmes to be offered by the school (OECD, 2011; Parsons,
2011; World Bank, 2014). The more adequate the physical facilities, the wider the
curriculum supported by the school and the more the students to be attracted and
retained in the school.
4.5.4.3 Influence of Adequacy of School Physical Facilities on the Mean
Number of Trophies Won in Co-curricular Activities
Co-curricular activities are an integral part of a well-rounded education that
develops students knowledge, competencies, skills, values and attitudes (MoEST,
2015a). According to UNESCO (2014, 2015b), quality education should not be
limited to development of cognitive domain only but rather be inclusive of the
psychomotor and affective domains too. Co-curricular activities accord learners an
opportunity to expose their skills and competencies. The learning activities that
expose these abilities include sports and games, martial arts, drama and music
festivals, science and engineering fares, essay competitions, athletics, Art, Home
Science, Clubs and Societies (MoEST, 2015a).
The study sought to establish the extent to which physical facilities influence the
number of trophies won by students on co-curricular activities. A simple regression

113
analysis was done to test whether there existed a significant relationship between
school physical facilities and the mean number of trophies won in co-curricular
activities in public secondary schools in Kenya.
The results are shown in Table 4.17
Table 4.17: Influence of Adequacy of School Physical Facilities on Mean
Number of Trophies Won in Co-curricular Activities
Model Summary
Model R R Square
Adjusted
R
Square
Std. Error of
the Estimate
1 0.343a 0.117 0.113 2.480462
ANOVAa
Model
Sum of
Squares df Mean Square F Sig.
1 Regression 158.786 1 158.786 25.808 <0.001
Residual 1193.622 194 6.153
Total 1352.409 195
Coefficientsa
Model
Unstandardized
Coefficients
Standardized
Coefficients
t Sig. B
Std.
Error Beta
1 (Constant) 2.035 .947 2.150 0.033
Q9.School
Physical
facilities
1.819 .358 .343 5.080 <0.001
a. Dependent Variable: Mean.trophies
b. Predictors: (Constant), School physical facilities
The model was summarized into a regression equation of the form Y=a+bX where
Y is the dependent variable (mean number of trophies), a- is the constant of

114
regression analysis, b - the value of the coefficient of the independent variable and
X, the value of the independent variable. The independent variable in this case was
school physical facilities. Thus the regression analysis equation becomes
Y= 2.035+1.819 x physical facilities. This equation implies that the school mean
trophies won in co- curricular activities were highly associated to the adequacy of
the schools physical facilities. Schools with more adequate physical facilities were
likely to win more trophies in co-curricular activities as opposed to schools with
less adequate school physical facilities. Since p<0.001the study concluded that
physical facilities have a significant positive relationship with school mean trophies
won in co-curricular activities. Further, R2 = 0.117 implies that physical facilities
predicted 11.7 percent of mean trophies won by a school in co-curricular activities.
Co-curricular activities were used as indicators of quality of education in this study.
Therefore the null hypothesis that there is no significant relationship between
school physical facilities and quality of education was rejected.
According to OECD (2011), Schools should have facilities that support a wide
range of educational programs including the co-curricular activities. Such facilities
include school playgrounds, swimming pools, outdoor amphitheatres, art studios,
outside running tracks indoor running tracks and turf fields among others.
Availability of these facilities enables student participation in many games and
sports hence winning more trophies in school competitions. World Bank (2009)

115
also concur that inadequacy of school facilities such as computer laboratories,
playgrounds and internet connectivity limit participation of students in co-
curricular activities hence affecting quality of education in schools. In Kenya,
student participation in co-curricular activities is constrained by inadequate training
facilities and resource materials (RoK, 2012a). According to MoEST (2015a),
public secondary schools lack important sporting resources like football nets,
cricket nets, grassed playing area, art and drama studios, and auditorium for student
presentations and performances. Schools, therefore, need to invest in educational
facilities that promote students participation in co-curricular activities to enhance
holistic learning hence quality education.
4.6 Teacher Motivation and Quality of Education
Teacher motivation is currently viewed as the most important variable on learner
motivation (Rogers & Vegas, 2009; Sujewa, 2010). A motivated teacher is one who
not only feels satisfied with his or her job, but also empowered to strive for
excellence and growth in instructional practice (Basil, 2013). It is the responsibility
of the school principal to assess the needs of the teaching staff and advise the school
stake holders on how to satisfy them (Basil, 2013).
According to OECD (2011), the quality of any education system cannot exceed the
quality of its teachers. The study sought to investigate the extent to which teacher
motivation levels influence quality of education in public secondary schools in
116
Kenya. A study by Save the Children Organization (2011) on teacher motivation
linked higher teacher motivation levels to high student learning outcomes.
According to the study, teachers in developing countries need intrinsic and extrinsic
motivational supports like career sponsorship to in-service training, welfare support
and recognition. Using teacher recognition, status, awards, sponsorship to in
service seminars and workshops, team building activities and teacher welfare
support as indicators of teacher motivation, the teachers were asked to rate
adequacy of each indicator on a scale of 1 to 5 (1-less adequate, 2-less adequate,3-
moderately adequate, 4 –adequate,5 -more adequate). Responses 1, 2, 3 were
considered as inadequate while 4 and 5 were considered as adequate. The findings
are as shown in Table 4.18.

117
Table 4.18: Teachers Responses on their Level of Motivation
Indicators Responses n %
The school recognizes the role teachers play as
crucial
Inadequate 222 76
Adequate 70 24
Total 292 100
The teachers in the school are held with high
status
Inadequate 228 78
Adequate 64 22
Total 292 100
The school has awarded high performing
teachers
Inadequate 237 81
Adequate 55 19
Total 292 100
The school sponsors teachers for INSET
seminars
Inadequate 242 83
Adequate 50 17
Total 292 100
The school has sponsored teachers to team
building trips
The school has supported teachers social welfare
initiatives
Inadequate 248 85
Adequate 44 15
Total 292 100
Inadequate
239
82
Adequate 53 18
Total 292 100
From Table 4.18 above, majority of the teachers 222 (76 %) felt that schools do not
recognize the role they play as crucial. The teachers also indicated that the schools
do not hold them with high status 228 (78%). From the findings, over 80 percent
of the respondents revealed that their schools do not award high performing
teachers adequately; nor do they adequately sponsor teachers for INSET seminars.
118
These results have generally established that teachers are hardly motivated in most
of the schools.
The Save the Children (2011) report observed that intrinsic motivation like
recognition of teachers, supporting teacher career development and professionalism
are more effective in sustaining teacher effort and enhancing student achievement.
Supporting teachers to go for INSET courses enhances their teaching skills and
professional growth; and therefore their ability to effectively influence student
achievement.
According to the Basic Education Framework (RoK, 2017b), twenty first century
teachers need to be highly knowledgeable and skilled to be able to identify the
learners needs, ability and skills and collaborate with other stakeholders to
influence the learners future career. The teachers need to be reflective and
competent in modern pedagogical tools such as coaching and mentorship in order
to provide innovative learning experiences that will ensure that each learner takes
his/her rightful place in the world. Schools, therefore, need to support teachers to
acquire these skills through INSET seminars and workshops. In-service training of
teachers improves their content delivery methods and exposes them to modern
practices in the teaching profession. They are given certificates of attendance which
increases their chances of promotion. These enhances teacher performance hence
quality education.

119
The findings concur with those of Bennell and Akyeampong (2007), and Sujewa
(2010) who observed that in developing countries, most schools are faced with what
amounts to teacher crisis. According to Sujewa (2010) Schools in developing
countries are characterized by poor declining social status for teachers, and poor
working conditions. Such conditions have highly affected the teacher productivity
and hence, low student achievement academically.
To supplement the responses of teachers on their level of motivation, the teachers
were asked to comment on their motivation levels in the schools. The results are
shown in Table 4.19.
Table 4.19: Teachers Perceptions on their Motivation Levels
Frequency Percent
Motivation is moderate but not adequate
in the school
82 28.0
There is motivation in the school 76 26.1
No motivation at all in the school
134 45.9
Total 292 100.0
From Table 4.19, majority of the teachers 216(74%) indicated their dissatisfaction
with the motivation levels in their schools. About 46 percent of the teachers
indicated that their schools do not motivate them at all. Recognition and support of

120
teachers increases their morale to teach. When teachers are praised or given
certificates of excellence, they not only get motivated to work the more, but also
challenge other teachers to put more effort to their work. When teachers effort is
not recognized, they see no reason for working hard and fail to strive for excellent
in student achievement. Lack of motivation in public secondary schools can be
attributed to lack of a policy on teacher motivation. Schools have no guidelines on
how to motivate teachers and those that do, they appreciate teachers based on
available funds and principals good will. The findings concur with that of Basil
(2013) whose study on teacher motivation in Tanzania revealed that majority of
teachers in Tanzania are hardly motivated. Basil attributes the low student academic
achievement in Tanzania to lack of teacher motivation.
4.6.1 Bivariate Correlation Between Teacher Motivation and Quality of
Education
In order to obtain adept understanding on how teacher motivation relates with
quality of education, Pearson correlation was used to establish the direction and
strength of the relationship. The result is shown in Table 4.20.

121
Table 4.20: Bivariate Correlation Between Teacher Motivation and Quality of
Education
Correlations
Teacher
Motivation
Quality of
Education
Teacher .Motivation
Pearson Correlation 1 0.294**
Sig. (2-tailed) <0.001
N 213 209
Quality of Education
Pearson Correlation 0.294** 1
Sig. (2-tailed) <0.001
N 209 223
**. Correlation is significant at the 0.01 level (2-tailed).
From Table 4.20, the correlation coefficient (r)=0.294 and
P<0.001.Therefore there is a significant positive relationship between
teacher motivation levels and quality of education. This implies that schools
with highly motivated teachers have high quality education as compared to
schools whose teachers have little or insufficient motivation.

122
Schools that award high performing teachers, sponsor teachers to in-service
training courses and seminars, sponsor teachers for team building trips,
support teachers social welfare and hold teachers with high status are more
likely to record high KCSE mean scores, record high student transition rates
from form one to form four and win more trophies in co-curricular activities.
According to Basil (2013), a motivated teacher feels satisfied with his or her
job and strives for excellence in instructional practice hence high quality
education for learners. The quality of any education system cannot exceed
the quality of its teachers and therefore its the responsibility of school
principals to assess the needs of the teaching staff and advice the school
stakeholders on how to satisfy them (Basil, 2013; OECD, 2011).
4.6.2 Teacher Motivation Levels and Quality of Education
The study sought to establish whether there is a significant difference in quality of
education between schools with different teacher motivation levels. This was to
answer the second hypothesis that stated that;
HO2: There is no significant relationship between teacher motivation levels and
quality of education in public secondary schools in Kenya.
T-Test analysis was done to establish whether schools with different levels of
teacher motivation had same quality of education or not, if quality of education for
schools with different teacher motivation levels was found to be the same, then the

123
study could conclude that there is no significant relationship between teacher
motivation levels and quality of education but if quality of education varied with
teacher motivation levels, then the study could conclude that there is a significant
relationship between quality of education and teacher motivation levels. To do this,
the study classified the five responses(1-not all, 2-less extent, 3-moderate extent,
4-larger extent and 5-more adequate) into two (1,2,3-inadequate, and 4,5 –
adequate) and computed the means of the responses based on quality of education
parameters (KCSE mean score, transition, school mean trophies won in co-
curricular activities).The study aimed at computing the means of the two groups
(schools with high teacher motivation and schools with low teacher motivation) and
establishing whether their means for education quality had a statistical significant
difference.
The results of the means of the two groups is as shown in Table 4.21.
Table 4.21: Teacher Motivation Levels and Quality of Education
Motivation levels Mean Std. Deviation Std. Error
Mean
Low motivation 2.6559 0.44316 0.04807
High motivation 2.8188 0.62401 0.05312
From Table 4.21, mean of education quality for schools with highly motivated
teachers is 2.8188 while schools with low teacher motivation have a mean of
2.6559.The findings indicate that quality of education is higher in schools that

124
motivated their teachers highly as compared to schools whose teachers were lowly
motivated. However to ascertain whether the mean differences are statistically
significant, the study undertook Levenes test of variance and the results are
presented in Table 4. 22.
Table 4.22: T- test for Equality of Means—Teacher Motivation Levels and
Quality of Education
Levene's
Test for
Equality
of
Variances
t-test for
Equality
of Means
F Sig. t df
Sig.
(2-
tailed)
Mean
Difference
Std. Error
Difference
95%
Confidence
Interval of the
Difference
Lower Upper
Equal
variances
assumed
9.262 0.003 -2.102 221 0.037 -0.163 0.078 -0.316 -0.010
Equal
variances
not
assumed
-2.275 216.484 0.024 -0.163 0.072 -0.304 -0.022

125
From the Table 4.22, F=9.262 at p=0.003 (less than 0.05) implying that variances
of the two groups (highly and lowly) motivated teachers is not the same. From
Table 4.22 (T-test), p =0.024 which is less than 0.05, implying that the two means
are statistically different. Hence schools with highly motivated teachers have better
quality of education (2.8188) as compared to schools with lowly motivated teachers
(2.6559). Thus, schools that reward teacher performance, sponsor teachers to in
service courses, support teachers welfare and team building activities and recognize
the role played by teachers as crucial have better quality of education than those
that do not motivate their teachers. This study used KCSE mean score, student
transition rate from form one to form four and mean number of trophies won in co-
curricular and extracurricular activities to indicate quality of education. The
findings imply that schools that motivate their teachers well are likely to have high
KCSE mean scores, higher student transition rates from form one to form four and
better performance in co-curricular activities as opposed to schools with low
teacher motivation levels.
The study has therefore established that there is indeed a statistical significant
difference in quality of education between schools that have highly motivated
teachers and those with low teacher motivation. Schools with highly motivated
teachers have higher quality of education (2.8188) than those with low teacher
motivation. The schools are likely to have high KCSE mean scores, high transition
rates within grades and more participation in co-curricular activities. When schools

126
recognize and award teacher performance, they increase the morale of the teacher
to work hence impacting learner achievement positively. The teacher will spend
more time in teaching, coaching, mentoring and caring for learners hence quality
education. Thus, there is a significant relationship between teacher motivation
levels and quality of education in public secondary schools in Kenya. The findings
are consistent with Basil (2013) and Sujewa (2010) who observed that low student
academic performance in Tanzania and Sri Lanka is largely due to poor teacher
motivation.
4.6.3 Influence of Teacher Motivation on Quality of Education
To establish the extent to which teacher motivation influence quality of education,
the study used simple regression analysis to test whether there exists a significant
relationship between teacher motivation levels and quality of education in public
secondary schools in Kenya. The results of the regression analysis are presented in
Table 4.23.

127
Table 4.23: Influence of Teacher Motivation on Quality of Education
Model Summary
Model R R Square
Adjusted
R
Square
Std. Error of
the Estimate
1 0.294a 0.087 0.082 0.546247
ANOVAa
Model
Sum of
Squares df Mean Square F Sig.
1 Regression 5.854 1 5.854 19.620 <0.001
Residual 61.766 207 0.298
Total 67.620 208
Coefficientsa
Model
Unstandardized
Coefficients
Standardized
Coefficients
t Sig. B
Std.
Error Beta
1 (Constant) 1.958 0.184 10.661 <0.001
Teacher
Motivation
0.289 0.065 0.294 4.429 <0.001
a Dependent Variable: Y Quality of education
b. Predictors: (Constant), Teacher motivation
The model was summarized into a regression equation of the form Y=a+bX where
Y is the dependent variable (quality of education), a- is the constant of regression
analysis, b - the value of the coefficient of the independent variable and X- the value
of the independent variable. The independent variable in this case was teacher
motivation. Thus the regression analysis equation becomes,

128
Y= 1.958+0.289 x teacher motivation. This implies that teacher motivation has a
positive relationship with quality of education. For every one-unit increase in
teacher motivation, quality of education increased by 0.289 units. Therefore the
higher the level of motivation of the teachers the better the quality of education in
a school. Since the significance level, p<0.001, then the relationship between
teacher motivation and quality of education was very significant. Further, R2=0.087
implies that teacher motivation predicted quality of education at 8.7 percent. Thus,
the study concluded that teacher motivation levels had a statistical significant
relationship with quality of education and the null hypothesis that teacher
motivation levels have no significant relationship with quality of education was
rejected.
The findings agree with those of Save the Children (2011), who observed that
teacher motivation is at the heart of quality of any education. The needs and welfare
of the teacher must be reasonably attended to before the needs of the learner OECD
(2011), posits that the quality of any education system cannot exceed the quality of
its teachers. Quality education is delivered by highly knowledgeable and motivated
teachers. Studying secondary education in India the World Bank (2009) noted that
teacher characteristics is one of the key determinants of quality education.
According to the World Bank report, teachers are the most valuable resource for
education quality. Therefore, it is important that school principals and management

129
come up with guidelines on how to appreciate teachers and help them in
professional development. This increases their effort to teach and inspire them to
work and stay longer in the school, in anticipation for enhanced professional
development and promotions. When teachers’ effort is increased, learner
achievement increases too hence quality education.
Since quality of education was a product of school KCSE mean score, transition
rate (between form 1 to 4) and number of trophies won by students in co-curricular
activities, the study sought to know the extent of influence of teacher motivation on
each of these indicators of quality.
4.6.3.1 Influence of Teacher Motivation on KCSE Mean Score
To establish the extent to which teacher motivation levels influence KCSE mean
score, the study used simple regression analysis to establish whether there exists a
significant relationship between teacher motivation and KCSE mean score in public
secondary schools in Kenya. The result was presented in Table 4.24.

130
Table 4.24: Influence of Teacher Motivation Levels on KCSE Mean Score
Model Summary
Model R R Square
Adjusted
R
Square
Std. Error of
the Estimate
1 0.255a 0.065 0.060 1.355587
ANOVAa
Model
Sum of
Squares df
Mean
Square F Sig.
1 Regression 24.839 1 24.839 13.517 <0.001
Residual 356.497 194 1.838
Total 381.336 195
Coefficientsa
Model
Unstandardized
Coefficients
Standardized
Coefficients
t Sig.
B
Std.
Error Beta
1 (Constant) 3.380 0.472 7.166 <0.001
Teacher
Motivation
0.621 0.169 0.255 3.677 <0.001
a. Dependent Variable: Y_ KCSE Mean Score
b. Predictors: (Constant), Teacher Motivation
The model in Table 4.24 was summarized into a regression equation of the form
Y=a+bX where Y is the dependent variable (KCSE mean score), a- is the constant

131
of regression analysis, b - the value of the coefficient of the independent variable
and X, the value of the independent variable. The independent variable was teacher
motivation levels. Thus the regression equation becomes,
Y = 3.38 + 0.621 x teacher motivation. For every one unit increase in teacher
motivation, KCSE mean score increased by 0.621 units. Since P<0.001, the
findings clearly revealed that teacher motivation had a positive significant
relationship with school KCSE mean score at R2 = 0.065. The model therefore
revealed that teacher motivation predict KCSE mean score at 6.5 percent. This
implied that there is a statistical significant relationship between teacher motivation
levels and KCSE mean score. The higher the level of motivation of teachers in a
school, the higher the school mean score and the lower the level of motivation, the
lower the school mean score. Since the significance level P<0.001, the study
concluded that there is a statistical significant relationship between teacher
motivation levels and KCSE mean score.
The findings are consistent to research findings of Basil (2013), OECD (2010), and
Sujewa (2010). According to OECD (2011), teachers in the worlds leading
countries in academic performance such as Finland and Singapore enjoy a variety
of incentives based on their academic performance. The teachers enjoy fully paid

132
professional development course every year and have a structured mentorship
programme on first posting. Teachers with outstanding performance in academics
and co-curricular activities get bonuses amounting to their three months salaries,
and other stipends for computer training, research and subscription to relevant
journals.
Research by Basil (2013) and Sujewa (2010) in Tanzania and Sri Lanka
respectively indicate that teachers in these countries are faced with increased
workload, poor teacher pay, declining social status, poor working and living
conditions. Consequently, the countries record high level of student absenteeism,
teacher transfers between schools, migration of qualified teachers to developed
countries in search of better paying jobs, hence low student academic achievement.
When teachers work in poor conditions and the schools fail to support them, their
input becomes minimal leading to poor quality education in the schools.
4.6.3.2 Influence of Teacher Motivation on Student Transition Rate
The study used student transition rate from form one to form four as an indicator of
quality of education. The study used Secondary school cohort (2013-2016) in the
sampled schools. According to World Bank (2009), high student transition rates
within education levels indicate high quality of education while repetition and
dropout indicates low quality of education. Therefore, to establish the extent to
which teacher motivation influences student transition rate within secondary school

133
level, the study used simple regression analysis to test whether there exists a
significant relationship between teacher motivation levels and student transition
rate in public secondary schools in Kenya.
The result is presented in Table 4.25.
Table 4.25: Influence of Teacher Motivation Levels on Student Transition
Rate
Model Summary
Model R R Square
Adjusted
R
Square
Std. Error of
the Estimate
1 .435a .189 .126 33.8008
ANOVAa
Model
Sum of
Squares df
Mean
Square F Sig.
1 Regression 608.019 1 608.019 5.32 0.021
Residual 22392.107 196 114.255
Total 23000.126 197
Coefficientsa
Model
Unstandardized
Coefficients
Standardized
Coefficients
t Sig. B
Std.
Error Beta
1 (Constant) 77.976 11.892 6.557 <0.001
Teacher
Motivation
0.632 0.278 0.052 3.730 0.021
a. Dependent Variable: Transition Rate
b. Predictors: (Constant), Teacher Motivation
From Table 4.25, the model was summarized into a regression equation of the form
Y=a+bX where Y is the dependent variable (transition rate), a- is the constant of
regression, b - the value of the coefficient of the independent variable and X, the

134
value of the independent variable. The independent variable in this case was teacher
motivation. Thus the regression equation becomes,
Y=77.976+0.632 x teacher motivation. This implied that there is a positive
relationship between teacher motivation and transition rate of students from one
grade to the next in public secondary schools in Kenya. For every one-unit increase
in teacher motivation, transition rate increased by 0.632 units. Furthermore,
R2=0.189 implied that teacher motivation predict transition rate of students at 18.9
percent. Since the significance level (p= 0.02) is less than 0.05, the study concluded
that the relationship between teacher motivation levels and student transition rate
in public secondary schools is significant.
The findings are consistent with World Bank (2009; 2014b) on education in India.
According to World Bank (2009), approximately one half of students who enroll
for lower secondary education in India fail to complete the course due to teacher
absenteeism. This indicates a big problem of retention and loss of potential human
capital. Quality of secondary education in India is therefore very low and there is
an urgent need to address the issue of teacher motivation, a key factor behind the
fast deteriorating secondary education in India. Teachers in India reported that they
have low morale to perform their duties, schools have no incentive system to
motivate them, and they have little access to school facilities and resources that
support teaching and learning including textbooks and teacher guides (World Bank,

135
2014b). The teachers, therefore, lack commitment to engage students effectively
hence high grade repetition and dropout rates; leading to low quality education.
4.6.3.3 Influence of Teacher Motivation Levels on Mean Number of Trophies
Won by a School in Co-curricular Activities
To establish the extent to which teacher motivation levels influence mean number
of trophies won in co-curricular activities, the study used simple regression analysis
to test whether there exists a significant relationship between teacher motivation
levels and mean number of trophies won in co-curricular activities in public
secondary schools in Kenya. The result is presented in Table 4.26.

136
Table 4.26: Influence of Teacher Motivation Levels on Mean Number of
Trophies Won in Co-curricular Activities
Model Summary
Model R R Square
Adjusted
R
Square
Std. Error of
the Estimate
1 0.168a 0.028 0.023 2.691858
ANOVAa
Model
Sum of
Squares df
Mean
Square F Sig.
1 Regression 37.772 1 37.772 5.213 0.024
Residual 1304.298 180 7.246
Total 1342.070 181
Coefficientsa
Model
Unstandardized
Coefficients
Standardized
Coefficients
t Sig. B
Std.
Error Beta
1 (Constant) 0.512 0.992 .517 .606
Teacher
Motivation
0.814 0.357 0.168 2.283 .024
a. Dependent Variable: Mean. No. of trophies
b. Predictors: (Constant), Teacher motivation
The model was summarized into a regression equation of the form Y=a+bX where
Y is the dependent variable (mean number of trophies), a- is the constant of
137
regression analysis, b - the value of the coefficient of the independent variable and
X, the value of the independent variable. The independent variable in this case was
teacher motivation. Thus, the regression analysis equation becomes,
Y= 0.512+0.814 x teacher motivation. This equation implied that school mean
trophies won in co- curricular activities were proportionate to the motivation levels
of the teachers. Schools that motivated teachers to high levels were likely to win
more trophies in co-curricular activities as opposed to schools with less teacher
motivation. Since P<0.05, the study concluded that teacher motivation has a
significant relationship with school mean trophies won in co-curricular activities.
Furthermore, R2=0.028 implied that teacher motivation levels predict 2.8 percent
of school mean trophies won by a school in co-curricular activities. Co-curricular
activities were used as indicators of quality of education in this study. Therefore,
the findings indicate that teacher motivation levels have a statistical significant
relationship with quality of education.
The findings concur with MoEST (2015a), who indicated that poor performance of
students in co-curricular activities in public secondary schools in Kenya is mainly
attributed to teacher characteristics such as absenteeism and lack of commitment to
engage learners. Although co-curricular activities are mandatory and programmed
in the school timetable, teachers in public secondary schools overemphasize
examinable subjects at the expense of co-curricular activities (MoEST,2015a).The
teachers lack the right attitude towards co-curricular activities and are inadequately
138
trained and motivated to coach students (Kapelinya & Lumumba 2017 MoEST,
2015a ).This is because schools focus more on academic grades and motivation of
teachers in school is mostly based on academic performance.
A study by Okumu et al (2017) on the influence of co-curricular activities on
students KCSE academic performance in Nakuru County revealed that majority of
the teachers who are club patrons and coaches, received little support and
motivation from the school administration hence making them reluctant to enroll a
big number of students in co-curricular clubs and sports. This could affect
exploitation of student talent and the number of awards won by a school in co-
curricular activities and, therefore limit the range of curriculum offered in a school,
hence low quality education.
A study on gender stereotypes in teachers running of co-curricular activities at
Rhodes Park and Silver Springs schools in Zambia also found out that majority of
the teachers who coach students in co-curricular activities hardly receive incentives
from the school administration (Muninde, 2016). According to the study, only 3 out
of 62 teachers who coached their teams to national levels that year received
certificates to appreciate their effort. This raised their chances of being promoted
to higher positions. The other teachers did not receive even verbal appreciation
from the school. This could affect the morale of the teachers and consequently the

139
number of students who could participate in co-curricular activities hence few
trophies to be won by a school.
4.7 School Financial Resources and Quality of Education
Issues of education funding and adequacy of school financial resources have been
highly debated both in developing and developed countries (Mascitti-Miller, 2013).
Policy makers, tax payers and other education stakeholders do wonder whether
schools that receive the most in terms of financial resources produce most in terms
of measurable student outcomes (Johnson, 2004). The study sought to establish the
sources of financial resources received by the schools. The results are shown in
Table 4.27.

140
Table 4.27: Principals’ Responses on Sources of School Financial Resources
Financial resources Responses n %
School receive government grants Yes 226 100
No 0 0
Total 226 100
School generates funds from income generating
activities
Yes 83 37
No 143 63
Total 226 100
School receives budgetary support from alumni
contribution
Yes 20 9
No 206 91
Total 226 100
Parents contribute to the school's financial
resources
Yes 207 92
No 19 8
Total 226 100
School receive financial sponsor support Yes 97 43
No 128 57
Total 226 100
School receive donations from other well wishes Yes 109 48
No 117 52
Total 226 100

141
From Table 4.27, all principals (100%) reported to have received financial support
from the government. This follows the government policy to fund all public
secondary schools through the Free Day Secondary Education and subsidized
education in boarding schools. According to the Circulars on guidelines on
implementation of Free Secondary Education in Kenya (MoE, 2008; MoE, 2017),
government subsidy to schools is based on capitation. The money is sent by the
Ministry of Education directly to schools and broken down into the following vote
heads- tuition, repairs, maintenance and improvement, local travel and transport,
electricity, water and conservancy, activity fees, personal emoluments, and medical
insurance fees. For public day secondary schools, the money is supposed to cover
all the financial needs of the schools however for boarding secondary schools,
parents are supposed to pay for boarding expenses the amount of which depends on
the cost of living of the location of the school (MoE, 2008; MoE, 2017; MoEST,
2014).
According to the findings in Table 4.23, majority of the principals 207(92%)
reported to have received financial support from the parents. This is in line with the
government policy that parents need to support education in public secondary
schools through the Parents Association. This could be done through organized
fundraising activities and individual parent contributions towards students’
boarding fees and school infrastructure development funds. A few schools (37 %)

142
also engage in income generating activities while 9 percent of the schools reported
to have received support from their Alumni.
4.7.1 Adequacy of Financial Resources in Schools
The study sought to establish whether the financial resources received from the
different sources above were adequate in running school activities. The school
principals were asked to rate the adequacy of the financial resources against each
source on a scale of 1-5 (1-not at all, 2-less adequate, 3 moderately adequate, 4-
large extent and 5-very large). The study considered results responses 1 and 2 and
3 as inadequate while 4, and 5 were rated as adequate. The results are shown in
Table 4.28.

143
Table 4.28: Principals Responses on Adequacy of School Financial Resources
Indicators Responses n %
The school has received adequate government
grants
Inadequate 200 88.6
Adequate 26 11.4
Total 226 100
The school has generated sufficient funds from
various income generating activities
Inadequate 215 95.2
Adequate 11 4.8
Total 226 100
The school has received adequate budgetary
support from alumni contribution
Inadequate 220 97.4
Adequate 6 2.6
Total 226 100
Parents contributions have been sufficient Inadequate 203 89.9
Adequate 23 10.1
Total 226 100
The school has received a lot of financial sponsor
support
Inadequate 215 95.2
Adequate 11 4.8
Total 226 100
According to the findings in Table 4.28, majority 200 (88.6%) of the school
principals felt that the government grants sent to public secondary schools to
support Free Secondary Education was inadequate. About 95 percent of the school
principals also reported that their schools had not generated sufficient funds from
income generating activities. The study also established that majority 220(97.4%)

144
of the school principals had not received adequate financial support from the school
alumni. Almost 90% of the principals indicated that the financial support received
from parents was inadequate while an overwhelming majority of the principals
indicated that they had received insufficient financial support from school sponsors.
The findings concur with that of Ogallo et al (2013), whose findings blamed poor
quality of education in Nyando and Muhoroni Districts on inadequate funds in
schools due to school levy default. A study by Orodho (2014), also revealed that
the government support for tuition fee in secondary schools was inadequate to
provide quality education in public secondary schools in Kenya.
4.7.2 Bivariate Correlation Between School Financial Resources and Quality
of Education
After establishing the adequacy levels of each of the sources of school finances, the
study sought to establish whether there exists a relationship between adequacy of
school financial resources and quality of education. Pearson correlation was used
to test if a relationship exists between school financial resources and quality of
education. The result is as shown in Table 4.29.

145
Table 4.29: Bivariate Correlation Between School Financial Resources and
Quality of Education
Correlations
School
Financial
Resources
Quality of
Education
School Financial
Resources
Pearson Correlation 1 0.152*
Sig. (2-tailed) 0.023
N 225 222
Quality of Education
Pearson Correlation 0.152* 1
Sig. (2-tailed) 0.023
N 222 223
*. Correlation is significant at the 0.05 level (2-tailed).
From Table 4.29, Pearson correlation coefficient (r) = 0.152 at 0.023 significance
level. Therefore, there is a positive relationship between school financial resources
and quality of education. The implication is that, schools with adequate financial
resources have higher quality of education than schools with inadequate school
financial resources. Since the study used KCSE mean score, student transition rates
and mean number of trophies won in co-curricular activities to indicate quality of
education, then, the study has established that schools with adequate financial
resources are likely to score higher KCSE mean scores, record high transition rates
146
between form one and form four, and win more trophies in co- curricular activities.
Since p=0.023, then the relationship between school financial resources and quality
of education is significant. The findings concur with that of Mascitter-Miller (2013)
and Amos and Koda (2018). According to Mascitter-Miller, school financial
resources and quality of education are highly related and the amount of wealth in a
school shapes the quality of education the school offers. After establishing a
relationship between quality of education and school financial resources, the study
sought to establish how quality of education varies with adequacy of school
financial resources
4.7.3 Relationship Between School Financial Resources and Quality of
Education
The study sought to establish whether there was a significant difference in quality
of education between schools with different levels of adequacy of school financial
resources. This was to answer the third hypothesis that stated that;
HO3: There is no significant relationship between adequacy of school financial
resources and quality of education in public secondary schools in Kenya.
T-Test analysis was done to establish whether schools with different levels of
school financial resources had same quality of education or not. If quality of
education for schools with different levels of adequacy of school financial resources
was found to be the same, then the study could conclude that there is no significant
relationship between adequacy of school financial resources and quality of
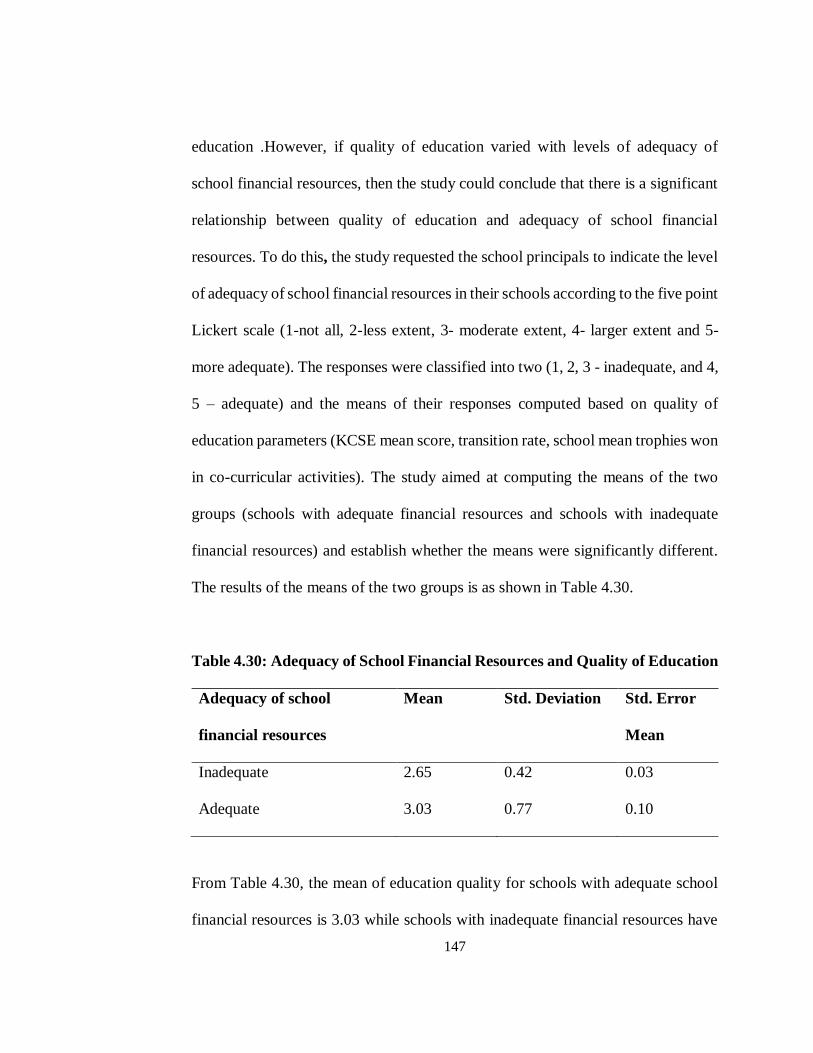
147
education .However, if quality of education varied with levels of adequacy of
school financial resources, then the study could conclude that there is a significant
relationship between quality of education and adequacy of school financial
resources. To do this, the study requested the school principals to indicate the level
of adequacy of school financial resources in their schools according to the five point
Lickert scale (1-not all, 2-less extent, 3- moderate extent, 4- larger extent and 5-
more adequate). The responses were classified into two (1, 2, 3 - inadequate, and 4,
5 – adequate) and the means of their responses computed based on quality of
education parameters (KCSE mean score, transition rate, school mean trophies won
in co-curricular activities). The study aimed at computing the means of the two
groups (schools with adequate financial resources and schools with inadequate
financial resources) and establish whether the means were significantly different.
The results of the means of the two groups is as shown in Table 4.30.
Table 4.30: Adequacy of School Financial Resources and Quality of Education
Adequacy of school
financial resources
Mean Std. Deviation Std. Error
Mean
Inadequate 2.65 0.42 0.03
Adequate 3.03 0.77 0.10
From Table 4.30, the mean of education quality for schools with adequate school
financial resources is 3.03 while schools with inadequate financial resources have
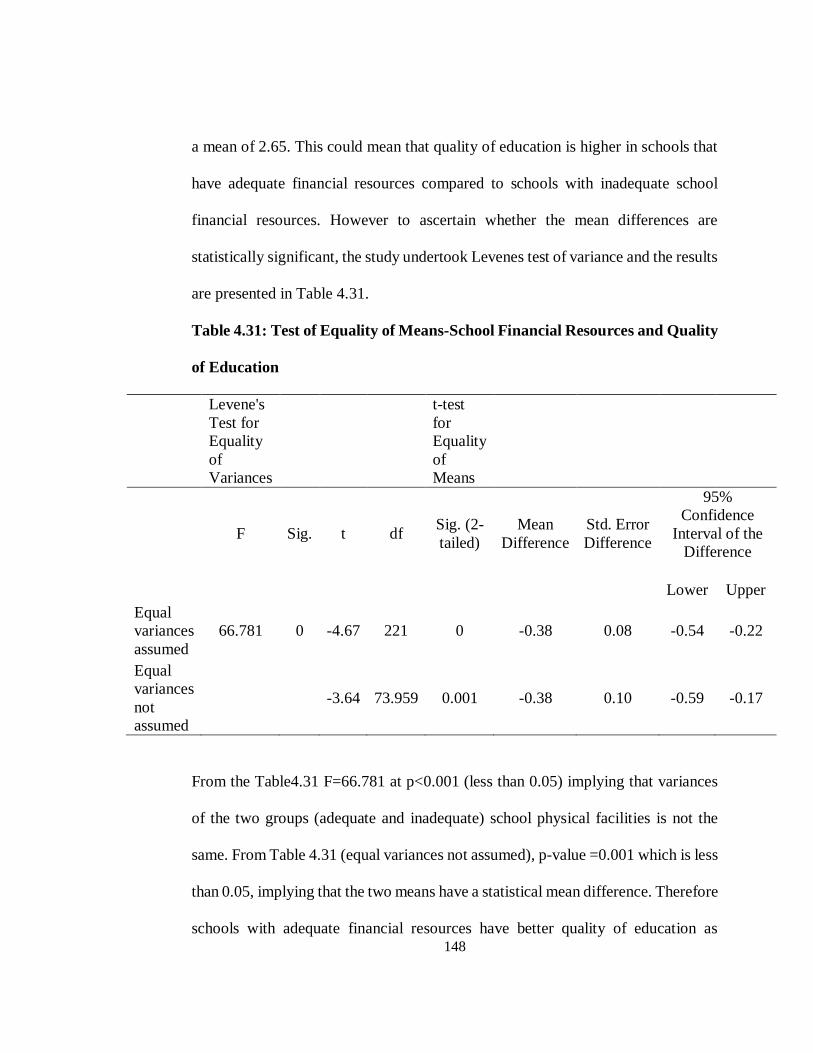
148
a mean of 2.65. This could mean that quality of education is higher in schools that
have adequate financial resources compared to schools with inadequate school
financial resources. However to ascertain whether the mean differences are
statistically significant, the study undertook Levenes test of variance and the results
are presented in Table 4.31.
Table 4.31: Test of Equality of Means-School Financial Resources and Quality
of Education
Levene's
Test for
Equality
of
Variances
t-test
for
Equality
of
Means
F Sig. t df Sig. (2-
tailed)
Mean
Difference
Std. Error
Difference
95%
Confidence
Interval of the
Difference
Lower Upper
Equal
variances
assumed
66.781 0 -4.67 221 0 -0.38 0.08 -0.54 -0.22
Equal
variances
not
assumed
-3.64 73.959 0.001 -0.38 0.10 -0.59 -0.17
From the Table4.31 F=66.781 at p<0.001 (less than 0.05) implying that variances
of the two groups (adequate and inadequate) school physical facilities is not the
same. From Table 4.31 (equal variances not assumed), p-value =0.001 which is less
than 0.05, implying that the two means have a statistical mean difference. Therefore
schools with adequate financial resources have better quality of education as

149
compared to schools with inadequate school financial resources. Thus, besides the
government grants, schools that engage in income generating activities; receive
financial support from parents, alumni, sponsors and receive donations from well-
wishers are more likely to have better quality of education than schools that depend
solely on government grants. This study used KCSE mean score, student transition
rate from form one to form four and mean number of trophies won in co-curricular
activities to indicate quality of education. The findings imply that schools that have
adequate financial resources are likely to have high KCSE mean scores, higher
student transition rates from form one to form four and better performance in co-
curricular activities as opposed to schools with inadequate financial resources.
The study has therefore established that there is indeed a statistical significant
difference between schools that have adequate school financial resources and those
with inadequate school financial resources. Schools with adequate school financial
resources have higher quality of education (3.03) than those with inadequate
financial resources. Thus the study concludes that there is a significant relationship
between adequacy of school financial resources and quality of education in public
secondary schools in Kenya.
The findings concur with Miles and Frank (2008) and the World Bank (2008a) who
observed that high performing schools have adequate financial resources. The
schools receive high allocations from parents, government and other partners; and

150
the finances are focused to offering a variety of academic programmes and
individualized student and teacher attention hence enhanced learner achievement.
4.7.4 Influence of School Financial Resources on Quality of Education
To establish the extent to which school financial resources influence quality of
education, the study used simple regression analysis to establish whether there
existed a significant relationship between school financial resources and quality of
education in public secondary schools in Kenya. The results of the regression
analysis are presented in Table 4.32.

151
Table 4.32: Influence of School Financial Resources on Quality of Education
Model Summary
Model R R Square
Adjusted
R
Square
Std. Error of
the Estimate
1 0.152a 0.023 0.019 .562410
ANOVA
Model
Sum of
Squares df Mean Square F Sig.
1 Regression 1.653 1 1.653 5.226 0.023
Residual 69.587 220 0.316
Total 71.240 221
Coefficientsa
Model
Unstandardized
Coefficients
Standardized
Coefficients
t Sig. B
Std.
Error Beta
1 (Constant) 2.428 0.149 16.307 <0.001
School
Financial
Resources
0.162 0.071 0.152 2.286 0.023
a. Dependent Variable: Y_Quality of education
b. Predictors: (Constant), School financial resources
The model in Table 4.32 was summarized into a regression equation of the form
Y= a+ bX where Y is the dependent variable (quality of education), a- is the
constant of regression equation, b - the value of the coefficient of the independent
variable and X, the value of the independent variable. The independent variable in

152
this case was school financial resources. Thus, the regression analysis equation
becomes Y= 2.428+0.162 x school financial resources.
This implied that for every one-unit increase in school financial resources, quality
of education increased by 0.162. Therefore the more the financial resources in a
school, the better the quality of education. Since p=0.023 and therefore less than
0.05, the relationship between quality of education and school financial resources
was found to be significant.
Further, since R2=0.023, it implies that school financial resources predicted quality
of education at 2.3 percent. Therefore the results in Table 4.32 have revealed that
there is a statistical significant relationship between adequacy of school financial
resources and quality of education in public secondary schools in Kenya. Thus, the
study rejected the null hypothesis and concluded that there is a statistical significant
relationship between adequacy of school financial resources and quality of
education in public secondary schools in Kenya. The findings concur with Miles
and Frank (2008) who found out that high performing schools have adequate
finances that are focused to offering a variety of programmes, and ensure that
students meet rigorous academic learning standards and create personalized
relationships between students and teachers.

153
Since quality consisted of KCSE mean score, transition rate and co-curricular
activities, the study sought to establish the relationship between school financial
resources and KCSE mean score, school financial resources and transition rate and
school financial resources and co-curricular activities.
4.7.4.1 Influence of School Financial Resources on KCSE Mean Score
To establish the extent to which school financial resources influence KCSE mean
score, the study used simple regression analysis and the results are presented in
Table 4.33.

154
Table 4.33: Influence of School Financial Resources on KCSE Mean Score
Model Summary
Model R
R
Square
Adjusted
R
Square
Std. Error of
the Estimate
1 0.333a 0.111 0.112 2.470462
ANOVAa
Model
Sum of
Squares df Mean Square F Sig.
1 Regression 158.8 1 158.8 25.8 <0.001
Residual 1193.6 194 6.153
Total 1352.4 195
Coefficientsa
Model
Unstandardized
Coefficients
Standardized
Coefficients
t Sig. B
Std.
Error Beta
1 (Constant) 2.040 .95 2.149 0.032
School
Financial
Resources
1.820 .357 .342 5.079 <0.001
a. Dependent Variable: Y_Mean KCSE score
b. Predictors: (Constant), School financial resources
The model in Table 4.33 was summarized into a regression equation of the form
Y=a+bX where Y is the dependent variable (KCSE mean score), a- is the constant
of regression equation, b - the value of the coefficient of the independent variable

155
and X, the value of the independent variable. The independent variable in this case
was school financial resources. Thus the regression analysis equation became, Y=
2.04 + 1.82 x school financial resources. This implied that for every one-unit
increase of school financial resources, KCSE mean score increased by 1.82 units.
Therefore the more adequate the school financial resources, the higher the schools’
KCSE mean score. Since p<0.001, then the relationship between school KCSE
mean score and school financial resources is significant.
Since R2=0.111, it also implied that school financial resources predict school KCSE
mean score at 11.1 percent. Therefore the study established that there is a statistical
significant relationship between adequacy of school financial resources and school
KCSE mean score. School financial resources predict school KCSE mean score at
11.1 percent. The study used KCSE mean score as an indicator of quality of
education thus it concluded that there is a statistical significant relationship between
school financial resources and quality of education. This agrees with findings of the
World Bank report (2008a) that linked Tanzania’s high performing schools to high
budgetary allocations from the government and high financial support from parents,
sponsors and other educational partners.
4.7.4.2 Influence of School Financial Resources on Student Transition Rate
To establish the extent to which school financial resources influence student
transition rate, the study used simple regression analysis to establish whether there

156
exists a significant relationship between school financial resources and student
transition rate in public secondary schools in Kenya. The results are shown in Table
4.34.
Table 4.34: Influence of School Financial Resources on Student Transition
Rate
Model Summary
Model
R R Square
Adjusted
R Square
Std. Error of the
Estimate
1 0.198a 0.039 0.035 32.2367
ANOVAa
Model
Sum of
Squares df Mean Square F Sig.
1 Regression 8880.819 1 8880.819 8.546 0.004
Residual 217193.269 209 1039.202
Total 226074.087 210
Coefficientsa
Model
Unstandardized
Coefficients
Standardized
Coefficients
t Sig. B Std. Error Beta
1 (Constant) 61.240 8.757 6.993 <0.001
School
Financial
Resources
12.128 4.149 0.198 2.923 0.004
a. Dependent Variable: Transition rate
b. Predictors: (Constant), School financial resources
The result in Table 4.34 was summarized into a regression equation of the form Y=
a+bX where Y is the dependent variable (Transition rate), a- is the constant of
regression equation, b- the value of the coefficient of the independent variable and
X- the value of the independent variable. The independent variable in this case was

157
school financial resources. Thus the regression analysis equation became Y=
61.24+12.128 x school financial resources. This implied that for every one-unit
increase in school financial resources, transition rate increased by 12.128 units.
Therefore the more adequate the financial resources, the higher the transition rate.
Since p<0.05, then it implied that there is a significant relationship between school
financial resources and student transition rate within the secondary school level.
Furthermore, since R2=0.039 it implied that school financial resources predict
student transition rate in secondary school level at 3.9 percent. Therefore there is a
significant relationship between school financial resources and student transition
rate within secondary school level in public secondary schools in Kenya. Since
transition rate is a component of quality education, the study concluded that there
is a statistical significant relationship between adequacy of school financial
resources and quality of education in public secondary schools in Kenya.
The findings concur with Lewin (2008) who observed that secondary schools in the
Sub Sahara Africa enroll just a quarter of the region’s secondary school age children
and those enrolled attend school irregularly with less than a third of a cohort
completing secondary school course. Lewin attributes this low transition within
secondary school level to lack of school fees and poverty. He recommends for
increased budgetary allocation from the government, scholarships, subsidies and
waivers for those who cannot afford to pay secondary school fees. Nyangaresi et al
(2016) also relates student retention rates to adequacy of school financial resources

158
and advocates for schools to engage in IGAs to ease financial burden of school fees
from parents and increase retention and student achievement.
4.7.4.3 Influence of School Financial Resources on Mean Number of Trophies
Won in Co-curricular Activities
To establish the extent to which school financial resources influence mean number
of trophies, the study used simple regression analysis to establish whether there
exists a significant relationship between school financial resources and mean
number of trophies won in co-curricular activities in public secondary schools in
Kenya. The results are presented in Table 4.35.

159
Table 4.35: Influence of School Financial Resources on Mean Number of
Trophies Won in Co-curricular Activities
Model Summary
Model R R Square
Adjusted
R
Square
Std. Error of
the Estimate
1 0.481a 0.2314 0.103 2.643306
ANOVAa
Model
Sum of
Squares df
Mean
Square F Sig.
1 Regression 8780.1 1 8780.10 7.84 <0.001
Residual 216197.2 193 1120.2
Total 224977.3 194
Coefficientsa
Model
Unstandardized
Coefficients
Standardized
Coefficients
t Sig. B
Std.
Error Beta
1 (Constant) 62.216 5.741 7.012 0.001
School
Financial
Resources
13.233 2.549 0.048 3.287 0.003
a. Dependent Variable: Mean trophies
b. Predictors: (Constant), School financial resources
The findings in Table 4.35 were summarized into a regression equation of the form
Y=a+bX where Y is the dependent variable (number of trophies), a- is the constant

160
of the regression analysis, b- the value of the coefficient of the independent variable
and X, the value of the independent variable. The independent variable in this case
was school financial resources. Thus the regression analysis equation became Y=
62.216 +13.233 x school financial resources. For every one unit increase in school
financial resources, the number of trophies increased by 13.233 units. Since
p=0.003, then the relationship between school financial resources and the number
of trophies won in co-curricular activities is significant. Further, R2=0.2314 implied
that school financial resources predict the number of trophies won in co-curricular
activities at 23.14 percent. Therefore, the study established that there is a significant
relationship between the schools mean number of trophies won in co-curricular
activities and adequacy of school financial resources.
The findings concur with MoEST (2015a), who observed that student participation
in co-curricular activities in Kenya is low due to inadequate financial resources to
support the co-curricular activities, organize and coordinate the competitions.
MoEST recommends for increased funding to public secondary schools to manage
and provide adequate materials for co-curricular activities, incorporation of more
partners to support co-curricular activities, and monitoring and evaluation of co-
curricular activities at all levels.

161
4.8 Teaching and Learning Resources and Quality of Education
Teaching and learning resources play an important role in diminishing the effect of
socio-economic factors in academic achievement and creating equal opportunities
for students (Savasci & Tomul, 2013). According to Asikhia (2010) adequate well
prepared teaching and learning resources determine the amount of learning that
takes place in a learning setting. Asikhia posits that quality learning materials
motivate students to learn, maintain concentration and make learning more
meaningful. Veerspoor, (2008) argues that shortages of learning resources
adversely affect instructional effectiveness. Based on this, the study sought to
determine the extent to which teaching and learning resources influence quality of
education in public secondary schools in Kenya. This could only be established
effectively when the level of availability of teaching and learning resources in
schools was known. Teachers were requested to rate the adequacy of teaching and
learning resources in their schools on a scale of 1-5 (1-not at all, 2-less adequate, 3
moderately adequate, 4-large extent and 5-very large). The study considered
responses 1, 2, and 3 as inadequate while 4, and 5 were considered as adequate. The
results are shown in Table 4.36.

162
Table 4.36: Teachers’ Responses on Adequacy of Teaching and Learning
Resources
Indicators Responses n %
The school has had adequate textbooks
Inadequate
231
79
Adequate 61 21
Total 292 100
The school has had adequate exercise books
Inadequate
169
57.9
Adequate 123 42.1
Total 292 100
The school has provided sufficient
assessment materials
Inadequate
219
75
Adequate 73 25
Total 292 100
The school has had adequate laboratory
equipment and chemicals to undertake
experiments
Inadequate
239
82
Adequate 53 18
Total 292 100
The desks and chairs in the school match all
the learners needs
Inadequate
216
74
Adequate 76 26
Total 292 100
There is adequate Information,
communication and technological teaching
aids in the school
Inadequate 257 88
Adequate 35 12
Total 292 100
163
From Table 4.36, majority of the teachers 231 (79%) reported to have had
inadequate textbooks in their schools. About 58 percent of the teachers also
indicated that their schools have inadequate exercise books. On assessment
materials, 75 percent of the teachers reported to have had inadequate assessment
materials in their schools. Majority of the teachers 239 (82%) also revealed that
their schools had inadequate laboratory equipment and chemicals to undertake
experiments. The desks and chairs were also found to be insufficient and therefore
could not match all the leaners needs. Majority of the teachers (88.4%) also reported
to have had inadequate information, communication and technological teaching
aids in their schools.
The findings concur with the Ministry of Education Science and Technology
(MoEST 2014, 2015a) that attributes low academic achievement in public
secondary schools to inadequate teaching and learning resources. According to
MoEST (2015a), insufficient teaching and learning resources in public secondary
schools greatly contribute to poor academic achievement of students, and under
performance by teachers. In Greece, Mexico, Poland, Turkey, Brazil, Lithuania,
Indonesia, Serbia, Thailand, Tunisia, Uruguay and Russian Federation, the school
managers maintain that lack of teaching aids or its poor quality hinder instructional
quality (Savisci & Tomul, 2013).

164
4.8.1 Bivariate Correlation Between Teaching and Learning Resources and
Quality of Education
After establishing the adequacy levels of each of the teaching and learning resource,
the study sought to find out whether there exists a relationship between teaching
and learning resources and quality of education. Pearson correlation was used to
test if a relationship exists between school teaching and learning resources and
quality of education. The results are shown in Table 4.37.
Table 4.37: Bivariate Correlation between Teaching and Learning Resources
and Quality of Education
Teaching and
Learning
Resources
Quality of
Education
Teaching.and.Learning.
Resources
Pearson Correlation 1 0.481**
Sig. (2-tailed) <0.001
N 213 209
Quality of Education
Pearson Correlation 0.481** 1
Sig. (2-tailed) <0.001
N 209 223
**. Correlation is significant at the 0.01 level (2-tailed).

165
From Table 4.37, the correlation coefficient (r) =0.481 and P<0.001.
Therefore there is a significant positive relationship between teaching and
learning resources and quality of education. The implication is that, the more
adequate the teaching and learning resources in a school, the higher the
quality of education in the school. Schools with inadequate or insufficient
teaching and learning resources are more likely to offer low quality
education. The study used KCSE mean score, student transition rates from
form one to form four and mean number of trophies won in co-curricular
activities to indicate quality of education. The findings indicate that schools
with adequate teaching and learning resources are likely to provide high
quality education than schools with inadequate teaching and learning
resources. The findings concur with that of Asikhia (2010) who found out
that teaching and learning resources determine the amount of learning that
takes place in a school.
4.8.2 Adequacy of Teaching and Learning Resources and Quality of Education
The study sought to establish whether there is a significant difference in quality of
education between schools with different levels of adequacy of teaching and
learning resources. This was to answer the fourth hypothesis that stated that;
HO4: There is no significant relationship between adequacy of teaching and
learning resources and quality of education in public secondary schools in Kenya.

166
T-Test analysis was done to establish whether schools with different levels of
teaching and learning resources had same quality of education. If quality of
education for schools with different levels of adequacy of teaching and learning
resources was found to be the same, then the study could conclude that there is no
significant relationship between adequacy of teaching and learning resources and
quality of education but if quality of education varied with levels of adequacy of
teaching and learning resources, then the study could conclude that there is a
significant relationship between quality of education and adequacy of teaching and
learning resources. To do this, the study classified the five responses (1-not all, 2-
less extent, 3-moderate extent, 4-larger extent and 5-more adequate) into two (1,2,
3 -inadequate, and 4,5 –adequate) and computed the means of the responses based
on quality of education parameters (KCSE mean score, transition rate, school mean
trophies won in co- curricular activities). The study aimed at computing the means
of the two groups (schools with more adequate teaching and learning resources and
schools with inadequate teaching and learning resources) and establish whether the
means had a significant difference. The results of the means of the two groups is
as shown in Table 4.38.

167
Table 4.38: Adequacy of Teaching and Learning Resources and Quality of
Education
Adequacy of teaching and
learning resources
Mean Std. Deviation Std. Error
Mean
Inadequate 2.5965 0.44510 0.05895
Adequate 2.8117 0.59380 0.04609
From Table 4.38, schools with adequate teaching and learning resources had a
higher mean for education quality (2.8117), than those with inadequate teaching
and learning resources (2.5965). However to ascertain whether the mean
differences are statistically significant, the study conducted Levene’s test of
variance and the results are presented on Table 4.39

168
Table 4.39: Test for Equality of Means- Teaching and Learning Resources and
Quality of Education
From the Table 4.39 F=6.972 at p=0.009 (less than 0.05) implying that variances
of the two groups (adequate and inadequate) school physical facilities is not the
same. From Table 4.18 (T-test), p-value =0.005 which is less than 0.05, implying
that the two means have a statistical mean difference. Therefore, schools with
adequate teaching and learning resources have better quality of education (2.8117)
Levene's
Test for
Equality
of
Variances
t-test for
Equality
of
Means
F Sig. t df Sig. (2-
tailed)
Mean
Difference
Std. Error
Difference
95%
Confidence
Interval of
the
Difference
Lower Upper
Equal
variances
assumed
6.972 0.009 -2.5 221 0.013 -0.22 0.09 -0.38 -0.05
Equal
variances
not
assumed
-2.88 129 0.005 -0.22 0.07 -0.36 -0.07

169
as compared to schools with inadequate teaching and learning resources (2.5965).
Thus, schools that had adequate textbooks, exercise books, laboratory equipment,
desks and chairs, sufficient assessment materials and information and
communication technology aids have better quality of education as opposed to
schools with inadequate teaching and learning resources. The study used KCSE
mean score, transition rate from form one to four and mean trophies won by schools
in co-curricular activities to indicate quality. The findings then imply that schools
with adequate teaching and learning resources had higher KCSE mean score, higher
transition rates from form one to four, and performed well in co-curricular activities
as opposed to schools with inadequate teaching and learning resources.
The study has therefore established that there is a statistical significant difference
between schools that have adequate teaching and learning resources and those with
inadequate teaching and learning resources. Schools with adequate teaching and
learning resources have higher quality of education (2.8117) than those with
inadequate teaching and learning resources. Thus, there is a significant relationship
between adequacy of teaching and learning resources and quality of education in
public secondary schools in Kenya. Asikia (2010) observes that adequate teaching
and learning resources in a classroom set-up determines student academic
achievement. Veerspoor (2008) and World Bank (2014) attributes low student
academic performance to inadequacy of textbooks in both Sub-Sahara and South
Asia schools.

170
4.8.3 Influence of Adequacy of Teaching and Learning Resources on Quality
of Education
After establishing that teaching and learning resources have a significant
relationship with quality of education, the study sought to establish the extent to
which the teaching and learning resources influence quality of education. The study
used simple regression analysis and the result is presented in Table 4.40.’
Table: 4.40: Influence of Adequacy of Teaching and Learning Resources on
Quality of Education
Model Summary
Model
R R Square
Adjusted
R
Square
Std. Error of
the Estimate
1 0.481a 0.232 0.228 .500952
ANOVAa
Model
Sum of
Squares df Mean Square F Sig.
1 Regression 15.673 1 15.673 62.453 <0.001
Residual 51.947 207 0.251
Total 67.620 208
Coefficientsa
Model
Unstandardized
Coefficients
Standardized
Coefficients
t Sig. B
Std.
Error Beta
1 (Constant) 1.355 0.181 7.505 <0.001
Teaching and
Learning
Resources
0.477 0.060 0.481 7.903 <0.001
a. Dependent Variable: Y_Quality of Education
b. Predictors: (Constant), Teaching and Learning Resources

171
The results in Table 4.40 was summarized into a regression equation of the form
Y=a+bX where Y is the dependent variable (quality of education), a- is the constant
of regression, b - the value of the coefficient of the independent variable and X- the
value of the independent variable. The independent variable was teaching and
learning resources. Thus the regression analysis equation became Y = 1.355 +
0.477 x teaching and learning resources. This implied that there is a direct
relationship between teaching and learning resources and quality of education. For
every one-unit increase in teaching and learning resources, quality of education
increased by 0.477 units. Since P<0.001, then the relationship between teaching
and learning resources is significant.
Further, since R2=0.232, it implied that teaching and learning resources predict
quality of education at 23.2 percent. Therefore, there is a significant relationship
between teaching and learning resources and quality of education. Thus, the study
rejected the null hypothesis that there is no significant relationship between
teaching and learning resources and quality of education and concluded that there
is a statistical significant relationship between teaching and learning resources and
quality of education.
The findings concur with that of the World Bank report (2014), whose findings
indicate that the role played by teaching and learning resources like textbooks and
well stocked libraries to ensure quality education cannot be under estimated.

172
Teaching and learning resources diminish the effect of socio-economic factors of
learners and create equal opportunities for learning (Savasci & Tomul, 2013).
Veerspoor (2008) blames low quality of education in Sub Sahara Africa on lack of
adequate teaching and learning resources. Since quality of education comprised of
schools KCSE mean score, transition rate within secondary level and number of
trophies won in co-curricular activities, the study sought to establish the extent to
which adequacy of teaching and learning resources influence each of these
components of quality of education.
4.8.3.1 Influence of Adequacy of Teaching and Learning Resources on KCSE
Mean Score
To determine the extent to which teaching and learning resources influence KCSE
mean score, the study used simple regression analysis to establish whether there is
a significant relationship between teaching and learning resources and KCSE mean
score in public secondary schools in Kenya. The result is presented in Table 4.41.

173
Table 4.41: Influence of Adequacy of Teaching and Learning Resources and
KCSE Mean Score
Model Summary
Model R R Square
Adjusted
R
Square
Std. Error of
the Estimate
1 0.340a 0.115 0.111 1.318570
ANOVAa
Model
Sum of
Squares df
Mean
Square F Sig.
1 Regression 44.043 1 44.043 25.332 <0.001
Residual 337.294 194 1.739
Total 381.336 195
Coefficientsa
Model
Unstandardized
Coefficients
Standardized
Coefficients
t Sig.
B
Std.
Error Beta
1 (Constant) 2.631 0.495 5.313 <0.001
Teaching and
Learning
Resources
0.836 0.166 0.340 5.033 <0.001
a. Dependent Variable: Y_Mean KCSE score
b.Predictors: (Constant), Teaching and learning resources

174
The model in Table 4.41 was summarized into a regression equation of the form
Y=a+bX where Y is the dependent variable (KCSE mean score), a- is the constant
of regression, b - the value of the coefficient of the independent variable and X -the
value of the independent variable (teaching and learning resources). Thus the
regression analysis equation became,
Y = 2.631 + 0.836 x teaching and learning resources. This implied that for every
unit increase in teaching and learning resources, KCSE mean score increased by
0.836 units. Therefore there is a relationship between teaching and learning
resources and KCSE mean score. Since the significance level, p<0.001, the
relationship between teaching and learning resources and KCSE mean score is
significant.
Further, since R2=0.115, teaching and learning resources predict KCSE mean score
at 11.5 percent. The study concluded that there is a statistical significant
relationship between teaching and learning resources and KCSE mean score. The
findings support that of Ercan (2014), Chundang et al (2012) and Figen and Ozlen
(2012) all of whose findings revealed that teaching and learning resources promote
effective learning, motivates learners and leads to higher student academic
achievements.

175
4.8.3.2 Influence of Adequacy of Teaching and Learning Resources on Student
Transition Rate
To determine the extent to which teaching and learning resources influence student
transition rate, the study used simple regression analysis to test whether there exists
a significant relationship between teaching and learning resources and student
transition rate in public secondary schools in Kenya.
The result is presented in Table 4.42
Table 4.42: Influence of Adequacy of Teaching and Learning Resources on
Student Transition Rate
Model Summary
Model R R Square
Adjusted
R
Square
Std. Error of
the Estimate
1 0.577a 0.313888 .213 33.7458
ANOVAa
Model
Sum of
Squares df
Mean
Square F Sig.
1 Regression 1336.518 1 1336.518 11.73 <0.001
Residual 22320.608 196 113.881
Total 23657.126 197
Coefficientsa
Model
Unstandardized
Coefficients
Standardized
Coefficients
t Sig. B
Std.
Error Beta
1 (Constant) 57.853 7.762 7.840 <0.001
Teaching and
Learning
Resources
11.674 3.315 0.077 4.083 0.0023
a. Dependent Variable: Transition rate
b. Predictors: (Constant), Teaching and learning resources
176
The model in Table 4.42 was summarized into a regression equation of the form
Y=a+bX where Y is the dependent variable (transition rate), a- is the constant of
regression, b - the value of the coefficient of the independent variable and X-the
value of the independent variable. The independent variable here was teaching and
learning resources. Thus the regression analysis equation became
Y = 57.853+11.674 x teaching and learning resources. Unit increase in teaching
and learning resources results to an increase of 11.67 units in transition rate.
Further, R2=0.3134, implied that teaching and learning resources predict 31.34
percent of student transition rate in public secondary schools in Kenya. Since
p=0.0023, there is a significant relationship between teaching and learning
resources and student transition rate. The study concluded that there is a statistical
significant relationship between teaching and learning resources and student
transition rate in public secondary schools in Kenya. Thus, the null hypothesis that
there is no significant relationship between teaching and learning resources in
public secondary schools in Kenya was rejected.
The findings concur with World Bank (2009) report that attributes low quality of
education in India to inadequate teaching and learning resources. According to the
World Bank report, grade repetition and dropout are the two key variables affecting
transition within secondary education level in India. Secondary schools in India
have limited access to academically important resources like textbooks, laboratory

177
equipment and information communication technology hence low student
achievement leading to grade repetition or dropping out of school (World Bank,
2009).
4.8.3.3 Influence of Adequacy of Teaching and Learning Resources on Mean
Number of Trophies Won in Co-curricular Activities
To determine the extent to which teaching and learning resources influence mean
number of trophies won in co -curricular activities, the study used simple regression
analysis to test whether there exists a significant relationship between teaching and
learning resources and mean number of trophies won in co-curricular activities in
public secondary schools in Kenya. The result is presented in Table 4.43.

178
Table 4.43: Influence of Adequacy of Teaching and Learning Resources on the
Mean Number of Trophies Won in Co-curricular Activities
Model Summary
Model R R Square
Adjusted
R
Square
Std. Error of
the Estimate
1 0.386a 0.149 0.145 2.518463
ANOVAa
Model
Sum of
Squares df
Mean
Square F Sig.
1 Regression 200.392 1 200.392 31.594 <0.001
Residual 1141.678 180 6.343
Total 1342.070 181
Coefficientsa
Model
Unstandardized
Coefficients
Standardized
Coefficients
t Sig. B
Std.
Error Beta
1 (Constant) 2.532 0.955 2.652 0.009
Teaching and
Learning
Resources
1.799 0.320 0.386 5.621 <0.001
a. Dependent Variable: Mean. trophies
b. Predictors: (Constant), Teaching and learning Resources

179
The model in Table 4.43 was summarized into a regression equation of the form
Y=a+bX where Y is the dependent variable (number of trophies), a- is the constant
of regression equation, b - the value of the coefficient of the independent variable
and X- the value of the independent variable (teaching and learning resources).
Thus the regression analysis equation became,
Y= 2.532+1.799 x teaching and learning resources. This implied that for every one-
unit increase in teaching and learning resources, number of trophies won increased
by 1.799 units. Therefore the more adequate the teaching and learning resources,
the more the number of trophies won in co-curricular activities. Since p<0.001,
then the relationship between schools teaching and learning resources and the
number of trophies won in co-curricular activities was very strong and therefore
highly significant.
Further, since R2=0.149, it also implied that teaching and learning resources
predicted the school’s number of mean trophies at 14.9 percent. Therefore the study
had established that there is a statistical significant relationship between teaching
and learning resources and number of trophies won in co-curricular activities.
Kapelinya and Lumumba (2017) attributed limited student participation in co-
curricular activities to inadequate facilities and equipment. The number of trophies
won by students partly depend on the variety of activities a school participates in.
180
The more the number of co-curricular activities a school engages in, the more the
students will be involved according to individual talent and interest, hence the more
the trophies won.
4.9 Joint Influence of Administrative Factors on Quality of Education
After establishing the relationship between adequacy of school financial resources,
adequacy of school physical facilities, teacher motivation levels, and adequacy of
teaching and learning resources on quality of education, the study sought to
establish how these variables relate to quality of education when considered jointly.
The results are presented in Table 4.44.

181
Table 4.44: Joint Influence of Administrative Factors on Quality of Education
Model Summary
Model R
R
Square
Adjusted R
Square
Std. Error of
the Estimate
1 0.533a 0.284 0.270 0.488318
ANOVA a
Model
Sum of
Squares Df
Mean
Square F Sig.
1 Regression 19.214 4 4.803 20.144 <0.001
Residual 48.406 203 0.238
Total 67.620 207
Coefficients a
Model
Unstandardized
Coefficients
Standardized
Coefficients
t Sig. B Std. Error Beta
1 (Constant) 0.857 0.245 3.505 <0.001
School
Financial
Resources
0.176 0.066 0.178 2.087 0.035
School
Physical
facilities
0.218 0.069 0.197 3.163 0.002
Teacher
Motivation
0.182 0.086 0.183 2.179 0.024
Teaching and
Learning
Resources
0.517 0.087 0.520 5.946 <0.001
a. Dependent Variable: Y_Quality of education
b. Predictors: (Constant), Teaching and learning resources, School financial
resources, School physical facilities, Teacher motivation
Table 4.44 shows the combined influence of adequacy of school physical facilities,
teacher motivation levels, adequacy of school financial resources and teaching and
learning resources on quality of education. From the results, quality of education
has a strong positive relationship with adequacy of school physical facilities,

182
teacher motivation levels, adequacy of school financial resources and adequacy of
teaching and learning resources (R=0.533). Since R2 = 0.284, it meant that the
independent variables (school physical facilities, teacher motivation, school
financial resources and learning and teaching resources) explained 28.4 percent of
quality of education in Kenya. The remaining 71.6 percent are to be explained by
variables not considered in this model. The calculated p-values (0.035, 0.002,
0.024, and 0.001) are less than 0.05, implying that there is a statistical significant
relationship between quality of education and school physical facilities, teacher
motivation, school financial resources and teaching and learning resources. These
were represented in the equation,
Quality of education = 0.857+0.176 school financial resources+0.218 school
physical facilities + 0.182 teacher motivation + 0.517teaching and learning
resources.
From the equation, one unit increase in school financial resources leads to an
increase of 0.176 units in quality of education, while a unit increase in school
physical facilities yields 0.218 positive change in quality of education. In addition,
a one unit increase in teacher motivation leads to 0.182 positive change in quality
of education while a one unit increase in teaching and learning resources yields
0.517 positive change in quality of education. Thus, quality of education=0.857
units when the four variables are kept constant, and varies otherwise with variation
of the variables. Thus, adequacy of teaching and learning resources was found to

183
influence quality of education most, followed by adequacy of school physical
facilities, teacher motivation levels, and adequacy of school financial resources.
Since quality was conceived to be a composite of school KCSE mean score, student
transition rate and mean number of trophies won in co-curricular activities, the
study sought to establish the joint influence of the predictor variables (school
physical facilities, teacher motivation, school financial resources and teaching and
learning resources) on each of the quality indicators.
4.10 Joint Influence of Administrative Factors on KCSE Mean Score
The study sought to establish the joint influence of adequacy of school physical
facilities, teacher motivation levels, adequacy of school financial resources, and
adequacy of teaching and learning resources on KCSE mean score. The results are
presented in Table 4.45.
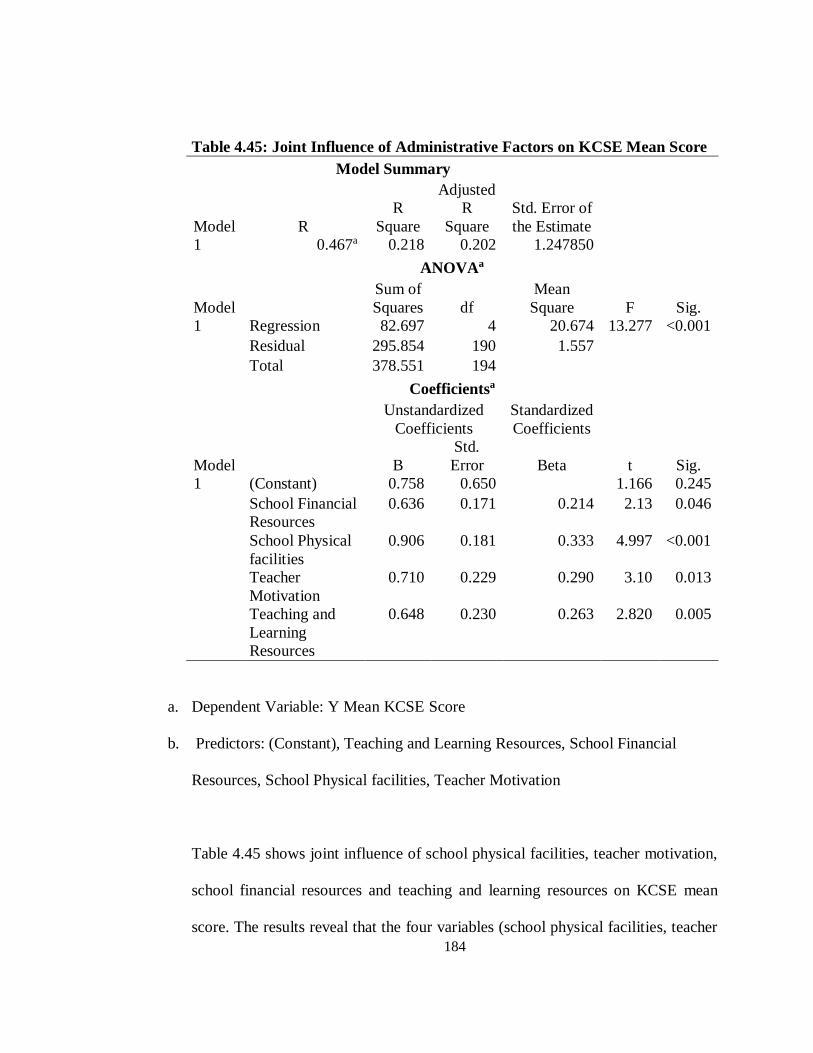
184
Table 4.45: Joint Influence of Administrative Factors on KCSE Mean Score
Model Summary
Model R
R
Square
Adjusted
R
Square
Std. Error of
the Estimate
1 0.467a 0.218 0.202 1.247850
ANOVAa
Model
Sum of
Squares df
Mean
Square F Sig.
1 Regression 82.697 4 20.674 13.277 <0.001
Residual 295.854 190 1.557
Total 378.551 194
Coefficientsa
Model
Unstandardized
Coefficients
Standardized
Coefficients
t Sig. B
Std.
Error Beta
1 (Constant) 0.758 0.650 1.166 0.245
School Financial
Resources
0.636 0.171 0.214 2.13 0.046
School Physical
facilities
0.906 0.181 0.333 4.997 <0.001
Teacher
Motivation
0.710 0.229 0.290 3.10 0.013
Teaching and
Learning
Resources
0.648 0.230 0.263 2.820 0.005
a. Dependent Variable: Y Mean KCSE Score
b. Predictors: (Constant), Teaching and Learning Resources, School Financial
Resources, School Physical facilities, Teacher Motivation
Table 4.45 shows joint influence of school physical facilities, teacher motivation,
school financial resources and teaching and learning resources on KCSE mean
score. The results reveal that the four variables (school physical facilities, teacher

185
motivation levels, school financial resources and teaching and learning resources
have a positive relationship (R=0.467) on KCSE mean score. From the findings,
the joint influence of the four variables (school physical facilities, teacher
motivation levels, school financial resources and learning and teaching resources
explains 21.8 percent KCSE mean score (R=0.218).This means that the other 78.2
percent is explained by factors not accounted for in this model. Since F(4,190)=
13.277 , p value <0.001,which is less than 0.05,the model was found to be
statistically significant at 95 percent confidence level and appropriate to measure
the hypothesis.
From the results, the four variables (adequacy of school physical facilities, teacher
motivation levels, adequacy of school financial resources and adequacy of teaching
and learning resources) have a positive influence on KCSE mean score (school
financial resources = 0.636, school physical facilities = 0.906, teacher motivation
levels = 0.71 and teaching and learning resources = 0.648). The four variables are
statistically significant (p values = 0.046, 0.001, 0.013, and 0.005 respectively)
since the p values are less than 0.05. Hence the equation becomes-
KCSE mean score = 0.758+0.636 x school financial resources + 0.906 x school
physical facilities +0.710 x teacher motivation + 0.648 x teaching and learning
resources.

186
From the equation, a unit change in school financial resources yields 0.636 positive
change in KCSE mean score. A unit change in school physical facilities leads to an
increase of 0.906 units in KCSE mean score while a unit increase in teacher
motivation yields 0.71 positive change in KCSE mean score. The results also
revealed that a unit change in teaching and learning resources yields 0.648 positive
change in KCSE mean score.
The findings have established that there is a statistical significant relationship
between KCSE mean score and the variables (school physical facilities, teacher
motivation, school financial resources and teaching and learning resources) when
combined together. The results in Table 4.45 established that school physical
facilities influenced school KCSE mean score most, followed by teacher motivation
levels, then teaching and learning resources and lastly, school financial resources.
4.11 Joint Influence of Administrative Factors on Student Transition Rate
The study sought to establish the joint influence of adequacy of school physical
facilities, teacher motivation levels, adequacy of school financial resources, and
adequacy of teaching and learning resources on student transition rate .The results
are presented in Table 4.46.

187
Table 4.46: Joint Influence of Administrative Factors on Student Transition
Rate
Model Summary
Model R R Square
Adjusted R
Square
Std. Error of
the Estimate
1 0.304a 0.093 0.074 32.5721
ANOVAa
Model
Sum of
Squares Df
Mean
Square F Sig.
1 Regression 20796.654 4 5199.163 4.901 0.001
Residual 203700.897 192 1060.942
Total 224497.551 196
Coefficientsa
Model
Unstandardized
Coefficients
Standardized
Coefficients
t Sig. B Std. Error Beta
1 (Constant) 52.190 16.920 3.085 0.002
School
Financial
Resources
10.262 4.464 0.165 2.299 0.023
School
Physical
facilities
10.640 4.716 0.162 2.256 0.025
Teacher
Motivation
11.710 5.956 0.194 1.966 0.049
Teaching and
Learning
Resources
15.619 6.018 0.257 2.595 0.010
a. Dependent Variable: Transition rate
b. Predictors: (Constant), Teaching and learning resources, School financial
resources, School physical facilities, Teacher motivation
Table 4.46 shows regression analysis of adequacy of school physical facilities,
teacher motivation levels, adequacy of school financial resources and adequacy of

188
teaching and learning resources on students’ transition rates from form one to form
four in public secondary schools in Kenya. The results reveal that the four variables
(school physical facilities, teacher motivation, school financial resources and
teaching and learning resources have a positive relationship (R=0.304) on transition
rate. The joint influence of the four variables (school physical facilities, teacher
motivation, school financial resources and learning and teaching resources explains
9.3 percent of student transition rates (R2=0.093). Since F(4,192)= 4.901 , p value
<0.001,which is less than 0.05, the model was found to be statistically significant
at 95 percent confidence level and appropriate to measure the hypothesized
scenario.
The variables (adequacy of school physical facilities, teacher motivation levels,
adequacy of school financial resources and adequacy of teaching and learning
resources) have a statistical significant relationship with student transition rate
since their p-values are less than 0.05 (school physical facilities = 0.025, teacher
motivation = 0.490, school financial resources = 0.023 and teaching and learning
resources = 0.010). These can be represented in the equation,
transition rate = 52.19+10.262 x school financial resources + 10.64 x school
physical facilities + 11.71 x teacher motivation + 15.619 x teaching and learning
resources.
From the equation, one unit increase in school financial resources leads to an
increase of 10.262 units in student transition rate, while a unit increase in school
189
physical facilities yields 10.64 positive change in student transition rate. In
addition, a one unit increase in teacher motivation leads to 11.71 positive change in
student transition rate while a unit increase in teaching and learning resources yields
15.619 positive change in student transition rate. Thus, transition rate=52.19 when
the four variables are kept constant, and varies otherwise with variation of the
variables. From the findings, adequacy of teaching and learning resources was
found to influence student transition rate from form one to form four more than any
of the variables in consideration. School financial resources had the least influence
on student transition rate from form one to form four when jointly considered with
school physical facilities, teaching and learning resources and teacher motivation
levels.
4.12 Joint Influence of Administrative Factors on Mean Number of Trophies
Won in Co-curricular Activities
The study sought to establish the joint influence of adequacy of school physical
facilities, teacher motivation levels, adequacy of school financial resources, and
adequacy of teaching and learning resources on mean number of trophies won in
co-curricular activities.
The results are presented in Table 4.47.

190
Table 4.47: Joint Influence of Administrative Factors on Mean Number of
Trophies Won in Co-curricular Activities
Model Summary
Model R R Square
Adjusted
R Square
Std. Error of
the Estimate
1 0.509a 0.259 0.242 2.376192
ANOVA
Model
Sum of
Squares df Mean Square F Sig.
1 Regression 347.453 4 86.863 15.384 <0.001
Residual 993.747 176 5.646
Total 1341.200 180
Coefficientsa
Model
Unstandardized
Coefficients
Standardized
Coefficients
t Sig. B
Std.
Error Beta
1 (Constant) 5.093 1.289 3.950 <0.001
School Financial
Resources
1.067 0.334 0.217 2.224 0.037
School Physical
facilities
1.596 0.364 0.295 4.379 <0.001
Teacher
Motivation
1.050 0.463 0.215 2.267 0.025
Teaching and
Learning
Resources
2.308 0.441 0.494 5.227 <0.001
a. Dependent Variable: Mean Trophies
b. Predictors: (Constant), Teaching and Learning Resources, School Financial
Resources, School Physical facilities, Teacher Motivation
Table 4.47 shows the results of multiple regression analysis done to establish the
joint influence of adequacy of school physical facilities, teacher motivation levels,
adequacy of school financial resources, and adequacy of teaching and learning

191
resources on the mean number of trophies won by a school in co- curricular
activities. From the results, combined influence of school physical facilities,
teacher motivation, school financial resources, and teaching and learning resources
had a strong positive relationship (R=0.509) on the mean number of trophies won
by a school in co-curricular activities. From the findings, the joint influence of the
four variables (school physical facilities, teacher motivation, school financial
resources, and teaching and learning resources) accounts for 25.9 percent of the
mean number of trophies won by schools in co-curricular activities (R2=0.259).
Since F (4,176) = 15.384 and p-value of the model is p<0.001, the model was found
to be statistically significant at 95 percent confidence level. School financial
resources, school physical facilities, teacher motivation, and teaching and learning
resources had a positive influence (Bs= 1.067, 1.596, 1.050 and 2.308 respectively)
on the mean number of trophies won by schools in co- curricular activities. The
four variables were also found to have a statistical significant relationship (p
values=0.037, 0.000, 0.025, and 0.001 respectively) with the mean number of
trophies won by schools in co- curricular activities. Hence the equation, mean
number of trophies = 5.093+1.067 x school financial resources + 1.596 x school
physical facilities + 1.050 x teacher motivation+2.308 x teaching and learning
resources.

192
From this equation, one unit increase in school financial resources leads to an
increase of 1.067 units in mean number of trophies, while a unit increase in school
physical facilities yields 1.596 positive change in mean number of trophies. In
addition, a one unit increase in teacher motivation leads to 1.05 positive change in
mean number of trophies while a unit increase of teaching and learning resources
yields 2.308 positive change in mean number of trophies won in co-curricular
activities. Thus, mean number of trophies won in co-curricular activities were found
to be influenced most by adequacy of teaching and learning resources followed by
school physical resources, school financial resources and teacher motivation levels
respectively.

193
CHAPTER FIVE
SUMMARY, CONCLUSION AND RECOMMENDATIONS
5.1 Introduction
This chapter presents the summary of the study, the conclusion and the
recommendations based on the findings of the study.
5.2 Summary of the Study
The purpose of this study was to investigate the administrative factors influencing
quality of education in public secondary schools in Kitui, Kisii and Nairobi
Counties, Kenya. The study was guided by the following objectives:
i. To determine the extent to which adequacy of school physical facilities influence
quality of education in public secondary schools in Kitui, Kisii and Nairobi
Counties.
ii. To establish the extent to which teacher motivation influence quality of education
in public secondary schools in Kitui, Kisii, and Nairobi Counties.
iii. To establish the extent to which school financial resources influence quality of
education in public secondary schools in Kitui, Kisii and Nairobi Counties.
iv. To determine the extent to which teaching and learning resources influence quality
of education in public secondary schools in Kitui, Kisii and Nairobi Counties.
The study used the correlational research design. The study was basically
quantitative in nature although qualitative data was collected through the principals

194
and teachers questionnaire. The questionnaire was the main instrument used in data
collection supplemented by the observation guide. Data was analyzed using
correlations, T-Test and regression analysis while qualitative data was organized
into themes as per study objectives and analyzed. Descriptive statistics like
frequencies and percentages were also used to analyze data. Presentation of data
was done using tables and the discussion of the findings linked the data to literature
review.
5.3 Summary of the Major Findings
The findings of this study were anchored on hypotheses.
5.3.1 Findings Based on Hypothesis HO1
HO1: There is no significant relationship between school physical facilities and
quality of education in public secondary schools in Kitui, Kisii and Nairobi
Counties.
The findings showed that there is a significant relationship school physical facilities
and quality of education in public secondary schools in Kenya. A T-test analysis to
establish whether quality of education for different schools with diverse level of
availability of physical facilities was the same, revealed that schools with adequate
physical facilities had a higher mean education quality ( 2.85) as compared to
schools with inadequate physical facilities (2.64).The two means were found to be

195
statistically different at p=0.008. Furthermore, regression analysis results on HO1
were as follows.
Influence of School Physical Facilities on Quality of Education in Public
Secondary Schools in Kitui, Kisii and Nairobi Counties.
The results were summarized into a simple regression equation
Y = 1.89 + 0.341*physical facilities………………………………5.1
Where Y = quality of education, and R2 = 0.094 at p< 0.001.
From equation 5.1, adequacy of school physical facilities has a significant
relationship with quality of education. The physical facilities predict quality of
education at 9.4 percent in public secondary schools in Kenya. This was supported
by the following findings that linked physical facilities to components of quality of
education (KCSE mean score, student transition rate, mean number of trophies won
in co-curricular activities).
Influence of School Physical Facilities on KCSE Mean Score.
The results were summarized into the regression equation
Y = 2.448 + 1.030* physical facilities…………………………5.2
Where Y = KCSE mean score, and R2 = 0.145 at p< 0.001.
From equation 5.2, adequacy of school physical facilities has a significant
relationship with KCSE mean score. The physical facilities predict quality of
education at 14.5 percent in public secondary schools in Kenya.
Influence of School Physical Facilities on Transition Rate
196
The results were summarized a simple regression equation
Y = 60.095 +10.164 * physical facilities………………………5.3
Where Y = student transition rate from form 1 to 4, and R2 = 0.025 at p = 0.022.
From equation 5.3, adequacy of school physical facilities has a significant
relationship with student transition rate from form 1 to 4. The physical facilities
predict transition rate at 2.5 percent in public secondary schools in Kenya.
Influence of School Physical Facilities on Number of Trophies Won in Co-
curricular Activities
The results were summarized into a simple regression equation
Y = 2.035 +1.819 * physical facilities………………………5.4
Where Y = Number of trophies won in co-curricular activities, and R2 = 0.117 at
p< 0.001.
The results show that there is a significant relationship between school physical
facilities and number of trophies won in co-curricular activities. Regression
analysis revealed that school physical facilities predict the mean number of trophies
won in co-curricular activities at 11.7 percent.
From the descriptive results of the study, majority of the schools had inadequate
physical facilities. About 80 percent of the respondents indicated that their schools
had inadequate classrooms. Nine out of every ten respondents confirmed that their
schools had inadequate science laboratories. On training workshops, only two

197
percent of the respondents indicated that their schools had enough workshops. The
study established that 95 percent of the schools had insufficient dormitories. About
80 percent of the respondents indicated that their schools had inadequate libraries
while 83 percent of the respondents confirmed that their schools had inadequate
playgrounds for student use in co-curricular activities.
The findings were further supported by the researchers’ observation which revealed
that most of the schools had inadequate classrooms (68%), inadequate laboratories
(84%), inadequate libraries (92%), toilets and lavatories (80%), and inadequate
play grounds (79%).
5.3.2 Findings Based on Hypothesis HO2
HO2: There is no significant relationship between teacher motivation and quality of
education in public secondary schools in Kitui. Kisii and Nairobi Counties.
By bivariate correlation, teacher motivation and quality of education had
correlation coefficient (r) =0.294 at P<0.001. Implying that there is a significant
relationship between teacher motivation levels and quality of education in public
secondary schools in Kenya. By T-test analysis, the study established that there is
a statistical significant difference in quality of education between schools that had
highly motivated teachers and those with low teacher motivation. Schools with
highly motivated teachers had a higher mean of quality of education (2.8188) than
those with low teacher motivation (2.6559) at p=0.024. Thus, there is a significant

198
relationship between teacher motivation levels and quality of education in public
secondary schools in Kenya. Regression analysis results were as follows:
Influence of Teacher Motivation on Quality of Education
The results were summarized into a simple regression equation
Y = 1.958 +0.289 * teacher motivation………………………5.5
Where Y = quality of education, and R2 = 0.087 at p< 0.001.
From equation 5.5, teacher motivation levels have a significant relationship with
quality of education. Teacher motivation levels predict quality of education at 8.7
percent. Since quality of education was composed of KCSE mean score, student
transition rate from form one to four (2013-2016) cohort, and mean number of
trophies won in co-curricular activities, the following findings also supported the
results of equation 5.5.
Influence of Teacher Motivation on School KCSE Mean Score
The results were summarized into a simple regression equation
Y = 3.380 +0.621 * teacher motivation………………………5.6
Where Y = KCSE mean score, and R2 = 0.065 at p< 0.001.
Equation 5.6 indicate that there is a significant relationship between teacher
motivation levels and school KCSE mean score. The regression analysis revealed

199
that teacher motivation levels predict school KCSE mean score at 6.5 percent in
public secondary schools in Kenya.
Influence of Teacher Motivation on Student Transition Rate
The results were summarized into a simple regression equation
Y = 77.976 +0.632 * teacher motivation………………………5.7
Where Y = student transition rate from form 1 to 4, and R2 = 0.189 at p = 0.021.
From equation 5.7, teacher motivation levels has a significant relationship with
student transition rate. Teacher motivation levels predict student transition rate
(from form 1- 4) at 18.9 percent in public secondary schools in Kenya.
Influence of Teacher Motivation on Number of Trophies Won in Co-
curricular Activities
The results were summarized into a simple regression equation
Y = 0.512 +0.814 * teacher motivation………………………5.8
Where Y = Number of trophies won in co-curricular activities, and R2 = 0.028 at
p< 0.024.
Therefore, there is a significant relationship between teacher motivation levels and
number of trophies won in co-curricular activities. The regression analysis equation
revealed that teacher motivation predicted school mean trophies won in co-
curricular activities at 2.8 percent.
200
From descriptive statistics, most of the respondents (76%) indicated that schools do
not recognize the role played by teachers as crucial. Majority of the respondents
(81%) alluded that schools inadequately reward high performing teachers. It was
also confirmed that majority of the schools (83%) hardly sponsor teachers to INSET
seminars for professional training. In addition, 85 percent of the respondents
indicated that their schools hardly sponsored team building events for teachers.
About 82 percent of the respondents indicated that their schools hardly sponsor
social welfare for teachers. Most of the respondents (79%) perceived the level of
teacher motivation in their schools as unsatisfactory while about half of the
respondents indicated that their schools do not motivate teachers at all.
5.3.3 Findings Based on Hypothesis HO3
HO3: There is no significant relationship between school financial resources and
quality of education in public secondary schools in Kitui, Kisii and Nairobi
Counties.
By bivariate correlation, adequacy of school financial resources and quality of
education had a Pearson Correlation Coefficient, (r)=0.152 at 0.023 significance
level. T-test analysis indicated that Schools with adequate school financial
resources had higher quality of education (3.03) than those with inadequate
financial resources (2.65) at p=0.001.The findings from regression analysis are
summarized as follows.

201
Influence of School Financial Resources on Quality of Education
The results were summarized into the regression equation
Y = 2.428 +0.162 * school financial resources……………………5.9
Where Y = quality of education, and R2 = 0.023 at p= 0.023.
From equation 5.9, adequacy of school financial resources predicted quality of
education at 2.3 percent .This was supported by the following findings on the
components of quality of education (KCSE mean score, student transition rate from
form 1-4 and mean number of trophies won in co-curricular activities).
Influence School Financial Resources on KCSE Mean Score
The results were summarized into the regression equation
Y = 2.04 + 1.82* school financial resources…………………5.10
Where Y = KCSE mean score, and R2 = 0.111 at p< 0.001.
Results on equation 5.10 indicate that there is a significant relationship between
school financial resources and school KCSE mean score. The regression equation
revealed that school financial resources predict school KCSE mean score at 11.1
percent in public secondary schools in Kenya.
Influence of School Financial Resources on Student Transition Rate
The results were summarized into the regression equation

202
Y = 61.24 +12.128 * school financial resources…………………5.11
Where Y = student transition rate from form 1 to 4, and R2 = 0.039 at p = 0.004.
From equation 5.11, adequacy of school financial resources had a significant
relationship with student transition rate. The regression analysis revealed that
school financial resources predict student transition rate at 3.9 percent in public
secondary schools in Kenya.
Influence of School Financial Resources on Mean Number of Trophies Won in
Co-curricular Activities
The results were summarized into the regression equation
Y =62.216 +13.233 * school financial resources…………………5.12
Where Y = Number of trophies won in co-curricular activities, and R2 = 0.2314 at
p= 0.003.
Therefore, the results show that there is a significant relationship between adequacy
of school financial resources and mean number of trophies won in co-curricular
activities. The regression analysis equation revealed that school financial resources
predict mean number of trophies won in co-curricular activities at 23.14 percent.
From descriptive statistics, all principals reported to have received government
grants to support secondary education. This is the free tuition capitation that the
203
government of Kenya sends to all registered public secondary schools based on the
number of registered students. An overwhelming majority (92%) of respondents
confirmed that parents supported the schools financially through school fees and
school infrastructure development. However about four of every ten respondents
sampled indicated that their schools had no income generating activity. Further,
majority of the respondents (91%) indicated that their schools had not received any
financial support from school alumni. From the findings of the study, majority
(88.6%) of the respondents did not perceive the government capitation to schools
as adequate. Over 90 percent of the respondents indicated that their schools had not
ventured into any income generating activity and the schools had received
inadequate financial support from the alumni, and school sponsors. It was held by
majority (95.2%) of the respondents who took part in the study that the financial
support of the parents was insufficient in provision of quality education.
5.3.4 Findings Based on Hypothesis HO4
HO4: There is no significant relationship between adequacy of teaching and learning
resources and quality of education in public secondary schools in Kitui,Kisii and
Nairobi Counties.
By bivariate correlation, adequacy of teaching and learning resources and quality
of education had a Pearson Correlation Coefficient, (r)= 0.481 at p= 0.001
significance level. T-test analysis indicated that Schools with adequate teaching and

204
learning resources had higher mean for quality of education (2.812) than those with
inadequate financial resources (2.597) at p=0.005.The findings from regression
analysis are summarized as follows.
Influence of Teaching and Learning Resources on Quality of Education
The results were summarized into the regression equation
Y = 1.355 +0.477 * teaching and learning resources……………5.13
Where Y = quality of education, and R2 = 0.232 at p< 0.001
Results on equation 5.13 indicate that there is a significant relationship between
adequacy of teaching and learning resources and quality of education. From the
equation, teaching and learning resources predict quality of education at 23.2
percent .This was supported by the following findings on the components of quality
of education (KCSE mean score, student transition rate from form 1-4 and mean
number of trophies won in co-curricular activities).
Influence of Teaching and Learning Resources on KCSE Mean Score
The results were summarized into the regression equation
Y = 2.631 + 0.836* teaching and learning resources…………5.14
Where Y = KCSE mean score, and R2 = 0.115 at p< 0.001.

205
Results on equation 5.14 indicate that there is a significant relationship between
adequacy of teaching and learning resources and KCSE mean score. The analysis
equation revealed that adequacy of teaching and learning resources predict school
KCSE mean score at 11.5 percent in public secondary schools in Kenya.
Influence of Teaching and Learning Resources on Student Transition Rate
The results were summarized into the regression equation
Y = 57.853 +11.674 * teaching and learning resources…………5.15
Where Y = student transition rate from form 1 to 4, and R2 = 0.3139 at p = 0.0023.
The results on equation 5.15 indicate that there is a significant relationship between
adequacy of teaching and learning resources and student transition rates. From the
equation, teaching and learning resources predict student transition rate at 31.34
percent in public secondary schools in Kenya.
Influence of Teaching and Learning Resources on Number of Trophies Won
in Co-curricular Activities
The results were summarized into the regression equation
Y = 2.532 +1.799 * teaching and learning resources………………5.16
Where Y = Number of trophies won in co-curricular activities, and R2 = 0.149 at
p< 0.001.
Therefore, the results show that there is a significant relationship between adequacy
of teaching and learning resources and mean number of trophies won in co-

206
curricular activities. The regression analysis equation revealed that teaching and
learning resources predict school mean number of trophies won in co-curricular
activities at 14.9 percent.
From the descriptive analysis of the study, most of the respondents (79%) indicated
that the number of textbooks in their schools were inadequate. Many of the
respondents (75%) also indicated that the schools had insufficient assessment
materials in provision of quality of education. About 80 percent of the respondents
confirmed to have had inadequate laboratory equipment in their schools while 88
percent of the respondents indicated that ICT teaching and learning aids were
inadequate.
5.3.5 Contribution of Administrative Factors on Parameters of Quality of
Education
The study sought to know the extent to which administrative factors influenced
quality of education when considered jointly. This was accomplished through
multiple regression analysis and results summarized as follows.
Joint Influence of Administrative Factors on Quality of Education
The results were summarized into a regression equation

207
Quality of education = 0.857 + 0.176 school financial resources + 0.218 school
physical facilities + 0.182 teacher motivation + 0.517 teaching and learning
resources…………….5.17
R2=0.24, calculated p-values (0.035, 0.002, 0.024, and 0.001) respectively.
From the regression equation, the coefficient for the multiple determination R2
=0.24, implying that the independent variables (school physical facilities, teacher
motivation, school financial resources and learning and teaching resources) explain
24 percent of quality of education in Kenya. The remaining 76 percent are
explained by variables not considered in this model. The calculated p-values (0.035,
0.002, 0.024, and 0.001) are less than 0.05, implying that the independent variables
were statistically significant.
From equation 5.17, adequacy of teaching and learning resources was found to
influence quality of education most, followed by adequacy of school physical
facilities, teacher motivation levels, and adequacy of school financial resources.
Joint Influence of Administrative Factors on KCSE Mean Score
The results were summarized into a regression equation
KCSE mean score=0.758 + 0.636 school financial resources + 0.906school
physical facilities + 0.710 teacher motivation + 0.648 teaching and learning
resources……………………………….5.18
R2=0.218, p value <0.001

208
Calculated p values = (0.046, 0.001, 0.013, and 0.005) respectively.
From equation 5.18, R2=0.218 implying that the joint influence of the four
variables (school physical facilities, teacher motivation levels, school financial
resources and learning and teaching resources explain 21.8 percent KCSE mean
score. This means that the other 78.2 percent is explained by factors not accounted
for in this model. From the regression equation 5.18, school physical facilities had
the highest in put (0.906) in KCSE mean score followed by teacher motivation
levels at 0.710, teaching and learning resources at 0.648 and school financial
resources at 0.636.
Joint Influence of Administrative Factors on Transition Rate
The results were summarized into the regression equation
Transition rate = 52.19 + 10.262*school financial resources + 10.64*school
physical facilities+11.71*teacher motivation + 15.619* teaching and learning
resources……………….5.19
R2 = 0.093, calculated p values = 0.023, 0.025, 0.049 and 0.01 respectively.
From equation 5.19, R2=0.093 implying that the joint influence of the four variables
(school physical facilities, teacher motivation levels, school financial resources and
learning and teaching resources explain 9.3 percent of student transition rate. This
means that the other 90.7 percent is explained by factors not accounted for in this
model. From the regression equation 5.19, teaching and learning resources had the
highest in put (15.619) in influencing student transition rate, followed by teacher
209
motivation levels at 11.71, school physical facilities at 10.64 and school financial
resources at 10.262.
Joint Influence of Administrative Factors on Mean Number of Trophies Won
in Co-curricular Activities
The results were summarized into a regression equation,
Mean number of trophies = 5.093+1.067*school financial resources +
1.596*school physical facilities + 1.050*teacher motivation + 2.308* teaching and
learning resources………………5.20
R2=0.259, and calculated p values= 0.037, 0.000, 0.025 and 0.000 respectively).
R2=0.259 implying that the joint influence of the four variables (school physical
facilities, teacher motivation levels, school financial resources and learning and
teaching resources explain 25.9 percent mean number of trophies won in co-
curricular activities. This means that the other 74.1 percent is explained by factors
not accounted for in this model. From the regression equation 5.20, teaching and
learning resources had the highest in put (2.308) in influencing the number of
trophies won in co-curricular activities, followed by physical facilities at 1.596,
school financial resources at 1.067 and teacher motivation at 1.050.
5.4 Conclusions of the Study
Based on findings from the study, the following conclusions were made:
The study established that there is a significant relationship between school
physical facilities and quality of education in public secondary schools in Kenya.

210
School physical facilities had a positive correlation to quality of education and
schools with more adequate physical facilities were found to have better quality of
education than schools with inadequate facilities.
The study found out that there is a significant relationship between teacher
motivation levels and quality of education in public secondary schools in Kenya.
Teacher motivation was found to be positively correlated to quality of education.
Schools that motivated teachers to a great extent recorded higher KCSE mean
scores than those that minimally motivated their teachers.
The study established that there is a significant relationship between adequacy of
school financial resources and quality of education. Adequacy of school financial
resources was found to be positively correlated to quality of education. Schools
with more adequate financial resources were found to have better quality of
education as compared to schools with inadequate financial resources
The study established that there is a significant relationship between teaching and
learning resources and quality of education in public secondary schools in Kenya.
Teaching and learning resources were found to have a positive correlation to quality
of education. Schools with more adequate teaching and learning resources were
found to have better quality of education than schools with inadequate resources.

211
On the joint influence of adequacy of school physical facilities, teacher motivation
levels, adequacy of school financial resources and adequacy of teaching and
learning resources on quality of education, the study established that adequacy of
teaching and learning resources had the highest contribution to quality of education,
followed by adequacy of school physical facilities and teacher motivation.
Adequacy of school financial resources was found to have the least contribution to
quality of education.
On the contribution of adequacy of school physical facilities, teacher motivation
levels, adequacy of school financial resources and adequacy of teaching and
learning resources on KCSE mean score, the study established that school physical
facilities had the highest input in KCSE mean score followed by teacher motivation
levels and teaching and learning resources. School financial resources was found
to have the least contribution to quality of education.
On the joint influence of adequacy of school physical facilities, teacher motivation
levels, adequacy of school financial resources, and adequacy of teaching and
learning resources on student transition rate, the study found teaching and learning
resources to have had the highest input in influencing student transition rate,
followed by teacher motivation levels, physical facilities, and school financial
resources in that order. The study concluded that adequacy of school physical
facilities, teacher motivation levels, adequacy of school financial resources, and

212
adequacy of teaching and learning resources had a significant relationship to
student transition rate, thereby contributing significantly to provision of quality
education.
On the joint influence of adequacy of school physical facilities, teacher motivation
levels, adequacy of school financial resources and adequacy of teaching and
learning resources on co-curricular activities, the study established that teaching
and learning resources had the highest input in influencing the number of trophies
won in co-curricular activities, followed by school physical facilities and school
financial resources. Teacher motivation levels had the least contribution to the
number of trophies won in co-curricular activities.
5.5 Recommendations of the Study
In light of the findings, the study recommends that:
i. The Teachers Service Commission and the Ministry of Education should come up
with teacher incentive policy based on teacher performance and student
achievement. Teacher incentives should be linked to student performance not only
in academics but also co-curricular activities, student discipline, leadership skills,
and soft skills like being honest and courteous. The policy should be cascaded to
schools with clear guidelines on how the school administration should reward
teachers.

213
ii. In terms of practice, the school principal and Parents Association should strategize
on how to actively engage parents and the community for purposes of acquiring
adequate school physical facilities and teaching and learning resources. The school
administration should engage the parents and community through seminars, and
general meetings to raise their awareness of the role played by school physical
facilities such as libraries, laboratories and toilets in provision of quality of
education. This will make them contribute willingly towards school development
projects.
iii. Other than government capitation and National Constituency Development Fund
bursaries, the government should come up with scholarship policy for bright needy
students. This will cover school fees, uniform and a stipend for all the four years of
secondary education. The scholarships should target poor students who do well in
grade eight with a focus on retaining them in school throughout the secondary
school level. Those admitted to private secondary schools should not be
discriminated either.
iv. The school principals and school management should diversify sources of school
financial resources. They should engage in income generating activities, reach out
to the school alumni and sponsors and encourage them to support school
development projects. The school principal, in consultation with management
should write grant proposals to the Ministry of Education and other donors in search

214
of funds to support school infrastructure development like Workshops and ICT
laboratory and equipment. The more the sources of school finances, the less the
burden of household contribution to secondary education leading to enhanced
access, participation and student achievement.
5.6 Suggestions for Further Research
The following areas were suggested as possible areas for further research
i. A study should be done to investigate the administrative factors influencing quality
of education in public primary schools in Kenya.
ii. A study should be done to investigate the challenges facing provision of quality
education in public secondary schools in Kenya.
iii. A study should be done to investigate administrative factors influencing quality of
education in private secondary schools in Kenya.
iv. A comparative study on the perceptions of parents, teachers and students on the
quality of education in public secondary schools in Kenya should be done.
v. A study should be done on administrative factors affecting quality of education in
public universities in Kenya.

215
REFERENCES
Allison, T.M.H. (2012).The impact of classroom performance system-based
instruction with peer instruction upon student achievement and motivation
in eighth grade math students (Doctoral dissertation, Liberty University).
Retrieved from www.opendoor.org.
Amos, O., & Koda, G.M. (2018). Contribution of school based income generating
activities in quality education provision in secondary schools managed by
thee Catholic Diocese of Moshi, Tanzania. British Journal of Education
6(4) 49-69.
Anyango, R.O & Orodho, J.A (2016). Coping with resource management
challenges in Mumias Sub- County, Kakamega County. Kenya. Journal of
Education and Practice 7(11).
Asikhia, O. A. (2010). Students and teachers perception on the cause of poor
academic performance in Ogun state secondary schools in Nigeria.
Implications for counseling for national development. European Journal
of Social Sciences,13(2).
Babbie, E. (2010). The practice of social science. Australia: Wadsworth, Cengage
Learning.
.
Baker, B.O. (2012). Does money matter in education? Washington D.C: The Albert
Shanker Institute.
Basil, E. B. (2013). An analytical study of motivation upon teachers in public
secondary schools of Nyamagana District in Mwanza City (Masters
dissertation, St Augustine University of Tanzania). Retrieved from
www.opendoor. org
Bennell, P., & Akyeampong, K. (2007). Teacher motivation in Sub-Saharan Africa
and South Asia. Essex: Department for International Development.
Bertalanffy, L.V. (1968). General systems theory. Foundations, development,
applications. New York: Braziller.
Best, J. W., & Kahn, J. (2006). Research in Education (10th ed.). New Delhi:
Darling Kindersley (India) Private Ltd.
Borg, W.R., & Gall, M.D. (1989). Educational research: An introduction. New
York: Longman.

216
British Columbia Teachers Federation (BCTF). (2012). Education Facts.
Retrieved from
http://www.bctf.caluploadedfiles/public/publications/2012/edfacts.pdf
Buckland, P., & Thurlow, M. (1996). An audit of EMD needs and resources in
South Africa. Pretoria: Department of Education.
Bush, T., & Heystek, J. (2006). School leadership and management in South Africa.
Principals’ perceptions. International Studies in Educational
Administration, 34.
Bhunia, G.S., Shit, P.K., and Duary, S. (2012). Assessment of School infrastructure
at primary and upper primary level: A geospatial analysis. New Delhi:
International initiative for impact evaluation.
Chundang, U., Singha, P, W., Adisak, T., & Puchong, P. (2012). Investigating
learning achievements of Thai high school students in a sequence and series
lesson delivered in a CAI based materials. US-China Education Review,
A3,(291-301).
Curveys, K. (2011). Well-being at school: Does infrastructure matter? CELE
exchange, centre for effective learning environments, Paris: OECD
publishing. Retrieved from http://dx-doi.org/10.1787/5kg01kzc81/vc-en.
Ercan, O. (2014). The effects of multimedia learning materials on students’
academic achievements and attitudes towards science courses. Journal of
Baltic Science Education, 13(5).
Elmuti, D. (2004).Can management be taught? If so, what should management
education curriculum include and how should the process be approached?
Journal of management decision, 42(3/4).
Figen, O., & Ozlen, O. (2012). The effects of animated agents on students’
achievements and attitudes. Turkish Online Journal of Distance Education,
13(12).
Fillardo, M., & Jeffrey, M. (2017). Adequate and equitable U.S PK-12
infrastructure: Priority actions for systemic reform. Washington D.C: 21st
century school fund, centre for cities schools and centre for green schools.

217
Glennerster, R., Kremer, M., Mbithi, I., & Takavarasha, A. (2011). Access and
quality in the Kenyan education system: A review of the progress,
challenges and potential solutions. Office of the prime minister. Nairobi:
Kenya
Guantai, L., Kariuki, M., & Nzomo, J. (2001). The SACMEQ I report. The quality
of primary education in Kenya: Some policy suggestions based on a survey
of schools. Paris: UNESCO
Hanushek, E. (2011).The economic value of higher teacher quality. Economics of
education review, 30, 466-479.
Humphrey, D. C., Gallagher, H. A., Yee, K. M., Goss, G. K. & Campbell, A. Z.
(2012). Teacher incentive fund. First implementation report, 2006 and
2007 grantees. Washington D.C: US department of education, Office of
planning, evaluation and policy development.
Imonje, R.M.K. (2011). Factors influencing teacher performance on
implementation of free Education in city council primary schools in
Nairobi province, Kenya (Doctoral PhD thesis). University of Nairobi,
Kenya.
Jackline, H. (2009). Teachers, identities and space (online). South Africa: available
url:http//.www.oerafrica.org
Javier, F.M., & Marcella, R. (2011). School infrastructure and resources do matter:
Analysis of the incidence of school resources on the performance of Latin
America students. School Effectiveness and School Improvement, 22(1),
29-50. doi 10.1080/092453.2010.5435338.
Jenkinson, K.A., & Benson, A. C. (2010). Barriers to providing physical education
and physical activity in Victorian state Secondary schools. Australian
journal of teacher education 35(8). Retrieved from
http://dx.doi.org/10.14221/ajte.2010v35n8.1
Johnson, J. (2004). Making bricks without straw. An analysis of achievement
patterns and fiscal inequity and inadequacy in Nebraska school systems.
Arlington: The Rural School and Community Trust.
Kamau, A.W., Rintangu, E.G., Muniu, R.K., & Amusa L.O. (2015). The effect of
participation in competitive sport on schools connectedness of secondary
school students. African Journal for Physical Health Education and Dance
(AJPHERD), 21(3:1), 876-889.

218
Kapelinyang, R.P. and Lumumba, P. K. (2017). Determinants of academic
performance in public secondary schools in Kapenguria Division-Kenya:
Assessing the effect of participation in selected co-curricular activities.
African Journal of Education Science and Technology, (4)2.
Kart, R.L. (1995). Skills in effective administration. U.S.A: Havard Business
Review.
Kenya Education Management Institute (KEMI). (2014). Diploma in education
Management: Guidance and Counselling, Module 8. Nairobi: KEMI.
Kenya Institute of Public Policy and analysis (KIPPRA). (2009). Kenya economic
report: Building a globally competitive economy. Nairobi: Kenya Institute
for Public Policy and Research Analysis.
Kenya Institute of Public Policy, Research and Analysis (KIPPRA) (2013). Kenya
economic report. Creating an enabling environment for stimulating
investment for competitive and sustainable Counties. Nairobi: Kenya
Institute for Public Policy Research and Analysis.
Kenya National Bureau of Statistics (KNBS). (2015). Spatial dimensions of well-
being in Kenya: where are the poor? From counties to wards. Nairobi:
Kenya National Bureau of Statistics.
Kenya National Examination Council. (2016). The Kenya certificate of secondary
examination: Press Release of the 2015 KCSE Examination Results.
Nairobi: Ministry of Education Science and Technology.
Kenya National Examinations Council. (2010). The national assessment system for
monitoring learner achievement: monitoring of learner achievement for
class 3. Nairobi: Ministry of Education Science and Technology.
Kerlinger, F.N., & Lee, H.B. (2000). Foundations of behavioural research (4th ed.).
California State University: Northridge.
Khewu, P.D.N. (2012). A study of practices in the alternatives to corporal
punishment strategy being implemented in selected primary schools in
buffalo city metro municipality: Implications for school leadership
(Doctoral Dissertation). University of Fort Hare, South Africa.
Kothari, C.R. (2011). Research methodology, Methods and Techniques (2nd ed.).
New Age International Publishers: New Delhi.
219
Kothari, C.R., & Garg, G. (2014). Research methodology, Methods and Techniques
(3rd ed.). New Age International Publishers: New Delhi.
Krejcie, R. V., & Morgan, D. W. (1970). Determining sample size for research
activities. Educational and psychological measurement. Retrieved from
http://www.kenpro.org/sample-size-determination-using-krejcie-
andmorgan-table/
Kuuskorpi, M., Kaarima, F., & Gonzalez, N.C. (2011). The Future of the Physical
learning Environment. School Facilities that Support the User. OECD
Publishing. www.Oecd.org/publishing/corrigenda.
Lauwerier, T. & Akkari, A. (2015). Teachers and quality of education in Sub-
Saharan Africa. Paris: UNESCO educational research and foresight, ERF
working papers series.
Leidnar, M., & Myslinki, D. J. (2014). Report card on American education:
Ranking State KYZ performance, progress and reform. Arlington:
American Legislative Exchange Council.
Lewin, K. M. (2008). Strategies for sustainable financing of secondary education
in Sub-Saharan Africa. Washington D.C: The World Bank.
Lucas, A., & Mbiti, I. (2011). “Elite secondary schools and Student achievement:
Regression discontinuity. Evidence from Kenya”. SMU working paper.
Lwakasana, E., & Getange, k. (2017). Effects of income generating activities in
public secondary schools in Transmara Sub-County, Narok County,
Kenya. International Journal of Novel Research in Interdisciplinary
studies 4(6) 1-8.www.noveltyjournals.com
Mascitti-Miller, E. (2013). Resource allocation practices in urban elementary
schools Education (Doctoral paper.19). Retrieved from http//fisher pub sjf.
ed/education –etal.
Massoni, E. (2011). Positive effects of extra-curricular activities on students.
ESSAI, 9, (27). http://dc.cod.edu/essai/vol9/iss1/27
Miles, B.M & Huberman, A.M. (1994). An expanded sourcebook qualitative data
analysis. (2nd ed.). Sage Publications: New Delhi.
Miles, K. H., & Frank, S. (2008). The strategic school: Making the most of people,
time and money. Thousand Oaks, CA: Corwin Press.

220
Ministry of Education. (2007). Gender Policy in Education. Nairobi: Government
printer.
Ministry of Education. (2008). Interim guidelines for the implementation of free
secondary education. Circular MoE/G1/9/1/44.
Ministry of Education. (2017).Guidelines for the implementation of free day
secondary education. Circular MoE.HQS/3/13/3.
Ministry of Education. (2012). Operational guidelines for disbursement of
bursaries and grants to schools and colleges. Nairobi: Ministry of
Education.
Ministry of education Science and Technology. (2005). Sessional paper No.1 of
2005 on a policy framework for education, training and research. Nairobi:
Government Printer.
Ministry of Education Science and Technology. (2015a). National education sector
plan, Volume one: Basic education programme rationale and approach
2013-2018. Nairobi: Government printer.
Ministry of Education Science and Technology. (2015b). National education sector
plan, Volume two: Operational plan 2013 – 2018. Nairobi: Government
Printer.
Ministry of Education, Science and Technology. (2002). National action plan on
education for all 2003-2015: From commitment to action. Expanding
opportunities for quality education to all Kenyans. Nairobi: Government
printer.
Ministry of Education, Science and Technology. (2014). Report of the task force
on secondary school fees. Towards free and compulsory quality basic
education in Kenya. Nairobi: Ministry of Education Science and
Technology.
Ministry of National Education. (2005). PISA 2003 Project National Final Report.
Ankara: Ministry of Education of Turkey.
Moleni, C., & Ndalama, L. (2004). Teacher absenteeism and attrition in Malawian
primary schools. A case study of four district draft report. Zomba: Centre
for Educational Research and Training and Malawi Institute of Education.

221
Mugenda, A.G. (2011). Social Science Research. Theory and principles. Nairobi:
Applied Research & Training Services Press.
Mugenda, O., & Mugenda, A. G. (2003). Research Methods: Qualitative and
quantitative approaches. Nairobi: Acts Press.
Mulkeen, A., Chapman D.W., Dejaeghere, J.G, & Leu, E. (2007). Recruiting,
retaining, and retraining secondary school teachers and principals in Sub-
Saharan Africa. Washington D.C: The World Bank.
Muninde, M.P. (2016). Gender stereotypes in teachers running of co-curricular
activities at Rhodes Park and Silver Spring schools (Master’s Dissertation).
University of Zambia, Zambia.
Mwaka, M. & Njogu, K. (2014). The effect of expanding access of day secondary
schools: Evidence from Kenya. International Journal of Education and
Research, 2(1) 2014.
Mwaura, N., Mbugua, Z.K., & Kagema, J. (2017). Assessment of secondary school
teachers participation in co-curricular activities in Kirinyaga County
central Sub-county, Kenya. International Journal of Humanities and Social
Sciences, 7(4).
Najjumba, I.M., & Marshall, J. (2013). Improving learning in Uganda Vol 11:
Problematic curricular areas and teacher effectiveness: Insights from
national assessments. Washington D.C: The World Bank.
National Centre for Education Statistics. (2011). Overview and key findings across
grade levels. Office of Educational Research and Improvement. U.S
Department of Education. http://Nces.Ed.Gov/Pubs99/19999081/
Nyamwega, H.N (2016). An evaluation of income generating activities projects in
public secondary schools in Nairobi Nairobi County. International Journal
of African Studies 21, ISSN 2409- 6938’
Nyangaresi, D.K., Onderi, H., & Mwebi, B. (2016). Influence of school based
income generating activities on student retention rate in secondary
education in Kenya. Journal of Educational Policy and Enterpreneurial
Research 3(11) 45-61
Obiero, C., Nzomo, J., & Onsomu E. (2005). The SACMEQ II project in Kenya: A
study of the conditions of schooling and the quality of education. Kenya
working paper. Harare: UNESCO.

222
Odhiambo, F & Shinali M.C. (2015). Towards access to secondary education in
Kenya. A focus on in-school factors that hinder transition from primary
schools. International Journal of Education and Research, 3(12).
Odundo, P. A. (1990). School personnel management (A Nigerian perspective).
Nigeria: University of Lagos.
Odundo P.A., and Rambo C.M (2013). Effect of school based income generating
activities on the financial performance of public secondary schools in
Kenya. Chinnese Business Review 12(6) 375-394.
OECD. (2011). Lessons from PISA for United States, strong performers and
successful reformers in education. OECD Publishing.
http://dx.doi.org/10.1787197/89264096660-en
OECD. (2012). Programme for international student assessment (PISA) results.
OECD Publishing. www.oecd.org/pisa
OECD. (2010). PISA 2009 Results: What students know and can do: Student
performance in reading, mathematics and science,1. OECD Publishing.
http://dx.doi.org/10.1787/9789264091450-en
Ogalo, P. L., Simatwa, E. M. W., & Okwach, T. O. (2013). Socio-economic
challenges faced by Principals in the Provision of quality Secondary School
education in Kenya. A case of Nyando and Muhoroni Districts.
Educational Research,4(5), 2013.
Okumbe, J. (2001). Human Resource Management an Educational Perspective.
Nairobi: Educational Development and Research Bureau.
Okumu, R., Maithya P., & Ronoh, A. (2017).The influence of students participation
in Drama on KCSE performance in public secondary schools in Nakuru
County, Kenya. Scholars Journal of Arts, Humanities and Social Sciences
5(1), 25-31.
Olembo, J.O., Wanga, P.E. & Karagu, N.M. (1992). Management in education.
Nairobi: Educational Research and Publications (ERAP).
Omae, N.S. (2018). An investigation of selected predictors on quality education in
public secondary schools (Unpublished PhD thesis). Jaramogi Oginga
Odinga University of Science and Technology, Kenya.
223
Omae, N. S., Onderi, H., & Mwebi, B. (2017). Quality implications of learning
infrastructure on performance in secondary education: A small scale study
of a county in Kenya. European Journal of Education Studies, 3(4).
Omukoba, H.O., Simatwa, E.M.W & Ayodo T.M.O. (2011). Contribution of
income generating activities to financing secondary education in Kenya. A
case study of Eldoret Municipality. Educational Research 2(2) 884-897.
Onderi, H., & Makori, A. (2013). Secondary school principals’ challenges in
Nyamira County in Kenya: Issues and challenges. Education Research
International, 1(1), 2013.
Onsomu, E.N., Muthaka, D.L., Ngware, M.W., & Manda, D.K. (2006).
Determinants and strategies for expanding secondary education in Kenya.
Nairobi: Kenya Institute of Public Policy and Research Analysis.
Orodho, J.A. (2009). Elements of education and social science: Research Methods.
(2nd Ed). Maseno: Kanezja.
Orodho, J. A. (2005). Elements of education and social sciences; Research
methods: Parents news online 5(5).
Orodho, J. A. (2014). The equity and quality implications of Free Day Secondary
Education (FDSE) policy in Kenya: what is the unfinished business in the
financial management? International Journal of Current Research 6(3),
(2014).
Owino, O.L., Osman, A., & Yunguyungu, A. (2014). An investigation of factors
that influence performance in KCSE Biology in selected secondary schools
in Nyakach District, Kisumu County, Kenya. American Research Institute
for Policy Development, 3(2).
Parsons. (2011). Comprehensive facility assessment report. De Kalb County school
system. America: Parsons Commercial Technology Group.
Rarieya, J.F.A. (2007). School leadership in Kenya. The lived realities of women
heads of schools (unpublished PhD Dissertation). Keele University.
Republic of Kenya. (1999). Totally integrated quality education and training for
unity, equity and development. Nairobi: Government Printer.
Republic of Kenya. (2000). National policy on gender and development. Nairobi:
Government Printer.

224
Republic of Kenya. (2007). Kenya vision 2030. Nairobi: Government Printer.
Republic of Kenya. (2010). The Constitution of Kenya. Nairobi: Government
Printer.
Republic of Kenya. (2011). Ministry of gender, children and Gender policy. .
Nairobi: Government Printer.
Republic of Kenya. (2012a). A policy framework for education: Aligning education
and training to the constitution of Kenya (2010) and Kenya vision 2030
and beyond. Nairobi: Government printer.
Republic of Kenya. (2012b). Teachers service commission act No.20 of 2012.
Nairobi: Government printer
Republic of Kenya. (2013). The basic education act No.14 of 2013.Nairobi:
Government Printer.
Republic of Kenya. (2015). Economic survey. Nairobi: Kenya National Bureau of
Statistics.
Republic of Kenya. (2017a). Economic survey. Nairobi: Kenya National Bureau of
statistics.
Republic of Kenya. (2017b). Basic Education Curriculum Framework. Nairobi:
Government printer.
Republic of Kenya. (2018). Economic survey. Nairobi: Kenya National Bureau of
statistics.
Rogers, F. H., & Vegas, E. (2009). No more cutting class? Reducing teacher
absence and providing incentives for performance. World Bank Policy
Research Working Paper No. 4847.
http://www.ds.worldbank.org/servlett/WD.scontentserver/WDsp/IB/2009/
02/26/000158349
200990226/142341/renderedPDF/WPS4847.pdf
Saeed, M., & Wain, K. R. (2011). Status of missing physical facilities in
government schools of Punjab. Journal of Research and Reflections in
Education, 5(2), 105 – 127.

225
Samkange, W., & Muranda, A.Z. (2013). Interrogating the teaching and learning
modes in open and distance learning (ODL) Within the context of quality
education. Turkish Online Journal of Distance Education, 14(1), 18, 2013.
Sang, A.K.A., Koros, P.K.A., & Bosire J.N. (2013). An analysis on dropout levels
of public secondary schools in Kericho District in relation to selected
school characteristics. International Education Studies, 6(7).
Savasci, H. S., & Tomul, E. (2013). The relationship between educational resources
of schools and Academic achievement. International Education Studies,6
(4), Canadian Centre of Science and Education.
Save the Children. (2011). Teacher motivation: Theoretical framework, situation
analysis of save the children country offices, and recommended strategies.
Washington D.C: UNESCO.
Sclafani, S., & Lim, E. (2008). Rethinking human capital in education. Singapore
as a model for teacher development. Washington D.C: The Aspen Institute.
Shahidul, S.M., & Karim A.H.M. (2015). Factors contributing to school drop -out
among the girls: A review of literature. European Journal of Research and
Reflection in Educational Sciences, 3(2).
Shari, K., Howard, W., & Ellan, C. (2013). Quality for children? What works in
education in developing countries. New Delhi: International initiative for
impact evaluation.
Shavisa, T., Ndiku, J.M., & Musasia, M.A. (2016). Role of student characteristics
in dropout cases among secondary school students in Vihiga County,
Kenya. International Journal of Education and Research, 4(2).
Shekytan, T.M. (2015). Quality education for social development and human well-
being. India: University of Kerala in Vision 2030. Contributions of
educational researchers on national development. Proceedings of the UGC
Sponsored two day seminar 6th to 7th August 2015. Pala, Kerala: St Thomas
College of Teacher Education, India.
Singapore Ministry of education. (2010). Building blocks for education: Whole
system reform: Building a national education system for the 21st century.
The Singapore experience. Toronto: Singapore Ministry of Education.
Sujewa, H. (2010). Teacher motivation in Sri Lanka public schools (unpublished
thesis), Michigan University Paper 316. http://commons.emich.edu/thesis

226
Teachers Service Commission. (2008). Guidelines for selection panels of
secondary school teachers. Unpublished Circular Ref Number TSC/ADM
192A/Vol.V11/104.
UNESCO. (2005). Challenges facing free primary education in Kenya. Nairobi:
UNESCO.
UNESCO. (2011). World data on education. Toronto, Singapore: UNESCO:
Publication.
UNESCO. (2014).Towards indicators for post-2015 education frame work: Post
2015 education indicators. Technical advisory group of the EFA Steering
Committee. Canada: UNESCO.
UNESCO. (2015a). EFA Global Monitoring Report. Education for all 2000-2015:
Achievements and challenges. Paris: UNESCO Publishing.
UNESCO. (2015b). Education 2030: Towards inclusive and equitable quality
education and lifelong learning for all. Declaration of World Education
Forum in Incheon. Korea: UNESCO Publishing.
UNESCO. (2015c). International charter of physical education and sport.
Washington DC: UNESCO publishing.
UNICEF. (2000). Defining quality in education. A paper presented by UNICEF at
the meeting of the International Working Group on education. Florence,
Italy: UNICEF.
Veerspoor, A., & Joshi, R.D. (2013). Secondary education in Ethiopia: Supporting
growth and transformation. Washington D.C: The World Bank.
Veerspoor, M. A. (2008). At the crossroads: Choices for secondary education in
Sub-Saharan Africa. Washington D.C: The World Bank.
Wasanga, P.M., Ogle M.A., & Wambua, M.N. (2012). The SACMEQ III project in
Kenya: A study of the conditions of schooling and the quality of education.
Nairobi: Kenya National Examinations Council.
Wiesmann, U., Kiteme, B., & Mwangi, Z. (2014). Social economic atlas of Kenya;
Depicting the national population census by County and Sublocation.
Nanyuki: Kenya National Bureau of Statistics.

227
World Bank. (2005). Expanding opportunities and building competencies for
young people: A new agenda for secondary education. Washington D.C:
The World Bank.
World Bank. (2007). The link between health, social issues and secondary
education in Sub-Saharan Africa. Washington D.C: The World Bank.
World Bank. (2008a). Transitions in secondary education in Sub-Saharan Africa:
Equity and efficiency issues. Washington D.C: The World Bank.
World Bank. (2008b). Governance, management and accountability in secondary
education in Sub-Sahara Africa. Washington D.C: The World Bank.
World Bank. (2008c). The challenges of expanding secondary education and
training in Madagascar. Washington D.C: The World Bank.
World Bank. (2009). Secondary education in India. Universalizing opportunity:
Human development unit, South Asia region. Washington D.C: The World
Bank.
World Bank. (2011a). Educational outcomes, school governance and parents’
demand for accountability. Evidence from Albania. Washington D.C: The
World Bank.
World Bank. (2011b). Quality of education in Madrasah: Main study. Washington
D.C: The World Bank.
World Bank. (2012). Enhancing the quality of education in Maldives. Washington
D.C: The World Bank.
World Bank. (2014a). Student learning In South Asia, challenges, opportunities
and policy priority. Washington D.C: The World Bank.
World Bank. (2014b). How much and what kind of teaching is there in elementary
education in India. Evidence from three states. Washington D.C: The
World Bank.

228
APPENDICES
APPENDIX A
LETTER OF INTRODUCTION TO THE RESPONDENTS
University of Nairobi
Department of Education Administration and Planning
P.O. Box 21108-00100
NAIROBI.
Dear respondent,
RE: RESEARCH STUDY
I am a postgraduate student at the University of Nairobi pursuing a Doctorate
Degree in Education. The topic of my research is: Administrative Factors
Influencing Quality of Education in Public Secondary Schools in Kenya. I
kindly request you to sincerely provide the most relevant information in each item
on the instrument of data collection given to you. Your identity will strictly be kept
confidential. Kindly do not indicate your name or the name of the institution
Looking forward to a positive response.
Yours faithfully,
Asiago Dorcah.

229
APPENDIX B
PRINCIPAL’S QUESTIONNAIRE
This questionnaire is designed to collect data from public secondary schools in
Kenya within selected counties. You are kindly requested to complete the
questionnaire by ticking (√ ) against your option and offering explanations in words
in the blank spaces. For confidentiality purposes, you need not write your name on
the questionnaires. Your cooperation and assistance will be highly appreciated.
Part I: School Profile
1. Which year was the school established__________________
2. (a).Which category is your school in
i. National [ ]
ii. Extra County [ ]
iii. County [ ]
iv. Sub county [ ]
( b) Please indicate school type
i. Boys boarding [ ]
ii. Girls’ boarding [ ]
iii. Mixed boarding [ ]
iv. Boys day [ ]
v. Girls day [ ]
vi. Mixed day and boarding [ ]
v. Mixed day [ ]

230
3(a) Please indicate the number of students in your school__________
(b) Please indicate the number of streams……………………..
(c) Please indicate the number of teachers in your school……………
4. (a) Please indicate your gender. Male [ ] Female [ ]
(b)Please indicate your highest academic qualification
i. Doctorate
ii. Masters
iii. Degree
iv. Diploma
v. Any other……………
5. For how long have you been heading this school (in years)
a) Less than a year [ ]
b) 1-5 [ ]
c) 6-10 [ ]
d) 11-15 [ ]
e) Over 15 [ ]
PART II: School Financial Resources
6. One aspect of this study is school financial resources. Several statements related
to various financial resources have been stated. Answer by ticking ‘Yes’ or ‘No’ to
each of the following questions.

231
School Financial Resources Yes No
i. Does your school receive government grants?
ii. Does the school generate funds from income generating
activities?
iii. Does the school receive budgetary support from alumni
contribution?
iv. Do parents contribute to the school’s financial resources?
v. Does the school receive\ financial sponsor support?
vi. Does the school receive donations from other well wishes?
7. If your answer is ‘Yes’ in any of the questions in ‘7’ above, to what extent have the
statements applied to your school?
Key:
1-Not at all; 2-Less extent; 3- Moderate extent; 4- Large extent; 5-Very large
extent
School Financial Resources 1 2 3 4 5
i. The school has received adequate government
grants
ii. The school has generated sufficient funds from
various income generating activities
iii. The school has received adequate budgetary
support from alumni contribution
iv. Parents contributions have been sufficient
v. The school has received a lot of financial
sponsor support
vi. The school has received donations from other
well wishes
8. Please state any other comments concerning adequacy of financial resources in
your school__________________________________
Section II: Physical Facilities
9. Another aspect of this study is the physical facilities that exist in school. Please
indicate the extent to which the statements apply to your school using the key
provided.
Key:
1-Not at all; 2-Less adequate; 3- Moderate adequate; 4- more adequate;
5-Very adequate
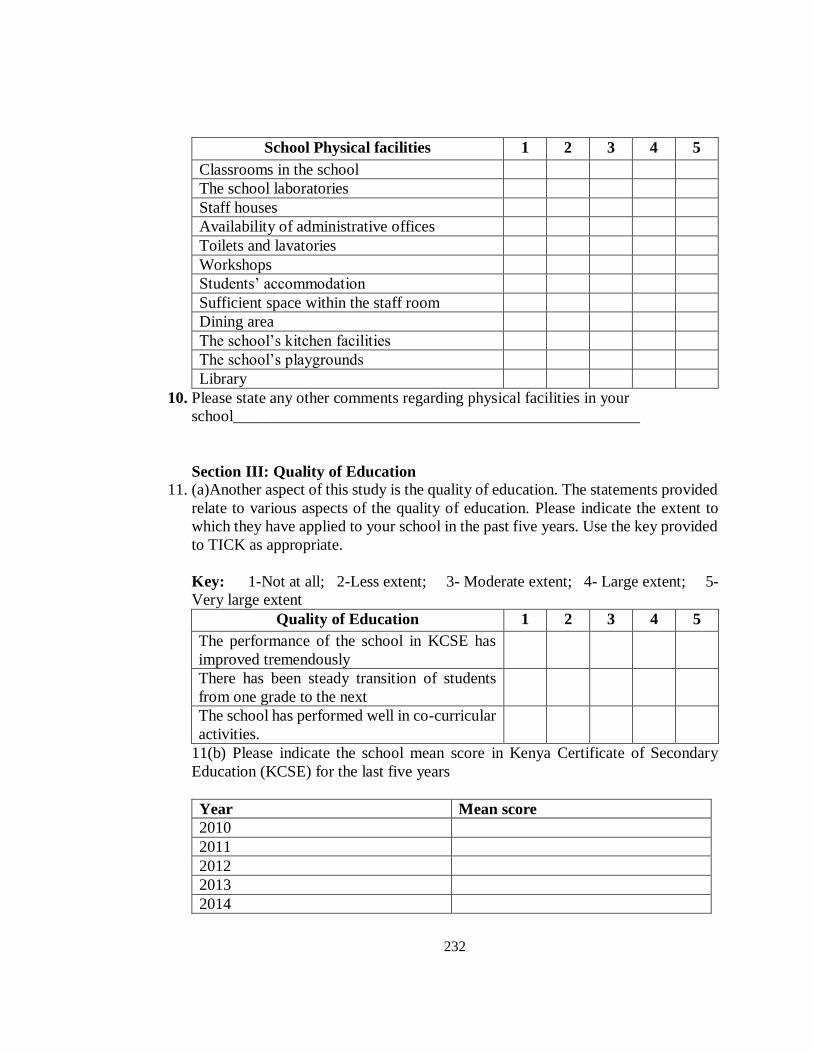
232
School Physical facilities 1 2 3 4 5
Classrooms in the school
The school laboratories
Staff houses
Availability of administrative offices
Toilets and lavatories
Workshops
Students’ accommodation
Sufficient space within the staff room
Dining area
The school’s kitchen facilities
The school’s playgrounds
Library
10. Please state any other comments regarding physical facilities in your
school___________________________________________________
Section III: Quality of Education 11. (a)Another aspect of this study is the quality of education. The statements provided
relate to various aspects of the quality of education. Please indicate the extent to
which they have applied to your school in the past five years. Use the key provided
to TICK as appropriate.
Key: 1-Not at all; 2-Less extent; 3- Moderate extent; 4- Large extent; 5-
Very large extent
Quality of Education 1 2 3 4 5
i. The performance of the school in KCSE has
improved tremendously
ii. There has been steady transition of students
from one grade to the next
iii. The school has performed well in co-curricular
activities.
11(b) Please indicate the school mean score in Kenya Certificate of Secondary
Education (KCSE) for the last five years
Year Mean score
2010
2011
2012
2013
2014

233
11(c) Please indicate the number of students who were admitted in the school in
2013 and have successfully transited from form 1 to form 4 (exclude those who
joined in form2,3,4)
Cohort (2013-2016) No. of Students
Form 1(2013)
Form 2(2014)
Form 3(2015)
Form 4(2016)
11 (d) Please indicate the number of trophies won by the school in co- curricular
activities in the last five years.
Year 2011 2012 2013 2014 2015
No. of
trophies
12. Please state any other comments on the quality of education in your
school………………………………………………………………………………
………………………………………………………………
Thank you for your time and cooperation.

234
APPENDIX C
TEACHER’S QUESTIONNAIRE
This questionnaire is designed to collect data from public secondary schools in
Kenya within selected counties. You are kindly requested to complete the
questionnaire by ticking (√ ) against your option and offering explanations in words
in the blank spaces. For confidentiality purposes, you need not write your name on
the questionnaires. Your cooperation and assistance will be highly appreciated.
Part I: School Profile
1. (a)Which category is your school in
(i) National [ ]
(ii) Extra County [ ]
(iii) County [ ]
(iv) Sub county [ ]
(b)Please indicate school type
i. Boys boarding [ ]
ii. Girls boarding [ ]
iii. Mixed boarding [ ]
iv. Boys day [ ]
v. Girls day [ ]
vi. Mixed day and boarding [ ]
v. Mixed day [ ]
2. What position do you hold in the school _________________
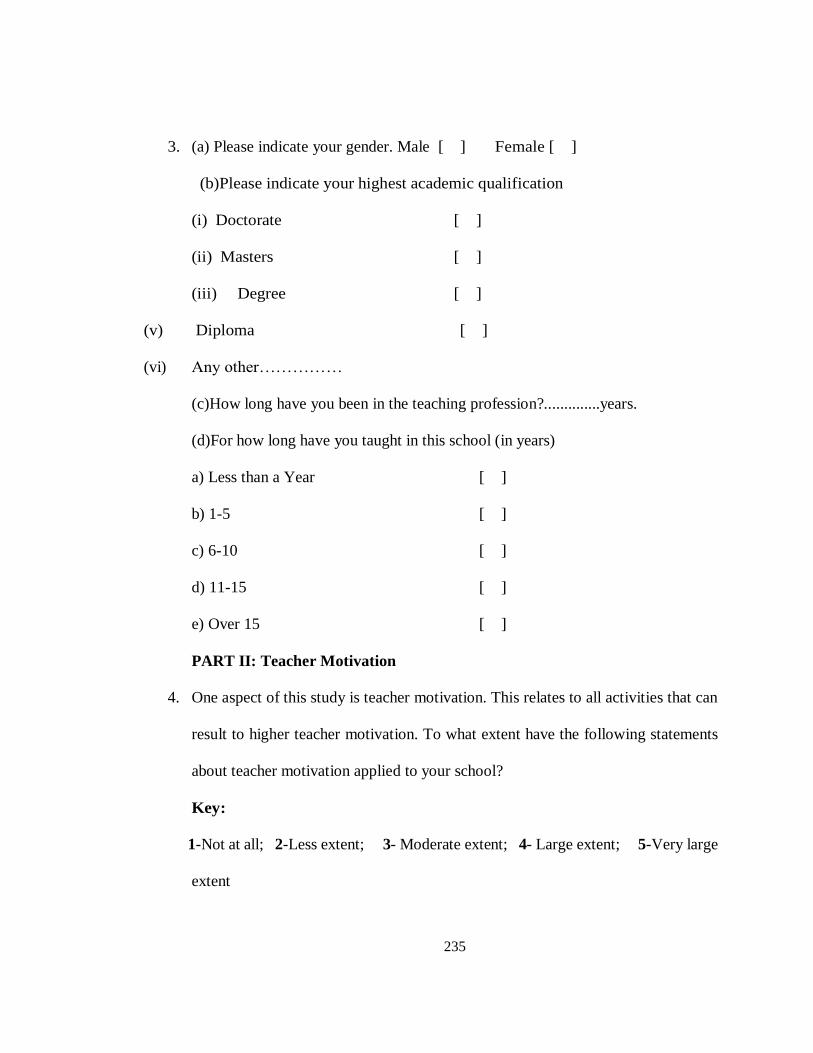
235
3. (a) Please indicate your gender. Male [ ] Female [ ]
(b)Please indicate your highest academic qualification
(i) Doctorate [ ]
(ii) Masters [ ]
(iii) Degree [ ]
(v) Diploma [ ]
(vi) Any other……………
(c)How long have you been in the teaching profession?..............years.
(d)For how long have you taught in this school (in years)
a) Less than a Year [ ]
b) 1-5 [ ]
c) 6-10 [ ]
d) 11-15 [ ]
e) Over 15 [ ]
PART II: Teacher Motivation
4. One aspect of this study is teacher motivation. This relates to all activities that can
result to higher teacher motivation. To what extent have the following statements
about teacher motivation applied to your school?
Key:
1-Not at all; 2-Less extent; 3- Moderate extent; 4- Large extent; 5-Very large
extent

236
Teacher Motivation 1 2 3 4 5
The school recognizes the role teachers play as
crucial
The teachers in the school are held with high
status
The school has awarded high performing
teachers
The school sponsors teachers for INSET
seminars
The school has sponsored teachers to team
building trips
The school has supported teachers social
welfare initiatives
5. Please state any other comments concerning teacher motivation in your
school__________________________________
Section II: Teaching and Learning Resources
6. Another aspect of this study is teaching and learning resources. The statements
provided relate to various aspects of this aspect. Please indicate the extent to which
they have applied to your school in the past five years. Use the key provided to
TICK as appropriate.
Key: 1-Not at all; 2-Less extent; 3- Moderate extent; 4- Large extent; 5-
Very large extent
Teaching and Learning Resources 1 2 3 4 5
The school has had adequate textbooks
There have been adequate exercise books
The school has provided sufficient assessment
materials
The school has had adequate laboratory
equipment and chemicals to undertake
experiments
The desks and chairs in the school match all the
learners needs
There is adequate Information, communication
and technological teaching aids in the school

237
7. Please state any other comments concerning the teaching and learning
resources in your school___________________________
Thank you for your time and cooperation

238
APPENDIX D
OBSERVATION GUIDE
FACILITY 1 2 3 4 5
Science Laboratories
Classrooms
Staff houses
Administrative offices
Toilets and lavatories
Dining hall/s
Workshops
Dormitories
Kitchen
Staffrooms
Library
School playground
KEY: 1-Not at all
2-Less extent
3-Moderate extent
4-Large extent
5-Very large extent

239
APPENDIX E
MAP OF KISII COUNTY

240
APPENDIX F
MAP OF KITUI COUNTY
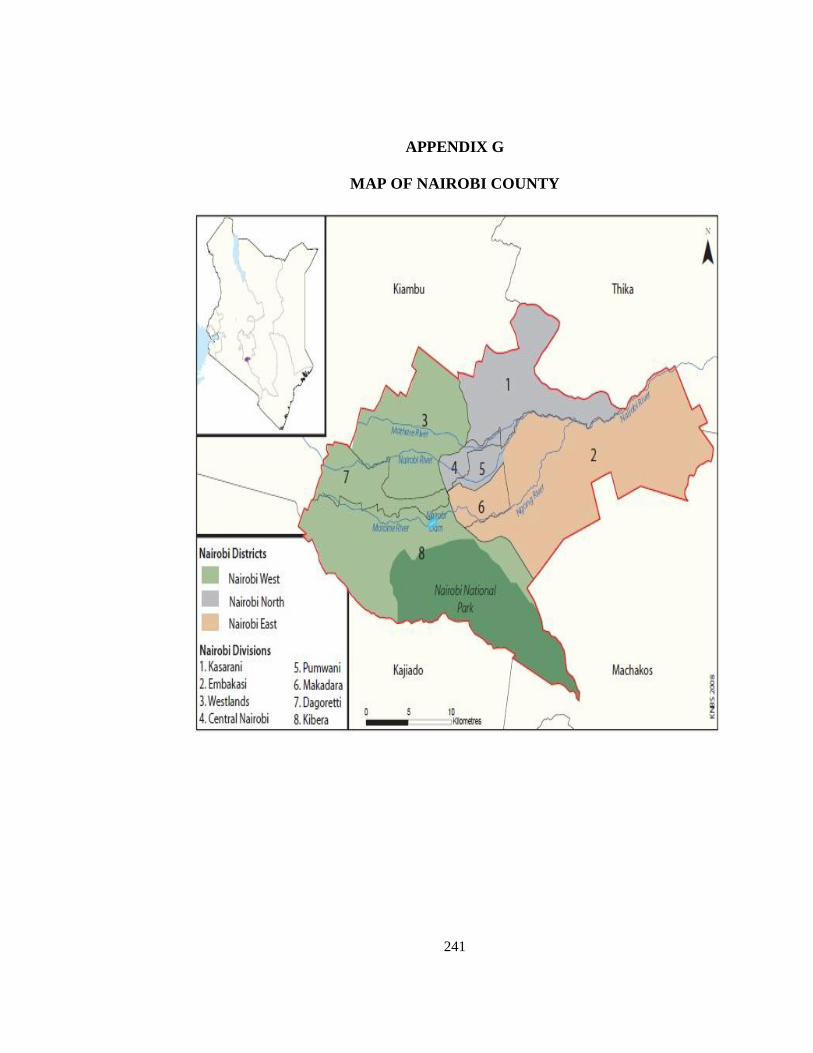
241
APPENDIX G
MAP OF NAIROBI COUNTY

242
APPENDIX H
NACOSTI RESEARCH AUTHORIZATION

243
APPENDIX I
RESEARCH PERMIT


![Factors influencing[1]](https://img.pdfslide.us/doc/110x75/54be1c8d4a795948378b4597/factors-influencing1.jpg)