Embed Size (px)
Citation preview
Finance Division Latonia McKinney, Director
Regina Poreda Ryan, Deputy Director Nathan Toth, Deputy Director
Paul Scimone, Deputy Director Emre Edev, Assistant Director
Report on the Mayor’s 2017 Preliminary Budget and the
Fiscal 2016 Preliminary Mayor’s Management Report
Administration for Children’s Services March 15, 2016
Brittany Morrissey, Legislative Financial Analyst Dohini Sompura, Unit Head
THE COUNCIL OF THE CITY OF NEW YORK
Hon. Melissa Mark-Viverito
Speaker of the Council
Hon. Stephen Levin Chair, Committee on General Welfare
Hon. Fernando Cabrera Chair, Committee on Juvenile Justice
Hon. Laurie Cumbo
Chair, Committee on Women’s Issues
Finance Division Briefing Paper Administration for Children’s Services
Page i
Table of Contents
Administration for Children’s Services Overview ................................................................................... 1
Fiscal 2017 Preliminary Budget Highlights ............................................................................................. 2
Financial Summary .................................................................................................................................. 3
Contract Budget ...................................................................................................................................... 5
Council Initiatives .................................................................................................................................... 6
2016-2017 State Executive Budget Highlights ........................................................................................ 8
Program Areas ........................................................................................................................................ 9
Early Care and Education Program Areas ......................................................................................... 10
Child Care Services ...................................................................................................................................... 10
Head Start.................................................................................................................................................... 12
Adoption Services ............................................................................................................................. 15
Child Welfare Support ...................................................................................................................... 17
Department of Education Residential Care ...................................................................................... 18
Foster Care Services .......................................................................................................................... 19
Foster Care Support .......................................................................................................................... 21
Preventive Homemaking Services .................................................................................................... 22
Preventive Services ........................................................................................................................... 23
Protective Services ............................................................................................................................ 25
General Administration .................................................................................................................... 27
Juvenile Justice Program Areas ........................................................................................................ 28
Alternatives to Detention ............................................................................................................................ 28
Juvenile Justice Support .............................................................................................................................. 29
Non-Secure Detention ................................................................................................................................. 30
Office of Children and Family Services Residential Placements ................................................................. 31
Secure Detention......................................................................................................................................... 32
Capital Program .................................................................................................................................... 35
Preliminary Capital Plan Highlights ................................................................................................... 35
Appendix A: Budget Actions in the November and the Preliminary Plans........................................... 37
Appendix B: ACS Reconciliation of Program Areas to Units of Appropriation ..................................... 38
Finance Division Briefing Paper Administration for Children’s Services
Page 1
Administration for Children’s Services Overview
The Administration for Children's Services (ACS or the agency) is responsible for the protection and wellness of the City’s children, youth, and families through the provision of quality child welfare, juvenile justice, and early child care and education services.
The Division of Early Care and Education provides child care and education services for children from six weeks to school-age for families and children that are eligible for subsidized care. Specifically, the Division oversees the administration of child care services purchased from private non-profit agencies and informal providers. Along with the provision of child care vouchers, the Division offers child care services to close to 100,000 children.
ACS’ Division of Youth and Family Justice (DYFJ) administers secure and non-secure detention services for justice-involved youth whose cases are pending in the Family or Criminal Courts, among many other services. Additionally, DYFJ provides residential placement services for juvenile delinquents through the Close to Home Initiative which aims to keep youth in their communities and near their families. In order to prevent youth from being detained, being placed in a residential setting, or becoming justice-involved, DYFJ provides preventive and alternatives-to-placement services.
The agency’s Divisions of Child Protection, Preventive Services, Family Court Legal Services, and Family Permanency Services all play a part in ensuring the wellbeing and protection of the City’s children from abuse or neglect. ACS completes more than 55,000 investigations of suspected child abuse or neglect each year. The agency is responsible for (as of November 2015) just over 10,000 children in foster care and manages the adoption of eligible children. Direct services for children and families are provided largely through contracts with private providers of preventive services, foster care, and adoption services, while child protection investigations and case work is handled by ACS employees.
This report provides a review of ACS’ Preliminary Budget for Fiscal 2017. In the first section, the highlights of its $2.97 billion Fiscal 2017 expense budget are presented, including initiatives funded by the Council, an analysis of the agency’s contract budget, and the expected impact of proposed State budget actions. The report then presents the agency’s budget by program area with analysis of significant budgetary issues, discusses initiatives included in the November and Preliminary Financial Plans, and reviews relevant sections of the Preliminary Mayor's Management Report (PMMR) for Fiscal 2016. This is followed by a review of the proposed capital budget for the agency with a discussion of significant changes proposed to the $131.6 million Capital Plan for Fiscal 2017-2019. Finally, an appendix is included to highlight the budget actions in the November and Preliminary Plans.
Finance Division Briefing Paper Administration for Children’s Services
Page 2
Fiscal 2017 Preliminary Budget Highlights
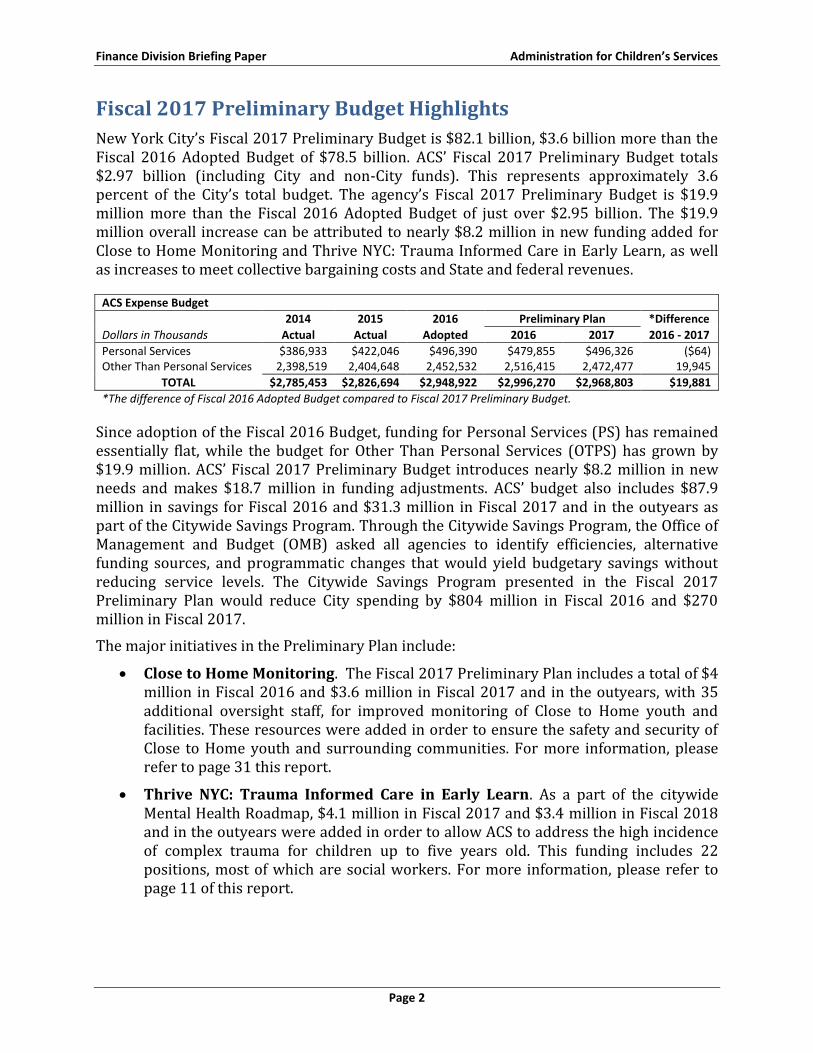
New York City’s Fiscal 2017 Preliminary Budget is $82.1 billion, $3.6 billion more than the Fiscal 2016 Adopted Budget of $78.5 billion. ACS’ Fiscal 2017 Preliminary Budget totals $2.97 billion (including City and non-City funds). This represents approximately 3.6 percent of the City’s total budget. The agency’s Fiscal 2017 Preliminary Budget is $19.9 million more than the Fiscal 2016 Adopted Budget of just over $2.95 billion. The $19.9 million overall increase can be attributed to nearly $8.2 million in new funding added for Close to Home Monitoring and Thrive NYC: Trauma Informed Care in Early Learn, as well as increases to meet collective bargaining costs and State and federal revenues.
ACS Expense Budget
2014 2015 2016 Preliminary Plan *Difference
Dollars in Thousands Actual Actual Adopted 2016 2017 2016 - 2017
Personal Services $386,933 $422,046 $496,390 $479,855 $496,326 ($64) Other Than Personal Services 2,398,519 2,404,648 2,452,532 2,516,415 2,472,477 19,945
TOTAL $2,785,453 $2,826,694 $2,948,922 $2,996,270 $2,968,803 $19,881
*The difference of Fiscal 2016 Adopted Budget compared to Fiscal 2017 Preliminary Budget.
Since adoption of the Fiscal 2016 Budget, funding for Personal Services (PS) has remained essentially flat, while the budget for Other Than Personal Services (OTPS) has grown by $19.9 million. ACS’ Fiscal 2017 Preliminary Budget introduces nearly $8.2 million in new needs and makes $18.7 million in funding adjustments. ACS’ budget also includes $87.9 million in savings for Fiscal 2016 and $31.3 million in Fiscal 2017 and in the outyears as part of the Citywide Savings Program. Through the Citywide Savings Program, the Office of Management and Budget (OMB) asked all agencies to identify efficiencies, alternative funding sources, and programmatic changes that would yield budgetary savings without reducing service levels. The Citywide Savings Program presented in the Fiscal 2017 Preliminary Plan would reduce City spending by $804 million in Fiscal 2016 and $270 million in Fiscal 2017.
The major initiatives in the Preliminary Plan include:
Close to Home Monitoring. The Fiscal 2017 Preliminary Plan includes a total of $4 million in Fiscal 2016 and $3.6 million in Fiscal 2017 and in the outyears, with 35 additional oversight staff, for improved monitoring of Close to Home youth and facilities. These resources were added in order to ensure the safety and security of Close to Home youth and surrounding communities. For more information, please refer to page 31 this report.
Thrive NYC: Trauma Informed Care in Early Learn. As a part of the citywide Mental Health Roadmap, $4.1 million in Fiscal 2017 and $3.4 million in Fiscal 2018 and in the outyears were added in order to allow ACS to address the high incidence of complex trauma for children up to five years old. This funding includes 22 positions, most of which are social workers. For more information, please refer to page 11 of this report.
Finance Division Briefing Paper Administration for Children’s Services
Page 3
Financial Summary
ACS Financial Summary Dollars in Thousands
2014 2015 2016 Preliminary Plan *Difference
Actual Actual Adopted 2016 2017 2016 - 2017
Budget by Program Area
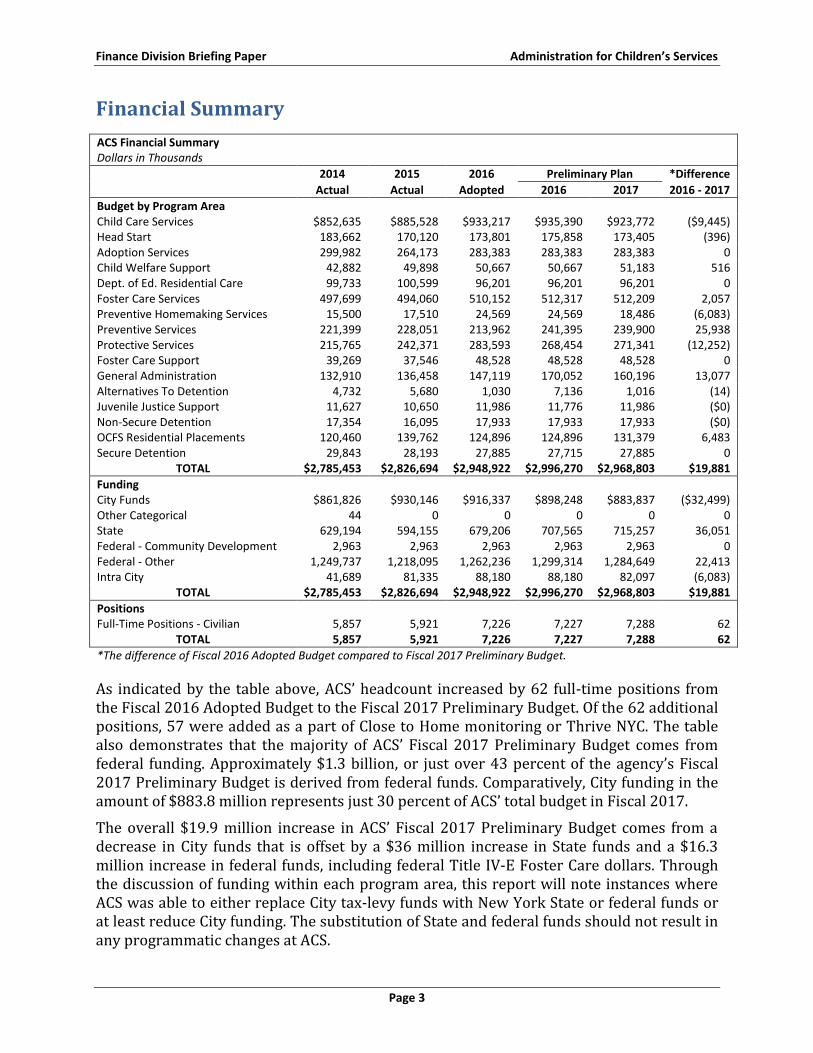
Child Care Services $852,635 $885,528 $933,217 $935,390 $923,772 ($9,445) Head Start 183,662 170,120 173,801 175,858 173,405 (396) Adoption Services 299,982 264,173 283,383 283,383 283,383 0 Child Welfare Support 42,882 49,898 50,667 50,667 51,183 516 Dept. of Ed. Residential Care 99,733 100,599 96,201 96,201 96,201 0 Foster Care Services 497,699 494,060 510,152 512,317 512,209 2,057 Preventive Homemaking Services 15,500 17,510 24,569 24,569 18,486 (6,083) Preventive Services 221,399 228,051 213,962 241,395 239,900 25,938 Protective Services 215,765 242,371 283,593 268,454 271,341 (12,252) Foster Care Support 39,269 37,546 48,528 48,528 48,528 0 General Administration 132,910 136,458 147,119 170,052 160,196 13,077 Alternatives To Detention 4,732 5,680 1,030 7,136 1,016 (14) Juvenile Justice Support 11,627 10,650 11,986 11,776 11,986 ($0) Non-Secure Detention 17,354 16,095 17,933 17,933 17,933 ($0) OCFS Residential Placements 120,460 139,762 124,896 124,896 131,379 6,483 Secure Detention 29,843 28,193 27,885 27,715 27,885 0
TOTAL $2,785,453 $2,826,694 $2,948,922 $2,996,270 $2,968,803 $19,881
Funding
City Funds $861,826 $930,146 $916,337 $898,248 $883,837 ($32,499) Other Categorical 44 0 0 0 0 0 State 629,194 594,155 679,206 707,565 715,257 36,051 Federal - Community Development 2,963 2,963 2,963 2,963 2,963 0 Federal - Other 1,249,737 1,218,095 1,262,236 1,299,314 1,284,649 22,413 Intra City 41,689 81,335 88,180 88,180 82,097 (6,083)
TOTAL $2,785,453 $2,826,694 $2,948,922 $2,996,270 $2,968,803 $19,881
Positions
Full-Time Positions - Civilian 5,857 5,921 7,226 7,227 7,288 62
TOTAL 5,857 5,921 7,226 7,227 7,288 62
*The difference of Fiscal 2016 Adopted Budget compared to Fiscal 2017 Preliminary Budget.
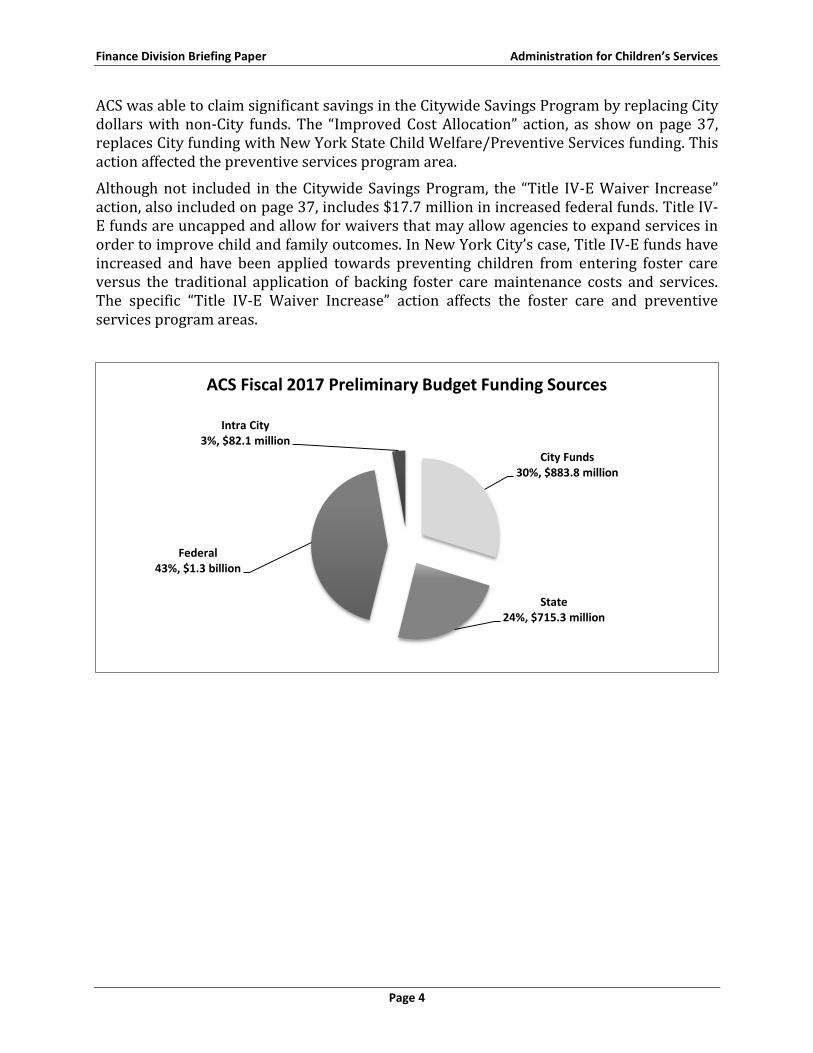
As indicated by the table above, ACS’ headcount increased by 62 full-time positions from the Fiscal 2016 Adopted Budget to the Fiscal 2017 Preliminary Budget. Of the 62 additional positions, 57 were added as a part of Close to Home monitoring or Thrive NYC. The table also demonstrates that the majority of ACS’ Fiscal 2017 Preliminary Budget comes from federal funding. Approximately $1.3 billion, or just over 43 percent of the agency’s Fiscal 2017 Preliminary Budget is derived from federal funds. Comparatively, City funding in the amount of $883.8 million represents just 30 percent of ACS’ total budget in Fiscal 2017.
The overall $19.9 million increase in ACS’ Fiscal 2017 Preliminary Budget comes from a decrease in City funds that is offset by a $36 million increase in State funds and a $16.3 million increase in federal funds, including federal Title IV-E Foster Care dollars. Through the discussion of funding within each program area, this report will note instances where ACS was able to either replace City tax-levy funds with New York State or federal funds or at least reduce City funding. The substitution of State and federal funds should not result in any programmatic changes at ACS.
Finance Division Briefing Paper Administration for Children’s Services
Page 4
ACS was able to claim significant savings in the Citywide Savings Program by replacing City dollars with non-City funds. The “Improved Cost Allocation” action, as show on page 37, replaces City funding with New York State Child Welfare/Preventive Services funding. This action affected the preventive services program area.
Although not included in the Citywide Savings Program, the “Title IV-E Waiver Increase” action, also included on page 37, includes $17.7 million in increased federal funds. Title IV-E funds are uncapped and allow for waivers that may allow agencies to expand services in order to improve child and family outcomes. In New York City’s case, Title IV-E funds have increased and have been applied towards preventing children from entering foster care versus the traditional application of backing foster care maintenance costs and services. The specific “Title IV-E Waiver Increase” action affects the foster care and preventive services program areas.
City Funds 30%, $883.8 million
State 24%, $715.3 million
Federal 43%, $1.3 billion
Intra City 3%, $82.1 million
ACS Fiscal 2017 Preliminary Budget Funding Sources
Finance Division Briefing Paper Administration for Children’s Services
Page 5
Contract Budget
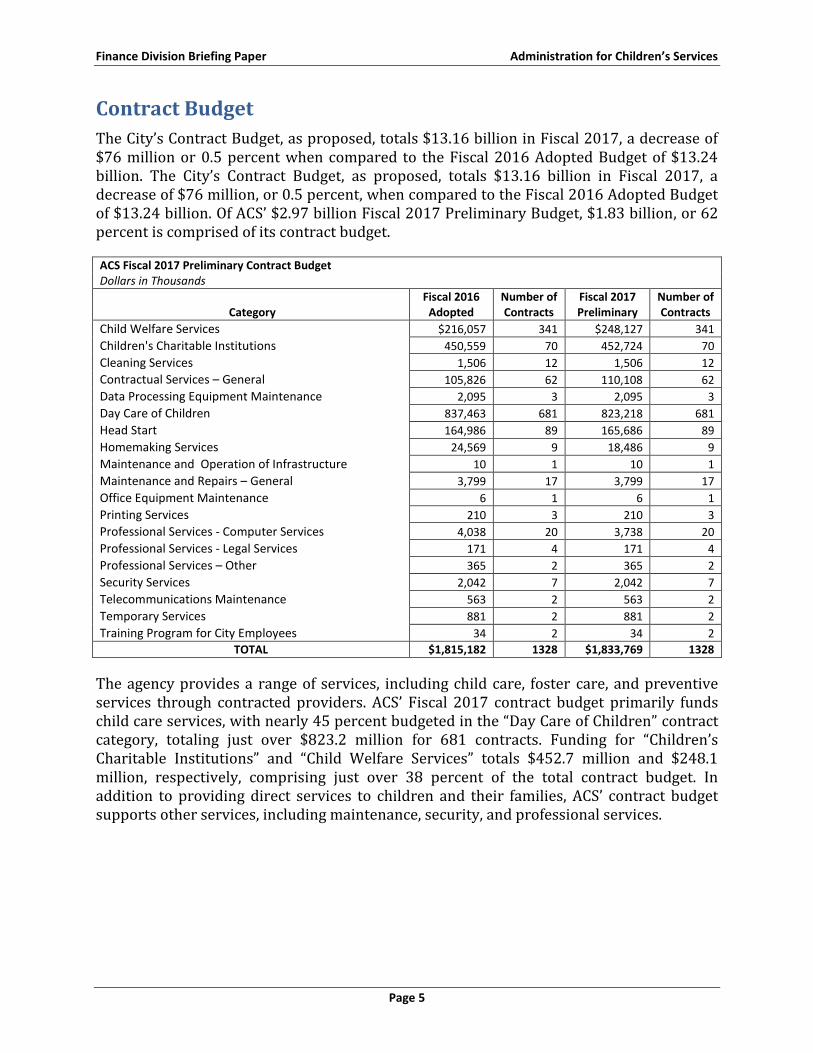
The City’s Contract Budget, as proposed, totals $13.16 billion in Fiscal 2017, a decrease of $76 million or 0.5 percent when compared to the Fiscal 2016 Adopted Budget of $13.24 billion. The City’s Contract Budget, as proposed, totals $13.16 billion in Fiscal 2017, a decrease of $76 million, or 0.5 percent, when compared to the Fiscal 2016 Adopted Budget of $13.24 billion. Of ACS’ $2.97 billion Fiscal 2017 Preliminary Budget, $1.83 billion, or 62 percent is comprised of its contract budget.
ACS Fiscal 2017 Preliminary Contract Budget Dollars in Thousands
Category Fiscal 2016
Adopted Number of Contracts
Fiscal 2017 Preliminary
Number of Contracts
Child Welfare Services $216,057 341 $248,127 341
Children's Charitable Institutions 450,559 70 452,724 70
Cleaning Services 1,506 12 1,506 12
Contractual Services – General 105,826 62 110,108 62
Data Processing Equipment Maintenance 2,095 3 2,095 3
Day Care of Children 837,463 681 823,218 681
Head Start 164,986 89 165,686 89
Homemaking Services 24,569 9 18,486 9
Maintenance and Operation of Infrastructure 10 1 10 1
Maintenance and Repairs – General 3,799 17 3,799 17
Office Equipment Maintenance 6 1 6 1
Printing Services 210 3 210 3
Professional Services - Computer Services 4,038 20 3,738 20
Professional Services - Legal Services 171 4 171 4
Professional Services – Other 365 2 365 2
Security Services 2,042 7 2,042 7
Telecommunications Maintenance 563 2 563 2
Temporary Services 881 2 881 2
Training Program for City Employees 34 2 34 2
TOTAL $1,815,182 1328 $1,833,769 1328
The agency provides a range of services, including child care, foster care, and preventive services through contracted providers. ACS’ Fiscal 2017 contract budget primarily funds child care services, with nearly 45 percent budgeted in the “Day Care of Children” contract category, totaling just over $823.2 million for 681 contracts. Funding for “Children’s Charitable Institutions” and “Child Welfare Services” totals $452.7 million and $248.1 million, respectively, comprising just over 38 percent of the total contract budget. In addition to providing direct services to children and their families, ACS’ contract budget supports other services, including maintenance, security, and professional services.
Finance Division Briefing Paper Administration for Children’s Services
Page 6
Council Initiatives
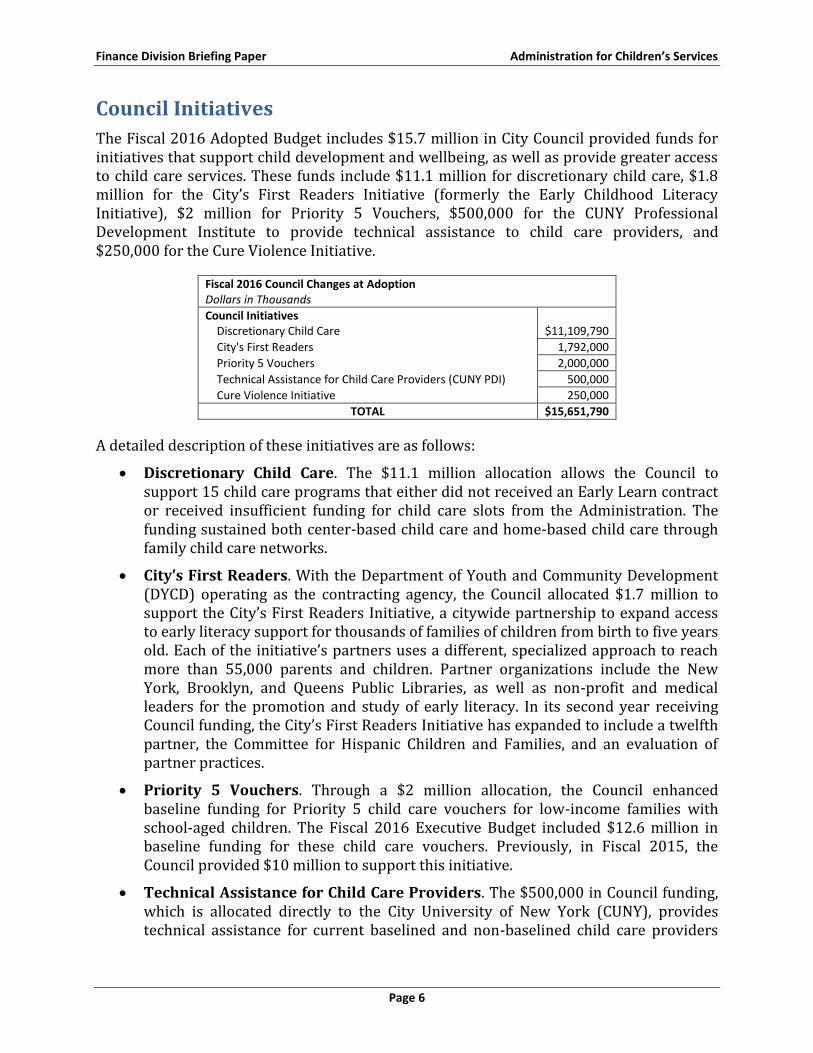
The Fiscal 2016 Adopted Budget includes $15.7 million in City Council provided funds for initiatives that support child development and wellbeing, as well as provide greater access to child care services. These funds include $11.1 million for discretionary child care, $1.8 million for the City’s First Readers Initiative (formerly the Early Childhood Literacy Initiative), $2 million for Priority 5 Vouchers, $500,000 for the CUNY Professional Development Institute to provide technical assistance to child care providers, and $250,000 for the Cure Violence Initiative.
Fiscal 2016 Council Changes at Adoption Dollars in Thousands
Council Initiatives Discretionary Child Care $11,109,790
City's First Readers 1,792,000
Priority 5 Vouchers 2,000,000
Technical Assistance for Child Care Providers (CUNY PDI) 500,000
Cure Violence Initiative 250,000
TOTAL $15,651,790
A detailed description of these initiatives are as follows:
Discretionary Child Care. The $11.1 million allocation allows the Council to support 15 child care programs that either did not received an Early Learn contract or received insufficient funding for child care slots from the Administration. The funding sustained both center-based child care and home-based child care through family child care networks.
City’s First Readers. With the Department of Youth and Community Development (DYCD) operating as the contracting agency, the Council allocated $1.7 million to support the City’s First Readers Initiative, a citywide partnership to expand access to early literacy support for thousands of families of children from birth to five years old. Each of the initiative’s partners uses a different, specialized approach to reach more than 55,000 parents and children. Partner organizations include the New York, Brooklyn, and Queens Public Libraries, as well as non-profit and medical leaders for the promotion and study of early literacy. In its second year receiving Council funding, the City’s First Readers Initiative has expanded to include a twelfth partner, the Committee for Hispanic Children and Families, and an evaluation of partner practices.
Priority 5 Vouchers. Through a $2 million allocation, the Council enhanced baseline funding for Priority 5 child care vouchers for low-income families with school-aged children. The Fiscal 2016 Executive Budget included $12.6 million in baseline funding for these child care vouchers. Previously, in Fiscal 2015, the Council provided $10 million to support this initiative.
Technical Assistance for Child Care Providers. The $500,000 in Council funding, which is allocated directly to the City University of New York (CUNY), provides technical assistance for current baselined and non-baselined child care providers
Finance Division Briefing Paper Administration for Children’s Services
Page 7
through CUNY’s New York Early Childhood Professional Development Institute (CUNY PDI). In order to support the provision of high-quality child care in New York City, CUNY PDI has been working with child care providers through New York’s rating and improvement system, QUALITYstarsNY. The system allows providers to evaluate their programs’ current quality, identify goals, and create and enact a plan for improvement.
Later into Fiscal 2016, the Council had the opportunity to fund a new initiative within ACS. The agency is currently supporting the cure violence model within its two juvenile detention facilities in Brooklyn and the Bronx. Council funding has allowed ACS to expand this work to other facilities and youth.
Cure Violence Initiative. Utilizing $250,000 in Council funding, ACS is building upon its existing work to bring violence interruption and cure violence programming to Close to Home non-secure placement sites. The initiative aims to reduce the risk of youth engaging in violent behavior and change community norms to stop the spread of violence. Violence interrupters work to prevent shootings and violence by mediating potentially lethal conflict. The program’s credible messengers utilize their own experiences to promote an anti-violence message and outreach workers involve community leaders to address and improve community norms regarding violence. Specifically, the funding is allocated to five groups that will work in each of the five boroughs. The $250,000 was split evenly among the following organizations:
o Life Camp, Inc.;
o Good Shepherd Services, Inc.;
o Getting Out and Staying Out, Inc;
o Central Family Life Center; and
o Gangstas Making Astronomical Community Changes, Inc.
Finance Division Briefing Paper Administration for Children’s Services
Page 8
2016-2017 State Executive Budget Highlights
The Fiscal 2016-2017 New York State Executive Budget includes two proposals that are expected to have an impact on ACS’ budget and provision of services: $10 million to support child care provider inspection activities and $1 million to implement Raise the Age.
Raise the Age: Last year, the Fiscal 2015-2016 New York State Budget added resources to support the initial implementation of the recommendation from the Commission on Youth, Public Safety and Justice to raise the age of juvenile jurisdiction from age 16 to age 18. Following last year’s investment, the Fiscal 2016-2017 State Executive Budget would devote $1 million to provide additional staffing resources to provide mental health services to minors who will be relocated from rehabilitation facilities to a single separate juvenile facility in 2016. In the Council’s Fiscal 2016 Preliminary Budget hearing regarding ACS’ proposed budget, ACS Commissioner Gladys Carrión testified that the agency had a commitment from Governor Cuomo for the State to fully cover costs incurred by ACS to implement the Raise the Age initiative.
Increase Support of Child Care Provider Inspection Activities. In order to comply with unfunded requirements of the federal Child Care and Development Block Grant Act of 2014, the Fiscal 2016-2017 State Executive Budget includes only $10 million to support child care provider inspection activities. However, child advocacy organizations have reported that this action leaves a $90 million funding deficit needed to meet health and safety requirements. It is estimated that an additional $100 million would be needed to continue providing subsidized child care. Failure to provide adequate funding will cause many children and families to lose child care services. New York City would have to provide significant funding to maintain its child care service levels.
Finance Division Briefing Paper Administration for Children’s Services
Page 9
Program Areas
ACS’s budget is comprised of four PS units of appropriation and four OTPS units of appropriation. The agency’s budget is categorized into sixteen distinct program areas that are aligned with ACS’ services and responsibilities. ACS’ sixteen program areas are:
Child care services*; Head Start*; Adoption services; Child welfare support; Department of Education residential care; Foster care services; Foster care support; Preventive homemaking services; Preventive services; Protective services; General administration; Alternatives to detention**; Juvenile justice support; Non-secure detention**; Office of Children and Family Services (OCFS) residential placements**; and Secure detention**.
The categorized budget, known as the program budget, clearly demonstrates how the agency’s budget resources are used to deliver services. Appendix B on page 38 details the funding in each program area by the respective unit of appropriation.
* Program areas marked with one asterisk have performance measures included in the Early Care and Education Performance Measures section.
** Program areas marked with two asterisks have performance measures included in the Juvenile Justice Performance Measures section.
Finance Division Briefing Paper Administration for Children’s Services
Page 10
Early Care and Education Program Areas
ACS oversees the largest municipal child care system in the country. Early education services are provided to eligible children ages six weeks to four years old through contracted private, non-profit organizations that operate child care programs throughout the City. Additionally, families with children ages six weeks to thirteen years old that meet eligibility requirements may be issued vouchers that can be used to purchase child care from providers. There are two program areas related to early childhood education and childcare, “Child Care Services” and “Head Start.”
Child Care Services
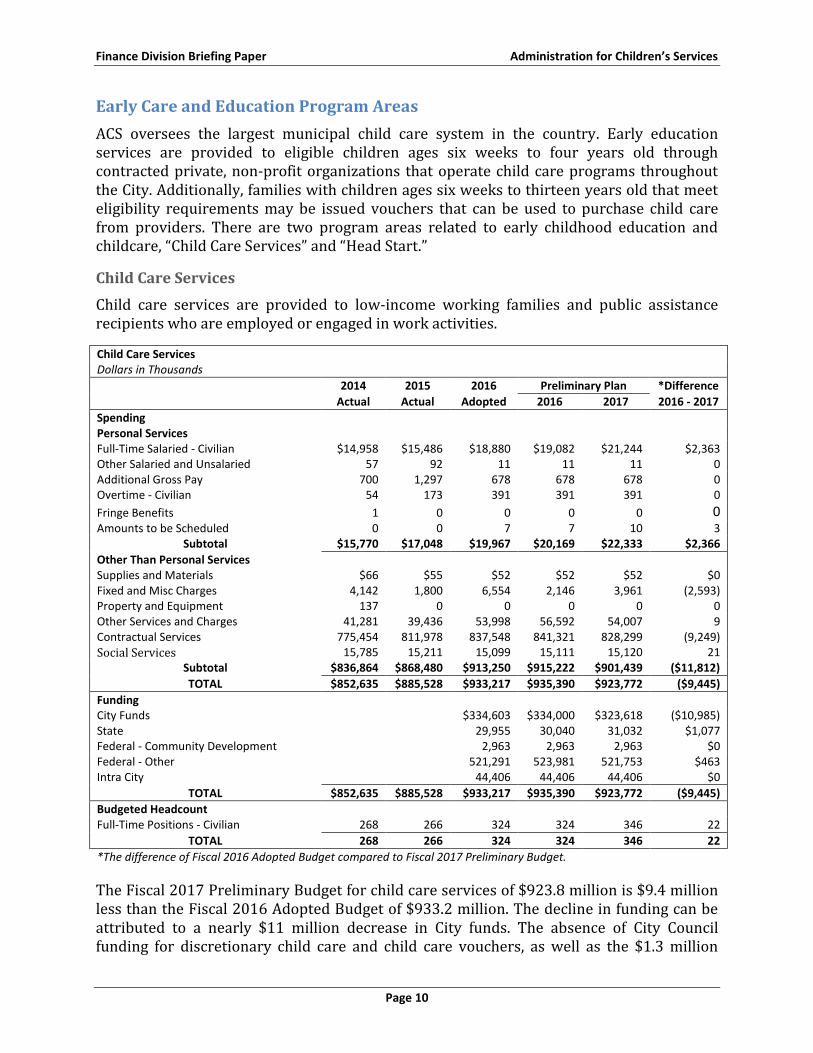
Child care services are provided to low-income working families and public assistance recipients who are employed or engaged in work activities.
Child Care Services Dollars in Thousands
2014 2015 2016 Preliminary Plan *Difference
Actual Actual Adopted 2016 2017 2016 - 2017
Spending
Personal Services
Full-Time Salaried - Civilian $14,958 $15,486 $18,880 $19,082 $21,244 $2,363 Other Salaried and Unsalaried 57 92 11 11 11 0 Additional Gross Pay 700 1,297 678 678 678 0 Overtime - Civilian 54 173 391 391 391 0
Fringe Benefits 1 0 0 0 0 0 Amounts to be Scheduled 0 0 7 7 10 3
Subtotal $15,770 $17,048 $19,967 $20,169 $22,333 $2,366
Other Than Personal Services
Supplies and Materials $66 $55 $52 $52 $52 $0 Fixed and Misc Charges 4,142 1,800 6,554 2,146 3,961 (2,593) Property and Equipment 137 0 0 0 0 0 Other Services and Charges 41,281 39,436 53,998 56,592 54,007 9 Contractual Services 775,454 811,978 837,548 841,321 828,299 (9,249)
Social Services 15,785 15,211 15,099 15,111 15,120 21 Subtotal $836,864 $868,480 $913,250 $915,222 $901,439 ($11,812)
TOTAL $852,635 $885,528 $933,217 $935,390 $923,772 ($9,445)
Funding
City Funds
$334,603 $334,000 $323,618 ($10,985)
State
29,955 30,040 31,032 $1,077 Federal - Community Development
2,963 2,963 2,963 $0
Federal - Other
521,291 523,981 521,753 $463 Intra City
44,406 44,406 44,406 $0
TOTAL $852,635 $885,528 $933,217 $935,390 $923,772 ($9,445)
Budgeted Headcount
Full-Time Positions - Civilian 268 266 324 324 346 22
TOTAL 268 266 324 324 346 22
*The difference of Fiscal 2016 Adopted Budget compared to Fiscal 2017 Preliminary Budget.
The Fiscal 2017 Preliminary Budget for child care services of $923.8 million is $9.4 million less than the Fiscal 2016 Adopted Budget of $933.2 million. The decline in funding can be attributed to a nearly $11 million decrease in City funds. The absence of City Council funding for discretionary child care and child care vouchers, as well as the $1.3 million
Finance Division Briefing Paper Administration for Children’s Services
Page 11
savings in child care vouchers included as part of the Citywide Saving Program, contribute to the decrease in City funds. These decreases are offset by the added funds for 22 positions as part of Thrive NYC: Trauma Informed Care in Early Learn.
Thrive NYC: Trauma Informed Care in Early Learn. A total of $4.1 million in Fiscal 2017 and $3.4 million in the outyears will allow ACS to implement an evidence-based practice model meant to address a high incidence of complex trauma among children between the ages of zero and five years old within New York Cities’ highest risk communities. ACS reports that Early Learn staff and providers will be trained in the social and emotional learning foundations of trauma informed care. Of the 22 positions added with this funding, 20 are social workers who will provide ongoing support and assistance to providers.
Citywide Savings Program. ACS will save $1.3 million annually beginning in Fiscal 2017 as a result of improved data matching that ensures that children enrolled in multiple child care programs are issued the correct voucher appropriate for their level of need. There is no expected reduction to the number of children served; rather, the savings reflects a re-estimate of the cost of providing the same level of service.
Finance Division Briefing Paper Administration for Children’s Services
Page 12
Head Start
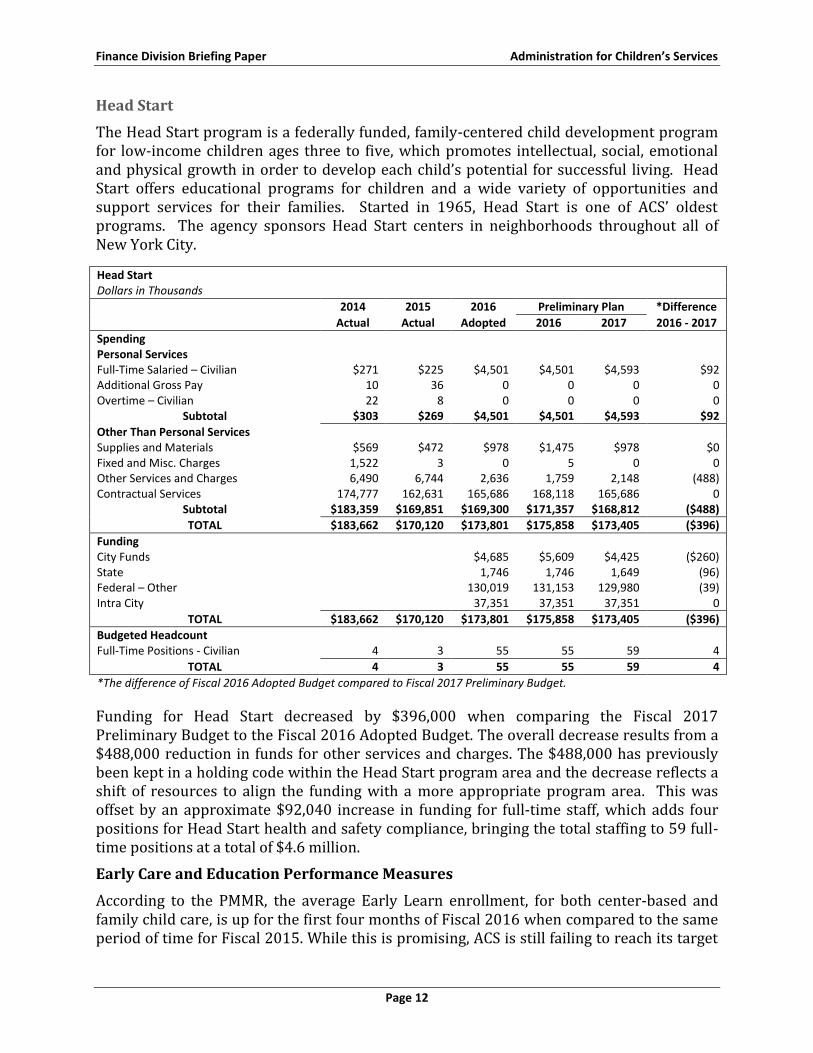
The Head Start program is a federally funded, family-centered child development program for low-income children ages three to five, which promotes intellectual, social, emotional and physical growth in order to develop each child’s potential for successful living. Head Start offers educational programs for children and a wide variety of opportunities and support services for their families. Started in 1965, Head Start is one of ACS’ oldest programs. The agency sponsors Head Start centers in neighborhoods throughout all of New York City.
Head Start Dollars in Thousands
2014 2015 2016 Preliminary Plan *Difference
Actual Actual Adopted 2016 2017 2016 - 2017
Spending
Personal Services
Full-Time Salaried – Civilian $271 $225 $4,501 $4,501 $4,593 $92 Additional Gross Pay 10 36 0 0 0 0 Overtime – Civilian 22 8 0 0 0 0
Subtotal $303 $269 $4,501 $4,501 $4,593 $92
Other Than Personal Services
Supplies and Materials $569 $472 $978 $1,475 $978 $0 Fixed and Misc. Charges 1,522 3 0 5 0 0 Other Services and Charges 6,490 6,744 2,636 1,759 2,148 (488) Contractual Services 174,777 162,631 165,686 168,118 165,686 0
Subtotal $183,359 $169,851 $169,300 $171,357 $168,812 ($488)
TOTAL $183,662 $170,120 $173,801 $175,858 $173,405 ($396)
Funding
City Funds
$4,685 $5,609 $4,425 ($260)
State
1,746 1,746 1,649 (96) Federal – Other
130,019 131,153 129,980 (39)
Intra City
37,351 37,351 37,351 0
TOTAL $183,662 $170,120 $173,801 $175,858 $173,405 ($396)
Budgeted Headcount
Full-Time Positions - Civilian 4 3 55 55 59 4
TOTAL 4 3 55 55 59 4
*The difference of Fiscal 2016 Adopted Budget compared to Fiscal 2017 Preliminary Budget.
Funding for Head Start decreased by $396,000 when comparing the Fiscal 2017 Preliminary Budget to the Fiscal 2016 Adopted Budget. The overall decrease results from a $488,000 reduction in funds for other services and charges. The $488,000 has previously been kept in a holding code within the Head Start program area and the decrease reflects a shift of resources to align the funding with a more appropriate program area. This was offset by an approximate $92,040 increase in funding for full-time staff, which adds four positions for Head Start health and safety compliance, bringing the total staffing to 59 full-time positions at a total of $4.6 million.
Early Care and Education Performance Measures
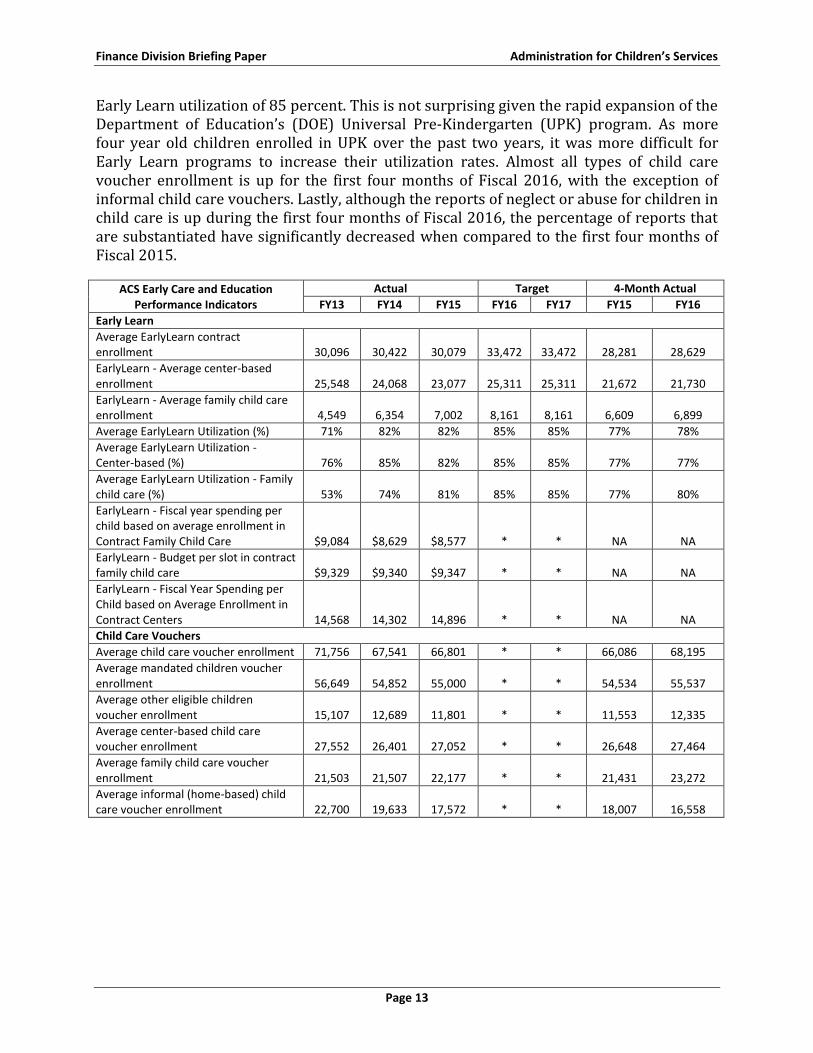
According to the PMMR, the average Early Learn enrollment, for both center-based and family child care, is up for the first four months of Fiscal 2016 when compared to the same period of time for Fiscal 2015. While this is promising, ACS is still failing to reach its target
Finance Division Briefing Paper Administration for Children’s Services
Page 13
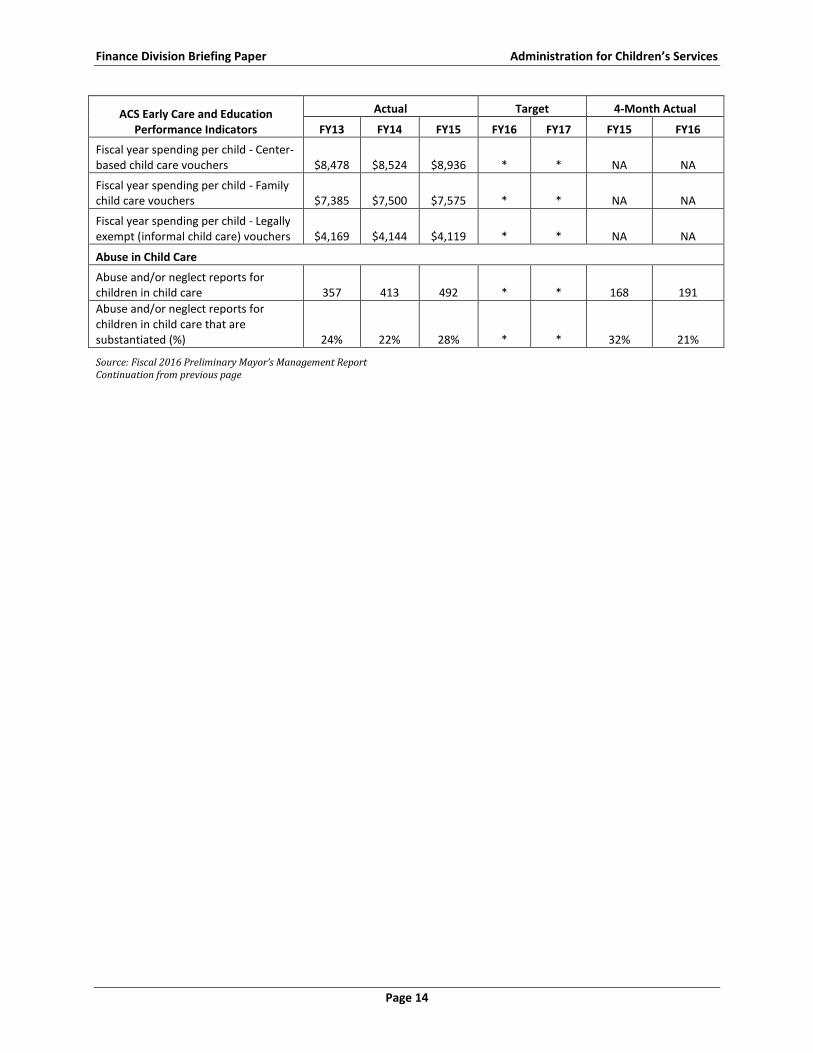
Early Learn utilization of 85 percent. This is not surprising given the rapid expansion of the Department of Education’s (DOE) Universal Pre-Kindergarten (UPK) program. As more four year old children enrolled in UPK over the past two years, it was more difficult for Early Learn programs to increase their utilization rates. Almost all types of child care voucher enrollment is up for the first four months of Fiscal 2016, with the exception of informal child care vouchers. Lastly, although the reports of neglect or abuse for children in child care is up during the first four months of Fiscal 2016, the percentage of reports that are substantiated have significantly decreased when compared to the first four months of Fiscal 2015.
ACS Early Care and Education Performance Indicators
Actual Target 4-Month Actual
FY13 FY14 FY15 FY16 FY17 FY15 FY16
Early Learn
Average EarlyLearn contract enrollment 30,096 30,422 30,079 33,472 33,472 28,281 28,629
EarlyLearn - Average center-based enrollment 25,548 24,068 23,077 25,311 25,311 21,672 21,730
EarlyLearn - Average family child care enrollment 4,549 6,354 7,002 8,161 8,161 6,609 6,899
Average EarlyLearn Utilization (%) 71% 82% 82% 85% 85% 77% 78%
Average EarlyLearn Utilization - Center-based (%) 76% 85% 82% 85% 85% 77% 77%
Average EarlyLearn Utilization - Family child care (%) 53% 74% 81% 85% 85% 77% 80%
EarlyLearn - Fiscal year spending per child based on average enrollment in Contract Family Child Care $9,084 $8,629 $8,577 * * NA NA
EarlyLearn - Budget per slot in contract family child care $9,329 $9,340 $9,347 * * NA NA
EarlyLearn - Fiscal Year Spending per Child based on Average Enrollment in Contract Centers 14,568 14,302 14,896 * * NA NA
Child Care Vouchers
Average child care voucher enrollment 71,756 67,541 66,801 * * 66,086 68,195
Average mandated children voucher enrollment 56,649 54,852 55,000 * * 54,534 55,537
Average other eligible children voucher enrollment 15,107 12,689 11,801 * * 11,553 12,335
Average center-based child care voucher enrollment 27,552 26,401 27,052 * * 26,648 27,464
Average family child care voucher enrollment 21,503 21,507 22,177 * * 21,431 23,272
Average informal (home-based) child care voucher enrollment 22,700 19,633 17,572 * * 18,007 16,558
Finance Division Briefing Paper Administration for Children’s Services
Page 14
ACS Early Care and Education Performance Indicators
Actual Target 4-Month Actual
FY13 FY14 FY15 FY16 FY17 FY15 FY16
Fiscal year spending per child - Center-based child care vouchers $8,478 $8,524 $8,936 * * NA NA
Fiscal year spending per child - Family child care vouchers $7,385 $7,500 $7,575 * * NA NA
Fiscal year spending per child - Legally exempt (informal child care) vouchers $4,169 $4,144 $4,119 * * NA NA
Abuse in Child Care
Abuse and/or neglect reports for children in child care 357 413 492 * * 168 191
Abuse and/or neglect reports for children in child care that are substantiated (%) 24% 22% 28% * * 32% 21%
Source: Fiscal 2016 Preliminary Mayor’s Management Report Continuation from previous page
Finance Division Briefing Paper Administration for Children’s Services
Page 15
Adoption Services
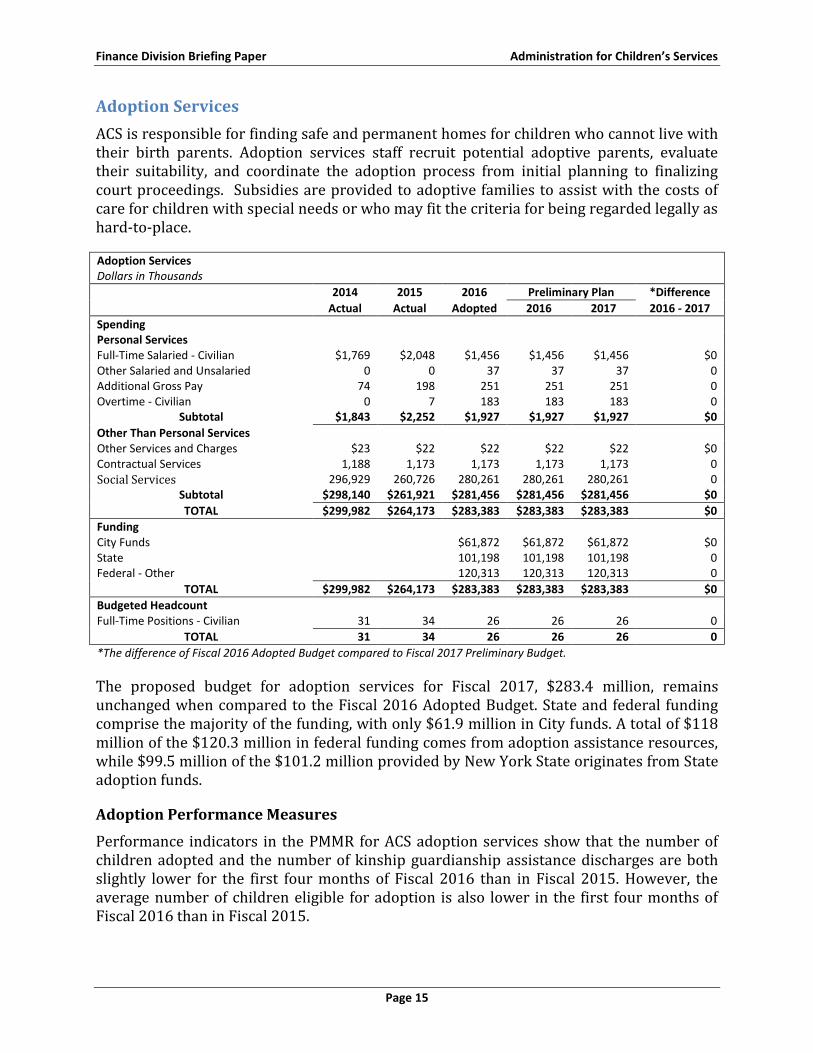
ACS is responsible for finding safe and permanent homes for children who cannot live with their birth parents. Adoption services staff recruit potential adoptive parents, evaluate their suitability, and coordinate the adoption process from initial planning to finalizing court proceedings. Subsidies are provided to adoptive families to assist with the costs of care for children with special needs or who may fit the criteria for being regarded legally as hard-to-place.
Adoption Services Dollars in Thousands
2014 2015 2016 Preliminary Plan *Difference
Actual Actual Adopted 2016 2017 2016 - 2017
Spending
Personal Services
Full-Time Salaried - Civilian $1,769 $2,048 $1,456 $1,456 $1,456 $0 Other Salaried and Unsalaried 0 0 37 37 37 0 Additional Gross Pay 74 198 251 251 251 0 Overtime - Civilian 0 7 183 183 183 0
Subtotal $1,843 $2,252 $1,927 $1,927 $1,927 $0
Other Than Personal Services
Other Services and Charges $23 $22 $22 $22 $22 $0 Contractual Services 1,188 1,173 1,173 1,173 1,173 0
Social Services 296,929 260,726 280,261 280,261 280,261 0 Subtotal $298,140 $261,921 $281,456 $281,456 $281,456 $0
TOTAL $299,982 $264,173 $283,383 $283,383 $283,383 $0
Funding
City Funds
$61,872 $61,872 $61,872 $0
State
101,198 101,198 101,198 0 Federal - Other
120,313 120,313 120,313 0
TOTAL $299,982 $264,173 $283,383 $283,383 $283,383 $0
Budgeted Headcount
Full-Time Positions - Civilian 31 34 26 26 26 0
TOTAL 31 34 26 26 26 0
*The difference of Fiscal 2016 Adopted Budget compared to Fiscal 2017 Preliminary Budget.
The proposed budget for adoption services for Fiscal 2017, $283.4 million, remains unchanged when compared to the Fiscal 2016 Adopted Budget. State and federal funding comprise the majority of the funding, with only $61.9 million in City funds. A total of $118 million of the $120.3 million in federal funding comes from adoption assistance resources, while $99.5 million of the $101.2 million provided by New York State originates from State adoption funds.
Adoption Performance Measures
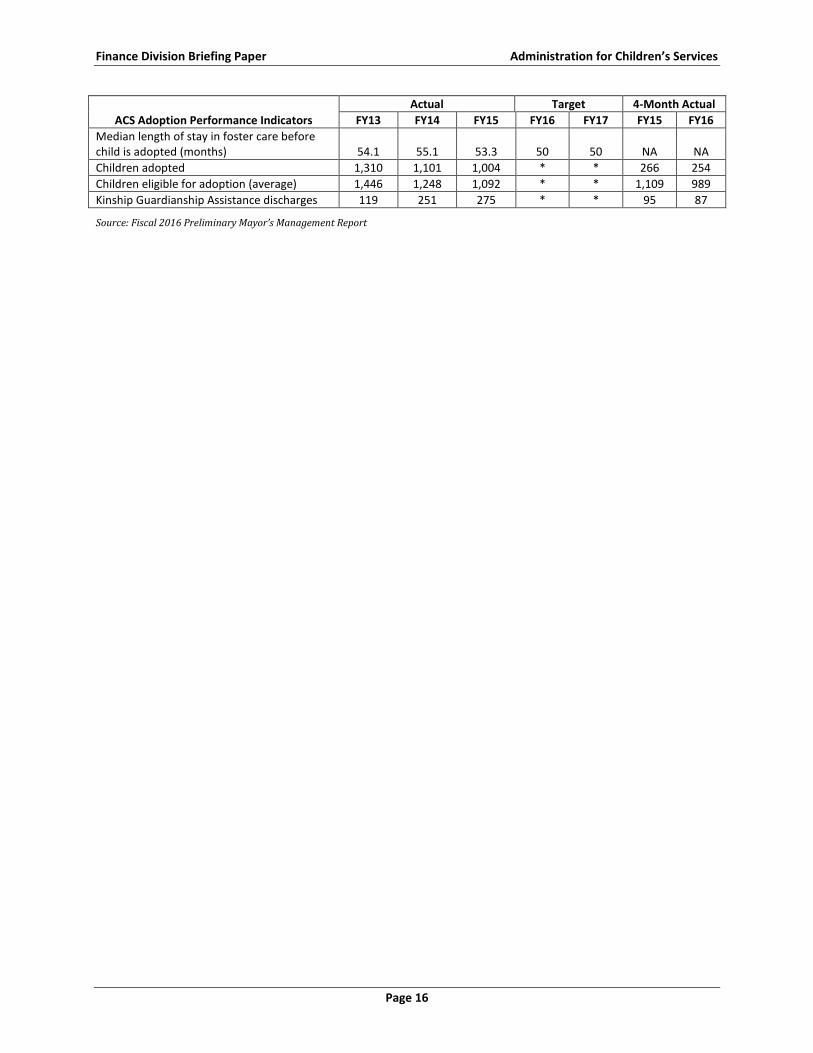
Performance indicators in the PMMR for ACS adoption services show that the number of children adopted and the number of kinship guardianship assistance discharges are both slightly lower for the first four months of Fiscal 2016 than in Fiscal 2015. However, the average number of children eligible for adoption is also lower in the first four months of Fiscal 2016 than in Fiscal 2015.
Finance Division Briefing Paper Administration for Children’s Services
Page 16
ACS Adoption Performance Indicators
Actual Target 4-Month Actual
FY13 FY14 FY15 FY16 FY17 FY15 FY16
Median length of stay in foster care before child is adopted (months) 54.1 55.1 53.3 50 50 NA NA
Children adopted 1,310 1,101 1,004 * * 266 254
Children eligible for adoption (average) 1,446 1,248 1,092 * * 1,109 989
Kinship Guardianship Assistance discharges 119 251 275 * * 95 87
Source: Fiscal 2016 Preliminary Mayor’s Management Report
Finance Division Briefing Paper Administration for Children’s Services
Page 17
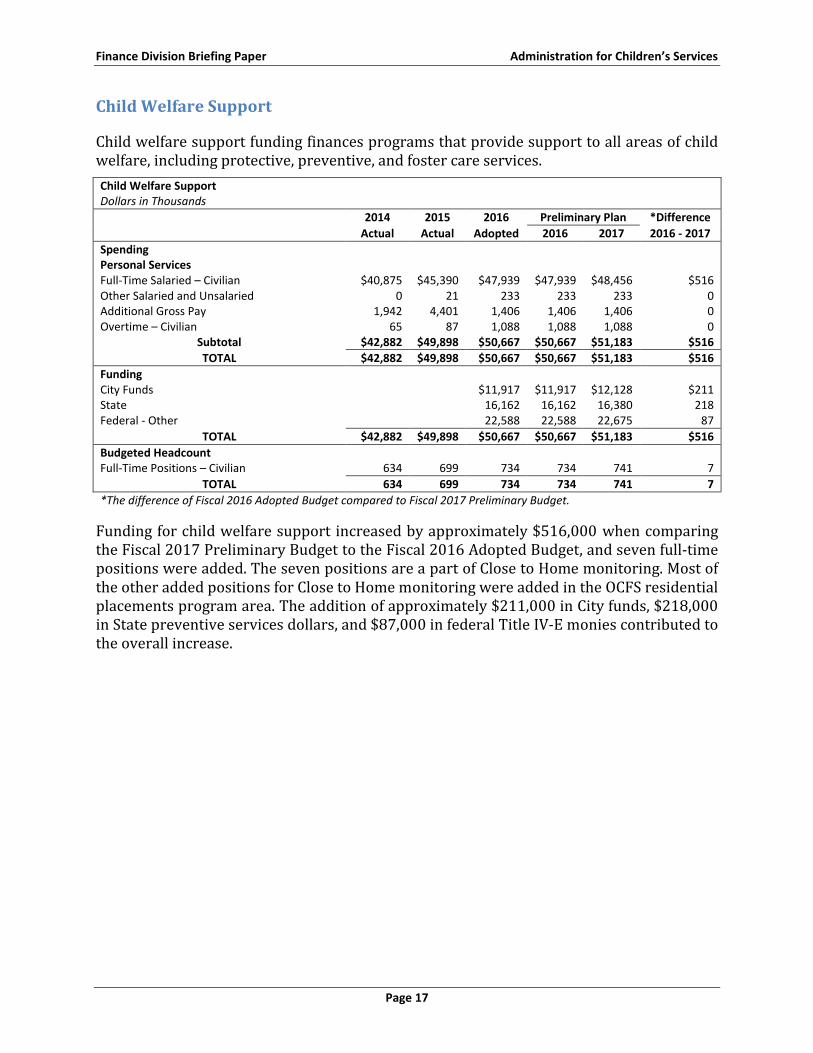
Child Welfare Support
Child welfare support funding finances programs that provide support to all areas of child welfare, including protective, preventive, and foster care services.
Child Welfare Support Dollars in Thousands
2014 2015 2016 Preliminary Plan *Difference
Actual Actual Adopted 2016 2017 2016 - 2017
Spending
Personal Services
Full-Time Salaried – Civilian $40,875 $45,390 $47,939 $47,939 $48,456 $516 Other Salaried and Unsalaried 0 21 233 233 233 0 Additional Gross Pay 1,942 4,401 1,406 1,406 1,406 0 Overtime – Civilian 65 87 1,088 1,088 1,088 0
Subtotal $42,882 $49,898 $50,667 $50,667 $51,183 $516
TOTAL $42,882 $49,898 $50,667 $50,667 $51,183 $516
Funding
City Funds
$11,917 $11,917 $12,128 $211
State
16,162 16,162 16,380 218 Federal - Other
22,588 22,588 22,675 87
TOTAL $42,882 $49,898 $50,667 $50,667 $51,183 $516
Budgeted Headcount
Full-Time Positions – Civilian 634 699 734 734 741 7
TOTAL 634 699 734 734 741 7
*The difference of Fiscal 2016 Adopted Budget compared to Fiscal 2017 Preliminary Budget.
Funding for child welfare support increased by approximately $516,000 when comparing the Fiscal 2017 Preliminary Budget to the Fiscal 2016 Adopted Budget, and seven full-time positions were added. The seven positions are a part of Close to Home monitoring. Most of the other added positions for Close to Home monitoring were added in the OCFS residential placements program area. The addition of approximately $211,000 in City funds, $218,000 in State preventive services dollars, and $87,000 in federal Title IV-E monies contributed to the overall increase.
Finance Division Briefing Paper Administration for Children’s Services
Page 18
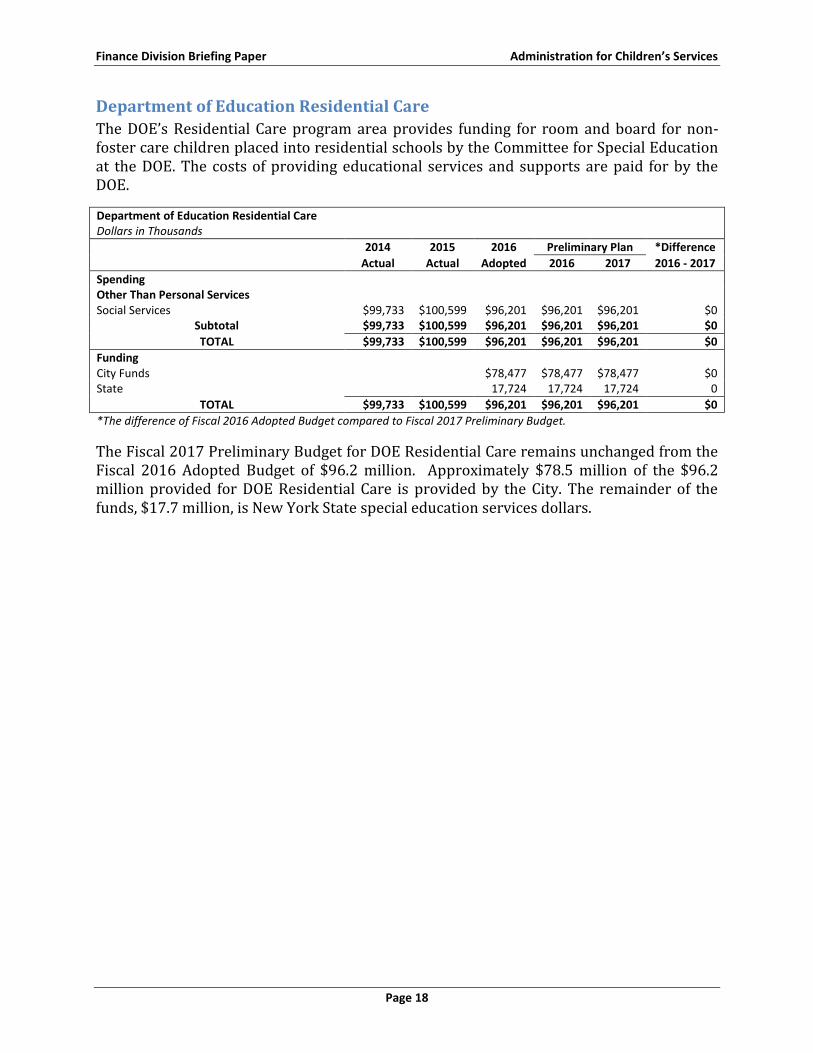
Department of Education Residential Care
The DOE’s Residential Care program area provides funding for room and board for non-foster care children placed into residential schools by the Committee for Special Education at the DOE. The costs of providing educational services and supports are paid for by the DOE.
Department of Education Residential Care Dollars in Thousands
2014 2015 2016 Preliminary Plan *Difference
Actual Actual Adopted 2016 2017 2016 - 2017
Spending
Other Than Personal Services
Social Services $99,733 $100,599 $96,201 $96,201 $96,201 $0 Subtotal $99,733 $100,599 $96,201 $96,201 $96,201 $0
TOTAL $99,733 $100,599 $96,201 $96,201 $96,201 $0
Funding
City Funds
$78,477 $78,477 $78,477 $0
State
17,724 17,724 17,724 0
TOTAL $99,733 $100,599 $96,201 $96,201 $96,201 $0
*The difference of Fiscal 2016 Adopted Budget compared to Fiscal 2017 Preliminary Budget.
The Fiscal 2017 Preliminary Budget for DOE Residential Care remains unchanged from the Fiscal 2016 Adopted Budget of $96.2 million. Approximately $78.5 million of the $96.2 million provided for DOE Residential Care is provided by the City. The remainder of the funds, $17.7 million, is New York State special education services dollars.
Finance Division Briefing Paper Administration for Children’s Services
Page 19
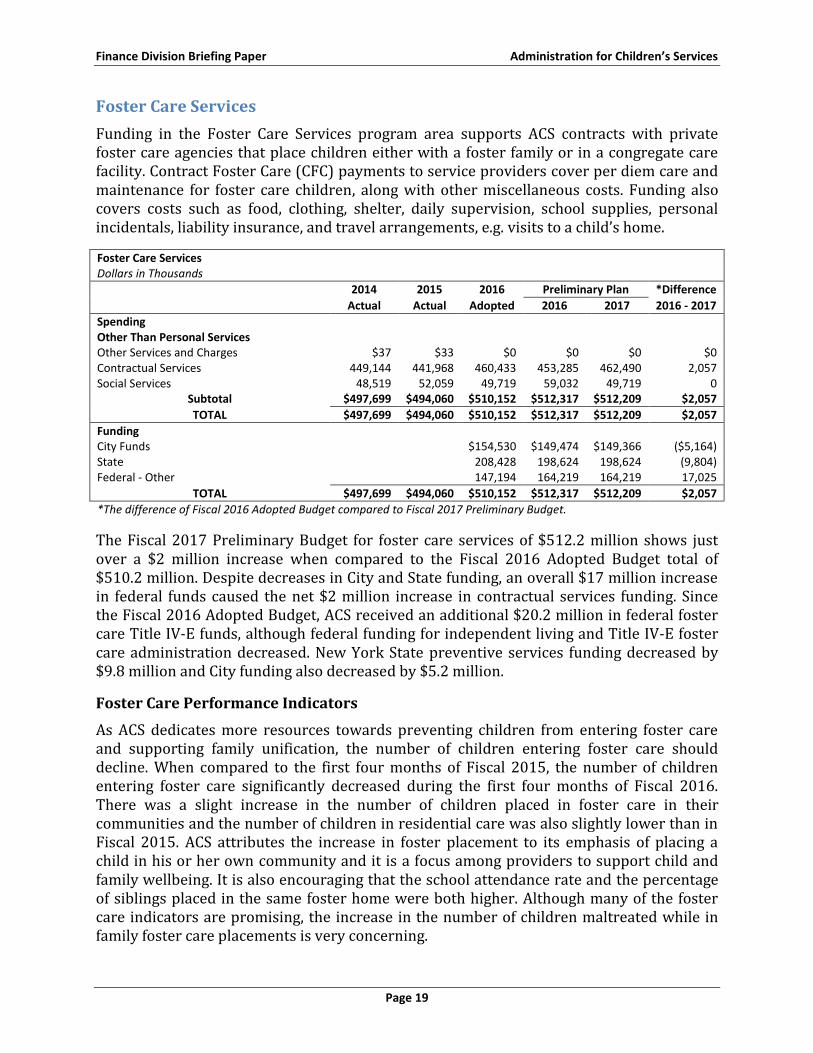
Foster Care Services
Funding in the Foster Care Services program area supports ACS contracts with private foster care agencies that place children either with a foster family or in a congregate care facility. Contract Foster Care (CFC) payments to service providers cover per diem care and maintenance for foster care children, along with other miscellaneous costs. Funding also covers costs such as food, clothing, shelter, daily supervision, school supplies, personal incidentals, liability insurance, and travel arrangements, e.g. visits to a child’s home.
Foster Care Services Dollars in Thousands
2014 2015 2016 Preliminary Plan *Difference
Actual Actual Adopted 2016 2017 2016 - 2017
Spending
Other Than Personal Services
Other Services and Charges $37 $33 $0 $0 $0 $0 Contractual Services 449,144 441,968 460,433 453,285 462,490 2,057 Social Services 48,519 52,059 49,719 59,032 49,719 0
Subtotal $497,699 $494,060 $510,152 $512,317 $512,209 $2,057
TOTAL $497,699 $494,060 $510,152 $512,317 $512,209 $2,057
Funding
City Funds
$154,530 $149,474 $149,366 ($5,164)
State
208,428 198,624 198,624 (9,804) Federal - Other
147,194 164,219 164,219 17,025
TOTAL $497,699 $494,060 $510,152 $512,317 $512,209 $2,057
*The difference of Fiscal 2016 Adopted Budget compared to Fiscal 2017 Preliminary Budget.
The Fiscal 2017 Preliminary Budget for foster care services of $512.2 million shows just over a $2 million increase when compared to the Fiscal 2016 Adopted Budget total of $510.2 million. Despite decreases in City and State funding, an overall $17 million increase in federal funds caused the net $2 million increase in contractual services funding. Since the Fiscal 2016 Adopted Budget, ACS received an additional $20.2 million in federal foster care Title IV-E funds, although federal funding for independent living and Title IV-E foster care administration decreased. New York State preventive services funding decreased by $9.8 million and City funding also decreased by $5.2 million.
Foster Care Performance Indicators
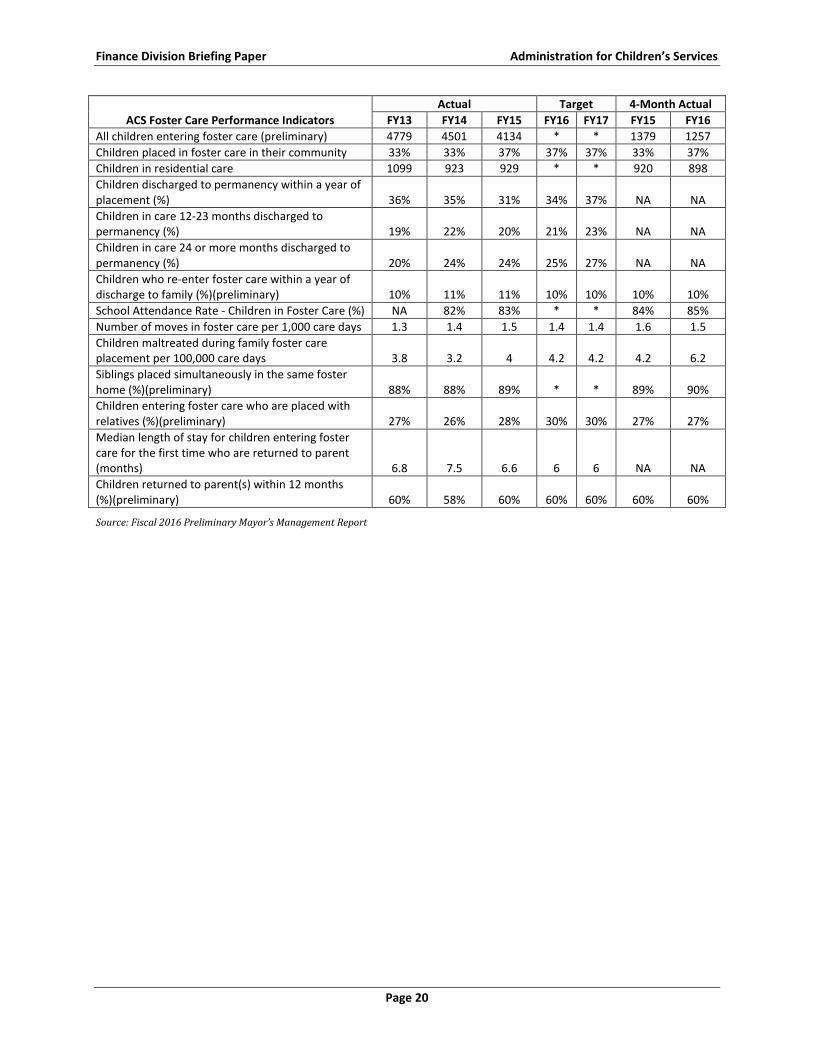
As ACS dedicates more resources towards preventing children from entering foster care and supporting family unification, the number of children entering foster care should decline. When compared to the first four months of Fiscal 2015, the number of children entering foster care significantly decreased during the first four months of Fiscal 2016. There was a slight increase in the number of children placed in foster care in their communities and the number of children in residential care was also slightly lower than in Fiscal 2015. ACS attributes the increase in foster placement to its emphasis of placing a child in his or her own community and it is a focus among providers to support child and family wellbeing. It is also encouraging that the school attendance rate and the percentage of siblings placed in the same foster home were both higher. Although many of the foster care indicators are promising, the increase in the number of children maltreated while in family foster care placements is very concerning.
Finance Division Briefing Paper Administration for Children’s Services
Page 20
ACS Foster Care Performance Indicators
Actual Target 4-Month Actual
FY13 FY14 FY15 FY16 FY17 FY15 FY16
All children entering foster care (preliminary) 4779 4501 4134 * * 1379 1257
Children placed in foster care in their community 33% 33% 37% 37% 37% 33% 37%
Children in residential care 1099 923 929 * * 920 898
Children discharged to permanency within a year of placement (%) 36% 35% 31% 34% 37% NA NA
Children in care 12-23 months discharged to permanency (%) 19% 22% 20% 21% 23% NA NA
Children in care 24 or more months discharged to permanency (%) 20% 24% 24% 25% 27% NA NA
Children who re-enter foster care within a year of discharge to family (%)(preliminary) 10% 11% 11% 10% 10% 10% 10%
School Attendance Rate - Children in Foster Care (%) NA 82% 83% * * 84% 85%
Number of moves in foster care per 1,000 care days 1.3 1.4 1.5 1.4 1.4 1.6 1.5
Children maltreated during family foster care placement per 100,000 care days 3.8 3.2 4 4.2 4.2 4.2 6.2
Siblings placed simultaneously in the same foster home (%)(preliminary) 88% 88% 89% * * 89% 90%
Children entering foster care who are placed with relatives (%)(preliminary) 27% 26% 28% 30% 30% 27% 27%
Median length of stay for children entering foster care for the first time who are returned to parent (months) 6.8 7.5 6.6 6 6 NA NA
Children returned to parent(s) within 12 months (%)(preliminary) 60% 58% 60% 60% 60% 60% 60%
Source: Fiscal 2016 Preliminary Mayor’s Management Report
Finance Division Briefing Paper Administration for Children’s Services
Page 21
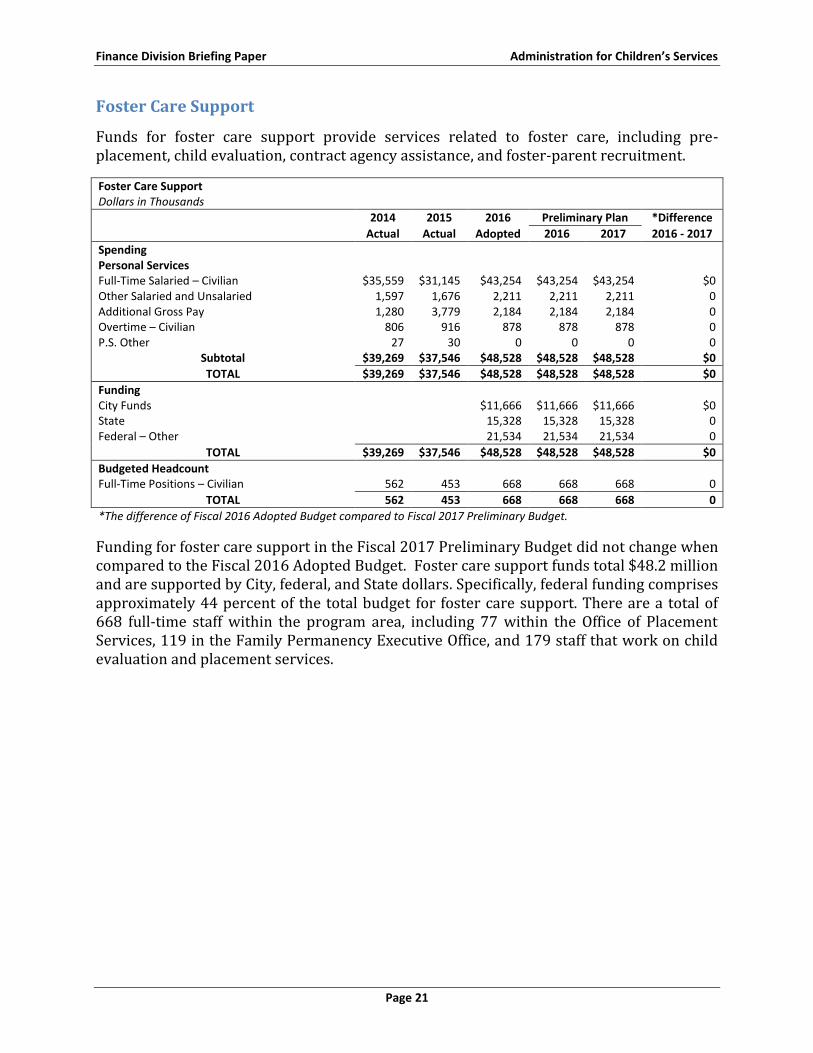
Foster Care Support
Funds for foster care support provide services related to foster care, including pre-placement, child evaluation, contract agency assistance, and foster-parent recruitment.
Foster Care Support Dollars in Thousands
2014 2015 2016 Preliminary Plan *Difference
Actual Actual Adopted 2016 2017 2016 - 2017
Spending
Personal Services
Full-Time Salaried – Civilian $35,559 $31,145 $43,254 $43,254 $43,254 $0 Other Salaried and Unsalaried 1,597 1,676 2,211 2,211 2,211 0 Additional Gross Pay 1,280 3,779 2,184 2,184 2,184 0 Overtime – Civilian 806 916 878 878 878 0 P.S. Other 27 30 0 0 0 0
Subtotal $39,269 $37,546 $48,528 $48,528 $48,528 $0
TOTAL $39,269 $37,546 $48,528 $48,528 $48,528 $0
Funding
City Funds
$11,666 $11,666 $11,666 $0
State
15,328 15,328 15,328 0 Federal – Other
21,534 21,534 21,534 0
TOTAL $39,269 $37,546 $48,528 $48,528 $48,528 $0
Budgeted Headcount
Full-Time Positions – Civilian 562 453 668 668 668 0
TOTAL 562 453 668 668 668 0
*The difference of Fiscal 2016 Adopted Budget compared to Fiscal 2017 Preliminary Budget.
Funding for foster care support in the Fiscal 2017 Preliminary Budget did not change when compared to the Fiscal 2016 Adopted Budget. Foster care support funds total $48.2 million and are supported by City, federal, and State dollars. Specifically, federal funding comprises approximately 44 percent of the total budget for foster care support. There are a total of 668 full-time staff within the program area, including 77 within the Office of Placement Services, 119 in the Family Permanency Executive Office, and 179 staff that work on child evaluation and placement services.
Finance Division Briefing Paper Administration for Children’s Services
Page 22
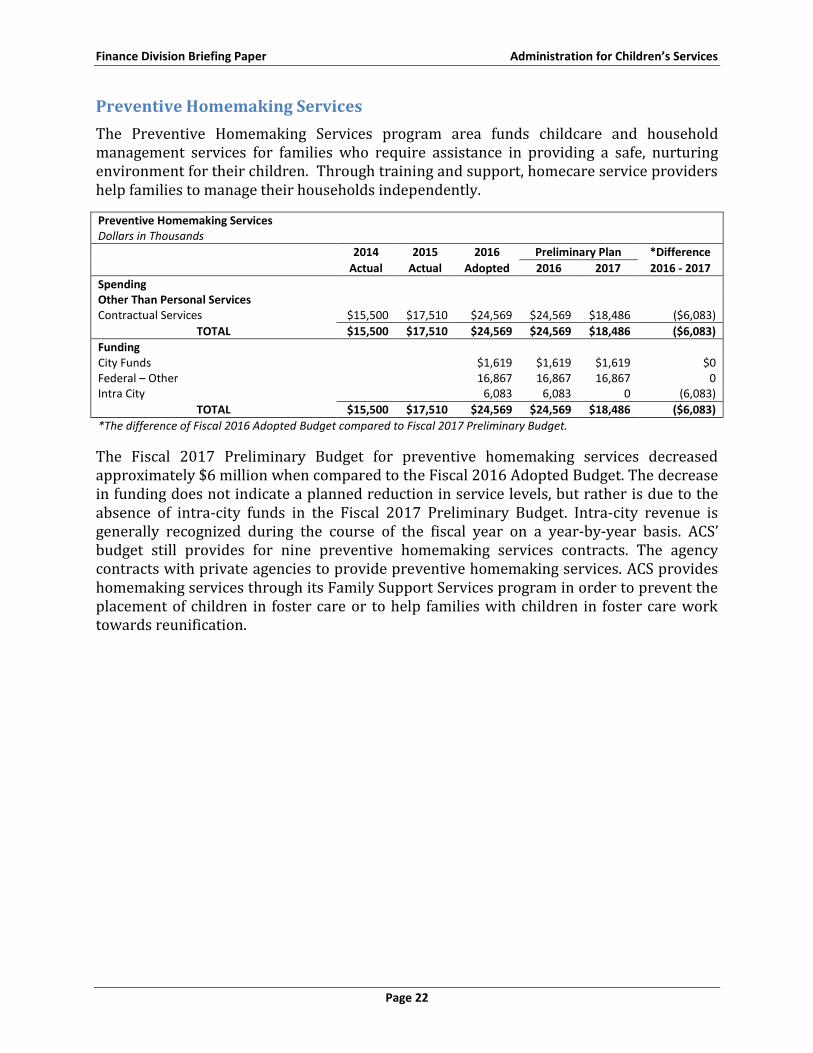
Preventive Homemaking Services
The Preventive Homemaking Services program area funds childcare and household management services for families who require assistance in providing a safe, nurturing environment for their children. Through training and support, homecare service providers help families to manage their households independently.
Preventive Homemaking Services Dollars in Thousands
2014 2015 2016 Preliminary Plan *Difference
Actual Actual Adopted 2016 2017 2016 - 2017
Spending
Other Than Personal Services
Contractual Services $15,500 $17,510 $24,569 $24,569 $18,486 ($6,083)
TOTAL $15,500 $17,510 $24,569 $24,569 $18,486 ($6,083)
Funding
City Funds
$1,619 $1,619 $1,619 $0
Federal – Other
16,867 16,867 16,867 0 Intra City
6,083 6,083 0 (6,083)
TOTAL $15,500 $17,510 $24,569 $24,569 $18,486 ($6,083)
*The difference of Fiscal 2016 Adopted Budget compared to Fiscal 2017 Preliminary Budget.
The Fiscal 2017 Preliminary Budget for preventive homemaking services decreased approximately $6 million when compared to the Fiscal 2016 Adopted Budget. The decrease in funding does not indicate a planned reduction in service levels, but rather is due to the absence of intra-city funds in the Fiscal 2017 Preliminary Budget. Intra-city revenue is generally recognized during the course of the fiscal year on a year-by-year basis. ACS’ budget still provides for nine preventive homemaking services contracts. The agency contracts with private agencies to provide preventive homemaking services. ACS provides homemaking services through its Family Support Services program in order to prevent the placement of children in foster care or to help families with children in foster care work towards reunification.
Finance Division Briefing Paper Administration for Children’s Services
Page 23
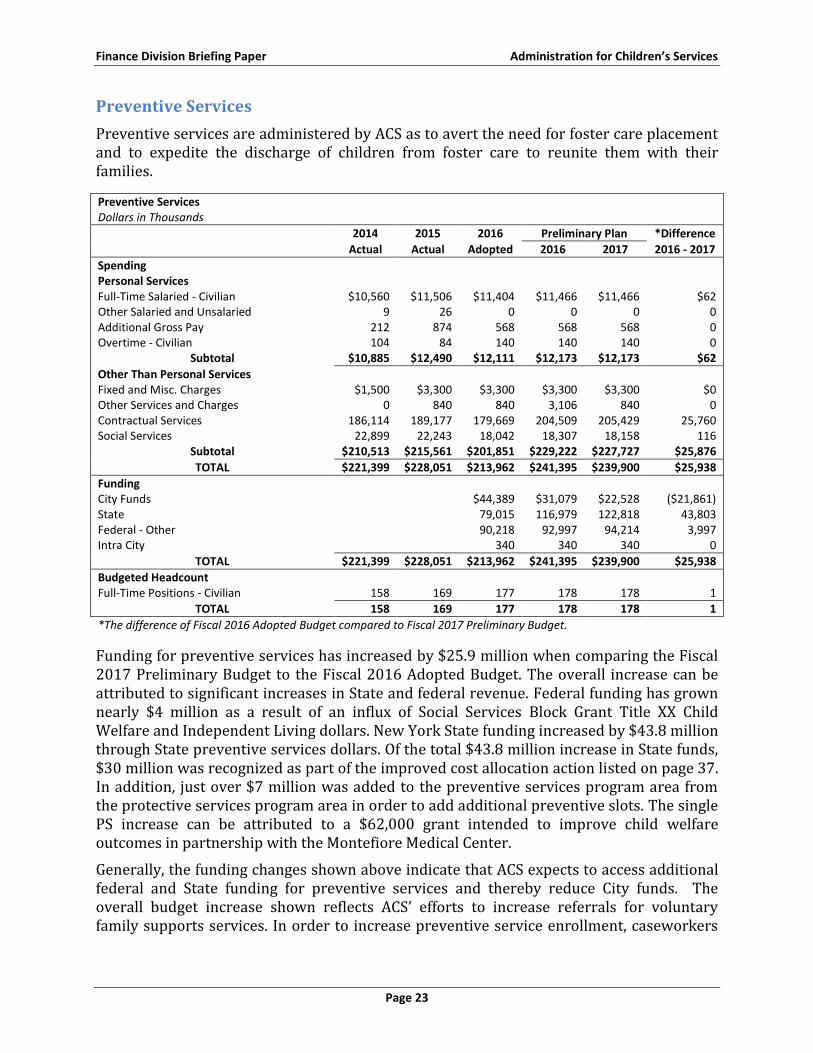
Preventive Services
Preventive services are administered by ACS as to avert the need for foster care placement and to expedite the discharge of children from foster care to reunite them with their families.
Preventive Services Dollars in Thousands
2014 2015 2016 Preliminary Plan *Difference
Actual Actual Adopted 2016 2017 2016 - 2017
Spending
Personal Services
Full-Time Salaried - Civilian $10,560 $11,506 $11,404 $11,466 $11,466 $62 Other Salaried and Unsalaried 9 26 0 0 0 0 Additional Gross Pay 212 874 568 568 568 0 Overtime - Civilian 104 84 140 140 140 0
Subtotal $10,885 $12,490 $12,111 $12,173 $12,173 $62
Other Than Personal Services
Fixed and Misc. Charges $1,500 $3,300 $3,300 $3,300 $3,300 $0 Other Services and Charges 0 840 840 3,106 840 0 Contractual Services 186,114 189,177 179,669 204,509 205,429 25,760 Social Services 22,899 22,243 18,042 18,307 18,158 116
Subtotal $210,513 $215,561 $201,851 $229,222 $227,727 $25,876
TOTAL $221,399 $228,051 $213,962 $241,395 $239,900 $25,938
Funding
City Funds
$44,389 $31,079 $22,528 ($21,861)
State
79,015 116,979 122,818 43,803 Federal - Other
90,218 92,997 94,214 3,997
Intra City
340 340 340 0
TOTAL $221,399 $228,051 $213,962 $241,395 $239,900 $25,938
Budgeted Headcount
Full-Time Positions - Civilian 158 169 177 178 178 1
TOTAL 158 169 177 178 178 1
*The difference of Fiscal 2016 Adopted Budget compared to Fiscal 2017 Preliminary Budget.
Funding for preventive services has increased by $25.9 million when comparing the Fiscal 2017 Preliminary Budget to the Fiscal 2016 Adopted Budget. The overall increase can be attributed to significant increases in State and federal revenue. Federal funding has grown nearly $4 million as a result of an influx of Social Services Block Grant Title XX Child Welfare and Independent Living dollars. New York State funding increased by $43.8 million through State preventive services dollars. Of the total $43.8 million increase in State funds, $30 million was recognized as part of the improved cost allocation action listed on page 37. In addition, just over $7 million was added to the preventive services program area from the protective services program area in order to add additional preventive slots. The single PS increase can be attributed to a $62,000 grant intended to improve child welfare outcomes in partnership with the Montefiore Medical Center.
Generally, the funding changes shown above indicate that ACS expects to access additional federal and State funding for preventive services and thereby reduce City funds. The overall budget increase shown reflects ACS’ efforts to increase referrals for voluntary family supports services. In order to increase preventive service enrollment, caseworkers
Finance Division Briefing Paper Administration for Children’s Services
Page 24
are offering preventive services to more at-risk families, including families where an allegation of abuse or neglect has been unsubstantiated.
Preventive Services Performance Indicators
ACS Preventive Services Performance Indicators
Actual Target 4-Month Actual
FY13 FY14 FY15 FY16 FY17 FY15 FY16
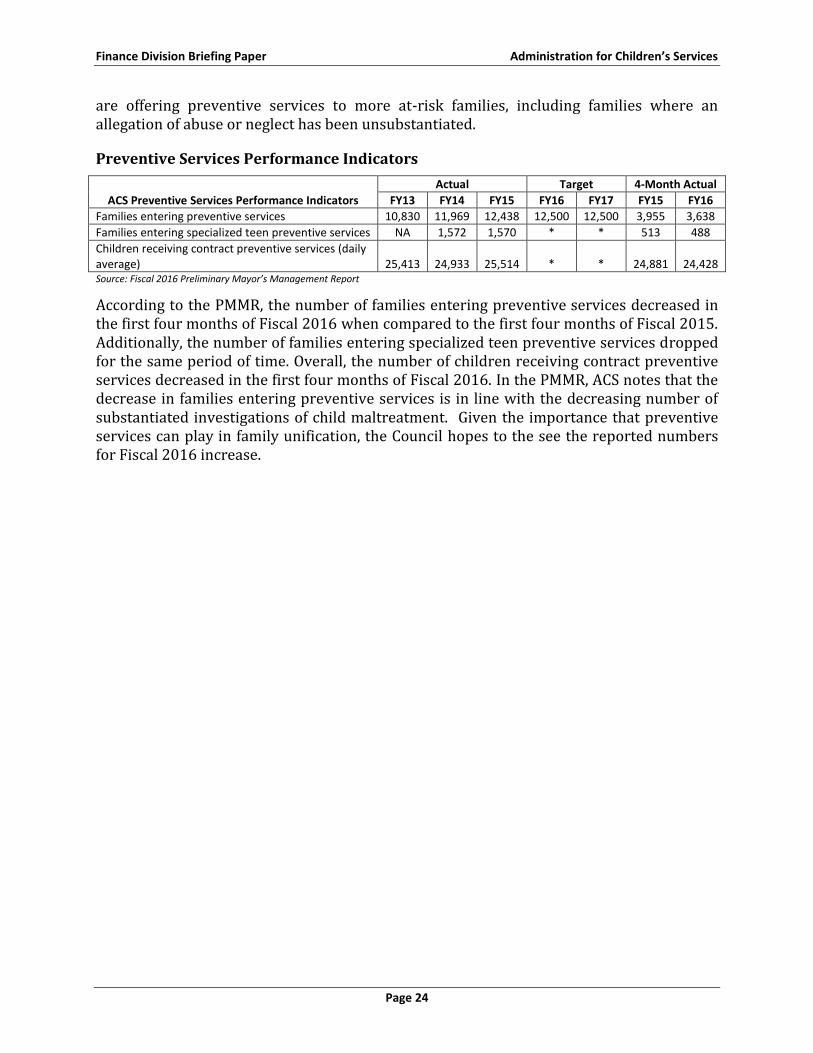
Families entering preventive services 10,830 11,969 12,438 12,500 12,500 3,955 3,638
Families entering specialized teen preventive services NA 1,572 1,570 * * 513 488
Children receiving contract preventive services (daily average) 25,413 24,933 25,514 * * 24,881 24,428 Source: Fiscal 2016 Preliminary Mayor’s Management Report
According to the PMMR, the number of families entering preventive services decreased in the first four months of Fiscal 2016 when compared to the first four months of Fiscal 2015. Additionally, the number of families entering specialized teen preventive services dropped for the same period of time. Overall, the number of children receiving contract preventive services decreased in the first four months of Fiscal 2016. In the PMMR, ACS notes that the decrease in families entering preventive services is in line with the decreasing number of substantiated investigations of child maltreatment. Given the importance that preventive services can play in family unification, the Council hopes to the see the reported numbers for Fiscal 2016 increase.
Finance Division Briefing Paper Administration for Children’s Services
Page 25
Protective Services
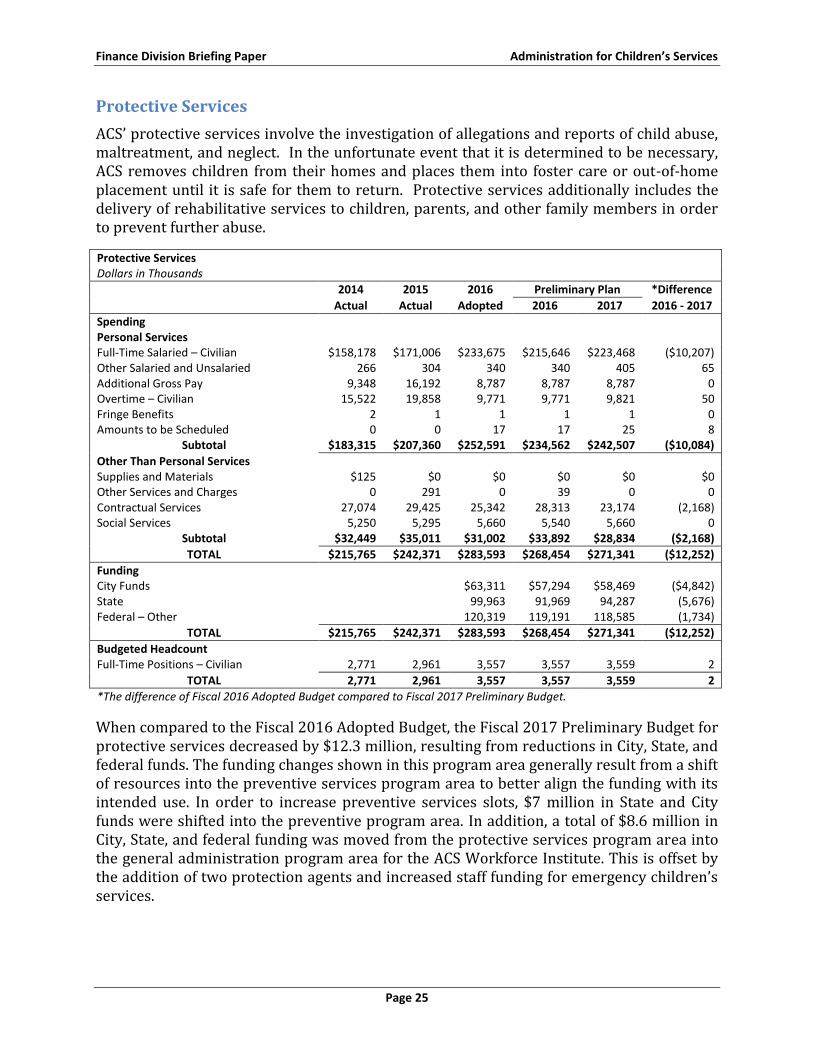
ACS’ protective services involve the investigation of allegations and reports of child abuse, maltreatment, and neglect. In the unfortunate event that it is determined to be necessary, ACS removes children from their homes and places them into foster care or out-of-home placement until it is safe for them to return. Protective services additionally includes the delivery of rehabilitative services to children, parents, and other family members in order to prevent further abuse.
Protective Services Dollars in Thousands
2014 2015 2016 Preliminary Plan *Difference
Actual Actual Adopted 2016 2017 2016 - 2017
Spending
Personal Services
Full-Time Salaried – Civilian $158,178 $171,006 $233,675 $215,646 $223,468 ($10,207) Other Salaried and Unsalaried 266 304 340 340 405 65 Additional Gross Pay 9,348 16,192 8,787 8,787 8,787 0 Overtime – Civilian 15,522 19,858 9,771 9,771 9,821 50 Fringe Benefits 2 1 1 1 1 0 Amounts to be Scheduled 0 0 17 17 25 8
Subtotal $183,315 $207,360 $252,591 $234,562 $242,507 ($10,084)
Other Than Personal Services
Supplies and Materials $125 $0 $0 $0 $0 $0 Other Services and Charges 0 291 0 39 0 0 Contractual Services 27,074 29,425 25,342 28,313 23,174 (2,168) Social Services 5,250 5,295 5,660 5,540 5,660 0
Subtotal $32,449 $35,011 $31,002 $33,892 $28,834 ($2,168)
TOTAL $215,765 $242,371 $283,593 $268,454 $271,341 ($12,252)
Funding
City Funds
$63,311 $57,294 $58,469 ($4,842)
State
99,963 91,969 94,287 (5,676) Federal – Other
120,319 119,191 118,585 (1,734)
TOTAL $215,765 $242,371 $283,593 $268,454 $271,341 ($12,252)
Budgeted Headcount
Full-Time Positions – Civilian 2,771 2,961 3,557 3,557 3,559 2
TOTAL 2,771 2,961 3,557 3,557 3,559 2
*The difference of Fiscal 2016 Adopted Budget compared to Fiscal 2017 Preliminary Budget.
When compared to the Fiscal 2016 Adopted Budget, the Fiscal 2017 Preliminary Budget for protective services decreased by $12.3 million, resulting from reductions in City, State, and federal funds. The funding changes shown in this program area generally result from a shift of resources into the preventive services program area to better align the funding with its intended use. In order to increase preventive services slots, $7 million in State and City funds were shifted into the preventive program area. In addition, a total of $8.6 million in City, State, and federal funding was moved from the protective services program area into the general administration program area for the ACS Workforce Institute. This is offset by the addition of two protection agents and increased staff funding for emergency children’s services.
Finance Division Briefing Paper Administration for Children’s Services
Page 26
Protective Services Performance Measures
ACS Protective Services Performance Indicators
Actual Target 4-Month Actual
FY13 FY14 FY15 FY16 FY17 FY15 FY16
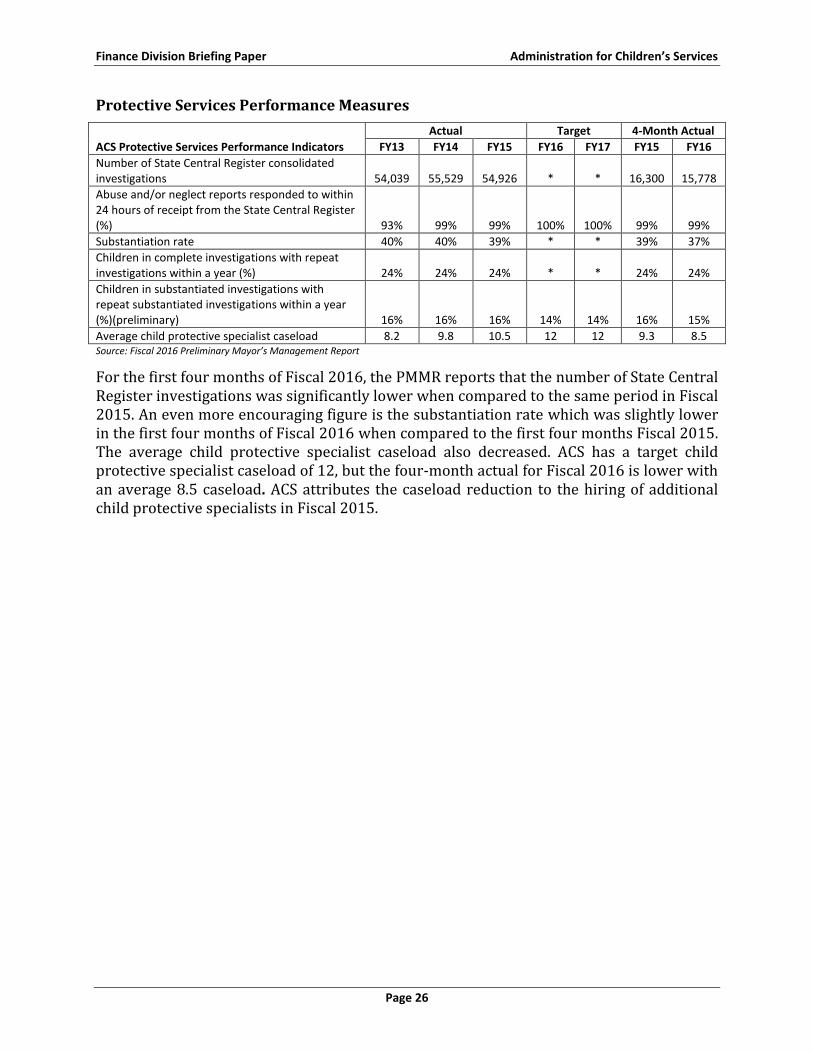
Number of State Central Register consolidated investigations 54,039 55,529 54,926 * * 16,300 15,778
Abuse and/or neglect reports responded to within 24 hours of receipt from the State Central Register (%) 93% 99% 99% 100% 100% 99% 99%
Substantiation rate 40% 40% 39% * * 39% 37%
Children in complete investigations with repeat investigations within a year (%) 24% 24% 24% * * 24% 24%
Children in substantiated investigations with repeat substantiated investigations within a year (%)(preliminary) 16% 16% 16% 14% 14% 16% 15%
Average child protective specialist caseload 8.2 9.8 10.5 12 12 9.3 8.5 Source: Fiscal 2016 Preliminary Mayor’s Management Report
For the first four months of Fiscal 2016, the PMMR reports that the number of State Central Register investigations was significantly lower when compared to the same period in Fiscal 2015. An even more encouraging figure is the substantiation rate which was slightly lower in the first four months of Fiscal 2016 when compared to the first four months Fiscal 2015. The average child protective specialist caseload also decreased. ACS has a target child protective specialist caseload of 12, but the four-month actual for Fiscal 2016 is lower with an average 8.5 caseload. ACS attributes the caseload reduction to the hiring of additional child protective specialists in Fiscal 2015.
Finance Division Briefing Paper Administration for Children’s Services
Page 27
General Administration
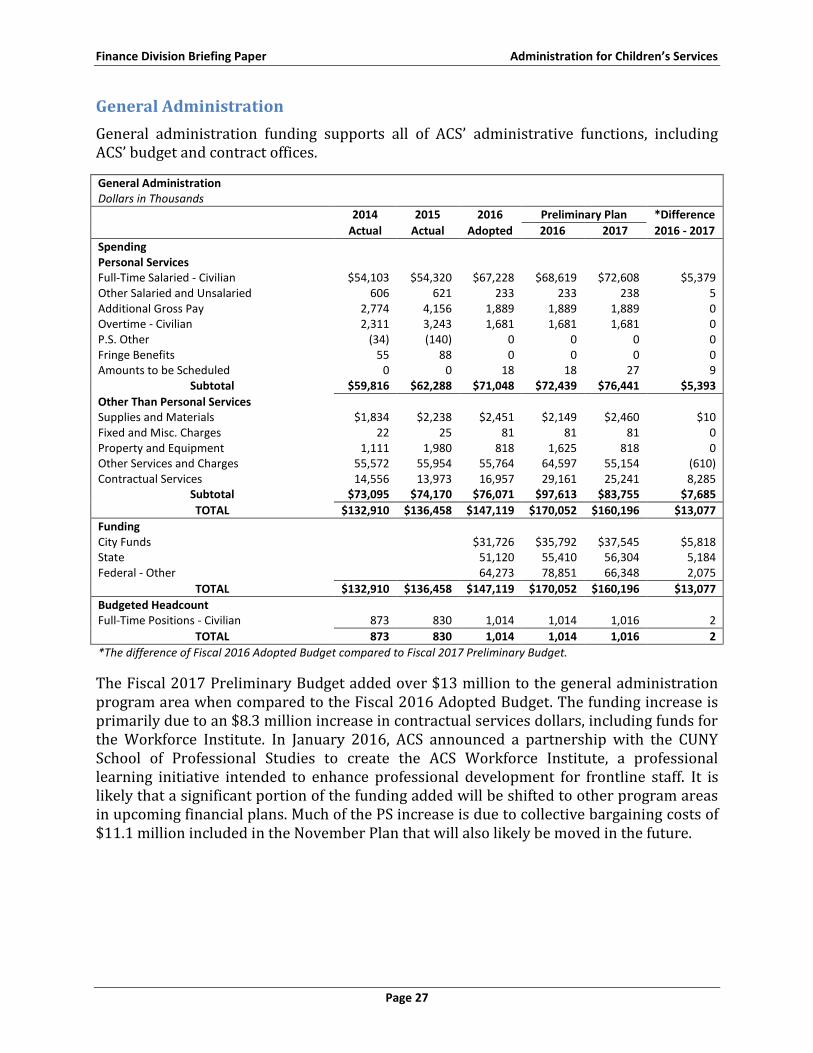
General administration funding supports all of ACS’ administrative functions, including ACS’ budget and contract offices.
General Administration Dollars in Thousands
2014 2015 2016 Preliminary Plan *Difference
Actual Actual Adopted 2016 2017 2016 - 2017
Spending
Personal Services
Full-Time Salaried - Civilian $54,103 $54,320 $67,228 $68,619 $72,608 $5,379 Other Salaried and Unsalaried 606 621 233 233 238 5 Additional Gross Pay 2,774 4,156 1,889 1,889 1,889 0 Overtime - Civilian 2,311 3,243 1,681 1,681 1,681 0 P.S. Other (34) (140) 0 0 0 0 Fringe Benefits 55 88 0 0 0 0 Amounts to be Scheduled 0 0 18 18 27 9
Subtotal $59,816 $62,288 $71,048 $72,439 $76,441 $5,393
Other Than Personal Services
Supplies and Materials $1,834 $2,238 $2,451 $2,149 $2,460 $10 Fixed and Misc. Charges 22 25 81 81 81 0 Property and Equipment 1,111 1,980 818 1,625 818 0 Other Services and Charges 55,572 55,954 55,764 64,597 55,154 (610) Contractual Services 14,556 13,973 16,957 29,161 25,241 8,285
Subtotal $73,095 $74,170 $76,071 $97,613 $83,755 $7,685
TOTAL $132,910 $136,458 $147,119 $170,052 $160,196 $13,077
Funding
City Funds
$31,726 $35,792 $37,545 $5,818
State
51,120 55,410 56,304 5,184 Federal - Other
64,273 78,851 66,348 2,075
TOTAL $132,910 $136,458 $147,119 $170,052 $160,196 $13,077
Budgeted Headcount
Full-Time Positions - Civilian 873 830 1,014 1,014 1,016 2
TOTAL 873 830 1,014 1,014 1,016 2
*The difference of Fiscal 2016 Adopted Budget compared to Fiscal 2017 Preliminary Budget.
The Fiscal 2017 Preliminary Budget added over $13 million to the general administration program area when compared to the Fiscal 2016 Adopted Budget. The funding increase is primarily due to an $8.3 million increase in contractual services dollars, including funds for the Workforce Institute. In January 2016, ACS announced a partnership with the CUNY School of Professional Studies to create the ACS Workforce Institute, a professional learning initiative intended to enhance professional development for frontline staff. It is likely that a significant portion of the funding added will be shifted to other program areas in upcoming financial plans. Much of the PS increase is due to collective bargaining costs of $11.1 million included in the November Plan that will also likely be moved in the future.
Finance Division Briefing Paper Administration for Children’s Services
Page 28
Juvenile Justice Program Areas
In 2010, the Department of Juvenile Justice merged into ACS with the goal of servicing overlapping youth populations more efficiently. DYFJ manages and provides services to justice-involved youth and their families throughout the juvenile justice system. ACS’ budget includes five program areas related to juvenile justice.
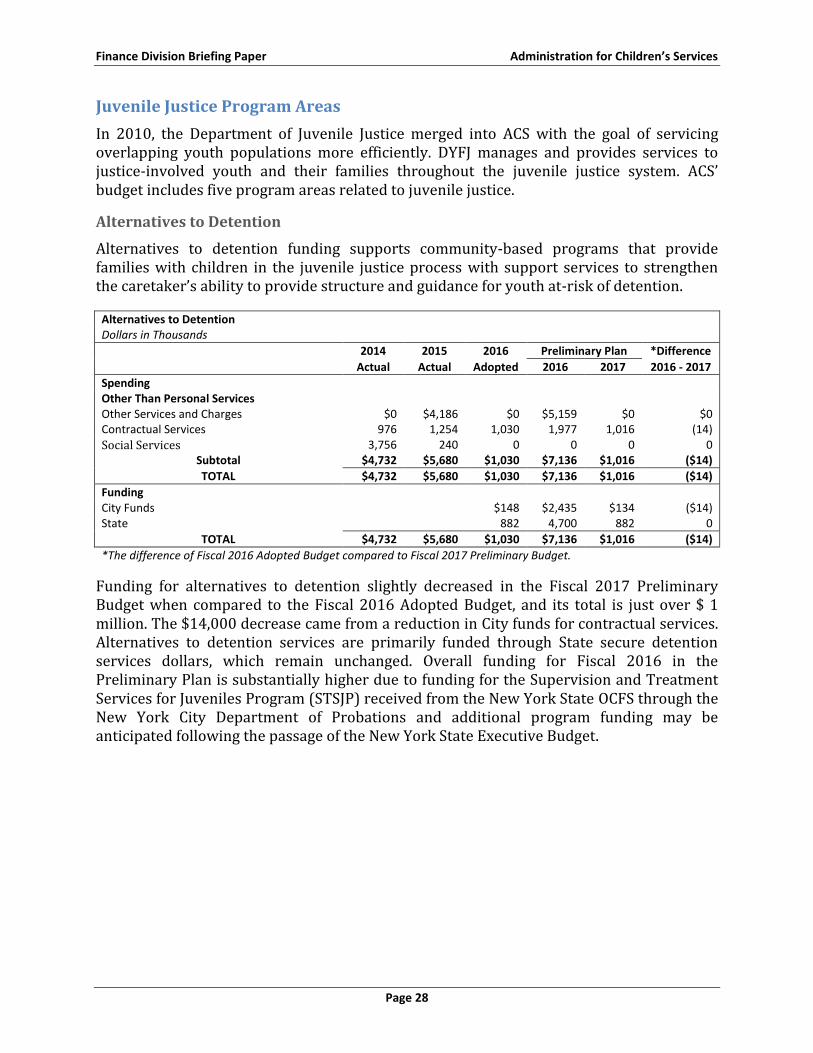
Alternatives to Detention
Alternatives to detention funding supports community-based programs that provide families with children in the juvenile justice process with support services to strengthen the caretaker’s ability to provide structure and guidance for youth at-risk of detention.
Alternatives to Detention Dollars in Thousands
2014 2015 2016 Preliminary Plan *Difference
Actual Actual Adopted 2016 2017 2016 - 2017
Spending
Other Than Personal Services
Other Services and Charges $0 $4,186 $0 $5,159 $0 $0 Contractual Services 976 1,254 1,030 1,977 1,016 (14)
Social Services 3,756 240 0 0 0 0 Subtotal $4,732 $5,680 $1,030 $7,136 $1,016 ($14)
TOTAL $4,732 $5,680 $1,030 $7,136 $1,016 ($14)
Funding
City Funds
$148 $2,435 $134 ($14)
State
882 4,700 882 0
TOTAL $4,732 $5,680 $1,030 $7,136 $1,016 ($14)
*The difference of Fiscal 2016 Adopted Budget compared to Fiscal 2017 Preliminary Budget.
Funding for alternatives to detention slightly decreased in the Fiscal 2017 Preliminary Budget when compared to the Fiscal 2016 Adopted Budget, and its total is just over $ 1 million. The $14,000 decrease came from a reduction in City funds for contractual services. Alternatives to detention services are primarily funded through State secure detention services dollars, which remain unchanged. Overall funding for Fiscal 2016 in the Preliminary Plan is substantially higher due to funding for the Supervision and Treatment Services for Juveniles Program (STSJP) received from the New York State OCFS through the New York City Department of Probations and additional program funding may be anticipated following the passage of the New York State Executive Budget.
Finance Division Briefing Paper Administration for Children’s Services
Page 29
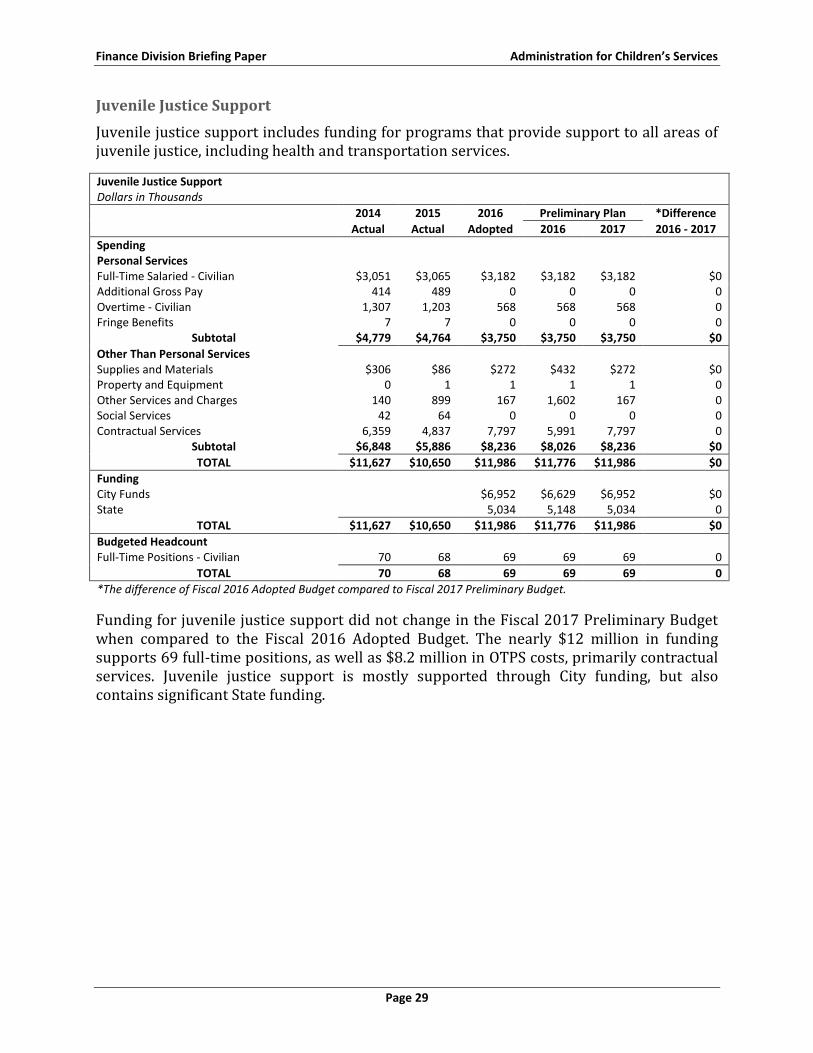
Juvenile Justice Support
Juvenile justice support includes funding for programs that provide support to all areas of juvenile justice, including health and transportation services.
Juvenile Justice Support Dollars in Thousands
2014 2015 2016 Preliminary Plan *Difference
Actual Actual Adopted 2016 2017 2016 - 2017
Spending
Personal Services
Full-Time Salaried - Civilian $3,051 $3,065 $3,182 $3,182 $3,182 $0 Additional Gross Pay 414 489 0 0 0 0 Overtime - Civilian 1,307 1,203 568 568 568 0 Fringe Benefits 7 7 0 0 0 0
Subtotal $4,779 $4,764 $3,750 $3,750 $3,750 $0
Other Than Personal Services
Supplies and Materials $306 $86 $272 $432 $272 $0 Property and Equipment 0 1 1 1 1 0 Other Services and Charges 140 899 167 1,602 167 0 Social Services 42 64 0 0 0 0 Contractual Services 6,359 4,837 7,797 5,991 7,797 0
Subtotal $6,848 $5,886 $8,236 $8,026 $8,236 $0
TOTAL $11,627 $10,650 $11,986 $11,776 $11,986 $0
Funding
City Funds
$6,952 $6,629 $6,952 $0
State
5,034 5,148 5,034 0
TOTAL $11,627 $10,650 $11,986 $11,776 $11,986 $0
Budgeted Headcount
Full-Time Positions - Civilian 70 68 69 69 69 0
TOTAL 70 68 69 69 69 0
*The difference of Fiscal 2016 Adopted Budget compared to Fiscal 2017 Preliminary Budget.
Funding for juvenile justice support did not change in the Fiscal 2017 Preliminary Budget when compared to the Fiscal 2016 Adopted Budget. The nearly $12 million in funding supports 69 full-time positions, as well as $8.2 million in OTPS costs, primarily contractual services. Juvenile justice support is mostly supported through City funding, but also contains significant State funding.
Finance Division Briefing Paper Administration for Children’s Services
Page 30
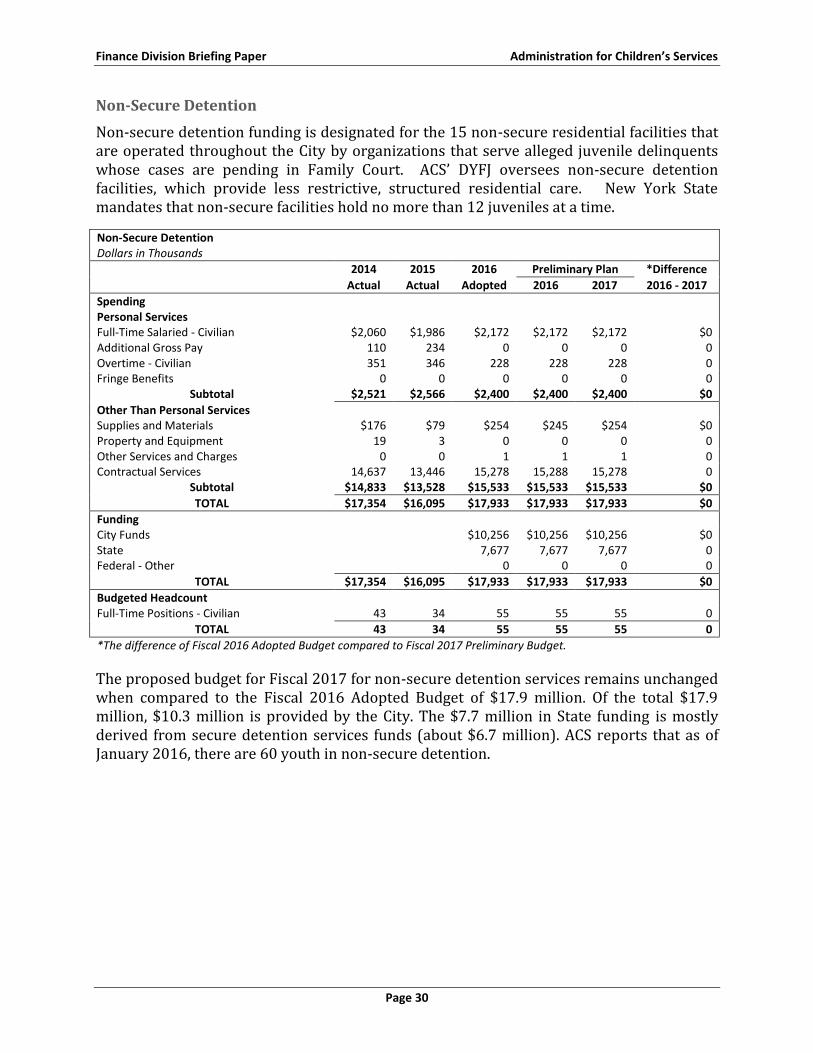
Non-Secure Detention
Non-secure detention funding is designated for the 15 non-secure residential facilities that are operated throughout the City by organizations that serve alleged juvenile delinquents whose cases are pending in Family Court. ACS’ DYFJ oversees non-secure detention facilities, which provide less restrictive, structured residential care. New York State mandates that non-secure facilities hold no more than 12 juveniles at a time.
Non-Secure Detention Dollars in Thousands
2014 2015 2016 Preliminary Plan *Difference
Actual Actual Adopted 2016 2017 2016 - 2017
Spending
Personal Services
Full-Time Salaried - Civilian $2,060 $1,986 $2,172 $2,172 $2,172 $0 Additional Gross Pay 110 234 0 0 0 0 Overtime - Civilian 351 346 228 228 228 0 Fringe Benefits 0 0 0 0 0 0
Subtotal $2,521 $2,566 $2,400 $2,400 $2,400 $0
Other Than Personal Services
Supplies and Materials $176 $79 $254 $245 $254 $0 Property and Equipment 19 3 0 0 0 0 Other Services and Charges 0 0 1 1 1 0 Contractual Services 14,637 13,446 15,278 15,288 15,278 0
Subtotal $14,833 $13,528 $15,533 $15,533 $15,533 $0
TOTAL $17,354 $16,095 $17,933 $17,933 $17,933 $0
Funding
City Funds
$10,256 $10,256 $10,256 $0
State
7,677 7,677 7,677 0 Federal - Other
0 0 0 0
TOTAL $17,354 $16,095 $17,933 $17,933 $17,933 $0
Budgeted Headcount
Full-Time Positions - Civilian 43 34 55 55 55 0
TOTAL 43 34 55 55 55 0
*The difference of Fiscal 2016 Adopted Budget compared to Fiscal 2017 Preliminary Budget.
The proposed budget for Fiscal 2017 for non-secure detention services remains unchanged when compared to the Fiscal 2016 Adopted Budget of $17.9 million. Of the total $17.9 million, $10.3 million is provided by the City. The $7.7 million in State funding is mostly derived from secure detention services funds (about $6.7 million). ACS reports that as of January 2016, there are 60 youth in non-secure detention.
Finance Division Briefing Paper Administration for Children’s Services
Page 31
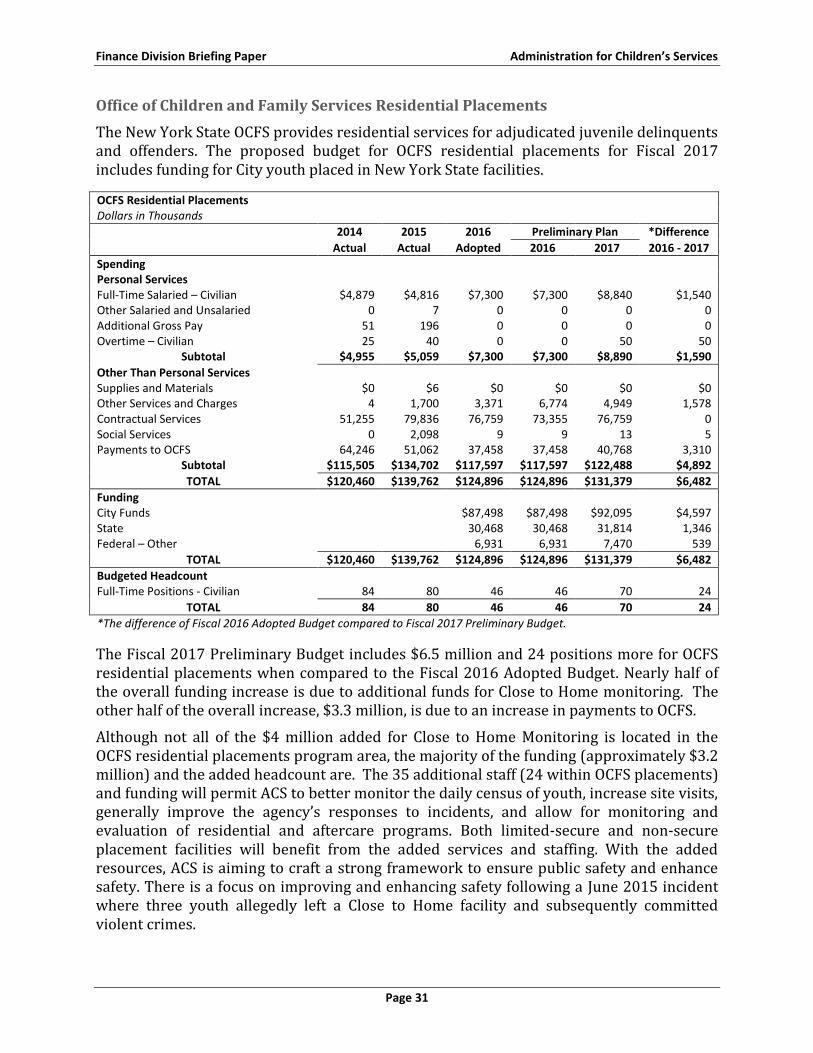
Office of Children and Family Services Residential Placements
The New York State OCFS provides residential services for adjudicated juvenile delinquents and offenders. The proposed budget for OCFS residential placements for Fiscal 2017 includes funding for City youth placed in New York State facilities.
OCFS Residential Placements Dollars in Thousands
2014 2015 2016 Preliminary Plan *Difference
Actual Actual Adopted 2016 2017 2016 - 2017
Spending
Personal Services
Full-Time Salaried – Civilian $4,879 $4,816 $7,300 $7,300 $8,840 $1,540 Other Salaried and Unsalaried 0 7 0 0 0 0 Additional Gross Pay 51 196 0 0 0 0 Overtime – Civilian 25 40 0 0 50 50
Subtotal $4,955 $5,059 $7,300 $7,300 $8,890 $1,590
Other Than Personal Services
Supplies and Materials $0 $6 $0 $0 $0 $0 Other Services and Charges 4 1,700 3,371 6,774 4,949 1,578 Contractual Services 51,255 79,836 76,759 73,355 76,759 0 Social Services 0 2,098 9 9 13 5 Payments to OCFS 64,246 51,062 37,458 37,458 40,768 3,310
Subtotal $115,505 $134,702 $117,597 $117,597 $122,488 $4,892
TOTAL $120,460 $139,762 $124,896 $124,896 $131,379 $6,482
Funding
City Funds
$87,498 $87,498 $92,095 $4,597
State
30,468 30,468 31,814 1,346 Federal – Other
6,931 6,931 7,470 539
TOTAL $120,460 $139,762 $124,896 $124,896 $131,379 $6,482
Budgeted Headcount
Full-Time Positions - Civilian 84 80 46 46 70 24
TOTAL 84 80 46 46 70 24
*The difference of Fiscal 2016 Adopted Budget compared to Fiscal 2017 Preliminary Budget.
The Fiscal 2017 Preliminary Budget includes $6.5 million and 24 positions more for OCFS residential placements when compared to the Fiscal 2016 Adopted Budget. Nearly half of the overall funding increase is due to additional funds for Close to Home monitoring. The other half of the overall increase, $3.3 million, is due to an increase in payments to OCFS.
Although not all of the $4 million added for Close to Home Monitoring is located in the OCFS residential placements program area, the majority of the funding (approximately $3.2 million) and the added headcount are. The 35 additional staff (24 within OCFS placements) and funding will permit ACS to better monitor the daily census of youth, increase site visits, generally improve the agency’s responses to incidents, and allow for monitoring and evaluation of residential and aftercare programs. Both limited-secure and non-secure placement facilities will benefit from the added services and staffing. With the added resources, ACS is aiming to craft a strong framework to ensure public safety and enhance safety. There is a focus on improving and enhancing safety following a June 2015 incident where three youth allegedly left a Close to Home facility and subsequently committed violent crimes.
Finance Division Briefing Paper Administration for Children’s Services
Page 32
Secure Detention
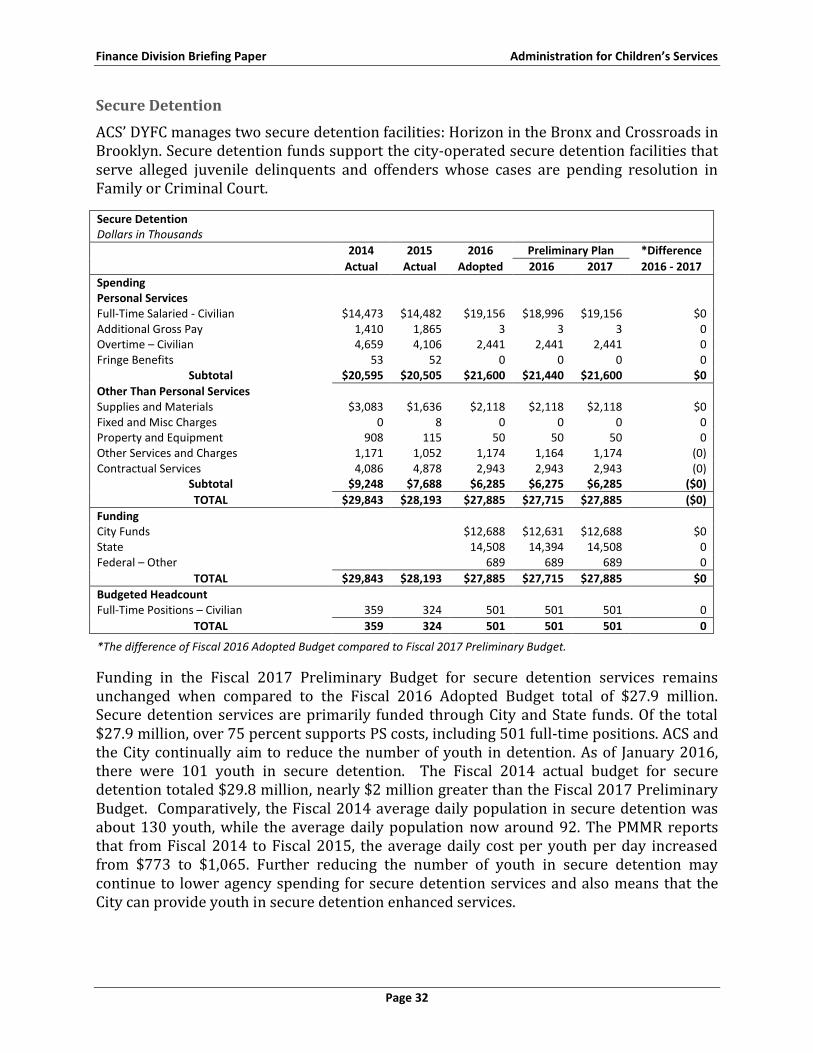
ACS’ DYFC manages two secure detention facilities: Horizon in the Bronx and Crossroads in Brooklyn. Secure detention funds support the city-operated secure detention facilities that serve alleged juvenile delinquents and offenders whose cases are pending resolution in Family or Criminal Court.
Secure Detention Dollars in Thousands
2014 2015 2016 Preliminary Plan *Difference
Actual Actual Adopted 2016 2017 2016 - 2017
Spending
Personal Services
Full-Time Salaried - Civilian $14,473 $14,482 $19,156 $18,996 $19,156 $0 Additional Gross Pay 1,410 1,865 3 3 3 0 Overtime – Civilian 4,659 4,106 2,441 2,441 2,441 0 Fringe Benefits 53 52 0 0 0 0
Subtotal $20,595 $20,505 $21,600 $21,440 $21,600 $0
Other Than Personal Services
Supplies and Materials $3,083 $1,636 $2,118 $2,118 $2,118 $0 Fixed and Misc Charges 0 8 0 0 0 0 Property and Equipment 908 115 50 50 50 0 Other Services and Charges 1,171 1,052 1,174 1,164 1,174 (0) Contractual Services 4,086 4,878 2,943 2,943 2,943 (0)
Subtotal $9,248 $7,688 $6,285 $6,275 $6,285 ($0)
TOTAL $29,843 $28,193 $27,885 $27,715 $27,885 ($0)
Funding
City Funds
$12,688 $12,631 $12,688 $0
State
14,508 14,394 14,508 0 Federal – Other
689 689 689 0
TOTAL $29,843 $28,193 $27,885 $27,715 $27,885 $0
Budgeted Headcount
Full-Time Positions – Civilian 359 324 501 501 501 0
TOTAL 359 324 501 501 501 0
*The difference of Fiscal 2016 Adopted Budget compared to Fiscal 2017 Preliminary Budget.
Funding in the Fiscal 2017 Preliminary Budget for secure detention services remains unchanged when compared to the Fiscal 2016 Adopted Budget total of $27.9 million. Secure detention services are primarily funded through City and State funds. Of the total $27.9 million, over 75 percent supports PS costs, including 501 full-time positions. ACS and the City continually aim to reduce the number of youth in detention. As of January 2016, there were 101 youth in secure detention. The Fiscal 2014 actual budget for secure detention totaled $29.8 million, nearly $2 million greater than the Fiscal 2017 Preliminary Budget. Comparatively, the Fiscal 2014 average daily population in secure detention was about 130 youth, while the average daily population now around 92. The PMMR reports that from Fiscal 2014 to Fiscal 2015, the average daily cost per youth per day increased from $773 to $1,065. Further reducing the number of youth in secure detention may continue to lower agency spending for secure detention services and also means that the City can provide youth in secure detention enhanced services.
Finance Division Briefing Paper Administration for Children’s Services
Page 33
Juvenile Justice Performance Measures
ACS Juvenile Justice Detention Performance Indicators
Actual Target 4-Month Actual
FY13 FY14 FY15 FY16 FY17 FY15 FY16
Total admissions to detention 3,419 3,126 2,755 * * 958 884
Youth admitted to detention with previous admission(s) to detention (%) 60.50% 60.90% 63.30% * * NA NA
Average daily population (ADP), detention 266 234.1 169.9 * * 181.2 157.9
Secure detention – ADP 150.1 130.2 94.7 * * 98.9 92.6
Non-secure detention – ADP 115.9 103.5 74.4 * * 81.8 65.3
Average length of stay, detention (days) 29 29 23 * * 24 20
Escapes from secure detention 0 0 0 0 0 0 0
Abscond rate in non-secure detention (average per 100 total ADP in non-secure) 0.05 0.08 0.05 0.03 0.03 0.01 0.02
Youth on youth assaults and altercations with injury rate (per 100 total ADP), detention 0.34 0.35 0.35 0.35 0.35 0.32 0.38
Youth on staff assault w/injury rate (per 100 total ADP), detention 0.06 0.05 0.05 0.04 0.04 0.08 0.07
Weapon recovery rate (average per 100 total ADP), detention 0.02 0.04 0.08 * * 0.04 0.03
Illegal substance/prescription or OTC medication recovery rate (average per 100 total ADP), detention 0.04 0.07 0.09 * * 0.05 0.05
Child abuse and/or neglect allegation rate (internal) (average per 100 total ADP), detention 0.11 0.1 0.1 0.09 0.09 0.11 0.08
Child abuse/neglect allegations cases (internal) reported as substantiated, detention 17 22 20 * * 4 1
In-care youth who were referred for mental health services, detention (%) 51% 48% 61% * * 50% 54%
General health care cost per youth per day, detention ($) $60 $62 $80 * * NA NA
Average daily cost per youth per day, detention ($) $729 $773 $1,065 * * NA NA Source: Fiscal 2016 Preliminary Mayor’s Management Report
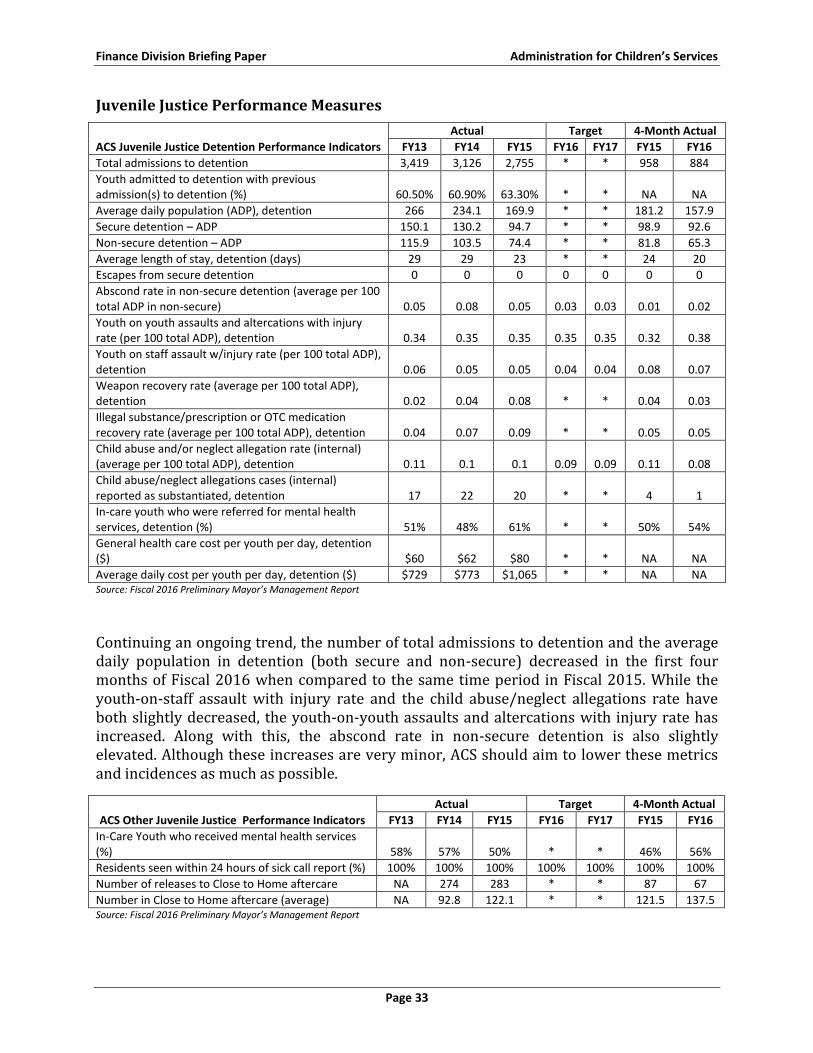
Continuing an ongoing trend, the number of total admissions to detention and the average daily population in detention (both secure and non-secure) decreased in the first four months of Fiscal 2016 when compared to the same time period in Fiscal 2015. While the youth-on-staff assault with injury rate and the child abuse/neglect allegations rate have both slightly decreased, the youth-on-youth assaults and altercations with injury rate has increased. Along with this, the abscond rate in non-secure detention is also slightly elevated. Although these increases are very minor, ACS should aim to lower these metrics and incidences as much as possible.
ACS Other Juvenile Justice Performance Indicators
Actual Target 4-Month Actual
FY13 FY14 FY15 FY16 FY17 FY15 FY16
In-Care Youth who received mental health services (%) 58% 57% 50% * * 46% 56%
Residents seen within 24 hours of sick call report (%) 100% 100% 100% 100% 100% 100% 100%
Number of releases to Close to Home aftercare NA 274 283 * * 87 67
Number in Close to Home aftercare (average) NA 92.8 122.1 * * 121.5 137.5 Source: Fiscal 2016 Preliminary Mayor’s Management Report
Finance Division Briefing Paper Administration for Children’s Services
Page 34
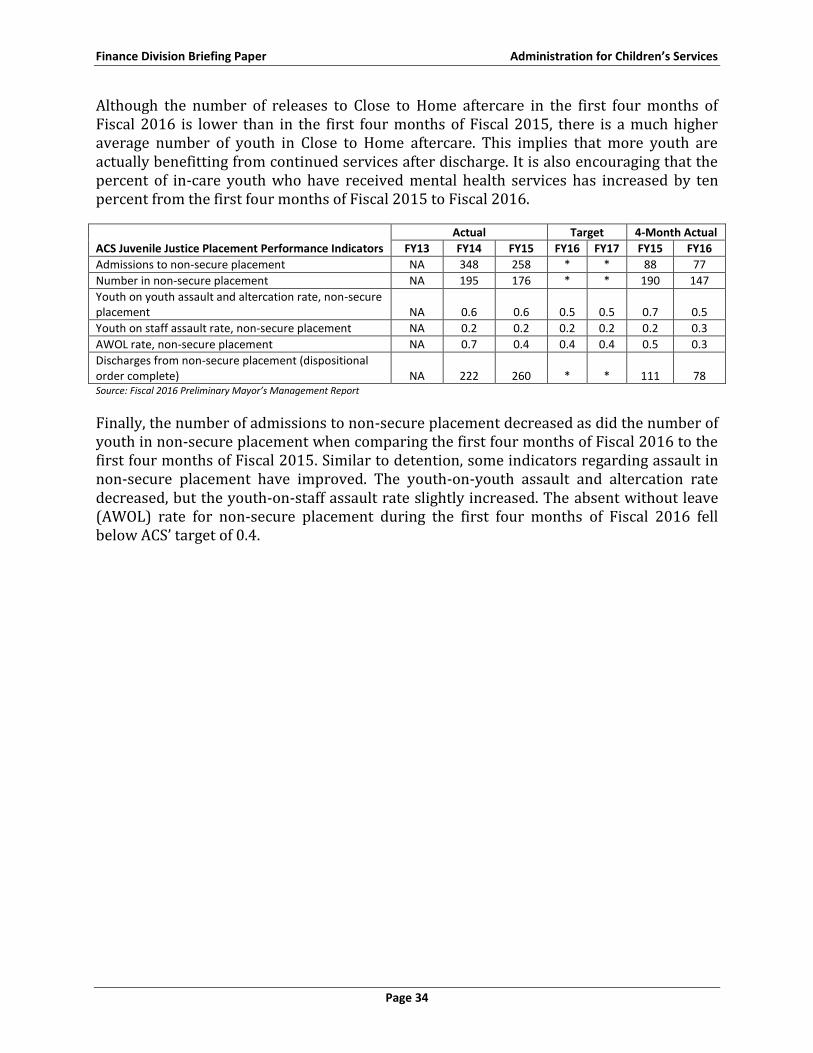
Although the number of releases to Close to Home aftercare in the first four months of Fiscal 2016 is lower than in the first four months of Fiscal 2015, there is a much higher average number of youth in Close to Home aftercare. This implies that more youth are actually benefitting from continued services after discharge. It is also encouraging that the percent of in-care youth who have received mental health services has increased by ten percent from the first four months of Fiscal 2015 to Fiscal 2016.
ACS Juvenile Justice Placement Performance Indicators
Actual Target 4-Month Actual
FY13 FY14 FY15 FY16 FY17 FY15 FY16
Admissions to non-secure placement NA 348 258 * * 88 77
Number in non-secure placement NA 195 176 * * 190 147
Youth on youth assault and altercation rate, non-secure placement NA 0.6 0.6 0.5 0.5 0.7 0.5
Youth on staff assault rate, non-secure placement NA 0.2 0.2 0.2 0.2 0.2 0.3
AWOL rate, non-secure placement NA 0.7 0.4 0.4 0.4 0.5 0.3
Discharges from non-secure placement (dispositional order complete) NA 222 260 * * 111 78 Source: Fiscal 2016 Preliminary Mayor’s Management Report
Finally, the number of admissions to non-secure placement decreased as did the number of youth in non-secure placement when comparing the first four months of Fiscal 2016 to the first four months of Fiscal 2015. Similar to detention, some indicators regarding assault in non-secure placement have improved. The youth-on-youth assault and altercation rate decreased, but the youth-on-staff assault rate slightly increased. The absent without leave (AWOL) rate for non-secure placement during the first four months of Fiscal 2016 fell below ACS’ target of 0.4.
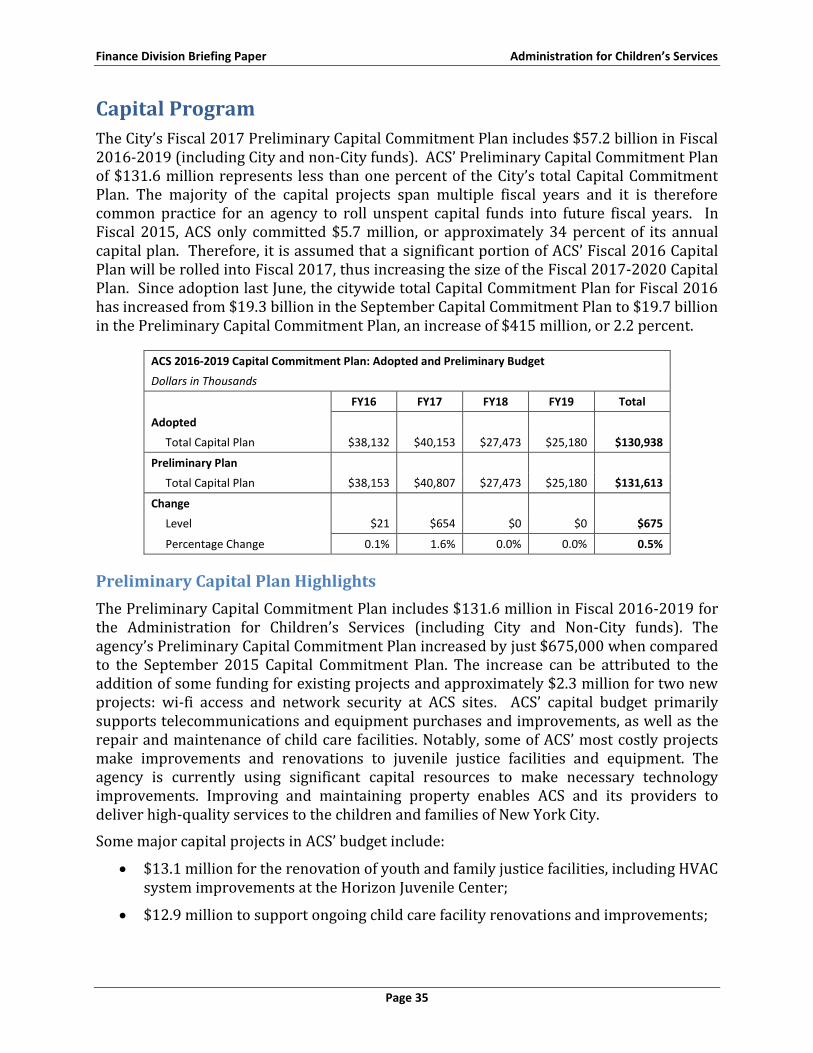
Finance Division Briefing Paper Administration for Children’s Services
Page 35
Capital Program
The City’s Fiscal 2017 Preliminary Capital Commitment Plan includes $57.2 billion in Fiscal 2016-2019 (including City and non-City funds). ACS’ Preliminary Capital Commitment Plan of $131.6 million represents less than one percent of the City’s total Capital Commitment Plan. The majority of the capital projects span multiple fiscal years and it is therefore common practice for an agency to roll unspent capital funds into future fiscal years. In Fiscal 2015, ACS only committed $5.7 million, or approximately 34 percent of its annual capital plan. Therefore, it is assumed that a significant portion of ACS’ Fiscal 2016 Capital Plan will be rolled into Fiscal 2017, thus increasing the size of the Fiscal 2017-2020 Capital Plan. Since adoption last June, the citywide total Capital Commitment Plan for Fiscal 2016 has increased from $19.3 billion in the September Capital Commitment Plan to $19.7 billion in the Preliminary Capital Commitment Plan, an increase of $415 million, or 2.2 percent.
ACS 2016-2019 Capital Commitment Plan: Adopted and Preliminary Budget
Dollars in Thousands
FY16 FY17 FY18 FY19 Total
Adopted
Total Capital Plan $38,132 $40,153 $27,473 $25,180 $130,938
Preliminary Plan
Total Capital Plan $38,153 $40,807 $27,473 $25,180 $131,613
Change
Level $21 $654 $0 $0 $675
Percentage Change 0.1% 1.6% 0.0% 0.0% 0.5%
Preliminary Capital Plan Highlights
The Preliminary Capital Commitment Plan includes $131.6 million in Fiscal 2016-2019 for the Administration for Children’s Services (including City and Non-City funds). The agency’s Preliminary Capital Commitment Plan increased by just $675,000 when compared to the September 2015 Capital Commitment Plan. The increase can be attributed to the addition of some funding for existing projects and approximately $2.3 million for two new projects: wi-fi access and network security at ACS sites. ACS’ capital budget primarily supports telecommunications and equipment purchases and improvements, as well as the repair and maintenance of child care facilities. Notably, some of ACS’ most costly projects make improvements and renovations to juvenile justice facilities and equipment. The agency is currently using significant capital resources to make necessary technology improvements. Improving and maintaining property enables ACS and its providers to deliver high-quality services to the children and families of New York City.
Some major capital projects in ACS’ budget include:
$13.1 million for the renovation of youth and family justice facilities, including HVAC system improvements at the Horizon Juvenile Center;
$12.9 million to support ongoing child care facility renovations and improvements;
Finance Division Briefing Paper Administration for Children’s Services
Page 36
$12.4 million for broad, long term improvements and renovations at the Crossroads Juvenile Center;
$7.5 million to purchase and replace computers that are older than five years;
$5.3 million to support the transition from copper wire communication services to Voice Over Internet Protocol (VOIP); and
$4.5 million for improvements to the Children’s Center High Needs Unit, including the enlargement of nursey and toddler rooms, reconstruction of dorms, and improvement to the nursing medical suite.
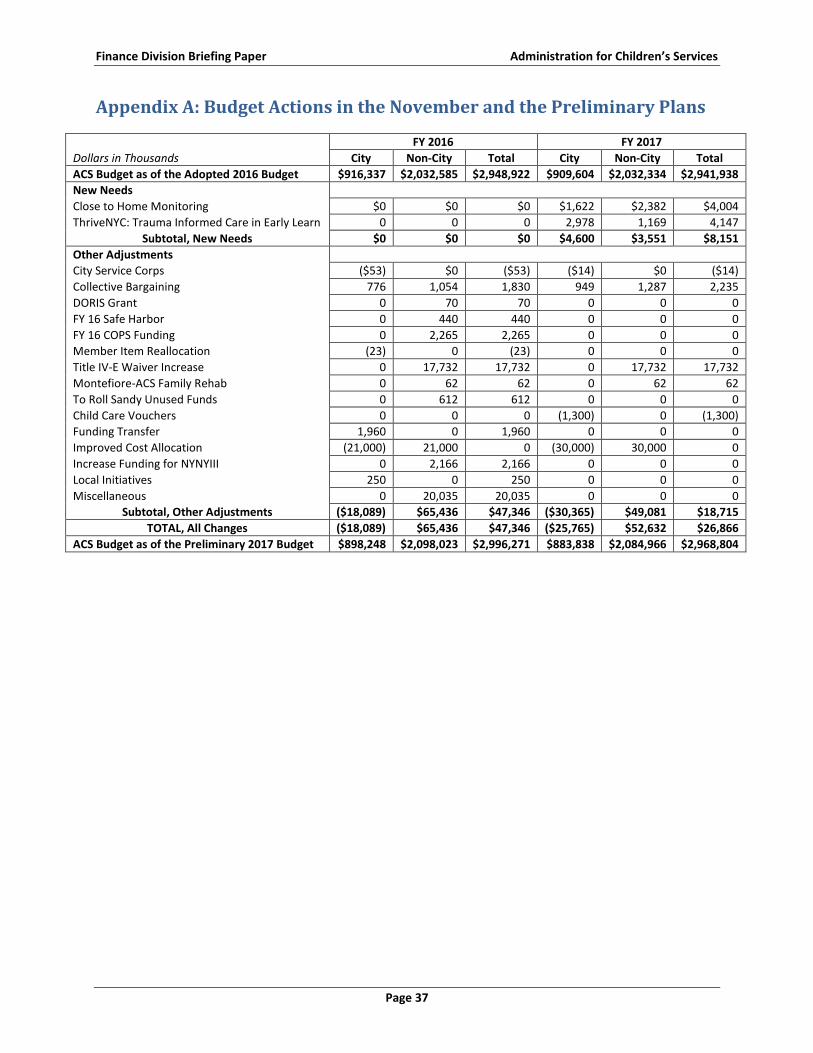
Finance Division Briefing Paper Administration for Children’s Services
Page 37
Appendix A: Budget Actions in the November and the Preliminary Plans
Dollars in Thousands
FY 2016 FY 2017
City Non-City Total City Non-City Total
ACS Budget as of the Adopted 2016 Budget $916,337 $2,032,585 $2,948,922 $909,604 $2,032,334 $2,941,938
New Needs
Close to Home Monitoring $0 $0 $0 $1,622 $2,382 $4,004
ThriveNYC: Trauma Informed Care in Early Learn 0 0 0 2,978 1,169 4,147
Subtotal, New Needs $0 $0 $0 $4,600 $3,551 $8,151
Other Adjustments
City Service Corps ($53) $0 ($53) ($14) $0 ($14)
Collective Bargaining 776 1,054 1,830 949 1,287 2,235
DORIS Grant 0 70 70 0 0 0
FY 16 Safe Harbor 0 440 440 0 0 0
FY 16 COPS Funding 0 2,265 2,265 0 0 0
Member Item Reallocation (23) 0 (23) 0 0 0
Title IV-E Waiver Increase 0 17,732 17,732 0 17,732 17,732
Montefiore-ACS Family Rehab 0 62 62 0 62 62
To Roll Sandy Unused Funds 0 612 612 0 0 0
Child Care Vouchers 0 0 0 (1,300) 0 (1,300)
Funding Transfer 1,960 0 1,960 0 0 0
Improved Cost Allocation (21,000) 21,000 0 (30,000) 30,000 0
Increase Funding for NYNYIII 0 2,166 2,166 0 0 0
Local Initiatives 250 0 250 0 0 0
Miscellaneous 0 20,035 20,035 0 0 0
Subtotal, Other Adjustments ($18,089) $65,436 $47,346 ($30,365) $49,081 $18,715
TOTAL, All Changes ($18,089) $65,436 $47,346 ($25,765) $52,632 $26,866
ACS Budget as of the Preliminary 2017 Budget $898,248 $2,098,023 $2,996,271 $883,838 $2,084,966 $2,968,804
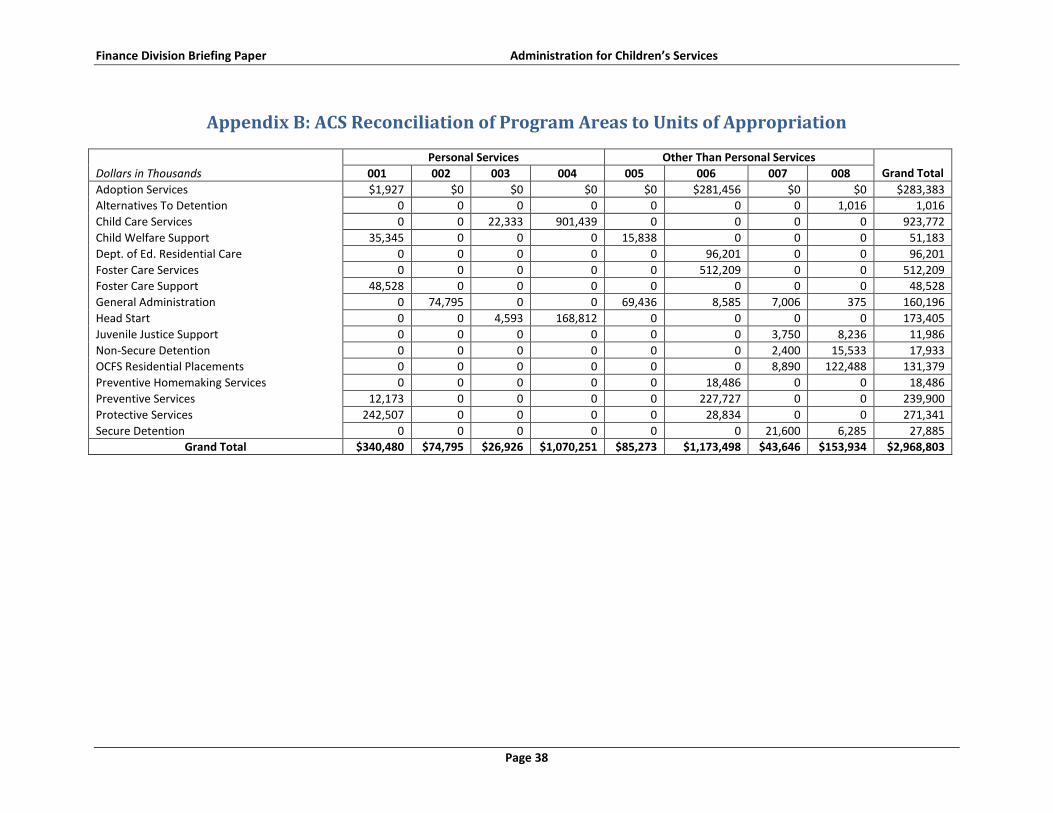
Finance Division Briefing Paper Administration for Children’s Services
Page 38
Appendix B: ACS Reconciliation of Program Areas to Units of Appropriation
Dollars in Thousands
Personal Services Other Than Personal Services Grand Total 001 002 003 004 005 006 007 008
Adoption Services $1,927 $0 $0 $0 $0 $281,456 $0 $0 $283,383
Alternatives To Detention 0 0 0 0 0 0 0 1,016 1,016
Child Care Services 0 0 22,333 901,439 0 0 0 0 923,772
Child Welfare Support 35,345 0 0 0 15,838 0 0 0 51,183
Dept. of Ed. Residential Care 0 0 0 0 0 96,201 0 0 96,201
Foster Care Services 0 0 0 0 0 512,209 0 0 512,209
Foster Care Support 48,528 0 0 0 0 0 0 0 48,528
General Administration 0 74,795 0 0 69,436 8,585 7,006 375 160,196
Head Start 0 0 4,593 168,812 0 0 0 0 173,405
Juvenile Justice Support 0 0 0 0 0 0 3,750 8,236 11,986
Non-Secure Detention 0 0 0 0 0 0 2,400 15,533 17,933
OCFS Residential Placements 0 0 0 0 0 0 8,890 122,488 131,379
Preventive Homemaking Services 0 0 0 0 0 18,486 0 0 18,486
Preventive Services 12,173 0 0 0 0 227,727 0 0 239,900
Protective Services 242,507 0 0 0 0 28,834 0 0 271,341
Secure Detention 0 0 0 0 0 0 21,600 6,285 27,885
Grand Total $340,480 $74,795 $26,926 $1,070,251 $85,273 $1,173,498 $43,646 $153,934 $2,968,803