Embed Size (px)
Citation preview

Adjustments for Age-sex and MLC
NRAC 29 March 2007

Age-sex cost weights (paper 16)
Morbidity and Life Circumstances (paper 17a)
Unmet Need (paper 17b)
Contents

Combined Mental Illness & Learning Difficulties
Adjustments produced at data zones level
Community data sources (PTI outstanding)
Overall Age-sex indices
Age-sex Cost weights - update
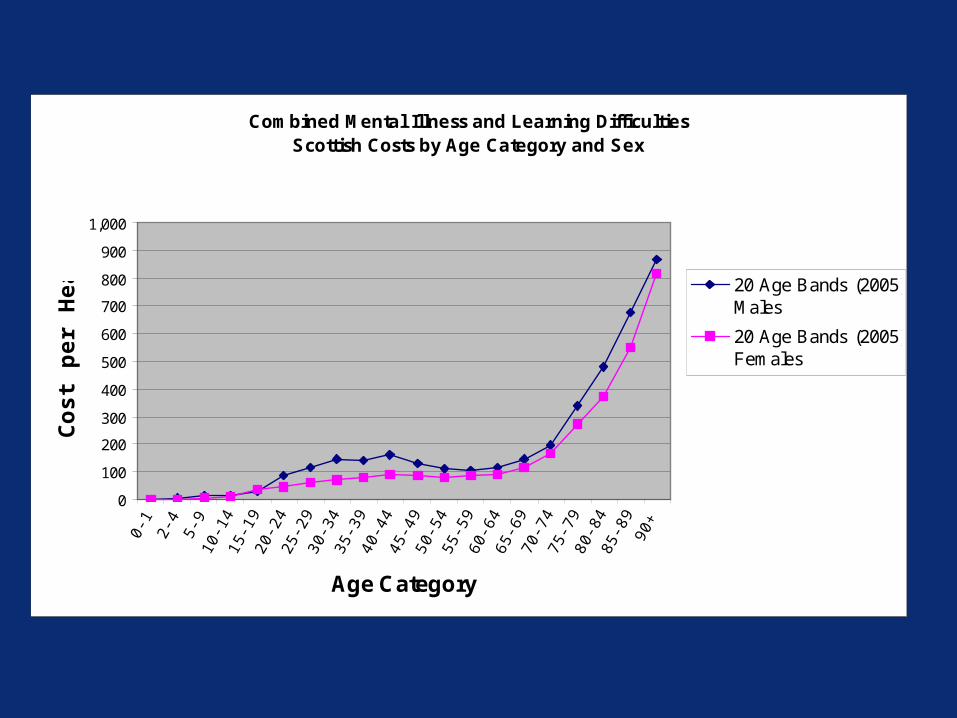
Combined Mental Illness and Learning DifficultiesScottish Costs by Age Category and Sex
0
100
200
300
400
500
600
700
800
900
1,000
0-1
2-4
5-9
10-1
415
-19
20-2
425
-29
30-3
435
-39
40-4
445
-49
50-5
455
-59
60-6
465
-69
70-7
475
-79
80-8
485
-89
90+
Age Category
Co
st
pe
r H
ea
d 20 Age Bands (2005)Males
20 Age Bands (2005)Females

Age Sex Final Indices Arbuthnott v NRAC
-10%
0%
10%
20%
1 2 3 4 5 6 7 8 9 10 11 12 13 14
Anonomised NHS Board
Dev
iati
on
fro
m S
cott
ish
Ave
rag
e
Arbuthnott
NRAC

• Option 1 (needs indices) preferable to Option 2 (needs indices + supplementary variables
• Flat funding not necessary (coefficients significant)
• Maternity index – birth rate
• Combine Mental illness and Learning Difficulties
MLC – Last Meeting

• Combined Mental illness and Learning Difficulties
• Included Maternity outpatients
• Analysis of options for:
– Mental Illness & Learning Difficulties
– Prescribing
– Community
• Completed rurality & ethnicity analyses
• Updated Draft technical addendum
• Further work on unmet need
MLC – Further work since meeting

Option 1 or Option 2 ?
Recommendation – In a straight choice between Option 1 and Option 2, Option 1, the use of needs indices without supplementary variables, should be adopted.
MLC – Recommendations

Acute care programme
Recommendation – To adopt the Acute needs index for the diagnostic groups in the Acute care programme and Care of the Elderly programmes as recommended in the original research report.
• all-cause standardised mortality rate ages 0-74
• limiting long term illness rate (age/sex standardised)
MLC – Recommendations

Mental Illness care programme
Recommendation – To adopt the Mental Health index as proposed in Option 1 but excluding the urbanity index.
• % claiming severe disability allowance,
• % of people in one person households
• % social rented housing
MLC – Recommendations

Out of Sample Evaluation: Mental Illness (Log Scale)
0%
10%
20%
30%
40%
50%
60%
70%
Learning Dementia Non Psych MentalOther
MentalOutpats
Schiz SubstanceMisuse
All Mental
R2
Proposed Index SupplementaryPseudo Arbuthnott Acute IndexProposed Index (In sample)
86.3
Proposed Index no Urbanity
Figure 6 – Out of sample regression fits (Updated cost ratios)

Learning Difficulties care programme
Recommendation – To amalgamate the Learning Difficulties and Mental Illness care programmes and predict needs for the aggregated costs using the Mental Health index recommended above (i.e. excluding urbanity index).
• % claiming severe disability allowance,
• % of people in one person households
• % social rented housing
MLC – Recommendations

Maternity care programme
Recommendation – To adopt birth rate as the index for Maternity.
MLC – Recommendations

A B C F G H L N R S T V W Y Z
NHS Board Code
0.00
1.00
2.00
3.00
Mat
ern
ity
Ra
tio
(U
pd
ate
d)
Figure 7 Average maternity cost ratios by Board

Table 10 Maternity Regression Model Fits Regression Model Adjusted R2 (%) % due to needs drivers
(in addition to HB + supply)
HB only 51.0 - HB + supply 54.2 - HB + supply + index (option 1) 55.1 +0.9 HB + supply + birth rate 62.9 +8.7 HB + supply + birth rate + AVLOS
64.3 +10.1
HB + supply + birth rate + rurality 63.5 +9.3

Prescribing care programme
Recommendation – To adopt the Acute index, as described above, to predict needs for each of the diagnostic groups in the Prescribing care programme.
MLC – Recommendations

Prescribing Cardiovascular
Central Nervous
System Gastro-intestinal Infections
Muscular & Joint
Diseases
Other
Prescribing
Prescribing index variables:
proportion with limiting long-term illness and not good health
(age/sex standardised) <0.01 NS <0.01 NS <0.01 <0.01
proportion of families with 2 or more children <0.05 NS <0.01 <0.05 <0.01 <0.01
proportion in semi-skilled and unskilled work NS <0.05 NS NS NS <0.05
proportion of houses in council house tax band A <0.01 NS NS NS NS NS
Supplementary variables:
Pension credit aged 75 and under <0.01
Income support recipients <0.01
Incapacity benefit and severe disability allowance recipients <0.01
% claiming severe disability allowance** <0.05 <0.01
Table 6 Significance of component variables

Out of Sample Evaluation: Prescribing
0%
10%
20%
30%
40%
50%
60%
70%
Gastro Cardio-vascular
CNS Infections Muscular Other Presc
R2
Proposed Index Supplementary Pseudo Arbuthnott Acute Index Proposed Index (In Sample)
Figure 6 – Out of sample regression fits (Updated cost ratios)

Community care programme
Option 1 index:
• proportion unemployed, on benefits or low paid
• proportion in South Asian ethnic minorities
MLC – Recommendations

Community care programme
• Limited coverage nationally (around 6% of the population)
• Lack of representation of all Boards (making Board level adjustments difficult)
• Wrong geography for resource allocation (so data is practice based so the benefits of data zone geography are lost and results have to be mapped back from practices to intermediate data zones using averaging)
MLC – Recommendations

Community care programme
• Data are for district nurses and health visitors only and therefore cover only around a quarter of all activity in this care programme
• Data are face-to-face contact rates with patients and so do not necessarily reflect the true cost.
• The PTI dataset is currently undergoing a revision to historical data that will revise previous contact rates.
MLC – Recommendations

Community care programme
• Tribal concerns about representativeness and index
• Replication of results not possible
• Non-significant index and variables
• Proportion South Asian negative coefficient
MLC – Recommendations

Community care programme - options
1. Option 1 index described above
2. Another proxy index, e.g. Acute
3. Current Arbuthnott index
4. Flat funding (no needs adjustment other than population and age-sex costs)
5. GMS index as a proxy
6. Further work to establish an better Option 1 index
MLC – Recommendations

coeff SE p District Nursing Option 1 index 0.217 0.147 NS Option 1 variables* Proportion South Asian 0.555 0.493 NS
Proportion unemployed, etc 0.193 0.152 NS Acute Index 0.045 0.043 NS Arbuthnott index 0.040 0.04 NS Health Visitors Option 1 index -0.269 0.143 NS
Option 1 variables* Proportion South Asian -1.452 0.437 <0.01 Proportion unemployed, etc -0.186 0.134 NS Acute Index 0.050 0.042 NS Arbuthnott index 0.052 0.039 NS
Table 13 Community regression model coefficients

Community care programme
Recommendation – that NRAC notes the lack of adequate data to produce a robust MLC indicator for Community. It is unlikely that further work on currently available data within the NRAC project would be fruitful. Therefore it is recommended that the Acute index, with a coefficient specific to Community services, be used as a proxy MLC index for Community.
MLC – Recommendations

Flat Funding
Recommendation – that the original proposal for flat funding is not adopted and that the coefficient for each diagnostic group is retained within the formula as estimated.
MLC – Recommendations

Ethnic Minorities
Recommendation – the original proposal for no specific ethnic minority adjustment is carried forward.
MLC – Recommendations

Care Programme Diagnostic Group Models Including Board + supply
Models including supply
Coefficient p-
value Coefficient p-value Acute Acute Outpatients -0.071 NS -0.335 <0.05
Cancer -0.876 <0.01 -0.804 <0.05 Circulatory -0.186 NS -0.134 NS Digestive -0.198 NS -0.202 NS Injuries -0.935 <0.01 -1.062 <0.01 Other Acute -0.270 NS -0.408 NS Respiratory 0.408 NS 0.214 NS
Care of Elderly Care of Elderly -0.331 NS -0.123 NS Learning
Difficulties Learning Difficulties -4.022 <0.05 -4.100 <0.05
Mental Illness Mental illness & Learning Difficulties -1.947 <0.01 -1.760 <0.01
Dementia -3.949 <0.01 -2.544 NS Mental Outpatients -0.243 NS -2.636 <0.05 Non-Psychological -1.782 NS -1.202 NS Other Mental Illness -2.349 NS -3.331 <0.05 Schizophrenia -0.889 NS -0.103 NS Substance Misuse -2.645 NS -2.322 NS
Prescribing Cardiovascular 0.347 NS -0.469 NS
Central Nervous System -0.799 NS -1.066 <0.05
Gastro-intestinal -0.821 <0.01 -1.278 <0.01 Infections 0.642 NS 0.489 NS
Muscular & Joint Diseases 0.243 NS -0.206 NS
Other Prescribing -0.091 NS -0.007 NS Community* District Nursing 4.993 NS 5.265 NS
Health Visitors -23.144 <0.05 -3.993 NS Maternity** Maternity -0.085 NS -0.042 NS
Table 14 Coefficients for % Black & ethnic minority populations when included in option 1 models

Asylum Seekers
No further work
Rurality
Indices generally good predictors across rural and urban areas.
Lower utilisation in rural areas often.
MLC – Recommendations

Comparison with Arbuthnott Formula
• Better geographical basis (data zones)
• Updated coefficients (frozen since 1997-8)
• Recommended indices better predictors
• Arbuthnott index variables require updating
MLC – Recommendations

Updating the formula - currently
• Needs index values (yearly)
• Needs index coefficients (frozen)
• Care programme weights (yearly)
• Expected costs based on age-sex cost weights (yearly)
MLC – Recommendations

Updating the formula
Recommendation - Needs index values should not be updated without also updating the index coefficients. Based on evidence in this report updating both needs indices and coefficients every 3 years should be sufficient.
MLC – Recommendations

Overall MLC adjustment
-20.0%
-15.0%
-10.0%
-5.0%
0.0%
5.0%
10.0%
15.0%
20.0%
1 2 3 4 5 6 7 8 9 10 11 12 13 14
NRAC Option 1 Arbuthnott

1. Shortfall method
2. Variations method
3. Shortfall tested using disease prevalence data
Unmet Need

Shortfall Method
Needs index
utilisation
Regressionslope
Actualtrend

Shortfall Method (2)
Needs index
utilisation
Regressionslope
Adjusted slope

Variations Method
Needs index
utilisation
Board B
Board A
Board C

Shortfall - deprivation
Cut-point for most deprived populations Care Prog Diagnostic group 25% 20% 15% 10% 5% 1%
Acute Acute Outpatients 0.04 0.04 0.04 0.04 0.04 0.04 Acute Cancer 0.04 0.04 0.04 0.03 0.04 0.04 Acute Circulatory 0.11 0.10 0.10 0.10 0.10 0.10 Acute Digestive 0.11 0.11 0.11 0.12 0.12 0.12 Acute Injuries 0.10 0.10 0.10 0.10 0.10 0.11 Acute Other Acute 0.09 0.09 0.09 0.09 0.10 0.09 Acute Respiratory 0.16 0.17 0.17 0.17 0.17 0.17
Care of Elderly Care of Elderly 0.13 0.12 0.11 0.10 0.09 0.09 Maternity Maternity 0.08 0.08 0.08 0.08 0.07 0.07
Mental Illness All Mental 0.11 0.11 0.11 0.11 0.11 0.11 Prescribing Cardiovascular 0.11 0.11 0.11 0.11 0.11 0.11 Prescribing Central Nervous System 0.13 0.14 0.14 0.14 0.15 0.16 Prescribing Gastro-intestinal 0.13 0.14 0.13 0.13 0.13 0.13 Prescribing Infections 0.04 0.05 0.04 0.04 0.03 0.03 Prescribing Muscular & Joint Diseases 0.18 0.19 0.19 0.18 0.19 0.20 Prescribing Other Prescribing 0.10 0.10 0.09 0.09 0.09 0.10
Table 17 – Shortfall method – Coefficients for least deprived populations

Shortfall – ethnic minorities
Cut point for most ethnic populations
Care Prog Diagnostic group >0.5% BME
>1% BME
>2% BME
>4% BME
Acute Acute Outpatients 0.043 0.041 0.039 0.040 Acute Cancer 0.056 0.037 0.031 0.031 Acute Circulatory 0.102 0.093 0.102 0.099 Acute Digestive 0.127 0.130 0.120 0.118 Acute Injuries 0.105 0.115 0.110 0.114 Acute Other Acute 0.098 0.094 0.094 0.093 Acute Respiratory 0.169 0.177 0.170 0.176
Care of Elderly Care of Elderly 0.099 0.121 0.112 0.100 Maternity Maternity 0.098 0.098 0.099 0.100
Mental Illness All Mental 0.108 0.106 0.117 0.121 Prescribing Cardiovascular 0.113 0.117 0.120 0.119 Prescribing Central Nervous System 0.173 0.168 0.162 0.179 Prescribing Gastro-intestinal 0.138 0.136 0.140 0.136 Prescribing Infections 0.038 0.032 0.031 0.030 Prescribing Muscular & Joint Diseases 0.197 0.196 0.195 0.203 Prescribing Other Prescribing 0.102 0.100 0.098 0.099
Table 19 – Shortfall method – Coefficients for areas of lower ethnic minority population

Shortfall – remoteness & rurality
Care Prog Diagnostic group Urban Remote Rural
Acute Acute Outpatients 0.04 0.04 Acute Cancer 0.04 0.04 Acute Circulatory 0.10 0.10 Acute Digestive 0.11 0.12 Acute Injuries 0.10 0.11 Acute Other Acute 0.09 0.09 Acute Respiratory 0.13 0.17
Care of Elderly Care of Elderly 0.19 0.09 Maternity Maternity 0.09 0.07
Mental Illness All Mental 0.10 0.12 Prescribing Cardiovascular 0.12 0.11 Prescribing Central Nervous System 0.15 0.17 Prescribing Gastro-intestinal 0.14 0.14 Prescribing Infections 0.05 0.03 Prescribing Muscular & Joint Diseases 0.22 0.20 Prescribing Other Prescribing 0.09 0.10
Table 21 – Shortfall method – Coefficients for non-urban and non-remote & rural areas

Disease prevalence (Health Survey)
0.00 5.00 10.00 15.00 20.00
Deprivation Vigintile
0.04
0.06
0.08
0.10
0.12
0.14
0.16
Cir
cu
lato
ry

Disease prevalence (Health Survey)
<0.5% 0.5-1% 1-2% 2-4% 4%or >
Proportion in Black & Ethnic Minorities
0.04
0.05
0.06
0.07
0.08
0.09
0.10
Val
ue
Cir
cula
tory

Disease prevalence (Health Survey)
Large urban
Other urban
Accessible small towns
Rem
ote small tow
ns
Accessible rural
Remote rural
SEURC 6 fold
0.077
0.078
0.079
0.08
0.081
0.082
0.083
0.084
Val
ue
Cir
cula
tory
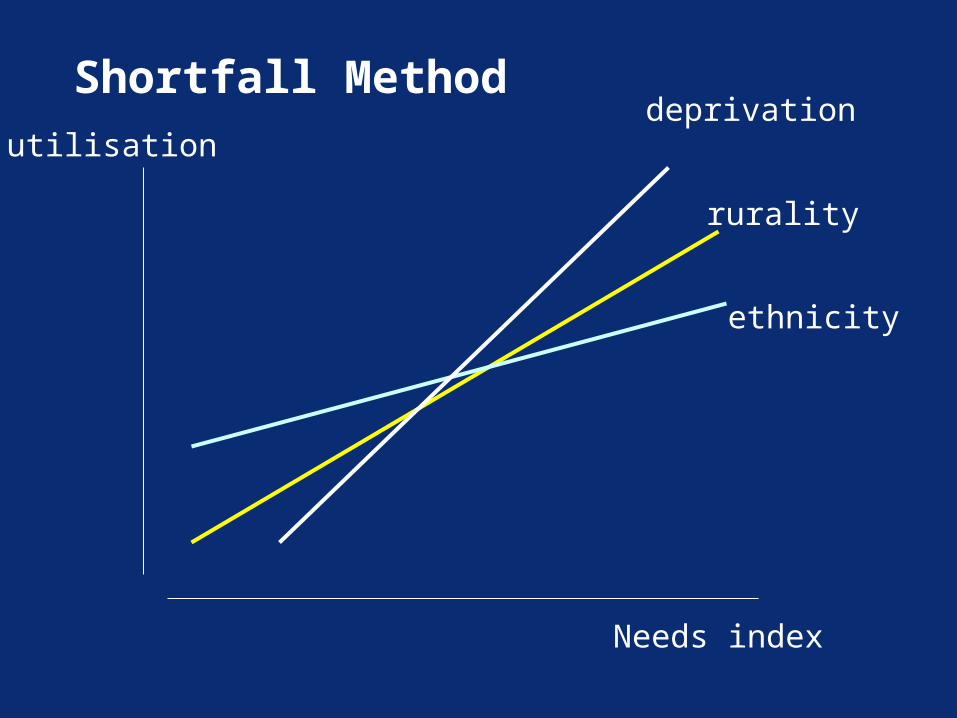
Shortfall Method
Needs index
utilisation
rurality
deprivation
ethnicity

Prevalence of disease =
Predicted needs (based on age-sex + MLC)
+ Deprivation shortfall
+ ethnicity shortfall
+ rurality shortall
Linking predicted needs and disease prevalence

Decide needs indices
Calculate predicted needs
Link to disease prevalence
Evidence of shortfall ?
If yes, use shortfall methods
Calculate predicted needs using adjusted coefficient
Proposed analysis