Embed Size (px)
Citation preview
Annual Report2014
TH
E P
AR
IS M
EM
OR
AN
DU
M O
F U
ND
ER
STA
ND
ING
ON
PO
RT
STA
TE
CO
NT
RO
L
Port State ControlAdjusting Course


3ANNUAL REPORT 2014
Annual Report
2014
Contents
Statement by Paris MoU chairman 4Statement by the Secretary General 6Executive summary 8Paris MoU developments 10Facts & Figures 2014 18Statistical Annexes Annual Report 2014 23White list 31Grey List 33Black List 35Explanatory note - “White”, “Grey” and “Black List” 59Secretariat Paris Memorandum of Understanding on Port State Control 60
4
PORT STATE CONTROL - ADJUSTING COURSE
2014:MLC important inthe coming years
The year 2014 was a busy one for the Paris MoU and in this
annual report you can read about the full details of our activities
for the year. The annual report contains details of the main
developments in the Paris MoU for the year and the outcomes of
our inspections are contained in the detailed statistical annexes.
It was the first year where the New Inspection Regime (NIR) was
based on statistical criteria developed from the NIR itself, thus
transitioning to its full implementation.
The entry into force of the
International Labour Organization’s
(ILO) Maritime Labour Convention
(MLC) was a key event in our industry
and the Convention will play an
important part of port State control
in the coming years. There are new
statistical tables presented in this
report giving details of the outcome of
our inspections in this area.
We held our Port State Control
Committee’s 47th Meeting in
Vilnius, Lithuania, in May 2014. The
meeting adopted several significant
matters improving the port State
control regime, many of which
you can read about in this Annual
Report. The meeting itself was a
Statement by the
Paris MoU chairman

5ANNUAL REPORT 2014
Authorities for their contributions to all
of the different fora of the Paris MoU,
including: the Technical Evaluation
Group (TEG) and its Chairman; all of
the contributors to our Task Forces;
and finally to the members of the MoU
Advisory Board (MAB), all of whom
have made a tremendous contribution
during the year.
I would also like to thank the European
Commission and the European
Maritime Safety Agency (EMSA)
for the excellent co-operation and
strong working relationship with
the Paris MoU. In conclusion, the
Port State Control Officers (PSCOs)
and Administrators in the Member
Authorities of the Paris MoU are the
people who ensure the success of our
endeavours. They are the ones who are
the core of the Paris MoU and continue
to deliver on our common objectives.
They deserve our special thanks and
appreciation.
Brian Hogan
success and strengthens the Paris
MoU for the future. Lithuania is to
be complimented on the hosting and
organisation for our meeting.
The Paris MoU relationship with other
regional port State control agreements
is growing. We are very proud and
appreciative of our co-operation with
them and also with the United States
Coast Guard. We are also aware of the
important role played by MoUs at the
IMO meetings.
The Paris MoU Secretariat again
continued to serve its members well
during the year and I would like to
thank them for their contribution.
I also wish to thank the Member

6
PORT STATE CONTROL - ADJUSTING COURSE
Adjusting course
Four years have passed since the introduction of the “New
Inspection Regime” (NIR) in 2011. A period after which an
evaluation of the impact is appropriate, in order to establish
if the NIR is on the right course and whether our objectives
have been accomplished.
The main objective was to establish
a new way of calculating a risk profile
of ships in order to be more effective
in selecting ships for inspection. Two
factors played an important role; giving
credit to quality ships and reducing
the inspection burden for port States.
Where in the past ships were inspected
every 6 months, regardless of their
performance, the NIR has introduced
inspection intervals up to 36 months
as a reward for good compliance.
At the same time poor performance
should have a bigger impact on the
operation of sub-standard ships in our
region. This has been accomplished
mainly by introducing mandatory
expanded inspections for high risk
Statement by the
Secretary General

7ANNUAL REPORT 2014
take their chances visiting our ports.
These ships and their owners do not
respect the international requirements
and apparently have no intentions
of doing so. They continue to pose a
threat to safety, the environment and
working and living conditions
on board.
For these reasons the time has come
to evaluate the progress made since
introduction of the NIR, to seek areas
of improvement and to adjust our
course where necessary.
Richard W.J. Schiferli
requirements and inspection
procedures. This has also added
to the success of the NIR and will
continue to be a focal area.
After an initially increasing average
detention percentage, the trend has
now been reversed and has reached
an all time low in 2014 since the
introduction of the NIR. Less sub-
standard ships are operating in the
region. At the same time, a large
number of ships have been “banned”
from the region after multiple
detentions. Many of them have been
recycled after having lost their trading
area. Some have moved to other areas
in the world and will hopefully be
caught by other PSC regimes.
Although it has become more difficult
for sub-standard ships to “slip
through the net”, some continue to
ships and “risky ship types” over 12
years old, as well as refusing ships
entry into Paris MoU ports after
multiple detentions.
It is fair to say that the main objective
has been accomplished given the
positive feedback from the maritime
industry and a more effective system
to select ships for inspection. This
has also been made possible by a
“state of the art” information system
(THETIS) provided by the European
Maritime Safety Agency (EMSA).
A similar regime has also been
embraced by the Tokyo MoU and is
likely to be introduced by the Black
Sea MoU soon.
Substantial resources have been
invested by the Paris MoU and EMSA
to enhance the training of Port State
Control Officers in new international

PORT STATE CONTROL - ADJUSTING COURSE
Executive summary Considered to be the worldwide index for
flag performance, the Paris MoU “White,
Grey and Black Lists” indicate further
improvements towards quality shipping.
Last year Kazakhstan, Saudi Arabia and
Switzerland were congratulated for their
efforts to move up to the “White List”.
This year India moved from the “Grey
List” to the “White List”. A very successful
achievement and an example to other
flags that, through determined actions and
political courage, changes can be made.
Spain, Lithuania, Poland and Thailand
moved from the “White List” to the “Grey
List”. Belize moved from the “Grey List” to
the “Black List”. There are still 10 flags on
the “Black List”, with the United Republic
of Tanzania having the worst performance.
There are now 43 flags on the “White List”,
3 less compared with last year. France is
still leading the list, followed by Hong
Kong and Bahamas. Several flags have
made a significant move upwards on the
“White List” into the top 10: Bahamas,
8
Refusal of access (banning) has been used 63 times since 2012. Most
cases involved ships which have been banned for multiple detentions
(46), while a significant number (13) were banned for failing to call at
an indicated repair yard. The remaining 4 cases involved ships which
“jumped the detention”, by sailing without authorization. Over a 3 year
period the flags of the United Republic of Tanzania, the Republic of
Moldova, Saint Vincent and the Grenadines and Togo have recorded
the highest number of bannings. Four ships have been banned for a
second time already. The m/v MANSOUR M (Moldova), m/v CAROLYN
(Tanzania), m/v MAXAL GITA (Belize) and m/v RENI (Ukraine).

9ANNUAL REPORT 2014
the overall inspection efforts in terms of
percentage. High Risk Ships have been
operating mostly in the southern part of
the region, while Low Risk Ships have
been calling in the north-western part of
the region.
With 1,286 inspections and 151
detentions the ships flying a “black listed
flag” score a detention rate of 11.74%.
For ships flying a “grey listed flag” the
detention rate is 6.27% (814 inspections
and 51 detentions) and for ships flying
a “white listed flag” 2.43% (16,175
inspections and 393 detentions).
During 2014 the Maritime Labour
Convention (MLC) was enforced for the
first time during a full calendar year.
A new table has been added to this
report reflecting the 14 areas of the MLC.
The highest areas of non-compliance
are “Hours of Work or Rest” (area 6)
21%, “Food and Catering” (area 10) 14%,
and “Health and Safety and Accident
Prevention” (area 11) 37%.
Isle of Man and the United States of
America. Other flags have made a
significant move downwards in the
“White List” and are no longer in the
top 10: Germany and Finland.
Recognized Organizations (ROs) are
delegated by flag States to carry out
statutory surveys on behalf of flags.
For this very reason, it is important to
monitor their performance. The best
performing RO over the period
2012-2014 was DNV GL, followed by
Det Norske Veritas (DNV) and
Lloyds Register (LR)1.
INCLAMAR is still at the bottom of
the list in terms of poor performance,
followed by International Register of
Shipping and Bulgarian Register of
Shipping. For several years a joint
submission with the Tokyo MoU to IMO
has addressed the correlation between
flags and ROs working on their behalf.
Since last year this information has
been published in the Annual Report.
The combinations of the Republic
of Moldova with Dromon Bureau of
Shipping and Venezuelan Register
of Shipping, as well as Togo with
International Naval Surveys Bureau
and International Naval Surveys Bureau
resulted each in a detention rate higher
than 5% over a 3-year rolling period.
The introduction of the NIR in 2011 has
also had an impact on the 2014 figures.
After an initial decline, the total number
of inspections has increased for the first
time. Since 2011 the average detention
percentage had slightly increased
annually until 2013 (3.61%), after
which a significant decrease has been
recorded for 2014 (3.32%). Spain, the
United Kingdom, Italy, the Netherlands,
Germany and France contribute most to
1 Performance of recognized organizations is measured over a 3-year rolling period. In 2014 DNV GL was included for the first year, while DNV and GL issued certificates were still recorded as separate entities.

10
PORT STATE CONTROL - ADJUSTING COURSE
Paris MoUdevelopments
Once a year the Port State Control Committee, which is the executive
body of the Paris MoU, meets in one of the member States. The
Committee considers policy matters concerning regional enforcement
of port State control, reviews the work of the Technical Evaluation
Group and task forces and decides on administrative procedures.
The task forces, of which 11 were
active in 2014, are each assigned a
specific work programme to investigate
improvement of operational, technical
and administrative port State control
procedures. Reports of the task
forces are submitted to the Technical
Evaluation Group (TEG) at which all
Paris MoU members and observers are
represented. The evaluation of the TEG
is submitted to the Committee for final
consideration and decision-making.
The MoU Advisory Board advises
the Port State Control Committee on
matters of a political and strategic
nature, and provides direction to the
task forces and Secretariat between
meetings of the Committee. The
Board meets several times a year
and was composed of participants
from Germany, Estonia, Norway,
Russian Federation and the European
Commission in 2014.
with the SOLAS requirements for
passenger ships, both from an
operational point of view and safety
equipment. The results will be
published and submitted to the IMO.
High importance was given to the
Concentrated Inspection Campaigns
(CICs). Jointly with the Tokyo MoU a
CIC on hours of rest in accordance
with the provisions of the STCW
Convention was scheduled from
September to November 2014. A CIC
focussing on Crew Familiarisation and
Entry of Enclosed Spaces is planned
in 2015. In addition, the Committee
considered a number of options for
other joint CICs with the Tokyo MoU
for 2016 and beyond.
The report of the CIC on Propulsion
and Auxiliary Machinery, carried out
in September to November of 2013,
was presented to PSCC47. Overall it
was concluded that in general there
was a good level of compliance with
Port State Control Committee
The Port State Control Committee
held its 47th meeting in Vilnius,
Lithuania from 19-23 May 2014.
The MoU has 27 member States.
Since the implementation of the new
inspection regime on the 1st January
2011, there is a clear indication
that it is showing positive results.
The Committee agreed to seek
further improvements, including the
recording of convention references
for all deficiencies by the 1st of July
2014.
The report of the Harmonized
Verification Programme (HAVEP)
on passenger ships, carried out in
2013, was presented to PSCC47. The
objective of the HAVEP was to obtain
a view of emergency preparedness on
passenger ships following the Costa
Concordia accident in January 2012.
The results of the HAVEP indicate
reasonable overall compliance

11ANNUAL REPORT 2014
with current issues such as inspection
campaigns and new requirements.
Expert and Specialized Training
aim to promote a higher degree
of professional knowledge and
harmonisation of more complex port
State control issues and procedures.
Since 2012 the IMO has been
sponsoring PSCOs from other PSC
agreements to attend the Paris MoU
Expert training programmes. In 2014
16 PSCOs from other MoUs attended
Paris MoU training programmes and
PSC seminars.
The Paris MoU is also assisting EMSA
in the preparation and delivery of New
Entrant and Refresher Programmes for
PSCOs from throughout the region.
PSC Seminar 57
The 57th Port State Control Seminar
was held from 16 to 19 June 2014
in Athens, Greece. PSCOs from the
Paris MoU and Montenegro as well as
representatives from the Tokyo MoU,
Vina del Mar Agreement, Caribbean
MoU and Riyadh MoU attended the
Seminar. The main topic of discussion
the SOLAS requirements covered by
the scope of the CIC. The results will
be published and submitted to the
IMO.
The Committee adopted the 2013
Annual Report, including the new
White, Grey and Black List and
the performance list of ROs. This
year Kazakhstan, Saudi Arabia and
Switzerland moved from the “Grey
List” to the “White List”.
Technical Evaluation Group
The TEG convened in Nantes, France
in December 2014. Eleven Task Forces
submitted reports to the TEG for
evaluation before submission to the
Port State Control Committee.
Issues considered by the TEG included:■ Revision of the guidelines for PSCOs
for the Maritime Labour Convention
■ Revision of the guidelines for RO
responsibility
■ Development of guidelines for
PSCOs regarding Ballast Water
Management
■ Development of the training policy
■ Development of a CIC on STCW
hours of rest
■ Development of a CIC Crew
Familiarisation and Enclosed
Space Entry
■ Enhanced Monitoring and Reporting
■ Improvement of the information
system THETIS
■ Revision of the guidelines on ISM
■ Evaluation of Paris MoU Statistics
■ Proposal for development
of guidelines for thickness
measurements
Port State Control training initiatives
The Paris MoU will continue to invest
in the training and development
of Port State Control Officers in
order to establish a higher degree of
harmonisation and standardisation in
inspections throughout the region.
The Secretariat organises three
different training programmes for Port
State Control Officers:
■ Seminars (twice a year)
■ Expert Training (twice a year)
■ Specialized Training (once a year)
The Seminars are open to members,
co-operating members and observers.
The agenda is more topical and deals

12
PORT STATE CONTROL - ADJUSTING COURSE
was the train the trainer course for the
CIC on Hours of Rest. Furthermore
there were presentations on the
MARPOL Annex VI – IEEC by an
expert from Greece and several case
studies on Paris MoU procedures
and specific inspection issues. The
Secretariat presented an overview of
developments in the Paris MoU and
a representative from EMSA gave a
presentation on the developments
within the EU and EMSA.
PSC Seminar 58
The 58th Port State Control Seminar
was held from 4 to 6 November
2014 in The Hague, the Netherlands.
PSCOs from the Paris MoU member
States and Montenegro attended
the Seminar. The main topics of
discussion were the new amendments
to MARPOL Annex VI, the new
requirements for LSA equipment,
the inspection of commercial yachts
and a first presentation on the new
requirements for entry into enclosed
The 10th Expert Training “Safety and
Environment”
The tenth Expert Training programme
was held in The Hague, Netherlands,
in February 2014. Important issues
during this training were MARPOL,
SOLAS, Load Lines, life saving
appliances and oil filtering equipment.
Participants from the Abuja MoU,
Black Sea MoU, Caribbean MoU,
Indian Ocean MoU and EMSA took
part in the training.
The 5th Specialized Training on the
inspection of Tankers
The fifth Specialized Training
programme on the inspection of
Tankers was held in The Hague,
Netherlands, in April 2014.
Participants from the Paris MoU
members States as well as the Abuja
MoU, Black Sea MoU, Indian Ocean
MoU and EMSA took part in the
training. During the training, the
construction and certification, and
the procedures for more detailed and
spaces. The Secretariat presented an
overview of developments in the
Paris MoU.
Expert and Specialized Training
For the Expert Training the central
themes are “The Human Element” and
“Safety and Environment”. The theme
of the Specialized Training changes
every year. In 2014 this training dealt
with the inspection of tankers. Both
training programmes are intended
for experienced PSCOs. Using that
experience, the participants can work
together to establish a higher degree
of harmonisation and standardisation
of their inspection practice. Lecturers
for the training programmes are
invited from the Paris MoU Authorities
and the maritime industry. For the
training programmes in 2014 Belgium,
the United Kingdom, Germany, the
Netherlands, Spain, Italy and several
Recognized Organizations, and service
companies, among others, provided
lecturers.
13ANNUAL REPORT 2014
In 2014 the Secretariat received seven
requests for review. Two cases did
not comply with the requirements for
detention review. These cases were
either submitted beyond the 120 days
limit, were handled at national courts,
challenged only RO responsibility or
originated from ship owners instead of
flag States or ROs.
Five cases met the criteria and were
submitted to MoU members for review.
One case was closed without review,
upon reconsideration by the port State
involved prior to the opinion of the
panel. In one case the detention review
panel concluded that the port State’s
decision to detain was not justified.
The panel requested the port State
to reconsider the detention. In three
cases the panel concluded that the
detaining port State would not have to
reconsider the decision to detain.
Quality management
Since 15 March 2011 the Paris MoU
Secretariat has been ISO9001:2008
certified for its services and products.
During 2014, the Secretariat continued
the improvement of the Quality
Manual and was successfully audited
and recertified for another 3-year
period in 2014. The outcome of
the specific customer surveys held
concerning products and services
of the Secretariat, showed that the
customer satisfaction by the Paris
MoU Member States remains high.
Paris MoU on the Internet
After the launch at the end of 2013, the
new restyled and more contemporary
website enjoyed an ever increasing
demand from a variety of visitors
in 2014. In particular from flag and
port States, government agencies,
charterers, insurers and classification
societies. They were able to monitor
their performance and the performance
of others on a continuous basis.
The port State enters ships that are
expanded inspections, of different
types of tankers were discussed.
Particularly the expanded inspection
on tankers was highlighted.
The 13th Expert Training “The Human
Element”
The thirteenth Expert Training
programme on the Human Element
was held in The Hague, the
Netherlands in October 2014. The
programme was dedicated to the
MLC, 2006 and STCW Conventions.
A short presentation was given
on the inspection of commercial
yachts, since this subject is still very
unfamiliar with many participants. As
an introduction to the program the
participants were asked to complete a
questionnaire that would give insight
into to their personal “enforcement
style”. This was again used when
the communication and interaction
exercise was conducted at the end of
program. Participants from member
States as well as from Montenegro
took part in the training.
Training in cooperation with EMSA
The Paris MoU assists EMSA in the
training delivered to PSCOs from all
Member States.
New Entrant and Refresher
PSC Seminars
In 2014 the fully established
Professional Development Scheme
(PDS) of the Paris MoU encompassed
4 EMSA/Paris MoU Seminars for
PSCOs.
The Paris MoU inspection regime
focuses on eradication of sub-
standard shipping and on rewarding
good performing ships in terms of
the inspection frequency. It translates
to “less, but better inspections”.
The regime is underpinned by an
elaborate set of procedures, all aiming
at providing more guidance for better
inspections.
Ongoing improvements and
performance measurement through
inspection results require strict
adherence to the established
procedures. For the seminars organised
for PSCOs held during 2014 the earlier
adopted approach was followed in
order to maximise familiarisation with
the procedures governing port State
control inspections.
The overarching goal for the seminars
remained the establishment of a
harmonised approach towards Port
State Control in the geographical
working area of the Paris MoU.
Feedback sessions with participants
during the seminars indicated that
indeed a wider understanding of the
procedures and the available tools such
as the Paris MoU manual, RuleCheck
and the distance learning modules, was
established. The constantly evolving
methodology of delivering the lectures
during the seminars is deemed effective
in achieving the objectives set for the
seminars.
All seminars were organised by EMSA
and held at its premises in Lisbon,
Portugal. Lecturers were provided
both by EMSA and the Paris MoU
Secretariat. The 176 participants
attending these seminars during 2014
originated from all Paris MoU Member
States. As from the 33rd PSC seminar
held in June, the duration of seminars
has been extended by half a day
taking into consideration the feedback
provided by participants of previous
sessions.
Detention Review Panel
Flag States or ROs which cannot
resolve a dispute concerning a
detention with the port State may
submit their case for review. The
detention review panel is comprised of
representatives of four different MoU
Authorities, on a rotating basis, and
the Secretariat.

14
PORT STATE CONTROL - ADJUSTING COURSE
currently under detention in a listing.
Validated port State control reports
could be accessed and offered visitors
more detailed information.
To increase public awareness of unsafe
ships, particularly serious port State
control detentions are published under
the heading ‘Caught in the Net’. These
detentions are described in detail and
illustrated with photographs. In 2014
details were published of the following
ships:
■ Craig Trans, flag Bolivia
■ Kamil, flag Panama
■ Hudson Leader, flag Panama
The annual award for best contribution
to the ‘Caught in the Net’ has been
presented to port State Germany.
Other information of interest such as
the current detentions and bannings,
monthly detention lists, the Annual
Report, the performance lists and
news items can be downloaded from
the website, which is found at
www.parismou.org.
Concentrated Inspection Campaigns
Several Concentrated Inspection
Campaigns (CICs) have been held in
the Paris MoU region over the past
years. These campaigns focus on a
particular area of compliance with
international regulations with the
aim of gathering information and
enforcing the level of compliance.
Each campaign is prepared by experts
and identifies a number of specific
items for inspection. Experience shows
that they serve to draw attention to the
chosen area of compliance.
CIC 2014 STCW Hours of Rest
The purpose of the CIC was to gain an
overall impression of compliance with
STCW Hours of Rest following concern
over several incidents where fatigue
was considered to be a factor. Also of
concern was that a bridge lookout was
being maintained.

15ANNUAL REPORT 2014
1,268 Ships (32.4%) were recorded as
having navigation two watch system.
There appeared to be little difference
between the rate of deficiencies on
a two watch system as opposed to a
non-two watch system.
There was some concern that,
although the CIC questionnaire was
publicised in advance, 912 deficiencies
were recorded (22.57% of inspections)
related specifically to STCW hours of
rest and that 16 ships were detained as
a result of the CIC.
The CIC questionnaire and guidance
was developed by the Paris MoU in
conjunction with the Tokyo MoU. The
questionnaire comprised 14 questions
to be answered by the Port State
Control Officer (PSCO) during every
Port State Control (PSC) inspection
throughout the period of the CIC.
The CIC was carried out on all ships
targeted for inspection within the Paris
MoU Region from 1 September 2014
until 30 November 2014.
The questionnaire was completed on
a total of 4,041 ships. 16 Ships were
detained as a direct result of the CIC
questionnaire. Whilst the detention
rate appears low (0.4%) it has to be
borne in mind that detention was not
always the most appropriate action, as
the breach of hours of rest may have
happened in the past.
In 449 of the inspections the hours
of rest were not being recorded
correctly and in 203 inspections the
watchkeeping personnel did not have
sufficient rest.
In 101 cases a bridge lookout was
not being maintained. 27 ships were
not manned in accordance with the
Minimum Safe Manning Document,
also 912 CIC-topic related deficiencies
were recorded.

PORT STATE CONTROL - ADJUSTING COURSE
16
Harmonized Verification Programme
on operational safety of passenger
ships
The decision to carry out a
Harmonized Verification Programme
(HAVEP) on passenger ships was
agreed at the Paris MoU Port State
Control Committee Meeting in May
2012 following the tragic events of the
Costa Concordia incident.
A Task Force was set up comprising all
the members of the Pairs MoU, EMSA
and the United States Coast Guard
to produce a HAVEP questionnaire
and provide guidance to PSCOs for
completion of the questionnaire.
The purpose of the HAVEP
was to obtain statistics and an
overall impression of emergency
preparedness, according to SOLAS,
for passenger ships operating in
the Paris MoU region. The HAVEP
ran from 1st January 2013 to 31st
December 2013. It was agreed within
It was agreed that the HAVEP
inspections would be pre-announced
to the master/operator and the
questionnaire was available prior to the
HAVEP commencing.
A HAVEP questionnaire was completed
and entered into THETIS for a total of
232 passenger ships out of a total of
281 individual passenger ship calls in
the Paris MoU region over the period
of the HAVEP.
A total of 2 ships were detained
as a direct result of the HAVEP
questionnaire. One Maltese ship was
detained for an inoperative source of
emergency power and a Bahamas ship
with 9 detainable deficiencies.
A total of 130 inspections had
deficiencies recorded that were directly
related to the HAVEP. The most
common deficiency recorded related
to Abandon Ship Drills recorded in 20
inspections (8.62% of all inspections).
the Task Force that only ships eligible
for inspection, under the Paris
MoU targeting regime (i.e. Priority
I or Priority II), should undergo the
HAVEP.
The HAVEP questionnaire comprised
20 questions ranging from hardware
information such as fire control plan,
muster list, record of emergency
training and drills, operation of
watertight doors and emergency
source of power to operational
control which included a standard fire
drill scenario and an abandon ship
drill. The guidance for the PSCOs
provided detailed information on
how to answer the questionnaire,
how to carry out the standard fire and
abandon ship drill scenario and how
to record deficiencies according to
the result of the questionnaire, which
would provide some consistency in
the results. A train the trainer session
was also held by the Paris MoU for
PSCOs.

17ANNUAL REPORT 2014
status for non-member States and
observer/associate status for other PSC
regions.
Specific criteria, including a self-
evaluation exercise, have to be made
before co-operating status can be
granted.
In 2011 the maritime Authority of
Montenegro joined the MoU as a co-
operating member with the prospect of
becoming a full member in the future.
The Paris MoU currently has
8 members with dual or even triple
membership: Canada and the Russian
Federation with the Tokyo MoU,
while the Russian Federation is also
a member of the Black Sea MoU.
With Bulgaria and Romania there are
further ties with the Black Sea MoU.
Malta and Cyprus are also members of
the Mediterranean MoU. France and
the Netherlands are members of the
Caribbean MoU, whilst France is also a
member of the Indian Ocean MoU.
The next most common was Fire Drills,
19 inspections (8.19%) followed by
Closing devices/Watertight doors,
18 inspections (7.76%) and SAR Co-
operation plan, 18 inspections (7.76%).
The purpose of the HAVEP was to
obtain an overall view of emergency
preparedness on passenger ships.
Whilst the results of the HAVEP
indicate reasonable overall compliance
with SOLAS requirements for
passenger ships, it is important that
masters and operators pay attention to
emergency preparedness and carrying
out realistic emergency drills.
Co-operation with other organizations
The strength of regional regimes of
port State control, which are bound
by geographical circumstances and
interests, is widely recognised. Nine
regional MoUs have been established.
In order to provide co-operation
to these MoUs, they may apply
for observer status with the Paris
MoU. Regional agreements seeking
observer status must demonstrate
that their member Authorities invest
demonstrably in training of PSCOs,
publish inspection data, have a
code of good practice, have been
granted official Inter Governmental
Organization (IGO) status at IMO and
have a similar approach in terms of
commitment and goals to that of the
Paris MoU.
All regional agreements have obtained
official observer status to the Paris
MoU: the Tokyo MoU, Caribbean MoU,
Mediterranean MoU, Black Sea MoU,
Riyadh MoU, Acuerdo de Viña del Mar,
Abuja MoU and Indian Ocean MoU.
The United States Coast Guard is also
an observer at Paris MoU meetings.
The International Labour Organization
and the International Maritime
Organization have participated in
the meetings of the Paris MoU on a
regular basis since 1982.
In 2006 the Paris MoU obtained
official status at the IMO as an
Inter Governmental Organization.
A delegation of the MoU participated
in the 1st session of the Sub-
Committee on Implementation of
IMO Instruments in July 2014.
The 2012 Annual Report including
inspection data, the performance of
flag Administrations and Recognized
Organizations, a combined list of
flags targeted by the Paris MoU,
Tokyo MoU and USCG and the
results of the 2012 CIC on Fire Safety
Systems and information on the
improvement of flag performance
were submitted to the Sub-
Committee Implementation of IMO
Instruments.
Membership of the Paris MoU
In preparation for prospective new
members of the Paris MoU, the
Port State Control Committee has
adopted criteria for co-operating

18
PORT STATE CONTROL - ADJUSTING COURSE
Inspections
With a total number of 18,430
inspections performed in 2014 the
inspection figures showed an increase
of 4% compared with the figures
of 2013. Each individual ship was
inspected an average of 1.2 times per
year, a rate which has been slightly
lower to that of 2012.
After a drop in the number of
inspections that started with the
introduction of the New Inspection
Regime in January 2011, and continued
in 2012 and 2013, the 2014 figures
show an increase of 4%. New features
of this inspection regime are that
the annual inspection target for
each Member State is based on ship
movement data rather than individual
ship calls. Also dedicated quality
shipping is awarded with longer
intervals between inspections. This
year’s results indicate that fewer ships
have been inspected more than once,
than the number of individual ships
inspected to take account of the fact
that some ships are detained more
than once a year.
Compared with 2013, the number of
detentions has decreased from 668 to
612 detentions. The average detention
rate in 2014 is 3.32%. In 2013 the
detention rate was 3.78%. In 2012 the
detention rate was 3.65%. This is first
year the increasing trend from previous
years has been reversed. A welcome
development.
“White, Grey and Black List”
The “White, Grey and Black (WGB)
List” presents the full spectrum,
from quality flags to flags with a poor
performance that are considered
high or very high risk. It is based on
the total number of inspections and
detentions over a 3-year rolling period
for flags with at least 30 inspections in
the period.
thereby reducing the inspection
burden on ships.
Deficiencies
In 2012 the number of deficiencies
recorded was 49,261. In 2013 the
number of deficiencies was 49,074.
In 2014 the number of deficiencies
decreased significantly to 45,979.
During 55% of all inspections
performed, one or more deficiencies
were recorded. In 2013 this figure
was 58%.The average number of
deficiencies per inspection also
decreased from 2.8 in 2013 to 2.5
in 2014.
Detentions
Some deficiencies are clearly
hazardous to safety, health or the
environment and the ship is detained
until they are rectified. Detention
rates are expressed as a percentage
of the number of inspections, rather
Facts & Figures2014
In the following pages the facts and figures of 2014 are listed.
For the first time since the introduction of the New Inspection
Regime the number of individual ships inspected has increased
(9%). The number of inspections has only increased slightly (4%).
With a further decrease in the number of detentions (8%), this
also resulted in a lower detention percentage.

19ANNUAL REPORT 2014
in 2013), general cargo/multipurpose
ships at 5.49% (down from 6.28%
in 2013); refrigerated cargo ships at
4.62% (down from 5.25% in 2013);
commercial yachts at 3.21% (down
from 6.00% in 2013) and bulk carriers
at 3.19% (down from 3.55% in 2013).
The remaining ship types have lower
detention rates and they are similar
to or lower than the 2013 detention
rates. Best performing ship types
are combination carriers, heavy load
ships and NLS tankers with zero
detention rate.
Performance of Recognized
Organizations
For several years the Committee has
closely monitored the performance of
classification societies acting as ROs
or flags. To calculate the performance
of the Recognized Organizations,
the same formula to calculate the
excess factor of the flags is used.
A minimum number of 60
inspections per RO are needed before
the performance is taken into account
for the list. In 2014 37 ROs are
recorded on the performance list.
On the “White, Grey and Black List”
for 2014, a total number of 72 flags
are listed: 43 on the “White List”,
19 on the “Grey List” and 10 on the
“Black List”. In 2013 the number of
flags listed totalled 75 flags, namely
46 on the “White List”, 19 on the
“Grey List” and 10 on the “Black
List”.
The “White List” represents quality
flags with a consistently low detention
record. Compared with 2013, the
number of flags on the “White List”
has decreased by 3 flags to a total
number of 43 flags. New on the
“White List” is India, which was on
the “Grey List” last year.
France has been placed highest on
the list in terms of performance for
the third year in a row. The next in
line of the best performing flags
in 2014 are Hong Kong, Bahamas,
Norway and Sweden.
Flags with an average performance
are shown on the “Grey List”. Their
appearance on this list may act as
an incentive to improve and move to
the “White List”. At the same time
flags at the lower end of the “Grey
List” should be careful not to neglect
control over their ships and risk
ending up on the “Black List” next
year.
On this year’s “Grey List” a total
number of 19 flags is recorded. Last
year the “Grey List” also recorded
19 flags. New on the “Grey List”
are Spain, Lithuania, Poland and
Thailand, which last year were on the
“White List”.
Belize has fallen from the “Grey
List” to the “Black List”. The poorest
performing flags are the United
Republic of Tanzania, Republic of
Moldova, Togo, Cook Islands and
Dominica.
A graph of the distribution of listed
and not listed flags indicates that only
0.8% of the ships inspected are from
flags not listed on the WGB list.
Ship type
In 2013 the top 5 detention rates were
for: tugs at 5.20% (down from 5.88%

PORT STATE CONTROL - ADJUSTING COURSE
Among the best performing
Recognized Organizations were:
■ DNV GL AS (DNVGL)
■ Det Norske Veritas (DNV)
■ Lloyd’s Register (LR)
■ American Bureau of Shipping (ABS)
■ China Classification Society (CCS)
The lowest performing Recognized
Organizations were:
■ INCLAMAR
■ International Register of
Shipping (IS)
■ Bulgarian Register of Shipping
(BRS)
Compared with last year’s
performance level, a small shift in RO
performance in 2014 can be noticed.
This year fewer organisations have
been placed in the very low and low
performing parts of the list and more
organisations have been placed in the
medium part of the list.
Deficiencies per major category
The number of deficiencies in
the following areas (certificate &
documentation, fire safety, safety
of navigation and working &
living conditions) accounted for
approximately 60% of the total number
of deficiencies. The trends in these
areas are clarified below.
Certificates & Documentation
The number of deficiencies recorded
as related to ships’ certificates, crew
certificates and documents showed a
decrease of 6.3% from 7,638 in 2013 to
7,158 in 2014.
Safety of navigation
In 2014, deficiencies in Safety of
Navigation accounted for 13.47% of
all deficiencies recorded (a decrease
from 13.98% in 2013). The number of
deficiencies in Safety of Navigation
shows a decrease of 9.8%, from 6,861
deficiencies in 2013 to 6,195 in 2014.
Details of the responsibility of
Recognized Organizations for
detainable deficiencies have been
published since 1999. When one
or more detainable deficiencies
are attributed to a Recognized
Organization in accordance with
the criteria, it is recorded “RO
responsible” and the RO is informed.
Out of 612 detentions recorded in
2014, 88 or 14.4% were considered
RO related.
Refusal of access of ships
In a total of 20 cases ships were
refused access (banned) from the
Paris MoU region in 2014 for reasons
of multiple detentions (17), failure to
call at an indicated repair yard (2) and
jumping detention (1). A number of
ships remain banned from previous
years. Several ships have been
banned a second time after multiple
detentions, resulting in a minimum
banning period of 12 months.
20

21ANNUAL REPORT 2014
found in the following areas.
Health and safety and accident
prevention (area 11) 2,059, hours
of work and rest (area 6) 1,152,
food and catering (area 10) 792,
accommodation (area 8) 436 and
seafarer’s employment agreements
(area 4) 238 deficiencies.
Management
The number of ISM related
deficiencies showed a decrease of
1.1% from 1,821 in 2013 to 1,801 in
2014.
Fire safety
In 2014 deficiencies in fire safety
accounted for 13.43% of all
deficiencies recorded (a decrease
from 13.57% in 2013). The number of
deficiencies in this area decreased by
7.2% from 6,657 in 2013 to 6,176 in
2014.
Pollution prevention
Deficiencies in MARPOL Annex I
show a decrease of 17.5% in 2014
(874), compared with 2013 (1,060).
Deficiencies in MARPOL Annex IV
show an increase of 0.9% in 2014
(344), compared with 2013 (341).
Deficiencies in MARPOL Annex V
show a decrease of 33% in 2014 (596),
compared with 2013 (889).
Deficiencies in MARPOL Annex VI
show a decrease of 6.9% in 2014
(458), compared with 2013 (492).
Working and living conditions
On 20 August 2013 the Maritime
Labour Convention 2006 entered into
force. Only Member States of the Paris
MoU that had ratified the MLC, 2006
on or before 20 August 2012 were
entitled to conduct PSC inspections
on MLC, 2006 requirements from 20
August 2013. For member States of
the Paris MoU that have not ratified
the MLC, 2006, enforcement of
the Merchant Shipping (Minimum
Standards) Convention (ILO 147) and
the protocol of 1996 to that Convention
(ILO P147) will initially continue.
In 2014, the first full calendar year with
the MLC in force, the number of ILO
147 deficiencies has decreased while
the number of MLC deficiencies has
increased. For the first year a table has
been added identifying the 14 areas of
the MLC. Most deficiencies have been

22

23ANNUAL REPORT 2014
Annual Report2014
Statistical Annexes

24
PORT STATE CONTROL - ADJUSTING COURSE
Basic port State control figures 2014
Number of individual ships inspected
Number ofinspections
Number ofdetentions
Note: The New Inspection Regime entered into force on the 1st of January 2011. Consequently the targeting of ships for
inspection has changed; inspection figures from 2011 onwards should not be compared to the ones from 2010 and before.
16,000
14,000
12,000
10,000
8,000
6,000
4,000
2,000
02005 2006 2007 2008 2009 2010 2011 2012 2013 2014
13,024
13,41
714
,182 15,
237
14,75
314
,762
15,26
8
14,646
14,10
8 15,37
7
25,000
20,000
15,000
10,000
5,000
02005 2006 2007 2008 2009 2010 2011 2012 2013 2014
21,30
221
,566
22,87
7 24,647
24,18
6
24,058
19,058
18,30
8
17,687 18
,430
1,400
1,200
1,000
800
600
400
200
0
2005 2006 2007 2008 2009 2010 2011 2012 2013 2014
9941,1
74 1,250
1,220
1,059
790
688 669668
612

25ANNUAL REPORT 2014
Number ofdeficiencies
Detentions in %of inspections
Number of refusalof access
Note: The cut-off date for inspection data to be included in the Annual Report 2013 was 15 January 2014. Changes to
inspection data after this date have as a rule not been taken into account.
90,000
80,000
70,000
60,000
50,000
40,000
30,000
20,000
10,000
02005 2006 2007 2008 2009 2010 2011 2012 2013 2014
62,434 66,14
2 74,71
3 83,75
1
71,911
64,698
50,73
8
49,26
1
49,074
45,979
7.00%
6.00%
5.00%
4.00%
3.00%
2.00%
1.00%
0.00%
2005 2006 2007 2008 2009 2010 2011 2012 2013 2014
4.67%
5.44%
5.46%
4.95%
4.38%
3.28% 3.6
1% 3.65%
3.78%
3.32%
30
25
20
15
10
5
02005 2006 2007 2008 2009 2010 2011 2012 2013 2014
28
14 14
19
13
6
20
14
29
20
26
PORT STATE CONTROL - ADJUSTING COURSE
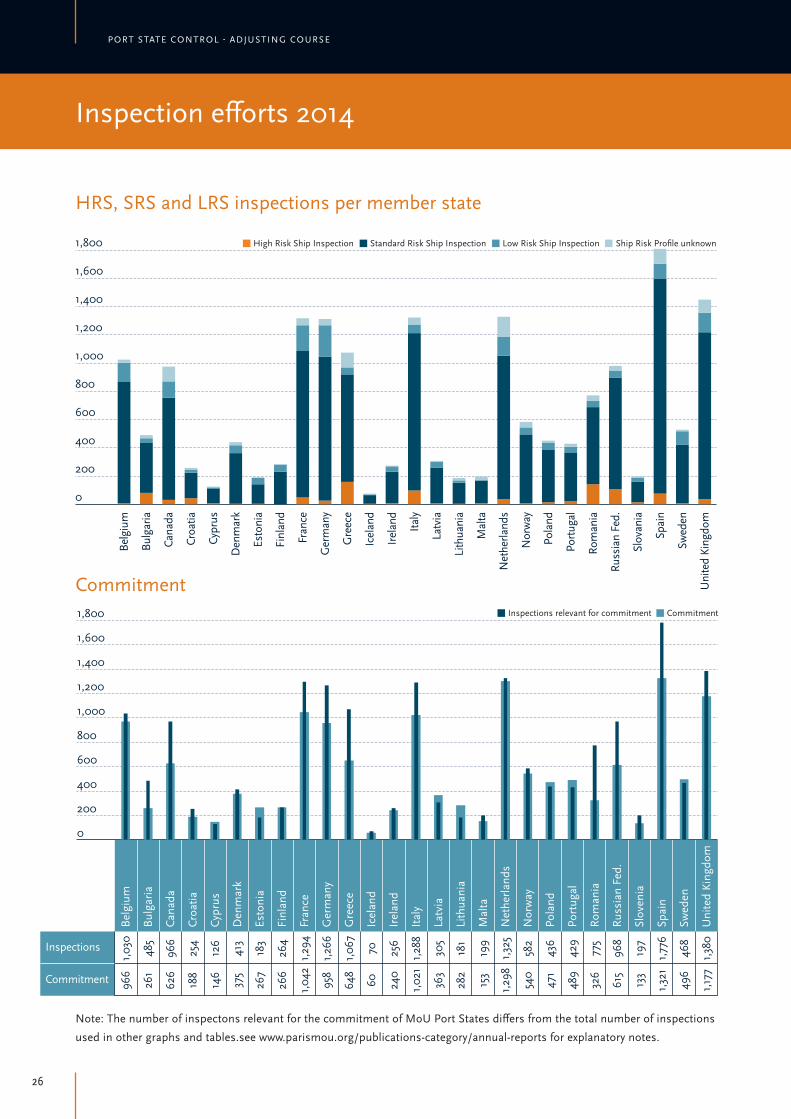
Inspection efforts 2014
HRS, SRS and LRS inspections per member state
1,800
1,600
1,400
1,200
1,000
800
600
400
200
0
Belg
ium
Bulg
aria
Cana
da
Croa
tia
Cypr
us
Den
mar
k
Esto
nia
Finl
and
Fran
ce
Ger
man
y
Gre
ece
Icel
and
Irela
nd Italy
Latv
ia
Lith
uani
a
Mal
ta
Net
herla
nds
Nor
way
Pola
nd
Port
ugal
Rom
ania
Russ
ian
Fed.
Slov
ania
Spai
n
Swed
en
Uni
ted
King
dom
High Risk Ship Inspection Standard Risk Ship Inspection Low Risk Ship Inspection Ship Risk Profile unknown
Belg
ium
Bulg
aria
Cana
da
Croa
tia
Cypr
us
Den
mar
k
Esto
nia
Finl
and
Fran
ce
Ger
man
y
Gre
ece
Icel
and
Irel
and
Ital
y
Latv
ia
Lith
uani
a
Mal
ta
Net
herla
nds
Nor
way
Pola
nd
Port
ugal
Rom
ania
Russ
ian
Fed.
Slov
enia
Spai
n
Swed
en
Uni
ted
King
dom
1,800
1,600
1,400
1,200
1,000
800
600
400
200
0
Inspections
Commitment
1,03
0
485
966
254
126
413
183
264
1,29
4
1,26
6
1,06
7
70 256
1,28
8
305
181
199
1,32
5
582
436
429
775
968
197
1,77
6
468
1,38
0
966
261
626
188
146
375
267
266
1,04
2
958
648
60 240
1,02
1
363
282
153
1,29
8
540
471
489
326
615
133
1,32
1
496
1,17
7
CommitmentInspections relevant for commitment
Note: The number of inspectons relevant for the commitment of MoU Port States differs from the total number of inspections
used in other graphs and tables.see www.parismou.org/publications-category/annual-reports for explanatory notes.
Commitment

27ANNUAL REPORT 2014
Inspection efforts of members as percentage of MoU total
BELGIUM 5.6%
SWEDEN 2.9%
SPAIN 9.8%
SLOVENIA 1.1%
RUSSIAN FEDERATION 5.3%
ROMANIA 4.2%
PORTUGAL 2.3%
POLAND 2.4%
NORWAY 3.2%
NETHERLANDS 7.2%
MALTA 1.1%
LITHUANIA 1.0%
LATVIA 1.7%
UNITED KINGDOM 7.9%
BULGARIA 2.7%
CANADA 5.3%
CROATIA 1.4%CYPRUS 0.7%
DENMARK 2.4%ESTONIA 1.0%
FINLAND 1.5%
FRANCE 7.2%
GERMANY 7.2%
GREECE 5.9%
ICELAND 0.4%IRELAND 1.5%ITALY 7.2%

28
PORT STATE CONTROL - ADJUSTING COURSE
MoU port State
Tota
l nr o
f In
spec
tions
Insp
ectio
ns w
ith
defic
ienc
ies
Insp
ectio
ns w
ith
dete
ntio
ns
Insp
ectio
ns w
ith R
O
rela
ted
deta
inab
le
defic
ienc
ies
% In
spec
tions
with
de
ficie
ncie
s
% D
eten
tions
% In
spec
tion
of
MoU
tota
l
% H
RS
% S
RS
% L
SR
% S
RP U
nkno
wn
Belgium 1,028 667 14 4 64.88 1.36 5.58 0.88 83.95 12.84 2.33
Bulgaria 491 330 14 4 67.21 2.85 2.66 16.90 71.89 6.31 4.89
Canada 981 485 22 1 49.44 2.24 5.32 2.96 74.31 11.52 11.21
Croatia 256 143 10 2 55.86 3.91 1.39 15.63 71.88 9.38 3.13
Cyprus 126 93 18 3 73.81 14.29 0.68 6.35 80.95 5.56 7.14
Denmark 439 178 6 1 40.55 1.37 2.38 0.91 81.55 12.30 5.24
Estonia 191 51 0 0 26.70 0.00 1.04 0.52 74.87 21.47 3.14
Finland 285 69 2 1 24.21 0.70 1.55 0.00 80.70 17.89 1.40
France 1,321 709 36 2 53.67 2.73 7.17 3.48 79.03 13.70 3.79
Germany 1,318 734 44 3 55.69 3.34 7.15 1.75 77.85 16.92 3.49
Greece 1,079 750 68 12 69.51 6.30 5.85 14.64 70.99 4.63 9.73
Iceland 71 33 6 0 46.48 8.45 0.39 4.23 84.51 7.04 4.23
Ireland 275 192 14 2 69.82 5.09 1.49 2.91 80.73 14.18 2.18
Italy 1,326 776 88 19 58.52 6.64 7.19 7.32 84.24 4.68 3.77
Latvia 308 72 0 0 23.38 0.00 1.67 3.25 80.19 14.29 2.27
Lithuania 184 79 0 0 42.93 0.00 1.00 1.09 82.07 10.33 6.52
Malta 199 110 11 4 55.28 5.53 1.08 4.02 80.40 2.01 13.57
Netherlands 1,334 742 27 3 55.62 2.02 7.24 2.85 76.39 9.97 10.79
Norway 585 194 1 0 33.16 0.17 3.17 1.20 83.76 8.38 6.67
Poland 450 325 24 4 72.22 5.33 2.44 3.11 82.67 11.33 2.89
Portugal 429 121 8 1 28.21 1.86 2.33 3.96 81.82 8.62 5.59
Romania 775 467 24 2 60.26 3.10 4.21 17.94 71.10 5.42 5.55
Russian Federation1 984 712 35 3 72.36 3.56 5.34 10.77 80.79 5.08 3.35
Slovenia 196 114 4 2 58.16 2.04 1.06 7.14 73.47 13.78 5.61
Spain 1,813 996 69 9 54.94 3.81 9.84 4.19 84.34 5.68 5.79
Sweden 530 131 4 1 24.72 0.75 2.88 1.70 77.92 18.49 1.89
United Kingdom 1,456 941 63 5 64.63 4.33 7.90 2.61 81.46 9.41 6.52
Total 18,430 10,214 612 88 55.42 3.32 100.00 5.36 79.25 9.80 5.59
1 Only inspections in the Russian ports of the Baltic, Azov, Caspian and Barents Sea are included.
MoU port States’s individual contributions to the total amount of inspections

29ANNUAL REPORT 2014

1France
278
0
27
12
-1,92
2Hong Kong, China
1709
20
137
102
-1,77
3Bahamas
2308
31
182
141
-1,74
4Norway
1472
19
120
86
-1,71
5Sweden
405
3
37
19
-1,69
6Isle of Man, UK
731
8
63
39
-1,68
7Denmark
1082
14
90
61
-1,67
8United Kingdom
1,369
19
112
80
-1,66
9United States of America
235
1
23
10
-1,64
10Italy
1210
17
100
70
-1,64
11Singapore
1517
23
123
89
-1,63
12Marshall Islands
2807
51
219
174
-1,58
13China
212
1
21
8
-1,56
14Greece
913
15
77
51
-1,50
15Germany
754
12
65
41
-1,48
16Finland
401
5
37
19
-1,46
17Liberia
4215
95
323
267
-1,45
18Belgium
228
2
23
9
-1,39
19Netherlands
3170
79
246
198
-1,34
20Bermuda, UK
252
3
25
10
-1,29
21Malta
4369
126
334
278
-1,22
22Cayman Islands, UK
357
6
33
17
-1,22
23Gibraltar, UK
848
20
72
47
-1,19
24Croatia
140
1
15
4
-1,12
25Cyprus
1976
69
157
119
-0,91
26Faroe Islands, DK
252
5
25
10
-0,91
27India
81
0
10
1
-0,90
28Iran, Islamic Republic of
81
0
10
1
-0,90
29Saudi Arabia
81
0
10
1
-0,90
30Kazakhstan
75
0
9
1
-0,79
31Barbados
363
10
34
17
-0,77
32Turkey
1494
61
121
88
-0,65
33Estonia
67
0
9
1
-0,62
34Japan
66
0
9
1
-0,60
35Antigua and Barbuda
3,623
174
279
228
-0,52
36Latvia
63
0
8
1
-0,52
37Russian Federation
1386
62
113
81
-0,50
38Ireland
91
1
11
2
-0,48
39Panama
6098
315
460
394
-0,45
40Philippines
161
4
17
5
-0,40
41Switzerland
107
2
12
3
-0,29
42Luxembourg
210
7
21
8
-0,23
43Korea, Republic of
103
2
12
2
-0,21
44Switzerland
99
2
12
2
-0.13
45Lithuania
176
6
18
6
-0.06
30
PORT STATE CONTROL - ADJUSTING COURSE

1France
278
0
27
12
-1,92
2Hong Kong, China
1709
20
137
102
-1,77
3Bahamas
2308
31
182
141
-1,74
4Norway
1472
19
120
86
-1,71
5Sweden
405
3
37
19
-1,69
6Isle of Man, UK
731
8
63
39
-1,68
7Denmark
1082
14
90
61
-1,67
8United Kingdom
1,369
19
112
80
-1,66
9United States of America
235
1
23
10
-1,64
10Italy
1210
17
100
70
-1,64
11Singapore
1517
23
123
89
-1,63
12Marshall Islands
2807
51
219
174
-1,58
13China
212
1
21
8
-1,56
14Greece
913
15
77
51
-1,50
15Germany
754
12
65
41
-1,48
16Finland
401
5
37
19
-1,46
17Liberia
4215
95
323
267
-1,45
18Belgium
228
2
23
9
-1,39
19Netherlands
3170
79
246
198
-1,34
20Bermuda, UK
252
3
25
10
-1,29
21Malta
4369
126
334
278
-1,22
22Cayman Islands, UK
357
6
33
17
-1,22
23Gibraltar, UK
848
20
72
47
-1,19
24Croatia
140
1
15
4
-1,12
25Cyprus
1976
69
157
119
-0,91
26Faroe Islands, DK
252
5
25
10
-0,91
27India
81
0
10
1
-0,90
28Iran, Islamic Republic of
81
0
10
1
-0,90
29Saudi Arabia
81
0
10
1
-0,90
30Kazakhstan
75
0
9
1
-0,79
31Barbados
363
10
34
17
-0,77
32Turkey
1494
61
121
88
-0,65
33Estonia
67
0
9
1
-0,62
34Japan
66
0
9
1
-0,60
35Antigua and Barbuda
3,623
174
279
228
-0,52
36Latvia
63
0
8
1
-0,52
37Russian Federation
1386
62
113
81
-0,50
38Ireland
91
1
11
2
-0,48
39Panama
6098
315
460
394
-0,45
40Philippines
161
4
17
5
-0,40
41Switzerland
107
2
12
3
-0,29
42Luxembourg
210
7
21
8
-0,23
43Korea, Republic of
103
2
12
2
-0,21
44Switzerland
99
2
12
2
-0.13
45Lithuania
176
6
18
6
-0.06
31ANNUAL REPORT 2014
RANK FLAG INSPECTIONS 2012-2014
DETENTIONS 2012-2014
BLACK TO GREY LIMIT
GREY TO WHITE LIMIT
EXCESS FACTOR
WHITE LIST
1 France 278 0 27 12 -1.92
2 Hong Kong, China 1,709 20 137 102 -1.77
3 Bahamas 2,308 31 182 141 -1.74
4 Norway 1,472 19 120 86 -1.71
5 Sweden 405 3 37 19 -1.69
6 Isle of Man, UK 731 8 63 39 -1.68
7 Denmark 1,082 14 90 61 -1.67
8 United Kingdom 1,369 19 112 80 -1.66
9 United States of America 235 1 23 10 -1.64
10 Italy 1,210 17 100 70 -1.64
11 Singapore 1,517 23 123 89 -1.63
12 Marshall Islands 2,807 51 219 174 -1.58
13 China 212 1 21 8 -1.56
14 Greece 913 15 77 51 -1.50
15 Germany 754 12 65 41 -1.48
16 Finland 401 5 37 19 -1.46
17 Liberia 4,215 95 323 267 -1.45
18 Belgium 228 2 23 9 -1.39
19 Netherlands 3,170 79 246 198 -1.34
20 Bermuda, UK 252 3 25 10 -1.29
21 Malta 4,369 126 334 278 -1.22
22 Cayman Islands, UK 357 6 33 17 -1.22
23 Gibraltar, UK 848 20 72 47 -1.19
24 Croatia 140 1 15 4 -1.12
25 Cyprus 1,976 69 157 119 -0.91
26 Faroe Islands, DK 252 5 25 10 -0.91
27 India 81 0 10 1 -0.90
28 Iran, Islamic Republic of 81 0 10 1 -0.90
29 Saudi Arabia 81 0 10 1 -0.90
30 Kazakhstan 75 0 9 1 -0.79
31 Barbados 363 10 34 17 -0.77
32 Turkey 1,494 61 121 88 -0.65
33 Estonia 67 0 9 1 -0.62
34 Japan 66 0 9 1 -0.60
35 Antigua and Barbuda 3,623 174 279 228 -0.52
36 Latvia 63 0 8 1 -0.52
37 Russian Federation 1,386 62 113 81 -0.50
38 Ireland 91 1 11 2 -0.48
39 Panama 6,098 315 460 394 -0.45
40 Philippines 161 4 17 5 -0.40
41 Switzerland 107 2 12 3 -0.29
42 Luxembourg 210 7 21 8 -0.23
43 Korea, Republic of 103 2 12 2 -0.21
White list
44Portugal
376
18
35
18
0,02
45Ukraine
202
9
21
8
0,10
46Malaysia
52
1
7
0
0,13
47Spain
196
9
20
7
0,13
48Lithuania
160
7
17
5
0,14
49Lebanon
77
3
10
1
0,21
50Bulgaria
40
1
6
0
0,21
51Poland
157
8
17
5
0,24
52Libya
44
2
6
0
0,34
53Thailand
62
4
8
1
0,46
54Egypt
61
4
8
0
0,46
55Tunisia
46
3
7
0
0,47
56Curacao
216
15
22
8
0,49
57Morocco
41
3
6
0
0,52
58Vanuatu
265
19
26
11
0,53
59Albania
92
7
11
2
0,56
60Saint Kitts and Nevis
313
25
30
14
0,69
61Algeria
73
7
9
1
0,73
62Tuvalu
34
4
5
0
0,77
32
PORT STATE CONTROL - ADJUSTING COURSE

44Portugal
376
18
35
18
0,02
45Ukraine
202
9
21
8
0,10
46Malaysia
52
1
7
0
0,13
47Spain
196
9
20
7
0,13
48Lithuania
160
7
17
5
0,14
49Lebanon
77
3
10
1
0,21
50Bulgaria
40
1
6
0
0,21
51Poland
157
8
17
5
0,24
52Libya
44
2
6
0
0,34
53Thailand
62
4
8
1
0,46
54Egypt
61
4
8
0
0,46
55Tunisia
46
3
7
0
0,47
56Curacao
216
15
22
8
0,49
57Morocco
41
3
6
0
0,52
58Vanuatu
265
19
26
11
0,53
59Albania
92
7
11
2
0,56
60Saint Kitts and Nevis
313
25
30
14
0,69
61Algeria
73
7
9
1
0,73
62Tuvalu
34
4
5
0
0,77
33ANNUAL REPORT 2014
RANK FLAG INSPECTIONS 2012-2014
DETENTIONS 2012-2014
BLACK TO GREY LIMIT
GREY TO WHITE LIMIT
EXCESS FACTOR
GREY LIST
44 Portugal 376 18 35 18 0.02
45 Ukraine 202 9 21 8 0.10
46 Malaysia 52 1 7 0 0.13
47 Spain 196 9 20 7 0.13
48 Lithuania 160 7 17 5 0.14
49 Lebanon 77 3 10 1 0.21
50 Bulgaria 40 1 6 0 0.21
51 Poland 157 8 17 5 0.24
52 Libya 44 2 6 0 0.34
53 Thailand 62 4 8 1 0.46
54 Egypt 61 4 8 0 0.46
55 Tunisia 46 3 7 0 0.47
56 Curacao 216 15 22 8 0.49
57 Morocco 41 3 6 0 0.52
58 Vanuatu 265 19 26 11 0.53
59 Albania 92 7 11 2 0.56
60 Saint Kitts and Nevis 313 25 30 14 0.69
61 Algeria 73 7 9 1 0.73
62 Tuvalu 34 4 5 0 0.77
Grey list

63Sierra Leone
316
32
30
Medium
1.19
64Cambodia
442
43
40
1.20
65Saint Vincent and the Grenadines
861
79
73
1,09
66Belize
591
59
52
1,35
67Comoros
280
34
27
1,62
68Dominica
70
11
9
1,73
69Cook Islands
310
39
30
1,96
70Togo
353
45
33
MEDIUM TO HIGH RISK 2,00
71Moldova, Republic of
593
80
52
2,59
72Tanzania United Rep.
313
51
30
2,65
34
PORT STATE CONTROL - ADJUSTING COURSE

63Sierra Leone
316
32
30
Medium
1.19
64Cambodia
442
43
40
1.20
65Saint Vincent and the Grenadines
861
79
73
1,09
66Belize
591
59
52
1,35
67Comoros
280
34
27
1,62
68Dominica
70
11
9
1,73
69Cook Islands
310
39
30
1,96
70Togo
353
45
33
MEDIUM TO HIGH RISK 2,00
71Moldova, Republic of
593
80
52
2,59
72Tanzania United Rep.
313
51
30
2,65
35ANNUAL REPORT 2014
RANK FLAG INSPECTIONS 2012-2014
DETENTIONS 2012-2014
BLACK TO GREY LIMIT
GREY TOWHITE LIMIT
EXCESSFACTOR
BLACK LIST
63 Sierra Leone 316 32 30
MediumRisk
1.18
64 Cambodia 442 43 40 1.18
65 Saint Vincent and the Grenadines 861 79 73 1.21
66 Belize 591 59 52 1.35
67 Comoros 280 34 27 1.71
68 Dominica 70 11 9 1.77
69 Cook Islands 310 39 30 1.89
70 Togo 353 45 33 1.99
71 Moldova, Republic of 593 80 52Medium to High Risk
2.43
72 Tanzania United Rep. 313 51 30 High Risk 3.00
Black list

36
PORT STATE CONTROL - ADJUSTING COURSE
Flags meeting criteria for Low Risk Ships 2014
Flags meeting criteria for Low Risk Ships (as per 31 December 2014)
Antigua and Barbuda Gibraltar, UK Marshall Islands
Bahamas Greece Netherlands
Belgium Hong Kong, China Norway
Bermuda, UK Ireland Panama
Cayman Islands, UK Isle of Man, UK Poland
China Italy Russian Federation
Cyprus Japan Singapore
Denmark Korea, Republic of Spain
Estonia Latvia Sweden
Faroe Islands, DK Liberia Switzerland
Finland Lithuania Turkey
France Luxembourg United Kingdom
Germany Malta United States of America
To meet the criteria for Low Risk Ships, flags should be on the Paris MoU White list and have submitted evidence of having
undergone an IMO VIMSAS Audit.
Non listed flags having undergone IMO VIMSAS AuditAustralia Canada
Flags who’s total number of inspections over a 3-years rolling period does not meet the minimum of 30 are not included
in the Paris MoU White list. Consequently some flags cannot meet the criteria for their ships to qualify as Low Risk Ships
under the Paris MoU, despite having undergone the IMO VIMSAS Audit.
Non listed flags with no detentions 2012-2014*Angola (1) Dominican Republic (2) Mexico (1) Seychelles (15)
Australia (5) Ethiopia (2) Montenegro (6) Slovenia (6)
Azerbaijan (8) Falkland Islands (5) Mozambique (1) South Africa (2)
Brazil (4) Israel (17) Pakistan (4) Syrian Arab Republic (25)
Canada (10) Jersey, UK (4) Peru (1) Taiwan, China (24)
Chile (1) Korea, Democratic People's Rep. (3) Qatar (17) Turkmenistan (4)
Colombia (1) Mauritius (10) Sao Tome and Principe (2) Venezuela (4)
Flags who’s total number of inspections over a 3-years rolling period does not meet the minimum of 30 are not included in
the Paris MoU White, Grey and Black lists. The flags in this table had too few inspections to be included in the lists, but had
no detentions in the period 2012-2014.
* Note: The flags are listed in alphabetical order. The number of inspections over the period 2012-2014 taken into account
is shown in brackets. Flags on this list do not meet the criteria for Low Risk Ships.

37ANNUAL REPORT 2014
Distribution of listed and non listed flags 2012-2014
White flags (87.0%)
Grey flags (4.6%)
Black flags (7.6%)
Not listed (0.8%)
SRI LANKA (18)
KIRIBATI (20)
HONDURAS (20)
TAIWAN, CHINA (24)
KUWAIT (24)
QATAR (17)
ISRAEL (17)
SEYCHELLES (15)
JAMAICA (15)
BAHRAIN (13)
UNITED ARAB EMIRATES (14)
BOLIVIA (13)
VIETNAM (12)
GEORGIA (12)
ICELAND (11)
MAURITIUS (10)
CANADA (10)
ETHIOPIA (2)
DOMINICAN REPUBLIC (2)SAO TOME AND PRINCIPE (2)
SOUTH AFRICA (2)UNKNOWN (2)
MEXICO (1)CHILE (1)
MOZAMBIQUE (1)
PERU (1)ANGOLA (1)
CAPE VERDE (1)CAMEROON (1)COLOMBIA (1)
GHANA (1)PALAU (29)
SYRIAN ARAB REPUBLIC (25)
BANGLADESH (6)MONGOLIA (5)
FALKLAND ISLANDS (5)ECUADOR (5)
AZERBAIJAN (8)SLOVAKIA (6)
SLOVENIA (6)MONTENEGRO (6)
INDONESIA (4)ROMANIA (4)
VENEZUELA (4)TURKMENISTAN (4)
AUSTRALIA (5)
BRAZIL (4)PAKISTAN (4)
NIGERIA (4)
JERSEY, UK (4)
KOREA, DEMOCRATIC PEOPLE'S REP. (3)
JORDAN (3)
38
PORT STATE CONTROL - ADJUSTING COURSE
Flag
Nr o
f In
spec
tions
Insp
ectio
ns
with
de
ficie
ncie
s
Insp
ectio
ns
with
de
tent
ions
Nr o
f In
divi
dual
sh
ips
insp
ecte
d
% o
f In
spec
tions
w
ith
defic
ienc
ies
% o
f In
spec
tions
w
ith
dete
ntio
ns
Albania 19 18 1 13 94.7 5.26
Algeria 20 13 2 17 65.0 10.00
Antigua and Barbuda 1,140 717 55 835 62.9 4.82
Azerbaijan 5 5 0 5 100.0 0.00
Bahamas 769 389 7 642 50.6 0.91
Bahrain 3 2 1 3 66.7 33.33
Bangladesh 4 3 0 3 75.0 0.00
Barbados 115 65 3 92 56.5 2.61
Belgium 74 33 0 68 44.6 0.00
Belize 203 168 22 151 82.8 10.84
Bermuda (UK) 80 37 0 74 46.3 0.00
Bolivia 2 2 1 2 100.0 50.00
Brazil 1 1 0 1 100.0 0.00
Bulgaria 12 9 0 12 75.0 0.00
Cambodia 132 123 14 93 93.2 10.61
Canada 3 2 0 3 66.7 0.00
Cape Verde 1 1 1 1 100.0 100.00
Cayman Islands (UK) 127 57 1 122 44.9 0.79
China 72 37 1 66 51.4 1.39
Comoros 68 67 7 45 98.5 10.29
Cook Islands 127 106 14 91 83.5 11.02
Croatia 41 17 1 33 41.5 2.44
Curacao 63 36 6 51 57.1 9.52
Cyprus 695 385 19 539 55.4 2.73
Denmark 414 165 3 348 39.9 0.72
Dominica 12 7 1 7 58.3 8.33
Ecuador 2 1 1 1 50.0 50.00
Egypt 21 15 3 15 71.4 14.29
Estonia 20 4 0 15 20.0 0.00
Ethiopia 1 1 0 1 100.0 0.00
Falkland Islands (UK) 1 0 0 1 0.0 0.00
Faroe Islands 89 44 0 71 49.4 0.00
Finland 132 50 2 106 37.9 1.52
France 103 61 0 78 59.2 0.00
Georgia 2 2 0 2 100.0 0.00
Germany 223 85 2 199 38.1 0.90
Ghana 1 1 1 1 100.0 100.00
Gibraltar (UK) 276 155 5 217 56.2 1.81
Greece 312 130 3 285 41.7 0.96
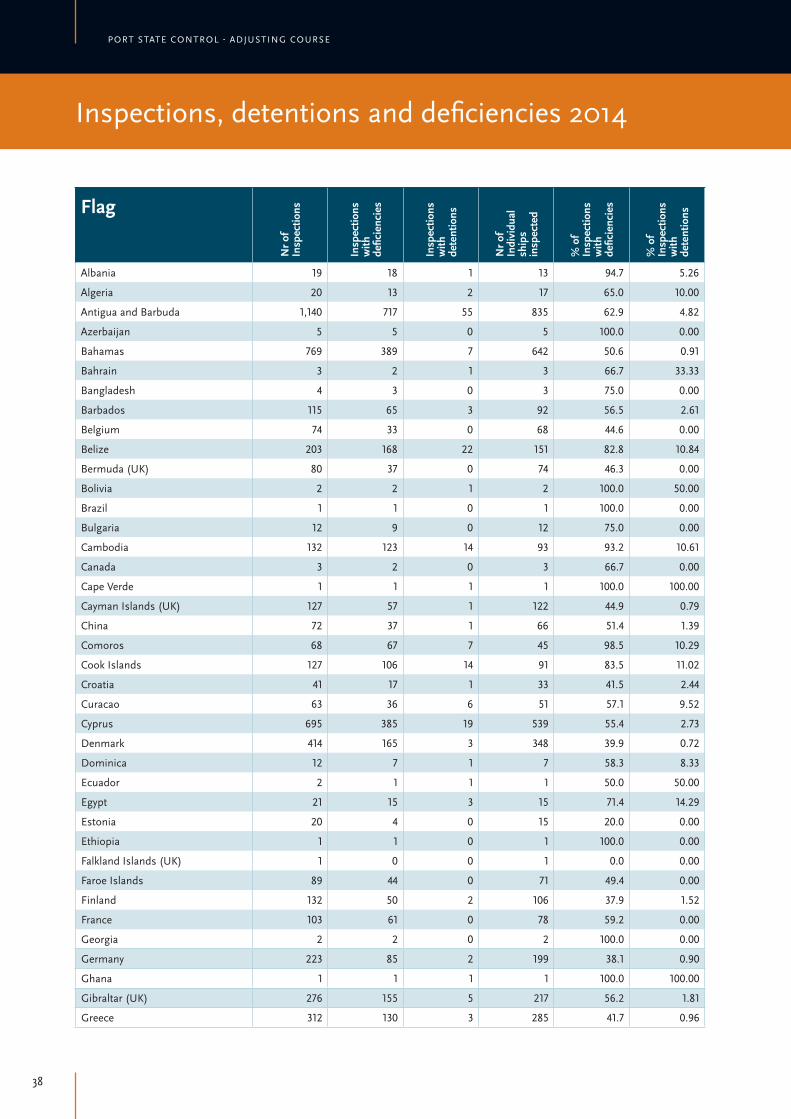
Inspections, detentions and deficiencies 2014

39ANNUAL REPORT 2014
Flag
Nr o
f In
spec
tions
Insp
ectio
ns
with
de
ficie
ncie
s
Insp
ectio
ns
with
de
tent
ions
Nr o
f In
divi
dual
sh
ips
insp
ecte
d
% o
f In
spec
tions
w
ith
defic
ienc
ies
% o
f In
spec
tions
w
ith
dete
ntio
ns
Honduras 4 3 0 4 75.0 0.00
Hong Kong, China 621 306 5 587 49.3 0.81
Iceland 6 3 1 5 50.0 16.67
India 26 11 0 23 42.3 0.00
Indonesia 2 2 1 1 100.0 50.00
Iran, Islamic Republic of 28 24 0 27 85.7 0.00
Ireland 43 17 0 34 39.5 0.00
Isle of Man (UK) 265 112 4 228 42.3 1.51
Israel 6 1 0 6 16.7 0.00
Italy 416 212 6 358 51.0 1.44
Jamaica 6 2 0 5 33.3 0.00
Japan 20 8 0 19 40.0 0.00
Jersey (UK) 3 2 0 2 66.7 0.00
Jordan 2 2 2 1 100.0 100.00
Kazakhstan 22 8 0 22 36.4 0.00
Kiribati 7 7 2 6 100.0 28.57
Korea, Republic of 33 23 1 31 69.7 3.03
Kuwait 13 1 0 13 7.7 0.00
Latvia 16 7 0 12 43.8 0.00
Lebanon 22 20 1 18 90.9 4.55
Liberia 1,440 716 39 1,307 49.7 2.71
Libya 10 6 0 9 60.0 0.00
Lithuania 50 23 2 33 46.0 4.00
Luxembourg 81 42 1 74 51.9 1.23
Malaysia 10 4 0 10 40.0 0.00
Malta 1,518 815 39 1,266 53.7 2.57
Marshall Islands 1,094 495 16 998 45.2 1.46
Mauritius 1 0 0 1 0.0 0.00
Mexico 1 1 0 1 100.0 0.00
Moldova, Republic of 178 167 26 118 93.8 14.61
Mongolia 1 1 0 1 100.0 0.00
Montenegro 3 2 0 3 66.7 0.00
Morocco 11 7 0 7 63.6 0.00
Netherlands 1,073 550 14 852 51.3 1.30
Nigeria 1 1 1 1 100.0 100.00
Norway 510 255 7 461 50.0 1.37
Pakistan 1 0 0 1 0.0 0.00
Palau 24 20 3 20 83.3 12.50
Panama 2,071 1,234 107 1,832 59.6 5.17

40
PORT STATE CONTROL - ADJUSTING COURSE
Flag
Nr o
f In
spec
tions
Insp
ectio
ns
with
de
ficie
ncie
s
Insp
ectio
ns
with
de
tent
ions
Nr o
f In
divi
dual
sh
ips
insp
ecte
d
% o
f In
spec
tions
w
ith
defic
ienc
ies
% o
f In
spec
tions
w
ith
dete
ntio
ns
Peru 1 1 0 1 100.0 0.00
Philippines 51 37 0 47 72.5 0.00
Poland 51 22 3 35 43.1 5.88
Portugal 138 79 3 116 57.2 2.17
Qatar 5 3 0 5 60.0 0.00
Russian Federation 461 290 22 379 62.9 4.77
Saint Kitts and Nevis 107 84 9 79 78.5 8.41
Saint Vincent and the Grenadines 251 185 29 178 73.7 11.55
Sao Tome and Principe 1 0 0 1 0.0 0.00
Saudi Arabia 32 12 0 32 37.5 0.00
Seychelles 6 1 0 4 16.7 0.00
Sierra Leone 83 75 8 62 90.4 9.64
Singapore 594 264 5 561 44.4 0.84
Slovenia 2 1 0 2 50.0 0.00
Spain 61 28 2 52 45.9 3.28
Sri Lanka 7 3 1 6 42.9 14.29
Sweden 109 33 0 81 30.3 0.00
Switzerland 36 22 0 31 61.1 0.00
Syrian Arab Republic 6 5 0 5 83.3 0.00
Taiwan, China 7 4 0 7 57.1 0.00
Tanzania, United Republic of 89 86 13 60 96.6 14.61
Thailand 30 21 4 28 70.0 13.33
Togo 143 134 17 84 93.7 11.89
Tunisia 15 13 2 11 86.7 13.33
Turkey 431 268 20 358 62.2 4.64
Tuvalu 7 6 0 6 85.7 0.00
Ukraine 61 52 2 50 85.2 3.28
United Arab Emirates 5 4 0 3 80.0 0.00
United Kingdom 441 224 4 384 50.8 0.91
United States 61 44 1 60 72.1 1.64
Vanuatu 106 84 9 93 79.2 8.49
Venezuela 3 0 0 3 0.0 0.00
Vietnam 3 3 1 3 100.0 33.33
Unknown 2 2 2 2 100.0 100.00

41ANNUAL REPORT 2014

42
PORT STATE CONTROL - ADJUSTING COURSE
Flag
Nr o
f In
spec
tions
Insp
ectio
ns
with
de
tent
ions
% o
f In
spec
tions
w
ith
dete
ntio
ns
Exce
ss o
f av
erag
e 20
14
Det
entio
ns %
20
13
Exce
ss o
f av
erag
e 20
13
Moldova, Republic of 178 26 15 11 14.1 10.36
Tanzania, United Republic of 89 13 15 11 19.6 15.85
Egypt 21 3 14 11 0.0 -3.78
Thailand 30 4 13 10 0.0 -3.78
Palau 24 3 13 9 20.0 16.22
Togo 143 17 12 9 15.5 11.73
Saint Vincent and the Grenadines 251 29 12 8 9.0 5.25
Cook Islands 127 14 11 8 16.8 13.05
Belize 203 22 11 8 11.2 7.39
Cambodia 132 14 11 7 11.9 8.08
Comoros 68 7 10 7 12.2 8.45
Algeria 20 2 10 7 13.3 9.56
Sierra Leone 83 8 10 6 8.7 4.96
Curacao 63 6 10 6 7.4 3.58
Vanuatu 106 9 8 5 7.8 4.00
Saint Kitts and Nevis 107 9 8 5 11.7 7.87
Poland 51 3 6 3 3.8 0.00
Panama 2,071 107 5 2 5.6 1.86
Antigua and Barbuda 1,140 55 5 2 4.1 0.28
Russian Federation 461 22 5 1 4.4 0.65
Turkey 431 20 5 1 3.0 -0.79
Lebanon 22 1 5 1 0.0 -3.78
Lithuania 50 2 4 1 3.8 0.00
Only flags with 20 and more port State control inspections in 2014 and with a detention percentage exceeding the average
percentage of 3.32% are recorded in this graph.
2014 detentions per flag, exceeding average percentage

43ANNUAL REPORT 2014
2014 detentions per flag, exceeding average percentage
■ Only flags with 20 and more port State control inspections in 2014 and with a detention percentage exceeding the average
percentage of 3.32% are recorded in this graph. In 2013 the average detentions percentage was 3.78%.
■ The grey column represents the 2014 average detention percentage (3.32%).
2014 detentions per flag, exceeding average percentage
Lithuania
Lebanon
Turkey
Russian Federation
Antigua and Barbuda
Panama
Poland
Saint Kitts and Nevis
Vanuatu
Curacao
Sierra Leone
Algeria
Comoros
Cambodia
Belize
Cook Islands
Saint Vincent and the Grenadines
Togo
Palau
Thailand
Egypt
Tanzania, United Republic of
Moldova, Republic of
0.00 5.00 10.00 15.00 20.00 25.00
Detention percentage 2014
Detention percentage 2013
Average dentention % 2014

44
PORT STATE CONTROL - ADJUSTING COURSE
Inspections and detentions 2014 PER SHIP TYPE
Ship type
Nr o
f Ins
pect
ions
Insp
ectio
ns w
ith
defic
ienc
ies
% o
f ins
pect
ions
w
ith d
efici
enci
es
Nr o
f Ind
ivid
ual
ship
s in
spec
ted
Insp
ectio
ns w
ith
dete
ntio
ns
% o
f det
entio
ns
to in
spec
tions
20
14
% o
f det
entio
ns
to in
spec
tions
20
13
% o
f det
entio
ns
to in
spec
tions
20
12
+ /
- ave
rage
de
tent
ion
3.32
%
Bulk carrier 3,547 1,993 56 3,202 113 3.19 3.55 2.60 -0.13
Chemical tanker 1,586 709 45 1,391 22 1.39 1.70 1.67 -1.93
Combination carrier 9 2 22 8 - 0.00 0.00 0.00 -3.32
Commercial yacht 156 85 54 155 5 3.21 6.00 0.00 -0.12
Container 1,911 921 48 1,652 29 1.52 2.56 2.62 -1.80
Gas carrier 428 163 38 389 9 2.10 1.56 1.10 -1.22
General cargo/multipurpose 5,558 3,664 66 4,069 305 5.49 6.28 5.99 2.17
Heavy load 47 25 53 45 - 0.00 2.78 9.68 -3.32
High speed passenger craft 73 49 67 44 2 2.74 1.41 2.86 -0.58
NLS tanker 53 22 42 48 - 0.00 0.00 0.00 -3.32
Offshore supply 524 275 52 504 11 2.10 1.08 2.12 -1.22
Oil tanker 1,359 539 40 1,253 19 1.40 1.55 1.21 -1.92
Other 163 119 73 138 10 6.13 5.23 5.50 2.81
Other special activities 704 382 54 660 22 3.13 2.32 4.34 -0.20
Passenger ship 324 168 52 255 3 0.93 0.59 1.72 -2.39
Refrigerated cargo 303 195 64 253 14 4.62 5.25 4.23 1.30
Ro-Ro cargo 780 393 50 681 24 3.08 2.89 3.64 -0.24
Ro-Ro passenger ship 530 310 58 279 9 1.70 1.18 1.83 -1.62
Special purpose ship 125 66 53 117 2 1.60 0.78 1.68 -1.72
Tug 250 134 54 234 13 5.20 5.88 3.39 1.88
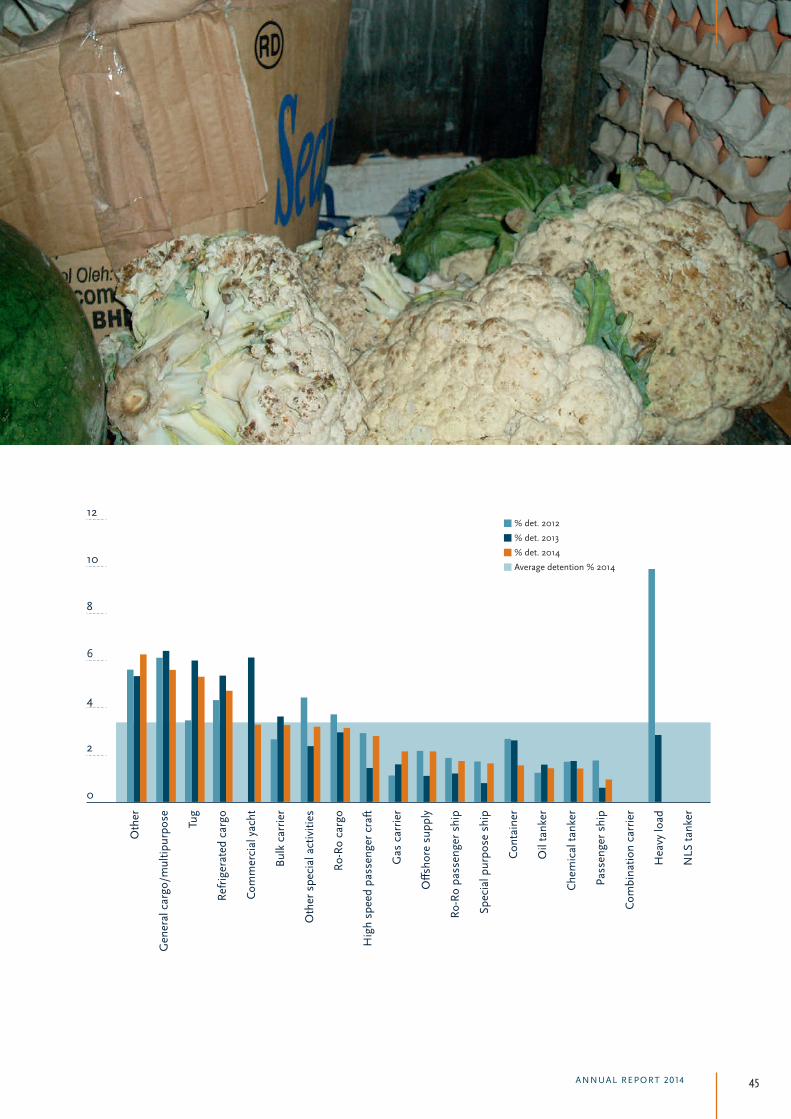
45ANNUAL REPORT 2014
12
10
8
6
4
2
0
% det. 2012
% det. 2013
% det. 2014
Average detention % 2014
Oth
er
Gen
eral
car
go/m
ultip
urpo
se Tug
Refr
iger
ated
car
go
Com
mer
cial
yac
ht
Bulk
car
rier
Oth
er s
peci
al a
ctiv
ities
Ro-R
o ca
rgo
Hig
h sp
eed
pass
enge
r cra
ft
Gas
car
rier
Offs
hore
sup
ply
Ro-R
o pa
ssen
ger s
hip
Spec
ial p
urpo
se s
hip
Cont
aine
r
Oil
tank
er
Che
mic
al ta
nker
Pass
enge
r shi
p
Com
bina
tion
carr
ier
Hea
vy lo
ad
NLS
tank
er

46
PORT STATE CONTROL - ADJUSTING COURSE
Major categories of deficiencies 2012-2014
2012 2013 2014
Deficiencies Main Group Category of deficiencies Def Def % Def Def % Def Def %
Certificates & Documentation
Crew Certificates 1,005 2.04 1,013 2.06 1,541 3.35
Documents 3,297 6.69 3,069 6.25 3,491 7.59
Ship Certificates 2,856 5.80 2,754 5.61 2,640 5.74
Structural Condition 2,216 4.50 2,202 4.49 1,904 4.14
Water/Weathertight condition 2,121 4.31 2,111 4.30 2,015 4.38
Emergency Systems 2,029 4.12 2,184 4.45 2,092 4.55
Radio Communication 1,476 3.00 1,301 2.65 1,240 2.70
Cargo operations including equipment 319 0.65 329 0.67 234 0.51
Fire safety 7,488 15.20 6,657 13.57 6,176 13.43
Alarms 398 0.81 490 1.00 392 0.85
Working and Living Conditions (ILO 147)**
Living Conditions 2,182 4.43 1,946 3.97 759 1.65
Working conditions 5,067 10.29 4,579 9.33 2,195 4.77
Working and Living Conditions (MLC, 2006)*
MLC, 2006 Title 1 14 0.03 57 0.12
MLC, 2006 Title 2 88 0.18 324 0.70
MLC, 2006 Title 3 258 0.53 1,352 2.94
MLC, 2006 Title 4 390 0.79 2,218 4.82
Safety of Navigation 6,816 13.84 6,861 13.98 6,195 13.47
Life saving appliances 4,393 8.92 4,526 9.22 4,016 8.73
Dangerous goods 98 0.20 100 0.20 107 0.23
Propulsion and auxiliary machinery 2,442 4.96 2,710 5.52 2,234 4.86
Pollution prevention
Anti Fouling 23 0.05 25 0.05 17 0.04
Marpol Annex I 1,127 2.29 1,060 2.16 874 1.90
Marpol Annex II 29 0.06 30 0.06 27 0.06
Marpol Annex III 12 0.02 9 0.02 4 0.01
Marpol Annex IV 324 0.66 341 0.69 344 0.75
Marpol Annex V 303 0.62 889 1.81 596 1.30
Marpol Annex VI 449 0.91 492 1.00 458 1.00
ISM 1,736 3.52 1,821 3.71 1,801 3.92
ISPS 485 0.98 401 0.82 337 0.73
Other 570 1.16 424 0.86 339 0.74
* On 20 August 2013 the Maritime Labour Convention 2006 entered into force. Only Member States of the Paris MoU
that had ratified the MLC, 2006 on or before 20 August 2012 were entitled to conduct PSC inspections on MLC,2006
requirements from 20 August 2013.
** For Member States of the Paris MoU that have not ratified the MLC, 2006, enforcement of the Merchant Shipping
Convention (ILO 147) and the protocol of 1996 to the Merchant Shipping Convention (ILO P147) will initially continue.

47ANNUAL REPORT 2014
Major categories of deficiencies 2012-2014
Top 5 categories of deficiencies 2014
Category of deficiencies Deficiencies % Deficiencies
Safety of Navigation 6,195 13.47
Fire safety 6,176 13.43
Life saving appliances 4,016 8.73
Certificate & Documentation - Documents 3,491 7.59
Certificate & Documentation - Ship Certificates 2,640 5.74
Top 5 deficiencies 2014
Deficiencies Deficiencies % Deficiencies
ISM 1,801 3.92
Charts 1,298 2.82
Nautical publications 1,267 2.76
Fire doors/openings in fire-resisting divisions 1,189 2.59
Records of seafarers' daily hours of work or rest 798 1.74

48
PORT STATE CONTROL - ADJUSTING COURSE
MLC Deficiencies per Area
Nr M
LC
Defi
cien
cies
% o
f Tot
al o
f Nr.
MLC
defi
cien
cies
Nr D
etai
nabl
e M
LC D
efici
enci
es
% o
f Det
aina
ble
defic
ienc
ies
of
MLC
defi
cien
cies
MLC,2006 Ship’s certificates and documents 137 2.49 5 3.6
Area 1 Minimum age of seafarers 3 0.05 0 0.0
Area 2 Medical certification of seafarers 160 2.91 4 2.5
Area 3 Qualifications of seafarers 17 0.31 0 0.0
Area 4 Seafarers’ employment agreements 238 4.33 22 9.2
Area 5 Use of any licensed or certified or regulated private recruit-ment and placement service for seafarers
15 0.27 0 0.0
Area 6 Hours of Works or rest 1,152 20.94 28 2.4
Area 7 Manning levels for the ship 81 1.47 24 29.6
Area 8 Accommodation 436 7.92 26 6.0
Area 9 On-board recreational facilities 6 0.11 0 0.0
Area 10 Food and catering 792 14.39 27 3.4
Area 11 Health and safety and accident prevention 2,059 37.42 50 2.4
Area 12 on-board medical care 191 3.47 8 4.2
Area 13 On-board complaint procedure 94 1.71 5 5.3
Area 14 Payment of wages 121 2.20 60 49.6
Grand Total 5,502 100.00 259 4.7
MLC deficiencies top 5
Category of deficiencies Deficiencies % Deficiencies
Records of seafarers' daily hours of work or rest 626 11.38
Electrical 246 4.47
Shipboard working arrangements 212 3.85
Ropes and wires 202 3.67
Maximum hours of work or minimum hours of rest 200 3.64
MLC detainable deficiencies top 5
Deficiencies Detainable deficiencies % Deficiencies
Wages 52 20.08
Manning specified by the minimum safe manning doc 24 9.27
Seafarers' employment agreement (SEA) 22 8.49
Records of seafarers' daily hours of work or rest 15 5.79
Sanitary Facilities 14 5.41
Maritime Labour Convention, 2006

49ANNUAL REPORT 2014ANNUAL REPORT 2014 49

50
PORT STATE CONTROL - ADJUSTING COURSE
Recognized Organization
Tota
l nu
mbe
r of
insp
ectio
ns*
Num
ber o
f in
divi
dual
sh
ips
insp
ecte
d*
Tota
l nu
mbe
r of
dete
ntio
ns**
Det
entio
n-%
of
tota
l nu
mbe
r of
insp
ectio
ns
+/-
Pe
rcen
tage
of
Ave
rage
(0
.33%
)
Det
entio
n-%
of
indi
vidu
al
ship
s
+/-
Pe
rcen
tage
of
Ave
rage
(0
.39%
)
American Bureau of Shipping ABS 1,900 1,754 1 0.05 -0.28 0.06 -0.33
ASIA Classification Society ACS 13 13 0 - -0.33 - -0.39
Bulgarian Register of Shipping BRS 89 57 2 2.25 1.92 3.51 3.12
Bureau Veritas BV 3,863 3,139 13 0.34 0.01 0.41 0.02
China Classification Society CCS 279 260 0 - -0.33 - -0.39
Columbus American Register COLAM-REG
28 19 2 7.14 6.81 10.53 10.14
CR Classification Society CRCS 14 12 0 - -0.33 - -0.39
Croatian Register of Shipping CRS 54 41 0 - -0.33 - -0.39
Det Norske Veritas DNV 3,427 3,068 1 0.03 -0.30 0.03 -0.36
DNV GL AS DNVGL 1,718 1,569 0 - -0.33 - -0.39
Dromon Bureau of Shipping DBS 182 114 2 1.10 0.77 1.75 1.36
Germanischer Lloyd GL 4,132 3,345 12 0.29 -0.04 0.36 -0.03
Global Marine Bureau Inc. GMB 24 19 1 4.17 3.84 5.26 4.87
Global Shipping Bureau Inc GSB 15 13 0 - -0.33 - -0.39
Hellenic Register of Shipping HRS 21 16 0 - -0.33 - -0.39
Indian Register of Shipping IRS 23 20 0 - -0.33 - -0.39
Inspeccion y Clasificacion Maritima (INCLAMAR)
INCLA-MAR
12 9 1 8.33 8.00 11.11 10.72
Intermaritime Certification Services, ICS Class
ICS 32 25 0 - -0.33 - -0.39
International Maritime Register IMR 12 9 0 - -0.33 - -0.39
International Naval Surveys Bureau INSB 222 159 4 1.80 1.47 2.52 2.13
International Register of Shipping IS 116 85 6 5.17 4.84 7.06 6.67
International Ship Classification ISC 10 10 1 10.00 9.67 10.00 9.61
Iranian Classification Society IRCS 19 18 0 - -0.33 - -0.39
Isthmus Bureau of Shipping, S.A. IBS 63 49 2 3.17 2.84 4.08 3.69
Korean Register of Shipping KRS 364 341 0 - -0.33 - -0.39
Lloyd's Register LR 4,130 3,576 1 0.02 -0.31 0.03 -0.36
Macosnar Corporation MC 25 21 0 - -0.33 - -0.39
Maritime Bureau of Shipping MBS 38 23 1 2.63 2.30 4.35 3.96
Maritime Lloyd - Georgia MLG 44 34 0 - -0.33 - -0.39
National Shipping Adjuster Inc. NASHA 24 22 0 - -0.33 - -0.39
Nippon Kaiji Kyokai NKK 2,508 2,264 10 0.40 0.07 0.44 0.05
Other OTHER 122 107 2 1.64 1.31 1.87 1.48
Overseas Marine Certification Services
OMCS 30 26 1 3.33 3.00 3.85 3.46
Panama Marine Survey and Certification Services Inc.
PMSCS 13 9 0 - -0.33 - -0.39
Panama Maritime Documentation Services
PMDS 24 23 1 4.17 3.84 4.35 3.96
Panama Register Corporation PRC 39 33 2 5.13 4.80 6.06 5.67
Detentions of ships with RO related detainable deficiencies per Recognized Organization 2014(CASES IN WHICH 10 OR MORE INSPECTIONS ARE INVOLVED)

ANNUAL REPORT 2014 51
Detentions of ships with RO related detainable deficiencies per Recognized Organization 2014
Recognized Organization
Tota
l nu
mbe
r of
insp
ectio
ns*
Num
ber o
f in
divi
dual
sh
ips
insp
ecte
d*
Tota
l nu
mbe
r of
dete
ntio
ns *
*
Det
entio
n-%
of
tota
l nu
mbe
r of
insp
ectio
ns
+/-
Pe
rcen
tage
of
Ave
rage
(0
,33%
)
Det
entio
n-%
of
indi
vidu
al
ship
s
+/-
Pe
rcen
tage
of
Ave
rage
(0
,39%
)
Panama Shipping Registrar Inc. PSR 17 15 1 5.88 5.55 6.67 6.28
Phoenix Register of Shipping PHRS 57 46 3 5.26 4.93 6.52 6.13
Polski Rejestr Statkow (Polish Register of Shipping)
PRS 156 113 1 0.64 0.31 0.88 0.49
Register of Shipping (Albania) RSA 19 13 0 - -0.33 - -0.39
Registro Italiano Navale RINA 1,137 929 2 0.18 -0.15 0.22 -0.17
Russian Maritime Register of Shipping
RMRS 1,258 976 8 0.64 0.31 0.82 0.43
Shipping Register of Ukraine SRU 179 137 2 1.12 0.79 1.46 1.07
Turkish Lloyd TL 216 175 0 - -0.33 - -0.39
Universal Shipping Bureau Inc. USB 37 29 1 2.70 2.37 3.45 3.06
Venezuelan Register of Shipping VRS 77 45 2 2.60 2.27 4.44 4.05
* As more than one Recognized Organization might have issued or endorsed statutory certificates with regard to the same
ship, an inspection can be relevant for more than one RO and might appear multiple times in this column.
** Only detentions with RO related detainable deficiencies are taken into account.
* Only ROs with 10 and more port State control inspections in 2014 and with a detention percentage exceeding the average
percentage of 0.33% are recorded in this graph. In 2013 the average detentions percentage was also 0.45%.
* The grey column represents the 2014 average detention percentage (0.33%).
% of detentions of ships with RO related detainable deficiencies per Recognized Organization 2013-2014(CASES IN WHICH MORE THAN 10 INSPECTIONS ARE INVOLVED )
Bureau VeritasNippon Kaiji Kyokai
Russian Maritime Register of ShippingPolski Rejestr Statkow (Polish Register of Shipping)
Dromon Bureau of ShippingShipping Register of Ukraine
OtherInternational Naval Surveys Bureau
Bulgarian Register of ShippingVenezuelan Register of Shipping
Maritime Bureau of ShippingUniversal Shipping Bureau Inc.
Isthmus Bureau of Shipping, S.A.Overseas Marine Certification Services
Global Marine Bureau Inc.Panama Maritime Documentation Services
Panama Register CorporationInternational Register of Shipping
Phoenix Register of ShippingPanama Shipping Registrar Inc.
Columbus American RegisterInspeccion y Clasificacion Maritima (INCLAMAR)
International Ship Classification
-2% 0% 2% 4% 6% 8% 10% 12% 14% 16%
Average detention percentage 2014 (0.33%)
+/- Percentage of Average 2013 (0.45%)
+/- Percentage of Average 2014 (0.33%)

52
PORT STATE CONTROL - ADJUSTING COURSE
Recognized Organization
Insp
ectio
ns
Det
entio
ns
Low
/med
ium
lim
it
Med
ium
/ h
igh
limit
Exce
ss F
acto
r
Perf
orm
ance
leve
l
DNV GL AS DNVGL 1718 0 44 24 -1.95
high
Det Norske Veritas DNV 10,219 7 228 181 -1.91
Lloyd's Register LR 11,485 10 255 205 -1.89
American Bureau of Shipping ABS 5,327 4 124 89 -1.89
China Classification Society CCS 769 0 22 8 -1.84
Registro Italiano Navale RINA 3,072 6 75 48 -1.70
Korean Register of Shipping KRS 936 1 26 11 -1.66
Bureau Veritas BV 11,239 37 250 200 -1.61
Germanischer Lloyd GL 12,674 47 280 227 -1.56
Nippon Kaiji Kyokai NKK 6,894 24 158 118 -1.56
Turkish Lloyd TL 776 2 22 9 -1.22
Russian Maritime Register of Shipping RMRS 4,011 23 95 65 -1.21
Polski Rejestr Statkow (Polish Register of Shipping)
PRS 471 3 15 4 -0.28
Croatian Register of Shipping CRS 169 0 7 0 0.02
medium
Indian Register of Shipping IRS 73 0 4 0 0.20
Hellenic Register of Shipping HRS 61 0 4 0 0.23
Other OTHER 437 7 14 3 0.34
Register of Shipping (Albania) RSA 93 1 5 0 0.34
Isthmus Bureau of Shipping, S.A. IBS 186 3 7 0 0.40
Macosnar Corporation MC 73 1 4 0 0.41
Shipping Register of Ukraine SRU 594 12 18 6 0.51
Dromon Bureau of Shipping DBS 484 10 15 4 0.53
International Naval Surveys Bureau INSB 667 14 20 7 0.55
Intermaritime Certification Services, ICS Class
ICS 79 2 4 0 0.58
Maritime Lloyd - Georgia MLG 164 4 7 0 0.60
Panama Register Corporation PRC 111 3 5 0 0.63
Maritime Bureau of Shipping MBS 101 3 5 0 0.67
Venezuelan Register of Shipping VRS 175 5 7 0 0.71
Global Marine Bureau Inc. GMB 125 4 6 0 0.74
Panama Maritime Documentation Services PMDS 81 3 4 0 0.77
Overseas Marine Certification Services OMCS 98 4 5 0 0.87
Phoenix Register of Shipping PHRS 171 6 7 0 0.87
Universal Shipping Bureau Inc. USB 129 5 6 0 0.89
Global Shipping Bureau Inc GSB 78 4 4 0 0.98
Bulgarian Register of Shipping BRS 256 10 9 1 1.21low
International Register of Shipping IS 390 16 13 3 1.64
Inspeccion y Clasificacion Maritima (INCLAMAR)
INCLAMAR 65 7 4 0 4.40 very low
In this table only Recognized Organizations that had 60 or more inspections in a 3-year period are taken into account.
The formula is identical to the one used for the White, Grey and Black list. However, the values for P and Q are adjusted to
P=0.02 and Q=0.01.
Recognized Organization performance table 2012-2014

53ANNUAL REPORT 2014
Recognized Organization performance table 2012-2014
Recognized Organization
Cert
ifica
tes
Nr o
f RO
de
tain
able
de
ficie
ncie
s
%
defe
icie
ncie
s /
cert
ifica
tes
American Bureau of Shipping ABS 14,720 4 0.03
Bulgarian Register of Shipping BRS 834 4 0.48
Bureau Veritas BV 28,939 24 0.08
China Classification Society CCS 2,420 0 0.00
Croatian Register of Shipping CRS 497 0 0.00
Det Norske Veritas DNV 23,031 5 0.02
DNV GL AS DNVGL 7,476 0 0.00
Dromon Bureau of Shipping DBS 1,827 7 0.38
Germanischer Lloyd GL 33,209 21 0.06
Intermaritime Certification Services, ICS Class ICS 140 0 0.00
International Naval Surveys Bureau INSB 1,580 13 0.82
International Register of Shipping IS 839 26 3.10
Isthmus Bureau of Shipping, S.A. IBS 313 3 0.96
Korean Register of Shipping KRS 3,426 0 0.00
Lloyd's Register LR 26,439 4 0.02
Maritime Bureau of Shipping MBS 392 4 1.02
Maritime Lloyd - Georgia MLG 429 0 0.00
Nippon Kaiji Kyokai NKK 23,946 22 0.09
Other OTHER 354 6 1.69
Overseas Marine Certification Services OMCS 187 1 0.53
Panama Register Corporation PRC 124 3 2.42
Phoenix Register of Shipping PHRS 321 4 1.25
Polski Rejestr Statkow (Polish Register of Shipping) PRS 1,061 8 0.75
Registro Italiano Navale RINA 7,436 2 0.03
Russian Maritime Register of Shipping RMRS 11,128 24 0.22
Shipping Register of Ukraine SRU 1,536 9 0.59
Turkish Lloyd TL 1,061 0 0.00
Universal Shipping Bureau Inc. USB 153 6 3.92
Venezuelan Register of Shipping VRS 782 13 1.66
Number of certificates covering RO responsible detainable deficiencies 2014

54
PORT STATE CONTROL - ADJUSTING COURSE
Flags on the “Black List” in combination with Recognized Organizations that act on their behalf with a combined lower performance 2012-2014
“Black” flags with corresponding RO with an excess factor ≥ 0.50 detentions period 2012-2014
Flag State Recognized Organization
Nr o
f In
spec
tions
Insp
ectio
ns
with
de
tent
ions
Det
entio
ns
% (+/-
) Av
erag
e de
t %
1.4
7
Belize International Naval Surveys Bureau 57 0 0.00 -1.47
Cambodia Global Marine Bureau Inc. 24 1 4.17 2.70
International Naval Surveys Bureau 13 0 0.00 -1.47
International Register of Shipping 14 0 0.00 -1.47
Shipping Register of Ukraine 59 1 1.69 0.22
Comoros Bulgarian Register of Shipping 16 0 0.00 -1.47
International Naval Surveys Bureau 21 1 4.76 3.29
Phoenix Register of Shipping 14 0 0.00 -1.47
Shipping Register of Ukraine 12 0 0.00 -1.47
Venezuelan Register of Shipping 10 0 0.00 -1.47
Cook Islands Shipping Register of Ukraine 11 0 0.00 -1.47
Moldova, Republic of Bulgarian Register of Shipping 30 0 0.00 -1.47
Dromon Bureau of Shipping 17 1 5.88 4.41
Maritime Bureau of Shipping 36 1 2.78 1.31
Maritime Lloyd - Georgia 14 0 0.00 -1.47
Shipping Register of Ukraine 45 1 2.22 0.75
Venezuelan Register of Shipping 15 1 6.67 5.20
Saint Vincent and the Grenadines International Naval Surveys Bureau 55 0 0.00 -1.47
Sierra Leone Dromon Bureau of Shipping 62 0 0.00 -1.47
International Register of Shipping 13 0 0.00 -1.47
Tanzania, United Republic of Bulgarian Register of Shipping 12 0 0.00 -1.47
Maritime Lloyd - Georgia 26 0 0.00 -1.47
Venezuelan Register of Shipping 37 1 2.70 1.23
Togo Dromon Bureau of Shipping 82 0 0.00 -1.47
International Naval Surveys Bureau 39 2 5.13 3.66
Venezuelan Register of Shipping 14 1 7.14 5.67
Note: Criteria were developed to identify flag States and Recognized Organizations acting on their behalf that jointly have
a lower performance. The targeted flags are the flags placed on the “Black List”. The targeted Recognized Organizations
are ROs which act on behalf of a flag on the “Black List” and have an excess factor of ≥ 0.50 on the RO performance list in
combination with ≥ 10 inspections for this flag.

55ANNUAL REPORT 2014
ROs with corresponding “Black” flags with an average detention % > 1.47% period 2012-2014
Recognized Organization
Flag State
Nr o
f In
spec
tions
Insp
ectio
ns
with
de
tent
ions
Det
entio
ns
% (+/-
) Av
erag
e de
t %
1.4
7
Dromon Bureau of Shipping Moldova, Republic of 17 1 5.88 4.41
Global Marine Bureau Inc. Cambodia 24 1 4.17 2.70
International Naval Surveys Bureau Comoros 21 1 4.76 3.29
International Naval Surveys Bureau Togo 39 2 5.13 3.66
Maritime Bureau of Shipping Moldova, Republic of 36 1 2.78 1.31
Shipping Register of Ukraine Cambodia 59 1 1.69 0.22
Shipping Register of Ukraine Moldova, Republic of 45 1 2.22 0.75
Venezuelan Register of Shipping Moldova, Republic of 15 1 6.67 5.20
Venezuelan Register of Shipping Togo 14 1 7.14 5.67
Venezuelan Register of Shipping Tanzania, United Republic of 37 1 2.70 1.23
Note: To identify the poorest performing Recognized Organizations the average detention rate (1.47%) of the lower
performing combinations of flags and ROs has been used as a limit. The outcome is a list of Recognized Organizations
which performance on behalf of a flag on the Black list is poorer than the average performance of ROs performing
below average.

56
PORT STATE CONTROL - ADJUSTING COURSE
Flag
Faile
d to
cal
l at
indi
cate
d re
pair
yard
Jum
ped
dete
ntio
n
Multiple detentions
Tota
l Ban
ned
ship
s
1st ban 2nd ban 3rd ban
Belize 1 1 1 3
Cambodia 2 2
Moldova, Republic of 1 9 1 11
Panama 3 1 4
Russian Federation 1 1
Saint Kitts and Nevis 1 1 2
Saint Vincent and the Grenadines 1 8 9
Sierra Leone 1 2 3
Tanzania, United Republic of 1 2 12 1 16
Togo 3 3 6
Ukraine 1 1
Mongolia 1 1
Albania 1 1
Curacao 1 1
Vanuatu 1 1
Comoros 1 1
Total 13 4 42 4 0 63
Refusal of access (banning) per flag 2012-2014
50454035302520151050
Failed to callat indicatedrepair yard
Jumpeddetention
Multipledetentions
1st ban
2nd ban
Refusal of access 2005-2014 2012-201430
25
20
15
10
5
020072006 2008 2009 2010 2011 2012 20142013
Multiple detentionsFailed to call at indicated repair yard
Jumped detentionsNo valid ISM code certificate
2005

Number of ships inspected during CIC
Nr o
f in
divi
dual
sh
ips
insp
ecte
d du
ring
CIC
Nr o
f in
spec
tions
pe
rfor
med
w
ith a
CIC
qu
estio
nnai
re
Nr o
f in
spec
tions
w
ithou
t a C
IC
ques
tionn
aire
Inspections 4,283 4,041 364
Inspections with detentions 132 117 15
Detentions with CIC-topic related deficiencies 16 16 1
Number of inspections performed per ship during CIC N
r of s
hips
% o
f tot
al
1 4,041 100.0
2 0 0.0
3 0 0.0
Total 3,843 100.0
Ship type
Nr o
f in
spec
tions
Nr o
f de
tent
ions
dete
ntio
n as
% o
f in
spec
tions
dete
ntio
ns
CIC
-topi
c re
late
d
dete
ntio
ns
CIC
-topi
c re
late
d as
% o
f in
spec
tions
Bulk carrier 948 26 2.7 3 0.3
Chemical tanker 376 7 1.9 0 0.0
Combination carrier 2 0 0.0 0 0.0
Commercial yacht 17 0 0.0 0 0.0
Container 407 2 0.5 1 0.2
Gas carrier 113 2 1.8 0 0.0
General cargo/multipurpose 1,207 58 4.8 11 0.9
Heavy load 5 0 0.0 0 0.0
High speed passenger craft 1 0 0.0 0 0.0
NLS tanker 11 0 0.0 0 0.0
Offshore supply 94 0 0.0 0 0.0
Oil tanker 325 2 0.6 0 0.0
Other 34 2 5.9 1 2.9
Other special activities 139 5 3.6 0 0.0
Passenger ship 32 2 6.3 0 0.0
Refrigerated cargo 73 4 5.5 0 0.0
Ro-Ro cargo 177 4 2.3 0 0.0
Ro-Ro passenger ship 25 3 12.0 0 0.0
Special purpose ship 17 0 0.0 0 0.0
Tug 38 0 0.0 0 0.0
Total 4,041 117 2.9 16 0.4
CIC 2014 Hours of Rest
57ANNUAL REPORT 2014

58
PORT STATE CONTROL - ADJUSTING COURSE
Number of ships inspected during CIC
Nr o
f in
divi
dual
sh
ips
insp
ecte
d du
ring
HAV
EP
Nr o
f in
spec
tions
pe
rfor
med
w
ith a
HAV
EP
ques
tionn
aire
Nr o
f in
spec
tions
w
ithou
t a
HAV
EP
ques
tionn
aire
Inspections 251 232 19
Inspections with detentions 2 2 0
Detentions with HAVEP-topic related deficiencies 2 2 0
Number of inspections performed per ship during HAVEP N
r of s
hips
% o
f tot
al1 218 96.9
2 7 3.1
3 0 0.0
Total 225 100.0
HAVEP-topic related deficienciesInspections* Detentions
HAVEP-topic related**
Detentions HAVEP-topic related with RO responsibility***
1109 Decision-support system for masters on pass. ships 3
1302 SAR co-operation plan for pass.ships trad on fixe 18
2101 Closing devices/watertight doors 18
4108 Muster list 10
4109 Fire drills 19 1
4110 Abandon ship drills 20 1
4111 Damage control plan 3
4114 Emergency source of power - Emergency generator 9 1
7122 Fire control plan 12
7125 Evaluation of crew performance (fire drills) 11
11131 On board training and instructions 7
* Number of inspections with this deficiency. One inspection can have multiple deficiencies.
** Number of inspections with this deficiency recorded as ground for detention.
*** Number of inspections with this deficiency recorded as ground for detention and RO related.
2013 Harmonized Verification Programme on Passenger ships

2013 Harmonized Verification Programme on Passenger ships
59ANNUAL REPORT 2014
Explanatory note – “White”, “Grey” and “Black List”
The performance of each Flag is
calculated using a standard formula for
statistical calculations in which certain
values have been fixed in accordance
with agreed Paris MoU policy. Two
limits have been included in the
system, the ‘black to grey’ and the
‘grey to white’ limit, each with its own
specific formula:
ublack _ to_ grey = N ⋅ p+ 0.5+ z (N ⋅ p ⋅ (1− p)
uwhite_ to_ grey = N ⋅ p− 0.5− z (N ⋅ p ⋅ (1− p)
In the formula “N” is the number
of inspections, “p” is the allowable
detention limit (yardstick), set to 7%
by the Paris MoU Port State Control
Committee, and “z” is the significance
requested (z=1.645 for a statistically
acceptable certainty level of 95%).
The result “u“ is the allowed number
of detentions for either the black or
white list. The “u“ results can be found
in the table. A number of detentions
above this ‘black to grey’ limit means
significantly worse than average, where
a number of detentions below the
‘grey to white’ limit means significantly
better than average. When the amount
of detentions for a particular Flag is
positioned between the two, the Flag
will find itself on the grey list. The
formula is applicable for sample sizes
of 30 or more inspections over a 3-year
period.
To sort results on the black or white
list, simply alter the target and repeat
the calculation. Flags which are still
significantly above this second target,
are worse than the flags which are
not. This process can be repeated to
create as many refinements as desired.
(Of course the maximum detention
rate remains 100%!) To make the
flags’ performance comparable, the
excess factor (EF) is introduced.
Each incremental or decremental
step corresponds with one whole
EF-point of difference. Thus the EF
is an indication for the number of
times the yardstick has to be altered
and recalculated. Once the excess
factor is determined for all flags,
the flags can be ordered by EF. The
excess factor can be found in the
last column of the White, Grey or
Black list. The target (yardstick) has
been set on 7% and the size of the
increment and decrement on 3%.
The White/Grey/Black lists have been
calculated in accordance with the
principles above*.
The graphical representation of the
system below is showing the direct
relations between the number of
inspected ships and the number
of detentions. Both axes have a
logarithmic character as the ‘black to
grey’ or the ‘grey to white’ limit.
The normative listing of Flags provides an independent categorization
that has been prepared on the basis of Paris MoU port State
inspection results over a 3-year period, based on binomial calculus.
Num
ber o
f Det
entio
ns
Number of Inspections
EF= 4EF= 3EF= 2EF= 1 BlackEF= 0 White
EF= -1
EF= -2
EF= 4 and above very high riskEF= 3 to 4 high riskEF= 2 to 3 medium to high riskEF= 1 to 2 medium risk
1000
100
10
1
* Explanatory notes can be found on www.parismou.org/publications
60
PORT STATE CONTROL - ADJUSTING COURSE
Secretariat Paris Memorandum of Understanding on Port State Control
Colophon
Layout and design
The KEY Agency
Photographs
Cover photo: Lithuania
Paris MoU Authorities
Secretariat
Address Secretariat
Koningskade 4
P.O. Box 16191
2500 BD The Hague
The Netherlands
Telephone: +31 70 456 1508
Fax: +31 70 456 1599
www.parismou.org
E-mail: [email protected]
Staff
Mr. Richard W.J. Schiferli
Secretary General
Mrs. Carien Droppers
Deputy Secretary General
Mr. Ivo Snijders
Secretary
Mr. Maarten Vlag
Secretary
Mr. Ronald Hulhoven
Secretary
Mr. Lourens van ‘t Wout
ICT Advisor
Mrs. Melany Cadogan - Eskici
Office Manager
Mrs. Ingrid de Vree
Management Assistant

61ANNUAL REPORT 2014
Paris MoU fact sheet – organizational structure
MaritimeAuthorities
EuropeanCommission
Co-operatingMaritime
Authorities
Observers:IMO, ILO,
other MoU’s
Port State Control Committee
MoU Advisory Board (MAB)
THETISInformation System
Paris MoU Secretariat
Taskforces
Technical Evaluation Group
Ship inspection services of
Paris MoU port States
Owners, Flags andclassification societies


TH
E P
AR
IS M
EM
OR
AN
DU
M O
F U
ND
ER
STA
ND
ING
ON
PO
RT
STA
TE
CO
NT
RO
L