Embed Size (px)
Citation preview
GRASIM
ADITYA BIRLA
Ref No.: GIL/CFD/SEC/20/148/SE
BSE Limited Dalai Street,
Phiroze Jeejeebhoy Towers, Fort, Mumbai - 400 001
Scrip Code: 500300
14th November 2019
The National Stock Exchange of India Limited Exchange Plaza, 5th Floor,
Plot No. C/1, G Block, Bandra-Kurla Complex, Bandra (East), Mumbai 400051
Symbol: GRASIM
Dear Sirs,
Sub: Presentation on Unaudited Financial Results of Grasim Industries Limited for the quarter/ half year ended 30th September 2019
This is further to our letter and email of date on the aforesaid subject.
We are attaching herewith a copy of the Presentation on the Unaudited Financial Results of
the Company•for the quarter/ half year ended 30th September 2019, which will be presented
to the investors and also posted on our websites, www.grasim.com and
www.adityabirla.com.
Thank you.
Yours faithfully,
Hutokshi Wadia President & Company Secretary
Encl. : as above
Cc: Luxembourg Stock Exchange Market & Surveillance Dept., P.O. Box 165, L-2011 Luxembourg,
Grand Duchy of Luxembourg, EUROPE
Citi Bank N.A. Depositary Receipt Services
388 Greenwich Street, 14th Floor
New York, NY 10013
Citi Bank N.A. Custodial Services FIFC, 11th Floor, C-54 & 55, G Block Bandra Kuria Complex
Bandra (East), Mumbai 400 051
Grasim Industries Limited Aditya Birla Centre, 'A' wing, 2nd Floor, S.K. Ahire Marg, Worli, Mumbai 400 030, India
T: +91 22 6652 5000 / 2499 5000 I F: +91 22 6652 5114 / 2499 5114 E: [email protected] I W: www.grasim.com I CIN: L17124MP1947PLC000410
Regd. Office : Birlagram, Nagda — 456 331 (M.P.)
ADITYA BIRLA
GRASIM Grasim Industries Limited
2
BIG IN YOUR LIFE
Earnings Presentation Q2FY20
BIG IN YOUR LIFE
Grasim Industries Limited
Earnings Presentation Q2FY20
ADITYA BIRLA
ADITYA BIRLA
UltraTech
Grasim Industries Limited | Earnings Presentation Q2 FY20
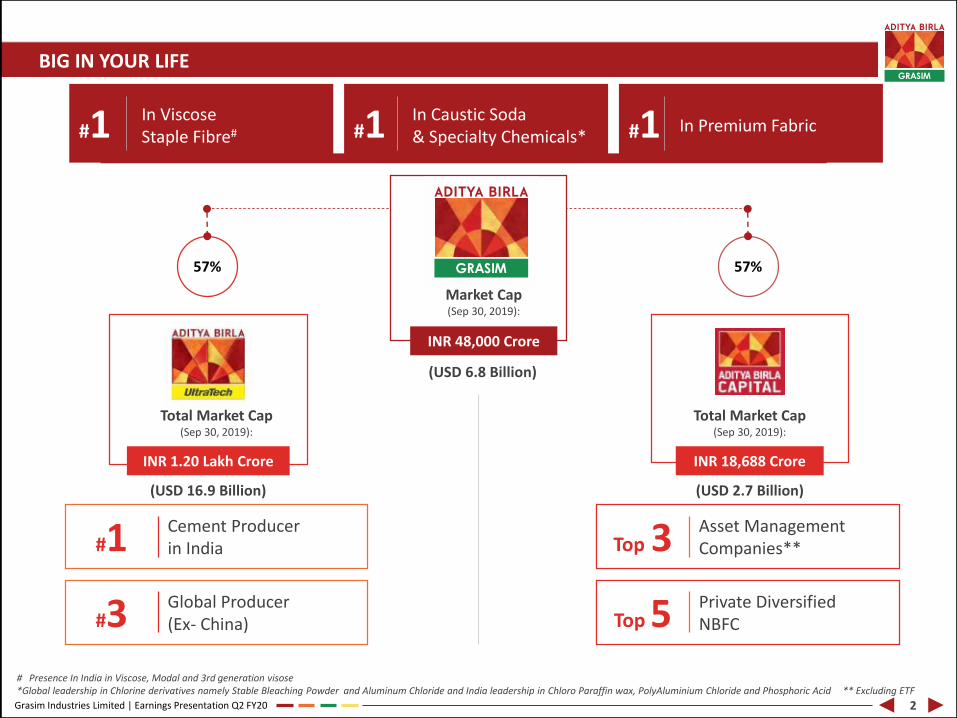
#1 #1 #1In Viscose Staple Fibre#
In Caustic Soda & Specialty Chemicals*
In Premium Fabric
BIG IN YOUR LIFE
Market Cap(Sep 30, 2019):
INR 48,000 Crore
Total Market Cap (Sep 30, 2019):
INR 18,688 Crore
(USD 2.7 Billion)
Top 3 Asset Management Companies**
Top 5 Private Diversified NBFC
Total Market Cap (Sep 30, 2019):
INR 1.20 Lakh Crore
(USD 16.9 Billion)
#1 Cement Producerin India
#3 Global Producer(Ex- China)
57%57%
# Presence In India in Viscose, Modal and 3rd generation visose*Global leadership in Chlorine derivatives namely Stable Bleaching Powder and Aluminum Chloride and India leadership in Chloro Paraffin wax, PolyAluminium Chloride and Phosphoric Acid ** Excluding ETF
(USD 6.8 Billion)
2
Table of Content
01
02
03
04
Key Highlights
Financial Overview
Business Performance
Appendix
ADITYA BIRLA
I
I
I I 1
1
ir-
KeyHighlights
ADITYA BIRLA
WI GRASIM
0-
0-
0-
0-
0-
Om
0- 4
Key Highlights Business PerformanceFinancial Overview
Grasim Industries Limited | Earnings Presentation Q2 FY20
Appendix
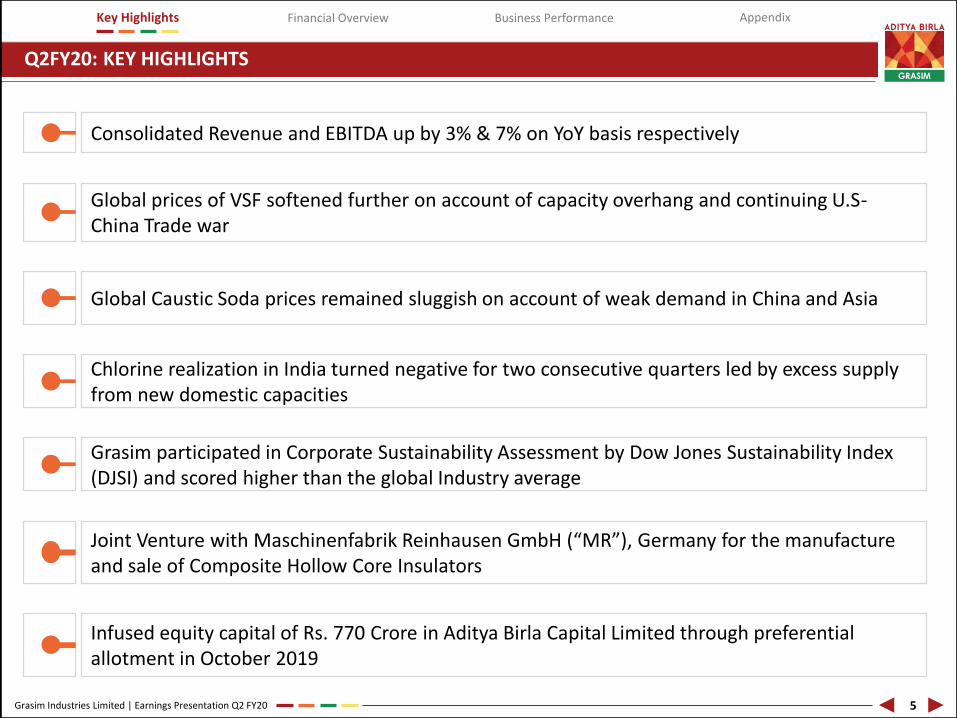
Q2FY20: KEY HIGHLIGHTS
Consolidated Revenue and EBITDA up by 3% & 7% on YoY basis respectively
Global prices of VSF softened further on account of capacity overhang and continuing U.S-China Trade war
Chlorine realization in India turned negative for two consecutive quarters led by excess supply from new domestic capacities
Grasim participated in Corporate Sustainability Assessment by Dow Jones Sustainability Index (DJSI) and scored higher than the global Industry average
Global Caustic Soda prices remained sluggish on account of weak demand in China and Asia
5
Joint Venture with Maschinenfabrik Reinhausen GmbH (“MR”), Germany for the manufacture and sale of Composite Hollow Core Insulators
Infused equity capital of Rs. 770 Crore in Aditya Birla Capital Limited through preferential allotment in October 2019
ADITYA BIRLA
10 41
I I !Financial
Overview
Financial Overview
Grasim Industries Limited | Earnings Presentation Q2 FY20
Key Highlights Business PerformanceFinancial Overview Appendix
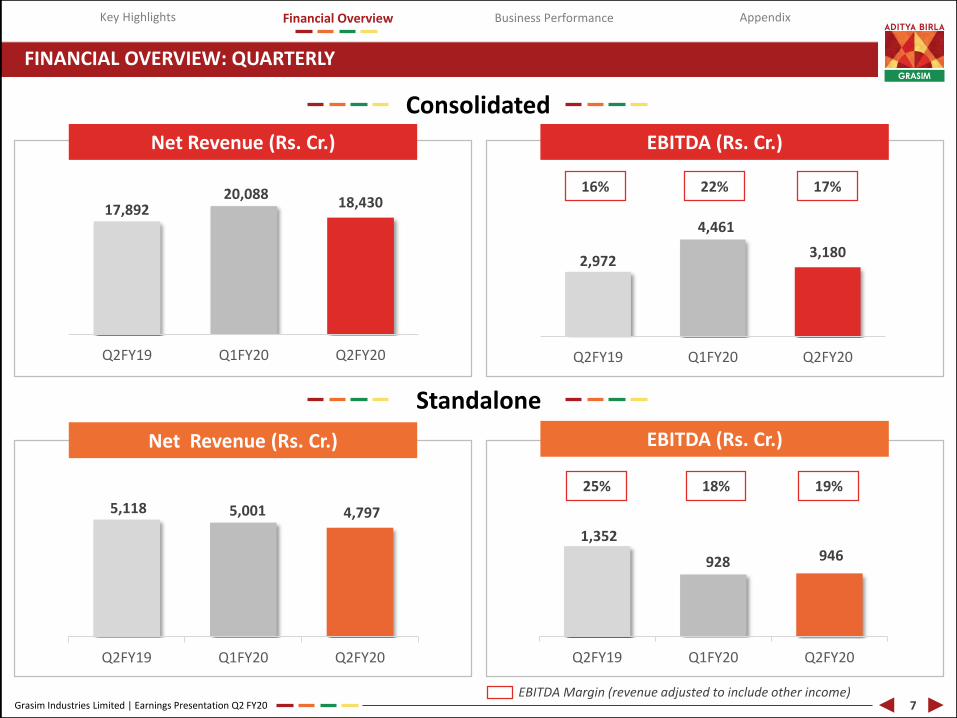
FINANCIAL OVERVIEW: QUARTERLY
EBITDA Margin (revenue adjusted to include other income)
Consolidated
Standalone
Net Revenue (Rs. Cr.) EBITDA (Rs. Cr.)
Net Revenue (Rs. Cr.) EBITDA (Rs. Cr.)
16% 22% 17%
7
25% 18% 19%
5,118 5,001 4,797
Q2FY19 Q1FY20 Q2FY20
1,352
928 946
Q2FY19 Q1FY20 Q2FY20
17,89220,088
18,430
Q2FY19 Q1FY20 Q2FY20
2,972
4,461
3,180
Q2FY19 Q1FY20 Q2FY20
Grasim Industries Limited | Earnings Presentation Q2 FY20
Key Highlights Business PerformanceFinancial Overview Appendix
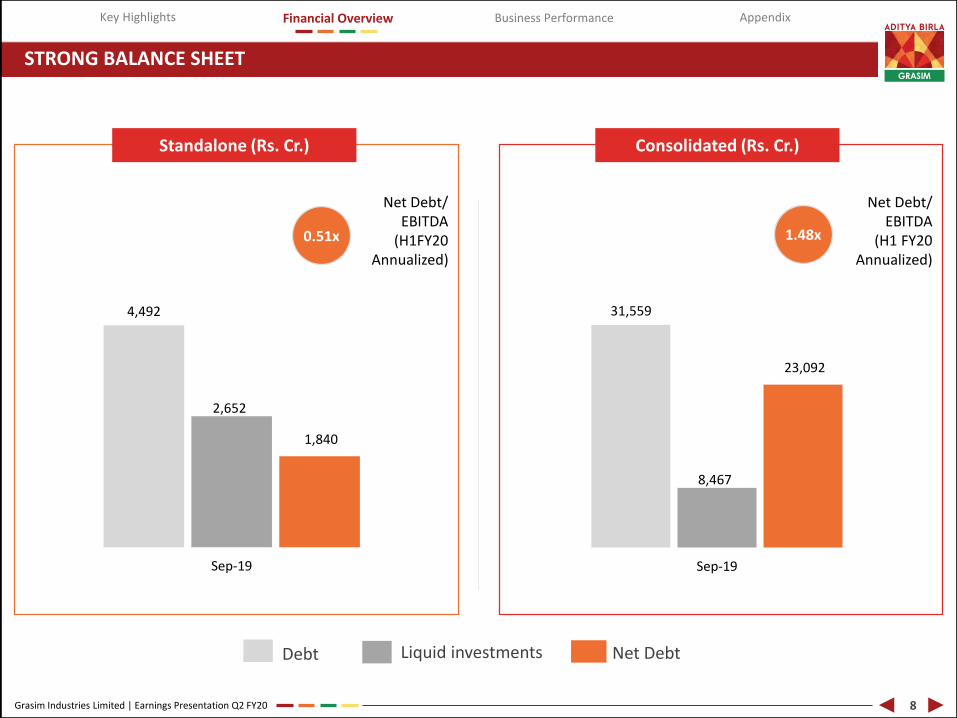
STRONG BALANCE SHEET
Standalone (Rs. Cr.) Consolidated (Rs. Cr.)
Net Debt/ EBITDA
(H1FY20 Annualized)
1.48x0.51x
Debt Liquid investments Net Debt
Net Debt/ EBITDA
(H1 FY20 Annualized)
8
4,492
2,652
1,840
Sep-19
31,559
8,467
23,092
Sep-19
Grasim Industries Limited | Earnings Presentation Q2 FY20
Key Highlights Business PerformanceFinancial Overview Appendix
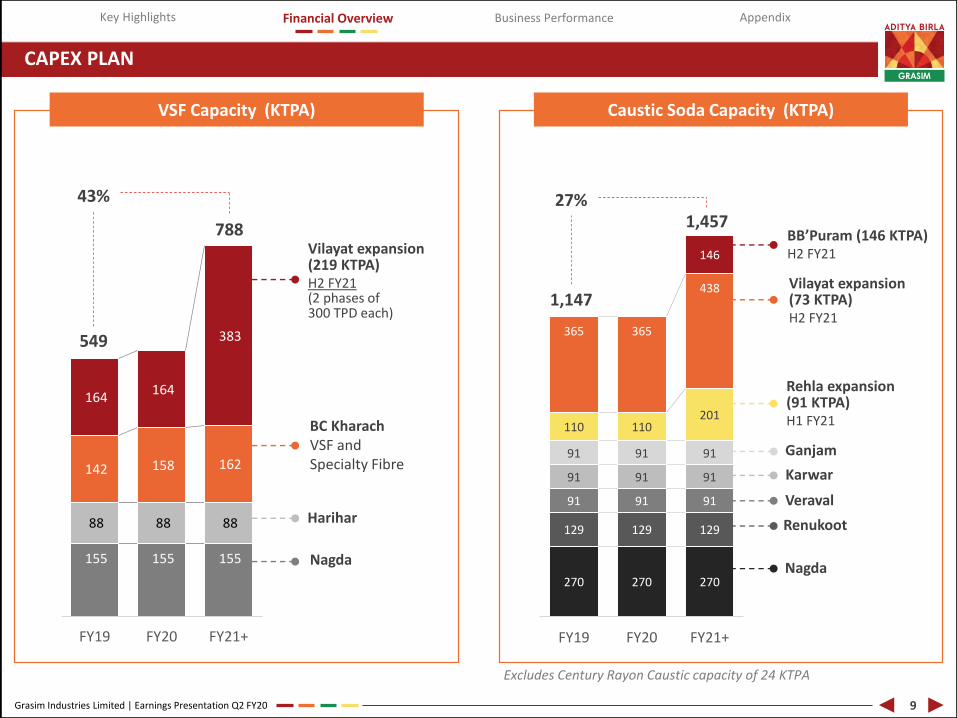
CAPEX PLAN
VSF Capacity (KTPA) Caustic Soda Capacity (KTPA)
155 155 155
88 88 88
142 158 162
164 164
383
FY19 FY20 FY21+
270 270 270
129 129 129
91 91 91
91 91 91
91 91 91
110 110201
365 365
438
146
FY19 FY20 FY21+
549
43%
788
1,147
27%1,457
Vilayat expansion(219 KTPA)H2 FY21 (2 phases of 300 TPD each)
BC KharachVSF and Specialty Fibre
Harihar
Nagda
BB’Puram (146 KTPA)H2 FY21
Vilayat expansion(73 KTPA)H2 FY21
Rehla expansion(91 KTPA)H1 FY21
Ganjam
Karwar
Veraval
Renukoot
Nagda
9
Excludes Century Rayon Caustic capacity of 24 KTPA
Grasim Industries Limited | Earnings Presentation Q2 FY20
Key Highlights Business PerformanceFinancial Overview Appendix
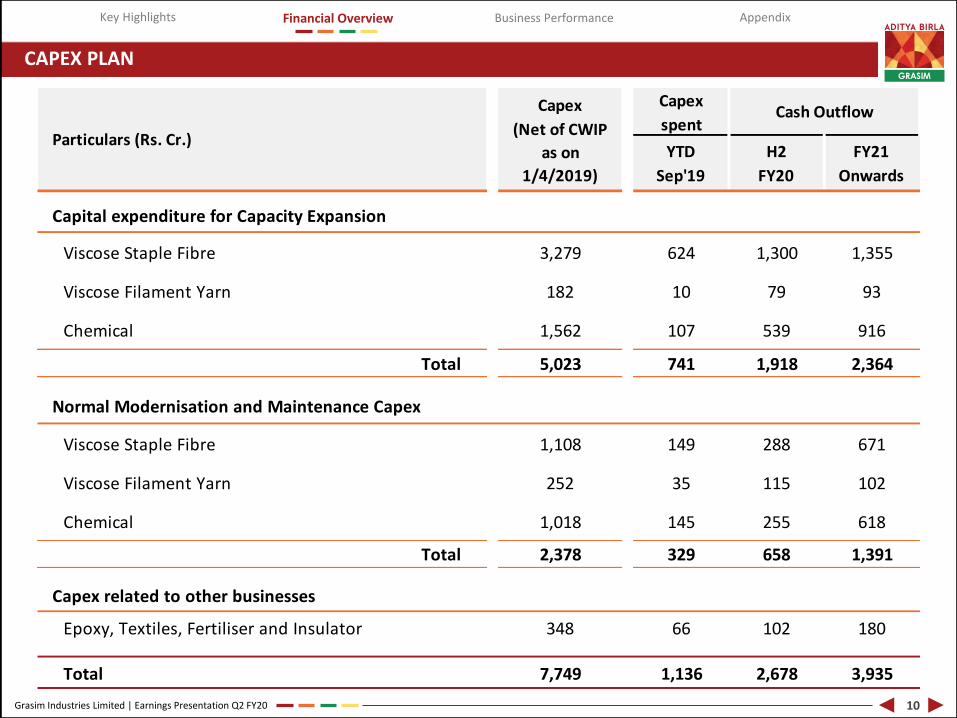
CAPEX PLAN
10
Capex
spent
Viscose Staple Fibre 3,279 624 1,300 1,355
Viscose Filament Yarn 182 10 79 93
Chemical 1,562 107 539 916
Total 5,023 741 1,918 2,364
Normal Modernisation and Maintenance Capex
Viscose Staple Fibre 1,108 149 288 671
Viscose Filament Yarn 252 35 115 102
Chemical 1,018 145 255 618
Total 2,378 329 658 1,391
Capex related to other businesses
Epoxy, Textiles, Fertiliser and Insulator 348 66 102 180
Total 7,749 1,136 2,678 3,935
Cash Outflow
YTD
Sep'19
H2
FY20
FY21
Onwards
Capital expenditure for Capacity Expansion
Particulars (Rs. Cr.)
Capex
(Net of CWIP
as on
1/4/2019)
Grasim Industries Limited | Earnings Presentation Q2 FY20
Key Highlights Business PerformanceFinancial Overview Appendix
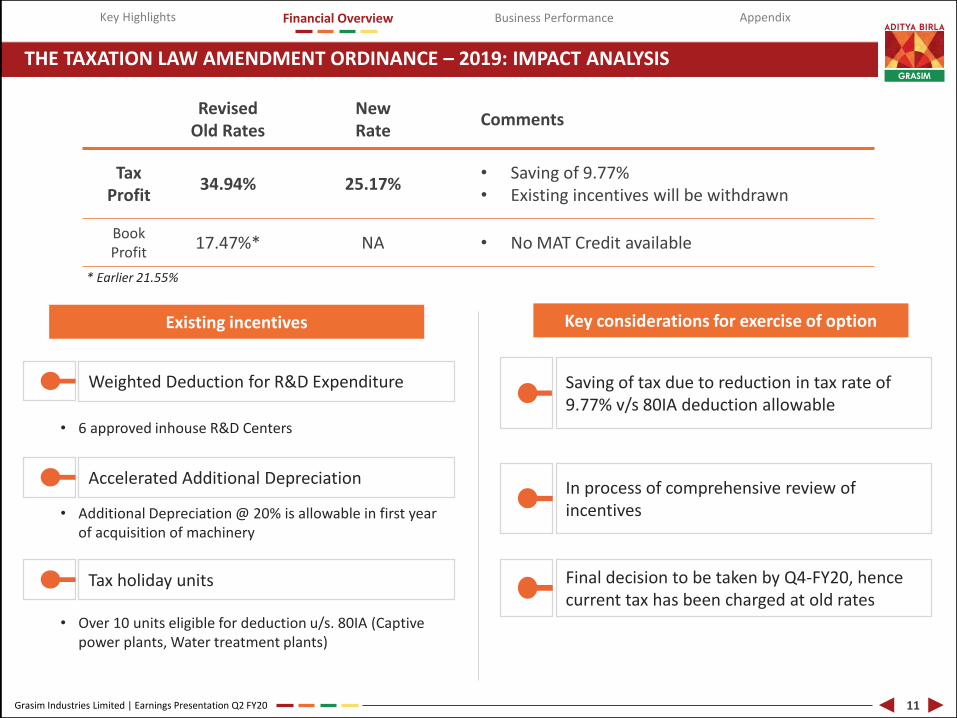
THE TAXATION LAW AMENDMENT ORDINANCE – 2019: IMPACT ANALYSIS
11
Revised Old Rates
NewRate
Comments
Tax Profit
34.94% 25.17%• Saving of 9.77%• Existing incentives will be withdrawn
BookProfit
17.47%* NA • No MAT Credit available
Existing incentives Key considerations for exercise of option
Weighted Deduction for R&D Expenditure
• 6 approved inhouse R&D Centers
Accelerated Additional Depreciation
• Additional Depreciation @ 20% is allowable in first year of acquisition of machinery
Tax holiday units
• Over 10 units eligible for deduction u/s. 80IA (Captive power plants, Water treatment plants)
Saving of tax due to reduction in tax rate of 9.77% v/s 80IA deduction allowable
In process of comprehensive review of incentives
Final decision to be taken by Q4-FY20, hence current tax has been charged at old rates
* Earlier 21.55%

ADITYA BIRLA
GRASIM
Business I Performance I
I I I
Business Performance
ADITYA BIRLA
GRASIM
...%%.*%...,,,.............••••••••.............................................
4 Grasim Industries Limited | Earnings Presentation Q2 FY20
Key Highlights Business PerformanceFinancial Overview Appendix
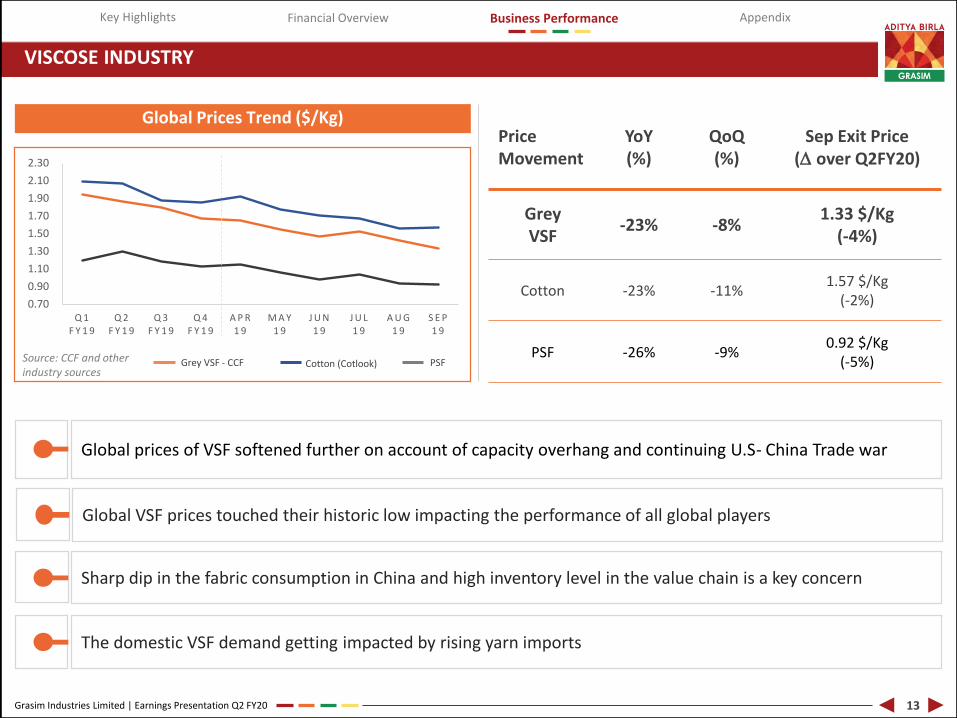
VISCOSE INDUSTRY
Global Prices Trend ($/Kg)
Source: CCF and other industry sources
Price Movement
YoY(%)
QoQ(%)
Sep Exit Price (D over Q2FY20)
GreyVSF
-23% -8%1.33 $/Kg
(-4%)
Cotton -23% -11%1.57 $/Kg
(-2%)
PSF -26% -9%0.92 $/Kg
(-5%)
13
Global prices of VSF softened further on account of capacity overhang and continuing U.S- China Trade war
Sharp dip in the fabric consumption in China and high inventory level in the value chain is a key concern
The domestic VSF demand getting impacted by rising yarn imports
Global VSF prices touched their historic low impacting the performance of all global players
0.70
0.90
1.10
1.30
1.50
1.70
1.90
2.10
2.30
Q 1F Y 1 9
Q 2F Y 1 9
Q 3F Y 1 9
Q 4F Y 1 9
A P R1 9
M A Y1 9
J U N1 9
J U L1 9
A U G1 9
S E P1 9
PSFCotton (Cotlook)Grey VSF - CCF
Grasim Industries Limited | Earnings Presentation Q2 FY20
Key Highlights Business PerformanceFinancial Overview Appendix
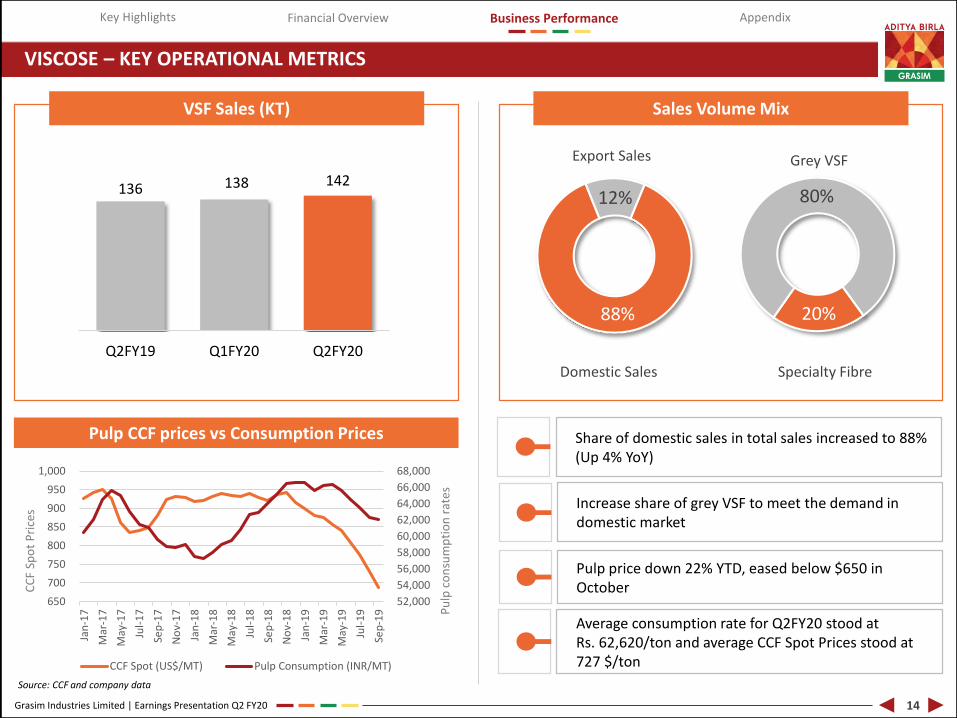
VISCOSE – KEY OPERATIONAL METRICS
VSF Sales (KT) Sales Volume Mix
Source: CCF and company data
Export Sales
Domestic Sales
Grey VSF
Specialty Fibre
Pulp price down 22% YTD, eased below $650 in October
Increase share of grey VSF to meet the demand in domestic market
14
Pulp CCF prices vs Consumption PricesP
ulp
co
nsu
mp
tio
n r
ates
CC
F Sp
ot
Pri
ces
136 138 142
Q2FY19 Q1FY20 Q2FY20
20%
80%
88%
12%
Share of domestic sales in total sales increased to 88% (Up 4% YoY)
52,000
54,000
56,000
58,000
60,000
62,000
64,000
66,000
68,000
650
700
750
800
850
900
950
1,000
Jan
-17
Mar
-17
May
-17
Jul-
17
Sep
-17
No
v-1
7
Jan
-18
Mar
-18
May
-18
Jul-
18
Sep
-18
No
v-1
8
Jan
-19
Mar
-19
May
-19
Jul-
19
Sep
-19
CCF Spot (US$/MT) Pulp Consumption (INR/MT)
Average consumption rate for Q2FY20 stood at Rs. 62,620/ton and average CCF Spot Prices stood at 727 $/ton
Grasim Industries Limited | Earnings Presentation Q2 FY20
Key Highlights Business PerformanceFinancial Overview Appendix
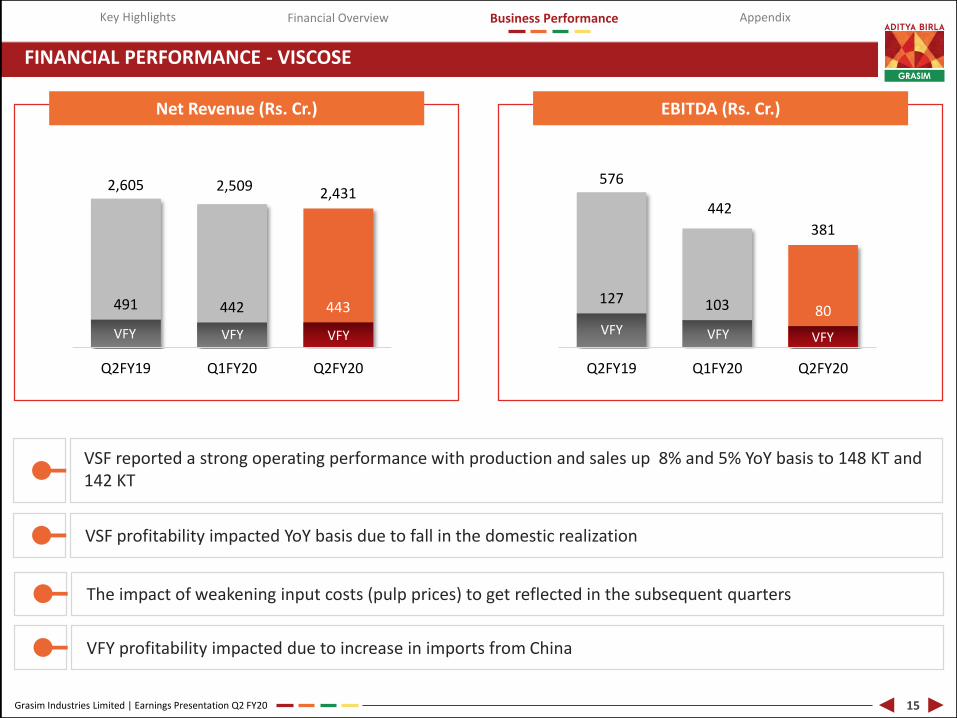
FINANCIAL PERFORMANCE - VISCOSE
Net Revenue (Rs. Cr.) EBITDA (Rs. Cr.)
VFY VFY VFY
15
2,605 2,509 2,431
491 442 443
Q2FY19 Q1FY20 Q2FY20
VFY VFY VFY
576
442
381
127 103 80
Q2FY19 Q1FY20 Q2FY20
VFY VFY VFY
VSF reported a strong operating performance with production and sales up 8% and 5% YoY basis to 148 KT and 142 KT
VSF profitability impacted YoY basis due to fall in the domestic realization
The impact of weakening input costs (pulp prices) to get reflected in the subsequent quarters
VFY profitability impacted due to increase in imports from China
Grasim Industries Limited | Earnings Presentation Q2 FY20
Key Highlights Business PerformanceFinancial Overview Appendix
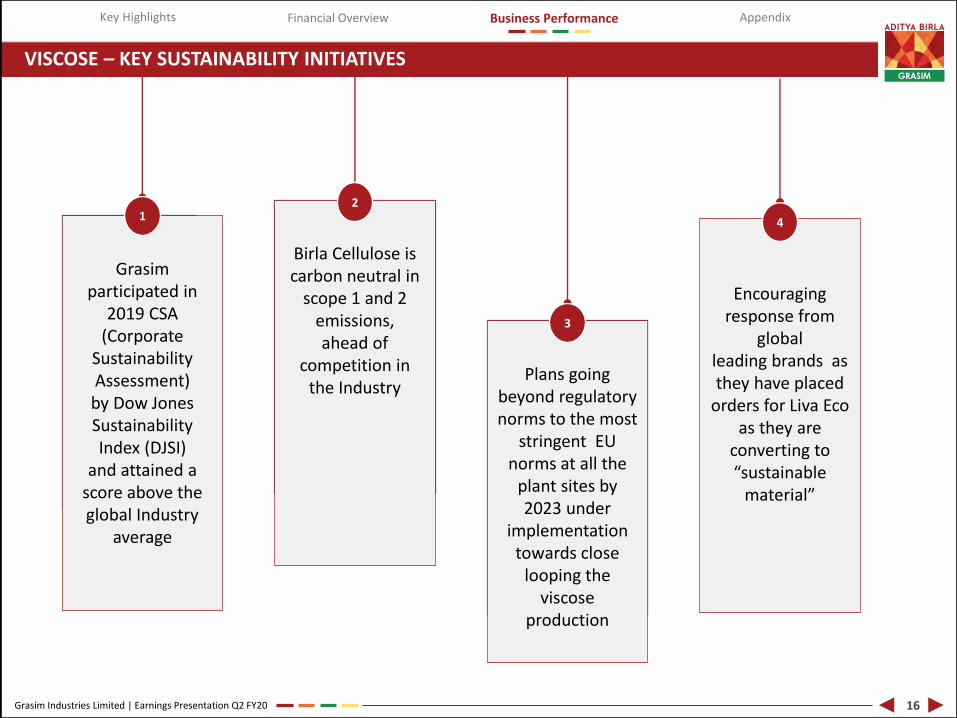
VISCOSE – KEY SUSTAINABILITY INITIATIVES
Plans going beyond regulatory norms to the most
stringent EU norms at all the
plant sites by 2023 under
implementation towards close
looping the viscose
production
3
Encouraging response from
global leading brands as they have placed
orders for Liva Eco as they are
converting to “sustainable
material”
4
Grasim participated in
2019 CSA (Corporate
Sustainability Assessment) by Dow Jones Sustainability Index (DJSI)
and attained a score above the global Industry
average
1
16
Birla Cellulose is carbon neutral in
scope 1 and 2 emissions, ahead of
competition in the Industry
2
Grasim Industries Limited | Earnings Presentation Q2 FY20
Key Highlights Business PerformanceFinancial Overview Appendix
CHLOR ALKALI INDUSTRY
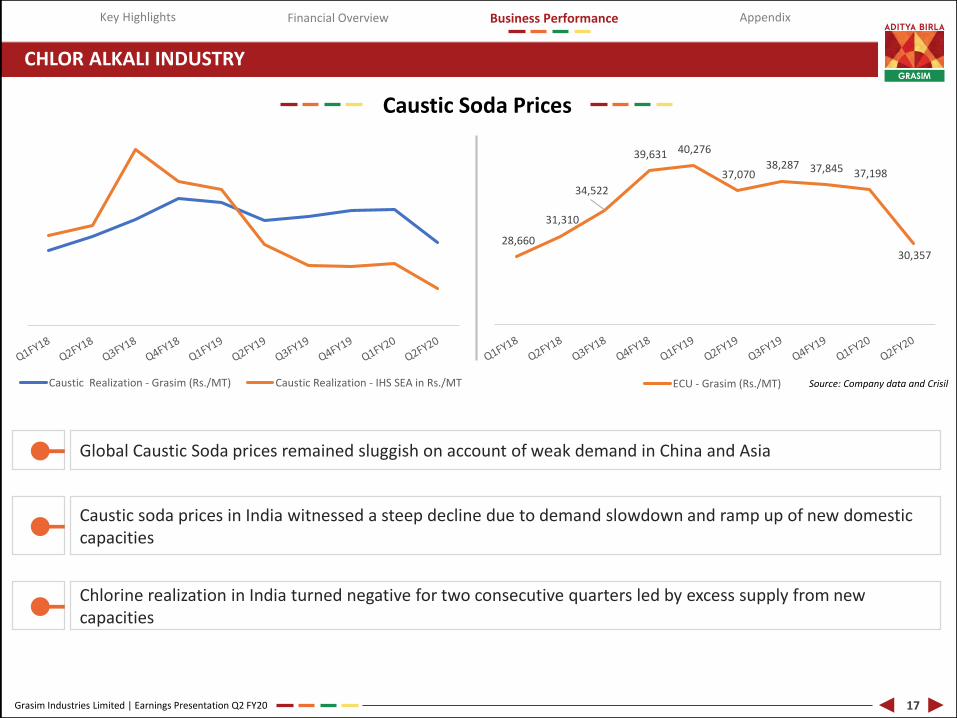
Caustic Soda Prices
Caustic soda prices in India witnessed a steep decline due to demand slowdown and ramp up of new domestic capacities
Chlorine realization in India turned negative for two consecutive quarters led by excess supply from new capacities
17
Global Caustic Soda prices remained sluggish on account of weak demand in China and Asia
28,660
31,310
34,522
39,631 40,276
37,070 38,287 37,845 37,198
30,357
ECU - Grasim (Rs./MT)Caustic Realization - Grasim (Rs./MT) Caustic Realization - IHS SEA in Rs./MT Source: Company data and Crisil
GRASIM
ADITYA BIRLA
0-
0-
0- 0-
4 Grasim Industries Limited | Earnings Presentation Q2 FY20
Key Highlights Business PerformanceFinancial Overview Appendix
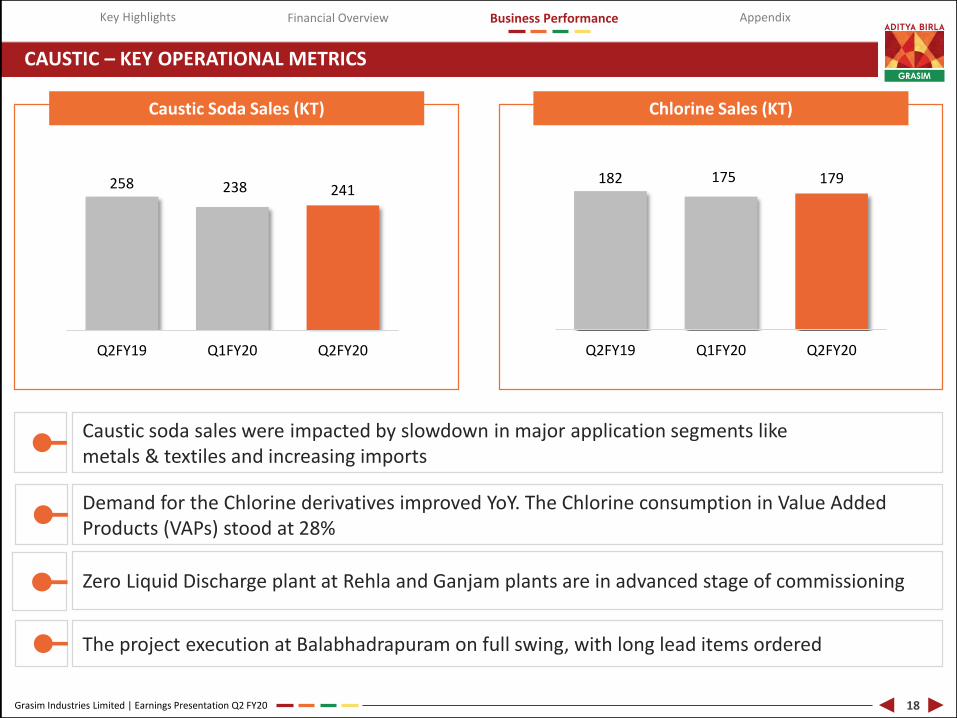
CAUSTIC – KEY OPERATIONAL METRICS
Caustic Soda Sales (KT) Chlorine Sales (KT)
18
258 238 241
Q2FY19 Q1FY20 Q2FY20
Demand for the Chlorine derivatives improved YoY. The Chlorine consumption in Value Added Products (VAPs) stood at 28%
The project execution at Balabhadrapuram on full swing, with long lead items ordered
Caustic soda sales were impacted by slowdown in major application segments like metals & textiles and increasing imports
Zero Liquid Discharge plant at Rehla and Ganjam plants are in advanced stage of commissioning
182 175 179
Q2FY19 Q1FY20 Q2FY20
Grasim Industries Limited | Earnings Presentation Q2 FY20
Key Highlights Business PerformanceFinancial Overview Appendix
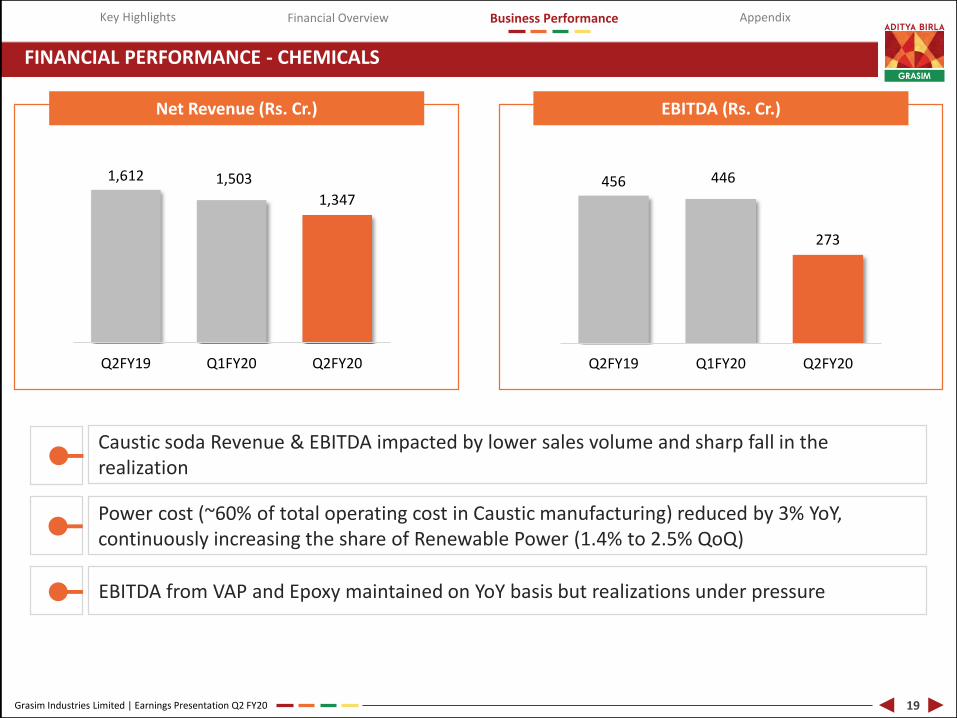
FINANCIAL PERFORMANCE - CHEMICALS
Net Revenue (Rs. Cr.) EBITDA (Rs. Cr.)
19
1,612 1,503
1,347
Q2FY19 Q1FY20 Q2FY20
456 446
273
Q2FY19 Q1FY20 Q2FY20
EBITDA from VAP and Epoxy maintained on YoY basis but realizations under pressure
Caustic soda Revenue & EBITDA impacted by lower sales volume and sharp fall in the realization
Power cost (~60% of total operating cost in Caustic manufacturing) reduced by 3% YoY, continuously increasing the share of Renewable Power (1.4% to 2.5% QoQ)

Grasim Industries Limited | Earnings Presentation Q2 FY20
Key Highlights Business PerformanceFinancial Overview Appendix
FINANCIAL PERFORMANCE – OTHER BUSINESSES
Fertilisers Textile Insulators
Net Revenue (Rs. Cr.)
EBITDA (Rs. Cr.)
Net Revenue (Rs. Cr.)
EBITDA (Rs. Cr.)
Net Revenue (Rs. Cr.)
EBITDA (Rs. Cr.)
20
743 697
721
Q2FY19 Q1FY20 Q2FY20
75
52 49
Q2FY19 Q1FY20 Q2FY20
14
31
13
Q2FY19 Q1FY20 Q2FY20
9 6
(2)
Q2FY19 Q1FY20 Q2FY20
276
437 420
Q2FY19 Q1FY20 Q2FY20
111 110 97
Q2FY19 Q1FY20 Q2FY20
Grasim Industries Limited | Earnings Presentation Q2 FY20
Key Highlights Business PerformanceFinancial Overview Appendix
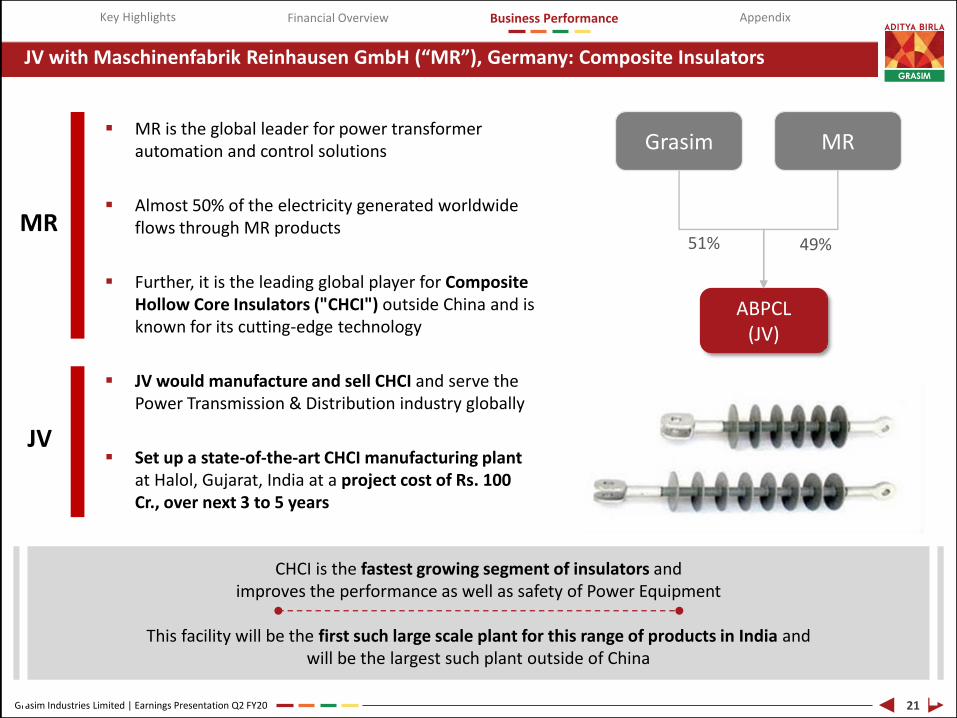
JV with Maschinenfabrik Reinhausen GmbH (“MR”), Germany: Composite Insulators
21
▪ MR is the global leader for power transformer automation and control solutions
▪ Almost 50% of the electricity generated worldwide flows through MR products
▪ Further, it is the leading global player for Composite Hollow Core Insulators ("CHCI") outside China and is known for its cutting-edge technology
▪ JV would manufacture and sell CHCI and serve the Power Transmission & Distribution industry globally
▪ Set up a state-of-the-art CHCI manufacturing plant at Halol, Gujarat, India at a project cost of Rs. 100 Cr., over next 3 to 5 years
Grasim MR
ABPCL(JV)
51% 49%
CHCI is the fastest growing segment of insulators and improves the performance as well as safety of Power Equipment
This facility will be the first such large scale plant for this range of products in India and will be the largest such plant outside of China
MR
JV
ADITYA BIRLA
GRASIM
1 II IN
I
4 Grasim Industries Limited | Earnings Presentation Q2 FY20
Key Highlights Business PerformanceFinancial Overview Appendix
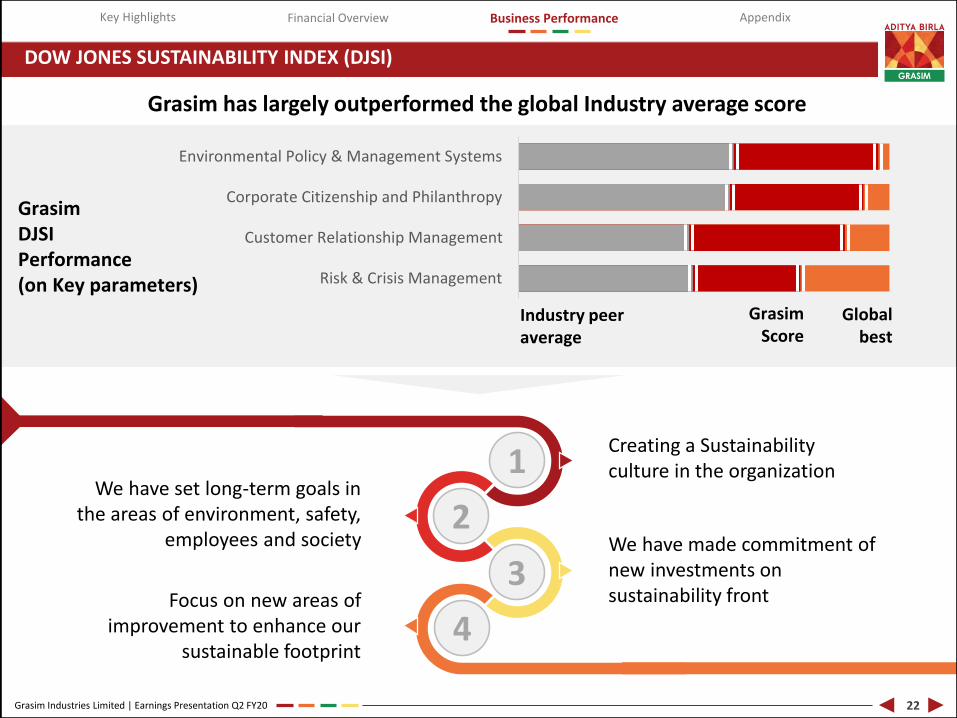
Grasim DJSI Performance(on Key parameters)
DOW JONES SUSTAINABILITY INDEX (DJSI)
22
Industry peer average
GrasimScore
Global best
Grasim has largely outperformed the global Industry average score
1
2
3
4
Creating a Sustainability culture in the organization
We have made commitment of new investments on sustainability front
We have set long-term goals in the areas of environment, safety,
employees and society
Focus on new areas of improvement to enhance our
sustainable footprint
Risk & Crisis Management
Customer Relationship Management
Corporate Citizenship and Philanthropy
Environmental Policy & Management Systems
Grasim Industries Limited | Earnings Presentation Q2 FY20
Key Highlights Business PerformanceFinancial Overview Appendix
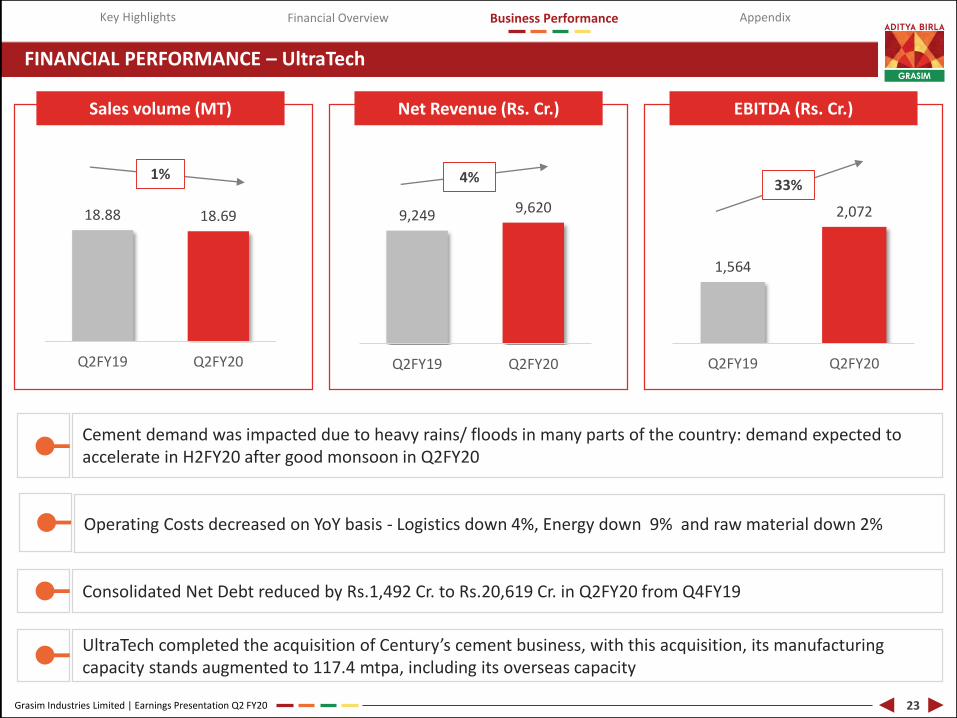
FINANCIAL PERFORMANCE – UltraTech
1% 4% 33%
Cement demand was impacted due to heavy rains/ floods in many parts of the country: demand expected to accelerate in H2FY20 after good monsoon in Q2FY20
UltraTech completed the acquisition of Century’s cement business, with this acquisition, its manufacturing capacity stands augmented to 117.4 mtpa, including its overseas capacity
Consolidated Net Debt reduced by Rs.1,492 Cr. to Rs.20,619 Cr. in Q2FY20 from Q4FY19
Operating Costs decreased on YoY basis - Logistics down 4%, Energy down 9% and raw material down 2%
Sales volume (MT) Net Revenue (Rs. Cr.) EBITDA (Rs. Cr.)
23
18.88 18.69
Q2FY19 Q2FY20
9,249 9,620
Q2FY19 Q2FY20
1,564
2,072
Q2FY19 Q2FY20
Grasim Industries Limited | Earnings Presentation Q2 FY20
Key Highlights Business PerformanceFinancial Overview Appendix
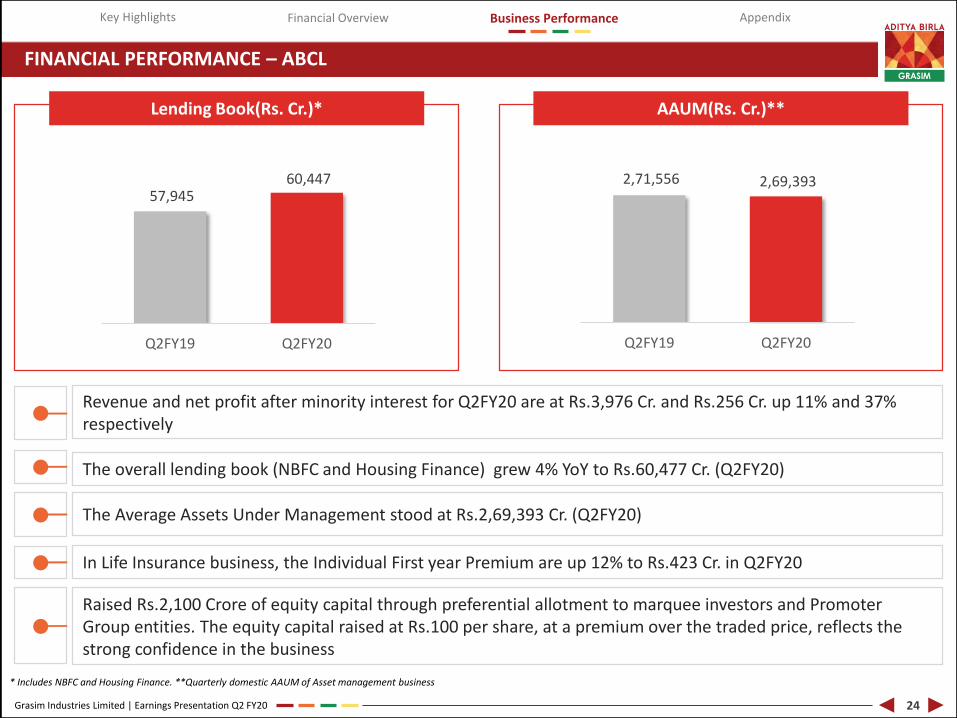
FINANCIAL PERFORMANCE – ABCL
* Includes NBFC and Housing Finance. **Quarterly domestic AAUM of Asset management business
Revenue and net profit after minority interest for Q2FY20 are at Rs.3,976 Cr. and Rs.256 Cr. up 11% and 37% respectively
Raised Rs.2,100 Crore of equity capital through preferential allotment to marquee investors and Promoter Group entities. The equity capital raised at Rs.100 per share, at a premium over the traded price, reflects the strong confidence in the business
The overall lending book (NBFC and Housing Finance) grew 4% YoY to Rs.60,477 Cr. (Q2FY20)
The Average Assets Under Management stood at Rs.2,69,393 Cr. (Q2FY20)
In Life Insurance business, the Individual First year Premium are up 12% to Rs.423 Cr. in Q2FY20
Lending Book(Rs. Cr.)* AAUM(Rs. Cr.)**
24
57,945 60,447
Q2FY19 Q2FY20
2,71,556 2,69,393
Q2FY19 Q2FY20

Grasim Industries Limited | Earnings Presentation Q2 FY20
Key Highlights Business PerformanceFinancial Overview Appendix
FINANCIAL PERFORMANCE – OTHER SUBSIDIARIES
25
Parameters Sep 2019
Cumulative Installed Capacity (MW) 182
No. of Projects 16
No. of Projects with Group Companies 11
Capacity with Group Companies (MW) 111
Q2FY20 Q1FY20
Net Revenue Rs. Cr. 20 26
EBITDA Rs. Cr. 10 14
EBITDA Margin % 50% 54%
EBIT Rs. Cr. 5 8
Capital Employed
(Incl. CWIP)Rs. Cr. 973 851
Particulars (Rs. Cr.)
Solar subsidiaries Grasim Premium Fabrics (Brand Soktas)
Q2FY20 Q1FY20
Net Revenue Rs. Cr. 45 48
EBITDA Rs. Cr. 7 8
EBITDA Margin % 16% 17%
EBIT Rs. Cr. -3 4
Capital Employed
(Incl. CWIP)Rs. Cr. 177 181
Particulars (Rs. Cr.)
The merger of Grasim Premium Fabric Private Limited with the Company is under process
Post acquisition, the fair valuation exercise has been completed in Q2FY20
Planned capacity at 500 MW by FY20
Grasim Industries Limited | Earnings Presentation Q2 FY20
Key Highlights Business PerformanceFinancial Overview Appendix
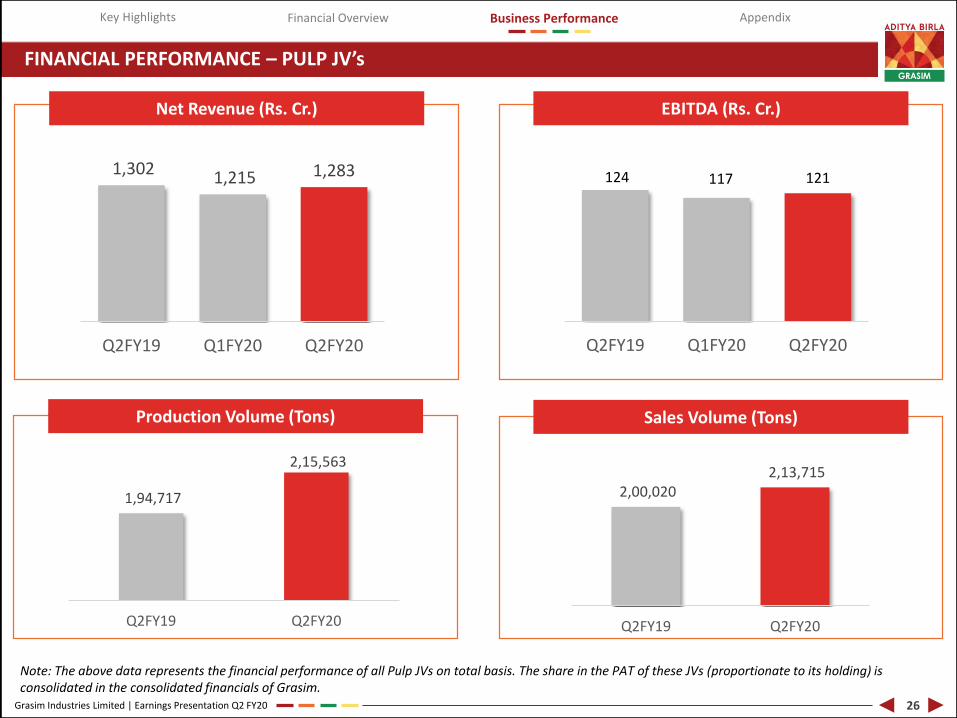
FINANCIAL PERFORMANCE – PULP JV’s
Note: The above data represents the financial performance of all Pulp JVs on total basis. The share in the PAT of these JVs (proportionate to its holding) is consolidated in the consolidated financials of Grasim.
Net Revenue (Rs. Cr.) EBITDA (Rs. Cr.)
26
1,302 1,215 1,283
Q2FY19 Q1FY20 Q2FY20
124 117 121
Q2FY19 Q1FY20 Q2FY20
Production Volume (Tons) Sales Volume (Tons)
1,94,717
2,15,563
Q2FY19 Q2FY20
2,00,020 2,13,715
Q2FY19 Q2FY20
ADITYA BIRLA
I
pendix I
7
Appendix
Grasim Industries Limited | Earnings Presentation Q2 FY20
Key Highlights Business PerformanceFinancial Overview Appendix
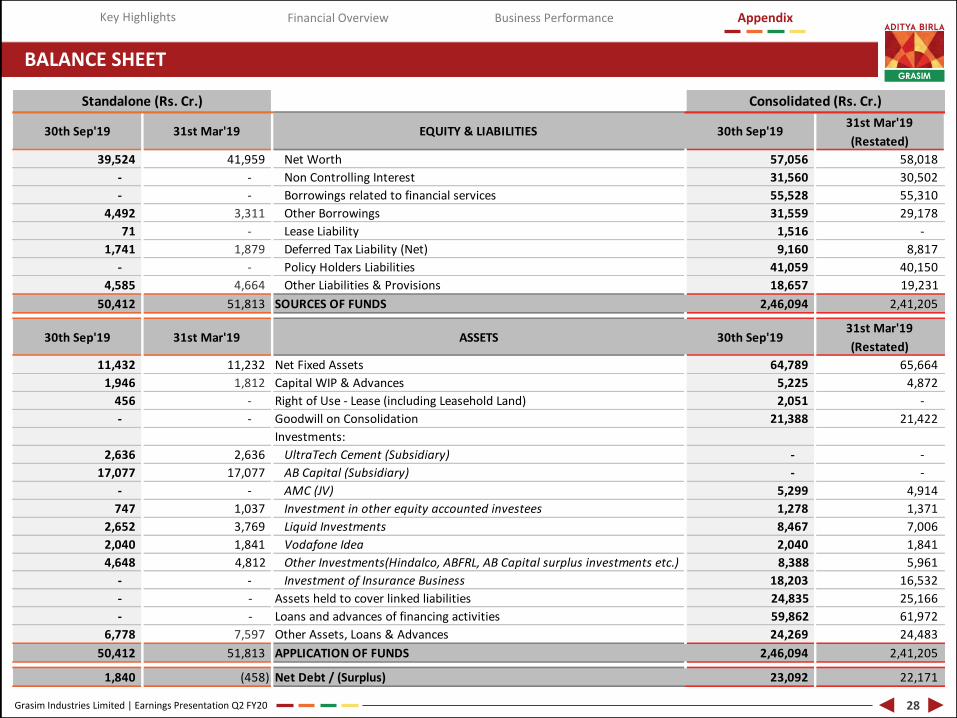
BALANCE SHEET
28
30th Sep'19 31st Mar'19 EQUITY & LIABILITIES 30th Sep'1931st Mar'19
(Restated)
39,524 41,959 Net Worth 57,056 58,018
- - Non Controlling Interest 31,560 30,502
- - Borrowings related to financial services 55,528 55,310
4,492 3,311 Other Borrowings 31,559 29,178
71 - Lease Liability 1,516 -
1,741 1,879 Deferred Tax Liability (Net) 9,160 8,817
- - Policy Holders Liabilities 41,059 40,150
4,585 4,664 Other Liabilities & Provisions 18,657 19,231
50,412 51,813 SOURCES OF FUNDS 2,46,094 2,41,205
30th Sep'19 31st Mar'19 ASSETS 30th Sep'1931st Mar'19
(Restated)
11,432 11,232 Net Fixed Assets 64,789 65,664
1,946 1,812 Capital WIP & Advances 5,225 4,872
456 - Right of Use - Lease (including Leasehold Land) 2,051 -
- - Goodwill on Consolidation 21,388 21,422
Investments:
2,636 2,636 UltraTech Cement (Subsidiary) - -
17,077 17,077 AB Capital (Subsidiary) - -
- - AMC (JV) 5,299 4,914
747 1,037 Investment in other equity accounted investees 1,278 1,371
2,652 3,769 Liquid Investments 8,467 7,006
2,040 1,841 Vodafone Idea 2,040 1,841
4,648 4,812 Other Investments(Hindalco, ABFRL, AB Capital surplus investments etc.) 8,388 5,961
- - Investment of Insurance Business 18,203 16,532
- - Assets held to cover linked liabilities 24,835 25,166
- - Loans and advances of financing activities 59,862 61,972
6,778 7,597 Other Assets, Loans & Advances 24,269 24,483
50,412 51,813 APPLICATION OF FUNDS 2,46,094 2,41,205
1,840 (458) Net Debt / (Surplus) 23,092 22,171
Standalone (Rs. Cr.) Consolidated (Rs. Cr.)
Grasim Industries Limited | Earnings Presentation Q2 FY20
Key Highlights Business PerformanceFinancial Overview Appendix
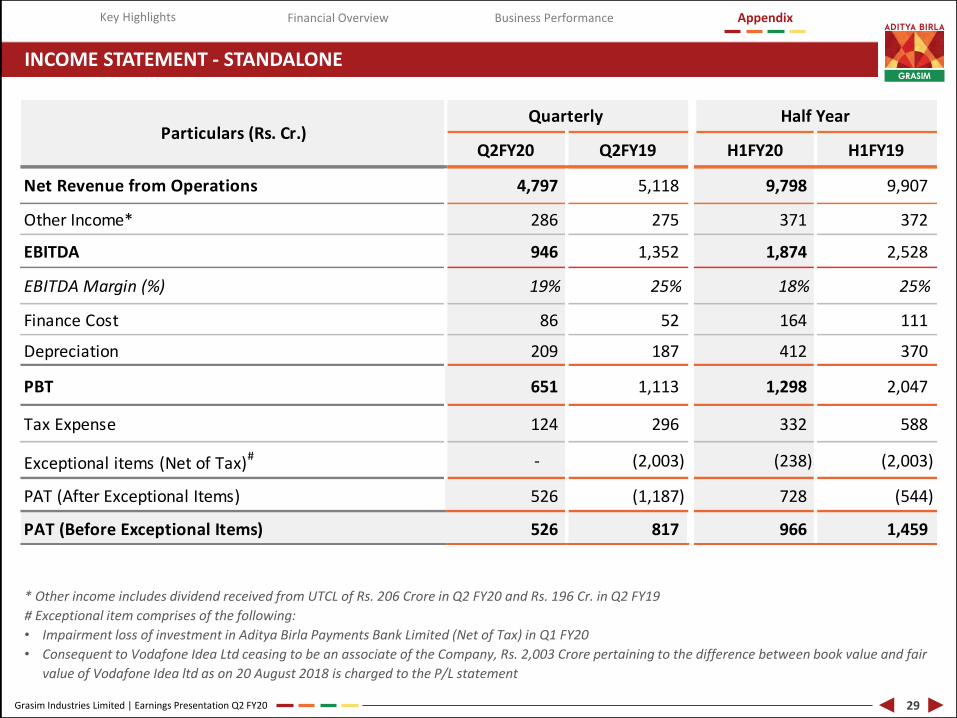
INCOME STATEMENT - STANDALONE
* Other income includes dividend received from UTCL of Rs. 206 Crore in Q2 FY20 and Rs. 196 Cr. in Q2 FY19
# Exceptional item comprises of the following:
• Impairment loss of investment in Aditya Birla Payments Bank Limited (Net of Tax) in Q1 FY20
• Consequent to Vodafone Idea Ltd ceasing to be an associate of the Company, Rs. 2,003 Crore pertaining to the difference between book value and fair
value of Vodafone Idea ltd as on 20 August 2018 is charged to the P/L statement
29
Q2FY20 Q2FY19 H1FY20 H1FY19
Net Revenue from Operations 4,797 5,118 9,798 9,907
Other Income* 286 275 371 372
EBITDA 946 1,352 1,874 2,528
EBITDA Margin (%) 19% 25% 18% 25%
Finance Cost 86 52 164 111
Depreciation 209 187 412 370
PBT 651 1,113 1,298 2,047
Tax Expense 124 296 332 588
Exceptional items (Net of Tax)# - (2,003) (238) (2,003)
PAT (After Exceptional Items) 526 (1,187) 728 (544)
PAT (Before Exceptional Items) 526 817 966 1,459
Particulars (Rs. Cr.)Quarterly Half Year
Grasim Industries Limited | Earnings Presentation Q2 FY20
Key Highlights Business PerformanceFinancial Overview Appendix
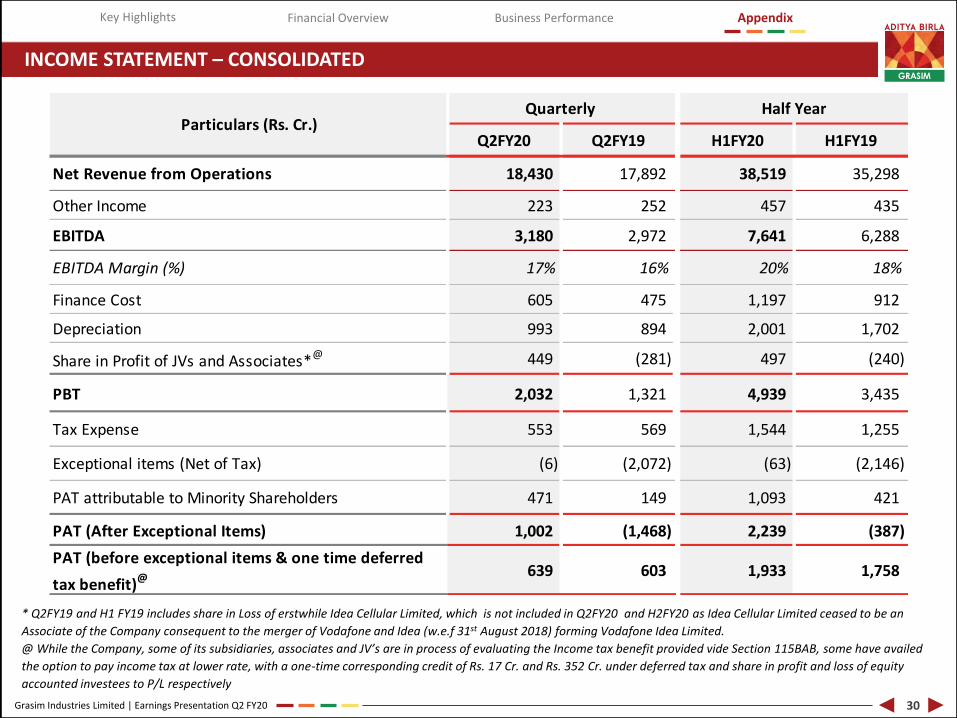
INCOME STATEMENT – CONSOLIDATED
* Q2FY19 and H1 FY19 includes share in Loss of erstwhile Idea Cellular Limited, which is not included in Q2FY20 and H2FY20 as Idea Cellular Limited ceased to be an
Associate of the Company consequent to the merger of Vodafone and Idea (w.e.f 31st August 2018) forming Vodafone Idea Limited.
@ While the Company, some of its subsidiaries, associates and JV’s are in process of evaluating the Income tax benefit provided vide Section 115BAB, some have availed
the option to pay income tax at lower rate, with a one-time corresponding credit of Rs. 17 Cr. and Rs. 352 Cr. under deferred tax and share in profit and loss of equity
accounted investees to P/L respectively
30
Q2FY20 Q2FY19 H1FY20 H1FY19
Net Revenue from Operations 18,430 17,892 38,519 35,298
Other Income 223 252 457 435
EBITDA 3,180 2,972 7,641 6,288
EBITDA Margin (%) 17% 16% 20% 18%
Finance Cost 605 475 1,197 912
Depreciation 993 894 2,001 1,702
Share in Profit of JVs and Associates*@ 449 (281) 497 (240)
PBT 2,032 1,321 4,939 3,435
Tax Expense 553 569 1,544 1,255
Exceptional items (Net of Tax) (6) (2,072) (63) (2,146)
PAT attributable to Minority Shareholders 471 149 1,093 421
PAT (After Exceptional Items) 1,002 (1,468) 2,239 (387)
PAT (before exceptional items & one time deferred
tax benefit)@ 639 603 1,933 1,758
Particulars (Rs. Cr.)Quarterly Half Year
Grasim Industries Limited | Earnings Presentation Q2 FY20
Key Highlights Business PerformanceFinancial Overview Appendix
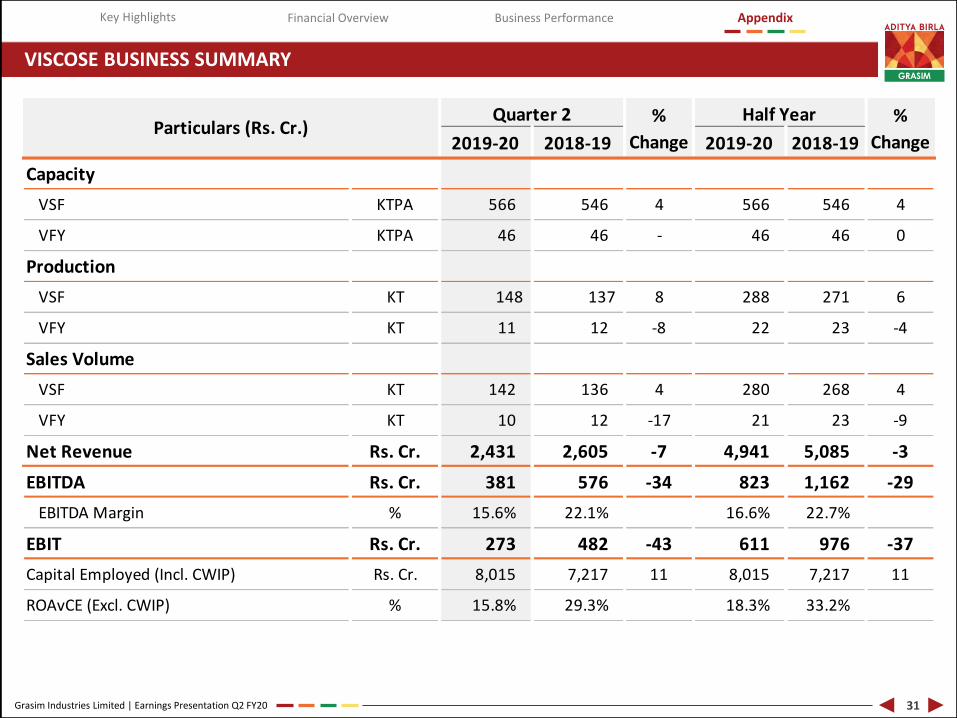
VISCOSE BUSINESS SUMMARY
31
2019-20 2018-19 2019-20 2018-19
Capacity
VSF KTPA 566 546 4 566 546 4
VFY KTPA 46 46 - 46 46 0
Production
VSF KT 148 137 8 288 271 6
VFY KT 11 12 -8 22 23 -4
Sales Volume
VSF KT 142 136 4 280 268 4
VFY KT 10 12 -17 21 23 -9
Net Revenue Rs. Cr. 2,431 2,605 -7 4,941 5,085 -3
EBITDA Rs. Cr. 381 576 -34 823 1,162 -29
EBITDA Margin % 15.6% 22.1% 16.6% 22.7%
EBIT Rs. Cr. 273 482 -43 611 976 -37
Capital Employed (Incl. CWIP) Rs. Cr. 8,015 7,217 11 8,015 7,217 11
ROAvCE (Excl. CWIP) % 15.8% 29.3% 18.3% 33.2%
Particulars (Rs. Cr.)Quarter 2 %
Change
%
Change
Half Year
Grasim Industries Limited | Earnings Presentation Q2 FY20
Key Highlights Business PerformanceFinancial Overview Appendix
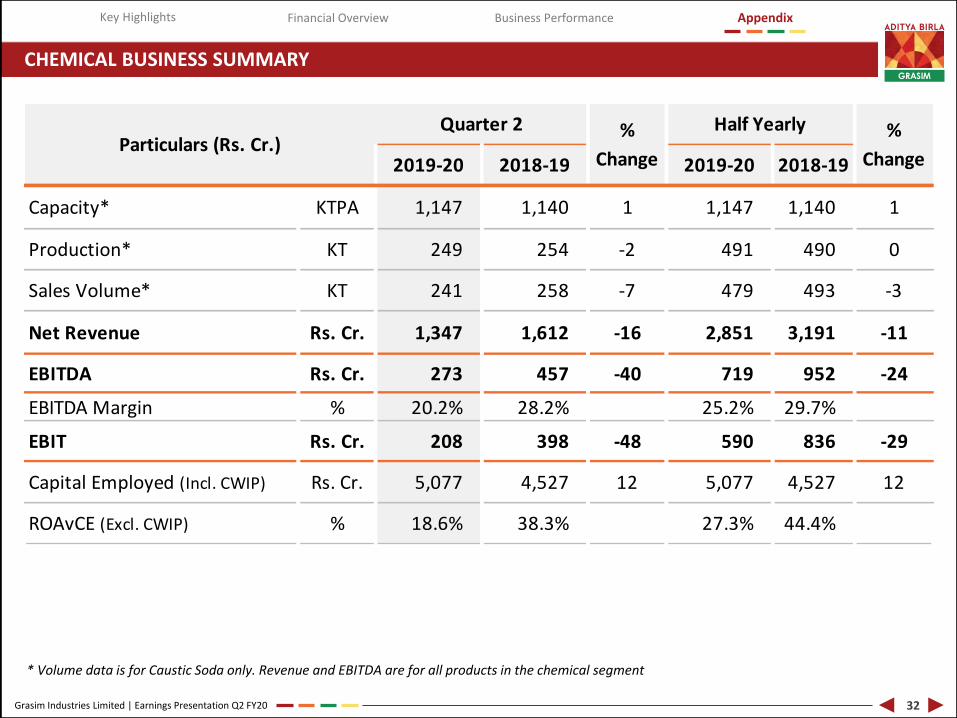
CHEMICAL BUSINESS SUMMARY
* Volume data is for Caustic Soda only. Revenue and EBITDA are for all products in the chemical segment
32
2019-20 2018-19 2019-20 2018-19
Capacity* KTPA 1,147 1,140 1 1,147 1,140 1
Production* KT 249 254 -2 491 490 0
Sales Volume* KT 241 258 -7 479 493 -3
Net Revenue Rs. Cr. 1,347 1,612 -16 2,851 3,191 -11
EBITDA Rs. Cr. 273 457 -40 719 952 -24
EBITDA Margin % 20.2% 28.2% 25.2% 29.7%
EBIT Rs. Cr. 208 398 -48 590 836 -29
Capital Employed (Incl. CWIP) Rs. Cr. 5,077 4,527 12 5,077 4,527 12
ROAvCE (Excl. CWIP) % 18.6% 38.3% 27.3% 44.4%
Particulars (Rs. Cr.)Quarter 2 %
Change
%
Change
Half Yearly

0 0 D 0
0 0 0 D 0
0
0 D 0 D
Grasim Industries Limited | Earnings Presentation Q2 FY20
Key Highlights Business PerformanceFinancial Overview Appendix
GRASIM GROUP STRUCTURE
* Subsidiary companies - Equity ownership^ Soktas India has been renamed to Grasim Premium Fabric Private Limited post acquisition
# Under construction Chlor-Alkali plant with capacity of 146 KTPA
Grasim Industries Limited
Overseas
Pulp & VSF JVs
AV Terrace Bay (40.0%)*
Domsjo 255K TPA (33.3%)*
AV Group NB Inc.
320K TPA (45.0%)*
VSF JVBirla Jingwei
88K TPA (26.6%)*
Nagda270K TPA
Vilayat365K TPA
Epoxy123K TPA
Caustic Soda -~1147K TPA
Epoxy – 123K TPA
Renukoot129K TPA
Rehla110K TPA
Ganjam91K TPA
Karwar91K TPA
Veraval91K TPA
Balabhadh-rampuram#
ABCL (55.99)*
Subsidiary
NBFC
(100%)*
Broking
(75%)*
Housing Finance
(100%)*
Insurance Advisory
(50.01%)*Life Insurance
(51%)* Private Equity
(100%)*AMC
(51%)* Online Money Management
(93.7%)*Health Insurance
(51%)*ARC
(100%)*Wellness
(51%)*
VSF - 566K TPA VFY - 47K TPAPulp - 74K TPA
Nagda155K TPA
Kharach159K TPA
Harihar88K TPA
Vilayat164K TPA
Veraval (VFY)21K TPA
Harihar (Pulp)74.4K TPA
Century (VFY)26K TPA
Solar(100%)*
Others
Fertilizers
Insulators
Textiles
Aditya Birla Renewables
Ltd.(100%)*
Grasim Premium Fabric^(100%)*
UTCL (60.21%)*
Subsidiary
20 Integrated plants &
1 clinkerisation unit
25 Split Grinding Units
>100 RMC Plants
White Cement & Putty
1.5 Mn. TPA
Grey Cement India Operations
94.75 Mn. TPA
Overseas4 Mn. TPA
(UAE, Bangladesh, Sri Lanka)
33
Grasim Industries Limited | Earnings Presentation Q2 FY20
FORWARD LOOKING AND CAUTIONARY STATEMENT
Certain statements in this report may be “forward looking statements” within the meaning of applicable securitieslaws and regulations. Actual results could differ materially from those expressed or implied. Important factors thatcould make a difference to the company’s operations include global and Indian demand supply conditions, finishedgoods prices, feed stock availability and prices, cyclical demand and pricing in the company’s principal markets,changes in Government regulations, tax regimes, economic developments within India and the countries withinwhich the company conducts business and other factors such as litigation and labour negotiations. The companyassume no responsibility to publicly amend, modify or revise any forward looking statement, on the basis of anysubsequent development, information or events, or otherwise.
Country and Year of Incorporation: India, 1947
Listing: India (BSE/NSE) , GDR (Luxembourg)
Bloomberg Ticker: GRASIM IB EQUITY , GRASIM IS EQUITY, GRAS LX (GDR)
Business Description: Viscose, Chemicals, Cement and Financial Services
Market Cap (30th September 2019) : Rs. 48,000 Cr.
34
Grasim Industries Limited | Earnings Presentation Q2 FY20
NOTES
35
ADITYA BIRLA
Pa11A GRASIM
Grasim Industries Ltd.Aditya Birla Centre'A' Wing, 2nd Floor ,S.K. Ahire Marg ,WorliMumbai 400 030 ,India
Investor Relations TeamEmail: [email protected]@adityabirla.com
Thank you


![INDEX [environmentclearance.nic.in]environmentclearance.nic.in/writereaddata/Online/...Grasim Industries Limited (G IL), a flagship company of the Aditya Birla Group, ranks amongst](https://img.pdfslide.us/doc/110x75/5e8f0a030f0e05433d00b64e/index-grasim-industries-limited-g-il-a-flagship-company-of-the-aditya.jpg)