Embed Size (px)
Citation preview
Adhesive Force Improvement of Polyethylene Terephthalate (PET)/EpoxyResin Joint by Electron Beam to PET Prior to Assembly
Chisato Kubo1,+, Masae Kanda2, Kenshin Miyazaki1,+, Takumi Okada1,+,Michael C. Faudree1 and Yoshitake Nishi1,2
1Graduate School of Engineering, Tokai University, Hiratsuka 259-1292, Japan2School of Engineering, Tokai University, Hiratsuka 259-1292, Japan
Adhesive 2-layer lamination joints of polyethylene terephthalate (PET)/epoxy resin were prepared without the use of hot press using a newadhesion method of applying homogeneous low energy electron beam irradiation (HLEBI) to the PET prior to assembly by hand pressure.HLEBI treatment within the range of 0.13 to 0.43MGy increased the adhesive force of peeling (oFp) substantially over the untreated. The largestoFp values at optimal dose 0.30MGy were 12.4, 37.2 and 190Nm¹1, which were more than 2.2, 2.8 and 9.5 times larger than 5.76, 13.5 and20.0Nm¹1 of the untreated at low-, median- and high peeling force accumulative probability, Pp of 0.06, 0.50 and 0.94, respectively. Thestatistically lowest oFp for safety design (Fs at Pp = 0) iterated by the 3-parameter Weibull equation was raised from zero for the untreated to10.7Nm¹1 for the 0.30MGy samples indicating increased reliability by the HLEBI. XPS (X-Ray Photoelectron Spectroscopy) observations ofthe peeled 0.30MGy HLEBI PET revealed generation of a C-O peak at 286 eV possibly explaining the increased adhesion. Therefore residualepoxy deposition is apparently found to be retained on the PET sheet by inter-matrix fracture of epoxy resin further into the thickness. This canbe explained by the adhesion force from crosslinking between PET/epoxy being stronger than the cohesive force of epoxy polymer itself. Sincethe experimental data shows the optimum HLEBI dose is about 0.30MGy, above which at 0.43MGy the oFp begins to drop, carefulness inoptimization is highly recommended when applying in industry to insure safety. [doi:10.2320/matertrans.M2015082]
(Received February 27, 2015; Accepted August 27, 2015; Published October 9, 2015)
Keywords: joint, adhesion, electron beam, irradiation, polyethylene terephthalate (PET), epoxy, crosslinking
1. Introduction
Joining polymers has extensive application hence advance-ments in techniques are always highly sought after. Recentadvances for joints include impact resistant joints of pressuresensitive adhesive (PSA) used in smart phones,1) thermo-plastic adhesive containing SiC layers for high frequencywelding of polypropylene (PP)2) and its glass fiber reinforcedpolymer (GFRP).3)
Applying surface treatment of low dose of electron beam(EB) irradiation on the order of 0.01 to 1MGy has beengaining momentum as a successful method to adherepolymeric materials without the use of adhesive. Polyimide/polytetrafluoroethylene (PI/PTFE) layered films have beensuccessfully fabricated by Homogeneous low energy electronbeam irradiation (HLEBI);4) while applying 0.50MGy EBdose increased adhesive bond strength between PET filmsand acrylic adhesive.5) HLEBI has been found to increaseadhesive mechanical properties of polymer-polymer joints forbiomedical applications of PDMS (polydimethylsilozane)/PTFE,6) PDMS/PP (polypropylene),7) and create strongadhesion in the difficult to bond PTFE/PE (polyethylene).8)
Increase in adhesion by EB is reported to occur bycrosslinking between the two polymer surfaces as in rubbers9)
and polyurethane (PU) based adhesives,10) and dangling bondgeneration: scission of bonds detected by electron spinresonance (ESR) creating reactive sites in PDMS/PP.7) In the1950s Charlesby-Pinner derived an expression for crosslinkdensity as a function of radiation dose dependent on solfraction, fracture density of main chain scission per unit dose,and initial number average degree of polymerization.11) Oneassumption they made crosslinking is independent of chainscission.11,12)
HLEBI is surface treatment that cuts the chemical bonds atthe polymer surface and generates active terminated atoms inpolymers generating strong adhesive bond by crosslinkingat the PET/epoxy joint interface. Total treatment time ofHLEBI application is only a few seconds preventing excessheating.
However, if radiation is too high it degrades materials forexample, NASDA reports PET films for thermal controlmaterials used in space are given tolerance limits certified upto 3MGy, and 1MGy where high optical transmission isexpected.13) Moreover, for the PET/epoxy joint when HLEBIover 0.43MGy is applied the peeling strength starts todegrade therefore carefulness in optimization is highlyrecommended when adjusting dose for strengthening prac-tical parts for maximum safety. Therefore, the purpose of theresearch is reproducibility to obtain the large adhesive forceof peeling resistance (oFp) for the PET/Epoxy polymers jointby applying 0.30MGy-HLEBI to the PET joining surfaceprior to lamination assembly by hand pressure without use ofglue or hot press.
2. Experimental Procedure
2.1 Preparation of PET/Epoxy laminated sheetsFor epoxy preparation, epoxy resin and curing agent (Craft
Resin, NISSIN RESIN Co. Ltd., Japan) were mixed in a 5 : 1by weight ratio, followed by applying heat at 350K for10min. Next, the epoxy resin was spread onto a 15 µm thicknylon 6 supporting film with uniform film thickness (³250+/¹ 10 µm, measured after drying) using a doctor blade(Elcometer, Belgium). To a thin PET (polyethylene tereph-thalate) sheet (10 © 40 © 0.50mm, Teijinμ Tetoronμ Film,Teijin DuPont Films, Japan) HLEBI was then applied to oneside. Following this, the HLEBI-treated side of the PET sheetwas laminated to the epoxy resin with hand pressure, then+Graduate Student, Tokai University
Materials Transactions, Vol. 56, No. 11 (2015) pp. 1821 to 1826©2015 The Japan Institute of Metals and Materials
dried for 1 day at 296K below the components’ glasstransition temperatures, Tg of 389 and 353K, of epoxy resinand PET, respectively. Since the PET was HLEBI-treated, thejoint is referred to as “PET/Epoxy”. Note although the epoxyresin by itself was heated during preparation, hot press wasnot used on the PET/Epoxy joint.
2.2 Homogeneous low energy electron beam irradiation(HLEBI)
The PET sheet was irradiated by using an electron-curtainprocessor (Type CB175/15/180L, Energy Science Inc.,Woburn, MA, Iwasaki Electric Group Co. Ltd. Tokyo).1423)
The specimen was homogeneously irradiated with thesheet HLEBI with low energy through a titanium thin filmwindow attached to a 240mm diameter vacuum chamber. Atungsten filament in a vacuum is used to generate the electronbeam at a low energy (acceleration potential, V: kV), of170 keV and irradiating current density (I, A/m2) of 0.089A/m2.
Although the sheet electron beam generation is in avacuum, the irradiated sample has been kept under protectivenitrogen at atmospheric pressure. The distance betweensample and window is 35mm. To prevent oxidation, thesamples are kept in a protective atmosphere of nitrogen gaswith a residual concentration of oxygen below 400 ppm. Theflow rate of nitrogen gas is 1.5 L/s at 0.1MPa nitrogen gaspressure.
The absorbed dose is controlled by the integratedirradiation time in each of the samples. Here, absorbed doseis corrected from irradiation dose by using an FWT nylondosimeter of RCD radiometer film (FWT-60-00: Far WestTechnology, Inc. 330-D South Kellogg Goleta, California93117, USA) with an irradiation reader (FWT-92D: Far WestTechnology, Inc. 330-D South Kellogg Goleta, California93117, USA). The absorbed dose corresponded to irradiationdose is 0.0432MGy at each irradiation, which is applied foronly a short time (0.23 s) to avoid excessive heating of thesample; the temperature of the sample surface remains below323K just after irradiation. The sample in the aluminum plateholder (0.15m © 0.15m) is transported on a conveyor at aspeed of 9.56m/min. The sheet HLEBI is applied inter-mittently. Repeated irradiations to both side surfaces of thesamples are used to increase the total irradiation dose. Theinterval between the end of one period of irradiation and thestart of the next operation is 30 s. When the irradiationcurrent (I, mA), the conveyor speed (S, m/min) and numberof irradiations (N) are determined, the irradiated dosage isproportional to the yield value from the irradiation current(I, mA), the conveyor speed (S, m/min), and number ofirradiations (N).
Based on the density (µ: kg/m3) and irradiation voltage atthe specimen surface (V: kV), the penetration depth (Dth: m)of HLEBI is expressed by the following equation.24)
Dth ¼ 66:7V5=3=µ ð1ÞSpecimen surface electrical potential (V ) was mainly reducedgoing through the Ti window ("VTi) and N2 gas atmosphere("VN2).
V ¼ 170 keV��VTi ��VN2 ð2Þ
Based on eq. (2), the dropped potential values, "VTi and"VN2 are estimated from the acceleration potential (170 keV),the 10 µm thickness (TTi) of the titanium window (density:4540 kgm¹3), and the 35mm distance between the sampleand the window (TN2) in the N2 gas atmosphere (density:µN2 = 1.13 kgm¹3).
VTi ¼ ðTTi=DthTiÞ � 170 keV
¼ TTiµTi=½66:7� ð170 keVÞ2=3�¼ ð10�5 mÞ � ð4540 kgm�3Þ=½66:7� ð170 keVÞ2=3�¼ 22:2 keV ð3Þ
�VN2 ¼ ðTN2=DthiN2Þ � VTi
¼ TN2µN2=½66:7� ðVTiÞ2=3�¼ ð35� 10�3 mÞ � ð1:13 kgm�3Þ=½66:7� ð170 keVÞ2=3� ð4Þ
Since the dropped potential values are 22.2 and 18.2 keV,the specimen surface electrical potential, V is 129.6 keV asfollows.
V ¼ 170 keV� 22:2 keV� 18:2 keV ¼ 129:6 keV ð5ÞGiven typical density of PET is 1380 kgm¹3, the HLEBIdepth into the PET film estimated from eq. (1) is Dth =238 µm, more than four times larger than the PET thicknessof 50 µm, hence the HLEBI penetrated through the entirethickness.
2.3 T-peeling testComposite samples after removing the 15 µm thick nylon
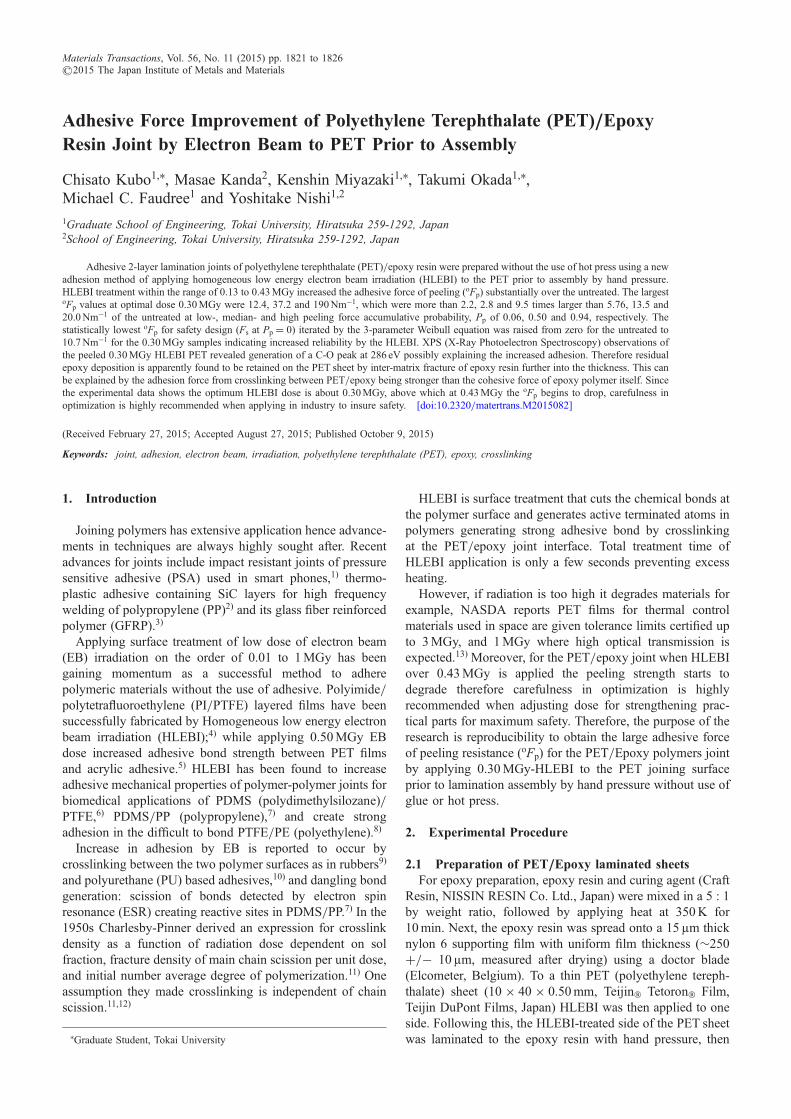
6 supporting film were prepared for the T-peeling test toevaluate the influence of HLEBI on the mean adhesive forceof peeling resistance (oFp), as shown in Fig. 1. Peelingadhesive force (Fp) vs. peeling distance (dp) curves wereobtained by using a micro-load tensile tester (F-S Master-1K-2N, IMADA Co. Ltd., Japan) with a strain rate of 10mm/min.6) Since the unit of the Fp was Nm¹1, the oFp was usedinstead of the adhesive strength, whose units should beNm¹2. The sample condition of tensile test was as follows:
(1) The vertical length from the peeling contact point to theend of the sample was 5mm.
(2) The Fp was determined by using micro-load tensiletester. The oFp was estimated by the peeling load andexperimental peeling width and length of 10 and 30mm,respectively. The initial distance before peeling (di) wasdefined at the start point of peeling force, which correspondsto the start point of the first relaxation. The di value is³1mm.
Fig. 1 Schematic diagram of T-Peeling test of the PET/Epoxy polymerslaminate sheet.
C. Kubo et al.1822
2.4 X-ray photoelectron spectrometer (XPS) measure-ments
X-ray photoelectron spectrometer (XPS: Quantum 2000,ULVAC Co., JAPAN)6) was used for surface analysis ofpeeled 0.30MGy HLEBI PET and unassembled untreatedPET. Both PET and Epoxy resin contain elements C, H andO. Narrow scans for the C (1s) and O (1s) signals from thePET surfaces were detected by the XPS.
3. Results
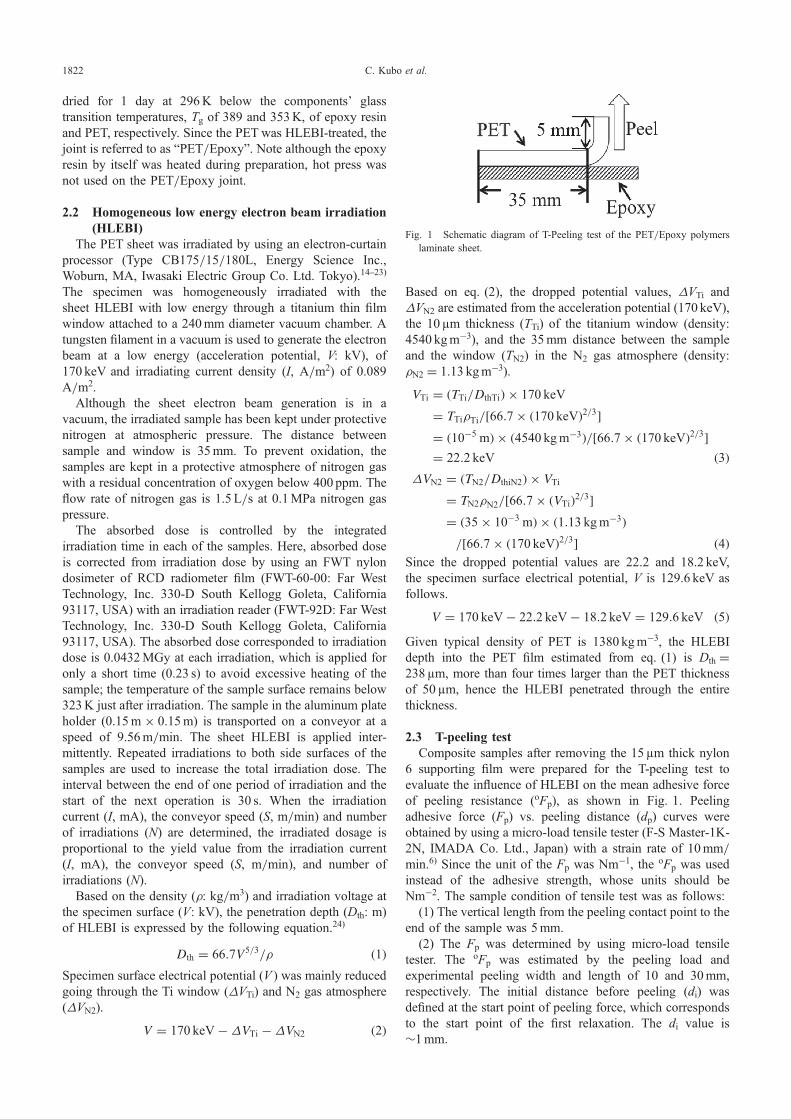
3.1 Peeling load (Lp)-peeling distance (dp) curveFigure 2 shows a comparison of Lp (N) vs. peeling
distance, dp (mm) curves between HLEBI and untreatedPET/Epoxy joint at median accumulative probability ofpeeling force, Pp = 0.50. Although without HLEBI a largeadhesive load of peeling resistance in the PET/Epoxy couldnot be obtained, by applying HLEBI at 0.30MGy the peelingload, Lp is significantly increased (³1.9N) over the low valueof the untreated (³0.20N). The 0.30MGy-HLEBI thereforelaminates the epoxy resin with the PET sheets, generating thehigher peeling resistance. Fracture was observed to alwaysoccur at the interface. The curves are flat, indicating stabilityand homogeneity throughout the 35mm peeling distance upuntil fracture.
3.2 Adhesive force of peeling (oFp) as a function ofaccumulative probability of peeling force (Pp)
Figure 3 plots the relationships between adhesive force ofpeeling (oFp) at each accumulative probability of peelingforce (Pp) of the PET/Epoxy laminated sheets for theuntreated and HLEBI-treated showing applying 0.30MGyHLEBI gives the highest oFp values, particularly abovePp > 0.2. Most notably, at high-Pp of 0.94 the 0.30MGyHLEBI raised the oFp significantly, 850% from 20 to190Nm¹1. At Pp = 0.85 the oFp was raised 584% from 19to 130Nm¹1.
Figure 4 shows the maximum oFp for low-, median-, andhigh-Pp of 0.06, 0.50 and 0.94 against HLEBI occurs in the
0.30MGy-HLEBI samples at 12.4, 37.2 and 190Nm¹1,respectively. The oFp at low- and median-Pp of 0.06 and 0.50,were 12.4 and 37.2Nm¹1, respectively which were more than2.2 and 2.8 times larger than 5.76 and 13.5Nm¹1 beforetreatment. All oFp values of PET/Epoxy laminated sheetswith 0.30 and 0.43MGy apparently exceed all correspondingvalues of untreated samples. Thus, adhesion of PET/Epoxylaminated sheets with 0.30 and 0.43MGy-HLEBI deemseffective.
4. Discussion
4.1 The statistically lowest adhesive forceIn order to obtain the statistically lowest peeling stress for
safety design, the lowest oFp value at Pp = 0 (Fs) is assumedto be attained from the adaptable relationship of the 3-parameter Weibull equation iterating to the high correlation
0 10 20 30 400
1
2
3
4
Peeling Distance, dp/mm
Peel
ing
Load
, Lp /
N
0.30 MGy Untreated
Fig. 2 Peeling load (Lp)-peeling distance (dp) curves of PET/Epoxylaminated sheets before and after 0.30MGy-HLEBI to PET at Pp of 0.50.
100 101 102 1030
0.2
0.4
0.6
0.8
1.0
Untreated 0.04 MGy 0.13 MGy 0.22 MGy 0.30 MGy 0.43 MGy
Mean Adhesive Force, Fp / Nm-1
Peel
ing
Prob
abili
ty, P
p
Fig. 3 Relationships between oFp and the accumulative probability ofpeeling force (Pp) of PET/Epoxy laminated sheets untreated and HLEBI-treated to PET.
0 0.1 0.2 0.3 0.4 0.5100
101
102
103
Absorbed Dose, D / MGy
Ade
sive
For
ce, F p
/ N
m-1
Pp = 0.94Pp = 0.50Pp = 0.06
Fig. 4 Changes in experimental oFp at each Pp of PET/Epoxy laminatedsheets at low-, median-, and high-Pp of 0.06, 0.50 and 0.94 againstabsorbed dose to PET.
Adhesive Force Improvement of Polyethylene Terephthalate (PET)/Epoxy Resin Joint by Electron Beam to PET Prior to Assembly 1823
coefficient (F). The Pp depends on the risk of rupture([oFp ¹ Fs]/FIII).6,2531)
Pp ¼ 1� exp½�ð½oFp � Fs�=FIIIÞm� ð6ÞThe FIII value is the oFp value, when the term ln[¹ln(1 ¹
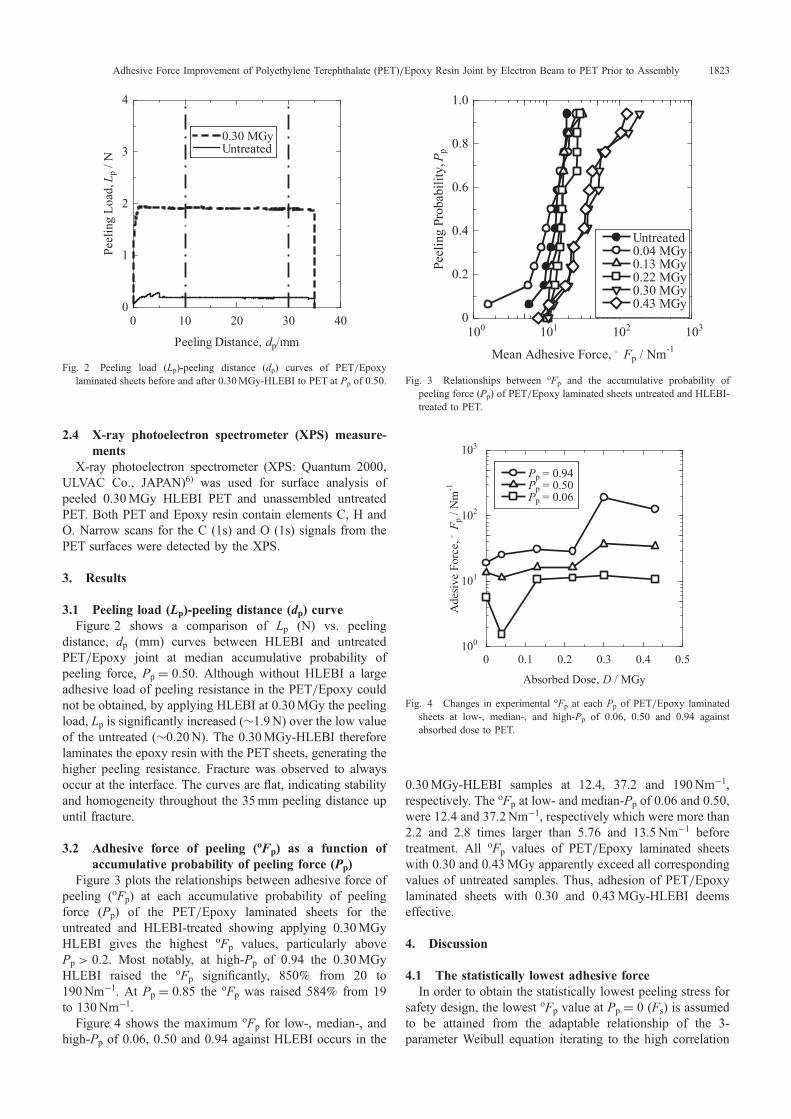
Pp)] is zero. When Pp = 0, the required oFp value to evaluatenew structural materials is defined as the Fs. In predictingthe Fs, coefficient (m) and constant (FIII) are the keyparameters. Figure 5 plots the iteration to obtain the highestcorrelation coefficient (F) with respect to the potentialadhesive force of peeling oFs value (eFs) estimated from thelogarithmic form.
Figure 6 illustrates the linear relationships betweenln(oFp ¹ Fs) and ln[¹ln(1 ¹ Pp)]. The values of FIII and mare determined by the least-squares best fit method. The mvalue is estimated by the slope of the relationship wheneFs = Fs.
Figure 7 shows Fs is always lower than the experimentaloFp value. The HLEBI from 0.13 to 0.43MGy improves the
Fs values of the PET/Epoxy laminated sheets over that of theuntreated. The 0.30MGy-HLEBI apparently enhances the Fs
from 0N·m¹1 for the untreated to 10.7N·m¹1; as well as atlow Pp of 0.06 (the lowest experimental oFp) from 5.8 for theuntreated to 12.4N·m¹1. Consequently, HLEBI enhances thesafety level (reliability) of PET/Epoxy laminated sheets. Thisindicates HLEBI induced adhesion can be applied to practicalarticles with sterilization without volatilization, when theadhesive force of peeling resistivity is less than 10.7N·m¹1.
4.2 X-ray photoelectron spectrometry (XPS) of PETsurface
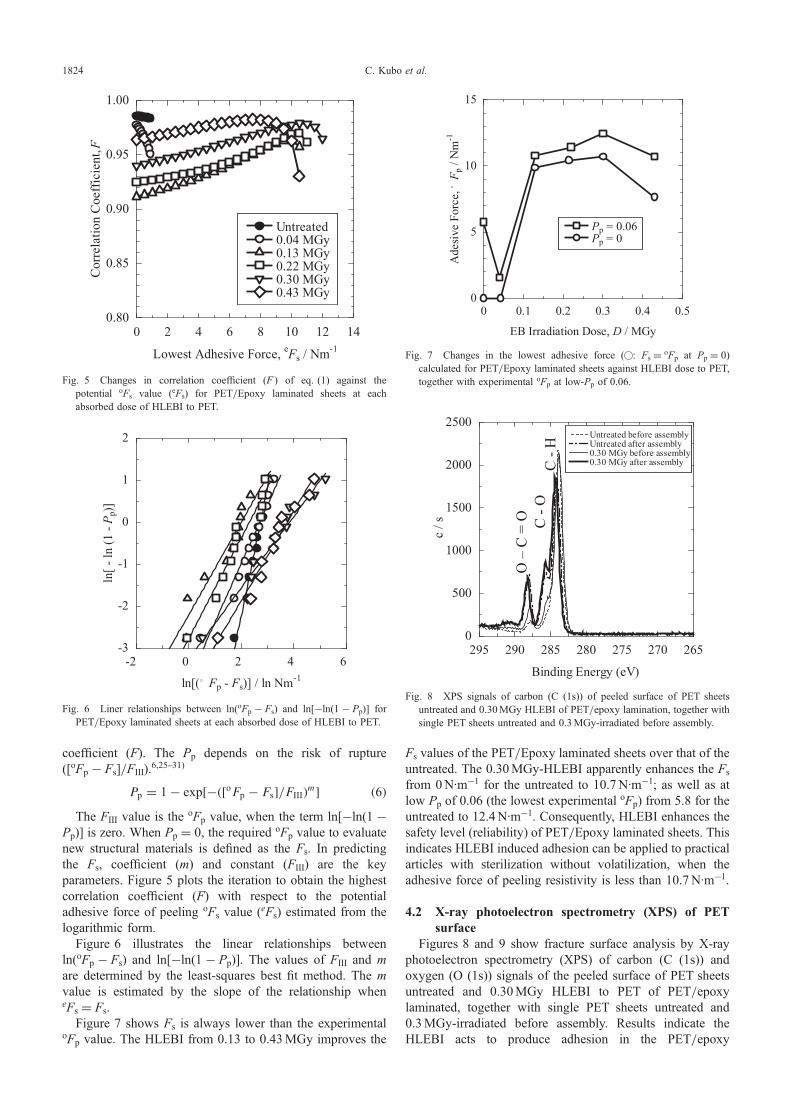
Figures 8 and 9 show fracture surface analysis by X-rayphotoelectron spectrometry (XPS) of carbon (C (1s)) andoxygen (O (1s)) signals of the peeled surface of PET sheetsuntreated and 0.30MGy HLEBI to PET of PET/epoxylaminated, together with single PET sheets untreated and0.3MGy-irradiated before assembly. Results indicate theHLEBI acts to produce adhesion in the PET/epoxy
0 2 4 6 8 10 12 140.80
0.85
0.90
0.95
1.00
Untreated 0.04 MGy 0.13 MGy 0.22 MGy 0.30 MGy 0.43 MGy
Lowest Adhesive Force, eFs / Nm-1
Cor
rela
tion
Coe
ffic
ient
, F
Fig. 5 Changes in correlation coefficient (F ) of eq. (1) against thepotential oFs value (eFs) for PET/Epoxy laminated sheets at eachabsorbed dose of HLEBI to PET.
-2 0 2 4 6-3
-2
-1
0
1
2
ln[( Fp - Fs)] / ln Nm-1
ln[ -
ln (1
- P p
)]
Fig. 6 Liner relationships between ln(oFp ¹ Fs) and ln[¹ln(1 ¹ Pp)] forPET/Epoxy laminated sheets at each absorbed dose of HLEBI to PET.
0 0.1 0.2 0.3 0.4 0.50
5
10
15
EB Irradiation Dose, D / MGy
Ade
sive
For
ce, F p
/ N
m-1
Pp = 0.06Pp = 0
Fig. 7 Changes in the lowest adhesive force ( : Fs =oFp at Pp = 0)
calculated for PET/Epoxy laminated sheets against HLEBI dose to PET,together with experimental oFp at low-Pp of 0.06.
C-H
C-O
O–
C =
O
2652702752802852902950
500
1000
1500
2000
2500 Untreated before assembly Untreated after assembly 0.30 MGy before assembly 0.30 MGy after assembly
Binding Energy (eV)
c / s
Fig. 8 XPS signals of carbon (C (1s)) of peeled surface of PET sheetsuntreated and 0.30MGy HLEBI of PET/epoxy lamination, together withsingle PET sheets untreated and 0.3MGy-irradiated before assembly.
C. Kubo et al.1824

lamination joint where fracture generally occurred near thepeeled PET-epoxy interface.
In Fig. 8 the XPS narrow scan of carbon (C (1s)) of thepeeled 0.30MGy sample shows peaks at ³284, 286 and288 eV corresponding with the C (1s) in C-H, O-C=O and C-O groups. Since the deceasing carbon ratio of PET to Epoxyis remarkably smaller than that of the O (1s), the change in C(1s) peak intensity is smaller than that of O (1s) as predicted.
In order to calibrate the results in detail, XPS signals of C(1s) have been obtained for PET with and without HLEBI(Solid and Broken lines in Fig. 8) before assembly (narrowlines in Fig. 8). The highest intensity of C-H signal foruntreated PET before assembly is gotten. Although0.30MGy-HLEBI slightly decreases the C-H intensity, itremarkably enhances the C-O and O-C=O intensities. SinceHLEBI activates the terminated polymer atoms, oxygenatoms from atmospheric molecules are attracted to surface,and then contaminate the polymers, resulting in increasingoxygen concentration at PET interface.
Each atomic ratio of elements of carbon, hydrogen andoxygen of PET ((C10H8O4)n) and Epoxy ((C18H23O2)n) is(C : 0.455, H : 0.364, O : 0.181) and (C : 0.418, H : 0.535,O : 0.047), respectively. Each atomic ratio of carbon andoxygen of PET is 1.09 and 3.85 times higher than those ofEpoxy, respectively, whereas the ratio of hydrogen of Epoxyis 3.85 times higher than that of PET.
The XPS signals of C-O and O-C=O of untreated PETsheet before assembly (narrow broken line in Fig. 8) arehigher than those of untreated PET sheet after lamination (Fatbroken line in Fig. 8), whereas the lamination decreases theintensity of C-H signal. Since the lamination increases theconcentrations of carbon and oxygen and decreases thehydrogen concentration because of oxygen contaminationfrom atmospheric molecules, it probably attributes to weakadhesion force of the PET/Epoxy lamination untreated, asshown in Figs. 3 and 4.
The intensity of C-O peak of 0.30MGy-HLEBI PET sheetafter lamination (Fat solid line in Fig. 8) is higher than that of
untreated PET sheet after lamination (Fat broken line inFig. 8), although the intensities of C-H and O-C=O peaks oflaminated sheets doesn’t change by HLEBI. It is explainedthat HLEBI activates the PET surface. The active PET attractsthe oxygen atoms from atmospheric molecules with increas-ing oxygen content. On the contrary, the active PET easilyadheres the Epoxy with decreasing the oxygen content atPET surface. Based on the both reaction, the adhesive forcewas increased. Therefore residual epoxy deposition isapparently found to be retained on the PET sheet by inter-matrix fracture of epoxy resin further into the thickness. Thiscan be explained by the adhesion force from cross-linkingbetween PET/epoxy being stronger than the cohesive forceof epoxy polymer itself.
In Fig. 9 the XPS narrow scan of oxygen (O (1s)) of thepeeled 0.30MGy sample shows peaks at 532 and 533.5 eVcorresponding with the O (1s) in O=C-O and C-O-C groups.
In order to calibrate the results in detail, XPS signals of O(1s) in O=C-O and C-O-C have been obtained for PET withand without HLEBI before assembly (Narrow solid andBroken lines in Fig. 9). The lowest intensity of O (1s) inO=C-O and C-O-C signals for untreated PET afterlamination is gotten. Since 0.30MGy-HLEBI remarkablyenhances the intensity, it remarkably enhances the oxygenconcentration at PET interface. Since HLEBI activates theterminated polymer atoms, oxygen atoms from atmosphericmolecules are attracted to surface, and then contaminate thepolymers.
The XPS signals of O (1s) in O=C-O and C-O-C ofuntreated PET sheet before assembly (Narrow broken line inFig. 9) are higher than those of untreated PET sheet afterlamination (Fat broken line in Fig. 9). It shows that thelamination simply increase the oxygen concentration becauseof oxygen contamination effects from atmospheric mole-cules, as shown in Fig. 8. The contamination probablyattributes to weak adhesion force of the PET/Epoxylamination untreated, as shown in Figs. 3 and 4.
The oxygen atoms exist as O=C-O before assembly,whereas they exist as O=C-O and C-O-C after lamination.The peak intensity value (oxygen concentration) of O (1s) inC-O-C is equal to that in C=O-C after lamination.
Increase in the peak intensity value (oxygen concentration)of O (1s) in C-O-C induced by the lamination from 263 to1477 c/s is two times larger than that of O=C-O from 846to 1493 c/s. The oxygen contamination from atmosphericmolecules mainly converts to the oxygen atoms in C-O-C.
The peak intensity of O (1s) in O=C-O and C-O-C of0.30MGy-HLEBI PET sheet after lamination (Fat solid linein Fig. 9) is slightly lower than that of untreated PET sheetafter lamination (Fat broken line in Fig. 9). Since atomic ratioof oxygen (O : 0.181) of PET ((C10H8O4)n) is 3.85 timeshigher than that (O : 0.047) of Epoxy ((C18H23O2)n), thereduction of peak of O (1s) in O=C-O and C-O-C in theHLEBI sample possibly indicates epoxy adheres to the PET.Therefore, residual epoxy deposition is apparently found tobe retained on the PET sheet by inter-matrix fracture of epoxyresin further into the thickness. This can be explained bythe adhesion force from crosslinking between PET/epoxybeing stronger than the cohesive force of epoxy polymeritself.
5155205255305355405450
1000
2000
Untreated before assembly Untreated after assembly 0.30 MGy before assembly 0.30 MGy after assembly
Binding Energy (eV)
c / s
C-O
-C
O =
C -
O
Fig. 9 XPS signals of oxygen (O(1s)) of peeled surface of PET sheetsuntreated and 0.30MGy HLEBI of PET/epoxy laminated, together withsingle PET sheets untreated and 0.3MGy-irradiated before assembly.
Adhesive Force Improvement of Polyethylene Terephthalate (PET)/Epoxy Resin Joint by Electron Beam to PET Prior to Assembly 1825
On the other hand, the peak intensity of O (1s) in O=C-Oand C-O-C of 0.30MGy-HLEBI PET sheet after lamination(Fat solid line in Fig. 9) is higher than that of 0.30MGy-HLEBI PET sheet before assembly (Narrow solid line inFig. 9). The concentration of oxygen is determined by bothatmospheric molecules and adhering Epoxy to PET.
5. Conclusions
A polyethylene terephthalate (PET)/Epoxy joint wasrapidly fabricated for bio-adaptable applications without theuse of glue or hot press by applying homogeneous low energyelectron beam irradiation (HLEBI) surface treatment to thePET prior to laminating to the epoxy resin with hand pressure.(1) By applying 0.30MGy HLEBI the adhesive force
of peeling (oFp) was increased substantially over theuntreated. The largest oFp values at optimal dose 0.30MGy were 12.4 and 37.2Nm¹1, which were more than2.2 and 2.8 times larger than 5.76 and 13.5Nm¹1 beforetreatment at low- and median-accumulative probabilityof peeling force, Pp of 0.06 and 0.50, respectively.
(2) Moreover, at high-Pp of 0.94 the 0.30MGy HLEBIraised the oFp significantly, 850% from 20 to 190Nm¹1
while at Pp = 0.85 the oFp was raised 584% from 19 to130Nm¹1.
(3) The statistically lowest oFp for safety design (Fs atPp = 0) iterated by the 3-parameter Weibull equationwas raised from 0Nm¹1 for the untreated to 10.7Nm¹1
for the 0.30MGy samples indicating increased reli-ability over the untreated.
(4) Although the ESR peaks of the HLEBI-treated PETwere low intensity, applying the HLEBI to the PETmade it possible to raise the peel force of the laminatedPET/Epoxy.
(5) The adhesion mechanism is HLEBI generally cuts theatomic bonding at weak chemical bonding sites anddangling bonds are formed at the terminated atoms withlow dissociation energies in the PET at methylene andcarboxylate groups. The dangling bonds were probablyin the form of free radicals bonding the PET and epoxyby cross-linking.
(6) Larger HLEBI dose of more than 0.43MGy decreasedthe oFp as general radiation damage. Therefore careful-ness to optimize the HLEBI dose for practicalapplications is highly recommended.
Acknowledgements
The authors wish to thank Prof. Akira Tonegawa of TokaiUniversity for his useful help. Our sincere gratitude also goesto Eye Electron Beam Co., Ltd. (Gyoda, Saitama, Japan) fortheir support with this work. This work was partly supportedby the Japan Science and Technology Agency (JST) A-STEPProgram.
REFERENCES
1) H. Hayashida, T. Sugaya, S. Kuramoto, C. Sato, A. Mihara and T.Onuma: Int. J. Adhes. Adhes. 56 (2015) 6172.
2) M. Sano, H. Oguma, M. Sekine and C. Sato: Int. J. Adhes. Adhes. 47(2013) 5762.
3) M. Sano, H. Oguma, M. Sekine and C. Sato: Int. J. Adhes. Adhes. 54(2014) 124130.
4) A. Oshima, H. Nagai, F. Muto, T. Miura and M. Washio: J. Polym. Sci.Tech. 19 (2006) 123127.
5) M. Zenkiewicz: Int. J. Adhes. Adhes. 24 (2004) 259262.6) Y. Nishi, M. Uyama, H. Kawazu, H. Takei, K. Iwata, H. Kudoh and K.
Mitsubayashi: Mater. Trans. 53 (2012) 16571664.7) Y. Nishi, H. Kawazu, H. Takei, K. Iwata, H. Kudoh and K.
Mitsubayashi: Mater. Trans. 52 (2011) 19431948.8) C. Kubo, T. Okada, M. Uyama, M. Kanda and Y. Nishi: Mater. Trans.
55 (2014) 17421749.9) W. Smitthipong, M. Nardin, J. Schultz and K. Suchiva: Int. J. Adhes.
Adhes. 27 (2007) 352357.10) A. K. Singh, D. S. Mehra, U. K. Niyogi, S. Subharwal, J. Swiderska, Z.
Czech and R. K. Khandal: Int. J. Adhes. Adhes. 41 (2013) 7379.11) A. Charlesby and S. H. Pinner: Proc. Roy. Soc. A 249 (1959) 367386.12) P. J. Flory: J. Am. Chem. Soc. 69 (1947) 3035.13) National Space Development Agency of Japan (NASDA) Contract
Report: JAXA Repository, Osaka Nuclear Science Association, Studyon radiation effects to materials, Part 4, On evaluation technique ofradhard characteristics, Report Number: NASDA-CNT-990013.
14) K. Oguri, N. Iwataka, A. Tonegawa, Y. Hirose, K. Takayama and Y.Nishi: J. Mater. Res. 16 (2001) 553557.
15) A. Mizutani and Y. Nishi: Mater. Trans. 44 (2003) 18571860.16) K. Sonoda, Y. Kaneda, I. K. Nakazaki, Z. Enomoto and K. Murayama:
Proc. Symp. of Space Sciences and Technology, (Utyu kagaku gizyuturenngou kouennkai kouennsyu, JST No. S0277A) 28 (1984) pp. 1415.
17) K. Oguri, K. Fujita, M. Takahashi, Y. Omori, A. Tonegawa, N. Honda,M. Ochi, K. Takayama and Y. Nishi: J. Mater. Res. 13 (1998) 33683371.
18) K. Oguri, N. Iwatani, H. Izumi, A. Tonegawa, K. Takayama and Y.Nishi: Proc. 2nd Japan-France Seminar on Intelligent Materials andStructures, (University of Louis Pasteur Strasbourg, France) (1998)pp. 142144.
19) Y. Nishi, A. Mizutani and N. Uchida: J. Thermoplastic Compos. Mater.17 (2004) 289302.
20) Y. Nishi, T. Toriyama, K. Oguri, A. Tonegawa and K. Takayama:J. Mater. Res. 16 (2001) 16321635.
21) Y. Nishi, A. Mizutani, A. Kimura, T. Toriyama, K. Oguri and A.Tonegawa: J. Mater. Sci. 38 (2003) 8992.
22) K. Inoue, K. Iwata, T. Morishita, A. Tonegawa, M. Silvia and Y. Nishi:Int. J. Appl. Electromag. Mech. 23 (2003) 251256.
23) Y. Nishi, K. Inoue and M. Salvia: Mater. Trans. 47 (2006) 28462851.24) M. Kanda, K. Yuse, B. Guiffard, L. Lebrun, Y. Nishi and D. Guyomar:
Mater. Trans. 53 (2012) 18061809.25) H. Takei, M. Salvia, A. Vautrin, A. Tonegawa and Y. Nishi: Mater.
Trans. 52 (2011) 734739.26) K. Iwata and Y. Nishi: Mater. Trans. 49 (2008) 20582062.27) Y. Nishi, H. Kobayashi and M. Salvia: Mater. Trans. 48 (2007) 1924
1927.28) N. Tsuchikura, M. C. Faudree and Y. Nishi: Mater. Trans. 54 (2013)
371379.29) H. Takei, K. Iwata, M. Salvia, A. Vautrin and Y. Nishi: Mater. Trans. 51
(2010) 22592265.30) W. Weibull: Ingeniörs Vetenskaps Akademien, nr. 153 (Generalstabens
litografiska anstalts förlag, Stockholm, 1939) pp. 1622.31) Yu. P. Yampolskii: Russian Chem. Rev. 76 (2007) 5978.
C. Kubo et al.1826