Embed Size (px)
Citation preview
Annual Development Effectiveness Review 2013Towards sustainable growth for Africa
Annual review
African Development Bank Group
ACKNOWLEDGEMENTS
This third edition of the African Development Bank (AfDB)’s Annual Development Effectiveness Review is the product of strong collaboration on the part of staff from most of AfDB’s departments. We would like to recognise Cecile Ambert, Stefan!Atchia, May!Ali Babiker, Awa Bamba, Douglas Barnett, Aimee Bella-Corbin, Nejmudin Kedir Bilal, Thomas Ampah!Brient, Domina! Buzingo, Sarah Cooper, Horia Sohir Debbiche, Mariem Dridi, Gabriele Fattorelli, Henrik Franklin, Gisela! Geisler, Azza! Gharbi, Henriette! Guede, Mouhamed Gueye, Samer Hachem, Helmi Hmaidi, Jonathan Kaliwata, Seung! Kook Kang, Mariem! Khelifi, Patience Kuruneri, Benson Maina, Luigi Mennella, Jacques Moulot, Joelle Kanyana Murara, Ihcen Naceur, Mahecor!Ndiaye, Etienne!Nkoa, James!Peters Opio-Omoding, Monojeet Pal, Joshua Powell, Alexis Rwabizambuga, Audrey!Rojkoff, Alexander!Samarin, Richard!Schiere, Olivier Shingiro, Frank Sperling, Hadja Tall, Frederik Teufel, Lornah Njok Gituro Wahome, and Georg Weiers.
We especially acknowledge the contributions of chief writer Marcus Cox (Agulhas Applied Knowledge), graphic designer Nadim!Guelbi (Belmakett), photographer Arne Hoel, and editor Patricia Rogers, all consultants.
Emmanuel Ebot Mbi Chief Operating Officer, First Vice-President African Development Bank
Simon Mizrahi Director, Quality Assurance and Results Department African Development Bank
Victoria Chisala Manager, Quality Assurance and Results Department African Development Bank
Cover photo: The construction of the Henry Konan Bedie Toll Bridge in Abidjan is expected to make a significant contribution to the country’s economic recovery by improving the quality of basic infrastructure, relieving heavy traffic congestion in the city centre.
© 2013 African Development Bank Group
All rights reserved. Published June 2013. Printed in Tunisia.
African Development Bank Group Development Effectiveness Review 2013
The views expressed in this book are those of the authors and do not necessarily reflect the views and policies of the African Development Bank (AFDB), its Board of Governors, its Board of Directors or the governments they represent.
AfDB and its Board of Directors do not guarantee the accuracy of the data included in this publication and accept no responsibility for any consequence of their use.
By making any designation of or reference to a particular territory or geographic area, or by using the term “country” in this document, AfDB does not intend to make any judgments as to the legal or other status of any territory or area.
AfDB encourages printing or copying information exclusively for personal and non-commercial use with proper acknowledgment of AfDB. Users are restricted from reselling, redistributing, or creating derivative works for commercial purposes without the express, written consent of AfDB.
Note: In this report, “$” refers to US dollars.
African Development Bank Group Temporary Relocation Agency Angle de l’Avenue du Ghana et des rues Pierre de Coubertin et Hédi Nouira B.P. 323 - 1002 Tunis - Belvédère
www.afdb.org
Contents
The 2013 ADER in 7 numbers vForeword 1Executive summary 3Introduction 11
Level 1: Development in Africa 13Economic growth and poverty reduction 13Private-sector development and investment climate 15Regional integration and trade 16Infrastructure 17Agriculture and food security 18Gender and human development 19Governance and transparency 20Fragile and conflict-affected countries 21Environment and clean energy 21Conclusion 22
Level 2: How AfDB contributes to!Africa’s development 25Measuring the Bank’s contribution to!development 25Africa’s transformation 27Private-sector development and investment climate 28Regional integration and trade 29Infrastructure 31Agriculture and food security 32Gender and human development 33Governance and transparency 34Fragile and conflict-affected countries 34Environment and clean energy 35Conclusion 36
Contents
Level 3: How well AfDB manages its operations 39Performance of the Bank’s portfolio 39Quality-at-entry of Bank operations 42Performance on the Paris Declaration indicators 43Knowledge management 43Gender mainstreaming in the Bank 44Climate change and clean energy 45Conclusion 45
Level 4: How efficient AfDB is as!an!organisation 47Human resources 47Business processes and practices 49Information technology 49Decentralisation 50Transparency 51Conclusion 52
Conclusion and outlook 55
Annual D
evelo
pm
ent Effe
ctiveness R
eview 2
013
v
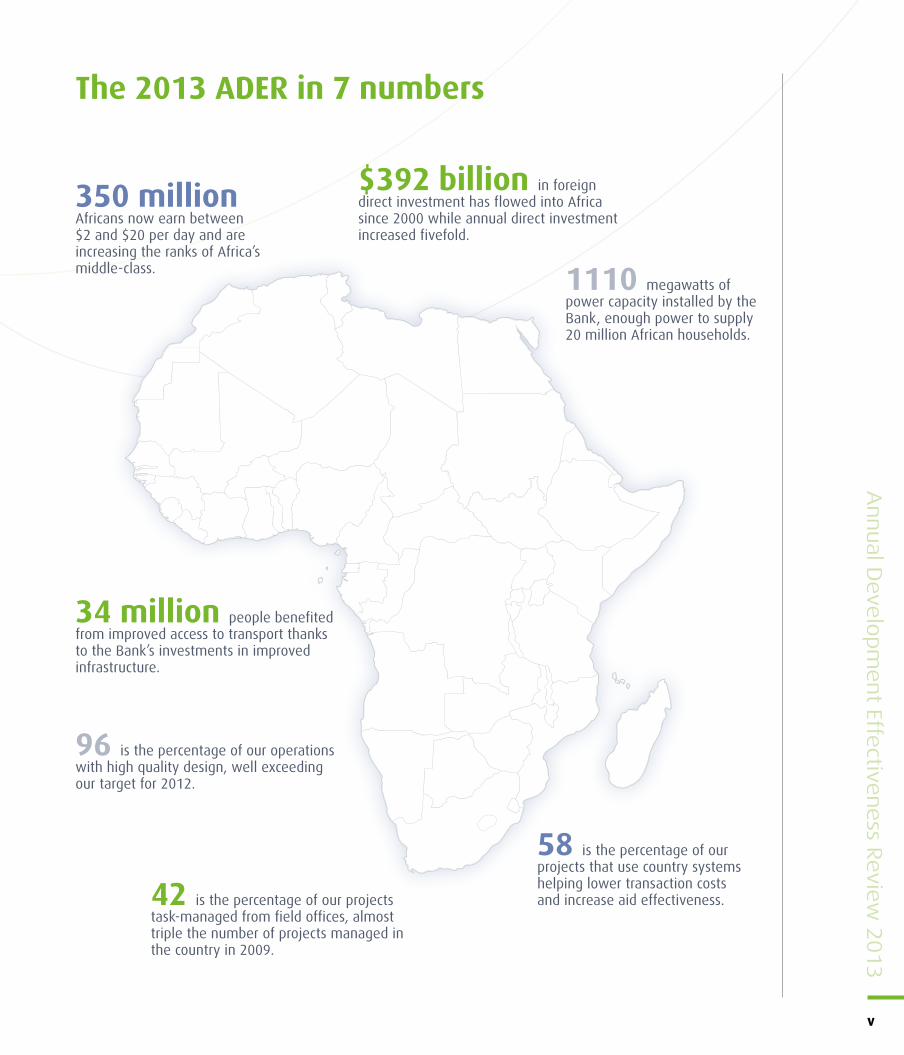
The 2013 ADER in 7 numbers
350 million Africans now earn between $2 and $20 per day and are increasing the ranks of Africa’s middle-class.
34 million people benefited from improved access to transport thanks to the Bank’s investments in improved infrastructure.
96 is the percentage of our operations with high quality design, well exceeding our target for 2012.
42 is the percentage of our projects task-managed from field offices, almost triple the number of projects managed in the country in 2009.
1110 megawatts of power capacity installed by the Bank, enough power to supply 20!million African households.
58 is the percentage of our projects that use country systems helping lower transaction costs and increase aid effectiveness.
$392 billion in foreign direct investment has flowed into Africa since 2000 while annual direct investment increased fivefold.
34°
1’ 5
3”
N —
6°
48’ 5
9”
W
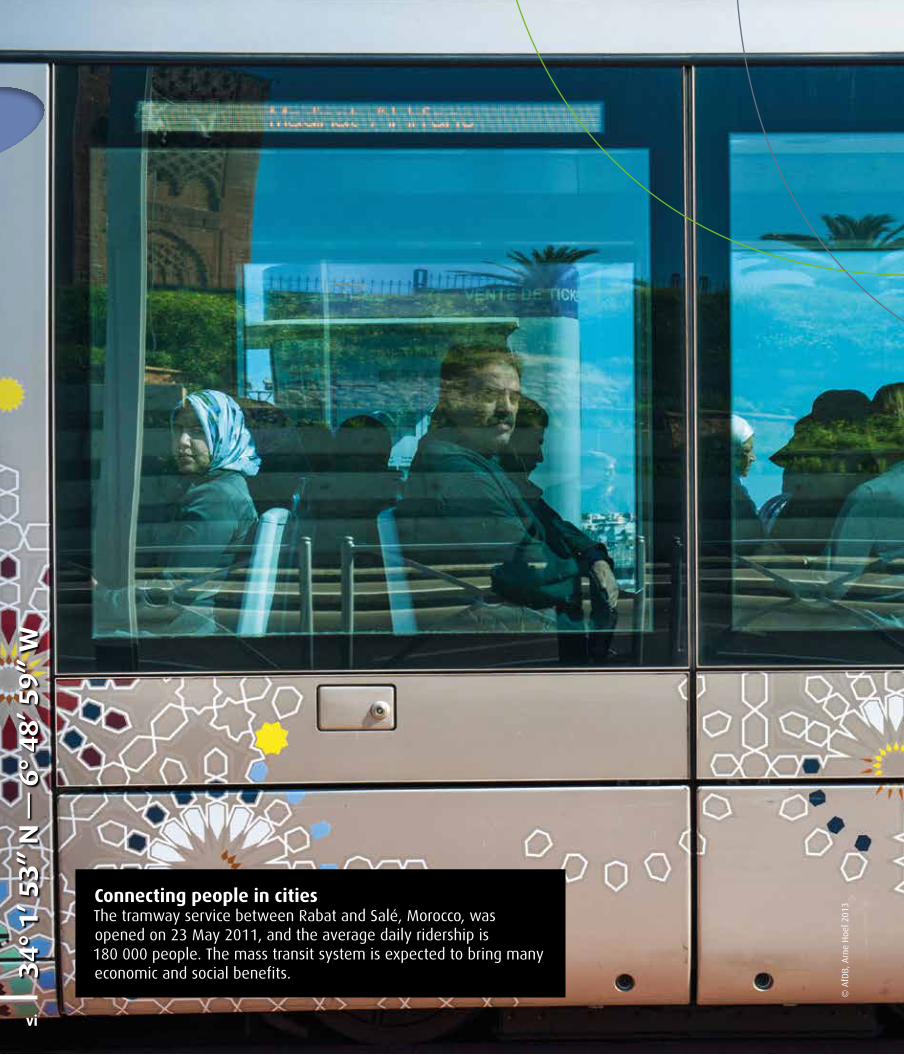
Connecting people in citiesThe tramway service between Rabat and Salé, Morocco, was opened on 23!May 2011, and the average daily ridership is 180!000 people. The mass transit system is expected to bring many economic and social benefits.
© A
fDB,
Arn
e H
oel 2
013
vi
With around one-third of its countries growing by more than 6%, Africa has become the world’s fastest-growing continent. This new economic dynamism is more than just a resource boom; it is the result of dramatic improvements in economic management.
More than two-thirds of African countries have improved their quality of governance, leading to a better business climate, improved basic services and expanded economic opportunities.
As a result, we are witnessing deep-seated structural changes. Some 350!million Africans now earn between $2 and $20 a day, giving rise to a growing middle class with increased disposable income, and making the continent an increasingly attractive market for investors – domestic and international.
These transformations open new development horizons for Africa. To unleash Africa’s potential and make sure the benefits of growth accrue to this and future generations, development needs to be managed sustainably.
This third Annual Development Effectiveness Review of the African Development Bank Group explores the theme of transition towards a sustainable growth path.
It examines the Bank Group’s efforts and accomplishments over the past year, indicating areas where we have been most successful and those in which we need to do better. We are particularly pleased to note that many of the Bank’s activities are already helping to bring about the structural transformations Africa needs to maintain its growth.
We are working with our clients to improve the management of land, forest and water resources – the natural infrastructure that underpins both growth and the quality of our day-to-day lives – and to develop solutions for sustainable growth, including renewable energy. And our investments are helping our clients deal with the effects of climate change, which are already taxing African countries’ economic potential.
As we go forward, we believe that Africa has the capacity to leapfrog to new technologies and become a global leader in sustainable development. We are committed to continuing to support and assist that transformation through intelligent investments, sound advice and innovative approaches.
Donald KaberukaPresident of the African Development Bank Group
Foreword
Annual D
evelo
pm
ent Effe
ctiveness R
eview 2
013
1
Towards sustainable growth for Africa
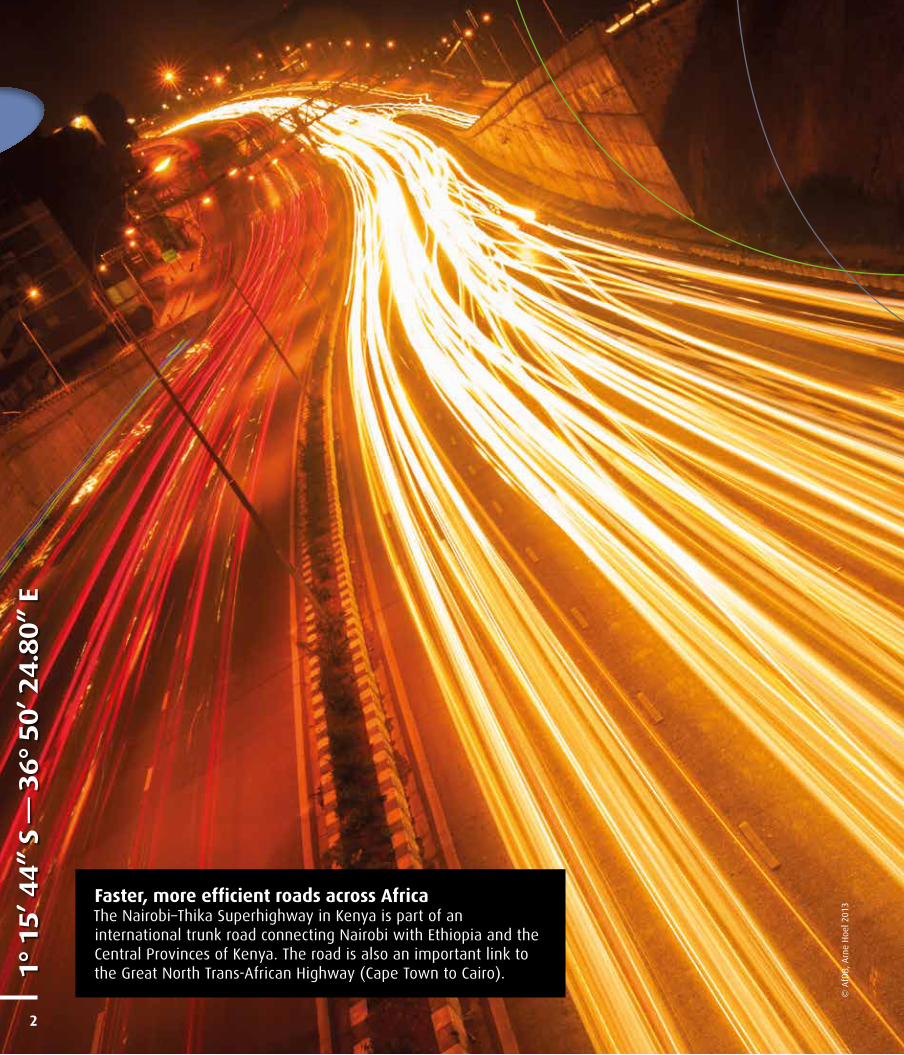
Faster, more efficient roads across Africa The Nairobi–Thika Superhighway in Kenya is part of an international trunk road connecting Nairobi with Ethiopia and the Central Provinces of Kenya. The road is also an important link to the Great North Trans-African Highway (Cape Town to Cairo).
© A
fDB,
Arn
e H
oel 2
013
1°
15’ 4
4”
S —
36°
50’ 2
4.8
0”
E
2
Executive summary
The Annual Development Effectiveness Review (ADER) provides an overview of how the African Development Bank (the Bank, or AfDB) is contributing to Africa’s development. This year’s ADER takes sustainable growth as its guiding theme. We examine the progress that Africa is making to place its current strong growth performance on sustainable foundations, and how the Bank is contributing to this transition.
The ADER reports against the four levels of the Bank’s results measurement framework. Level!1 presents Africa’s development progress over nine areas, such as infrastructure, regional integration and private sector development, drawing linkages to the theme of sustainable growth; Level!2 presents the aggregate outcomes of our operations in nine areas, along with selected examples of our projects; Level!3 assesses how well we manage our portfolio; and Level!4 describes our efforts to strengthen our organisational capacity through initiatives such as decentralisation. The ADER incorporates data from our results measurement framework throughout, with traffic-light ratings that indicate progress towards our goals.
Growing African Economies SustainablyStrong Growth — Africa is now the fastest growing continent in the world. The growth rate of its low-income countries exceeded 4.5% in 2012 and it is predicted to remain above 5.5% in the coming years. Africa’s collective GDP per capita has reached $953, and 26!of the 54 African countries have achieved middle-income status. Internal demand is beginning to become a source of Africa’s growth in its own right.
Strong economic growth has made major inroads into income poverty. The share of the population living below the poverty line has fallen from 51% in 2005 to 39% in 2012. Some 350 million Africans now earn between $2 and $20 per day, and the middle class is becoming an increasingly attractive consumer market. The challenge will be to address continuing inequality so that all Africans, including those living in isolated rural communities, deprived neighbourhoods, and fragile states are able to benefit from this economic growth. Pursuing an inclusive and sustainable growth agenda is key to reducing these inequalities.
Natural resource management — Around the world, nature and natural resources are under more pressure than ever before – and nowhere is this more striking than in Africa. The region’s transformation is resulting in greater consumption of resources in Africa, with an increasing impact on the natural environment. In the coming decades, the effects of climate change are expected to compound environmental losses. Yields from rain-fed agriculture
could be reduced by up to 50%, and by 2020, up to 250 million people are likely to experience water shortages.
Private-sector-led growth — The private sector continues to be Africa’s main engine of growth and poverty reduction. African countries have made steady progress in improving the business climate: the costs of starting a business have fallen by more than two-thirds over the past seven years, while delays for starting a business have been halved. This progress has brought increased levels of trade and investment, with the annual rate of foreign investment increasing fivefold since 2000. For the future, improvements in such areas as access to finance and quality of infrastructure should help improve Africa’s global competitiveness.
Regional economic integration — Regional economic integration is key to enabling Africa’s producers to build regional value chains, achieve economies of scale and become internationally competitive. Recent years have seen a series of bold initiatives, including rationalising the complex architecture of regional institutions and launching specialist organisations to manage regional power pools and water basins. However, exports are still predominantly in the form of primary commodities, and more work to increase intra-African trade will be needed.
Infrastructure — Africa’s infrastructure deficit remains a major constraint on its development. Africa currently invests just 4% of its collective GDP in infrastructure, compared with China’s 14%. Nonetheless, this gap also represents an opportunity for Africa to leapfrog to new, environmentally sound technologies. While sustainable infrastructure entails significant up-front investments, it will prove cost-effective over the longer term.
Water and sanitation — Africa has been making slow progress on improving access to clean water and sanitation. Access to an improved water source improved only slightly from 64% in 2005 to 66% in 2012 (compared to an average of 89% across the developing world), and just 28% of people in Africa’s poorest countries had access to improved sanitation facilities. Access is gradually improving in rural settings, but it will be important
Annual D
evelo
pm
ent Effe
ctiveness R
eview 2
013
3
Africa is now the fastest growing continent in the world, with a labour force larger than that of China or India by 2035
The private sector generates 90% of Africa’s jobs, two-thirds of its investment and 70% of its output
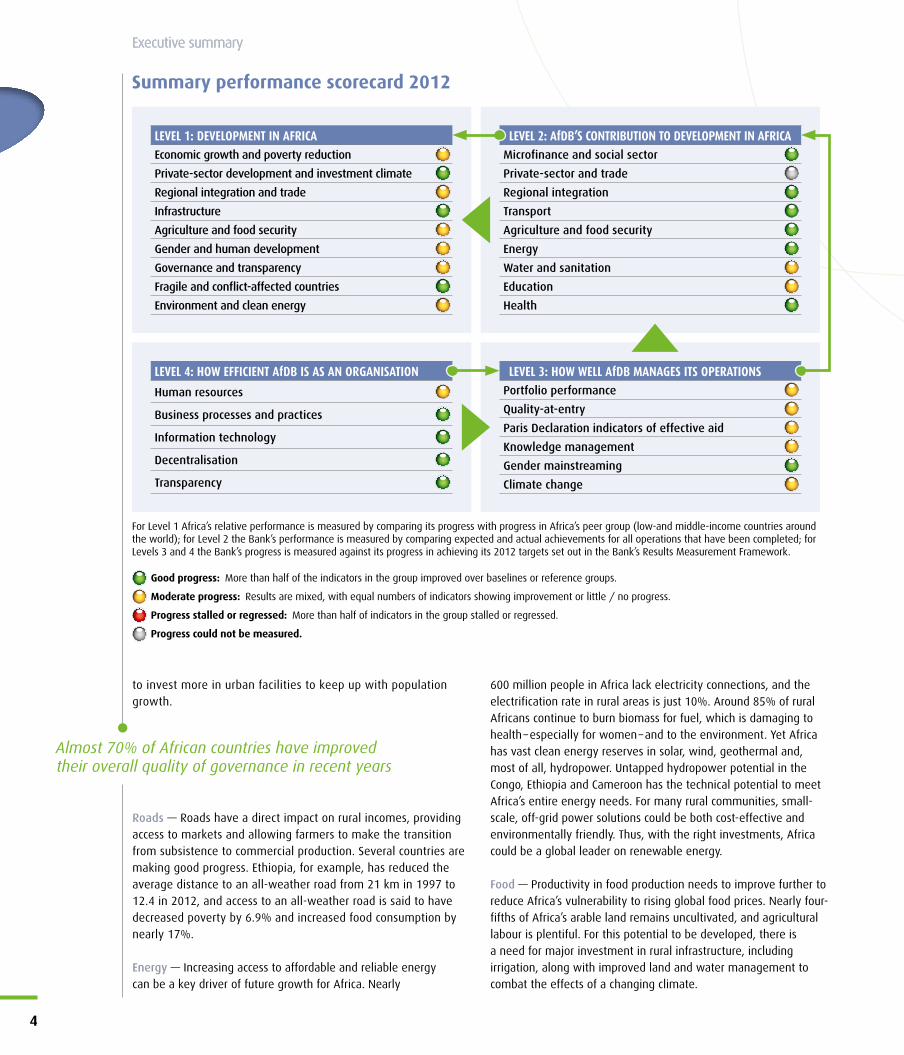
For Level 1 Africa’s relative performance is measured by comparing its progress with progress in Africa’s peer group (low-and middle-income countries around the world); for Level 2 the Bank’s performance is measured by comparing expected and actual achievements for all operations that have been completed; for Levels 3 and 4 the Bank’s progress is measured against its progress in achieving its 2012 targets set out in the Bank’s Results Measurement Framework.
Good progress: More than half of the indicators in the group improved over baselines or reference groups.
Moderate progress: Results are mixed, with equal numbers of indicators showing improvement or little / no progress.
Progress stalled or regressed: More than half of indicators in the group stalled or regressed.
Progress could not be measured.
Summary performance scorecard 2012
LEVEL 3: HOW WELL AfDB MANAGES ITS OPERATIONSPortfolio performance
Quality-at-entry
Paris Declaration indicators of effective aid
Knowledge management
Gender mainstreaming
Climate change
LEVEL 2: AfDB’S CONTRIBUTION TO DEVELOPMENT IN AFRICAMicrofinance and social sector
Private-sector and trade
Regional integration
Transport
Agriculture and food security
Energy
Water and sanitation
Education
Health
LEVEL 4: HOW EFFICIENT AfDB IS AS AN ORGANISATION
Human resources
Business processes and practices
Information technology
Decentralisation
Transparency
LEVEL 1: DEVELOPMENT IN AFRICAEconomic growth and poverty reduction
Private-sector development and investment climate
Regional integration and trade
Infrastructure
Agriculture and food security
Gender and human development
Governance and transparency
Fragile and conflict-affected countries
Environment and clean energy
to invest more in urban facilities to keep up with population growth.
Roads — Roads have a direct impact on rural incomes, providing access to markets and allowing farmers to make the transition from subsistence to commercial production. Several countries are making good progress. Ethiopia, for example, has reduced the average distance to an all-weather road from 21!km in 1997 to 12.4 in 2012, and access to an all-weather road is said to have decreased poverty by 6.9% and increased food consumption by nearly 17%.
Energy — Increasing access to affordable and reliable energy can be a key driver of future growth for Africa. Nearly
600!million!people in Africa lack electricity connections, and the electrification rate in rural areas is just 10%. Around 85% of rural Africans continue to burn biomass for fuel, which is damaging to health – especially for women – and to the environment. Yet Africa has vast clean energy reserves in solar, wind, geothermal and, most of all, hydropower. Untapped hydropower potential in the Congo, Ethiopia and Cameroon has the technical potential to meet Africa’s entire energy needs. For many rural communities, small-scale, off-grid power solutions could be both cost-effective and environmentally friendly. Thus, with the right investments, Africa could be a global leader on renewable energy.
Food — Productivity in food production needs to improve further to reduce Africa’s vulnerability to rising global food prices. Nearly four-fifths of Africa’s arable land remains uncultivated, and agricultural labour is plentiful. For this potential to be developed, there is a need for major investment in rural infrastructure, including irrigation, along with improved land and water management to combat the effects of a changing climate.
4
Executive summary
Executive summary
Almost 70% of African countries have improved their overall quality of governance in recent years
Education and health — Africa has made enormous progress towards the goal of universal primary education, with the primary school completion rate rising from 53% in 2000 to 73% in 2012. The number of African children in secondary school has doubled, and the gender gap in education has narrowed considerably. To reap the demographic dividend Africa must do better at preparing its young people for the labour market. In the area of health, both maternal and child mortality rates have been falling, although less rapidly than on other continents.
Economic governance — Africa’s economic growth could not have happened without major improvements in economic governance. More than two-thirds of African countries have registered overall improvement in the quality of governance in recent years, with increased capacity to deliver economic opportunity and basic services. There have been improvements in the business environment and public sector management, although progress on public safety and the rule of law has not kept pace. The exploitation of oil and minerals has become a major source of economic growth for a growing number of African countries, but these assets need to be effectively managed and used in an accountable and transparent manner. It is therefore encouraging to see that six African countries have achieved the Extractive Industries Transparency Initiative standards, while another eleven are candidates.
Fragile states — Finally, if Africa as a whole is to realise its potential, it will be necessary to address the issues of fragility. More than one-third of African countries – 19 in total – are fragile and lag behind on almost every development indicator. Conflict and fragility are major drivers of poverty, suppressing trade and investment and disrupting public services. Girls and women suffer disproportionately from their effects, both as direct victims and through reduced economic opportunities. There is a clear connection between conflict and fragility and the need for improved environmental management. Competition over land and water can be both a driver and a consequence of conflict, while managing natural resources fairly is critical to overcoming fragility in resource-rich areas.
AfDB’s contribution to Africa’s transformation The African Development Bank has a strong record of supporting Africa’s transformation. Through our portfolio of lending operations and our many other activities, we are promoting growth that is both inclusive and sustainable in nature. The results reported in this ADER are based on the priorities set out in our Medium Term Strategy (2008–2012): building critical infrastructure, supporting regional integration, strengthening institutions and fostering private sector development. Our new Ten Year Strategy (2013–2022) builds on these themes, while sharpening our focus on inclusion and sustainability.
Promoting inclusive and sustainable growth is a multi-dimensional challenge. The Bank has a strong track record of choosing investments that boost the prospects for growth.! In recent years, we have broadened our approach to ensure that we promote
growth that is inclusive across social groups and geographical areas. Our challenge now is to help African countries achieve development pathways that are sustainable in economic, social and environmental terms. As this ADER shows, we have already begun to make progress in this direction. In the coming years, we will intensify our efforts to support social inclusion and a transition towards green growth. Given its operational track record, the Bank has a clear comparative advantage in developing investments in areas such as clean energy, sustainable transport, smart agriculture and integrated land and water management.
Business climate — We have been working with our client countries to improve their business climate. Our budget support operations have provided platforms for dialogue on policy choices and reform initiatives. In Rwanda, we supported reforms that have taken the country from 139th in the world for ease of doing business in 2006 to 45th place in 2012. In Mozambique, we have been developing “one-stop shops” to deliver public services to businesses and citizens. We are strengthening Africa’s financial systems and capital markets, and we have provided nearly half a million microcredits over the past three years, benefitting almost 17!million people through our microfinance and social activities.
Regional integration — Our Regional Integration Strategy Papers have tailored our support for regional integration to the needs of each region. We are helping build capacity in the regional economic communities, which play a key role in regional initiatives. We are also helping to harmonise regulations and reduce barriers to the free movement of goods, services, capital and people. We have constructed 550!km of cross-border roads and have invested in “transport corridors”’ that link centres of economic activity to ports and local populations to markets and services.
Infrastructure — Major infrastructure projects continue to be the backbone of our portfolio. Through 60!projects across 35!countries, over the past three years we have provided almost 16!million!people with improved access to clean water and sanitation. We have built or rehabilitated 14!500!km of main roads and 5760!km of feeder roads and are supporting the development of environmentally sustainable urban mass transit systems in Kenya and Nigeria. Our energy portfolio has expanded generation capacity by 1100!MW and connected an additional 560!000!households to the electricity grid. We also help mobilise private finance for
Annual D
evelo
pm
ent Effe
ctiveness R
eview 2
013
5
Our energy portfolio has expanded generation capacity by!1100!MW and connected an additional
560!000!households to the electricity grid
In Rwanda, we supported reforms that have taken the!country from 139th in the world for ease of doing
business in 2006 to 45th place in 2012
infrastructure development: a new hydroelectric plant on the border between Congo and Rwanda will be Africa’s first regional public-private partnership in the power sector. We have also financed the development of regional and national broadband communication infrastructure, particularly through investments in submarine cables.
Agriculture — Our projects on agricultural productivity and food security have included improved land and water management on nearly 1.5!million!hectares of land, to the benefit of about 32!million!people. In climate-change-affected parts of the Gambia, our investments have led to a sixfold increase in rice production over four years, and in Cape Verde we have helped improve water retention in a vulnerable ecosystem. Through our Africa Food Crisis Response Fund, we have provided $215!million in emergency programmes to help African countries deal with the impact of high food prices, responded to the famine in the Horn of Africa and mobilised the international community to support initiatives to end famine in the region.
Education — We focus on higher education and vocational training. In the last three years, we have rehabilitated nearly 50!000!classrooms and provided 13!million!textbooks and teaching materials, enabling 1.1!million!new enrolments. We support the African Virtual University, which provides online access to quality tertiary education across the continent. We have been instrumental in a number of new initiatives to tackle youth unemployment, including an innovative project in Tunisia that matches youth entrepreneurs with training opportunities and project finance. Gender equality is increasingly mainstreamed across our portfolio. In Ghana, we supported a gender-responsive budgeting initiative that reduced gender disparities in the budget from 25% in 2008 to just 5% by the end of 2010.
Governance — In the governance arena, we focus on our areas of comparative advantage: revenue systems, public finances and the equitable delivery of public services. For example, in Benin we helped develop a new legislative framework for public financial management and results-based budgeting, in Liberia we strengthened public audit functions, and in DRC we supported a reform of tax administration. We are strong supporters of the Extractive Industries Transparency Initiative (EITI) and other measures that promote the transparent management of natural resource revenues.
Fragile states — The Bank has a strong focus on fragile states, helping them consolidate peace and stabilise their economies. We have focused in particular on infrastructure and on governance. The over 850!km of feeder roads we built in fragile states are helping to link rural areas to growth centres and opening up national and regional markets and trade routes. We have helped restore agriculture, making populations less vulnerable to the effects of climate change. We have undertaken a range of research and analysis on the impact of natural resource revenue flows on conflict and fragility.
Energy — We have a range of investments in energy, including hydro and solar power. We are helping build “power highways” that enable Ethiopia to share its enormous hydropower capacity with Kenya and Djibouti. Our Sustainable Energy Fund for Africa, a joint initiative with the Danish Government, is encouraging private investment in small and medium-scale renewable energy, such as an off-grid hybrid solar-hydro installation in Madagascar and a municipal waste-to-energy project in Ghana. We are working with the regional economic communities and other inter-governmental mechanisms to build their capacity to manage shared water resources, such as the Nile Basin, Lake Victoria and Lake Chad.
How well the Bank manages its operationsAt the end of 2012, the Bank’s portfolio consisted of 732!operations valued at $34!billion. In recent years, to maximise impact, we have reduced the number of projects and increased their average size. By decentralising Bank staff and functions to the field, we have improved the supervision of our operations: two-thirds of our projects are now supervised twice a year. This has enabled us to reduce the number of underperforming projects, either by fixing problems quickly or shutting down those that fail to deliver.
We have introduced a range of new management tools to ensure that our projects are technically sound. Robust scrutiny resulted in satisfactory ratings for 96% of new project designs and 100% of our country strategy papers. Efficiency of project delivery slipped slightly, with an average of 13!months’ delay from project approval to first disbursement, but this still represents considerable progress from our 2007 baseline of 21 months. We continue to publish environmental and social impact assessments on our website, giving beneficiaries and stakeholders the chance to voice any concerns.
We continue to track our aid effectiveness against a number of indicators from the Paris Declaration (pending the adoption of new indicators following the Busan High-Level Forum). The share of our aid recorded on national budgets has increased slightly, but progress remains linked to the pace of reforms to national budget systems. Our predictability of disbursement has increased as we have simplified conditions and streamlined procedures, and we have eliminated nearly two-thirds of our parallel project implementation units. The use of country public financial management systems has exceeded expectations, but the use of
6
Executive summary
In the Gambia, our investments have led to a sixfold increase in rice production over four years
Transferring staff and functions into the field has improved the supervision of our operations, reducing the share of problem projects from 5% to 2%
country procurement systems still lags behind. Decentralisation is enabling us to play an increasingly active role in policy dialogue and aid coordination mechanisms.
Generating and sharing knowledge is a key part of the development process. We use project completion reports to capture and disseminate lessons from our operations. In 2012, we launched a new evaluation website, providing ready access to lessons, ratings and recommendations organised according to different sectors and themes. We continue to produce a broad range of country-specific analytical work, and our flagship publications – the Africa Economic Outlook and the African Development Report – are key reference works on development trends in Africa.
We are making steady progress in incorporating the cross-cutting themes of gender equality and sustainability into our portfolio. In 2012, 78% of new projects used gender-disaggregated indicators to track results for women and men.
How well the Bank manages its own organisationIf we wish to remain Africa’s premier development finance institution, we need to be able to attract and retain staff of the highest calibre. We have increased our proportion of professional staff, with a more diverse gender and age profile and a better match of skills to operational needs. Improvements in our recruitment processes have resulted in a lower vacancy rate, and our efforts to provide career development opportunities and a positive working environment are bearing fruit, with lower premature attrition among staff.
In line with the tight fiscal context, real budgets have been held at 2010 levels, helping deliver better value for money. We have nonetheless been able to increase spending on priority areas like decentralisation and information technology through efficiencies elsewhere. A series of measures to streamline our business processes and practices have enabled us to achieve better value for money, with lower administrative overheads. We have been working to improve our procurement processes, reducing their average length from 60!weeks in 2010 to just 38 in 2012.
The Bank is increasingly decentralised, with 34!field offices (including 11 in fragile states and two regional resource centres). We now have 35% of our operations professional staff located in the field, and 42% of project management is done by field offices. This stronger field presence has helped strengthen our engagement with country-led processes and the regional economic communities. Our information technology system is the backbone of a decentralised Bank. In 2012, we continued to update the system with the latest technology, to support secure financial transactions and increasingly complex operational needs.
As strong supporters of the drive for greater transparency in aid delivery, we have launched a number of pilots for disclosing
our spending and activities according to the standards of the International Aid Transparency Initiative. A 2012 review by Publish What You Fund ranked AfDB eighth out of 58 development agencies on transparency. In 2011–12 we overhauled our disclosure policy in line with emerging international best practice. We have also strengthened our communication capacity and developed a new framework for engaging with civil society organisations. To support transparency and accountability to our member countries and other stakeholders, we strive to produce materials – such as the ADER – in an accessible style.
Conclusions and way forwardAs Africa enters a dynamic period in its development history, it faces some critical choices. Embracing a more sustainable approach to development can generate benefits in terms of environmental security, human well-being and increased competitiveness. The choices made today about infrastructure, energy and food production will shape Africa’s opportunities and options far into the future. Africa’s natural resources also need to be managed responsibly if they are to be a source of growth for future generations. In recognition of this, a growing number of African countries – among them Ethiopia, Mozambique, Sierra Leone, Rwanda and South Africa – are incorporating sustainable development into their national development planning. This means creating the foundations of sustainable growth by using their natural resources more efficiently, reducing waste and pollution, and increasing the resilience of households, communities and firms in the face of a changing environment and other shocks.
Our new Ten Year Strategy (2013–2022) commits us to the pursuit of Africa’s transformation through inclusive and sustainable growth. This is an important commitment, with implications for our strategies, our operations and our own organisation. As our ADER series illustrates, we have already made important progress. Our knowledge development, partnerships and policy dialogue are helping promote structural transformation across Africa, while our operations increasingly incorporate inclusive and sustainable development measures.
More needs to be done to bring about transformational change. In the coming period, we will increase our investments in sustainable infrastructure development, including regional transport corridors, rural road connections and mass transit systems. Our investment projects will be adapted to minimise waste and pollution. We will invest in Africa’s considerable potential for affordable and
Annual D
evelo
pm
ent Effe
ctiveness R
eview 2
013
7
Real budgets have been held at 2010 levels, helping deliver better value for money
The share of operations rated satisfactory has increased considerably, to 96% from 77% in 2009
8
Executive summary
clean energy, including hydro, wind and solar power, while building distribution networks that share the benefits across national boundaries. Rural electrification and development of environmentally friendly, off-grid solutions for remote areas will continue to be areas of focus for our investments.
We will support the sustainable management of renewable resources, on which so many Africans depend for their livelihoods. Continuing emphasis will be on helping our clients to develop policies and capacities for sustainable land, forest and water management and supporting cooperative arrangements for cross-border resource management. We will help introduce sustainable agricultural techniques and practices to boost food security and will support countries in managing natural resource revenues responsibly, channelling them into investments in sustainable development that will benefit future generations. We will increasingly focus on promoting resilience at the national,
community and household levels in the face of a changing climate, and on strengthening national capacity to respond to extreme weather events.
To achieve these ambitious goals, we must become a more nimble and effective organisation. Our far-reaching organisational reforms of recent years have given us a strong platform to move forward. In the coming years, we will focus on mobilising the additional financial resources needed to achieve an inclusive and sustainable development pathway for Africa. We will build partnerships with new development actors, and we will use our own resources more efficiently by leveraging private investments. We will continue striving to be a more responsive and supportive development partner as we bring our operations closer to our clients through decentralisation, while making sure we are the employer of choice for high-calibre staff who are committed to Africa’s development
Annual D
evelo
pm
ent Effe
ctiveness R
eview 2
013
9
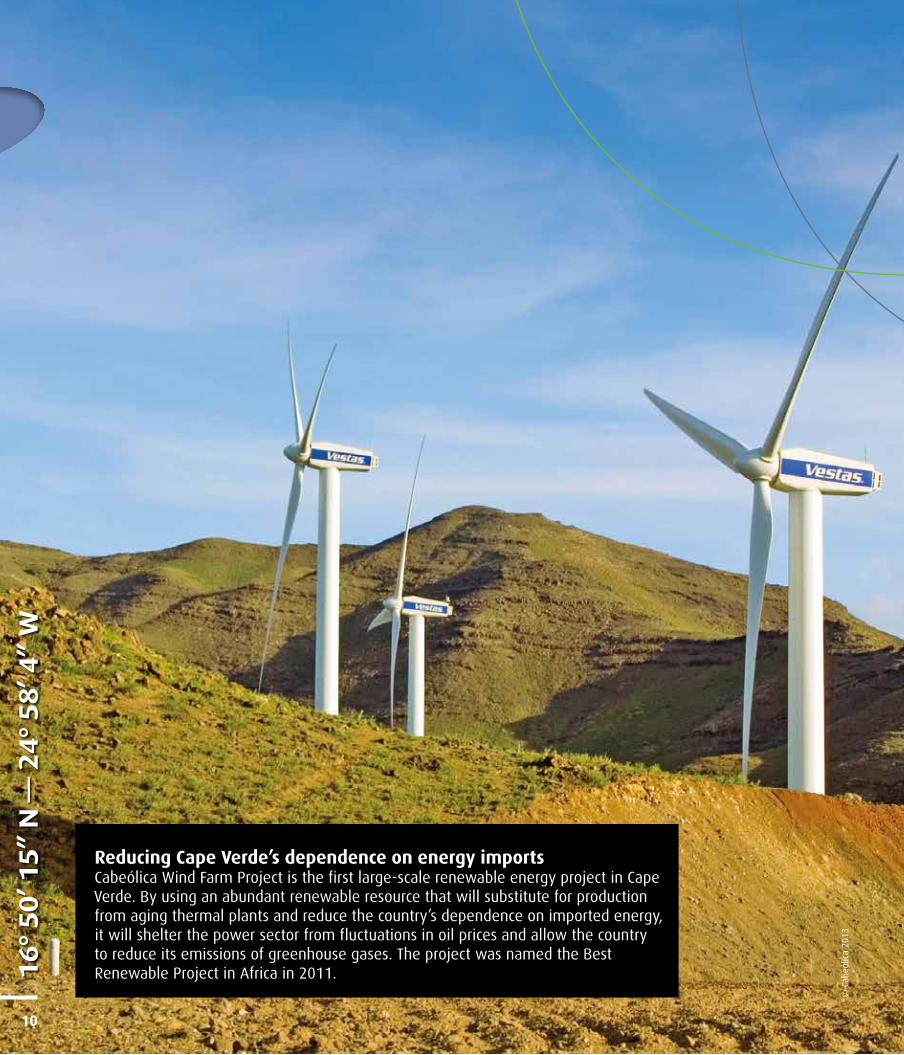
Reducing Cape Verde’s dependence on energy importsCabeólica Wind Farm Project is the first large-scale renewable energy project in Cape Verde. By using an abundant renewable resource that will substitute for production from aging thermal plants and reduce the country’s dependence on imported energy, it will shelter the power sector from fluctuations in oil prices and allow the country to reduce its emissions of greenhouse gases. The project was named the Best Renewable Project in Africa in 2011.
© C
abeó
lica
2013
16°
50’ 1
5”
N —
24°
58’ 4
” W
10
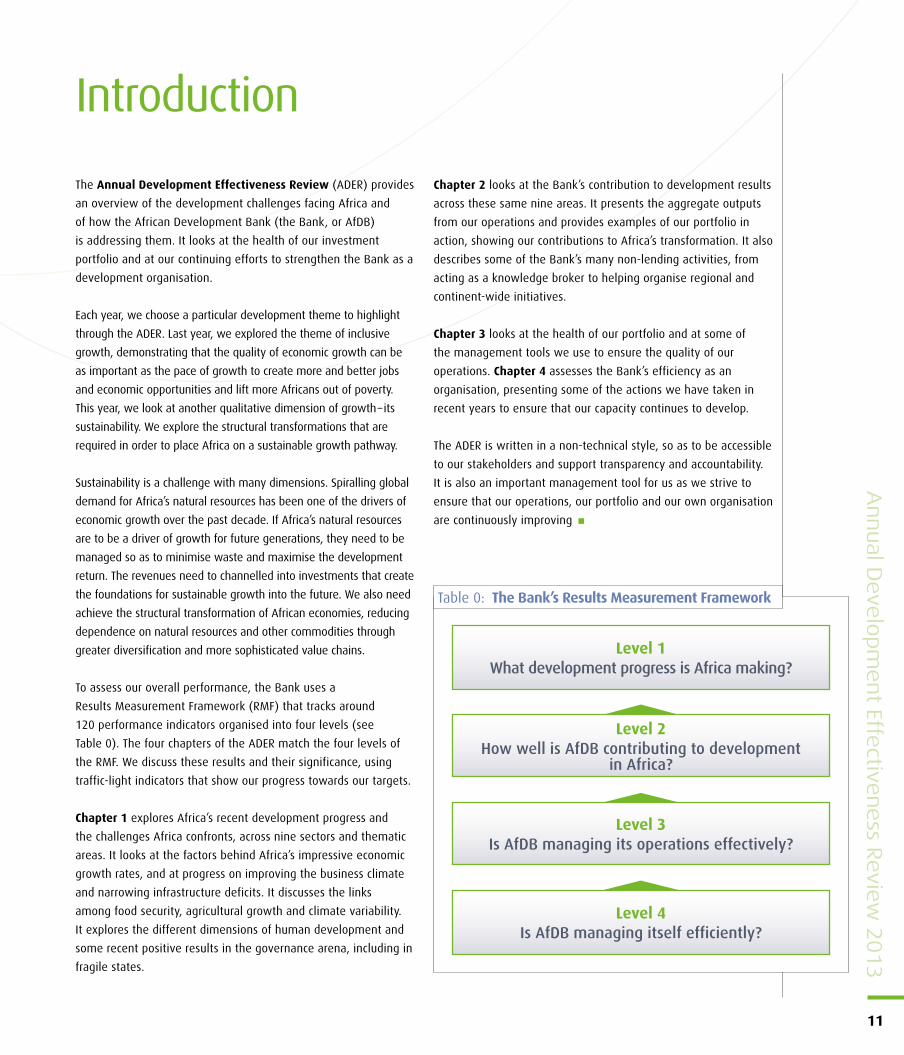
The Annual Development Effectiveness Review (ADER) provides
an overview of the development challenges facing Africa and
of how the African Development Bank (the Bank, or AfDB)
is addressing them. It looks at the health of our investment
portfolio and at our continuing efforts to strengthen the Bank as a
development organisation.
Each year, we choose a particular development theme to highlight
through the ADER. Last year, we explored the theme of inclusive
growth, demonstrating that the quality of economic growth can be
as important as the pace of growth to create more and better jobs
and economic opportunities and lift more Africans out of poverty.
This year, we look at another qualitative dimension of growth – its
sustainability. We explore the structural transformations that are
required in order to place Africa on a sustainable growth pathway.!
Sustainability is a challenge with many dimensions. Spiralling global
demand for Africa’s natural resources has been one of the drivers of
economic growth over the past decade. If Africa’s natural resources
are to be a driver of growth for future generations, they need to be
managed so as to minimise waste and maximise the development
return. The revenues need to channelled into investments that create
the foundations for sustainable growth into the future. We also need
achieve the structural transformation of African economies, reducing
dependence on natural resources and other commodities through
greater diversification and more sophisticated value chains.
To assess our overall performance, the Bank uses a
Results Measurement Framework (RMF) that tracks around
120!performance indicators organised into four levels (see
Table!0). The four chapters of the ADER match the four levels of
the RMF. We discuss these results and their significance, using
traffic-light indicators that show our progress towards our targets.
Chapter 1 explores Africa’s recent development progress and
the challenges Africa confronts, across nine sectors and thematic
areas. It looks at the factors behind Africa’s impressive economic
growth rates, and at progress on improving the business climate
and narrowing infrastructure deficits. It discusses the links
among food security, agricultural growth and climate variability.
It explores the different dimensions of human development and
some recent positive results in the governance arena, including in
fragile states.
Chapter 2 looks at the Bank’s contribution to development results
across these same nine areas. It presents the aggregate outputs
from our operations and provides examples of our portfolio in
action, showing our contributions to Africa’s transformation. It also
describes some of the Bank’s many non-lending activities, from
acting as a knowledge broker to helping organise regional and
continent-wide initiatives.
Chapter 3 looks at the health of our portfolio and at some of
the management tools we use to ensure the quality of our
operations. Chapter 4 assesses the Bank’s efficiency as an
organisation, presenting some of the actions we have taken in
recent years to ensure that our capacity continues to develop.
The ADER is written in a non-technical style, so as to be accessible
to our stakeholders and support transparency and accountability.
It is also an important management tool for us as we strive to
ensure that our operations, our portfolio and our own organisation
are continuously improving
Introduction
Annual D
evelo
pm
ent Effe
ctiveness R
eview 2
013
11
Level 1What development progress is Africa making?
Level 2How well is AfDB contributing to development
in Africa?
Level 3Is AfDB managing its operations effectively?
Level 4Is AfDB managing itself efficiently?
Table 0: The Bank’s Results Measurement Framework
TUNISIA4.84%
SOUTHAFRICA
3.87%
EGYPT5.31%
ETHIOPIA6.50%
UGANDA6.65%
NIGERIA6.68%
LIBERIA6.36%
NIGER6.66%
MOZAMBIQUE7.93%
CONGO,REP.
8.10%
SIERRALEONE
7.07% CÔTED’IVOIRE7.44%
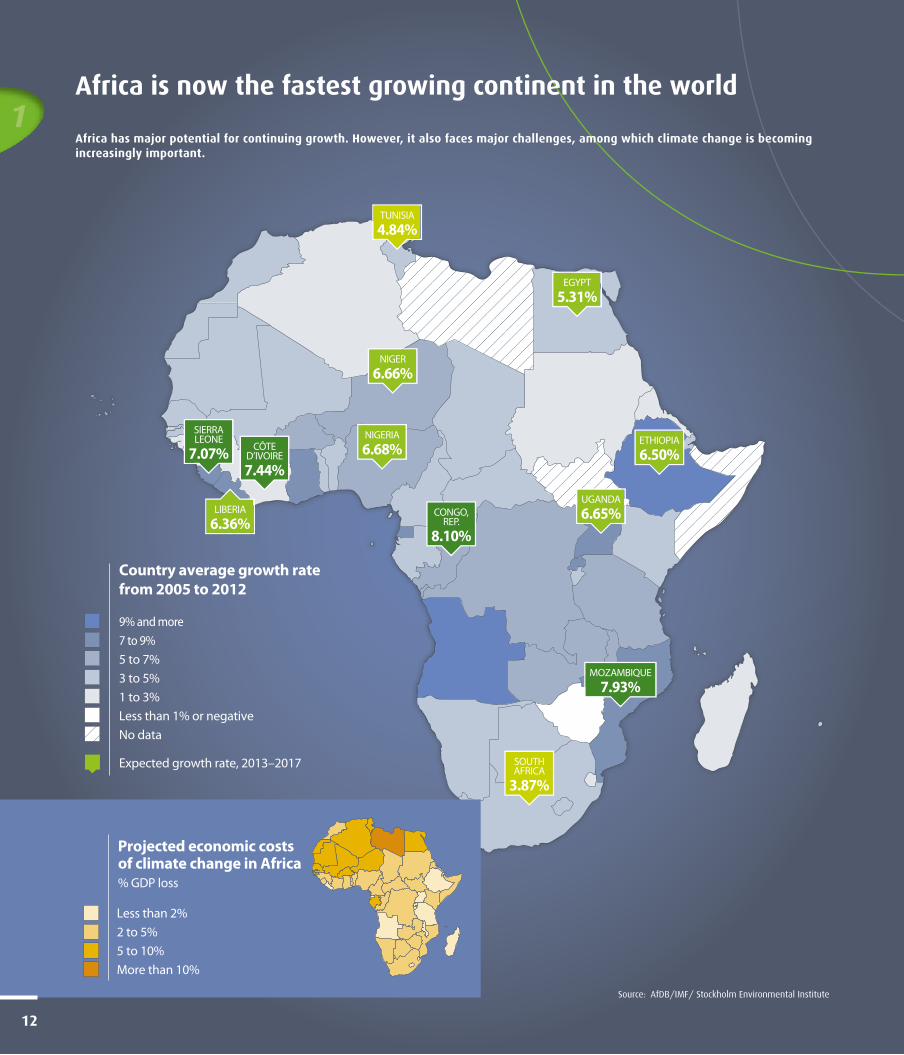
Country average growth rate from 2005 to 2012
9% and more7 to 9%5 to 7%3 to 5%1 to 3%Less than 1% or negativeNo data
Expected growth rate, 2013–2017
Less than 2%2 to 5%5 to 10%More than 10%
Projected economic costsof climate change in Africa% GDP loss
12
1Africa is now the fastest growing continent in the world
Africa has major potential for continuing growth. However, it also faces major challenges, among which climate change is becoming increasingly important.
Source: AfDB/IMF/ Stockholm!Environmental Institute
Annual D
evelo
pm
ent Effe
ctiveness R
eview 2
013
13
Economic growth and poverty reductionAfrican countries have continued to grow at above the global average: of the 20!fastest-growing countries in the world, 13 are African. Of Africa’s 54 countries, 26 have now reached middle-income status, with annual per capita incomes above $1000. In 2012 the growth rate of low-income countries in Africa exceeded 4.5%, and it is predicted to stay above 5.5% over the coming years. Whilst population has continued to increase to over one billion people, Africa’s collective GDP per capita1 has reached $953 (see Figure!1.1).
Strong growth rates have made important inroads into income poverty. In 2012 the share of the population living on less than $1.25 a day2 decreased to 39%, from 51% in 2005. Of the ten countries that improved the fastest over the past decade on the Human Development Index, nine were African. A growing number of Africans have achieved middle-class status, with 350!million earning between $2 and $20 per day. This represents a vital structural change in Africa’s economy: internal demand is becoming a source of growth in its own right.
While the overall outlook for Africa appears bright, challenges remain. Growth rates vary across the continent, and not all Africans
are benefiting from the growth. Six of the ten most unequal countries in the world are in Africa, and there is not yet any evidence of progress in reducing income inequality3. Poverty rates remain unacceptably high, and over 60% of Africans – many located in isolated and rural communities and in fragile states – earn less than $2 a day. Increasingly, poverty also has an urban face. The number of slum dwellers in African cities is growing at an alarming pace, bringing with it an array of new social and environmental challenges.
Africa’s longer-term growth trajectory is closely tied to the sustainable management of its natural resources. Africa’s environment is under pressure from rapidly growing populations, high global demand for commodities and climate change. Africa’s trade relies heavily on primary products, with 80% of exports
Level 1: Development in Africa
1 A yellow bullet indicates that Africa’s progress is positive but less than peers.2 A green bullet indicates that Africa’s progress is strong and better than peers.3 A red bullet indicates a regression against the baseline.
Africa is growing fast. During the 21st century, even as the global economy has gone through turbulent times, African economies have continued to achieve high levels of growth. Of the 20 fastest-growing countries in the world in 2012, 13 were in Africa. In 2013, it is expected that 9!African countries will achieve growth rates of over 7% and a further 19 will grow at between 5% and 7%.
This growth is indispensable, if more Africans are to be lifted out of poverty. But it is not sufficient. We also need to pay close attention to the quality of growth. It needs to be inclusive, generating opportunities for all Africans to share in, and it needs to be sustainable, creating economic structures that use resources effectively, and that are resilient for a continent increasingly affected by climate change. Last year, we chose “inclusive growth” as the theme of our Annual Development Effectiveness Review. This year, we look at Africa’s transformation towards a sustainable growth path.
This chapter takes stock of the current state of development in Africa. It is organised according to the nine headings in our Results Measurement Framework, each with associated indicators of progress. Each indicator is allocated a “traffic light” score showing Africa’s progress since 2005 relative to that of other developing regions. A green rating indicates strong performance equal to or better than that of other regions, and yellow indicates progress, but less than in other regions. Encouragingly, there are only two red ratings showing poorer progress than other regions.
“Africa is rising! Africa is transitioning! Africa continues to be committed to those processes that will lead to rationalisation
of its own natural resources, to accountability, transparency, to!mutuality and responsibility.”
Ellen Johnson Sirleaf, President of the Republic of Liberia
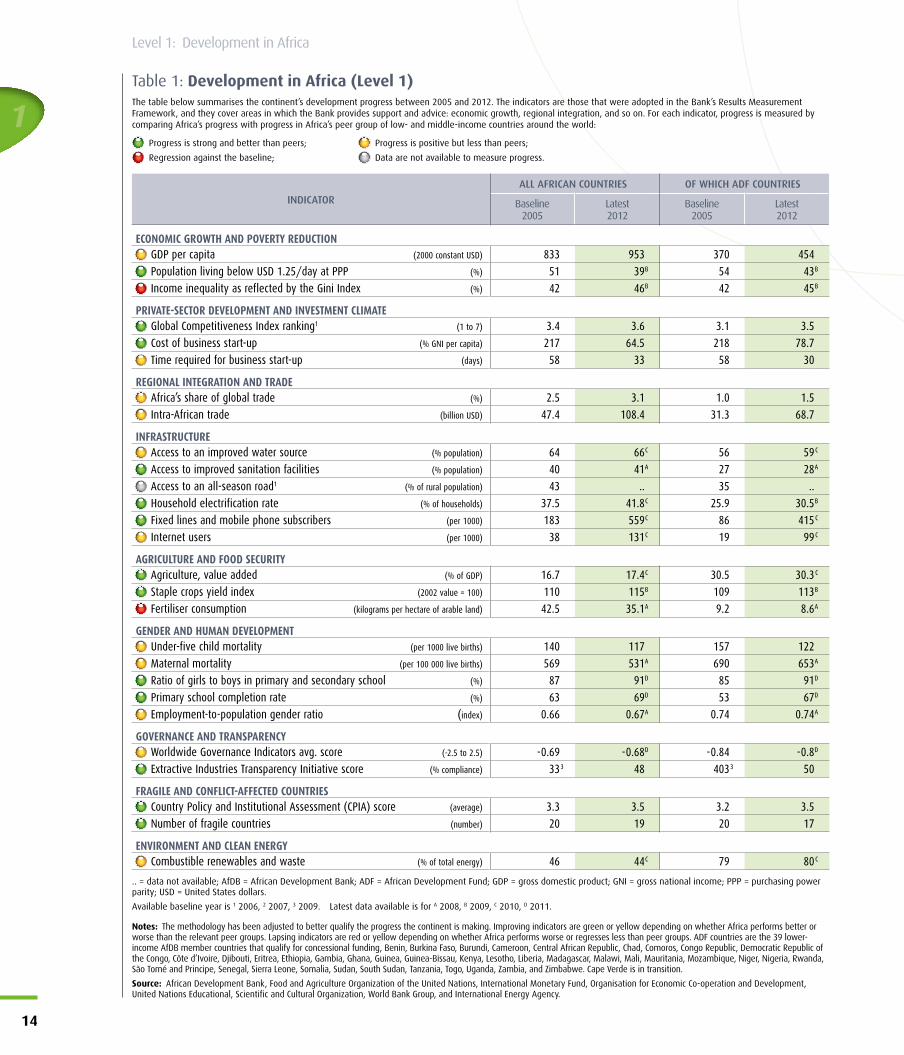
Table 1: Development in Africa (Level 1)The table below summarises the continent’s development progress between 2005 and 2012. The indicators are those that were adopted in the Bank’s Results Measurement Framework, and they cover areas in which the Bank provides support and advice: economic growth, regional integration, and so on. For each indicator, progress is measured by comparing Africa’s progress with progress in Africa’s peer group of low- and middle-income countries around the world:
Progress is strong and better than peers; Progress is positive but less than peers;
Regression against the baseline; Data are not available to measure progress.
INDICATORALL AFRICAN COUNTRIES OF WHICH ADF COUNTRIES
Baseline 2005
Latest 2012
Baseline 2005
Latest 2012
ECONOMIC GROWTH AND POVERTY REDUCTIONGDP per capita (2000 constant USD) 833 953 370 454Population living below USD!1.25/day at PPP (%) 51 39B 54 43B
Income inequality as reflected by the Gini Index (%) 42 46B 42 45B
PRIVATE-SECTOR DEVELOPMENT AND INVESTMENT CLIMATEGlobal Competitiveness Index ranking1 (1 to 7) 3.4 3.6 3.1 3.5Cost of business start-up (% GNI per capita) 217 64.5 218 78.7Time required for business start-up (days) 58 33 58 30
REGIONAL INTEGRATION AND TRADEAfrica’s share of global trade (%) 2.5 3.1 1.0 1.5Intra-African trade (billion USD) 47.4 108.4 31.3 68.7
INFRASTRUCTUREAccess to an improved water source (% population) 64 66C 56 59C
Access to improved sanitation facilities (% population) 40 41A 27 28A
Access to an all-season road1 (% of rural population) 43 .. 35 ..Household electrification rate (% of households) 37.5 41.8C 25.9 30.5B
Fixed lines and mobile phone subscribers (per 1000) 183 559C 86 415C
Internet users (per 1000) 38 131C 19 99C
AGRICULTURE AND FOOD SECURITYAgriculture, value added (% of GDP) 16.7 17.4C 30.5 30.3C
Staple crops yield index (2002 value = 100) 110 115B 109 113B
Fertiliser consumption (kilograms per hectare of arable land) 42.5 35.1A 9.2 8.6A
GENDER AND HUMAN DEVELOPMENTUnder-five child mortality (per 1000 live births) 140 117 157 122Maternal mortality (per 100!000 live births) 569 531A 690 653A
Ratio of girls to boys in primary and secondary school (%) 87 91D 85 91D
Primary school completion rate (%) 63 69D 53 67D
Employment-to-population gender ratio (index) 0.66 0.67A 0.74 0.74A
GOVERNANCE AND TRANSPARENCYWorldwide Governance Indicators avg. score (-2.5 to 2.5) -0.69 -0.68D -0.84 -0.8D
Extractive Industries Transparency Initiative score (% compliance) 333 48 4033 50
FRAGILE AND CONFLICT-AFFECTED COUNTRIESCountry Policy and Institutional Assessment (CPIA) score (average) 3.3 3.5 3.2 3.5Number of fragile countries (number) 20 19 20 17
ENVIRONMENT AND CLEAN ENERGYCombustible renewables and waste (% of total energy) 46 44C 79 80C
.. = data not available; AfDB = African Development Bank; ADF = African Development Fund; GDP = gross domestic product; GNI = gross national income; PPP = purchasing power parity; USD = United States dollars.
Available baseline year is 1 2006, 2 2007, 3 2009. Latest data available is for A 2008, B 2009, C 2010, D 2011.
Notes: The methodology has been adjusted to better qualify the progress the continent is making. Improving indicators are green or yellow depending on whether Africa performs better or worse than the relevant peer groups. Lapsing indicators are red or yellow depending on whether Africa performs worse or regresses less than peer groups. ADF countries are the 39!lower-income AfDB member countries that qualify for concessional funding, Benin, Burkina Faso, Burundi, Cameroon, Central African Republic, Chad, Comoros, Congo Republic, Democratic Republic of the Congo, Côte d’Ivoire, Djibouti, Eritrea, Ethiopia, Gambia, Ghana, Guinea, Guinea-Bissau, Kenya, Lesotho, Liberia, Madagascar, Malawi, Mali, Mauritania, Mozambique, Niger, Nigeria, Rwanda, São Tomé and Principe, Senegal, Sierra Leone, Somalia, Sudan, South Sudan, Tanzania, Togo, Uganda, Zambia, and Zimbabwe. Cape Verde is in transition.
Source: African Development Bank, Food and Agriculture Organization of the United Nations, International Monetary Fund, Organisation for Economic Co-operation and Development, United Nations Educational, Scientific and Cultural Organization, World Bank Group, and International Energy Agency.
1
14
Level 1: Development in Africa
coming from the renewable and non-renewable resources sectors. With demand from China and other emerging economies keeping commodity prices high, this situation is likely to continue: global demand for natural resources is projected to triple by 2050. Careful management will enable Africa’s natural resource wealth to be a driver of growth not just for this generation, but for those that follow.
For this reason, a number of African countries have begun to plan for more sustainable development paths. They are trying to manage their natural resources more efficiently, maximise development benefits, minimise environmental damage and ensure that their natural wealth is preserved for future generations. It is a challenging agenda, requiring careful planning, targeted investments and the right governance structures.
Ethiopia, Rwanda and South Africa are among the early movers in building green growth into their national development planning. For example, Rwanda’s Economic Development and Poverty Reduction Strategy 2008–2012 identified the sectors dealing with environmental and natural resources as key to national development, while prioritising investments in land, forest and water resources.
Private-sector development and investment climateThe private sector is Africa’s primary engine for growth and poverty reduction. It generates 90% of Africa’s jobs, two-thirds of its investment and 70% of its output. Creating and promoting a sound climate for business and investments is crucial to enabling Africa’s small and medium-sized enterprises (SMEs) to grow and flourish.
Over the past few years, Africa has made considerable progress in promoting a more business-friendly environment. The costs of business start-up have fallen by more than two-thirds over the past seven years, and the time required for business start-up has been reduced by nearly half. Countries like Botswana, Ghana, Mauritius, Rwanda, and South Africa have been among the leading improvers internationally. Their successes have been rewarded by increased levels of trade and investment. Across the continent as a whole foreign direct investment has increased fivefold since 2000 (see Figure!1.2).
Africa is becoming increasingly attractive to investors. By 2035, its labour force will be larger than that of China or India. Consumer spending in Africa grew to nearly $600 billion in 2010, and by 2020, Africa’s market is expected to be worth a trillion dollars. Business-friendly policies, increasing urbanisation, a growing and better-educated workforce, and growing consumer spending are creating opportunities for manufacturing and services industries to grow. Ethiopia’s shoe production and Morocco’s automotive parts industries, for example, have created thousands of jobs.
While it has become much easier to start new businesses in Africa, the continent has improved only slightly on the Global Competitiveness Index ranking. Red tape remains a significant
Annual D
evelo
pm
ent Effe
ctiveness R
eview 2
013
15
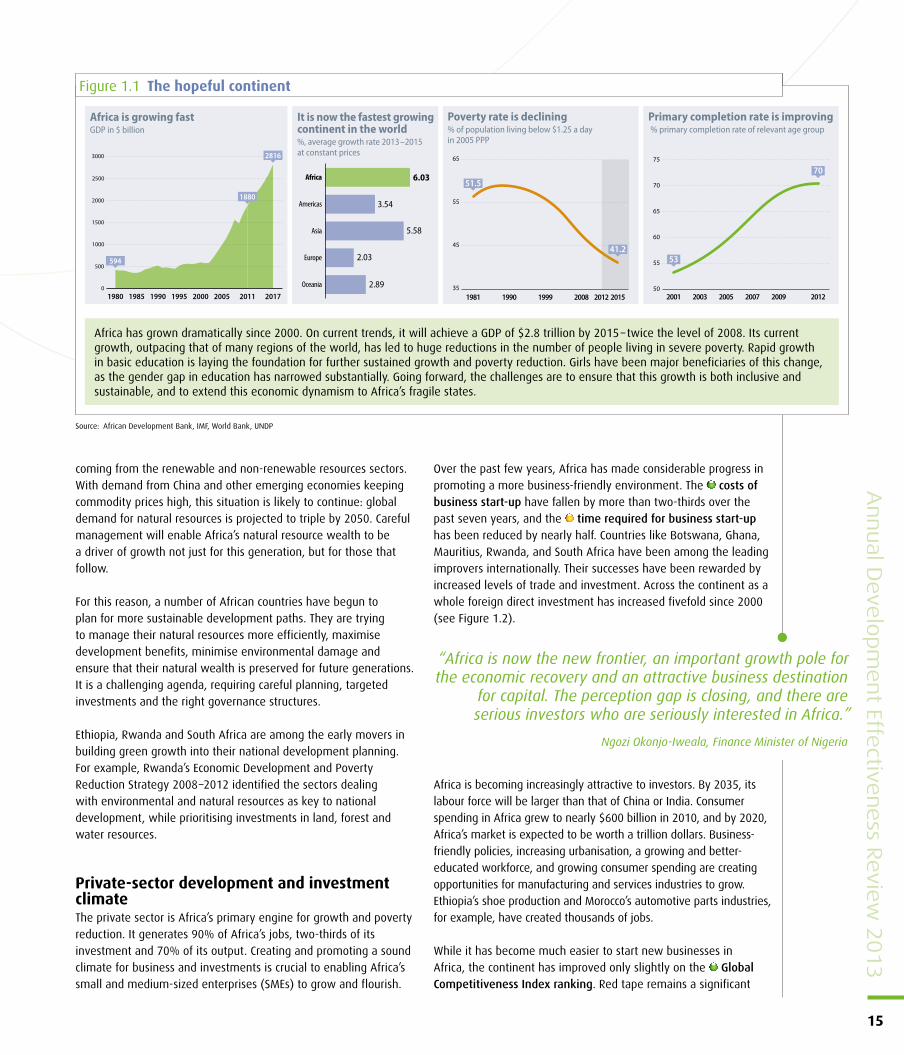
Figure 1.1 The hopeful continent
0
500
1000
1500
2000
2500
3000
20172011200520001995199019851980
1880
594
2816
Africa is growing fastGDP in $ billion
It is now the fastest growing continent in the world%, average growth rate 2013–2015 at constant prices
Oceania
Europe
Asia
Americas
Africa 6.03
3.54
5.58
2.03
2.89
Primary completion rate is improving % primary completion rate of relevant age group
Poverty rate is declining% of population living below $1.25 a day in 2005 PPP
35
45
55
65
201520122008199919901981
41.2
51.5
50
55
60
65
70
75
201220092007200520032001
70
53
Source: African Development Bank, IMF, World Bank, UNDP
Africa has grown dramatically since 2000. On current trends, it will achieve a GDP of $2.8 trillion by 2015 – twice the level of 2008. Its current growth, outpacing that of many regions of the world, has led to huge reductions in the number of people living in severe poverty. Rapid growth in basic education is laying the foundation for further sustained growth and poverty reduction. Girls have been major beneficiaries of this change, as the gender gap in education has narrowed substantially. Going forward, the challenges are to ensure that this growth is both inclusive and sustainable, and to extend this economic dynamism to Africa’s fragile states.
“Africa is now the new frontier, an important growth pole for the economic recovery and an attractive business destination
for capital. The perception gap is closing, and there are serious investors who are seriously interested in Africa.”
Ngozi Okonjo-Iweala, Finance Minister of Nigeria
1
16
Level 1: Development in Africa
concern to investors. Poor transport, energy and communications infrastructure all add costs to business activity, holding back competitiveness. Investments in these areas can offer significant returns, especially in low-income countries.
Africa’s capital markets are developing quickly. The number of stock exchanges increased from 8 in 2002 to 29 in 2012, with market capitalisation across the five leading exchanges tripling over that period. Many African countries have undertaken reforms to develop their national financial institutions and strengthen their financial markets. Nonetheless, because Africa’s financial sector remains relatively small and fragmented, SMEs (which make up the bulk of the private sector) rely more on internal funds than on bank loans or the financial markets. This holds back their potential to expand and diversify.
Regional integration and tradeThe division of Africa into 54 economic spaces, many of them small and landlocked, has been one of the constraints on the continent’s development. Companies serving small markets find it difficult to be internationally competitive. Dismantling the barriers to cross-border trade would help companies form regional value chains and achieve economies of scale in production, thereby creating more employment.
Regional integration is progressing slowly but steadily. Africa’s regional economic communities have launched some bold initiatives in recent years, beginning to rationalise Africa’s complex architecture of regional institutions. Specialist organisations have been formed to take forward the development of regional power pools and water basins, making energy and water more accessible to less endowed countries. Increasingly, integrated development planning is being led at the regional and continental levels.
Intra-African trade has increased from its low level, more than doubling over the past seven years. If informal cross-border trade – mainly food, handcrafts and simple manufacturing goods – were included, this figure would be higher. But with intra-African trade worth just $108!billion in 2012, it is clear that much faster progress is needed to remove trade barriers and create larger markets. Domestic demand for food and other products is growing rapidly. This provides great opportunities for African businesses if they can provide quality, low-cost goods to compete with foreign imports.
As Africa integrates its markets and reduces production costs, enhanced competitiveness should lead to increased access to global markets. Africa has maintained its share of global trade at 3.1%. This is up from 2.5% in 2005, but represents slower progress than other developing regions. A large majority of its exports – over 80% – are primary products, including oil, minerals and a limited range of primary commodities. While the resource-rich countries have benefited from a fivefold increase in trade to China and other emerging economies, the lack of economic integration means that the benefits of trade are narrowly concentrated.
One of the keys to regional integration is investing in better transport, energy and communications networks and soft infrastructure. Upgrading roads and power interconnections across Africa would foster trade, economic growth and integration, with the biggest gains accruing to the most isolated and resource-deprived regions. For example, it takes two to three weeks to transport copper from the Democratic Republic of Congo (DRC) to the port at Mombasa. In Europe, the same distance could be covered in 48!hours. Reducing travel times in Africa by even a single day would on average increase exports by 7%.
One of the key priorities for sustainable growth is to increase Africa’s capacity for joint action on regional public goods, particularly the management of shared resources such as river systems and forests. Joint action is also required to manage the
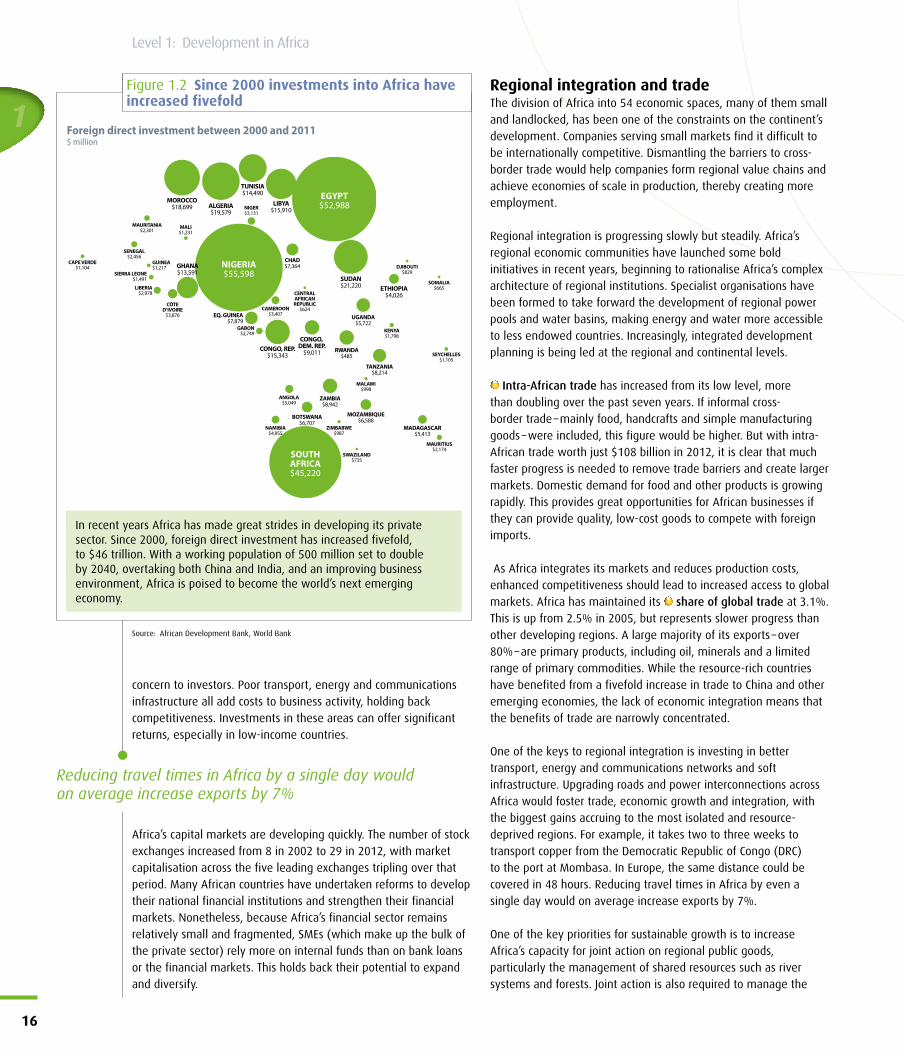
Figure 1.2 Since 2000 investments into Africa have increased fivefold
NIGERIA$55,598
EGYPT$52,988
SUDAN$21,220
TANZANIA$8,214
ETHIOPIA$4,026
MOZAMBIQUE$6,588
MADAGASCAR$5,413
UGANDA$5,722
ALGERIA$19,579
TUNISIA$14,490
MOROCCO$18,699
CONGO, REP.$15,343
GHANA$13,591
EQ. GUINEA$7,879
LIBYA$15,910
CONGO, DEM. REP.
$9,011
CHAD$7,364
BOTSWANA$6,707
ZAMBIA$8,942
RWANDA$485
SOUTHAFRICA$45,220
KENYA$1,798
CÔTED’IVOIRE
$3,876
MAURITIUS$2,174
MALAWI$998
ZIMBABWE$987
LIBERIA$2,978
SIERRA LEONE$1,491
SENEGAL$2,456
MAURITANIA$2,301 MALI
$1,231
CAPE VERDE$1,104
GUINEA$1,217
GABON$2,749
CAMEROON$3,407
NIGER$3,131
ANGOLA$5,049
NAMIBIA$4,955
SEYCHELLES$1,105
DJIBOUTI$829
SOMALIA$665
CENTRALAFRICANREPUBLIC
$624
SWAZILAND$735
Foreign direct investment between 2000 and 2011$ million
In recent years Africa has made great strides in developing its private sector. Since 2000, foreign direct investment has increased fivefold, to $46!trillion. With a working population of 500!million set to double by 2040, overtaking both China and India, and an improving business environment, Africa is poised to become the world’s next emerging economy.
Source: African Development Bank, World Bank
Reducing travel times in Africa by a single day would on!average increase exports by 7%
Annual D
evelo
pm
ent Effe
ctiveness R
eview 2
013
17
ever-increasing impact of climate change and to develop Africa’s huge renewable energy potential.
InfrastructureAfrica faces a massive infrastructure deficit. It invests only 4% of its collective GDP in infrastructure, compared with China’s 14%. Bridging the infrastructure gap could increase Africa’s growth rates by an estimated 2% per year. But Africa also has a unique opportunity to develop its infrastructure in an environmentally sustainable manner. Compared to more developed regions, Africa could leapfrog to new, environmentally sound technologies, drawing on the best innovations from around the world. Investing in sustainable and climate-proof infrastructure entails major upfront costs, but will prove cost-effective over the longer term.
Water and sanitationIncreasing access to clean water and sanitation has been among the most challenging of the Millennium Development Goals (MDGs) to implement in Africa. The share of the population in Africa’s poorest countries with access to an improved water source has increased from 56% in 2005 to 59% in 2012, compared to average access rates of 89% across the developing world. Sanitation lags even further behind. Only 28% of people have access to improved sanitation facilities, and the rate of investment is only just ahead of population growth. While access has been improving in rural settings, progress in urban areas has stagnated, with growing disparities between wealthier and poorer neighbourhoods.
Water is one of the most essential of all natural resources, for livelihoods, food security and economic growth. Africa urgently needs to invest in the sustainable development of its vast water resources, to protect against the impact of climate change in the coming years. This includes improving cooperation on the shared management of Africa’s 80 or more international water basins. There are a number of successful models to follow, such as the Senegal River Basin Organisation and the Nile Basin Initiative.
TransportIn Africa, the density of transport infrastructure trails behind that of other regions. This gap is one of the most direct constraints on Africa’s development. It leaves businesses isolated from their suppliers and markets, making it very difficult to compete with exports. At present, less than half of Africa’s rural population has
access to an all-season road4. Poor road access prevents farmers from making the shift from subsistence to commercial production, while limiting access to basic services for millions of people.
Investment rates in transport infrastructure have been increasing, thanks to major continental initiatives such as the Programme for Infrastructure Development in Africa (PIDA). Some countries are making good progress. Ethiopia, for example, has reduced the average distance to an all-weather road from 21 km in 1997 to
12.4 km in 2012, and access to an all-weather road is said to have decreased poverty by 6.9% and increased food consumption by nearly 17%.
With many national economies relying on the transport of bulky primary produce, increased attention is being given to developing rail networks and inland waterways. In Africa’s rapidly growing cities, mass rapid transport systems, including commuter bus and rail networks, are helping to relieve traffic congestion and improve the business climate. But the rate of investment still lags well behind the need, as does the capacity to plan, design and build sustainable transport infrastructure.
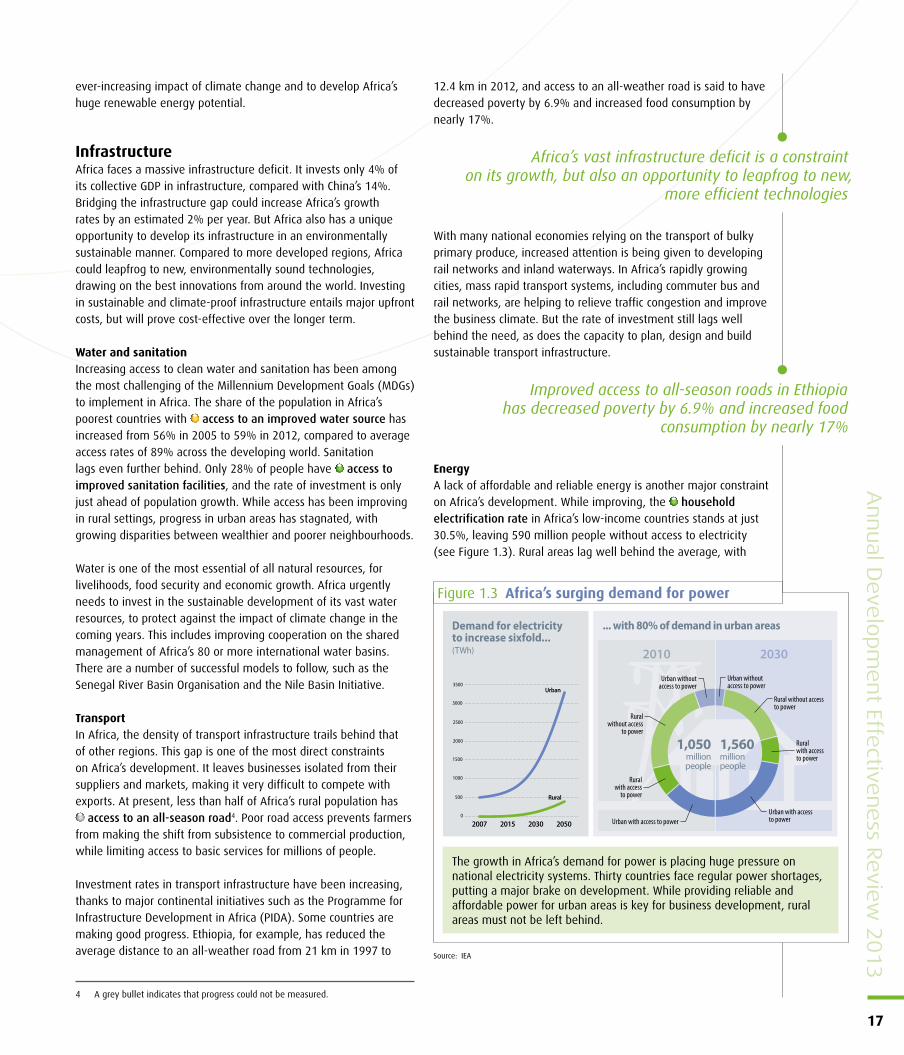
EnergyA lack of affordable and reliable energy is another major constraint on Africa’s development. While improving, the household electrification rate in Africa’s low-income countries stands at just 30.5%, leaving 590!million people without access to electricity (see Figure!1.3). Rural areas lag well behind the average, with
Africa’s vast infrastructure deficit is a constraint on its growth, but also an opportunity to leapfrog to new,
more efficient technologies
Improved access to all-season roads in Ethiopia has!decreased poverty by 6.9% and increased food
consumption by nearly 17%
4 A grey bullet indicates that progress could not be measured.
Figure 1.3 Africa’s surging demand for power
... with 80% of demand in urban areasDemand for electricity to increase sixfold...(TWh)
0
500
1000
1500
2000
2500
3000
3500
2050203020152007
Urban
Rural
1,050millionpeople
1,560millionpeople
Urban withoutaccess to power
Urban withoutaccess to power
Rural without access to power
Ruralwithout access
to powerRural with access to power
Ruralwith access
to power
Urban with access to powerUrban with access to power
2010 2030
The growth in Africa’s demand for power is placing huge pressure on national electricity systems. Thirty countries face regular power shortages, putting a major brake on development. While providing reliable and affordable power for urban areas is key for business development, rural areas must not be left behind.
Source: IEA
an electrification rate of just 10%. Around 85% of rural Africans continue to burn biomass for fuel, which poses both health and environmental hazards and requires time-consuming foraging by women and children.
Yet Africa has huge energy reserves. According to the World Bank, if Africa reinvested just 5% of its oil and coal export revenue, it could achieve modern energy for all by 2030. Africa also has enormous potential for clean and affordable energy. There is vast hydropower potential in Central and East Africa, barely 10% of which is currently tapped. East Africa has large geothermal energy potential, while North Africa, South Africa and the Horn of Africa offer favourable conditions for wind and solar energy. With far less invested in conventional energy generation than other continents, Africa has the potential to leapfrog over old technologies and become a global leader in renewable energy.
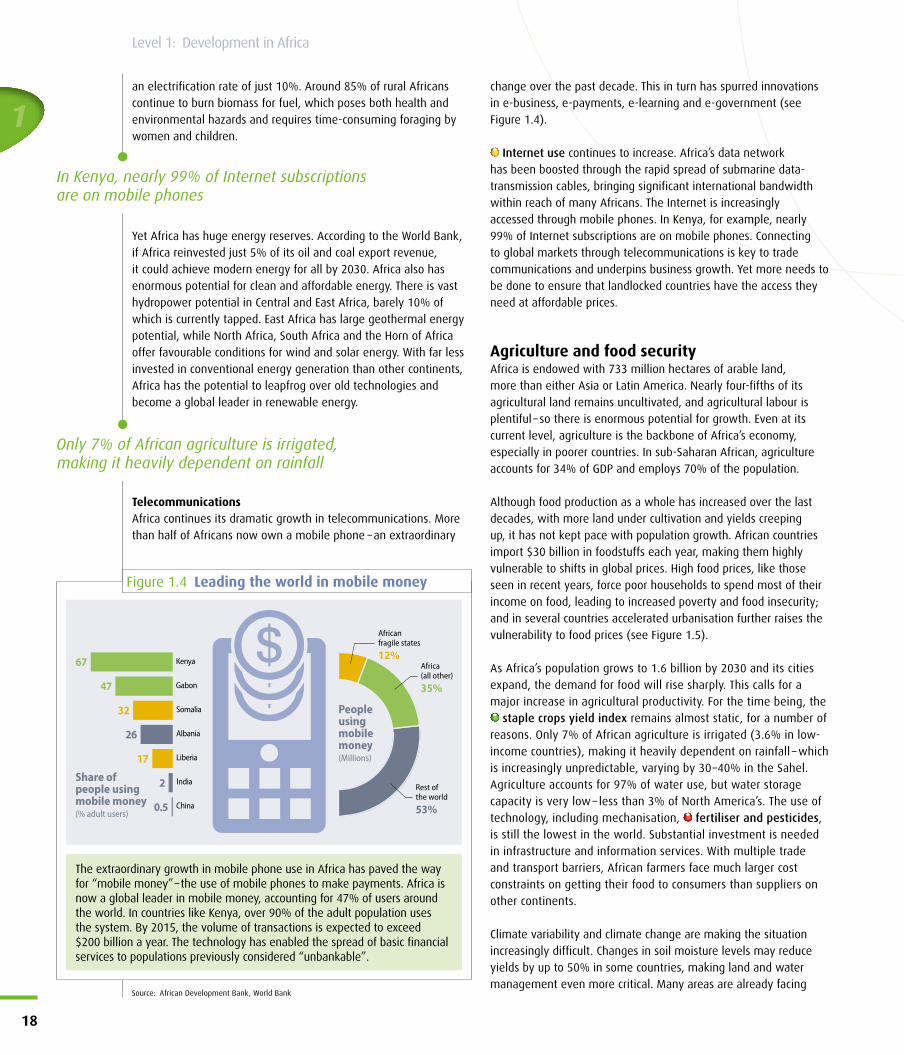
TelecommunicationsAfrica continues its dramatic growth in telecommunications. More than half of Africans now own a mobile phone – an extraordinary
change over the past decade. This in turn has spurred innovations in e-business, e-payments, e-learning and e-government (see Figure!1.4).
Internet use continues to increase. Africa’s data network has been boosted through the rapid spread of submarine data-transmission cables, bringing significant international bandwidth within reach of many Africans. The Internet is increasingly accessed through mobile phones. In Kenya, for example, nearly 99% of Internet subscriptions are on mobile phones. Connecting to global markets through telecommunications is key to trade communications and underpins business growth. Yet more needs to be done to ensure that landlocked countries have the access they need at affordable prices.
Agriculture and food securityAfrica is endowed with 733!million hectares of arable land, more than either Asia or Latin America. Nearly four-fifths of its agricultural land remains uncultivated, and agricultural labour is plentiful – so there is enormous potential for growth. Even at its current level, agriculture is the backbone of Africa’s economy, especially in poorer countries. In sub-Saharan African, agriculture accounts for 34% of GDP and employs 70% of the population.
Although food production as a whole has increased over the last decades, with more land under cultivation and yields creeping up, it has not kept pace with population growth. African countries import $30!billion in foodstuffs each year, making them highly vulnerable to shifts in global prices. High food prices, like those seen in recent years, force poor households to spend most of their income on food, leading to increased poverty and food insecurity; and in several countries accelerated urbanisation further raises the vulnerability to food prices (see Figure!1.5).
As Africa’s population grows to 1.6!billion by 2030 and its cities expand, the demand for food will rise sharply. This calls for a major increase in agricultural productivity. For the time being, the
staple crops yield index remains almost static, for a number of reasons. Only 7% of African agriculture is irrigated (3.6% in low-income countries), making it heavily dependent on rainfall – which is increasingly unpredictable, varying by 30–40% in the Sahel. Agriculture accounts for 97% of water use, but water storage capacity is very low – less than 3% of North America’s. The use of technology, including mechanisation, fertiliser and pesticides, is still the lowest in the world. Substantial investment is needed in infrastructure and information services. With multiple trade and transport barriers, African farmers face much larger cost constraints on getting their food to consumers than suppliers on other continents.
Climate variability and climate change are making the situation increasingly difficult. Changes in soil moisture levels may reduce yields by up to 50% in some countries, making land and water management even more critical. Many areas are already facing
1
18
Level 1: Development in Africa
Figure 1.4 Leading the world in mobile money
Africanfragile states12%
Rest ofthe world53%
Africa(all other)35%
People usingmobile money(Millions)
Share of people using mobile money(% adult users)
China
India
Liberia
Albania
Somalia
Gabon
Kenya
0.5
2
17
26
32
47
67
The extraordinary growth in mobile phone use in Africa has paved the way for “mobile money” – the use of mobile phones to make payments. Africa is now a global leader in mobile money, accounting for 47% of users around the world. In countries like Kenya, over 90% of the adult population uses the system. By 2015, the volume of transactions is expected to exceed $200!billion a year. The technology has enabled the spread of basic financial services to populations previously considered “unbankable”.
Source: African Development Bank, World Bank
In Kenya, nearly 99% of Internet subscriptions are on mobile phones
Only 7% of African agriculture is irrigated, making it heavily dependent on rainfall
more frequent extreme weather, including droughts, floods and cyclones, which compound chronic problems such as famine in the Horn of Africa and flooding in Mozambique and Madagascar.
The challenge for the future is therefore to accomplish a major transformation of African agriculture from subsistence towards commercial production. This means scaling up investments in irrigation. It means improving access to markets and to key agricultural inputs and technologies. It means building up agro-processing value chains, to allow greater diversification and increasing returns in the rural economy. Of equal importance will be introducing environmentally friendly methods of soil and water management. All this in turn means building up stronger national and regional agricultural institutions that can support farmers with research, extension services and help in maintaining standards.
Gender and human developmentAlongside the focus on economic growth, the last decade has seen major investments in human development in Africa, with some remarkable results. Progress towards universal primary education has been particularly strong, especially for the most disadvantaged groups. Net enrolment rates in Africa’s poorest countries have increased dramatically, while the primary school completion rate moved from 53% in 2005 to 67% in 2012. Places at the secondary level in low-income countries have doubled, although Africa continues to have the world’s lowest secondary enrolment rate, at 40%. Given that two-thirds of Africa’s one billion people are under 25!years of age, this expansion in access to basic education is particularly impressive.
There has been a determined effort to encourage girls to attend and stay in school. As a result, the ratio of girls to boys in primary and secondary school has improved significantly. Some successful strategies have included improving school infrastructure, raising community awareness, heightening teacher awareness and tackling gender-based violence.
While access to education has improved dramatically, quality remains a significant concern, with one-third of school leavers lacking basic literacy and numeracy. Without these foundation skills, their life prospects are severely limited.
It is estimated that by 2030 Africa will have produced 137!million secondary school graduates and 12!million tertiary graduates. These educated young people can be an enormous resource for Africa, if their energy and creativity can be channelled towards productive employment. Around 73!million jobs were created between 2000 and 2008, but only 16!million of them were for young people. Many young Africans now find themselves unemployed or underemployed in low-paying jobs in the informal sector. With inadequate employment, 72% of Africa’s youth live on less than $2 a day. This is not just a wasted economic resource, but also a major social and political challenge for the coming decades.
We have already witnessed how youth unemployment in North Africa can lead to dangerous levels of discontent.
Despite the progress in educating African girls, women have not yet increased their share of employment in the formal sector; the
employment-to-population gender ratio has remained static. Many women continue in unpaid work in the agricultural sector, where they make up 70% of the workforce and produce 90% of food products. However, it is encouraging to see that women are increasingly active at the political level. They are well represented in a number of national parliaments: 45% in South Africa, 35% in Uganda and 56% in Rwanda (the highest proportion in the world).
Across Africa, maternal mortality has declined 47% over the last two decades to 531!deaths per 100!000!births. This is, however, a slower rate of improvement than in other developing regions, held back by low rates of skilled birth attendance in rural areas.
There has likewise been progress on child mortality, although Africa lags behind other regions. Under-five child mortality stood at
Annual D
evelo
pm
ent Effe
ctiveness R
eview 2
013
19
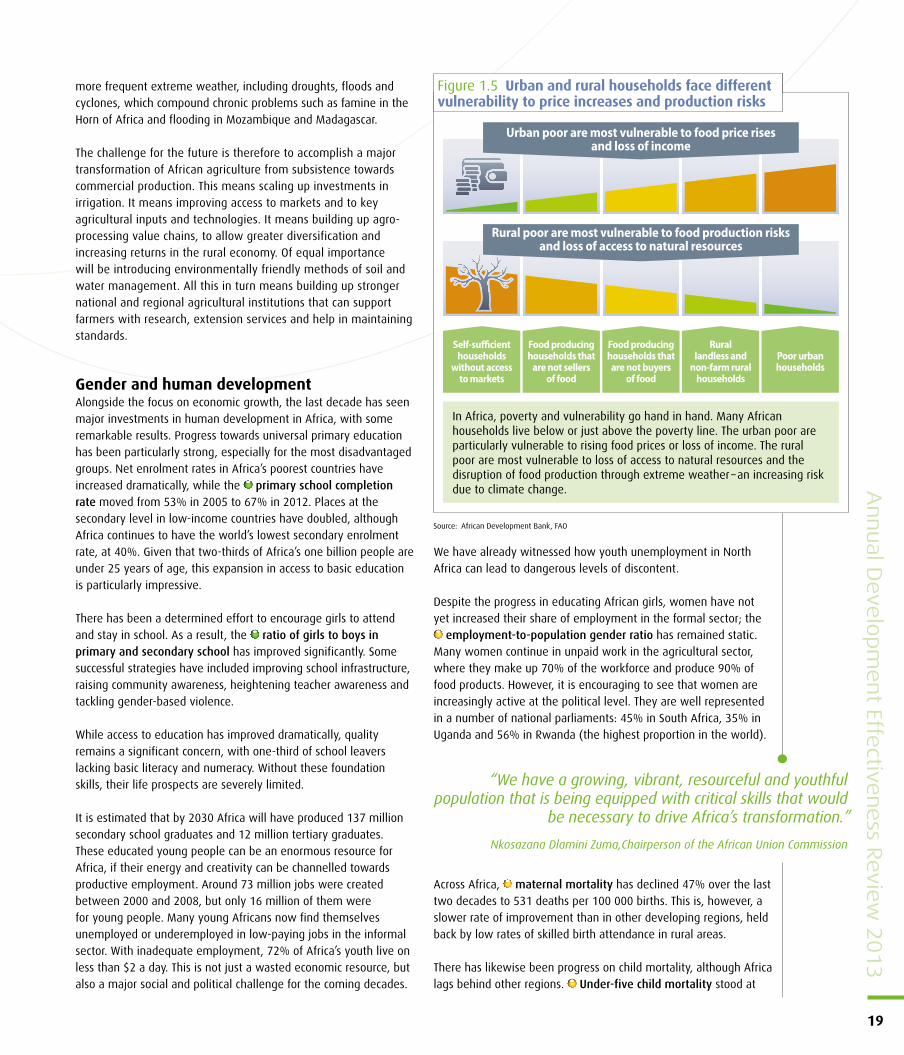
Figure 1.5 Urban and rural households face different vulnerability to price increases and production risks
Self-su!cienthouseholds
without accessto markets
Food producinghouseholds that
are not sellersof food
Food producinghouseholds thatare not buyers
of food
Rurallandless and
non-farm ruralhouseholds
Poor urbanhouseholds
Urban poor are most vulnerable to food price risesand loss of income
Rural poor are most vulnerable to food production risksand loss of access to natural resources
In Africa, poverty and vulnerability go hand in hand. Many African households live below or just above the poverty line. The urban poor are particularly vulnerable to rising food prices or loss of income. The rural poor are most vulnerable to loss of access to natural resources and the disruption of food production through extreme weather – an increasing risk due to climate change.
Source: African Development Bank, FAO
“We have a growing, vibrant, resourceful and youthful population that is being equipped with critical skills that would
be necessary to drive Africa’s transformation.”
Nkosazana Dlamini Zuma,Chairperson of the African Union Commission
1
20
Level 1: Development in Africa
117!per!1000!live births in 2012, down from 140 in 2005. Clean water is a key factor in improving the health of children. Providing clean water and toilets to all children in the poorest countries could prevent more than 50!deaths per 1000 children. Overcoming air pollution from inefficient household stoves could also prevent over 1.5!million premature deaths (see Box!1.1).
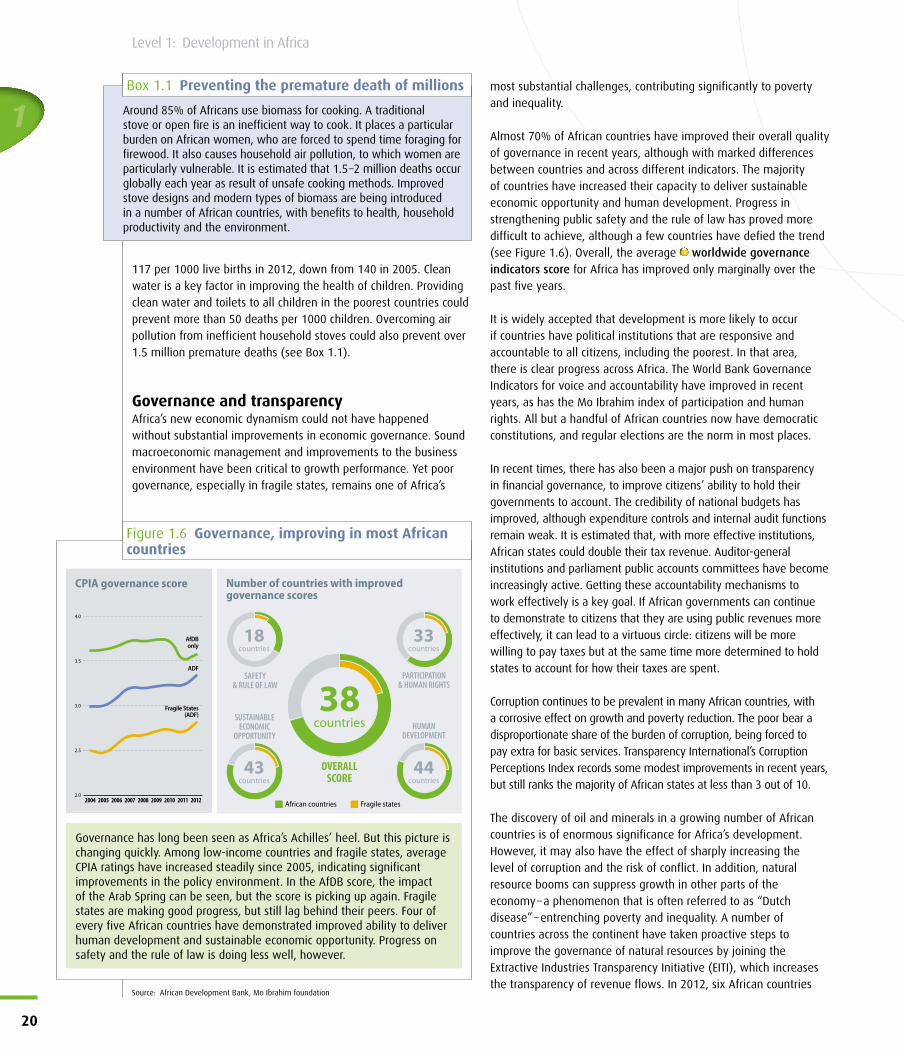
Governance and transparencyAfrica’s new economic dynamism could not have happened without substantial improvements in economic governance. Sound macroeconomic management and improvements to the business environment have been critical to growth performance. Yet poor governance, especially in fragile states, remains one of Africa’s
most substantial challenges, contributing significantly to poverty and inequality.
Almost 70% of African countries have improved their overall quality of governance in recent years, although with marked differences between countries and across different indicators. The majority of countries have increased their capacity to deliver sustainable economic opportunity and human development. Progress in strengthening public safety and the rule of law has proved more difficult to achieve, although a few countries have defied the trend (see Figure!1.6). Overall, the average worldwide governance indicators score for Africa has improved only marginally over the past five years.
It is widely accepted that development is more likely to occur if countries have political institutions that are responsive and accountable to all citizens, including the poorest. In that area, there is clear progress across Africa. The World Bank Governance Indicators for voice and accountability have improved in recent years, as has the Mo Ibrahim index of participation and human rights. All but a handful of African countries now have democratic constitutions, and regular elections are the norm in most places.
In recent times, there has also been a major push on transparency in financial governance, to improve citizens’ ability to hold their governments to account. The credibility of national budgets has improved, although expenditure controls and internal audit functions remain weak. It is estimated that, with more effective institutions, African states could double their tax revenue. Auditor-general institutions and parliament public accounts committees have become increasingly active. Getting these accountability mechanisms to work effectively is a key goal. If African governments can continue to demonstrate to citizens that they are using public revenues more effectively, it can lead to a virtuous circle: citizens will be more willing to pay taxes but at the same time more determined to hold states to account for how their taxes are spent.
Corruption continues to be prevalent in many African countries, with a corrosive effect on growth and poverty reduction. The poor bear a disproportionate share of the burden of corruption, being forced to pay extra for basic services. Transparency International’s Corruption Perceptions Index records some modest improvements in recent years, but still ranks the majority of African states at less than 3 out of 10.
The discovery of oil and minerals in a growing number of African countries is of enormous significance for Africa’s development. However, it may also have the effect of sharply increasing the level of corruption and the risk of conflict. In addition, natural resource booms can suppress growth in other parts of the economy – a phenomenon that is often referred to as “Dutch disease” – entrenching poverty and inequality. A number of countries across the continent have taken proactive steps to improve the governance of natural resources by joining the Extractive Industries Transparency Initiative (EITI), which increases the transparency of revenue flows. In 2012, six African countries
Around 85% of Africans use biomass for cooking. A traditional stove or open fire is an inefficient way to cook. It places a particular burden on African women, who are forced to spend time foraging for firewood. It also causes household air pollution, to which women are particularly vulnerable. It is estimated that 1.5–2!million deaths occur globally each year as result of unsafe cooking methods. Improved stove designs and modern types of biomass are being introduced in a number of African countries, with benefits to health, household productivity and the environment.
Box 1.1 Preventing the premature death of millions
Figure 1.6 Governance, improving in most African countries
OVERALLSCORE
38countries
SAFETY& RULE OF LAW
PARTICIPATION& HUMAN RIGHTS
SUSTAINABLEECONOMIC
OPPORTUNITY
43countries
HUMANDEVELOPMENT
44countries
18countries
33countries
Number of countries with improved governance scores
CPIA governance score
African countries Fragile states2.0
2.5
3.0
3.5
4.0
Fragile States(ADF)
ADF
AfDBonly
201220112010200920082007200620052004
Governance has long been seen as Africa’s Achilles’ heel. But this picture is changing quickly. Among low-income countries and fragile states, average CPIA ratings have increased steadily since 2005, indicating significant improvements in the policy environment. In the AfDB score, the impact of the Arab Spring can be seen, but the score is picking up again. Fragile states are making good progress, but still lag behind their peers. Four of every five African countries have demonstrated improved ability to deliver human development and sustainable economic opportunity. Progress on safety and the rule of law is doing less well, however.
Source: African Development Bank, Mo Ibrahim foundation
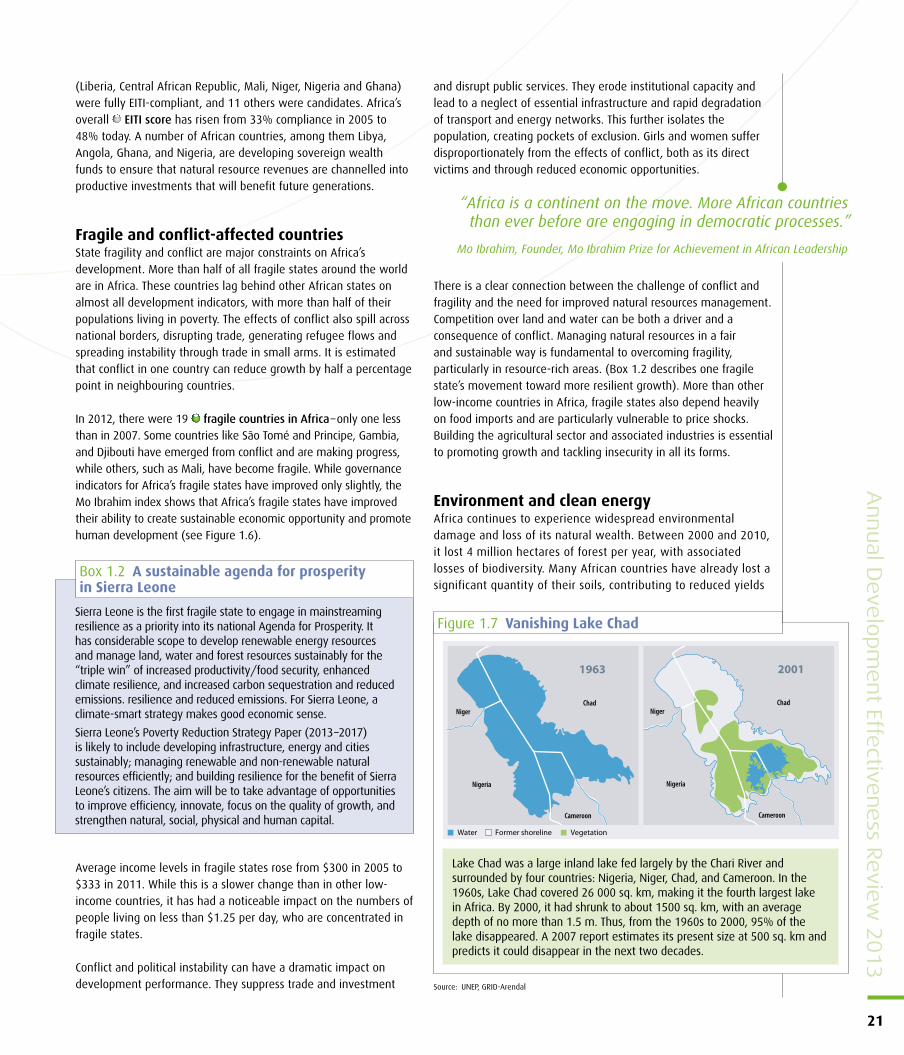
Annual D
evelo
pm
ent Effe
ctiveness R
eview 2
013
21
(Liberia, Central African Republic, Mali, Niger, Nigeria and Ghana) were fully EITI-compliant, and 11 others were candidates. Africa’s overall EITI score has risen from 33% compliance in 2005 to 48% today. A number of African countries, among them Libya, Angola, Ghana, and Nigeria, are developing sovereign wealth funds to ensure that natural resource revenues are channelled into productive investments that will benefit future generations.
Fragile and conflict-affected countriesState fragility and conflict are major constraints on Africa’s development. More than half of all fragile states around the world are in Africa. These countries lag behind other African states on almost all development indicators, with more than half of their populations living in poverty. The effects of conflict also spill across national borders, disrupting trade, generating refugee flows and spreading instability through trade in small arms. It is estimated that conflict in one country can reduce growth by half a percentage point in neighbouring countries.
In 2012, there were 19 fragile countries in Africa – only one less than in 2007. Some countries like São Tomé and Principe, Gambia, and Djibouti have emerged from conflict and are making progress, while others, such as Mali, have become fragile. While governance indicators for Africa’s fragile states have improved only slightly, the Mo Ibrahim index shows that Africa’s fragile states have improved their ability to create sustainable economic opportunity and promote human development (see Figure!1.6).
Average income levels in fragile states rose from $300 in 2005 to $333 in 2011. While this is a slower change than in other low-income countries, it has had a noticeable impact on the numbers of people living on less than $1.25 per day, who are concentrated in fragile states.
Conflict and political instability can have a dramatic impact on development performance. They suppress trade and investment
and disrupt public services. They erode institutional capacity and lead to a neglect of essential infrastructure and rapid degradation of transport and energy networks. This further isolates the population, creating pockets of exclusion. Girls and women suffer disproportionately from the effects of conflict, both as its direct victims and through reduced economic opportunities.
There is a clear connection between the challenge of conflict and fragility and the need for improved natural resources management. Competition over land and water can be both a driver and a consequence of conflict. Managing natural resources in a fair and sustainable way is fundamental to overcoming fragility, particularly in resource-rich areas. (Box!1.2 describes one fragile state’s movement toward more resilient growth). More than other low-income countries in Africa, fragile states also depend heavily on food imports and are particularly vulnerable to price shocks. Building the agricultural sector and associated industries is essential to promoting growth and tackling insecurity in all its forms.
Environment and clean energyAfrica continues to experience widespread environmental damage and loss of its natural wealth. Between 2000 and 2010, it lost 4!million hectares of forest per year, with associated losses of biodiversity. Many African countries have already lost a significant quantity of their soils, contributing to reduced yields
“Africa is a continent on the move. More African countries than ever before are engaging in democratic processes.”
Mo Ibrahim, Founder, Mo Ibrahim Prize for Achievement in African Leadership
Sierra Leone is the first fragile state to engage in mainstreaming resilience as a priority into its national Agenda for Prosperity. It has considerable scope to develop renewable energy resources and manage land, water and forest resources sustainably for the “triple win” of increased productivity/food security, enhanced climate resilience, and increased carbon sequestration and reduced emissions. resilience and reduced emissions. For Sierra Leone, a climate-smart strategy makes good economic sense.
Sierra Leone’s Poverty Reduction Strategy Paper (2013–2017) is likely to include developing infrastructure, energy and cities sustainably; managing renewable and non-renewable natural resources efficiently; and building resilience for the benefit of Sierra Leone’s citizens. The aim will be to take advantage of opportunities to improve efficiency, innovate, focus on the quality of growth, and strengthen natural, social, physical and human capital.
Box 1.2 A sustainable agenda for prosperity in!Sierra Leone
Figure 1.7 Vanishing Lake Chad
2001
NigerChad
Nigeria
Cameroon
Water Former shoreline Vegetation
1963
NigerChad
Nigeria
Cameroon
Lake Chad was a large inland lake fed largely by the Chari River and surrounded by four countries: Nigeria, Niger, Chad, and Cameroon. In the 1960s, Lake Chad covered 26!000!sq.!km, making it the fourth largest lake in Africa. By 2000, it had shrunk to about 1500!sq. km, with an average depth of no more than 1.5!m. Thus, from the 1960s to 2000, 95% of the lake disappeared. A 2007 report estimates its present size at 500!sq. km and predicts it could disappear in the next two decades.
Source: UNEP, GRID-Arendal
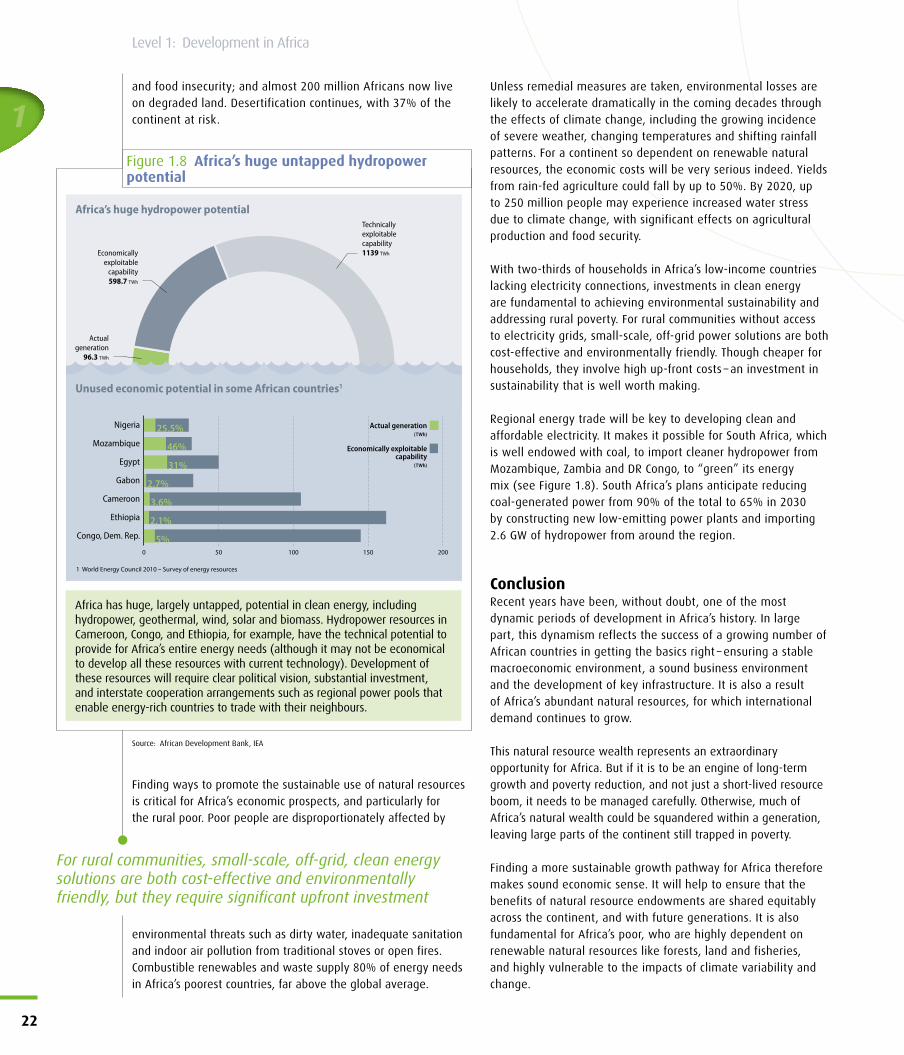
1
22
Level 1: Development in Africa
and food insecurity; and almost 200!million Africans now live on degraded land. Desertification continues, with 37% of the continent at risk.
Finding ways to promote the sustainable use of natural resources is critical for Africa’s economic prospects, and particularly for the rural poor. Poor people are disproportionately affected by
environmental threats such as dirty water, inadequate sanitation and indoor air pollution from traditional stoves or open fires. Combustible renewables and waste supply 80% of energy needs in Africa’s poorest countries, far above the global average.
Unless remedial measures are taken, environmental losses are likely to accelerate dramatically in the coming decades through the effects of climate change, including the growing incidence of severe weather, changing temperatures and shifting rainfall patterns. For a continent so dependent on renewable natural resources, the economic costs will be very serious indeed. Yields from rain-fed agriculture could fall by up to 50%. By 2020, up to 250!million people may experience increased water stress due to climate change, with significant effects on agricultural production and food security.
With two-thirds of households in Africa’s low-income countries lacking electricity connections, investments in clean energy are fundamental to achieving environmental sustainability and addressing rural poverty. For rural communities without access to electricity grids, small-scale, off-grid power solutions are both cost-effective and environmentally friendly. Though cheaper for households, they involve high up-front costs – an investment in sustainability that is well worth making.
Regional energy trade will be key to developing clean and affordable electricity. It makes it possible for South Africa, which is well endowed with coal, to import cleaner hydropower from Mozambique, Zambia and DR Congo, to “green” its energy mix (see Figure!1.8). South Africa’s plans anticipate reducing coal-generated power from 90% of the total to 65% in 2030 by constructing new low-emitting power plants and importing 2.6!GW of hydropower from around the region.
ConclusionRecent years have been, without doubt, one of the most dynamic periods of development in Africa’s history. In large part, this dynamism reflects the success of a growing number of African countries in getting the basics right – ensuring a stable macroeconomic environment, a sound business environment and the development of key infrastructure. It is also a result of Africa’s abundant natural resources, for which international demand continues to grow.
This natural resource wealth represents an extraordinary opportunity for Africa. But if it is to be an engine of long-term growth and poverty reduction, and not just a short-lived resource boom, it needs to be managed carefully. Otherwise, much of Africa’s natural wealth could be squandered within a generation, leaving large parts of the continent still trapped in poverty.
Finding a more sustainable growth pathway for Africa therefore makes sound economic sense. It will help to ensure that the benefits of natural resource endowments are shared equitably across the continent, and with future generations. It is also fundamental for Africa’s poor, who are highly dependent on renewable natural resources like forests, land and fisheries, and highly vulnerable to the impacts of climate variability and change.
Figure 1.8 Africa’s huge untapped hydropower potential
Africa’s huge hydropower potential
Actualgeneration
96.3 TWh
Economicallyexploitable
capability598.7 TWh
Technicallyexploitablecapability1139 TWh
0 50 100 150 200
Economically exploitablecapability
(TWh)
Actual generation(TWh)
Congo, Dem. Rep.
Ethiopia
Cameroon
Gabon
Egypt
Mozambique
Nigeria
5%
2.1%
3.6%
2.7%
31%
46%
25.5%
Unused economic potential in some African countries1
1 World Energy Council 2010 – Survey of energy resources
Africa has huge, largely untapped, potential in clean energy, including hydropower, geothermal, wind, solar and biomass. Hydropower resources in Cameroon, Congo, and Ethiopia, for example, have the technical potential to provide for Africa’s entire energy needs (although it may not be economical to develop all these resources with current technology). Development of these resources will require clear political vision, substantial investment, and interstate cooperation arrangements such as regional power pools that enable energy-rich countries to trade with their neighbours.
Source: African Development Bank, IEA
For rural communities, small-scale, off-grid, clean energy solutions are both cost-effective and environmentally friendly, but they require significant upfront investment
This is also an opportunity for Africa. The continent has a large share of the world’s potential for clean energy. In the coming years, as investment in infrastructure increases, Africa has an
opportunity to leapfrog over old technologies and invest in new, efficient, and clean technologies. The short-term costs may be high, but the returns will be substantial
Annual D
evelo
pm
ent Effe
ctiveness R
eview 2
013
23
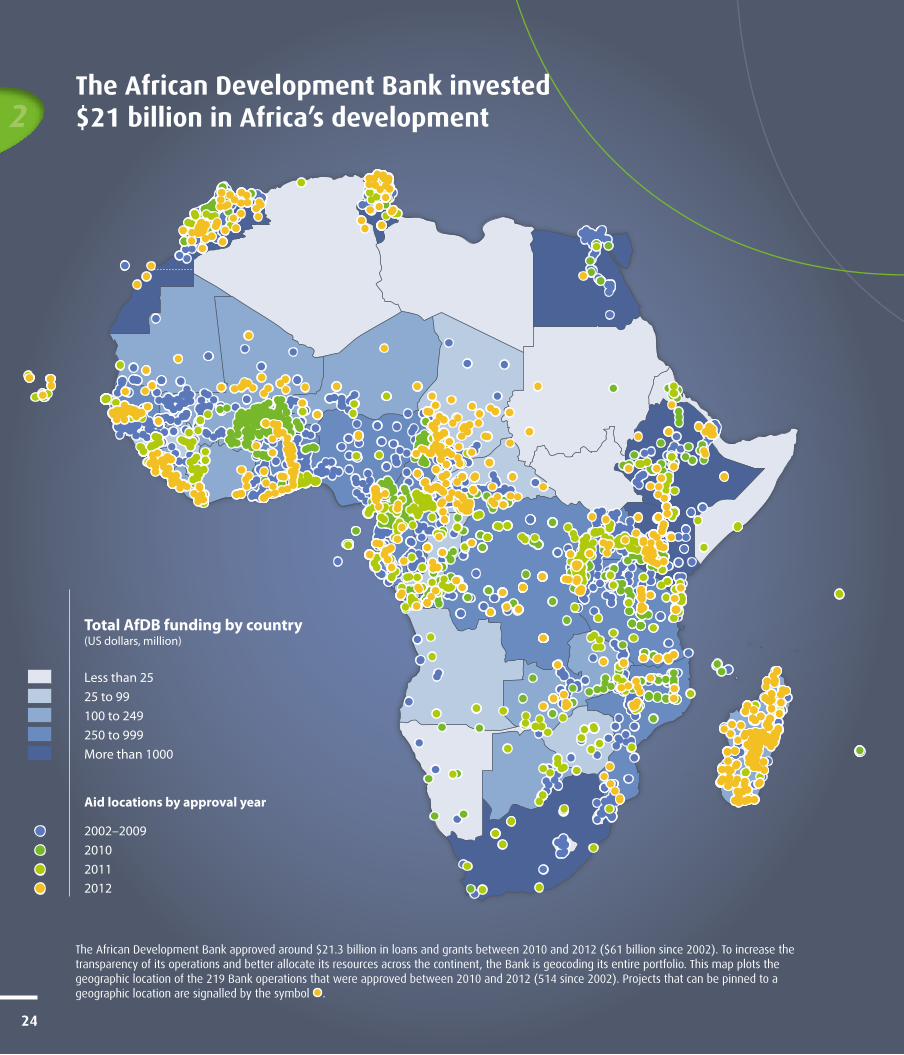
24
2
The African Development Bank approved around $21.3!billion in loans and grants between 2010 and 2012 ($61!billion since 2002). To increase the transparency of its operations and better allocate its resources across the continent, the Bank is geocoding its entire portfolio. This map plots the geographic location of the 219!Bank operations that were approved between 2010 and 2012 (514!since 2002). Projects that can be pinned to a geographic location are signalled by the symbol .
The African Development Bank invested $21 billion in Africa’s development
Total AfDB funding by country(US dollars, million)
Less than 2525 to 99100 to 249250 to 999
Aid locations by approval year
2002–2009201020112012
More than 1000
Level 2: How AfDB contributes to!Africa’s development
As Africa’s premier development finance institution, the African Development Bank contributes to poverty reduction across Africa by promoting sustainable economic development and social progress in its regional member countries. To this end, we invest around $6!billion each year through a wide range of operations, which we support with policy advice and technical assistance. We are also
closely engaged in joint initiatives at the regional, continental and international levels, helping to promote Africa’s development.
This chapter describes how AfDB contributes to Africa’s development. It reviews the results of our operations across the range of sectors and thematic areas, from infrastructure and private sector development to agriculture and women’s equality. It presents these results in the same nine areas as the previous chapter.
Annual D
evelo
pm
ent Effe
ctiveness R
eview 2
013
25
Measuring the Bank’s contribution to!developmentMeasuring the Bank’s overall contribution to Africa’s development is a challenging undertaking. As we have seen from the previous chapter, development is a complex process. Increasing demand for raw materials from middle-income countries promotes Africa’s growth, while the degradation of Africa’s natural wealth and the impacts of climate change can hold it back. Structural issues like the increasing numbers of young people joining the labour market have a major influence on development performance, as do external shocks like rises in international food prices. Furthermore, the Bank is just one of many actors promoting development in Africa, alongside its regional member countries, other development partners, firms and civil society organisations.
In this context, it is difficult to attribute overall development results to the work of a single organisation. We therefore assess our results by building up a picture of our support from the project level. The
51!indicators in Level!2 of our Results Measurement Framework capture this contribution. They present aggregate outputs from projects completed between 2010 and 2012, for which we have Project Completion Reports (PCRs).
It is estimated that the costs of responding to climate change in Africa will run to $40 billion a year
until 2030 – well above the current rate of investment
Under the leadership of the Bank, the African Union and UNECA, African countries and institutions successfully raised the levels of their participation in international fora. Under this partnership, an Africa Pavilion was established at the international climate negotiations in Durban in 2011. Also, an Africa-wide process enhanced Africa’s participation at Rio+20, which included the development of the Africa Consensus Statement.
The key policy conclusions that emerged from the Durban meeting included the need to sustain the momentum Africa had gained through its common position on climate change; articulate a continent-wide strategy to address climate change in Africa; and provide better access to climate finance. The Africa Pavilion afforded African decision-makers the opportunity to advocate for Africa’s key messages and opportunities for African voices to be heard in the climate change arena. The meeting called on African leaders to effectively and adequately mainstream climate change into development policies, programmes and projects, taking advantage of the opportunities for finance and capacity building that exist throughout the UNFCCC, and to continue to enhance the capacity of African institutions to properly build climate services networks and better benefit from climate information for development planning.
For Rio+20, the partnership provided technical inputs to enable Africa’s effective participation in the discussions and negotiations as well as in the organisation of a! high-level Africa Day that was attended by several heads of states and high level decision-makers. The meeting resulted in an enhanced awareness and understanding of Africa’s sustainable development priorities and concerns; development of key policy messages and recommendations on accelerating progress towards sustainable development to inform the discussions at Rio+20; enhanced buy-in and support for Africa’s negotiating positions at Rio+20; and strengthened partnerships for the advancement of Africa’s sustainable development agenda.
Box 2.1 The African voice in international negotiations on climate and sustainable development
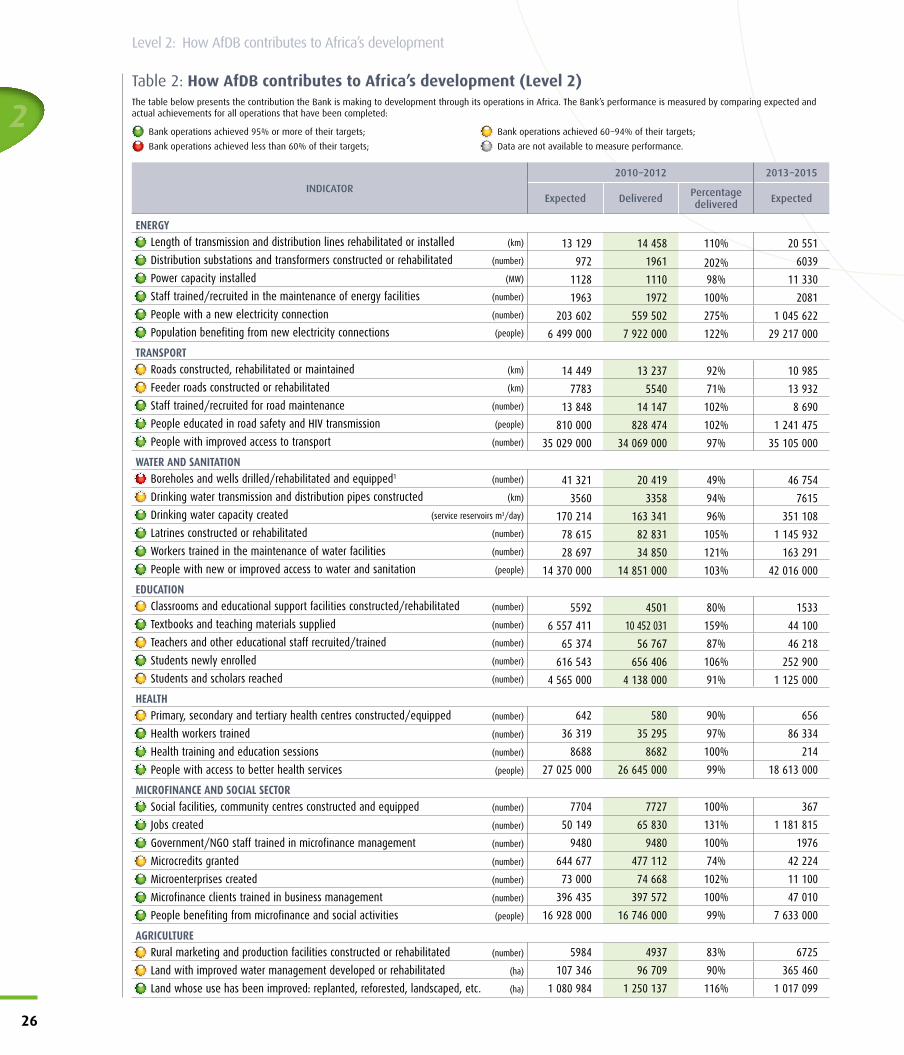
Table 2: How AfDB contributes to Africa’s development (Level 2)The table below presents the contribution the Bank is making to development through its operations in Africa. The Bank’s performance is measured!by comparing expected and actual achievements for all operations that have been completed:
Bank operations achieved 95% or more of their targets; Bank operations achieved 60–94% of their targets;
Bank operations achieved less than 60% of their targets; Data are not available to measure performance.
INDICATOR2010–2012 2013–2015
Expected Delivered Percentage delivered Expected
ENERGYLength of transmission and distribution lines rehabilitated or installed (km) 13!129 14!458 110% 20!551Distribution substations and transformers constructed or rehabilitated (number) 972 1961 202% 6039Power capacity installed (MW) 1128 1110 98% 11!330Staff trained/recruited in the maintenance of energy facilities (number) 1963 1972 100% 2081People with a new electricity connection (number) 203!602 559!502 275% 1!045!622Population benefiting from new electricity connections (people) 6!499!000 7!922!000 122% 29!217!000
TRANSPORTRoads constructed, rehabilitated or maintained (km) 14!449 13!237 92% 10!985Feeder roads constructed or rehabilitated (km) 7783 5540 71% 13!932Staff trained/recruited for road maintenance (number) 13!848 14!147 102% 8!690People educated in road safety and HIV transmission (people) 810!000 828!474 102% 1!241!475People with improved access to transport (number) 35!029!000 34!069!000 97% 35!105!000
WATER AND SANITATIONBoreholes and wells drilled/rehabilitated and equipped1 (number) 41!321 20!419 49% 46!754Drinking water transmission and distribution pipes constructed (km) 3560 3358 94% 7615Drinking water capacity created (service reservoirs m3/day) 170!214 163!341 96% 351!108Latrines constructed or rehabilitated (number) 78!615 82!831 105% 1!145!932Workers trained in the maintenance of water facilities (number) 28!697 34!850 121% 163!291People with new or improved access to water and sanitation (people) 14!370!000 14!851!000 103% 42!016!000
EDUCATIONClassrooms and educational support facilities constructed/rehabilitated (number) 5592 4501 80% 1533Textbooks and teaching materials supplied (number) 6!557!411 10!452!031 159% 44!100Teachers and other educational staff recruited/trained (number) 65!374 56!767 87% 46!218Students newly enrolled (number) 616!543 656!406 106% 252!900Students and scholars reached (number) 4!565!000 4!138!000 91% 1!125!000
HEALTHPrimary, secondary and tertiary health centres constructed/equipped (number) 642 580 90% 656
Health workers trained (number) 36!319 35!295 97% 86!334
Health training and education sessions (number) 8688 8682 100% 214
People with access to better health services (people) 27!025!000 26!645!000 99% 18!613!000
MICROFINANCE AND SOCIAL SECTORSocial facilities, community centres constructed and equipped (number) 7704 7727 100% 367
Jobs created (number) 50!149 65!830 131% 1!181!815
Government/NGO staff trained in microfinance management (number) 9480 9480 100% 1976
Microcredits granted (number) 644!677 477!112 74% 42!224
Microenterprises created (number) 73!000 74!668 102% 11!100
Microfinance clients trained in business management (number) 396!435 397!572 100% 47!010
People benefiting from microfinance and social activities (people) 16!928!000 16!746!000 99% 7!633!000
AGRICULTURERural marketing and production facilities constructed or rehabilitated (number) 5984 4937 83% 6725
Land with improved water management developed or rehabilitated (ha) 107!346 96!709 90% 365!460
Land whose use has been improved: replanted, reforested, landscaped, etc. (ha) 1!080!984 1!250!137 116% 1!017!099
2
26
Level 2: How AfDB contributes to!Africa’s development
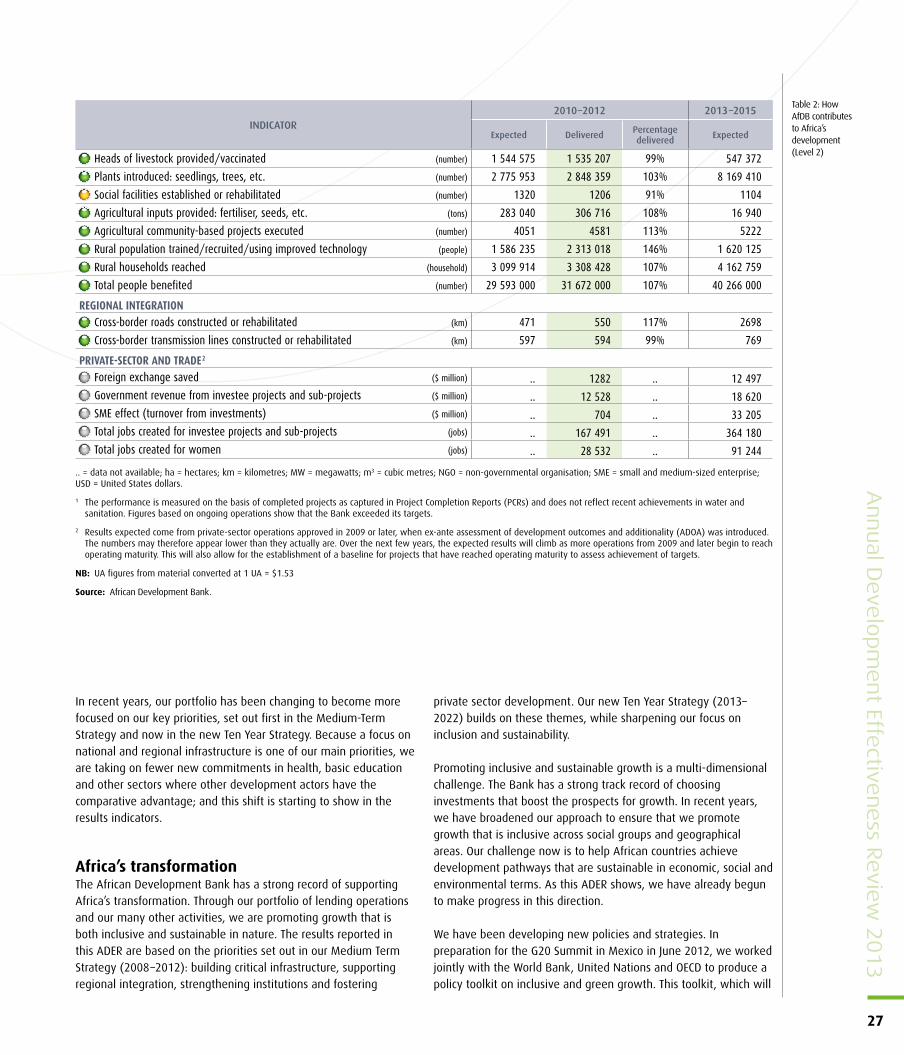
Annual D
evelo
pm
ent Effe
ctiveness R
eview 2
013
27
In recent years, our portfolio has been changing to become more focused on our key priorities, set out first in the Medium-Term Strategy and now in the new Ten Year Strategy. Because a focus on national and regional infrastructure is one of our main priorities, we are taking on fewer new commitments in health, basic education and other sectors where other development actors have the comparative advantage; and this shift is starting to show in the results indicators.
Africa’s transformationThe African Development Bank has a strong record of supporting Africa’s transformation. Through our portfolio of lending operations and our many other activities, we are promoting growth that is both inclusive and sustainable in nature. The results reported in this ADER are based on the priorities set out in our Medium Term Strategy (2008–2012): building critical infrastructure, supporting regional integration, strengthening institutions and fostering
private sector development. Our new Ten Year Strategy (2013–2022) builds on these themes, while sharpening our focus on inclusion and sustainability.
Promoting inclusive and sustainable growth is a multi-dimensional challenge. The Bank has a strong track record of choosing investments that boost the prospects for growth. In recent years, we have broadened our approach to ensure that we promote growth that is inclusive across social groups and geographical areas. Our challenge now is to help African countries achieve development pathways that are sustainable in economic, social and environmental terms. As this ADER shows, we have already begun to make progress in this direction.
We have been developing new policies and strategies. In preparation for the G20 Summit in Mexico in June!2012, we worked jointly with the World Bank, United Nations and OECD to produce a policy toolkit on inclusive and green growth. This toolkit, which will
INDICATOR2010–2012 2013–2015
Expected Delivered Percentage delivered Expected
Heads of livestock provided/vaccinated (number) 1!544!575 1!535!207 99% 547!372
Plants introduced: seedlings, trees, etc. (number) 2!775!953 2!848!359 103% 8!169!410
Social facilities established or rehabilitated (number) 1320 1206 91% 1104
Agricultural inputs provided: fertiliser, seeds, etc. (tons) 283!040 306!716 108% 16!940
Agricultural community-based projects executed (number) 4051 4581 113% 5222
Rural population trained/recruited/using improved technology (people) 1!586!235 2!313!018 146% 1!620!125
Rural households reached (household) 3!099!914 3!308!428 107% 4!162!759
Total people benefited (number) 29!593!000 31!672!000 107% 40!266!000
REGIONAL INTEGRATIONCross-border roads constructed or rehabilitated (km) 471 550 117% 2698
Cross-border transmission lines constructed or rehabilitated (km) 597 594 99% 769
PRIVATE-SECTOR AND TRADE2
Foreign exchange saved ($ million) .. 1282 .. 12!497Government revenue from investee projects and sub-projects ($ million) .. 12!528 .. 18!620SME effect (turnover from investments) ($ million) .. 704 .. 33!205Total jobs created for investee projects and sub-projects (jobs) .. 167!491 .. 364!180Total jobs created for women (jobs) .. 28!532 .. 91!244
.. = data not available; ha = hectares; km = kilometres; MW = megawatts; m3 = cubic metres; NGO = non-governmental organisation; SME = small and medium-sized enterprise; USD = United States dollars.
1 The performance is measured on the basis of completed projects as captured in Project Completion Reports (PCRs) and does not reflect recent achievements in water and sanitation. Figures based on ongoing operations show that the Bank exceeded its targets.
2 Results expected come from private-sector operations approved in 2009 or later, when ex-ante assessment of development outcomes and additionality (ADOA) was introduced. The numbers may therefore appear lower than they actually are. Over the next few years, the expected results will climb as more operations from 2009 and later begin to reach operating maturity. This will also allow for the establishment of a baseline for projects that have reached operating maturity to assess achievement of targets.
NB: UA figures from material converted at 1 UA = $1.53
Source: African Development Bank.
Table 2: How AfDB contributes to Africa’s development (Level 2)
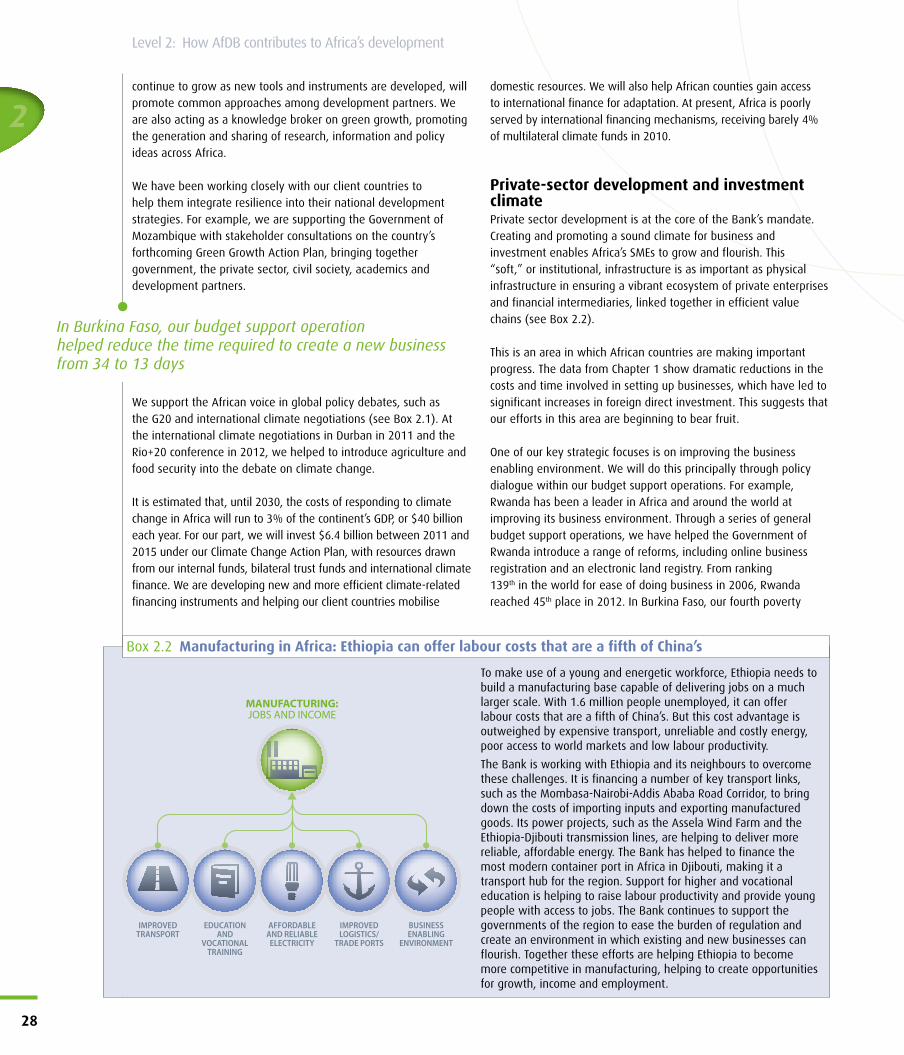
2
28
Level 2: How AfDB contributes to!Africa’s development
continue to grow as new tools and instruments are developed, will promote common approaches among development partners. We are also acting as a knowledge broker on green growth, promoting the generation and sharing of research, information and policy ideas across Africa.
We have been working closely with our client countries to help them integrate resilience into their national development strategies. For example, we are supporting the Government of Mozambique with stakeholder consultations on the country’s forthcoming Green Growth Action Plan, bringing together government, the private sector, civil society, academics and development partners.
We support the African voice in global policy debates, such as the G20 and international climate negotiations (see Box!2.1). At the international climate negotiations in Durban in 2011 and the Rio+20 conference in 2012, we helped to introduce agriculture and food security into the debate on climate change.
It is estimated that, until 2030, the costs of responding to climate change in Africa will run to 3% of the continent’s GDP, or $40!billion each year. For our part, we will invest $6.4 billion between 2011 and 2015 under our Climate Change Action Plan, with resources drawn from our internal funds, bilateral trust funds and international climate finance. We are developing new and more efficient climate-related financing instruments and helping our client countries mobilise
domestic resources. We will also help African counties gain access to international finance for adaptation. At present, Africa is poorly served by international financing mechanisms, receiving barely 4% of multilateral climate funds in 2010.
Private-sector development and investment climatePrivate sector development is at the core of the Bank’s mandate. Creating and promoting a sound climate for business and investment enables Africa’s SMEs to grow and flourish. This “soft,” or institutional, infrastructure is as important as physical infrastructure in ensuring a vibrant ecosystem of private enterprises and financial intermediaries, linked together in efficient value chains (see Box!2.2).
This is an area in which African countries are making important progress. The data from Chapter!1 show dramatic reductions in the costs and time involved in setting up businesses, which have led to significant increases in foreign direct investment. This suggests that our efforts in this area are beginning to bear fruit.
One of our key strategic focuses is on improving the business enabling environment. We will do this principally through policy dialogue within our budget support operations. For example, Rwanda has been a leader in Africa and around the world at improving its business environment. Through a series of general budget support operations, we have helped the Government of Rwanda introduce a range of reforms, including online business registration and an electronic land registry. From ranking 139th in the world for ease of doing business in 2006, Rwanda reached 45th!place in 2012. In Burkina Faso, our fourth poverty
In Burkina Faso, our budget support operation helped reduce the time required to create a new business from 34 to 13!days
Box 2.2 Manufacturing in Africa: Ethiopia can offer labour costs that are a fifth of China’s
To make use of a young and energetic workforce, Ethiopia needs to build a manufacturing base capable of delivering jobs on a much larger scale. With 1.6!million people unemployed, it can offer labour costs that are a fifth of China’s. But this cost advantage is outweighed by expensive transport, unreliable and costly energy, poor access to world markets and low labour productivity.
The Bank is working with Ethiopia and its neighbours to overcome these challenges. It is financing a number of key transport links, such as the Mombasa-Nairobi-Addis Ababa Road Corridor, to bring down the costs of importing inputs and exporting manufactured goods. Its power projects, such as the Assela Wind Farm and the Ethiopia-Djibouti transmission lines, are helping to deliver more reliable, affordable energy. The Bank has helped to finance the most modern container port in Africa in Djibouti, making it a transport hub for the region. Support for higher and vocational education is helping to raise labour productivity and provide young people with access to jobs. The Bank continues to support the governments of the region to ease the burden of regulation and create an environment in which existing and new businesses can flourish. Together these efforts are helping Ethiopia to become more competitive in manufacturing, helping to create opportunities for growth, income and employment.
MANUFACTURING:JOBS AND INCOME
IMPROVEDTRANSPORT
EDUCATIONAND
VOCATIONALTRAINING
AFFORDABLEAND RELIABLEELECTRICITY
IMPROVEDLOGISTICS/
TRADE PORTS
BUSINESSENABLING
ENVIRONMENT
Annual D
evelo
pm
ent Effe
ctiveness R
eview 2
013
29
reduction strategy support programme emphasised improved competitiveness as the key to private sector development. As part of a $40!million budget support operation, we helped promote an integrated services framework for the national business registration centre, reducing the time required to create a new business from 34 in 2007 to 13 days now.
Another example of public sector reform to facilitate private sector development is our support to Mozambique. Among other things, we have been supporting the decentralising and restructuring of key services to business and citizens. We helped establish six “one-stop shops” that deliver a range of services, including national identification, tax and social security matters, notary functions, the registration of legal entities, property registration and business licensing.
We have deepened access to the financial and capital markets through a range of investment projects, lines of credit and programme-based operations, mostly undertaken jointly with other development partners. We host the Making Finance Work for Africa Initiative, which strengthens partnerships and promotes knowledge sharing on financial sector development across Africa. We also deliver non-sovereign (private sector) lending using quasi-equity to lower the cost or risk profile for private investors. Our investment projects over the past three years led to foreign exchange savings1 of $1.3!billion and generated government revenues of $12.5!billion.
Another important aspect of private sector development is that we continue to prioritise access to finance for small and medium-sized enterprises. This is key to enabling them to expand and take on more workers. Over the past two years, we have extended nearly half a million microcredits2 and supported the creation of 75!000! microenterprises3 through the training of nearly 400!000!clients in business management. This support has
created 66!000!jobs.
Regional integration and tradeThe Bank is Africa’s principal financier of regional projects. Over the last decade, we have scaled up our support and developed a more systematic and focused approach to regional efforts, in line with African Union and NEPAD priorities. The majority of our resources went towards infrastructure development in transport and energy. In parallel, we provided support to “soft infrastructure” projects dealing with regulatory issues and capacity building, and to technical advisory services. We were also active in supporting the financial sector and in private sector development.
We have prepared Regional Integration Strategy Papers for four regional groupings (East, South, West and Central Africa; the paper
for North Africa was deferred on account of the political situation), working in close collaboration with the regional economic communities and their member states. We have helped build the capacity of the regional economic communities, which play a key role in planning and implementing regional integration initiatives. Our goal is to promote the free movement of goods, services, capital and people by dismantling the barriers between countries and harmonising key economic and financial policies.
Despite significant challenges, including an overall shortage of finance for regional initiatives and the complexities of project implementation at the regional level, there has been some important progress. Our projects have delivered 550!km of cross-border roads. Our investments in transport infrastructure increasingly take a “transport corridor” approach, with major transport routes linking centres of economic activity with ports, and feeder roads extending the benefits to surrounding areas (see Box!2.4). These investments generate benefit along the route from increased economic activity and improved access to services.
As part of our transport corridors, we have been developing ‘one-stop border posts’ (OSBPs). At present, complex procedures at national borders cause delays and increase costs. OSBPs provide a single window for accessing services from different government agencies, thereby reducing transit costs and increasing access to regional markets (see Box!2.3). The Bank is also working jointly with the World Customs Organisation to build capacity across the continent and improve customs operations.
We also delivered on our target of 594!km of cross-border transmission lines. This investment supports the development of regional power pools, through which neighbouring countries connect their power grids into a single transmission network. An
1 A grey bullet indicates that progress could not be measured.2 A yellow bullet indicates that Bank operations achieved 60–94% of their targets.3 A green bullet indicates that Bank operations achieved 95% or more of their targets.
One-stop border posts have proved an effective means of!bringing down the costs of cross-border trade
In Africa the cost of trading across borders is the highest in the world. Much of this cost is caused by bureaucratic inefficiencies at border crossings. To address this, a pioneering one-stop border post was developed at Chirundu, on the Zimbabwe-Zambia border. In a model that is being widely emulated, it offers a single window for basic services, significantly decreasing waiting time. The Southern Africa region has 35!major border crossings, 16 of which are being considered for one-stop border posts in the coming years.
Box 2.3 Soft infrastructure to break down barriers
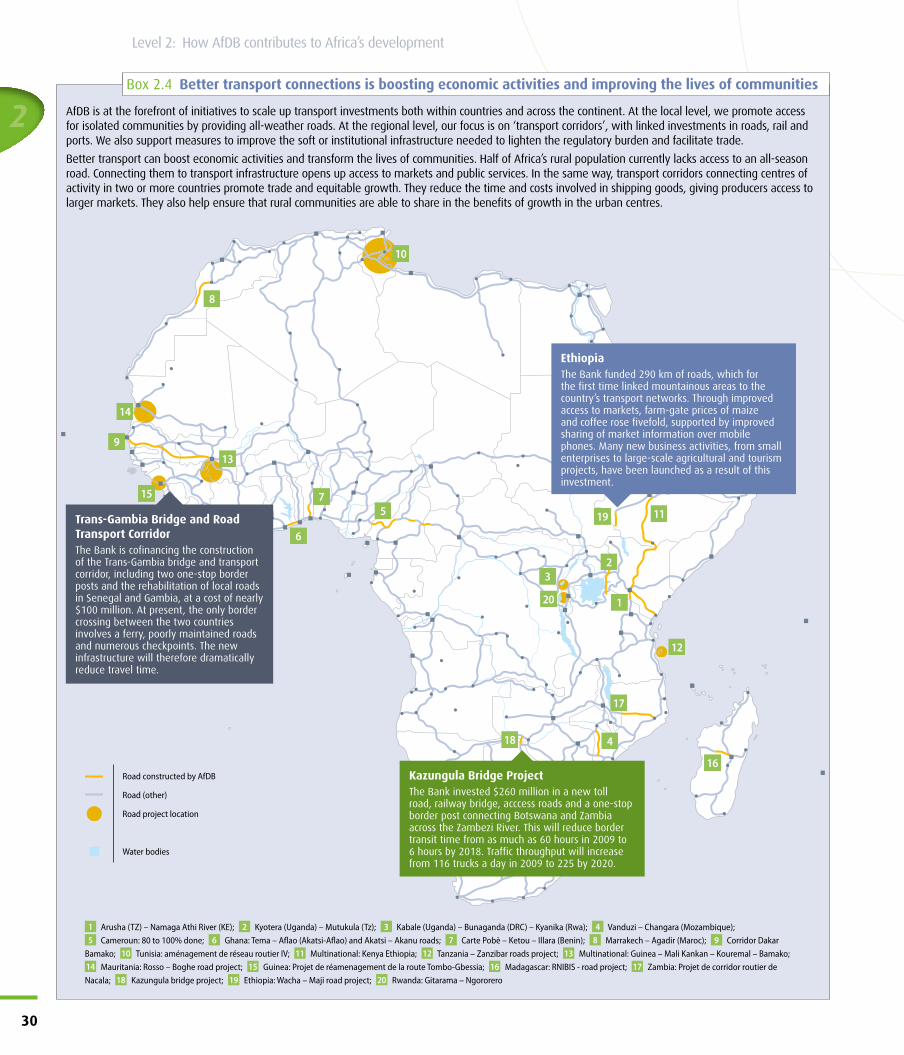
2
30
Level 2: How AfDB contributes to!Africa’s development
Box 2.4 Better transport connections is boosting economic activities and improving the lives of communities
10
14
15
139
8
1119
12
17
16
18
20
6
75
23
1
4
AfDB is at the forefront of initiatives to scale up transport investments both within countries and across the continent. At the local level, we promote access for isolated communities by providing all-weather roads. At the regional level, our focus is on ‘transport corridors’, with linked investments in roads, rail and ports. We also support measures to improve the soft or institutional infrastructure needed to lighten the regulatory burden and facilitate trade.
Better transport can boost economic activities and transform the lives of communities. Half of Africa’s rural population currently lacks access to an all-season road. Connecting them to transport infrastructure opens up access to markets and public services. In the same way, transport corridors connecting centres of activity in two or more countries promote trade and equitable growth. They reduce the time and costs involved in shipping goods, giving producers access to larger markets. They also help ensure that rural communities are able to share in the benefits of growth in the urban centres.
EthiopiaThe Bank funded 290!km of roads, which for the first time linked mountainous areas to the country’s transport networks. Through improved access to markets, farm-gate prices of maize and coffee rose fivefold, supported by improved sharing of market information over mobile phones. Many new business activities, from small enterprises to large-scale agricultural and tourism projects, have been launched as a result of this investment.
Trans-Gambia Bridge and Road Transport CorridorThe Bank is cofinancing the construction of the Trans-Gambia bridge and transport corridor, including two one-stop border posts and the rehabilitation of local roads in Senegal and Gambia, at a cost of nearly $100!million. At present, the only border crossing between the two countries involves a ferry, poorly maintained roads and numerous checkpoints. The new infrastructure will therefore dramatically reduce travel time.
Kazungula Bridge ProjectThe Bank invested $260!million in a new toll road, railway bridge, acccess roads and a one-stop border post connecting Botswana and Zambia across the Zambezi River. This will reduce border transit time from as much as 60 hours in 2009 to 6!hours by 2018. Traffic throughput will increase from 116!trucks a day in 2009 to 225 by 2020.
1 Arusha (TZ) – Namaga Athi River (KE); 2 Kyotera (Uganda) – Mutukula (Tz); 3 Kabale (Uganda) – Bunaganda (DRC) – Kyanika (Rwa); 4 Vanduzi – Changara (Mozambique); 5 Cameroun: 80 to 100% done; 6 Ghana: Tema – A!ao (Akatsi-A!ao) and Akatsi – Akanu roads; 7 Carte Pobè – Ketou – Illara (Benin); 8 Marrakech – Agadir (Maroc); 9 Corridor Dakar
Bamako; 10 Tunisia: aménagement de réseau routier IV; 11 Multinational: Kenya Ethiopia; 12 Tanzania – Zanzibar roads project; 13 Multinational: Guinea – Mali Kankan – Kouremal – Bamako; 14 Mauritania: Rosso – Boghe road project; 15 Guinea: Projet de réamenagement de la route Tombo-Gbessia; 16 Madagascar: RNIBIS - road project; 17 Zambia: Projet de corridor routier de Nacala; 18 Kazungula bridge project; 19 Ethiopia: Wacha – Maji road project; 20 Rwanda: Gitarama – Ngororero
Road constructed by AfDB
Road (other)
Road project location
Water bodies
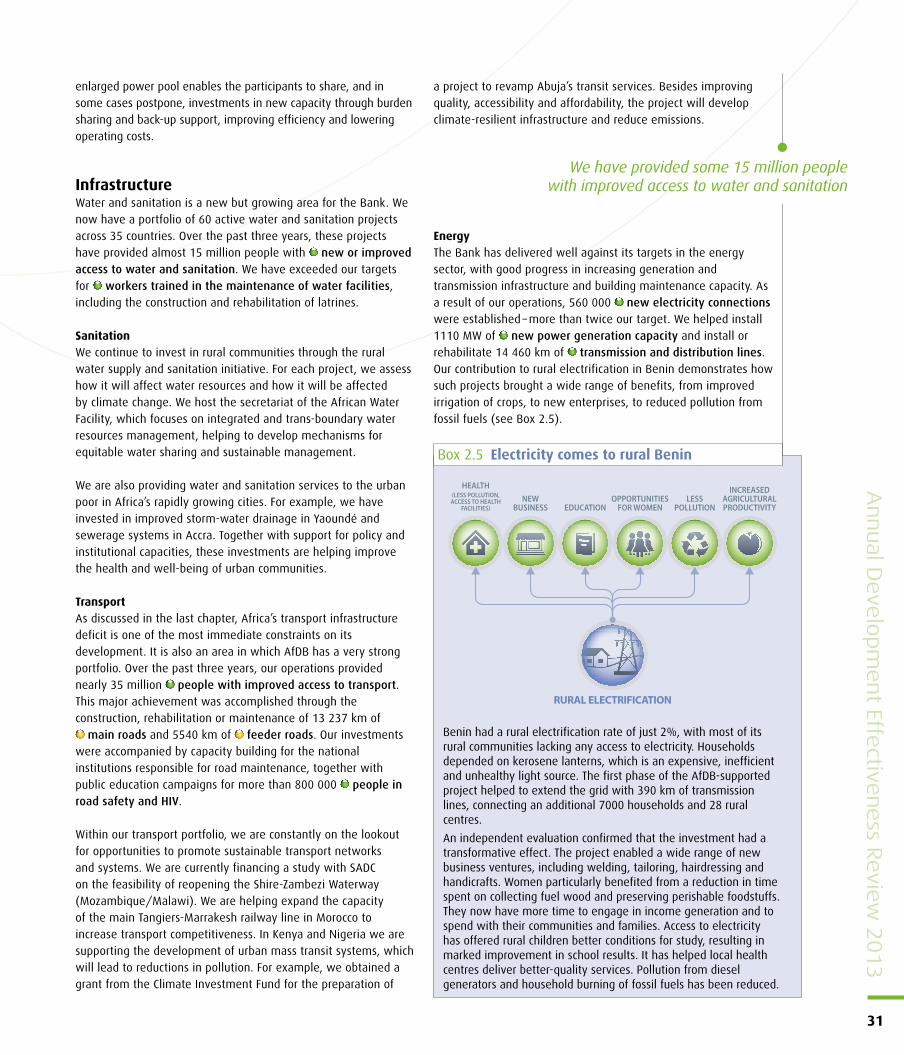
Annual D
evelo
pm
ent Effe
ctiveness R
eview 2
013
31
enlarged power pool enables the participants to share, and in some cases postpone, investments in new capacity through burden sharing and back-up support, improving efficiency and lowering operating costs.
InfrastructureWater and sanitation is a new but growing area for the Bank. We now have a portfolio of 60!active water and sanitation projects across 35!countries. Over the past three years, these projects have provided almost 15!million people with new or improved access to water and sanitation. We have exceeded our targets for workers trained in the maintenance of water facilities, including the construction and rehabilitation of latrines.
SanitationWe continue to invest in rural communities through the rural water supply and sanitation initiative. For each project, we assess how it will affect water resources and how it will be affected by climate change. We host the secretariat of the African Water Facility, which focuses on integrated and trans-boundary water resources management, helping to develop mechanisms for equitable water sharing and sustainable management.
We are also providing water and sanitation services to the urban poor in Africa’s rapidly growing cities. For example, we have invested in improved storm-water drainage in Yaoundé and sewerage systems in Accra. Together with support for policy and institutional capacities, these investments are helping improve the health and well-being of urban communities.
TransportAs discussed in the last chapter, Africa’s transport infrastructure deficit is one of the most immediate constraints on its development. It is also an area in which AfDB has a very strong portfolio. Over the past three years, our operations provided nearly 35!million people with improved access to transport. This major achievement was accomplished through the construction, rehabilitation or maintenance of 13!237!km of
main roads and 5540!km of feeder roads. Our investments were accompanied by capacity building for the national institutions responsible for road maintenance, together with public education campaigns for more than 800!000 people in road safety and HIV.
Within our transport portfolio, we are constantly on the lookout for opportunities to promote sustainable transport networks and systems. We are currently financing a study with SADC on the feasibility of reopening the Shire-Zambezi Waterway (Mozambique/Malawi). We are helping expand the capacity of the main Tangiers-Marrakesh railway line in Morocco to increase transport competitiveness. In Kenya and Nigeria we are supporting the development of urban mass transit systems, which will lead to reductions in pollution. For example, we obtained a grant from the Climate Investment Fund for the preparation of
a project to revamp Abuja’s transit services. Besides improving quality, accessibility and affordability, the project will develop climate-resilient infrastructure and reduce emissions.
EnergyThe Bank has delivered well against its targets in the energy sector, with good progress in increasing generation and transmission infrastructure and building maintenance capacity. As a result of our operations, 560!000 new electricity connections were established – more than twice our target. We helped install 1110!MW of new power generation capacity and install or rehabilitate 14!460!km of transmission and distribution lines. Our contribution to rural electrification in Benin demonstrates how such projects brought a wide range of benefits, from improved irrigation of crops, to new enterprises, to reduced pollution from fossil fuels (see Box!2.5).
We have provided some 15 million people with improved access to water and sanitation
Box 2.5 Electricity comes to rural Benin
Benin had a rural electrification rate of just 2%, with most of its rural communities lacking any access to electricity. Households depended on kerosene lanterns, which is an expensive, inefficient and unhealthy light source. The first phase of the AfDB-supported project helped to extend the grid with 390!km of transmission lines, connecting an additional 7000!households and 28!rural centres.
An independent evaluation confirmed that the investment had a transformative effect. The project enabled a wide range of new business ventures, including welding, tailoring, hairdressing and handicrafts. Women particularly benefited from a reduction in time spent on collecting fuel wood and preserving perishable foodstuffs. They now have more time to engage in income generation and to spend with their communities and families. Access to electricity has offered rural children better conditions for study, resulting in marked improvement in school results. It has helped local health centres deliver better-quality services. Pollution from diesel generators and household burning of fossil fuels has been reduced.
RURAL ELECTRIFICATION
HEALTH!LESS POLLUTION,ACCESS TO HEALTH
FACILITIES"NEW
BUSINESS EDUCATIONOPPORTUNITIES
FOR WOMEN
INCREASEDAGRICULTURALPRODUCTIVITY
LESSPOLLUTION
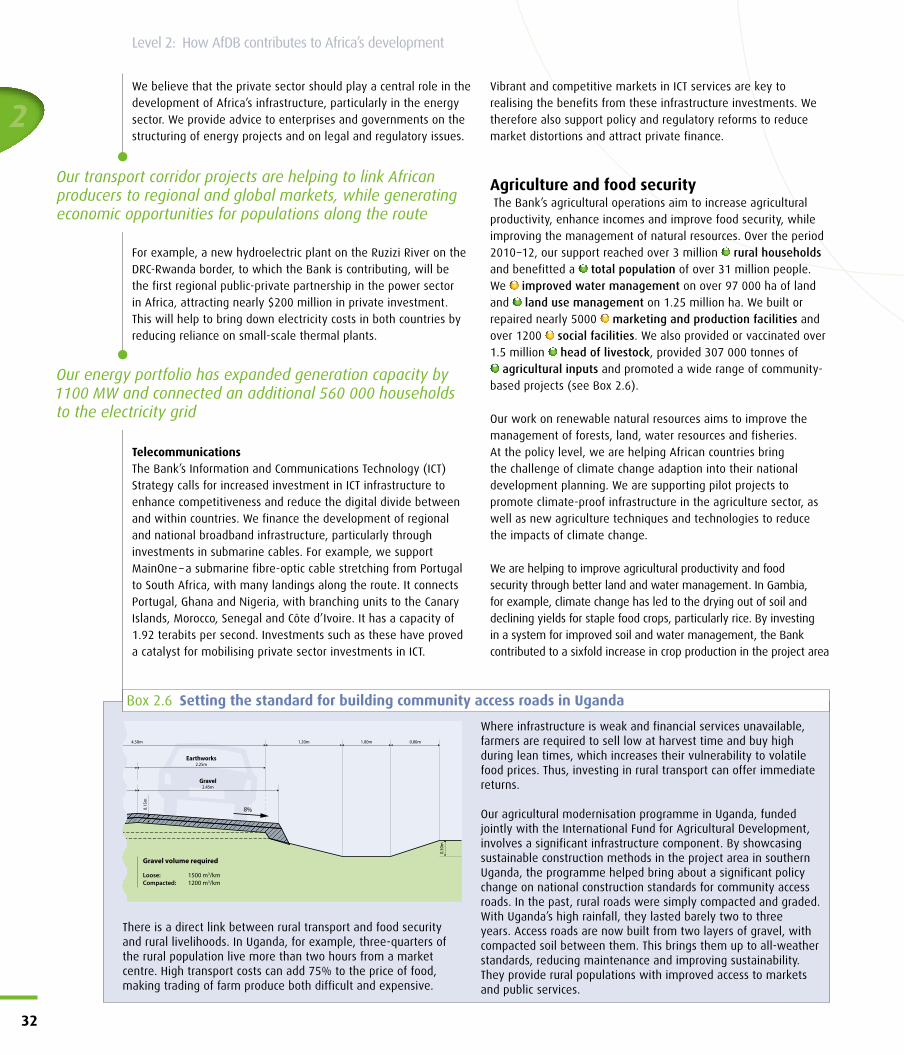
2
32
Level 2: How AfDB contributes to!Africa’s development
We believe that the private sector should play a central role in the development of Africa’s infrastructure, particularly in the energy sector. We provide advice to enterprises and governments on the structuring of energy projects and on legal and regulatory issues.
For example, a new hydroelectric plant on the Ruzizi River on the DRC-Rwanda border, to which the Bank is contributing, will be the first regional public-private partnership in the power sector in Africa, attracting nearly $200 million in private investment. This will help to bring down electricity costs in both countries by reducing reliance on small-scale thermal plants.
TelecommunicationsThe Bank’s Information and Communications Technology (ICT) Strategy calls for increased investment in ICT infrastructure to enhance competitiveness and reduce the digital divide between and within countries. We finance the development of regional and national broadband infrastructure, particularly through investments in submarine cables. For example, we support MainOne – a submarine fibre-optic cable stretching from Portugal to South Africa, with many landings along the route. It connects Portugal, Ghana and Nigeria, with branching units to the Canary Islands, Morocco, Senegal and Côte d’Ivoire. It has a capacity of 1.92!terabits per second. Investments such as these have proved a catalyst for mobilising private sector investments in ICT.
Vibrant and competitive markets in ICT services are key to realising the benefits from these infrastructure investments. We therefore also support policy and regulatory reforms to reduce market distortions and attract private finance.
Agriculture and food security The Bank’s agricultural operations aim to increase agricultural productivity, enhance incomes and improve food security, while improving the management of natural resources. Over the period 2010–12, our support reached over 3!million rural households and benefitted a total population of over 31!million!people. We improved water management on over 97!000!ha of land and land use management on 1.25!million!ha. We built or repaired nearly 5000! marketing and production facilities and over 1200! social facilities. We also provided or vaccinated over 1.5!million head of livestock, provided 307!000!tonnes of
agricultural inputs and promoted a wide range of community-based projects (see Box 2.6).
Our work on renewable natural resources aims to improve the management of forests, land, water resources and fisheries. At the policy level, we are helping African countries bring the challenge of climate change adaption into their national development planning. We are supporting pilot projects to promote climate-proof infrastructure in the agriculture sector, as well as new agriculture techniques and technologies to reduce the impacts of climate change.
We are helping to improve agricultural productivity and food security through better land and water management. In Gambia, for example, climate change has led to the drying out of soil and declining yields for staple food crops, particularly rice. By investing in a system for improved soil and water management, the Bank contributed to a sixfold increase in crop production in the project area
Our transport corridor projects are helping to link African producers to regional and global markets, while generating economic opportunities for populations along the route
Our energy portfolio has expanded generation capacity by 1100!MW and connected an additional 560!000!households to the electricity grid
Box 2.6 Setting the standard for building community access roads in Uganda
There is a direct link between rural transport and food security and rural livelihoods. In Uganda, for example, three-quarters of the rural population live more than two hours from a market centre. High transport costs can add 75% to the price of food, making trading of farm produce both difficult and expensive.
Where infrastructure is weak and financial services unavailable, farmers are required to sell low at harvest time and buy high during lean times, which increases their vulnerability to volatile food prices. Thus, investing in rural transport can offer immediate returns.
Our agricultural modernisation programme in Uganda, funded jointly with the International Fund for Agricultural Development, involves a significant infrastructure component. By showcasing sustainable construction methods in the project area in southern Uganda, the programme helped bring about a significant policy change on national construction standards for community access roads. In the past, rural roads were simply compacted and graded. With Uganda’s high rainfall, they lasted barely two to three years. Access roads are now built from two layers of gravel, with compacted soil between them. This brings them up to all-weather standards, reducing maintenance and improving sustainability. They provide rural populations with improved access to markets and public services.
8%
Gravel2.45m
Earthworks2.25m
4.50m 1.20m 1.00m 0.80m
0.30
m
0.15
m
Gravel volume required
Loose:Compacted:
1500 m3/km1200 m3/km
Annual D
evelo
pm
ent Effe
ctiveness R
eview 2
013
33
over four years. In Cape Verde, we helped to restore watersheds, rehabilitate agricultural land and improve the water retention in a particularly vulnerable ecosystem. Our activities were accompanied by education programmes in soil conservation, sustainable farming practices and agro-processing.
Alongside these operations, we have worked with a range of partners to share knowledge and best practice through multi-stakeholder knowledge platforms such as TerrAfrica (platform for sustainable land management), the Climate for Africa’s Development Program and the Land Policy Initiative consortium. We manage the Congo Basin Forest Fund, which helps governments and communities to manage and preserve their forests.
Finally, we have been helping our regional member countries to deal with the impact of high and fluctuating food prices. The Africa Food Crisis Response helps reduce the vulnerability of poor people through investments in agricultural productivity and improved food markets. It also addresses agricultural policy and marketing constraints, while providing a better environment for the private sector. Under this instrument, the Bank has released $215!million to 18!countries.
Gender and human developmentBuilding skills, creating jobs, providing inclusive and equitable services and developing safety nets to protect the poorest against shocks are key areas of our focus. We work to improve access, quality, equity and voice in public service delivery, particularly for women and youth.
Through our investments in education, science and technology, we have built or rehabilitated 4500 classrooms and have provided more than 10!million textbooks and teaching materials, which was well in excess of our target. Overall, we enabled over 656!000 new enrolments and supported nearly 4.2 million current students.
We continue to support the African Virtual University, which promotes access to quality tertiary education across the continent. This exciting venture helps to foster the integration of regional labour markets and promotes the participation of female students in maths and science courses.
With more than 40!million young Africans unemployed, youth employment has emerged as one of the most pressing development challenges of our time. Our extensive experience in the higher education and training fields makes us well equipped to contribute. With the International Labour Organisation, UNECA and the African Union, we helped to create the Joint Youth Employment Initiative for Africa. In 2013, we organised a regional conference in Dakar to examine the state of knowledge on employment creation and showcase effective programmes and policies. Box!2.7 describes our work in this area.
Our investments in the health sector have provided nearly 27!million people with access to better health services. This has been accomplished through building or equipping 580! primary, secondary and tertiary health centres, training over 35!000 health workers and holding 8700 health training and education sessions. These results have all been delivered to plan.
One example of our health sector work is a Kenyan rural health project, which combined investments in rural health centres with support to help schools harvest rainwater and build latrines. Improved water and sanitation in schools has reduced both disease and absenteeism, and some schools have also put in place feeding programmes and boarding accommodation for girls. Our Senegal health project used local nongovernmental organisations to build capacity and deliver training to health services and communities, since they were better placed to deliver to remote communities with specific cultural contexts.
Gender equality is a theme running through these and many of our operations. In the health sector, we promote women’s access to health care through a range of measures, including training for female health workers. Our community-based agriculture and microfinance programmes have a strong focus on women.
Our extensive experience with higher education and training makes us well placed to address youth unemployment,
which has emerged as one of Africa’s most pressing development challenges
Youth unemployment is one of the most pressing development issues facing Africa today. Among Africa’s unemployed people, 60% are from 16 to 25!years of age. Youth unemployment is twice the average rate. And most of the young people who have jobs work in low-productivity roles in the informal sector with few prospects for advancement. The problem is particularly acute in middle-income countries, with 23% youth unemployment in North Africa and 48% in South Africa. In fragile contexts, the lack of economic opportunities for young people can be a driver of instability.
AfDB has adopted youth employment as a major theme. We are contributing to the Joint Youth Employment Initiative for Africa with a programme of research and analysis on policy responses and labour market reforms. We have used our convening power to bring together African institutions and development partners, most recently at a Dakar regional conference on youth employment. In Tunisia, where social exclusion and youth unemployment were among the drivers of the Jasmine Revolution, we are leading a multi-donor initiative called Souk-at-Tanmia, which is providing training and grants to young people for new business enterprises, matching them with financial support from the private sector. In 2013 this innovative pilot will be replicated in various countries, including Zambia, Egypt and Senegal.
Box 2.7 Creating jobs for Africa’s youth
2
34
Level 2: How AfDB contributes to!Africa’s development
Governance and transparencyWithout strong institutions, Africa will be unable to develop and implement policies to promote sustainable growth and development. African states also need to be responsive and accountable to their populations, to ensure that they promote the public good and that all citizens share the benefits of growth in an inclusive manner, both now and into the future.
Governance remains a core priority for the Bank. In the governance arena, the Bank focuses on public finances and the equitable delivery of public services (see Box!2.8). Our main focus, in line with the Bank’s comparative advantage, is on economic and financial governance. We aim to build state capacity and increase transparency and accountability in managing public resources, including public finances and natural resources. For example, we have helped Benin develop its legislative framework for public financial management and implement results-based budgeting. We supported Liberia with strengthening its public financial management, including internal and external audit, and we worked with DRC to improve its tax administration at both central and regional levels.
In recognition of the importance of the extractive industries to equitable growth and development, in 2012, the Bank supported the Extractive Industries Transparency Initiative (EITI) in eight countries through budget support programmes (Central African Republic, Guinea, Sierra Leone and Tanzania), institutional support programmes (Guinea, Liberia, Sierra Leone and Togo) and governance trust funds (Zambia and Congo). All these countries have worked to improve their management of the extractive
sectors along the entire value chain, from legal and institutional reforms to social and environmental safeguards, community rights, mine closure and site reclamation.
We provided additional help to Sierra Leone to reform its governance of mineral resources and to Guinea Bissau to develop a policy and regulatory framework to govern the extractive industry. More broadly, we have invested in the African Legal Support Facility, which helps countries to modernise their legislation for natural resource extraction and provides them with support in negotiating contracts with international companies.
Fragile and conflict-affected countriesThe Bank created its Fragile States Facility to channel additional resources to fragile states. It is a fast and flexible disbursement mechanism designed to help fragile states consolidate peace, stabilise their economies and lay the foundation for sustainable poverty reduction. Through a number of windows, we provide additional financing for governance, capacity building and reconstruction of basic infrastructure; clearing debt arrears to enable fragile states to normalise their relations with the international community; and targeted support in the form of critical expert advice and services. We have allocated 7.5% of African Development Fund (ADF) resources to this Facility, which is available to fragile states over and above their regular allocation.
In fragile states, we have focused in particular on the agriculture and infrastructure sectors, and on governance. Countries emerging from protracted conflict generally face massive infrastructure deficits as a result of war damage and years of neglect. In all countries, the Bank gives high priority – over 40% of its total lending – to infrastructure development. In fragile states, we promote inclusive growth by linking rural areas to growth centres and by opening up national and regional markets and trade routes. We have built or rehabilitated over 850 km of feeder roads in fragile states, helping to link agricultural producers to their markets.
Because Africa’s fragile states depend heavily on food imports, they are vulnerable to increases in commodity prices. In protracted conflicts, disruption to agriculture can lead to widespread food insecurity and hunger, at great cost to the population. We have helped boost agricultural productivity by introducing better land use practices on 26!000!ha, constructing more than 1100!rural markets and storage centres and drilling or repairing 3000!boreholes. We have trained more than 3200!farmers, of whom 60% were women, in agriculture technologies and land use. We financed the preparation of the Horn of Africa Drought Resilience and Sustainable Livelihoods Project, which will benefit 12!million people in Djibouti, Eritrea, Somalia, Sudan and South Sudan. The project will help to mitigate the impact of recurrent droughts by building long-term resilience, stabilising the natural environment and restoring livelihoods.
Many of our AfDB gender initiatives are designed to deliver immediate benefits for women and girls through concrete investments. Others work at the national level, by influencing government policies and strategies. In Ghana, one of the goals for our budget support operation has been to ensure that gender equality is mainstreamed into the national development strategy. A key initiative was the introduction of gender-responsive budgeting. By introducing gender-sensitive indicators, we helped the government to identify whether the benefits of development spending were being shared equitably among women and men. The programme succeeded ensuring budget allocations were more equitably shared by reducing gender disparities in the budget from 25% in 2008 to just 5% by the end of 2010.
We continue to face challenges, however, in capturing the true impact of our operations on men and women, and we need to do more to monitor sex-disaggregated data.
Box 2.8 Sharing budgets equitably between men and!women
We are helping our client countries to be more transparent and accountable in managing their public finances, including their natural resource revenues
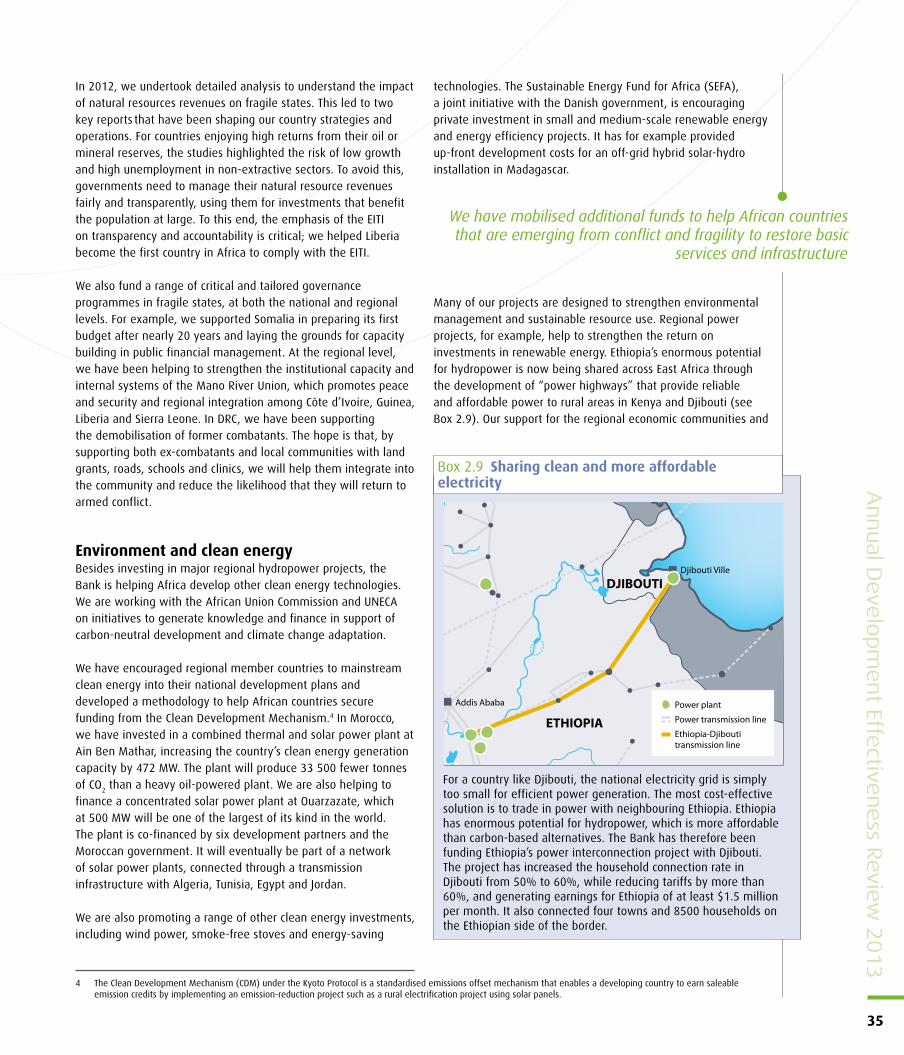
Annual D
evelo
pm
ent Effe
ctiveness R
eview 2
013
35
In 2012, we undertook detailed analysis to understand the impact of natural resources revenues on fragile states. This led to two key reports that have been shaping our country strategies and operations. For countries enjoying high returns from their oil or mineral reserves, the studies highlighted the risk of low growth and high unemployment in non-extractive sectors. To avoid this, governments need to manage their natural resource revenues fairly and transparently, using them for investments that benefit the population at large. To this end, the emphasis of the EITI on transparency and accountability is critical; we helped Liberia become the first country in Africa to comply with the EITI.
We also fund a range of critical and tailored governance programmes in fragile states, at both the national and regional levels. For example, we supported Somalia in preparing its first budget after nearly 20!years and laying the grounds for capacity building in public financial management. At the regional level, we have been helping to strengthen the institutional capacity and internal systems of the Mano River Union, which promotes peace and security and regional integration among Côte d’Ivoire, Guinea, Liberia and Sierra Leone. In DRC, we have been supporting the demobilisation of former combatants. The hope is that, by supporting both ex-combatants and local communities with land grants, roads, schools and clinics, we will help them integrate into the community and reduce the likelihood that they will return to armed conflict.
Environment and clean energyBesides investing in major regional hydropower projects, the Bank is helping Africa develop other clean energy technologies. We are working with the African Union Commission and UNECA on initiatives to generate knowledge and finance in support of carbon-neutral development and climate change adaptation.
We have encouraged regional member countries to mainstream clean energy into their national development plans and developed a methodology to help African countries secure funding from the Clean Development Mechanism.4 In Morocco, we have invested in a combined thermal and solar power plant at Ain Ben Mathar, increasing the country’s clean energy generation capacity by 472!MW. The plant will produce 33!500!fewer tonnes of CO2 than a heavy oil-powered plant. We are also helping to finance a concentrated solar power plant at Ouarzazate, which at 500 MW will be one of the largest of its kind in the world. The plant is co-financed by six development partners and the Moroccan government. It will eventually be part of a network of solar power plants, connected through a transmission infrastructure with Algeria, Tunisia, Egypt and Jordan.
We are also promoting a range of other clean energy investments, including wind power, smoke-free stoves and energy-saving
technologies. The Sustainable Energy Fund for Africa (SEFA), a joint initiative with the Danish government, is encouraging private investment in small and medium-scale renewable energy and energy efficiency projects. It has for example provided up-front development costs for an off-grid hybrid solar-hydro installation in Madagascar.
Many of our projects are designed to strengthen environmental management and sustainable resource use. Regional power projects, for example, help to strengthen the return on investments in renewable energy. Ethiopia’s enormous potential for hydropower is now being shared across East Africa through the development of “power highways” that provide reliable and affordable power to rural areas in Kenya and Djibouti (see Box!2.9). Our support for the regional economic communities and
4 The Clean Development Mechanism (CDM) under the Kyoto Protocol is a standardised emissions offset mechanism that enables a developing country to earn saleable emission credits by implementing an emission-reduction project such as a rural electrification project using solar panels.
We have mobilised additional funds to help African countries that are emerging from conflict and fragility to restore basic
services and infrastructure
Box 2.9 Sharing clean and more affordable electricity
For a country like Djibouti, the national electricity grid is simply too small for efficient power generation. The most cost-effective solution is to trade in power with neighbouring Ethiopia. Ethiopia has enormous potential for hydropower, which is more affordable than carbon-based alternatives. The Bank has therefore been funding Ethiopia’s power interconnection project with Djibouti. The project has increased the household connection rate in Djibouti from 50% to 60%, while reducing tariffs by more than 60%, and generating earnings for Ethiopia of at least $1.5!million per month. It also connected four towns and 8500!households on the Ethiopian side of the border.
ETHIOPIA
DJIBOUTIDjibouti Ville
Addis Ababa Power plantPower transmission lineEthiopia-Djiboutitransmission line
2
36
Level 2: How AfDB contributes to!Africa’s development
other inter-governmental mechanisms is building their capacity to manage shared environmental resources. Africa’s most important water resources – the Nile Basin, Lake Victoria and Lake Chad – are shared by two or more countries. We are helping to resolve some of the complex governance challenges that this poses.
ConclusionAcross the many sectors and thematic areas of our operations, it is clear that this has been a strong year for the African Development Bank. We have achieved or surpassed the majority of our targets, making an important contribution to Africa’s development.
Through the construction of power, transport and water infrastructure, we delivered concrete development results to over 50!million Africans. We are helping to connect African businesses to their suppliers and markets, in Africa and around the world. We are working with the regional economic communities to dismantle barriers between countries and harmonise policies and regulations. Our work on agriculture is helping boost food security and rural incomes, while our support for higher and vocational education helps address the challenge of youth unemployment.
We have helped our regional member countries achieve substantial improvements in economic governance, and have improved the prospects for lasting peace and prosperity among countries emerging from conflict and fragility.
Our portfolio is increasingly tailored to support sustainable growth pathways. We are investing in Africa’s energy potential and in the development of regional mechanisms to manage cross-boundary resources. We are working to ensure the sustainable use of land, forests and other resources, and to minimise waste and pollution. Our infrastructure investments are being climate-proofed to ensure sustainable results. We are helping African governments, businesses, communities and households improve their resilience in the face of a changing climate.
To strengthen our engagement in this area, we are investing in research and analysis to generate new policies and approaches. We are helping our partner countries integrate resilience and sustainability into their national development policies and express their collective voice in international policy forums. We are investing almost $10!billion in climate change programmes, while helping African countries access additional funds, both from international sources and from the private sector.
Yet we recognise that these actions are just the beginning. With our member countries and our international partners, we still have much work to do in helping Africa achieve sustainable transformation
We are helping to finance one of the world’s largest concentrated solar plants in Morocco, which will provide clean energy across North Africa

Annual D
evelo
pm
ent Effe
ctiveness R
eview 2
013
37
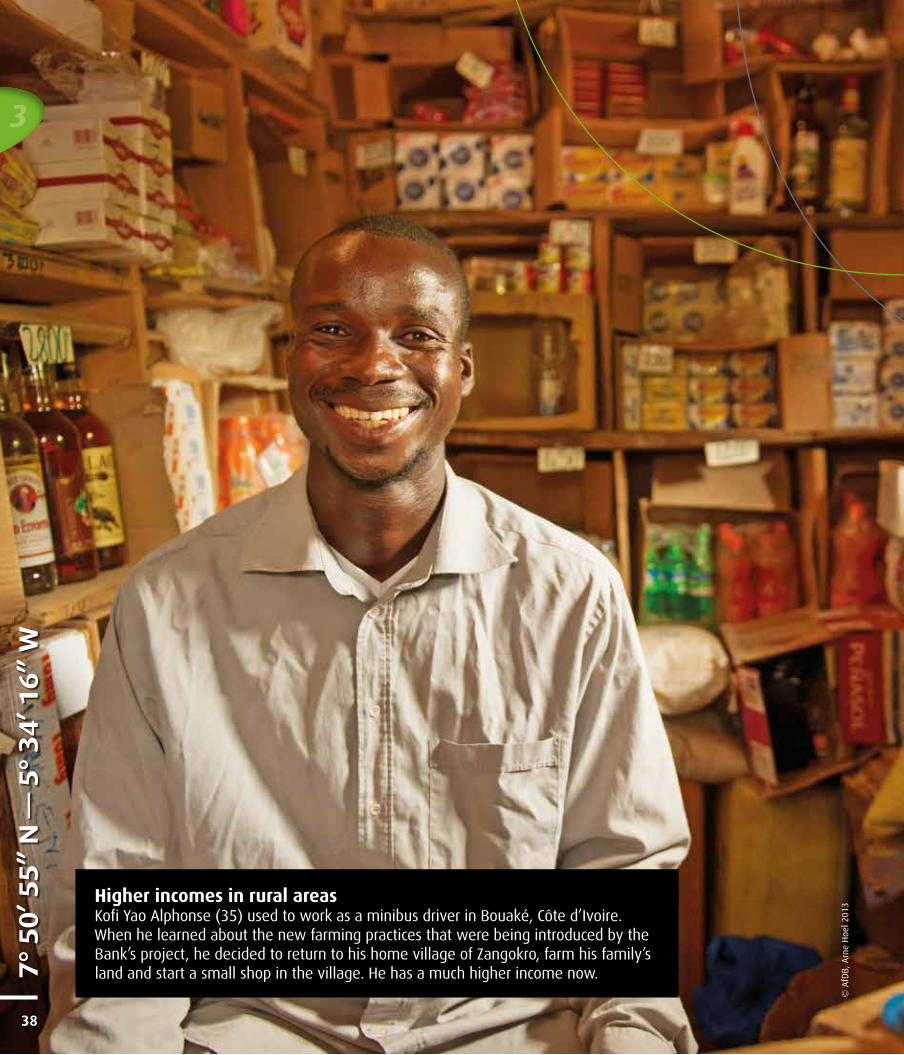
Higher incomes in rural areasKofi Yao Alphonse (35) used to work as a minibus driver in Bouaké, Côte d’Ivoire. When he learned about the new farming practices that were being introduced by the Bank’s project, he decided to return to his home village of Zangokro, farm his family’s land and start a small shop in the village. He has a much higher income now.
© A
fDB,
Arn
e H
oel 2
013
7°
50’ 5
5”
N —
5°
34’ 1
6”
W
38
3
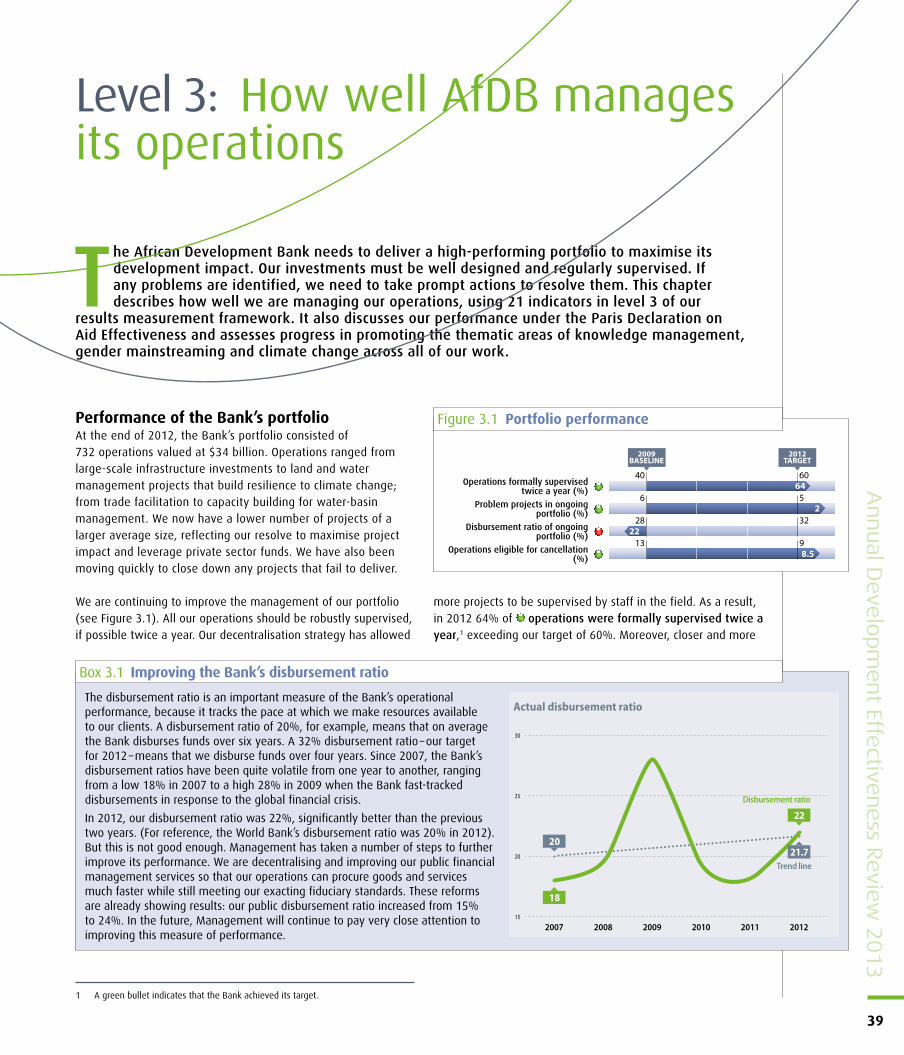
Performance of the Bank’s portfolioAt the end of 2012, the Bank’s portfolio consisted of 732!operations valued at $34!billion. Operations ranged from large-scale infrastructure investments to land and water management projects that build resilience to climate change; from trade facilitation to capacity building for water-basin management. We now have a lower number of projects of a larger average size, reflecting our resolve to maximise project impact and leverage private sector funds. We have also been moving quickly to close down any projects that fail to deliver.
We are continuing to improve the management of our portfolio (see Figure!3.1). All our operations should be robustly supervised, if possible twice a year. Our decentralisation strategy has allowed
more projects to be supervised by staff in the field. As a result, in 2012 64% of operations were formally supervised twice a year,1 exceeding our target of 60%. Moreover, closer and more
Level 3: How well AfDB manages its operations
1 A green bullet indicates that the Bank achieved its target.
The African Development Bank needs to deliver a high-performing portfolio to maximise its development impact. Our investments must be well designed and regularly supervised. If any problems are identified, we need to take prompt actions to resolve them. This chapter describes how well we are managing our operations, using 21!indicators in level!3 of our
results measurement framework. It also discusses our performance under the Paris Declaration on Aid!Effectiveness and assesses progress in promoting the thematic areas of knowledge management, gender mainstreaming and climate change across all of our work.
Annual D
evelo
pm
ent Effe
ctiveness R
eview 2
013
39
Figure 3.1 Portfolio performance
40 60
6 5
28 32
13 9
2009BASELINE
2012TARGET
2
64
22
8.5
Operations formally supervised twice a year (%)
Problem projects in ongoing portfolio (%)
Disbursement ratio of ongoing portfolio (%)
Operations eligible for cancellation (%)
Box 3.1 Improving the Bank’s disbursement ratio
Actual disbursement ratio
15
20
25
30
201220112010200920082007
18
21.720
22
Trend line
Disbursement ratio
The disbursement ratio is an important measure of the Bank’s operational performance, because it tracks the pace at which we make resources available to our clients. A disbursement ratio of 20%, for example, means that on average the Bank disburses funds over six years. A 32% disbursement ratio – our target for 2012 – means that we disburse funds over four years. Since 2007, the Bank’s disbursement ratios have been quite volatile from one year to another, ranging from a low 18% in 2007 to a high 28% in 2009 when the Bank fast-tracked disbursements in response to the global financial crisis.
In 2012, our disbursement ratio was 22%, significantly better than the previous two years. (For reference, the World Bank’s disbursement ratio was 20% in 2012). But this is not good enough. Management has taken a number of steps to further improve its performance. We are decentralising and improving our public financial management services so that our operations can procure goods and services much faster while still meeting our exacting fiduciary standards. These reforms are already showing results: our public disbursement ratio increased from 15% to 24%. In the future, Management will continue to pay very close attention to improving this measure of performance.
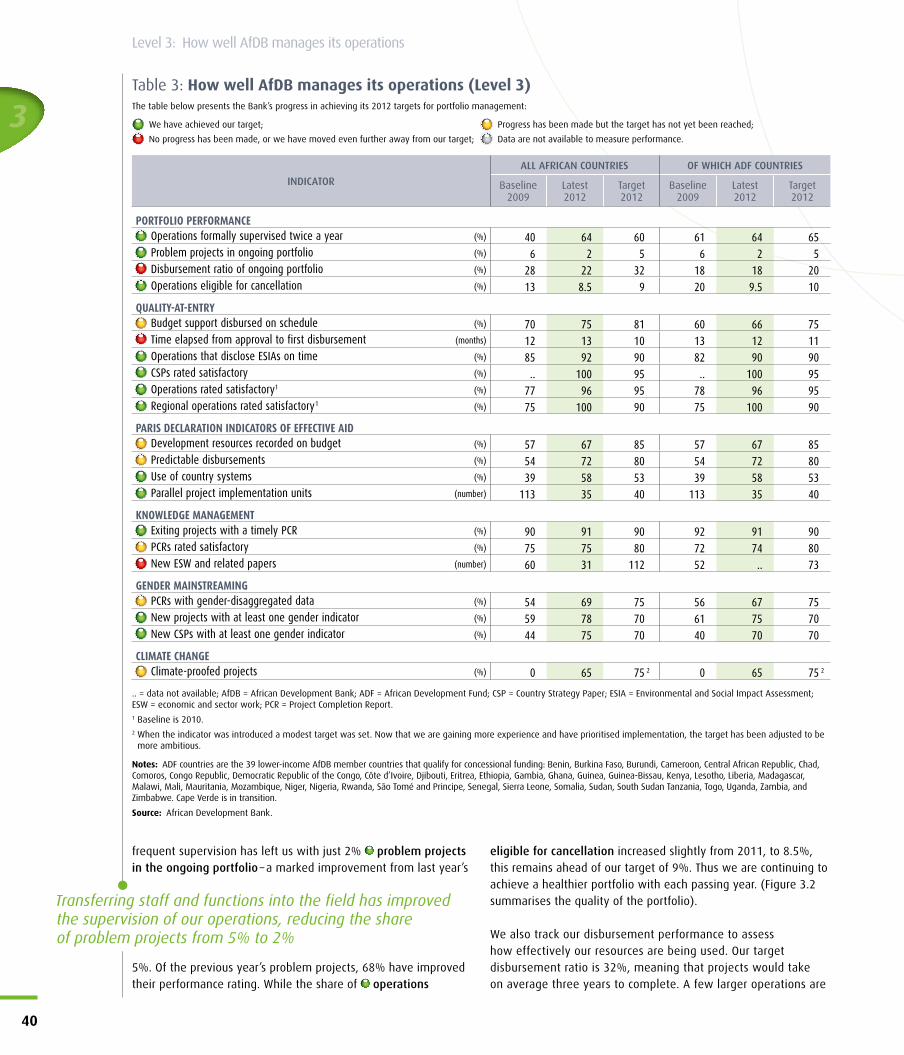
Table 3: How well AfDB manages its operations (Level 3)The table below presents the Bank’s progress in achieving its 2012 targets for portfolio management:
We have achieved our target; Progress has been made but the target has not yet been reached;
No progress has been made, or we have moved even further away from our target; Data are not available to measure performance.
INDICATORALL AFRICAN COUNTRIES OF WHICH ADF COUNTRIES
Baseline2009
Latest2012
Target2012
Baseline2009
Latest2012
Target2012
PORTFOLIO PERFORMANCEOperations formally supervised twice a year (%) 40 64 60 61 64 65Problem projects in ongoing portfolio (%) 6 2 5 6 2 5Disbursement ratio of ongoing portfolio (%) 28 22 32 18 18 20Operations eligible for cancellation (%) 13 8.5 9 20 9.5 10
QUALITY-AT-ENTRYBudget support disbursed on schedule (%) 70 75 81 60 66 75Time elapsed from approval to first disbursement (months) 12 13 10 13 12 11Operations that disclose ESIAs on time (%) 85 92 90 82 90 90CSPs rated satisfactory (%) .. 100 95 .. 100 95Operations rated satisfactory1 (%) 77 96 95 78 96 95Regional operations rated satisfactory1 (%) 75 100 90 75 100 90
PARIS DECLARATION INDICATORS OF EFFECTIVE AIDDevelopment resources recorded on budget (%) 57 67 85 57 67 85Predictable disbursements (%) 54 72 80 54 72 80Use of country systems (%) 39 58 53 39 58 53Parallel project implementation units (number) 113 35 40 113 35 40
KNOWLEDGE MANAGEMENTExiting projects with a timely PCR (%) 90 91 90 92 91 90PCRs rated satisfactory (%) 75 75 80 72 74 80New ESW and related papers (number) 60 31 112 52 .. 73
GENDER MAINSTREAMINGPCRs with gender-disaggregated data (%) 54 69 75 56 67 75New projects with at least one gender indicator (%) 59 78 70 61 75 70New CSPs with at least one gender indicator (%) 44 75 70 40 70 70
CLIMATE CHANGEClimate-proofed projects (%) 0 65 75 2 0 65 75 2
.. = data not available; AfDB = African Development Bank; ADF = African Development Fund; CSP = Country Strategy Paper; ESIA = Environmental and Social Impact Assessment; ESW = economic and sector work; PCR = Project Completion Report.1 Baseline is 2010. 2 When the indicator was introduced a modest target was set. Now that we are gaining more experience and have prioritised implementation, the target has been adjusted to be
more ambitious.
Notes: ADF countries are the 39!lower-income AfDB member countries that qualify for concessional funding: Benin, Burkina Faso, Burundi, Cameroon, Central African Republic, Chad, Comoros, Congo Republic, Democratic Republic of the Congo, Côte d’Ivoire, Djibouti, Eritrea, Ethiopia, Gambia, Ghana, Guinea, Guinea-Bissau, Kenya, Lesotho, Liberia, Madagascar, Malawi, Mali, Mauritania, Mozambique, Niger, Nigeria, Rwanda, São Tomé and Principe, Senegal, Sierra Leone, Somalia, Sudan, South Sudan Tanzania, Togo, Uganda, Zambia, and Zimbabwe. Cape Verde is in transition.
Source: African Development Bank.
3
40
Level 3: How well AfDB manages its operations
frequent supervision has left us with just 2% problem projects in the ongoing portfolio – a marked improvement from last year’s
5%. Of the previous year’s problem projects, 68% have improved their performance rating. While the share of operations
eligible for cancellation increased slightly from 2011, to 8.5%, this remains ahead of our target of 9%. Thus we are continuing to achieve a healthier portfolio with each passing year. (Figure!3.2 summarises the quality of the portfolio).
We also track our disbursement performance to assess how effectively our resources are being used. Our target disbursement ratio is 32%, meaning that projects would take on average three years to complete. A few larger operations are
Transferring staff and functions into the field has improved the supervision of our operations, reducing the share of!problem projects from 5% to 2%
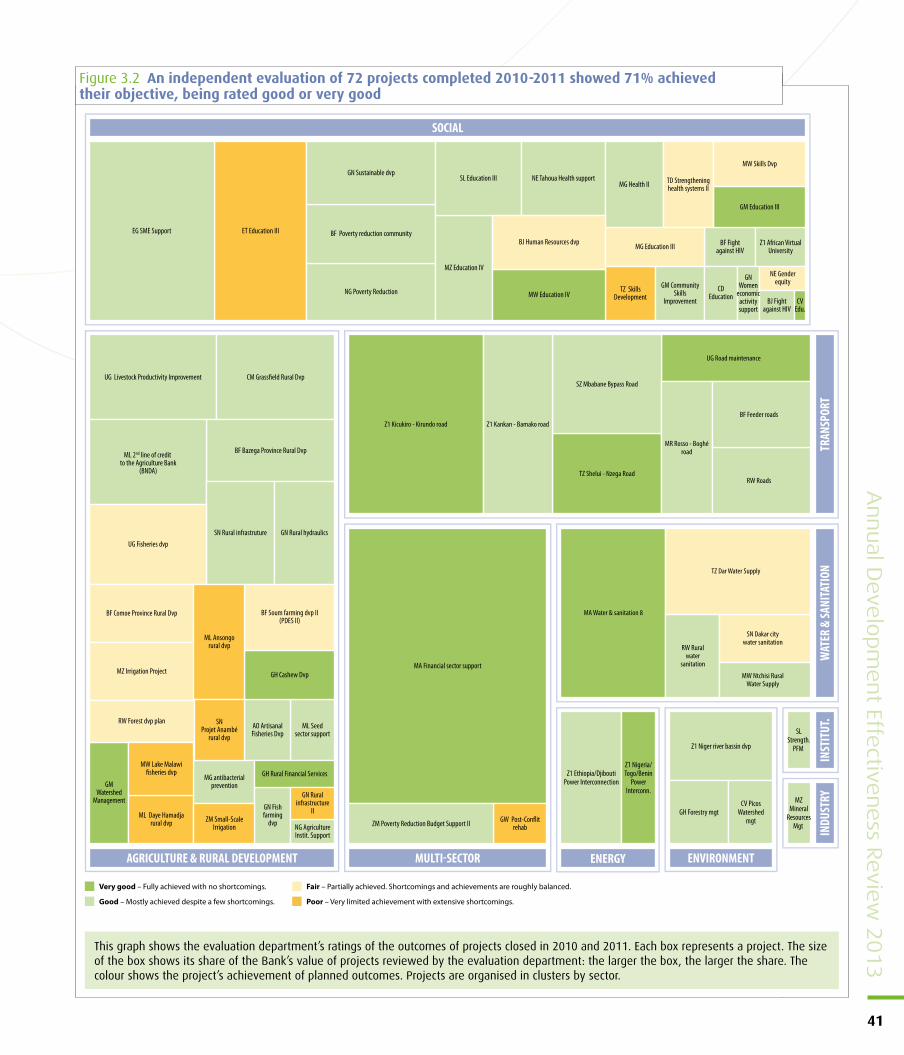
Annual D
evelo
pm
ent Effe
ctiveness R
eview 2
013
41
Figure 3.2 An independent evaluation of 72 projects completed 2010-2011 showed 71% achieved their!objective, being rated good or very good
SOCIAL
AGRICULTURE & RURAL DEVELOPMENT MULTI!SECTOR ENERGY
INST
ITUT
.IN
DUST
RY
ENVIRONMENT
TRAN
SPOR
TW
ATER
& SA
NITA
TION
EG SME Support ET Education III
GN Sustainable dvp
BF Poverty reduction community
NG Poverty Reduction
SL Education III
MZ Education IV
NE Tahoua Health supportMG Health II TD Strengthening
health systems II
MW Skills Dvp
GM Education III
BJ Human Resources dvp
MW Education IV
MG Education III BF Fightagainst HIV
Z1 African VirtualUniversity
TZ SkillsDevelopment
GM CommunitySkills
Improvement
CDEducation
GNWomen
economicactivitysupport
NE Genderequity
BJ Fightagainst HIV
CVEdu.
UG Livestock Productivity Improvement CM Grass!eld Rural Dvp
ML 2nd line of credit to the Agriculture Bank
(BNDA)
BF Bazega Province Rural Dvp
UG Fisheries dvpSN Rural infrastruture GN Rural hydraulics
BF Comoe Province Rural Dvp
MZ Irrigation Project
ML Ansongorural dvp
BF Soum farming dvp II(PDES II)
GH Cashew Dvp
RW Forest dvp plan SNProjet Anambé
rural dvpAO ArtisanalFisheries Dvp
ML Seedsector support
GH Rural Financial ServicesGM
WatershedManagement
MW Lake Malawi!sheries dvp
ML Daye Hamadjarural dvp
MG antibacterialprevention
ZM Small-ScaleIrrigation
GN Fishfarming
dvp
GN Ruralinfrastructure
II
NG AgricultureInstit. Support
Z1 Kicukiro - Kirundo road Z1 Kankan - Bamako road
SZ Mbabane Bypass Road
TZ Shelui - Nzega Road
UG Road maintenance
MR Rosso - Boghéroad
BF Feeder roads
RW Roads
MA Financial sector support
ZM Poverty Reduction Budget Support II GW Post-Con"itrehab
MA Water & sanitation 8
TZ Dar Water Supply
RW Ruralwater
sanitation
SN Dakar citywater sanitation
MW Ntchisi RuralWater Supply
Z1 Nigeria/Togo/Benin
PowerInterconn.
Z1 Ethiopia/DjiboutiPower Interconnection
Z1 Niger river bassin dvp
GH Forestry mgtCV Picos
Watershedmgt
SLStrength.
PFM
MZMineral
ResourcesMgt
Very good – Fully achieved with no shortcomings.
Good – Mostly achieved despite a few shortcomings.
Fair – Partially achieved. Shortcomings and achievements are roughly balanced.
Poor – Very limited achievement with extensive shortcomings.
This graph shows the evaluation department’s ratings of the outcomes of projects closed in 2010 and 2011. Each box represents a project. The size of the box shows its share of the Bank’s value of projects reviewed by the evaluation department: the larger the box, the larger the share. The colour shows the project’s achievement of planned outcomes. Projects are organised in clusters by sector.
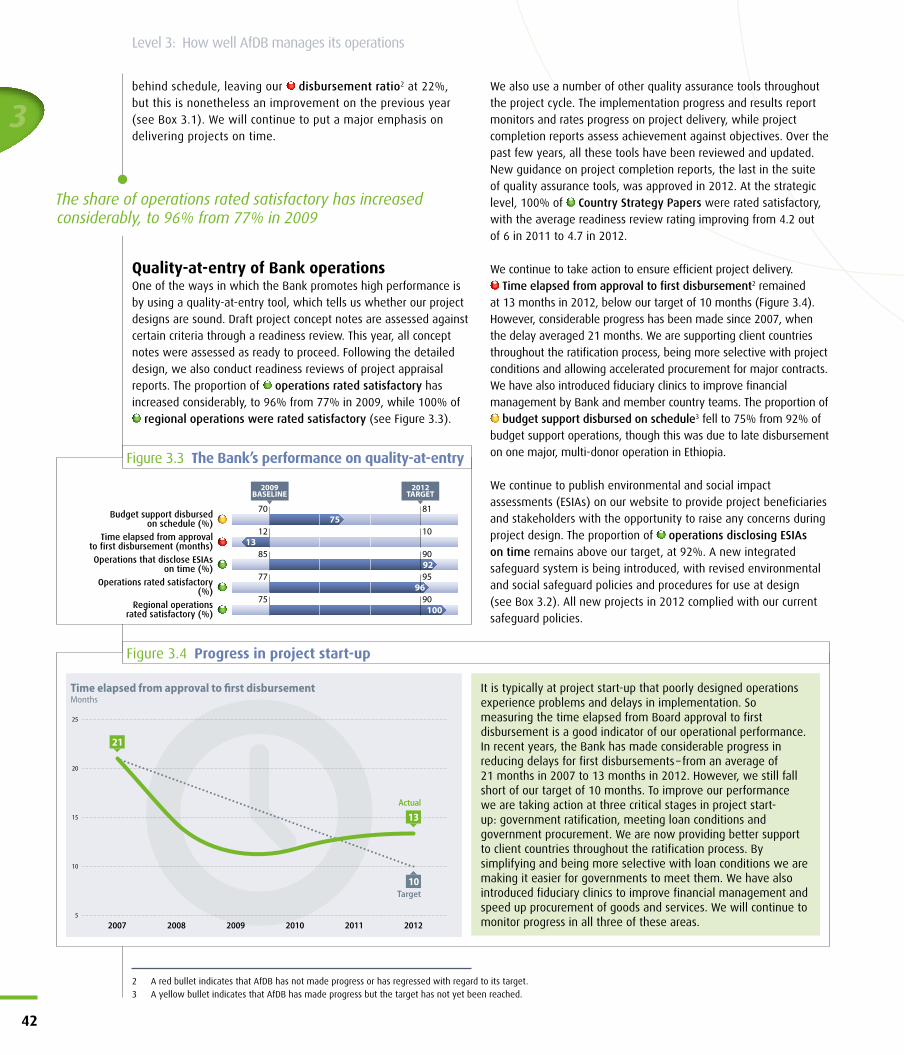
3
42
Level 3: How well AfDB manages its operations
behind schedule, leaving our disbursement ratio2 at 22%, but this is nonetheless an improvement on the previous year (see Box!3.1). We will continue to put a major emphasis on delivering projects on time.
Quality-at-entry of Bank operationsOne of the ways in which the Bank promotes high performance is by using a quality-at-entry tool, which tells us whether our project designs are sound. Draft project concept notes are assessed against certain criteria through a readiness review. This year, all concept notes were assessed as ready to proceed. Following the detailed design, we also conduct readiness reviews of project appraisal reports. The proportion of operations rated satisfactory has increased considerably, to 96% from 77% in 2009, while 100% of
regional operations were rated satisfactory (see Figure 3.3).
We also use a number of other quality assurance tools throughout the project cycle. The implementation progress and results report monitors and rates progress on project delivery, while project completion reports assess achievement against objectives. Over the past few years, all these tools have been reviewed and updated. New guidance on project completion reports, the last in the suite of quality assurance tools, was approved in 2012. At the strategic level, 100% of Country Strategy Papers were rated satisfactory, with the average readiness review rating improving from 4.2 out of!6 in 2011 to 4.7 in 2012.
We continue to take action to ensure efficient project delivery. Time elapsed from approval to first disbursement2 remained
at 13!months in 2012, below our target of 10 months (Figure!3.4). However, considerable progress has been made since 2007, when the delay averaged 21!months. We are supporting client countries throughout the ratification process, being more selective with project conditions and allowing accelerated procurement for major contracts. We have also introduced fiduciary clinics to improve financial management by Bank and member country teams. The proportion of
budget support disbursed on schedule3 fell to 75% from 92% of budget support operations, though this was due to late disbursement on one major, multi-donor operation in Ethiopia.
We continue to publish environmental and social impact assessments (ESIAs) on our website to provide project beneficiaries and stakeholders with the opportunity to raise any concerns during project design. The proportion of operations disclosing ESIAs on time remains above our target, at 92%. A new integrated safeguard system is being introduced, with revised environmental and social safeguard policies and procedures for use at design (see Box!3.2). All new projects in 2012 complied with our current safeguard policies.
Figure 3.3 The Bank’s performance on quality-at-entry
70 81
12 10
85 90
2009BASELINE
2012TARGET
13
75
9277 95
9675 90
100
Budget support disbursed on schedule (%)
Time elapsed from approval to first disbursement (months)Operations that disclose ESIAs
on time (%)Operations rated satisfactory
(%)Regional operations
rated satisfactory (%)
The share of operations rated satisfactory has increased considerably, to 96% from 77% in 2009
2 A red bullet indicates that AfDB has not made progress or has regressed with regard to its target.3 A yellow bullet indicates that AfDB has made progress but the target has not yet been reached.
Figure 3.4 Progress in project start-up
Time elapsed from approval to !rst disbursementMonths
5
10
15
20
25
Actual
Target
201220112010200920082007
21
13
10
It is typically at project start-up that poorly designed operations experience problems and delays in implementation. So measuring the time elapsed from Board approval to first disbursement is a good indicator of our operational performance. In recent years, the Bank has made considerable progress in reducing delays for first disbursements – from an average of 21!months in 2007 to 13!months in 2012. However, we still fall short of our target of 10 months. To improve our performance we are taking action at three critical stages in project start-up: government ratification, meeting loan conditions and government procurement. We are now providing better support to client countries throughout the ratification process. By simplifying and being more selective with loan conditions we are making it easier for governments to meet them. We have also introduced fiduciary clinics to improve financial management and speed up procurement of goods and services. We will continue to monitor progress in all three of these areas.
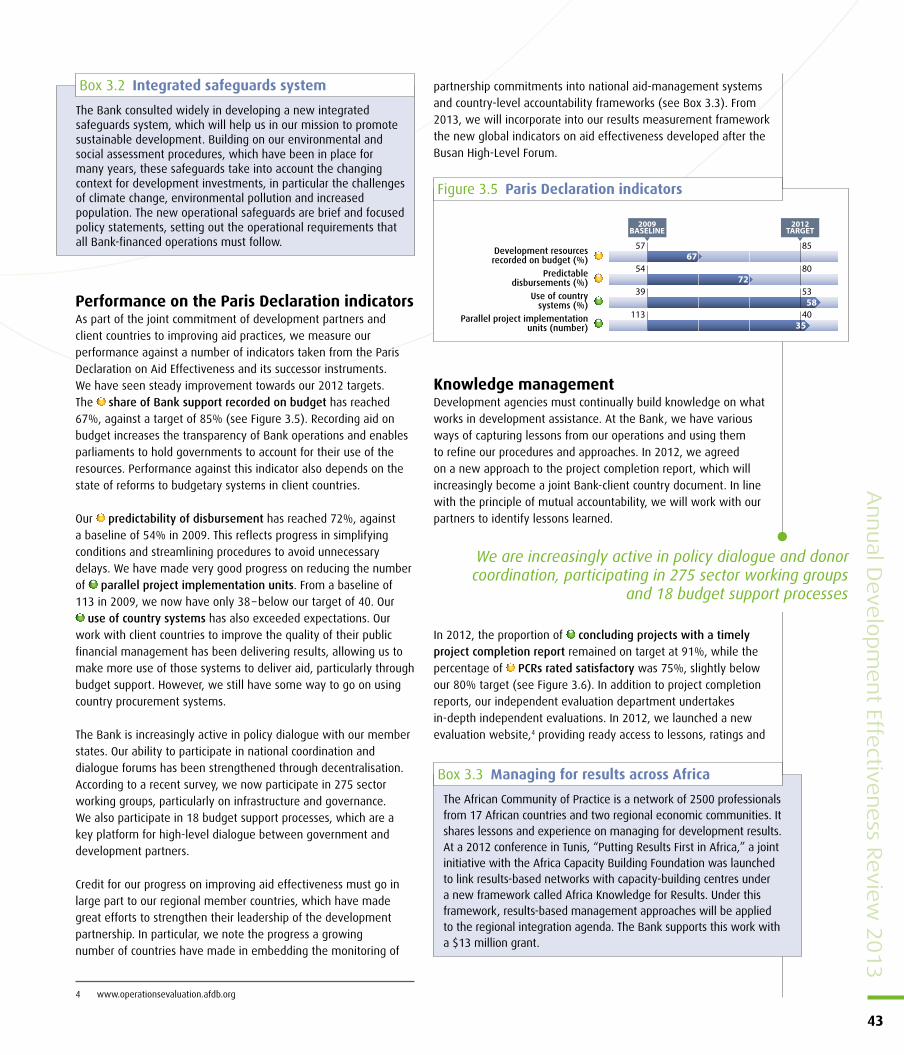
Annual D
evelo
pm
ent Effe
ctiveness R
eview 2
013
43
Performance on the Paris Declaration indicatorsAs part of the joint commitment of development partners and client countries to improving aid practices, we measure our performance against a number of indicators taken from the Paris Declaration on Aid Effectiveness and its successor instruments. We have seen steady improvement towards our 2012 targets. The share of Bank support recorded on budget has reached 67%, against a target of 85% (see Figure!3.5). Recording aid on budget increases the transparency of Bank operations and enables parliaments to hold governments to account for their use of the resources. Performance against this indicator also depends on the state of reforms to budgetary systems in client countries.
Our predictability of disbursement has reached 72%, against a baseline of 54% in 2009. This reflects progress in simplifying conditions and streamlining procedures to avoid unnecessary delays. We have made very good progress on reducing the number of parallel project implementation units. From a baseline of 113 in 2009, we now have only 38 – below our target of 40. Our
use of country systems has also exceeded expectations. Our work with client countries to improve the quality of their public financial management has been delivering results, allowing us to make more use of those systems to deliver aid, particularly through budget support. However, we still have some way to go on using country procurement systems.
The Bank is increasingly active in policy dialogue with our member states. Our ability to participate in national coordination and dialogue forums has been strengthened through decentralisation. According to a recent survey, we now participate in 275!sector working groups, particularly on infrastructure and governance. We also participate in 18!budget support processes, which are a key platform for high-level dialogue between government and development partners.
Credit for our progress on improving aid effectiveness must go in large part to our regional member countries, which have made great efforts to strengthen their leadership of the development partnership. In particular, we note the progress a growing number of countries have made in embedding the monitoring of
partnership commitments into national aid-management systems and country-level accountability frameworks (see Box 3.3). From 2013, we will incorporate into our results measurement framework the new global indicators on aid effectiveness developed after the Busan High-Level Forum.
Knowledge managementDevelopment agencies must continually build knowledge on what works in development assistance. At the Bank, we have various ways of capturing lessons from our operations and using them to refine our procedures and approaches. In 2012, we agreed on a new approach to the project completion report, which will increasingly become a joint Bank-client country document. In line with the principle of mutual accountability, we will work with our partners to identify lessons learned.
In 2012, the proportion of concluding projects with a timely project completion report remained on target at 91%, while the percentage of PCRs rated satisfactory was 75%, slightly below our 80% target (see Figure!3.6). In addition to project completion reports, our independent evaluation department undertakes in-depth independent evaluations. In 2012, we launched a new evaluation website,4 providing ready access to lessons, ratings and
We are increasingly active in policy dialogue and donor coordination, participating in 275!sector working groups
and!18 budget support processes
4 www.operationsevaluation.afdb.org
The Bank consulted widely in developing a new integrated safeguards system, which will help us in our mission to promote sustainable development. Building on our environmental and social assessment procedures, which have been in place for many years, these safeguards take into account the changing context for development investments, in particular the challenges of climate change, environmental pollution and increased population. The new operational safeguards are brief and focused policy statements, setting out the operational requirements that all Bank-financed operations must follow.
Box 3.2 Integrated safeguards system
The African Community of Practice is a network of 2500!professionals from 17!African countries and two regional economic communities. It shares lessons and experience on managing for development results. At a 2012 conference in Tunis, “Putting Results First in Africa,” a joint initiative with the Africa Capacity Building Foundation was launched to link results-based networks with capacity-building centres under a new framework called Africa Knowledge for Results. Under this framework, results-based management approaches will be applied to the regional integration agenda. The Bank supports this work with a $13!million grant.
Box 3.3 Managing for results across Africa
Figure 3.5 Paris Declaration indicators
57 85
113 40
2009BASELINE
2012TARGET
67
35
39 5358
54 8072
Development resources recorded on budget (%)
Predictable disbursements (%)
Use of country systems (%)
Parallel project implementation units (number)
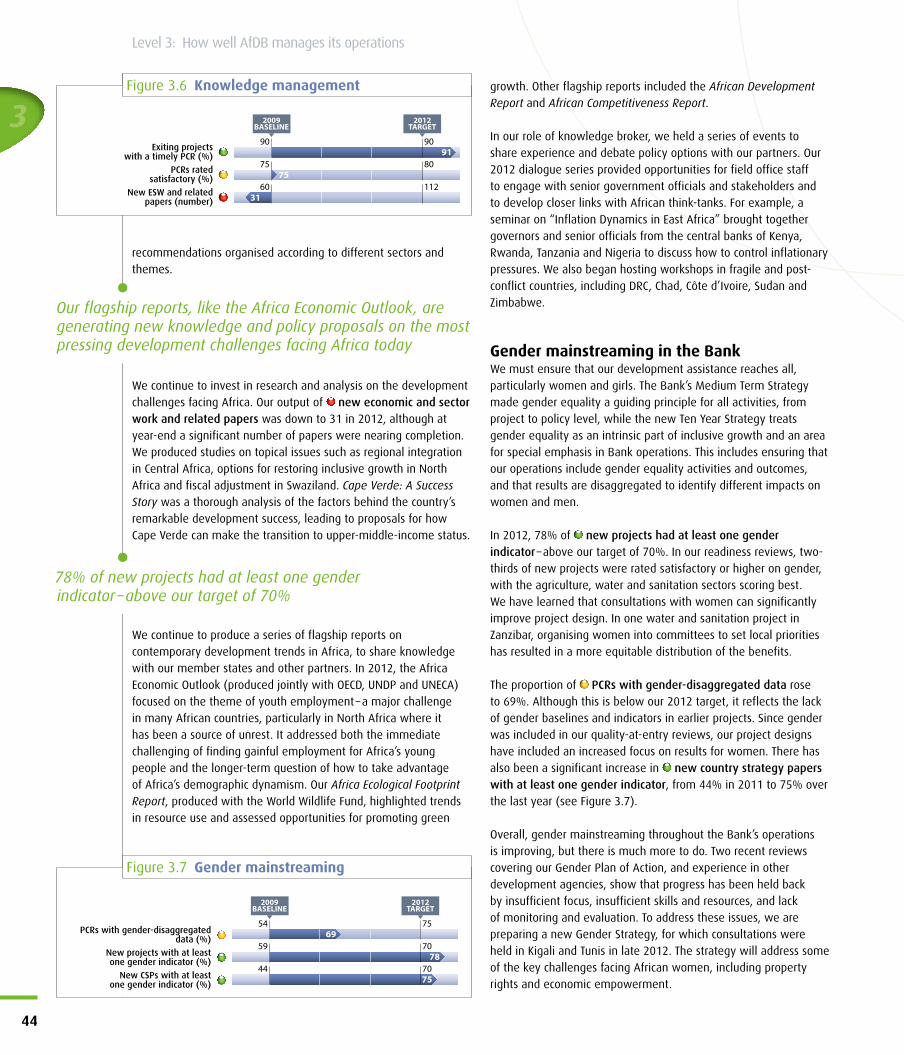
3
44
Level 3: How well AfDB manages its operations
recommendations organised according to different sectors and themes.
We continue to invest in research and analysis on the development challenges facing Africa. Our output of new economic and sector work and related papers was down to 31 in 2012, although at year-end a significant number of papers were nearing completion. We produced studies on topical issues such as regional integration in Central Africa, options for restoring inclusive growth in North Africa and fiscal adjustment in Swaziland. Cape Verde: A Success Story was a thorough analysis of the factors behind the country’s remarkable development success, leading to proposals for how Cape Verde can make the transition to upper-middle-income status.
We continue to produce a series of flagship reports on contemporary development trends in Africa, to share knowledge with our member states and other partners. In 2012, the Africa Economic Outlook (produced jointly with OECD, UNDP and UNECA) focused on the theme of youth employment – a major challenge in many African countries, particularly in North Africa where it has been a source of unrest. It addressed both the immediate challenging of finding gainful employment for Africa’s young people and the longer-term question of how to take advantage of Africa’s demographic dynamism. Our Africa Ecological Footprint Report,!produced with the World Wildlife Fund, highlighted trends in resource use and assessed opportunities for promoting green
growth. Other flagship reports included the African Development Report and African Competitiveness Report.
In our role of knowledge broker, we held a series of events to share experience and debate policy options with our partners. Our 2012 dialogue series provided opportunities for field office staff to engage with senior government officials and stakeholders and to develop closer links with African think-tanks. For example, a seminar on “Inflation Dynamics in East Africa” brought together governors and senior officials from the central banks of Kenya, Rwanda, Tanzania and Nigeria to discuss how to control inflationary pressures. We also began hosting workshops in fragile and post-conflict countries, including DRC, Chad, Côte d’Ivoire, Sudan and Zimbabwe.
Gender mainstreaming in the BankWe must ensure that our development assistance reaches all, particularly women and girls. The Bank’s Medium Term Strategy made gender equality a guiding principle for all activities, from project to policy level, while the new Ten Year Strategy treats gender equality as an intrinsic part of inclusive growth and an area for special emphasis in Bank operations. This includes ensuring that our operations include gender equality activities and outcomes, and that results are disaggregated to identify different impacts on women and men.
In 2012, 78% of new projects had at!least one gender indicator – above our target of 70%. In our readiness reviews, two-thirds of new projects were rated satisfactory or higher on gender, with the agriculture, water and sanitation sectors scoring best. We have learned that consultations with women can significantly improve project design. In one water and sanitation project in Zanzibar, organising women into committees to set local priorities has resulted in a more equitable distribution of the benefits.
The proportion of PCRs with gender-disaggregated data rose to 69%. Although this is below our 2012 target, it reflects the lack of gender baselines and indicators in earlier projects. Since gender was included in our quality-at-entry reviews, our project designs have included an increased focus on results for women. There has also been a significant increase in new country strategy papers with at!least one gender indicator, from 44% in 2011 to 75% over the last year (see Figure!3.7).
Overall, gender mainstreaming throughout the Bank’s operations is improving, but there is much more to do. Two recent reviews covering our Gender Plan of Action, and experience in other development agencies, show that progress has been held back by insufficient focus, insufficient skills and resources, and lack of monitoring and evaluation. To address these issues, we are preparing a new Gender Strategy, for which consultations were held in Kigali and Tunis in late 2012. The strategy will address some of the key challenges facing African women, including property rights and economic empowerment.
Figure 3.6 Knowledge management
90 90
75 80
60 112
2009BASELINE
2012TARGET
75
91
31
Exiting projects with a timely PCR (%)
PCRs rated satisfactory (%)
New ESW and related papers (number)
Figure 3.7 Gender mainstreaming
54 75
59 70
2009BASELINE
2012TARGET
78
69
44 7075
PCRs with gender-disaggregated data (%)
New projects with at least one!gender indicator (%)
New CSPs with at least one gender indicator (%)
Our flagship reports, like the Africa Economic Outlook, are generating new knowledge and policy proposals on the most pressing development challenges facing Africa today
78% of new projects had at!least one gender indicator – above our target of 70%
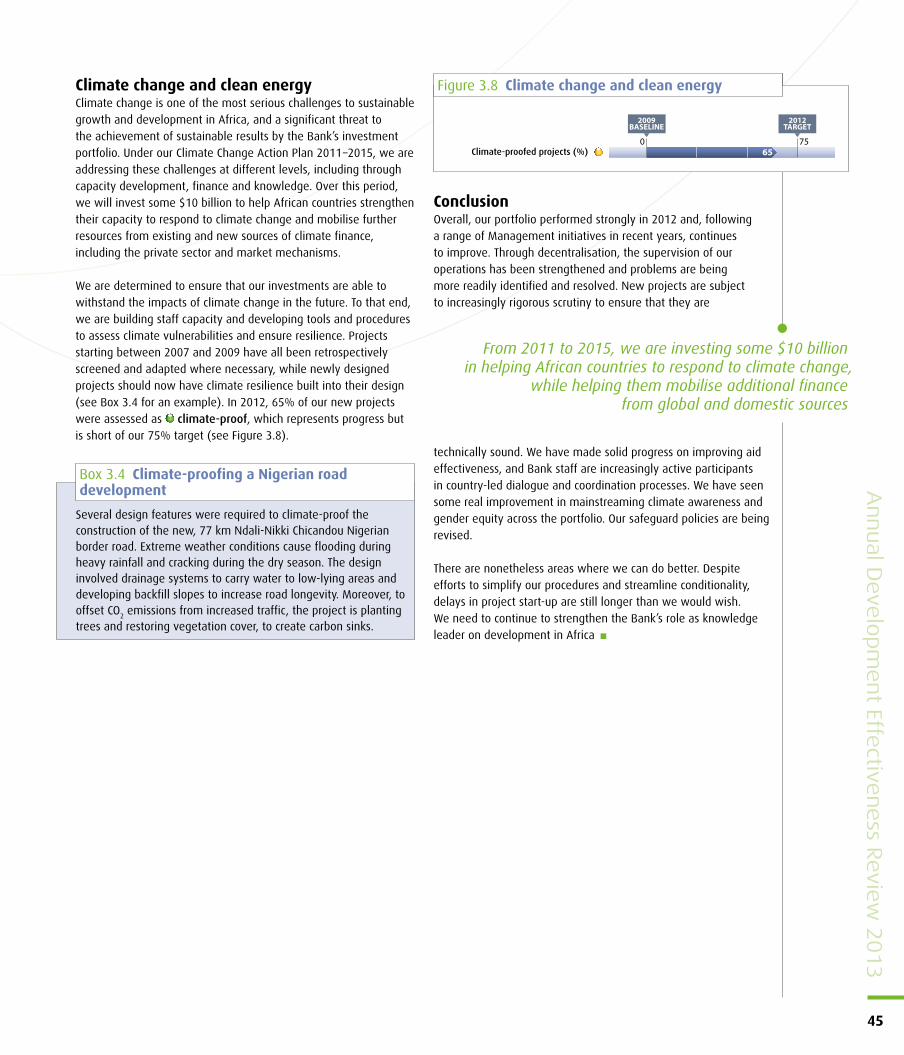
Annual D
evelo
pm
ent Effe
ctiveness R
eview 2
013
45
Climate change and clean energyClimate change is one of the most serious challenges to sustainable growth and development in Africa, and a significant threat to the achievement of sustainable results by the Bank’s investment portfolio. Under our Climate Change Action Plan 2011 –2015, we are addressing these challenges at different levels, including through capacity development, finance and knowledge. Over this period, we will invest some $10!billion to help African countries strengthen their capacity to respond to climate change and mobilise further resources from existing and new sources of climate finance, including the private sector and market mechanisms.
We are determined to ensure that our investments are able to withstand the impacts of climate change in the future. To that end, we are building staff capacity and developing tools and procedures to assess climate vulnerabilities and ensure resilience. Projects starting between 2007 and 2009 have all been retrospectively screened and adapted where necessary, while newly designed projects should now have climate resilience built into their design (see Box!3.4 for an example). In 2012, 65% of our new projects were assessed as climate-proof, which represents progress but is short of our 75% target (see Figure!3.8).
ConclusionOverall, our portfolio performed strongly in 2012 and, following a range of Management initiatives in recent years, continues to improve. Through decentralisation, the supervision of our operations has been strengthened and problems are being more readily identified and resolved. New projects are subject to increasingly rigorous scrutiny to ensure that they are
technically sound. We have made solid progress on improving aid effectiveness, and Bank staff are increasingly active participants in country-led dialogue and coordination processes. We have seen some real improvement in mainstreaming climate awareness and gender equity across the portfolio. Our safeguard policies are being revised.
There are nonetheless areas where we can do better. Despite efforts to simplify our procedures and streamline conditionality, delays in project start-up are still longer than we would wish. We need to continue to strengthen the Bank’s role as knowledge leader on development in Africa
From 2011 to 2015, we are investing some $10!billion in helping African countries to respond to climate change,
while helping them mobilise additional finance from global and domestic sources
Figure 3.8 Climate change and clean energy
0 75
2009BASELINE
2012TARGET
65Climate-proofed projects (%)
Several design features were required to climate-proof the construction of the new, 77!km Ndali-Nikki Chicandou Nigerian border road. Extreme weather conditions cause flooding during heavy rainfall and cracking during the dry season. The design involved drainage systems to carry water to low-lying areas and developing backfill slopes to increase road longevity. Moreover, to offset CO2 emissions from increased traffic, the project is planting trees and restoring vegetation cover, to create carbon sinks.
Box 3.4 Climate-proofing a Nigerian road development
Clean, safe water at schoolBefore AfDB’s Rural Health project, the students at Karucho Primary School, Kenya, often spent as much as 30 minutes fetching water from a river, and they often contracted water-borne diseases. Now they can enjoy clean, safe water directly from the tanks at school. Susan Munene, the head teacher, says that higher test scores show that access to clean and safe water has already affected learning at the school.
© A
fDB,
Arn
e H
oel 2
009
0°
30’ 8
” S
— 3
7°
23’ 1
1”
E
46
4
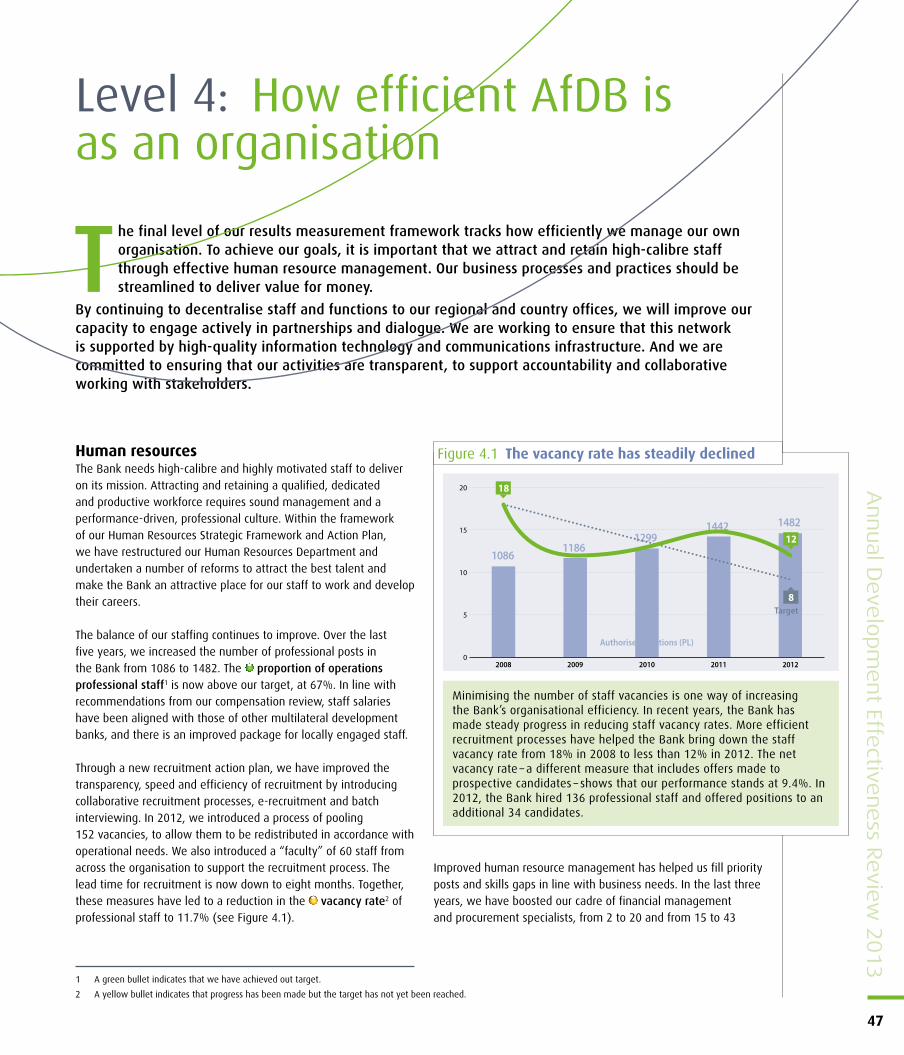
Human resourcesThe Bank needs high-calibre and highly motivated staff to deliver on its mission. Attracting and retaining a qualified, dedicated and productive workforce requires sound management and a performance-driven, professional culture. Within the framework of our Human Resources Strategic Framework and Action Plan, we have restructured our Human Resources Department and undertaken a number of reforms to attract the best talent and make the Bank an attractive place for our staff to work and develop their careers.
The balance of our staffing continues to improve. Over the last five years, we increased the number of professional posts in the Bank from 1086 to 1482. The proportion of operations professional staff1 is now above our target, at 67%. In line with recommendations from our compensation review, staff salaries have been aligned with those of other multilateral development banks, and there is an improved package for locally engaged staff.
Through a new recruitment action plan, we have improved the transparency, speed and efficiency of recruitment by introducing collaborative recruitment processes, e-recruitment and batch interviewing. In 2012, we introduced a process of pooling 152!vacancies, to allow them to be redistributed in accordance with operational needs. We also introduced a “faculty” of 60!staff from across the organisation to support the recruitment process. The lead time for recruitment is now down to eight months. Together, these measures have led to a reduction in the vacancy rate2 of professional staff to 11.7% (see Figure!4.1).
Improved human resource management has helped us fill priority posts and skills gaps in line with business needs. In the last three years, we have boosted our cadre of financial management and procurement specialists, from 2 to 20 and from 15 to 43
Level 4: How efficient AfDB is as!an!organisation
The final level of our results measurement framework tracks how efficiently we manage our own organisation. To achieve our goals, it is important that we attract and retain high-calibre staff through effective human resource management. Our business processes and practices should be streamlined to deliver value for money.
By continuing to decentralise staff and functions to our regional and country offices, we will improve our capacity to engage actively in partnerships and dialogue. We are working to ensure that this network is supported by high-quality information technology and communications infrastructure. And we are committed to ensuring that our activities are transparent, to support accountability and collaborative working with stakeholders.
Annual D
evelo
pm
ent Effe
ctiveness R
eview 2
013
47
1 A green bullet indicates that we have achieved out target.
2 A yellow bullet indicates that progress has been made but the target has not yet been reached.
Figure 4.1 The vacancy rate has steadily declined
20122011201020092008
10861186
12991442 1482
Authorised positions (PL)
Target
0
5
10
15
20 18
12
8
Minimising the number of staff vacancies is one way of increasing the Bank’s organisational efficiency. In recent years, the Bank has made steady progress in reducing staff vacancy rates. More efficient recruitment processes have helped the Bank bring down the staff vacancy rate from 18% in 2008 to less than 12% in 2012. The net vacancy rate – a different measure that includes offers made to prospective candidates – shows that our performance stands at 9.4%. In 2012, the Bank hired 136!professional staff and offered positions to an additional 34!candidates.
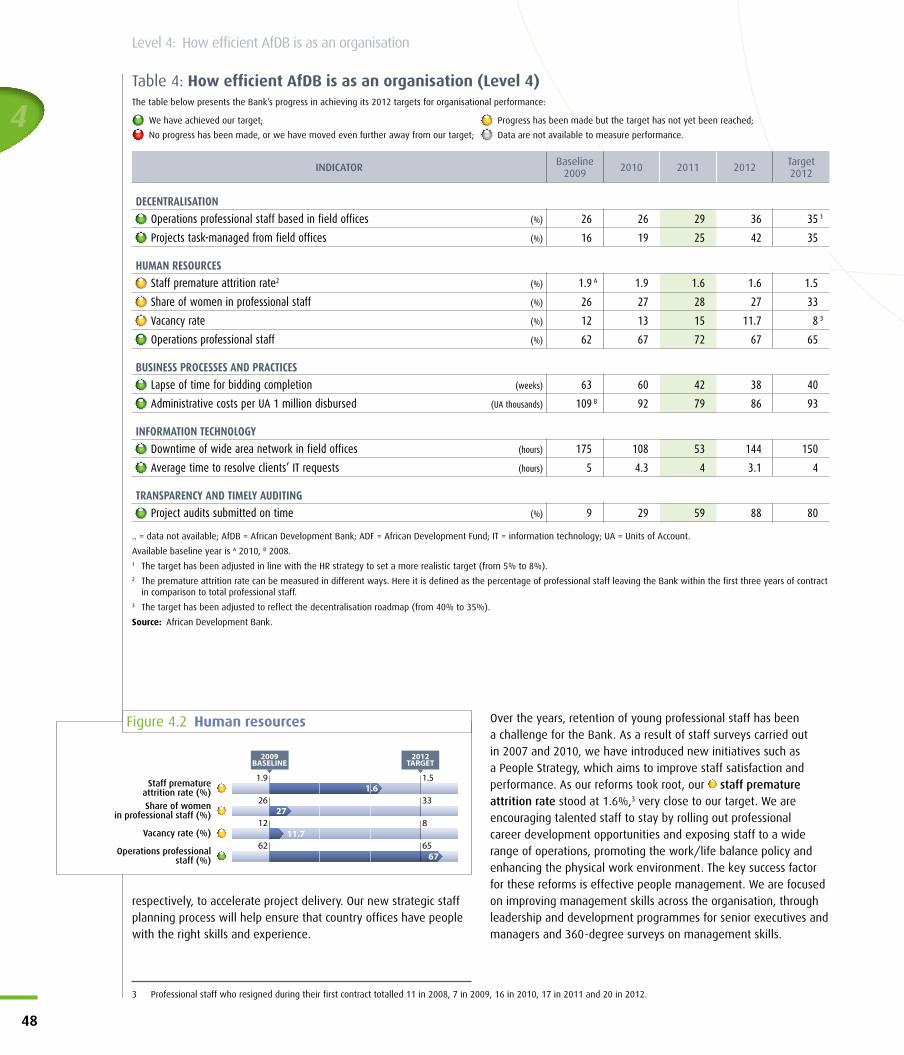
respectively, to accelerate project delivery. Our new strategic staff planning process will help ensure that country offices have people with the right skills and experience.
Over the years, retention of young professional staff has been a challenge for the Bank. As a result of staff surveys carried out in 2007 and 2010, we have introduced new initiatives such as a People Strategy, which aims to improve staff satisfaction and performance. As our reforms took root, our staff premature attrition rate stood at 1.6%,3 very close to our target. We are encouraging talented staff to stay by rolling out professional career development opportunities and exposing staff to a wide range of operations, promoting the work/life balance policy and enhancing the physical work environment. The key success factor for these reforms is effective people management. We are focused on improving management skills across the organisation, through leadership and development programmes for senior executives and managers and 360-degree surveys on management skills.
Table 4: How efficient AfDB is as an organisation (Level 4)The table below presents the Bank’s progress in achieving its 2012 targets for organisational performance:
We have achieved our target; Progress has been made but the target has not yet been reached;
No progress has been made, or we have moved even further away from our target; Data are not available to measure performance.
INDICATOR Baseline2009 2010 2011 2012 Target
2012
DECENTRALISATIONOperations professional staff based in field offices (%) 26 26 29 36 35 1
Projects task-managed from field offices (%) 16 19 25 42 35
HUMAN RESOURCESStaff premature attrition rate2 (%) 1.9 A 1.9 1.6 1.6 1.5
Share of women in professional staff (%) 26 27 28 27 33
Vacancy rate (%) 12 13 15 11.7 8 3
Operations professional staff (%) 62 67 72 67 65
BUSINESS PROCESSES AND PRACTICESLapse of time for bidding completion (weeks) 63 60 42 38 40
Administrative costs per UA 1 million disbursed (UA thousands) 109 B 92 79 86 93
INFORMATION TECHNOLOGYDowntime of wide area network in field offices (hours) 175 108 53 144 150
Average time to resolve clients’ IT requests (hours) 5 4.3 4 3.1 4
TRANSPARENCY AND TIMELY AUDITINGProject audits submitted on time (%) 9 29 59 88 80
.. = data not available; AfDB = African Development Bank; ADF = African Development Fund; IT = information technology; UA = Units of Account.
Available baseline year is A 2010, B 2008.1 The target has been adjusted in line with the HR strategy to set a more realistic target (from 5% to 8%).2 The premature attrition rate can be measured in different ways. Here it is defined as the percentage of professional staff leaving the Bank within the first three years of contract
in comparison to total professional staff.3 The target has been adjusted to reflect the decentralisation roadmap (from 40% to 35%).
Source: African Development Bank.
3 Professional staff who resigned during their first contract totalled 11 in 2008, 7 in 2009, 16 in 2010, 17 in 2011 and 20 in 2012.
4
48
Level 4: How efficient AfDB is as!an!organisation
Figure 4.2 Human resources
1.9 1.5
26 33
12 8
2009BASELINE
2012TARGET
27
1.6
11.762 65
67
Staff premature attrition rate (%)Share of women
in professional staff (%)
Vacancy rate (%)
Operations professional staff (%)
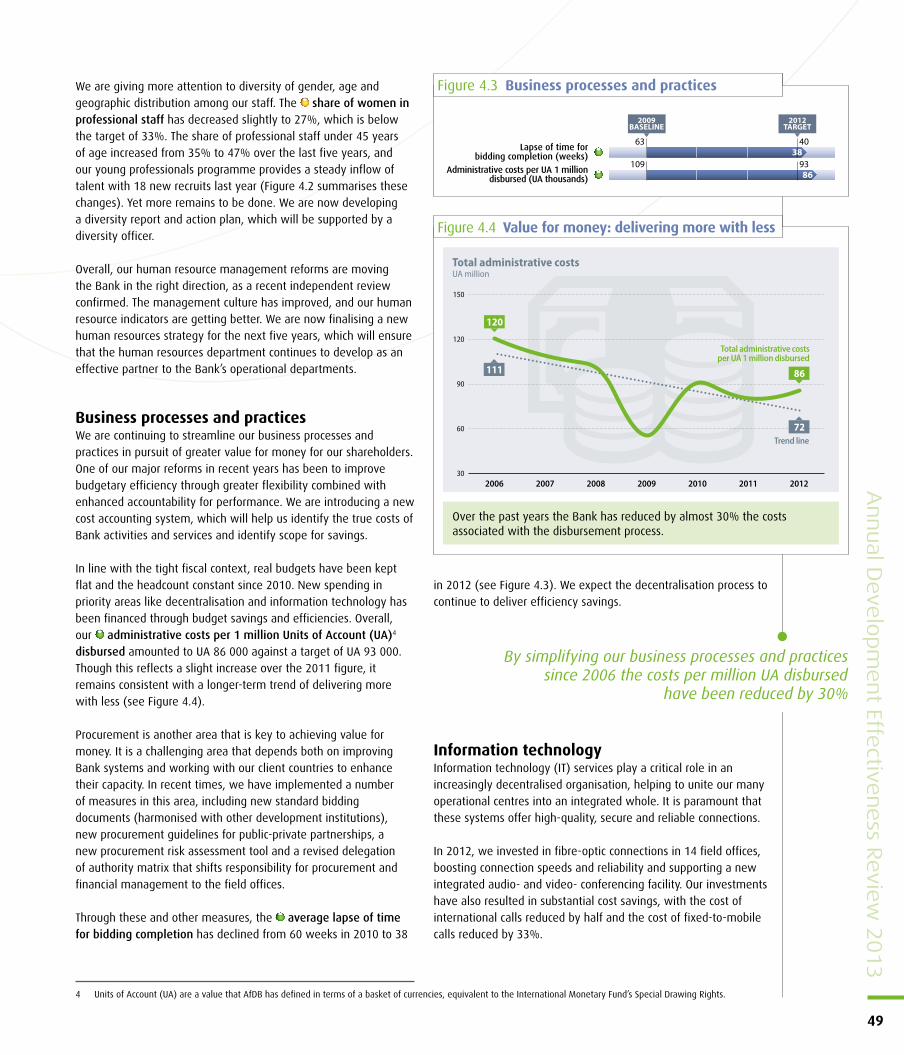
We are giving more attention to diversity of gender, age and geographic distribution among our staff. The share of women in professional staff has decreased slightly to 27%, which is below the target of 33%. The share of professional staff under 45 years of age increased from 35% to 47% over the last five years, and our young professionals programme provides a steady inflow of talent with 18!new recruits last year (Figure!4.2 summarises these changes). Yet more remains to be done. We are now developing a diversity report and action plan, which will be supported by a diversity officer.
Overall, our human resource management reforms are moving the Bank in the right direction, as a recent independent review confirmed. The management culture has improved, and our human resource indicators are getting better. We are now finalising a new human resources strategy for the next five years, which will ensure that the human resources department continues to develop as an effective partner to the Bank’s operational departments.
Business processes and practices We are continuing to streamline our business processes and practices in pursuit of greater value for money for our shareholders. One of our major reforms in recent years has been to improve budgetary efficiency through greater flexibility combined with enhanced accountability for performance. We are introducing a new cost accounting system, which will help us identify the true costs of Bank activities and services and identify scope for savings.
In line with the tight fiscal context, real budgets have been kept flat and the headcount constant since 2010. New spending in priority areas like decentralisation and information technology has been financed through budget savings and efficiencies. Overall, our administrative costs per 1 million Units of Account (UA)4 disbursed amounted to UA!86!000 against a target of UA!93!000. Though this reflects a slight increase over the 2011 figure, it remains consistent with a longer-term trend of delivering more with less (see Figure!4.4).
Procurement is another area that is key to achieving value for money. It is a challenging area that depends both on improving Bank systems and working with our client countries to enhance their capacity. In recent times, we have implemented a number of measures in this area, including new standard bidding documents (harmonised with other development institutions), new procurement guidelines for public-private partnerships, a new procurement risk assessment tool and a revised delegation of authority matrix that shifts responsibility for procurement and financial management to the field offices.
Through these and other measures, the average lapse of time for bidding completion has declined from 60!weeks in 2010 to 38
in 2012 (see Figure!4.3). We expect the decentralisation process to continue to deliver efficiency savings.
Information technologyInformation technology (IT) services play a critical role in an increasingly decentralised organisation, helping to unite our many operational centres into an integrated whole. It is paramount that these systems offer high-quality, secure and reliable connections.
In 2012, we invested in fibre-optic connections in 14 field offices, boosting connection speeds and reliability and supporting a new integrated audio- and video- conferencing facility. Our investments have also resulted in substantial cost savings, with the cost of international calls reduced by half and the cost of fixed-to-mobile calls reduced by 33%.
4 Units of Account (UA) are a value that AfDB has defined in terms of a basket of currencies, equivalent to the International Monetary Fund’s Special Drawing Rights.
Annual D
evelo
pm
ent Effe
ctiveness R
eview 2
013
49
By simplifying our business processes and practices since 2006 the costs per million UA disbursed
have been reduced by 30%
Figure 4.3 Business processes and practices
63 40
109 93
2009BASELINE
2012TARGET
86
38Lapse of time for bidding completion (weeks)
Administrative costs per UA 1 million disbursed (UA thousands)
Figure 4.4 Value for money: delivering more with less
30
60
90
120
150
2012201120102009200820072006
120
111
72
86
Total administrative costsUA million
Total administrative costsper UA 1 million disbursed
Trend line
Over the past years the Bank has reduced by almost 30% the costs associated with the disbursement process.
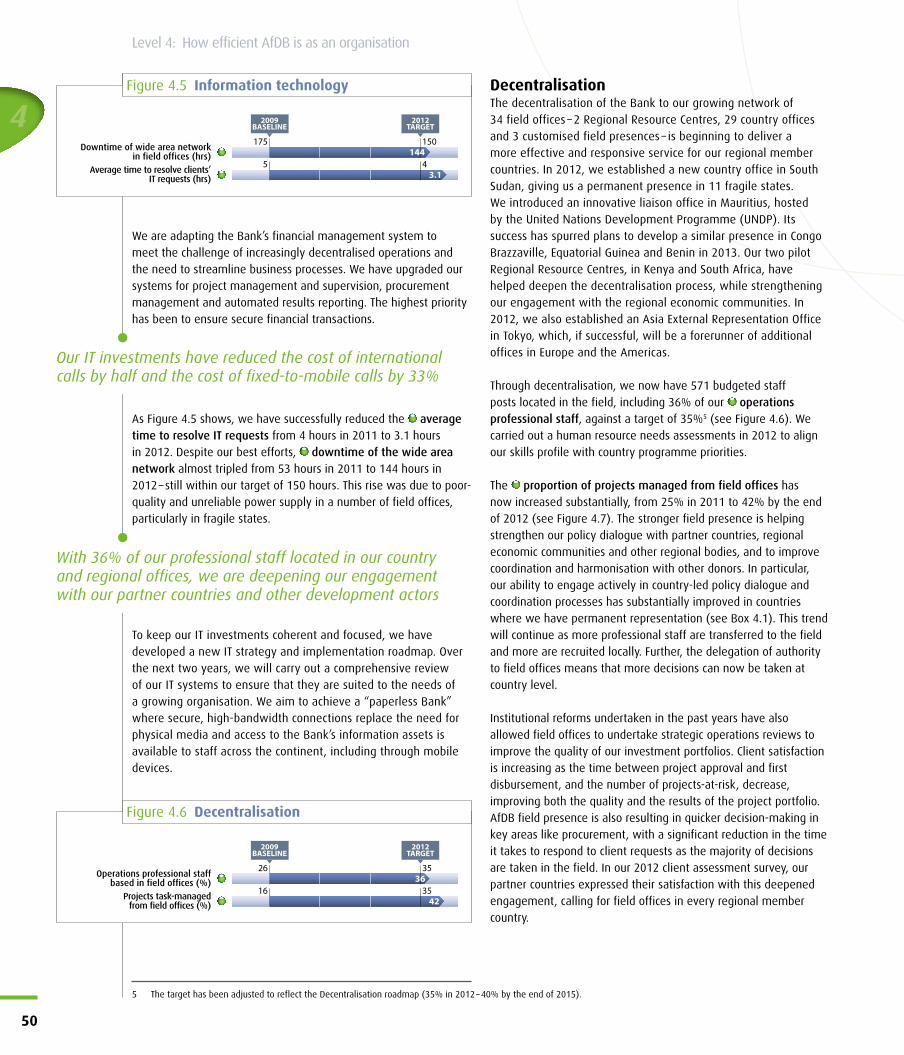
We are adapting the Bank’s financial management system to meet the challenge of increasingly decentralised operations and the need to streamline business processes. We have upgraded our systems for project management and supervision, procurement management and automated results reporting. The highest priority has been to ensure secure financial transactions.
As Figure 4.5 shows, we have successfully reduced the average time to resolve IT requests from 4!hours in 2011 to 3.1!hours in 2012. Despite our best efforts, downtime of the wide area network almost tripled from 53!hours in 2011 to 144!hours in 2012 – still within our target of 150 hours. This rise was due to poor-quality and unreliable power supply in a number of field offices, particularly in fragile states.
To keep our IT investments coherent and focused, we have developed a new IT strategy and implementation roadmap. Over the next two years, we will carry out a comprehensive review of our IT systems to ensure that they are suited to the needs of a growing organisation. We aim to achieve a “paperless Bank” where secure, high-bandwidth connections replace the need for physical media and access to the Bank’s information assets is available to staff across the continent, including through mobile devices.
DecentralisationThe decentralisation of the Bank to our growing network of 34!field offices – 2!Regional Resource Centres, 29!country offices and 3!customised field presences – is beginning to deliver a more effective and responsive service for our regional member countries. In 2012, we established a new country office in South Sudan, giving us a permanent presence in 11!fragile states. We introduced an innovative liaison office in Mauritius, hosted by the United Nations Development Programme (UNDP). Its success has spurred plans to develop a similar presence in Congo Brazzaville, Equatorial Guinea and Benin in 2013. Our two pilot Regional Resource Centres, in Kenya and South Africa, have helped deepen the decentralisation process, while strengthening our engagement with the regional economic communities. In 2012, we also established an Asia External Representation Office in Tokyo, which, if successful, will be a forerunner of additional offices in Europe and the Americas.
Through decentralisation, we now have 571!budgeted staff posts located in the field, including 36% of our operations professional staff, against a target of 35%5 (see Figure!4.6). We carried out a human resource needs assessments in 2012 to align our skills profile with country programme priorities.
The proportion of projects managed from field offices has now increased substantially, from 25% in 2011 to 42% by the end of 2012 (see Figure!4.7). The stronger field presence is helping strengthen our policy dialogue with partner countries, regional economic communities and other regional bodies, and to improve coordination and harmonisation with other donors. In particular, our ability to engage actively in country-led policy dialogue and coordination processes has substantially improved in countries where we have permanent representation (see Box!4.1). This trend will continue as more professional staff are transferred to the field and more are recruited locally. Further, the delegation of authority to field offices means that more decisions can now be taken at country level.
Institutional reforms undertaken in the past years have also allowed field offices to undertake strategic operations reviews to improve the quality of our investment portfolios. Client satisfaction is increasing as the time between project approval and first disbursement, and the number of projects-at-risk, decrease, improving both the quality and the results of the project portfolio. AfDB field presence is also resulting in quicker decision-making in key areas like procurement, with a significant reduction in the time it takes to respond to client requests as the majority of decisions are taken in the field. In our 2012 client assessment survey, our partner countries expressed their satisfaction with this deepened engagement, calling for field offices in every regional member country.
4
50
Level 4: How efficient AfDB is as!an!organisation
Figure 4.5 Information technology
175 150
5 4
2009BASELINE
2012TARGET
3.1
144Downtime of wide area network in field offices (hrs)
Average time to resolve clients’ IT requests (hrs)
Figure 4.6 Decentralisation
26 35
16 35
2009BASELINE
2012TARGET
42
36Operations professional staff based in field offices (%)
Projects task-managed from field offices (%)
Our IT investments have reduced the cost of international calls by half and the cost of fixed-to-mobile calls by 33%
5 The target has been adjusted to reflect the Decentralisation roadmap (35% in 2012 – 40% by the end of 2015).
With 36% of our professional staff located in our country and!regional offices, we are deepening our engagement with our partner countries and other development actors
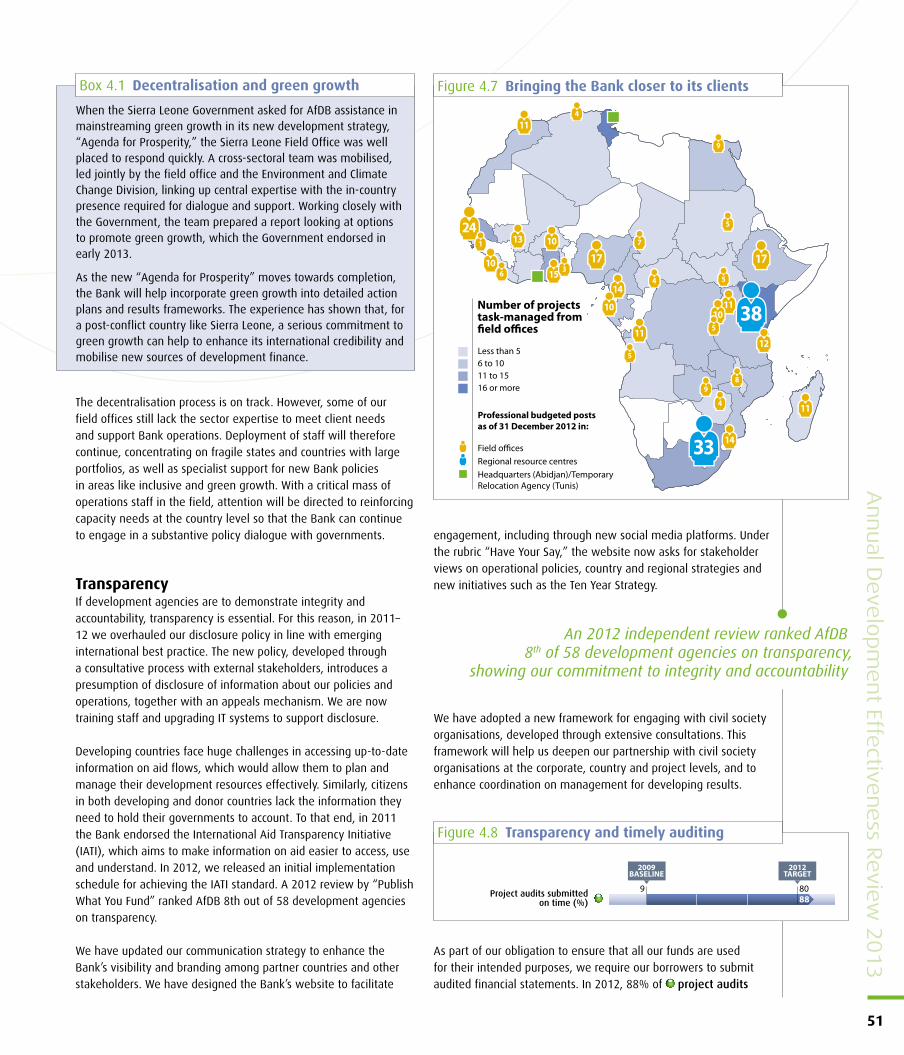
The decentralisation process is on track. However, some of our field offices still lack the sector expertise to meet client needs and support Bank operations. Deployment of staff will therefore continue, concentrating on fragile states and countries with large portfolios, as well as specialist support for new Bank policies in areas like inclusive and green growth. With a critical mass of operations staff in the field, attention will be directed to reinforcing capacity needs at the country level so that the Bank can continue to engage in a substantive policy dialogue with governments.
TransparencyIf development agencies are to demonstrate integrity and accountability, transparency is essential. For this reason, in 2011–12 we overhauled our disclosure policy in line with emerging international best practice. The new policy, developed through a consultative process with external stakeholders, introduces a presumption of disclosure of information about our policies and operations, together with an appeals mechanism. We are now training staff and upgrading IT systems to support disclosure.
Developing countries face huge challenges in accessing up-to-date information on aid flows, which would allow them to plan and manage their development resources effectively. Similarly, citizens in both developing and donor countries lack the information they need to hold their governments to account. To that end, in 2011 the Bank endorsed the International Aid Transparency Initiative (IATI), which aims to make information on aid easier to access, use and understand. In 2012, we released an initial implementation schedule for achieving the IATI standard. A 2012 review by “Publish What You Fund” ranked AfDB 8th out of 58!development agencies on transparency.
We have updated our communication strategy to enhance the Bank’s visibility and branding among partner countries and other stakeholders. We have designed the Bank’s website to facilitate
engagement, including through new social media platforms. Under the rubric “Have Your Say,” the website now asks for stakeholder views on operational policies, country and regional strategies and new initiatives such as the Ten Year Strategy.
We have adopted a new framework for engaging with civil society organisations, developed through extensive consultations. This framework will help us deepen our partnership with civil society organisations at the corporate, country and project levels, and to enhance coordination on management for developing results.
As part of our obligation to ensure that all our funds are used for their intended purposes, we require our borrowers to submit audited financial statements. In 2012, 88% of project audits
Annual D
evelo
pm
ent Effe
ctiveness R
eview 2
013
51
Figure 4.8 Transparency and timely auditing
9 80
2009BASELINE
2012TARGET
88Project audits submitted on time (%)
Figure 4.7 Bringing the Bank closer to its clients
24
17 17
14
10
10
11
10 11
15
13
11
6
1
3
4
7
9
8
4 5
5
5
4
10
9
11
1433
3812
5
Less than 56 to 1011 to 1516 or more
Field o!ces
Professional budgeted posts as of 31 December 2012 in:
Regional resource centresHeadquarters (Abidjan)/TemporaryRelocation Agency (Tunis)
Number of projects task-managed from !eld o"ces
When the Sierra Leone Government asked for AfDB assistance in mainstreaming green growth in its new development strategy, “Agenda for Prosperity,” the Sierra Leone Field Office was well placed to respond quickly. A cross-sectoral team was mobilised, led jointly by the field office and the Environment and Climate Change Division, linking up central expertise with the in-country presence required for dialogue and support. Working closely with the Government, the team prepared a report looking at options to promote green growth, which the Government endorsed in early 2013.
As the new “Agenda for Prosperity” moves towards completion, the Bank will help incorporate green growth into detailed action plans and results frameworks. The experience has shown that, for a post-conflict country like Sierra Leone, a serious commitment to green growth can help to enhance its international credibility and mobilise new sources of development finance.
Box 4.1 Decentralisation and green growth
An 2012 independent review ranked AfDB 8th of 58 development agencies on transparency,
showing our commitment to integrity and accountability
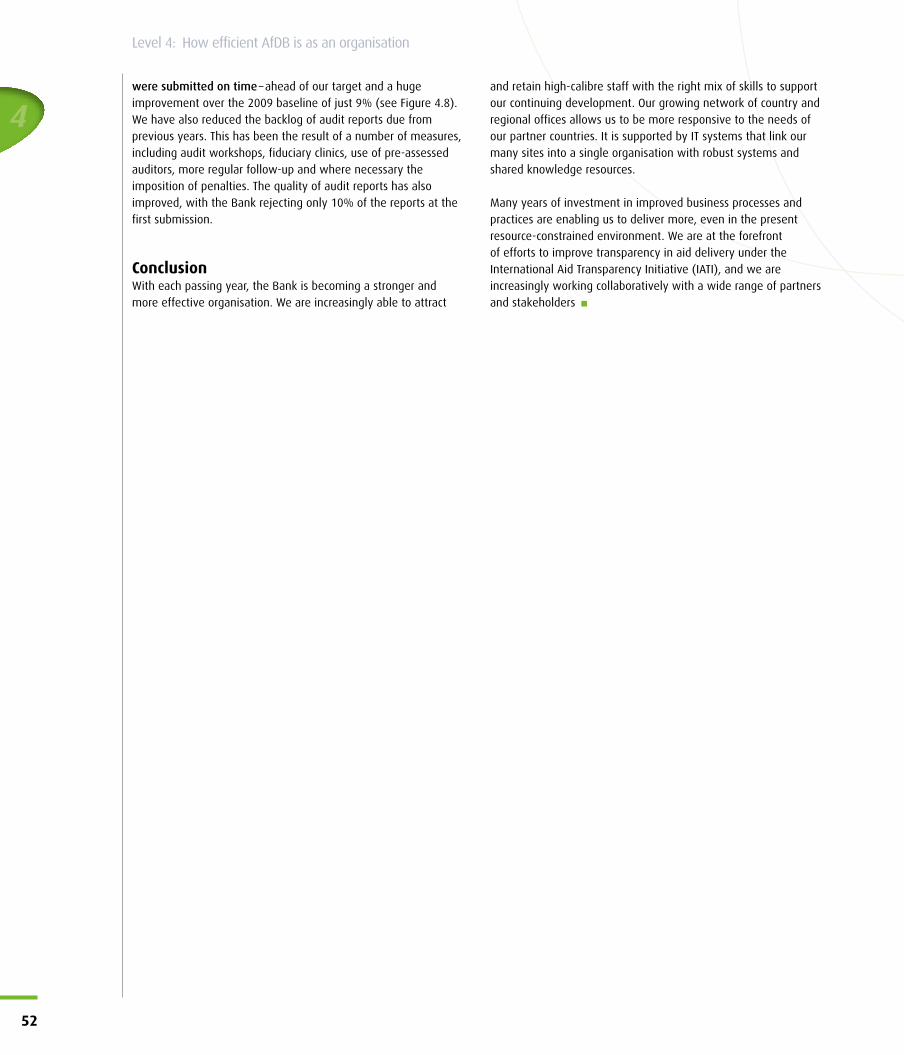
4
52
Level 4: How efficient AfDB is as!an!organisation
were submitted on time – ahead of our target and a huge improvement over the 2009 baseline of just 9% (see Figure!4.8). We have also reduced the backlog of audit reports due from previous years. This has been the result of a number of measures, including audit workshops, fiduciary clinics, use of pre-assessed auditors, more regular follow-up and where necessary the imposition of penalties. The quality of audit reports has also improved, with the Bank rejecting only 10% of the reports at the first submission.
ConclusionWith each passing year, the Bank is becoming a stronger and more effective organisation. We are increasingly able to attract
and retain high-calibre staff with the right mix of skills to support our continuing development. Our growing network of country and regional offices allows us to be more responsive to the needs of our partner countries. It is supported by IT systems that link our many sites into a single organisation with robust systems and shared knowledge resources.
Many years of investment in improved business processes and practices are enabling us to deliver more, even in the present resource-constrained environment. We are at the forefront of efforts to improve transparency in aid delivery under the International Aid Transparency Initiative (IATI), and we are increasingly working collaboratively with a wide range of partners and stakeholders
Annual D
evelo
pm
ent Effe
ctiveness R
eview 2
013
53
Delivering clear water to people in ZambiaThe water treatment plant in Kapiri!Mposhi, Zambia, provided over 200!000!people in the project area with access to clear, purified water and improved sanitation services.
© A
fDB,
Arn
e H
oel 2
013
13°
58’ 9
” S
— 2
8°
40’ 4
2”
E
54
5
Africa’s transformationIn our new Ten Year Strategy we commit to the pursuit of growth that is both inclusive and environmentally sustainable. This is a commitment with major implications for our strategies, our operations and our own organisation. We have already made a strong start. We have been investing in research and knowledge generation, and building new partnerships at the continental and global levels. We have begun incorporating green development goals into our sectoral policies and the design of our operations. We are working closely with our client countries to help them build green growth into their national development planning. Among the many challenges involved in achieving sustainable growth, we have identified the following as key priorities for the coming period.
Sustainable infrastructure developmentInfrastructure is the backbone of our investment portfolio. We are progressively adapting our infrastructure projects so that they minimise waste, pollution and emissions and are “climate-proof.” While sustainable infrastructure development entails higher up-front costs, it can offer significant returns over the longer term.
Z Developing sustainable transport networks — To address one of Africa’s most pressing infrastructure gaps, we will Increase our investments in sustainable transport by:
Focusing on regional transport corridors, combining hard infrastructure development with investments that promote inclusive growth and environmental sustainability.
Investing in rural transport to link African farmers and other businesses to their markets. Increasingly offsetting the environmental costs of new transport infrastructure with investments in trees and forests. Helping Africa’s rapidly expanding cities to develop mass transit systems that reduce their reliance on motor vehicles.
Z Improving energy efficiency — We will help develop Africa’s considerable potential for clean energy by:
Continuing to develop Africa’s vast, untapped hydropower potential, linking new generation capacity with distribution networks that enable the benefits of cheaper and cleaner energy to be shared regionally. Exploring the potential for solar and wind power. In Morocco, for example, we will invest in the Koudia el Baida wind farm, which will be one of the biggest in the world.Accompanying major generation projects with investments in rural electrification, reducing the need to burn biomass, which is damaging both to public health and to the environment. For remote locations, helping to develop environmentally friendly, off-grid power solutions. At the community level, promoting the introduction of green technologies such as solar lamps and cleaner stoves.
Conclusion and outlook
Africa continues to be among the most dynamic regions in the developing world. Robust economic growth is lifting Africans out of poverty at an impressive rate and propelling a growing number of African countries towards middle-income status. Yet while growth is indispensable for poverty reduction, the quality of growth is equally important. Achieving Africa long-term development
requires growth that is both sustainable and inclusive. Last year’s ADER emphasised the need for inclusive growth, with the benefits shared equitably across different social groups and geographical areas. This year, our theme has been a broader view on structural transformation, with a particular emphasis on growing African economies sustainably. We need to find development pathways that preserve Africa’s renewable resources, minimise harm to its natural environment and build resilience in the face of a changing climate.
There is no single template or roadmap for achieving inclusive and resilient growth. Each African county has a unique set of socioeconomic conditions and natural endowments. Each must find its own path, in what will inevitably be a lengthy and gradual process. At the African Development Bank, we are ready to work with our regional member countries to help them find their development pathway that is both inclusive and sustainable.
Annual D
evelo
pm
ent Effe
ctiveness R
eview 2
013
55
5
56
Conclusion and outlook
Sustainable management of natural resourcesAfrica is endowed with abundant natural wealth, from its minerals to its land and forests and its extraordinary biodiversity. At present, Africa is enjoying a surge in global demand for its resources. But if this demand is to be a driver of growth and poverty reduction for future generations, it needs to be managed responsibly. Sustainable natural resource management will therefore become an increasingly important part of our portfolio.
Z Sustainable management of renewable resources — A high proportion of Africans depend for their livelihoods on renewable resources like land, forest and fisheries. These resources are under threat through land degradation and desertification. Our activities in this area will include the following:
Helping our partner countries, at the government and community levels, to build policies and capacities for sustainable land, forest and water management. Supporting international cooperation on the management of cross-border resources. Introducing sustainable agricultural technologies and practices that boost food security, improve rural livelihoods and increase resilience to climate change. Investing more in rural water and sanitation, to improve living conditions.
Z Responsible use of non-renewables — Africa’s abundant oil and minerals offer an extraordinary opportunity to bridge the poverty gap. But if they are to provide more than a short-lived resource boom, they must be managed in a sustainable way. We will continue to work with our partner countries to strengthen their management of natural resource flows, and will support sovereign wealth funds and other instruments for channelling these resource flows into productive investments that benefit future generations.
Building resilient livelihoodsAfrica’s climate is changing fast. With so much of its population dependent on rain-fed agriculture, Africa is acutely vulnerable to the effects of climate change. Agricultural yields could be reduced by as much 50% in some areas, while droughts and flooding will become more prevalent. We need to build resilience by strengthening the capacity of governments, communities and households to manage these changes.
Z Building climate resilience — Building resilience is a multidimensional challenge that we will address in a variety of ways:
Using our knowledge generation, policy advice and investments to help diversify African economies, to make them less dependent on a narrow range of agricultural products. Supporting the introduction of new crop varieties and farming methods.
Working with governments and communities to help them anticipate and manage climate risks, and to ensure that resource shortages do not become a source of conflict. Channelling more of our resources towards helping those who are most vulnerable to strengthen their livelihoods and build up their assets.
Z Disaster risk management — We will work with African governments – and particularly with those that face chronic or recurrent emergencies (such as drought in the Horn of Africa and floods in Mozambique) – to build their capacity to manage natural disasters. This means increasing their ability to anticipate and manage risks, reduce vulnerability and prepare for emergencies.
Strengthening our own effectiveness and!efficiencyIn the coming period, we must press ahead with our efforts to become a more responsive, effective and efficient organisation. The ambitious organisational reforms of the past decade have already delivered impressive results, creating a strong platform for our continuing growth and development. To equip ourselves to implement our Ten Year Strategy, three priorities in particular stand out.
Z Mobilising additional financial resources — Shifting to an inclusive and green development path involves major up-front investments. Our own financial resources will provide only a small fraction of the need, especially in an economic climate where growth in donor finance will be limited. To mobilise other sources of funding, we will use our resources creatively in the following ways:
Building stronger partnerships with emerging economies and encouraging South-South investment. Working with new development actors, such as philanthropic foundations. Looking to sovereign wealth and pension funds as promising avenues for long-term investments in sustainable infrastructure. Mobilising private sector investment through public-private partnerships, cofinancing arrangements and risk-sharing instruments. Supporting our partner countries in issuing local currency bonds and helping build the capacity of Africa’s financial markets to raise long-term investment finance. Use our existing resources and instruments more efficiently, ensuring that every dollar we spend unlocks much more from other investors. Increasing the blending of AfDB and ADF resources, particularly for countries moving into middle-income status. Developing more flexible instruments for supporting regional projects.
Annual D
evelo
pm
ent Effe
ctiveness R
eview 2
013
57
Z Moving closer to our clients — Decentralisation is making AfDB a more nimble organisation, able to build stronger partnerships with our clients and respond more flexibly to their needs. Decentralisation will continue to play a key role under our Ten Year Strategy. When it comes to inclusive and green growth, it is our partner countries that will lead, while we will support them. We will continue working to ensure that our field offices have the staff and the authority they need to be effective partners; the skills for high-quality policy dialogue, technical advice and project management; and the ability to make full use of their delegated authority. Our Regional Resource Centres will supplement that capacity, acting as knowledge hubs and providing a platform for engaging more effectively with the regional economic communities and intergovernmental mechanisms. We will continue to support our decentralised staff with the necessary investments in information and communications technology to give them full access to the Bank’s knowledge resources, including when they are on the move. Robust systems and communications will ensure that, despite our decentralised structure, we continue to operate as “One Bank.”
Z An employer of choice — To achieve our goals, we need to attract and retain outstanding people and motivate them to achieve their best. Building on a wide range of improvements to our human resource systems and practices in recent years, we will press ahead with making the Bank the employer of choice for those who are committed to supporting Africa’s development by:
Providing incentives for learning, innovation, teamwork and commitment to results. Continuing to strengthen management skills and
practices, using 360-degree assessments to identify and address shortcomings. Promoting modern work practices with an attractive work-life balance.
Managing for resultsIn this ADER, we report against a Results Measurement Framework (RMF) prepared in 2010 to support implementation of our Medium-Term Strategy. The RMF set out ambitious targets and indicators for tracking our progress towards them. This framework has now come to an end. In 2013, we will launch a new RMF aligned to our Ten Year Strategy, with new and improved ways of measuring our performance as an organisation and our contribution to Africa’s development.
The new RMF will continue to track results over four levels, in line with the practice of other multilateral development banks. It will cover all three of our funding windows and both public and private-sector operations, to enable us to report our results as “One Bank.” In line with the Ten Year Strategy, it will include indicators that measure our contribution to inclusive and green growth, with ambitious but realistic targets to be achieved over a four-year timeframe. It will contain new methods of measuring our value for money, covering effectiveness, efficiency and economy. Gender equity will be mainstreamed across the framework, with gender-specific indicators and sex-disaggregated data wherever relevant. Like the current RMF, it will be selective; with around 100!indicators, it will be broad enough to provide a meaningful overview of our work, but concise enough to facilitate use. Finally, it will focus not just on our outputs but on the changes we help to bring about in the lives and livelihoods of the communities and individuals we aim to support

www.afdb.org Des
ign/
layo
ut: w
ww
.bel
mak
ett.n
et
African Development Bank Temporary Relocation Agency
Angle de l’Avenue du Ghana et des rues Pierre de Coubertin
www.afdb.org
About this publication
About the African Development Bank Group