Embed Size (px)
Citation preview
ADEQUACY OF MONITORING OF INTRAVENOUS FLUIDS IN ELDERLY PATIENTS IN KENYATTA
NATIONAL HOSPITAL
by
DR. KENYATTA GLORIA KAVUTHA
[ dissertation in part fulfilment for the Degree o f Master o f Pharmacy in Clinical Pharmacy o fUniversity o f Nairobi
Dr F. A. Okalebo
Supervisors
Dr K. O. Bosire Dr P. M. Maturi
University of NAIROBI Library
■INOVEMBER, 2010
DECLARATION
I hereby, declare that the work contained herein is my original idea and has not been presented at any other university.
%
Signature
APPROVAL BY SUPERVISORS
This dissertation has been submitted with my approval as a University supervisor.
1. DR. F. A.OKALEBO ....... D ate..J .^ .:.\).-..<̂ rC)l P *
2. DR. K .0. BOSIRE Date ... l i / i l . U t r D .
3. DR. 1>. M. MATURI
DEDICATION
With absolute humility, I am most grateful to Almighty God, without whom nothing is
possible and for all the blessings in my life, which are unquantifiable.
I dedicate this dissertation to my family who are my pillars of strength. I draw immeasurable
inspiration from my parents, Mr Ben Kenyatta and Mrs Christine Kenyatta for their
unwavering support. They have always ensured that I pursue my dreams to get quality
education and a healthy balance in all aspects of life.
I also dedicate this dissertation to my brothers, Ken, Steve and Alex who in moments of
fatigue reminded me “that life was never meant to be that serious”. To all my friends who
make life beautiful and memorable, I will forever be indebted.
ACKNOWLEDGEMENTS
I wish to acknowledge and thank the following individuals for making this study a success.
I salute Dr. F. Okalebo, who despite been on maternity leave, graciously and selflessly
offered me unlimited guidance. I am also indebted to Dr. K. Bosire and Dr. P. Maturi for their
advice and support. I extend a hand of gratitude to Prof. A. Guantai, for her supervisory
support during proposal development. Your insight helped give perspective to this
dissertation 4
Many thanks, to the entire staff of KNH internal medical wards as well as fellow medical
registrars for their facilitation of and contribution towards data collection.
I acknowledge and thank Mrs. Janet Musia and Mr. Moses Mwangi of Centre for Public
Health Research for their role in data analysis.
Cheers to the Clinical Pharmacy year 2010 class for sharing their experiences and providing
me with academic moral support.
IV

Table of ContentsDECLARATION...................................................................................................................... iiDEDICATION......................................................................................................................... iiiACKNOWLEDGEMENTS................................................................................................... ivLIST OF TABLES AND FIGURES.....................................................................................viiABBREVIATIONS............................................................................................................... viiiDEFINITION OF TERMS..................................................................................................... ixABSTRACT...............................................................................................................................x
CHAPTER ONE.......................................................................................................................11.0 INTRODUCTION AND LITERATURE REVIEW............................................... 11.1 Introduction.................................................................................................................11.2 Literature Review................................... f.................................................................2
1.2.1 Basic fluid physiology......................................................................................... 2
1.2.2 Components of IV fluids..................................................................................... 2
1.2.3 Selection of an IV fluid....................................................................................... 4
1.2.4 Guidelines for assessing IV fluid requirements................................................ 5
1.2.5 Guidelines for monitoring of IV fluid therapy.................................................. 5
1.2.6 Complications of IV fluid therapy..................................................................... 6
1.2.7 Patient groups at risk for complication............................................................ 7
1.3 Study problem............................................................................................................ 81.4. Justification............................................................................................................... 91.5 Research questions..................................................................................................... 91.6 Objectives...................................................................................................................10
1.6.1 Main objective....................................................................................................10
1.6.2 Specific Objectives............................................................................................ 10
CHAPTER TWO....................................................................................................................112.0 METHODOLOGY...................................................................................................112.1 Study area..................................................................................................................112.2 Study population.......................................................................................................112.3 Study design...............................................................................................................112.4 Sample size.................................................................................................................112.5 Sampling method......................................................................................................112.6 Inclusion criteria.......................................................................................................122.7 Exclusion criteria......................................................................................................122.8 Data collection and materials.................................................................................. 122.9 Data analysis..............................................................................................................122.10 Definition of cases...................................................................................................132.11 Variables, confounders and outcomes of interest............................................... 132.12 Ethical considerations............................................................................................ 14
v
CHAPTER THREE................................................................................................................153.0 RESULTS AND DISCUSSION.............................................................................. 153.1Baseline characteristics............................................................................................ 153.2. Clinical and laboratory assessments at admission...............................................163.3 Prescribing patterns for IV fluids..........................................................................173.4 Compliance to prescribed IV fluid........................................................................ 183.5 Duration of treatment and reasons for stoppage of IV fluid administration....193.6. Monitoring of IV fluid therapy.............................................................................20
3.6.1. Parameters of fluid balance monitored.......................................................... 20
3.6.2. Adequacy of monitoring.................................................................................. 21
3.6.2.1 Frequency of monitoring each parameter;.............................................. 21
3.6.2.2 Composite measure of adequacy of monitoring;.....................................22
3.7. Factors associated with adequacy of monitoring................................................. 233.8. Prevalence of fluid overload................................................................................... 263.9 Limitations.................................................................................................................26
CHAPTER FOUR...................................................................................................................284.0 CONCLUSION AND RECOMMENDATIONS................................................... 28
REFERENCES........................................................................................................................30
APPENDICES.........................................................................................................................33Appendix A: Letter of approval................................................................................... 33Appendix B: Informed Consent explanation and Consent form...............................34Appendix C: Study eligibility checklist........................................................................ 37Appendix D: Data collection form................................................................................ 38Appendix E: Redesigned IV fluid section of treatment sheet....................................41
vi
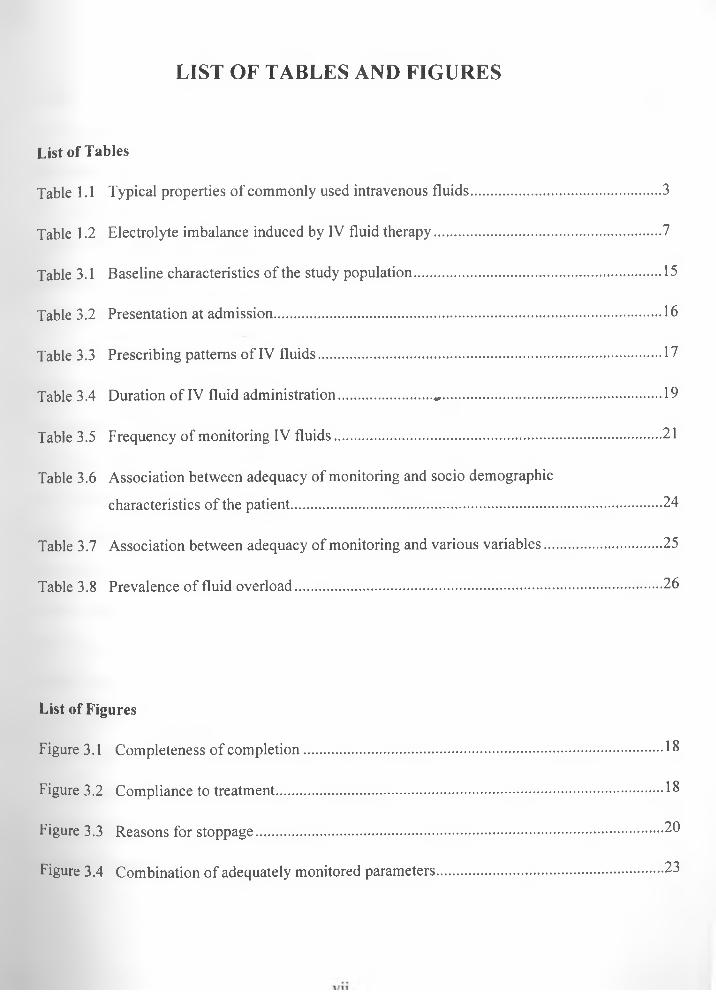
LIST OF TABLES AND FIGURES
List of Tables
Table 1.1 Typical properties of commonly used intravenous fluids...............................................3
Table 1.2 Electrolyte imbalance induced by IV fluid therapy........................................................7
Table 3.1 Baseline characteristics of the study population............................................................. 15
Table 3.2 Presentation at admission................................................................................................ 16
Table 3.3 Prescribing patterns of IV fluids.....................................................................................17
Table 3.4 Duration of IV fluid administration.......................«,.......................................................19
Table 3.5 Frequency of monitoring IV fluids..................................................................................21
Table 3.6 Association between adequacy of monitoring and socio demographic
characteristics of the patient............................................................................................24
Table 3.7 Association between adequacy of monitoring and various variables.............................25
Table 3.8 Prevalence of fluid overload........................................................................................... 26
List of Figures
Figure 3.1 Completeness of completion......................................................................................... 18
Figure 3.2 Compliance to treatment................................................................................................ 18
Figure 3.3 Reasons for stoppage.................................................................................................... 20
Figure 3.4 Combination of adequately monitored parameters........................................................ 23
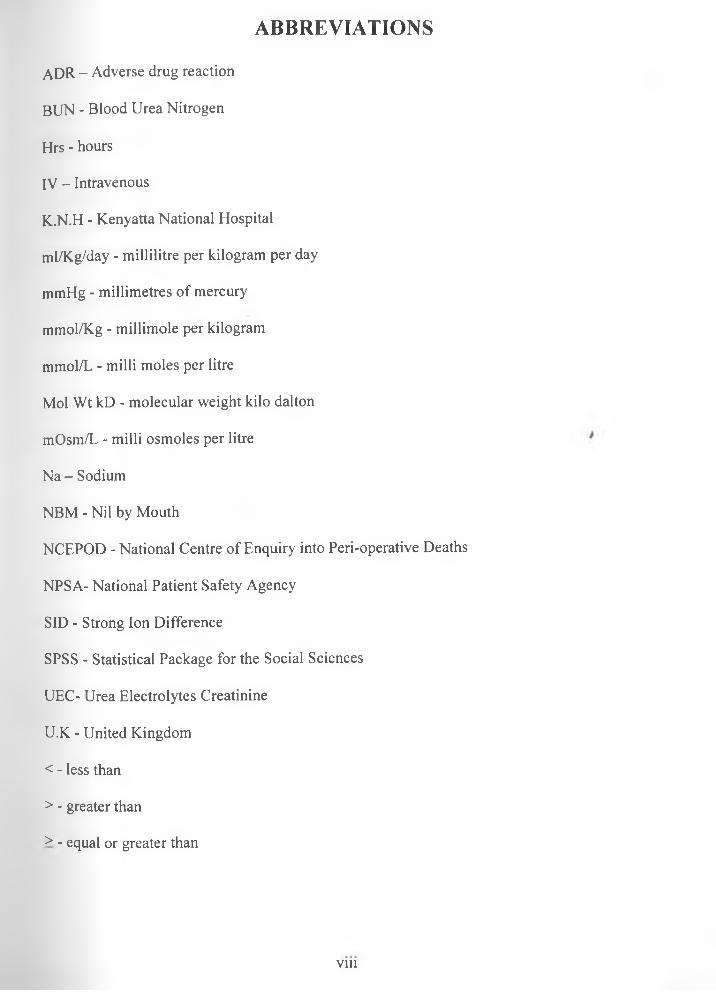
ABBREVIATIONS
ADR - Adverse drug reaction
BUN - Blood Urea Nitrogen
Hrs - hours
IV - Intravenous
K.N.H - Kenyatta National Hospital
ml/Kg/day - millilitre per kilogram per day
mmHg - millimetres of mercury
mmol/Kg - millimole per kilogram
mmol/L - milli moles per litre
Mol Wt kD - molecular weight kilo dalton
mOsm/L - milli osmoles per litre
Na - Sodium
NBM - Nil by Mouth
NCEPOD - National Centre of Enquiry into Peri-operative Deaths
NPSA- National Patient Safety Agency
SID - Strong Ion Difference
SPSS - Statistical Package for the Social Sciences
UEC- Urea Electrolytes Creatinine
U.K - United Kingdom
< - less than
> - greater than
> - equal or greater than
vm
DEFINITION OF TERMS
Elderly- For purposes of this study, elderly refers to adults 50 years and above.
IV fluids - This refers to fluids introduced directly to the vein via an intravenous access
device to correct fluid and electrolyte imbalance. It does not include solutions for total
parenteral nutrition.
Dilutional hyponatremia - A lower than normal concentration of sodium in the blood (<
135mmol/ L) caused by inadequate excretion of water or by excessive water in the circulating
bloodstream.
IX

ABSTRACTBackground
Iatrogenic problems arising from inappropriate IV fluid therapy can increase morbidity and
prolong hospital stay. Among those at risk, are the elderly patients as they have a high burden
of cardio respiratory and renal diseases. Volumes and types of IV fluids will vary depending
on the clinical scenario. Therefore, monitoring of fluid balance parameters is crucial and
should remain consistent regardless of the clinical indications for IV fluids. Research has
revealed gaps in the monitoring of fluid balance among the elderly patients.
ObjectiveThe study thus aimed to establish if IV fluids were prescribed rationally and to determine if
fluid balance was adequately monitored in elderly patients.
Methodology
This was a longitudinal descriptive study. All elderly patients who met the inclusion criteria,
between March and July 2010 in Kenyatta National Hospital, were followed up until the day
of discharge or death. A universal sample of 150 patients was obtained. The data obtained
were entered into a structured data collection form. The data were analyzed using SPSS 12.0
software. Descriptive data analysis was performed on all variables. Exploratory data analysis
was done to assess variables for associations and correlations. Multivariate logistic regression
was done to control for confounding.
Results
A good majority of the patients (87.3 %) had IV fluids rationally prescribed. About 79.3 %
had their baseline UEC determined. The most commonly prescribed IV fluid was Normal
saline. The IV fluid most prone to administration errors was Normal saline alternating with 5
% dextrose. About 25 % of the patients either had no prescriptions for IV fluids or had
incomplete prescriptions, though they received IV fluids. Weight and fluid charting were the
least frequently monitored parameters. In contrast, vital signs and clinical signs and
symptoms were the most frequently monitored (98 %). Determination of baseline UEC,
duration of hospital stay and duration of IV fluid administration were found to be
significantly associated with adequate monitoring. (P<0.05)
x
Conclusion and recommendations
The study found that only 50% of the patients were noted to have had their fluid balance
parameters adequately monitored. Lack of clarity of some of the prescriptions may have
contributed to errors observed. Redesigning of the IV fluid prescription segment of the
treatment sheet will go a long way in ensuring clarity of the prescription. Continuous Medical
Education should be encouraged so as to stress the need to give IV fluid prescriptions just as
much importance as is given to other medication.
xi

CHAPTER ONE
1.0 INTRODUCTION AND LITERATURE REVIEW
1.1 IntroductionIntravenous fluids are broadly classified as crystalloids and colloids. Crystalloids are
solutions of small molecules that dissolve completely in water whereas colloids are
dispersions of large organic molecules.1 Based on their mechanism of distribution,
crystalloids pass freely between the intravascular and interstitial compartments. Examples
include sodium chloride, glucose and Hartmann’s solutions. Colloid solutions, depending on
their molecular size, structure and permeability of the capillaries, remain in the intravascular
compartment and for longer periods than crystalloids.
Colloid solutions used in clinical practice for fluid therapy are divided into the semi synthetic
colloids and the naturally occurring human plasma derivatives. Examples of synthetic
colloids include gelatin, dextrans, and hydroxyethyl starches (HES). The naturally occurring
colloids are human albumin solutions, plasma protein fraction, fresh frozen plasma and
immunoglobulin solutions.3
IV fluids are used to replace or maintain fluid and electrolytes which can be lost in a wide
variety of situations. These include maintaining homeostasis when enteral intake is
insufficient and replacing gastrointestinal losses occur due to diarrhoea, vomiting or fistula.
Other losses arise from urinary tract (for example diabetes insipidus) or from blood loss due
to trauma or surgery. After suffering bums or in episodes of fever, IV fluids are given to
match increased insensible losses. IV fluids are used during anaesthesia, surgery or in
inflammatory conditions such as sepsis, where there is loss of circulating volume due to
vasodilation and leakage of vascular epithelial walls.1,4
Fluid and electrolyte balance is often poorly understood. Iatrogenic problems arising from
inappropriate fluid therapy can increase morbidity and prolong hospital stay.5 When it comes
to IV fluids, one size definitely does not fit all. Volumes and types of IV fluids will vary
depending on the clinical scenario. It is for this reason that monitoring of fluid balance
1
parameters is crucial and should remain consistent regardless of the clinical indications for IV
fluids.6 This study focuses on adult patients.
1.2 Literature Review
1.2.1 Basic fluid physiologyTotal body water in a 70 kg individual is approximately 42 L (60 % of total body weight).
Two thirds of this (28 L) is intracellular water. The remaining third in the extracellular
compartment is divided between the intravascular (3 L) and interstitial (11 L) compartments.
The cell wall separates the intracellular from extracellular compartments. The intravascular
and interstitial compartments are separated by the capillary endothelium and walls of arteries
and veins. Water moves freely across membranes that separate the compartments to maintain
osmotic equilibrium.
Normally, fluid is gained from a person’s food and drink intake while it is lost via urine,
sweat and faeces as well as insensible losses via lung and skin. In healthy individuals,
volume homeostasis is regulated largely by antidiuretic hormone (ADH) which is released
when osmoreceptors and baroreceptors detect small decreases in osmolality and blood
pressure. It then elicits a sensation of thirst and reduces renal excretion of water. Renal
mechanisms also play a role whereby renin-angiotensin mechanism is activated by falling
renal perfusion pressure. However, after injury or during episodes of sepsis or other critical
illness, normal homeostatic mechanisms may not work well.
1.2.2 Components of IV fluidsThe main solute of crystalloid IV fluids is either glucose or sodium chloride. The solutions
may be isotonic, hypotonic or hypertonic with respect to plasma. Potassium, calcium and
lactate may be added to more closely replicate the ionic makeup of plasma. The osmolality of
blood plasma is about 290 mOsm/litre and this sets the standard. Fluids in the range of 240 to
340 mOsm/litre are considered isotonic. Examples include 0.9 % w/v Sodium chloride, 5 %
w/v dextrose and Hartmann’s solution. Those with tonicity above 340 mOsm/litre are
hypertonic while those below 240 mOsm/litre are hypotonic. Crystalloids with an ionic
composition close to that of plasma may be referred to as "balanced’ or "physiological
fluid.3,7
2
Most colloid solutions have the colloidal molecules dissolved in isotonic saline but isotonic
glucose, hypertonic saline and isotonic balanced electrolyte solutions are also used. Their
molecular size can be highly variable. Many modem colloidal solutions are based on
hydroxyethyl starches which have high molecular weights and can provide volume expansion
for 6-24 hrs. There are well recognized and documented differences in the pharmacokinetic
properties of colloids. However, a 2007 meta-analysis failed to show any difference in
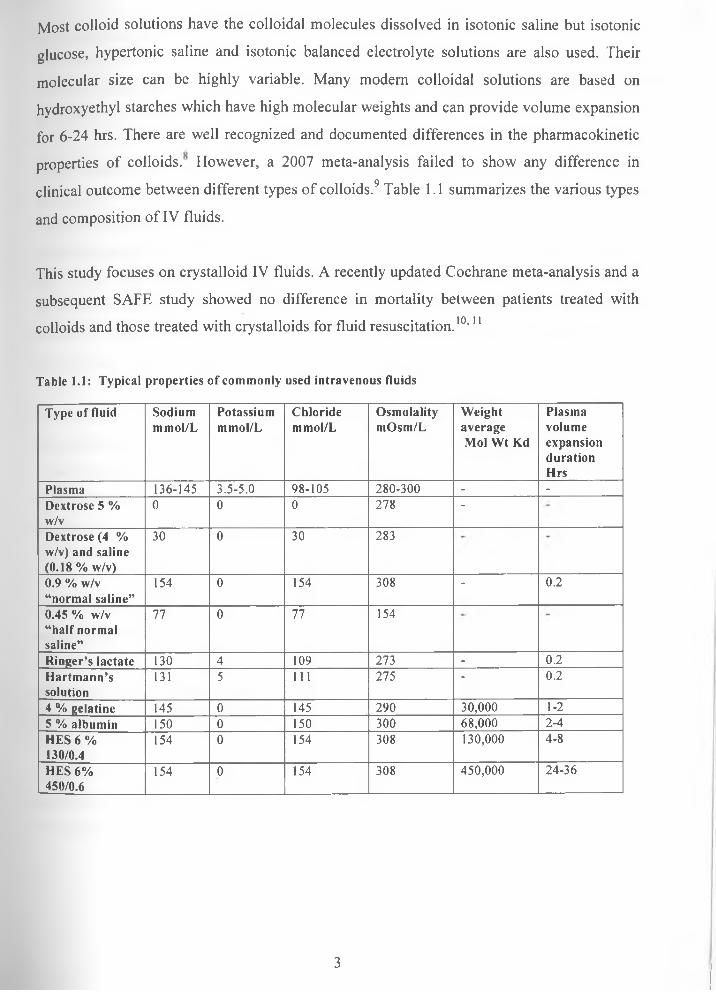
clinical outcome between different types of colloids.9 Table 1.1 summarizes the various types
and composition of IV fluids.
This study focuses on crystalloid IV fluids. A recently updated Cochrane meta-analysis and a
subsequent SAFE study showed no difference in mortality between patients treated with
colloids and those treated with crystalloids for fluid resuscitation.10,11
Table 1.1: Typical properties of commonly used intravenous fluids
Type of fluid Sodiummmol/L
Potassiummmol/L
Chloridemmol/L
OsmolalitymOsm/L
Weight average Mol Wt Kd
PlasmavolumeexpansiondurationHrs
Plasma 136-145 3.5-5.0 98-105 280-300 - -Dextrose 5 % w/v
0 0 0 278 -
Dextrose (4 % w/v) and saline (0.18 % w/v)
30 0 30 283
0.9 % w/v “normal saline”
154 0 154 308 - 0.2
0.45 % w/v “half normal saline”
77 0 77 154
Ringer’s lactate 130 4 109 273 - 0.2Hartm ann’ssolution
131 5 111 275 - 0.2
4 % gelatine 145 0 145 290 30,000 1-25 % albumin 150 0 150 300 68,000 2-4HES 6 % 130/0.4
154 0 154 308 130,000 4-8
HES 6% 450/0.6
154 0 154 308 450,000 24-36
3
1.2.3 Selection of an IV fluidDeciding which fluids are appropriate for each patient depends on the type of fluid lost and
the body compartment(s) that require additional volume. IV fluids are prescribed either for
resuscitation or for maintenance.
Fluid resuscitation is required in situations where there is acute circulatory shock or
intravascular volume depletion. The objective is to restore circulating volume and increase
cardiac output thus restoring tissue perfusion and oxygen delivery. Usually large volumes of
fluid are required in the short term. Sodium or colloid based solutions can be used to achieve
this. Fluids that distribute throughout total body water such as glucose do not restore
intravascular volume and can worsen interstitial oedema in those with inflammatory
conditions. Where large volumes of fluid are required for longer periods, a crystalloid of a19 1 ̂ 90more physiological composition such as Hartmann’s solution is preferred. ' ’
For a patient requiring fluid maintenance with healthy kidneys and no co-morbidities that
affect fluid homeostasis, a suitable regimen aims to provide 1-1.5 mmol/Kg sodium,
1 mmol/Kg potassium per day and 30 ml/kg/day of water. Calcium and magnesium
supplementation is considered where oral intake is interrupted for a few days. Often a
combination of a glucose based and second fluid to boost intravascular volume (usually a
sodium based fluid) will suffice.
Isotonic glucose solution is prescribed to treat simple dehydration and provide water
replacement. The small amount of glucose in the isotonic solution is rapidly metabolized, thus
allowing the solvent water to freely distribute throughout total body water. The hypertonic
glucose solutions are given to provide glucose as a metabolic substrate in hypoglycaemia or in
combination with insulin therapy.15'20
After identifying the type of fluid that will best treat the deficit or maintain euvolumia, the
appropriate rate of fluid administration guided by clinical assessment and safety limits of
each fluid is determined.
4
1.2.4 Guidelines for assessing IV fluid requirementsOn admission, patients’ medical histories give an indication of their expected fluid status.
Patients’ conditions suggestive of a fluid deficit include haemorrhage, vasodilation,
diarrhoea, and vomiting, insensible or renal losses. In addition, signs such as thirst, reduced
skin turgor, dry mucous membranes, increased capillary refill time and altered levels of
consciousness, are strong indicators for institution of IV fluid therapy.
When a patient has volume depletion, heart rate increases so as to maintain tissue perfusion.
Blood pressure only begins to fall when the intravascular volume drops by 20-30 %. ' ’
Urine becomes more concentrated and in more severe cases of volume depletion, a fall in
urine output will be noted. Thus hypotension and acute renal failure are strong indicators for
IV fluid therapy.
Checking lab values is vital for clues of fluid imbalance. Elevated plasma sodium (> 145
mmol/L), hematocrit and urea (> 6 mmol/L) indicate dehydration as does acidosis from a
blood gas analysis.
1.2.5 Guidelines for monitoring of IV fluid therapyIV fluid administration requires monitoring the clinical response and for signs of adverse
effects to ensure safety and efficacy. To evaluate the desired endpoint, the hydration status is
monitored by checking urine output, heart rate, capillary filling time and blood pressure. A
patient’s subjective report of feeling better and absence of thirst can indicate successful
therapy as well as a return of sodium, urea and creatinine levels to normal.
Since fluid overload is common to all IV fluids, one needs to monitor for this. This is
indicated by neck vein distension, adventitious lung sounds and respiratory distress as well as
vital signs showing increased blood pressure, heart or respiratory rate. Weighing and
documenting initial and daily weight is the simplest and most reliable means of monitoring
fluid status.
For immobile patients and the high risk patients, accurate monitoring of overall intake and
output is vital to tailor fluid administration. This includes losses via urine drains, stoma or
nasogastric aspirates. In addition insensible losses via respiratory tract and skin are estimated
5

and compared with patients normal physiological requirements. The normal daily water
intake and output for an adult is 2500 to 3000 ml. Invasive techniques for monitoring, such as
measurement of central venous pressure and use of techniques like oesophageal Doppler or
thermodilution are usually restricted to critical care areas.
In a study done in a London hospital, it was found that the most frequently monitored
parameters of fluid balance are daily serum urea, creatinine and sodium levels. Initial weight
and daily weight is not frequently monitored yet they are non-invasive procedures.21
It is important to note that all signs and symptoms need to be evaluated as a whole since their
specificity in isolation is limited. All observations should be interpreted in the context of a
patient’s clinical diagnosis. Prescribers also need to be aware of any concurrent conditions or
medication that can predispose the patient to adverse effects from fluid therapy or alter fluid
distribution. ’’4’5’22-24
1.2.6 Complications of IV fluid therapyThese can broadly be classified as those due to excessive fluid administration, electrolyte
imbalance and those due to inadequate fluid replacement. Insufficient fluid administration
leads to a reduced effective circulating volume. Diversion of blood away from non vital
organs towards the vital organs results in pre-renal renal failure and inadequate tissue
perfusion.3,25-27
Fluid overload as a result of excessive fluid has no precise definition but complications arise
in the context of pre-existing cardiorespiratory disease and severe acute illness. This results
when the heart fails to pump the expanded circulatory volume effectively. Over distension of
the left ventricle causes heart failure and hence pulmonary oedema. This presents as a cough
with pink frothy sputum and respiratory distress that worsens when lying down. Abdominal
compartment syndrome (ACS) is also a recognized consequence. It arises as a result of an
acute rise in intra-abdominal pressure usually > 20 mmHg. It is characterized by difficulty in
breathing and decreased urine output due to compression of renal arteries and veins. The
bowel develops severe oedema reducing visceral perfusion and leading to bowel ischemia.25
6
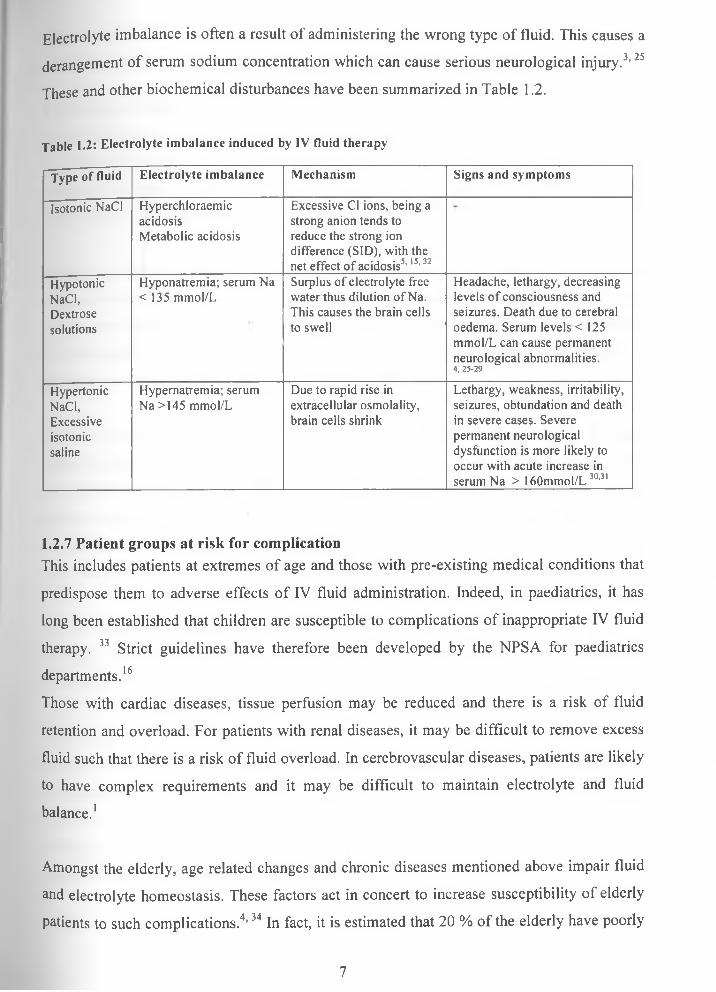
Electrolyte imbalance is often a result of administering the wrong type of fluid. This causes a
derangement of serum sodium concentration which can cause serious neurological injury.3,25
These and other biochemical disturbances have been summarized in Table 1.2.
Table 1.2: Electrolyte imbalance induced by IV fluid therapy
Type of fluid Electrolyte imbalance Mechanism Signs and symptoms
Isotonic NaCl HyperchloraemicacidosisMetabolic acidosis
Excessive Cl ions, being a strong anion tends to reduce the strong ion difference (SID), with the net effect of acidosis5,15,32
HypotonicNaCl,Dextrosesolutions
Hyponatremia; serum Na < 135 mmol/L
Surplus of electrolyte free water thus dilution of Na. This causes the brain cells to swell
Headache, lethargy, decreasing levels of consciousness and seizures. Death due to cerebral oedema. Serum levels < 125 mmol/L can cause permanent neurological abnormalities.4 , 2 5 -2 9
HypertonicNaCl,Excessiveisotonicsaline
Hypernatremia; serum Na >145 mmol/L
Due to rapid rise in extracellular osmolality, brain cells shrink
Lethargy, weakness, irritability, seizures, obtundation and death in severe cases. Severe permanent neurological dysfunction is more likely to occur with acute increase in serum Na > 160mmol/L 30,31
1.2.7 Patient groups at risk for complicationThis includes patients at extremes of age and those with pre-existing medical conditions that
predispose them to adverse effects of IV fluid administration. Indeed, in paediatrics, it has
long been established that children are susceptible to complications of inappropriate IV fluid
therapy. 33 Strict guidelines have therefore been developed by the NPSA for paediatrics
departments.16
Those with cardiac diseases, tissue perfusion may be reduced and there is a risk of fluid
retention and overload. For patients with renal diseases, it may be difficult to remove excess
fluid such that there is a risk of fluid overload. In cerebrovascular diseases, patients are likely
to have complex requirements and it may be difficult to maintain electrolyte and fluid
balance.1
Amongst the elderly, age related changes and chronic diseases mentioned above impair fluid
and electrolyte homeostasis. These factors act in concert to increase susceptibility of elderly
patients to such complications.4,34 In fact, it is estimated that 20 % of the elderly have poorly
7

documented fluid balance or have fluid imbalance that is unrecognized or untreated. 35
Therefore, fluid administration has to be particularly balanced in these groups of people.
1.3 Study problemResearch has shown that IV fluids are often administered with little regard for actual fluid
and electrolyte needs. It has also shown that prescribers are often not aware of sodium and
potassium contents of common IV fluids. In addition, the review and monitoring of IV
fluids is less consistent compared to that of other injectable drugs.
Iatrogenic problems arising from inappropriate fluid therapy can increase morbidity and
prolong hospital stay. This is especially seen in patients with coexisting cardiac, renal,
cerebral and respiratory diseases or those at risk of hemodynamic instability. Irrational use of
IV fluids arises as a result of inappropriate prescribing, lack of monitoring as well as lack of
guidelines and knowledge on the practical aspects of IV fluids.
A report by the NCEPOD criticized the fluid management of the elderly patients. This may
reflect inadequate training of junior hospital doctors who are responsible for most of the
prescriptions of IV fluids. For instance an evaluation of the level of training and the clinical
practice of pre-registration house officers and senior house officers in south Wales showed
that 58 % had never received any formal training on the subject and that 36 % did not check
either the clinical details or the blood results before prescribing IV fluids.36
A study done in a university hospital, Nottingham UK, found that training on the subject of37IV fluids in both undergraduate and postgraduate does not prepare prescribers for the task.
In Kenya, no studies have been done on the practical aspects of fluid and electrolytes therapy.
Traditionally “elderly” is defined as age over 65. However, chronological age is only one of
the determinants of factors pertinent to drug therapy. The onset of renal, cardiovascular and
most chronic diseases often begin at age 45 years in the Kenyan context. Thus patients' aged
45 to 64 years, though not elderly are prone to adverse drug reactions due to declining body
functions. Given that the life expectancy at birth in Kenya is 52 and 55 years for men and
women respectively, arbitrarily assigning persons above 50 years as elderly may apply.35,38 40
8

1.4. JustificationIn absence of guidelines for monitoring IV fluids for the elderly or those with chronic
conditions, the study aimed to establish baseline data on the prescribing and monitoring of IV
fluids in K.N.H.
With regard to prescribing of IV fluids, this study showed whether clinical details or
biochemical results were checked prior to their administration. Thus revealed any shortfalls
or cases where there was no rationale for giving IV fluids.
The study was done in a resource constrained setting. Its findings on parameters of fluid
balance that were routinely assessed and monitored were used to draw comparison with
findings of other studies done in well resourced settings. That was done in view of parameters
that should have been more keenly and feasibly followed in our setting.
The study also drew conclusions on the incidence of IV fluid induced adverse effects. That
was not a primary objective however that information provided evidence for the need to
closely monitor IV fluid therapy in the elderly patients.
Where gaps were identified, findings of the study would help initiate dialogue on strategies
that can inform, guide and regulate decisions of prescribers on the use of IV fluids. Elderly
patients are selected because they had an increased risk for iatrogenic complications of
inappropriate fluid therapy.
1.5 Research questions
1) What baseline assessments were done prior to prescribing IV fluids?
2) What are the most commonly prescribed IV fluids?
3) What are the deficiencies in prescriptions for IV fluids?
4) How frequently are measures of fluid balance monitored?
5) What is the prevalence of fluid overload as an adverse effect of IV fluid therapy?
9
1.6 Objectives
1.6.1 Main objectiveThe main objective of the study was to assess adequacy of monitoring of intravenous fluids in
patients aged 50 years and above in K.N.H
1.6.2 Specific ObjectivesThe specific objectives of the study were to:
1) Find out what baseline clinical and laboratory assessment was done prior to
prescribing IV fluids and conditions for which IV fluids are prescribed.
2) Identify types of IV fluids prescribed.3) Establish how frequently measures of fluid balance were monitored once IV fluid
therapy was initiated.4) Assess the prevalence of fluid overload as an adverse effect of inappropriate IV fluids
administration.
10
CHAPTER TWO
2.0 METHODOLOGY
2.1 Study areaThe study was carried out in internal medical wards of Kenyatta National Hospital, which is
the main teaching and referral hospital in Eastern Africa.
2.2 Study populationThe study population was elderly patients aged 50 years and above admitted to K.N.H
medical wards between March to July 2010.
2.3 Study designThis was a longitudinal descriptive study carried out between March to July 2010 on patients
admitted during that time interval.
2.4 Sample sizePrevalence of poorly documented fluid balance or fluid imbalance that is unrecognised or
untreated in the elderly is 10-20 % .21
Sample size was therefore calculated using the formulae:
N= [p (1-p)] / (S.E)2..................................................................... Equation [1]
Where;
S.E was the standard error or accepted level of precision set at ±5 %
P was the hypothesised prevalence of poorly documented fluid balance 10 %.
Using equation [1], the minimal study population was 144 subjects however 150 patients
were recruited.
2.5 Sampling methodSampling of the patients was carried out on post admission days. All patients who met the
inclusion criteria were recruited from the admitting wards over a period of 3 days every
fortnight from March to July 2010. On the sampling days, a universal sample was obtained.
11
2.6 Inclusion criteria
The inclusion criteria were as follows: Patients 50 yrs and above, receiving IV fluids within
the preceding 24 hrs of the survey days and who consented to the study
2.7 Exclusion criteriaThe exclusion criterion was patients with non medical condition such as surgical patients.
2.8 Data collection and materialsA pre-designed data collection instrument was pre-tested and modified. The data collection
form is appended (Appendix D). Data collection took place during a twelve week period
between March and July 2010.
Data was collected from the following sources: patient medical records, drug charts,
observation charts and laboratory reports which are all contained in the patients’ file, as well
as the patient. Where there was need to verify information, patients were interviewed. Data
was collected daily until the day of discharge or death.
2.9 Data analysis
Data collected were entered into and analyzed using SPSS 12.0 software. Accuracy of the
data entered was counterchecked daily by the investigator. Descriptive data analysis was
performed on all variables. The medians and range were reported for variables that showed
skewed distribution. Exploratory data analysis was performed to examine the variables for
associations and correlations. A bivariate analysis using chi-squared test was done to
determine the association between categorical variables.
Odds ratios (OR) and 95 % confidence intervals (Cl) associated with adequate monitoring
were calculated. Logistic regression modelling was done with only variables that had p-value
< 0.06 in the bivariate analysis. Model building was done by a forward stepwise combination
of the predictive variables to successfully determine Akaike Information Criterion (AIC).
Those that were then found to be significantly associated with the outcome were retained in
the final model. All p-values were two tailed at a significance of 5 %.
12
2.10 Definition of casesThe following criteria were used to define adequacy of monitoring parameters of fluid
balance and adverse effects of IV fluid therapy.
Adequacy of monitoring; At least one UEC determined every three days of a patient been
on IV fluid other than the baseline, daily recording of vitals, daily observation of clinical
signs and symptoms with regard to evidence of dehydration or oedema, taking weight
measurements every two days (besides the baseline measurement) and at least one hemogram
every 3 days, charting of input and output for catheterized patients
For each patient, the total number of adequately monitored parameters was computed and this
was then used as an index of the adequacy of monitoring.
Adverse effects of IV fluid therapy; Signs of fluid overload after institution of IV fluids
therapy included, patients who developed or had worsening of pre-existing oedema,
respiratory distress characterised by dyspnoea, cough with pink frothy sputum and crackles,
worsening of hypertension within 24 hrs of instituting IV fluids characterised by a rise in
diastolic blood pressure by > 10 mmHg and dilutional hyponatremia defined by serum Na
levels < 135 mmol/L
2.11 Variables, confounders and outcomes of interest
The main outcome of interest was adequacy of monitoring measures of fluid balance.
The independent variables/ confounders were patients' demographics, NBM status,
immobility, consciousness, pre-existing medical conditions that predispose to fluid overload,
determination of UEC within 24 hrs of initiating IV fluid therapy, length of hospital stay,
duration of IV fluid therapy, adverse effects attributable to IV fluid therapy and concurrent
medication.
13
2.12 Ethical considerationsEthical approval for this study was granted by K. N. H Research and Ethics Committee as per
the attached letter of approval (Appendix A). Consent from the patients or their relatives
were also sought as per attached consent form (Appendix B).
Review of information from the patient and their files was done within the wards to ensure
confidentiality. Patients’ names were not included in the data collection form. Patients were
assigned study numbers in place of actual hospital numbers. In the case that a clinically
important issue was discovered by the investigator, it was followed up according to KNH
procedures
CHAPTER THREE
3.0 RESULTS AND DISCUSSION
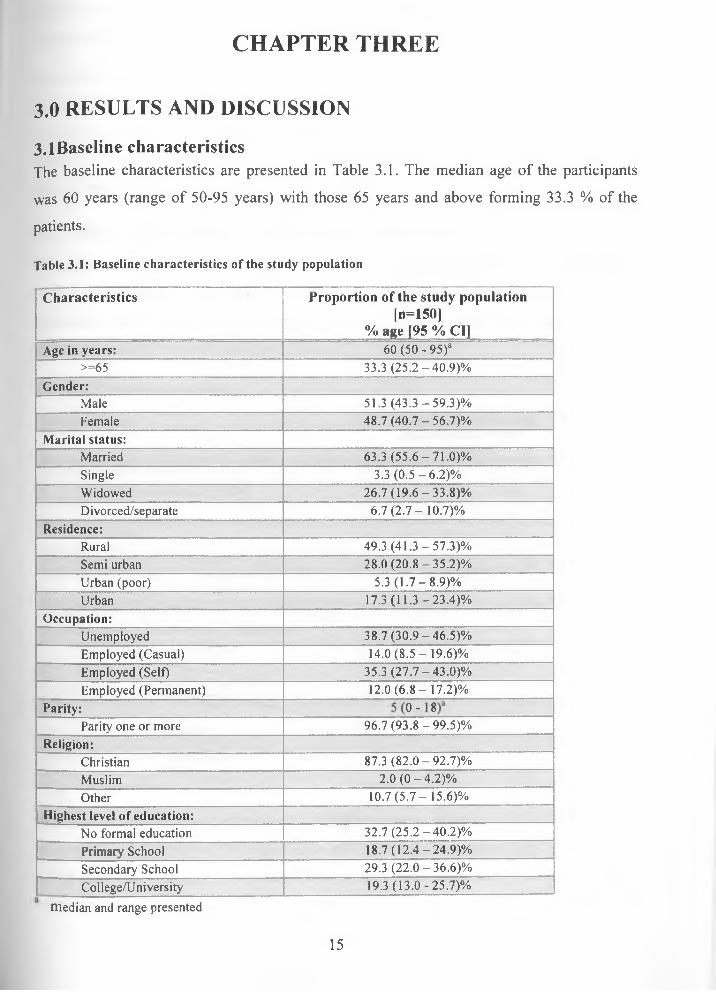
3.1BaseIine characteristicsThe baseline characteristics are presented in Table 3.1. The median age of the participants
was 60 years (range of 50-95 years) with those 65 years and above forming 33.3 % of the
patients.
Table 3.1: Baseline characteristics of the study population
Characteristics Proportion o f the study population [n=1501
% age [95 % Cl]Age in years: 60 (50 - 95)a
>=65 33.3 (25.2-40.9)%Gender:
Male 51.3 (43.3 -59.3)%Female 48.7 (40.7 - 56.7)%
Marital status:Married 63.3 (55.6-71.0)%Single 3.3 (0 .5-6 .2)%Widowed 26.7(19.6-33.8)%Divorced/separate 6.7 (2 .7-10.7)%
Residence:Rural 49.3 (41.3 -57.3)%Semi urban 28.0 (20.8-35.2)%Urban (poor) 5.3 (1 .7-8 .9)%Urban 17.3(11.3-23.4)%
Occupation:Unemployed 38.7(30.9-46.5)%Employed (Casual) 14.0 (8 .5-19.6)%Employed (Self) 35.3 (27.7-43.0)%Employed (Permanent) 12.0 (6 .8-17.2)%
Parity:
oo1o
Parity one or more 96.7(93.8-99.5)%Religion:
Christian 87.3 (82.0-92.7)%Muslim 2.0 (0 -4 .2 )%Other 10.7 (5 .7 - 15.6)%
Highest level of education:No formal education 32.7 (25.2-40.2)%Primary School 18.7(12.4-24.9)%Secondary School 29.3 (22.0-36.6)%College/University 19.3 (13.0-25.7)%
median and range presented
15
Slightly more males (51.3 %) than females were recruited. At the time of the study, 63.3%
were married and a cumulative 96.7% were noted to have been at least once married.
The majority of the participants (87.3 %) were Christians by religion and 49.3 % resided in
the rural areas. Almost all, 96.7 % had children and the median number of children was 5
(range of 0-18). Just over half the population (51.4%), either had no formal education or
stopped at primary school. About 36% were unemployed while 35.3 % were self employed,
most of who were subsistence farmers.
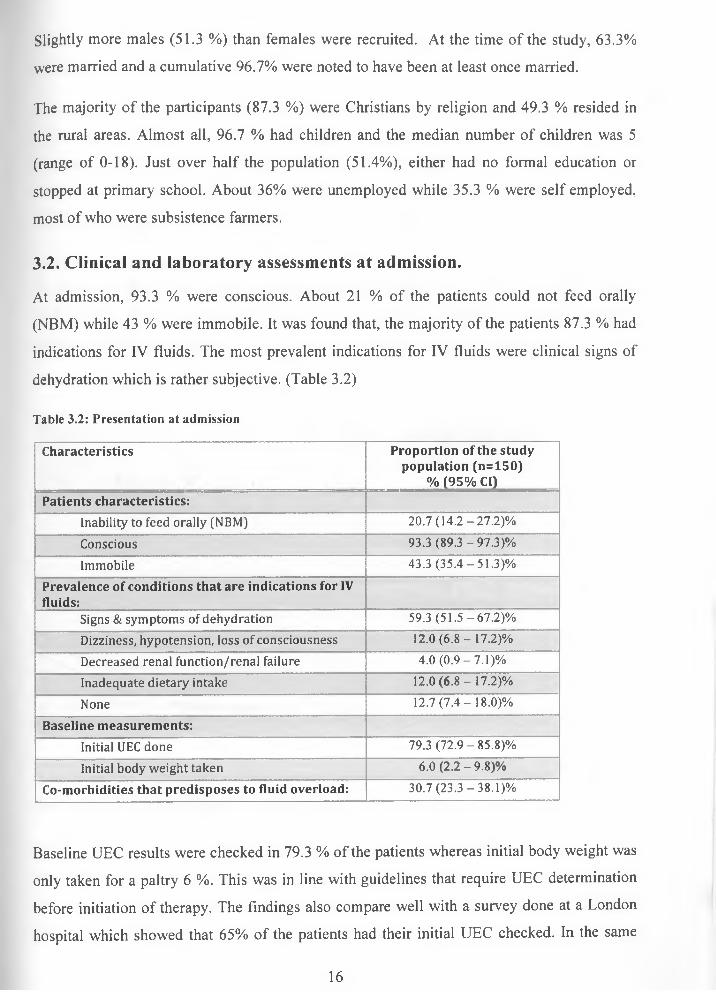
3.2. Clinical and laboratory assessments at admission.
At admission, 93.3 % were conscious. About 21 % of the patients could not feed orally
(NBM) while 43 % were immobile. It was found that, the majority of the patients 87.3 % had
indications for IV fluids. The most prevalent indications for IV fluids were clinical signs of
dehydration which is rather subjective. (Table 3.2)
Table 3.2: Presentation at admission
Characteristics Proportion o f the study population (n = 150)
% (95% Cl)Patients characteristics:
Inability to feed orally (NBM) 20.7(14.2-27.2)%
Conscious 93.3 (89.3 -97.3)%
Immobile 43.3 (35.4-51.3)%
Prevalence o f con d itions th at are ind ications for IV fluids:
Signs & symptoms of dehydration 59.3 (51.5-67.2)%
Dizziness, hypotension, loss of consciousness 12.0 (6.8-17.2)%
Decreased renal function/renal failure 4.0 (0.9 -7 .1)%
Inadequate dietary intake 12.0 (6.8-17.2)%
None 12.7(7.4-18.0)%
B aseline m easurem ents:
Initial UEC done 79.3 (72.9-85.8)%
Initial body weight taken 6.0 (2 .2-9 .8)%
Co-m orbidities that p red isp oses to fluid overload: 30.7 (23.3 -38.1)%
Baseline UEC results were checked in 79.3 % of the patients whereas initial body weight was
only taken for a paltry 6 %. This was in line with guidelines that require UEC determination
before initiation of therapy. The findings also compare well with a survey done at a London
hospital which showed that 65% of the patients had their initial UEC checked. In the same
16
survey, 85% of doctors claimed that they were likely to check initial UEC prior to prescribing
IV fluids.
Only a quarter of the doctors claimed to check initial weight. Indeed only 46.8 % of patients
had their initial weight determined in the same London survey, which is eight times higher
than that observed in our own setting. It was however noted that 12.7 % of the patients did
not have any indications for IV fluids. These patients may actually have had indications for
IV fluids but this information may have been missing from the records.
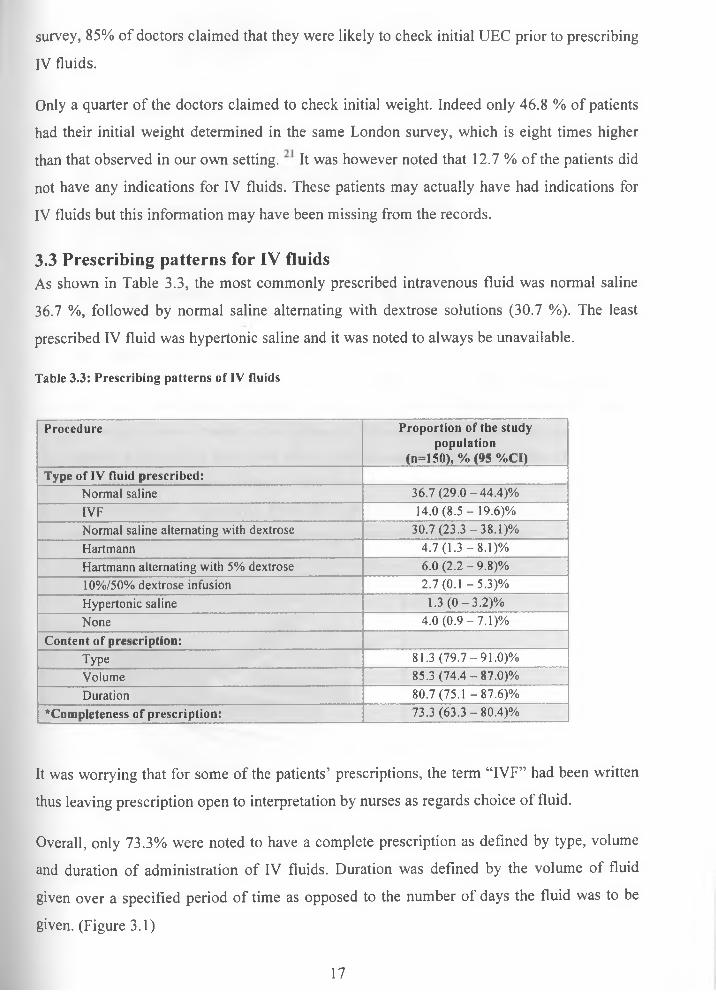
3.3 Prescribing patterns for IV fluidsAs shown in Table 3.3, the most commonly prescribed intravenous fluid was normal saline
36.7 %, followed by normal saline alternating with dextrose solutions (30.7 %). The least
prescribed IV fluid was hypertonic saline and it was noted to always be unavailable.
Table 3.3: Prescribing patterns of IV fluids
Procedure Proportion of the study population
(n=150), % (95 %CI)Type of IV fluid prescribed:
Normal saline 36.7(29.0-44.4)%IVF 14.0 (8.5-19.6)%Normal saline alternating with dextrose 30.7(23.3 -38.1)%Hartmann 4.7 (1 .3-8 .1)%Hartmann alternating with 5% dextrose 6.0 (2.2 - 9.8)%10%/50% dextrose infusion 2.7 (0.1 -5 .3)%Hypertonic saline 1.3 (0 -3 .2 )%None 4.0 (0 .9-7 .1)%
Content of prescription:Type 81.3 (79.7-91.0)%Volume 85.3 (74.4-87.0)%Duration 80.7 (75.1 -87.6)%
*CompIeteness of prescription: 73.3 (63.3 -80.4)%
It was worrying that for some of the patients’ prescriptions, the term “IVF” had been written
thus leaving prescription open to interpretation by nurses as regards choice of fluid.
Overall, only 73.3% were noted to have a complete prescription as defined by type, volume
and duration of administration of IV fluids. Duration was defined by the volume of fluid
given over a specified period of time as opposed to the number of days the fluid was to be
given. (Figure 3.1)
17
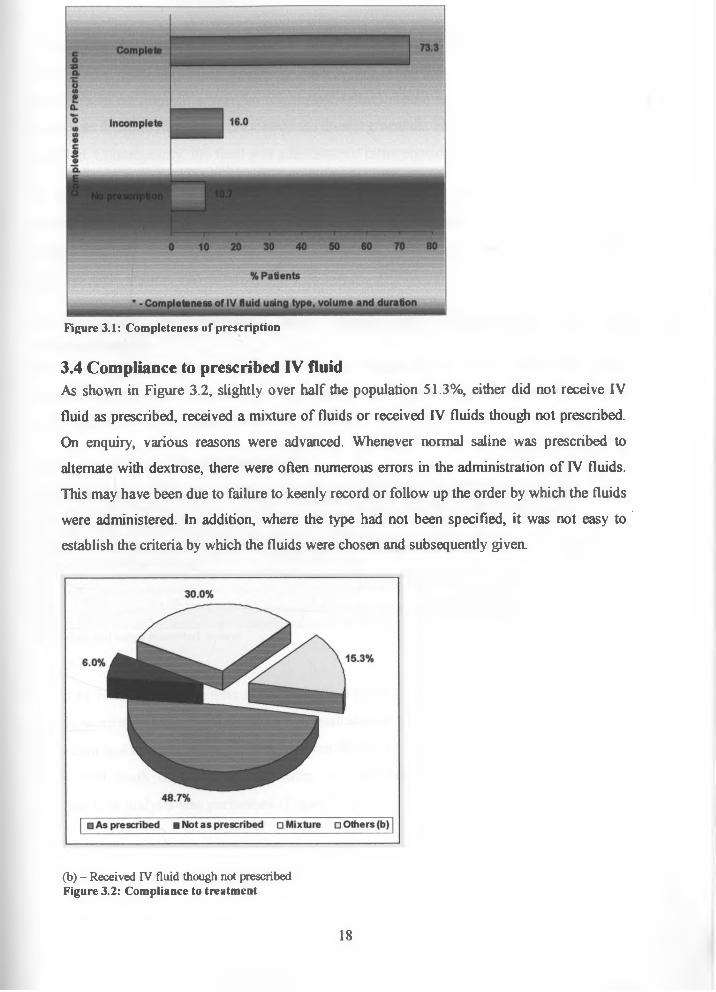
Figure 3.1: Completeness of prescription
3.4 Compliance to prescribed IV fluidAs shown in Figure 3.2, slightly over half the population 51.3%, either did not receive IV fluid as prescribed, received a mixture of fluids or received IV fluids though not prescribed. On enquiry, various reasons were advanced. Whenever normal saline was prescribed to alternate with dextrose, there were often numerous errors in the administration of IV fluids. This may have been due to failure to keenly record or follow up the order by which the fluids were administered. In addition, where the type had not been specified, it was not easy to establish the criteria by which the fluids were chosen and subsequently given.
(b) - Received IV fluid though not prescribed Figure 3.2: Compliance to treatment
18
About 15 % of the patients received IV fluids even though they had not been prescribed. For
some, it was found out that abbreviations such as V/S (vital signs 4 hourly) were confused to
mean N/S (a common abbreviation for normal saline). There are a few cases where normal
saline was found to have been prescribed for dressing wounds but this had not been expressly
specified. Consequently, the fluid was administered intravenously.
In others, it was simply an error as there were no clear reasons given, however,
administration of the fluid was subsequently stopped. All these errors may have resulted from
the fact that only 73.3 % of the patients prescriptions were found to have clarity as regards
specified type, volume and duration.
3.5 Duration of treatment and reasons for stoppage of IV fluid administrationThe median length of hospital stay was 6 days (range of 1-21 days) while the median
duration of intravenous fluid therapy was 3 days (range of l-16days). Almost two thirds were
on IV fluids for 3 days. (Table 3.4)
Table 3.4: Duration of IV fluid administration
Characteristics Proportion of the study population (n=150), % (95 % Cl)
Length of stay in hospital: 6(1 - 21)cMedian of days patient was on IV fluid: 3(1 — 16)cDuration of IV fluid therapy:
1 -3 56.7 (48.7 - 64.6)%4-6 24.0(17.2-30.8)%
>6 19.3 (13.0-25.7)%c - Median and range presented in days
About 41 % of the patients were noted to achieve better hydration status. Some of the patients
(28 %), were either noted to have fluid administration stopped due to adverse effects or where
the patient had no clear reasons for been given the fluids. The rest of the patients received the
fluids until death of the patient, transfer to a different ward or hospital or until when
transfusion or dialysis was performed (Figure 3.3).
19

n Better hydration■ Adverse effect of IV noted□ Patient not meant to be on IVF□ Dialysis done■ Transfer of patients
Figure 3.3: Reasons for stoppage
3.6. Monitoring of IV fluid therapy
3.6.1. Parameters of fluid balance monitored
Six parameters namely UEC, daily weight, vitals, clinical signs and symptoms, fluid charting and hemogram were followed up. While determination of blood glucose levels is not an indicator of fluid balance, it was also followed up. This was because it sometimes was the reason for initiating IV fluid therapy or determining the end point for giving the fluids. The latter however was noted to only be keenly followed up in the diabetic population as expected.
Amongst the non invasive parameters, clinical signs and symptoms as well as vitals were the easiest and most frequently monitored parameters. These were monitored daily in about 98% of the patients as shown in Table 3.5. In contrast, daily weight was the most unpopular and was only checked in two patients (1.3 %). For the invasive parameters, a cumulative 84 % of the patients had their UEC determined at least once besides the baseline UEC results. At least one hemogram was obtained in 82.7 % of the patients while 26.6% had their fluid charting
well done.
20
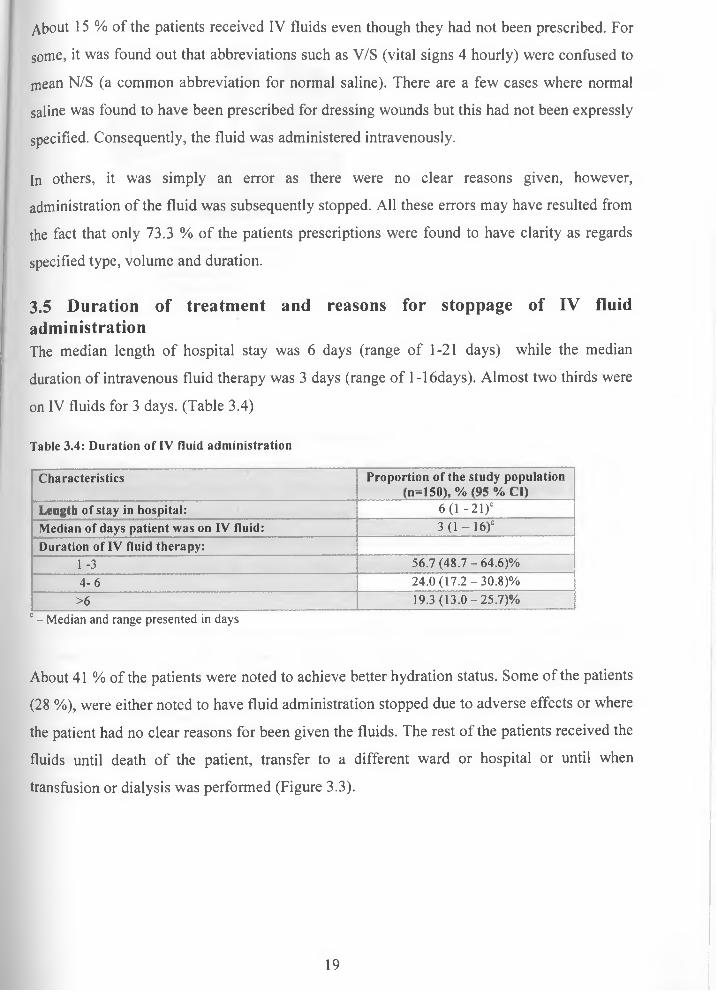
3.6.2. Adequacy of monitoring
Adequacy of monitoring was assessed in two ways: the observed frequency vis a vis the
defined criteria of recommended frequency and a composite measure for adequacy which
took into consideration all parameters.
Table 3.5: Frequency of monitoring IV fluids
Parametermonitored
Observed frequency *
Proportion of patients N=150
Recommendedfrequency of monitoring
* *
Proportion of adequately
monitored patients N=150, % (95% Cl)
Vitals Daily 98.0 % Daily 98.0 (95.8 - 100)%Not done 2.0 %
Clinical signs & symptoms
Daily 98.7 % Daily 98.7 (96 .8 - 100)%Not done 1.3 %
Daily weight Once 1.3% Once every 2 days 0.0 %Not done 98.7 %
UEC Once 48.7 % Once every 3 days 62.7 (54 .9-70 .4)%2 - 4 times 31.3%> 4 times 4.0 %Not done 16.0%
Fluid charting Not done 73.4% Daily charting for catheterized patients
12.7(7 .4-18 .0)%Wellcharted
26.6 %
Hemogram Once 74.7 % Once every 3 days 63.3 (55 .6-71 .0)%Twice 5.3 %Thrice 2.7%Not done 17.3%
*- This excludes baseline measurements **- Criteria as defined in case definition
3.6.2.1 Frequency of monitoring each parameter;The only two parameters that were adequately monitored were vital signs and clinical signs
and symptoms. These were monitored daily as required in almost 100 % of the patients as
shown in Table 3.5. Vitals give a measure of intravascular fluid balance while clinical
evidence of oedema and dehydration are indices of extracellular volume as is daily weight.
Daily weight, which was determined only once in two patients, was the most inadequately
monitored parameter. Indeed for those two patients, weight may have been taken for other
reasons. This compares with resource enabled centres where only 9.4 % of patients were• • * 2 1 found to have their daily weight monitored.
Admittedly, daily weight monitoring is more cumbersome in an adult or geriatric patient
particularly where there are few or no bedside weighing machines. Even when the machines
21

are availed, the healthcare team may be too few and overburdened thus not motivated to take
these measurements. However, despite all that, weight alone has been long established to
provide an accurate guide to assessment of fluid requirements and status. It also is non
invasive and provides just as useful information in comparison to the more invasive
parameters such as UEC and catheterization associated with higher costs, bleeding and risk
of infection.
For the invasive parameters, of the 84 % and 26.6 % of the patients’ who had their UEC and
fluid charting routinely monitored respectively, only 62.7 % and 12.7 % of these patients
respectively were noted have the above parameters adequately monitored. The high
percentage of UEC monitoring maybe explained by a general perception that laboratory
results provide more accurate information on hydration status and end organ function. In
addition, it is easy to check UEC even in the bed bound or critically ill (immobile patients).
For immobile patients the odds of having been adequately monitored by fluid charting were
1.3 times more than the non-immobile patients. Similarly, the odds of having been adequately
monitored by UEC were 1.7 times more in the immobile than in the non-immobile. This
however was not found to be significant (p=0.535 and p=0.073 respectively).
A strict and accurate fluid charting of input and output provides a potential surrogate marker
for daily weight where a millilitre fluid discrepancy is equivalent to 1 milligram change in
body weight. 1,16,21,30 in our setting, fluid output was found not to be recorded consistently yet
it was a crucial index of end organ perfusion for the immobile patients that enables
comparison with fluid intake. This may be explained by the delay in time taken to catheterize
these patients and the laborious nature of recording on the chart by an over stretched team of
nurses.
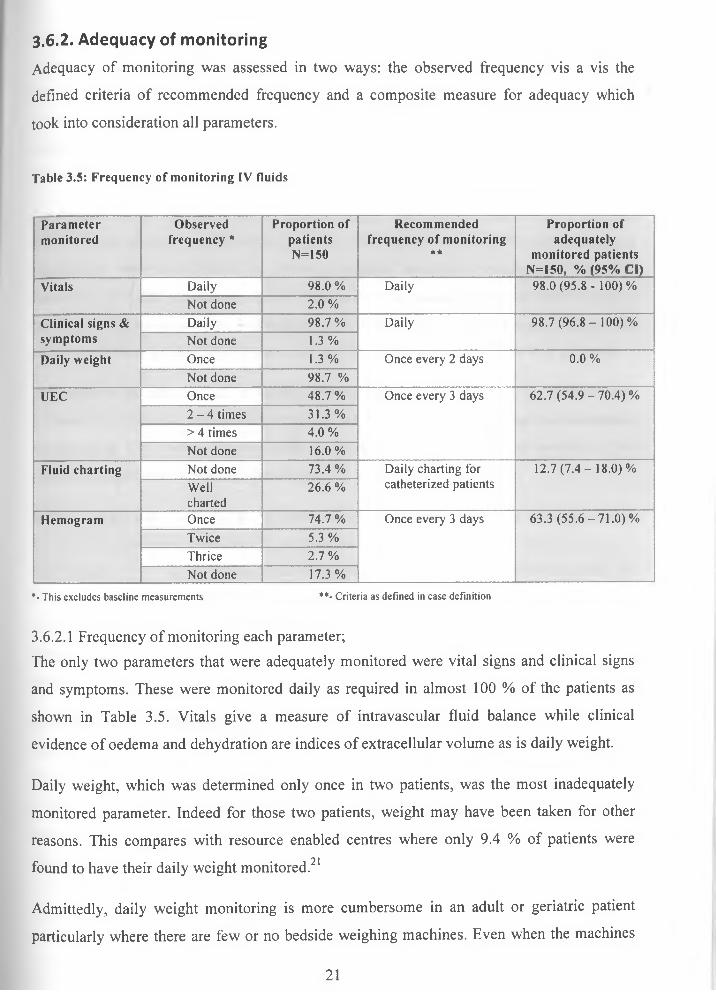
3.6.2.2 Composite measure of adequacy of monitoring;The total number of parameters monitored in a single patient was used as a composite
measure of adequacy. Among the seven parameters followed up, daily weight was left out as
it was 100% inadequately measured in all the patients. Glucose was also left out as it was
both not a measure of fluid balance and noted to have been only keenly followed in the
diabetic population.
22
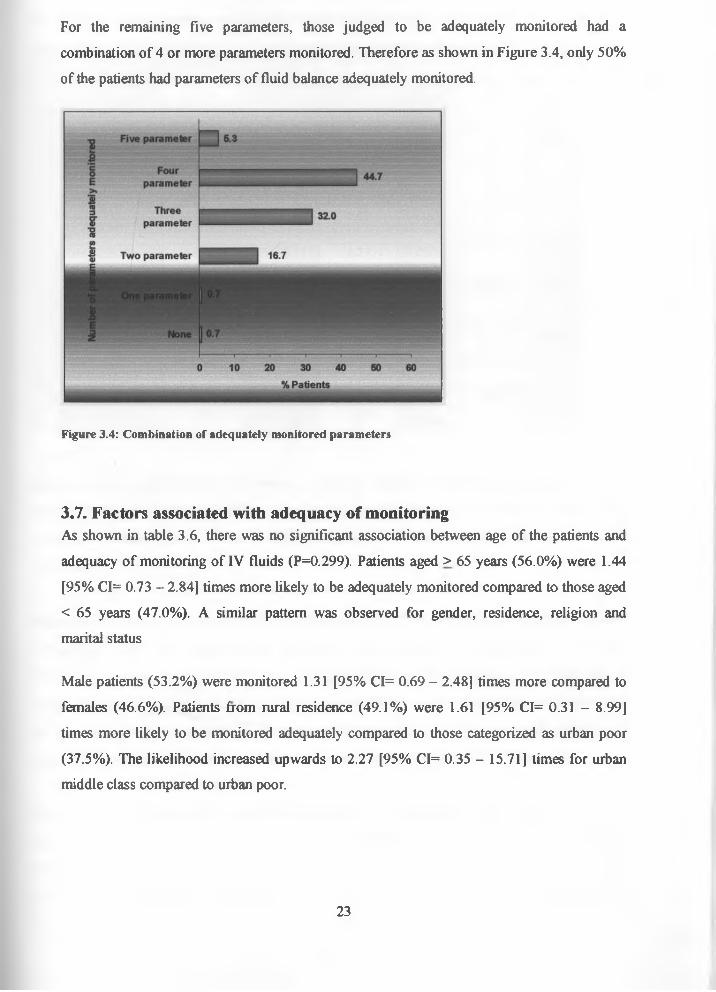
For the remaining five parameters, those judged to be adequately monitored had a combination of 4 or more parameters monitored. Therefore as shown in Figure 3.4, only 50% of the patients had parameters of fluid balance adequately monitored.
Figure 3.4: Combination of adequately monitored parameters
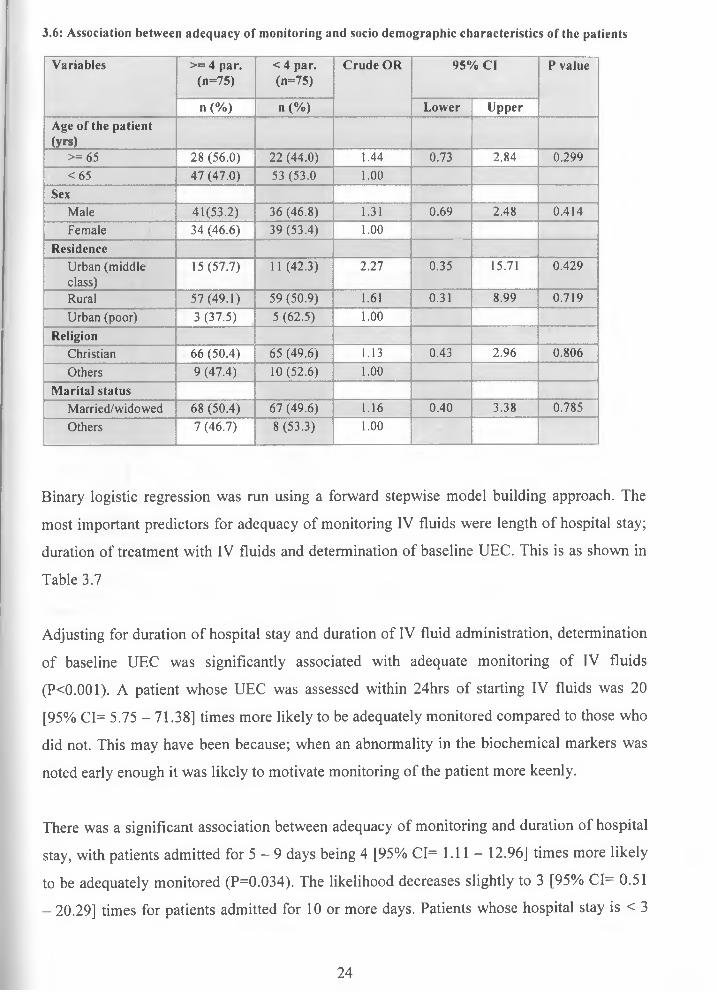
3.7. Factors associated with adequacy of monitoringAs shown in table 3.6, there was no significant association between age of the patients and adequacy of monitoring of IV fluids (P=0.299). Patients aged > 65 years (56.0%) were 1.44 [95% CI= 0.73 - 2.84] times more likely to be adequately monitored compared to those aged < 65 years (47.0%). A similar pattern was observed for gender, residence, religion and marital status
Male patients (53.2%) were monitored 1.31 [95% CI= 0.69 - 2.48] times more compared to females (46.6%). Patients from rural residence (49.1%) were 1.61 [95% CI= 0.31 - 8.99] times more likely to be monitored adequately compared to those categorized as urban poor (37.5%). The likelihood increased upwards to 2.27 [95% CI= 0.35 - 15.71] times for urban middle class compared to urban poor.
23
3.6: Association between adequacy of monitoring and socio demographic characteristics of the patients
Variables >= 4 par. (n=75)
< 4 par.(n=75)
Crude OR 95% Cl P value
n (%) n (%) Lower UpperAge of the patient (yrs)
>= 65 28 (56.0) 22 (44.0) 1.44 0.73 2.84 0.299<65 47 (47.0) 53 (53.0 1.00
SexMale 41(53.2) 36 (46.8) 1.31 0.69 2.48 0.414Female 34 (46.6) 39 (53.4) 1.00
ResidenceUrban (middle class)
15(57.7) 11 (42.3) 2.27 0.35 15.71 0.429
Rural 57(49.1) 59 (50.9) 1.61 0.31 8.99 0.719Urban (poor) 3 (37.5) 5 (62.5) 1.00
ReligionChristian 66 (50.4) 65 (49.6) 1.13 0.43 2.96 0.806Others 9 (47.4) 10(52.6) 1.00
Marital statusMarried/widowed 68 (50.4) 67 (49.6) 1.16 0.40 3.38 0.785Others 7 (46.7) 8(53.3) 1.00
Binary logistic regression was run using a forward stepwise model building approach. The
most important predictors for adequacy of monitoring IV fluids were length of hospital stay;
duration of treatment with IV fluids and determination of baseline UEC. This is as shown in
Table 3.7
Adjusting for duration of hospital stay and duration of IV fluid administration, determination
of baseline UEC was significantly associated with adequate monitoring of IV fluids
(PO.OOl). A patient whose UEC was assessed within 24hrs of starting IV fluids was 20
[95% CI= 5.75 - 71.38] times more likely to be adequately monitored compared to those who
did not. This may have been because; when an abnormality in the biochemical markers was
noted early enough it was likely to motivate monitoring of the patient more keenly.
There was a significant association between adequacy of monitoring and duration of hospital
stay, with patients admitted for 5 —9 days being 4 [95% CI= 1.11 — 12.96] times more likely
to be adequately monitored (P=0.034). The likelihood decreases slightly to 3 [95% CI= 0.51
- 20.29] times for patients admitted for 10 or more days. Patients whose hospital stay is < 3
24
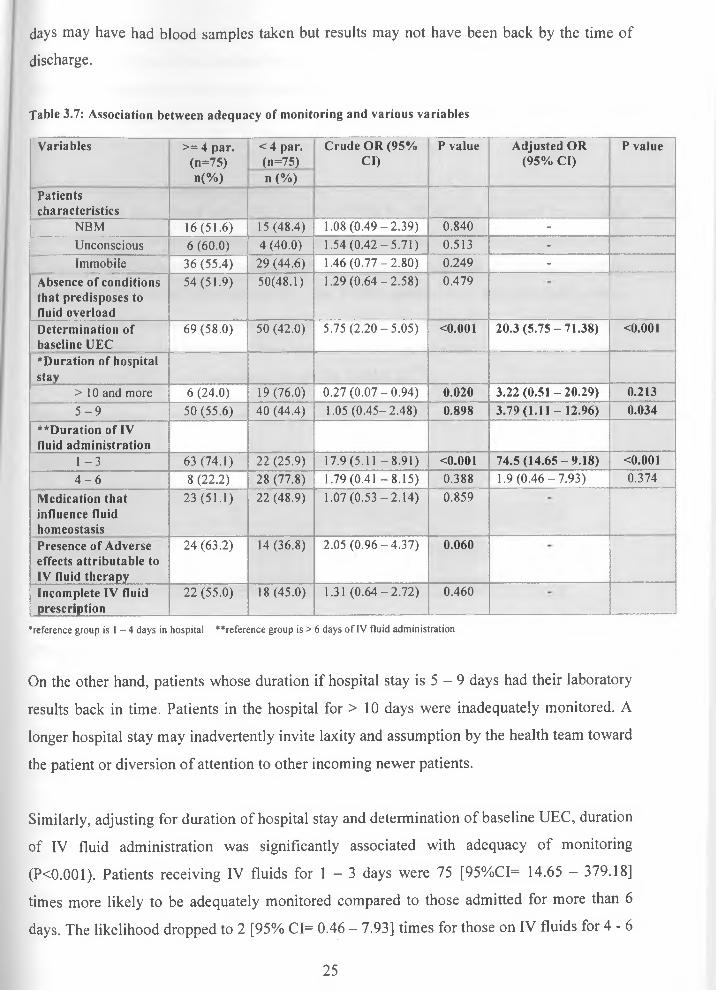
days may have had blood samples taken but results may not have been back by the time of
discharge.
Table 3.7: Association between adequacy of monitoring and various variables
Variables >= 4 par. (n=75) n(%)
< 4 par. Crude OR (95% (n=75) Cl) n (%)
P value Adjusted OR P value (95% Cl)
Patientscharacteristics
NBM 16(51.6) 15(48.4) 1.08 (0.49-2.39) 0.840 -Unconscious 6 (60.0) 4 (40.0) 1.54 (0.42-5.71) 0.513 -Immobile 36 (55.4) 29 (44.6) 1.46 (0.77-2.80) 0.249 -
Absence of conditions that predisposes to fluid overload
54 (51.9) 50(48.1) 1.29 (0.64-2.58) 0.479
Determination of baseline UEC
69 (58.0) 50 (42.0) 5.75 (2.20-5.05) <0.001 20.3 (5.75-71.38) <0.001
*Duration of hospitalstay
> 10 and more 6 (24.0) 19(76.0) 0.27(0.07-0.94) 0.020 3.22 (0.51 - 20.29) 0.2135 - 9 50 (55.6) 40 (44.4) 1.05 (0.45-2.48) 0.898 3.79(1.11 -12.96) 0.034
**Duration of IV fluid administration
1 - 3 63 (74.1) 22 (25.9) 17.9 (5 .11-8.91) <0.001 74.5(14.65-9.18) <0.0014 - 6 8 (22.2) 28 (77.8) 1.79 (0.41 -8 .15 ) 0.388 1.9 (0 .46-7 .93) 0.374
Medication that influence fluid homeostasis
23 (51.1) 22 (48.9) 1.07 (0.53-2.14) 0.859
Presence of Adverse effects attributable to IV fluid therapy
24 (63.2) 14 (36.8) 2.05 (0.96-4.37) 0.060
Incomplete IV fluid prescription
22 (55.0) 18(45.0) 1.31 (0.64-2.72) 0.460
■"reference group is 1 - 4 days in hospital ""reference group is > 6 days of IV fluid administration
On the other hand, patients whose duration if hospital stay is 5 - 9 days had their laboratory
results back in time. Patients in the hospital for > 10 days were inadequately monitored. A
longer hospital stay may inadvertently invite laxity and assumption by the health team toward
the patient or diversion of attention to other incoming newer patients.
Similarly, adjusting for duration of hospital stay and determination of baseline UEC, duration
of IV fluid administration was significantly associated with adequacy of monitoring
(PO.OOl). Patients receiving IV fluids for 1 - 3 days were 75 [95%CI= 14.65 - 379.18]
times more likely to be adequately monitored compared to those admitted for more than 6
days. The likelihood dropped to 2 [95% CI= 0.46 — 7.93] times for those on IV fluids for 4 -6
25
days. The shortest duration of IV fluid therapy is consistent with one week ( 5 - 9 days) of
hospital stay. This may be explained by the drive to ensure drastic recovery in those severely
dehydrated presenting with pre-renal renal failure to prevent the more serious and difficult to
reverse parenchymal renal failure.
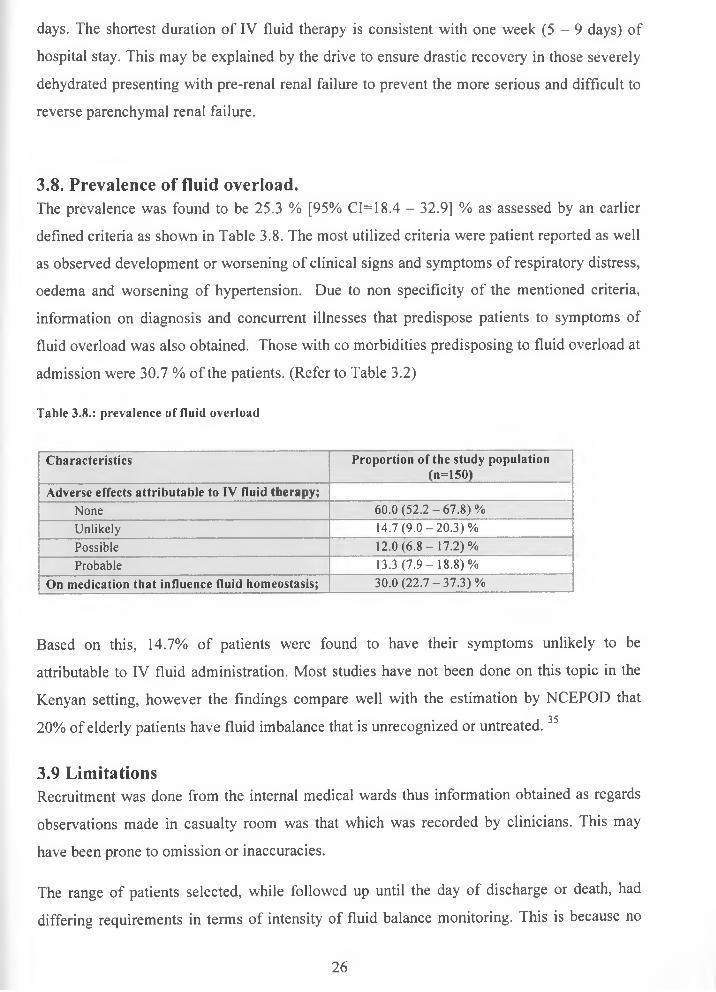
3.8. Prevalence of fluid overload.The prevalence was found to be 25.3 % [95% CI= 18.4 - 32.9] % as assessed by an earlier
defined criteria as shown in Table 3.8. The most utilized criteria were patient reported as well
as observed development or worsening of clinical signs and symptoms of respiratory distress,
oedema and worsening of hypertension. Due to non specificity of the mentioned criteria,
information on diagnosis and concurrent illnesses that predispose patients to symptoms of
fluid overload was also obtained. Those with co morbidities predisposing to fluid overload at
admission were 30.7 % of the patients. (Refer to Table 3.2)
Table 3.8.: prevalence of fluid overload
Characteristics Proportion of the study population (n=150)
Adverse effects attributable to IV fluid therapy;None 60.0 (52 .2 -67 .8 )%Unlikely 14.7 (9 .0 -2 0 .3 )%Possible 12.0 (6 .8 -1 7 .2 )%Probable 13.3 (7 .9 -1 8 .8 )%
On medication that influence fluid homeostasis; 30.0 (22 .7 -37 .3 )%
Based on this, 14.7% of patients were found to have their symptoms unlikely to be
attributable to IV fluid administration. Most studies have not been done on this topic in the
Kenyan setting, however the findings compare well with the estimation by NCEPOD that3520% of elderly patients have fluid imbalance that is unrecognized or untreated.
3.9 LimitationsRecruitment was done from the internal medical wards thus information obtained as regards
observations made in casualty room was that which was recorded by clinicians. This may
have been prone to omission or inaccuracies.
The range of patients selected, while followed up until the day of discharge or death, had
differing requirements in terms of intensity of fluid balance monitoring. This is because no
26
exclusion was made on the basis of different fluid requirements as regards resuscitation or
maintenance regimens thus this may have affected the precision of observations made.
Lack of local and national guidelines on administration and monitoring of IV fluids among
the adults and elderly patients thus this study borrowed from NPSA guidelines for
paediatrics, recommendations of NCEPOD as well those of an audit done in London District
General Hospital.
27
CHAPTER FOUR
4.0 CONCLUSION AND RECOMMENDATIONS
While there were various indications for IV fluids for a good majority of the patients, only
half the patients were noted to be adequately monitored.
The intravenous fluid prescription section on the treatment sheet should be redesigned to
enhance clarity of the prescription and improve the ease with which it is reviewed on a daily
basis. It should thus include sections for the date, type of IV fluid, additives and dose of
additives, rate and route of administration. (Appendix E)
If possible, an already pre- mixed dextrose saline solution should be purchased to replace the
practice of prescribing normal saline alternating with 5 % dextrose. The latter was quite
prone to errors as regards the order with which fluids were given.
The health care team should use as many parameters to accurately assess patients IV fluid
needs and thus monitor thereon for clinical response and adverse effects. The various
parameters should then be interpreted as a whole and not in isolation as well as in context of a
patients’ clinical diagnosis. In a resource constrained setting, the following are recommended.
As is already been done, all elderly patients should have their vitals checked daily as these
are indices of intravascular volume. There should be daily observation for signs and
symptoms reflective of fluid status. This includes checking for clinical evidence of edema or
dehydration as these are indices of extracellular fluid balance. Thirdly, where possible all
elderly patients should be weighed in the casualty department and prior to initiation of IV
fluids. Thereafter weight measurements should be taken every 2 days throughout the period
of IV fluid administration.
For the immobile patients, strict input and output charts should be maintained. Daily fluid
balance should be documented consistently and accurately. These are indices of end organ
perfusion. Both weight and fluid balance should be documented adjacent to the IV fluid
prescription section of the treatment sheet. Initial UEC should be determined prior to or
within 24 hrs of initiating IV fluids. Thereafter measurements should be repeated every 48
hrs of initiation of IV fluid therapy. However, where plasma electrolytes are found to be
28
abnormal, then repeated measurements every 24 hrs whilst the patient is on IV fluids should
be done.
Continuous medical education sessions should be held on the need to give just as much
importance to IV fluid prescriptions as is given to other medications. In addition, knowledge
on both judicious selection of a fluid regimen and adequate monitoring will reduce costs and
morbidity associated with inappropriate fluid administration.
Further exploration with a smaller more selective patient sample can be done prospectively to
establish with more precision the rate of complications of IV fluid administration as regards
both fluid overload and insufficient hydration. The information obtained from this and other
studies done in future can be used to initiate dialogue on local standards and protocols of
administering and monitoring IV fluids in adults and elderly patients. This is in view of age
related changes and high burden of cardio-respiratory, renal and cerebral vascular diseases
amongst this age bracket that predispose to adverse effects of IV fluids.
29
REFERENCES1. Katharina F, Mark B, Christine C. (2008), Intravenous fluid therapy. Hospital
Pharmacist 15:271-4.
2. Jeremy PT, Peter G, Lobo DN, et al. (2009), British consensus guidelines on
intravenous flu id therapy fo r adult surgical patients. (GIFTASUP). London: NH S
National Library o f Health.
http://www.ics.ac.uk/downloads/2008112340 GIFTASUP%20FINAL 31-10-08.pdf (accessed 11 January 2009).
3. Grocott MP, Mythen MG, Gan TJ. (2005). Perioperative fluid management and clinical outcomes in adults. British journal o f Anaesthesia and Analgesia 100:1093- 106.
4. Shafiee MA, Bohn D, Hoorn EJ, et al. (2003), How to select optimal fluid therapy. Quarterly Journal o f Medicine: 96:549-52.
5. Lobo DN. (2004), Fluid electrolytes and nutrition: the Proceedings o f the Nutrition
Society 63:453-66 (last retrieval date: 2/18/2009)
6. Andrew S, John D, Chris A. (2008), Intravenous fluid therapy. Hospital Pharmacist
15:277-82.
7. Terry J. (ed): (1995), Intravenous therapy: Clinical principles and practice. Philadelphia, L: "Back to Basics, would you hang these I.'V.solutions” American
Journal o f Nutrition. (6):37-39
8. Boldt J, Suttner S. (2005) Plasma substitutes. Minerva Anestesiol 71:741-758.
9. Bunn F, Trivedi D, Ashraf S. (2007), Colloid solutions for fluid resuscitation. Cochrane Database o f Systematic Reviews, Issue 4.
10. Perei P, Roberts I. (2007), Colloids versus crystalloids for fluid resuscitation in critically ill patients. Cochrane Database o f Systematic Reviews, Issue 3.
11. The SAFE study investigators. (2004), A comparison of albumin and saline for fluid resuscitation in the intensive care unit. New England Journal o f Medicine 350:2247- 56.
12. Rivers E, Nguyen B, Hanstad S, et al. (2001), Early goal-directed therapy in the treatment of severe sepsis and septic shock, New England Journal o f Medicine
345:1368-77.
30
13. Dellinger RP, Levy MM, Carlet JM, et al. (2008), Surviving sepsis campaign: International guidelines for management of severe sepsis and septic shock, Critical
Care Medicine 36:296-327.
14. Cotton BA, Guy JS, Morris JA, et al. (2006), The cellular metabolic and systemic consequences of aggressive fluid resuscitation strategies. Shock 26:115-21.
15. Morgan TJ. (2005), Clinical review: the meaning of acid base abnormalities in the intensive care unit- effect of fluid administration. Critical Care 9:204-11.
16. National Patient Safety Agency. (2007), Patient Safety Alert 20: Promoting safer use of injectable medicines, London:The Agency.
17. Aber TS, Hosac AM, Veach MP, et al. (2002), Fluid therapy in the critically ill patient, Journal o f Pharmacy Practice 15:114.
18. Scottish Intercollegiate Guidelines Network. (2004), Postoperative management in adults (guideline 77), Edinburgh: The Network.
19. Halperin ML, Skorecki KL.(1986), Interpretation of the urine electrolytes and osmolality in the regulation of body fluid tonicity. America Journal o f Nephrology,
6:241-5.rWeb ofSciencel
20. Vassar MJ, Perry CA, Holcroft JW. (1990), Analysis of potential risks associated with 7.5% sodium chloride resuscitation of traumatic shock. Archives o f Surgery 125:1309- 15.
21. Ferenczi E, Datta SJ, Chopada A. (2007), Intravenous fluid administration in elderly patients at a London hospital: A two-part audit encompassing ward-based fluid monitoring and prescribing practice by doctors. International Journal o f Surgery
5:408-12.
22. Lin M, Liu SJ, Lim IT. (2005) Disorders of water imbalance. Emergency Medicine
Clinics o f North America 23:749.
23. Subramanian S, Ziedalski TM. (2005), Oliguria, volume overload, Na+ balance, and diuretics. Critical Care Clinics 21(2):291.
24. Stems, R. FI. "Disorders of water and sodium balance: Introduction." 2002. www.medscape.com/viewarticle/535477 (3 Aug. 2007).
25. Andrew KH, Vincent AP, Carlos DS. (2008), Avoiding common problems associated with intravenous fluid therapy. Medical Journal o f Australia 189 (9):509-13.
31
26. Allison SP, Lobo DN. (2004) Fluid and electrolytes in the elderly. Current Opinion in
Clinical Nutrition and M etabolic Care 7:27-33.
27. Pearse RM, Harrison DA, James P, et al. (2006), Identification and characterisation of the high-risk surgical population in the United Kingdom. Critical Care 10:81.
28. Adrogue HJ, Madias NE. (2000), Hyponatremia. New England Journal o f Medicine
342:1581-89.
29. Adrogue HJ, Madias NE.(2000), Hypernatremia. New England Journal o f Medicine 342:1493-99.
30. Schrier RW, ed. (2003), Renal and electrolyte disorders, 6th ed. New York:Lippincott Williams and Wilkins
31. Rose BD, Post TW.(2001), Clinical Physiology o f Acid-B ase and Electrolyte Disorders, 5th ed, New York: McGraw-Hill
32. Scheingraber S, Rehm M, Sehmisch C, et al. (1999), Rapid saline infusion produces hyperchloremic acidosis in patients undergoing gynecologic surgery. Anesthesiology 90:1265-70.1Web ofSciencel
33. Morirtz ML, Ayus JC. (2003), Prevention of hospital acquired hyponatremia: a case for using isotonic saline in maintenance fluid therapy. Pediatrics 111:227-30
34. Kugler JP, Hustead T. (2000), Hyponatremia and Hypernatremia in the elderly. American Family Physician 61:3623-30.
35. Callum KG, Gray AJ, Martin IC, et al. (1999), Extremes of age: the elderly.NCEPOD 55-102.
36. Lobo DN, Dube MG, Neal KR, et al. (2001), Problems with solutions: drowning in the brine of an inadequate knowledge base. Clinical Nutrition 20:125-30.
37. Somasekar K, Somasekar A, Hayat G, et al. (2003), Fluid and electrolytes: how do junior doctors measure up? Hospital Medicine 64:369-70.
38. Bimbaum LS: Pharmadokinetic basis of age related changes in sensitivity to toxicants. Annual Review o f Pharmacology and Toxicology. 1991:31:101
39. Life expectancy and health life expectancy at birth: www.who.int>WHO>countries>Kenya.
40. Definition of elderly person in Africa: www.who.int/. ./index.html
32
APPENDICES
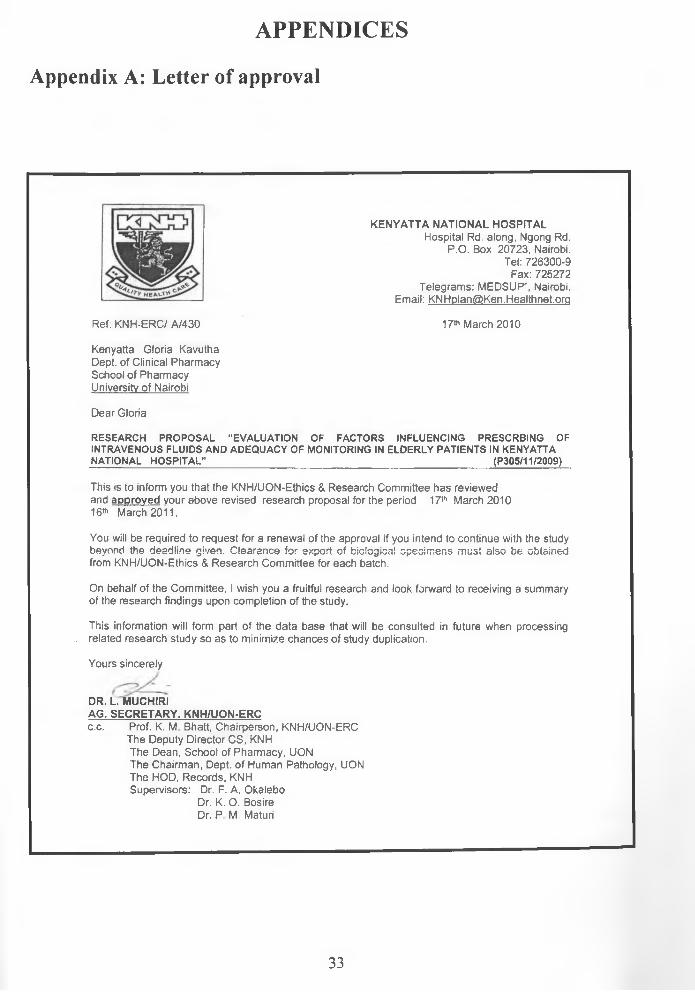
Appendix A: Letter of approval
KENYATTA NATIONAL HOSPITALHospital Rd. along, Ngong Rd.
P.O. Box 20723, Nairobi.Tel: 726300-9 Fax: 725272
Telegrams: MEDSUP’’, Nairobi. Email: [email protected]
Ref: KNH-ERC/ A/430 17* March 2010
Kenyatta Gloria Kavutha Dept, of Clinical Pharmacy School of Pharmacy University of Nairobi
Dear Gloria
RESEARCH PROPOSAL “EVALUATION OF FACTORS INFLUENCING PRESCRBING OF INTRAVENOUS FLUIDS AND ADEQUACY OF MONITORING IN ELDERLY PATIENTS IN KENYATTA NATIONAL HOSPITAL”______________________________________________________(P305/11/2009)
This is to inform you that the KNH/UON-Ethics & Research Committee has reviewed and approved your above revised research proposal for the period 17th March 2010 16th March 2011.
You will be required to request for a renewal of the approval if you intend to continue with the study beyond the deadline given. Clearance for export of biclcgica! specimens must also be obtained from KNH/UON-Ethics & Research Committee for each batch.
On behalf of the Committee, I wish you a fruitful research and look forward to receiving a summary of the research findings upon completion of the study.
This information will form part of the data base that will be consulted in future when processing related research study so as to minimize chances of study duplication.
Yours sincerely
DR. L. MUCHIRIAG. SECRETARY. KNH/UON-ERCc.c. Prof. K. M. Bhatt, Chairperson, KNH/UON-ERC
The Deputy Director CS, KNH The Dean, School of Pharmacy, UON The Chairman, Dept, of Human Pathology, UON The HOD, Records, KNH Supervisors: Dr. F. A. Okalebo
Dr. K. O. Bosire Dr. P M. Maturi
33
Appendix B: Informed Consent explanation and Consent form
To be read in a language that the respondent is fluent.
TITLE OF THE STUDY: EVALUATION OF FACTORS INFLUENCING PRESCRIBING
OF IV FLUIDS AND ADEQUACY OF MONITORING IN THE ELDERLY PATIENTS IN
KNH
Institution: Department of Pharmaceutics and Pharmacy practice, School of Pharmacy,
University of Nairobi
P. O. Box 30197-00400
Investigator: Gloria Kenyatta
P. O. Box 4526-01002 Thika Tel. 0721687629
Supervisors:
Dr. Faith A. Okalebo, Lecturer, Dept, of Pharmacology and Pharmacognosy
Dr. Kepha O. Bosire, Lecturer, Dept, of Pharmacology and Pharmacognosy
Dr Peter M. Maturi Lecturer, Dept, of Hematology and Blood Transfusions
Ethical Approval
Kenyatta National Hospital/ University of Nairobi Ethics and Research committee
P. O. Box 20723 - 00100, Nairobi Tel: 2726300/2726450 Ext. 44102
Located at the School of Pharmacy buildings, University of Nairobi
Permission is requested from you to enrol in this medical research study. You should
understand the following general principles, which apply to all in medical research
participants whether normal or patient volunteers.
Your agreement to enrol in this study is entirely voluntary. You may withdraw from the study
at any time without necessarily giving any reason for such withdrawal. After you read the
34
explanation, please feel free to ask any questions that will enable you to understand clearly
the nature of this study.
Introduction
In this study, I am assessing factors influencing prescribing of IV fluids and parameters
routinely monitored during their use in elderly patients admitted in KNH internal medical
wards.
Purpose
The purpose of the study is to reduce complications of inappropriate IV fluid therapy and
shorten hospital stay and costs for admitted patients.
Procedures
I intend to refer to your file including treatment sheet and lab reports daily for a minimum of
five days. The information obtained will then be filled into a data collection form by me in
confidence. Occasionally and with your permission, I will request you to provide answers to
questions on information that is not available from the file or that which needs to be verified.
Risks
I wish to inform you that in this study, I will not carry out any invasive procedures such as
insertion of needles or physical examination of the patient. It also does not involve any cost
to the patient. No risks are therefore foreseen to result from this study.
Benefits
No monetary rewards or other material awards will be gained from this study. However, it is
hoped that your participation will improve healthcare management of elderly patients.
Assurance of confidentiality
Any information /data obtained about patients will remain confidential and will not be
accessed by any unauthorized individuals or groups. Your names will not be used during
data handling or any publication. Your participation is voluntary and any refusal to
participate will not interfere with your treatment and management in KNH.
U N IV E R S I T Y O F NAIROBIMEDICAf i i r d a d w
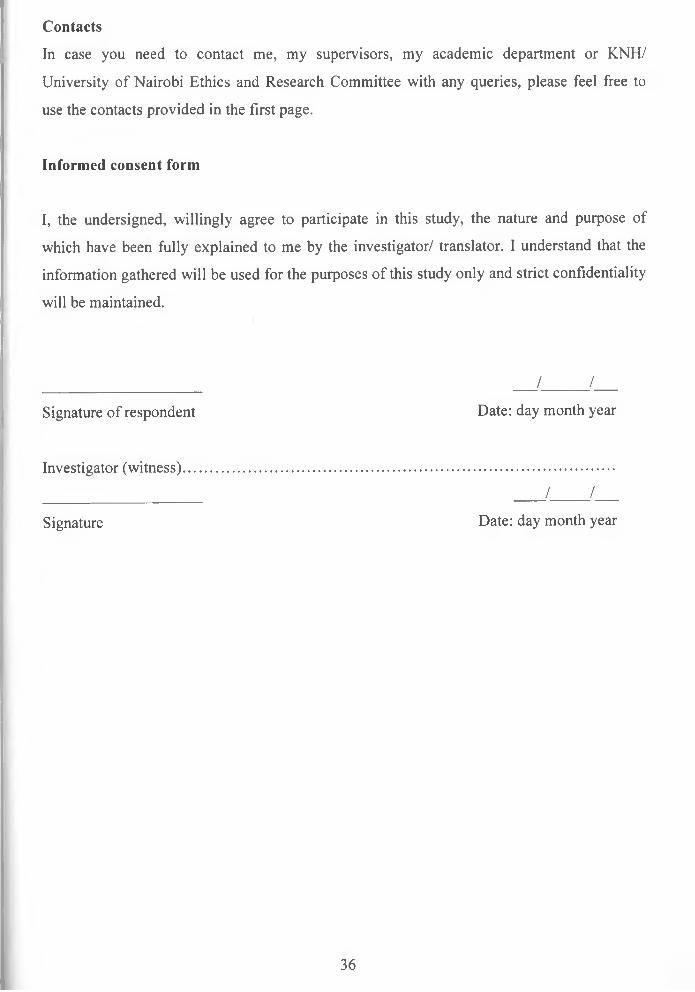
Contacts
In case you need to contact me, my supervisors, my academic department or KNH/
University of Nairobi Ethics and Research Committee with any queries, please feel free to
use the contacts provided in the first page.
Informed consent form
I, the undersigned, willingly agree to participate in this study, the nature and purpose of
which have been fully explained to me by the investigator/ translator. I understand that the
information gathered will be used for the purposes of this study only and strict confidentiality
will be maintained.
________________________ / /Signature of respondent Date: day month year
Investigator (witness)............................................................................................................________________________ / /Signature Date: day month year
36

Appendix C: Study eligibility checklist
Date.............................
Data collector’s initials
Patient code no............
Inclusion criteria (If any inclusion criteria is marked “NO”, the patient is not eligible for
enrolment)
Yes No
[ ] [ ] 1. Patient is above 50 yrs old
[ ] [ ] 2. Patient has been started on IV fluids within 24hrs
[ ] [ ] 3. Patient has signed consent form
Exclusion criteria (If any exclusion criteria is marked “YES”, the patient is not eligible for
enrolment)
Yes No[ ] [ ] 1 • Patient has a non medical condition (surgical patient)
Is the patient eligible for the study?
Yes [ ]
No [ ]
37

Appendix D: Data collection form
Patient demographics
Date....................................
Data collector’s initials.......
Patient code no...................
Age [ ] Sex [M] / [F] Marital status; Single/Married/Divorced or
separated/Other
Residence........................... Occupation; Unemployed/employed[self/casual/permanent]
No. of children................... Religion................
Highest level of education; No formal education/Primary/secondary/University or college
Date of admission............... Ward of admission........... Date of discharge or
death...............
Patient medical history on the day of admission
1. Presence of the following signs and symptoms of dehydration. (Tick appropriately)
[ ] Thirst [ ] Dry mucous membranes [ ] Diarrhoea
[ ] Decreased skin turgor [ ] Hypotension [ ] other specified
[ ] Dizziness [ ] Concentrated/ little/no urine
[ ] Decreased capillary filling time [ ] Vomiting
2. Condition that led to admission? ............................................................................
3. Is the condition an indication for IV fluids? (Tick appropriately)
[ ] Yes
[ ] No
Tick appropriately for the following;
4. Is the patient Nil by Mouth (NBM) Yes [ ] No [ ]
5. Is the patient conscious Yes [ ] No [ ]
6. Is the patient immobile Yes [ ] No [ ]
38

7. Any concurrent ailments/ conditions?
Were the following assessed at or within 24 hrs of admission? (Tick appropriately)
Yes No
8. [ ] [ ] Urea and electrolytes
9. [ ] [ ] Initial body weight
IV fluids
10. Which IV fluid was prescribed? ....................
Specify Date.............................................
11. Were the following specified?
[ ] Volume [Yes] [No]
[ ] duration over which fluid is to be administered [Yes] [No]
12. Why was it stopped?
Specify Date.......................................
Medication
13. Medication that patient has been taking?
14. Medication that patient is prescribed on admission?
39
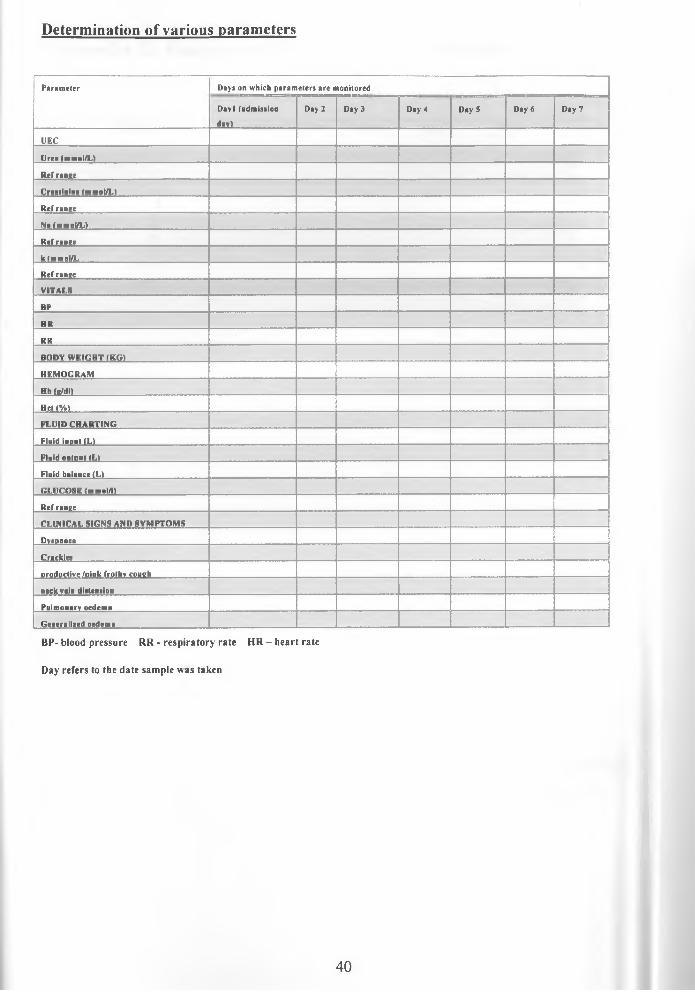
Determination of various parameters
P a r a m e t e r D a y s o n w h i c h p a r a m e t e r s a r e m o n i t o r e d
D a v l ( a d m i s s i o n
d a y )
D a y 2 D a y 3 D a y 4 D a y 5 D a y 6 D a y 7
U E C
U r e a ( n t m o l /L ) . . .......................
R e f r a n g e
C r e a t i n i n e ( m m o l /L ) _......................
R e f r a n g e
N a (m m o l/L J i
R e f r a n g e
k ( m m o l /L
R e f r a n g e
V I T A L S
B P
H R
R R
B O D Y W E I G H T ( K G )
H E M O G R A M
H b ( g /d l )
H c t ( % )
F L U I D C H A R T I N G
F lu i d i n p u t ( L )
F lu i d o u t p u t ( L )
F lu i d b a l a n c e ( L )
G L U C O S E ( m m o l /1 )
R e f r a n g e
C L I N I C A L S I G N S A N D S Y M P T O M S
D y s p n o e a
C r a c k l e s
p r o d u c t i v e / p i n k f r o t h y c o u g h
n e c k v e in d i s t e n s i o n
P u l m o n a r y o e d e m a
G e n e r a l i z e d o e d e m a
B P - b lo o d p r e s s u r e R R - r e s p i r a t o r y r a t e H R - h e a r t r a te
D a y r e f e r s to th e d a t e s a m p le w a s ta k e n
40
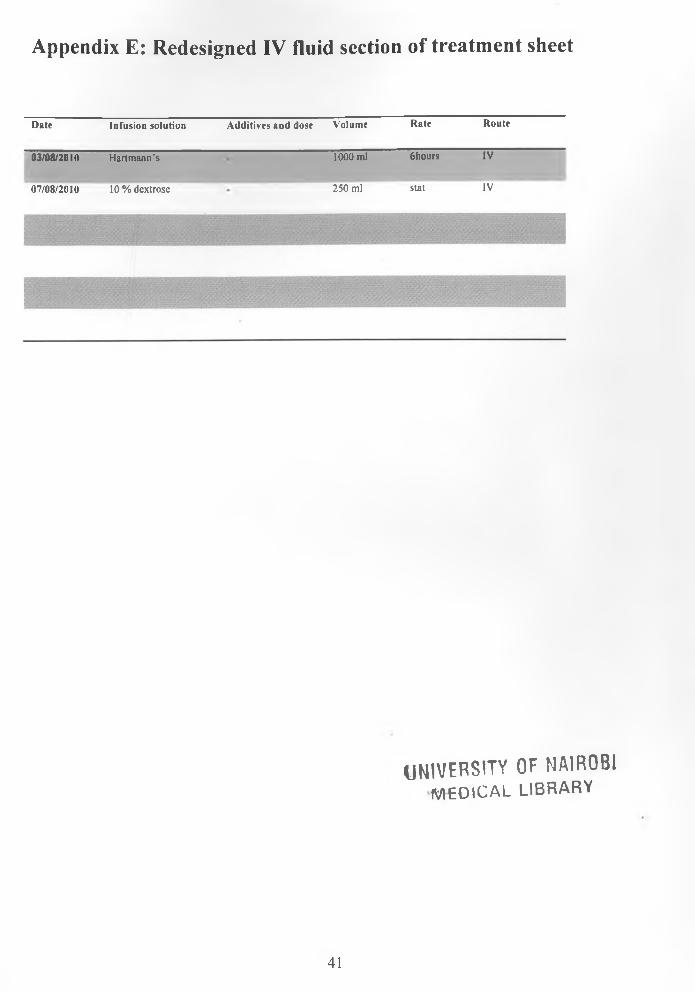
Appendix E: Redesigned IV fluid section of treatment sheet
D a te In f u s io n s o lu t io n A d d i t iv e s a n d d o s e V o lu m e R a te R o u te
0 3 /0 8 /2 0 1 0 H a r tm a n n ’s 1000 m l 6 h o u rs IV
0 7 /0 8 /2 0 1 0 10 % d e x tro s e 2 5 0 m l s ta t IV
UNIVERSITY OF NAIROBI m e d i c a l l i b r a r y
41