Embed Size (px)
DESCRIPTION
An important step m the development of modem experimental virology wasthe development of the plaque assay, first with bacteriophage, then witheukaryotic viruses. In order to obtain quantitative, interpretable, and reproducibleresults, it is necessary to know how much virus is bemg used in the expenment.With adenoviruses, several approaches have generally been used toquantitate virus stocks.
Citation preview
1
Preparation and Titration of CsCl-Banded Adenovirus Stock
Ann E. Tollefson, Terry W. Hermiston, and William S. M. Wold
1. Introduction An important step m the development of modern experimental virology was
the development of the plaque assay, first with bacteriophage, then with eukaryotic viruses. In order to obtain quantitative, interpretable, and reproduc- ible results, it is necessary to know how much virus is bemg used in the experr- ment. With adenovuuses, several approaches have generally been used to quantitate vrrus stocks. First, virus particles are counted, e.g., in an electron microscope (1,2). Another approach is to quantitate virion DNA by optical absorbance (2). The problem with these approaches is that many adenovirus particles are not infectious, perhaps because they have a defective complete genome or they lack fiber or some other protein. The second approach is to determine the number of plaque-forming units (PFU) per mL. Here, the analy- sis quantitates the number of vnions capable of a full infectious cycle. This approach will be described in detail in this article.
Experimental reproducibility also requires that adenovirus stocks be pre- pared in a consistent manner. Such stocks are stable for years when stored at -7OOC. One simple approach is to prepare a cytopathic effect (CPE) stock. Here, an isolated plaque is picked and a small dish of permissive cells (e.g., A549) is infected. After approx 4-5 d, the cells in the monolayer will show typical adenovirus CPE, i.e., their nuclei will become enlarged and they will round up and detach from the dishes into individual floating cells as well as grape-like clusters. These floating cells remain alive for some time (cell death and the release of adenovnus from the cells begins at approx 3 d postinfection for subgroup C adenoviruses). These cells are collected, adenovirus is released by repeatedly freezing and thawing, and then it is used to infect a larger mono-
From Methods m Molecular Medrcme, Vol 21 Adenowrus Methods and Protocols Edited by W S M Wold @ Humana Press Inc , Totowa, NJ
1

2 Tollefson, Hermiston, and Wold
layer, such as a T-150 flask. After CPE appears, cells are collected and aden- ovirus is released by three rounds of freeze-thawing followed by sonication; then the adenovirus is titered by plaque assay. These CPE stocks, which are typically 1 Os-1O’o PFU/mL, are adequate for exploratory studies. Large-scale vnus stocks are usually prepared by banding the virus in CsCl equilibrium- density gradients, and this procedure will be described. CsCl-banding yields large quantities of high-titer (10’ t PFU/mL) adenovirus stocks.
2. Materials
2.1. Cell-Culture Media and Stock Solutions
1 Dulbecco’s modified Eagle’s medium (DMEM) from powdered medmm (20 L): DMEM (with high glucose, with L-glutamine, with phenol red, without sodmm pyruvate, without sodium bicarbonate; Gtbco-BRL, Gaithersburg, MD; JRH Bto- sciences [Lenexa, KS]) (2X 10 L), 74 g (3.7 g/L) of sodmm bicarbonate (tissue- culture grade, Gibco-BRL or Sigma [St. Louis, MO]). Adjust the pH of the solution to approx 6.9 with 1 N HCl or 1 N NaOH (pH will increase 0.3 to 0.4 U with filtration). Add commercral penicillin-streptomycm stock (1 mL/L; Gibco- BRL). Medium is membrane-sterilized by posrtive or negative pressure (postttve pressure IS preferable in mamtaming pH) through a 0 22-p filter (Mrllipore, Bedford, MA; Coming [Coming, NY], Nalge [Rochester, NY])
2. MEM (Joklik-modified) for suspension cultures (20 L) (see Note 1) mmimum essential medium (S-MEM) (Jokbk-modified) (with L-glutamine, with 10X phos- phate, without sodmm bicarbonate; Gibco-BRL or JRH Biosciences) (2X 10 L), 40 g sodium bicarbonate (2 g/L) Adjust pH to 6.9 with 1 N HCI or 1 N NaOH, then add streptomycin-penicillin stock (1 mL/L). Sterilize medmm by membrane filtration (0.22~pm filter).
3. 2X DME for plaque assay overlays (5 L) (see Note 2): Combine 4.5 L ddHzO (tissue-culture grade), 0.6 g penicillin G (sodium salt, 1670 U/mg), 1 .O g strepto- mycm sulfate (787 U/mg), DME powder (1X 10 L) (with htgh glucose, with L-glutamine, with phenol red, without sodium bicarbonate, without sodium pyru- vate; Gibco-BRL). AdJust to 5 L. pH is not adjusted at the time of preparation (sodium bicarbonate stock is added at the time of overlay preparation). Sterilize by membrane filtration through a 0.22-u filter
4. Penicillin and streptomycin: penicillin/streptomycin stock (1000X) contains 10,000 U/mL penicillin G sodium, and 10,000 U/mL streptomycin sulfate in 0.85% saline (Gtbco-BRL). Store frozen until use in preparation of DMEM and Joklik-modified MEM.
5. Phosphate-buffered saline (PBS): prepare Dulbecco’s phosphate-buffered saline (PBS) (without calcium chloride, without magnesium chloride; Sigma) with trs- sue-culture grade water and sterilize by filtration through a 0.22~~.un filter.
6. Ttypsin-EDTA stock solution (4 L): dissolve 4 g trypsin (1:250, DIFCO Labora- tories, Detroit, MI), 2 g EDTA (disodium salt), 4 g dextrose, 20 mg phenol red (sodium salt, Fisher, Pittsburgh, PA), 0.25 g penicillin G (sodium salt, 1670 U/mg,
&Cl-Banded Adenovirus Stock 3
Sigma), 0.45 g streptomycm sulfate (787 U/mg, Sigma) m a final volume of 4 L Dulbecco’s PBS (calcium- and magnesium-free). Adjust pH to 7.2. Sterilize by mem- brane filtration. Store aliquoted stocks frozen until they are needed as workmg stocks.
7. Horse serum and fetal bovine serum (see Notes 3 and 4): Sera are needed for supplementation of the tissue culture media. Heat horse serum at 56°C for 30 min to inactivate complement prior to use in growth or during infection of KB cells.
8. Tris-salme-glycerol (TSG) (for dilution of cesium-chloride-banded vnus): Solu- tton A: 900 mL ddHz0, 8.0 g NaCl, 0.1 g NaHPO, (dibasic), 0.3 g KCl, 3.0 g Trisma base (Tris); adjust pH to 7.4 by addition of approx l-2 mL concentrated HCl. Solution B: 2.0 g MgCl,, 2 0 g CaCl,, 100 mL ddH20. Combine 700 mL solution A with 3.5 mL solution B. Add 300 mL ultrapure glycerol (Gibco-BRL). Heat solution m microwave and filter sterilize through 0.22~pm filter (unheated solution is too viscous to filter).
9. 1.8% DIFCO Noble agar stock: Add 1.8 g Noble agar per 100 mL of tissue-culture grade water (9 g of Noble agar in 500 mL water is convenient). Autoclave for 25-30 min to sterilize. Store at 4°C until approx 1 h prior to preparation of overlay.
10. Agar overlay medium for plaque assays: Final volumes of components for 100 mL of overlay are as follows: 50 mL of 2X DME (see item 3), 5 mL 7.5% (w/v) sodmm-bicarbonate stock solution (Gtbco-BRL), 2 mL fetal bovme serum (FBS), 43 mL 1 8% agar Noble stock (see item 9). Microwave 1.8% agar Noble stock to melt; then reduce temperature to 56’C in a 56°C water bath prior to addition to the other overlay components. Mix the other components of the overlay and keep at 37°C in a water bath. These temperatures are used to keep the agar from solidt- fying and to ensure that the overlay will not be hot enough to result in cell killmg when it is layered onto the monolayer. If stock of 2X DME was prepared 1 mo or more prior to the date of plaque assays, add 1 mL of glutamine stock (200 mM; Gibco-BRL) per 100 mL of overlay. Neutral red is added to the second overlay. Add 0.45 mL of neutral red stock (3.333 g/L neutral red sodium salt m distilled water, membrane-filtered; Gibco-BRL) per 100 mL overlay. Addition of neutral red to the first overlay may inhibit plaque formation and expansion. Do not reheat or reuse the overlay mixture.
3. Method 3.1. Growth of Monolayer and Suspension Cultures
3.1.1. KB Cells
US-suspension cultures are a clonal line derived in the laboratory of Maurice Green (from a KB-suspension culture received originally from Harry Eagle) and grown in the laboratories of Maurice Green and William Wold. This clonal line is reported to produce higher yields of virus than the parental KB cell line (3,#).
1 Grow KB cells in suspension in Joklik-modified MEM (5% heat-inactivated horse serum) in spinner flasks (Bellco Glass [Vineland, NJ]). Maintain cells m culture with daily dilution of cells to maintain cultures in the 1.5-4.0 x lo5 cells/ml range.
4 Tollefson, Hermiston, and Weld
2. Split the culture each day to a cell density of 1.5-2.0 x lo5 cells per mL. Cells typically double in 24 h. Add new medium to the cell suspension and discard excess cells. Replace only a portion of the medium because conditioned medium appears to have some beneficial effect on the growth of the cells (perhaps from autocrine effects).
3.1.2. A549 Cells
A549 cells (CCL 185; American Type Culture Collection, Rockville, MD) are grown in DMEM supplemented with glutamine and 10% FBS (HyClone, Logan, UT; BioWhittaker [Walkersville, MD]; or Gibco-BRL).
1, For routine passage, remove medium from the plates and add trypsin-EDTA (2 mL for 100~mm dish or 5 mL for a 1 75-cm2 flask).
2. When cells have rounded up (usually in 3-5 min), remove cells from the dish by adding DMEM (10% FBS) with gentle pipettmg. Use of 10% FBS/DMEM inhibits continued trypsm action and cells remain more intact with higher viability.
3. Centrifuge cells at 600-1000 rpm (lOO-25Og) in a table-top centrifuge (e.g., Beckman GS-6) to pellet cells
4. Remove trypsin/medium solution and resuspend cells in DMEM (10% FBS), and plate at 1:5 to 1:20 dilutions relative to the original cell density.
5. Cells are usually passaged at 2- to 3-d intervals. Grow cells at 37’C with 6% CO* in humidified incubators in 100~nun dishes or 175-cm* flasks. Cells should not be allowed to become very heavy in routine culture or they will not have good survival in plaque assays.
3.1.3. Large-Scale Adenovirus Preparation
Spinner KB cells are used for large scale production of adenovnuses. Grow cells m mmimal essential medium, Joklik-modified (Gibco-BRL or JRH Biosciences), a suspension medtum with reduced calcium and increased levels of phosphate, with 5% horse serum (heat-inactivated at 56OC for 30 min to inactivate complement). For infection, it 1s typical to use a 3-L volume of cells that have reached a density of 3-3.5 x lo5 cells/ml. Reduce volume for infection to 1 L by centrifuging 2400 mL of suspension culture to pellet cells, resuspend these cells in approx 400 mL of serum- free Joklik-modified MEM, and return cells to spinner. Infect cells with 5- 20 PFU/cell with stock viruses (lower MO1 will result in fewer defective particles). Virus is adsorbed with spinning at 37OC for 1 h; at the end of the adsorption period, add 2 L of medium (with 5% horse serum) to the infec- tion. Maintain infected cells in spinner flasks at 37°C for 40-46 h; then harvest. Given viruses may be incubated for more extended times if cell lysis is not occurring (especially if the E3 gene for the adenovirus death protein, previously named E3-11.6K, is absent).
CsCI-Banded Adenovirus Stock 5
Day 1:
1. Prepare 3 L KB spmner cells in Joklik-modified MEM/S% horse serum at approx 2 x lo5 cells per mL.
Day 2:
2. Do cell count on hemacytometer to determine the cell number. This cell number will be used to determine the volume of virus to use for infection.
3. Reduce the total cell volume to 1 L by centrifugation. Cells (2400 mL) are pelleted in a table-top centritige (Beckman GS-6 centrifuge) in 750-mL Beckman centrifuge tubes at 1000 rpm (250g) for 10 min. Because the centrifuge bottle bottoms are flat, the rotor is not braked at the end of the spin.
4 Resuspend cells in 400 mL Joklik-modified medium (serum-free) and return to the spinner flask.
5. Add virus (5-20 PFWcell or use a portion of a CPE stock from a flask). If using small volumes of banded vnus, it is best to dilute the virus in serum-free Joklik- modified MEM in a 50-mL centrifuge tube (Falcon, Coming) prior to addition to the spinner. Adsorb 1 h at 37°C with spinning.
Day 4:
6. Pellet infected cells in 750-mL Beckman centrifuge tubes in table-top centrifuge (1000 rpm [25Og], 10 min, 4’C). Do not use brake at end of centrifugation.
7. Remove medium. Resuspend cell pellets m a total volume of 150-200 mL of cold PBS (4°C) and transfer to a 250-mL conical centrifuge tube (Corning). Cen- trifuge at 1000 rpm (250g) at 4°C for 10 min.
8. Repeat PBS wash and pelleting of cells twice. 9. Resuspend cell pellet in enough cold 10 mM Tris-HCl, pH 8.0 (4°C) to give a
final volume of 24 mL. 10. Ahquot 8 mL into each of three sterile polypropylene snap-cap tubes (15 mL
size), wrap caps with parafilm, and freeze at -7O’C or m ethanol/dry ice bath for at least 1 h (processing can be left at this point for one or more d before complet- ing the remainder of the protocol).
11. Thaw tubes m 37°C water bath. Repeat these freeze-thaw steps two more times and then place tubes on ice.
12. Disrupt cells by sonication on me in the cup of a Branson sonifier 250. Settings are as follows: duty cycle on “constant,” output control on 9 (scale of l-lo), and 3-mm cycles. Repeat three times for each sample.
13. Transfer somcated material to sterile 50-mL flip-cap centrifuge tubes and centnmge at 10,000 rpm (12,000g) for 10 min at 4°C in a Beckman J2-HC centrifuge. Remove supematant (which will contain released virions) and discard cell-debris pellet.
14. Determine the volume of supernatant and multiply by 0.5 1. The resulting number will be the grams of CsCl to be added to the preparation. For example: 20 mL of supernatant x 0.5 1 g of CsCl per mL equals 10.2 g of CsCl for addition to the supernatant.
17. Stop the ultracentrifnge without using the brake. 18 The virus will appear as a white band that will be at approximately the middle of
the tube. Collect by syringe puncture at the bottom (puncture top of tube as well). Band will visibly move down the tube. Collect the band region in a 15- or 50-mL sterile centrifuge tube (Coming, Falcon) as it drips from the bottom Altema- tively, the virus band can be removed by side puncture of the tube at the level of the virus band with a syringe and withdrawing the band wtth the syringe
19. Dilute virus 5- to lo-fold in Trts-saline-glycerol (TSG) (see Subheading 2.1., item 8); this will usually result m a stock which is 101o-lO” PFU/mL when using wild-type viruses.
20 Aliquot in l- to 3-mL volumes in sterile 6-mL snap-cap polypropylene tubes or m cryovials and store at -70°C unttl needed.
21. Determine titer of the vtrus by plaque assay on A549 cells (see Note 5).
3.2. Plaque Assays for Determination of Adenovirus Titers
1.
2
3.
One day prior to plaque assay, plate A549 cells at 2.0 x lo6 tells/60-mm dish (Coming, Falcon). On the day of the plaque assay, wash dishes of confluent A549 cells with 5 mL serum-free DMEM for 30-60 mm prtor to addition of the diluted vn-us; remove this wash medium immediately before the addition of the VIIUS dilutions. Make serial dtlutions of vtrus in serum-free DMEM; perform dilutions within a laminar flow hood. Dilute virus in sterile-dtsposable snap-cap polypropylene tubes and vortex well after each dilution (5-10 s at an 8-9 setting on a I-10 scale). Typically for cesium-chloride-banded stocks, the initial two dilutions are 1: 1000 (10 pL mto 10 mL), followed by dilutions of 1:lO. Be sure to change micropipet tips after each dilution; avoid contamination of the mrcropipet barrel (use of barrier tips will help avoid contammatton). Care should also be taken to avoid transfer of virus stock on the outside of the micropipet tip by avoiding dipping the tip into the solutton, especially in expellmg the volume. For cesium- banded stocks, the range of dilutions that are usually countable are 1 W8-1 O-lo. Place a volume of 0.5 mL of the appropriate dilution on confluent A549 cells (each relevant dilution 1s assayed in triplicate). Rock dishes to distribute medium over the monolayer at lo- to 15-mm intervals. Incubate cells at 37°C with 6% CO,. Immediately prior to addition of overlay to the cell monolayers, mix the agar stock with the remaining ingredients At the end of the 1 -h adsorption period, add 6 mL overlay (see Subheading 2.1., item 9) to the edge of the dish and rotate the dish to blend overlay wtth the medium used for infection (the 0.5-n& volume of medium used for infection IS not removed).
6 Tollefson, Hermiston, and Weld
15. After mixing wtth CsCI, divide sample into two Ti50 quick-seal tubes. 16. Centrrfuge in Ti50 rotor at 35,000 (110,OOOg) rpm m Beckman ultracentrifuge at
4°C for 16-20 h to band the virus
Day 5:
CsCI-Banded Adenovirus Stock 7
8. Leave dishes at room temperature on a level surface for 5-15 mm in order to allow the overlay to solidify.
9 Transfer dishes to 37°C 6% CO, and mcubate for 4-5 d. At that time add a second overlay (5 r&/60-mm dish) containing neutral red (see Subheading 2.1., item 9). It is important to have a humidified atmosphere in the incubator, but avoid very high humidity because it may cause excess moisture on and around the overlay, resulting in plaques that diffuse excessively and inconsistently.
10. Begin counting plaques 1 d after the neutral-red overlay is added. On A549 cells it is not necessary to add more than the first and second overlays
11. Count plaques at 2- to 3-d intervals until new plaques are no longer becommg apparent. For Ad2 and Ad5 wild-type viruses, this may be 12-l 5 d postinfectton, with other serotypes ($6) and with group C adenoviruses that have mutations or deletions in the adenovuus death protein, this may be approx 30 d postinfection (7,s). Plaques are most apparent when holding the dish up toward a light source and observing an unstained circular area that has altered light diffractron. Cells initially may not be rounded up and may simply appear unstained, but plaques will typically become more apparent with time.
12 Use dishes with 20-100 plaques for the calculation of titer (plaque assays are done m triplicate for each of the serial dilutions for more accurate numbers).
4. Notes 1. Incubate test bottles of medium at 37°C for 5 d to ensure sterility for each batch.
Sterility can also be tested on blood agar plates or in nutrient broth. Care should be taken to cover the medium during preparation and to prepare medium in an area not normally used for handling of virus (adenovirus vtrions can pass through a 0.22-p filter). Bottles, 20-L container, and stir bar used for media preparation should be dedicated for tissue-culture use and not mixed with chemi- cal glassware.
2. 2X DME is usually ahquoted in 500~mL volumes and is stored at 4’C; care should be taken to avoid increases in pH (cell survival of monolayers m plaque assays is significantly decreased m medium that has become “basic” or if the pH of the overlay is too high initially).
3. Serum testing: sera (HyClone, BioWhittaker, Gibco-BRL) are purchased in large lots to reduce experimental variation caused by differences m serum lots. Sera are tested with relevant cell lines in two different assays. a. To determine cloning efficiency of cells at low-cell density, plate 100-500
cells per tissue culture plate. After 10-12 d, fix clones in methanol (10 min at -20°C) and stain wtth Giemsa staining solution or with crystal violet. The number, stze, and morphology of clones can then be compared for dtfferent lots. Determination of cloning efficiency is of importance for experiments in which small numbers of cells will be present on a tissue-culture dish (as m production of stable transfectants or in limited dilution for selectton of clonal- cell populations). One can also check the appearance of clones and make sub- jective judgments about the growth of the cells (flatness or overgrowth of the
8 Tollefson, Hermisron, and Wold
clones, size of the cells, cell uniforrmty, vacuoles, mitotic index, and relative “health” of the cells).
b Cell-growth rates are calculated by plating lo5 cells per 60-mm tissue-culture dish; cell counts are done at daily intervals to determine the kinetics of growth for the different serum lots.
4. The FBS is not heat-inactivated (heat-inactivation will substantially decrease the survival of A549 cells in plaque assays).
5. Verification of virus stocks. Virus preparations are tested periodically by Hirt assay (see Chapter 2) or other assays (such as immunofluorescence or PCR) to confirm the “fidelity” of the vnus preparations. It may be necessary to plaque- purify a stock periodically (see Chapter 2) to eliminate possible contaminants (this is especially important for viruses that grow less efficiently than wild-type virus or that are released from cells less efficiently during infection).
6. Plaque-assay consistency: Careful and consistent plaque assays will typically result in less than twofold differences in determined titer of the same virus prepa- ration in separate experiments. It is often preferable to plaque assay a large panel of mutants that will be used in the same experiments simultaneously so that the relative titers will be quite accurate.
7. Adjusting plaque assays for small-plaque morphologies (viruses that lack the subgroup C adenovnus death protein gene and serotypes that produce small plaques): It is important to have consistent PFU informatton in order to perform infections with viruses m which comparisons are made between the phenotypes of various virus mutants. The most direct method of generating infectrous titers 1s by doing plaque assays for PFU. In the study of E3 mutants, we have determined that given mutants have a small plaque morphology and therefore a number of modifications have been made in previous plaque-assay methodologies to accommodate the requirements for these mutants. It is necessary for the cell monolayers to remain viable for an extended time (approx 28-30 d) to see the full extent of the plaque development. Plaque assays are done on A549 cells (ATCC) that have a very good survival time under the overlay in plaque assays. Cell survrval of A549 cells is also somewhat dependent on the type of tissue- culture dish used
References 1. Pinteric, L. and Taylor, J. (1962) The lowered drop method for the preparation of
specimens of parttally purified virus lysates for quantitative electron mtcrographtc analysis. YzroIogy l&359-371.
2. Mittereder, N., March, K. L., and Trapnell, B. C (1996) Evaluatton of the con- centration and bioactivity of adenovirus vectors for gene therapy. J Vlrol. 70, 7498-7509.
3. Green, M. and Pina, M. (1963) Biochemical studies on adenovnus multiplication. IV. Isolation, purification, and chemical analysis of adenovuus. Virology 20, 199-207.
4. Green, M. and Wold, W. S. M. (1979) Human adenoviruses: growth, purificatton, and transfection assay. Methods Enzymol. 58,425-435.
CsCI-Banded Adenovirus Stock 9
5. Hashimoto, S., Sakakibara, N., Kumai, H., Nakai, M., Sakuma, S., Chiba, S., and Fujinaga, K. (1991) Fastidious human adenovirus type 40 can propagate effi- ciently and produce plaques on a human cell line, A549, derived from lung carci- noma. J Vwol. 65,2429-2435.
6. Green, M., Pma, M., and Kimes, R. C. (1967) Biochemical studies on adenovirus multiplication. XII. Plaquing efficiencies of purified human adenoviruses. Dis- cussion and preliminary reports. Vlrohgy 31,562-565.
7. Tollefson, A. E., Scaria, A., Hermiston, T. W., Ryerse, J. S., Wold, L. J., and Wold, W. S. M. (1996) The adenovirus death protein (E3-11.6K) is required at very late stages of infection for efficient cell lysis and release of adenovirus from infected cells. J. Viral 70,2296-2308.
8 Tollefson, A. E., Ryerse, J. S., Scaria, A., Hermiston, T. W., and Wold, W. S. M. (1996) The E3-11.6kDa adenovirus death protein (ADP) is required for effi- cient cell death: characterization of cells Infected with adp mutants. Virology 220, 152-162.

Construction of Mutations in the Adenovirus Early Region 3 (E3) Transcription Units
Terry W. Hermiston, Ann E. Tollefson, and William S. M. Wold
1. Introduction The E3 transcription umt of the well-studied subgroup C adenovtruses (Ad)
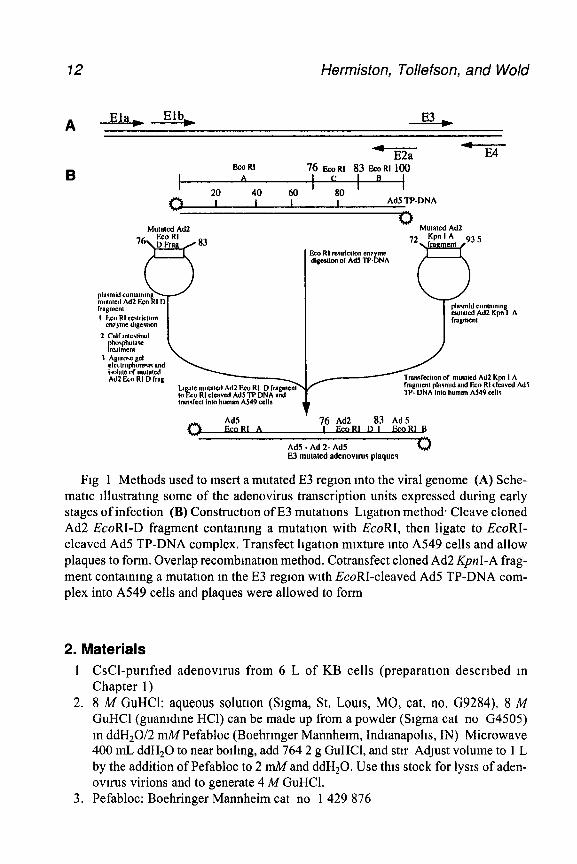
(prototypic serotypes 2 [Ad21 and 5 [Ad5]) is located between map units 76- 86 (see Fig. 1). The E3 region 1s surrounded by the genes for virion protein VIII and fiber, and is transcribed off the r-strand. The E3-region transcription unit is complex Extensive sphcmg controls expression of seven identified E3 proteins, four of which have functions that modify the host immune response to the viral mfection (reviewed m ref. I, Table 1)
Human adenovirus has served as a model system for studying persistent infections and has enjoyed widespread interest as a gene therapy vector. In both cases, understanding the immune response to the virus is paramount for further advancements m these fields. This will require mutational analysis of the immune-response modifying E3 region and its proteins, their reincorpora- tion mto the viral genome, and study of the viral infection in vwo A series of protocols will be presented that have been used for the creation of adenoviruses with mutations in the E3 region A method detailing the tsolation of adenovirus DNA containing the terminal protein (TP-DNA) will be described (8-10). This will serve as the startmg material into which the mutated E3 region will be inserted, either by overlap recombmation (11) or by ligation insertion (12). In either method, transfection of the DNA into the cell is required for infectious virus to be generated, and a protocol will be given. Lastly, a procedure will be provided that can be used to screen for the desired E3-mutated adenovnus. Mutagenesis techniques will not be discussed here but excellent reviews are available (13,14).
From Methods m Molecular Medune, Vol 21 Adenovws Methods and Protocols Edited by W S M Wold 0 Humana Press Inc , Totowa, NJ
11
12 Hermiston, Tollefson, and Wold
A Ela, Elb E3 )
4 E2a IE4
B EC0 RI 76 l?coRl 83 ECORI 100
t A c I a
20 40 60 ’ so ’ I I I I Ad5 TP-DNA
r%
Mutoled Ad2
83
w Mulated Ad2
Em RI m.w,c,ion en? me digeuion 0r ~d5 w- L NA
Fro RI cleaved Ad5 TP- DNA lnlo human A549 &lr
Ad5 EcoRl A
’ 76 Ad2 83 Ad 5 oR1 D I IlkoR B
Ad5. Ad 2- Ad5 v E3 mutated adenovnn plaques
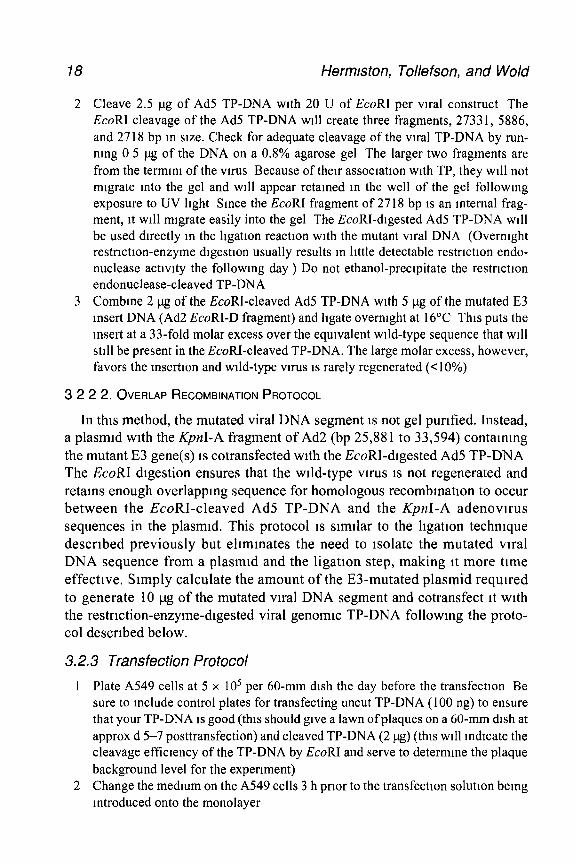
Fig 1 Methods used to insert a mutated E3 region mto the viral genome (A) Sche- matic tllustratmg some of the adenovirus transcription units expressed during early stages of infection (B) Construction of E3 mutations Ligation method. Cleave cloned Ad2 EcoRI-D fragment contammg a mutation with EcoRI, then ligate to EcoRI- cleaved Ad5 TP-DNA complex. Transfect legation mixture mto A549 cells and allow plaques to form. Overlap recombmatton method. Cotransfect cloned Ad2 KpnI-A frag- ment containing a mutation m the E3 region with EcoRI-cleaved Ad5 TP-DNA com- plex into A549 cells and plaques were allowed to form
2. Materials 1 CsCl-purified adenovtrus from 6 L of KB cells (preparation described m
Chapter 1) 2. 8 M GuHCI: aqueous solution (Stgma, St. LOUIS, MO, cat. no. G9284). 8 M
GuHCl (guamdme HCl) can be made up from a powder (Sigma cat no G4505) m ddH20/2 WPefabloc (Boehrmger Mannhetm, Indtanapolls, IN) Microwave 400 mL ddH,O to near botlmg, add 764 2 g GuHCl, and stir Adjust volume to 1 L by the addition of Pefabloc to 2 mM and ddH20. Use this stock for lys~s of aden- ovuus virions and to generate 4 M GuHCl.
3. Pefabloc: Boehringer Mannheim cat no 1 429 876
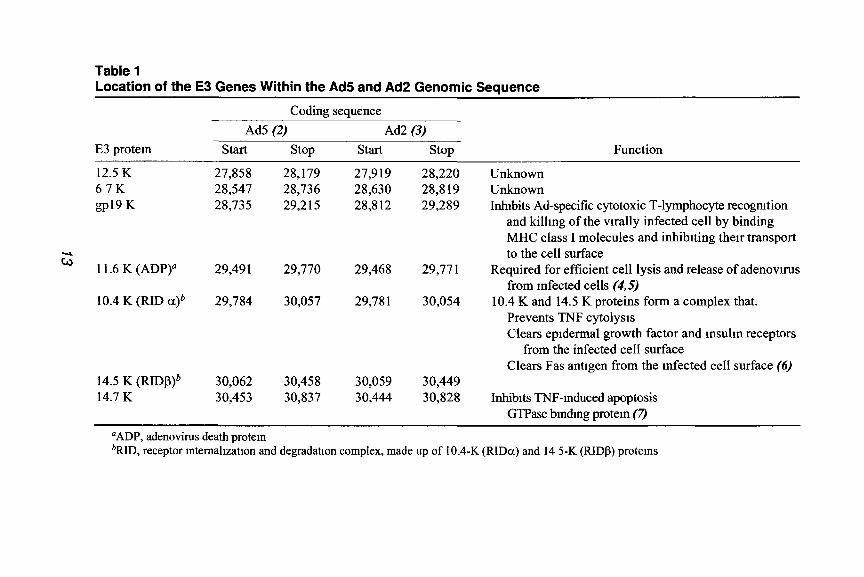
Table 1 Location of the E3 Genes Within the Ad5 and Ad2 Genomic Sequence
Coding sequence
E3 protein
Ad5 (2) ACQ (3) start stop start stop Function
12.5 K 27,858 28,179 27,919 28,220 Unknown 67K 28,547 28,736 28,630 28,8 19 Unknown gp19 K 28,735 29,215 28,812 29,289 Inhibits Ad-specific cytotoxic T-lymphocyte recognition
and killing of the virally infected cell by binding MHC class I molecules and inhibtting their transport
z to the cell surface
11.6 K (ADP) 29,49 1 29,770 29,468 29,77 1 Required for efficient cell lysis and release of adenovuus from Infected cells ($5)
10.4 K (RID CL)~ 29,784 30,057 29,78 1 30,054 10.4 K and 14.5 K proteins form a complex that. Prevents TNF cytolysts Clears epidermal growth factor and msulm receptors
from the infected cell surface Clears Fas antigen from the mfected cell surface (6)
14.5 K (PYIDP)~ 30,062 30,458 30,059 30,449 14.7 K 30,453 30,837 30,444 30,828 Inhibtts TNF-mduced apoptosis
GTPase bmdmg protein (7)
‘ADP, adenovirus death protein *RID 3 receptor mtemallzatlon and degradation complex, made up of 10.4-K (RIDa) and 14 5-K (RIDB) protems
14 Hermlston, Tollefson, and Wold
10
11 12
13.
14.
15
16.
17.
18.
4 L of TEMP pH 8.0: 10 mM Trts-HCl, pH 8.0 (20’(Z), 1 mA4 EDTA (EDTA at pH 8.0-8.5), 2 mMP-mercaptoethanol (P-ME), 2.0 mMPefabloc, filter sterthze 2 L of 4 A4 GuHCl m TEMP pH 8 0 4 A4 GuHCl made up n-t 10 mM Trts-HCl, pH 8 0, 1 mA4 EDTA (pH 8 O-8 5) 2 mM P-ME, 0 2 mMPefabloc, filter sterthze 200 mL Sepharose 4B-200 m 4 M GuHCl in TEMP pH 8 0. 250 mL of Sepharose 4B-200 (Stgma cat no 4B-200) mixed wtth 750 mL of 4 MGuHCl m TEMP pH 8 0 Column chromatography assembly Ktmble/Kontes (Vmeland, NJ) flex-column (cat. no 420401-2550), l-way stopcock (cat. no. 420163-0001) female luer (cat. no 420407-0000), ferrule for l/16-in OD tubmg (cat. no 420822-0116), 1/4-m tubing nut for 1/16-m OD tubmg (cat. no 420821-0116), 5-ft PTFE tubing w/ integral luer lock (cat. no. 420823-0016), and column reservotr 1000 mL (cat no 420406- 1025). Alternatively, Ace Glass (Vmeland, NJ). Ace chromatography column (cat. no 5820-39), Ace cylmdrtcal funnel (cat no 5822-15), couplmg (cat no 5841-50), bottom-drip adapter (cat no. 5838-53), male nut connector (cat. no 5854-09), ferrule connector (cat. no 5854-26), TFE Teflon tubing (cat no 12684-28) and filter disk (cat no 5848-25) Fraction collector. 16&200 silicomzed stertle glass test tubes (13 x 100 mm) 13 x 100~mm tubes (VWR cat. no 60825-923) can be stltcomzed with Stgmacote (Stgma cat no SL-2), which 1s resistant to autoclavmg Markers for mcluston and excluston volumes wtthm the column. 0 1% (wt/vol) phenol red and dextran blue (Sigma cat nos P4758 and D575 1) m 4 M GuHCl- TEMP pH 8.0, respecttvely 8 L 5 mA4 Trts-HCI, pH 7.5, 1 mM EDTA, autoclaved or filter sterthzed Dialysis tubing and closures. Spectrum (Laguna Hills, CA) Spectra/Par stertle CE membranes, MWCO 15,000 (cat. no 130562), and closures, (cat no. 132735) Tissue-culture reagents for propagation of A549 cells and for plaque assays IS discussed m Chapter 1 Restriction enzymes, New England Biolabs (Beverly, MA): EcoRI (cat no 10 15), HzndIII (cat. no 1045), and calf intestinal alkaline phosphatase (CIP) (cat no. 2905) 2X HEPES-buffered saline (HeBS) solution. 42 mM HEPES (N-2-hydroxy- ethylptperazine-Ar-2-ethanesulfomc acid), 270 mMNaC1, 10 mM KCl, 1 0 mA4 Na2HP04, 0.2% dextrose pH to 7 05 with 5 NNaOH and filter sterdtze through a 0 45-pm mtrocellulose filter (see Note 1) After functtonal testmg (descrtbed m Note l), altquot the solutton m lo-mL ahquots and store frozen at -70°C 2 5 MCaCl* dihydrate (Sigma. cat no. C7902) Filter sterthze through a 0 45-pm mtrocellulose filter (Nalgene) and store at -20°C m lo-mL ahquots (can be fro- zen and thawed repeatedly) Somcated salmon-sperm DNA (Stratagene, La Jolla, CA, cat no 20 1190). 10 mg/mL stored frozen at -20°C 25% Glycerol shock solution: (for 10 mL) 7 5 mL of Dulbecco’s modtfied Eagle’s medmm (DMEM)/lO% fetal bovine serum (FBS), 2 5 mL glycerol (hgma cat no 2025)
Adenowrus E3 Mutations 15
19 1 8% Noble agar. 1.8 g ofNoble agar (DIFCO, Detroit, MI, cat no. 0142) m 100 mL ddH,O Sterilize by autoclavmg
20 Hirt lys~s buffer. 0 6% SDS, 0 01 M EDTA, 0.01 M Tris-HCl, pH 7.4 21. Proteinase K: (Boehringer Mannhelm cat no. 1 373 196) 15 mg/mL stock 22 5 MNaCl. 23 Loading dye. 6X buffer 0 25% bromophenol blue, 0.25% xylene cyan01 FF, 30%
(w/v) glycerol in water, store at 4O C. 24. 0 8% agarose. Electrophoresis-grade agarose (Glbco-BRL, Galthersburg, MD,
ultrapure agarose, cat no 15510-027). Prior to pouring the gel, add ethldium bromide (Sigma cat. no E875 1) to a concentration of 0.5 clg/mL for DNA visual- lzatlon under UV light
25 50X TAE buffer (per liter) 242 g Tris base, 57.1 mL glacial acetlc acid, 100 mL 0.5 M EDTA (pH 8.0), brought up to 1 L by the addition of ddH,O (workmg concentration of 40 mM Tris-acetate, 2 ti EDTA)
26. Plasmld-containing mutated E3 gene(s) of choice
3. Methods 3.1. Adenovirus TP-DNA Preparation
Adenovlruses contam two origins of replication located in the inverted ter- mmal repeats. The E2-coded terminal protein, along with the adenovirus DNA polymerase, bind wlthin the origin of replication where the terminal protein 1s cleaved to a polypeptlde of 55 kDa. This smaller polypepttde is then covalently attached to the vu-al genome, where it serves to initiate viral DNA replrcatlon. Purified adenovlrus DNA that has retained the terminal protem produces vu-al plaques at a 40-100 times higher frequency than viral DNA lacking the termmal protein followmg transfection (8,9). Because of its enhanced Infectivity, TP-DNA has been used as a starting point toward constructmg recombinant adenoviruses mutated in the E3 region. The following IS a proto- col for the purification of TP-DNA from the point where the mvestlgator has CsCl-purified adenovirus. Preparation of CsCl-purified adenovlrus is described m Chapter 1.
3.7.1. Column Preparation
1 Fill the column with 200 mL of 4 M GuHCl-TEMP. 2. Mix 250 mL of Sepharose 4B with 750 mL 4 MGuHCl-TEMP, degas for 10 mm. 3 Add the Sepharose 4B/GuHCl-TEMP solution to the column A glass rod may be
used to stir the Sepharose 4B solution m the column to remove any air bubbles 4 Move the column to 4°C and connect the column to a fraction collector Estabhsh
a flow rate of 18 mL/h Elute excess column buffer, being careful to retam enough column buffer so that the packing material 1s not exposed to air. Allow the Sepharose 4B to settle (usually overnight) at 4°C. The final column bed volume will be approx 35 cm.
76 Hermiston, Tollefson, and Wold
5 Add 200 mL of 4 M GuHCl-TEMP to wash the column agam retammg enough column buffer so that the packing material is not exposed to au-.
3.1.2. Virion Lysis and Collection of Ad TP-DNA
1. Collect CsCl-banded Ad5 virus prepared from 6-7 L virally infected KB spmner cells (as described Chapter 1).
2 Place the CsCl-banded adenovirns mto dialysis tubing and dialyze against two changes of TEMP at 4°C (allow 3 h/change of buffer) Normally, a white precipl- tate will appear (the adenovlrus vmons)
3 Remove the dialyzed adenovu-us from the tubing Measure the vlrns volume and add an equal volume of 8 M GuHCl-TEMP at 4”C, mix gently, and incubate at least 10 min on ice The white precipitate of adenovirus vlrions ~111 clear upon the addition of the 8 M GuHCl-TEMP
4 Using a pipet, gently layer the lysed adenovlrus vlrlon solution onto the pre- pared Sepharose 4B column described above, bemg careful not to disturb the column bed.
5. Begin runnmg the column, collectmg 2-mL fractions. Immediately add 1 mL 4 M GuHCl contammg 0 1% dextran blue and 0.1% phenol red as markers for exclu- sion and inclusion volumes.
6 Add 5 mL 4 MGuHCl-TEMP After these solutions have run into the column and the volume above the column nears the column bed, add 300 mL of 4 MGuHCl- TEMP to the column reservoir and continue running the column The full run will take approx 6-8 h
7. Pool the first 20 mL from the column and save 8. Test the additional fractions (usually every other one) for the appearance of the
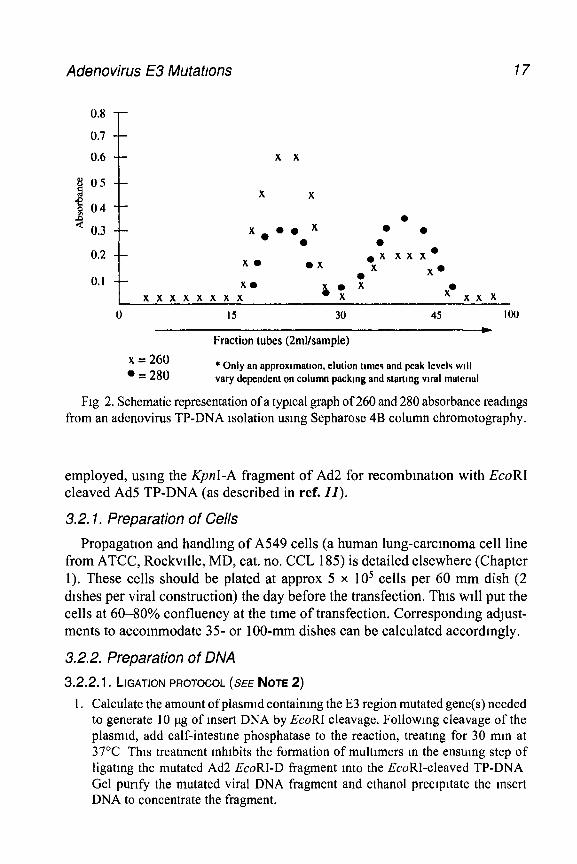
viral TP-DNA. This can be done by takmg absorbance measurements at 260 nm and 280 nm, usmg the column buffer, 4 M GuHCl-TEMP, as a blank After plot- ting these data (a typical graphed experimental run appears in Fig. 2), pool the peak fractions (to maintain a maximum concentration) and subsequent shoulders These fractions are then dialyzed at 4°C against two 2-L volumes of 5 nuW Tns- HCl, pH 7.5, 1 mMEDTA.
9 Read the absorbance at 260 nm and 280 nm to get a final concentration of the TP- DNA pools (the 260 280 ratio should be 1.8 to 2 0). The DNA-protein complex (normally 30-50 pg/mL for the pooled peak fractions) can be stored at 4°C for up to 10 yr However, for maximal mfectivlty, DNA-protein complex should be used within 1 yr Do not ethanol-precipitate TP-DNA.
3.2. Transfecfion of A549 Cells
Thts se&on presents a standard protocol used for transfecting A549 cells to generate recombmants m the E3 region. Mutations m the E3 12.5 K, 6.7 K, gp19 K, ADP (11.6 K), and the majority of the 10.4 K-coding sequence can be transferred to the viral genome by hgation of the mutated Ad2 EcoRI-D frag- ment to EcoRI-digested Ad5 TP-DNA (12). In cases in which mutations are needed in the 14.5 K and 14.7 K protems, homologous recombmation has been
Adenovirus E3 Mutations 17
0.8
0.7
0.6 E x x
X X
0 Xo .o x 0 0
0 0 Y “XX 0
X0 l x l A A X X’
X0
xxxxxxxx by;: T X0 xxx
0 15 30 45 loo
x = 260 l = 280
Fraction tubes (2mVsample)
* Only an npproxlmatton, elution times and peok levels WIII vary dependent on column packmg and startmg viral matcrud
Fig 2. Schematic representation of a typical graph of 260 and 280 absorbance readmgs from an adenovirus TP-DNA isolation using Sepharose 4B column chromatography.
employed, using the KpnI-A fragment of Ad2 for recombmatron with EcoRI cleaved Ad5 TP-DNA (as described in ref. II).
3.2.1. Preparation of Cells
Propagation and handling of A549 cells (a human lung-carcmoma cell line from ATCC, Rockvtlle, MD, cat. no. CCL 185) is detailed elsewhere (Chapter I). These cells should be plated at approx 5 x IO5 cells per 60 mm dish (2 dishes per viral construction) the day before the transfection. This will put the cells at 60-80% confluency at the time of transfection. Correspondmg adjust- ments to accommodate 35- or loo-mm dishes can be calculated accordmgly.
3.2.2. Preparation of DNA
3.2.2.1. LIGATION PROTOCOL (SEE NOTE 2)
1. Calculate the amount of plasmid containing the E3 region mutated gene(s) needed to generate 10 pg of insert DNA by EcoRI cleavage. Followmg cleavage of the plasmid, add calf-intestme phosphatase to the reaction, treating for 30 mm at 37°C This treatment Inhibits the formation of multtmers m the ensumg step of ligating the mutated Ad2 EcoRI-D fragment into the EcoRI-cleaved TP-DNA Gel purify the mutated viral DNA fragment and ethanol precipitate the Insert DNA to concentrate the fragment.
18 Hermlston, Tollefson, and Weld
2 Cleave 2.5 ug of Ad5 TP-DNA wrth 20 U of EcoRI per viral construct The EcoRI cleavage of the Ad5 TP-DNA will create three fragments, 2733 1, 5886, and 2718 bp m size. Check for adequate cleavage of the viral TP-DNA by run- ning 0 5 pg of the DNA on a 0.8% agarose gel The larger two fragments are from the termmt of the vnus Because of then association with TP, they ~111 not migrate mto the gel and will appear retained m the well of the gel followmg exposure to UV light Smce the EcoRI fragment of 2718 bp IS an Internal frag- ment, it will migrate easily into the gel The EcoRI-digested Ad5 TP-DNA will be used directly m the ligation reaction with the mutant viral DNA (Overnight restriction-enzyme dtgestton usually results m Me detectable restriction endo- nuclease activtty the followmg day ) Do not ethanol-precipitate the restrtctron endonuclease-cleaved TP-DNA
3 Combme 2 pg of the EcoRI-cleaved Ad5 TP-DNA with 5 pg of the mutated E3 insert DNA (Ad2 EcoRI-D fragment) and hgate overmght at 16°C This puts the insert at a 33-fold molar excess over the equivalent wild-type sequence that ~111 still be present in the EcoRI-cleaved TP-DNA. The large molar excess, however, favors the msertion and wild-type vnus IS rarely regenerated (~10%)
3 2 2 2. OVERLAP RECOMBINATION PROTOCOL
In this method, the mutated viral DNA segment 1s not gel purified. Instead, a plasmtd with the KpnI-A fragment of Ad2 (bp 25,881 to 33,594) containing the mutant E3 gene(s) 1s cotransfected with the EcoRI-digested Ad5 TP-DNA The EcoRI digestion ensures that the wild-type vu-us 1s not regenerated and retains enough overlappmg sequence for homologous recombmatton to occur between the EcoRI-cleaved Ad5 TP-DNA and the KpnI-A adenovtrus sequences in the plasmtd. This protocol IS similar to the hgatton technique described previously but elrmmates the need to isolate the mutated viral DNA sequence from a plasmtd and the ligatton step, making tt more time effective. Simply calculate the amount of the E3-mutated plasmid required to generate 10 pg of the mutated viral DNA segment and cotransfect tt with the restriction-enzyme-drgested viral genomtc TP-DNA followmg the proto- col described below.
3.2.3 Transfection Protocol
1 Plate A549 cells at 5 x lo5 per 60-mm dish the day before the transfectton Be sure to include control plates for transfecting uncut TP-DNA ( 100 ng) to ensure that your TP-DNA is good (this should give a lawn of plaques on a 60-mm dish at approx d 5-7 posttransfection) and cleaved TP-DNA (2 pg) (this ~111 mdtcate the cleavage efficiency of the TP-DNA by EcoRI and serve to determine the plaque background level for the experiment)
2 Change the medmm on the A549 cells 3 h prtor to the transfectton solutton bemg Introduced onto the monolayer
Adenovirus E3 Mutatrons 79
3 Combme the ligand DNA with 20 clg of salmon sperm DNA and add sterile ddH,O to a volume of 450 pL
4. Add 50 & of 2.5 M CaCI,. 5 Place 500 pL of 2X HeBS mto a sterile IS-mL comcal tube. While mtxmg the 2X
HeBS (either mechanically by bubbling air through the solution usmg a mecham- cal pipettor or by hand shakmg the solution) add the DNAKaCl, solution dropwise (using a Pasteur pipet or Ptpetteman). Immediately vortex the solutton for 5 s
6 Allow the tube to stand at room temperature undisturbed for 20 mm while a pre- cipitate forms
7 Aspirate the medium off the cell monolayer and add 0.5 mL transfection mixture onto cell monolayer in each 60-mm dish Incubate for 20 mm m a 37°C 5% CO2 mcubator
8 Add 4 mL complete medra (DME + 10% FCS) and Incubate for an additional 4 h m a 37°C COz incubator
3.2.4. Glycerol Shock
1. Remove the medmm on the plate and add 1 mL glycerol shock solution (warmed to 37Y) to the cells for 1 mln
2. Aspnate off the shock medium and wash 2X wtth 5 mL of DME/lO% FBS Alternattvely, the mittal wash of DME/lO% FBS can be added dtrectly to reduce the exposure of the cells to the solutton if a number of transfecttons are being done at one time
3.3. Agar Overlay
1 After all transfected cells have been shocked (with either protocol), an agar over- lay 1s apphed
2. Make up 50 mL agar overlay solutton m the following fashton. 25 mL 2X DME, I mL of FBS, 2.5 mL 7 5% NaHCO,. Warm the solution to 37°C. Immediately prtor to overlaying the cell monolayer, add 2 1 5 mL sterile 1 8% Noble agar that has been melted and cooled to 56°C.
3 Add 5 mL of the agar overlay medium per 60-mm dish Allow the solution to sohdify at room temperature (approx 3 min) and then return the plates to a 37°C CO, incubator.
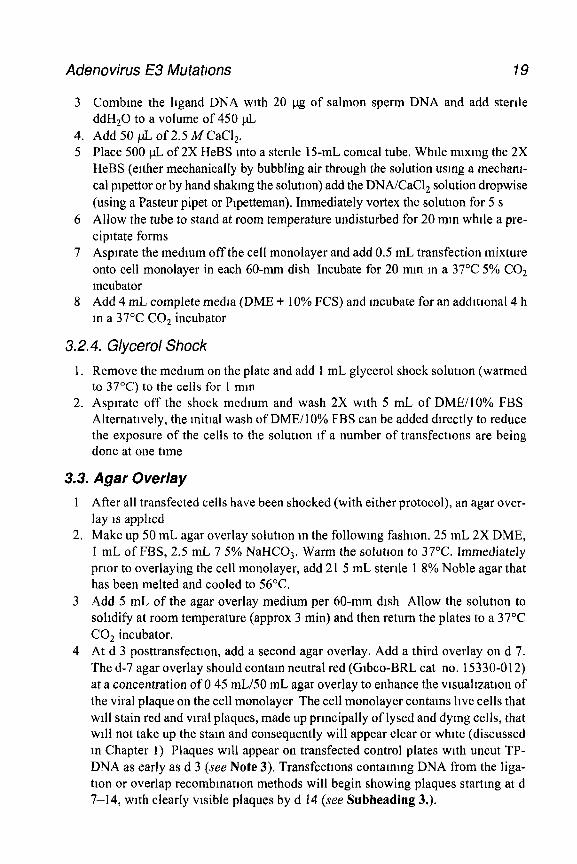
4 At d 3 posttransfectlon, add a second agar overlay. Add a third overlay on d 7. The d-7 agar overlay should contam neutral red (Gtbco-BRL cat no. 15330-012) at a concentration of 0 45 mL/50 mL agar overlay to enhance the vtsuahzatton of the viral plaque on the cell monolayer The cell monolayer contams hve cells that will stain red and viral plaques, made up prmcipally of lysed and dymg cells, that will not take up the stam and consequently will appear clear or white (discussed m Chapter 1) Plaques will appear on transfected control plates with uncut TP- DNA as early as d 3 (see Note 3). Transfectrons contammg DNA from the liga- non or overlap recombmation methods will begin showing plaques startmg at d 7-14, with clearly visible plaques by d 14 (see Subheading 3.).
20 Hermiston, Tollefson, and Wold
3.4. hitid isolation and Storage of Viral Plaques
Pick well-isolated plaques from transfected cultures by punching out agar plugs with a sterile Pasteur pipet. Store agar plugs in 0.5 mL sterile PBS with calcium and magnesium and 10% glycerol at -70°C. Ideally, however, plaques are propagated on A549 cells immediately after they are picked and viral supernatant containing the candidate virus IS stored (see Subheading 3.5.).
3.5. Initial Propagation of Viral Plaques
1. Plate A549 cells at 5 x lo5 cells per 35-mm dish the day before picking plaques This will place the cells at 80% confluency the day of the infection
2. Remove medium from cells and add 0.2 mL vuus (agar-plug suspenston solutton described in the previous step). Adsorb at room temperature for 30 mm and then add 2 5 mL complete medta and incubate at 37°C. Cells should not need to be refed during the imtial propagatton.
3 Viruses are ready to harvest when all cells are rounded (due to the viral cyto- pathic effect or CPE) and most have detached from the dish (usually 4-7 d)
4. To permit collectton of medmm (as stock) while retammg the majority of the infected cells (for analysis), leave dishes undisturbed in the tissue-culture hood for 30 mm
5 Gently remove 2 mL medium and add tt to a sterile veal containmg 0 25 mL sterile glycerol Gently mix and store these candidate viruses at -70°C
6 Slowly aspirate any remammg medium from the plate If this IS done carefully, the majority of cells ~111 remam m the dish and can be used m the next section for analysts of adenovirus plaques.
3.6. Analysis of Adenovirus Plaques
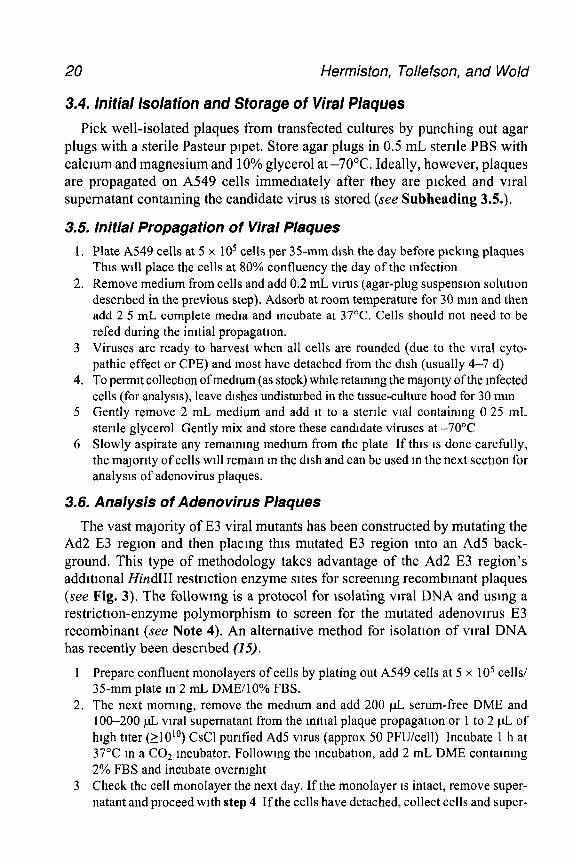
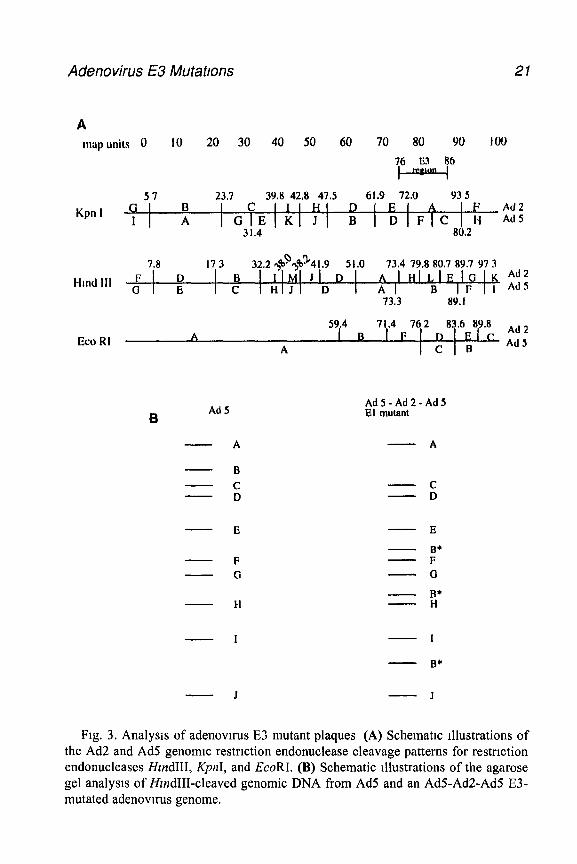
The vast majority of E3 viral mutants has been constructed by mutating the Ad2 E3 region and then placing this mutated E3 region mto an Ad5 back- ground. This type of methodology takes advantage of the Ad2 E3 region’s additional Hind111 restriction enzyme sites for screening recombinant plaques (see Fig. 3). The followmg is a protocol for isolating viral DNA and usmg a restriction-enzyme polymorphism to screen for the mutated adenovn-us E3 recombinant (see Note 4). An alternative method for isolation of viral DNA has recently been described (15).
1 Prepare confluent monolayers of cells by plating out A549 cells at 5 x 1 O5 cells/ 35-mm plate m 2 mL DME/lO% FBS.
2. The next mornmg, remove the medium and add 200 pL serum-free DME and 1 O&200 pL viral supernatant from the mittal plaque propagation or 1 to 2 pL of high titer (~10’~) CsCl purified Ad5 vuus (approx 50 PFU/cell) Incubate 1 h at 37°C m a CO2 Incubator. Followmg the mcubatton, add 2 mL DME contammg 2% FBS and incubate overnight
3 Check the cell monolayer the next day. If the monolayer 1s intact, remove super- natant and proceed with step 4 If the cells have detached, collect cells and super-
Adenovirus E3 Mutations 21
A map units 0 10 20 30 40 50 60 70 80 90 100
76 E3 86
57 23.7 39.8 42.8 47.5 61.9 72.0 93 5
Kpn 1 y / B I C IIIHI D IEI A IF Ad2
A IGIEIKIJI B IDIFICIH Ad5 31.4 80.2
7.8 173 32.2
Hand 111 0” ’ D
+‘[email protected] 51.0 73.4 79.8 80.7 89.7 97 3
I B 1 IlMiJI D 1 I AAI
1 HiLiE IG IK 1 E I c I HIJI D B IFI1
73.3 89.1
59.4 71.4 762 83.6 89.8
Eco RI A B IFIDIEIC A 1 Cl9
B Ad5
-A
-B
-c -D
- E
-F -CI
-H
- I
- J
Ad5-Ad2-Ad5 El mutant
-A
-c -D
-E
- B* -F -G
=i
-1
- B*
-J
Ad 2 Ad5
Ad 2 Ad 5
Fig. 3. Analysis of adenovnus E3 mutant plaques (A) Schematic illustrations of the Ad2 and Ad5 genomic restriction endonuclease cleavage patterns for restriction endonucleases HlndIII, KpnI, and EcoRI. (B) Schematic illustrations of the agarose gel analysis of HwrdIII-cleaved genomic DNA from Ad5 and an AdS-Ad2-Ad5 E3- mutated adenovnus genome.
22 Hermiston, Tollefson, and Weld
4
5
6.
7
8.
9
10
11 12
13.
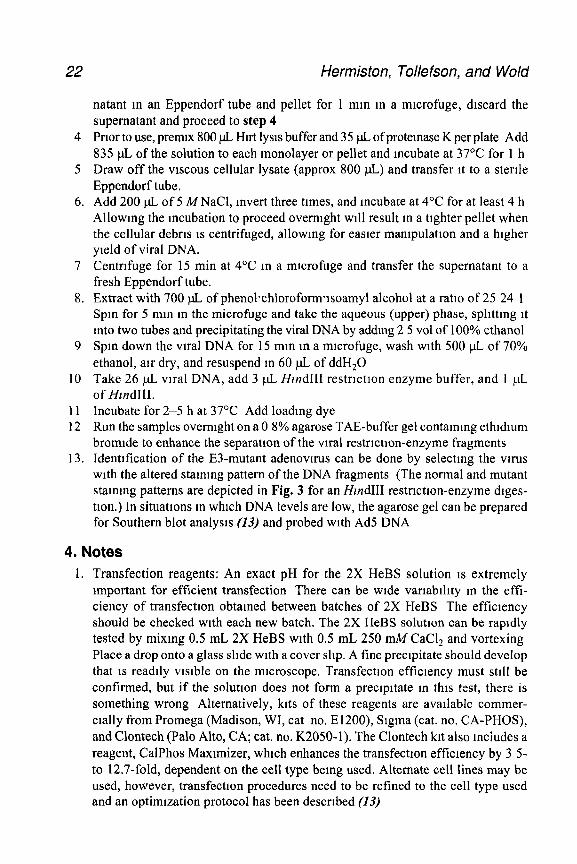
natant m an Eppendorf tube and pellet for 1 mm m a mtcrofuge, dtscard the supernatant and proceed to step 4 Pnor to use, premtx 800 pL Hnt lys~s buffer and 35 pL of protemase K per plate Add 835 pL of the solution to each monolayer or pellet and incubate at 37°C for 1 h Draw off the viscous cellular lysate (approx 800 pL) and transfer it to a sterile Eppendorf tube. Add 200 p.L of 5 MNaCl, invert three times, and Incubate at 4°C for at least 4 h Allowmg the incubation to proceed overnight will result m a tighter pellet when the cellular debris is centrifuged, allowing for easier manipulation and a higher yield of viral DNA. Centrifuge for 15 min at 4°C m a microfuge and transfer the supernatant to a fresh Eppendorf tube. Extract with 700 pL of phenol*chloroform~isoamyl alcohol at a ratio of 25 24 1 Spin for 5 mm m the microfuge and take the aqueous (upper) phase, sphttmg it into two tubes and precipitating the viral DNA by adding 2 5 vol of 100% ethanol Spm down the viral DNA for 15 mm m a microfuge, wash with 500 pL of 70% ethanol, an dry, and resuspend m 60 pL of ddH,O Take 26 p.L viral DNA, add 3 p.L HzndIII restriction enzyme buffer, and 1 pL of HzndIII. Incubate for 2-5 h at 37’C Add loadmg dye Run the samples overmght on a 0 8% agarose TAE-buffer gel contammg ethrdmm bromide to enhance the separation of the viral restriction-enzyme fragments Identification of the E3-mutant adenovn-us can be done by selecting the virus with the altered stammg pattern of the DNA fragments (The normal and mutant staining patterns are depicted in Fig. 3 for an HzndIII restriction-enzyme diges- tion.) In situations m which DNA levels are low, the agarose gel can be prepared for Southern blot analysis (23) and probed with Ad5 DNA
4. Notes 1. Transfection reagents: An exact pH for the 2X HeBS solution is extremely
important for efficient transfection There can be wide variability m the effi- ciency of transfectton obtained between batches of 2X HeBS The efficiency should be checked with each new batch. The 2X HeBS solution can be rapidly tested by mixing 0.5 mL 2X HeBS with 0.5 mL 250 ti CaCI, and vortexing Place a drop onto a glass shde with a cover slip. A fine precipitate should develop that is readily visible on the microscope. Transfection efficiency must still be confirmed, but if the solution does not form a precipitate in this test, there is something wrong Alternatively, kits of these reagents are available commer- cially from Promega (Madison, WI, cat no. E1200), Sigma (cat. no. CA-PHOS), and Clontech (Palo Alto, CA; cat. no. K2050-1). The Clontech kit also includes a reagent, CalPhos Maximizer, which enhances the transfectton efficiency by 3 5- to 12.7-fold, dependent on the cell type bemg used. Alternate cell lines may be used, however, transfectton procedures need to be refined to the cell type used and an optimization protocol has been described (13)
Adenovirus E3 Mutattons 23
2 Plasmtd DNA preparatton. The quality of the plasmtd DNA used m transfectton expertments IS crucral for success. Plasmid DNA should be prepared by CsCl banding (13) or by commerctally avatlable kits designed to reduce the quantity of lipopolysacchartde (LPS) present in the completed plasmtd preparation (Qtagen, Chatsworth, CA, cat no 12362)
3. Plaque assay. The plaque appearance may be greatly delayed (2 1 d or longer) in cases m which the adenovnus E3 ADP (11.6 K) protein expression is altered by deletion or mutation These plaques will typically be small in size.
4 Screenmg adenovirus plaques* An alternattve method to determme the E3-mutant adenovnus utrhzes m vtvo labelmg of the vtral DNA wtth 32P. Much of this pro- cedure parallels that previously discussed with the followmg exceptrons Seven to nme hours postmfectton, wash the cell monolayer with phosphate-free DMEM (Gtbco-BRL, cat no 1197 I-025); then add 1 mL of phosphate-free DMEM con- taming 2% FBS and 32P-orthophosphate (NEN-DuPont, Wilmington, DE; cat. no. NEX-053) at 50 @I/ 35-mm plate. Incubate overnight in a 37°C CO, mcuba- tor (32P orthophosphate IS a p emitter. The mvesttgator’s radtatton safety officer should be nottfied for proper handling and dtsposal of all matertals ) Harvestmg, processmg, and restrtctton-enzyme digestion of the vtral DNA can contmue as prevtously descrtbed. After the restrictton-enzyme fragments are separated by gel electrophorests, the gel can be drted at 80°C for 2 h under a vacuum (be sure to have a cold trap installed to capture 32P-radtoacttve waste) and then exposed to autoradiography film for 5 mm or more at room temperature
References 1. Wold, W. S. M , Tollefson, A E , and Hermiston, T W (1995) E3 transcriptton
unit of adenovu-us, in The Molecular Repertowe of Adenovwuses, Current TOPICS zn Mzcroblology and Immunology, vol. 199 (Doerfler, W. and Bohm, P , eds ), Springer, pp 237-274
2. Chroboczek, J., Bteber, F , and Jacrot, B. (1992) The sequence of the genome of adenovnus type 5 and tts compartson wtth the genome of adenovnus type 2 Vwology 186, 28&285.
3 Roberts, R. J , O’Netll, K E., and Yen. C. T. (1984) DNA sequences from the adenovnus 2 genome. J Blol Chem 259, 13,968-13,975.
4. Tollefson, A E , Ryerse, J S., Scaria, A., Hermiston, T. W., and Wold, W S. M. (1996) The E3 11 6-kDa adenovtrus death protein (ADP) is requtred for effi- cient cell death characterization of cells infected with adp mutants. Vzrology 220,152-162
5 Tollefson, A E , Scat-la, A., Hermiston, T. W , Ryerse, J S , Wold, L J , and Wold, W. S M (1996) The adenovnus death protein (E3-11 6K) is reqmred at very late stages of infection for efficient cell lysrs and release of adenovnus from Infected cells. J Vu-01 70, 229&2306.
6 Tollefson, A E , Hermtston, T. W., Ltchtenstem, D L., et al (1998) Forced degradation of Fas mhtbtts apoptosts m adenovnus-infected cells. Nature 392, 726-730
24 Hermiston, Tollefson, and Wold
7. Li, Y., Kang, J., and Horwitz, M J. (1997) Interaction of an adenovirus 14 7- kilodalton protein inhibitor of tumor necrosis factor alpha cytolysls with a new member ofthe GTPase superfamily of signal transducers. J Vzrol 71, 1576-l 582
8 Robmson, A. J., Younghusband, H. B , and Bellett, A. J D (1973) A cucular DNA-protein complex from adenovnuses. Vzrology 56, 54-69
9 Sharp, P. A., Moore, C , and Haverty, J. L (1976) The mfectrvrty of adenovuus 5 DNA-protein complex VzroZogv 75,442-456
10. Chmnadural, G , Chinnadurai, S., and Green, M. (1978) Enhanced mfecttvtty of adenovlrus type 2 DNA and a DNA-protein complex J Vzrol 26, 195-199
11 Ranhelm, T. S., Shtsler, J., Horton, T. M., Weld, L. S , Gooding, L R., and Wold, W S. M. (1993) Characterization of mutants wrthm the gene for the adenovuus E3 14.7-kilodalton protein which prevents cytolysts by tumor necrosts factor J. Vzrol 67,2159-2167
12 Wold, W S M , Deutscher, S L., Takernon, N , Bhat, B M., and Magle, S C. (1986) Evidence that AGUAUAUGA and CCAAGA UGA mmate translation m the same mRNA m regron E3 of adenovu-us. Vzrology 148, 168-180.
13. Ausbel, F. M , Brent, R , Kingston, R. E., Moore, D D , Seidman, J G., Smtth, J. A., and Struhl, K (1994) Introduction of DNA into mammalian cells, m Current Protocols zn Molecular Bzology, vol. 1, Wiley, New York, pp. 9.1 l-9 5 5
14 Trower, M K. (1996) A protocol for site-directed mutagenesis employmg a uracrl- containing phagemld template Methods Mol. BIOI 58,469-476.
15 Deryckere, F and Burger-t, H -G (1997) Rapld method for preparing adenovrrus DNA Bzotechnzques 22, 868-870
3
Isolation, Growth, and Purification of Defective Adenovirus Deletion Mutants
Gary Ketner and Julie Boyer
1. Introduction Adenovirus mutants that lack essential genes must be grown by complemen-
tation, the products of the missmg genes supplied by a source other than the vtral genome. Two methods are available for the growth of defective adenovirus mutants by complementation. For mutations confined to E 1, E4, or portions of E2, complementmg cell lines that contain segments of viral DNA and that can supply the missing viral products can be used to produce pure stocks of mutant particles (1-9). This approach will probably be extended to other regions of the viral genome, but may prove difficult to adapt to genes such as the late genes, whose products are required in large amounts by the virus. Alternatively, defec- tive mutants can be grown as mixed stocks with a second helper virus that can supply in truns functions required by the mutant (10). Providing that a mutant contains all of the c&-active elements required for viral growth and is large enough to be packaged into an adenoviral capsid, there are in principle no restric- tions on the DNA sequences that can be deleted from a mutant grown by comple- mentation with helper virus. In addition, because the helper virus replicates, even products needed in large amounts can be effectively supplied in trans. Recently, adenoviral genomes constructed for gene therapy purposes and lacking nearly all viral sequences have been propagated in this way (11-13).
Growth of mutants by complementation with helper virus requires that, for most purposes, the mutant and helper be physically separated before use. This is done by CsCl equilibrium density gradient centrifugation. The following proto- cols were developed for propagation of defective mutants with modest deletions (l O-20% of the viral genome), but are applicable to larger deletions and to sub- stitutron mutants with genome sizes that differ from that of wild-type virus.
From Methods In Molecular Me&me, Vol 21 Adenovms Methods and Protocols Edited by W S M Wold 0 Humana Press Inc, Totowa, NJ
25
26 Ketner and Bayer
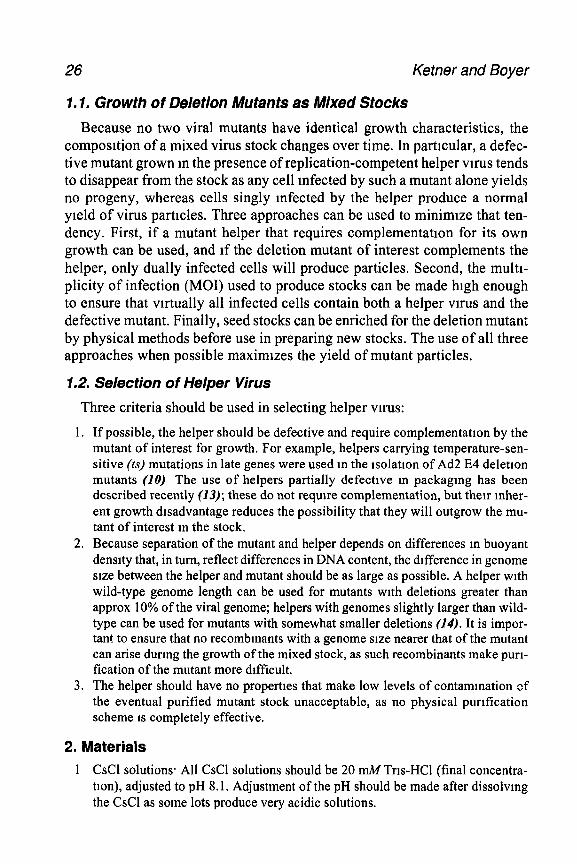
1.7. Growth of Deletion Mutants as Mixed Stocks
Because no two viral mutants have identical growth characteristics, the composttion of a mixed virus stock changes over time. In parttcular, a defec- tive mutant grown m the presence of replication-competent helper vn-us tends to disappear from the stock as any cell infected by such a mutant alone yields no progeny, whereas cells singly infected by the helper produce a normal yield of virus particles. Three approaches can be used to minimize that ten- dency. First, if a mutant helper that requires complementation for its own growth can be used, and if the deletion mutant of interest complements the helper, only dually infected cells will produce particles. Second, the multi- plicity of infection (MOI) used to produce stocks can be made high enough to ensure that virtually all infected cells contain both a helper virus and the defective mutant. Finally, seed stocks can be enriched for the deletion mutant by physical methods before use in preparing new stocks. The use of all three approaches when possible maximizes the yield of mutant particles.
1.2. Selection of Helper Virus
Three criteria should be used in selecting helper vnus:
1. If possible, the helper should be defective and require complementation by the mutant of interest for growth. For example, helpers carrying temperature-sen- sitive (ts) mutations in late genes were used m the isolation of Ad2 E4 deletion mutants (10) The use of helpers partially defective m packaging has been described recently (13); these do not reqmre complementation, but then mher- ent growth disadvantage reduces the possibility that they will outgrow the mu- tant of interest m the stock.
2. Because separation of the mutant and helper depends on differences m buoyant density that, in turn, reflect differences in DNA content, the difference in genome size between the helper and mutant should be as large as possible. A helper with wild-type genome length can be used for mutants with deletions greater than approx 10% of the viral genome; helpers with genomes slightly larger than wild- type can be used for mutants with somewhat smaller deletions (24). It is impor- tant to ensure that no recombmants with a genome size nearer that of the mutant can arise during the growth of the mixed stock, as such recombinants make purr- fication of the mutant more difficult.
3. The helper should have no properties that make low levels of contammation of the eventual purified mutant stock unacceptable, as no physical purification scheme IS completely effective.
2. Materials
1 CsCl solutions, All CsCl solutions should be 20 mM Trrs-HCl (final concentra- tion), adjusted to pH 8.1. Adjustment of the pH should be made after dissolvmg the CsCl as some lots produce very acidic solutions.
Defective Adenovirus Deletion Mutants 27
CsCl density 1.25, refractive index 1.3572; 33.8 g CsCl per 100 mL of solution. CsCl density 1.34, refractive index 1.3663; 46.0 g CsCl per 100 mL of solution. CsCl density 1.7: refractive index 1.3992; 95.1 g CsCl per 100 mL of solution.
2. 1,1,2 Trichlorotrifluoroethane (Sigma, St. Louis, MO; cat. no. T5271). 3. 200X IGEPAL (Sigma cat, no. I-3021): 10% IGEPAL CA-630 solution m water. 4. TE. 10 mA4Tris-HCl, 1 mMEDTA, pH 8.1. 5. PBS: per liter: 160 g NaCl, 4 g KCI, 18.2 g Na*HPO,, 4 g KH,PO,, 37.2 g EDTA.
pH should be 7.2.
3. Methods
3.7. lsolation of Defective Mutants by Complementetion PIaquing 3.7.1. With Defective Helpers (see Notes 1 and 2)
1. Prepare host cell monolayers m 6-cm tissue culture dishes. If applicable, the host cells should be nonpermissive for the helper,
2. Determine the number of cells in one dish. 3. Transfect monolayers with mutant DNA by the calcmm phosphate procedure
(protocol elsewhere in this volume). DNA fragments can be used if mutants are being constructed by a recombinational strategy.
4 After transfection, infect the monolayer at an MO1 of 2-5 PFU/cell with the helper virus. Remove the medium from the transfected dishes, add the virus m 1 mL medium, adsorb for 2 h, remove the inoculum, and till the dishes with agar medium.
5 Contmue by a standard plaquing protocol. If the helper is a ts mutant, incubate the dishes at the restrictive temperature.
6. When plaques are vistble, pick and screen for the presence of the mutant (see Chapter 4)
3.1.2. With Nondefective Helpers
1, Prepare helper vu-us DNA-protein complex (DNAPC; see Chapter 4). 2. MIX mutant DNA and helper DNAPC in a molar ratio of 10: 1 to 50: 1 and trans-
feet appropriate monolayers. The optimal amount of DNA for transfection varies depending on the plaque-forming efficiency of the helper DNA; adjust the DNA level to produce approx 100 plaques per dish.
3. Treat as a normal plaque assay. 4. Pick and screen plaques for the presence of the mutant.
3.2. Growth of Mixed Stocks
1. Prepare host cell monolayers in 6-cm tissue culture dishes. If applicable, the host cells should be nonpermissive for the helper.
2. Remove the medium from each dish. Place the dishes with one edge slightly raised (for example, resting on a pencil) on a tray. This makes it possible to restrict the inoculum to a small area of the dish and raises the MO1 in that region.
28 Ketner and Bayer
3. Pipet 0.1-0.25 mL of a mixed moculum onto the lower edge of the monolayer. The inoculum can be a ministock (Chapter 4), a portion of a previously made mixed stock, or a stock enriched for the deletion mutant by one round of CsCl denstty gradtent centrifugation (below), diluted with medium to approx log infectious units per mL.
4. With the dish still tilted, incubate at 37°C in a humldlfied incubator for 2 h. (Proper humidification IS important to prevent the raised side of the monolayer from drying out.)
5 Remove the moculum, refill the dish with medmm, place the dish flat, and mcu- bate until all of the cells have detached from the plate. If a ts helper is being used, incubate at the restrictive temperature. Feed twice weekly by replace- ment of the medium until evidence of viral infection 1s seen over a substantial portion of the monolayer.
6. Harvest the infected cells and medium when all of the cells have detached from the dish. This mixed stock can be stored at -80°C until use.
3.3. Purification of Deletion Mutants From Mixed Stocks
Because adenovirus particles with differing DNA contents have differing buoyant densities in CsCI, adenovirus deletion mutants grown in the presence of helper virus can be separated from the helper by equilibrium sedimenta- tion in CsCl density gradients. Only mutants with fairly large deletion mutations (> 10%) can be efficiently purified from helpers with a wild-type genome size by this method, although helper virus with longer than wild- type genomes have been used to make the purification of mutants with smaller deletions possible (14).
1. Prepare a mixed lysate. One dish should be labeled with 32P as described below. 2. To the mlxed stock, add IGEPAL to a final concentration of 0.05%. 3. Extract the stock vigorously with l/5 volume of 1 ,1,2 trichlorotrifluoroethane. Recover
the aqueous phase after centrifugation at 4000g for 5 min in a Sorvall GSA rotor. Re-extract the cell debris and organic phase with a small volwne of PBS; recover the aqueous phase and pool with the supematant from the previous centrifugation
4. Prepare a discontinuous CsCl gradient in a 35-mL polypropylene centrifuge tube by adding (in order) approx 20 mL extracted virus suspension, 4 mL. CsCl den- sity 1.25, and 5 mL CsCl density 1.7. Add each solution slowly through a plpet placed all of the way to the bottom of the tube. After the CsCl solutions have been added, fill the tube to the desired level with extracted vn-us suspension.
5. Centrifuge for 90 min at 17,000 rpm (29,000g) (Sorvall SV288 rotor or equiva- lent) or 3 h at 25,000 rpm (82,000g) (Beckman SW27 rotor or equivalent).
6. In a darkened tissue culture hood, illuminate the gradient wrth a narrow beam of light from one side. A microscope lamp is a suitable light source. The virus will form a sharp, blue-white, translucent band at the interface of the two CsCl solu- tions. A broader, yellowish or tan, frequently granular layer of cell debris will appear at the top of the lighter CsCl cushion.
Defective Adenovirus Deletion Mutants 29
7. Collect the virus, avoiding the cell debris (see Note 3). 8. Adjust the concentrated virus suspension to a density of 1.34 (refractive index
1.3663) with 20 mM Tris-HCl, pH 7.5 or with the density 1.7 CsCl solution. Adjust to the required volume with CsCl density 1.34.
9. Centrifuge the suspension at 35,000 rpm for 16 h in a Sorvall TV865 rotor (or equivalent). Two closely spaced virus bands should be visible m the center of the tube.
10. Fractionate the gradient into single-drop fractions through a hole made in the bottom of the tube.
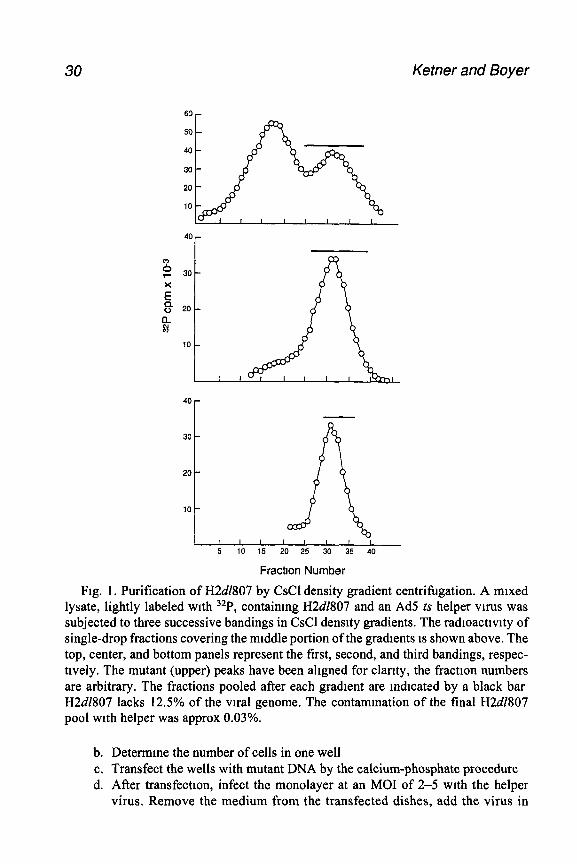
11. Measure the radioacttvity m each fraction by Cherenkov counting. Two more or less well-separated peaks should appear (Fig. 1).
12. Pool the fractrons that comprise the lighter peak (see Fig. 1) and repeat steps 8-11 (see Note 4).
13 Estimate the infectious titer of the virus suspension from its A,,, An A,,, of 1 corresponds to a plaque-formmg titer of 3.5 x 1 Og PFU/mL for Ad5 purified over three CsCl gradients.
14. The purity of the mutant stock can be assessed by plaqumg under conditions permissive for the helper, or by restriction enzyme digestion of purified DNA.
15 Purified virus is stable for months m buoyant CsCl at 4°C. However, htgh-titer suspensions dialyzed against solutions of low ionic strength (for example, TE) frequently precipitate. If it is necessary to remove the CsCl from a purified stock, first adjust the A 260 of the suspension to 0.5 or lower, and mimmize storage time at low ionic strength.
3.4. Preparation of 32P-Labeled Tracer Virus Particles (see Note 5)
1. Inoculate a IO-cm dish of cells with a mixed stock as described above. 2. Examme the dish daily, replacing the medium every 3 d until one-fourth to one-
half of the cells show evidence of viral infectron. Gently remove the medium from the dish and replace it with 10 mL phosphate-free medium supplemented with 2% serum and 40 uCi/mL 32P orthophosphate.
3. When all of the cells have become detached from the dish, harvest the cells and medium.
4. Collect the cells by low-speed centrifugation. Rinse the labeled cells twice by low-speed centrifugation and resuspension in PBS.
5. After the second rinse, resuspend the cells in 5 mL PBS, add IGEPAL to 0.05%, and extract vigorously with 5 mL of 1,1,2 trichlorotrifluoroethane Centrifuge and recover the aqueous phase. If intended for use as tracer, add this material to one tube of unlabeled virus and concentrate (step 3).
4. Notes 1. Some defective vrruses kill cells that they infect even though they do not form
plaques. If monolayers infected with helper at the MO1 recommended here do not survive, the following modification should be used a. Prepare monolayers m 24-well tissue culture dishes.
30 Ketner and Boyer
40 r
40 r
Fraction Number
Fig. 1, Purification of H2d1807 by CsCl density gradient centrifugation. A mixed lysate, lightly labeled with 32P, containmg H2d1807 and an Ad5 ts helper vu-us was subjected to three successive bandings in CsCl density gradients. The radioacttvity of single-drop fractions covering the middle portion of the gradients is shown above. The top, center, and bottom panels represent the first, second, and third bandings, respec- tively. The mutant (upper) peaks have been aligned for clarity, the fraction numbers are arbitrary. The fractions pooled after each gradient are indicated by a black bar H2d1807 lacks 12.5% of the viral genome. The contammation of the final H2dZ807 pool with helper was approx 0.03%.
b. Determine the number of cells in one well c. Transfect the wells with mutant DNA by the calcium-phosphate procedure d. After transfection, infect the monolayer at an MO1 of 2-5 with the helper
virus. Remove the medium from the transfected dishes, add the virus in
Defective Adenovirus Deletion Mutants 31
0.5 mL of medium, adsorb for 2 h, remove the inoculum, and refill with medium. If the helper is a ts mutant, incubate at the restrictive tempera- ture (see Note 2)
e. 12-16 h after infection, trypsinize each well and reseed the transfected/ infected cells in a 6-cm dish along with enough uninfected cells to form a confluent or nearly confluent monolayer.
f. After the cells have attached (8-24 h), overlay with agar medium and proceed as described In Subheading 3.1.1., step 5.
2. If the mutant is available as virus particles (as in the isolatton of naturally occur- rmg mutants), use one of the protocols in Subheading 3.1.1., or m Note 1, replacing the transfection step with infection by the mutant stock at approx 50 mfectious particles per dish (or well).
3. It is convenient to collect virus through a hole made m the bottom of the tube with a pushpin. Plug the tube with a rubber stopper pierced by a large-gage syringe needle, close the needle with a finger over its hub, and make the hole m the bottom of the tube. The rate at which liquid flows out of the hole can be controlled by finger pressure on the hub of the syringe needle. Alternatively, a needle can be inserted through the side of the tube and the virus band drawn out with a syringe. For lysates from two or more lo-cm dishes, the virus band should be visible in the drops as they leave the tube; for small preps, 32P-labeled virus tracer (see above) can be added before centrifbgation and fractions can be col- lected and the virus located by Cherenkov counting.
4. Depending on the purity required, two or more gradient steps may be necessary. In the experiment shown in Fig. 1, contamination of the deletion mutant stock by helper was approx 0.03% after three gradient steps.
5. If labeled virus to be used as tracer 1s being prepared in parallel with a large unlabeled stock, the labeled cells should be harvested at the same time as the large stock, even if not all cells appear to be infected. If the labeled dishes are ready for harvesting before the remaining dishes, collect and rinse the cells and store at -80°C until needed
References 1. Graham, F. L., Smiley, J., Russel, W. C., and Nairn, R. (1977) Characteristics of
a human cell line transformed by DNA from human adenovirus 5. J. Gen. Vzrol. 36, 59-72.
2. Weinberg, D. H and Ketner, G. (1983) A cell line that supports the growth of a defective early region 4 deletion mutant of human adenovirus type 2. Proc Natl. Acad Sci. USA 80,5383-5386.
3. Brough, D E., Lizonova, A , Hsu, C., Kulesa, V. A., and Kovesdi, I (1996) A gene transfer vector-cell line system for complete functional complementation of adenovirus early regions El and E4. J. Viral. 70, 6497-6501.
4. Brough, D. E., Cleghon, V., and Klessig, D. F. (1992) Construction, characteriza- tion, and utilization of cell lines which inducibly express the adenovints DNA- binding protein. Virology 90,624-634.
32 Ketner and Boyer
5. Amalfitano, A., Begy, C. R., and Chamberlain, J. S. (1995) Improved adenovirus packaging cell lines to support the growth of replication-defective gene-delivery vectors. Proc. Nat1 Acad. Sci. USA 93,3352-3356.
6. Ho, W. Y., Karlok, M., Chen, C., and Ornelles, D. (1995) Adenovirus type 5 precursor terminal protein-expressing 293 and HeLa cell lines. J Vwol 69, 4079-4085.
7 Kroughliak, V. and Graham, F. (1995) Development of cell lines capable of complementing El, E4, and protein IX defective adenovirus type 5 mutants. Human Gene Ther 6,157~1586.
8. Wang, Q., Jia, X.-C,, and Fmer, M. H. (1995) A packaging cell lme for propaga- tion of recombinant adenovirus vectors containing two lethal gene region dele- ttons. Gene Ther. 2,775-783.
9. Yeh, P., Didieu, J.-F., Orsim, C., Vigne, E., Denefle, P., and Perricaudet, M (1996) Efficient dual transcomplementation of adenovirus E 1 and E4 regions from a 293-derived cell line expressing a minimal E4 functional unit. J Vzrol 70,559-565.
10. Challberg, S. S. and Ketner, G. (198 1) Deletion mutants of adenovirus 2: tsolation and initial characterization of vuus carrying mutations near the right end of the viral genome. Virology 114, 196-209
11. Fisher, K. J., Choi, H., Burda, J., Chen, S.-J., and Wilson, J. M (1996) Recombi- nant adenovirus deleted of all viral genes for gene therapy of cystic fibrosis. Virology 217, 1 l-22.
12. Mitani, K., Graham, F. L., Caskey, C. T., and Kochanek, S. (1995) Rescue, propa- gation and partial purification of a helper virus-dependent adenovirus vector. Proc Nat1 Acad. Sci. USA 92,3854-3858.
13. Kochanek, S., Clemens, P. R., Mitani, K , Chen, H -H., Chan, S., and Caskey, C. T. (1996) A new adenoviral vector: Replacement of all viral coding sequences with 28kb of DNA independently expressing both full-length dystrophin and P-galactosidase Proc. Natl. Acad. Scz USA 93, 573 l-5736.
14. Falgout, B. and Ketner, G. (1987) Adenovirus early region 4 is required for effi- cient virus particle assembly. J. Virol 61, 3759-3768
Manipulation of Early Region 4
Julie Boyer and Gary Ketner
1. Introduction Early region 4 (E4; Fig. 1A) occupies the right-hand 3000 bp of the human
adenovirus genome. The sequences of E4 and E4 cDNAs indicate that E4 encodes seven polypeptides (I-41, most of which have been detected m infected cells. Analysis of E4 mutants has implicated E4 products m a variety of processes that occur in Infected cells, including viral early and late gene expression, DNA repllcatlon, the shutoff of host-cell protein synthesis, trans- formation, and the ability to stimulate replication of adenovlrus-associated vn-us (AAV). Specific E4 products have been implicated in many of those pro- cesses and, in some cases, mformatlon on the molecular mechanisms of E4 function IS emerging. Current knowledge of the functions of E4 products 1s summarized below.
ORFl mutants of adenovirus type 5 (Ad5) are viable in standard hosts and no mutant phenotypes have been detected in cultured cells. However, the prod- uct of ORF 1 of adenovirus 9 (Ad9) is necessary for the induction of mammary tumors m mice by that virus, and Ad9 E4 ORFl alone can transform cells m culture (5). The mechanism of transformation by Ad9 ORFI is unknown.
ORF2 mutants of Ad5 are viable in standard hosts and have no known mutant phenotypes in cultured cells. No evidence implicating ORF2 in events in infected cells has been published.
The products of ORFs 3 and 6 are required for viral late-gene expression and thus for viral growth. ORFs 3 and 6 are genetically redundant; either prod- uct is sufficient for normal (ORF6) or near-normal (ORF3) late-protein syn- thesis and growth m cultured cells, but mutants lacking both are profoundly defective (6-8). When constructing virus with mutations that simultaneously disrupt both ORFs, an E4-complementing cell line such as W 162 (ref. 9; see
From Methods m Molecular Medmne, Vol 21 Adenovrrus Methods and Protocols Edlted by W S M Wold 0 Humana Press Inc , Totowa, NJ
33
34
A
Buyer and Ke tner
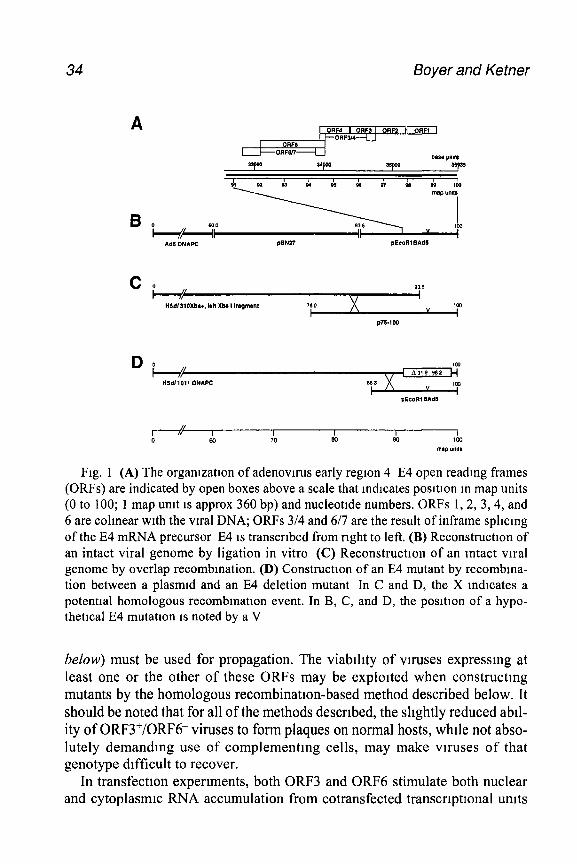
Fig. 1 (A) The orgamzatlon of adenovuus early regton 4 E4 open reading frames (ORFs) are indicated by open boxes above a scale that Indicates position m map units (0 to 100; 1 map unit is approx 360 bp) and nucleotide numbers. ORFs 1,2, 3,4, and 6 are colmear with the viral DNA; ORFs 3/4 and 6/7 are the result of inframe sphcmg of the E4 mRNA precursor E4 is transcribed from right to left, (B) Reconstructton of an intact viral genome by ligation in vitro (C) Reconstructton of an intact viral genome by overlap recombmation. (D) Construction of an E4 mutant by recombma- tion between a plasmid and an E4 deletion mutant In C and D, the X indicates a potential homologous recombmation event. In B, C, and D, the position of a hypo- thetical E4 mutation is noted by a V
below) must be used for propagation. The viabiltty of viruses expressing at least one or the other of these ORFs may be exploited when constructmg mutants by the homologous recombinatton-based method described below. It should be noted that for all of the methods described, the slightly reduced abil- ity of ORF3+/ORF6- viruses to form plaques on normal hosts, while not abso- lutely demanding use of complementtng cells, may make viruses of that genotype dtfficult to recover.
In transfection experiments, both ORF3 and ORF6 stimulate both nuclear and cytoplasmic RNA accumulation from cotransfected transcriptional units
Early Region 4 Manipulation 35
contammg 5’ mtrons. Then modes of actton apparently differ; ORF3 specifi- cally stimulates the accumulation of messages containing optional exons such as the adenovnus ‘1’ leader, whereas ORF6 stimulates accumulatton of mes- sages with or without such exons. The Elb 55-kDa protein is not required, nor are viral nuclerc acid sequences required m the target RNAs (10,11,39). The ORF6 product has roles m the transport of late viral mRNAs from the nucleus to the cytoplasm of infected cells (81 and 1s required for completion of second- strand DNA synthesis m the life cycle of AAV (12). ORF6 forms a physical complex with the 55-kDa product of adenovnus early region 1 b (E 1 b) and the complex is the functtonal unit m at least some steps in late gene expression (13-15). The ORF6 product also bmds the cellular p53 protein, preventing activation of transcription by p53 in transfection systems (26). Whether this activity is mvolved in late message production is not known. Both ORF3 and ORF6 affect the architecture of the nucleus in infected cells and may mediate some of then effects in that way (I 7,181.
ORF4 mutants are viable m standard hosts. Expression of ORF4 depresses transcription from at least some promoters that contam CREB protem-bmdmg sites, mcluding cJunB (19) and the adenovirus E2 and E4 promoters (20,21) The effect of ORF4 is indirect; an ORF4-induced change in the phosphoryla- non state of cFos results m a reduction m cJunB transcriptton and consequently JunB levels and AP- 1 activity. Reduced AP- 1 activity presumably reduces E2 transcription (21) The ORF4 protein bmds to and modulates the activity of protein phosphatase 2a, providmg a plausible btochemical mechamsm for its effect on cFos phosphorylation (22). As a result of its effects on E2 transcrip- tion and, perhaps, on protein phosphorylatton, ORF4 downregulates viral DNA synthesis. This activity IS antagomzed by the E4 ORF 3 and 6 products by an unknown mechanism (23).
ORF6/7 mutants are viable m standard hosts. The ORF6/7 product binds to transcription factor E2F and confers cooperattvity on E2F binding to promot- ers, such as the E2 promoter, that contain appropriately positioned E2F bmd- ing sites (24,225). As a consequence, ORF6/7 expression stimulates E2 transcription in infected cells (26). In most host-cell types, this effect requires the E 1 a 289R protein, which dissociates E2F from pRB and makes it available for binding by ORF6/7 (27). ORF6/7 mutants are not obviously defective m viral DNA synthesis in cultured cells.
1.1. Complementing Cell Link
E4 mutants lacking both ORF3 and ORF6 are defective for growth m nor- mal adenovirus hosts and must be propagated on cell lines capable of supply- ing required E4 functions in trans. The most commonly used such cell lme is W 162 (9). The W 162 cell lme was constructed by mtroducmg the Ad5 EcoRI
36 Boyer and Ketner
B fragment (map units 86.3-100) mto Vero cells as part of a plasmrd carrying the selectable marker gpt. W 162 cells contain intact E4 and supply the E4 func- tions required to support the growth of deletion mutants lacking all identified E4 products. E4 is attached to its natural promoter in W 162 cells and it is presumed that E4 expression 1s off until induced by Ela expression from an infecting virus. Both WI62 and Vero cells (which are of monkey origin but permissive for human adenovnuses) support plaque formation by wild-type adenovirus approx lo-fold less efficiently than do other adenovnus hosts, such as 293 cells. It IS therefore important when comparing defective E4 mutants titrated on W 162 cells to other viruses on a PFU basis, that W162 titers be obtained for all stocks.
In addition to W 162 cells, several 293-derived cell lines that complement mutants with lesions m both El and E4 have been isolated. These lines, devel- oped primarily for use in construction of gene-delivery vectors, make it pos- sible to grow multiply-defective mutants Because of its role m mhtbtting host-cell protein synthesis, E4 IS presumed to be toxic if constitutively expressed. Ela expression induces the E4 promoter, and regulable heterolo- gous promoters therefore have been used to control E4 expression in each of the 293-derived complementing cell lines. E4 expression thus remains low until it is deliberately induced. The E4 complementing cell lines described so far are listed in Table 1.
1.2. Isolation of Mutants
7.2.1. Naturally Occurring Mutants
The first E4 mutants were isolated from a stock of adenovnus 2 that had accumulated a substantial proportion of deletion mutants, presumably as a result of many undiluted serial passages. All of the mutants lacking E4 sequences were defective and were originally cloned and propagated by the use of a LS helper virus. For characterization, deletion-mutant parttcles were purified from the resulting mixed stocks by repeated CsCl density gradient centrifugatton (ref. 29; see Chapter 3). The development of E4 complementmg cell lines made the use of helper viruses unnecessary, and most of what is known of the phenotypes of E4 mutants has been learned using mutants con- structed in vitro and propagated on W 162 cells.
1.2.2. Construction of Mutants in Vitro
Most E4 mutants are made by in vitro manipulation of E4-containing plas- mids and subsequent mtroduction of the mutations into an intact viral genome. The mutations themselves can be made by any of a large variety of standard technrques. Three methods have been used to incorporate E4 mutations into
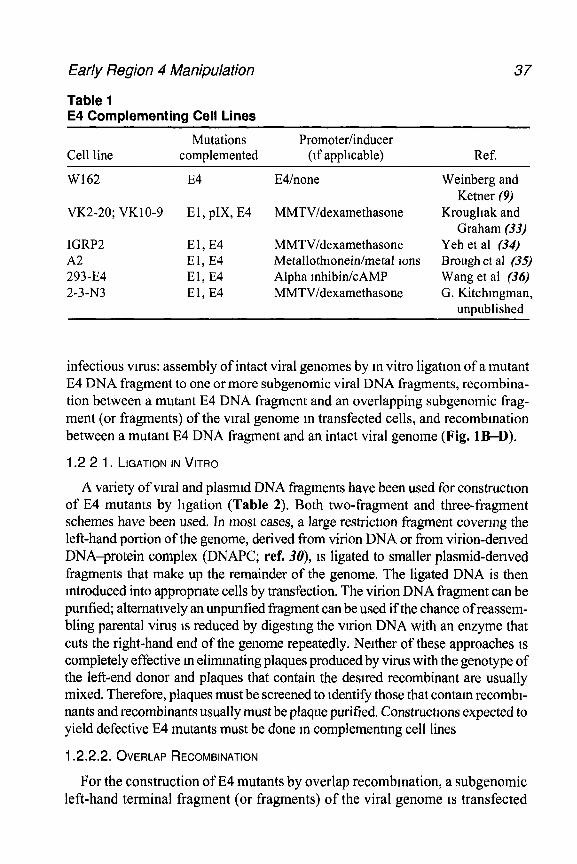
Early Region 4 Manipulation 37
Table 1 E4 Complementing Cell Lines
Cell line Mutations
complemented Promoter/inducer
(if applicable) Ref.
W162 E4 EWnone Weinberg and Ketner (9)
VK2-20; VKl O-9 El, pIX, E4 MMTVldexamethasone Kroughak and Graham (33)
IGRP2 El, E4 MMTVIdexamethasone Yeh et al (34) A2 El, E4 Metallothtonein/metal Ions Brough et al (35) 293-E4 El, E4 Alpha mhibin/cAMP Wang et al (36) 2-3-N3 El, E4 MMTV/dexamethasone G. Kitchmgman,
unpublished
infectious virus: assembly of intact viral genomes by m vitro ligatton of a mutant E4 DNA fragment to one or more subgenomic viral DNA fragments, recombina- tion between a mutant E4 DNA fragment and an overlapping subgenomic frag- ment (or fragments) of the vu-al genome m transfected cells, and recombmation between a mutant E4 DNA fragment and an intact viral genome (Fig. lB-D).
1.2 2 1. LIGATION IN VITRO
A variety of viral and plasmid DNA fragments have been used for constructron of E4 mutants by ligation (Table 2). Both two-fragment and three-fragment schemes have been used. In most cases, a large restriction fragment covering the left-hand portion of the genome, derived from virion DNA or from virion-dertved DNA-protein complex (DNAPC; ref. 30), 1s ligated to smaller plasmid-derived fragments that make up the remainder of the genome. The ligated DNA is then introduced into appropnate cells by transfection. The virion DNA fragment can be purified; alternatrvely an unpurified fragment can be used if the chance of reassem- bling parental virus 1s reduced by digesting the vnion DNA with an enzyme that cuts the right-hand end of the genome repeatedly. Neither of these approaches 1s completely effective m eliminating plaques produced by virus with the genotype of the left-end donor and plaques that contain the desired recombinant are usually mixed. Therefore, plaques must be screened to identify those that contam recombi- nants and recombinants usually must be plaque purified. Constructrons expected to yield defective E4 mutants must be done m complementmg cell lines
1.2.2.2. OVERLAP RECOMBINATION
For the construction of E4 mutants by overlap recombmation, a subgenomic left-hand terminal fragment (or fragments) of the viral genome 1s transfected
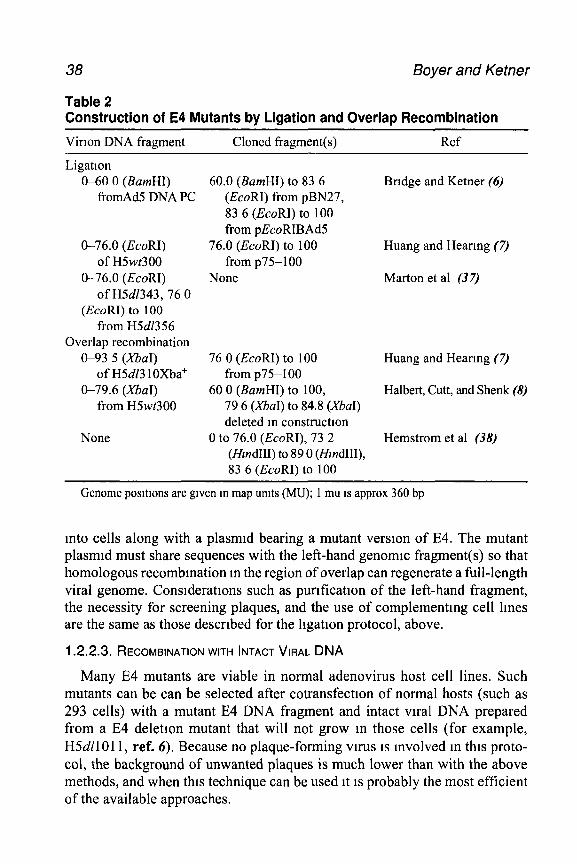
38 Boyer and Ketner
Table 2 Construction of E4 Mutants by Ligation and Overlap Recombination
Virton DNA fragment Cloned fragment(s) Ref
Ligation CM0 0 (BarnHI)
fromAd DNA PC
O-76.0 (EcoRI) of H5wt300
O-76.0 (EcoRI) of HW343,76 0
(EcoRI) to 100 from H5dl356
Overlap recombination t&93 5 (x&21)
of HSd13 1 OXba+ O-79.6 (XbaI)
from H5wt300
None
60.0 (BarnHI) to 83 6 (EcoRI) from pBN27, 83 6 (EcoRI) to 100 from pEcoRIBAd5
76.0 (EcoRI) to 100 from ~75-100
None
76 0 (EcoRI) to 100 from ~75-100
60 0 (BarnHI) to 100, 79 6 @&I) to 84.8 (XbaI) deleted m constructton
0 to 76.0 (EcoRI), 73 2 (findII1) to 89 0 (kzzndIII), 83 6 (EcoRI) to 100
Brtdge and Ketner (6)
Huang and Hearing (7)
Marton et al (37)
Huang and Hearing (7)
Halbert, Cutt, and Shenk (8)
Hemstrom et al (38)
Genome posltlons are given m map units (MU); 1 mu IS approx 360 bp
into cells along with a plasmrd bearing a mutant version of E4. The mutant plasmrd must share sequences with the left-hand genomrc fragment(s) so that homologous recombmation m the region of overlap can regenerate a full-length viral genome. Consrderatrons such as purrficatron of the left-hand fragment, the necessity for screening plaques, and the use of complementmg cell lines are the same as those described for the hgatron protocol, above.
1.2.2.3. RECOMBINATION WITH INTACT VIRAL DNA
Many E4 mutants are viable in normal adenovirus host cell lines. Such mutants can be can be selected after cotransfectron of normal hosts (such as 293 cells) with a mutant E4 DNA fragment and intact viral DNA prepared from a E4 deletion mutant that will not grow m those cells (for example, H5d11011, ref. 6). Because no plaque-forming virus IS involved m this proto- col, the background of unwanted plaques is much lower than with the above methods, and when this technique can be used rt IS probably the most efficient of the available approaches.
Early Region 4 Man&w/at/on 39
2. Materials 1. TE: 10 mM Tns-HCl, 1 mA4 EDTA. Adjust to pH 8.1. 2 Buffered 8 h4 guamdmmm hydrochloride solution: 8 A4 guanidinium hydrochlo-
ride, 50 mM Tris-HCl, pH 8.1. 3 Guanidimum hydrochlonde/CsCl solutions: 4 Mguamdmmm hydrochloride con-
taming either 3.03 M CsCl (51.0 g of CsCl per 100 mL of solution) or 4.54 M CsCl (76 5 g of CsCl per 100 mL of solution), buffered with 20 mM Tns-HCl. Final pH should be 8.1. Confirm the pH before use, as some lots of CsCl produce very acidic solutions unless neutralized.
4. PMSF* 100 mM Phenylmethylsulfonylflourlde in isopropanol. Store tightly
5.
6
7
8
9
10
11
12
13 14. 15. 16.
capped at -20°C PMSF is toxic. HBS (HEPES-buffered salme) 8 g/L NaCl, 0.37 g/L KCl, 0.125 g/L Na2HP0, 2H,O, 1 s/L glucose, 5 g/L N-2-hydroxyethylpiperazine-W-2-ethanesulfomc acid (HEPES), final pH 7.05. The pH of the HBS 1s cntlcal for the success of transfectlons. Herring sperm DNA Dissolve herring sperm DNA in TE at approx 5 mg/mL. Somcate on ice m 30-s bursts with an immersed probe until the viscosity no longer changes appreciably with each burst (6-10 bursts). Determine the concentration of the solution spectrophotometrlcally and adjust to 2.5 mg/mL with TE Plasmlds (see also Table 2). a pBN27 (6): pBR322 containing Ad5 DNA from map unit (mu) 60 (BarnHI) to
mu 86.4 (NdeI) One map unit corresponds to 1% of the viral genome, or approx 360 bp.
b pEcoRIBAd5 (28). pBR322 containing Ad5 mu 83 6 (EcoRI) to mu 100 (right genomic end)
Vu-uses a Adenovlrus 5 b. H5d11011 (6). a defective E4 mutant that lacks Ad5 nt 33091 to 35353 c. H5d13 lOXba+ (7) carries a single XbaI site at mu 93.5 Sucrose solutions* 5,20, and 60% sucrose solutions prepared m I MNaCI, 1 mM EDTA, 10 mM Tns-HCl, pH 8.1. 200X IGEPAL (Sigma, St LOUIS, MO; cat. no. I-3021). 10% IGEPAL CA-630 solution in water. Phosphate-free medium. MEM formulated without sodium phosphate can be purchased from media suppliers (for example, Glbco-BRL, Gaithersburg, MD, cat. no. 21-097-027) For labeling viral DNA, supplement with 2% fetal bovine serum (FBS) (dialysis is not necessary) and 40 pCi/mL carrier-free 32P orthophosphate Lysls buffer: 0 6% sodium dodecyl sulfate (SDS), 200 pg/mL Protemase K, 10 mM Tris-HCl, pH 8 1, 1 mM EDTA. 5 A4 Ammonium acetate 1,1,2 Trichlorotrifluoroethane (Sigma cat. no. T527 1) 25% glucose solution. 25% (w/v) glucose m HBS; filter sterilize. Agar medium. MEM without phenol red, supplemented with 2% FBS, penicillin, and streptomycm, and solidified with 0.9% Difco (E. Molesley, Surrey, UK)
40 Boyer and Ketner
Bacto-agar. Prepare and filter stenhze 2X MEM without sodium bicarbonate, glutannne, and phenol red Supplement with sodium bicarbonate, FBS, penicillin, streptomycm, and glutannne, and store tightly closed at 4°C. Note that thts mednnn 1s 2X, and supplements should be added accordmgly. Prepare and autoclave 1.8% agar m water. To prepare agar overlays, melt the agar tn a steam bath or mrcrowave oven, mix with an equal volume of supplemented 2X MEM, equihbrate to 48°C and use to overlay plates
3. Methods
3.1. Preparation of Adenovirus DNA-Protein Complex (DNA PC; ref. 30)
1.
2.
3
4
5
6
7
Dialyze CsCl density-gradient purified virus particles (see Chapter 3) against TE. Highly concentrated virus suspensions sometimes precipitate during dtaly- sis, this does not affect the procedure. Mix equal volumes of virus suspension and buffered 8 M guanidmium hydro- chloride (GuHCl) solution. Immediately add PMSF to 1 mM final concentratton Incubate on tee for 5 min. The turbidity of the suspension will decrease as the vu-us particles are dtssoctated To the disrupted virus, add 4 A4 GuHCl, 4 54 M CsCI, 20 mA4 Tris-HCI, pH 8.1 The volume should be four times the original volume of the virus suspenston Adjust to a convement volume with 4 A4 GuHCl, 3.03 M CsCl, 20 mA4 Tris- HCl, pH 8 1 Centrifuge the solutton overnight at 45,000 rpm (177,OOOg) and 15°C m a Sorvall TV865 rotor or equtvalent. Collect 0 25- to 0 5-mL fractions and locate fractions containing DNA by UV spectrophotometry. Pool DNA-contammg fracttons and dtalyze 4 h vs TE, 1 M NaCl then overnight vs two changes of TE. Store the DNAPC m a plasttc tube, as the termmal protein adheres to glass. The yield should be approx 10 pg of DNAPC per IO-cm Petrt dish of infected cells
3.2. Construction of E4 Mutants by Ligation
1. Introduce the destred E4 mutation mto the plasmtd pEcoRIBAd5. 2 Prepare Ad5 or H5dZlO 11 DNAPC. The use of H5d110 11 reduces the background
of plaques contammg parental vnus when constructmg viable E4 mutants m noncomplementmg cell lines.
3 Prepare pBN27 and mutant pEcoRIBAd5 DNAs by CsCl-ethtdmm bromide den- sity gradient centrifugation, Qiagen (Valencia, CA) column, or similar method.
4. Digest 9 pg of DNAPC with BumHI and EcoRI m a mtcrofuge tube This ytelds a large left end fragment (O-60 0 mu) and cleaves the right end mto three pteces
5. Precipitate the digested DNA by the addmon of 2.5 volumes of ethanol directly to the digestion reaction Chill on tee for 15 mm; centrifuge for 15 mm at 4°C m a mtcrofuge, and remove the supernatant with a mtcroprpet. Invert the tube and air-dry the pellet for 15 min at room temperature.
Early Region 4 Mampulation 41
6. Dissolve the dried pellet in a small volume of TE (see Note 1) 7. Digest 15 c(g of pBN27 with BumHI and EcoRI and the mutant E4 plasmld with
EcoRI. Precipitate the digested DNAs as described above and redissolve m small volumes of TE
8. Add the digested plasmld DNAs to the dissolved digested DNAPC (see Note 1) Add concentrated hgase buffer to 1X final concentration, and 5-7 U of T4 DNA hgase. Total volume should be 70 $
9 Incubate overnight at 4°C 10 Transfect the ligated DNA mto W 162 or other complementmg cells or, if the
mutant 1s likely to be viable, mto 293 cells. Use 2 5 pg of ligated DNA and 7 5 B of herring sperm DNA per transfected 60-mm dish.
11 Pick plaques and screen for mutants as described below.
3.3. Construction of E4 Mutants by Overlap Recombination (7)
1 Introduce the desired E4 mutation into the plasmld pEcoRIBAd5. 2 Digest the mutant plasmld with EcoRI. 3 Digest purified H5d13 lOXba+ vlrlon DNA with XbaI. 4 Purify the large (left-hand) XbaI fragment
a Load 10-50 pg of digested DNA on a linear 5-20% sucrose gradient built over a 60% sucrose cushion in an SW40 ultracentrtfuge tube. (All sucrose solutions are m TE, with 1 MNaCl )
b Centrifuge the gradients at 32,000 rpm (82,300g) for 18 h at room temperature c Fractionate the gradlent into 0 5- to I-mL fractions. d Identify the fractions containing the large XbaI fragment by analyzing small
portions of each fraction on an agarose gel e. Pool and briefly (2 h) dialyze positive fractions. f. Ethanol precipitate the DNA.
5. Transfect appropriate cells. Use 1 pg of large fragment and 9 pg of digested plasmld DNA per 60-mm dish.
6. Prck plaques and screen for mutants as described below
3.4. Construction of E4 Mutants by Recombination with an Intact Viral Genome
1. Introduce the desired E4 mutation into the plasmld pEcoRIBAd5 2 Prepare H5d11011 DNAPC. 3. Linearize the E4 mutant plasmld m adenovn-ns sequences outside of the H5dllO 11
deletion by digestton with HpuI (nt 32002) or MeI (nt 3 1088). This results m a l- to 2-kb region to the left of E4 where recombination can occur.
4. Combme 2 ~18 each of the digested plasmid DNA and H5d11011 DNAPC (3.6: 1 molar ratio of plasmid DNA to DNAPC) Add 6 c(g somcated herring sperm DNA, for 10 pg total DNA per transfection.
5. Transfect this mixture into 293 cells. 293 cells can be transfected by a procedure identical to that for W 162 cells (below), with the omission of the glucose boost step.
6. Pick plaques that arise and screen as described below (see Note 2).
42
3.5. Calcium Phosphate Transfection (31,32)
Bayer and Ketner
1
2
3 4 5
6 7
8.
9
10
11
Prepare freshly confluent monolayers of W 162 (for defective E4 mutants) or 293 (for mutants that do not require an E4 complementing line) cells m 60-mm tissue culture dishes Slightly subconfluent monolayers are acceptable but can be fragile, and heavily confluent monolayers can be used with somewhat reduced efficiency Add a total of 10 pg of plasmld, viral, and somcated herring sperm DNA, m a mmlmum volume of TE or hgatlon buffer (less than 50 pL>, to 0 95 mL of HBS m a plastic tube. The amounts of the various DNAs recommended for each pro- cedure are noted above Add 50 pL of 2.5 M CaC12 and mix quickly. Incubate 20-30 mm at room temperature. Without removing the medium, add 0 5 mL of the mixture to each of two 60-mm dishes containing cell monolayers Gently agitate the dishes to dlstrlbute the DNA evenly Incubate 46 h at 37°C For W 162 cells, boost with a 25% glucose shock (see Note 3) a Remove the medium from a transfected dish b Gently add 2 mL of sterile 25% glucose directly to the center of the mono-
layer c Incubate for 4 mm exactly, remove the glucose, and rinse the monolayer once
with culture medmm. d Overlay with 5 mL of agar medium. Incubate the dishes at 37”C, adding 2.5 mL of agar medium every thu-d day The second addition should contam neutral red When plaques arlse (7-12 d), mark their locations on the outside of the plaqumg dishes Pick plaques for screening by drawing the agar and cell debris over and around a marked plaque mto a Pasteur plpet Transfer the agar and cell debris mto a vial contammg I mL of culture medium Store at -80°C.
3.6. Screening for Mutants 1. Prepare a high-titer mmistock from each plaque.
a Inoculate monolayers of permissive cells growing in a 24-well tissue culture plate with the resuspended plaque, frozen and thawed three times to release vu-us from the cell debris
b. Inspect the wells dally, replacing the medium every third day, harvest the stocks when most or all of the cells m a well have detached from the plastic
c. Freeze and thaw the mmistock three times. 2. Inoculate monolayers of permlsslve cells growmg m 24-well tissue culture plates
with 100 pL of the high-titer mmistock. 3 Allow the vnus to adsorb for 2 h at 37”C, then remove the moculum and refill the
well with 2 mL of medium
Early Region 4 Manipulation 43
4
5. 6
7
8. 9
10 11 12 13 14
15
24 h after infectton, remove the medmm from the infected cells, rinse the mono- layer once wtth medium lacking phosphate, and add 1 mL of phosphate-free medmm containing 2% FBS and 40 pCi/mL 32P orthophosphate. Incubate 6-24 h at 37°C Remove the labeling medium and gently rinse the monolayers once with phos- phate-buffered salme Lyse the labeled cells by adding 300 pL 0.6% SDS, 200 ug/mL Protemase K m TE directly to the wells Seal the plate with Parafilm and incubate at 37°C 2 h to overnight Transfer the contents of each well to a microfuge tube, add 200 pL of 5 Mammo- mum acetate and mtx well. Add 1 mL isopropyl alcohol and mix well. Centrifuge m-mediately for 5 mm at full speed m a mtcrocentrtfuge Rinse the pellet twtce in 70% ethanol. Air-dry the pellet and resuspend the DNA in TE The labeled DNA can be analyzed by restrtctton dtgestton, agarose gel electro- phorests, and autoradtography for the presence of the mutation After tdenttficatton of plaques contammg the desired recombinants, use the mmtstock (step 1) for a second round of plaque punficatton. Before plaqumg, add IGEPAL to 0.05% and extract the stock vtgorously wtth l/l0 volume of 1,1,2 tnchlorotnfluoro- ethane This dtssoctates clumps of vnus that otherwise make plaque purtficatton extremely Inefficient. Plaques should be purified one round beyond the point where parental (Ad5 or H5d11011) DNA can no longer be detected m any plaque
4. Notes 1 DNAPC has a tendency to bind to the walls of tubes, and other labware, and so the
digestion of the DNAPC and hgatton should be carried out in the same tube tf possible To preserve the terminal protem, do not treat the digest with protease, phenol, or SDS
2. Almost all plaques will contam both recombinant virus and H5d11011, the latter complemented by the viable recombinant When preparing mmtlysates for screen- mg, use cells which are nonpermtsstve for H5dflOll to enrtch the mmistocks for the recombinant However, labeled DNA should be prepared m W 162 cells, which permit growth of H5d11011 and thus maximize the sensitivity ofthe screen- mg procedure for contaminatmg parental virus.
3 Ttmmg of the glucose boost is important for good efficiency and monolayer sur- vival; If multiple dishes are to be boosted as a group, stagger the addition of the glucose solutton so that prectse timmg can be mamtamed To stmplify the mampulatton of large numbers of dashes, dishes can be refilled with culture medium after the glucose boost and overlaid with agar later as a group
References 1. Fryer, G. A., Katoh, Y , and Roberts, R. J (1984) Charactertzatton of the maJor
mRNAs from adenovirus 2 early region 4 by cDNA clonrng and sequencing Nucleic Aclds Res 12,3503-3519
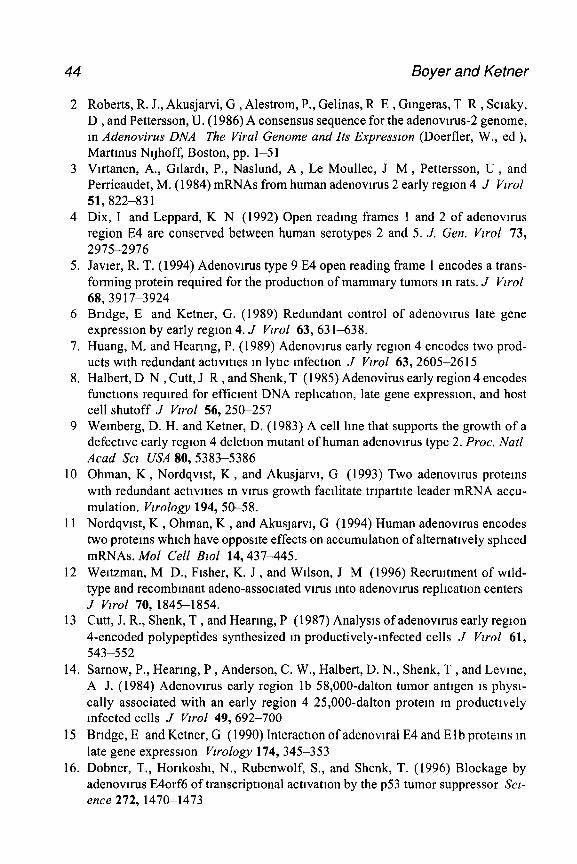
2 Roberts, R. J., Akusjarvi, G , Alestrom, P., Gelinas, R E , Gmgeras, T R , Sctaky, D , and Pettersson, U. (1986) A consensus sequence for the adenovuus-2 genome, m Adenovirus DNA The Viral Genome and Its ExpressIon (Doerfler, W., ed ), Martmus NtJhoff, Boston, pp. l-5 1
3 Vntanen, A., Gtlardt, P., Naslund, A, Le Moullec, J M , Pettersson, U , and Perricaudet, M. (1984) mRNAs from human adenovnus 2 early region 4 J Vzrol 51,822-83 1
4 Dix, I and Leppard, K N (1992) Open readmg frames 1 and 2 of adenovnus region E4 are conserved between human serotypes 2 and 5. J. Gen. Vlrol 73, 2975-2976
5. Javier, R. T. (1994) Adenovn-us type 9 E4 open reading frame 1 encodes a trans- forming protein required for the production of mammary tumors m rats. J Vrrol 68,3917-3924
6 Bridge, E and Ketner, G. (1989) Redundant control of adenovuus late gene expression by early regton 4. J Vlrol 63, 63 I-638.
7. Huang, M. and Hearing, P. (1989) Adenovuus early regton 4 encodes two prod- ucts with redundant acttvtttes m lyttc infection J Vzrol 63, 2605-26 15
8. Halbert, D N , Cutt, J R , and Shenk, T (1985) Adenovirus early region 4 encodes functions required for efficient DNA rephcation, late gene expression, and host cell shutoff J Vwol 56,25&257
9 Weinberg, D. H. and Ketner, D. (1983) A cell lme that supports the growth of a defective early region 4 deletton mutant of human adenovuus type 2. Proc. Nat1 Acad Scl USA 80,5383-5386
10 Ohman, K , Nordqvist, K , and Akusjarvt, G (1993) Two adenovtrus proteins with redundant activities m vuus growth facilitate tripartite leader mRNA accu- mulation. Vzrology 194, 50-58.
11 Nordqvist, K , Ohman, K , and AkusJarvi, G (1994) Human adenovu-us encodes two protems which have opposite effects on accumulation of alternatively spliced mRNAs. MOE Cell B~ol 14,437-445.
12 Wettzman, M D., Fisher, K. J , and Wilson, J M (1996) Recrmtment of wild- type and recombinant adeno-associated vnus mto adenovuus rephcatton centers J Vzrol 70, 1845-1854.
13 Cutt, J. R., Shenk, T , and Hearmg, P (1987) Analysis of adenovn-us early region 4-encoded polypeptides synthesized m productively-infected cells J Vzrol 61, 543-552
14. Sarnow, P., Hearing, P , Anderson, C. W., Halbert, D. N., Shenk, T , and Levine, A J. (1984) Adenovtrus early region 1 b 58,000-dalton tumor antigen is physi- cally associated with an early region 4 25,000-dalton protem m productively infected cells J Vu-o1 49, 692-700
15 Bridge, E and Ketner, G (1990) Interaction of adenovtral E4 and E 1 b proteins m late gene expresston Vzrology 174, 345-353
16. Dobner, T., Hortkoshi, N., Rubenwolf, S., and Shenk, T. (1996) Blockage by adenovnus E4orf6 of transcripttonal activation by the ~53 tumor suppressor Scz- ence 272,147&1473
44 Boyer and Ketner
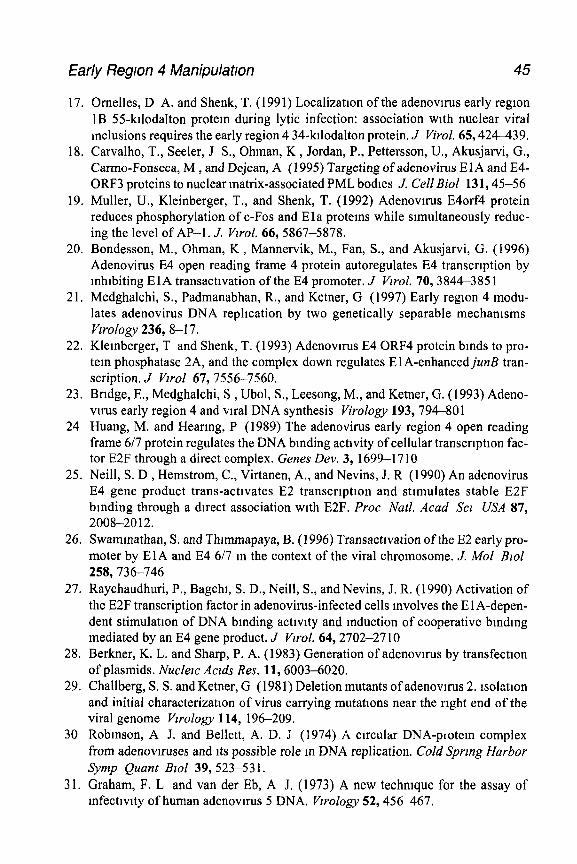
Early Region 4 Manipulation 45
17. Ornelles, D A. and Shenk, T. (1991) Localization of the adenovuus early region 1B 55-kllodalton protein during lytic infection: association with nuclear viral mclusions requires the early region 4 34-kllodalton protein. J Viral. 65,424-439.
18. Carvalho, T., Seeler, J S., Ohman, K , Jordan, P., Pettersson, U., Akusjarvi, G., Carmo-Fonseca, M , and Dejean, A (1995) Targeting of adenovirus El A and E4- ORF3 proteins to nuclear matrix-associated PML bodies J. Cell Biol 131,45-56
19. Muller, U., Kleinberger, T., and Shenk, T. (1992) Adenovlrus E4orf4 protein reduces phosphorylation of c-Fos and E 1 a proteins while simultaneously reduc- ing the level of AP-1. J. Vwol. 66,5867-5878.
20. Bondesson, M., Ohman, K , Mannervik, M., Fan, S., and Akusjarvi, G. (1996) Adenovirus E4 open reading frame 4 protein autoregulates E4 transcription by mhlbiting ElA transactlvation of the E4 promoter. J Vzrol. 70,3844-385 1
2 1. Medghalchi, S., Padmanabhan, R., and Ketner, G (1997) Early region 4 modu- lates adenovirus DNA replication by two genetically separable mechamsms Vwology 236, 8-l 7.
22. Klemberger, T and Shenk, T. (1993) Adenovn-us E4 ORF4 protein bmds to pro- tein phosphatase 2A, and the complex down regulates ElA-enhanced junB tran- scription. J ho1 67, 7556-7560.
23. Bridge, E., Medghalchi, S , Ubol, S., Leesong, M., and Ketner, G. (1993) Adeno- vu-us early region 4 and viral DNA synthesis Virology 193,794-801
24 Huang, M. and Hearing, P (1989) The adenovirus early region 4 open reading frame 6/7 protein regulates the DNA binding activity of cellular transcrlptlon fac- tor E2F through a direct complex. Genes Dev. 3, 1699-l 7 IO
25. Neill, S. D , Hemstrom, C., Virtanen, A., and Nevins, J. R (1990) An adenovirus E4 gene product trans-activates E2 transcrlptlon and stimulates stable E2F binding through a direct association with E2F. Proc Natl. Acad Scl USA 87, 2008-2012.
26. Swammathan, S. and Thlmmapaya, B. (1996) Transactlvation of the E2 early pro- moter by El A and E4 617 m the context of the viral chromosome. J. Mel Blol 258,736-746
27. Raychaudhuri, P., Bagchl, S. D., Neill, S., and Nevins, J. R. (1990) Activation of the E2F transcription factor in adenovirus-infected cells mvolves the E 1 A-depen- dent stimulation of DNA binding activity and induction of cooperative bmdmg mediated by an E4 gene product. J Vwol. 64,2702-27 10
28. Berkner, K. L. and Sharp, P. A. (1983) Generation of adenovuus by transfectlon of plasmids. Nucleic Acids Res. 11,6003-6020.
29. Challberg, S. S. and Ketner, G (1981) Deletion mutants of adenovuus 2. lsolatlon and initial characterization of virus carrying mutattons near the right end of the viral genome Vzrology 114, 196-209.
30 Robmson, A J. and Bellett, A. D. J (1974) A circular DNA-protein complex from adenovnuses and its possible role m DNA replication. Cold Spring Harbor Symp Quant Blol 39,523-53 1.
3 1. Graham, F. L and van der Eb, A J. (1973) A new technique for the assay of infectivity of human adenovn-us 5 DNA. VwoEogy 52, 45&467.
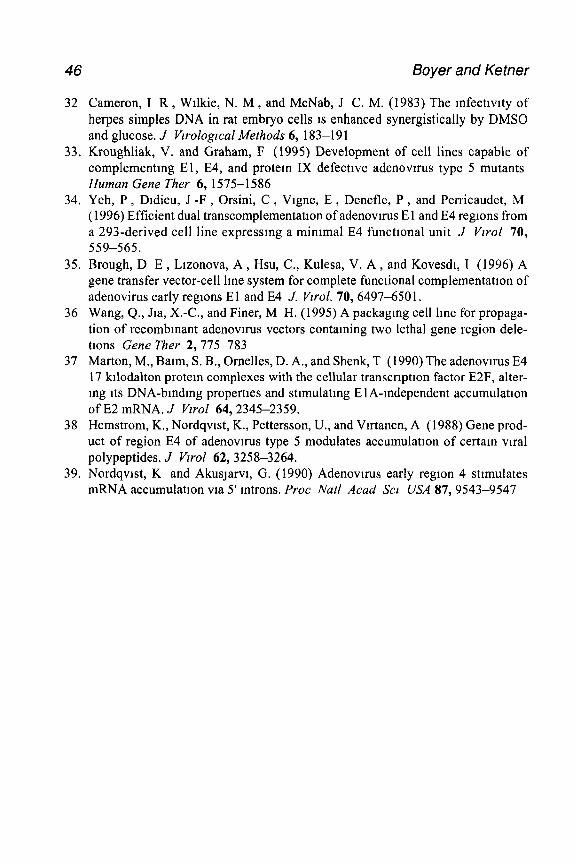
46 Boyer and Ketner
32 Cameron, I R , Wllkie, N. M , and McNab, J C. M. (1983) The mfectlvlty of herpes simples DNA in rat embryo cells IS enhanced synergistically by DMSO and glucose. J Vwologzcal Methods 6, 183-l 9 1
33. Kroughliak, V. and Graham, F (1995) Development of cell lines capable of complementmg El, E4, and protem IX defective adenovlrus type 5 mutants Human Gene Ther 6, 1575-1586
34. Yeh, P , Dldieu, J -F , Orsini, C , Vlgne, E , Denefle, P , and Perricaudet, M ( 1996) Efficient dual transcomplementatlon of adenovlrus E 1 and E4 regions from a 293-derived cell line expressmg a minimal E4 functlonal unit J Vzrol 70, 559-565.
35. Brough, D E , Llzonova, A , Hsu, C., Kulesa, V. A , and Kovesdl, I (1996) A gene transfer vector-cell lme system for complete functional complementatlon of adenovirus early regions E 1 and E4 J. Vwol. 70,6497-650 1.
36 Wang, Q., Jla, X.-C., and Finer, M H. (1995) A packaging cell lme for propaga- tion of recombinant adenovuus vectors containing two lethal gene region dele- tions Gene Ther 2,775-783
37 Marton, M., Balm, S. B., Ornelles, D. A., and Shenk, T (1990) The adenovnus E4 17 kllodalton protein complexes with the cellular transcription factor E2F, alter- mg its DNA-binding properties and stlmulatmg E 1 A-Independent accumulation of E2 mRNA. J Vwol 64,2345-2359.
38 Hemstrom, K., Nordqvlst, K., Pettersson, U., and Vutanen, A (1988) Gene prod- uct of region E4 of adenovuus type 5 modulates accumulation of certain vu-al polypeptides. J Vu-01 62,3258-3264.
39. Nordqvlst, K and AkusJarvi, G. (1990) Adenovlrus early region 4 stimulates mRNA accumulation via 5’ mtrons. Proc Nat1 Acad Scr USA 87,9543-9547
5
Adenovirus DNA Packaging
Construction and Analysis of Viral Mutants
Susanne I. Schmid and Patrick Hearing
1, Introduction The selective packaging of adenovnus DNA into a capsid at late times after
viral mfection raises a number of interesting questions. How is the viral DNA specifically selected from the pool of viral and cellular DNA for encapsidation? Is the packaging process coordinated with viral DNA replication? What pro- tein-protein and protein-DNA interactions are mvolved in this process? Does the virus share a packaging mechanism with one or more of the well-character- ized prokaryotic phages? The nonenveloped adenovirus particle contams a pro- tein shell consisting of multiple proteins and a DNA-protein core. The adenovlrus particle contains minimally 12 distinct virus-encoded proteins (1) (the structural proteins: hexon, penton, fiber, IIIa, VI, VIII, and IX; the core proteins: V, VII and ~1; and the nonstructural proteins: proteinase and terminal protein). The virus capsid is assembled by the association of two different capsomeres: the hexon capsomere, composed of multiple (9-12) hexon mol- ecules, and the penton capsomere, composed of five penton molecules and three fiber proteins. The hexon capsomeres assemble to form the 20 sides of the virion particle, whereas the penton capsomeres comprise the 12 vertices of the virion. The viral core 1s composed of the linear double-stranded DNA genome, with covalently linked terminal protein at each 5’ terminus, in asso- ciation with three viral core proteins: V, VII, and u.
The assembly of adenovirus particles proceeds through an ordered series of assembly events and follows the paradigm of prokaryotic phage assembly (2). The first recognizable viral assembly intermediate is a light-intermedlate particle (buoyant density of 1.3 15 g/cc in a CsCl-equilibrium gradient). These
From Methods m Molecular Medrcme, Vol 21 Adenovws Methods and Protocols Edited by W S M Wold 0 Humana Press Inc ( Totowa, NJ
47
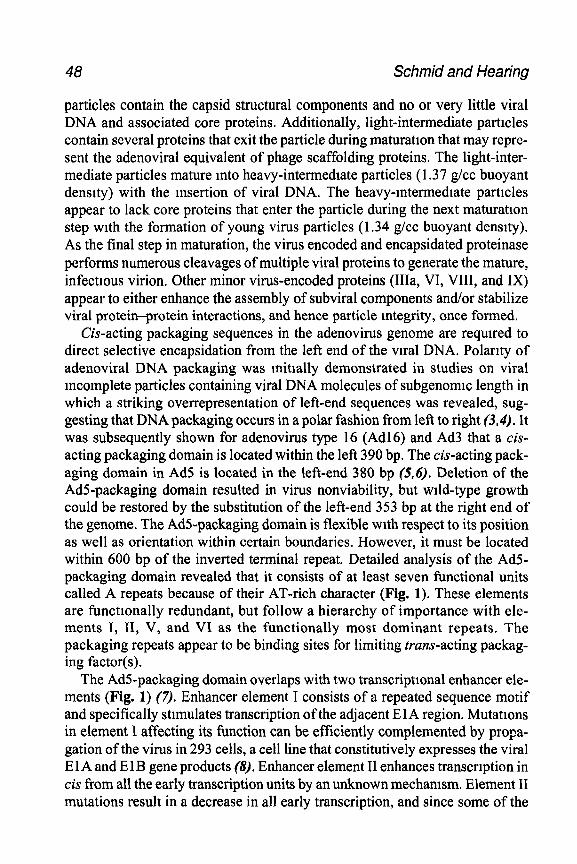
48 Schmid and Hearing
particles contain the capsid structural components and no or very little viral DNA and associated core proteins. Additionally, light-intermediate particles contain several proteins that exit the particle during maturation that may repre- sent the adenoviral equivalent of phage scaffolding proteins. The light-inter- mediate particles mature into heavy-intermediate particles (1.37 g/cc buoyant density) with the insertion of viral DNA. The heavy-mtermedtate particles appear to lack core proteins that enter the particle during the next maturation step with the formation of young virus particles (1.34 g/cc buoyant density). As the final step in maturation, the virus encoded and encapsidated proteinase performs numerous cleavages of multiple viral proteins to generate the mature, infectious virion. Other minor virus-encoded proteins (IIIa, VI, VIII, and IX) appear to either enhance the assembly of subviral components and/or stabilize viral protein-protein interactions, and hence particle integrity, once formed.
C&acting packaging sequences in the adenovirus genome are required to direct selective encapsidation from the left end of the vu-al DNA. Polarity of adenoviral DNA packaging was mitially demonstrated in studies on viral mcomplete particles containing viral DNA molecules of subgenomtc length in which a striking overrepresentation of left-end sequences was revealed, sug- gesting that DNA packaging occurs in a polar fashion from left to right (3,4). It was subsequently shown for adenovirus type 16 (Ad16) and Ad3 that a cis- acting packaging domain is located within the left 390 bp. The cis-acting pack- aging domain in Ad5 is located in the left-end 380 bp (5,6). Deletion of the AdS-packaging domain resulted in virus nonviability, but wild-type growth could be restored by the substitution of the left-end 353 bp at the right end of the genome. The AdSpackaging domain is flexible with respect to its position as well as orientation within certain boundaries. However, it must be located within 600 bp of the inverted terminal repeat. Detailed analysis of the Ad5- packaging domain revealed that it consists of at least seven functional units called A repeats because of their AT-rich character (Fig. 1). These elements are functionally redundant, but follow a hierarchy of importance with ele- ments I, II, V, and VI as the functionally most dominant repeats. The packaging repeats appear to be binding sites for limiting truns-acting packag- ing factor(s).
The AdS-packaging domain overlaps with two transcriptional enhancer ele- ments (Fig. 1) (7). Enhancer element I consists of a repeated sequence motif and specifically stimulates transcription of the adjacent ElA region. Mutations in element I affecting its function can be efficiently complemented by propa- gation of the virus in 293 cells, a cell line that constitutively expresses the viral E 1 A and El B gene products (8). Enhancer element II enhances transcription in cis from all the early transcription units by an unknown mechanism. Element II mutations result in a decrease in all early transcription, and since some of the
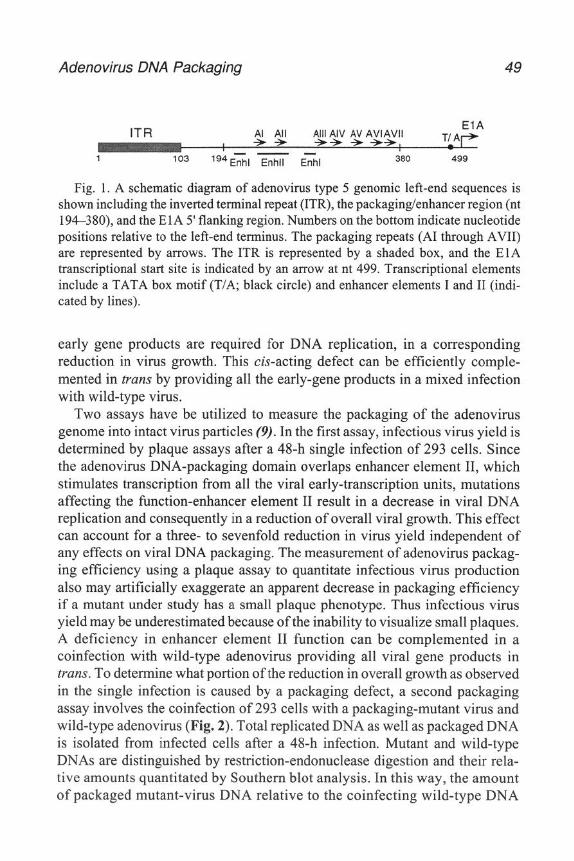
Adenovirus DNA Packaging 49
-- 103 lg4 Enhl Enhll Enhl 380 499
Fig. 1. A schematic diagram of adenovirus type 5 genomic left-end sequences is shown including the inverted terminal repeat (ITR), the packaging/enhancer region (nt 194-380), and the E 1A 5’ flanking region. Numbers on the bottom indicate nucleotide positions relative to the left-end terminus. The packaging repeats (AI through AVII) are represented by arrows. The ITR is represented by a shaded box, and the ElA transcriptional start site is indicated by an arrow at nt 499. Transcriptional elements include a TATA box motif (T/A; black circle) and enhancer elements I and II (indi- cated by lines).
early gene products are required for DNA replication, in a corresponding reduction in virus growth. This c&acting defect can be efficiently comple- mented in trans by providing all the early-gene products in a mixed infection with wild-type virus.
Two assays have be utilized to measure the packaging of the adenovirus genome into intact virus particles (9). In the first assay, infectious virus yield is determined by plaque assays after a 48-h single infection of 293 cells. Since the adenovirus DNA-packaging domain overlaps enhancer element II, which stimulates transcription from all the viral early-transcription units, mutations affecting the function-enhancer element II result in a decrease in viral DNA replication and consequently in a reduction of overall viral growth. This effect can account for a three- to sevenfold reduction in virus yield independent of any effects on viral DNA packaging. The measurement of adenovirus packag- ing efficiency using a plaque assay to quantitate infectious virus production also may artificially exaggerate an apparent decrease in packaging efficiency if a mutant under study has a small plaque phenotype. Thus infectious virus yield may be underestimated because of the inability to visualize small plaques. A deficiency in enhancer element II function can be complemented in a coinfection with wild-type adenovirus providing all viral gene products in trans. To determine what portion of the reduction in overall growth as observed in the single infection is caused by a packaging defect, a second packaging assay involves the coinfection of 293 cells with a packaging-mutant virus and wild-type adenovirus (Fig. 2). Total replicated DNA as well as packaged DNA is isolated from infected cells after a 48-h infection. Mutant and wild-type DNAs are distinguished by restriction-endonuclease digestion and their rela- tive amounts quantitated by Southern blot analysis. In this way, the amount of packaged mutant-virus DNA relative to the coinfecting wild-type DNA
50 Schmid and Hearing
Comfectlon Exoenment: pat- mutant x wt
cotnfechion 5 PFUkell
I
1 Harvest cells 2 days post mfection 1
Isolate Nuclei Isolate Vtrlons
Punfy HMW DNA Punfy Vlrlon DNA
I RestmXlon digestion
Quantltatlon by Southern blot
Fig. 2. Schematic outlme of a packaging assay and the results obtained with a typical packaging-mutant virus. Input viruses on the top are represented by their respective genomes. Wild-type genomes (wt) are indicated by white boxes, pack- aging-mutant genomes (pat-) by hatched boxes representing the ITR Equal amounts of replicated mutant and wild-type genomes are present m the nucleus (middle, left) after coinfection, whereas fewer mutant genomes are packaged into virion particles than wild-type genomes (middle, right) Relative levels of mutant and wild type DNA present m the nucleus or in virions respectively are visualized in then respective lanes (HMW and VIRION) on the Southern blot on the bottom. Because of the mutation in the pat- packaging domain as indicated by an arrow on the top, mutant left-end fragments display faster mob&y than wild-type fragments.
can be normalized to the total pool of nuclear replicated DNA of mutant and wild-type virus. This quantitation of the data measures the reduction of viral-DNA packaging independent of an element II phenotype. Addition- ally, the coinfecting wild-type virus serves as an internal control. The final important advantage to this approach is that it is a direct measure of viral- genome packaging.
Adenovirus DNA Packaging 51
2. Materials 2.1. Adenovirus Plaque Assay
1. Agar overlay solution no. 1 (for 100 mL): 50 mL 2X DME, 2.5 mL 1 MHEPES, 7.5, 1 25 rnL 1 MMgCl,, 10 mL calf serum, 36 mL 2.8% Difco (Detroit, MI) Bacto-Agar.
2. Overlay no. 2: the same as no. 1 except + 2% serum 3. Overlay no. 3 is the same as no. 2 but also containing 2.5 mL 0.1% neutral red.
2.2. Adenovirus Particle Purification
1 TD: 137 mMNaCl,25 mA4Tris-HCl, pH 7.4, 5 mMKC1, 7.5 mMNa2HP04 2. TBS: TD + 0.1 mg/mL CaC12 + 0.1 mg/mL MgClz. 3. CsCl solutions:
a. 1.25 g/cc = 36 16 g CsCl + 100 mL TD. b 1.35g/cc=51.2OgCsCl+ 100mLTD. c. 1.40 g/cc = 62.00 g CsCl + 100 mL TD.
4. Pronase: 50 mg/mL pronase heat inactivated at 37°C for 1 h. 5 Glycerol storage solution* 10 mMTris-HCl, pH 8.0, 100 mit4NaC1, 0.1% BSA,
1 mM MgCl*, 50% glycerol Filter sterilize. 6. TE: 10 mMTrrs-HCI, pH 7.4, 1 mMEDTA.
2.3. Preparation of High-Molecular- Weight DNA
1. Isotonic buffer: 150 mM NaCl, 10 mM Tris-HCl, pH 7.4, 1.5 mM MgClz. 2. Solution no 1: 400 mMTris-HCl, pH 8.0, 100 mMEDTA, 1% SDS, 100 pg/mL
proteinase K 3. Solution no. 2: Equilibrate 5 mL phenol/chloroform solution (1.1) with 50 pL
1 MTris-HCl, pH 8.0,20 pL 0.25 MEDTA, 100 p.L 5 M NaCl.
3. Methods
3.1. Construction and Purification of Recombinant Adenoviruses
Plasmids used for all vtrus constructions are derived from pE1 A-WT, which contains the left-terminal 1339 bp of the Ad5 genome cloned into pBR322 (10). Deletion and base substitution mutations in pE1 A-WT are introduced into the packaging domain followmg standard cloning procedures. All mutations con- structed in plasmids are rebuilt mto intact viruses by the method of Stow (11).
3.7.7. Preparation ofdl309 Right-End Xbal Fragment
The d1309 right-end J&z1 fragment is prepared by digestion of d1309 puri- fied vu-al DNA (see below).
1. Digest 30-40 pg dE309 DNA overnight using 2-4 U of both ClaI and XbaI restriction endonucleases per pg viral DNA in a 500~pL reaction volume. A unique ClaI site is present in d1309 at nucleotide (nt) 918 (2 5 map units [mu]) and a umque XbaI site is present at nt 1339 (3.8 mu).
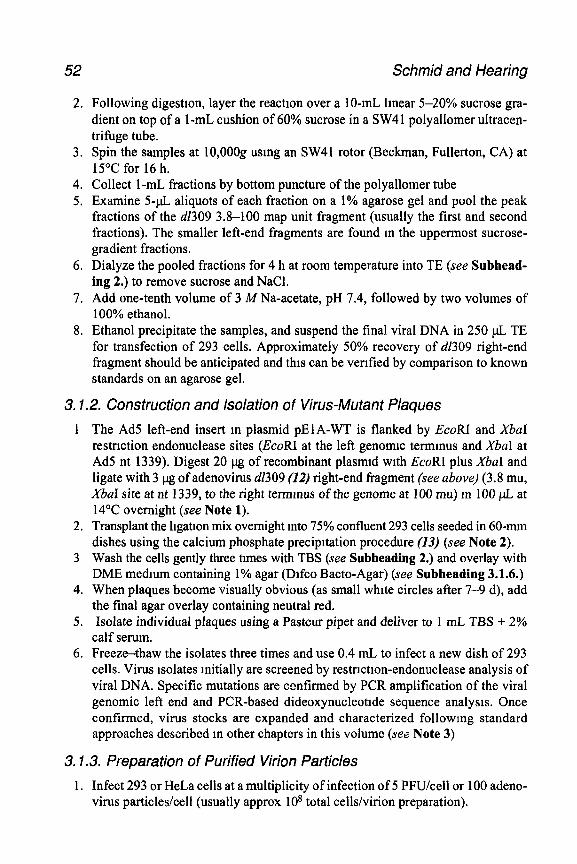
52 Schmid and Hearing
2. Following digestion, layer the reaction over a lo-mL lmear 5-20% sucrose gra- dient on top of a 1 -mL cushion of 60% sucrose in a SW4 1 polyallomer ultracen- trif?tge tube.
3. Spin the samples at 10,OOOg using an SW41 rotor (Beckman, Fullerton, CA) at 15°C for 16 h.
4. Collect 1 -mL fractions by bottom puncture of the polyallomer tube 5. Examine 5+L aliquots of each fraction on a 1% agarose gel and pool the peak
fractions of the d1309 3.8-100 map unit fragment (usually the first and second fractions). The smaller left-end fragments are found m the uppermost sucrose- gradient fractions.
6. Dialyze the pooled fractions for 4 h at room temperature into TE (see Subhead- ing 2.) to remove sucrose and NaCl.
7. Add one-tenth volume of 3 MNa-acetate, pH 7.4, followed by two volumes of 100% ethanol.
8. Ethanol precipitate the samples, and suspend the final viral DNA in 250 pL TE for transfection of 293 cells. Approximately 50% recovery of d1309 right-end fragment should be anticipated and this can be verified by comparison to known standards on an agarose gel.
3.1.2. Construction and Isolation of Virus-Mutant Plaques
1 The Ad5 left-end insert m plasmid pElA-WT is flanked by EcoRI and XbaI restriction endonuclease sites (EcoRI at the left genomic termmus and XbaI at Ad5 nt 1339). Digest 20 pg of recombinant plasmtd with EcoRI plus XbaI and ligate with 3 pg of adenovirus d1309 (12) right-end fragment (see above) (3.8 mu, XbaI site at nt 1339, to the right termmus of the genome at 100 mu) m 100 pL. at 14°C overnight (see Note 1).
2. Transplant the hgatton mix overnight mto 75% confluent 293 cells seeded in 60-mm dishes using the calcium phosphate precipitation procedure (13) (see Note 2).
3 Wash the cells gently three times with TBS (see Subheading 2.) and overlay with DME medium containing 1% agar (Drfco Bacto-Agar) (see Subheading 3.1.6.)
4. When plaques become visually obvious (as small white circles after 7-9 d), add the final agar overlay containing neutral red.
5. Isolate individual plaques using a Pasteur pipet and deliver to 1 mL TBS + 2% calf serum.
6. Freeze-thaw the isolates three times and use 0.4 mL to infect a new dish of 293 cells. Virus isolates initially are screened by restrtctton-endonuclease analysis of viral DNA. Specific mutations are confirmed by PCR amplification of the viral genomic left end and PCR-based dideoxynucleotide sequence analysts. Once confirmed, virus stocks are expanded and characterized followmg standard approaches described m other chapters in this volume (see Note 3)
3.1.3. Preparation of Purified Virion Particles
1. Infect 293 or HeLa cells at a multiplicity of infection of 5 PFU/cell or 100 adeno- virus particles/cell (usually approx lo8 total cells/virion preparation).
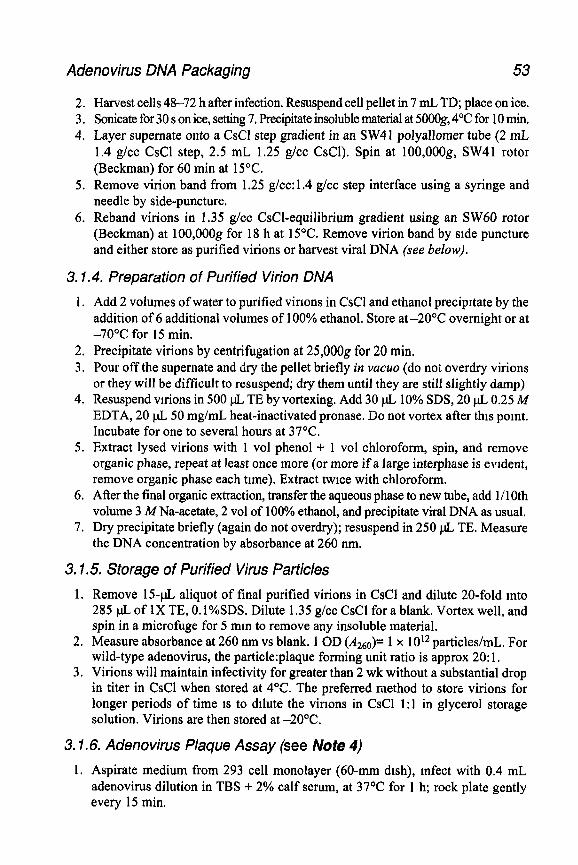
Adenovirus DNA Packaging 53
2. Harvest cells 48-72 h after infection. Resuspend cell pellet in 7 mL TD; place on ice. 3. Sonicate for 30 s on ice, setting 7. Precipitate insoluble material at 5OOOg, 4°C for 10 min. 4. Layer supernate onto a CsCl step gradient in an SW41 polyallomer tube (2 mL
1.4 g/cc CsCl step, 2.5 mL 1.25 g/cc CsCl). Spin at lOO,OOOg, SW41 rotor (Beckman) for 60 min at 15°C.
5. Remove virion band from 1.25 g/cc: 1.4 g/cc step interface using a syringe and needle by side-puncture.
6. Reband virions in 1.35 g/cc CsCl-equilibrium gradient using an SW60 rotor (Beckman) at 100,OOOg for 18 h at 15°C. Remove virion band by side puncture and either store as purified virions or harvest viral DNA (see below).
3.1.4. Preparation of Purified Virion DNA
1. Add 2 volumes of water to purified virlons in CsCl and ethanol precipitate by the addition of 6 additional volumes of 100% ethanol. Store at -2O’C overnight or at -70°C for 15 min.
2. Precipitate virions by centrifugation at 25,000g for 20 min. 3. Pour off the supernate and dry the pellet briefly in vacua (do not overdry virions
or they will be difficult to resuspend; dry them until they are still slightly damp) 4. Resuspend vlrions in 500 pL TE by vortexing. Add 30 & 10% SDS, 20 pL 0.25 M
EDTA, 20 pL 50 mg/mL heat-inactivated pronase. Do not vortex after this pomt. Incubate for one to several hours at 37°C.
5. Extract lysed virions with 1 vol phenol + 1 vol chloroform, spin, and remove organic phase, repeat at least once more (or more if a large interphase is evident, remove organic phase each time). Extract twice with chloroform.
6. After the final organic extraction, transfer the aqueous phase to new tube, add l/lOth volume 3 M Na-acetate, 2 vol of 100% ethanol, and precipitate viral DNA as usual.
7. Dry precipitate briefly (again do not overdry); resuspend in 250 pL TE. Measure the DNA concentration by absorbance at 260 nm.
3.1.5. Storage of Purified Virus Particles
1. Remove 15-a aliquot of final purified virions in CsCl and dilute 20-fold mto 285 pL of 1X TE, O.l%SDS. Dilute 1.35 g/cc CsCl for a blank. Vortex well, and spin in a microfuge for 5 mm to remove any insoluble material.
2. Measure absorbance at 260 nm vs blank. 1 OD (&,)= 1 x 10¹² particles/ml. For wild-type adenovirus, the particle:plaque forming unit ratio is approx 20: 1.
3. Virions will maintain infectivity for greater than 2 wk without a substantial drop in titer in CsCl when stored at 4“C. The preferred method to store virions for longer periods of time 1s to dilute the virrons in CsCl 1: 1 in glycerol storage solution. Virions are then stored at -2OOC.
3.1.6. Adenovirus Plaque Assay (see Note 4)
1. Aspirate medium from 293 cell monolayer (60~mm dish), infect with 0.4 mL adenovirus dilution in TBS + 2% calf serum, at 37OC for 1 h; rock plate gently every 15 min.
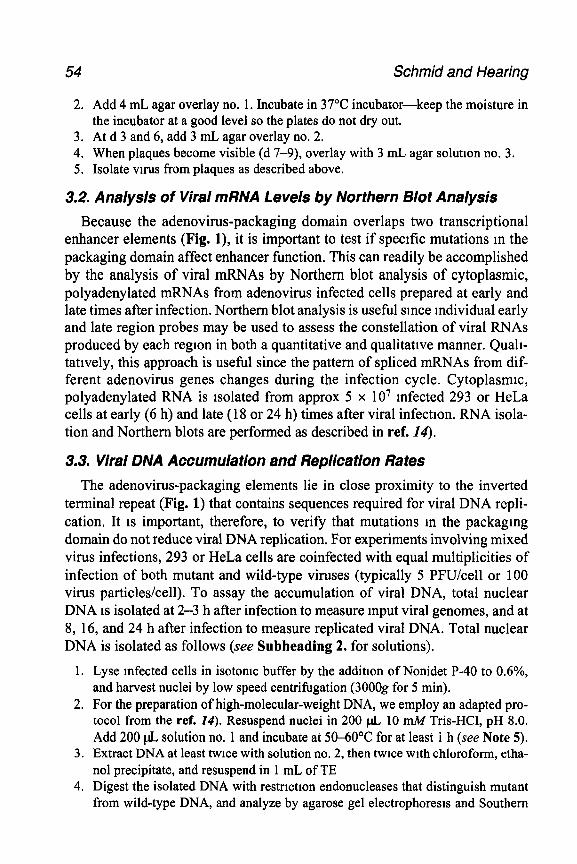
54 Schmid and Hearing
2. Add 4 mL agar overlay no. 1. Incubate in 37°C incubator-keep the moisture in the incubator at a good level so the plates do not dry out.
3. At d 3 and 6, add 3 mL agar overlay no. 2. 4. When plaques become visible (d 7-9), overlay with 3 mL agar solution no. 3. 5. Isolate virus from plaques as described above.
3.2. Analysis of Viral mRNA Levels by Northern BIot Analysis
Because the adenovirus-packaging domain overlaps two transcriptional enhancer elements (Fig. l), it is important to test if specific mutations m the packaging domain affect enhancer function. This can readily be accomplished by the analysis of viral mRNAs by Northern blot analysis of cytoplasmic, polyadenylated mRNAs from adenovirus infected cells prepared at early and late times after infection. Northern blot analysis is useful since individual early and late region probes may be used to assess the constellation of viral RNAs produced by each region in both a quantitative and qualitative manner. Quali- tatively, this approach is useful since the pattern of spliced mRNAs from dif- ferent adenovirus genes changes during the infection cycle. Cytoplasmic, polyadenylated RNA is isolated from approx 5 x 10’ mfected 293 or HeLa cells at early (6 h) and late (18 or 24 h) times after viral infection. RNA isola- tion and Northern blots are performed as described in ref. 14).
3.3. Viral DNA Accumulation and Replication Rates The adenovirus-packaging elements lie in close proximity to the inverted
terminal repeat (Fig. 1) that contains sequences required for viral DNA repli- cation. It 1s important, therefore, to verify that mutations m the packagmg domain do not reduce viral DNA replication. For experiments involving mixed virus infections, 293 or HeLa cells are coinfected with equal multiplicities of infection of both mutant and wild-type viruses (typically 5 PFU/cell or 100 virus particles/cell). To assay the accumulation of viral DNA, total nuclear DNA 1s isolated at 2-3 h after infection to measure input viral genomes, and at 8, 16, and 24 h after infection to measure replicated viral DNA. Total nuclear DNA is isolated as follows (see Subheading 2. for solutions).
1. Lyse infected cells in isotonic buffer by the addition of Nonidet P-40 to 0.6%, and harvest nuclei by low speed centrifugation (3000g for 5 min).
2. For the preparation of high-molecular-weight DNA, we employ an adapted pro- tocol from the ref. 14). Resuspend nuclei in 200 pL, 10 mA4 Tris-HCl, pH 8.0. Add 200 pL solution no. 1 and incubate at 50-6O”C for at least 1 h (see Note 5).
3. Extract DNA at least twice with solution no. 2, then twice with chloroform, etha- nol precipitate, and resuspend in 1 mL of TE
4. Digest the isolated DNA with restriction endonucleases that distinguish mutant from wild-type DNA, and analyze by agarose gel electrophoresis and Southern
Adenovirus DNA Packaging 55
hybridization (14) using pElA-WT, 32P-labeled by the random primer method (IS), as probe (see Notes 6 and 7).
5. Determine ratios of wild-type to mutant DNAs by densitometric scanning of autoradiographs generated using X-ray film without an intensifying screen, or using a phosphoimager.
6. Viral DNA accumulation in the nucleus of single-virus infected 293 or Hela monolayer cells is determined by isolating total nuclear DNA at 2-3, 8, 16, and 24 h after infection, as described above. Quantitate viral DNA in samples of equal amounts of total nuclear DNA (measured at A 260nm) by slot-blot analysis using 32P-labeled pElA-WT probe. To confirm that equal amounts of total DNA are represented in each sample, aliquots are also analyzed using an actin- specific probe. Two different dilutions of samples from a typical experiment are quantitated by liquid-scintillation spectroscopy of the hybridized filter pieces, and values of virus-specific cpm are normalized to the input (2-3 h) value for each virus.
3.4. Defection of Viral Late-Protein Levels
To confirm that vu-al late-protem synthesis is normal in cells infected with packaging domain mutants, the levels of different adenovirus gene products in virus-infected cells are determined by Western blot analysis.
1. Prepare whole-cell extracts by RIPA buffer lysis of infected cells (500 & RIPA buffer/lo7 cells) harvested at 8, 16, and 24 h after infection, as described (26).
2. Somcate cellular extracts briefly to reduce viscosity. 3. Determine protein concentrations using the Bio-Rad (Hercules, CA) Protein
Assay reagent. 4. Separate 50-100 pg of each sample by SDS-PAGE and assay by Western blot
analysis (16) using chemiluminescence and ECL Western blotting detection reagents (Amersham, Braunschweig, Germany). Different virus proteins are detected using specific antibodies; polyclonal anti-adenovirus antiserum is avail- able from the American Type Culture Collection (ATCC, Rockville, MD) and antisera developed against individual adenovirus gene products are commercially available or can be obtained from individual research laboratories.
3.5. Analysis of Viral Genome Packaging
3.5.1, Single-Infection Assay
This assay reflects the overall growth ability (single-step growth) of pack- aging-mutant viruses as detected using a plaque assay to measure infectious virus yield.
1 Infect monolayers of 293 cells (2 x 10⁶cells, approx 50% confluent monolayer in a 60-mm dish) with 5 PFU/cell of mutant or wild-type vuus at 37°C for 1 h.
2 Harvest infect cells 48 h after infection into 15-mL centrifuge tubes. Lyse infected cells in culture medium by three cycles of freeze-thawing.
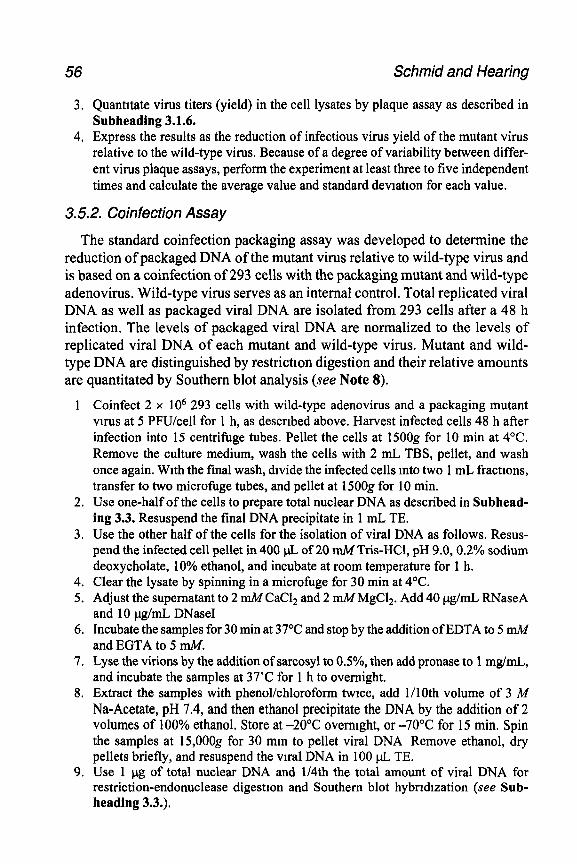
56 Schmid and Hearing
3. Quantitate virus titers (yield) in the cell lysates by plaque assay as described in Subheading 3.1.6.
4. Express the results as the reduction of infectious virus yield of the mutant virus relative to the wild-type virus. Because of a degree of variability between differ- ent virus plaque assays, perform the experiment at least three to five independent times and calculate the average value and standard deviation for each value.
3.5.2. Coinfection Assay
The standard coinfection packaging assay was developed to determine the reduction of packaged DNA of the mutant virus relative to wild-type virus and is based on a coinfection of 293 cells with the packaging mutant and wild-type adenovirus. Wild-type virus serves as an internal control. Total replicated viral DNA as well as packaged viral DNA are isolated from 293 cells after a 48 h infection. The levels of packaged viral DNA are normalized to the levels of replicated viral DNA of each mutant and wild-type virus. Mutant and wild- type DNA are distinguished by restrictton digestion and their relative amounts are quantitated by Southern blot analysis (see Note 8).
1 Coinfect 2 x lo6 293 cells with wild-type adenovirus and a packaging mutant vuus at 5 PFU/cell for 1 h, as described above. Harvest infected cells 48 h after infection into 15 centrifuge tubes. Pellet the cells at 15OOg for 10 min at 4°C. Remove the culture medium, wash the cells with 2 mL TBS, pellet, and wash once again. With the final wash, divide the infected cells mto two 1 mL fractions, transfer to two microfuge tubes, and pellet at 15OOg for 10 min.
2. Use one-half of the cells to prepare total nuclear DNA as described in Subhead- ing 3.3. Resuspend the final DNA precipitate in 1 mL TE.
3. Use the other half of the cells for the isolation of viral DNA as follows. Resus- pend the infected cell pellet in 400 pL of 20 mM Tris-HCl, pH 9.0,0.2% sodium deoxycholate, 10% ethanol, and incubate at room temperature for 1 h.
4. Clear the lysate by spinning in a micromge for 30 min at 4°C. 5. Adjust the supernatant to 2 mMCaC12 and 2 mA4MgC12. Add 40 pg/mL RNaseA
and 10 pg/mL DNaseI 6. Incubate the samples for 30 min at 37°C and stop by the addition of EDTA to 5 mA4
and EGTA to 5 mM. 7. Lyse the virions by the addition of sarcosyl to 0.5%, then add pronase to 1 mg/mL,
and incubate the samples at 37°C for 1 h to overnight. 8. Extract the samples with phenol/chloroform twice, add l/lOth volume of 3 M
Na-Acetate, pH 7.4, and then ethanol precipitate the DNA by the addition of 2 volumes of 100% ethanol. Store at -2O’C overmght, or -70°C for 15 min. Spin the samples at 15,000g for 30 mm to pellet viral DNA Remove ethanol, dry pellets briefly, and resuspend the viral DNA in 100 pL TE.
9. Use 1 ug of total nuclear DNA and 1/4th the total amount of viral DNA for restriction-endonuclease digestion and Southern blot hybridization (see Sub- heading 3.3.).
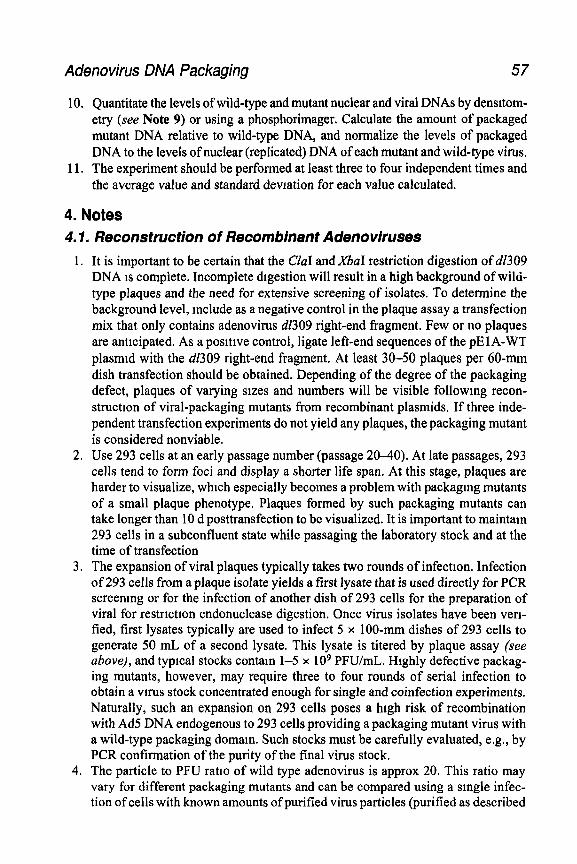
Adenovirus DNA Packaging 57
10. Quantitate the levels of wild-type and mutant nuclear and viral DNAs by densitom- etry (see Note 9) or using a phosphorimager. Calculate the amount of packaged mutant DNA relative to wild-type DNA, and normalize the levels of packaged DNA to the levels of nuclear (replicated) DNA of each mutant and wild-type virus.
11. The experiment should be performed at least three to four independent times and the average value and standard deviation for each value calculated.
4. Notes 4.1. ffeccmsfrucfion of /?ecombhent Adenowiruses
1. It is important to be certain that the CM and BaI restriction digestion of d1309 DNA is complete. Incomplete digestion will result in a high background of wild- type plaques and the need for extensive screening of isolates. To determine the background level, include as a negative control in the plaque assay a transfection mix that only contains adenovirus d/309 right-end fragment. Few or no plaques are anticipated. As a positive control, ligate left-end sequences of the pE1 A-WT plasmid with the dl309 right-end fragment. At least 30-50 plaques per 60-mm dish transfection should be obtained. Depending of the degree of the packaging defect, plaques of varying sizes and numbers will be visible followmg recon- struction of viral-packaging mutants from recombinant plasmids. If three inde- pendent transfection experiments do not yield any plaques, the packaging mutant is considered nonviable.
2. Use 293 cells at an early passage number (passage 20-40). At late passages, 293 cells tend to form foci and display a shorter life span. At this stage, plaques are harder to visualize, which especially becomes a problem with packaging mutants of a small plaque phenotype. Plaques formed by such packaging mutants can take longer than 10 d posttransfection to be visualized. It is important to maintain 293 cells in a subconfluent state while passaging the laboratory stock and at the time of transfection
3. The expansion of viral plaques typically takes two rounds of infectton. Infection of 293 cells from a plaque isolate yields a first lysate that is used directly for PCR screenmg or for the infection of another dish of 293 cells for the preparation of viral for restriction endonuclease digestion. Once virus isolates have been veri- tied, first lysates typically are used to infect 5 x 100~mm dishes of 293 cells to generate 50 mL of a second lysate. This lysate is titered by plaque assay (see above), and typical stocks contam l-5 x IO9 PFU/mL. Highly defective packag- ing mutants, however, may require three to four rounds of serial infection to obtain a virus stock concentrated enough for single and coinfection experiments. Naturally, such an expansion on 293 cells poses a htgh risk of recombination with Ad5 DNA endogenous to 293 cells providing a packaging mutant virus with a wild-type packaging domain. Such stocks must be carefully evaluated, e.g., by PCR confirmation of the purity of the final virus stock.
4. The particle to PFU ratio of wild type adenovirus is approx 20. This ratio may vary for different packaging mutants and can be compared using a smgle infec- tion of cells with known amounts of purified virus particles (purified as described
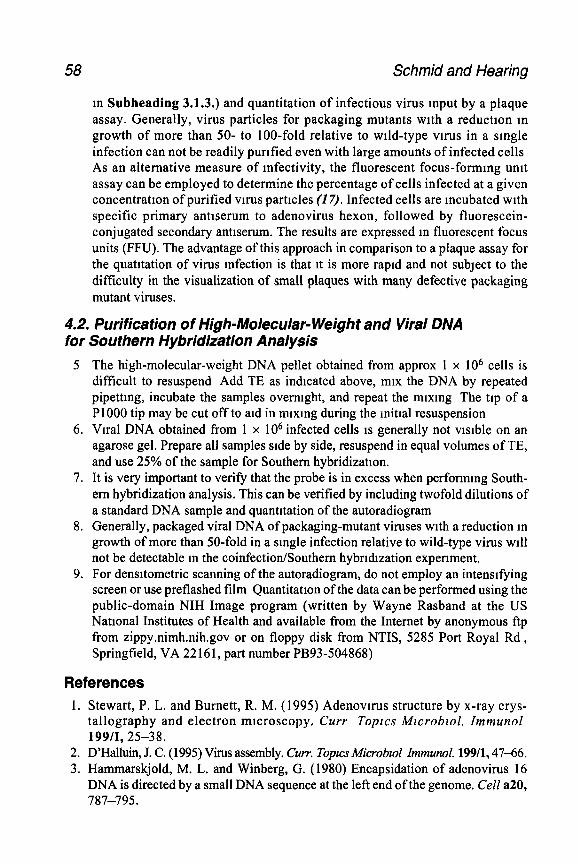
58 Schmid and Hearing
m Subheading 3.1.3.) and quantitation of infectious virus input by a plaque assay. Generally, virus particles for packaging mutants with a reduction m growth of more than 50- to loo-fold relative to wild-type virus in a smgle infection can not be readily purtfied even with large amounts of infected cells As an alternative measure of infectivity, the fluorescent focus-forming umt assay can be employed to determine the percentage of cells infected at a given concentration of purified vtrus particles (2 7). Infected cells are incubated with specific primary antiserum to adenovirus hexon, followed by fluorescein- conjugated secondary anttserum. The results are expressed m fluorescent focus units (FFU). The advantage of this approach in comparison to a plaque assay for the quatttation of virus Infection is that it is more rapid and not SubJect to the difficulty in the visualization of small plaques with many defective packaging mutant viruses.
4.2. Purification of High-Molecular-Weight and Viral DNA for Southern Hybridization Analysis
5 The high-molecular-weight DNA pellet obtained from approx 1 x lo6 cells is difficult to resuspend Add TE as indicated above, mix the DNA by repeated pipettmg, incubate the samples overnight, and repeat the mtxmg The tip of a Pl 000 tip may be cut off to atd in mtxmg during the mitral resuspension
6. Viral DNA obtained from 1 x lo6 infected cells is generally not visible on an agarose gel. Prepare all samples side by side, resuspend in equal volumes of TE, and use 25% of the sample for Southern hybridization.
7. It is very important to verify that the probe is in excess when performmg South- em hybridization analysis. This can be verified by including twofold dilutions of a standard DNA sample and quantttation of the autoradiogram
8. Generally, packaged viral DNA of packaging-mutant viruses with a reduction m growth of more than 50-fold in a smgle infection relative to wild-type virus will not be detectable m the coinfection/Southem hybrtdtzation experiment.
9. For densttometric scanning of the autoradiogram, do not employ an intensifying screen or use preflashed film Quantitatton of the data can be performed using the public-domain NIH Image program (written by Wayne Rasband at the US National Institutes of Health and available from the Internet by anonymous ftp from zippy.nimh.nih.gov or on floppy disk from NTIS, 5285 Port Royal Rd , Springfield, VA 22 161, part number PB93-504868)
References 1, Stewart, P. L. and Burnett, R. M. (1995) Adenovnus structure by x-ray crys-
tallography and electron microscopy. Curr Topics Mlcroblol. Immunol 199/I, 25-38.
2. D’Halluin, J. C. (1995) Virus assembly. Curr. Topics MicrobzoE Immunol. 199/l, 47-66. 3. Hammarskjold, M. L. and Winberg, G. (1980) Encapsidation of adenovirus 16
DNA is directed by a small DNA sequence at the left end of the genome. Cell a20, 787-795.
Adenovirus DNA Packaging 59
4. Tlbbetts, C. (1977) Vu-al DNA sequences from mcomplete particles of human adenovirus type 7. Cell 12,243
5 Fujisawa, H. and Hearing, P. (1994) Structure, function and specificity of the DNA packaging signals in double-stranded DNA viruses. Semm. Viral. 5,5-l 3.
6. Schmid, S. I. and Hearing, P. (1995) Selective encapsidation of adenovirus DNA. Curr Topics Microbial. Immunol. 199/l, 67-80.
7. Hearing, P. and Shenk, T. (1986) The adenovirus ElA enhancer contains two functionally distinct domains: One is specific for ElA and the other modulates all early units in cis. Cell 45, 229-236.
8 Graham, F. L , Smiley, J., Russell, W. C., and Nairu, R. (1977) Characteristics of a human cell line transformed by DNA from human adenovirus type 5. J Gen. Vzrol. 36, 59-72.
9. Grable, M. and Hearing, P. (1990) Adenovirus type 5 packaging domain is composed of a repeated element that is functionally redundant. J. Virol 64, 2047-2056
10. Hearing, P. and Shenk, T. (1983) The adenovnus type 5 ElA transcriptional con- trol region contains a duplicated enhancer element. Cell 33,695-703.
11. Stow, N. D. (1981) Clonmg a DNA fragment from the left-hand terminus of the adenovirus type 2 genome and its use in site-directed mutagenesis. J. Vvol 37, 171-180.
12. Jones, N and Shenk, T. (1979) Isolation of adenovirus type 5 host range deletion mutants defective for transformation of rat embryo cells. Cell 17, 683-689.
13. Wigler, M., Silverstein, S , Lee, L S., Pellicer, A., Cheng, Y. C., and Axel, R. (1977) Transfer of purified herpes simplex virus thymidine kinase gene to cul- tured mouse cells. Cell 11,223-232.
14. Maniatis, T., Fritsch, E. F., and Sambrook, J. (1982) Molecular Clonzng A Laboratory Manual. Cold Spring Harbor Laboratory, Cold Spring Harbor, NY.
15 Feinberg, A. P. and Vogelstein, B. (1983) A technique for radiolabeling DNA restriction endonuclease fragments to high specific activity. Anal Baochem 132, 6-13.
16 Harlow, E. and Lane, D. (1988) Antibodzes. A Laboratory Manual Cold Spring Harbor Laboratory, Cold Spring Harbor, NY.
17. Philipson, L., Lonberg-Holm, K., and Pettersson, U. (1968) Virus-receptor interacation in an adenovirus system. J Virol. 2, 1064-1075

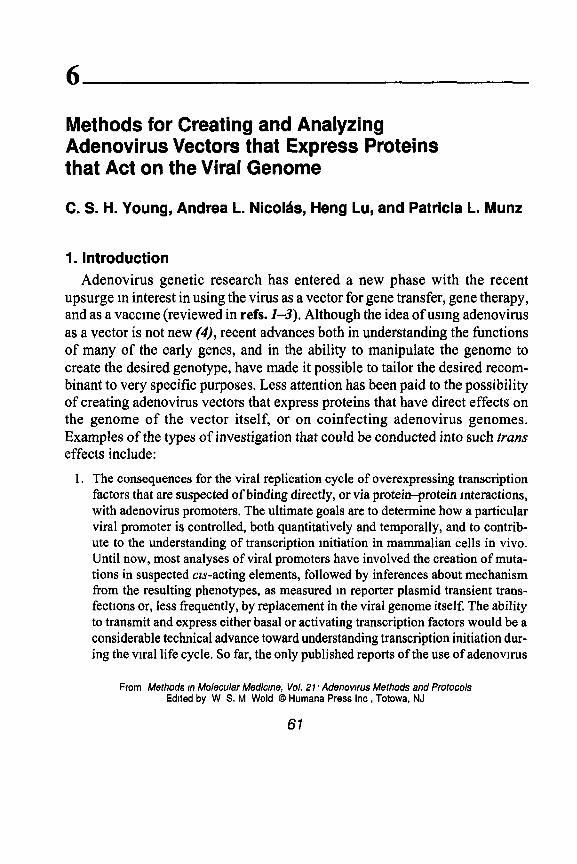
6
Methods for Creating and Analyzing Adenovirus Vectors that Express Proteins that Act on the Viral Genome
C. S. H. Young, Andrea L. Nicolb, Heng Lu, and Patricia L. Munz
1. Introduction Adenovirus genetic research has entered a new phase with the recent
upsurge m interest in using the virus as a vector for gene transfer, gene therapy, and as a vaccine (reviewed in refs. I-3). Although the idea of using adenovirus as a vector is not new (4J, recent advances both in understanding the functions of many of the early genes, and in the ability to manipulate the genome to create the desired genotype, have made it possible to tailor the desired recom- binant to very specific purposes. Less attention has been paid to the possibility of creating adenovirus vectors that express proteins that have direct effects on the genome of the vector itself, or on coinfecting adenovirus genomes. Examples of the types of investigation that could be conducted into such trans effects include:
1. The consequences for the viral replication cycle of overexpressing transcription factors that are suspected of binding directly, or via protein-protein Interactions, with adenovirus promoters. The ultimate goals are to determine how a particular viral promoter is controlled, both quantitatively and temporally, and to contrib- ute to the understanding of transcription initiation in mammalian cells in vivo. Until now, most analyses of viral promoters have involved the creation of muta- tions in suspected cu-acting elements, followed by inferences about mechanism from the resulting phenotypes, as measured m reporter plasmid transient trans- fectlons or, less frequently, by replacement in the viral genome itself. The ability to transmit and express either basal or activating transcription factors would be a considerable technical advance toward understanding transcription initiation dur- ing the viral life cycle. So far, the only published reports of the use of adenovnus
From Methods m Molecular Me&me, Vol. 21, Adenovrrus Methods and Protocols Edlted by W S. M Wold 0 Humana Press Inc , Totowa, NJ
61
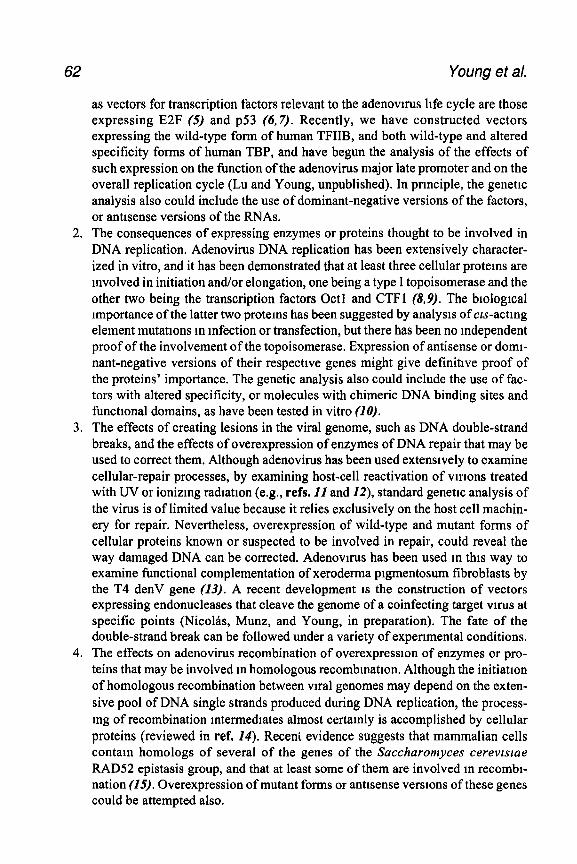
62 Young et al.
as vectors for transcription factors relevant to the adenovuus life cycle are those expressing E2F (5) and ~53 (67). Recently, we have constructed vectors expressing the wild-type form of human TFIIB, and both wild-type and altered specificity forms of human TBP, and have begun the analysis of the effects of such expression on the function of the adenovirus major late promoter and on the overall replication cycle (Lu and Young, unpublished). In principle, the genetic analysis also could include the use of dominant-negative versions of the factors, or antisense versions of the RNAs.
2. The consequences of expressing enzymes or proteins thought to be involved in DNA replication. Adenovirus DNA replication has been extensively character- ized in vitro, and it has been demonstrated that at least three cellular proteins are mvolved in initiation and/or elongation, one being a type I topoisomerase and the other two being the transcription factors Octl and CTFl (8,9). The biological importance of the latter two proteins has been suggested by analysis of czs-actmg element mutations m infection or transfection, but there has been no independent proof of the involvement of the topoisomerase. Expression of antisense or domi- nant-negative versions of their respective genes might give definitive proof of the proteins’ importance. The genetic analysis also could include the use of fac- tors with altered specificity, or molecules with chimeric DNA binding sites and functional domains, as have been tested in vitro (10).
3. The effects of creating lesions in the viral genome, such as DNA double-strand breaks, and the effects of overexpression of enzymes of DNA repair that may be used to correct them. Although adenovirus has been used extensively to examine cellular-repair processes, by examining host-cell reactivation of virions treated with UV or ionizing radiation (e.g., refs. II and 12), standard genetic analysis of the virus is of limited value because it relies exclusively on the host cell machin- ery for repair. Nevertheless, overexpression of wild-type and mutant forms of cellular proteins known or suspected to be involved in repair, could reveal the way damaged DNA can be corrected. Adenovnus has been used m this way to examine functional complementation of xeroderma pigmentosum fibroblasts by the T4 denV gene (13). A recent development is the construction of vectors expressing endonucleases that cleave the genome of a coinfecting target virus at specific points (Nicolas, Munz, and Young, in preparation). The fate of the double-strand break can be followed under a variety of experimental conditions.
4. The effects on adenovirus recombination of overexpression of enzymes or pro- teins that may be involved m homologous recombmation. Although the initiation of homologous recombination between viral genomes may depend on the exten- sive pool of DNA single strands produced during DNA replication, the process- ing of recombination mtermedrates almost certainly is accomplished by cellular proteins (reviewed in ref. 24). Recent evidence suggests that mammalian cells contain homologs of several of the genes of the Saccharomyces cerevwae RAD52 epistasis group, and that at least some of them are involved m recombi- nation (15). Overexpression of mutant forms or antisense versions of these genes could be attempted also.
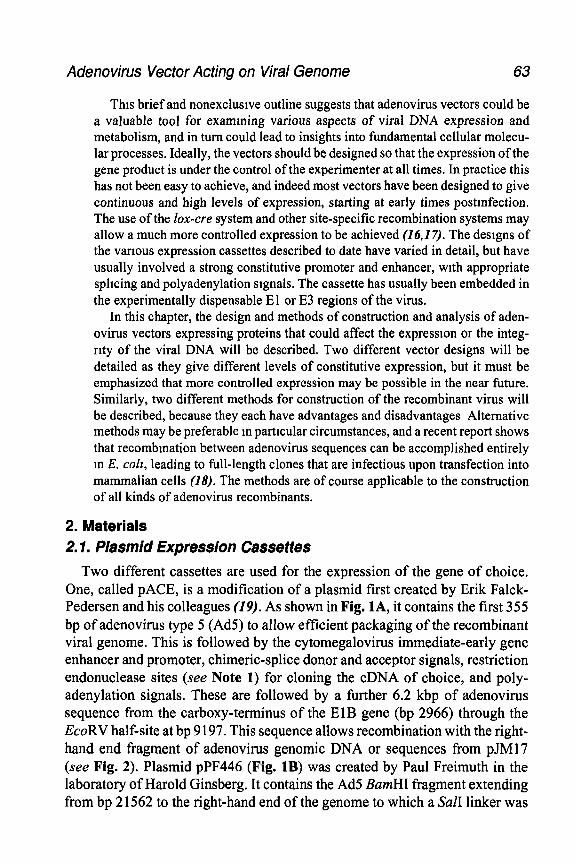
Adenovirus Vector Acting on Viral Genome 63
This brief and nonexclusive outline suggests that adenovirus vectors could be a valuable tool for examming various aspects of viral DNA expression and metabolism, and in turn could lead to insights into fundamental cellular molecu- lar processes. Ideally, the vectors should be designed so that the expression of the gene product is under the control of the experimenter at all times. In practice this has not been easy to achieve, and indeed most vectors have been designed to give continuous and high levels of expression, starting at early times postmfection. The use of the lox-cre system and other site-specific recombination systems may allow a much more controlled expression to be achieved (16,17). The designs of the various expression cassettes described to date have varied in detail, but have usually involved a strong constitutive promoter and enhancer, with appropriate splicing and polyadenylation signals. The cassette has usually been embedded in the experimentally dispensable E 1 or E3 regions of the virus.
In this chapter, the design and methods of construction and analysis of aden- ovirus vectors expressing proteins that could affect the expresston or the integ- rity of the viral DNA will be described. Two different vector designs will be detailed as they give different levels of constitutive expression, but it must be emphasized that more controlled expression may be possible in the near future. Similarly, two different methods for construction of the recombinant virus will be described, because they each have advantages and disadvantages Alternative methods may be preferable m particular circumstances, and a recent report shows that recombmation between adenovirus sequences can be accomplished entirely m E. colt, leading to full-length clones that are infectious upon transfection into mammalian cells (28). The methods are of course applicable to the construction of all kinds of adenovirus recombinants.
2. Materials 2.1. Plasmid Expression Cassettes
Two different cassettes are used for the expression of the gene of choice. One, called PACE, is a modification of a plasmid first created by Erik Falck- Pedersen and his colleagues (19). As shown in Fig. lA, it contains the first 355 bp of adenovirus type 5 (Ad5) to allow efticient packaging of the recombinant viral genome. This is followed by the cytomegalovirus immediate-early gene enhancer and promoter, chimeric-splice donor and acceptor signals, restriction endonuclease sites (see Note 1) for cloning the cDNA of choice, and poly- adenylation signals. These are followed by a further 6.2 kbp of adenovirus sequence from the carboxy-terminus of the ElB gene (bp 2966) through the EcoRV half-site at bp 9 197. This sequence allows recombination with the right- hand end fragment of adenovirus genomic DNA or sequences from pJM17 (see Fig. 2). Plasmid pPF446 (Fig. 1B) was created by Paul Freimuth in the laboratory of Harold Ginsberg. It contains the Ad5 BamHI fragment extending from bp 2 1562 to the right-hand end of the genome to which a Sal1 linker was
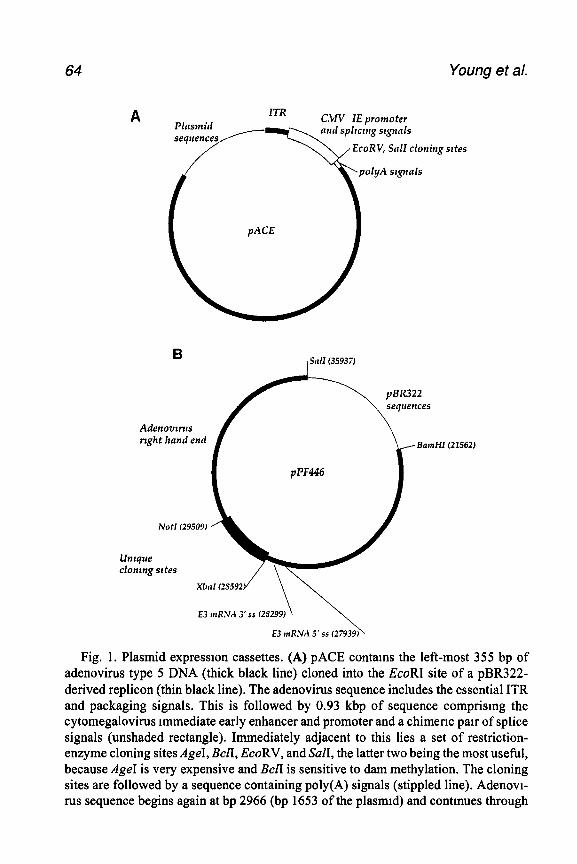
64 Young et al.
ITR CMV 1E promoter and splfctng stgnnls
EcoRV, Sal1 cloning sttes
PACE
Adenomms
E3 mR.VA 3’s 129299)
(21562)
Fig. 1. Plasmid expression cassettes. (A) PACE contains the left-most 355 bp of adenovirus type 5 DNA (thick black line) cloned into the EcoRI site of a pBR322- derived replicon (thin black line). The adenovirus sequence includes the essential ITR and packaging signals. This is followed by 0.93 kbp of sequence comprismg the cytomegalovirus immediate early enhancer and promoter and a chimertc pair of splice signals (unshaded rectangle). Immediately adjacent to this lies a set of restriction- enzyme cloning sites AgeI, BcfI, EcoRV, and SalI, the latter two being the most useful, because Age1 is very expensive and BclI is sensitive to dam methylation. The cloning sites are followed by a sequence containing poly(A) signals (stippled line). Adenovt- rus sequence begins again at bp 2966 (bp 1653 of the plasmid) and contmues through
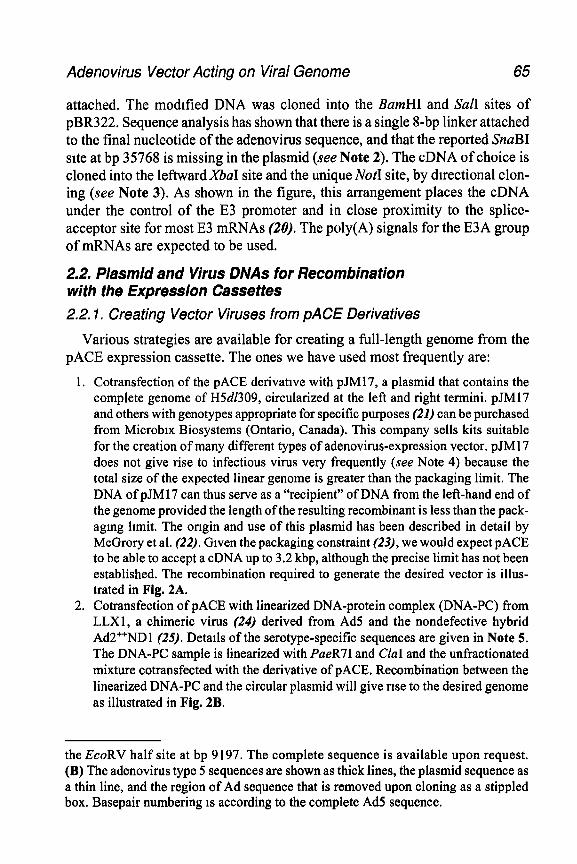
Adenovirus Vector Acting on Viral Genome 65
attached. The modified DNA was cloned into the BamHI and SalI sites of pBR322. Sequence analysis has shown that there is a single 8-bp linker attached to the final nucleotide of the adenovirus sequence, and that the reported SnuBI site at bp 35768 is missing in the plasmid (see Note 2). The cDNA of choice is cloned into the leftwardBa1 site and the unique Not1 site, by directional clon- ing (see Note 3). As shown in the figure, this arrangement places the cDNA under the control of the E3 promoter and in close proximity to the splice- acceptor site for most E3 mRNAs (20). The poly(A) signals for the E3A group of mRNAs are expected to be used.
2.2. Plasmid and Virus DNAs for Recombination with the Expression Cassettes 2.2.1. Creating Vector Viruses from PACE Derivatives
Various strategies are available for creating a full-length genome from the PACE expression cassette. The ones we have used most frequently are:
1. Cotransfection of the PACE derivative with pJM17, a plasmid that contains the complete genome of H5d/309, circularized at the left and right termini. pJM17 and others with genotypes appropriate for specific purposes (21) can be purchased from Microblx Biosystems (Ontario, Canada). This company sells kits suitable for the creation of many different types of adenovirus-expression vector. pJM 17 does not give rise to infectious virus very frequently (see Note 4) because the total size of the expected linear genome is greater than the packaging limit. The DNA of pJM17 can thus serve as a “recipient” of DNA from the left-hand end of the genome provided the length of the resulting recombinant is less than the pack- aging limit. The origin and use of this plasmid has been described in detail by McGrory et al. (22). Given the packaging constraint (23), we would expect PACE to be able to accept a cDNA up to 3.2 kbp, although the precise limit has not been established. The recombination required to generate the desired vector is illus- trated in Fig. 2A.
2. Cotransfection of PACE with linearized DNA-protein complex (DNA-PC) from LLXl, a chimeric virus (24) derived from Ad5 and the nondefective hybrid Ad2++NDl (25). Details of the serotype-specific sequences are given in Note 5. The DNA-PC sample is linearized with PueR71 and CluI and the unfractionated mixture cotransfected with the derivative of PACE. Recombination between the linearized DNA-PC and the circular plasmid will give nse to the desired genome as illustrated in Fig. 2B.
the EcoRV half site at bp 9197. The complete sequence is available upon request. (B) The adenovirus type 5 sequences are shown as thick lines, the plasmid sequence as a thin line, and the region of Ad sequence that is removed upon cloning as a stippled box. Basepair numbering 1s according to the complete Ad5 sequence.
66 Young et al.
\ ,7kb,
PACE-derlvatlve
B
PACE-derivative 8254 1
a-.
LLXI DNA-PC
Fig. 2. Recombination strategies for creatmg virus vectors from PACE derivatives. (A). Rescue of the packaging constraint in pJM17. Plasmtd sequences are shown as checkered lines, the CMV enhancer and promoter and the splicing signals as a thick black rectangle, the gene to be expressed as a thick stippled lme, and adenovirus sequences as black lines. The crossovers necessary to create a derivative genome, capable of being packaged into virus, are depicted as reversed curved lines Neither plasmid is drawn to scale. Note that in pJM17 the left and right genomic termim are covalently closed. The 7 kb line above the pBR322 sequence mserted into the unique XbaI site of d1309 refers to the total distance between adenovirus bp 355 and bp 2966 after insertion. Taking mto account the net deletion present in d1309, the extra DNA that can be accommodated in a stable virus genome, and the net deletion of region E 1 adenovnus sequence in PACE, we estimate that cDNAs up to 3.2 kbp could be incor- porated into a recombinant virus, This could be increased considerably by using plas- mids similar to pJM17 with extensive deletions in E3. (B) In this diagram, the PACE derivative DNA is shown linearized for convenience only. Conventions are as for (A),
Adenovirus Vector Acting on Viral Genome 67
2.2.2. Creating Vector Viruses from pPF446 Derivatives
Because the pPF446 contains a particularly large right-hand terminal aden- ovirus DNA sequence, and because the cDNA is placed about 7 kbp to the right of the BamHI site at bp 21562, rt is very easy to reconstruct viruses by cotransfection with the pPF446 derivative and the large left-hand terminal frag- ment derived from Ad5 by digestion with EcoRI, which cleaves at bp 2733 1. This is illustrated in Fig. 3.
2.3. Cells Used for Transfection and Subsequent Characterization of the Recombinant Viruses
Those vectors that have expression cassettes embedded in the El region of the genome must be propagated in human cells transformed by E 1 A and E 1 B. To date this has effectively meant using the 293 embryo-kidney-cell lme developed by Graham and colleagues (26). We use early-passage-adherent cells originally obtained from Eric Frost at the University of Sherbrooke, Province Quebec, Canada. In our experience, no advantage has been observed m using highly transfectable derivatives of 293 such as 293T (27). For the pPF446- derivative viruses, we have had excellent results with the continuous human small-cell lung-carcinoma cell line A549 (28). These cells are readily trans- fected, yield high titers of virus, and are an excellent plaquing cell line.
2.4. Cell-Culture Media and Supplies
One of the determinants of success in making recombinant adenovirus is the choice of both the appropriate culture medium, and the ability to perform reli- able focal assays to measure viral infectivity.
1. Cell growth media: In a laboratory with low cell-culture requirements and a lim- ited number of personnel, it is economical and time-saving to purchase standard media in liquid form. Both 293 and A549 cells are grown in DMEM supplied by Mediatech, Hemdon, VA (“cellgro”; cat. no. 15-013-LV). This medium, which contains glucose at 4 5 g/L, but lacks glutamine, has a long shelf hfe. Shortly before use, the medium is supplemented with glutamine to a final concentration of 250 pg/mL, pemcillin (100 U/mL), streptomycin (100 pg/mL) (both from Sigma, St. Louis, MO), and bovine calf serum “defined supplemented” (cat. no.
except that the packaging stgnal (w) is indtcated next to the ITR. LLXl DNA-PC digested with PueR71 and &I gives four fragments, of which only the rightmost one is shown, with the dotted lme indicating sequence continuing to the right termmus. Note that PueR71, although an rsoschrzomer ofXho1, does not cleave at the XhoI site at bp 9699. Because LLXl has a net deletion of 1171 bp, the largest cDNA that is expected to be accommodated in PACE is approx 4.2 kbp.
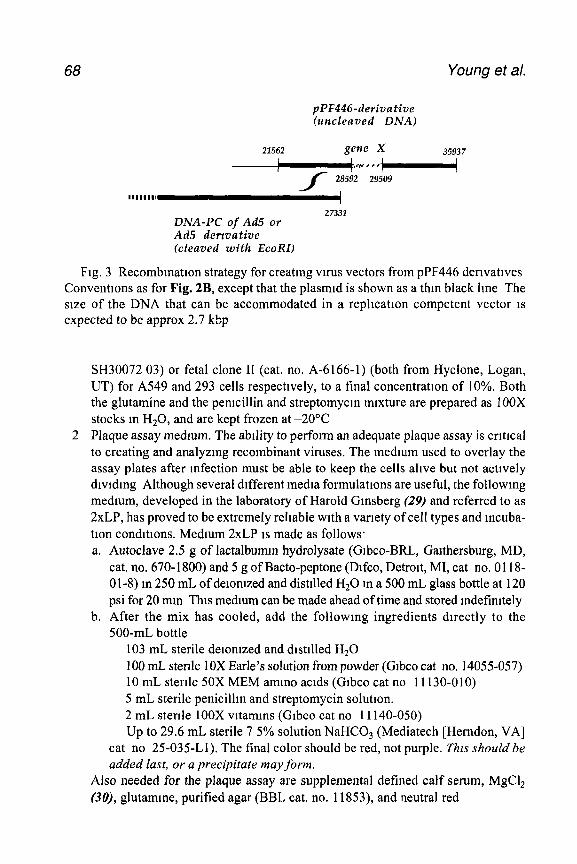
68 Young et a/.
pPF446-derivative (uncleaved DNA)
21562 gene X 35937 /.*+-j
28592 29509
DNA-PC of Ad5 or Ad5 derivative (cleaved with EcoRI)
27331
Fig. 3 Recombmatton strategy for creatmg virus vectors from pPF446 dertvatives Conventions as for Fig. 2B, except that the plasmid is shown as a thm black lure The size of the DNA that can be accommodated in a repllcatton competent vector IS expected to be approx 2.7 kbp
2
SH30072 03) or fetal clone II (cat. no. A-6166-1) (both from Hyclone, Logan, UT) for A549 and 293 cells respectively, to a final concentration of 10%. Both the glutamine and the pemcillin and streptomycm mtxture are prepared as 100X stocks m H20, and are kept frozen at -20°C Plaque assay medrum. The abrlity to perform an adequate plaque assay is critical to creating and analyzing recombinant viruses, The medium used to overlay the assay plates after infection must be able to keep the cells alive but not actively dtvtdmg Although several different medta formulattons are useful, the followmg medium, developed in the laboratory of Harold Ginsberg (29) and referred to as 2xLP, has proved to be extremely rehable wtth a vartety of cell types and mcuba- tion condmons. Medmm 2xLP IS made as follows* a. Autoclave 2.5 g of lactalbumm hydrolysate (Grbco-BRL, Garthersburg, MD,
cat. no. 670-l 800) and 5 g of Bacto-peptone (Dtfco, Detroit, MI, cat no. 0 118- 01-8) m 250 mL of detomzed and distilled Hz0 m a 500 mL glass bottle at 120 psi for 20 mm This medium can be made ahead of time and stored mdefimtely
b. After the mix has cooled, add the followmg ingredients directly to the 500-mL bottle
103 mL sterile deionized and distilled H,O 100 rnL stenle 1 OX Earle’s solution from powder (Grbco cat no. 14055-057) 10 mL sterile 50X MEM ammo acids (Gibco cat no 11130-010) 5 mL sterile penicillm and streptomycin solution. 2 mL stertle 100X vitamms (Gibco cat no 11140-050) Up to 29.6 mL sterile 7 5% solution NaHCOs (Mediatech [Herndon, VA]
cat no 25-035-Ll). The final color should be red, not purple. Ths should be added last, or a precipitate may form.
Also needed for the plaque assay are supplemental defined calf serum, MgCl* (30), glutamme, purified agar (BBL cat. no. 11853), and neutral red
Adenovirus Vector Acting on Viral Genome 69
3. Viral growth medium: Although there are many different media suitable for over- laying infected cells, the following medium, developed by the Ginsberg labora- tory (31) and referred to as “infecting fluid” or “IF” has proved to be excellent for growing stocks of virus, analyzing the infectious cycle, and for long-term storage of unpurified stocks of virus, Even if the stock is frozen and thawed many times, the titer is maintained at its original level. The formulation and preparation is as follows: a. Dissolve 7.4 g of bacto-tryptose phosphate broth (Difco cat. no. 0060-01-6)
in 508.5 mL of deionized, distilled H,O, and autoclave at 120 psi for 30 min. b. Dissolve 1.4 g of NaHCO, in 250 mL of deionized, distilled H,O and auto-
clave at 120 psi for 30 min. c. Immediately before making a batch of IF, combine the two sterile ingredients. d. Then add: 75 mL of chicken serum (Gibco cat. no. 16110-082; sole supplier),
56.5 mL of concentrated Scherer’s maintenance medium (BioWhittaker [Walkersville, MD] cat. no. 06-191B); this must be requested specially, as it is not made routinely, and 10 mL of stock penicillin and streptomycin solution.
e. Dispense in convenient sizes, typically 100 mL and store at 4°C in tightly capped bottles. A sample should be incubated at 37°C for a sterility check. The shelf life of IF is several months, but non-air-tight bottles may allow it to become more alkaline with time, and a precipitate may form. (This may hap- pen during the sterility check, and is no cause for alarm.) Although this seems to have little effect on the replication cycle of the vuus, IF contammg a pre- cipitate should be used for noncritical viral preparations only.
4. Hnt analysis reagents. a. Nuclear lysis buffer: make a stock of 11.1 mM Tris-HCl, pH 7.4, 11.1 rnA4
NaCl, 11.1 mA4 EDTA, 0.555% SDS. Keep at room temperature. (This stock can be made easily by diluting the separate ingredients together to give the appropriate concentrations It will be further diluted by 9/10 with pronase stock to give a final concentration of 10 mA4TNE, 0.5% SDS.)
b. Pronase stock: Make a stock solution of pronase (Sigma cat. no. 6911) at 10 mg/mL, and incubated at 37°C for at least 30 min to digest any contami- nating nucleases. Distribute the digested stock in 1 .O-mL aliquots and store at -20°C. Tubes can be frozen and thawed several times and the enzyme ~111 retain activity.
5. DNA-PC reagents: The methods for preparing the DNA-PC are a modification of those described in Chinnadurai et al. (32) and Volkert and Young (33). CsCl- purified vinons of LLX 1 are isolated using techniques described elsewhere (34). There is no need to remove the CsCl by dialysis prior to subsequent steps. a. Set up a Sepharose CL-4B column as follows: Put 50 mL of Sepharose in a
250-mL Erlenmeyer flask with a suction side-arm. Remove air by applying a vacuum, holding the flask at an angle at all times. The Sepharose is ready when it stops bubbling Pipet approx 25 mL of the Sepharose into a small glass column, such as a 10 x 40 mm disposable column from Bio-Rad. Let the buffer run through the column into a sterile beaker, and keep reloadmg the
70 Young et al.
buffer onto the column until the matrix is packed. The final packed column should have approx 1.5 in. of buffer above the matrix within the column m preparation for loading of the viral band.
b. Wash the column with 25 mL of newly prepared 4 M guanidine-HCl buffer (use approx 50 mL to wash a previously prepared column).
c. Prepare a small volume (approx 1 mL) of approx 8 Mguanidme-HCl by add- ing crystals of the solid to a small volume of dtstilled H,O until no more wrll go into solution. A saturated solution is slightly greater than 8 M.
d. Dependmg on how much DNA-PC is to be prepared, add an equal volume of the 8 Mguamdme-HCl solution to the viral band in a 5-mL snap-cap polysty- rene tube In our experience, a sample of 0.2 mL of a very concentrated viral band will be sufficient to prepare a reasonable concentration of DNA-PC Vortex briefly. Put the solution on ice for 5-10 min. The translucent viral band will become clear as the virus structure is disrupted by the guanidine.
e. Set up the fraction collector to collect I-mL fractions. Add 1 or 2 drops of 0.2% bromphenol blue dye to the disrupted viral solution and load through the guanidine-HCl buffer on top of the matrix, using a Pasteur pipet. The column is eluted using a continuous flow of guanidine-HCl buffer. The DNA- PC usually emerges at fractions 5-7 and approx 3-4 fractions before those containing the blue dye. Stop the elution when the dye has reached the bottom of the column. The column can be reused with another sample of the same viral preparation, but it must be washed with 50 mL 4 M guanidine-HCI. Do not let the column dry if it is intended to reuse it.
f Keep the fractions on ice and take the A 260/A280 value of each fraction using 4 A4 guanidine-HCl buffer as a blank. Select the fractions with the highest AzbO values for subsequent dialysis. It is important to try to keep the concentration of DNA-PC as high as possible for the later transfections, so do not pool the fractions if they have very different AzhO values. Peak fractions may have con- centrations of 30-50 pg/mL, but those as low as 10 pg/mL are usable.
g. Dialysis: To promote faithful refolding of the termmal protein, the dialysis is performed in a number of steps: First, dialyze the fractions agamst approx 100 volumes of 1.3 M guanidine-HCl buffer for 30 min, next, 0.4 M guam- dine-HCl buffer for 30 min, and, finally, TE for at least 1 h or overnight,
h. Place the DNA-PC sample into a sterile Eppendorf tube, and take a final A,& Asgo reading to calculate the concentration of the DNA-PC. Concentration changes are minor from the undialyzed sample. The ratio of A260/A280 varies from approx 1.6-l .9, but all seem to be infectious.
1. Store the DNA-PC sample on ice in the cold room. It ~111 remam infectious for many months and despite the apparent lack of sterile technique, it remains uncontaminated.
j 4 A4 guanidine-HCl buffer: Dissolve 114.64 g guamdine-HCl from Sigma or Fisher (Pittsburgh, PA) m 10 rnMTrts-HCl, pH 7.4,l mMEDTA, up to 300 mL. This will be enough to prepare the columns, elute the DNA-PC, and prepare the lower concentration buffers for dialysis. It should be kept cold and used
Adenovirus Vector Acting on Viral Genome 71
the same day. Do not use old solutions because the guanidine breaks down quote rapidly.
6. Calcium phosphate transfection reagents. a Sterile deionized and distilled H,O. b. Filter-sterilized 10X salmon-sperm DNA as carrier (240 pg/mL). c 10X Hepes buffer, pH 7 05 (the pH is important) d. 10X CaCl, (1.25 M). Keep at 4°C.
3. Methods 3.1. The Creation of Adenovlrus Expression Vectors by Recombination In Vivo
Because the adenovirus genome is relatively large and linear, it is very con- venient to allow the final assembly of the desired genome to occur by homolo- gous recombination in vivo, following cotransfection of two (or more) adenovirus genome fragments. The most common way in which this is accom- plished is by recombmatton between overlapping left-terminal and right-ter- minal genome fragments, one of which contains the desired expression cassette (see Fig. 2B). Several alternative methods are now available including a form of marker rescue of a potentially infectious genomic plasmid with a lethal insert (see Fig. 2A).
3.1.1. Cotransfection of pACE Derivatives with Linearized DNA-PC from LLXI
3.1.1 .I. CELL CULTURE (SEE NOTE 6)
The transfectron can be performed either as a direct plaque assay, in which the transfected cells are overlaid with semisolid medium (2xLP/agar mix), or as a yield under liquid medium (IF).
1. Prepare 60-mm plates of 293 cells for the plaque assay, or 35-mm plates for the yield assay, 2 d before the transfection. Best results have been obtained with plates that are just confluent at the time of transfection.
2. Use two plates for each construction, and for the various controls. It is convenient to set up 12-24 plates per assay, although greater numbers can be accommodated.
3.1. I .2. PREPARATION OF DNA-PC
1. Prepare DNA-PC from CsCl-purified LLXl using column chromatography (32). 2. Digest with PaeR71 and CM an amount of DNA-PC suffictent for all construc-
tions, with approx 1 pg extra to check the completeness of digestion on a stan- dard agarose gel. Digestion with this pair of restriction enzymes yields four fragments, and infectious virus is not produced from the cleaved DNA-PC when transfected alone, tf the digestion is complete.
72 Young et al.
3. After digestion, heat the mix at 65°C for 10 min to inactivate the CluI. 4. Remove a small sample of the digested DNA-PC for analysis on an analytical
gel Before running the gel, the sample must be deproteinized with pronase, and then phenol extracted, ethanol precipitated and resuspended in TE.
5. Store the digested DNA-PC on ice for use up to 24 h later (or at -80°C if the sample is to be used several days later).
3.1 .1.3. PREPARATION OF PACE-DERIVATIVE DNA (SEE NOTE 6)
1. Isolate a pure clone of the bacterium containing the desired plasmid. 2 Prepare the plasmid DNA using proprietary column chromatography (Qtagen,
Chatsworth, CA). We usually use the “midiprep” kit as thts gives sufficient DNA for several confirmatory restriction enzyme digestions and for sev- eral transfections.
3.1 .I .4 PRECIPITATION WITH CALCIUM PHOSPHATE (SEE NOTES 7 AND 6)
The precipitation is accomplished by the formation of a calcium phosphate- DNA coprecipitate (35). Note: The order of addition of ingredients 1s important.
It is useful to set out a chart for each transfection, in which samples 1 to IE contain the different plasmids to be used in the creation of the respective vectors, sample )z + 1 contams a known plasmid as a positive control for the production of virus, sample n + 2 contains n.o plasmid as a control for the efficiency of cutting of the DNA-PC, and sample n + 3 contains uncut DNA-PC only, as a control for transfection efficiency. Total volumes of the precipitates can be modified, depending on the numbers and sizes of plates to be transfected.
1. Make a cocktail of the H20, 10X HEPES and 10X ssDNA, but not the CaC12. The experimental DNA additions rarely come to more than approx 50 p,L total, and can be considered equal in each tube.
2. Distribute into I5-mL blue-capped polystyrene tubes (Falcon, Los Angeles, CA, cat. no. 2095), and warm the samples for 10 min at 37°C
3. Add the appropriate plasmid, cut DNA-PC, or uncut DNA-PC to the respective tubes, and then add the CaCl* dropwise to make sure it all enters the solution. You may see a faint precipitate at this time. Mtx gently but thoroughly, and incubate for 10-15 min at 37°C. The precipitate should give a bluish tinge to the solutions
4. For plaque assays, add 500 pL of the precipitate directly to each plate. For liquid assays use 250 pL per plate. For 24-well dishes, use no more than 100 pL per well.
5. Swirl to distribute the precipitate, and incubate at 37°C for 3-4 h.
3.1 .1.5. “BOOSTING” (3s) AND OVERLAYING THE PLATES (DIRECT-PLAQUE ASSAY)
1. During the incubation period, autoclave the agar solution. Keep at 5O’C. 2. Three hours after addition of the precipitate, warm enough of the solutions
required for the glycerol boost, washing, and overlaying steps. The supplements
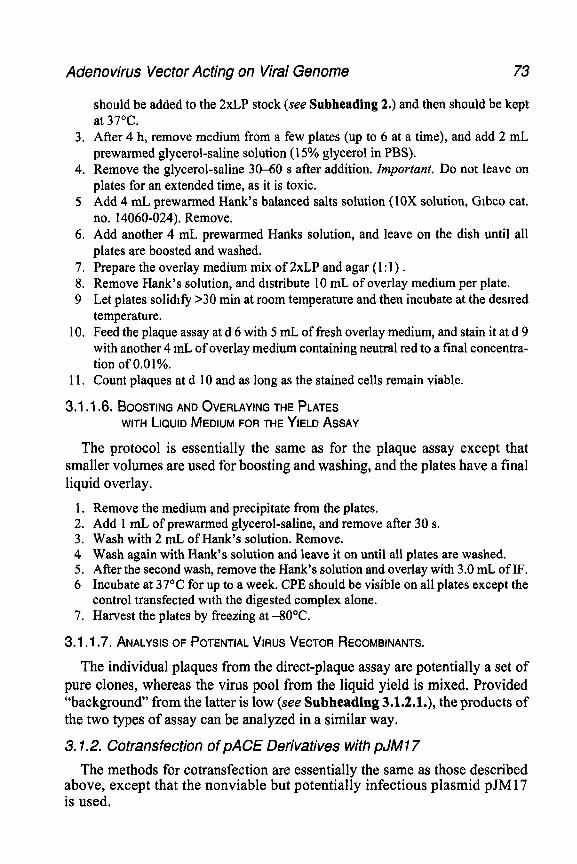
Adenovirus Vector Acting on Viral Genome 73
should be added to the 2xLP stock (see Subheading 2.) and then should be kept at 37°C.
3. After 4 h, remove medium from a few plates (up to 6 at a time), and add 2 mL prewarmed glycerol-saline solution (15% glycerol in PBS).
4. Remove the glycerol-saline 30-60 s after addition. Important. Do not leave on plates for an extended time, as it is toxic.
5 Add 4 mL prewarmed Hank’s balanced salts solution (10X solution, Gibco cat. no. 14060-024). Remove.
6. Add another 4 mL prewarmed Hanks solution, and leave on the dish until all plates are boosted and washed.
7. Prepare the overlay medium mix of 2xLP and agar (1: 1) . 8. Remove Hank’s solution, and dtstribute 10 mL of overlay medium per plate. 9 Let plates solidify >30 min at room temperature and then incubate at the destred
temperature. 10. Feed the plaque assay at d 6 with 5 mL of fresh overlay medium, and stain it at d 9
with another 4 mL of overlay medium containing neutral red to a final concentra- tion of 0.01%.
11. Count plaques at d 10 and as long as the stained cells remain viable.
3.1 .1.6. BOOSTING AND OVERLAYING THE PLATES WITH LIQUID MEDIUM FOR THE YIELD ASSAY
The protocol is essentially the same as for the plaque assay except that smaller volumes are used for boosting and washing, and the plates have a final liquid overlay.
1. Remove the medium and precipitate from the plates. 2. Add 1 mL of prewarmed glycerol-saline, and remove after 30 s. 3. Wash with 2 mL of Hank’s solution. Remove. 4 Wash again with Hank’s solution and leave it on until all plates are washed. 5. After the second wash, remove the Hank’s solution and overlay with 3.0 mL of IF. 6 Incubate at 37T for up to a week. CPE should be visible on all plates except the
control transfected wtth the digested complex alone. 7. Harvest the plates by freezing at -80°C.
3.1.1.7. ANALYSIS OF POTENTIAL VIRUS VECTOR RECOMBINANTS.
The individual plaques from the direct-plaque assay are potentially a set of pure clones, whereas the virus pool from the liquid yield is mixed. Provided “background” from the latter is low (see Subheading 3.1.2.1.), the products of the two types of assay can be analyzed in a similar way.
3.1.2. Cotransfection of PACE Derivatives with pJMl7 The methods for cotransfection are essentially the same as those described
above, except that the nonviable but potentially infectious plasmid pJM 17 is used.
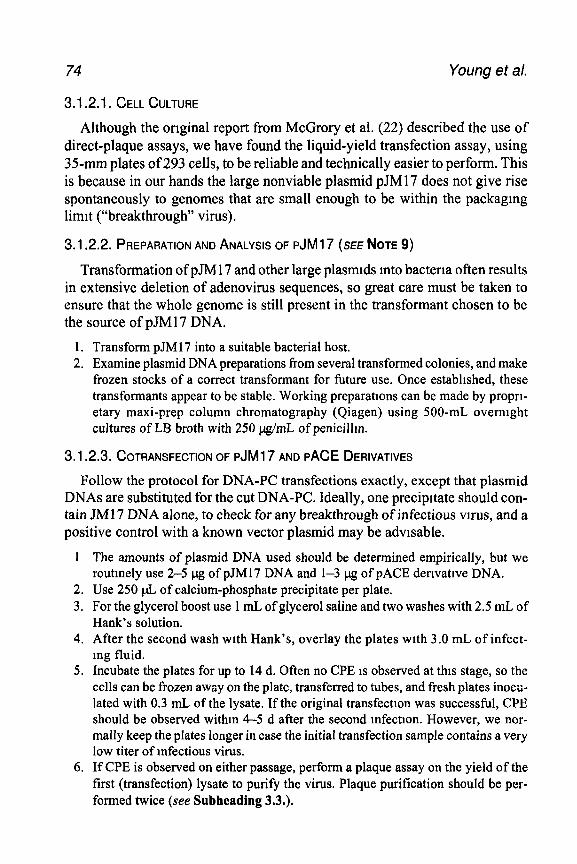
74 Young et al.
3.1.2.1. CELL CULTURE
Although the original report from McGrory et al. (22) described the use of direct-plaque assays, we have found the liquid-yield transfection assay, using 35-mm plates of 293 cells, to be reliable and technically easier to perform. This is because in our hands the large nonviable plasmid pJM17 does not give rise spontaneously to genomes that are small enough to be within the packaging limit (“breakthrough” virus).
3.1.2.2. PREPARATION AND ANALYSIS OF pJM17 (SEE NOTE 9)
Transformation of pJM 17 and other large plasmids mto bacteria often results in extensive deletion of adenovirus sequences, so great care must be taken to ensure that the whole genome is still present in the transformant chosen to be the source of pJM17 DNA.
1. Transform pJMl7 into a suitable bacterial host. 2. Examine plasmid DNA preparations from several transformed colonies, and make
frozen stocks of a correct transformant for future use. Once established, these transformants appear to be stable. Working preparations can be made by propri- etary maxi-prep column chromatography (Qiagen) using 500-mL overnight cultures of LB broth with 250 &mL of penicillm.
3.1.2.3. COTRANSFECTION OF pJM17 AND PACE DERIVATIVES
Follow the protocol for DNA-PC transfections exactly, except that plasmid DNAs are substituted for the cut DNA-PC. Ideally, one precipitate should con- tain JM 17 DNA alone, to check for any breakthrough of infectious vn-us, and a positive control with a known vector plasmid may be advisable.
1 The amounts of plasmid DNA used should be determined empirically, but we routinely use 2-5 pg of pJM17 DNA and l-3 pg of PACE derivative DNA.
2. Use 250 pL of calcium-phosphate precipitate per plate. 3. For the glycerol boost use 1 mL of glycerol saline and two washes with 2.5 mL of
Hank’s solution. 4. After the second wash with Hank’s, overlay the plates with 3.0 mL of infect-
mg fluid. 5. Incubate the plates for up to 14 d. Often no CPE is observed at this stage, so the
cells can be frozen away on the plate, transferred to tubes, and fresh plates inocu- lated with 0.3 mL of the lysate. If the original transfection was successful, CPE should be observed within 4-5 d after the second mfection. However, we nor- mally keep the plates longer in case the initial transfection sample contains a very low titer of infectious virus.
6. If CPE is observed on either passage, perform a plaque assay on the yield of the first (transfection) lysate to purify the virus. Plaque purification should be per- formed twice (see Subheading 3.3.).
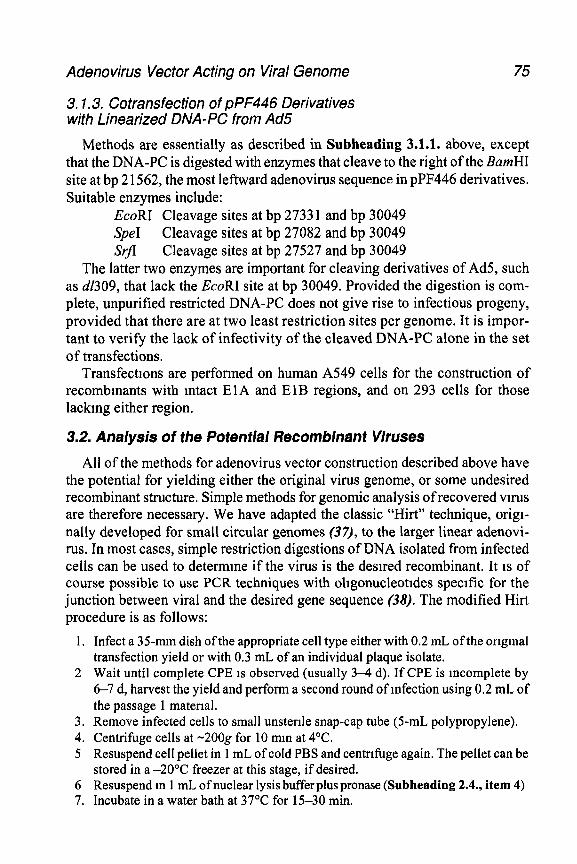
Adenovirus Vector Acting on Viral Genome 75
3.1.3. Cotransfection of pPF446 Derivatives with Linearized DNA-PC from Ad5
Methods are essentially as described in Subheading 3.1.1. above, except that the DNA-PC is digested with enzymes that cleave to the right of the BarnHI site at bp 2 1562, the most leftward adenovirus sequence in pPF446 derivatives. Suitable enzymes include:
EcoRI Cleavage sites at bp 2733 1 and bp 30049 SpeI Cleavage sites at bp 27082 and bp 30049 Srfl Cleavage sites at bp 27527 and bp 30049
The latter two enzymes are important for cleaving derivatives of Ad5, such as d1309, that lack the EcoRI site at bp 30049. Provided the digestion is com- plete, unpurified restricted DNA-PC does not give rise to infectious progeny, provided that there are at two least restriction sites per genome. It is impor- tant to verify the lack of infectivity of the cleaved DNA-PC alone in the set of transfections.
Transfections are performed on human A549 cells for the construction of recombmants with intact ElA and ElB regions, and on 293 cells for those lacking either region.
3.2. Analysis of the Potential Recombinant Viruses
All of the methods for adenovirus vector construction described above have the potential for yielding either the original virus genome, or some undesired recombinant structure. Simple methods for genomic analysis of recovered virus are therefore necessary. We have adapted the classic “Hut” technique, origi- nally developed for small circular genomes (37), to the larger linear adenovi- r-us. In most cases, simple restriction digestions of DNA isolated from infected cells can be used to determine if the virus is the desired recombinant. It is of course possible to use PCR techniques with ohgonucleotrdes specific for the junction between viral and the desired gene sequence (38). The modified Hirt procedure is as follows:
1. Infect a 35-mm dish of the appropriate cell type either with 0.2 mL of the original transfection yield or with 0.3 mL of an individual plaque isolate.
2 Wait until complete CPE is observed (usually 3-4 d). If CPE is incomplete by 6-7 d, harvest the yield and perform a second round of infection using 0.2 mL of the passage 1 maternal.
3. Remove infected cells to small unsterile snap-cap tube (5-mL polypropylene). 4. Centrifuge cells at -200g for 10 mm at 4°C. 5 Resuspend cell pellet in 1 mL of cold PBS and centrifuge again. The pellet can be
stored in a -20% freezer at this stage, if desired. 6 Resuspend m 1 mL of nuclear lysis buffer plus pronase (Subheading 2.4., item 4) 7. Incubate in a water bath at 37°C for 15-30 min.
76 Young et al.
8. Add 0.25 mL of 5 A4 NaCl. Mix gently and pour into a 1 S-mL Eppendorf tube. The mixture will be very viscous, and there will be a whitish precipitate.
9 Chill on ice for 30 min or longer; the precipitate can be left indefinitely at 4°C 10. Centrifuge at 4°C for 5-10 mm. Il. Remove approx 0 5 mL of clear supernatant and place m an Eppendorf tube. Add
an equal volume of isopropanol to precipitate the DNA. Centrifuge the preclpl- tate for 15 min. (The remainder of the original NaCl precipitate and supernatant can be kept m reserve at 4°C.)
12. Wash precipitate with 70% ethanol, and then dry the pellet by evaporation. 13. After the DNA is dry, resuspend in 50 pL of TE. This DNA preparation is not
very pure, but it can be digested by most restriction enzymes. If desired, RNase can be added to a final concentration of 0.5 mg/mL. If the sample IS to be kept for several days, store tt at -2O’C
14. If the DNA samples do not digest well, add 45 ltL of a 1.1 phenol-chloroform/ lsoamyl alcohol mixture to the DNA Vortex and spur for 5 mm at room temperature.
15. Remove the supernatant very carefully. Be sure not to pick up any of the lower phenol-chloroform/isoamyl alcohol phase. This supematant can be used directly for restriction digestion without a second ethanol precipitation. If the DNA still does not digest well, precipitate rt a second time with 100% ethanol, wash the pellet with 70% ethanol, dry, and resuspend as before.
3.3. Plaque Purification of a Confirmed Recombinant (see Note 70)
After the restriction analysis (or PCR analysis) has confirmed the expected genomic organization of the desired vector, it is necessary to purify the virus by plaque purification.
1. Prepare 60-mm dishes of the appropriate cell type to be Just confluent 2 d after seeding.
2. Prepare IO-fold serial dilutions of either the original transfection yield from the liquid yield assay, or of the original plaque isolate from the direct transfection assay, using IF as the diluent.
3. Perform a plaque assay using several different dilutions of the virus, so that at least one plate has less than 10 well-isolated plaques. In practice, this is usu- ally obtained by diluting the original plaque isolate 103-, 104-, and 105-fold. It is harder to Judge the dilutions needed for purification from the liquid yield, but if CPE was observed on the original transfection plates, use 1 04-, 1 05-, and 106-fold dilutions.
4. Aspirate medium from the plates and inoculate with 0.2 mL of the various dilutions 5. Incubate at 37’C for 60 mm, rocking the plates to disperse the moculum every
15-20 min. 6. Warm up enough of the 2xLP for all plates (5 mL per plate), add supplemental
defined calf serum to 2%, MgCl, to 5 mM (essential to get large plaques) (30),
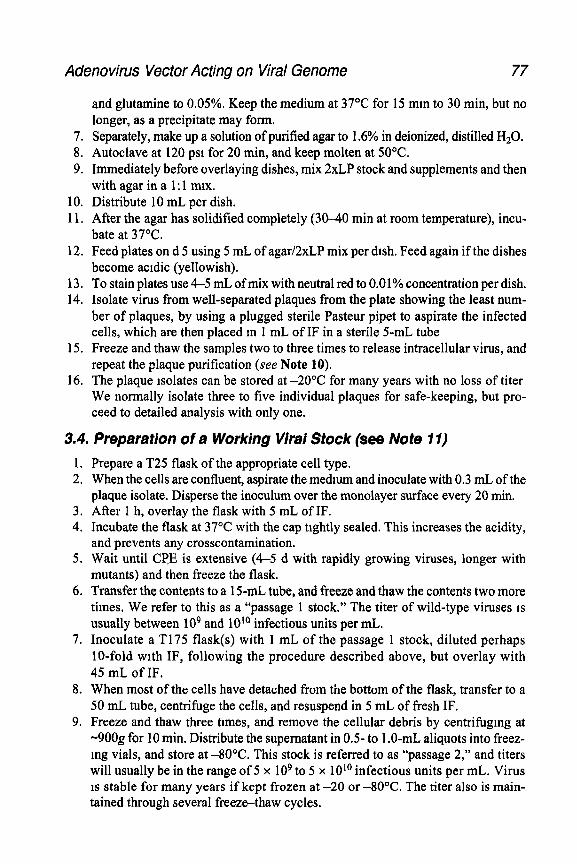
Adenovirus Vector Acting on Viral Genome 77
and glutamine to 0.05%. Keep the medium at 37’C for 15 mm to 30 min, but no longer, as a precipitate may form.
7. Separately, make up a solution of purified agar to 1.6% in deionized, distilled H20. 8. Autoclave at 120 psi for 20 min, and keep molten at 5O“C. 9. Immediately before overlaying dishes, mix 2xLP stock and supplements and then
with agar in a 1: 1 mix. 10. Distribute 10 mL per dish. 11, After the agar has solidified completely (30-40 min at room temperature), incu-
bate at 37’C. 12. Feed plates on d 5 using 5 mL of agar/2xLP mix per dish. Feed again if the dishes
become acidic (yellowish). 13. To stain plates use 4-5 mL of mix with neutral red to 0.01% concentration per dish. 14. Isolate virus from well-separated plaques from the plate showing the least num-
ber of plaques, by using a plugged sterile Pasteur pipet to aspirate the infected cells, which are then placed m 1 mL of IF in a sterile 5-mL tube
15. Freeze and thaw the samples two to three times to release intracellular virus, and repeat the plaque purification (see Note 10).
16. The plaque isolates can be stored at -20°C for many years with no loss of titer We normally isolate three to five individual plaques for safe-keeping, but pro- ceed to detailed analysis with only one.
3.4. Preparation of a Working Viral Stock (see Note 11)
1. Prepare a T25 flask of the appropriate cell type. 2. When the cells are confluent, aspirate the medtum and inoculate with 0.3 mL of the
plaque isolate. Disperse the inoculum over the monolayer surface every 20 min. 3. After 1 h, overlay the flask with 5 mL of IF. 4. Incubate the flask at 37°C with the cap tightly sealed. This increases the acidity,
and prevents any crosscontamination. 5. Wait until CPE is extensive (4-5 d with rapidly growing viruses, longer with
mutants) and then freeze the flask. 6. Transfer the contents to a 15-mL tube, and freeze and thaw the contents two more
times. We refer to this as a “passage 1 stock.” The titer of wild-type viruses IS usually between lo9 and lOlo infectious units per mL.
7. Inoculate a T175 flask(s) with 1 mL of the passage 1 stock, diluted perhaps lo-fold with IF, following the procedure described above, but overlay with 45 mL of IF.
8. When most of the cells have detached from the bottom of the flask, transfer to a 50 mL tube, centrifuge the cells, and resuspend in 5 mL of fresh IF.
9. Freeze and thaw three times, and remove the cellular debris by centrifugmg at -9OOg for 10 min. Distribute the supematant in 0.5- to 1 .O-mL aliquots into freez- ing vials, and store at -8O’C. This stock is referred to as “passage 2,” and titers will usually be in the range of 5 x lo9 to 5 x lOlo infectious units per mL. Virus IS stable for many years if kept frozen at -20 or -80°C. The titer also is main- tained through several freeze-thaw cycles.
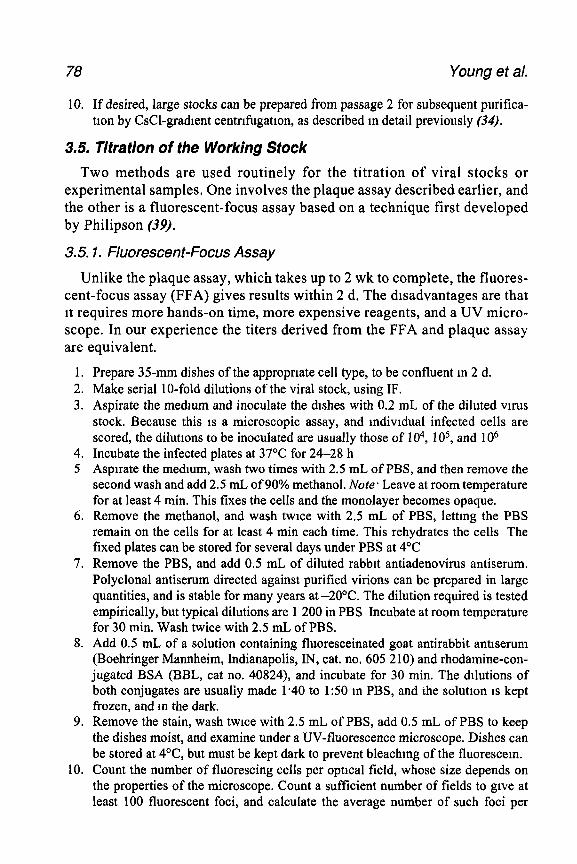
78 Young et al.
10. If desired, large stacks can be prepared from passage 2 for subsequent purifica- tion by CsCl-gradient centrifugation, as described m detail previously (34).
3.5. Tifraflon of the Working Stock
Two methods are used routinely for the titration of viral stocks or experimental samples. One involves the plaque assay described earlier, and the other is a fluorescent-focus assay based on a technique first developed by Philipson (39).
3.5.1. Fluorescent-Focus Assay
Unlike the plaque assay, which takes up to 2 wk to complete, the fluores- cent-focus assay (FFA) gives results within 2 d. The dtsadvantages are that rt requires more hands-on time, more expensive reagents, and a UV micro- scope. In our experience the titers derived from the FFA and plaque assay are equivalent.
1. Prepare 35-mm dishes of the appropriate cell type, to be confluent m 2 d. 2. Make serial IO-fold dilutions of the viral stock, using IF. 3. Aspirate the medmm and inoculate the dishes with 0.2 mL of the diluted vu-us
stock. Because this 1s a microscopic assay, and mdividual infected cells are scored, the diluttons to be inoculated are usually those of 1 04, 1 OS, and 1 O6
4. Incubate the infected plates at 37°C for 24-28 h 5 Aspirate the medium, wash two times with 2.5 mL of PBS, and then remove the
second wash and add 2.5 mL of 90% methanol. Note* Leave at room temperature for at least 4 min. This fixes the cells and the monolayer becomes opaque.
6. Remove the methanol, and wash twice with 2.5 mL of PBS, lettmg the PBS remain on the cells for at least 4 min each time. This rehydrates the cells The fixed plates can be stored for several days under PBS at 4’C
7. Remove the PBS, and add 0.5 mL of diluted rabbit antiadenovirus antiserum. Polyclonal antiserum directed against purified virions can be prepared in large quantities, and is stable for many years at -2O’C. The dilution required is tested empirically, but typical dilutions are 1 200 in PBS Incubate at room temperature for 30 min. Wash twice with 2.5 mL of PBS.
8. Add 0.5 mL of a solution containing fluoresceinated goat antirabbit antiserum (Boehringer Mannheim, Indianapolis, IN, cat. no. 605 210) and rhodamine-con- jugated BSA (BBL, cat no. 40824), and incubate for 30 min. The dilutions of both conjugates are usually made 1.40 to 1:50 in PBS, and the solution IS kept frozen, and m the dark.
9. Remove the stain, wash twice with 2.5 mL of PBS, add 0.5 mL of PBS to keep the dishes moist, and examine under a UV-fluorescence microscope. Dishes can be stored at 4”C, but must be kept dark to prevent bleaching of the fluorescem.
10. Count the number of fluorescing cells per optical field, whose size depends on the properties of the microscope. Count a sufficient number of fields to give at least 100 fluorescent foci, and calculate the average number of such foci per
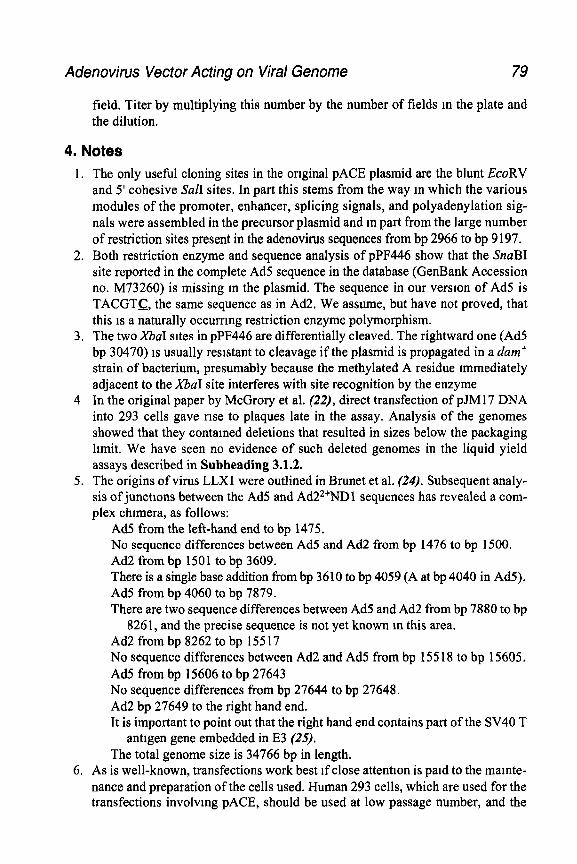
Adenovirus Vector Acting on Viral Genome 79
field. Titer by multiplying this number by the number of fields m the plate and the dilution,
4. Notes 1. The only useful cloning sites in the original PACE plasmid are the blunt EcoRV
and 5’ cohesive sun sites, In part this stems from the way m which the various modules of the promoter, enhancer, splicing signals, and polyadenylation sig- nals were assembled in the precursor plasmid and m part from the large number of restriction sites present in the adenovirus sequences from bp 2966 to bp 9 197.
2. Both restriction enzyme and sequence analysis of pPF446 show that the SnuBI site reported in the complete Ad5 sequence in the database (GenBank Accession no. M73260) is missing m the plasmid. The sequence in our version of Ad5 is TACGTC, the same sequence as in Ad2. We assume, but have not proved, that this is a naturally occurrmg restriction enzyme polymorphism.
3. The two %a1 sites in pPF446 are differentially cleaved. The rightward one (Ad5 bp 30470) is usually resistant to cleavage if the plasmid is propagated in a dam+ strain of bacterium, presumably because the methylated A residue immediately adjacent to the %a1 site interferes with site recognition by the enzyme
4 In the original paper by McGrory et al. (22), direct transfection of pJM 17 DNA into 293 cells gave rise to plaques late in the assay. Analysis of the genomes showed that they contained deletions that resulted in sizes below the packaging hmit. We have seen no evidence of such deleted genomes in the liquid yield assays described in Subheading 3.1.2.
5. The origins of virus LLXI were outlined in Brunet et al. (24). Subsequent analy- sis of junctions between the Ad5 and Ad22+ND1 sequences has revealed a com- plex chimera, as follows:
Ad5 from the left-hand end to bp 1475. No sequence differences between Ad5 and Ad2 from bp 1476 to bp 1500. Ad2 from bp 1501 to bp 3609. There is a single base addition from bp 3610 to bp 4059 (A at bp 4040 in Ad5). Ad5 from bp 4060 to bp 7879. There are two sequence differences between Ad5 and Ad2 from bp 7880 to bp
826 1, and the precise sequence is not yet known m this area. Ad2 from bp 8262 to bp 155 17 No sequence differences between Ad2 and Ad5 from bp I55 18 to bp 15605, Ad5 from bp 15606 to bp 27643 No sequence differences from bp 27644 to bp 27648. Ad2 bp 27649 to the right hand end. It is important to point out that the right hand end contains part of the SV40 T
antigen gene embedded in E3 (25). The total genome size is 34766 bp in length.
6. As is well-known, transfections work best if close attention is paid to the mamte- nance and preparation of the cells used. Human 293 cells, which are used for the transfections involvmg PACE, should be used at low passage number, and the
80 Young et al.
plates to be transfected should be just confluent. Cells that have been at confluence for some time do not transfect efftctently, and underconfluent monolayers are eas- ily disturbed by the manipulations of the transfection, and also may not survtve under the agar overlay. The stock cultures are maintained in DME with 10% fetal clone II (Hyclone), and are split once a week, at a dilution of 1:20. Removal of the cells from the culture flask is accompltshed by standard techniques, namely wash- ing with PBS, and brief treatment with trypsin-EDTA. In our experience, it is not desirable to ttturate the cells extensively to make a single-cell suspension, and thus we do not count the number of cells removed from the flask. A T75 flask will yield about thirty 35-mm or fifteen 60-mm dishes ready to transfect in 2 d. One-day-old plates are not used, because the monolayers are not stable to manipulation
7 The preparation of plasmid DNA for the overlap reaction has been performed in many different ways, including the use of crude minipreps produced by the boilmg lysts method (40). Recently Qiagen has repotted that the presence of LPS in some plasrmd DNA preparations mhtbits the efficiency of transfection. We have not determined if this is a problem m adenovirus-overlap recombmatton, but caution may be m order.
8. Although several alternative proprietary preparations for transfectton using ltpo- some micelles have been developed, we have not found them to be sigmficantly better than the calcium-phosphate method first described by Graham and van der Eb (35). The latter is reliable and cost-effective. We have not tested electro- poration as a method for vnus reconstruction.
9. Different methods for preparing pJMl7 have not been evaluated by us, and because the efficiency of recombination with PACE derivatives is low, tt may be worthwhile to see if CsCl-purified preparations are more efficient.
10. Although plaque-purification is time-consummg, it 1s necessary because the origi- nal transfection may yield a mixture of genotypes, and even if there is a smgle genotype, the population is not clonal. At least one round of plaque purificatton is necessary, and many investigators have suggested three rounds of purification. It should also be emphasized that if a set of different recombinants has been created in a particular transfection, the plaque-purificatton stage must be con- ducted under conditions in which crosscontamination cannot occur. Note- Restriction-enzyme analysis and, if necessary, sequence analysis is performed on Hirt DNA derived from cells infected with samples of the final plaque Isolate to confirm the identity of the recombinant,
11. If several different recombinants have been created in a transfection, each one is handled separately durmg the preparation of the working stocks. We inoculate the T25 flasks at different times, and designate samples of IF for each stock. Minor crosscontaminatton between isolates from aerosols created durmg maculation would be possible if suitable precautions are not taken, and likely to escape notice.
References 1. Berkner, K. L. (1988) Development of adenovirus vectors for the expression of
heterologous genes. BioTechniques f&616-629.
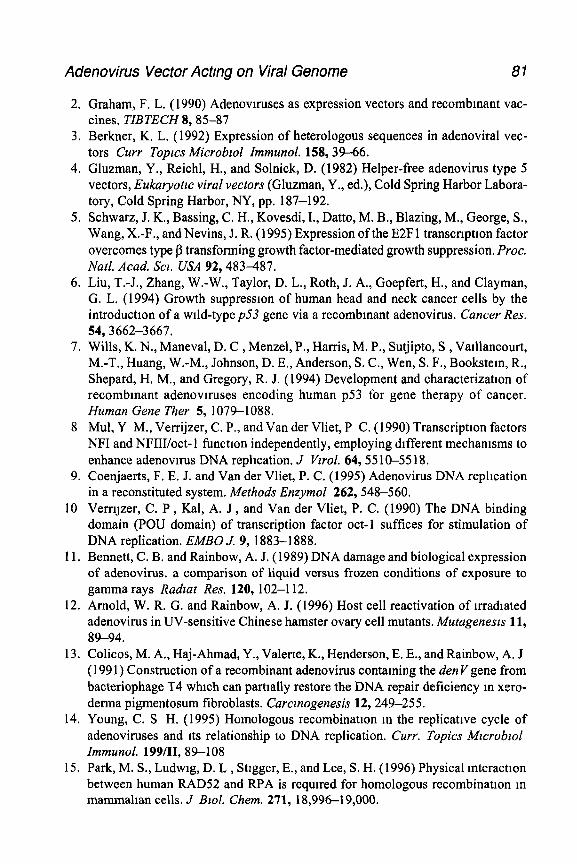
Adenovirus Vector Actmg on Viral Genome 81
2. Graham, F. L. (1990) Adenovnuses as expression vectors and recombinant vac- cines. TIBTECH 8, 85-87
3. Berkner, K. L. (1992) Expression of heterologous sequences in adenoviral vec- tors Curr Topxs Microblol Immunol. 158,39-66.
4. Gluzman, Y., Reichl, H., and Solnick, D. (1982) Helper-free adenovirus type 5 vectors, Eukaryotlc viral vectors (Gluzman, Y., ed.), Cold Spring Harbor Labora- tory, Cold Spring Harbor, NY, pp. 187-192.
5. Schwarz, J. K., Bassing, C. H., Kovesdi, I., Datto, M. B., Blazing, M., George, S., Wang, X.-F., and Nevins, J. R. (1995) Expression of the E2Fl transcriptton factor overcomes type p transforming growth factor-mediated growth suppression. Proc. Natl. Acad. SCL USA 92,483+87.
6. Liu, T.-J., Zhang, W.-W., Taylor, D. L., Roth, J. A., Goepfert, H., and Clayman, G. L. (1994) Growth suppression of human head and neck cancer cells by the introduction of a wild-type pS3 gene via a recombinant adenovirus. Cancer Res. 54,3662-3667.
7. Wills, K. N., Maneval, D. C , Menzel, P., Harris, M. P., Sutjipto, S , Vaillancourt, M.-T., Huang, W.-M., Johnson, D. E., Anderson, S. C., Wen, S. F., Bookstem, R., Shepard, H. M., and Gregory, R. J. (1994) Development and characterizatton of recombmant adenoviruses encoding human p53 for gene therapy of cancer. Human Gene Ther 5, 1079-1088.
8 Mul, Y M., Verrijzer, C. P., and Van der Vliet, P C. (1990) Transcription factors NFI and NFIII/oct-1 function independently, employing different mechanisms to enhance adenovn-us DNA replication. J Vu-01. 64,5510-5518.
9. Coenjaerts, F. E. J. and Van der Vliet, P. C. (1995) Adenovirus DNA rephcation in a reconstituted system. Methods Enzymol 262,548-560.
10 VerrtJzer, C. P , Kal, A. J , and Van der Vliet, P. C. (1990) The DNA binding domain (POU domain) of transcription factor act-1 suffices for stimulation of DNA replication. EMBO J. 9, 1883-1888.
11. Bennett, C. B. and Rainbow, A. J. (1989) DNA damage and biological expression of adenovirus. a comparison of liquid versus frozen conditions of exposure to gamma rays Radzat Res. 120, 102-l 12.
12. Arnold, W. R. G. and Rainbow, A. J. (1996) Host cell reactivation of irradiated adenovirus in UV-sensitive Chinese hamster ovary cell mutants. Mutageneszs 11, 89-94.
13. Colicos, M. A., Haj-Ahmad, Y., Valerie, K., Henderson, E. E., and Rainbow, A. J (199 1) Construction of a recombinant adenovirus contaming the den V gene from bacteriophage T4 which can partially restore the DNA repair deficiency m xero- derma pigmentosum fibroblasts. Carcznogenesis 12,249-255.
14. Young, C. S H. (1995) Homologous recombinatton m the replicative cycle of adenoviruses and its relationship to DNA replication. Curr. Topics Mcroblol Immunol. 199/11, 89-108
15. Park, M. S., Ludwig, D. L , Stigger, E., and Lee, S. H. (1996) Physical mteraction between human RAD52 and RPA is required for homologous recombination m mammalian cells. J Blol. Chem. 271, 18,99619,000.
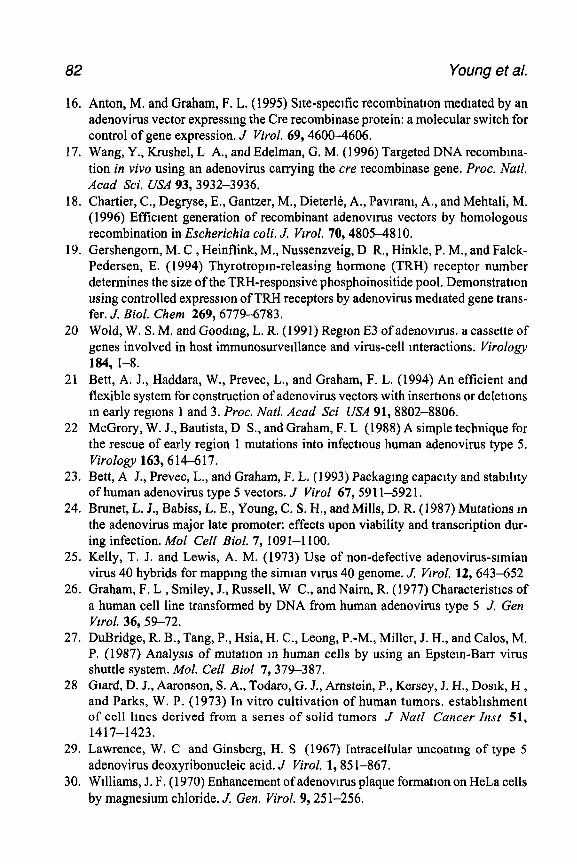
82 Young et al.
16. Anton, M. and Graham, F. L. (1995) Site-specific recombination medlated by an adenovirus vector expressing the Cre recombinase protein: a molecular switch for control of gene expression. J Virol. 69,4600-4606.
17. Wang, Y., Krushel, L A., and Edelman, G. M. (1996) Targeted DNA recombma- tion in vivo using an adenovirus carrying the cre recombinase gene. Proc. Natl. Acad Sci. USA 93,3932-3936,
18. Chartier, C., Degryse, E., Gantzer, M., Dieterlk, A., Pavtram, A., and Mehtali, M. (1996) Efficient generation of recombinant adenovlrus vectors by homologous recombination in Escherichia coli. J. Vzrol. 70,4805-48 10.
19. Gershengorn, M. C , Heinflink, M., Nussenzveig, D R., Hinkle, P. M., and Falck- Pedersen, E. (1994) Thyrotropm-releasing hormone (TRH) receptor number determines the size of the TRH-responsive phosphoinositide pool. Demonstration using controlled expresslon of TRH receptors by adenovirus mediated gene trans- fer. J. Biol. Chem 269, 67796783.
20 Weld, W. S. M. and Goodmg, L. R. (1991) Region E3 of adenovlrus. a cassette of genes involved in host immunosurvelllance and virus-cell interactions. ViroZogy 184, 1-8.
21 Bett, A. J., Haddara, W., Prevec, L., and Graham, F. L. (1994) An efficient and flexible system for construction of adenovirus vectors with insertions or deletions m early regions 1 and 3. Proc. Natl. Acad Sci USA 91,8802-8806.
22 McGrory, W. J., Bautista, D S., and Graham, F. L (1988) A simple technique for the rescue of early region 1 mutations into infectious human adenovirus type 5. Virology 163,614-617.
23. Bett, A J., Prevec, L., and Graham, F. L. (1993) Packaging capacity and stability of human adenovirus type 5 vectors. J Virol 67,59 1 l-592 1.
24. Brunet, L. J., Babiss, L. E., Young, C. S. H., and Mills, D. R. (1987) Mutations m the adenovirus major late promoter: effects upon viability and transcription dur- ing infection. Mol Cell Bioi. 7, 1091-l 100.
25. Kelly, T. J. and Lewis, A. M. (1973) Use of non-defective adenovirus-simian virus 40 hybrids for mapping the simian virus 40 genome. J. Vwol. 12, 643-652
26. Graham, F. L , Smiley, J., Russell, W C., and Nairn, R. (1977) Characteristics of a human cell line transformed by DNA from human adenovirus type 5 J. Gen Vzrol. 36,59-72.
27. DuBridge, R. B., Tang, P., Hsia, H. C., Leong, P.-M., Miller, J. H., and Calos, M. P. (1987) Analysis of mutation m human cells by using an Epstein-Barr virus shuttle system. Mol. Cell Biol 7, 379-387.
28 Glard, D. J., Aaronson, S. A., Todaro, G. J., Arnstein, P., Kersey, J. H,, Doslk, H , and Parks, W. P. (1973) In vitro cultivation of human tumors. establishment of cell lmes derived from a series of solid tumors J Nat/ Cancer lnst 51, 1417-1423.
29. Lawrence, W. C and Ginsberg, H. S (1967) Intracellular uncoatmg of type 5 adenovirus deoxyribonucleic acid. J Virol. 1,85 l-867.
30. Williams, J. F. (1970) Enhancement of adenovlrus plaque formation on HeLa cells by magnesium chloride. J, Gen. Virol. 9,25 1-256.
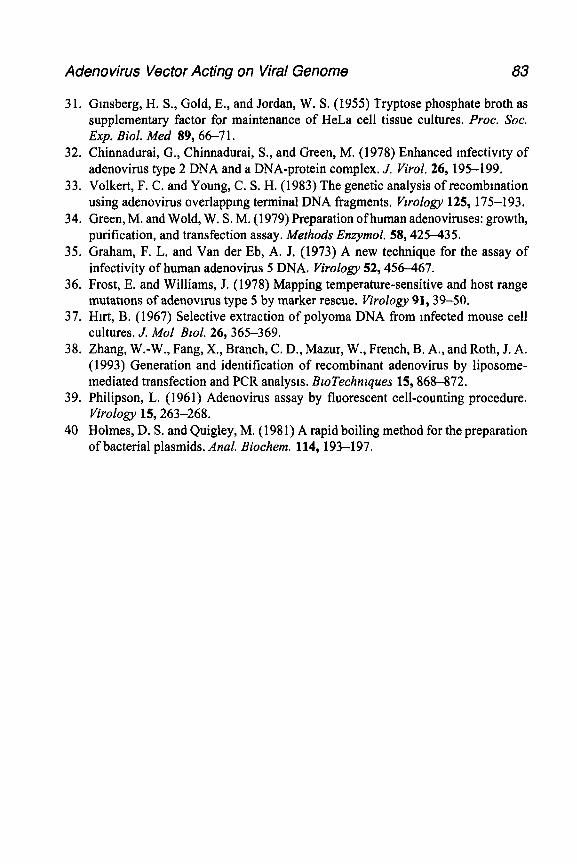
Adenovirus Vector Acting on Viral Genome 83
3 1. Ginsberg, H. S., Gold, E., and Jordan, W. S. (1955) Tryptose phosphate broth as supplementary factor for maintenance of HeLa cell tissue cultures. Proc. Sot. Exp. Biol. Med 89,66-71.
32. Chinnadurai, G., Chinnadurai, S., and Green, M. (1978) Enhanced mfectivrty of adenovirus type 2 DNA and a DNA-protein complex. J. Virol. 26, 195-199.
33. Volkert, F. C. and Young, C. S. H. (1983) The genetic analysis of recombmation using adenovirus overlappmg terminal DNA fragments. Gology 125, 175-l 93.
34. Green, M. and Wold, W. S. M. (1979) Preparation of human adenoviruses: growth, purification, and transfection assay. Methods Enzymol. 58,425-435.
35. Graham, F. L. and Van der Eb, A. J. (1973) A new technique for the assay of infectivity of human adenovirus 5 DNA. Virology 52,456-467.
36. Frost, E. and Williams, J. (1978) Mapping temperature-sensitive and host range mutattons of adenovuus type 5 by marker rescue. Virology 91,39-50.
37. Hut, B. (1967) Selective extraction of polyoma DNA from infected mouse cell cultures. J. Mol Bzol. 26, 365-369.
38. Zhang, W.-W., Fang, X., Branch, C. D., Mazur, W., French, B. A., and Roth, J. A. (1993) Generation and identification of recombinant adenovirus by liposome- mediated transfection and PCR analysts, BloTechnzques 15,868-872.
39. Philipson, L. (1961) Adenovirus assay by fluorescent cell-counting procedure. Virology 15,263-268.
40 Holmes, D. S. and Quigley, M. (198 1) A rapid boiling method for the preparation of bacterial plasmids. Anal. Biochem. 114, 193-197.

7
Construction of Mouse AdenovirusType 1 Mutants
Angela N. Cauthen and Katherine R. Spindler
1. Introduction Construction of mouse adenovirus type 1 (MAV-1) mutants is facilitating
studies of adenoviral pathogenesis in the natural host. We have isolated the first site-directed viral mutants of MAV-1, and we are comparmg effects of wild-type (wt) and these mutant viruses in infections of mice (Smith et al., submitted; Ying et al., submitted; refs. I and 2). The mutants have lesions m viral genes early region 1 (El) or 3 (E3), and have altered lethality in adult mice.
Wild-type MAV-1 causes acute and persistent infections in mice (3-6). Wild-type and mutant MAV-1 can be propagated in cell lines and primary mouse cells in vitro. MAV-1 is the better-characterized of the two known mouse adenovirus serotypes. It causes a fatal disease in newborns or adult nude or SCID mice when inoculated intraperitoneally, intracerebrally, or intrana- sally (4,5,7). Infection of adult mice with high dosages of MAV-1 results in death for all of the animals (6,8,9). Virus is disseminated throughout many organs and found at the highest levels in the spleen and brain (3,6). We and others documented a previously unreported acute central nervous system dis- ease in outbred and inbred mice, in which brains and spinal cords exhibited encephalomyelitis (6,9).
MAV-1 has a genome organization like that of the human adenoviruses: There is a set of genes transcribed early after infection, and a set of late genes transcribed after the onset of viral DNA replication (5,1&15). The DNA genome of MAV- 1 is 30,946 bp, and a terminal protein is covalently attached to the 5’ end of each strand (1617). The genome sequence of MAV-1 is complete and has been published (5,10, II, 13,14,18-22~). The MAV- 1 genome has inverted terminal repeats of 93 bp which serve as the replication origins (17). The El A region encodes only one mRNA and one protein, which corre-
From Methods fn Molecular Medrcme, Vol 27 Adenovrrus Methods and Protocols Edlted by W S M Weld 0 Humana Press Inc , Totowa, NJ
85
86 Cauthen and Spindler
sponds to the 289-amino acid El A protein of adenovirus type 2 (Ad2) (11). The EIB, E2A, and late-structural genes are predicted to encode protems similar to the human adenoviruses, whereas E3 and E4 proteins have little or no similarity to their human adenovirus counterparts (5,10,13,14,18-22). No evidence for a virus-associated (VA) RNA has been found (Cauthen and Spindler, unpublished). The morphology of MAV- 1 virions is like that of other adenoviruses, with an icosahedral shell of 74 nm and fiber projections 29 nm in length (23). Unlike the human adenoviruses, MAV-1 does not have direct or indirect hemagglutinatmg activity (23,241.
The method described here for constructing mouse adenovirus mutants relies on the ability of MAV-1 to undergo homologous recombmation in mouse cells and is largely based on methods used to make human adenovirus mutants (25-2 7). In the first section we describe the preparation of MAV- 1 DNA-pro- tein complex. Preparation of stocks of MAV-1 is slightly different because MAV- 1 is released into the media and does not stay associated with cell debris (Spindler, unpublished; ref. 23). Thus the virus stock is first concentrated using PEG (28) and then purified in CsCl gradients (29). DNA-protein complex is prepared from the virus (30) and then digested with EcoRI. To increase the probability of obtaining recombinant viruses relative to wt viruses, we added a restriction digest/Klenow fill-m step to the preparation of DNA-protein com- plex prior to transfection (1,2). We also describe the preparation of MAV-1 viral DNA (see Note 6).
In the second section we describe the transfection protocol. We have success- fully used mouse 3T6 cells to obtain mutants. In some cases we have also used 3T6 cell derivatives that inducibly express the gene region to be mutated (Cauthen and Spindler, unpublished; ref. 2). We use a calcium phosphate transfection proto- col modified from that of Gorman et al. (311, but other methods may be used. Any of a variety of methods can be used to obtain the mutation in a plasmid containing the gene of interest, including oligonucleotide-directed mutagenesis, PCR mutagenesis, and restriction fragment replacement cloning.
In the third section we describe the identification and plaque purification of mutants. We have used preparation of viral DNA directly from plaques, from cell-culture fluid, and by the Hirt method (32) for use m PCR. We have also used DNA prepared by the Hirt method for direct restriction enzyme analysis of potential mutants. In the final sections we describe the preparation of MAV- 1 viral stocks, and our plaque assay protocol.
2. Materials 1. 5MNaCl. 2. 50% Polyethylene glycol (PEG8000, Sigma, St. Louis, MO, cat. no. P-2139):
Weigh out 250 g of PEG and add water to 500 mL. Stir until dissolved, and
Construction of MA V- 1 Mutants 87
autoclave. Mix while cooling to prevent precipitation of the PEG. Store at room temperature.
3. 1 MTris-HCl, pH 8.0. Autoclave and store at room temperature. 4. 13-mL Ultracentrifuge tubes (Seton [Sunnyvale, CA] cat. no. 7030). 5. 1 A4 Tris-HCl, pH 7.4. Autoclave and store at room temperature. 6. CsCl p = 1.2 g/cm 3 = 22.49%: 26.99 g/100 mL of 50 mMTris-HCl, pH 7.4. Store
at room temperature. 7. CsCl p = 1.4 g/cm3 = 38.60%: 54.04 g/100 mL of 50 mMTris-HCl, pH 7.4. Store
at room temperature. 8. Gradient dripper. 9. Peristaltic pump.
10. Gradient maker (lo-mL capacity for each chamber). 11. 12,000-14,000 Molecular-weight exclusion-dialysis tubing. Store in 10 mM
EDTA at 4°C. 12. 15-mL Conical polypropylene tubes. 13. 0.5 M EDTA, pH 8.0. Autoclave and store at room temperature. 14. 8 M Guanidine HCl. Store at room temperature. 15. Optical-grade CsCl (Pharmacia, Uppsala, Sweden, cat. no. 17-0845-02). 16. 1.5-mL Microfuge tubes. 17. TE: 10 mM Tris-HCl, pH 8.0, 1 mM EDTA, pH 8.0. Store at room temperature. 18. EcoRI (20 II/@.,). 19. 10X EcoRI buffer: 1 M NaCI, 0.5 A4 Tris-HCI, pH 7.5, 0.1 A4 MgCIZ, 10 mM
DTT. Add DTT before using. Store at room temperature. 20. 100 miVDTT. Store at -2O’C. 2 1. Klenow polymerase (5 U/pL). Store at -2OOC. 22. 10 mMdATP in 10 miVTris-HCl, pH 7.5. Store at-2O’C. 23. 1 pg/pL Sheared salmon-sperm DNA (33). Store at -2OV. 24 Mouse 3T6 cells (American Type Culture Collection, Rockville, MD). 25. 100X glutamine: 29 g L-glutamine in 1 L of water. Filter sterilize and ahquot.
Store at -20°C for long term or 4OC while in use. 26. 100X pen/strep: 10 g streptomycin, 6.06 g penicillin ( 10,000 U; 1 X = 100 U/mL)
in 1 L of water. Filter sterilize and aliquot. Store at -2OOC for long term or 4OC while in use.
27. 1X DMEM (Gibco-BRL, Gaithersburg, MD, cat. no. 12100-012): Make according to manufacturer’s directions. Stir for at least 4 h. Add pen/strep to 1X and pH to 7.2 with HCl. Filter sterilize through 0.2~pm filter and place one bottle at 37OC overnight to check for contamination. Add glutamine every 2 wk to 1X. Store at 4°C.
28. 60-mm Polystyrene tissue-culture plates (Corning, Coming, NY, cat. no. 25010). 29. Heat-inactivated calf serum (HICS): Thaw if frozen. Heat at 57’C for 1 h.
Store at 4’C. 30. Newborn calf serum (NBCS) Store at 4OC if in use or at -2O’C for long-term storage. 3 1. Glycerol. 32. 2X HEBS, pH 7.03 f 0.05: Per 200 mL add 3.2 g NaCl, 0.148 g KCl, 0.04 g
Na,HP04, 0.4 g n-glucose, and 2 g HEPES to water. pH with NaOH and
88 Cauthen and Spindler
filter-sterilize, Store long term at -7O’C m lo-mL aliquots. Store at 4°C while in use.
33. 1X HEBS. Use same quantities as for 2X HEBS (step 32) but make up to 400 mL.
34. 20X PBS: For 1 L add 4 g KCl, 4 g KH,PO,, 160 g NaCl, 22.8 g Na,HPO, to water. Autoclave and store at room temperature (PH will be 7 2 when diluted to 1X).
35. 2.5 A4 CaCl,. Filter sterilize and store at room temperature. 36. Sterile water. 37. Polystyrene tubes (Falcon, Los Angeles, CA, 2054). 38. 1-mL Disposable polystyrene cotton-plugged pipets. 39. Stopwatch. 40. Cotton-plugged, sterile Pasteur pipets. 41. 4.5% NP40/4.5% Tween-20. Store at room temperature. 42. Protemase K (10 mg/mL): Resuspend 10 mg in 1 mL TE and dtgest for 15-30 mm
at 37’C. Store at -20°C. 43. 95% Ethanol. 44. 3 MNaOAc, pH 6.0. pH with acetic acid and autoclave or filter sterilize Store at
room temperature. 45. 24-well Polystyrene tissue-culture plates (Corning cat. no. 25820). 46. Rubber policeman. 47. 13-mL Polypropylene tubes with caps (Sarstedt [Newton, NC] cat. nos. 55.518
and 65.793). 48. Hirt solution 1: 10 mMTris-HCl, pH 7.0,lO mMEDTA. Store at room temperature. 49. Hirt solution 2. 10 mM Tris-HCl, pH 7.0, 10 mM EDTA, 1.2% SDS, 2 mg/mL
pronase added fresh before using. Store at room temperature. 50. 10% SDS: Do not autoclave. Make with sterile water. Store at room temperature. 51. Pronase (20 mg/mL): Prepare in water and incubate at 37’C for 2 h. Store in
aliquots at -20°C. 52. 4mLPolypropylenetubeswithcaps(Sarstedt[Newton, CA] cat. nos. 55.532 and65.809). 53. 10X TBE: 108 g Tris base, 55 g boric acid, 4 mL 0.5 MEDTA, pH 8.0 per liter. 54. 0.7% Agarose in 1X TBE for gel electrophoresis. 55. 10X Tag polymerase buffer: 500 r&fKCl, 100 mMTris-HCl, pH 9.0, 1% Trtton
X- 100. Store at -20°C. 56. 25 mMMgCl*: Use for PCR only and store at -20°C. 57. PCR primers: 250 ng/pL stocks of each. Store at -2OOC. 58. Tuq polymerase (5 U&L). Store at -20°C. 59. 10 mM dNTPs: Make stock in water from ultrapure dNTPs (Pharmacia cat no.
27-2035-01). Store at -20°C. 60. PCR tubes. 61. 7% Native polyacrylamide gel: 5 mL 10X TBE, 11.67 mL 30:0.8 acrylamide,
33.1 mL water. Mix by swirling and add 300 pL of 10% ammonium persulfate and 30 pL TEMED. Mix and cast immediately.
62. Ethidium bromide (10 mg/mL): Dissolve in water and stir overnight in a con- tainer covered with foil. Store at room temperature wrapped in foil.
Construction of MA V- 1 Mutants 89
63. Wizard DNA Clean-up Kit (Promega, Madison, WI, cat. no. 47280). Store at room temperature.
64. fmol Sequencing Kit (Promega cat. no. 44110). Store at -20°C 65. ym3*P dATP 3000 Ct/mmol. Store at -20°C. 66. 8% Urea, 6% polyacrylamide gel: 5 mL 10X TBE, 7.5 mL 38:2 acrylamide, 18.3 mL
water, and 24 g urea. Stir for at least 15 min. Add 300 pL of 10% ammonium persulfate and 20 pL of TEMED and cast immediately.
67. Sequencing gel fix: 10% methanol/lo% acetic acid. Store at room temperature in a brown bottle.
68. 35-mm Polystyrene tissue-culture plates (Corning cat. nos. 25000-35 or 258 10). 69. loo-mm Polystyrene tissue-culture plates (Corning cat. no. 25020). 70. 150~mm Polystyrene tissue-culture plates (Corning cat. no. 25030- 150). 71. Small glass test tubes with caps. 72. 1 2% Agarose: Weigh agarose (low EEO), add water, and autoclave. Store at
room temperature. 73. 2X DMEM. For 2 L add 53.5 g DMEM powder (Gibco-BRL cat. no. 12 lOO-012),
14.8 g NaHCO,. Star for at least 4 h and pH to 7.2 with HCl. Brmg volume to 1700 mL. Filter sterilize with 0.2-p filter to 425-mL aliquots. Incubate one bottle at 37°C overnight to check for contamination. Per 425 mL of 2X DMEM, add 10 mL 100X glutamine, 10 mL 100X pen/strep, 10 mL 100X nonessential ammo acids, 25 mL 1 MMgCl,, and 20 mL HICS. When these components are added, the solution IS 2X. Add glutamine to 2X every 2 wk. Store at 4OC. Do not use if >2 mo old.
74. 100X Nonessential amino actds (Gibco-BRL cat. no. 11140-019). 75. 1 M MgC12. Autoclave and store at room temperature. Use only for cell culture. 76. 100X Neutral red: 1% neutral red in water. Filter through Whatman no. 1, boll,
then through 0.2~pm filter. Store at room temperature. 77 TE-equilibrated phenol (33) 78. Chloroform 79. Oligonucleotide-directed mutagenesis kit (Amersham, Arlington Heights, IL, or
Stratagene). 80. Plugged pipet tips. 8 1. StrataClean resin (Stratagene).
3. Methods 3.1. Preparation of DNA-Protein Complex
3.1-I. Collecting Virus
1. Obtain a 1 -L (approx forty 150~mm plates) fresh virus stock of MAV- 1 (see Sub- heading 3.4.). To make mutants in the ElA or E3 regtons, use wild-type variants pmE301 or pmE 10 1, respectively (see Note 1).
2. Pour the vnus stock into a I-L graduated cylinder to determine the volume. Spht the volume equally into two 1-L centrifuge bottles.
3. Add NaCl to 0.5 Musing a 5 MNaCl stock (see Note 2).
90 Cauthen and Spindler
4. Add 50% polyethylene glycol (PEG) to a final concentratron of 8% based on the volume including the NaCl added in step 3.
5. Mix gently by inversion and incubate overnight on ice at 4°C. 6. Pellet virus by centrifugation at 2200g for 20 min at 4°C. It will be a white film
that covers the bottom of the bottle. 7. Pour off the supematant and discard after treating with bleach. 8. Add 6 mL of 10 mA4Tris-HCl, pH 8.0, to each 1-L centrifuge bottle and gently
resuspend by pipetting up and down. (Residual media will be present in each bottle.) Incubate at 4’C for 30 min to overnight. Load onto CsCl step gradients
3.1.2. Making a CsCl Step Gradient 1. Add 3 5 mL of 1.4 g/cm3 CsCl to a 13-mL ultracentnfuge tube. 2. Use a 5-mL pipet to draw up approx 5 mL of 1.2 g/cm3 CsCl, remove the bulb
from the end of the prpet, and quickly cover with a gloveless hand, which allows for greater control of the rate of flow. Release the liquid mto the stock container until 3.5 mL remains in the pipet.
3 Slowly layer the 1.2 g/cm3 CsCl above the 1.4 s/cm3 by dripping it down the side of the tube, holding the pipet close to the existing liquid level and keeping the tube at eye level to observe the formation of a layer between the two solutions. Continue dripping slowly until the gradient is complete. Make four gradients for this procedure (see Note 3)
4. Add up to 5-6 mL of vms (Subheading 3.1.1., step 8) to each step gradient. If necessary add 10 n&f Tris-HCl, pH 8.0, so that the tube is filled to within a few millimeters of the top.
5. Centrifuge the samples m an SW4 1 swinging bucket rotor at 35,000 rpm (2 10,OOOg) for at least 90 min at 4-10°C (see Note 4). The density of adenovirus is 1.33-1.35
6. After centrifbgation, inspect the samples for two white bands. The lower, smaller band is virus and will be collected using a dripper (see Note 5) A black piece of paper behind the tubes will help visualize the bands present after centrifugatlon
7. Place a sample into the dripper and attach the top, making sure that the dripper needle is below the tube holder and will not immediately puncture the tube. Clamp the tubing with a hemostat or set up a peristaltic pump and turn on for a few seconds to put a small amount of positive pressure on the system. Turn the needle until the tube is punctured and the liquid drips out briefly. Release the hemostat and control the flow manually or with the peristaltic pump. Begin to collect the lower white band, which contams virus, as it nears the bottom of the tube. It will appear white or translucent against a black paper background. The remaining material, includmg the upper band, has mcomplete capsids, cellular DNA, and lipids and can be discarded. Repeat for each sample.
8. Dilute each sample with one volume of 10 mMTrts-HCl, pH 8.0, to get p I 1 2 and load onto a linear gradient.
3.1.3. Making a CsCl Linear Gradient 1. Attach l-mm inner-diameter tubing, long enough to be used with a peristaltic
pump, to the outlet valve on the gradient maker, and insert a capillary tube into the free end of the tube. Adjust the flow rate to approx 1 mL/min.
Construction of MA V- 1 Mutants 91
2. Close the outlet valve on the gradient maker and add 5 mL of 1.2 g/cm3 CsCl and a stir bar to the chamber proximal to the outlet valve. Open the valve between the two chambers and allow a small amount of the liquid to flow into the distal cham- ber to remove the air from the valve. Close the valve and pipet the liquid from the distal chamber to the proximal chamber. Add 5 mL of 1.4 g/cm3 CsCl to the distal chamber.
3. Place the tubing into the bottom of a 13-mL ultracentrifuge tube. Start the stirrer, then open both valves and turn on the peristaltic pump simultaneously. Fill the tube from the bottom and monitor the progress of the gradient so that no bubbles are released as the gradient is completed. Gently remove the capillary tube from the solution by sliding it up one wall of the tube so as not to disturb the gradient. Make four to stx gradients for this procedure.
4. Load the diluted virus from Subheading 3.1.2., step 8 to the top of the gradients. As necessary, add 10 mMTris-HCl, pH 8.0, to fill tubes to within a few millime- ters of the top of the tube.
5. Centrifuge at 35,000 rpm (210,OOOg) m an SW41 swinging bucket rotor at 4°C for at least 16 h (see Note 4).
6. In the second gradient a major band should be seen, with possibly a faint band above it Using the dripper as described above, collect the bottom white band, which contains vuus. Discard the rest of the gradient, including the top white band containing mostly cellular debris and top components.
7. Dialyze the samples for 2 h to overnight against 10 mMTris-HCl, pH 8.0, at 4°C m 12,000-14,000 molecular-weight exclusion-dialysis tubing (see Note 6).
8 Place no more than 3.5 mL of sample m a conical polypropylene 15-mL tube with graduations and add the following: 70 pL 1 MTris-HCl, pH 8.0, 14 pL 0 5 M EDTA, 3.5 mL 8 Mguamdme HCl, 3.57 g optical grade CsCl, and dH20 to a final volume of 7 mL (see Note 7).
9. Mtx well by mverston and pour into 13-mL ultracentrifuge tubes. Fill to within a few millimeters of the top with mineral oil.
10. Centrifuge m an SW4 1 swinging bucket rotor at 28,000 rpm (134,000g) for 40 h at 15°C (see Note 4).
11. Using the dripper and the peristaltic pump as described above, fractionate the gradient into 0.5~mL ahquots (approx 20-25 drops per fraction), collecting 15-20 fractions per gradient in capless microfuge tubes.
12. Measure the AX6s of each fraction (dilute fractions in TE if necessary) and plot. Pool the fractions that form the peak.
13. Dialyze in 12,000- 14,000 molecular-weight exclusion-dialysis tubing against 2 L of chtlled TE at 4°C for four changes of at least 4 h each.
14. Measure &s and calculate the concentration using the following formula: Q&,) (50 pg/mL) (dilution factor)/1000 = concentration in pg/pL. The total yield should be 100-200 pg.
15. Store m microfuge tubes in 5- or lo-pg aliquots Freeze quickly in dry ice or liquid nitrogen and store at -70°C.
92 Cauthen and Spindler
3.1.4. Preparing DNA-Protein Complex for Transfection
1. Thaw 5 pg of DNA-protein complex (Subheading 3.1.3., step 15) per transfec- tion sample and digest it with 8 @., ofEcoRI (20 VI&) in a final concentration of 1X ,??coRI buffer containing 1 mMDTT in a final volume of 250 pL. Digest 4 h to overnight at 37°C. (See Subheading 3.2. to determine the number of aliquots of DNA-protein complex needed.)
2. Partially fill in the sticky ends created by the EcoRI using 8 U of Klenow poly- merase and a final concentration of 1 mM dATP. Incubate for 30 mm at 37°C. Stop the reaction by adding EDTA to a final concentration of 25 mA4. Store at -20°C until ready to use
3. Linearize 4 pg of plasmid containing the desired MAV-1 mutation(s) by cuttmg at a unique site within the vector. Store at -2O’C until ready to use (see Note 8).
3.2. Trensfection of Mouse Cells 1. For each transfection, it IS important to include the following controls. As a nega-
ttve control (no. 4, Table l), add only salmon-sperm DNA to the transfectlon mix. As a positive control (no. 3, Table l), transfect undigested complex alone. As a control for background levels of religation of digested, partially filled-m DNA-protein complex (no 2, Table l), include digested, partially filled-in com- plex alone. As a positive control for the plaque assay, set up a plaque assay with a stock of the virus that was used to make the DNA-protein complex
2. One or two days prior to transfectlon, pass mouse 3T6 cells to 60-mm tissue- culture plates in 1X DMEM containing 5% heat-inactivated calf serum (HICS). The cells should be approx 70% confluent at the time of transfection (There will be approx 1 x 10’ mouse 3T6 cells on a loo-mm plate when confluent.) Set up two plates for each transfection that is planned, i.e., two plates for each control listed above and two plates for each mutant (see Note 9).
3. On the day of the transfection, warm the following to 37°C: 3 mL/transfectlon plate of 1X DMEM containing 5% HICS, 5 mL/transfection and plaque assay plate of 1X DMEM containing 2% newborn calf serum (NBCS), 1.5 mL/trans- fection plate of 15% glycerol in 1X DMEM, 1.5 mL/transfection plate of 1X HEBS, pH 7.03 + 0.05, and approx 5 mL per transfectlon plate of 1X PBS (see Note 10).
4. Have the following at room temperature: 0.5 mL per transfection of 2X HEBS, pH 7.03 & 0.05,50 pL per transfection of 2.5 MCaCl,, and up to 500 pL of sterile water per transfection.
5. Thaw the following and store on ice until ready to use: 5 pg of dlgested, filled-m DNA-protem complex per experimental transfectlon and background con- trol, 5 pg of undigested DNA-protein complex per positive control, 4 pg of linearized mutant plasmid per experimental transfection, and salmon-sperm DNA (1 PdcLL).
6. Pipet 0.5 mL of room temperature 2X HEBS, pH 7.03 f 0.05, into a numbered polystyrene tube (Falcon cat. no. 2054) for each pair of plates to be transfected.
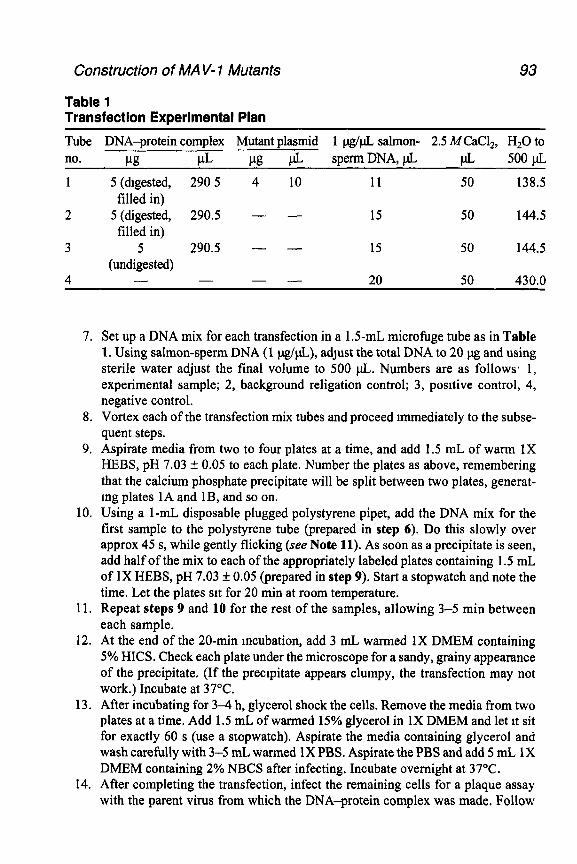
Construction of MAV-1 Mutants 93
Table 1 Transfection Experimental Plan
Tube DNA-protein complex Mutant plasmid 1 pg/pL salmon- 2.5 MCaCI,, Hz0 to no. I43 PL I% clt sperm DNA, pL CiL 500 pL
1 5 (digested, 290 5 4 10 11 50 138.5 filled in)
2 5 (digested, 290.5 - - 15 50 144.5 filled in)
3 5 290.5 - - 15 50 144.5 (undigested)
4 - - - - 20 50 430.0
7. Set up a DNA mix for each transfection in a 1.5-mL microfuge tube as in Table 1. Using salmon-sperm DNA (1 pg/pL), adJust the total DNA to 20 pg and using sterile water adjust the final volume to 500 pL. Numbers are as follows* 1, experimental sample; 2, background religation control; 3, positive control, 4, negative control.
8. Vortex each of the transfection mix tubes and proceed munediately to the subse- quent steps.
9. Aspirate media from two to four plates at a time, and add 1.5 mL of warm 1X HEBS, pH 7.03 f 0.05 to each plate. Number the plates as above, remembering that the calcium phosphate precipitate will be split between two plates, generat- mg plates 1A and lB, and so on.
10. Using a l&L disposable plugged polystyrene pipet, add the DNA mix for the first sample to the polystyrene tube (prepared in step 6). Do this slowly over approx 45 s, while gently flicking (see Note 11). As soon as a precipitate is seen, add half of the mix to each of the appropriately labeled plates containing 1.5 mL of 1X HEBS, pH 7.03 f 0.05 (prepared in step 9). Start a stopwatch and note the time. Let the plates stt for 20 min at room temperature.
11. Repeat steps 9 and 10 for the rest of the samples, allowing 3-5 min between each sample.
12. At the end of the 20-min incubation, add 3 mL warmed 1X DMEM containing 5% HICS. Check each plate under the microscope for a sandy, grainy appearance of the precipitate. (If the precipitate appears clumpy, the transfection may not work.) Incubate at 37°C.
13. After incubating for 3-4 h, glycerol shock the cells. Remove the media from two plates at a time. Add 1.5 mL of warmed 15% glycerol in 1X DMEM and let it sit for exactly 60 s (use a stopwatch). Aspirate the media containing glycerol and wash carefully with 3-5 mL warmed 1X PBS. Aspirate the PBS and add 5 mL 1X DMEM containing 2% NBCS after infecting. Incubate overnight at 37°C.
14. After completing the transfection, infect the remaining cells for a plaque assay with the parent virus from which the DNA-protein complex was made. Follow
94 Cauthen and Spindler
the directions in Subheading 3.5. to infect the cells for a plaque assay, but instead of overlaying with agarose, add 5 ml/plate of 1X DMEM containing 2% NBCS. Incubate overnight at 37’C.
15. The next day, aspirate the media from one set of the transfection plates from step 13 (i.e., lA, 2A, and so on) and overlay with 5 mL of media/agarose as in Sub- heading 3.5. Change the media on the duplicate plates (lB, 2B, and so on) to fresh 1X DMEM containing 5% HICS. Overlay all of the plates for the virus infection (plaque assay control) from step 14. Follow the directions for overlay- ing and checking for plaques as m Subheading 3.5.
3.3. Isolation and Identification of Mutants
3.3.1. Picking Plaques and Extracting Viral DNA
1. After plaques have formed on the experimental plates, circle plaques, using an ethanol-soluble marker, and use a plugged Pasteur pipet to pick each of the plaques from the experimental plates first. Then pick one to two plaques from the positive-control plate or the background plate. Pipet the agarose plug mto 0.5 mL 1X PBS. Vortex the samples to break up the agarose and distribute the virus. In all the following steps be careful not to crosscontammate samples smce they will be used in a PCR assay (see Note 12).
2. Using a plugged pipet tip, aliquot l/4 to l/2 of each of the plaque-containing solutions to PCR clean 1.5-mL microfuge tubes. Freeze the remammg por- tions at -2OOC.
3. Add approx 20 ng of puntied MAV- 1 DNA (see Note 6) to a 1.5-mL microfuge tube as a control for the DNA extraction procedure.
4. To extract the DNA from the plaque solution, add 0.1 vol 4.5% NP40/4.5% Tween-20 and 250 pg/mL proteinase K. Digest at 55°C for 1 h. Incubate at 95°C for 10 min to inactivate the proteinase K.
5. Ethanol precipitate the DNA by adding 0.1 volume of 3 M NaOAc, pH 6.0, and 2.5 volumes of 95% ethanol. Incubate on ice or at -2O*C for 15 min. Centrifuge for 15 min at 4’C or room temperature. Discard the supernatant and air dry the pellet. (A pellet may or may not be visible.)
6. Resuspend the pellet m 10 pL of sterile water and use l-5 pL in a PCR reaction.
3.3.2. Hit-t Method for Obtaining Viral DNA from Plaques (32) (see Note 13)
1. Infect one well of a 24-well plate using l/4 to l/2 of each of the solutions derived from a plaque. Follow the protocol found in Subheading 3.4.1.
2. Monitor the cells daily for cytopathic effect (CPE) (see Note 14). Harvest the cells when CPE is visible by scraping the cells in the media using a rubber police- man. Freeze-thaw the stock three times and centrifuge to remove the cellular debris. Use this stock to infect one to two 60-mm plates of mouse 3T6 cells that are 7580% confluent. When early signs of CPE are evident, such as a slight rounding of cells and some refractile cells (approx 48 h postinfection), wash the
Construction of MA V- 1 Mutants 95
monolayer once with IX PBS. Scrape cells with a rubber pohcman in 1X PBS and transfer the solution to a 13-mL polypropylene tube. Centrifuge at 200& 3000g for 10 min at 4°C.
3. Aspirate the supernatant without disturbing the cell pellet. (The cell pellets can be frozen at -2OOC if necessary.)
4. Resuspend each pellet in 0.5 mL Hirt solution 1 and vortex very gently to resus- pend the cells.
5. While gently vortexing, add 0.5 mL Hirt solution 2 to which 0.1 volume of 20 mg/mL pronase has been added.
6. Cap the tubes and incubate at 37°C for 2 h. 7. Add 0.25 mL of 5 M NaCl to each sample and flick the bottom of each tube to
mix. Incubate overnight on ice at 4°C 8. Centrifuge at 17,000g for 45 min at 4OC. 9 Transfer supematant to a 4-mL polypropylene tube and extract twice with an
equal volume of phenol. 10. Add 2 5 volumes of ethanol to each tube and incubate on ice or at -2OOC for 15 min.
Centrifuge at 10,OOOg for 15 min at 4OC. Discard the supematant. (No salt is needed to precipitate the DNA since the supematant contains 1 M NaCI.)
11. Resuspend pellet m 0.3 M NaOAc, pH 6.0, and transfer to a 1.5-mL microfuge tube. Add 1 mL 95% ethanol to tube and precipitate as above.
12. Wash pellet with 1 mL 70% ethanol and centrifuge for 5 min. 13. Air-dry the pellet and resuspend m 50 pL of water or TE. 14. Use l-5 $ in PCR or 10 @+ per restriction enzyme digest and electrophorese on
a 0.7% agarose gel. If usmg m a restriction digest, also add 1 pg RNase per sample. Include appropriate control DNA samples in analysis.
3.3.3. PCR Amplification of Potential Mutants
1. The following PCR reaction components can be used to amplify DNA obtained in Subheading 3.3.1. or 3.3.2. PCR reactions should be set up with the appropriate positive and negative controls. Standard PCR conditions include 1X Tuq polymerase buffer, 1 mMMgCl,, 0.2 mMdNTPs, 250 ng of each primer, 1 U of Taq polymerase, l-5 pL of viral template from Subheading 3.3.1. or 3.3.2. in a volume of 25 pL. 0. l-l .O ng of MAV-1 DNA or 0. l-l .O ng of the plasmid containing the wild-type DNA sequence or the mutation of interest can be used as a positive control.
2 Use the following PCR conditions for machines that accommodate thin-wall 0.2~mL tubes. Denature at 94°C for 2 min. Repeat the following program for 40 cycles: denature for 15 s at 94”C, anneal for 15 s at 44’C, and extend for 45 s at 72’C. Finally, extend at 72°C for 3 min followed by 4°C indefinitely. (If using a machine that accommodates 0.5~mL tubes, the times for each step may need to be adjusted.)
3.3.4. Analysis of the PCR Products for Potential Mutants
1. Once the PCR amplification has been completed, the mutants can be screened directly by electrophoresis, by restriction digestion and electrophoresis, or by sequencmg.
96 Cauthen and Spindler
2. If the mutation results in a stgnificantly smaller PCR product than that of wlld- type (Le., the mutation 1s a deletion), the completed PCR reactions may be sim- ply electrophoresed on a 7% native polyacrylamlde gel after loading dye has been added (5% glycerol final concentration) (1). Electrophorese at 200 V for 2 h. Stain with ethidium bromide for 1 O-20 min and destain with water for 1 O-20 mm. View and photograph on a UV transilluminator.
3. If a restriction site that is unique to the PCR product has been incorporated mto the mutation, the PCR product can be digested with the appropriate enzyme to determine if the DNA 1s mutated (1). In this case, aliquot half of each completed PCR reaction to mrcrofuge tubes and digest with the appropriate enzyme. Elec- trophorese the undigested and digested samples using electrophoresis and detec- tion conditions as above.
4. Point mutations may also be screened using differential PCR (2). In this case, two primers are designed that will differentially amplify the wild-type and mutant DNAs. This can be accomplished by havmg the 3’ nucleotlde in each oligonucleotide correspond to the wild-type or mutant sequence. The PCR con- ditions to differentially amplify mutant and wild-type products will have to be empirically determined. To do this, try varying the Mg’* concentration and/or the annealing temperature. The PCR products are then electrophoresed and detected as described.
5. If the mutation does not meet the above criteria, the PCR product can be sequenced. After the PCR reaction 1s complete, remove the excess primers usmg the Wizard DNA Clean-up Kit (Promega). Analyze 5-10 & of the cleaned PCR product by electrophoresls to ensure that the primers have been removed and that the expected PCR product was produced. Use 5 pL of the purified PCR product as template in sequencing reactions, following the directions given m Promega’s fmol Sequencing Kit. The best results are obtained using end-labeled 32P-oligo- nucleotides as the sequencing primers. Using the bromophenol blue and xylene cyan01 dyes as markers for oligonucleotide migration, electrophorese the sequencing reactions on an 8% urea, 6% polyacrylamide gel until the area of interest is in a readable position on the gel. Fix the gel in 10% methanol/lo% acetic acid for 30-45 min and rinse in water briefly. Dry on a gel dryer and expose to film overnight. Read the film after exposure to determine if the desired mutations have been incorporated mto the viral DNA.
3.3.5. Purification of Mutant Plaques
1. Once the mutations of interest have been identified by one of the methods in Subheading 3.3.4., the mutant virus should be plaque purified to ensure that the virus stock is not contaminated with wild-type virus.
2. To plaque purify the mutants, set up one to two 60-mm plates of mouse 3T6 cells (see Subheading 3.2., step 2) per mutant that was obtained in the above screen The cells should be approx 70% confluent at the time of infection.
3. Aspirate media from the cells and infect with 0.125-0.25 rnL. of the solution of VXI.IS derived from a plaque (from Subheading 3.3.1., step 2). Incubate for 1 h at
Construction of MA V- 1 Mutants 97
37°C. Following incubation, overlay with 5 mL of media/agarose and maintain for 10-14 d as described in Subheading 3.5.
4. When plaques appear, pick (10 per plate if available) and screen them as before. 5. Choose a plaque from each plate that appears to be free of most of the back-
ground wild-type virus and repeat the plaque purification procedure. If after this third round of plaque purification there is still some contamination by wild-type virus, repeat the purification again. If not, prepare a virus stock of the mutants from the most purified plaque (see Subheading 3.4.).
3.4. Preparation of Virus Stocks
3.4.1. Making a Virus Stock from a Plaque
1. Set up one to two wells (24-well plate) of mouse 3T6 cells per purified mutant plaque so that they will be 75--80% confluent at the time of infection.
2. When the cells are ready, infect one or two wells per mutant by adding l/4 to l/2 of the purified plaque stock (see Note 15). Incubate at 37°C for 1 h and add approx 1 mL of prewarmed 1X DMEM containing 1% HICS. Monitor for CPE (see Note 14).
3. When the cells have significant CPE or have been infected for 10-14 d, harvest them by scraping the cells into the media with a rubber policeman (see Note 16). Freezethaw the virus three times, then centrifuge 5 min at 2200g to remove the cellular debris. Store the virus at -70°C.
4. Using the newly obtained virus stocks and following the directions given above, infect one 35 mm plate of 75-80% confluent mouse 3T6 cells per mutant (see Note 17). Harvest as above and repeat using the new virus stock to infect the next larger plate of cells (35 mm + 60 mm + 100 mm + 150 mm). Since the titer of the virus stocks is unknown, estimate the amount of virus needed. As a starting point, use approx 0.5-l mL to infect 35-mm plates, 1 mL to infect 60-mm plates, 2 mL to infect 1 00-mm plates, and 3 mL to infect 150~mm plates. (Two 150~mm plates of cells will need to be infected if a large virus stock of greater than 200 mL is to be generated.)
3.4.2. Making a Large Virus Stock
1. Set up ten 150~mm plates of 3T6 cells per mutant so that they are 75-80% confluent at the time of infection,
2. Aspirate the media from each plate and add approx 3 mL of mutant virus per plate. Rock the plates to ensure that all the cells are covered by the liquid. Incu- bate at 37’C for 1 h, then add 22 mL of warmed 1X DMEM containing 1% HICS. Monitor the cells for CPE and harvest when most of the cells are dead and detached from the plate. Harvest the virus by collecting the media and spinning out the cells or by scraping the cells into the media, freeze-thawing three times and centrifuging to remove the cellular debris (see Note 16). Aliquot approx 1 mL of each mutant stock to a tube to use in a plaque assay. Store the remainder at -70°C in a large volume or as smaller aliquots for easy thawing upon use.
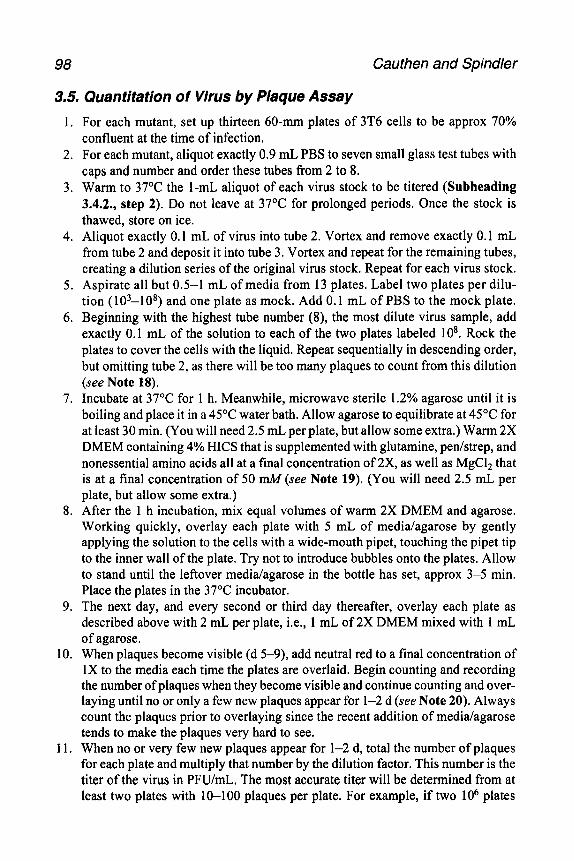
98 Cauthen and Spindler
3.5. Quantitation of Virus by Plaque Assay
1. For each mutant, set up thirteen 60-mm plates of 3T6 cells to be approx 70% confluent at the time of infection.
2. For each mutant, aliquot exactly 0.9 mL PBS to seven small glass test tubes with caps and number and order these tubes from 2 to 8.
3. Warm to 37°C the I-mL aliquot of each virus stock to be titered (Subheading 3.4.2., step 2). Do not leave at 37’C for prolonged periods. Once the stock is thawed, store on ice.
4. Aliquot exactly 0.1 mL of virus into tube 2. Vortex and remove exactly 0.1 mL from tube 2 and deposit it into tube 3. Vortex and repeat for the remaining tubes, creating a dilution series of the original virus stock. Repeat for each virus stock.
5. Aspirate all but 0.5-l mL of media from 13 plates. Label two plates per dilu- tion ( 103-108) and one plate as mock. Add 0.1 mL of PBS to the mock plate.
6. Beginning with the highest tube number (8), the most dilute virus sample, add exactly 0.1 mL of the solution to each of the two plates labeled 108. Rock the plates to cover the cells with the liquid. Repeat sequentially in descending order, but omitting tube 2, as there will be too many plaques to count from this dilution (see Note 18).
7. Incubate at 37°C for 1 h. Meanwhile, microwave sterile 1.2% agarose until it is boiling and place it in a 45°C water bath. Allow agarose to equilibrate at 45°C for at least 30 min. (You will need 2.5 mL per plate, but allow some extra.) Warm 2X DMEM containing 4% HICS that is supplemented with glutamine, pen/strep, and nonessential amino acids all at a final concentration of 2X, as well as MgC12 that is at a final concentration of 50 mM (see Note 19). (You will need 2.5 mL per plate, but allow some extra.)
8. After the 1 h incubation, mix equal volumes of warm 2X DMEM and agarose. Working quickly, overlay each plate with 5 mL of medialagarose by gently applying the solution to the cells with a wide-mouth pipet, touching the pipet tip to the inner wall of the plate. Try not to introduce bubbles onto the plates. Allow to stand until the leftover media/agarose in the bottle has set, approx 3-5 min. Place the plates in the 37’C incubator.
9. The next day, and every second or third day thereafter, overlay each plate as described above with 2 mL per plate, i.e., 1 mL of 2X DMEM mixed with 1 mL of agarose.
10. When plaques become visible (d 5-9), add neutral red to a final concentration of 1X to the media each time the plates are overlaid. Begin counting and recording the number of plaques when they become visible and continue counting and over- laying until no or only a few new plaques appear for l-2 d (see Note 20). Always count the plaques prior to overlaying since the recent addition of media/agarose tends to make the plaques very hard to see.
11. When no or very few new plaques appear for l-2 d, total the number of plaques for each plate and multiply that number by the dilution factor. This number is the titer of the virus in PFU/mL. The most accurate titer will be determined from at least two plates with 10-100 plaques per plate. For example, if two lo6 plates
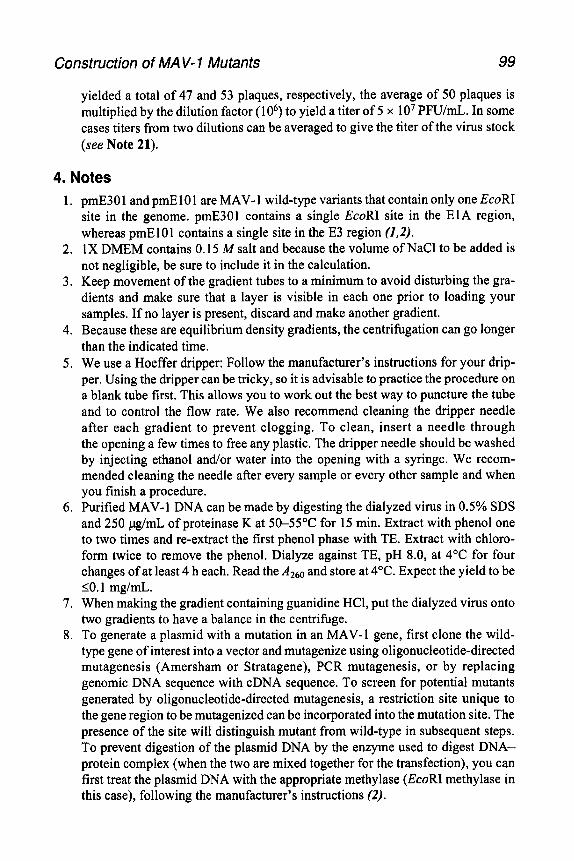
Construction of MA V- 1 Mutants 99
yielded a total of 47 and 53 plaques, respectively, the average of 50 plaques is multiplied by the dilution factor ( 106) to yield a titer of 5 x lo7 PFU/mL. In some cases titers from two dilutions can be averaged to give the titer of the virus stock (see Note 21).
4. Notes 1. pmE30 1 and pmE 10 1 are MAV- 1 wild-type variants that contain only one EcoRI
site in the genome. pmE301 contains a single EcoRI site in the ElA region, whereas pmElO1 contains a single site in the E3 region (1,2).
2. 1X DMEM contains 0.15 A4 salt and because the volume of NaCl to be added is not negligible, be sure to include it in the calculation.
3. Keep movement of the gradient tubes to a minimum to avoid disturbing the gra- dients and make sure that a layer is visible in each one prior to loading your samples, If no layer is present, discard and make another gradient.
4. Because these are equilibrium density gradients, the centrifugation can go longer than the indicated time.
5. We use a Hoeffer dripper: Follow the manufacturer’s instructions for your drip- per. Using the dripper can be tricky, so it is advisable to practice the procedure on a blank tube first. This allows you to work out the best way to puncture the tube and to control the flow rate. We also recommend cleaning the dripper needle after each gradient to prevent clogging. To clean, insert a needle through the opening a few times to free any plastic. The dripper needle should be washed by injecting ethanol and/or water into the opening with a syringe. We recom- mended cleaning the needle after every sample or every other sample and when you finish a procedure.
6. Purified MAV-1 DNA can be made by digesting the dialyzed virus in 0.5% SDS and 250 pg/mL of proteinase K at 50-55OC for 15 min. Extract with phenol one to two times and re-extract the first phenol phase with TE. Extract with chloro- form twice to remove the phenol. Dialyze against TE, pH 8.0, at 4°C for four changes of at least 4 h each. Read the AZ60 and store at 4°C. Expect the yield to be 10.1 mg/mL.
7. When making the gradient containing guanidine HCl, put the dialyzed virus onto two gradients to have a balance in the centrifuge.
8. To generate a plasmid with a mutation in an MAV-1 gene, first clone the wild- type gene of interest into a vector and mutagenize using oligonucleotide-directed mutagenesis (Amersham or Stratagene), PCR mutagenesis, or by replacing genomic DNA sequence with cDNA sequence. To screen for potential mutants generated by oligonucleotide-directed mutagenesis, a restriction site unique to the gene region to be mutagenized can be incorporated into the mutation site. The presence of the site will distinguish mutant from wild-type in subsequent steps. To prevent digestion of the plasmid DNA by the enzyme used to digest DNA- protein complex (when the two are mixed together for the transfection), you can first treat the plasmid DNA with the appropriate methylase (EcoRI methylase in this case), following the manufacturer’s instructions (2).
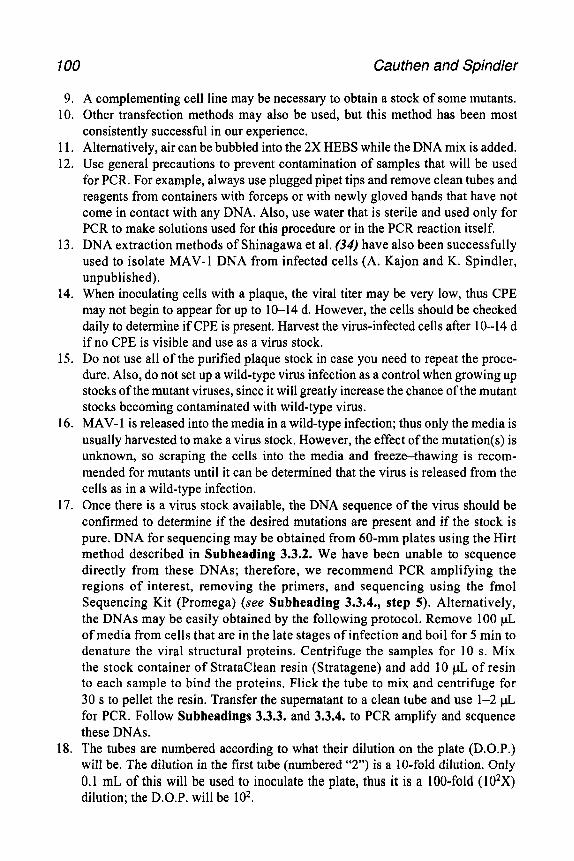
100 Cauthen and Spindler
9. A complementing cell line may be necessary to obtain a stock of some mutants. 10. Other transfection methods may also be used, but this method has been most
consistently successful in our experience. 11. Alternatively, air can be bubbled into the 2X HEBS while the DNA mix is added. 12. Use general precautions to prevent contamination of samples that will be used
for PCR. For example, always use plugged pipet tips and remove clean tubes and reagents from containers with forceps or with newly gloved hands that have not come in contact with any DNA. Also, use water that is sterile and used only for PCR to make solutions used for this procedure or in the PCR reaction itself.
13. DNA extraction methods of Shinagawa et al. (34) have also been successfully used to isolate MAV-1 DNA from infected cells (A. Kajon and K. Spindler, unpublished).
14. When inoculating cells with a plaque, the viral titer may be very low, thus CPE may not begin to appear for up to 10-14 d. However, the cells should be checked daily to determine if CPE is present. Harvest the virus-infected cells after 1 O-14 d if no CPE is visible and use as a virus stock.
15. Do not use all of the purified plaque stock in case you need to repeat the proce- dure. Also, do not set up a wild-type virus infection as a control when growing up stocks of the mutant viruses, since it will greatly increase the chance of the mutant stocks becoming contaminated with wild-type virus.
16. MAV-1 is released into the media in a wild-type infection; thus only the media is usually harvested to make a virus stock. However, the effect of the mutation(s) is unknown, so scraping the cells into the media and freeze-thawing is recom- mended for mutants until it can be determined that the virus is released from the cells as in a wild-type infection.
17. Once there is a virus stock available, the DNA sequence of the virus should be confirmed to determine if the desired mutations are present and if the stock is pure. DNA for sequencing may be obtained from 60-mm plates using the Hirt method described in Subheading 3.3.2. We have been unable to sequence directly from these DNAs; therefore, we recommend PCR amplifying the regions of interest, removing the primers, and sequencing using the fmol Sequencing Kit (Promega) (see Subheading 3.3.4., step 5). Alternatively, the DNAs may be easily obtained by the following protocol. Remove 100 $ of media from cells that are in the late stages of infection and boil for 5 min to denature the viral structural proteins. Centrifuge the samples for 10 s. Mix the stock container of StrataClean resin (Stratagene) and add 10 & of resin to each sample to bind the proteins. Flick the tube to mix and centrifuge for 30 s to pellet the resin. Transfer the supernatant to a clean tube and use l-2 & for PCR. Follow Subheadings 3.3.3. and 3.3.4. to PCR amplify and sequence these DNAs.
18. The tubes are numbered according to what their dilution on the plate (D.O.P.) will be. The dilution in the first tube (numbered “2”) is a IO-fold dilution. Only 0.1 mL of this will be used to inoculate the plate, thus it is a loo-fold (1O’X) dilution; the D.O.P. will be lo*.
Construction of MA V-7 Mutants 101
19. When overlaymg cells with medialagarose for a plaque assay, keep the media and agarose separate until ready to overlay. Warm the media in a container that is big enough to accommodate the agarose as well. When ready to over- lay, add an equal volume of agarose to the aliquot of media and use immedi- ately, Have separate aliquots of media/agarose for each mutant when overlaying and overlay the mock plate first, followed by the plates infected with the least amount of virus (1 O*), continuing in order to those plates infected with the most amount of virus (1 03). Prepare enough media/agarose to overlay one to two extra plates.
20. The plaques should be visible as holes in the monolayer of cells or l- to 2-mm circular areas where the density of the monolayer appears lighter or heavier than the surrounding area when the plates are held up to the light. The formation of a plaque can be confirmed by circling the area with an ethanol soluble pen and viewing under the microscope usmg the 10X objective. The plaque will appear as a roughly circular area of dead cells. The plaques will be more difficult to see than human-adenovirus plaques, and seeing them macroscopically is easier If observed against a black background. We have a piece of black paper on the ceiling near an overhead light and this seems to be crucial for seemg MAV- 1 plaques.
21. Wild-type vu-us generally grows to a titer of approx lo6 or lo7 PFU/mL; how- ever, some mutants, depending on the nature of the defect, may grow to lo- to lOO-fold lower titers than wild-type virus. The titer of the stocks may also decrease upon multiple freeze-thaws, so we recommend aliquotting the large stock of virus, especially if small amounts of vuus are needed to obtain the desired multiplicity of infection (MOI).
References 1. Beard, C. W. and Spindler, K. R. (1996) Analysis of early region 3 mutants of
mouse adenovirus type 1 J Viral 70,5867-5874. 2. Smith, K., Y ing, B., Ball, A. O., Beard, C. W., and Spindler, K. R. (1996) Interac-
tion of mouse adenovuus type 1 early region 1A protein with cellular proteins pRb and ~107 Virology 224,184-197.
3. van der Veen, J. and Mes, A. (1973) Experimental infection with mouse adenovt- rus in adult mice. Arch. Gesamte Virusforsch. 42,235-241.
4. Ishibashi, M. and Yasue, H. (1984) Adenoviruses of animals, in The Adenoviruses (Ginsberg, H S., ed.), Plenum, New York, pp. 497-562.
5. Ball, A. O., Beard, C. W., Villegas, P., and Spindler, K. R. (1991) Early region 4 sequence and biological comparison of two isolates of mouse adenovirus type 1. Virology 180,257-265
6. Kring, S. C., King, C. S., and Spindler, K. R. (1995) Susceptibility and signs associated with mouse adenovnus type 1 infection of adult outbred Swiss mice. J Virol. 69, 8084-8088.
7. Pirofski, L., Horwitz, M. S., Scharff, M. D., and Factor, S. M. (1991) Murine adenovirus infection of SCID mice induces hepatic lesions that resemble human Reye syndrome. Proc. Natl. Acad SCL USA 88,4358-4362.
102 Cauthen and Spindler
8. Winters, A. L., Brown, H. K., and Carlson, J. K. (1981) Interstitial pneumonia induced by a plaque-type variant of mouse adenovirus. Proc Sot. Exp Biol Med. 167,359-364.
9. Guida, J. D., Fejer, G., Pirofski, L.-A., Brosnan, C. F., and Horwitz, M. S. (1995) Mouse adenovirus type 1 causes a fatal hemorrhagic encephalomyelitis in adult C57BL/6 but not BALB/c mice. J. Viral. 69, 7674-768 1.
10. Ball, A. O., Williams, M. E., and Spindler, K. R. (1988) Identification of mouse adenovirus type 1 early region 1: DNA sequence and a conserved transacttvatmg function. J. Virol. 62,3947-3957.
11. Ball, A. O., Beard, C. W., Redick, S. D., and Spindler, K. R. (1989) Genome organization of mouse adenovnus type 1 early region 1: a novel transcription map. Virology 170,523-536.
12. Beard, C. W., Ball, A. O., Wooley, E. H., and Spindler, K. R (1990) Tran- scription mapping of mouse adenovnus type 1 early region 3 Virology 175, 8 l-90.
13. Cauthen, A. N. and Spindler, K. R. (1996) Sequence of the mouse adenovirus type-l DNA encoding the lOO-kDa, 33-kDa and DNA binding proteins. Gene 168,183-187.
14. Kring, S. C. and Spindler, K. R. (1990) Sequence of mouse adenovnus type 1 DNA encoding the ammo termmus of protein IVa2. Nucleic Acids Res l&4003
15. Kring, S. C., Ball, A. O., and Spindler, K. R. (1992) Transcription mapping of mouse adenovirus type 1 early region 4. Vwologv 190,248-255.
16. Larsen, S. H and Nathans, D. (1977) Mouse adenovirus: growth of plaque- purified FL virus in cell lines and characterization of viral DNA. Vzrology 82, 182-195.
17. Temple, M., Antoine, G., Delius, H., Stahl, S., and Winnacker, E.-L. (1981) Rep- lication of mouse adenovirus strain FL DNA. Virology 109, 1-12.
18. Cai, F., Tang, D., and Weber, J. M. (1992) Primary structure of the murme ad- enovirus type 1 proteinase. Blochim. Biophys Acta 1129,33!&341
19. Raviprakash, K. S., Gnmhaus, A., El Kholy, M. A., and Horwitz, M. S. (1989) The mouse adenovnus type 1 contains an unusual E3 region. J Viral 63, 5455-5458.
20. Song, B., Spindler, K. R., and Young, C. S. H. (1995) Sequence of the mouse adenovirus serotype-I DNA encoding the precursor to capsrd protein VI. Gene 152,279-280
21. Song, B., Hu, S.-L., Darai, G., Spindler, K. R., and Young, C. S. H. (1996) Con- servation of DNA sequence in the predicted major late promoter regions of se- lected mastadenoviruses. Virology 220,390-401.
22. Weber, J. M., Cai, F , Murali, R., and Burnett, R. M. (1994) Sequence and structural analysts of murine adenovirus type 1 hexon. J, Gen. Vzrol. 75, 141-147.
22a.Meissner, J. D., Hirsh, G. N., LaRue, E. A., Fulcher, R. A., and Spindler, K. R. (1997) Completion of the DNA sequence of mouse adenovirus type 1: Sequence of E2B, Ll, and L2 (18-51 map untts). Virus Res. 51,53-64.
Construction of MA V- 1 Mutants 103
23. Wigand, R., Gelderblom, H., and Gzel, M. (1977) Biological and biophysical characteristics of mouse adenovirus, strain FL. Arch. Vi&. 54, 13 1-142.
24. Hartley, J. W. and Rowe, W. P. (1960) A new mouse virus apparently related to the adenovirus group. Virology 11,645-647.
25. Kapoor, Q. S. and Chinnadurai, G. (1981) Method for introducing site-specific mutations into adenovirus 2 genome: construction of a small deletion mutant in VA-RNA, gene. Proc. Natl. Acad. Sci. USA 78,2184-2188.
26. Stow, N. D. (1981) Cloning of a DNA fragment from the left-hand terminus of the adenovirus type 2 genome and its use in site-directed mutagenesis. J. Viral. 37, 171-180.
27. Chinnadurai, G., Chinnadurai, S., and Brusca, J. (1979) Physical mapping of a large-plaque mutation of adenovirus type 2. J. Virol. 32,623-628.
28. Larsen, S. H. (1982) Evolutionary variants of mouse adenovirus containing cellu- lar DNA sequences, Virology 116,573-580.
29. Pettersson, U. and Sambrook, J. (1973) Amount of viral DNA in the genome of cells transformed by adenovirus type 2. J, Mol. Biol. 73, 125-130.
30. Dunsworth-Browne, M., Schell, R. E., and Berk, A. J. (1980) Adenovirus termi- nal protein protects single stranded DNA from digestion by a cellular exonuclease. Nucleic Acids Res. 8,543-554.
3 1. Gorman, C. (1985) High efficiency gene transfer into mammalian cells, in DNA Cloning: A Practical Approach (Glover, D. M., ed.), IRL, Oxford, pp. 143-190.
32. Hirt, B. (1967) Selective extraction of polyoma DNA from infected mouse cell cultures. J. Mol. Biol. 26,365-369.
33. Sambrook, J., Fritsch, E. F., and Maniatis, T. (eds.) (1989)MoZecular CZoning: A Labo- ratoly Manual, 2nd ed. Cold Spring Harbor Laboratory, Cold Spring Harbor, NY.
34. Shinagawa, M., Matsuda, A., Ishiyama, T., Goto, H., and Sato, G. (1983) A rapid and simple method for preparation of adenovirus DNA from infected cells. Mcrobiol. Immunol. 27,8 17-822.

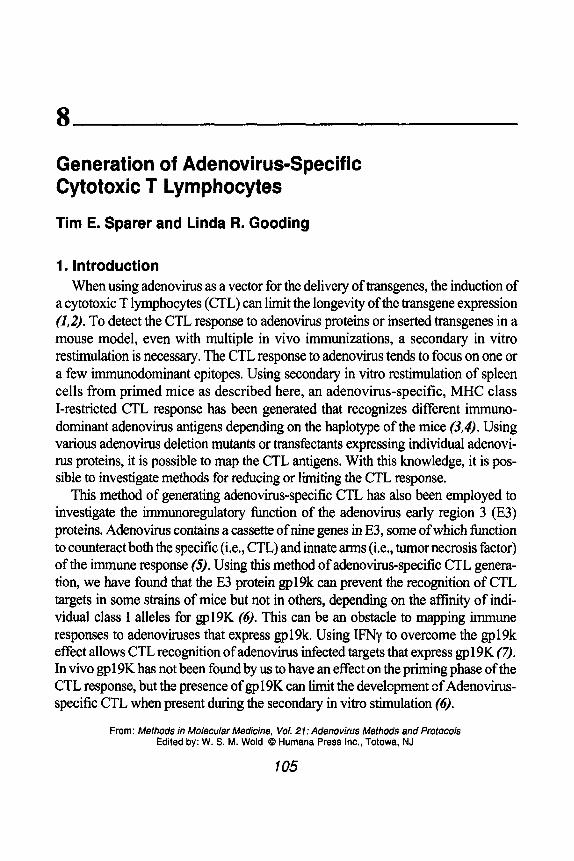
Generation of Adenovirus-Specific Cytotoxic T Lymphocytes
Tim E. Sparer and Linda R. Gooding
1. Introduction When using adenovirus as a vector for the delivery of transgenes, the induction of
a cytotoxic T lymphocytes (CTL) can limit the longevity of the transgene expression (1,2). To detect the CTL response to adenovirus proteins or inserted transgenes in a mouse model, even with multiple in vivo immunizations, a secondary in vitro restimulation is necessary. The CTL response to adenovirus tends to focus on one or a few immunodominant epitopes. Using secondary in vitro restimulation of spleen cells from primed mice as described here, an adenovirus-specific, MHC class I-restricted CTL response has been generated that recognizes different immuno- dominant adenovirus antigens depending on the haplotype of the mice (34. Using various adenovirus deletion mutants or transfectants expressing individual adenovi- rus proteins, it is possible to map the CTL antigens. With this knowledge, it is pos- sibie to investigate methods for reducing or limiting the CTL response.
This method of generating adenovirus-specific CTL has also been employed to investigate the immunoregulatory function of the adenovirus early region 3 (E3) proteins. Adenovirus contains a cassette of nine genes in E3, some of which function to counteract both the specific (i.e., CTL) and innate arms (i.e., tumor necrosis factor) of the immune response (5”. Using this method of adenovirus-specific CTL genera- tion, we have found that the E3 protein gpl9k can prevent the recognition of CTL targets in some strains of mice but not in others, depending on the affinity of indi- vidual class I alleles for gpl9K (6). This can be an obstacle to mapping immune responses to adenoviruses that express gpl9k. Using IFNy to overcome the gpl9k effect allows CTL recognition of adenovirus infected targets that express gpl9K (7). In vivo gp 19K has not been found by us to have an effect on the priming phase of the CTL response, but the presence of gpl9K can limit the development of Adenovims- specific CTL when present during the secondary in vitro stimulation (6).
From: Methods in Molecular Medicine, Vol. 21: Adenovirus Methods and Protocols Edited by: W. S. M. Wold Q Humana Press Inc., Totowa, NJ
106 Sparer and Gooding
2. Materials 1. Avertin (2% 2,2,2 tribromoethanol in H20, 0.5% tert amyl alcohol, filter steril-
ized) (Aldrich, Milwaukee, WI) for anesthetizing mice for intranasal inoculation. 2. CsCl-banded adenovirus (minimum of 10” PFU/mL). 3. Phosphate-buffered saline (PBS): 0.14 A4 NaCl, 1.5 mM KHZP04, 2.7 mM KCl,
8.1 mA4 Na2HP04, pH 7.35. This is used for diluting the adenovirus stocks and for washing fibroblasts before adding trypsin for removal.
4. Dissecting instruments for harvesting spleens. This includes sterilized Petri dishes with a loo-mesh stainless steel screen placed inside and a glass rod with flattened end for pushing spleen cells through the screen to dissociate (Bellco, Vineland, NJ).
5. HEPES-buffered Hank’s balanced salt solution (HHR-5): 23.83 g HEPES (Sigma, St. Louis, MO), 97.56 g Hank’s balanced salts (Gibco-BRL, Gaithers- burg, MD, into 10 L of H20) with 5% fetal calf serum (Hyclone). This is used as a wash solution throughout this protocol.
6. Counting solution that allows for cell enumeration while lysing red cells: 0.01 g crystal violet, 3 mL of glacial acetic acid. Mix these together first and adjust to 100 mL with PBS.
7. Complete RPMI: RPMI-1640 containing 10% fetal calf serum (Hyclone, Logen, UT), 1% antibiotic/antimycotic mixture (Gibco-BRL), 1 mA4 sodium pyruvate, 2 mM L-glutamine, 1% MEM nonessential amino acids (Gibco-BRL), 5 x lop5 M 2-mercaptoethanol (filter sterilized). The L-
glutamine will last approx 1 mo in solution and the 2 ME will last only 2 wk in solution at 4°C.
8. DME-IO: Dulbecco’s modified Eagle’s medium containing 10% fetal calfserum, 2 mA4 L-glutamine. This medium is used to grow the SV40-transformed fibro- blasts used as stimulator cells and as target cells.
9. DME-SF: Dulbecco’s modified Eagle’s medium containing 2 mA4 L-glutamine and 1% antibiotic/antimycotic.
10. cDME: DME containing 2 mM L-glutamine, 1% antibiotic/antimycotic 5 x 10e5 A4 2-mercaptoethanol, 1% MEM nonessential amino acids (Gibco-BRL,), and 1 mM sodium pyruvate.
11. Trypsin (0.25 mg/mL in PBS; Gibco-BRL): for removing the SV40-transformed fibroblasts from Petri dishes.
12. 24-well Tissue-culture plates and 96-well V-bottom plates. 13. lOO- and 35-mm Petri dishes (Corning, Corning, NY). 14. Packard y-counter with additional statistical software.
3. Methods
3.1. Primary In Vivo Sensitization (see Note 1)
1. For intranasal inoculation, three mice (6-8 wk old)/group are anesthetized with avertin and inoculated with 25 & of CsCl-banded adenovims (10’ ’ PFU/mL) (see Note 2).
2. For intraperitoneal inoculation 2 x 10’ PFU of virus is used per mouse. This dose was shown to be the optimum dose to generate a strong adenovirus-specific
Adenovirus-Specific Cytotoxic T Lymphocytes 107
CTL response (6) The presence or absence of the E3 gene product gp 19K m the moculatmg virus has no effect on the quantity or spectftcity of CTL gen- erated (3,6).
3.2. Maintenance of Target Cell Lines (Stimulator and Target Cells)
1 Most of the target cells used to analyze mouse CTL responses are SV40-trans- formed fibroblasts dertved from primary cultures of mouse embryo or adult kid- ney fibroblasts (8)
2. Grow SV40 tibroblasts to confluency m 100~mm plates at 37°C and 8% CO, Each loo-mm plate yields 2-5 x lo6 cells.
3 To remove cells, aspirate the medium and add approx 1 mL sterile PBS 4 Aspirate the PBS and add approx 1 mL trypsm (0.25 mg/mL m PBS). 5. After 2-3 min remove the cells and wash to remove the trypsm. 6 Subculture at least twice per week at a split ratio of I:20
3.3. Secondary In Vitro Sensitization for CTL Generation (see /Vote 3)
3 3.1. Splenocytes
1 Seven days followmg mtranasal maculation or 14 d following up moculatton, sacrifice immune mice and remove spleens under stertle condttions Place spleens from each group (generally three per group) together in a sterilized Petrt dish containing a loo-mesh stamless-steel wire screen and 4 mL of HHR-5
2 Using the flattened end of a glass rod, gently push the spleens agamst the screen extruding cells from the capsule and creating a single-cell suspension
3 Bring the cell suspension to 50 mL with HHR-5, centrifuge at 15Og for 10 mm and resuspend in cRPMI
4 Enumerate mononuclear cells on a hemocytometer using countmg solutton and dilute to 2.5 x IO6 cells/ml in cRPMI. Add 2 mL of cell suspension per well of a 24-well plate.
3.3.2. Adenovirus Infect/on of Stimulator Cells
1. The day prior to splenocyte harvest, syngeneic (at least MHC identical, and preferably from the same mouse strain as the spleen donor) trypsmlze SV40- transformed fibroblasts and wash once in HHR-5 by centrifugation at 150g for 10 mm
2. Place 1 x lo6 sttmulators m DME-10 onto 100 mm tissue culture dishes and allow to adhere for at least 4 h (less time followmg trypsm treatment results m decreased efficiency of vn-us mfectton)
3 Remove medium and replace with 4 mL DME-SF 4 Infect cells with 100 PFU/cell of human adenovirus. Allow the adenovnus to adsorb
for 2 h at 37°C m 8% CO2 Remove the medium and replace with 6 mL of DME- 10. 5. After overnight mcubation at 37°C and 8% CO,, harvest the stimulators with
trypsm and wash once with HHR-5.
108 Sparer and Gooding
6 Count cells and dilute to 3 x lo5 cells/ mL m cRPM1 7. Irradiate stimulators with 5000 rad from 137CS source (GammaCell 40, Nordion,
Canada) 8. Add 0 I mL of stimulators (3 x IO4 cells) to roughly half the wells of the 24-well
plates containing spleen cells (Subheading 3.3.1.). The remainmg wells of splenocytes that do not receive stimulators will serve as control effecters m the assay (see Note 4)
3.4. 51Cr Release Assay
3.4.1. Target Cell Labeling (see Note 5)
1. The day prior to assay (d 5 after beginning the m vita sensitization), harvest syngeneic SV40-transformed fibroblasts using trypsin and wash once in HHR-5
2. Enumerate cells and plate 5 x IO5 cells onto a 35-mm tissue-culture dish 3. Allow cells to adhere for 4 h. Again, sufficient time to regenerate receptors is
necessary or virus infection efficiency will be poor. Adherence should be appar- ent under the microscope prior to infection.
4. Infect cells with 100 PFU/cell of adenovnus m 2 mL DME-SF or mock-infect as follows. Allow adenovu-us to adsorb for 2 h at 37°C. Remove the medium and replace with 4 mL of DME- 10 (see Note 6)
5. For adenovnuses lacking the ElA region, infect targets 48 h prior to assay with 1000 PFU/cell
6. Normally, include plates of uninfected cells for specifictty controls. 7. Label all targets by addition of 200 pCi of Naz5’Cr04 (New England Nuclear,
Boston, MA) 18 h prior to assay (see Notes 7 and 8).
3.4.2. Target cell harvest (see Note 9)
Harvest 51Cr-labeled targets by first gently removmg the medium and rmsmg the monolayers twice with HHR-5 and once with PBS. Add trypsm (0.25 mg/mL m PBS) to the plate for 2-3 min (dependmg on the cell line). Add HHR-5 to stop trypsm action and gently remove the cells to a 15mL comcal centrifuge tube. Collect cells by centrlfugatron at 1.5Og for 10 min. Resuspend cells in cDME, count and dilute to 1 x 10⁵/mL in cDME.
3.4.3. Assembly of the Assay (d 6 of In Vitro Stimulation)
1. On d 6, harvest stimulated and unstimulated splenocytes by gentle pipetting of the semiadherent CTL Pool the 2-mL cultures from each group Centrifuge cells at 15Og for 10 min and resuspend in cDME. From this point forward, all proce- dures can be performed under nonsterile conditions
2. Count splenocytes using counting solution and then dilute to 6 x lo6 cells per mL (for a 60: 1 E:T ratio). From this, make 1.3 serial dtlutions (20: 1, 6.1 E.T ratios, respectively)
3, In triplicate, add 50 @., of targets and 50 p.L of stimulated or unstimulated splenocytes (of each dilution) to wells of a 96-well V-bottom microtiter plate.
Adenovirus-Specific Cytotoxic T Lymphocytes 109
One set of triplicate wells per target receives labeled target cells plus 50 pL of cDME (medium only). These wells function as a measure of spontaneous release of 5’Cr from each target. Another triplicate of wells for each target will receive lysis medium at the end of the incubation (maximal release). In total there are eight sets of triplicate wells for each target (24 wells total: 3 wells maximal release, 3 wells medium only, 3 wells 6O:l E:T ratio [stimulated], 3 wells nonstimulated), 3 wells 2O:l E:T ratto (stimulated), 3 wells (nonstimulated), 3 wells 20: 1 (sttmulated), 3 wells (nonstimulated). Centrifuge the plate at 1508 for 2 min with low brake. Incubate the plates for 5 h at 37°C at 8% CO,.
3.4.4. 57Cr-Re/ease Assay Harvest 1 Add 50 $ of 1 N HCl to each maximum release well and mix well 2 Centrifuge plates at 15Og for 10 min 3. Remove 50 l.rL of cell supernatant and record counts per minute by a y-counter. 4. Express results as the mean +/-- SEM of triplicate samples Calculate as follows*
(E - C)I(M- C) x 100% = % specific lysis, where C is cpm released in the presence of nonstimulated lymphocytes, E IS cpm released in the presence of sensitized lymphocytes, and M is maximum releasable cpm determined by the addition of 0.05 mL of 1 N HCl to 0.05 mL of target cells. Spontaneous release (the medium only control) should be less than 20% of the maxtmum release values.
4. Notes 1
2
3
4.
5.
In order to generate CTL m vitro, it IS necessary first to prime the lymphocyte population by inoculating mice with virus a mmimum of 8 d prior to harvest of spleen cells for in vitro culture. Spleen cells from unprimed animals exposed to adenovuus infected cells in vitro will not differentiate into CTL. This is why SV40-transformed fibroblasts can be used as m vitro stimulator and target cells without fear of generating a response to SV40 (9). Intranasal maculations: Once the mice have been anesthettzed, the bolus of aden- ovnus is placed on the tip of the nose while holding the mouse up by the scruff of skm under the chin. This IS important since it forces the mouth closed and pre- vents the majority of the moculum from going into the mouth. The concentration of the adenovnus is crucial. We have found that even a log difference in titer can prevent CTL priming. Also, we did not freeze-thaw these stocks in order to avoid decreasing the titer. Past experience indicates that the capacity to support m vitro generation of CTL varies from one lot of fetal calf serum to another. Preliminary screening should be done to identify a suitable lot that supports strong development of specific CTL and not nonspecific cytolysis. Secondary in vitro sensitization Nonstimulated cultures can either be incubated with no stimulators or with uninfected stimulators Sirmlar results were achieved either way. Care is required when working with radiolabeled chromium. This work should be done using protective clothmg, gloves, and eye protection. Personnel also need
110 Sparer and Gooding
to be monitored for exposure during this work. Addtttonally, any waste (solid or liquid) generated should be disposed of m accordance with applicable instttu- tional guidelines
6 When using El A-deleted viruses to Infect target cells, mfectton should be with 1000 PFU/cell begmnmg 48 h prior to assay. Since these viruses lack the transacttvatmg region of adenovitus, they require longer periods of time and higher viral concentrattons to get complete vrral gene expression m mouse cells.
7 The protocol given here labels cells with chromtum overmght; this long a label- mg period is sometimes, but not always necessary (it will depend on the charac- teristtcs of the cells bemg used as targets). A mmtmum of 3 h 1s recommended
8 If the MHC class I haplotype of the target cells is among those that bmds to gpl9K, then cells can be treated wtth 50 U of recombinant interferon-y (IFN-y) (Genzyme, Cambridge MA) beginning immediately after vnus mfectton (7). IFN- y treatment Increases levels of class I, overcoming the gpl9K blockade, but it does not interfere with expression of viral protems. Although the degree of sup- pression of CTL recogmtion by gp 19K varies from one cell line to another, even among cells of the same haplotype, m many SV40-transformed cells we have observed a 50-60% drop m CTL recognition Alleles for which IFN-)I treatment of target cells 1s advisable include Db, Ld, and Kd
9. Target cells. It 1s crucial that target cells not remain in air at room temperature for too long as the spontaneous release of 51Cr increases the longer the cells are exposed to temperature and CO2 fluctuattons
References 1. Yang, Y., Lr, Q., Ertl, H C., and Wilson, J. M. (1995) Cellular and humoral
mnnune responses to vtral antigens create barrters to lung-directed gene therapy with recombinant adenovn-uses. J Viral 69, 2004-20 15
2. Yang, Y., Nunes, F A , Berencst, K., Furth, E E , Gonczol, E., and Wilson, J. M. (1994) Cellular nnmuntty to vtral anttgens limits E 1 -deleted adenoviruses for gene therapy. Proc Nat1 Acad Scl USA 91,4407-441 I.
3. Rawle, F., Knowles, B. B., Ricciardi, R P , Brahmacheri, V , Duerksen-Hughes, P., Wold, W. S M., and Goodmg, L. R. (1991) Specificity of the mouse cytotoxtc T lymphocyte response to Adenovirus 5 Immunodommance of E 1A depends on H-2 haplotype. J Immunol. 146,3977-3984
4 Sparer, T., Wynn, S. G., Clark, D J , Kaplan, J. M., Cardoza, L. M., Wadsworth, S. C , Smith, A E., and Gooding, L R. (1997) Generation of cytotoxtc T lympho- cytes against immunorecessive epitopes after multiple nnmunizations with aden- ovirus vectors is dependent on haplotype. J Vlrol 71,2277-2284.
5 Wold, W S. M and Goodmg, L. R. (1991) Region E3 of adenovirus. a cassette of genes involved m host unmunosurvetllance and virus-cell interactions Vzrology 184, l-8
6. Rawle, F. C , Tollefson, A. E , Wold, W. S. M., and Goodmg, L R (1989) Mouse anti-adenovirus CTL. Inhibition of lysis by E3 gpl9K but not E3 14.7K. J lmmunol 143,203 l-2037.

Adenovirus-Specific Cytotoxic T Lymphocytes 111
7 Sparer, T., Trtpp, R. A, Ddlehay, D. L., Hermiston, T W., Weld, W S M., and Gooding, L R. (1996) The role of adenovirus early region 3 proteins (19K, 10 4K, 14.5K, and 14.7K) m a murme pneumoma model J Viral. 70,243 l-2439
8. Goodmg, L. R. (1979) Specrfictties of killing by T lymphocytes generated against syngeneic SV40 transformants. Studies employmg recombinants wlthm the H-2 complex. J. Immunol 122, 1002-1008.
9 Goodmg, L R (1977) Spectficittes of killmg by cytotoxtc T lymphocytes gener- ated En VIVO and En wtro to syngeneic SV40 transformed cells. J Immunol 118, 920-927

9
Measurement of Macrophage-Mediated Cytolysis of Adenovirus-Infected Cells
Penelope J. Duerksen-Hughes and Linda R. Gooding
1. Introduction Macrophages are well-known for their ability to serve as phagocytes,
ingesting and destroymg microorgamsms such as bacteria, and for their func- tion m antigen presentation. Less appreciated, perhaps, is the fact that mac- rophages are also capable of recognizing and destroying certain abnormal self-cells; for example, some virus-infected and tumor cells are macrophage targets. This chapter describes an assay procedure by which the macrophage- mediated cytolysis of such cells can be measured.
In this procedure, macrophages are first activated with lipopolysaccharide (LPS). Simultaneously, the target cells are prepared. This includes virus infec- tion, if the targets are to be virus-Infected cells, and 5’Cr labeling for all cells. Then, the activated macrophages and labeled target cells are combmed at the appropriate ratios m wells of 96-well plates and allowed to comcubate for an appropriate period. At the end of this period, ahquots of media are removed from each well and the amount of radioactivity released into this media is mea- sured. This raw data is then used to calculate the percentage of lysed cells.
2. Materials 2.1. Effecfor Cells
1 C3HeB/FeJ male mice (between 1 and 5 per assay). 2. Brewers thloglycollate broth (Dlfco, Detroit, Ml). prepare by adding 4.05 g
thloglycollate to 100 mL dHzO, bollmg to dissolve, then autoclavmg for 15 mm with slow exhaust. The broth can be stored for a few months at 4°C
3. Sterile syrmges (3-mL) and needles.
From Methods in Molecular Medune, Vol 21 Adenovrrus Methods and Protocols E&ted by W S M Wold 0 Humana Press Inc , Totowa, NJ
113
114 Duerksen-Hughes and Gooding
4. Lipopolysaccharrde (Salmonella Minnesota R595. Ltst Laboratones, Campbell, CA) Prepare stock of 0.2 mg/mL in medra. LPS stock can be stored m aliquots (approx 1 mL) at -20°C for a few months
5 Sterile flat-bottomed 96-well plates with covers 6 Endotoxin-free Dulbecco’s modified Eagle’s media (DMEM) (Grbco-BRL,
Garthersburg, MD) supplemented with 10% fetal calf serum (FCS) and antibtot- ICS (such as anttbiotic/antrmycotic [aa] and gentamrcm) (see Note 1)
7. Endotoxm-free DMEM with no FCS added (wash media) 8 Sterile, disposable 50-n& centrifuge tubes
2.2. Target Cells 1. Target cells, such as SVB6KH-A (a SV40-transformed mouse fibroblast) (I), grown to
approx 5&70% confluency 111 the appropriate condtnons (III thrs case, 37°C wrth 8% COz). 2. Virus stocks (If used) These should be kept at -80°C for long-term storage, with
ahquots currently being used kept at -20°C. Gloves and protective clothing should be worn while working with adenovuus or adenovnus-infected cells
3 DMEM (Gibco-BRL) supplemented with 10% fetal calf serum (FCS) and antrbr- otzs (such as aa and gentamlcin).
4 DMEM without FCS (serum-free DMEM). 5. Na15’Cr0, (1000 Cl/g) stored at 4°C. Thts compound emits gamma radiation,
thus appropriate lead shielding and protective gloves and clothing should be used for storage, mmrmal exposure, and protection.
6. Trypsin solution (0.25 mg/mL) (stored at -20°C) 7 Hemocytometer 8. Sterile 60-mm plastic tissue-culture plates. 9 Sterile PBS (room temperature).
10. HEPES Hanks Red (HHR) (Gibco-BRL) or other suitable wash solutron (4°C) 11 Sterile, disposable 15-mL centrifuge tubes
2.3. Assay 1 2 N HCl (room temperature). 2. Disposable borosihcate glass tubes 3 y-Counter.
3. Methods 3.1. Preparation of Effecfor Cells
3.1.1. Induce with Thioglycolla te
Four to five days before the experrment IS planned, inject between 1 and 5 male C3HeB/FeJ mice wtth 1 S mL Brewers thioglycollate broth peritoneally, depending on the size of the experiment planned. In general, one can obtain between a little less than one and two 96-well plate(s) of macrophages per mouse. The throglycollate broth induces the accumulatton of macrophages m the perttoneal fluid, and provides the first step toward then actrvation.
Macrophage-Mediated Cytolysls
3.1.2. Insulate the Macrophages
On the day before the experiment, obtain the macrophages from the mice.
1. Sacrifice the mice by CO, asphyxiation and lay them on their backs. Apply etha- nol to the mldsectlon, then hft the skin with forceps and cut the skin vertically and hortzontally such that the skin flaps can be opened to expose the abdomen.
2. Inject 10 mL of DMEM into each peritoneum using an 18 and l/2-gage needle. Rock mice to allow the media to suspend the cells; one can also palpate the abdo- men gently.
3. Insert a second needle and syringe mto a second site and withdraw the fluid Try to avoid fat (which will clog the needle) and blood One should obtain between 5 and 10 mL of fluid per mouse
4 Put the fluid mto a 50-mL polypropylene centrifuge tube (macrophages may adhere to other types of plastic, such as polystyrene) and centrifuge for 10 mm at 15Og m a bench-top centrifuge. Place tube on ice
5 Aspirate off the supernatant, flick the pellet (see Note 2), and add DMEM to the tube The amount of DMEM added will depend on the estimated yield of mac- rophages per mouse (based on visual inspection of the pellet); approx 3 mL per mouse IS a reasonable starting point Combine the tubes with macrophages (one tube per mouse at this point) into a single tube.
6. Determine the concentration of macrophages usmg a hemocytometer Add media to obtain a final concentration of 2 x 1 O6 macrophages/mL.
3.1.3. Activate the Macrophages
1. Add macrophages to 96-well plates In a typical lysis expertment, use effector- to-target ratios of 5 I, 10 1, 15.1, and 20 1 Also, do each measurement m trtph- cate So, to fill a 96-well plate with macrophages using this setup, put 50 $ of the macrophage suspenston into columns 1, 2, and 3 of each row (1 x 1 O5 mac- rophages per well), 100 pL into columns 4, 5, and 6 (2 x lo5 macrophages per well), 150 pL into columns 7,8, and 9 (3 x lo5 macrophages per well), and 200 pL into columns 10, 11, and 12 (4 x lo5 macrophages per well). Under some condi- tions, 10 1, 20.1, 30 1, and 40.1 ratios will yield better results
2. In order to discrtmmate between kill mediated by macrophage contact and kill mediated by soluble mediators released by macrophages (such as TNF), set up a specific control (supernatant control) (see Subheading 3.3.2.) At this point, plate out any extra macrophages (100 mL per well) on a separate plate
3. Allow the cells to adhere to the plastic by placing the plates in the incubator for approx 2 h.
4 While cells are adhering, prepare LPS. The stock is 200 mg/mL, made up in media At this point, dilute the appropriate amount (you will need 100 &/well) 1.40 m media to give a final concentration of 5 mg/mL. It may be necessary to somcate the stock before and/or after dilution, make sure the solution is clear
5. Wash cells three times, Attach a sterile pipet tip to the end of a Pasteur pipet, and attach the Pasteur pipet to a tube hooked up to a vacuum. For each wash, aspirate
116 Duerksen-Hughes and Gooding
out the media by gently touching the plasttc ttp to the mtersectron of the stde and bottom of each well and allow the media to be suctroned out Repeat for each well Add 100 p.L warm media to each well (a repeating pipettor or an 8-trp ptpettor will make this step easier), rock the plates gently, then aspirate out the media, and repeat three times
6 Add the LPS. Note that for each data point, it is usually necessary to measure cytolysis m the presence both of macrophages activated with LPS and those not exposed to LPS. Therefore, only half of your macrophages should be treated wtth LPS. Aspirate out the last wash media from the wells and add 100 mL LPS (at 5 mg/mL) to each well to be treated; add 100 mL media to the other half of the wells. If one has two plates of macrophages, tt 1s usually easiest (and muumtzes the chances of crosscontamination) to treat one plate with LPS and the other with media. Also, add LPS to wells contammg those extra macrophages that will be used for the supernatant control.
7 Incubate overnight m the CO, incubator.
3.2. Preparation of Target Cells
3.2 1 Plate Out Targets
On the day before the assay, plate out the target cells for labelmg (and possibly mfection). Remove growing cells from then plates by first rinsing with sterile PBS and then treating with trypsm, and add them to a tube containing 10 mL of HHR or other rinse media Centrifuge cell suspensions at 15Og for 10 mm. Decant the supernatant, flick the pellet, and add approx 2 mL media (actual amount depends on number of target cells used, 2 mL 1s a reasonable starting point for two to three plates of cells). Count the cells using a hemocytometer. Calculate the volume of the cell suspen- ston needed to provide 1 x lo6 cells Add this amount to 60 mm prepared plates (plates containing approx 2 mL media that have been warmed and equilibrated m a CO, Incubator). If vu-us-infected cells are being used, include one plate for a negatrve control (uninfected), one plate for a posrttve control, and one plate for each vuus construct tested, Allow cells to adhere to the plastic. This will generally take between 1 and 3 h depend- ing on the cell lme
3.2.2. Infect the Targets (if Necessary)
If virus-infected cells are to be used as the targets, they should be infected the day before they are to be exposed to the macrophages. The infection is generally done just before the chromium labeling.
1 Remove vnus ahquots from the freezer (-20”(Z), allowing them to thaw on Ice 2 In a tissue-culture hood reserved for biohazard use, aspirate DMEM medta from
the cells and briefly rinse each plate two times with 3 mL of serum-free DMEM warmed to 37°C (see Note 3)
Macrophage-Mediated Cytolysis 117
3.
4.
5
6
7
8
9
10
Add 1 5-2 mL serum-free DMEM to each 60mmplate. Rotate the plates to cover the entire bottom of the plate with media. Given that the titer of the virus stock is known, calculate the volume of vu-us needed for the desired number of plaque-forming units (PFU) per cell using the equation below (see Note 4).
[( 1 x lo6 cell) (XPFU/cell)]I(Y PFU/mL) = the number of mL of virus stock to add per plate
For example, if you wanted to add 100 PFU/cell, and had a stock with lo9 PFU per mL, X would equal 100 (100 PFU/cell) and Y would equal lo9 ( IO9 PFU/mL m the vnus stock). One would therefore add 1 x 1 O6 x 100/l 0” = 0 100 mL vu-us stock per plate Somcate the vnus stocks for approx 1 mm to break apart clumps that frequently develop and to create an even suspension of virus particles In the biohazard tissue-culture hood, add virus to the plates usmg a Pipetman Change pipet-tips between viruses Gently swirl media and virus around m each of the 60-mm plates to ensure an even distribution of the virus. Return the 60-mm plates to the incubator (37’C, 8% COZ) for 90 mm (see Note 5). In the biohazard hood, aspirate the vu-us and medium from the cells and rinse the cells twice with 2 mL serum-free DMEM (prewarmed to 37°C) (see Note 6) Add 2 mL DMEM (+lO% FCS) to each of the plates and return the plates to the incubator. Allow the mfectron to proceed for approx 16 h; the actual time can be adlusted as needed. Too long an mcubatron time can result in cytotoxicity, whereas too short a time can result m insufficient expression of vuus proteins. Human cells will require less time than will rodent cells
3.2.3. Label the Targets (see Notes 7 and 8)
1. To each plate of target cells, add 200 pL radiolabeled chromium. This is done using a I-mL tuberculm syringe. Pull up the required amount of an mto the syringe (for example, for three plates of target, one would pull up 600 pL au-). Keeping the glass vial of chromium m the lead pig (if possible), insert the needle mto the plastic or rubber stopper. Expel the air mto the vial, invert the vial/pig/ needle assembly, and withdraw the correct amount of liquid (in this case, 600 pL). Add 200 pL to the media of each plate of targets using the syrmge.
2 Incubate the target cells overnight to allow labeling
3.3. Assay Procedure
3.3.1. Harvest the Target Cells
1. This is done the day of the assay Remove supernatant from each plate and add to radioactive liquid waste container. Rinse cells with PBS, trypsmrze, remove cells with Pasteur pipet, and add to a tube containing 10 mL of HHR or other rmse media.
118 Duerksen-Hughes and Gooding
2. Centrifuge cell suspensions at 15Og for 10 mm. Decant the supernatant, flrck the pellet, and add approx 2 mL media.
3 Determme the cell concentratron usmg a hemocytometer Add the reqmred amount of medra to bring the final concentration to 2 x lo5 cells/ml
Add 100 pL of the radiolabeled target cells to each well with macrophages. A repeating ptpettor ~111 make thrs step easier. It IS also recommended that one add the targets to the unactivated macrophages first, then to the activated mac- rophages. This minimrzes the chance of accrdentally transferrmg LPS to the unacttvated macrophages.
3.3.2 Prepare Controls
Four types of controls are necessary; the first three may be best prepared using a new 96-well plate.
1
2.
3
4
The maxtmum control determrnes the maximum radroactrvrty that can be released by an aliquot of labeled targets. At this point, to each of three wells of a new plate, add 100 pl.. target cells This should be done for each of the target cell populations to be tested. The buffer control determines the amount of radtoacttvity that ~111 leak out m the absence of lysts. At thts point, add 100 p.L target cells plus 100 p.L medra to each of three wells This should be done for each of the target-cell popula- tions to be tested. The supernatant control is helpful m drscrimmatmg between ktll mediated by macrophage contact and kill mediated by soluble mediators released by mac- rophages. Harvest and combme the conditioned media from the wells contaimng the extra activated macrophages. Store this condtttoned media on ice Add 100 pL of the target cells plus 100 pL of the conditioned media to each of three wells Thts should be done for each of the target-cell populations to be tested The acttvatton control helps to determme that any effects seen are m fact depen- dent on macrophage activation Because you have already set up separate plates with activated and unacttvated macrophages, this control has already been taken care of.
3.3.3. Incubate Overnight
It may be necessary to experiment to find the best time for each cell type; 20 h is a reasonable starting point for many cell types (see Note 9).
3.3.4. Analyze Samples
1, Remove plates from the incubator. At thts pomt, tt IS not necessary to use a sterde tissue-culture hood; the remammg steps can be carrred out on a laboratory bench.
2 Add 100 p.L 2 N HCl to each of the maximum control wells. Prpet each well up and down three times to ensure complete lysis of cells, and change ptpet ttps between each well.
Macrophage-Mediated Cytolysis 119
3. Centrifuge microtiter plates at 150g for 10 min. Spin the samples with a low brake to keep the cell pellets intact.
4. Transfer 100 pI, supernatant from each well into separate borosihcate glass tubes using a ~200 Pipetman. The same pipet tip can be used for each set of triplicates within the row, but change tips between these sets. Do not release a sample of supernatant back into a well to try a transfer again; also, do not touch the bottom of the plate with a pipet ttp. Etther of these actions may pick up radtoacttve, unlysed cells and give a falsely high reading.
5. Determine the radtoacttvity of these cellular supernatants on a y-counter. 6 To analyze the percent specific lysis induced by the macrophages, average the
trtphcate values and use the following equatton (see Note 9). [(experimental - spontaneous release)/(maxtmum - spontaneous release)] x 100. The spontaneous release is that found in the buffer control wells, the maximum release IS that found in the maximum control (or HCI-treated) wells.
7 Graph and analyze your data For examples of this technique, see refs. 2-4.
4. Notes 1 The part of this assay that 1s probably the most drfficult to reproducibly replicate
is the state of the macrophages. We have found that even trace amounts of endo- toxin present in the media used during the preparatory steps (Subheading 3.1.2.) can cause the expertment to fail. Therefore, we recommend purchasing serum from lots with an absolute mimmum of endotoxin, and to use media purchased m liquid form from the supplier in order to mmimtze the possibility of laboratory- induced contaminatton with endotoxin
2. Resuspension of the pellet at this point is a fairly crttical step, as macrophages adhere to each other easily and once clumps form they are difficult to dissoctate. We have found that the best way to accomplish this is to vigorously flick the pellet (and, If necessary, even bang the centrifuge tube against the countertop) to loosen the cells before addmg the media; once media ts added, any clumps present are probably there to stay.
3. The high level of protein m DMEM + 10% FCS inhibtts attachment of adenovr- rus to Its cellular receptor Hence, It is critical to use serum-free medra or media with a low percentage of serum during the mfection.
4 The PFU/cell IS dependent on the cell type In general, a high multlpllclty of infection IS needed for complete infection of mouse cells and rat cells (100-200 PFU/cell). Human cells require a much lower multiplicity of Infection (S-20 PFU/ cell) for complete infection.
5 One and a half hours is generally adequate for mfection However, tf the cell lme you are working wtth is difficult to infect, you can increase the amount of incubation time with the vn-us to 2 h. It is inadvlsable to incubate cells m serum-free DMEM for longer than 2 h, as the cells will begin to lyse because of serum starvatton.
6. To ensure vu-us inactivation after removal from the plate, one may mclude in the trap an agent such as Wescodyne Also, solid waste should be collected as bio- hazard waste and autoclaved before disposal,
120 Duerksen-Hughes and Gooding
7. The protocol grven here labels cells with chrommm overnight; this long of a label- mg penod 1s somettmes, but not always, necessary (tt will depend on the character- istics of the cells being used as targets). A mmimum of 3 h is recommended.
8. Care 1s required when workmg with radiolabeled chrommm. This work should be done using protective clothing, gloves, and eye protection. Personnel also need to be monitored for exposure durmg thts work Addtttonally, any waste (sohd or liquid) generated should be drsposed of m accordance wtth apphcable institu- tional gutdelmes.
9 The spontaneous release should be no more than 30% of the maximum release. A high spontaneous-release value could indicate that the targets are poorly viable, or that you have allowed the assay to run too long
References 1 Whitmore, A C and Goodmg, L. R. (198 I) Spectfictttes of ktllmg by T lympho-
cytes generated against syngeneic SV40 transformants: cross-reacttvtty of the H-2Kbm1 through Kbm4H-2 mutant alleles in Kb-restricted SV40-specific ktllmg J Immunol 127, 1207-1211.
2. Duerksen-Hughes, P. J , Day, D. B., Laster, S M , Zachartades, N. A., Aqumo, L , and Goodmg, L. R. (1992) Both tumor necrosts factor and mtrtc oxide parttct- pate in lysis of Simian Virus 40-transformed cells by activated macrophages J Immunol. 149,2114-2122.
3. Laster, S. M., Wood, J. G., and Gooding, L. R. (1988) Target-mduced changes in macrophage migration may explam differences in lyttc sensttivtty among stmian virus 40-transformed fibroblasts. J Zmmunol 141,221-227.
4. Laster, S. M and Goodmg, L. R. (1990) Evidence that a target-derived soluble factor IS necessary for the selecttve lysts of SV40-transformed fibroblasts by actt- vated mouse macrophages. J. Immunol 144, 1438-1443
Measurement of Tumor Necrosis Factor (TNF) Lysis of Adenovirus-Infected Cells
Joanna L. Shisler and Linda R. Gooding
1. Introduction To mmimtze or prevent the spread of an acute vnus mfectton, the anttvrral
immune response must detect and lyse virus-mfected cells before virus reph- cates or 1s released from the host cell. The immune response has developed both Innate and specific responses to meet this objective. Virus-Infected cells are lysed by cells of the innate immune response such as acttvated macroph- ages and natural killer cells, and by cytokines like tumor necrosis factor (TNF) (1,2). Here, we will discuss methods we developed to measure the cytotoxic capacities of TNF against adenovnus-infected cells.
The TNF cytotoxtcrty assay our laboratory developed requires 3 d from beginning to end. On day one, cells are mfected with adenovnus and labeled with radioactive sodium chromate (NaZ5’Cr04). TNF assay plates are prepared and infected cells are added to TNF on d 2. On d 3, the assay IS harvested, counted on the y-counter and the percent specific lysts induced by TNF is determined. Because not all cells are readily infected with human adenoviruses (especially mouse cells), a control to determine the extent of mfectton is included m every experiment.
2. Materials 1 Adenovirus stocks: Mamtam at -70°C for long-term storage. Store smaller
ahquots of viruses that will be used repeatedly over a short period of time at -20°C Btosafety level 2 precautrons, including gloves and protective clothing, should be observed whtle workmg with adenovtrus or adenovtrus-infected cells,
2. Human recombmant TNF (Genzyme, Frammgham, MA) (5400 U/pL) Store at -7O’C m ahquots (ZO-pL) to mmtmrze repeated freezing and thawing
From Methods m Molecular Medune, Vol 21 Adenovms Methods and Protocols Edlted by W S M Wold 0 Humana Press Inc , Totowa, NJ
721
722 Shlsler and Goodmg
3 NaZ5’C!r0, (1000 Cl/g) (DuPont NEN, Boston, MA). Store at 4°C This compound emlts y-radlatlon, thus appropriate lead shielding and protective gloves and cloth- mg should be employed for mmlmal exposure and protection to personnel
4 NIH-3T3 mouse fibroblast cells (ATCC, Rockvllle, MD) Mamtam m D-MEM (see below) at 37”C, 8% CO,
5 Culture media for mouse cells consists of DMEM (Dulbecco’s modified Eagle’s medmm), containing 5% glutamine, supplemented with 10% fetal calf serum (FCS). Infection of mouse cells requires DMEM with 5% glutamme only (referred to as serum-free DMEM)
6 Sterile flat-bottomed 96-well plates (see Note 1) 7 Trypsm, stored at -20°C. 8 Refrigerated centrifuge, with swinging buckets and mIcrotIter plate carriers 9 Sterile 60-mm plastic tissue-culture plates.
10 Sterile and nonsterile phosphate-buffered salme (PBS), pH 7 4, at room temperature. 11. HBSS (Hank’s balanced salt solution) or other suitable wash solution (4°C) 12. Disposable borosillcate glass tubes 13. 15-mL Centrifuge tubes 14 2 N HCI (room temperature) 15. y-Counter 16. Hemocytometer 17 g-Well chamber slides (glass or plastic) suitable for tissue culture 18. M73 anti-El A antibody (ATCC) I9 FITC-conjugated antlmouse antibody
3. Methods
3.7. infecting and Labeling Adherent Cells
3. I 7. Preparing Cells for Infection-Morning of d 1
Plate 1 x 1 O6 cells (NIH-3T3) into sterile plastic 60-mm tissue-culture dishes, with one 60-mm plate for each virus to be tested and one for uninfected cells (see Note 1). The total volume (cells plus media) should be no more than 2 mL, as a smaller volume of media ensures adherence. Allow cells to adhere (at least 3 h) (see Note 2).
3.1.2. infecting and Labeling Cells-Afternoon of d 7
1 Remove virus aliquots from freezer (-20°C). Thaw viruses quickly at room temperature, then immediately put thawed ahquots on Ice. Before infecting cells, somcate virus allquots for 30 s Somcatlon dlssoclates virus particles from cellular debris created during virus propagation, thus increasing the efficiency of infection.
2 In a tissue-culture hood reserved for biohazard use, remove DMEM media from the cells and briefly rinse each of the plates two times (5 s each time) with 3 mL of serum free DMEM (prewarmed to 37°C) (see Note 3).
TNF Lysis of Adenovirus-Infected Cells 123
3 Add 1.5-2 mL serum free DMEM to each 60-mm plate. Rotate the plates, cover- mg the entire bottom of the plate with serum-free DMEM.
4 Given that the titer of the virus stock 1s known, determine the volume of vrrus needed for 100 PFU/cell using the equation below (see Note 4) For example, if the virus titer is I O9 PFU/mL (plaque-forming units/ml), and there are 1 O6 NIH- 3T3 cells to be infected at an MO1 (multiplicity of infection) of 100 PFU/cell, then 0.100 mL of virus would be added to cells
([(l x lo6 cells) (XPFWcell)] I(YPFUImL)} {[(l x lo6 cells) (100 PFU/cell)] / ( lo9 PFU/mL)} = 0.100 mL vu-us to add to cells
X= PFU/cell = 100 m this example Y = PFU/mL = lo9 m this example
5 In the biohazard tissue-culture hood, add the appropriate amount of virus to a 60-mm plate of NIH-3T3 cells, using a fresh pipet tip for each vu-us stock Gently swn-1 media and virus m each of the 60-mm plates to ensure even distribution of the virus
6 Incubate the 60-mm plates in the Incubator (37”C, 8% CO,) for 90 min, gently swirling the plates every 30 mm (see Note 5)
7. In the biohazard hood, remove the vnus and medium from the cells m the 60-mm plates. Rinse each plate of cells twice with 2 mL serum-free DMEM (prewarmed to 37°C)
8. Add 2 mL DMEM (+lO% FCS) to each of the 60-mm plates and return the 60-mm plates to the 37”C, 8% CO2 incubator
9. In the biohazard hood, prepare the work area for use with radioactive NaZ5’Cr04 Add 200 pCl of Na2 5’Cr04 to each 60-mm plate. Swirl each of the plates gently two or three times to ensure uniform mixing of media and radioactive sodium chromate
10 Return the radlolabeled cells to the 37”C, 8% CO, incubator; incubate cells over- night (see Note 6)
3.2. Adding infected Cells to TNF-Morning of d 2
3.2.7. Preparation of TNF and of Assay Wells
1 Thaw a 20-pL ahquot of hrTNF (5400 U/mL) on ice. Keep TNF on ice at all times. Add 2 @L of hrTNF to 2 mL DMEM (1: 1000 dilution) in a 15-mL centri- fuge tube and place tube on ice This is the TNF stock solution and it 1s stable for 1 wk at 4°C. Return the hrTNF (5400 U/mL) to the -70°C freezer
2. Add 1 85 mL of the stock solution to 3.15 mL DMEM, for a final concentration of 2000 U hrTNF/mL media Keep this tube, and all other tubes containing TNF, on Ice
3 Add 0 5 mL of the 2000 U/mL TNF to 4.5 mL DMEM m a 15-mL centrifuge tube, resultmg in a 200 U/mL concentration. Continue the serial dilutions of TNF for concentrations of 20, 2,0.2, 0.02, and 0.002 U/mL.
4. Flat-bottomed microtlter plates are partitioned as follows: eight horizontal rows labeled A-H, and twelve columns numbered 1-12. Each microtiter plate ~111 provide enough space and reagents for four different groups of adenovl-
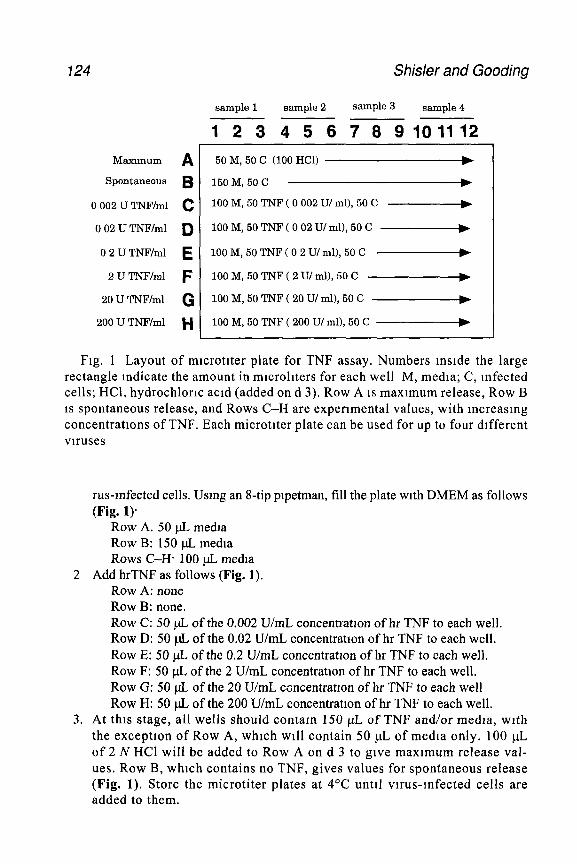
124 Shisler and Gooding
M-mum
Spontaneous
0 002 U TNF/ml
0 02 U TNF/ml
0 2 U TNF/ml
2 U TNF/ml
20 U TNF/ml
200 U TNF/ml
A E? C
D E F G H
sample 1 sample 2 sample 3 sample 4
1 2 3 4 5 6 7 8 9101112
50 M, 50 C (100 HCl) b
150 M, 50 C b
100 M, 50 TNF ( 0 002 U/ml), 50 C -b
100 M, 50 TNF ( 0 02 U/ml), 50 C _____)
100 M, 50 TNF ( 0 2 U/ml), 50 C ______)
100 M, 50 TNF ( 2 U/ ml), 50 C ,-b
100 M, 50 TNF ( 20 U/ ml), 50 C -+
100 M, 50 TNF ( 200 U/ml), 50 C .-W
Fig. 1 Layout of mtcrottter plate for TNF assay. Numbers mstde the large rectangle indicate the amount in mrcrolrters for each well M, medta; C, mfected cells; HCl, hydrochlortc acid (added on d 3). Row A is maxtmum release, Row B IS spontaneous release, and Rows C-H are expertmental values, with mcreasmg concentrations of TNF. Each microttter plate can be used for up to four dtfferent viruses
rus-Infected cells. Usmg an s-tip ptpetman, fill the plate with DMEM as follows (Fig. 1).
Row A. 50 p.L medra Row B: 150 pL media Rows C-H* 100 $ medra
2 Add hrTNF as follows (Fig. 1). Row A: none Row B: none. Row C: 50 p.L of the 0.002 U/mL concentratron of hr TNF to each well. Row D: 50 pL of the 0.02 U/mL concentratton of hr TNF to each well. Row E: 50 p.L of the 0.2 U/mL concentratron of hr TNF to each well. Row F: 50 pL of the 2 U/mL concentratton of hr TNF to each well. Row G: 50 pL of the 20 U/mL concentratron of hr TNF to each well Row H: 50 pL of the 200 U/mL concentratton of hr TNF to each well.
3. At this stage, all wells should contam 150 PL of TNF and/or medra, wrth the exception of Row A, which will contain 50 nL of media only. 100 pL of 2 N HCI will be added to Row A on d 3 to give maximum release val- ues. Row B, which contains no TNF, gives values for spontaneous release (Fig. 1). Store the microtiter plates at 4°C unttl vrrus-Infected cells are added to them.
TNF Lysis of Adenovirus-Infected Cells
3.2.2. Collection of Radiolabeled Cells and Addition of Cells to Microtiter Plates
125
1.
2.
3.
4
5
6. 7
8 9
10
11
Add 10 mL HBSS (4°C) to 15-mL centrifuge tube for each sample. Keep tubes on ice. Remove 60-mm plates from incubator and place m biohazard hood. Pour or pipet off radioactive media into an appropriate lead-shielded container Rinse each of the 60-mm plates twice with 2 mL PBS to remove excess radioactive sodium chromate Pour off the PBS into the same lead-shielded container as above. Add 2 mL trypsm (prewarmed to 37°C) to each of the 60-mm plates of infected cells and incubate the plates in the hood for 1-2 mm. Using either a 2-mL sterile plpet or a sterile cotton-plugged glass pipet, transfer cells from each plate to separate 15-mL centrifuge tubes with HBSS. Return tubes to me immedtately Centrifuge cells at 2508 for 10 mm. Aspirate off wash medium. Add 2 mL DMEM to each of the pellets, resuspend cells, and count cells on the hemocytometer Adjust concentratron of cells to 2 x lo5 cells/ml. Add 50 l.tL (1 x lo4 total cells/well) of the first sample of infected cells to the first three columns in Row A, Row B, and Rows C-H: Thus, each point is m triplicate The next sample of infected cells will be added to columns 4-6 in Rows A-H. The thud sample of cells will be added to columns 7-9 in Row A-H, and so on Cover the mtcrotiter plate with its hd, and incubate at 37’C, 8% CO, for 18 h (see Note 8) Add 50-100 pL of each virus sample to two chambers on the chamber slide These samples will be used to determine the percentage of cells that was infected by that particular adenovtrus construct (see Subheading 3.4.). Incubate the infected cells m the chamber slides overnight at 37°C at 8% CO*
3.3. Harvesting Supernatants and Calculating Percent Specific Lysis-d 3
1 From this point, the experiment can be carried out in a nonsterile environment such as a lab bench. Add 100 pL 2 N HCI to each of the wells in Row A. Mix the contents of the well thoroughly, by pipetting up and down in each well, to ensure complete lysis of cells Change pipet tips in between each well.
2. Centrifuge mtcrotiter plates at 250g for 10 min, usmg a low brake to keep the cell pellet intact.
3. Transfer 100 pL of supernatant from each well into separate borosilicate glass tubes. Do not disrupt the cell pellet. The same pipet ttp can be used for each of triplicates within the row, but change tips between Row A and Row B, Row B and Row C, and so on (see Note 7).
4 Count the cellular supernatant on a y-counter. 5. To analyze the percent specific lysis induced by TNF, average the triplicate
values for each row of each experimental, and use the following equation (see Note 8).
726 Shisler and Gooding
% Specific Lysis = [(experimental - spontaneous release) / (maximum - spontaneous release)] x 100
experimental release = triphcate value for Row C, D, E, F, G, or H; spontaneous release = triplicate value for Row B maximum release = triplicate value for Row A The standard error of the percent specific lysis IS determined as the followmg, where E = SE of experimental, S = SE of spontaneous release, M = SE of maxi- mum release.
%SE = 100 x [(SEE2 + SE,*) / (E-s) (* SE,,,,*) + ti
3.4. Determining Percent infection of Cells-d 3
1 While the microtiter plates are being centrifuged, examme the infected cells m the chamber slides underneath a microscope. Observe and determine the percent- age of cells that are adherent. Infected cells show a rounded morphology, whereas uninfected cells are adherent
2. Remove media from each chamber and then remove the wells of the chamber slide. Rinse the cells twice m a Coplm jar filled with dPBS Remove excess dPBS
3 Incubate the slide m absolute cold methanol (-2O’C) for 10 min At this point, the slides can be stored at -2O’C for up to 1 wk without harmmg the sample. The shdes should be stored in a new tissue-culture plate after it has been sealed with parafllm to prevent drymg
4. Rehydrate the sample m room temperature PBS for 5 mm 5 In Subheading 3.2.2., each sample of vnus-infected cells was plated mto two
wells on a chamber slide. For each vnus, add an anti-adenovnus antibody to one well (our laboratory has used the M73 anti-ElA antibody [ATCC) for the pri- mary antibody), and PBS to the other well. The cells incubated with PBS are a negative control, measuring nonspecific bmding of the secondary antibody.
6 Rinse spot plates three times in room temperature PBS for 5-min mtervals 7 Remove excess PBS, drying around the sample. Add a FITC-conjugated rabbit
antimouse antibody to each sample and Incubate samples for 30-60 mm at 4°C 8. Rmse three times m PBS and remove excess PBS 9. Put a few drops of glycerme on the glass slide, then put a cover slip on, pressmg
out any bubbles. Seal with nail pohsh 10 Examine cells under a fluorescent microscope to determine the percentage of mfection.
4. Notes 1. Modifications for suspension cells
a. Day 1: Use an appropnate volume of suspended cells for 1 x 1 O6 cells into 10 mL serum-free DMEM m a 15-mL conical tube Centrifuge at 250g for 10 mm, aspirate off medium, and resuspend cell pellet m serum-free DMEM Add virus to the cells, and incubate at 37°C for 1 h, resuspendmg cells gently every 15 mm. Centrifuge the tube again for 10 mm at 25Og. Decant the serum- free DMEM and resuspend suspenston cells m 4 mL regular DMEM, and transfer infected cells to a 25-cm3 flask. Add 200 pCi Na251Cr0, to each flask and incubate overnight at 37°C m 8% CO2
TNf Lysis of Adenowrus-Infected Cells
b. Day 2: Transfer cells to a 15-mL centrifuge tube; centrifuge for 10 mm at 250g Remove the supernatant and resuspend the pellet m 2 mL DMEM Pro- ceed, followmg the dtrectlons of those for adherent cells, adding the same amount and concentration of suspension cells to the microtiter plates contain- mg TNF.
2 Trypsin removes surface moieties required for vuus adsorptton and/or penetra- tion Thus, to ensure successful infectton, allow a minimum of 3 h for cells to recover from trypsm treatment before infection.
3 Serum-free DMEM The high level of protein m DMEM + 10% fetal calf serum (FCS) mhtbtts attachment of adenovirus to Its cellular receptor Hence, it IS crttical to use serum free media or media with a low percentage of serum durmg infection
4. The PFU/cell 1s dependent on the cell type In general, a high MO1 IS needed for complete infection of mouse cells and rat cells (100-200 PFU/cell) Human cells require a much lower MO1 (5-20 PFU/cell) for complete infection
5 Incubation for 1 5 h IS generally adequate for infection However, tf the cell lme you are working with is hard to infect, you can increase the amount of mcubatton time with vtrus to 2 h You do not want to incubate cells m serum-free DMEM for longer than 2 h, as serum-free medium will adversely affect cells
6 Efficiency of radtoacttve sodium chromate IS cell-line dependent. Most cell hnes wtll label well with Naz5’Cr0,. To increase the efficiency of uptake m cell lines that take up chrommm poorly, double the amount of radtoacttve chromium added to the cells and incubate for longer periods of time (16-18 h) Minimum labeling time for most cell lines is 6 h.
7. Each well can be drawn from one time Do not release a sample of supernatant back into a well to try a transfer again, as this procedure will give false readings Do not touch the bottom of the plate with the ptpet tip, as this will pick up radio- active cells and give false readings
8. The spontaneous release should be no more than 30% of the maximum release. High spontaneous release values can be indicative of a few situations a The cells are over-infected, and a high percentage of the cells have died from
virus infection alone. Confirm this posstbtlity with cell staining for mfectiv- ity and reduce the amount of virus added to cells.
b The assay has run too long. As stated above, the incubation time of cells with TNF is 18 h. This can be mcreased to 24 h for increased ktllmg, but times longer than this yield higher buffers.
9. There are colortmetrtc-stammg kits available commercially that are good for determining the percent populatton infected by adenovtrus. One such ktt that we have had direct experience with is the LSAB2 kit from the DAK0 Corporatton m Carpinterta, CA. As above, we used the M73 anti-El A antibody and used the kit according to dtrecttons gtven by the manufacturer.
10 Infectton and assay times for mutant El A and E 1B adenovnuses are different Cells infected with an adenovuus mutant that deletes the EIA region should be incubated an extra 24 h after mfection (before labeling the infected cells with
128 Shisler and Goodmg
radioactive sodmm chromate). Adenovirus mutants lackmg the E lB- 19K protein display a cyt cieg phenotype that can result in high spontaneous release of chro- mium Therefore, cells infected with adenovirus constructs that mutate the ElB region must be assayed m the followmg short time-course d 1 (PM+plate down 7.5 x 10 5 cells m 60-mm plates, allowing for doublmg time. d 2 (9 AM), Infect cells for 1.5 h, label cells immediately after infection with 300 pCi radioactive sodmm chromate per 60-mm plate Incubate for 6 h, then add infected cells to the microtiter plates contaming TNF Incubate for 16-18 h. d 3-harvest superna- tants as previously described.
References 1 Goodmg, L R., Elmore, L W , Tollefson, A E , Brady, H A., and Wold, W S
M. (1988) A 14,700 MW protein from the E3 region of adenovuus mhibits cytolysts by tumor necrosis factor Cell 53,34 l-346
2 Goodmg, L R , Ranheim, T. S., Tollefson, A E , Aqumo, L , Duerksen-Hughes, P , Horton, T. M , and Weld, W. S M. (1991) The 10,400- and 14,500-dalton proteins encoded by region E3 of adenovirus function together to protect many but not all mouse cell lines agamst lysis by tumor necrosis factor J Vwol 65, 4114-4123
11
Role of Natural Killer (NK) Cells in Immunity to Adenoviruses
John M. Routes
1. Introduction Natural killer (NK) cells have become increasingly recognized as integral
members of the host cellular immune response. The purpose of this section is to review the general biology of NK cells, their role in anttadenoviral immunity, and outline the most commonly used method to assess NK-cell lytic function.
1.1. Cellular Immunity: Key Immunologic Defense Against Adenoviruses
Human adenoviruses (Ad) are ubiquitous human pathogens. They are com- monly associated with respiratory, ocular, and gastrointestinal infections. Although Ad can cause persistent infections, they are usually self-limited m the immunocompetent host. Cell-mediated immunity appears to be the piv- otal immunological defense in limiting Ad infections. Clinical observations demonstrate that disseminated infections occur almost exclusively in patients with impaired cellular immunity, but not those with impaired humoral immunity (I-4].
Ad have not been found to be oncogenic in humans, despite their well-known ability to transform mammalian cells in vitro, including human cells (5). The reasons for Ad’s apparent lack of oncogenicity in humans are unclear; how- ever, studies in rodents indicate that cellular immunity is the critical host defense against Ad-transformed cells. Group A Ad (Ad serotype 12, Ad12) and group C Ad (Ad serotypes 2 and 5, Ad2/5) are equivalently competent to transform primary rodent cells (6,7). However, only group A Ad and cells trans- formed by group A Ad are tumorigenic in immunocompetent rodents (8,9).
From Methods in Molecular Medicme, Vol. 21: Adenovws Methods and Protocols Ed&d by. W. S M Wold Q Humana Press Inc., Totowa, NJ
729
130 Routes
The oncogenicity of both group A Ad and group C Ad-transformed cells is markedly increased in immunosuppressed animals (I@-12). Extrapolation of these results to humans indicates that cellular immunity is likely involved in the prevention of Ad-induced malignancy.
Cellular immunity consists of two components, an early appearing, non- major histocompatibility complex (MHC)-restricted component and a later, Ag specific component. Early, nonspecific cellular immunity includes macroph- ages, neutrophils, and natural killer cells, whereas specific cellular immunity includes cytotoxic T lymphocytes and T-helper cells.
NK cells are a lymphocyte subpopulation that do not express either the CD3 antigen or the T-cell receptor (alpha/beta or gamma/delta). NK cells mediate cytolytic reactions that do not require expression of either class I or class II MHC Ags on target cells. NK cells commonly express certain cell-surface markers such as CD16 (FcyRIII) and CD56 (isoform of N-CAM) in humans and NKl. I (NKR-Pl) and NKl.2 in certain strains of mice (13).
NK-cell killing can be augmented by a number of cytokines, in particular IL-2, IL-12, and interferons (IFN-a, -0, or -y). Lymphocyte-activated killer cells (LAK) are lymphocytes that mediate non-MHC-restricted cytotoxicity following activation with IL-2, IL- 12, IFN, or with other cytokines. LAK con- sist of both T lymphocytes and NK cells (14-16). In general, LAK generated in short-term cultures with cytokines (24 h) are derived primarily from NK cells. In long-term cultures with IL-2, there is a substantial contribution of T lym- phocytes to the LAK activity.
Apart from their lytic capacity, NK cells exert important immunomodulatory functions. In part, these activities of NK cells appear to be mediated by their capacity to secrete growth factors and cytokines, in particular IFN-y. NK cells augment cell-mediated immune responses and are an important immunologic defense against certain malignancies and some bacterial, viral, and parasitic infections (17-24).
1.2. NK Lysis of Ad-infected or Transformed Cells is Serotype Dependent
Early studies using either Ad-transformed rat or hamster cells established that there is an inverse correlation between the oncogenicity of Ad-transformed cells and their sensitivity to lysis by NK cells (25,26). Rodent cells transformed by group C Ad (Ad2, Ad5) are sensitive to NK-cell lysis and are non- tumorigenic, whereas Ad-12-transformed cells are resistant and oncogenic. Transfection of the Ad5El genes into NK resistant, tumorigenic Adl2-trans- formed cells decreased their tumorigenicity with a concomitant induction of NK susceptibility (27). (The El coding region consists of both the ElA and E 1 B genes.)
NK Cells and Adenovirus immunity 131
The ElA gene solely governs the difference in the cytolytic susceptibility between Ad12- and Ad2/5transformed cells. In contrast to Ad12 El A, expres- sion of Ad2/5 El A gene products in either Ad-infected or Ad-transformed rodent cells induces an increased sensitivity to NK-cell lysis (28-30). Interest- ingly, although Ad2/5transformed human cells are sensitive to NK-cell lysis, AdY54nfected cells are not (31,32). This inability of ElA produced in the context of Ad-infection to induce susceptibility to NK-cell lysis might contrib- ute to their proclivity to cause persistent infections in humans.
The capacity of Ad2/5 ElA to induce susceptibility to NK-cell lysis is rel- evant to the low oncogenicity of Ad2/5-transformed cells or Ad2/5 ElA- expressing tumor cells in vivo (33-38). For example, in vivo depletion of rat NK cells with antiasialo GM1 antibody enhances the tumorigenicity of Ad2- transformed rat cells without affecting T cell proliferative responses (39). Transfection of the Ad5 El A gene into highly oncogenic sarcoma cells increases their susceptibility to NK-cell lysis with a concomitant reduction in their tumorigenicity. In vivo depletion studies with antiasialo GM1 show that rejection of these El A-expressing tumor cells is NK cell dependent (36,38). Other studies show that the inability of newborn rats to reject Ad5 ElA- expressing sarcoma cells is related to a developmental lack in NK-cell lytic function. Maturation of NK lytic function with time correlates with the ability to reject El A-expressing sarcoma cells in vivo (37). In summary, these data suggest that the difference in oncogenicity between Ad12 and Ad2/5 may be explained at least in part by the capacity of NK cells to reject Ad2/5- but not Ad124ransformed cells in vivo. NK-cell lytic activity appears important in mediating the rejection of Ad2/5 El A-expressing tumor cells.
7.3. Molecular Basis for NK-Cell Killing of Ad215 ElA-Expressing Cells
There are many possible explanations for the induction of cytolytic suscep- tibility by Ad2/5 El A and lack thereof by Ad12 El A. The difference in the susceptibility between Ad1 2- and Ad2/5-transformed cells to lysis by NK cells could be the result of a lack of NK cell binding and target-cell recognition of Ad12-transformed cells or enhanced binding of Ad2M-transformed cells. How- ever, early studies indicated that both Ad2- and AdlZtransformed cells are equivalently bound by NK cells (25). An alternative hypothesis, which is sup- ported by a recent study, suggests that Ad2/5 ElA sensitizes target cells to destruction by killer cells independently of cell-surface recognition phenomena.
Cytotoxic lymphocytes, including NK cells, kill target cells through two major mechanisms. One pathway involves degranulation and secretion of the pore-forming protein, perforin. Alternatively, there is a nonsecretory pathway that relies on inducible expression of fas ligand on killer cells interacting with
132 Routes
the apoptosis-inducing fas molecule on the target cell (40-42). Ad2/5 El A expression sensitizes target cells to both of these killing mechanisms mde- pendently of target-cell recognition (43). Whether Ad12 El A lacks the capacity to sensitize rodent cells to perforin and fas-dependent killing remains to be determined.
One mechanism that does not explain the differences in NIX-cell killing of Ad12 and Ad2/5 transformed cells is the modulation of NK function by target- surface class I Ag. In many model systems there is an inverse correlation between the levels of class I MHC antigens expressed on target cells and their sensitivity to NK-cell lysis (4). There are two explanations for this corre- lation. Surface class I molecules could interfere with the recognition of target- cell ligands by receptors on NK cells. Alternatively, class I molecules could bmd directly to NK-cell receptors such as Ly-49 leading to an inhibitory or “off’ signal (48). However, studies to date using both virally infected or virally transformed cells indicate that the regulation of cytolytic susceptibility is inde- pendent of class I MHC levels in the Ad system.
El A expression in Ad12-transformed cells markedly decreases class I Ag expression (49,X)). However, as pointed out previously, Ad1 2-transformed cells are resistant to NK-cell lysis. Furthermore, stable transfection of Ad12- transformed mouse cells with Ad5 El renders these ceils susceptible to NK- cell lysis without altering class I Ag expression (27).
In contrast to Ad1 2 El A, Ad2/5 E 1 A expression does not consistently alter class I Ag expression in virally transformed cells (51,52). Therefore, Ad2/5- E 1 A expressing tumor cells may express either very low or very high levels of surface class I MHC Ags. However, even when Ad2/5 El A-expressing cells express significantly higher levels of class I Ag than the parental cells, they are still susceptible to NK lysis.
Although contradictory findmgs have been published, in some cases the inhibitory effect of class I molecules can be overcome by the binding of foreign peptides (e.g., viral peptides) by class I Ags (53,5#). This does not appear to be the reason for the Ad2/5 ElA induction of NK susceptibility. Using a series of Ad2/5 ElA mutants, Krantz et al. showed that the capacity of El A to induce cytolytic susceptibility does not map to a single ElA-peptide- coding region and requires sequences present both in exon 1 and exon 2 of ElA (55).
The results cited previously used non-cytokine-activated NK cells. Studies have also been performed in the Ad-system using LAK- and IFN-activated NK cells. IFN effects on NK-cell-target-cell killing are complex. IFN augments the cytolytic capacity of NK cells. IFN also increases the resistance of target cells to lysis by IFN-activated NK cells, a process that can be blocked by infec- tion with some viruses (54,56,57). It has been proposed that the induction of
NK Cells and Adenovirus Immunity 733
cytolytic resistance by IFN rests with its capacity to increase the surface expression of class I MHC Ags on target cells (58). However, again this rela- tionship does appear to apply m the Ad-system.
IL-2-activated rat LAK kill Ad12-transformed rodent cells. IFN-treatment of these cells increases class I MHC without changing the sensitivity of these cells to lysis by LAK (39). IFN-activated NK cells nonselectively kill Ad2/5- infected and uninfected human cells. IFN-treatment of uninfected target cells induces class I Ag expression and reduces their susceptibility to NK-cell lysis. In contrast, although IFN-treatment of Ad-infected cells increases class I Ag expression to a similar extent as IFN-treated, uninfected cells, it does not pro- tect infected cells from NK-cell lysis (59). The capacity of Ad to block the protective effect of IFN is solely dependent on the expressron of El A gene products, does not involve ElA peptidtilass I binding, and maps to the ~300 binding site of E 1 A (60,61).
1.4. Measurement of NK=Cell Lytic Activity
Standard NK cytolysis assays measure the ability of NK cells to kill certain target cells (tumor cells, virally infected cells) in short-term (usually 4-6 h) cytolysis assays. This assay can easily be adapted to the Ad-system by the inclusion of appropriate Ad-infected or Ad-transformed target cells. NK-sensi- tive targets such as K562 (human leukemia-cell line) or YAC-1 (mouse lym- phoma-cell line) are usually included as positive controls in human and murine NK assays, respectively. However, NK-susceptible, Ad-infected, or Ad-trans- formed cell lines can be substituted as positive controls for K562 or YAC- 1.
To measure the susceptibility of a target cell to NK-cell lysis, a constant number of target cells are labeled with 5*Cr and incubated with graded num- bers of NK cells (effector cells). Sufficient period of time should be allowed for target-cell lysis, which is measured by radiolabel released into the supema- tant. Although other nonradioactive methods of measuring NK cell killing have been developed, these protocols have yet to be widely accepted or used.
Effector cells for NK-cytolysis assays may include NK-cell clones, highly purified populations of NK cells, freshly isolated human peripheral-blood- mononuclear cells, or rodent mononuclear cells, the latter usually obtained from the spleen. This section specifically covers the isolation of human- and rodent-mononuclear cells for use in NK assays.
NK-cytolysis assays should be performed at multiple effector- to target-cell ratios. Effector-to-target ratio (E:T) refers to the ratio of the total number of effector cells to target cells. When using unpurified populations of mononuclear cells as a source of NK cells, effector-cell number refers to the total number of mononuclear cells, not just NK cells. Results are commonly presented graphi- cally as a percent of specific target-cell lysis at each effector to target-cell
134 Routes
ratio. Another common method of presenting NK-killing data is by calculatmg lytic units, which is derived from the NK-killing curve. Lytic units are defined as the number of effector cells (NK cells) required to kill a specific number of target cells (62).
2. Materials
2.1. Materials for Isolation of Rodent Mononuclear Cells
1. RPMI-10% FCS: RPM1 media (Gibco/BRL, Gaithersburg, MD, cat. no. 320/ 1870AJ), 10% fetal calf serum (FCS), heat inactivated at 56°C for 1 h, 2 mM L-glutamine, pemcillin G (1000 U/mL) and streptomycin (100 pg/mL).
2. RBC lysing buffer: NH&I (8 29 g/L), KHC03 (1 .O g/L), and EDTA (0 0372 g/L). Add to 1000 mL, filter with 0.22~pm filter, aliquot (85 mL) m bottles and refrig- erate. Add 15 mL endotoxin free, heat inactivated FCS prior to use.
3. Hank’s balanced buffer solution (HBBS). 4. Sterile scissors and forceps. 5. loo-Mesh wire sieve. 6. Freshly removed spleens from mice, hamsters, or rats (2-5-mo old). 7. Equipment and reagents for counting viable cells (e.g., trypan blue 0.1%
and hemocytometer).
2.2. For Isolation of Human-Peripheral-Blood Mononuclear Cells
1. RPM&IO, HBBS. 2. Ficoll-Hypaque solution (Ficoll-Paque, Pharmacia, Piscataway, NJ). 3. Heparin sulfate (1000 U/mL) 4. Equipment for drawing blood. Caution: Standard biosafety procedures must
be followed when using human blood. Donors should screened by serology for hepatitis B, hepatitis C, and HIV-l prior to isolation of blood mono- nuclear cells.
2.3. Materials for NK Cytolysis Assay
1. Targets (Ad-infected or Ad-transformed cell lines). Usually include YAC-1 or K562 cells (positive controls) when performing rodent- or human-NK-cytolysis assays, respectively.
2. RPMI-10. 3. Mononuclear cells. 4. 96-Well, tissue-culture-treated, flat-bottomed plates 5. NazS’Cr04: sodium chromate in normal sterile saline, 1 mCi/mL (NEN
Research Products, Boston, MA; cat. no. NEZ-0305). 6. 0.5% Sodium dodecyl sulfate (SDS). 7. Multichamber pipets (~200 mL). 8. 51Cr counting tubes. 9. y-Scintillation counter.
NK Cells and Adenovirus Immunity 735
3. Methods
3.1. Isolation of Mononuclear Cells from Spleen
1. Remove spleen under sterile conditions and place into a 60 x 15mm Petri dish containing 5-10 mL of cold HBSS.
2. Cut spleen into half, and puncture repeatedly with 19-gage needle. Remove splenocytes by repeatedly perfusing spleen with cold HBSS solution using 6-mL syringe and 1 g-gage needle. Remainder of splenocytes may be removed by teas- ing and crushing with forceps. Process is complete when only predominately white, fibrous trssue remains.
3. Centrifuge (200g for 10 min). Resuspend pellet in 5 mL cold RBC lysing solu- tton on ice for 5 min. Add 10 mL HBSS, and centrifuge (200g for 10 min). Wash pellet twice with HBBS.
4. Resuspend pellet with 5-l 0 mL RPMI- 10. Pass remaining cells through 1 00-mm mesh wire sieve (2OOmm nylon mesh may be substituted), and count viable cells. Resuspend splenocytes at the following concentrations: mouse: 4 x 10’ cells/ml; hamster or rat: 2 x lo7 cells/ml (see Note 1).
3.2. Isolation of Mononuclear Cells from Human-Peripheral Blood
1. Draw peripheral blood mto a 30 to 60-mL syringe containing roughly 3-4 mL sterile heparin-sulfate solution (1000 U/mL) and mix.
2. Mix equal volume of warm HBSS to heparinized blood in sterile container. 3. Hold 15-mL, polystyrene centrifuge tube at 45O angle and slowly pipet 10 mL
HBSS/blood over 5 mL Ficoll-Hypaque solution. It is imperative that one maintains a sharp Ficoll-blood interface for optimal separatton of mono- nuclear cells.
4. Centrifuge (room temp) 30 min at 9OOg; brake off. 5. Carefully remove tubes from the centrifuge. There are four layers: The large top
layer contains plasma and platelets, the second narrow layer contains mono- nuclear cells, followed by a larger Ficoll-Hypaque layer, and RBCYgranulocytes at the bottom of the tube (see Note 2).
6. Remove the upper layer and discard. Carefully remove the thin mononuclear-cell layer and transfer to centrifuge tube.
7. Wash cells three times with HBSS. In the initial wash, dilute mononuclear cells with at least threefold excess (v/v) of HBBS and spin at 500g for 10 min. The remainder of the centrifugations can be performed (at 200-300g for IO min).
8. Resuspend mononuclear-cell pellet in an appropriate volume of RPMI-10 and count viable cells by trypan blue exclusion (see Note 1). Resuspend cells at a final concentration of 1 x lo7 cell/mL.
3.3. Target-Cell Preparation
1. l-2 x 1 O6 target cells are passaged into fresh media the night before the cytolysis assay (see Note 3).
136 Routes
2. Prepare approx l-3 x lo6 target cells into a single cell suspension in RPMI-10. 3. Centritbge at 2008 for 10 min, pour off supernatant, and gently resuspend cells
(do not vortex) in remaining 100-200 $ of media. Add 100 $ of heat-macti- vated, LPS-free FBS.
4. Add 100 pCi 51Cr, gently resuspend, and incubate in 37°C water bath for 1 h. Gently resuspend every 15 min. Increased incubation times (1.5 h) and/or 5’Cr (up to 200 PC) may be added if cells insufficiently label (see Note 6).
5. 5’Cr-labeled target cells are washed two times in HBSS (15 mL). Resuspend pel- let in 10 mL of RPMI- 10 and incubate additional 30-45 min (mix every 15 min) in 37’C water bath. (This additional purging step decreases the spontaneous release of radiolabel) (see Note 5).
6. Centrifuge, resuspend pellet in complete media; count viable cells by trypan blue exclusion, and resuspend cells at a final concentration of 5 x 1 O4 cells/ml. For most targets, IO“ targets/well are used in cytolysis assays.
3.4. Cytolysis Assays
1. Unless limited by number of mononuclear cells (effector cells) or target cells, one should generate killing curves using different E:T ratios (effecter/target cell ratios). In general, make serial twofold dilutions of mononuclear cells prior to the addition of targets. Beginning and ending E:T ratios vary with the source of mononuclear cells. Typical killing curves use E:T ratios from 4OO:l to 25:l (mouse); 200: 1 to 12:l (hamster, rat) and 100: 1 to 6: 1 (human).
2. For each effector-cell concentration, pipet (in triplicate) 100 pL of the mono- nuclear cell preparation m the wells of a 96-well tissue-culture plate.
3. Add 0.2 mL of labeled target cells (1 x lo4 cells/well) to replicate wells contain- mg effector cells. Additionally, target cells are added in triplicate to wells con- taming 100 pL of complete media and 100 pL of 0.5% SDS.
4. Carefully centrifuge plates (200g) for 1 min (brake off) to enhance contact between target and effector cells. Incubate plates for 4-6 h at 37”C, 5% COz incubator.
5. Using a multichamber pipet, carefully harvest 150 pL of supernatant and transfer to 5*Cr-counting tubes. Avoid disturbing cells at the bottom of the plate. For wells with 0.5% SDS, gently pipet several times before final harvest.
6. Count samples in y-scintillation counter. 7. Calculate percent specific release (see Notes 2 and 4) for each E:T ratio using the
arithmetic mean of triplicate cultures and usmg the following formula:
% specific release = (experimental release - spontaneous release) / (total release - spontaneous release)
total release = 51Cr released from wells with 0.5% SDS; spontaneous release = 5’Cr released from wells with RPM&lo; experimental release = 51Cr released from wells with effector cells.
8. Calculate percent spontaneous release (see Note 5):
% spontaneous release = 100 x (spontaneous release) / (total release)
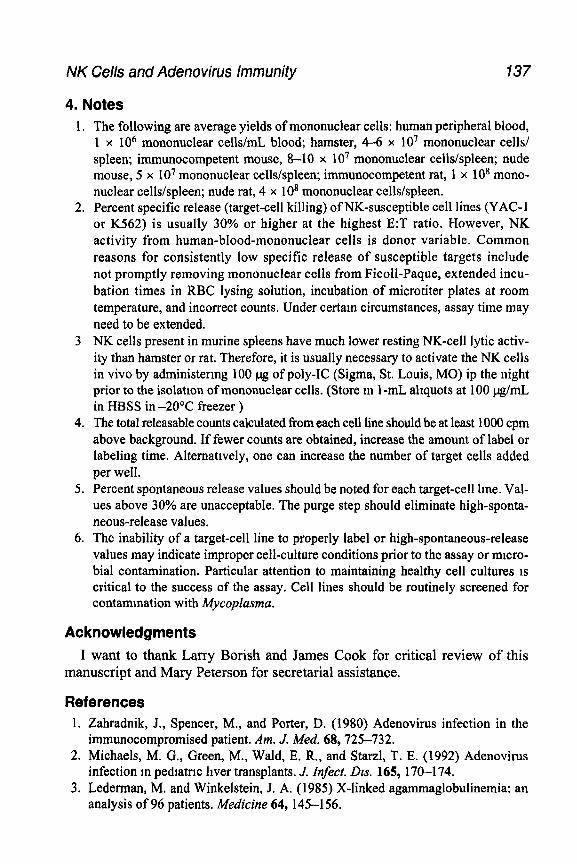
NK Cells and Adenovirus immunity 137
4. Notes 1. The following are average yields of mononuclear cells: human peripheral blood,
1 x IO6 mononuclear cells/ml blood; hamster, 4-6 x lo7 mononuclear cells/ spleen; immunocompetent mouse, 8-10 x lo7 mononuclear cells/spleen; nude mouse, 5 x lo7 mononuclear cells/spleen; immunocompetent rat, 1 x lo8 mono- nuclear cells/spleen; nude rat, 4 x lo8 mononuclear cells/spleen.
2. Percent specific release (target-cell killing) of NK-susceptible cell lines (YAC-1 or K562) is usually 30% or higher at the highest E:T ratio. However, NK activity from human-blood-mononuclear cells is donor variable. Common reasons for consistently low specific release of susceptible targets include not promptly removing mononuclear cells from Ficoll-Paque, extended incu- bation times in RBC lysing solution, incubation of microtiter plates at room temperature, and incorrect counts. Under certain circumstances, assay time may need to be extended.
3 NK cells present in murine spleens have much lower resting NK-cell lytic activ- ity than hamster or rat. Therefore, it is usually necessary to activate the NK cells in vivo by administermg 100 pg of poly-IC (Sigma, St. Louis, MO) ip the night prior to the isolatton of mononuclear cells. (Store m 1 -mL ahquots at 100 pg/mL in HBSS in -20°C freezer )
4. The total releasable counts calculated from each cell line should be at least 1000 cpm above background. If fewer counts are obtained, increase the amount of label or labeling time. Alternatrvely, one can increase the number of target cells added per well.
5. Percent spontaneous release values should be noted for each target-cell lure. Val- ues above 30% are unacceptable. The purge step should eliminate high-sponta- neous-release values.
6. The inability of a target-cell line to properly label or high-spontaneous-release values may indicate improper cell-culture conditions prior to the assay or mtcro- bial contamination. Particular attention to maintaining healthy cell cultures is critical to the success of the assay. Cell lines should be routinely screened for contamination with Mycoplasma.
Acknowledgments I want to thank Larry Borish and James Cook for critical review of this
manuscript and Mary Peterson for secretarial assistance.
References 1. Zahradnik, J., Spencer, M., and Porter, D. (1980) Adenovirus infection in the
immunocompromised patient. Am. J. Med. 68,725-732. 2. Michaels, M. G., Green, M., Wald, E. R., and Starzl, T. E. (1992) Adenovirus
infection m pediatric ltver transplants. J. Znfect. Dzs. 165, 170-174. 3. Lederman, M. and Winkelstein, J. A. (1985) X-linked agammaglobulinemia: an
analysis of 96 patients. Medicine 64, 145-156.
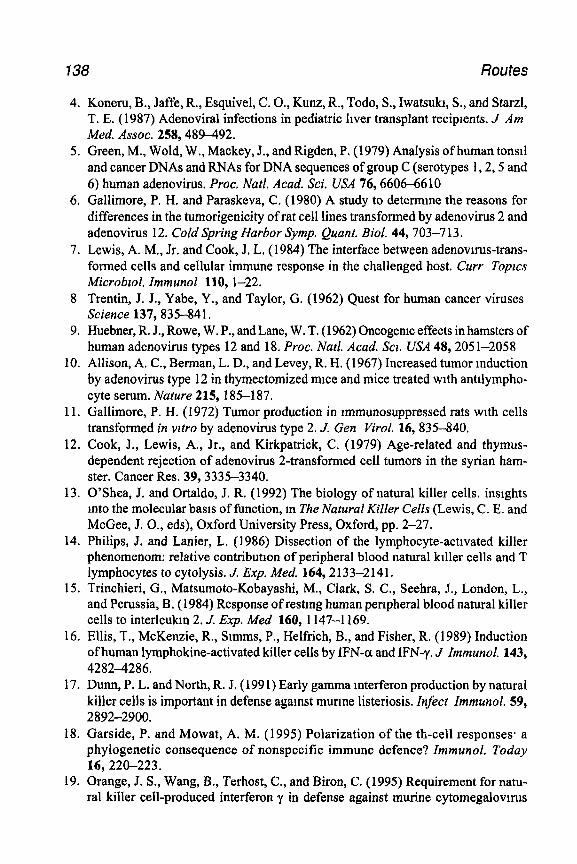
138 Routes
4. Koneru, B., Jaffe, R., Esquivel, C. O., Kunz, R., Todo, S., Iwatsukr, S., and Starzl, T. E. (1987) Adenoviral infections in pediatric liver transplant reciprents. J Am Med. Assoc. 258,489-492.
5. Green, M., Weld, W., Mackey, J., and Rigden, P. (1979) Analysis of human tonsil and cancer DNAs and RNAs for DNA sequences of group C (serotypes 1,2,5 and 6) human adenovirus. Proc. Natl. Acad. Sci. USA 76,6606-6610
6. Gallimore, P. H. and Paraskeva, C. (1980) A study to determine the reasons for differences in the tumorigenicity of rat cell lines transformed by adenovirus 2 and adenovirus 12. Cold Spring Harbor Symp. Quant. Biol. 44,703-7 13.
7. Lewis, A. M., Jr. and Cook, J. L. (1984) The interface between adenovnus-trans- formed cells and cellular immune response in the challenged host. Curr Topzcs Microblol. Immunol 110, l-22.
8 Trentin, J. J., Yabe, Y., and Taylor, G. (1962) Quest for human cancer viruses Science 137,835-84 1.
9. Huebner, R. J., Rowe, W. P., and Lane, W. T. (1962) Oncogemc effects in hamsters of human adenovirus types 12 and 18. Proc. Natl. Acad. SCL USA 48,2051-2058
10. Allison, A. C., Berman, L. D., and Levey, R. H. (1967) Increased tumor induction by adenovirus type 12 in thymectomized mice and mice treated with anttlympho- cyte serum. Nature 215, 185-187.
11. Gallimore, P. H. (1972) Tumor production in mnnunosuppressed rats with cells transformed in wtro by adenovirus type 2. J. Gen Virol. 16,835-840.
12. Cook, J., Lewis, A., Jr., and Kirkpatrick, C. (1979) Age-related and thymus- dependent rejection of adenovirus 2-transformed cell tumors in the Syrian ham- ster. Cancer Res. 39,3335-3340.
13. O’Shea, J. and Ortaldo, J. R. (1992) The biology of natural killer cells. insights into the molecular basis of function, m The Natural Killer Cells (Lewis, C. E. and McGee, J. O., eds), Oxford University Press, Oxford, pp. 2-27.
14. Philips, J. and Lanier, L. (1986) Dissection of the lymphocyte-activated killer phenomenom: relative contribution of peripheral blood natnral killer cells and T lymphocytes to cytolysis. J. Exp. Med. 164, 2133-2141.
15. Trinchieri, G., Matsumoto-Kobayashi, M., Clark, S. C., Seehra, J., London, L., and Perussia, B. (1984) Response of restmg human peripheral blood natural killer cells to interleukm 2. J. Exp. Med 160, 1147-l 169.
16. Ellis, T., McKenzie, R., Smuns, P., Helfrich, B., and Fisher, R. (1989) Induction of human lymphokine-activated killer cells by IFN-a and IFN-y. .I Zmmunol. 143, 4282-4286.
17. Dunn, P. L. and North, R. J. (199 1) Early gamma mterferon production by natural killer cells is important in defense against murme listeriosis. Infect Zmmunol. 59, 2892-2900.
18. Garside, P. and Mowat, A. M. (1995) Polarization of the th-cell responses* a phylogenetic consequence of nonspecific immune defence? Immunol. Today 16,220-223.
19. Orange, J. S., Wang, B., Terhost, C., and Biron, C. (1995) Requirement for natu- ral killer cell-produced interferon y in defense against murine cytomegalovuus
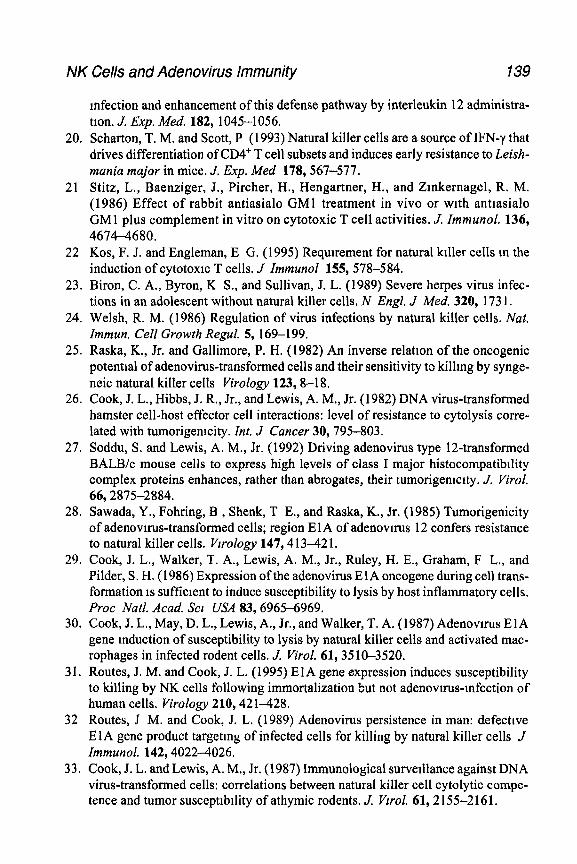
NK Cells and Adenovirus Immunity 139
infection and enhancement of this defense pathway by interleukin 12 administra- tron. J, Exp. Med. 182, 1045-1056.
20. Scharton, T. M. and Scott, P (1993) Natural killer cells are a source of IFN-y that drives differentiation of CD4+ T cell subsets and induces early resistance to Leish- mania major in mice. J. Exp. Med 178,567-577.
21 Stitz, L., Baenziger, J., Pircher, H., Hengartner, H., and Zmkernagel, R. M. (1986) Effect of rabbit antiasialo GM1 treatment in vivo or with anttasialo GM1 plus complement in vitro on cytotoxic T cell activities. J. Zmmunol. 136, 4674-4680.
22 Kos, F. J. and Engleman, E G. (1995) Requnement for natural hller cells m the induction of cytotoxic T cells. J Immunol 155, 578-584.
23. Biron, C. A., Byron, K S., and Sullivan, J. L. (1989) Severe herpes virus infec- tions in an adolescent without natural killer cells. N Engl. J Med. 320, 173 1.
24. Welsh, R. M. (1986) Regulation of virus infections by natural killer cells. Nat. Immun. Cell Growth Regul. 5, 169-199.
25. Raska, K., Jr. and Gallimore, P. H. (1982) An inverse relation of the oncogenic potential of adenovirus-transformed cells and their sensitivity to killing by synge- neic natural killer cells Virology 123,8-18.
26. Cook, J. L., Hibbs, J. R., Jr., and Lewis, A. M., Jr. (1982) DNA virus-transformed hamster cell-host effector cell interactions: level of resistance to cytolysis corre- lated with tumorigemcity. Int. J Cancer 30,795-803.
27. Soddu, S. and Lewis, A. M., Jr. (1992) Driving adenovirus type 12-transformed BALB/c mouse cells to express high levels of class I major histocompatibility complex proteins enhances, rather than abrogates, their tumorigemctty. J. Viral. 66,2875-2884.
28. Sawada, Y., Fohring, B , Shenk, T E., and Raska, K., Jr. (1985) Tumorigenicity of adenovu-us-transformed cells; region ElA of adenovnus 12 confers resistance to natural killer cells. Vzrology 147,4 13-42 1.
29. Cook, J. L., Walker, T. A., Lewis, A. M., Jr., Ruley, H. E., Graham, F L., and Pilder, S. H. (1986) Expression of the adenovirus ElA oncogene during cell trans- formation is sufficient to induce susceptibility to lysis by host inflammatory cells. Proc Natl. Acad. Scl USA 83,6965-6969.
30. Cook, J. L., May, D. L., Lewis, A., Jr., and Walker, T. A. (1987) Adenovnus El A gene induction of susceptibility to lysis by natural killer cells and activated mac- rophages in infected rodent cells. J. Viral. 61,3510-3520.
3 1. Routes, J. M. and Cook, J. L. (1995) ElA gene expression induces susceptibility to killing by NK cells following immortalization but not adenovnus-infection of human cells. Virology 210,421-428.
32 Routes, J M. and Cook, J. L. (1989) Adenovirus persistence in man: defective ElA gene product targeting of infected cells for killing by natural killer cells J Immunol. 142,4022-4026.
33. Cook, J. L. and Lewis, A. M., Jr. (1987) Immunological surveillance against DNA virus-transformed cells: correlations between natural killer cell cytolytic compe- tence and tumor susceptibtlity of athymic rodents. J. Vzrol. 61,2 155-2 16 1.
140 Routes
34. Lewis, A. M., Jr. and Cook, J. L. (1985) A new role for DNA virus early proteins in viral carcinogenesis. Science 227, 15-20.
3 5. Kenyon, D. J. and Raska, K., Jr. (1986) Region El A of highly oncogenic adenovnus 12 in transformed cells protects against NK but not LAK cytolysis. viro/ogv 155,644654.
36. Walker, T. A., Wilson, B. A., Lewis, A. M., Jr., and Cook, J. L. (1991) E IA oncogene induction of cytolytic susceptibility eliminates sarcoma cell tumorige- nicity. Proc. Natl. Acad Sci. USA 88,6491-6495.
37. Cook, J. L , Ikle, D. N., and Routes, B. A. (1995) Natural killer cell ontogeny in the athymic rat. Relationship between functional maturation and acquired resistance to ElA oncogene-expressing sarcoma cells. J. Immunol. 155,5512-5518.
38. Cook, J. L., Wilson, B. A., Wolf, L. A., and Walker, T. A. (1993) El A oncogene expression level in sarcoma cells: an independent determinant of cytolytic sus- ceptibility and tumor rejection. Oncogene 8,625-635.
39. Kenyon, D. J., Dougherty, J., and Raska, K., Jr. (1991) Tumorigenicity of aden- ovirus-transformed cells and their sensitivity to tumor necrosis factor a and NW LAK cell cytolysis. Vzrulugy 180,8 18-821.
40. Arase, H., Arase, N., and Saito, T. (1995) Fas-mediated cytotoxicity by freshly isolated natural killer cells. J Exp. Med. 181, 1235-1238.
41. Vujanovic, N. L., Nagashima, S., Herberman, R. B., and Whitestde, T. L. (1996) Nonsecretory apoptotic killing by human NK cells. J. Immunol. 157, 1117-l 126.
42, Kagi, D., Lederman, B., Bilrki, K., Zinkernagel, R., and Hengartner, H. (1996) Molecular mechanisms of lymphocyte-mediated cytotoxicity and their role in unmu- nological protection and pathogenesis m vivo. Ann. Rev. Immunol. 14,207-232
43. Cook, J. L., Potter, T. A., Bellgrau, D., and Routes, B. A. (1996) El A oncogene expression m target cells induces cytolytic susceptibility at a post-recogmtion stage in the interaction with ktller lymphocytes. Oncogene 12, 833-842.
44 Ljunggren, H -G. and Karre, K. (1986) Variations in MHC antigen expression on tumours and its significance. Experimental strategtes and interpretations m the analy- sis of changes in MHC gene expression during tumour progression. Opposing influ- ences of T cell and natural killer mediated resistance. J Zmmunogenet 13, 141-15 1.
45. Hoglund, P., Glas, R., Ohlen, C., Ljunggren, H.-G., and Karre, K. (1991) Alter- ation of the natural killer repertoire m H-2 transgenic mice: specificity of rapid lymphoma cell clearance determined by the H-2 phenotype of the target. J Exp Med. 174,327-334.
46. Hoglund, P., Ohlen, C., Carbone, E., Franksson, L., LJunggren, H.-G , Latour, A., Koller, B., and Karre, K. (1991) Recognition of b2-microglobulin-negative (b2m-) T-cell blasts by natural killer cells from normal but not from b2m- mace* nonresponsiveness controlled by b2m- bone marrow in chimeric mice. Proc. Nat1 Acad SCL USA 88,10332-10336.
47. Liao, N.-S., Bix, M., Zijlstra, M., Jaenisch, R, and Raulet, D. (1991) MIX class I deficiency susceptibility to natural killer (AK) cells and impaned NK activity. Scrence 253,199.
48. Daniels, B. F., Karlhofer, W. E., Seamen, W. E., and Yokoyama, W. M. (1994) A natural killer cell receptor specific for a major histocompatibtlity complex class I molecule. J. Exp. Med. 180,687-692.
NK Cells and Adenovirus Immunity 141
49. Schrier, P. I., Bernards, R., Vaessen, R. T. M. J., Houweling, A., and van der Eb, A. J. (1983) Expression of class I major histocompatibility antigens switched off by highly oncogenic adenovirus 12 in transformed cells. Nature 305, 77 l-775.
50. Mellow, G. H., Fiihring, B., Dougherty, J., Gallimore, P. H., and Raska, K., Jr. (1984) Tumorigenicity of adenovirus-transformed rat cells and expression of class I major histocompatibihty antigen. Virology 134,46OA65.
51. Haddada, H., Sogn, J. A., Coligan, J. E., Carbone, M., Dixon, K., Levine, A. S., and Lewis, A. M., Jr. (1988) Viral gene inhibition of class I major histocompat- ibility antigen expression: not a general mechanism governing the tumorigenicrty of adenovirus type 2-, adenovirus type 12-, and simian virus 40-transformed Syrian hamster cells. J. Virol. 62,2755-2761.
52. Haddada, H., Lewis, A. M., Jr., Sogn, J. A., Coligan, J. E., Cook, J. L., Walker, T. A., and Levine, A. S. ( 1986) Tumorigenicity of hamster and mouse cells transformed by adenovirus types 2 and 5 is not influenced by the level of class I major histocompat- ibility antigens expressed on the cells. Proc. Natl. Acad. Sci. USA 83,9684-9688.
53. Chadwick, B S. and Miller, R. G. (1992) Hybrid resistance in vitro. Possible role of both class I MHC and self peptides in determining the level of target cell sensi- tivity. J Immunol 1458,2307-23 13.
54. Brutkiewicz, R. R. and Welsh, R. M. (1995) Major h&compatibility complex class I antigens and the control of viral mfections by natural killer cells. J. Viol. 69,3967-397 1.
55. Kranz, C. K., Routes, B. A,, Quinlan, M. A., and Cook, J. L. (1996) El A second exon requirements for induction of target cell susceptibility to lysis by natural killer cells. Virology 217,23-32.
56. Bukowski, J. F. and Welsh, R. M. (1985) Inability of interferon to protect virus- infected cells against lysis by natural killer (NK) cells correlates with NK cell- mediated antiviral effects in vivo. J. Immunol. 135,3537-3541.
57. Trinchieri, G., Granato, D., and Perussia, B. (1981) Interferon-induced resistance of tibroblasts to cytolysis mediated by natural killer cells: specificity and mecha- nism. J. Immunol 126,335-340.
58. Piontek, G. E., Taniguchi, K., Ljunggren, H.-G., Gronberg, A., Kiessling, R., Klem, G., and Karre, K. (1985) YAC-1 MHC class I variants reveal an associa- tion between decreased NK sensitivity and increased H-2 expression after inter- feron treatment or in vivo passage. J. Immunol. 135,4281-4288.
59 Routes, J. M. (1992) Interferon increases class I MHC Ag expression on adenovi- rus infected human cells without inducing resistance to NK cell killing, J, Immunol. 149,2372-2377.
60. Routes, J. M. (1993) Adenovnus ElA inhibits IFN-induced resistance to cytoly- sis by natural killer cells. J. Zmmunol. 150,43 15-4322.
61. Routes, J. M., Li, H., Bayley, S. T., Ryan, S., and Klemm, D. J. (1996) Inhibition of IFN-stimulated gene expression and IFN induction of cytolytic rerstance corre- late with ElA-~300 binding. J. Immunol. 156, 1055-1061.
62. Pross, H F., Baines, H. T., Rubin, P., Shragge, P., and Patterson, M. S. (1981) Spontaneous human lymphocyte-mediated cytotoxicity against tumor target cells. IX. The quantition of natural killer activity. J Clin. Immunol. 1, 5 l-63.

12
Determination of the Transforming Activities of Adenovirus Oncogenes
T. Subramanian and G. Chinnadurai
1. Introduction Oncogenesis is a multistep process that ultimately leads to the demise of the
organism. These steps can be mimicked in vitro by treatment of cultured ani- mal cells with various oncogenic agents such as chemical carcinogens and oncogemc viruses. Oncogenes encoded by various DNA tumor viruses func- tion as dominant oncogenes and can induce either immortalization of primary cells or oncogenic transformation of primary cells and certain established (immortalized) cell lines in vitro. Among the oncogenes of various DNA tumor viruses, the Ela oncogene of human adenoviruses is well-studied and serves as a prototypical transforming gene (reviewed in ref. 1-3). Autonomous ectopic expression of the Ela gene can immortalize primary cells, thus conferring an ability to grow indefinitely in culture. Ela can also mediate oncogenic trans- formation in cooperation with cellular oncogenes such as the activated rus (T24 rus) oncogene (4) and other viral transforming genes such as adenovirus Elb and polyoma virus middle T antigen (5). In addition, Ela also exhibits an inter- esting tumor inhibitory activity by which it suppresses the metastatic potential of malignant tumor cells (reviewed in refs. 6 and 7). Thus, the Ela oncogene appears to offer an ideal tool to dissect the multistep process of oncogenesis.
The Ela gene encodes two major proteins of 289 aa (289R) and 243 aa (243R) from two differenttally spliced overlapping mRNAs (reviewed in ref. 8). Whereas the 289R protein is required for viral replication, the 243R protein encodes all the functions necessary for immortalization of primary cells and for cooperative transformation with other oncogenes. DNA transfection is com- monly used to determine the transforming activities of the Ela gene since the effect of Ela can be studied in the absence of other viral genes, In this chapter,
From Methods tn Molecuktr Me&me, Vol 21 Adenoviros Methods and Protocols Edited by W S M. Weld @I Humana Press Inc., Totowa, NJ
143
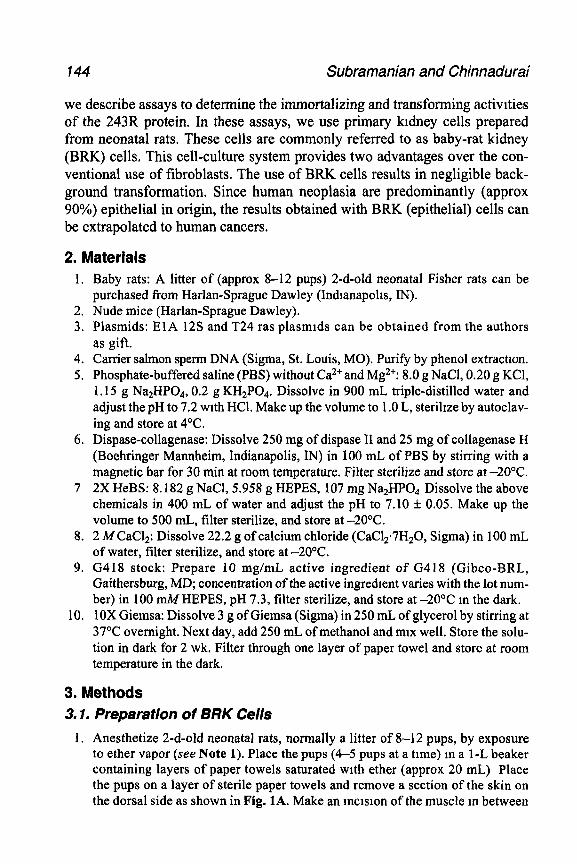
144 Subramanian and Chinnadurai
we describe assays to determine the immortalizing and transforming activities of the 243R protein. In these assays, we use primary kidney cells prepared from neonatal rats. These cells are commonly referred to as baby-rat kidney (BRK) cells. This cell-culture system provides two advantages over the con- ventional use of fibroblasts. The use of BRK cells results in negligible back- ground transformation. Since human neoplasia are predominantly (approx 90%) epithelial in origin, the results obtained with BRK (epithelial) cells can be extrapolated to human cancers.
2. Materials 1. Baby rats: A litter of (approx S-12 pups) 2-d-old neonatal Fisher rats can be
purchased from Harlan-Sprague Dawley (Indlanapohs, IN). 2. Nude mice (Harlan-Sprague Dawley). 3. Plasmids: ElA 12s and T24 ras plasmlds can be obtained from the authors
as gift. 4. Carrier salmon sperm DNA (Sigma, St. Louis, MO). Purify by phenol extraction. 5. Phosphate-buffered saline (PBS) without Ca2+ and Mg2+: 8.0 g NaCl, 0.20 g KCl,
1.15 g Na2HP04, 0.2 g KH2P04. Dissolve in 900 mL triple-distilled water and adjust the pH to 7.2 with HCl. Make up the volume to 1 .O L, sterilize by autoclav- ing and store at 4’C.
6. Dispase-collagenase: Dissolve 250 mg of dispase II and 25 mg of collagenase H (Boehringer Mannheim, Indianapolis, IN) in 100 mL of PBS by stirring with a magnetic bar for 30 min at room temperature. Filter sterilize and store at -20°C.
7 2X HeBS: 8.182 g NaCl, 5,958 g HEPES, 107 mg Na,HP04 Dissolve the above chemicals in 400 mL of water and adjust the pH to 7.10 + 0.05. Make up the volume to 500 rnL, filter sterilize, and store at -20°C.
8. 2 MCaC12: Dissolve 22.2 g of calcium chloride (CaC12*7H20, Sigma) in 100 mL of water, filter sterilize, and store at -20%
9. G418 stock: Prepare 10 mg/mL active ingredient of G418 (Gibco-BRL, Gaithersburg, MD; concentration of the active ingredient varies with the lot num- ber) in 100 miVHEPES, pH 7.3, filter sterilize, and store at -20°C m the dark.
10. 10X Giemsa: Dissolve 3 g of Giemsa (Sigma) in 250 mL of glycerol by stirring at 37’C overnight. Next day, add 250 mL of methanol and mix well. Store the solu- tion in dark for 2 wk. Filter through one layer of paper towel and store at room temperature in the dark.
3. Methods 3.1. Preparation of BRK Cells
1. Anesthetize 2-d-old neonatal rats, normally a litter of 8-12 pups, by exposure to ether vapor (see Note 1). Place the pups (4-5 pups at a time) m a 1-L beaker containing layers of paper towels saturated with ether (approx 20 mL) Place the pups on a layer of sterile paper towels and remove a section of the skin on the dorsal side as shown in Fig. 1A. Make an mclslon of the muscle m between
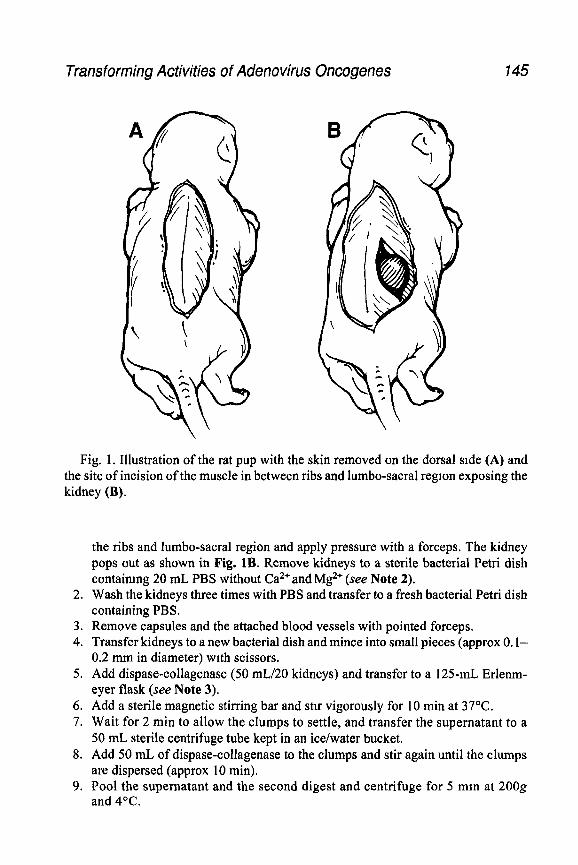
Transforming Activities of Adenovirus Oncogenes 145
Fig. 1. Illustration of the rat pup with the skin removed on the dorsal side (A) and the site of incision of the muscle in between ribs and lumbo-sacral region exposing the kidney (B).
the ribs and lumbo-sacral region and apply pressure with a forceps. The kidney pops out as shown in Fig. 1B. Remove kidneys to a sterile bacterial Petri dish containmg 20 mL PBS without Ca*+ and Mg*+ (see Note 2).
2. Wash the kidneys three times with PBS and transfer to a fresh bacterial Petri dish containing PBS.
3. Remove capsules and the attached blood vessels with pointed forceps. 4. Transfer kidneys to a new bacterial dish and mince into small pieces (approx 0. I-
0.2 mm in diameter) with scissors. 5. Add dispase-collagenase (50 mL/20 kidneys) and transfer to a 125-mL Erlenm-
eyer flask (see Note 3). 6. Add a sterile magnetic stirring bar and stir vigorously for 10 min at 37°C. 7. Wait for 2 min to allow the clumps to settle, and transfer the supernatant to a
50 mL sterile centrifuge tube kept in an ice/water bucket. 8. Add 50 mL of dispase-collagenase to the clumps and stir again until the clumps
are dispersed (approx 10 min). 9. Pool the supernatant and the second digest and centrifuge for 5 mm at 200g
and 4°C.
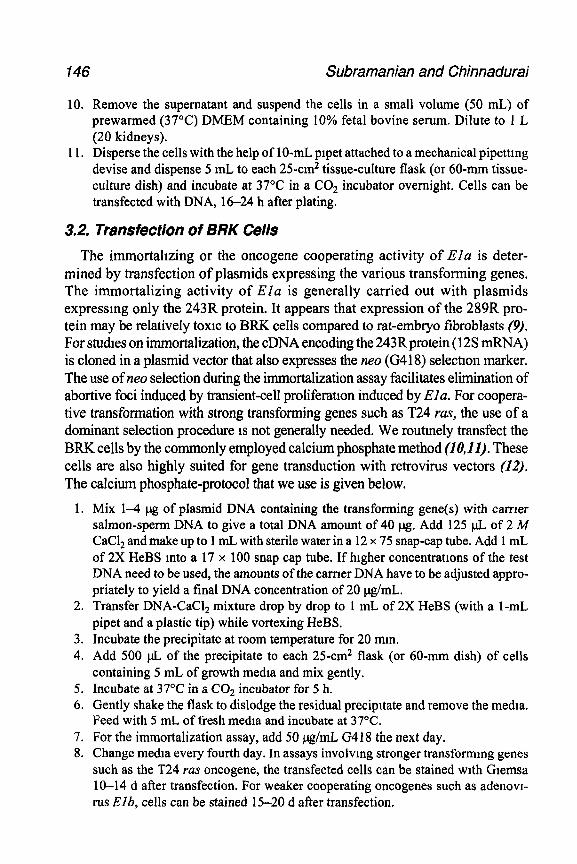
146 Subramanian and Chinnadurai
10. Remove the supernatant and suspend the cells in a small volume (50 mL) of prewarmed (37°C) DMEM containing 10% fetal bovine serum. Dilute to 1 L (20 kidneys).
11. Disperse the cells with the help of lo-mL plpet attached to a mechanical pipettmg devise and dispense 5 mL to each 25-cm2 tissue-culture flask (or 60-mm tissue- culture dish) and incubate at 37°C in a CO, incubator overnight. Cells can be transfected with DNA, 16-24 h after plating.
3.2. Transfection of f3RK Cells
The immortahzing or the oncogene cooperating activity of EZa is deter- mined by transfection of plasmids expressing the various transforming genes. The immortalizing activity of Ela is generally carried out with plasmids expressing only the 243R protein. It appears that expression of the 289R pro- tein may be relatively toxic to BRK cells compared to rat-embryo fibroblasts (9). For studies on immortalization, the cDNA encoding the 243R protein ( 12s mRNA) is cloned in a plasmid vector that also expresses the neo (G418) selection marker. The use of neo selection during the immortalization assay facilitates elimination of abortive foci induced by transient-cell proliferation induced by Ela. For coopera- tive transformation with strong transforming genes such as T24 ras, the use of a dominant selection procedure IS not generally needed. We routinely transfect the BRK cells by the commonly employed calcium phosphate method (1OJI). These cells are also highly suited for gene transduction with retrovirus vectors (12). The calcium phosphate-protocol that we use is given below.
1. Mix 1-4 pg of plasmid DNA containing the transforming gene(s) with tamer salmon-sperm DNA to give a total DNA amount of 40 pg. Add 125 pL of 2 A4 CaCl, and make up to 1 mL with sterile water in a 12 x 75 snap-cap tube. Add 1 mL of 2X HeBS mto a 17 x 100 snap cap tube. If higher concentrations of the test DNA need to be used, the amounts of the tamer DNA have to be adjusted appro- priately to yield a final DNA concentration of 20 pg/mL.
2. Transfer DNA-CaCl* mixture drop by drop to 1 mL of 2X HeBS (with a 1-mL pipet and a plastic tip) while vortexing HeBS.
3. Incubate the precipitate at room temperature for 20 mm. 4. Add 500 pL of the precipitate to each 25-cm* flask (or 60-mm dish) of cells
containing 5 mL of growth media and mix gently. 5. Incubate at 37°C in a CO2 incubator for 5 h. 6. Gently shake the flask to dislodge the residual precipitate and remove the media.
Feed with 5 mL of fresh media and incubate at 37°C. 7. For the immortalization assay, add 50 clg/mL G418 the next day. 8. Change media every fourth day. In assays involvmg stronger transforming genes
such as the T24 ras oncogene, the transfected cells can be stained with Glemsa 10-14 d after transfection. For weaker cooperating oncogenes such as adenovl- rus Elb, cells can be stained 15-20 d after transfection.
Transforming Activities of Adenovirus Oncogenes 147
3.3. Staining of lmmorfalized Co/odes and Transformed Foci
The immortalized/transformed colonies can be visualized approx 1 wk after transfection. After periodical visual examination of the colonies, if the sizes of the colonies appear satisfactory, stain with Giemsa for quantitation and photography.
1. One day prior to staining, feed cells with fresh media. 2. Remove medra and wash once with 5 mL of PBS. 3. Fix the colonies with 5 mL of methanol for 5 min. 4. Stam with Gremsa (freshly diluted from a filtered 10X stock solution) for 30 mm
and wash two times with tap water. 5. Dry the flasks, count the colonies, and photograph if necessary.
The immortalized and transformed colonies of p12S (243R) and two mutants of 12s with and without T24 ras are shown in Fig. 2.
3.4. Characterization of Transformed Cells
To determine the extent of transformation, the transformed cells are gener- ally assayed for their ability to form anchorage-independent colonies on semi- solid (soft-agar) media in vitro or examined for their ability to form tumors m athymic mice or syngeneic hosts.
3.4.1. Soft-Agar-Colony Assay
1. Prepare a 1% agarose solution tn drstilled water by autoclaving and cooling to 56°C. Add equal volume of prewarmed (37’C) 2X growth media (containing 20% serum). Add 10 mL of the mixture to each 25cm* flask and let solidify at room temperature (in a laminar flow hood) for approx 1 h.
2. Prepare cell suspension by trypsin-EDTA dispersion. Adjust to a final volume of 5 mL with growth media. Count the number of cells.
3. Transfer 5-8 x lo3 cells into a 15-mL conical tube and spin for 5 min at 2OOg m an International centrifuge.
4. Resuspend the cells in 4 mL of prewarmed 2X growth media. Add 4 mL of 0.6% agarose (autoclaved and cooled to 56’C). Overlay 2 mL of the cell-agarose sus- pension over the solidified bottom layer.
5. Leave the flasks in the hood until the top layer is solidttied and gently transport to the CO2 incubator. Examine colony formation after 14-20 d.
6. Count the number of colonies and calculate the frequency of colony formation The relative sizes of the colonies can be determined from photomrcrographs of random fields of the flasks.
3.4.2. Tumorigenesis in A thymic Mice
1. Irradiate nude mice with 500 rads of y rays 24 h before injection of trans- formed cells.
148 Subramanian and Chinnadurai
Fig. 2. EMT24 ras cooperative transformation. Five pg of plasmids expressing ElA 12s (wt) or C-terminal mutants (177-9 or 176-E) were transfected with or without 5 pg of the plasmids expressing T24 ras. Transfected cells were stained with Giemsa 13 days after transfection and photographed. (A) p12S wt; (B) p12S (177-9); (C) p12S (176-E); (d) p12S+pT24 ras; (E) p12S (177-9)+pT24 ras; (F) p12S (176-E)pT24 ras.
2. Prepare cell suspension by treatment with trypsin-EDTA and wash once with serum free media.
3. Resuspend the desired number of cells (5 x 10⁵-2 x 10⁶) in 100 pL of serum-free media and inject into irradiated nude mice subcutaneously using a tuberculin (26-gage) syringe.
4. Periodically examine at the site of injection for development of tumor nodules to determine the latency period. After development of visible tumors, measure the length and width of the tumors and calculate the approximate tumor volume.
3.4.3. Tumor Metastasis Assay
Athymic mice injected with transformed cells (that induce tumors) can also be examined for formation of metastatic tumor nodules in the internal organs
Transforming Activities of Adenovirus Oncogenes 149
such as lungs. If the burden of primary tumors is heavy for the animals, the primary tumors have to be surgically removed and animals are maintained for additional 2-4 wk and autopsied.
4. Notes 1. Neonatal Fisher rat pups should be used between 2 and 3 d after birth. If older
pups are used, the efficiency of transformation may be lower. 2. During preparation of BRK cells, the capsule present in the kidney should be
removed as much as possible with a tine-pointed forceps. If it is not fully removed, the preparation will contain flbroblasts. The fibroblasts will grow faster than epithelial cells and will not die with 50 pg/mL of G4 18 (normal concentra- tion for BRK cells); this will result in background colomes.
3. The minced kidneys are digested with dispase-collagenase for a maximum period of 15 min each time. Digestion for longer period of time will reduce the viability of epithelial cells.
References 1. Moran, E. (1993) Interactton of adenovirus proteins with pRb and ~53. FASEB J.
7,880-885. 2. Nevins, J. R. (1995) Adenovuus ElA: transcription regulation and alteration of
cell growth control. Curr. Topics Microbial. Immunol. 199,25-32. 3. Harlow, E. (1996) A research shortcut from a common cold virus to human can-
cer. Cancer 78,558-565. 4. Ruley, H. E. (1983) Adenovirus early region 1A enables viral and cellular trans-
forming genes to transform primary cells in culture. Nature 304,602-606. 5. Zerler, B., Roberts, R. J., Mathews, M. B., and Moran, E. (1987) Different func-
tional domains of the adenovirus ElA gene are involved in regulation of host cell cycle products. Mol. Cell. Blol. 7, 821-829.
6. Chinnadurai, G. (1992) Adenovirus Ela as a tumor-suppressor gene. Oncogene 7, 1255-1258.
7. Mymryk, J. S. (1996) Tumor suppressive properties of the adenovirus 5 Ela oncogene. Oncogene 13,1581-1589.
8. Sussenbach, J. S. (1984) The structure of the genome, in The adenoviruses (Ginsberg, H. S., ed.), pp. 35-124. Plenum, New York.
9. Kuppuswamy, M. and Chinnadurai, G. (1988) Cell type dependent transforma- tion by adenovirus 5 Ela proteins. Oncogene 2,567-572.
10. Graham, F. L. and Van der Eb, A. J. (1973) A new technique for the assay of infectivity of human adenovirus 5 DNA. Virology 52,456-467.
11. Wigler, M., Pellicer A., Silverstem S., Axe1 R., Urlaub G., and Chasm L. (1979) DNA-ediated transfer of the adenine phosphoribosyltransferase locus into mam- malian cells. Proc. Natl. Acad. Sci. USA 76, 1373-1376.
12. Kuppuswamy, M., Subramanian, T., and Chinnadurai, G. (1988) Separation of immortalization and T24-ras oncogene cooperative functions of adenovirus El a. Oncogene 2,613-615.

13
Cell Survival and Apoptosis Assays for ElB 19K and B&2 Family Members
T. Subramanian and G. Chinnadurai
1. Introduction Programmed cell death, or apoptosts, is an important event in the normal
development and homeostasis of multicellular organisms (2). Apoptosts is regulated by a number of genes that promote or suppress cell death. The bcl-2 family of genes constitute important regulators of apoptosrs. Several members of the bcl-2 family such as bcl-2 (2) and bcl-xL (3) suppress apoptosts, whereas certain other members such as bax (4), bak (5), and bzk (6) promote apoptosts Certain animal viruses such as adenovirus, Epstein-Barr vuus, herpesvuus stmarri, and African swine fever virus also encode structural and functional homologs of Bcl-2. The methods currently available to determine the anti- or pro-apoptotic activrttes of various cellular and viral Bcl-2 homologs are cum- bersome. Here, we describe highly reproducible, simple methods that we have developed to assay the activities of adenovirus E I B 19 kDa, Bcl-2, and various pro-apoptotic interacting partners.
2. Materials 1. Primary baby-rat kidney cells. prepare these cells from 2-d-old Fisher baby-rat
kidneys (BRK) according to the procedure described by Subramanian and Chinnadurai (Chapter 12).
2. BRK ElA/p53V135 cell lme purchase from Scintech, St LOUIS, MO, or prepare from BRK cells.
3. Plasmrds: obtain p12S 177-9+ras from the authors as gift. 4. Trypan blue (Sigma, St. LOUIS, MO). 5. 2X HeBS* 8.182 g, 5 958 HEPES, 107 mg Na2HP04 Dissolve in 400 mL of
water and adjust the pH to 7.10 _+ 0 05. Make up the volume to 500 mL, filter stertltze, and store at -20°C
From Methods m Molecular Me&one, Vol 21 Adenovws Methods and Protocols Edlted by W S M Wold 0 Humana Press Inc , Totowa, NJ
757
752 Subramanian and Chinnadurai
6 2 MCaClz: Dtssolve 22 2 g of calcium chloride (CaCI, a 7H,O, Stgma) in 100 mL of water, filter steribze, and store at -20°C.
7 G418 stock Prepare 10 mg/mL acttve ingredient of G4 18 (Gibco-BRL, Gatthers- burg, MD; concentratton of the active Ingredient varies with the lot number) m 100 mMHEPES, pH 7 3, filter sterilrze, and store at -20°C in the dark
8. 10X Gtemsa: Dtssolve 3 g of Gtemsa (Sigma) m 250 mL of glycerol by sttrrmg at 37°C overnight. Next day, add 250 mL of methanol and mtx well. Store the solu- tion in dark for 2 wk Filter through one layer of paper towel and store at room temperature m the dark.
3. Methods 3.1. Antiapoptosis Assay
This assay is based on results obtained by Oren and colleagues (7), who showed that certain hematopoietic cells expressing a temperature-sensitive mutant of the p53 tumor suppressor protein (p53tsVall35) undergo rapid and complete apoptosis at the permissrve temperature (32.5”C) at which the p53 protein assumes wild-type conformation. These results were further extended by Debbas and White (81 who showed that BRK cells transformed with aden- ovirus Ela and p53tsVall35 grow normally at 38.5”C and undergo rapid apoptosis at 32.5OC. BRK cells expressing Ela and p53tsVa1135 offer two advantages: They can be readily transfected with various test genes by the con- ventional calcmm-phosphate method, and the antrapoptotrc activrty of various test genes can then be assayed by simple temperature shift. We have used this assay to determme the antiapoptotic activity of adenovirus ElB 19-kDa pro- tein (9) and a number of Bcl-2 family protems (10).
In order to determine the apoptotic activity of various pro-apoptotic genes, a transient transfection procedure is commonly used. In this assay, the pro- apoptotic genes are cotransfected with the Escherzchia coli 1acZ reporter gene. Among the transfected cells (identified by X-gal staining), the cells undergo- ing apoptosis are identified by microscoptc exammation. The apoptotic and nonapoptotic cells are discriminated by virtue of a rounded (dead) or flat (live) morphology (II). However, we and others have found that this method is labo- rious and can sometimes yield unreliable results. We have developed a sample colony assay that we have used to determine the anttapoptotic activity of vart- ous Bcl-2 protein family members such as Bax, Bak, and Bik. In thts chapter, the assays for evaluating anti or pro-apoptotic activity are descrtbed.
1 Establish BRK cells expressing Ela and p53tsVa1135 (BRK-EIA/p53 V135) by cotransfection of l-2 ug of a plasmtd expressing adenovnus 2 E 1 a (pE 1 A) along with l-2 pg of pLTRp53va1135 (7). After transformed foci become visible, tso- late cells from mdtvidual colomes and propagate Ascertam the ts phenotype of the cell line by shafting a monolayer of the culture to 32 5°C (see Note 1).
E/B 19K and Bcl-2 Family Members 153
2 Trypsmize the BRK-ElA/p53V135 cell line and plate 1 x lo5 tells/25-cm* flask 1 d prior to transfectlon and grow the cells at 38 5°C
3. Transfect 10 pg of a plasmld (pcDNA3 or pRcCMV-based) that expresses E 1B 19 kDa, Bcl-2, another test protein, or the vector plasmld (control) by the cal- clum-phosphate method (Chapter 12) Twenty-four hours after transfection, feed cells with medium containing 300 pg/mL of G418 with subsequent changes of medium at 4-d intervals (see Note 2)
4. Two weeks later, pool the colonies formed m each flask and establish as polyclonal cell lines Alternatively, clonal cell lines, if desued, could also be established from Isolated colonies.
5. Subject the polyclonal cell line to three passages. Ascertam the expression of the protein of interest by lmmunopreclpitatlon or by protein blotting.
6 Trypsmize the cell lines and plate 5 x lo4 tells/35-mm dish. For each cell Ime, prepare four dishes and allow them to grow at 38.5”C overnight
7 The next day, feed with fresh media and transfer the dishes to 32 5°C. 8 After 24 h, remove media from a single dish, add 0 5 mL of trypsin and wait for
5 min Add 0.5 mL medium containing serum. Suspend the cells thoroughly and mix 20 p.L of cells with equal volume of Trypan blue Wait for another 5 mm and count the Trypan blue-excluded live cells using a hemocytometer Obtam cell counts every 24 h, using the remainmg dishes
9 Plot a graph with relative number of viable cells O/-axis) vs time m hours (x-axis)
We have observed under these assay conditions, cells expressmg anti- apoptosis proteins such as E 1 B 19 kDa or Bcl-2 retain 60-l 00% vlabllity over a period of 96 h. In contrast, cells transfected with the vector lose near total vlabllity within 72 h (Fig. 1).
3.2. Apoptosis Assay for Bcl-2 Family Members
This method can be used to assay the activity of pro-apoptotlc members of the Bcl-2 family or their mutants. The assay method is based on the cotransfor- mation of primary BRK cells with a Ela super-transforming mutant (contain- mg a deletion mutation m the second exon) and T24 ras oncogene. We have observed that cotransfectlon of the various death-inducing members of the Bcl-2 family consistently mhlbit transformed-colony formation and spe- cific mutations that abolish the death-promoting activity relieve this inhibl- tton. In this assay, BRK cells are transfected with a plasmid (p12S177-9+ras) that expresses both the E 1 a mutant (12s 177-9; ref. 12) and the T24 ras oncogene along with the plasmid (pcDNA3 or pRcCMV-based) that expresses the pro-apoptotlc gene and the dominant selection marker neo. Plasmids expressing Bax, Bak, or Blk are used as the posltlve control and vector plas- mids are used as the negative control.
1. Prepare BRK cells from 2-d-old Fisher rat pups and plate them in 25-cm* flasks at a cell concentration of 5 x IO5 cells/flask in 5 mL of DMEM contam-
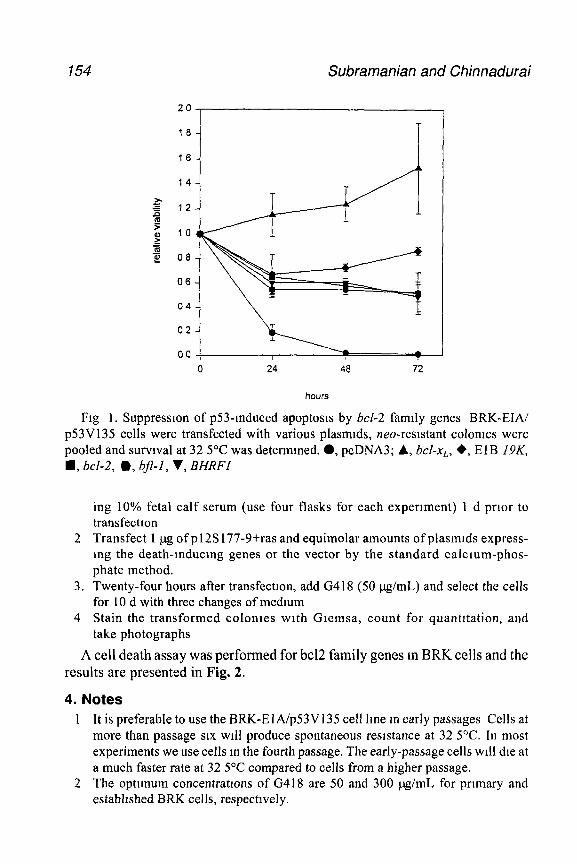
154 Subramanian and Chinnadurai
20
18
16
14
12
IO
08
06
04
02
00
0 24 48 72
hours
Ftg 1. Suppression of p53-Induced apoptosts by M-2 family genes BRK-EIAI p53Vl35 cells were transfected with various plasmtds, neo-reststant colomes were pooled and survtval at 32 5°C was determined. l , pcDNA3; A, b&xl, a., ElB 19K, n , bcl-2, a, @l-l, V, BHRFI
ing 10% fetal calf serum (use four flasks for each experiment) 1 d prior to transfection
2 Transfect 1 pg of p 12s 177-9+ras and equimolar amounts of plasmtds express- mg the death-mducmg genes or the vector by the standard calcium-phos- phate method.
3. Twenty-four hours after transfectton, add G418 (50 I.lg/mL) and select the cells for 10 d with three changes of medmm
4 Stain the transformed colontes with Giemsa, count for quantitation, and take photographs
A cell death assay was performed for bc12 family genes m BRK cells and the results are presented in Fig. 2.
4. Notes 1 It is preferable to use the BRK-ElA/p53V135 cell hne m early passages Cells at
more than passage SIX ~111 produce spontaneous resistance at 32 5’C. In most experiments we use cells m the fourth passage. The early-passage cells will die at a much faster rate at 32 5’C compared to cells from a higher passage.
2 The optimum concentrations of G418 are 50 and 300 ,ug/mL for prtmary and established BRK cells, respectively.
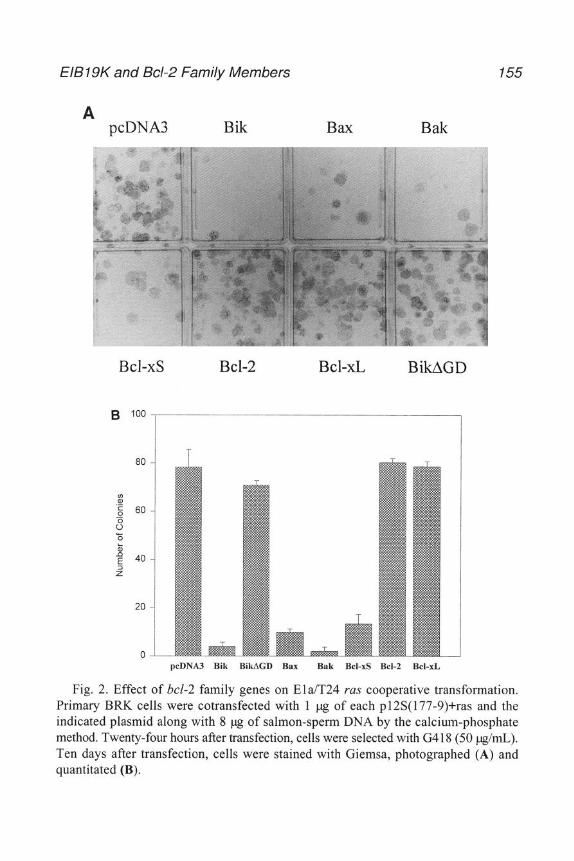
EIB 19K and Bcl-2 Family Members 155
A pcDNA3 Bik Bax Bak
Bcl-xS Bcl-2 Bcl-xL BikAGD
80 -I
I ‘E p 60 s 5 2 E 40-
2
20 -
0 L pcDNA3 Bik BikAGD Bax Bak Bcl-xS Bcl-2 Bcl-XL
Fig. 2. Effect of bcl-2 family genes on Ela/T24 YLZS cooperative transformation. Primary BRK cells were cotransfected with 1 ug of each p12S( 177-9)+ras and the indicated plasmid along with 8 ~18 of salmon-sperm DNA by the calcium-phosphate method. Twenty-four hours after transfection, cells were selected with G4 18 (50 &mL,). Ten days after transfection, cells were stained with Giemsa, photographed (A) and quantitated (B).
156
References
Subramanian and Chinnadurar
1. Elhs, R E., Yuan, J J , and Horvttz, H. R. (1991) Mechanisms and functions of
2
3
4.
5
6
7
8
9
10.
11.
12.
cell death Annu Rev. Cell Brol 7,663-698. Korsmeyer, S J. (1992) B&2 mitrates a new category of oncogenes: regulators of cell death. Blood 80, 879-886. Boise, L. H., Gonzalez-Garcia, M., Postema, C E., Dmg, L , Lindsten, T , Turka L. A., Mao, X., Nunez G , and Thompson, C. B. (1993) B&x, a bcl-2- related gene that functrons as a dominant regulator of apoptotrc cell death. Cell 74, 597-608. Oltvar, Z. N., Mtlhman, C. L , and Korsmeyer, S J (1993) Bcl-2 heterodlmertzes in VIVO with a conserved homolog, Bax, that accelerates programmed cell death Cell 74,609-619. Chrttenden, T., Flemmgton, C., Houghton, A B , Ebb, R. G., Gallo, G J., Elangovan, B., Chmnadural G., and Lutz R. J (1995) A conserved domain m Bak, distinct from BHl and BH2, mediates cell death and protem bmdmg functions EMBO J 14,5589-5596 Boyd, J M., Gallo, G. J , Elangovan, B , Houghton, A B., Malstrom, S , Avery, B J., Ebb, R. G , Subramaman T., Chtttenden, T., Lutz, R J., and Chmnadurat G. (1995) Brk, a novel death-inducing protein with a distinct sequence motif, interacts with viral and cellular survrval promotmg protems. Oncogene II, 1921-1928. Mlchalovttz, D., Halevy, O., and Oren, M. (1990) Condrtional mhrbmon of trans- formatron and of cell prohferation by a temperature-sensitrve mutant of p53. Cell 62,67 l-680. Debbas, M. and White, E (1993) Wild-type ~53 mediates apoptosls by El A, which is inhibited by ElB. Genes Dev 7,546554 Subramanian, T., Boyd, J M , and Chmnadurai, G (1995) Functronal substrtutton Identifies a cell survival promoting domain common to adenovnus E 1 B 19 kDa and Bcl-2 proteins. Oncogene 11,2403-2409 D’Sa-Eipper, C., Subramanian, T., and Chinnadurat, G (1996) Bfl-I, a bcl-2 homologue, suppresses p53-induced apoptosrs and exhibrts potent cooperatrve transforming activity. Cancer Res 56,3879-3882. Miura, M , Zhu, H., Rotello, R., Hartwerg, E. A., and Yuan, J Y. (1993) Inductton of apoptosis m tibroblasts by IL-1 beta-converting enzyme, a mammalian homo- logue of the C. elegans cell death gene ted-3 Cell 75,653-660 Subramanian, T., La Regina M., and Chinnadural, G (1989) Enhanced ras oncogene mediated cell transformatton and tumortgenesrs by adenovrrus 2 mutants lacking the C-termmal region of E la protein. Oncogene 4,4 15-420
14
In Vitro Transcription
Probing the Molecular Functions of Adenovirus Regulatory Proteins
Paul M. Loewenstein, Chao-Zhong Song, and Maurice Green
1. Introduction Adenoviruses (Ads), like other DNA tumor viruses, have evolved specific
regulatory genes that facilitate virus replication by controlling the transcrip- tion of other viral genes as well as that of key cellular genes that regulate cell- cycle progression and cellular DNA synthesis. Of parttcular interest is the Ad ElA transcription unit that encodes two major proteins of 243 and 289 amino acids. The 28913 protein is identical to the 243R protein except that tt also contains conserved region 3 (CR3, restdues 140-188), a powerful transcrip- tional activator of Ad early genes (see ref. I for review). The 243R protem encodes diverse biological functions, including the ability to induce cell-cycle progression, immortalize cells, transform cells in cooperation wtth other oncogenes, and paradoxically to inhibit tumorigenicity and cell differentiation (I). These El A 243R functions are encoded within multiple protein domains that can transcriptionally acttvate or repress cellular genes involved in the regu- lation of cell proliferation and cell differentiation.
Recently, in vitro proteipprotein binding studies have revealed that viral regulatory proteins such as ElA can interact with sequence-specific transcrip- tional activators as well as with several general transcription factors (GTFs) of the cellular transcription machinery. The significance of these protein-protein interactions in transcriptional regulation can be addressed mechanistically by the applrcatton of the vitro transcription methodology using purified recombi- nant viral proteins.
From Methods in Molecular Medmne, Vol 21 Adenovrrus Methods and Protocols Edlted by W S M Wold 0 Humana Press Inc , Totowa, NJ
757
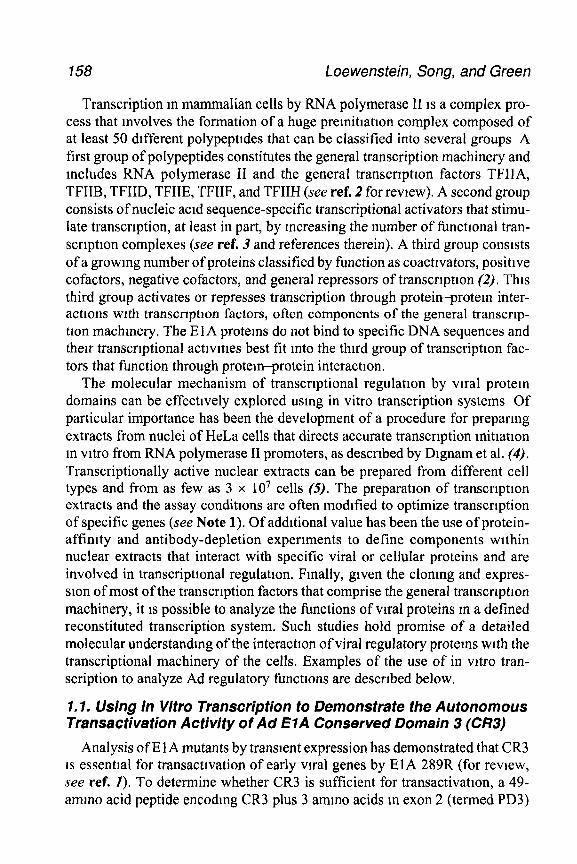
158 Loewenstein, Song, and Green
Transcription m mammalian cells by RNA polymerase II IS a complex pro- cess that mvolves the formation of a huge premitlation complex composed of at least 50 different polypeptides that can be classified into several groups A first group of polypeptides constitutes the general transcription machinery and includes RNA polymerase II and the general transcrrptron factors TFIIA, TFIIB, TFIID, TFIIE, TFIIF, and TFIIH (see ref. 2 for review). A second group consists of nucleic acid sequence-specific transcriptional activators that stimu- late transcrtption, at least in part, by mcreasing the number of functional tran- scription complexes (see ref. 3 and references therein). A third group conststs of a growing number of proteins classified by function as coactivators, positive cofactors, negative cofactors, and general repressors of transcription (2). This third group activates or represses transcription through protein-protein inter- actrons wrth transcription factors, often components of the general transcrlp- tton machmery. The E 1A protems do not bind to specific DNA sequences and then transcriptional activities best fit mto the third group of transcriptton fac- tors that function through protein-protein interaction.
The molecular mechanism of transcriptional regulation by viral protein domains can be effectively explored using in vitro transcription systems Of particular importance has been the development of a procedure for preparing extracts from nuclei of HeLa cells that directs accurate transcription mitiation m vitro from RNA polymerase II promoters, as described by Dignam et al. (4). Transcriptionally active nuclear extracts can be prepared from different cell types and from as few as 3 x lo7 cells (5). The preparation of transcription extracts and the assay conditions are often modified to optimize transcription of specific genes (see Note 1). Of additional value has been the use of protein- affimty and antibody-depletion experiments to define components within nuclear extracts that interact with specific viral or cellular proteins and are involved in transcriptional regulation. Fmally, given the clonmg and expres- sion of most of the transcription factors that comprise the general transcription machinery, it is possible to analyze the functions of viral proteins in a defined reconstituted transcription system. Such studies hold promise of a detailed molecular understanding of the interaction of viral regulatory protems with the transcriptional machinery of the cells. Examples of the use of in vitro tran- scription to analyze Ad regulatory functrons are described below.
7.7. Using in Vitro Transcription to Demonstrate the Autonomous Transactivation Activity of Ad ElA Conserved Domain 3 (CR3)
Analysis of E 1A mutants by transient expression has demonstrated that CR3 IS essential for transactivation of early viral genes by ElA 289R (for review, see ref. I). To determine whether CR3 is sufficient for transactivatton, a 49- ammo acid peptide encodmg CR3 plus 3 ammo acids m exon 2 (termed PD3)
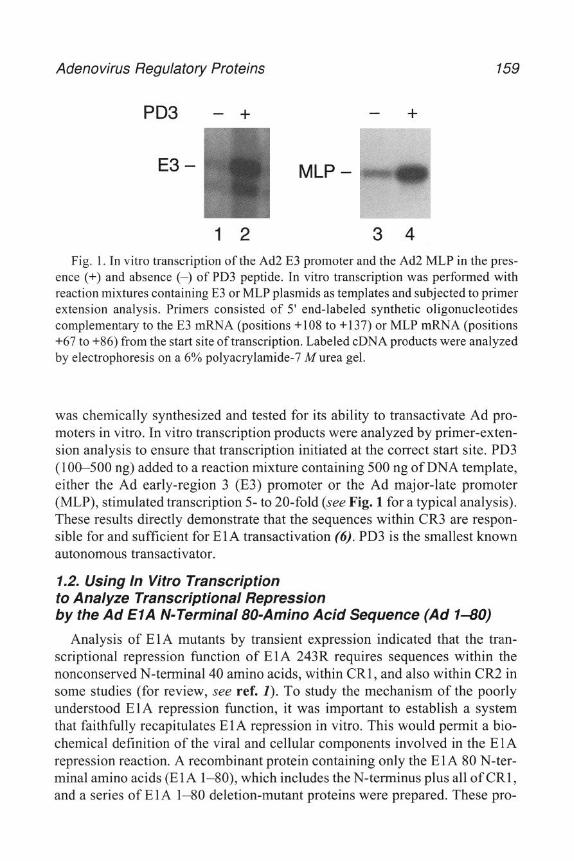
Adenovirus Regulatory Proteins 159
PD3 - + - +
E3-
1 2 3 4 Fig. 1. In vitro transcription of the Ad2 E3 promoter and the Ad2 MLP in the pres-
ence (+) and absence (-) of PD3 peptide. In vitro transcription was performed with reaction mixtures containing E3 or MLP plasmids as templates and subjected to primer extension analysis. Primers consisted of 5’ end-labeled synthetic oligonucleotides complementary to the E3 mRNA (positions + 108 to + 137) or MLP mRNA (positions +67 to +86) from the start site of transcription. Labeled cDNA products were analyzed by electrophoresis on a 6% polyacrylamide-7 M urea gel.
was chemically synthesized and tested for its ability to transactivate Ad pro- moters in vitro. In vitro transcription products were analyzed by primer-exten- sion analysis to ensure that transcription initiated at the correct start site. PD3 (100-500 ng) added to a reaction mixture containing 500 ng of DNA template, either the Ad early-region 3 (E3) promoter or the Ad major-late promoter (MLP), stimulated transcription 5- to 20-fold (see Fig. 1 for a typical analysis). These results directly demonstrate that the sequences within CR3 are respon- sible for and sufficient for ElA transactivation (6). PD3 is the smallest known autonomous transactivator.
1.2. Using In Vitro Transcription to Analyze Transcriptional Repression by the Ad ElA N-Terminal 80-Amino Acid Sequence (Ad l-80)
Analysis of E 1A mutants by transient expression indicated that the tran- scriptional repression function of ElA 243R requires sequences within the nonconserved N-terminal 40 amino acids, within CR1 , and also within CR2 in some studies (for review, see ref. 1). To study the mechanism of the poorly understood ElA repression function, it was important to establish a system that faithfully recapitulates ElA repression in vitro. This would permit a bio- chemical definition of the viral and cellular components involved in the ElA repression reaction. A recombinant protein containing only the ElA 80 N-ter- minal amino acids (El A l-SO), which includes the N-terminus plus all of CR1 , and a series of ElA l-80 deletion-mutant proteins were prepared. These pro-
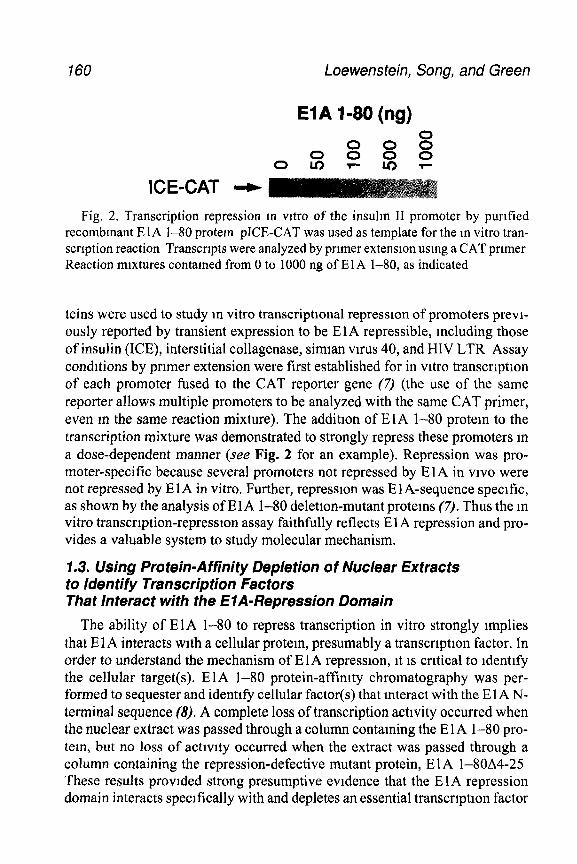
160 Loewenstein, Song, and Green
ICE-CAT
EIA I-80 (ng)
Fig. 2. Transcription repression m vitro of the insulm II promoter by purtfied recombmant E 1 A l-80 protem pICE-CAT was used as template for the m vitro tran- scrtption reaction Transcrrpts were analyzed by prtmer extension using a CAT primer Reaction mrxtures contained from 0 to 1000 ng of ElA l-80, as indicated
teins were used to study m vitro transcriptional repression of promoters prevt- ously reported by transient expression to be El A repressible, including those of insulin (ICE), interstitial collagenase, simian vnus 40, and HIV LTR Assay conditions by primer extension were first established for in vitro transcrtption of each promoter fused to the CAT reporter gene (7) (the use of the same reporter allows multiple promoters to be analyzed with the same CAT primer, even in the same reaction mixture). The addition of ElA l-80 protem to the transcription mixture was demonstrated to strongly repress these promoters m a dose-dependent manner (see Fig. 2 for an example). Repression was pro- moter-specific because several promoters not repressed by ElA in vtvo were not repressed by E 1 A in vitro. Further, repression was E 1 A-sequence spectfic, as shown by the analysis of ElA l-80 deletron-mutant proteins (7). Thus the m vitro transcription-repression assay faithfully reflects ElA repression and pro- vides a valuable system to study molecular mechanism.
7.3. Using Protein-Affinity Depletion of Nuclear Extracts to identify Transcription Factors That interact with the HA-Repression Domain
The ability of ElA l-80 to repress transcription in vitro strongly implies that ElA interacts with a cellular protem, presumably a transcrtptton factor. In order to understand the mechanism of El A repression, tt 1s crttical to Identify the cellular target(s). EIA l-80 protein-affintty chromatography was per- formed to sequester and identify cellular factor(s) that interact with the El A N- terminal sequence (8). A complete loss of transcription activity occurred when the nuclear extract was passed through a column contaming the El A l-80 pro- tein, but no loss of actrvrty occurred when the extract was passed through a column containing the repression-defective mutant protein, E 1 A l-8OA4-25 These results provided strong presumptive evidence that the ElA repression domain interacts specifically with and depletes an essential transcription factor
Adenovirus Regulatory Proteins 161
I; tii + 2
!i!i -8 H 53 -cl ? h zi
% h iii
+ 2 $ h 2 -0 @ z; c
HIV LTR -
123456
Fig. 3. TBP can restore transcriptional activity to an ElA l-SO-depleted nuclear extract. The transcriptional activity of the original nuclear extract (NE) (lane 1) is repressed by added ElA l-80 protein (400 ng, lane 2). Transcriptional activity is lost by passage through an ElA l-80 affinity column (lane 4), but not an ElA l-8084-25 column (lane 3). The addition of TBP (5 ng, lane 5) restores transcrip- tional activity to the ElA I-80 affinity depleted nuclear extract. The activity restored by TBP can be repressed by addition of E 1 A l-80 (400 ng, lane 6). In vitro transcrip- tion and primer extension analysis was performed with pBennCAT (HIV LTR) as template and a CAT primer.
from the nuclear extract. Western analysis demonstrated that the general tran- scription factor, TBP (TFIID), was depleted from the extract and was bound to the E 1 A l-80 affinity column (8). Significantly, activity of the depleted extract was completely restored by addition of TBP, thus providing strong evidence that TBP (TFIID) is a target of ElA repression (see Fig. 3).
2. Materials To minimize RNase contamination, all reagents should be made with DEPC-
treated water: add 1 mL of DEPC per liter of water, shake well, and autoclave after 1 h. Wear gloves during all operations to avoid contamination with finger RNases. Pipetting devices should be wiped down with ethanol and never used with solutions containing RNase. All reagents can be stored at -20°C.
162 loewenstein, Song, and Green
1 Buffer A* 10 mMHEPES (pH 7 9 at 4”C), 1.5 mM MgCl,, 10 mMKC1, 0 5 mM dithiothreitrol (DTT).
2 Low-salt buffer 20 mA4 HEPES (pH 7.9 at 4”C), 1 5 mM MgCI,, 20% glycerol, 20 rmI4 KCl, 0 2 truI4 EDTA, 0.2 m&! PMSF, 0 5 m1I4 DTT
3 High-salt buffer: 20 nnI4 HEPES (pH 7.9 at 4’C), 1.5 mM MgCl,, 20% glycerol, 12MKCl,O2~EDTA,O2mMPMSF,O5mMDTT
4 Buffer D: 20 mM HEPES (pH 7.9 at 4”C), 20% glycerol, 100 m&I KCl, 0 2 n&I EDTA, 0.2 m&I PMSF, 0.5 m/I4 DTT
5. Forward-exchange buffer (10X) 500 mM Trts-HCl (pH 7 5), 100 mM MgCl,, 50 mA4 DTT, 1 mM spermtdine
6 Transcriptton buffer (10X). 40 mM HEPES (pH 7 9 at 4”C), 40 n&I creatme phosphate, 100 mA4 MgCl,, 200 mM KCl, 5 mM DTT, 0 2 mM EDTA
7. Stop mix* 20 mMEDTA, pH 8.0,200 mMNaC1, 1% SDS, 0 2 mg/mL glycogen 8 PE buffer (2X). 100 mA4Trts-HCI (pH 8 3 at 42’(Z), 100 mMKCl,20 mA4MgCl,,
20 n&I DTT, 2 mM dNTPs, 1 mM spermtdme 9 TBE (10X) 1 MTrts base, 900 &boric acid, 10 mMEDTA
10. Formamide-loadmg mtx: 98% formamide, 10 mMEDTA (pH 8 0), 0.0 1% xylene cyanol, 0 0 1% bromophenol blue
11. Cornmg polypropylene centrtfuge tubes (Acton, NY, cat no. 25350-250) 12. Kontes B pestle (VWR, W Chester, PA) 13. 50-mL Falcon centrifuge tubes (Los Angeles, CA, cat no 2098) 14 Spectro/Por dialysis tubing (VWR) (1 S-mm flat wtdth, molecular-weight cutoff
2000) 15. 32P-ATP (approx 1000 Ct/mmol). 16 T4 DNA ligase 17 ATP, GTP, CTP, UTP. 5 mA4each 18 0 3 A4 Sodium acetate 19 Phenol/chloroform/tsoamyl alcohol (50.50 2). 20. 80% Ethanol. 2 1 40 mM Sodium pyrophosphate. 22. AMV reverse transcrtptase (Promega, Madison, WI) 23 Srliconizing reagent. Rain-X (Unelko Corp ). 24 Urea (Gibco-BRL, Garthersburg, MD, ultrapure, RNase free). 25 3MM filter paper sheets. 26. 32P-UTP (800-1000 cmnmol).
3. Methods 3.7. Preparation of the Nuclear Transcription Extract
Nuclear extracts can be made from vutually any volume of cells grown m monolayer or in suspension culture (5). For reproducrbihty and convenience, the majority of nuclear extracts are from liter quantities of HeLa cell-suspen- sion culture. The protocol used in our laboratory IS a modtficatron of that of Dtgnam et al. (4). We use monolayer cultures of HeLa cells obtained from
Adenovirus Regulatory Protems 163
ATCC that are adapted to growth m suspension in Jokhk’s MEM (Grbco-BRL) for suspension culture supplemented wrth 10% fetal bovme serum.
1 Six liters of HeLa cells in suspension are grown by feeding cells every day and mamtammg a cell density of approx 5 x lo5 per mL. Cells should be harvested for the preparation of nuclear extracts when they are growing well, I e., doubling nearly every 24 h.
2 Harvest cells m 250 mL Corning polypropylene centrifuge tubes by repeated cen- trtfugation at 4°C for 10 mm at 180g (in a Beckman, Fullerton, CA, J6-HC cen- trrfuge), 1 e , carefully pour off the supernatant and add fresh suspension culture on top of the existing cell pellet and repeat centrrfugation unttl the entn-e 6 L of suspension culture are harvested
3 All subsequent steps are done at 4°C using precooled buffers. Gently resuspend cell pellets by pipettmg into 40 mL of PBS, combme the suspension mto a single 50-mL centrifuge tube, and recentrifuge. Gently resuspend the packed cell pellet (usually 5-8 mL, note exact volume) m five times the pellet volume of hypotonic buffer A and incubate on ice for 10 mm Centrifuge swollen cells for 10 mm at 18Og and carefully withdraw the supernatant with a pipet so as not to disturb the soft, swollen cell pellet Using buffer A, resuspend the cells m twice the ortgmal volume of packed cells, A microscoprc examination of a small ahquot should reveal that cells are greatly swollen but largely Intact
4. Dounce-homogenize the cells using 10 strokes of a Kontes B pestle. A mtcro- scoptc exammatron should show that greater than 90% of the cells have been drsrupted and that the vast maJorrty of nucler are Intact.
5 Centrifuge the nuclear preparation m a 30-mL centrifuge tube at 1 OOOg for 10 mm (m a JA20 rotor in a Beckman 52 1B centrifuge). Remove the supernant, transfer the nuclear pellet into a 50 mL Falcon centrifuge tube, and centrifuge at 1OOOg for 5 mm (in a JS4.2 rotor m a Beckman J6-HC centrifuge) Remove and discard the small amount of remammg supernant
6 Resuspend the pellet m exactly one-half the nuclear pellet volume of low-salt buffer. Add dropwise the same volume of high-salt buffer as low salt-buffer while shaking the tube Cap the tube and extract the pellet by rotatton for 30 mm
7. Centnmge the extract at 10,OOOg for 30 min (in a Beckman JA2 IB centrtfuge usmg a JA20 rotor) Transfer the supernatant mto Spectra/Par dialysis tubmg (1 S-mm flat width, molecular-weight cutoff.2000) and dialyze for 3-5 h against 1 L of buffer D
8. Remove the extract from the tubing and clarify it by centrifugation for 10 mm at 10,OOOg Aliquot the supernatant (100-500 pL) into precooled mtcrofuge tubes (4°C) and freeze by munerston n-r liquid nitrogen. Store in a -70°C freezer or in a vapor-phase nitrogen freezer for long-term storage
3.2. Analysis of In Vitro Transcription by Primer Extension and by Run-Off Assay
Inasmuch as RNA polymerase II does not terminate transcriptton in vitro, two assays have been developed that yield products of discrete length. The first
164 Loewensteeln, Song, and Green
assay is the run-off assay that uses a DNA template cut with a restrlctlon enzyme downstream of the transcriptlon start site. This simple solution creates a site where the polymerase will fall off the template, thus terminating tran- scnptlon. By use of a 32P-labeled rNTP precursor, an RNA transcription prod- uct of specific length 1s synthesized and 1s resolved as a discrete band by denaturing polyacrylamide gel electrophoresls and autoradiography. The sec- ond assay 1s primer extension m which the RNA product of the in vitro tran- scription reaction 1s annealed with a 32P end-labeled deoxyohgonucleotlde complementary to a discrete sequence downstream of the transcrlptlon start site. Reverse transcription of the hybrid RNA product/DNA primer yields a labeled DNA fragment of discrete length that spans the sequence between the 5’ end of the primer and the transcription start site. This labeled cDNA fragment 1s resolved by denaturing polyacrylamlde gel electrophoresls and autoradtography The product of both assays can be quantitated by scanning densitometry or PhosphorImage analysis (Molecular Dynamics, Sunnyvale, CA).
In our laboratory, we use primer extension almost exclusively. In general, primer extension is more sensitive than run-off assay and permits a more accu- rate measurement of the transcription product from the authentic transcrlptlon start site. For many of our studies, we use the CAT gene as a reporter for dlffer- ent promoters, thus allowing a single CAT primer to be used for a variety of promoters. This also permits the use of multiple DNA-template promoters m a single transcrtptlon reaction because the S-transcribed sequence from each promoter 1s usually sufficiently different m size and thus gives rise to primer extension products of different lengths.
3.2.1. Preparatron of DNA Templates for In Vitro Transcription
Plasmld templates containing the promoter of interest are prepared by stan- dard alkaline-lysis procedure or by use of commercial plasmid-preparation kits. It is important, however, to further purify templates for in vitro transcrlptlon analysis using phenol-chloroform extractlon followed by ethanol precipitation. For primer extension, superhelical plasmid templates are used. For run-off analysis, templates are linearized with a restriction enzyme m order to terml- nate transcription at a known site.
3.2.2. Preparation of Radiolabeled Deoxyoligonucleotides for Primer Extensron
Deoxyoligonucleotide primers m our laboratory are designed to be approx. 30 nt m length and to be complementary to a region from 100 to 200 nt down- stream of the transcription-initiation site. Primers with self complementary sequences are avoided. To label a primer, incubate 10 pmol of deoxyohgo- nucleotide at 37°C for 30 min in a lo-@ reaction containing 1 & of 10X
Adenovirus Regulatory Proteins 165
forward-exchange buffer, 6 pL of y32P-ATP (1000 Ci/mmol), and 1 pL of T4 polynucleotrde kmase (10 U). Heat the reaction mixture at I OOOC for 2 mm and add 190 pL of water. Store at -2OOC. The radiolabeled primer can be used as long as a suitable transcription signal is obtained, usually 4-6 wk.
3.2.3. In vitro Transcription Analysis Using Primer-Extension Analysis
3.2.3.1, THE TRANSCRIPTION REACTION
Reaction mixtures are assembled in RNase-free micromge tubes contaming 2.5 pL of 1 OX transcription buffer, 2.5 uL of rNTP mrxture (5 &each of ATP, GTP, CTP, and UTP), DNA template (typically 500 ng), nuclear extract (typically 10 pL), and water to give a final volume of 25 pL. The reaction is initiated by the addition of nuclear extract followed by incubation at 30°C for 60 min. For each new DNA tem- plate, preliminary titrauons are done with different amounts of template (100-l 000 ng) and nuclear extract (5.0-l 2.5 pL) to optimize the transcription signal (strength and authenticity, i.e., correct size). One should compensate for volumes of nuclear extract below 10 pL by the addttron of an equivalent volume of buffer D.
3.2.3.2. ISOLATION OF THE RNA TRANSCRIPTION PRODUCT
When the transcrrption reaction IS complete, terminate the reaction by addi- tion of 100 $ of stop mix. Then add 300 mL of 0.3 Msodium acetate and 300 & of phenol/chloroform/isoamyl alcohol (50:50:2). Vortex the sample for 30 s and separate the phases by centrrfugation at 10,OOOg for 2 min. Transfer the upper aqueous phase to a fresh tube containing 1 mL of ethanol, mtx, and place on dry ice for 15 min. Centrifuge the sample at 10,OOOg for 10 min at 4”C, rinse the pellet carefully with 500 + of 80% ethanol (-2O”C), and briefly dry the pellet containing the RNA product in a vacuum desiccator.
3.2.3.3. PRIMER-EXTENSION ANALYSIS
Resuspend the RNA pellet completely in 5 pL of 2X PE buffer, 5 pL of water, and 1 pL of the labeled primer (approx 0.5 pmol) by repeated vortexing and centrifuga- tion. Denature the RNA by incubation at 65°C for 10 min and anneal the RNA with the primer by incubation at 42°C for 10 min. Next add 5 pL of 2X PE buffer, 1.6 pL of water, 1.4 pL of 40 mMsodium pyrophosphate, I& of AMV reverse transcriptase (2.5 U), and incubate the mtxture at 42°C for 30 min. Terminate the reverse-tran- scriptase reaction by the addition of 20 pL of formamrde-loading mix.
3.2.3.4. RESOLUTION OF THE LABELED PRIMER EXTENSION PRODUCT BY DENATURING POLYACRYLAMIDE GEL ELECTROPHORESIS
We resolve the labeled product by electrophoresis on a 0.75-mm-thick/ 20-cm-long 6% urea polyacrylamide gel using a vertical gel chamber (Gtbco-BRL,
166 Loewenstein, Song, and Green
Model V16). The smaller plate (facing the apparatus) is silicomzed with Ram- X to facilitate separation of the plates after electrophoresis. To prepare the gel, stir with a magnetic bar 12 g of urea (Gibco-BRL ultrapure, RNase free) with 6.0 mL of 5X TBE, 4.5 mL of 40% acrylamidelbzs-acrylamrde (29: l), 300 pL of 10% ammonium persulfate, and water to a final volume of 30 mL. When the urea 1s completely dissolved, add 20 l.iL of TEMED and ptpet the mixture into an assembled gel sandwich held at about a 40’ angle. Insert a 15well comb and the allow the gel to polymerize in a horizontal position for 3 h or over- night. Prior to loading the samples, mount the gel on the electrophoresis cham- ber, add TBE to the upper and lower chambers, and clean the gel teeth by pipetting TBE up and down. Pre-electrophorese the gel for approx 15 min at 400 V constant. Load the samples (10-20 &) and a labeled size marker (e.g., a 50-bp ladder. see Note 2) mto mdividual lanes on the gel and electrophorese at 400 V constant until the bromophenol blue marker migrates to the bottom of the gel.
In our laboratory, the gel is pulled onto 3MM paper. Briefly separate the gel sandwich by gentle prying with a fine-bladed spatula. The gel will adhere to the larger, unsiliconized plate, Put the gel-containing plate flat on a bench top and carefully position a sheet of 3MM paper over the gel. Rub the paper gently but firmly and carefully pull off the paper with the adherent gel. The gel can then be drred on a gel dryer prior to autoradiography or simply covered with plastrc wrap and autoradiographed with an mtensifymg screen at -70°C over- mght. For quantitation of signals by PhosphorImage analysis, gels are dried and exposed to a phosphor storage screen.
3.2.4. In Vitro Transcription Using the Run-Off Assay
The transcription reaction for the run-off assay is virtually the same as that described m Subheading 3.2.3.1. with the following modifications. First, the DNA template is cut at a convenient sue with a restriction enzyme. Second, the 10X rNTP mixture consists of 5 mM ATP, GTP, and CTP, but only 0.25 rm?4 UTP. Third, 32P-UTP (0.5 & of 10 mCi/mL, 800-1000 Ci/mmol) is added to the reaction mixture. Finally, RNA is isolated as described m Subheading 3.2.3.2. and is directly analyzed by gel electrophoresis as described in Sub- heading 3.2.3.4.
4. Notes 1, When one IS studying transcriptional regulation in vitro by the addition of a can-
didate regulatory protein to a transcnptlon-reaction mixture, it 1s important that the transcription signal in the absence of added regulatory protein be optimized In the case of transcripttonal activation, it 1s desirable to use conditions that are suboptimal in the absence of added activator so that transactwatlon can be easdy
Adenovirus Regulatory Protems 167
measured over a wide dynamic range. By contrast, when one IS studymg tran- scription repression, it IS desirable to use condmons that provide a strong tran- scription signal, thus providing a sensitive assay for measuring repression by added protein These goals can often be achieved empirically by one of two means. First, the amount of nuclear extract in the reaction mixture can often be titrated to provide the desired level of transcription m the absence of added pro- tem factor. Second, it is possible to prepare extracts that possess innately high or low activity by altering the ionic strength of the salt used to prepare the nuclear extract. These extracts may contain greater or lesser amounts of transcription factors or cellular inhibitors of transcription, some of which may represent a cel- lular target of the added regulator protein The putative cellular target may not be rate-limiting m the nuclear-transcription extract prepared under standard condi- tions. Specific modification of the reaction mixture can also achieve the desired results For example, to demonstrate in vitro transactivation of the HIV LTR promoter by the HIV- 1 Tat transactivator protein in run-off assays, it was neces- sary to reduce the basal transcription level of extracts by the addition of 6 mM sodmm citrate (9).
2. As a size marker for analysis of transcription products, it is convenient to label 50 or 100 bp DNA ladder as described by the manufacturer (Gibco-BRL)
Acknowledgments
We thank Carolyn E. Mulhall for editorial assistance. The work from the authors’ laboratories was supported by Research Career Award AI-04739 and Public Health Service grants CA-29561, CA-54703, and AI-28201 to M. G from the National Institutes of Health.
References 1 Shenk, T (1996) Adenoviridae. the viruses and then replication, m Virology
(Fields, B. et al , eds ), Lippincott-Raven, New York, pp 2111-2148 2. Zawel, L and Reinberg, D. (1995) Common themes m assembly and function of
eukaryotic transcription complexes. Ann Rev. Bzochem 64,533-561 3 Choy, B. and Green, M. R. (1993) Eukaryotic activators function during multiple
steps of premitation complex assembly. Nature 366, 53 l-536. 4. Dignam, J. D , Lebovitz, R M., and Roeder, R. G. (1983) Accurate transcription
initiation by RNA polymerase II m a soluble extract from isolated mammalian nuclei. NucIelc Aczds Res 11, 1475-1489.
5. Lee, K A W and Green, M R. (1990) Small-scale preparation of extracts from radtolabeled cells efficient in pre-mRNA splicing. Methods Enzymol 181,20-30.
6. Green, M , Loenstein, P M , Pustazi, R., and Symington, J. S (1988) An adenovi- rus EIA protein domain activates transcription in vzvo and In vztro m the absense of protein synthesis, Cell 53, 92 l-926.
7. Song, C-Z , Tierney, C. J , Loewenstem, P. M., Pusztai, R., Symmgton, J S., Tang, Q , Toth, K., Nishikawa, A , Bayley, S. T., and Green, M. (1995) Transcnp-

168 Loewenstein, Song, and Green
tional repression by human adenovirus ElA N-terminus/conserved domain 1 polypeptides in vwo and in vitro in the absence of protein synthesis. J, BEOI Chem 40,23,263-23,267
8. Song, C -Z., Loewenstem, P. M , Toth, K., and Green, M. (1995) TFIID is a direct functional target of the adenovirus E 1 A transcription-repression domain Proc Nat1 Acad Sci USA 92, 10,330-10,333.
9 Kato, H , Sumimoto, H , Pognonec, T , Chen, C.-H., Rosen, C. A., and Roeder, R G. (1992) HIV-l Tat acts as a processtvtty factor m vitro m conJunction with cellular elongation factors. Gene Dev 6,655-666.
15
Cell Microinjection
in Vivo Analysis of the Functional Domains of Viral Regulatory Proteins
Maurice Green, Andrew Thorburn, and Paul M. Loewenstein
1. Introduction Mammalian-cell microinjection is a powerful method for analyzing the in
vivo functions of viral genes and viral gene products. By microinjection, a controlled amount (ranging from 1 to many thousands of copies) of a viral or cellular gene, a protein product of a gene, a polypeptide fragment encoding a specific protein domain, or an RNA molecule can be delivered into a target cell and the functional consequences analyzed. Injection of DNA into the nuclei of cultured mammalian cells provides a sensitive bioassay for gene expression. The product of a single injected gene copy can be detected using standard immunofluorescent, immunochemical, and autoradiographic techniques (I). The direct analysis of protein function by microinjection has been facilitated by the ability to produce biologically active recombinant proteins and protein fragments encoded by many interesting genes.
A valuable use of microinjection is to deliver antibody targeted to a spe- cific protein domain in order to analyze the requirement of the protein for spe- cific cell functions, for example, cell-cycle progression, transcription of specific genes, or intracellular transport. Antibodies introduced by microinjec- tion into mammalian cells are highly specifk and nontoxic. Several additional cell-microinjection strategies have been used successfully. These include, for example, the delivery and functional analysis of antisense RNA and the deter- mination of morphological alterations in response to an injected molecule, including cell transformation. Cell microinjection has been uniquely used to address mechanistic questions, such as whether the function of a microinjected
From Methods III Molecular Medmne, Vol 21 Adenovrrus Methods and Protocols Edited by* W S M. Wold 0 Humana Press Inc., Totowa, NJ
169
170 Green, Thorburn, and Loe wenstein
protein requires the activation of cellular genes or whether it interacts directly with cellular factors.
In recent years, there have been increasingly large numbers of publications reporting the use of cell mlcroinjection to provide key insights into important biological questions. This has been facilitated by the availability of semi-auto- mated injection equipment and computerized microcapillary pullers that have made cell microinjection a reliable and routme laboratory procedure.
7.7. Cell Microinjection Strategies to Analyze Adenovirus (Ad) Gene Functions
The response of a cell to the expression of a microinjected gene, the intro- duction of a microinjected protein or protein fragment, or the micromjection of an antibody can be measured by a variety of methods. Below some of the cell microinjection strategies are described, illustrated with the adenovirus system, and accompanied by schematics of the experimental designs.
7. I. I. Transcriptional Activation by an Ad ElA-Protein Fragment Encoding Conserved Domain 34mmunofluorescence Analysis of the Protein Product of an Activated Gene
Biochemical analysis of the expression of Ad E 1 A mutants showed that the CR3 domain (conserved amino acid residues 140-188) of the Ad 289R protein was required for transactivation of early viral genes (for review, see ref. 2). To directly determine whether CR3 was sufficient for transactivation, a chemi- cally synthesized ElA peptide containing CR3 (PD3, protein domam 3) was introduced into HeLa cells together with a reporter plasmid, pE2 which encodes the Ad2 E2 early gene (see Fig. 1 for schematic). Immunofluorescence analy- sis for the pE2 product (the 73-kDa DNA-binding protein) showed that PD3 efficiently activated the E2 gene (3). Thus, by micromjection, the ElA CR3 peptide was shown to be the smallest known protein fragment functioning as a transcriptional activator.
1.1.2. Microinjection of the Ad E IA- Transactivation Peptide (PD3) to Determine Whether Transcriptional Activation Requires de novo Protein Synthesis-In Situ Hybridization Analysis of the RNA Product of an Activated Gene
Mechanistically, the ElA CR3 domain could transactivate early genes by either of two general models. First, CR3 could induce the expression of cellu- lar gene(s) resulting in the increased synthesis of a specific transcription factor required for transactivation. Second, PD3 could directly activate a pre-existing transcription factor. The first mechanism but not the second would require cel- lular protein synthesis. A microinjection strategy to directly test these alterna-
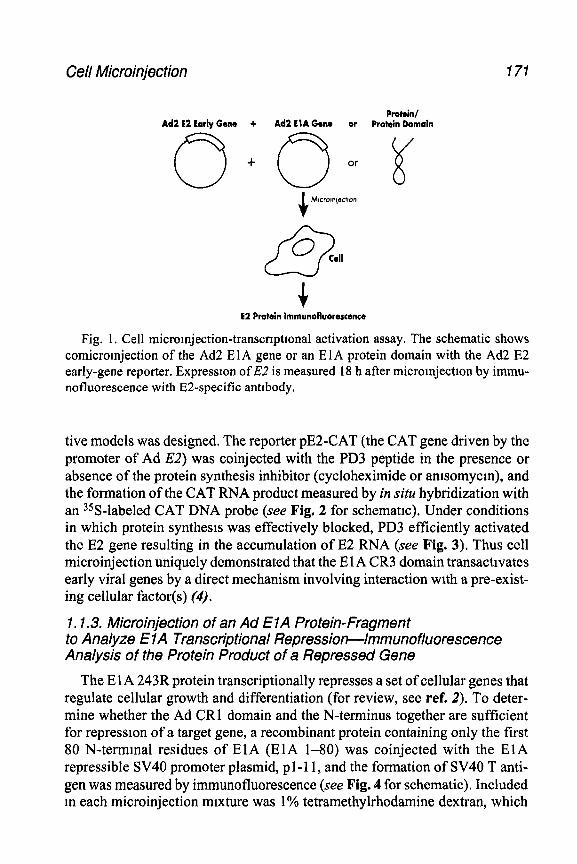
Cell Microinjection
Protein/ Ad2 E2 Early Gene + Ad2 El A Gene or Protein Domain
E2 Protein lmmunoRuorercence
Fig. 1. Cell micromjection-transcrrpttonal activation assay. The schematic shows comicromjection of the Ad2 ElA gene or an ElA protein domain with the Ad2 E2 early-gene reporter. Expressron of E2 is measured 18 h after micromjectton by immu- nofluorescence with EZ-specific antrbody.
tive models was designed. The reporter pE2-CAT (the CAT gene driven by the promoter of Ad E2) was coinjected with the PD3 peptide in the presence or absence of the protein synthesis inhibitor (cycloheximide or antsomycm), and the formation of the CAT RNA product measured by in situ hybridization with an 35S-labeled CAT DNA probe (see Fig. 2 for schematic). Under conditions in which protein synthesis was effectively blocked, PD3 efficiently activated the E2 gene resulting in the accumulation of E2 RNA (see Fig. 3). Thus cell microinjection uniquely demonstrated that the E 1 A CR3 domain transactrvates early viral genes by a direct mechanism involving interaction with a pre-exist- ing cellular factor(s) (4).
1.1.3. Microinjection of an Ad EIA Protein-Fragment to Analyze E 1 A Transcriptional Repression-immune fluorescence Analysis of the Protein Product of a Repressed Gene
The El A 243R protein transcriptionally represses a set of cellular genes that regulate cellular growth and differentiation (for review, see ref. 2). To deter- mine whether the Ad CR1 domain and the N-terminus together are sufficient for repression of a target gene, a recombinant protein containing only the first 80 N-terminal residues of ElA (ElA l-80) was coinjected with the ElA repressible SV40 promoter plasmid, p 1 - 11, and the formation of SV40 T anti- gen was measured by immunofluorescence (see Fig. 4 for schematic). Included m each microinjection mixture was 1% tetramethylrhodamine dextran, which
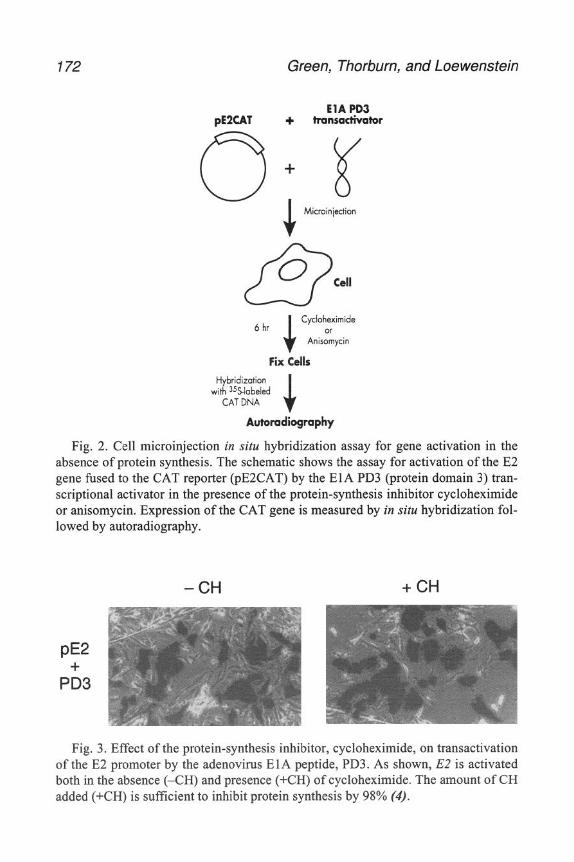
172 Green, Thorburn, and Loe wenstein
ElA PD3 pE2CAT + tmnsoctivator
0 0 Cell
6 hr Cycloheximide
Or Amsomycm
Fii Cells
Hybridization with Wobeled
CAT DNA
Automdiogrophy
Fig. 2. Cell microinjection in situ hybridization assay for gene activation in the absence of protein synthesis. The schematic shows the assay for activation of the E2 gene fused to the CAT reporter (pE2CAT) by the ElA PD3 (protein domain 3) tran- scriptional activator in the presence of the protein-synthesis inhibitor cycloheximide or anisomycin. Expression of the CAT gene is measured by in situ hybridization fol- lowed by autoradiography.
-CH +CH
Fig. 3. Effect of the protein-synthesis inhibitor, cycloheximide, on transactivation of the E2 promoter by the adenovirus ElA peptide, PD3. As shown, E2 is activated both in the absence (-CH) and presence (+CH) of cycloheximide. The amount of CH added (+CH) is sufficient to inhibit protein synthesis by 98% (4).
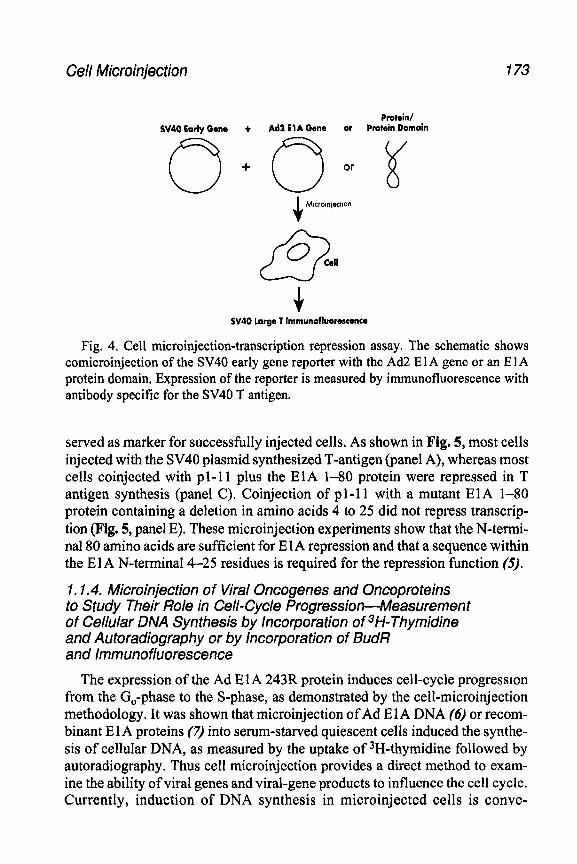
Cell Microinjection 173
Protein/ SW0 Ear’ Gene + Ad2 El A Gene or PrWein Domain
SV40 large 1 Immunofluorexence
Fig. 4. Cell microinjection-transcription repression assay. The schematic shows comicroinjection of the SV40 early gene reporter with the Ad2 E 1 A gene or an E 1 A protein domain. Expression of the reporter is measured by immunofluorescence with antibody specific for the SV4O T antigen.
served as marker for successfully injected cells. As shown in Fig. 5, most cells injected with the SV40 plasmid synthesized T-antigen (panel A), whereas most cells coinjected with pl- 11 plus the ElA l-80 protein were repressed in T antigen synthesis (panel C). Coinjection of ~1-11 with a mutant ElA I-80 protein containing a deletion in amino acids 4 to 25 did not repress transcrip- tion (Fig. 5, panel E). These microinjection experiments show that the N-termi- nal 80 amino acids are sufficient for E IA repression and that a sequence within the E 1 A N-terminal 4-25 residues is required for the repression function (5).
1.1.4. Microinjection of Viral Oncogenes and Oncoproteins to Study Their Role in Cell-Cycle Progression-Measurement of Cellular DNA Synthesis by Incorporation of 3H-Thymidine and Autoradiography or by incorporation of BudR and immunofluorescence
The expression of the Ad ElA 243R protein induces cell-cycle progression from the Go-phase to the S-phase, as demonstrated by the cell-microinjection methodology. It was shown that microinjection of Ad E 1 A DNA (6) or recom- binant ElA proteins (7) into serum-starved quiescent cells induced the synthe- sis of cellular DNA, as measured by the uptake of 3H-thymidine followed by autoradiography. Thus cell microinjection provides a direct method to exam- ine the ability of viral genes and viral-gene products to influence the cell cycle. Currently, induction of DNA synthesis in microinjected cells is conve-
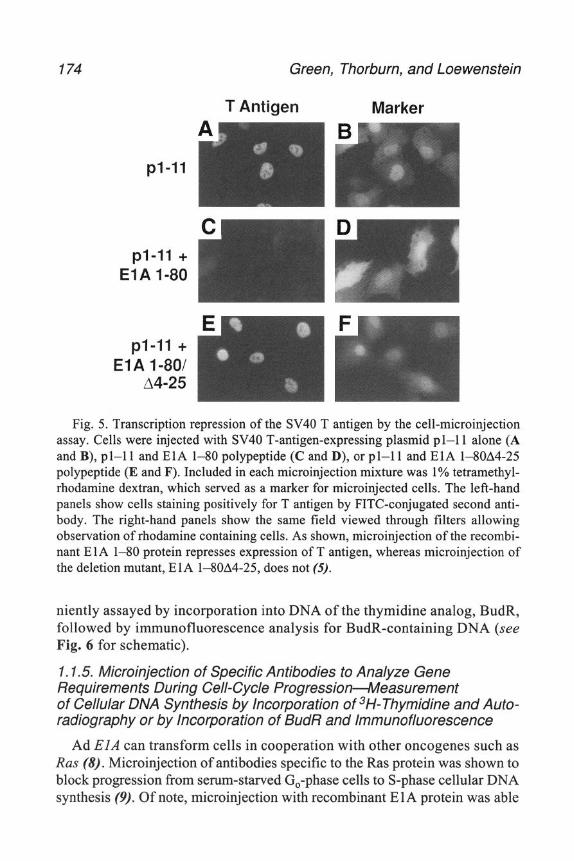
174 Green, Thorburn, and Loewenstein
T Antigen Marker
pl-11
Fig. 5. Transcription repression of the SV40 T antigen by the cell-microinjection assay. Cells were injected with SV40 T-antigen-expressing plasmid ~1-11 alone (A and B), ~1-11 and ElA l-80 polypeptide (C and D), or ~1-11 and ElA 1--8OA4-25 polypeptide (E and F). Included in each microinjection mixture was 1% tetramethyl- rhodamine dextran, which served as a marker for microinjected cells. The left-hand panels show cells staining positively for T antigen by FITC-conjugated second anti- body. The right-hand panels show the same field viewed through filters allowing observation of rhodamine containing cells. As shown, microinjection of the recombi- nant ElA l-80 protein represses expression of T antigen, whereas microinjection of the deletion mutant, ElA 1--8OA4-25, does not (5).
niently assayed by incorporation into DNA of the thymidine analog, BudR, followed by immunofluorescence analysis for BudR-containing DNA (see Fig. 6 for schematic).
1.1.5. Microinjection of Specific Antibodies to Analyze Gene Requirements During Cell-Cycle Progression-Measurement of Cellular DNA Synthesis by Incorporation of 3H-Thymidine and Auto- radiography or by Incorporation of BudR and lmmunofluorescence
Ad EIA can transform cells in cooperation with other oncogenes such as Ras (8). Microinjection of antibodies specific to the Ras protein was shown to block progression from serum-starved Go-phase cells to S-phase cellular DNA synthesis (9). Of note, microinjection with recombinant ElA protein was able
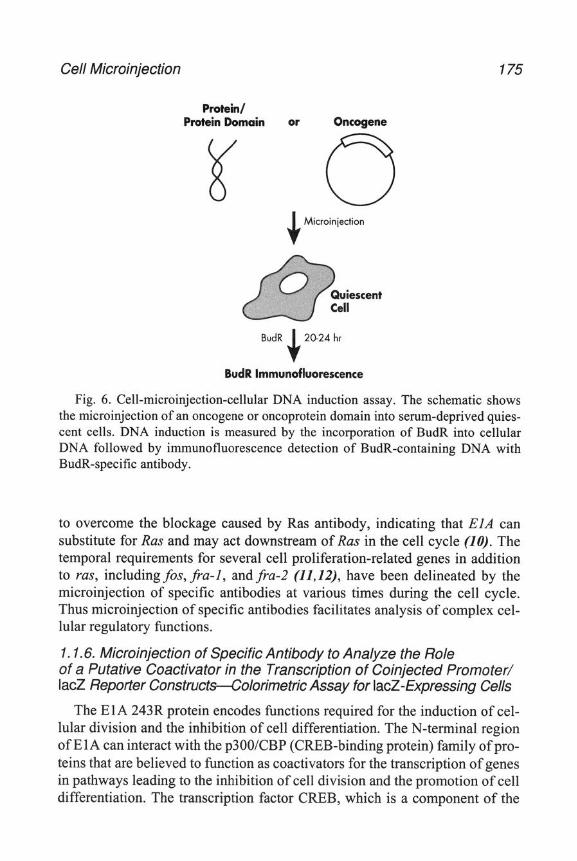
Cell Microinjection 175
Protein/ Protein Domain or Oncogene
6 w J- Microinjection
BudR 20-24 hr
BudR lmmunofluorescence
Fig. 6. Cell-microinjection-cellular DNA induction assay. The schematic shows the microinjection of an oncogene or oncoprotein domain into serum-deprived quies- cent cells. DNA induction is measured by the incorporation of BudR into cellular DNA followed by inununofluorescence detection of BudR-containing DNA with BudR-specific antibody.
to overcome the blockage caused by Ras antibody, indicating that EIA can substitute for Ras and may act downstream of Rus in the cell cycle (IO). The temporal requirements for several cell proliferation-related genes in addition to ras, including fos, $%I, and fru-2 (11,12), have been delineated by the microinjection of specific antibodies at various times during the cell cycle. Thus microinjection of specific antibodies facilitates analysis of complex cel- lular regulatory functions.
1.1.6. Microinjection of Specific Antibody to Analyze the Role of a Putative Coactivator in the Transcription of Coinjected Promoter/ IacZ Repotter Constructs-Calorimetric Assay for IacZ-Expressing Cells
The El A 243R protein encodes functions required for the induction of cel- lular division and the inhibition of cell differentiation. The N-terminal region of E 1 A can interact with the p300KBP (CREB-binding protein) family of pro- teins that are believed to function as coactivators for the transcription of genes in pathways leading to the inhibition of cell division and the promotion of cell differentiation. The transcription factor CREB, which is a component of the
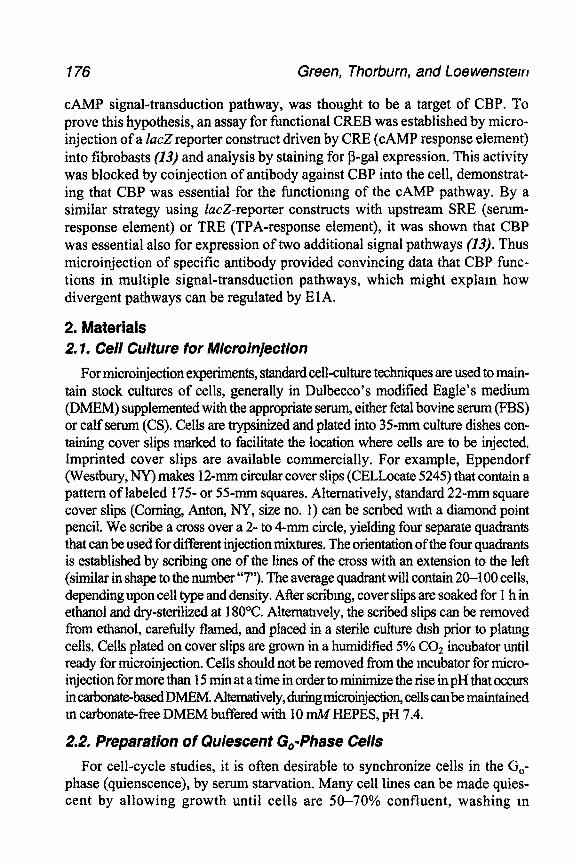
176 Green, Thorburn, and Loewensrem
CAMP signal-transduction pathway, was thought to be a target of CBP. To prove this hypothesis, an assay for functional CREB was established by micro- injection of a lad reporter construct driven by CRE (CAMP response element) into fibrobasts (13) and analysis by staining for P-gal expression. This activity was blocked by coinjection of antibody against CBP into the cell, demonstrat- ing that CBP was essential for the functionmg of the CAMP pathway. By a similar strategy using la&reporter constructs with upstream SRE (serum- response element) or TRE (TPA-response element), it was shown that CBP was essential also for expression of two additional signal pathways (13). Thus microinjection of specific antibody provided convincing data that CBP func- tions in multiple signal-transduction pathways, which might explam how divergent pathways can be regulated by E 1 A.
2. Materials 2.7. Cell Culture for Microinjection
For microinjection experiments, standard cell-culture techniques are used to main- tain stock cultures of cells, generally in Dulbecco’s modified Eagle’s medium (DMEM) supplemented with the appropriate serum, either fetal bovine serum (FBS) or calf serum (CS). Cells are trypsinized and plated into 35-mm culture dishes con- taining cover slips marked to facilitate the location where cells are to be injected. Imprinted cover slips are available commercially. For example, Eppendorf (Westbury, NY) makes 12-mm circular cover slips (CELLocate 5245) that contain a pattern of labeled 175- or 55-mm squares. Alternatively, standard 22-mm square cover slips (Coming, Anton, NY, size no. 1) can be scribed with a diamond point pencil. We scribe a cross over a 2- to 4-mm circle, yielding four separate quadrants that can be used for different injection mixtures. The orientation of the four quadrants is established by scribing one of the lines of the cross with an extension to the left (similar in shape to the number “7”). The average quadrant will contain 20-100 cells, depending upon cell type and density. After scribmg, cover slips are soaked for 1 h in ethanol and dry-sterilized at 180°C. Alternatively, the scribed slips can be removed from ethanol, carefully flamed, and placed in a sterile culture &sh prior to plating cells. Cells plated on cover slips are grown in a humidified 5% CO, incubator until ready for microinjection. Cells should not be removed from the incubator for micro- injection for more than 15 min at a time in order to minimize the rise in pH that occurs in carbonate-basedDMEM. Altematively, during microinjection, cells canbe maintained m carbonate-free DMEM buffered with 10 mM HEPES, pH 7.4,
2.2. Preparation of Quiescent GO-Phase Cells For cell-cycle studies, it is often desirable to synchronize cells in the G,-
phase (quienscence), by serum starvation. Many cell lines can be made quies- cent by allowing growth until cells are 50-70% confluent, washing m
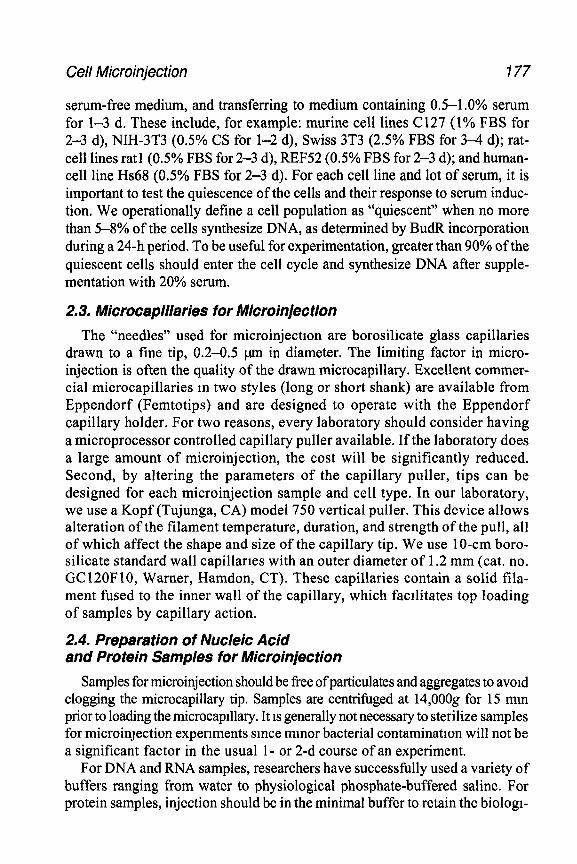
Cell Microinjection 177
serum-free medium, and transferring to medium containing 0.5-l -0% serum for l-3 d. These include, for example: murine cell lines Cl27 (1% FBS for 2-3 d), NIH-3T3 (0.5% CS for l-2 d), Swiss 3T3 (2.5% FBS for 3-4 d); rat- cell lines rat1 (0.5% FBS for 2-3 d), REF52 (0.5% FBS for 2-3 d); and human- cell line Hs68 (0.5% FBS for 2-3 d). For each cell line and lot of serum, it is important to test the quiescence of the cells and their response to serum induc- tion. We operationally define a cell population as “quiescent” when no more than 5-8% of the cells synthesize DNA, as determined by BudR incorporation during a 24-h period. To be useful for experimentation, greater than 90% of the quiescent cells should enter the cell cycle and synthesize DNA after supple- mentation with 20% serum.
2.3. Microcapillaries for Microinjection
The “needles” used for microinjection are borosilicate glass capillaries drawn to a fine tip, 0.2-0.5 l,trn in diameter. The limiting factor in micro- injection is often the quality of the drawn microcapillary. Excellent commer- cial microcapillaries in two styles (long or short shank) are available from Eppendorf (Femtotips) and are designed to operate with the Eppendorf capillary holder. For two reasons, every laboratory should consider having a microprocessor controlled capillary puller available. If the laboratory does a large amount of microinjection, the cost will be significantly reduced. Second, by altering the parameters of the capillary puller, tips can be designed for each microinjection sample and cell type. In our laboratory, we use a Kopf (Tujunga, CA) model 750 vertical puller. This device allows alteration of the filament temperature, duration, and strength of the pull, all of which affect the shape and size of the capillary tip. We use IO-cm boro- silicate standard wall capillaries with an outer diameter of 1.2 mm (cat. no. GC120F10, Warner, Hamdon, CT). These capillaries contain a solid fila- ment fused to the inner wall of the capillary, which facilitates top loading of samples by capillary action.
2.4. Preparation of Nucleic Acid and Protein Samples for Microinjection
Samples for microinjection should be free ofparticulates and aggregates to avoid clogging the microcapillary tip. Samples are centrifuged at 14,000g for 15 mm prior to loading the microcapillary. It is generally not necessary to sterilize samples for microinjection experiments since minor bacterial contamination will not be a significant factor in the usual 1- or 2-d course of an experiment.
For DNA and RNA samples, researchers have successfully used a variety of buffers ranging from water to physiological phosphate-buffered saline. For protein samples, injection should be in the minimal buffer to retain the biologi-
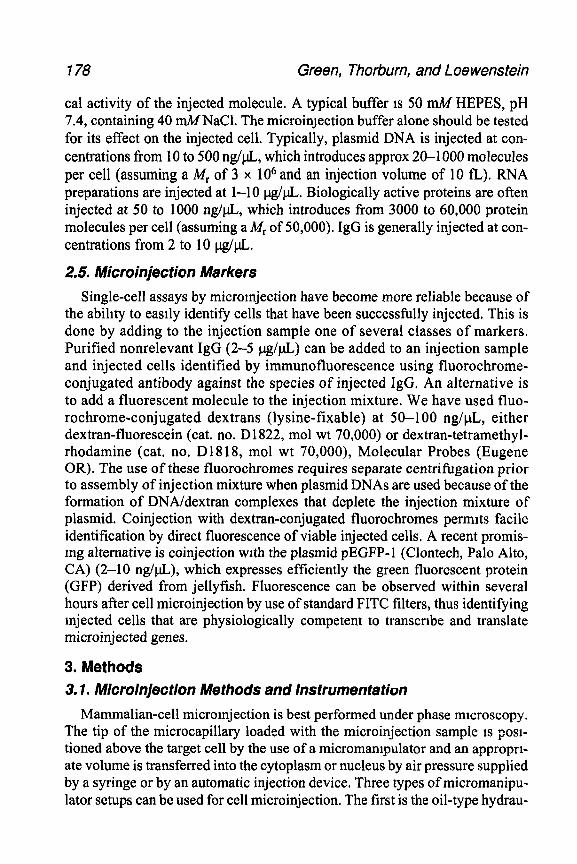
178 Green, Thorburn, and Loewenstein
cal activity of the injected molecule. A typical buffer IS SO mA4 HEPES, pH 7.4, containing 40 mMNaC1. The microinJection buffer alone should be tested for its effect on the injected cell. Typically, plasmid DNA is injected at con- centrations from 10 to 500 ng/&, which introduces approx 20-l 000 molecules per cell (assuming a Mr of 3 x lo6 and an injection volume of 10 fL). RNA preparations are injected at l-10 cl%/@. Biologically active proteins are often injected at 50 to 1000 ng/&, which introduces from 3000 to 60,000 protein molecules per cell (assuming a A4, of 50,000). IgG is generally injected at con- centrations from 2 to 10 w/pL.
2.5. Microinjection Markers
Single-cell assays by micromjection have become more reliable because of the ability to easily identify cells that have been successfully injected. This is done by adding to the injection sample one of several classes of markers, Purified nonrelevant IgG (2-5 p.g/pL) can be added to an injection sample and injected cells identified by immunofluorescence using fluorochrome- conjugated antibody against the species of injected IgG, An alternative is to add a fluorescent molecule to the injection mixture. We have used fluo- rochrome-conjugated dextrans (lysine-fixable) at 50-100 ng/pL, either dextran-fluorescein (cat. no. D1822, mol wt 70,000) or dextran-tetramethyl- rhodamine (cat. no. D1818, mol wt 70,000), Molecular Probes (Eugene OR). The use of these fluorochromes requires separate centrifugation prior to assembly of injection mixture when plasmid DNAs are used because of the formation of DNA/dextran complexes that deplete the injection mixture of plasmid. Coinjection with dextran-conjugated fluorochromes permits facile identification by direct fluorescence of viable injected cells. A recent promis- mg alternative is coinjection with the plasmid pEGFP-1 (Clontech, Palo Alto, CA) (2-10 r&L), which expresses efficiently the green fluorescent protein (GFP) derived from jellyfish. Fluorescence can be observed within several hours after cell microinjection by use of standard FITC filters, thus identifying injected cells that are physiologically competent to transcribe and translate microinjected genes.
3. Methods 3.1. Microinjection Methods and Instrumentation
Mammalian-cell micromjection is best performed under phase microscopy. The tip of the microcapillary loaded with the microinjection sample 1s posl- tioned above the target cell by the use of a micromampulator and an appropn- ate volume is transferred into the cytoplasm or nucleus by air pressure supplied by a syringe or by an automatic injection device. Three types of micromanipu- lator setups can be used for cell microinjection. The first is the oil-type hydrau-
Cell Microinjection 779
lit micromanipulator that we use for manual microinjection; an excellent hydraulic unit is the Nikon/Narashige. The second type is a mechanical micro- manipulator such as the Leitz. The third type is the electromechanical micro- manipulator which we use for semi-automatic microinjection. For the third type, the Eppendorf micromanipulator 5171 coupled with the model 5246 transjector is highly recommended. The micromanipulator is microprocessor controlled, which allows highly reproducible microcapillary positioning. The transjector permits accurate delivery of controlled volumes of injected materi- als into each cell. The use of an inverted microscope is desirable because of its ample stage and the large working distance between the stage and the con- denser. It is advantageous to use a microscope equipped with UV fluorescence to monitor cells injected with fluorescent-marker molecules. This permits iden- tification of microinjected cells to assess cell survival and for experiments that involve multiple injections at various times. For teaching purposes, it is desir- able to fit the microscope with a black-and-white video camera linked to a high-resolution monitor.
We describe below a detailed protocol for manual microinjection as well as for semi-automatic microinjection using the Eppendorf system that is now being used in many laboratories. These details provide insights into the micro- injection methodology. Manuals accompanying microinJection equipment describe the equipment but do not (and are not intended to) teach the scientist how to microinject cells.
3.7. I. Manual Microinjection
3.1.1.1. POSITIONING THE MICROCAPILLARY ABOVE THE CELL FIELD
For manual microinjection, we use a Narishige MO-204 Joystick Microma- nipulator connected to a hydraulic microdrive onto which the microcapillary holder is attached. The hydraulic microdrive is connected to a mechanical course-movement manipulator both of which are mounted on a Nikon Diaphot inverted-phase contrast microscope (Boyce Scientific, St. Louis, MO). The course manipulator moves the microdrive and attached microcapillary holder through course movements. The microscope and the micromanipulator are placed on a vibration-isolation table (Technical Manufacturing).
To begin microinjection, connect the microcapillary loaded with the sample to be injected via tygon tubing to a Gilmont micrometer 2.0-mL threaded- plunger syringe (cat. no S-1200). Apply a positive pressure of approx 0.2 mL on the syringe that has been filled with water. This will provide a holding pres- sure that prevents clogging of the microcapillary tip during subsequent manipulation. Carefully attach the microcapillary to the Narashige capillary holder (which is clamped to the microdrive at an approx 45O angle to the plane of the mtcroscope stage). Center the 35-mm dish containing cells to
180 Green, Thorburn, and Loewenstein
be injected on the stage of the microscope and focus the objective on the plane of the cells. The coarse controls consist of three knobs that direct movement in the x-axis (left and right), y-axis (front and back), and z-axis (up and down). Use the knobs on the coarse movement manipulator to bring the microcapillary to the center of the culture dish and to lower its tip to just below the surface of the culture medium.
Looking through the microscope at a x 100 magnification, focus on the microcapillary tip by moving the microcaplllary back and forth with the joy- stick in the Y direction to locate the microcapillary as a moving shadow, and raising the objective with the focusing knob until the tip of the microcapillary comes into view. Change the objective lens to give a final magnification of x200 or x400. Focus on the tip of the microcapillary and check that it is intact. In 3- to 4-step Increments, first lower the focal plane with the focusing knob and then lower the microcapillary tip with the course control until the tip is in focus. Finally, when the target cells are in focus, bring the microcapillary tip down, leaving itjust above thefocalplane of the cells, i.e., the tip is kept out of focus to avoid penetrating the cells.
3.1.1.2. MICROINJECTION OF CELLS
Use the joystick assembly controls for fine movement of the microcapillary and for microinjection. The joystick assembly of the Narashige micromampu- lator contains two knobs at the base which control fine movement separately m the X- or y-axis. Deflection of the joystick causes the microcapillary to move m a combinedxy-axis. Rotation of the joystick raises or lowers the mlcrocapillary in the z-axis. Use the two knob controls on the joystick assembly to center the microcapillary tip over the area of cells to be microiqected. Rotate the joystick to lower the tip to Just above the surface of the cell to be injected, the “search plane” (the tip should appear slightly blurry m the search plane). Microinject cells by carefully lowering the tip to penetrate the nucleus or the cytoplasm of the cell as desired. The tip of the capillary that is positioned at a 45” angle will penetrate the cell vertically, i.e., at a 90” angle. Successful injectlons are indicated by gentle swelling of the nucleus or the cytoplasm, Move the microcapillary tip from cell to cell by appropriate deflection of the joystlck. When all of the desired cells in a field are injected, move to the new area by use of the joystick knobs.
During cell microinjection, it will be necessary to periodlcally regulate the pressure applied to the microcapillary by adjustment of the Gllmont syringe. Injections with the manual system are performed under constant pressure, resulting in a constant flow of fluid. Therefore, injections into the nucleus will also deliver some sample into the cytoplasm. By constant pressure and by operator control of the degree of nuclear or cytoplasmic swelling, a moderate
Cell Microinjection 181
degree of control is obtained, delivering volumes of approx 10-20 tL (I). Although easy to learn, successful cell microinjection using the manual system requires patience and experience.
3. I .2. Eppendorf Semi-Automated Cell-Microinjection System: Micromanipulator 57 71 Combined with the Transjector 5246 (see Note 7)
The computerized Eppendorf system enables precise, reliable, and rapid posi- tioning of microcapillaries for microinjection of mammalian cells. The system consists of two basic units: the micromanipulator that electronically controls movement of the microcapillary, and the transjector that regulates injection parameters. The micromanipulator contains three precision DC stepper motors that are controlled by the operator through a joystick and are capable of smooth movement, rapidly or slowly, in the x-, y-, and z-axes. Cells can be automatically injected either in the Axial mode (the cell is injected by movement of the microcapillary in the 45” angle) or the non-Axial mode (the cell is injected by the capillary being held at a 45” angle while it is lowered in the z-axis, as is done in manual microinjection). The transjector is programmable through a convenient keypad that communicates with the micromanipulator to execute automatic- injection routines. The injection parameters include injection pressure, injection time, and compensation pressure (a constant holding pressure to prevent back- flow of medium into the microcapillary) are programmed to permit controlled injection of reproducible volumes of injection mixture into cells,
3.1.2.1. FILLING AND MOUNTING THE MICROCAPILLARY
Swing the tool holder assembly containing the capillary holder toward the operator and screw in an injection-sample-loaded microcapillary as described here. For Eppendorf femtotips, insert the tip of an Eppendorf microloader con- taining 0.5-l .O & of the injection sample as far into the femtotip as possible and slowly empty the contents into the tip. Remove the protective cap and screw the loaded femtotip into the capillary holder. To load glass micro- capillaries pulled in the laboratory, pipet the injection mixture onto the top of the capillary. After capillary action has drawn the liquid to the tip, insert the blunt end of the capillary into the 1.2~mm chuck assembly, tighten it, and insert the chuck assembly into the capillary holder. Return the capillary-holder assembly to the default injection position.
3.1.2.2. SETTING PARAMETERS FOR MICROINJECTION
Power on the transjector and the micromanipulator when the sample is ready to be microinjected. Using the transjector control keypad (T pad), set the valve to the valve position 1 (both valves closed) by cycling through the I1/12 key on the T keypad, which selects the active injection port (select valve position X
182 Green, Thorh.m, and Loewenstein
when there is no capillary mounted in order to prevent the bleedmg of au through the open valve). The T pad ~111 now display AUTO (automatic mode) and the settmgs in permanent memory for Pi (qectton pressure), PC (compen- sation pressure), 11, TI (time of injection in fractions of a second), and n (num- ber of injections). The most recently entered parameters in the tranqector may have to be modified for different tips and inJectton samples in order to obtain sattsfactory iqections. Use the SET key on the tranqector T pad to scroll through the Pi, Ti, and PC options. AdJust the values for Pi, Ti, and PC with the UP or DOWN key (followed by the SAVE key to place the new values m permanent memory if desired). After setting these parameters, press the INJECT MODE key to switch from the programmmg mode to the inject mode For most microcapillaries and mammalian cells, use settmgs for Pi of 50-200 hPA, for PC of 20 hPA, and for Ti of 0.2-0.8 s (settings of 80 for Pi, 20 for PC, and 0.2 s for Ti are good starting pomts).
3 1.2.3. POSITIONING THE MICROCAPILLARY TIP ABOVE THE CELLS
Usmg the micromanipulator keypad (M pad), switch to the Fast mode with the SPEED toggle key and to Axial movement with the AXIAL key. The M pad dtsplay should now read Dynamic, Fast, AX (axial movement), In (iqect mode), X, Y, and 2 coordmates m microns (0 when the mstrument is first turned on), and JB = INJ/IMP (Joystick button m the mJect/impale mode). If the above parameters are not displayed, enter the correct ones using the M pad keys. Center a 35-mm culture dish containing the cover slip with cells to be injected above the obJective on the microscope stage and focus on the target cells using x 100 magnification. Visually bring the tip of the microcaptllary slightly past the center of the mtcroscope obJective by rotating the Joystick knob clockwtse to lower the microcapillary, m the stmultaneous X/Z dnection (i.e., a 45’ angle smce the AXIAL movement key IS toggled on).
After centering the microcapillary tip, toggle off the AXIAL movement key so that the microcaptllary is now lowered in the Z rather than the X/Z direction. Carefully lower the microcapillary by clockwise rotation of the joystick until the tip isJust below the surface of the culture medium Switch to Slow using the SPEED toggle key on the M pad to permit a controlled approach to the plane of the cells, While viewing through the microscope, raise the obJective wtth the focusmg knob to focus on the tip of the microcapillary by moving the joystick back and forth m the Y direction to locate the mtcrocapillary as a moving shadow, and ratsing the objective until the tip comes mto view. Change the ObJective to provide a final magnification of x200 or x400. Focus on the microcapillary tip and check that it is intact. Press the CLEAN key on the T pad and confirm that the mJection mixture flows from the tip, as indt- cated by the schlieren pattern (the clean function flushes the microcapillary
Cell Microinjection 783
at maximum pressure of approx 7000 hPa). In three to four steps, alter- nately lower the focal plane with the focus knob and then lower the microcapillary with the joystick until its tip is in focus. At the last step, when the target cells are in focus, carefully lower the microcapillary tip until it is slightly above the focal plane of the cells, i.e., keep the tip slightly out offocus to avoidpenetrating the cells.
3.1.2.4. PREPARATION FOR MICROINJECTION BY SETTING THE Z-LIMIT AND SEARCH PLANE
Check the injection parameters on the A4 pad by pressing the SET key and then the INJECT key. Use the SET key to toggle between the choices and use the UP or DOWN key as a toggle to change the choices. Ensure that INJ is on, IMP is off, and for most injections, the Axial-injection mode is on (see Note 1). The speed of injection can be modified (300 pm/s is a good choice). Finally, press the ENTER key to exit the program mode. On the T pad display, N indi- cates the total number of injections attempted; set N to zero prior to each new series of injections.
The Z-LIMIT is the final depth of the microcapillary tip upon injectlon of adherent cells and is experimentally established for each series of InJections. The Z-LIMIT must be set before microinjection can be performed. Carefully rotate the joystick clockwise to lower the microcapillary tip until it just touches the surface of the target cell. Set this temporary Z-LIMIT into memory by pressing SET, LIMIT, and ENTER on the Mpad. Raise the microcapillary tip to the SEARCH PLANE with the joystick so that it is slightly above the sur- face of the cells. The image of the tip in the SEARCH PLANE will appear slightly out of focus. Attempt to inject a cell by positioning the tip slightly beyond the site of the intended injection and pressing the center button on the joystick to automatically inject the cell. The microcapillary tip will be with- drawn in the X direction, will pierce the cell in the Axial direction down to the Z-LIMIT, and will then be withdrawn to its original position in the SEARCH PLANE. If injection is successful, as indicated by a gentle swelling of the tar- geted nucleus or cytoplasm, the current Z-LIMIT is satisfactory. Most often, setting the Z-LIMIT will require several adjustments. If the tip passes through the cell entirely, as indicated by a white spot that persists, adjust the Z-LIMIT upward. If the tip does not puncture the cell, adjust the Z-LIMIT downward. To adjust the Z-LIMIT, press the LIMIT key, the UP or DOWN key (each press of the key adjusts the Z-LIMIT 160 nm), and then ENTER.
3.1.2.5. SEMIAUTOMATIC INJECTION OF ADHERENT CELLS ON COVER SLIPS
Cells are injected by positioning the microcapillary tip, while in the SEARCH PLANE, over the target site and pressing the button on the joystick.
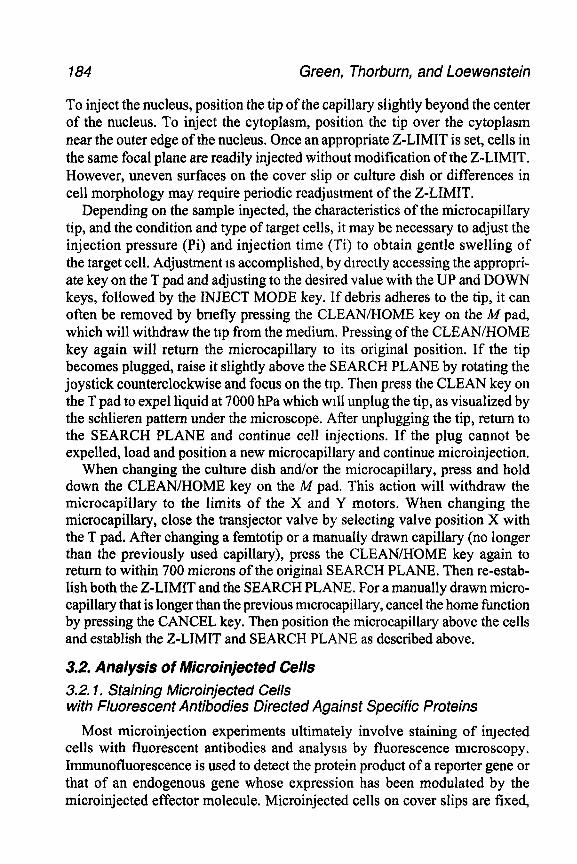
184 Green, Thorburn, and Loe wens tein
To inject the nucleus, position the tip of the capillary slightly beyond the center of the nucleus. To inject the cytoplasm, position the tip over the cytoplasm near the outer edge of the nucleus. Once an appropriate Z-LIMIT is set, cells in the same focal plane are readily injected without modification of the Z-LIMIT. However, uneven surfaces on the cover slip or culture dish or differences in cell morphology may require periodic readjustment of the Z-LIMIT.
Depending on the sample inJected, the characteristics of the microcapillary tip, and the condition and type of target cells, it may be necessary to adjust the injection pressure (Pi) and injection time (Ti) to obtain gentle swelling of the target cell. Adjustment is accomplished, by directly accessing the appropri- ate key on the T pad and adjusting to the desired value with the UP and DOWN keys, followed by the INJECT MODE key. If debris adheres to the tip, it can often be removed by briefly pressing the CLEAN/HOME key on the M pad, which will withdraw the tip from the medium. Pressing of the CLEAN/HOME key again will return the microcapillary to its original position. If the tip becomes plugged, raise it slightly above the SEARCH PLANE by rotating the joystick counterclockwise and focus on the tip. Then press the CLEAN key on the T pad to expel liquid at 7000 hPa which will unplug the tip, as visualized by the schlieren pattern under the microscope. After unplugging the tip, return to the SEARCH PLANE and continue cell injections. If the plug cannot be expelled, load and position a new microcapillary and continue microinjection.
When changing the culture dish and/or the microcapillary, press and hold down the CLEAN/HOME key on the M pad. This action will withdraw the microcapillary to the limits of the X and Y motors. When changing the microcapillary, close the transjector valve by selecting valve position X with the T pad. After changing a femtotip or a manually drawn capillary (no longer than the previously used capillary), press the CLEAN/HOME key again to return to within 700 microns of the original SEARCH PLANE. Then re-estab- lish both the Z-LIMIT and the SEARCH PLANE. For a manually drawn micro- capillary that is longer than the previous mtcrocapillary, cancel the home function by pressing the CANCEL key. Then position the microcapillary above the cells and establish the Z-LIMIT and SEARCH PLANE as described above.
3.2. Analysis of Microinjected Cells 3.2. I. Staining Microinjected Cells with Fluorescent Antibodies Directed Against Specific Proteins
Most microinjection experiments ultimately involve staining of inJected cells with fluorescent antibodies and analysis by fluorescence microscopy. Immunofluorescence is used to detect the protein product of a reporter gene or that of an endogenous gene whose expression has been modulated by the microinjected effector molecule. Microinjected cells on cover slips are fixed,
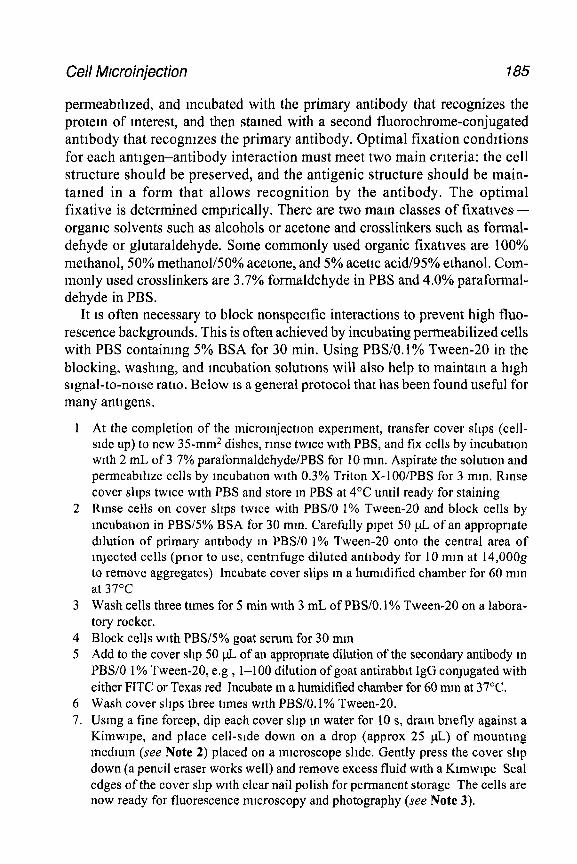
Cell M/croinjection 185
permeablllzed, and incubated with the primary antibody that recognizes the protein of Interest, and then stained with a second fluorochrome-conjugated antibody that recognizes the primary antibody. Optimal fixation conditions for each antigen-antibody interaction must meet two main criteria: the cell structure should be preserved, and the antigenic structure should be main- tamed in a form that allows recognition by the antibody. The optimal fixative is determined empirically. There are two mam classes of tixatlves- organic solvents such as alcohols or acetone and crosslinkers such as formal- dehyde or glutaraldehyde. Some commonly used organic fixatives are 100% methanol, 50% methanol/50% acetone, and 5% acetic acid/95% ethanol. Com- monly used crosslinkers are 3.7% formaldehyde in PBS and 4.0% paraformal- dehyde in PBS.
It 1s often necessary to block nonspecific interactions to prevent high fluo- rescence backgrounds. This is often achieved by incubating permeabilized cells with PBS containing 5% BSA for 30 min. Using PBS/O.l% Tween-20 in the blocking, washing, and incubation solutions will also help to maintain a high signal-to-noise ratlo. Below 1s a general protocol that has been found useful for many antigens.
At the completion of the micromjectlon experiment, transfer cover shps (cell- side up) to new 35-mm2 dishes, rinse twice with PBS, and fix cells by incubation with 2 mL of 3 7% paraformaldehyde/PBS for 10 mm. Aspirate the solution and permeablhze cells by mcubatlon with 0.3% Triton X-lOO/PBS for 3 mm. Rinse cover slips twice with PBS and store m PBS at 4°C until ready for staining Rinse cells on cover shps twice with PBS/O 1% Tween-20 and block cells by incubation in PBS/S% BSA for 30 mm. Carefully plpet 50 pL of an appropriate dilution of primary antlbody m PBS/O 1% Tween-20 onto the central area of Injected cells (prior to use, centrifuge diluted antibody for 10 mm at 14,OOOg to remove aggregates) Incubate cover slips m a humidified chamber for 60 mm at 37OC Wash cells three times for 5 min with 3 mL of PBS/O. 1% Tween-20 on a labora- tory rocker. Block cells with PBS/S% goat serum for 30 mm Add to the cover shp 50 pL of an appropnate dilution of the secondary antibody m PBS/O 1% Tween-20, e.g , l-100 dilution of goat antirabblt IgG coqugated with either FITC or Texas red Incubate m a humidified chamber for 60 mm at 37°C. Wash cover slips three times with PBS/O. 1% Tween-20. Using a fine forcep, dip each cover slip m water for 10 s, dram briefly against a Kimwlpe, and place cell-side down on a drop (approx 25 pL) of mountmg medium (see Note 2) placed on a microscope slide. Gently press the cover s11p down (a pencil eraser works well) and remove excess fluid with a Klmwlpe Seal edges of the cover slip with clear nail polish for permanent storage The cells are now ready for fluorescence microscopy and photography (see Note 3).
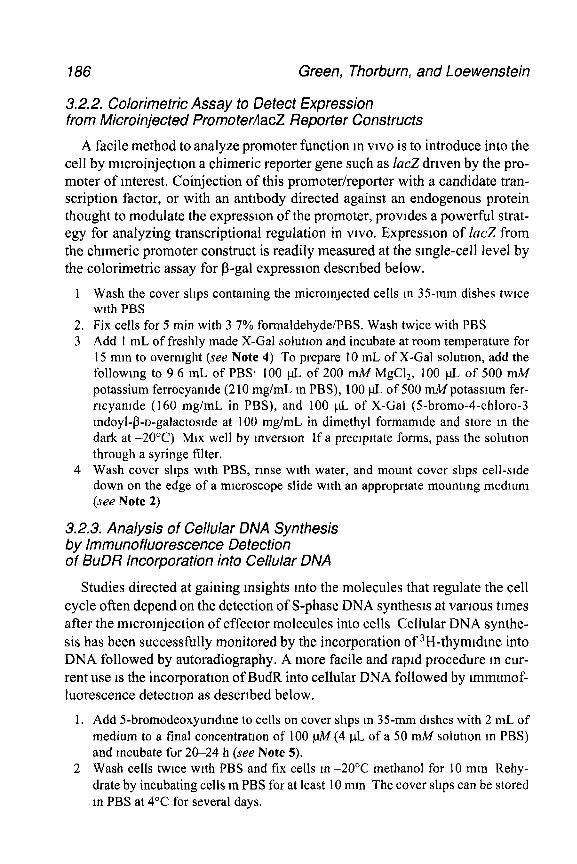
786 Green, Thorburn, and Loewenstein
3.2.2. Calorimetric Assay to Detect Expression from Microinjected PromoteulacZ Reporter Constructs
A facile method to analyze promoter function m VIVO is to introduce into the cell by mlcroinjectlon a chimeric reporter gene such as lad driven by the pro- moter of interest. Coinjection of this promoter/reporter with a candidate tran- scription factor, or with an antibody directed against an endogenous protein thought to modulate the expression of the promoter, provides a powerful strat- egy for analyzing transcriptional regulation in VIVO. Expression of 1ac.Z from the chlmeric promoter construct is readily measured at the smgle-cell level by the calorimetric assay for P-gal expresslon described below.
1 Wash the cover slips containing the micromjected cells m 35-mm dishes twice with PBS
2. Fix cells for 5 min with 3 7% formaldehyde/PBS. Wash twice with PBS 3 Add 1 mL of freshly made X-Gal solution and incubate at room temperature for
15 mm to overmght (see Note 4) To prepare 10 mL of X-Gal solution, add the followmg to 9 6 mL of PBS* 100 pL of 200 mM MgC12, 100 pL of 500 mM potassium ferrocyamde (210 mg/mL m PBS), 100 pL of 500 mMpotassmm fer- rlcyamde (160 mg/mL in PBS), and 100 pL of X-Gal (5-bromo-4-chloro-3 mdoyl-P-n-galactoslde at 100 mg/mL in dimethyl formamide and store in the dark at -20°C) MIX well by mverslon If a preclpltate forms, pass the solution through a syringe filter.
4 Wash cover slips with PBS, rinse with water, and mount cover shps cell-side down on the edge of a microscope slide with an appropriate mounting medmm (see Note 2)
3.2.3. Analysis of Cellular DNA Synthesis by lmmunoiluorescence Detection of BuDR incorporation into Cellular DNA
Studies directed at gaining Insights mto the molecules that regulate the cell cycle often depend on the detection of S-phase DNA synthesis at various times after the mlcromjection of effector molecules into cells Cellular DNA synthe- sis has been successfully monitored by the incorporation of 3H-thymldme into DNA followed by autoradiography. A more facile and rapid procedure m cur- rent use IS the incorporation of BudR into cellular DNA followed by tmmunof- luorescence detectlon as described below.
1. Add 5-bromodeoxyundme to cells on cover shps m 35-mm dishes with 2 mL of medium to a final concentration of 100 $! (4 pL of a 50 mM solution m PBS) and incubate for 20-24 h (see Note 5).
2 Wash cells twice with PBS and fix cells m -20°C methanol for 10 mm Rehy- drate by incubating cells m PBS for at least 10 mm The cover shps can be stored m PBS at 4°C for several days.
Cell Microiqection 187
3 Incubate cover sltps for 30 min m 1 5 N HCl to denature cellular DNA Wash coverslips three times for 3 mm with PBS.
4 Incubate cover slips for 30 min at 37°C in a humidified incubator wtth 50 ml of primary antibody solution consisting of a 1:50 dilutton m PBS/O.S% BSA of anti- BrdU monoclonal antibody (Becton Dickmson, Rutherford, NJ, cat no 7580)
5. Wash cover slips three times for 5 mm with PBS. 6 Incubate cover slips for 30 mm at 37°C with a secondary-antibody solution con-
ststmg of 50 p.L of a 1.50 dilution in PBS/O.S% BSA of Texas red ConJugated sheep antimouse irrununoglobulin polyclonal antrbody (Amersham, Arlmgton Heights, IL, cat no N 203 1).
7 Wash cover slips three times with PBS, rinse briefly with water, and mount each cover slip cell-stde down on a mtcroscope slide (see Note 2)
3.2.4. In situ Hybridization and Autoradiography to Measure Speclfx RNA Molecules in Microinjected Cells
Studies on the transcription of microinJected genes, of reporter genes driven by microinjected promoter/reporter constructs, or of endogenous cellular genes require the use of in situ hybridization to detect specific RNA molecules RNA formation can often be detected within 20 min after injection of a suttable expression plasmid. Hybridization is performed using radtolabeled DNA or antisense RNA probes followed by autoradtography with a low melting tem- perature photographic emulsion. Below we provide detailed protocols used in our laboratory based on the methods developed in the laboratory of R. Singer with manor modrfications (4,14) 35S 1s preferable for radiolabehng probes used for zn sttu hybrtdization. DNA probes are prepared by nick translation or by random priming, using 35S-dCTP as labeled precursor and a commercial kit. Anttsense RNA probes are prepared from an appropriate vector contaming the gene of interest upstream of a T7, T3, or Sp6 promoter. 35S-CTP 1s used as precursor with the appropriate RNA polymerase, and a commercial kit (Promega, Madison, WI).
In the past few years, the use of nonradioactive detection of mRNA by zn sztu hybridizatton has become widely used. One of the most sensitive proce- dures involves labeling the DNA or RNA probe or an approprtate oltgonucle- otide with digoxigenin-tagged deoxyuridine triphosphate (DIG- 11 -dUTP) and immunological detection using antidigoxigenin antibody conjugated with alkaline phosphatase followed by calorimetric analysis. These procedures are reported to be as sensitive as the radioactive detection. The methodology used for in situ hybridization with probes labeled by the dtgoxtgenin are very simi- lar to those described below with appropriate modifications (for example, see ref. 15) Boehringer Mannhelm offers reagents for nonradtoacttve zn sztu hybridtzation and provides an excellent apphcatton manual (ref. 26) that pro- vides detailed protocols.
188 Green, Thorburn, and Loewenstein
3 2.4 1 FIXATION OF MICROINJECTED CELLS
1. Wash microinJected cells on 22-mm2 cover slips twice with 3 mL of PBS 2. Rinse cover slips with 3 mL of 4% paraformaldehyde/5 mA4 M&&/PBS and
incubate for 15 mm with 3 mL of the same solution; 4% paraformaldehyde 1s prepared by heating paraformaldehyde (Aldrich, Milwaukee, WI) m PBS at approx 60°C with stirring for about 3 h and then adding MgCl, to 5 mM, fol- lowed by filtration to remove particulates
3. Rinse cover slips with 3 mL of 70% ethanol and incubate with 3 mL of 70% ethanol at 4°C for at least 1 h
3.2 4.2 PREHYBRIDIZATION
1.
2.
3
4.
Remove each cover slip from 70% ethanol with a fine-tipped forceps, blot the edge agamst a KImwipe, place carefully m a stammg dish contammg 10 mL of 5 mA4MgC12/PBS, and Incubate for 10 mm. Be sure to monitor which side of the cover slip contains the cells (mark one end of the staining dish and place cover slips with cells facing the marked end) (a VWR Scientific staining dish, cat no 25452-002, contains four pan-s of grooves and can accommodate seven cover slips positioned m a zigzag onentatlon). For antisense RNA probes, acetylate cells by mcubatlon for 10 mm with 10 mL of 0.1 M triethanolamine-HCl, pH 8.0 containing 0 25% acetic anhydride (stock 0 1 M triethanolamme 1s brought to pH 8.0 with approx 2 mL of concentrated HCI and stored at room temperature). Add 25 pL anhydrous acetlc anhydride to 10 mL of triethanolamine just before use Rinse cover shps twice with 2X SSC (SSC IS 150 mMNaCl/lS tiNa Citrate, pH 7 0) Aspirate the solution and incubate cover slips for 10 mm m the staining dish with 10 mL of 0.1 M glycme/0.2 M Tns-HCl, pH 7.4, Aspirate the solution completely and incubate cover slips for exactly 10 mm in 10 mL of 50% deionized formamide/2X SSC/lO mMDTT at 65’C (do this at the same time as the probe 1s being denatured, Just prior to hybndlzatlon). Molecular-biology grade formamide is deionized by stirring for 30 min with AG5OlX8(D) resin (Bio-Rad, Hercules, CA), filtered through Whatman no. 1 filter paper, and then stored in the dark at -20°C.
3.2 4.3. HYBRIDIZATION
1. Dry down the following mixture m a separate Eppendorf tube for each cover slip (Savant, Hlcksvllle, NY, Speed Vat Concentrator or a lyophllizer) Add in order to each tube: 2 pL of 10 mg/mL (10 pg) E colz tRNA (Boehrmger); 2 pL of 10 mg/mL (10 pg) salmon-sperm DNA (Sigma, sheared to approx 300 bp by passing through a 26-gage needle); and 620 ng of either 35S-labeled DNA or 35S-labeled RNA probe (l-5 x lo6 cpm).
2 Add 10 & of formamide to the dried probe mixture m each Eppendorf tube. 3 Cap each Eppendorf tube and denature the probe by heating for 10 mm at 90°C
using a heating block
Cell Microinjection
4. Prepare 2X hybridization buffer by mixing l/5 volume of 20X SSC, l/5 of BSA (20 mg/mL, Boehrmger, molecular-biology grade), 215 volume of 50% dextran sulfate (Pharmacra), and l/5 volume of 1 M DTT (dithlothreitol). One at a time, remove an Eppendorf tube from the heating block, add 10 pL of 2X hybrrdization buffer, and gently pipet up and down five times with a 20-pL prpetman (the final concentration in the hybridization mixture is 2X SSC or 0.36 MNa+). Take every precaution to avoid an bubbles. If air bubbles are formed, centrtfuge the tube for 10 s Transfer the hybridization mixture in two installments (to avoid an bubbles) to a sheet of parafilm taped tightly on top of a glass plate. With a pair of fine forceps, remove the cover slip from the prehybridization mixture, drain briefly, and place it cell-side down on top of the 20-$ drop of hybridization mixture. Remove any an bubbles over the region of injected cells by gentle manipulation of the cover slip with the forceps. When all cover slips have been applied to the probe mixture, place a second sheet of parafilm over the cover shps to prevent drying, and incubate at 37°C for DNA probes or 45°C for RNA probes in a humidified incubator for 4 h to overnight.
3.2.4.4. POSTHYBRIDIZATION WASHING OF COVER SLIPS AFTER HYBRIDIZATION WITH DNA PROBES
1 Gently lift each cover slip from the parafilm with a pair of forceps as follows. To avoid breaking fragile cover slips, add a drop of 50% formamide/2X SSC to the edge of the cover slip, pierce the parafilm near the edge wrth sharp forceps, and gently break the surface tension by slowly raising the cover slip to allow the solution to enter the space between the cover slip and the parafilm. Incubate the cover slips m 10 mL of 50% formamide/2X SSC for 30 mm at 37°C in a staining dish (seven slips per dish as described above).
2 Aspirate the solution and incubate the cover slips for 30 mm in 10 mL of 50% formamide/lX SSC at 37°C.
3. Transfer each cover shp to individual 60-mm culture dishes contammg 10 mL of 1X SSC and wash by rocking for 30 mm. Repeat washes two or three times.
4. Dehydrate the cells on cover slips in a staining dish by sequential incubation for 5 mm with 70,95, and 100% ethanol. Air-dry for at least 30 min.
5. Mount each cover slip cell-side up at one end of a microscope slide using a drop of Pro-Texx mounting medium (American Scientific Products [McGraw Park, IL] cat no. M7635). Mounted cover slips are ready for autoradiography after approx 1 h.
3.2.4.5. POSTHYBRIDIZATION WASHING OF COVER SLIPS AFTER HYBRIDIZATION WITH RNA PROBES
1. Gently lift each cover slip from the parafilm as described above and wash m individual 60-mm culture dishes by rocking for 60 min m 10 mL of 4X SSC/ 10 mA4DTT
2. Transfer cover slips to a staining dish. Dehydrate by 2-min sequential incuba- tions in 70% ethanol and 95% ethanol containing 300 mA4 ammomum acetate, followed by 100% ethanol.
190 Green, Thorburn, and Loewenstein
3 Incubate the cover slips for 10 min m 10 mL of 50% formamide/2X SSC/l 0 mM DTT at 50°C
4. Rinse cover slips with 2X SSC 5 Incubate cover slips for 30 min at 37°C with 10 mL of 20 pg/mL RNase A,
prepared by adding 20 & of 10 mg/mL stock RNase in water to 10 mL of RNase buffer (RNase buffer is 500 mMNaCI/lO rnUTrts-HCl, pH 8.0/l mA4EDTA)
6. Incubate cover slips for 10 mm in 10 mL of RNase buffer at 37°C. 7 Incubate cover slips for 10 min in 10 mL of 2X SSC. Rinse twice wtth 2X SSC 8. Incubate cover shps for 15 mm in 10 mL of 0.1X SSC at 40°C. 9 Transfer each cover shp to a 60-mm culture dish contammg 10 mL of 0.1X SSC
and rock for 10 mm. 10 Dehydrate cells m a stainmg dish for 2-mm periods m 70% and 95% ethanol
containing 300 mM ammonmm acetate, followed by 100% ethanol. An-dry for at least 30 mtn.
11. Mount cover slips cell-stde up at one end of microscope slide usmg Pro-Texx mountmg medium (American Scientific Products cat no. M7635) The mounted cover slips are ready for autoradiography after 1 h
3.2.4.6. AUTORADIOGRAPHY
1
2.
3.
4 5
6. 7. 8 9
In a darkroom under a safelight (Kodak Wratten no 2 safehght contammg a 25-W bulb), melt a 20-mL aliquot of Kodak NTB-2 emulston in a 50-mL centrifuge tube in a 42°C water bath for at least 1 h (Kodak NTB-2 emulsion on receipt from the vender is melted at 42°C m the dark for at least 2 h and 20-mL ahquots are placed m plastic tubes, wrapped in alummum foil, and stored at 4°C until used). Carefully and slowly dip the cover slip end of the slide into the emulsion. Allow the mounted cover shp to dram vertically in a test tube rack for approx 30 mm in the absolute dark (as the emulsion dnes, it becomes very light sensitive, even to a safelight). Place shdes in a light-tight slide box contammg a desiccant, wrap the box m aluminum foil, and expose the emulsion-covered cover slips at 4°C for 2-4 d depending on the strength of the radioactive signal After exposure, allow slides to warm to room temperature. In a darkroom (no safelight), develop the emulsion-covered cover slips mounted on slides m a shde-staming tray for 5 mm at approx 18°C m Kodak D- 19 devel- oper diluted 1: 1 with water Rinse slides for 30 s m water at approx 18°C Fix slides for 5 min in Kodak fixer at approx 18°C Wash slides for 30 mm m cold runnmg water Air-dry slides Score slides by microscoptc observatton under phase at a magmficatton of x200-400 Heavily hybridtzed cells ~111 have many exposed silver grams visible over the cell Lightly hybrtdized cells ~111 show individual grains, often best viewed out of phase, and can be quantitated by gram countmg See Note 6 for combined IF and autoradiographic analysis.
Cell Micromjection
4. Notes 1. The Eppendorf micromanipulator provides the ability to automatically inject m
two different modes, the Axtal mlectton mode on and the Axial injection mode off: In both modes, the capillary IS held at a 45” angle With the Axtal mode on, mjection 1s automatically performed with the cell being pierced m the Axial direction, i e., at a 45” angle, and then returned to its initial position at the Search Plane. With the Axial mode osf, the capillary (which is normally held at a 45” angle) is lowered vertically m the X direction, thus injecting the cell and then is returned to its initial position. The Axtal injectton mode on is the preferred method for injecting most mammalian cells. However, the Axial mode off has been found to improve survival of certain cell types, including human cardiac myocytes and prostate cells
2 Several commercially available mounting media are available for permanently attaching cover slips cell-side down to slides. For fluorescence microscopy, we recommend a SlowFadeTM-light Antifade kit from Molecular Probes. A perma- nent mountmg medium useful for both fluorescence and X-Gal stammg 1s Gelvatol, which can be used for fluorescent microscopy by the addition of DABCO as described (ref. 17).
3 It is Important to photograph all important data for permanent records. For black- and-whtte photography, we use Kodak T-Max (ASA 400) with a microscopic magnification of x20&400.
4 High levels of P-galactosidase expression produce detectable blue cells within 60 min after addmon of the X-Gal solution. For cells with less /3-galactosidase activity, overnight stammg may be required and therefore stained cells should be monitored by phase microscopy to determine when to terminate X-Gal staining. Note that when coinjectmg a fluorescent marker, X-Gal staining which 1s caused by a blue precipitate will quench the mununofluorescent signal from the marker. Because P-galactosidase activity is derived from an injected plasmrd, any blue stamed cells have been successfully injected whether a fluorescent marker is seen or not. Thus the total number of injected cells is the sum of blue-stained cells plus fluorescent cells not exhibiting a blue stain.
5. BudR can be added to cells for dtfferent time periods, depending on the purpose of the experrment. For example, to measure quiescence or stimulation of quies- cent cells by serum or microinjection of various oncogenes or mttogens, it is convenient to add BudR at 4-8 h after micromjection followed by mcubation for 12-24 h prior to fixation and analysis for BudR incorporation. In this manner, one can determine the cumulative number of cells that enter S phase during the mcorporatron period. Pulse mcorporation of BudR for shorter periods at various times after microinjection can be used to more precisely define the time periods when cellular DNA synthesis is occurrmg.
6. It is possible to detect both protein by immunofluorescence and RNA by in sztu hybridization. First, do standard zn sttu hybridization analysis but do not add photographic emulsion Second, perfomr the antibody-staining reaction Third, coat the slide wtth photographic emulsron, expose, and develop. Under the
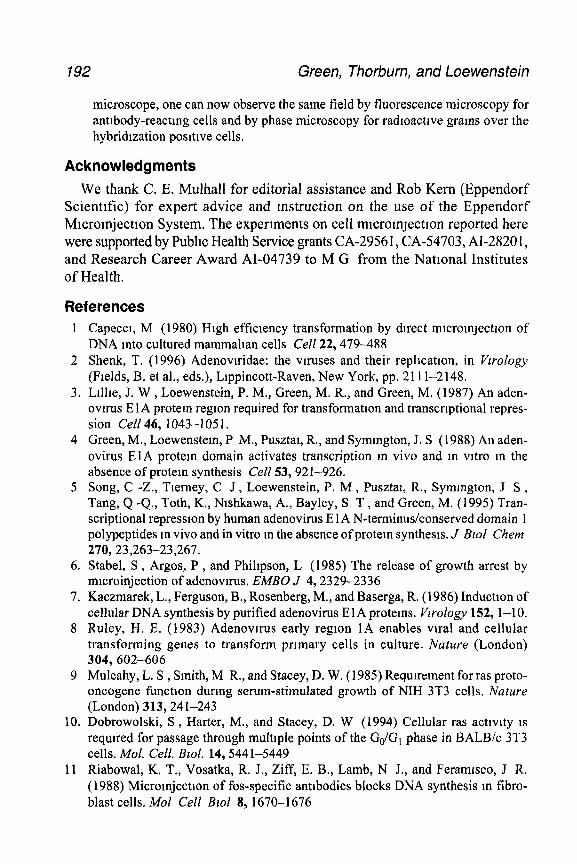
192 Green, Thorburn, and Loewenstein
microscope, one can now observe the same field by fluorescence microscopy for antibody-reacting cells and by phase microscopy for radIoactIve grams over the hybridization positive cells.
Acknowledgments We thank C. E. Mulhall for editorial assistance and Rob Kern (Eppendorf
Scientific) for expert advice and mstruction on the use of the Eppendorf Mlcromjectlon System. The experiments on cell mlcroqectlon reported here were supported by Public Health Service grants CA-2956 1, CA-54703, AI-2820 1, and Research Career Award AI-04739 to M G from the National Institutes of Health.
References 1 Capeccl, M (1980) High efficiency transformation by direct mlcromJectlon of
DNA mto cultured mammalian cells Cell 22,479-488 2 Shenk, T. (1996) Adenovlridae: the viruses and their repllcatlon, in Vwology
(Fields, B. et al,, eds.), Llppincott-Raven, New York, pp. 211 l-2148. 3. L&e, J. W , Loewenstein, P. M., Green, M. R., and Green, M. (1987) An aden-
ovu-us E 1 A protein region required for transformation and transcriptional repres- sion Cell 46, 1043-l 05 1.
4 Green, M., Loewenstem, P M., Pusztal, R., and Symmgton, J. S (1988) An aden- ovirus EIA protein domain activates transcription m vivo and m vitro m the absence of protein synthesis Cell 53,92 l-926.
5 Song, C -Z., Tlerney, C J , Loewenstein, P. M , Pusztal, R., Symmgton, J S , Tang, Q -Q., Toth, K., Nlshkawa, A., Bayley, S T , and Green, M. (1995) Tran- scriptional repression by human adenovirus E 1 A N-terminus/conserved domain 1 polypeptides m vivo and in vitro m the absence of protern synthesis. J Blol Chem 270,23,263-23,267.
6. Stabel, S , Argos, P , and Phihpson, L (1985) The release of growth arrest by microinjection of adenovnus. EMBO J 4,2329-2336
7. Kaczmarek, L., Ferguson, B., Rosenberg, M., and Baserga, R. (1986) Induction of cellular DNA synthesis by purified adenovirus ElA proteins. Vzrology 152, l-10.
8 Ruley, H. E. (1983) Adenovlrus early region IA enables viral and cellular transforming genes to transform primary cells in culture. Nature (London) 304,602-606
9 Mulcahy, L. S , Smith, M R., and Stacey, D. W. (1985) Requirement for ras proto- oncogene function during serum-stimulated growth of NIH 3T3 cells. Nature (London) 313,24 l-243
10. Dobrowolski, S , Harter, M., and Stacey, D. W (1994) Cellular ras activity 1s required for passage through multiple points of the GdG, phase in BALB/c 3T3 cells. Mol. Cell. Blol. 14, 5441-5449
11 Riabowal, K. T., Vosatka, R. J., Ziff, E. B., Lamb, N J., and Feramlsco, J R. (1988) Micromjectlon of fos-specific antibodies blocks DNA synthesis m fibro- blast cells. Mol Cell Bzol 8, 1670-1676

Cell Microinjection 193
12. Kovary, K. and Bravo, R (1992) TheJun and fos protein families are both requtred for cell cycle progressron in fibroblasts. Mol Cell. Biol 11,4466-4472.
13. Arias , J., Alberts, A S , Brindle, P , Claret, F. X , Smeal, T , Karm, M., Feramisco, J., and Montminy, M. (1994) Activation of CAMP and mrtogen responsive genes relies on a common nuclear factor Nature (London) 370, 226-229.
14. Lawrence, J. B. and Singer, R H. (1986) Intracellular localizatton of messenger RNAs for cytoskeletal protems. Cell 45,407-4 15.
15. Ktslauskts, E. H , Lr, Z , Singer, R H., and Taneja, K. L. (1993) Isoform-spectfic 3’-untranslated sequences sort a-cardiac and P-cytoplasmtc actm messenger RNAs to different cytoplasmic compartments. J Cell Bzol 123, 165-l 72.
16. Nonradloactzve in sztu hybridzzatron application manual, 2nd ed Boehringer Mannheim, Mannhelm, Germany.
17. Harlow, E. and Lane, D. (1988) Antlbodles A Laboratory Manual Cold Spring Harbor Laboratory, Cold Sprmg Harbor, NY.

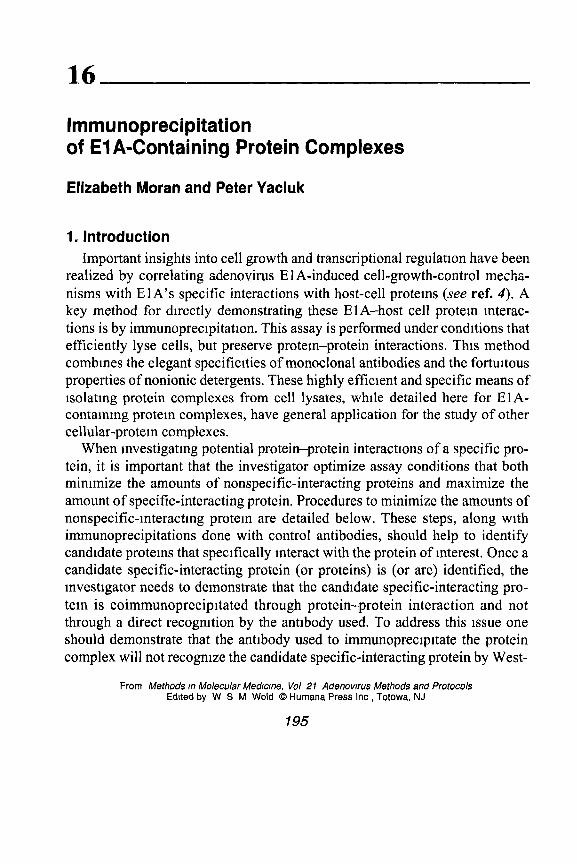
16
Immunoprecipitation of El A-Containing Protein Complexes
Elizabeth Moran and Peter Yaciuk
1. Introduction Important insights into cell growth and transcriptional regulation have been
realized by correlating adenovirus E 1 A-induced cell-growth-control mecha- nisms with El A’s specific interactions with host-cell proteins (see ref. 4). A key method for directly demonstrating these El A-host cell protem tnterac- tions is by immunoprecipitation. This assay is performed under condttions that efficiently lyse cells, but preserve protem-protein interactions. This method combines the elegant specificities of monoclonal antibodies and the fortuitous properties of nonionic detergents. These highly efficient and specific means of isolatmg protein complexes from cell lysates, while detailed here for ElA- containing protein complexes, have general application for the study of other cellular-protein complexes.
When investigating potential protein-protein interactions of a specific pro- tein, it is important that the investigator optimize assay conditions that both mirumize the amounts of nonspecific-interacting proteins and maximize the amount of specific-interacting protein. Procedures to minimize the amounts of nonspecific-mteractmg protein are detailed below. These steps, along with immunoprecipitations done with control antibodies, should help to identify candidate proteins that specifically interact with the protein of interest. Once a candidate specific-interacting protein (or proteins) is (or are) identified, the investigator needs to demonstrate that the candidate specific-interacting pro- tem is coimmunoprecipitated through protein-protein interaction and not through a direct recognition by the antibody used. To address this issue one should demonstrate that the antibody used to immunoprecipttate the protein complex will not recognize the candidate specific-interacting protein by West-
From Methods m Molecular Medmne, Vol 21 Adenovms Methods and Protocols Edited by W S M Wold 0 Humana Press Inc , Totowa, NJ
195
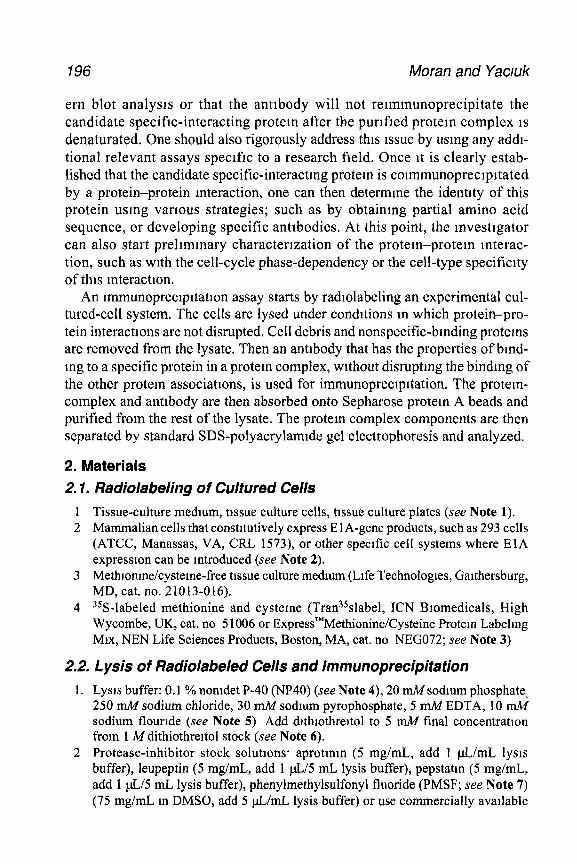
796 Moran and Yacwk
et-n blot analysis or that the antibody will not rermmunoprecipitate the candidate specific-interacting protern after the purrfred protein complex IS denaturated. One should also rigorously address this Issue by usrng any addr- tional relevant assays specrfrc to a research field. Once rt is clearly estab- lished that the candidate specific-interactmg protein is counmunoprecrprtated by a protein-protein interaction, one can then determine the identrty of this protein using vartous strategies; such as by obtainmg partial amino acid sequence, or developing specific antrbodies. At this point, the mvestrgator can also start prelrmmary characterization of the protein-protein mterac- tion, such as wrth the cell-cycle phase-dependency or the cell-type specificity of thus mteractron.
An mununoprecrprtat~on assay starts by radlolabeling an experimental cul- tured-cell system. The cells are lysed under condttions m which protein-pro- tein interactions are not disrupted. Cell debris and nonspecific-binding protems are removed from the lysate. Then an antibody that has the properties of bmd- mg to a specific protein in a protein complex, wrthout disrupting the binding of the other protein associatrons, is used for immunoprecrpttation. The protem- complex and antrbody are then absorbed onto Sepharose protem A beads and purified from the rest of the lysate. The protem complex components are then separated by standard SDS-polyacrylamrde gel electrophoresis and analyzed.
2. Materials 2.1. Radiolabeling of Cultured Cells
1 Tissue-culture medium, tissue culture cells, tissue culture plates (see Note 1). 2 Mammalian cells that constuutively express El A-gene products, such as 293 cells
(ATCC, Manassas, VA, CRL 1573), or other specific cell systems where El A expression can be mtroduced (see Note 2).
3 Methlonme/cysteme-free tissue culture medium (Life Technologres, Garthersburg, MD, cat. no. 21013-016).
4 3SS-labeled methionine and cysteme (Tran35slabel, ICN Bromedicals, High Wycombe, UK, cat. no 5 1006 or ExpressT”Methionine/Cysteine Protem Labelmg MIX, NEN Life Sciences Products, Boston, MA, cat. no NEG072; see Note 3)
2.2. Lysis of Radiolabeled Cells and lmmunoprecipitation 1. Lysrs buffer: 0.1 % nomdet P-40 (NP40) (see Note 4), 20 mM sodmm phosphate,
250 mI4 sodium chloride, 30 mM sodium pyrophosphate, 5 mA4 EDTA, 10 mM sodium flourlde (see Note 5) Add drthrothreltol to 5 mA4 final concentration from 1 M dithiothrertol stock (see Note 6).
2 Protease-inhibitor stock solutions aprotmm (5 mg/mL, add 1 pL/mL lys~s buffer), leupeptin (5 mg/mL, add 1 pL/5 mL lysis buffer), pepstatm (5 mg/mL, add 1 @J5 mL lysis buffer), phenylmethylsulfonyl fluoride (PMSF; see Note 7) (75 mg/mL m DMSO, add 5 p.L/mL lysis buffer) or use commercially avarlable
E lA-Containing Protein Immunoprecipitation 197
mixes of protease mhibitors (Protease Inhibttor cocktail, Sigma, St LOUIS, MO, cat. no. P8340 or Protease Inhibitor Set, Boehringer Mannhetm, Mannhetm, Germany, cat. no 1206 893) according to manufacturers recommendattons (see Note 8).
3. Phosphotyrosme-specific phosphatase mhibttor stocks solutton: 100 mMNa,VOQ add 1 pL/mL of lysis buffer (see Note 9)
4. Stock 10% Staphlococcus aureus Cowan A strain slurry (Igsorb, The Enzyme Center, Malden, MA, cat. no IgSL-100; see Note 10).
5. Antt-El A monoclonal antibody, M73 (Oncogene Research, Calbtochem, La Jolla, CA, cat. no. DPl 1, see Note 11) or stock antigen-specific antibody solu- tions (see Note 12) and secondary antibody, such as rabbit antimouse polyclonal antibodies (Organon Tekmka, Durham, NC, cat no 55480, or various venders, see Note 13)
6. Stock 3% Protein A Sepharose CL4B beads (Pharmacta Biotech, Uppsala, Swe- den, cat. no. 17-0780-01) (see Note 14).
7. 2X Sample loading buffer: 100 mM Trts, 200 mM dithiothreitol, 4% sodium dodecyl sulfate (SDS), 0 2% bromophenol blue, 10% glycerol
2.3. Norma/izafion of Cell Lysafes
1. Bio-Rad Protein Assay kit (Bio-Rad, Hercules, CA, cat. no. 500-0001, or other venders, see Note 14).
2 Glass-microfiber filter disks (Fischer Sctenttfic, Ptttsburgh, PA) (Whatman GF/C, cat. no. 1822-024 or various vendors).
3 20% trichloroacetic acid
3. Methods 3.1. Radiolabeling of Cultured Cells
1. Infect or transfect cells with appropriate wild-type or mutant adenovnuses (see Note 16) or weld type or mutant ElA-expression plasmtds at appropriate times prior to the m vivo labeling of cells.
2 Remove media from infected- or transfected-cell cultures or cell lmes that con- stttuttvely express E 1 A
3. Rmse tissue-culture cells with 3 mL methionme/cysteine-free DMEM. 4. Add 3 mL methionine-free DMEM containing 100 pCi 35S-labeled methioninel
cysteme (see Note 17) 5. Incubate at 37°C in a tissue-culture incubator for the appropriate labelmg times
(see Note 18)
3.2. Immunoprecipifafion
1 After the mcubatton period, remove radioacttve media into designated radioac- tive waste containers.
2. Add 1 mL lysis buffer to each plate. Distribute lysis buffer over entire surface of plate, manually shake, and then rock plates m cold room for 10 mm
198 Moran and Yaciuk
3. Transfer cell lysates to microfuge tubes. 4. Preclear lysates by adding 100 pL 10% slurry of the S aureus Cowan A strain
(see Note 19). Incubate on ice for 5 min. 5 Spm tubes in refrigerated microfuge at high speeds for 10 mm (or m the ultracen-
trrfuge for 20 min at 70,OOOg) to pellet cell debrts and Staph A bacteria 6 Normalize lysate volumes to trichloroacettc acid preciprtable radroactlve
counts per minutes (cpm) or total-cell protein (see Subheadings 3.3.1. and 3.3.2. and Note 20), if required.
8 Transfer lysates to a new set of microfuge tubes. 9. Add titered amount of specified antibody and vortex
10. Add titered amount of specified secondary anttbody (if necessary, see Note 13) and vortex.
11 Add 100 & of 3% slurry (w/v) protein A Sepharose beads and vortex (see Note 14).
12. Rotate sample tubes for 1 h at 4°C 13 Spm nnmunocomplex-contammg beads down m a variable-speed mtcrofuge at a
low-speed setting for 10 s m the microfuge (see Note 21) 14 Remove supernatant mto appropriate radioacttve-waste contamer 15. Wash beads five times by adding 1 mL lysis buffer, vortex, and spin as m
step 13, and discard each wash solution into radroactive waste container (see Note 22).
16. Add 40 pL 2X sample buffer, mix, and boil tubes 3 mm. 17 Vortex and then spin tubes at high speed for 1 mm 18 Run samples on a SDS-polyacrylamide gel (see ref. 3 and Note 23) Dry gel and
expose to film or phosphotmaging plate and analyze results
3.3. Normalization of Radioactive Lysafes
3.3.1. Normalization to Amount of total Ceil Protein
In experiments in which cell lysates are normalized to amounts of cell protein m the lysate, the Bio-Rad protein assay kit works well with these assay conditions.
1. Distribute 800 pL dHzO to a series of SIX mtcrofuge tubes for standards and duplicate tubes for each cell-lysate sample.
2. Add 5 pL of lysis buffer to the SIX protein-standard tubes 3. Add 0,2,5, 10, 15, and 20 g of the IgG-protein standard to the SIX protem-stan-
dard tubes, respectively. 4. Add 5 & of cell Iysate of each sample to the corresponding sample tubes 5 Add 200 & of the dye-reagent concentrate to each tube and mix well. Incubate at
room temperature for at least 5 mm 6. Measure absorbance at 595 nm and calculate total-cell protein per cell-
lysate sample Use these calculated amounts to transfer equal amounts of total-cell protein per sample to a new set of tubes and adjust each sample to the same volume
E IA-Containing Protein lmmunoprecipitation
3.3.2. Normalization by Radioactive incorporation into Total Cellular Protein
199
In some experiments, in which relative levels of specific proteins need to be compared in different cell populations, lysates should be normalized to a total number of radioactive counts.
1 Spot 5 pL of radioactive lysate onto a glass-mtcrofiber filter disk and place m filter disk filtration apparatus with suction.
2. Wash the filter disks with 10 mL Ice-cold 20% trichloroacetic acid (TCA), fol- lowed by 10 mL ice-cold 10% TCA and a final wash with 10 mL 100% ice-cold ethanol. Air-dry filter-disks briefly.
3 Transfer the filter disks to scmttllation vials, add scintillation fluid, and measure the amounts of incorporated radioactivity wtth a scintillation counter Calculate and portion the lysate volumes to contain equal amounts of radioactivities. Adjust samples to the same volume
4. Notes 1 A wide variety of tissue-culture medium and serum concentrations and types are
used for growing specific cell types in culture For 293 cells, grow m 10% calf serum m DMEM contaming streptomycin and penicillm
2. The E IA protems have been introduced into numerous types of cells by transfec- tion, such as the primary human-embryonal kidney-cell line called 293 cells, m which sheared human adenovirus DNA was transfected and a transformed cell lme that constitutlvely expresses the El A gene products was isolated (see ref. 2) Since many cell types are permissrve for adenovirus mfection, the E 1 A prod- ucts (and its cell growth control mechanisms) can be introduced into a wide variety of cells to address specific scientific questions about particular biologt- cal mechanisms.
3. All labeling and handling of radioactive materials should be done m comphance wtth Nuclear Regulatory Cormmssion Radiation Safety Regulations. Tran3?S- label and ExpressTMMethionme/Cysteine Protein Labelmg MIX are cellular hydrosylates of E colz grown in the presence of 35S04. Typically, they contain 270% L-methionine, 5 15% L- cysteine, plus other label compounds, but serve as an economical source of 35S-labeled amino acids and are good for general m vivo 35S-labeling of cellular proteins Please note that 35S- labeled compound have volatile components that can be inhaled or contaminate the working areas. It IS Important to imttally open the 35S-reagents stock vial in a fume hood and check for and clean up any working surfaces, mcludmg CO* mcubator shelves! It IS a good idea to equip tissue-culture incubators that circulate the Incubator an through a sterilization filter with a charcoal prefilter to remove any volatile 35S- compound. To maximize the m vivo mcorporation of these radioactive ammo acids it is best to use them in conjunction with methionine/cysteine-free DMEM Increases in incorporation have been noted by preincubating cells for up to 1 h m methionme/cysteme-free DMEM to deplete cellular methtonine/cysteine con-
200 Moran and Yaciuk
centrations prior to labeling cells. For a thorough drscussion on labelmg with other amino acids, see ref. I
4 The nomomc detergents, such as Nonidet P-40 (NP40), tend to be much less effective at disrupting protein-protem mteractions than the ionic detergents and therefore are better suited for the purification of protein complexes. Tween-20 and Triton X- 100 have also has been used with success. Whereas ElA-contam- mg protein complexes are punfied using NP40 concentratrons m the range of 0 l-OS%, it is recommended that the mvesttgators workmg with other cellular- protein complexes optimize for the amount of then specific-mteractrng protein by varying the concentration of detergent and other lysis buffer components For an overview about detergents, see ref. 5).
5 Upon cell lysis, various enzyme activities, such as protease, kmase, and phosphatase activities, are released from their subcellular compartments and can potentially use the other proteins m the cell lysate as substrates To mnnmize these effects, keep cell lysates and reagents ice-cold at all times Keeping cell lysates cold will also enhance general protein stability. Also to ehmmate or minimize these effects, sev- eral components of this lysis buffer act as mhlbitors of these activities. Whereas sodium phosphate is a good buffer at pH 7.0, it also functions as a phosphatase inhibitor. EDTA chelates divalent metal ions and therefore will inhibit the activity of enzymes that are metal ion-dependent, such as kinases and metallo- proteases Sodium pyrophosphate will inhibit protein phosphorylation Sodium fluoride should inhibit some senne/theonine-specific protein phosphatases
6. Dtthtothreitol IS a reducing agent that is added to inhibit protein aggregation through disulphrde-bond formation of cystemes It IS also highly volatile and therefore should be added fresh If unacceptable high backgrounds of nonspe- cific bmdmg-proteins are obtained, addition of dithiotreitol at a few steps m this procedure can reduce these backgrounds.
7. Phenylmethylsulfonyl flouride (PMSF) IS highly toxic and should not be inhaled or come mto contact with skin. It should be stored m a double-sealed container and only opened m the hood.
8. Aprotmm and PMSF are general serine-protease mhibitors, leupeptm mhiblts thiolproteases, and pepstatm A inhibits acid-proteases.
9, Add sodium vandate to eliminate potential phosphotyrosine-specific phos- phatases, since this activity may affect protein-protein interactions and migra- tion position in SDS polyactylamide gels. Add this reagent fresh
10. Resuspend the freeze-dried bacteria to the recommended volume. It is strongly recommended that this slurry be sonicated for at least 5 mm to ensure that it IS homogenous Store each preparation at -20°C m 1 mL portions. Thaw one or more portions per experiment as needed. Vortex well before use
11, All anttgen-specific monoclonal or polyclonal antibodies are not useful m dem- onstrating protein-protein interactions, since it is suspected that protein-binding sites serve as good immunogens, and the antibody competes away the associated proteins It is the rare antibody that binds to a region other than a protein binding site and preserves the binding of all associated proteins
HA-Containing Protein Immunoprecipitation 201
12 Whereas antibodies are rather stable protems, the buffers are ideal media for growth of contaminating microbes Antibody solutions should be filter-sterthzed and treated with strict aseptic technique. Store each antibody solutton in multtple portions to prevent loss of the entire preparation by a single contammatton event. It IS recommended that multiple portions of antibody solution be frozen, while keeping one portion at 4“C as the current working stock. This will avoid loss of antibody affinity because of the detrimental effect of multiple freeze/thaw cycles and indefimtely preserve the mittal preparation. Addition of bactert- tidal agents, such as sodmm azide (at 0.02% (w/v)) or mercury-[(o-carboxy- phenyl)thto]-ethyl sodium salt (at 0.01% w/v) (thtmersol, Sigma, T-5125) work well m preventmg mtcrobial contammation in antibody soluttons wtth- out affecting most antibody-antigen interactions, but it should be strongly noted that these bactericidal agents are htghly reactive molecules that can affect antl- body affinity, m vttro btochemlcal reactions and are htghly toxic in viva Also, antibody preparations should be titered to assure that the investigator IS in antt- body excess and that the amount of protein A Sepharose CL-4B beads is sufti- cient to bind that amount of antibody.
13. Protein A has a range of affinities for different types of antibodies. If protein A does not recognize or has low affinity for your specific antibody, you can add a secondary antibody to improve tsolatton of your protem of interest. For example, some mouse monoclonal antibodies of subclass IgG, are not recognized by protein A. In this case, by adding a titered amount of a rabbit antimouse sec- ondary antibody, the IgGl IS recogntzed well by the secondary antibody and the secondary antibody is recognized well by protein A, and your protein of Interest can be isolated.
14 Sepharose protein A CL-4B beads (Pharmacia Biotech, cat no 17-0780-o 1) are commerctally supplied and are freeze-dried m the presence of additives. When the beads are rehydrated, they must be washed well to remove the additives It is also important to vortex these beads thoroughly to disperse any clumps of beads. These clumps have clogged pipetman tips without preventing buffer from bemg drawn up mto the ptpet tip, resulting m the correct volume of solution transferred but wtth reduced or no bead transfer and therefore reduced nnmunocomplex iso- lation To eliminate this problem, cut off the end of the ptpet tip (approx 2 mm) with a clean scissor or razor blade. This step has led to more consistent final bead volumes and mnnunocomplex isolation. Also, these protein A Sepharose bead preparations will start to settle wtthm 1 mm if left standing. It IS critical to keep slurry well mixed during transfer to multiple sample immunoprectpitation tubes to maintam consistent bead transfer.
15 Commercially available protein assay kits each have their advantages and dtsad- vantages depending on the specttic contents of the protem-solutton buffers and amounts or type of proteins being measured. To minimize the effects caused by buffer contents, it 1s recommended that you add a volume of lysis buffer to your protein standards that equals the cell-lysate volume that you use to do your pro- tein measurements.
202 Moran and Yaciuk
16
17
18.
19
20
21.
22
23
If using adenovu-us as a vector to introduce your protein of interest into cultured cells and a polyclonal antigen-specific serum in your analysis, it is important to note that most serum contains high titer of antibodies to various adenovtrus pro- teins. Thus it is critical to compare your immune-serum results with results using preunmune serum from the same animal. Adding 3 mL methionme/cysteme-free DMEM contammg 100 @l/n& 35S-labeled amino acids IS good starting radioactivity concentration for several exponentially grow- mg tissue culture systems. Different tissue-cultures cell systems may require as little as 10 pCi/rnL or as much as 300 @l/n& 35S-labeled ammo acids. The 3-mL volume is sufficient to cover a IO-cm plate (or 2 mL for a 6-cm plate or 1 mL for a 35-mm tissue- culture plate). Incubate cells at 37°C for 1 h or more depending on purpose of expenment Long incubation tunes, such as overrnght labeling, may require supplementmg the label- mg medmm with 10% DMEM or 10% DMEM/l% serum, since these longer labeling umes may exhaust essential methlonme/cysteme reservoirs and/or growth factors To optimize radioactive mcorporation, check that the shelf in the tissue-culture mcubator is level and the radioactive medium is evenly distributed S aureus cowen A strain contams the protein A molecule m its membranes and IS an excellent and economical reagent to absorb nonspecific-bmdmg protems from cell lysates and can reduce the volume of the cell-debris pellet m the next step Some experiments may reqmre that mdtvtdual samples be normalized to the same amount of total-cell protein or to an amount of radioactivity incorporated mto cellular proteins, such as when testing for an associated kmase activtty or when quantitating apparent protein steady-state levels. Slow-speed spins help to mmlmize background caused by high-molecular-weight protein complexes that may be pelleted at high speeds. To reduce contaminating protein bands that nonspecifically bind to the inside side walls of the nncrofuge tubes, it is recommended that following the final wash, the immunocomplex- containing beads should be resuspended and transferred to a new nucromge tube. Protem complexes may contam protems with widely varying molecular weights. It may be advantageous to run your samples on gradient SDS-polyacrylamide gels to best resolve both low- and high-molecular-weight protems.
References 1 Bonifacino, J S (1987) Biosynthetic labeling of protems, m Current Protocols In
Molecular Bzology, Wiley, New York, Unit 10.18 2. Graham, F L., Smiley, J., Russell, W , and Nairn, R (1977) Characteristics of a
human cell lure transformed by DNA from human adenovu-us type 5 J Gen Vlrol 36, 59-72.
3 Harlow, E. and Lane, D (1988) Antzbodres A Laboratory Manual Cold Spring Harbor Laboratory, Cold Spring Harbor, NY, pp 636-640.
4 Moran, E. (1994) Cell growth control mechamsms reflected through protein inter- actions with the adenovirus E 1A gene products, Semm. Vlrol. 5,327-340.
5 Neugebauer, J. M (1990) Detergents. an overview, m Guide to Protern Purljka- tion (Deutscher, M. P., ed.), Methods Enzymol. 182,239-253
Preparation of Splicing-Competent Nuclear Extracts from Adenovirus-Infected Cells
Oliver Miihlemann and Gijran Akusjtirvi
1. Introduction Adenovn-us has contributed srgnificantly to our current understanding of the
orgamzatron and expression of genes in eukaryotic cells. The most startling discovery was probably the observation that most adenovrrus mRNAs are encoded from drscontmuous DNA segments. The splat-gene and RNA-sphcmg concepts were rapidly extended to other systems and accepted as dogma within a few months after then initial discovery. It was clear right from the beginning that most adenovirus-transcription units encode multiple alternatively spliced mRNAs: Many are translated into proteins that have unique biologrcal activr- ties. It was also shown that the accumulatron of alternatively spliced mRNA was temporally regulated during virus mfection. The shift from the early to late pattern of mRNA accumulation was shown to be dependent on viral late-pro- tein synthesis (1).
Much of our knowledge about the btochemrstry of RNA splrcmg comes from studies of the adenovnus major-late-first intron. The conclusions from these and other studies have been extensively revtewed elsewhere (2) and will not be summarized here. Experiments to reproduce RNA splicing m vttro ml- tially progressed slowly. The first examples of successful m vrtro RNA splicing were published in the early 80s (3-7). Success was to a large extent ham- pered by the difficulty of synthesizing or purifying a substrate RNA for in vitro splicing experiments. A major step forward was therefore the develop- ment of the SP6 in vitro transcription system for pre-mRNA substrate synthe- srs (8). With an easy method to produce large quantitres of substrate RNA the basic mechanisms of RNA sphcmg were rapidly established (2).
From Methods m Molecular Medune, Vol 21 Adenonrus Methods and Protocols Edlted by W S M Wold 0 Humana Press Inc , Totowa, NJ
203
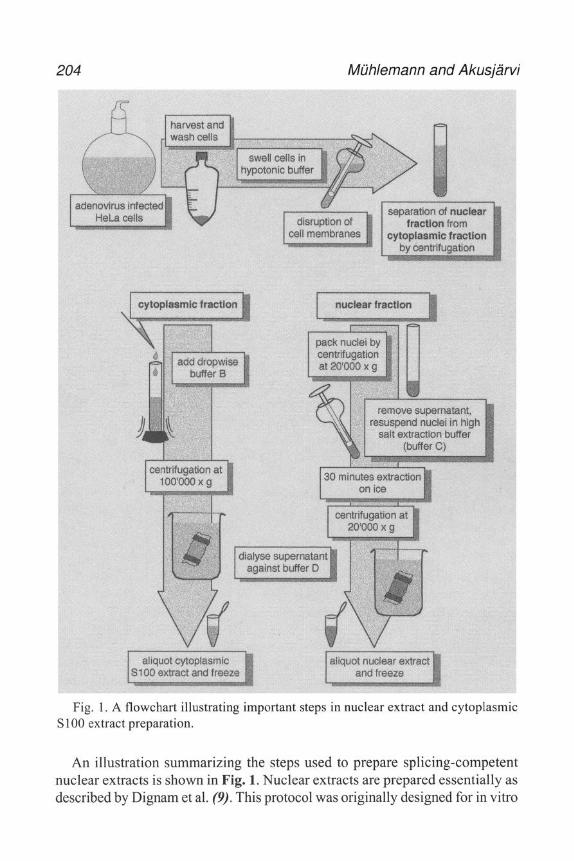
204 Mijhlemann and AkusjSrvi
Fig. 1. A flowchart illustrating important steps in nuclear extract and cytoplasmic S 100 extract preparation.
An illustration summarizing the steps used to prepare splicing-competent nuclear extracts is shown in Fig. 1. Nuclear extracts are prepared essentially as described by Dignam et al. (9). This protocol was originally designed for in vitro
205
transcnptlon, but produces nuclear extracts that also are competent for m vitro RNA splicing. However, we (and most other groups) extract nuclei with 0.6 M KC1 instead of 0.42 MNaCl as described in the original protocol. The usage of a higher salt concentration is essential to obtain nuclear extracts that reproducibly sphce the regulated adenovlrus Ll-IIIa mRNA in vitro (10,11). Interestingly, higher salt appears to extract a dtstinct factor required for adenovirus Ll-IIIa splicing that does not have a major effect on splicing of prototypical transcripts conforming to the RNA 3’ splice site consensus sequence (11). Substrate RNA 1s synthesized using bacteriophage T7 or SP6 RNA polymerase. The efficiency of in vitro splicing of pre-mRNAs with weak 3’ splice sites, such as Ll-IIIa, is sometimes low and therefore difficult to detect. Thus, we often include a Ul snRNA binding site downstream of the 3’ splice site to improve the efficiency of weak splice-site usage (12). Such a Ul -tag can increase the efficiency of splicing of weak splice sites up to 20 times. However, the inclusion of a Ul -tag may for some experiments be counterproductive, because it results in an unproportlonal increase of the splicing efficiency in uninfected nuclear extract (0. M., unpub- lished observation), resulting in an underestimation of the actual difference m splicing efficiencies between infected and uninfected nuclear extracts.
2. Materials
2.1. Infection of HeLa Spinner Cells with Adenovirus
The protocol below 1s adapted for 4-6 L exponentially growing HeLa spm- ner cells, giving approx 10 mL nuclear extract, but can be eastly adjusted for cell cultures ranging between 500 mL and 30 L. To prepare small-scale nuclear extracts, see Lee et al. (13)
1. MEM spinner-cell medium (can be obtained from Life Technologies, Galthersburg, MD).
2 Newborn calf serum (Life Technologies). 3. Peniclllm (10,000 IU/mL)/Streptomycin (10,000 pg/mL) stock solution (Life
Technologies), 4 Purified adenovirus stock (wild-type or mutant of your choice) with a titer >lO’O
PFU per mL.
2.2. Preparation of Splicing-Competent Nuclear Extract and Cytoplasmic SlOO Extract
1. Dounce homogenizers with tight-fitting pestles, 40 and 10 mL sizes (Kontes, Vineland, NJ)
2. PBS: 20 mM potasstum phosphate, pH 7.4, 130 mA4 NaCl. Made up m auto- claved double-dlstllled Hz0 (ddH,O), store at +4”C
3. Stock solutions for buffer preparation. Make up with autoclaved ddH,O 0.5 A4 HEPES pH 7.9 (Sigma, St Louis, MO, H 0891), adjusted to pH 7.9 with 5 A4
206 Mtihlemann and Akusj&-vi
KOH. Store at 4°C. 2 M KC1 and 1 M M&l,, store at room temperature 1 h4 DTT, store m 1 -mL ahquots at -20°C
4. Buffer A (hypotomc). 100 mL 10 mM HEPES, pH 7 9, 10 mM KCI, 1.5 mA4 MgCl,, 0 5 mMDTT Make fresh in ddHzO, from stock solutions filtrate through a 0 2-w membrane, keep on Ice Optlonal, add PMSF to a concentration of 0 2 mM just before use (see Note 5)
5 BufferB (forSlOO)* lOOmL300mMHEPES,pH 7 9,14MKCl, 30mA4MgC1,. Make up in ddH,O from stock solutions, sterile filtrate Can be stored at 4°C up to6mo
6 Buffer C (hypertonic): 10 mL 20 mM HEPES, pH 7 9,600 mA4 KCI, 25% glyc- erol, 0 2 mM EDTA, and 0 5 mM DTT Make fresh m ddH,O from stock solu- tions, filtrate through a 0.2-w membrane, keep on ice.
7. Buffer D (dlalysls): 2 L 20 mM HEPES, pH 7 9, 100 mA4 KCl, 20% glycerol, 0 2 mA4 EDTA, and 0.5 mM DTT. Make up with ddH,O, filtrate through a 0.2-w membrane, and cool down to 4°C.
8. Dialysis tubing, mol-wt cutoff 12-14 kDa (Spectrum Medical Industries, Houston, TX)
2.3. Preparation of Radioactively Labeled Splicing Substrates
1 2
3
4
9 10
11
Template DNA (see Notes 9 and 11). Nucleotlde-mix* 5 mM ATP, 5 mM UTP, 0 5 mA4 GTP, and 0 5 mM CTP Stock solutions of nucleotides (Pharmacla) are made by dlssolvmg m autoclaved ddH20 to a concentration of 100 mM, store at -7O’C. From these stock solutions a nucle- otide mix 1s prepared The GTP concentration should be kept at 0.5 mA4 to favor mcorporation of the cap nucleotlde as the start nucleotlde In our example the CTP concentration is also kept at 0 5 mA4 since we use 32P-a CTP (Amersham, Arlington Heights, IL, 20 mCi/mL, 800 Cl/mmol) to label the transcript Mix the nucleotldes m autoclaved ddHzO, store at -20°C m loo-$ ahquots 10 mA4 mGpppG-cap nucleotlde (Pharmacla 27-4635) Dissolve 5 U of lyo- phllized mGpppG m 24 pL autoclaved ddH20, store at -2O’C 5X transcription buffer. 200 mA4Trls pH 7.9,30 mA4MgC12, 10 mMsperrmdme, 50 mMNaC1, store at -2O“C (this buffer is usually provided by the manufacturer of the RNA polymerase) RNase mhlbitor 20-50 U&L (MB1 Fermentas, Vilnius, Lithuania, E003 11) T7 RNA polymerase. 20 U/& (MB1 Fermentas, EPOl 11). RQI RNase-free DNase: 1 U/pL (Promega, Madison, WI, M6101) Loading buffer* 50 mM Tris pH 7 9, 10 mA4 EDTA, 0.025% bromophenol blue/ 0 025% xylene cyanol, 80% formamide (Baker, proanalysis grade) 40% Acrylamlde stock solutron (acrylamlde:bu-acrylamlde ratlo 1.30) 10X TBE stock solution: 108 g Tris base, 55 g boric acid, 7.44 g EDTA, add delomzed H20 to 1 L, let dissolve, autoclave. Use 1X TBE in gel and 0 5X TBE m the running buffer 10% APS* for 10 mL dissolve 1 g ammonium persulphate m 10 mL ddH,O. Aliquots should be stored at -20°C Keep a working solution at 4°C no longer than 1 mo
Splicing-Competent Nuclear Extracts 207
12. Elution buffer 0 75 M NH4-acetate, 0 1% (w/v) SDS, 10 mM Mg-acetate, 0 1 mM EDTA Make 10 mL from sterile stock soluttons and store at room tem- perature wrapped m alumimum foil. Store the 7.5 MNH,-acetate stock also pro- tected from light.
2.4. In Vitro Splicing Assay
1. Nuclear extract (see Subheading 3.2.). 2 In vitro transcrrbed, radioactively labeled pre-mRNA (see Subheading 3.3.). 3, 13% (w/v) PVA: Dissolve 1 3 g polyvinylalcohol (Sigma P8 136) in 10 mL ddH,O
by addmg the powder to the water on a magnetic stirrer. If the PVA does not dissolve completely, gentle heating helps, vortexing should be avoided. Store 1 -mL aliquots at -20°C
4 62 5 mMMgC&* I-mL abquots are made up by dilution from a 1 M stock. Note that the MgCl, requirement has to be experimentally tested (see Note 14)
5. 0.5 MCreatine phosphate dissolved in autoclaved ddH*O Store 1 OO+L ahquots at -20°C 6. 10 mg/mL yeast tRNA (Sigma R5636), dtssolved in autoclaved ddH,O; store in
aliquots at -20°C 7. 2X Proteinase K buffer 200 mMTris-HCl, pH 7.5,300 rtuWNaCI,25 mA4EDTA,
2% SDS made up in autoclaved ddH,O; store at room temperature 8 20 mg/mL Protemase K* Dissolve 20 mg lyophtlized protemase K (Merck,
Rahway, NJ) m 1 mL (50 mM Tris-HCl, pH 7.5, 10 mA4 CaCl,), store m small (e g., 30 p.L) ahquots at -20°C. Do not freeze-thaw more than five times
9 Proteinase K mix consist of 100 pL 2X Protemase K buffer, 10 pg tRNA, 2 p.L 20 mg/mL protemase K + 75 pL autoclaved ddHzO per reaction Do not store, make up fresh, use immediately.
3. Methods 3.1. Infection of HeLa Spinner Cells with Adenovirus
HeLa spinner cells are grown in round cell-culture bottles on a magnetic stn-rer at 37*C m MEM spinner cell medium, 5% newborn calf serum, optton- ally containing 1% penicillm/streptomycin. The cells must be kept in log phase (titer 2-6 x lo5 cells/ml), doubling time approx 24 h.
1 Start with 2-3 x lo9 HeLa spinner cells, collect them by centrifugatton m sterile 1 -L plastic bottles by spmnmg at 900g at room temperature for 20 min. (Beckman J6M/E centrifuge, JS-4 2 rotor).
2. Decant medium back into the cell-culture bottle (handle under sterile condittons the medium will be reused later), resuspend cells in 200-300 mL MEM without serum (see Note l), and transfer to a 1-L cell-culture bottle.
3. Infect cells wtth approx 10 PFU/cell of adenovirus from a high-titer vnus prepa- ration Leave at 37°C on a magnetic stirrer for 1 h. Dilute cells to approximately 4 x lo5 cells per mL in a large cell culture bottle with the old MEM medium saved at step 2 Add fresh medium if necessary
4 Continue Incubation at 37°C for 20-24 h for preparation of late-Infected extracts.
208 Miihlemann and Akusj%vi
3.2. Preparation of Splicing-Competent Nuclear Extracts and Splicing Deficient Cytoplasmic SlOO Extracts
This protocol describes a modrficatron of the original Drgnam protocol (9). The procedure IS our lab protocol adapted to yield hrgh adenovirus maJor-late Ll splicing activity (IO) (see Note 3) However other modifications of the pro- tocol might be better suited for sphcmg of other pre-mRNAs (I4,1.5).
3.2.1. Nuclear-Extract Preparation
1. Check the cell dens@ at the end of mfectton. It should be almost the same as at the start of mfectton An adenovn-us infection mhrbrts cell drvtsron Thus, rf cells continue to divide during the course of mfectron, the mfectton most probably drd not work
2
3.
7
8
9. 10.
11.
12.
Collect cells by centrtfugation at 18OOg at 15°C for 20 mm (Beckman J6M/E centrifuge, JS-4 2 rotor.) Decant medium (see Note 2) and resuspend cells gently m a small volume of remaining medmm. Transfer mto two, conical 250-mL cen- trifuge bottles Pellet cells at 1OOOg at 4°C for 10 mm (Beckman GPKR centrifuge). Carefully remove all medium and resuspend cells in 20 mL ice-cold PBS and pool mto one bottle, measure volume. From here on all steps should be performed on ice (see Note 4) Determme the packed cell volume (pcv) according to the formula. total volume of suspensron (step 3) - 20 mL = pcv. F111 up wrth ice-cold PBS and repeat centrrfugatron as m step 3 Decant PBS (carefully remove all remains of PBS with a Pasteur pipet) and resuspend cells m (5 x pcv) mL ice-cold buffer A (hypotomc buffer) by gently prpettmg up and down. Leave on ice for 10 mm Transfer cells mto transparent 50-mL centrifuge tubes (note total volume) and centrifuge at 500g at 4°C for 10 min (Beckman JS 13.1 rotor) Carefully remove the supernatant and measure Its volume. The volume of the swollen cells is total volume (step 7) - supernatant and should by about 2-2.5 x pcv. Add (2 x pcv) mL ice-cold buffer A and gently resuspend the cells with a prpet Transfer the solution to a 40-mL homogenizer, prechilled on ice. Disrupt cells with 10-12 strokes usmg the tight pestle To check the efficiency of disruption, dilute a drop of the solution with buffer A, add 2 pL 0.4% trypan blue (Sigma), and check under the microscope. Nuclei stain blue, intact cells do not stam. If necessary, give a few additional strokes until approx 90% of the cells are dis- rupted (see Note 6). Transfer the solution mto a transparent centrifuge tube (note volume) and spur at 750g at 4°C for 10 min (Beckman JS 13 1 rotor) Transfer the supernatant (cytoplasmtc fraction) into a new tube (note volume, see Note 7). To prepare cytoplasmrc SlOO extract continue with this fraction at step 19.
Splicing-Competent Nuclear Extracts 209
13. Spm the pellet (the nuclet fraction) at 20,OOOg at 4°C for 20 mm (Beckman JA20 rotor), then remove and discard the supernatant (note its volume) Calculate the packed nuclei volume (pnv) accordmg to the formula. pnv = total volume after cell dtsruption (step 11) - [cytoplasmic supernatant (step 12) + supernatant from 20,OOOg spin (step 13)]
14. Add (1 x pnv) mL of me-cold buffer C (high-salt buffer) to the nuclei pellet, transfer to the small (IO-mL) homogenizer, and resuspend nuclei wtth several (6-12) gentle strokes using the ttght-fittmg pestle.
15 Transfer the homogenate back to the centrifuge tube, embed it m ice, and shake on a rocking table for 30 mm
16. Spin the homogenate at 20,OOOg at 4°C for 30 min (Beckman JA20 rotor). 17 Collect the supernatant (nuclear extract) and dialyze tt agamst Ice-cold buffer D
at 4°C usmg a membrane with a cut-off at 12-14 kDa Use 4 x 250 mL buffer D and change buffer m 1 -h intervals.
18. Spm the extract at 20,OOOg at 4°C for 20 min (Beckman JA20 rotor), discard the pellet, ahquot the supernatant mto Eppendorf tubes, quack-freeze m bqutd mtro- gen, and store at -7O’C (see Note 8)
3 2.2. Sl 00 Extract Preparation
For convenience, these steps should be performed simultaneously with the nuclear extract preparation.
19. Add dropwtse (0 11 x volume of cytoplasmic supernatant from Subheading 3.2.1., step 12) mL buffer B under gentle vortexing.
20 Spin at 100,OOOg at 4 ‘C for 1 h (Beckman SW41 Ti rotor) 2 1. Dialyze the supernatant (S 100 extract) against Ice-cold buffer D and freeze m
altquots as described m steps 17 and 18 of Subheading 3.2.1.
3.3. Preparation of Radioactively Labeled Splicing Substrates
3.3.1. In Vitro Transcupbon with T7 RNA Polymerase
1. Make a master mix by combining at room temperature in a Eppendorf tube (see Note 17):
3.75 ccz, ddH,O 2.5 pL Nucleotide-mix (5 mM ATP and UTP, 0.5 mM CTP and GTP). 1.25 pL 10 mM mGpppG cap-nucleottde. 5 & 5X Transcriptton buffer 2.5 pL 100 mA4 DTT. 0 5 & RNase Inhibitor 2 5 pL (50 pCi) a32P-CTP.
2 Mix 5 pL template DNA (concentration 0.2-0.3 pg DNA/pL, see Notes 9 and ll), 18 pL of the master mix, and 2 pL T7 RNA polymerase (20 U/a) in a Safe- lock Eppendorf tube and incubate at 37°C for 2 h.
3 Optionally (see Note 10). Dilute 2 @. of the remaining master mix wtth 48 pL H,O, measure Cerenkov counts of 5 pL of the dilution. Recalculate the value to dpm based
210 Miihlemann and Akusj&vi
on the efticiency of your Cerenkov counter. Calculate the total amount of dpm per reactton according to the formula. dpm (total) = dpm (measured m ahquot) x 90
4 Add 1 uL of RQ DNase to the reaction and continue incubatron for 30 mm at 37°C 5 Add 15 pL loading buffer to stop the reaction. Store samples at -20°C or con-
tinue dnectly.
3.3.2. Recovery of Full-Length RNA Transcripts
1.
2.
3
4
5.
6
Prepare a 4% acrylamide 8 M urea gel (acrylamide.bzs-acrylamtde = 29 1, 1X TBE) using a wade preparatrve comb Incubate samples at 100°C for 5 mm, chtll on ice, and load on gel. Run gel m 0 5X TBE at 50 W unttl the bromophenol blue dye reaches the mtddle of the gel (see Note 12). Detach the gel from the electrophoresis equipment Carefully remove the upper glass plate, wrap the gel with a plastic wrap and cover with a clean glass plate. Move the whole setup to the darkroom, place an X-ray film on the upper half of the gel (covermg from the wells to the bromophenol blue band), mark the posl- tion of the X-ray film with a waterproof pen on the Saran wrap, cover with a clean glass plate, and expose for 5 mm at room temperature. Develop the X-ray film. For your own safety, work behmd a Plexiglas shield. Copy the positton of the band correspondmg to your full-length transcript from the autoradiograph back to the gel using a needle and cut out the full-length band with a disposable scalpel or razor blade, place the gel piece (volume 1 O&l 50 pL) m an Eppendorf tube and add 500 pL elution buffer. Elute the transcript at room temperature on a turning wheel for at least 4 h (or up to over night) Remove gel debris by a short spm in the mtcrofuge, transfer the solution to a new Eppendorf tube. A check with the hand momtor should give you roughly 80% of the counts in the solution. If necessary, the 20% remaming m the gel piece can be recovered by repeating the elution step. Add an equal volume of phenol/chloroform/isoamyl alcohol (25 24: 1) to each tube, vortex vtgorously for 1 min, spin in the mtcrofuge for 3 min, and carefully transfer the aqueous phase (upper) to a new Eppendorf tube. Repeat step 7 two times with chloroform/lsoamyl alcohol (24.1). Optionally: determme the volume of the samples by aspiratmg m a pipet tip (usu- ally approx 400 pL) and measure dpm of a 5-pL ahquot Calculate the total amounts of counts in each sample. The yield of transcript can then be determined according to the formula
yield (mol) = total dpm in transcript x moles CTP in the reaction/ total dpm (Subheading 3.3-l., step 3) x number of “C” residues m transcript
Followmg the protocol described here, CTP = 1 3 1 x lop9 mol per reaction (see Note 13).
10 Add 2 5 x volumes 95% ethanol and store the transcript in the ethanol m a lead or Plexiglass box at -20°C For m vitro spltcmg reactions (Subheading 3.4.,
Splicing-Competent Nuclear Extracts 211
Spm ahquots wtth desired amount of transcript immediately before use, wash the pellet with 80% ethanol, remove all ethanol with an outdrawn, sterile Pasteur plpet, and dry under the bench lamp for 3-5 min. Dissolve the pellet in auto- claved ddH,O to 20,000-25,000 dpm/$.
2. For a 25-pL standard reactron, mix the following Ingredients in a Eppendorf tube on me. (see Notes 15-17)
5 pL 13% PVA. 5 pL Buffer D 10 pL Nuclear extract
Spin tubes at 16,000g at +4”C for 30 mm in an Eppendorf centrifuge and remove all ethanol with a outdrawn, sterile Pasteur plpet. Dry pellets under the bench lamp (3-5 min) and dtssolve in 5-10 pL (depending on the well-size in the gel) loading buffer by vortexmg and ptpetting up and down,
8. Boil the samples for 2 min, chill on ice, and collect all materral at the bottom of the tube by a short pulse in the mrcrofuge.
9 Load samples on a 5-10% acrylamrde 8 Murea gel (acrylamide:bis acrylamrde = 19.1, 1X TBE) The lengths of the expected sphcing products determines the percentage of the gel 8% gels are suitable to resolve products ranging from 100 to 500 nucleotides, longer fragments should be run on a 6% gel.
10 Run the gel until desired separation is obtained and dry rt on a gel dryer 11. Expose the gel to a X-ray film over night and/or expose rt on a PhosphorImager
screen for subsequent quantitatton of the result (see Fig. 2 for an example).
step 2), transcrtpts up to 2 wk old will work; however, fresh transcripts usu- ally gave a higher splrcing efficrency
3.4. In Vitro Spiking Assay
1 0 & 62.5 n&I MgC& (see Note 14). 1 0 pL 0.5 M Creatme phosphate 0 5 pL 100 m&I ATP (see Note 14) 2.5 & RNA transcript, approx 50,000-70,000 dpm (5-10 fmol).
Collect maternal at the bottom of the tube by a short pulse m the mlcrofuge, mrx by prpetting up and down, do not vortex, and Incubate for 90 mm at 30°C Add 175 pL protemase K mtx to each tube and incubate at 45°C for 3&45 mm (see Note 18) Add 200 pL ddHzO, extract with 400 pL phenol/chloroform/rsoamyl alcohol (25 24 1) and transfer upper phase (380 pL) into a new tube Repeat extraction with 380 pL chloroform/rsoamyl alcohol, transfer upper phase (360 pL) into a new tube. Add 40 & 3 M sodium acetate and 1 mL 95% ethanol, prectpttate at -20°C over night or 1 h in dry me
4. Notes I Cells are infected m a small volume of medmm (10’ cells/ml) m order to achieve
efficient adherence of vu-us to cells and a somewhat synchronous infection. The
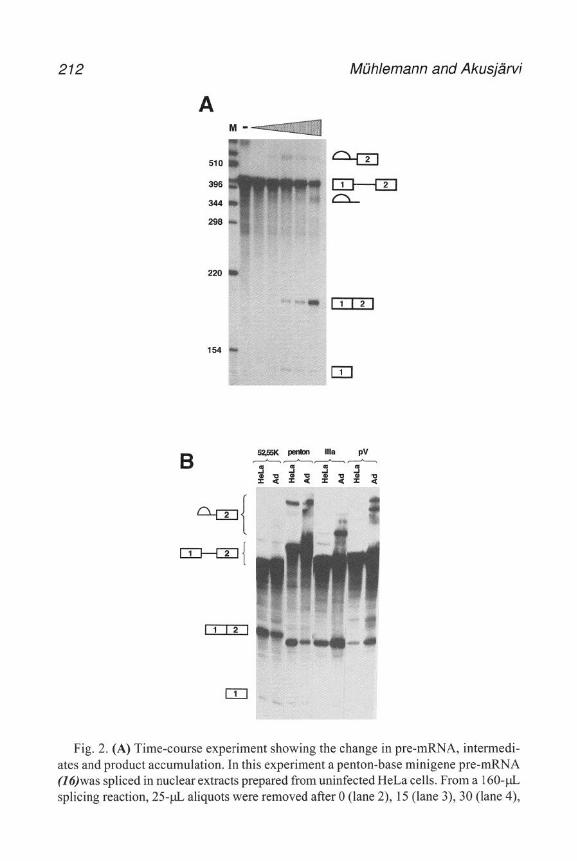
212 Miihlemann and AkusjSrvi
A
510
396
344
298
220
154
M- -
km
b
UmJ
en
f--m r--J+TJ A-
11121
El
Fig. 2. (A) Time-course experiment showing the change in pre-mRNA, intermedi- ates and product accumulation. In this experiment a penton-base minigene pre-mRNA (‘16)was spliced in nuclear extracts prepared from uninfected HeLa cells. From a 160~& splicing reaction, 25+L aliquots were removed after 0 (lane 2) 15 (lane 3) 30 (lane 4),
Splicing-Competent Nuclear Extracts 273
infection 1s carried out in MEM without serum to avoid a potential problem of neutralizing antibodies in the newborn calf serum. We use 10 times excess of virus over cells to ensure infection of every cell, but that number can probably be decreased if vu-us amounts are limited.
2 During the whole extract preparation the material 1s potentially infectious and everything must therefore be disinfected (glassware and solutrons) or autoclaved (disposable material) after use.
3. In the standard Dignam protocol (9), nuclei are extracted with 0.42 M NaCl. We have found that a higher salt concentration is essential to obtain nuclear extracts that reproducibly splice the LI-IIIa pre-mRNA (IO,I1) Thus, we routinely use 0 6 A4 KC1 to extract nuclei
4 Low temperature during the whole procedure and total processing time are criti- cal parameters for extract activity Therefore prepare all materials and precool solutions on me before begmmng the preparation. When started, proceed without prolonged mcubatrons from step to step, the whole preparation mcludmg dialysis should be completed in one day.
5 We routinely include PMSF in buffers A, B, C, and D to mimmize proteolytrc degradation during extract preparation However, we obtain satisfying extracts also without protease inhibitors. From a 200-mMPMSF stock solution dissolved m 95% ethanol, add PMSF to a final concentration of 0 2 &just before use; PMSF is unstable in aqueous solutions.
6. The number of strokes required to obtain 90% of the cells disrupted can vary considerably between different homogenizers and cells should therefore be checked as described Avoid to fast movement of the pestle and too many strokes since this tend to result m considerable leakage of sphcmg factors mto the cyto- plasm. This IS particularly important if you are interested in producing splicmg- deficient SlOO extracts suitable for biochemical complementation. Noteworthy, SlOO extracts prepared from adenovirus infected cells are, in our hands, always spbcmg-competent, probably because of leakage from more labile nuclei.
7. The nuclei fraction (lower) should be roughly half the volume of the cytoplasmic supernatant. The border of the two phases can easiest be seen when the tube IS held up agamst a brrght background.
8. The extracts can be stored for years at-70°C, but repeated freeze-thawing should be avorded (we observe decreased activity after more than 5 freeze-thaw cycles). If the extracts are used mainly for in vitro splicing assays, 100~& ahquots are suitable. This protocol gives extracts with a concentration of total protein of 6-10 pg/pL
45 (lane 5), 60 (lane 6), and 120 (lane 7) mm. RNA was isolated as described and products resolved on an 6% polyacrylamide 8 A4 Urea gel Lane 1: Size marker. (B) Comparison of the splicing efficiency of several major late mmrgene pre-mRNAs m nuclear extracts prepared from uninfected (HeLa) and infected (Ad) HeLa cells (modl- fied from ref. Id).
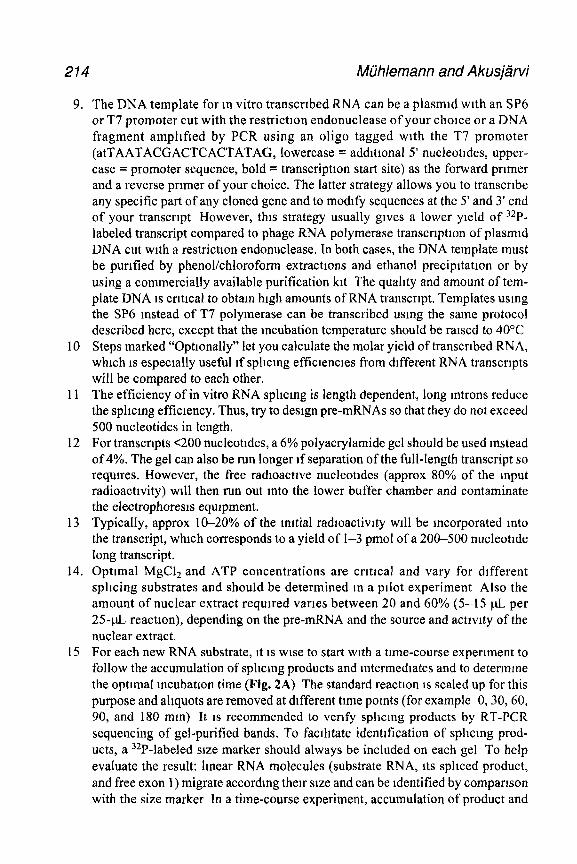
214 Miihlemann and Akusjiirvi
9,
10
11
12
13
14,
15
The DNA template for m vitro transcribed RNA can be a plasmld with an SP6 or T7 promoter cut with the restriction endonuclease of your choice or a DNA fragment ampllfled by PCR using an oligo tagged with the T7 promoter (atTAATACGACTCACTATAG, lowercase = additional 5’ nucleotldes, upper- case = promoter sequence, bold = transcription start site) as the forward primer and a reverse primer of your choice. The latter strategy allows you to transcribe any specific part of any cloned gene and to modify sequences at the 5’ and 3’ end of your transcript However, this strategy usually gives a lower yield of 32P- labeled transcript compared to phage RNA polymerase transcription of plasmld DNA cut with a restriction endonuclease. In both cases, the DNA template must be purified by phenol/chloroform extractions and ethanol precipitation or by using a commercially available purification kit The quahty and amount of tem- plate DNA is critical to obtain high amounts of RNA transcript. Templates using the SP6 instead of T7 polymerase can be transcribed using the same protocol described here, except that the incubation temperature should be raised to 40°C Steps marked “Optionally” let you calculate the molar yield of transcribed RNA, which 1s especially useful tf splicing efficiencies from different RNA transcripts will be compared to each other. The efficiency of in vitro RNA splicing is length dependent, long mtrons reduce the spllcmg efficiency. Thus, try to design pre-mRNAs so that they do not exceed 500 nucleotides in length. For transcripts ~200 nucleotldes, a 6% polyacrylamide gel should be used instead of 4%. The gel can also be run longer if separation of the till-length transcript so requires. However, the free radioactive nucleotldes (approx 80% of the input radioactivity) will then run out mto the lower buffer chamber and contaminate the electrophoresls equipment. Typically, approx 1620% of the initial radloactivlty will be incorporated mto the transcript, which corresponds to a yield of l-3 pmol of a 200-500 nucleotlde long transcript. Optimal MgC12 and ATP concentrations are critical and vary for different splicing substrates and should be determined m a pilot experiment Also the amount of nuclear extract required varies between 20 and 60% (5-l 5 pL per 25-pL reaction), depending on the pre-mRNA and the source and activity of the nuclear extract. For each new RNA substrate, it 1s wise to start with a time-course experiment to follow the accumulation of sphcmg products and intermediates and to determme the optimal mcubatlon time (Fig. 2A) The standard reaction is scaled up for this purpose and allquots are removed at different time pomts (for example 0,30,60, 90, and 180 mm) It 1s recommended to verify splicing products by RT-PCR sequencing of gel-purified bands. To faclhtate identification of sphcmg prod- ucts, a 32P-labeled size marker should always be included on each gel To help evaluate the result: linear RNA molecules (substrate RNA, its spliced product, and free exon 1) migrate according their size and can be identified by comparison with the size marker In a time-course experiment, accumulation of product and
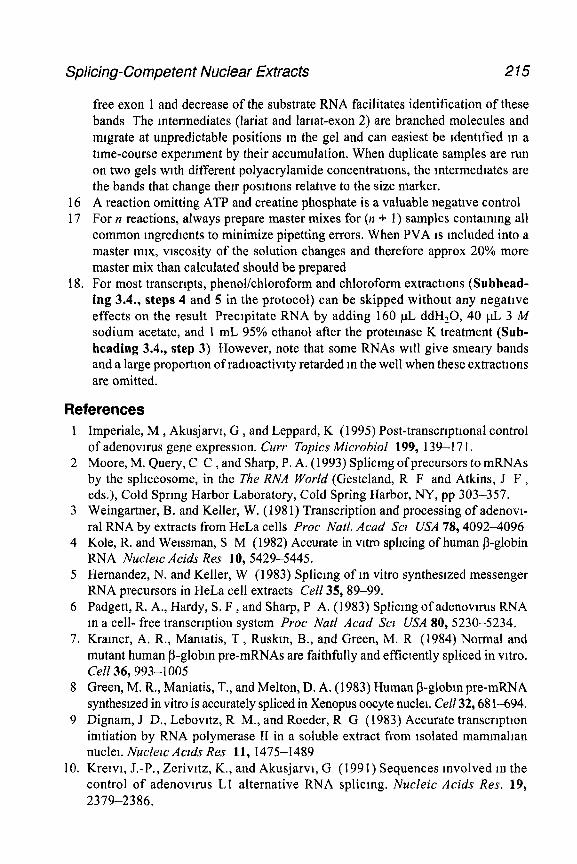
Splicing-Competent Nuclear Extracts 215
free exon 1 and decrease of the substrate RNA facilitates identification of these bands The intermediates (lariat and lartat-exon 2) are branched molecules and migrate at unpredictable positions m the gel and can easiest be Identified m a time-course experiment by their accumulation. When duplicate samples are run on two gels with different polyacrylamide concentrations, the intermediates are the bands that change then posittons relattve to the size marker.
16 A reaction omitting ATP and creatine phosphate is a valuable negative control 17 For IZ reactions, always prepare master mixes for (n + 1) samples containing all
common ingredients to minimize pipetting errors. When PVA 1s included into a master mix, viscosity of the solution changes and therefore approx 20% more master mix than calculated should be prepared
18. For most transcrtpts, phenol/chloroform and chloroform extractions (Subhead- ing 3.4., steps 4 and 5 in the protocol) can be skipped without any negative effects on the result Precipitate RNA by adding 160 pL ddH,O, 40 @ 3 M sodium acetate, and 1 mL 95% ethanol after the protemase K treatment (Sub- heading 3.4., step 3) However, note that some RNAs will give smeary bands and a large proportion of radioactivity retarded m the well when these extractions are omitted.
References 1
2
8
9
10.
Imperiale, M , Akusjarvi, G , and Leppard, K (1995) Post-transcriptional control of adenovtrus gene expression. Curr Topics Mcrobiol 199, 139-l 7 1. Moore, M. Query, C C , and Sharp, P. A. (1993) Splicing of precursors to mRNAs by the sphceosome, in the The RNA World (Gesteland, R F and Atkins, J F , eds.), Cold Spring Harbor Laboratory, Cold Spring Harbor, NY, pp 303-357. Weingartner, B. and Keller, W. (198 1) Transcription and processing of adenovt- ral RNA by extracts from HeLa cells Proc Natl. Acad Scr USA 78,4092-4096 Kole, R. and Weissman, S M (1982) Accurate in vitro sphcing of human P-globin RNA Nuclerc Acids Res 10, 5429-5445. Hernandez, N. and Keller, W (1983) Splicmg of m vitro synthesized messenger RNA precursors in HeLa cell extracts Cell 35,89-99. Padgett, R. A., Hardy, S. F , and Sharp, P A. (1983) Splicing of adenovu-us RNA m a cell- free transcription system Proc Nat1 Acad Scl USA 80, 5230-5234. Kramer, A. R., Mamatis, T , Ruskm, B., and Green, M. R (1984) Normal and mutant human /3-globm pre-mRNAs are faithfully and effictently spliced in vitro. Cell 36,993-l 005 Green, M. R., Maniatis, T., and Melton, D. A. (1983) Human @globm pre-mRNA synthesized in vitro is accurately spliced in Xenopus oocyte nuclei. Cell 32,68 1-694. Dignam, J D., Lebovttz, R M., and Roeder, R G (1983) Accurate transcription imtiation by RNA polymerase II in a soluble extract from isolated mammalian nuclei. Nucleic Aczds Res 11, 1475-1489 Kreivi, J.-P., Zerivitz, K., and Akusjarvt, G (1991) Sequences involved in the control of adenovtrus Ll alternative RNA splicmg. Nucleic Acids Res. 19, 2379-2386.
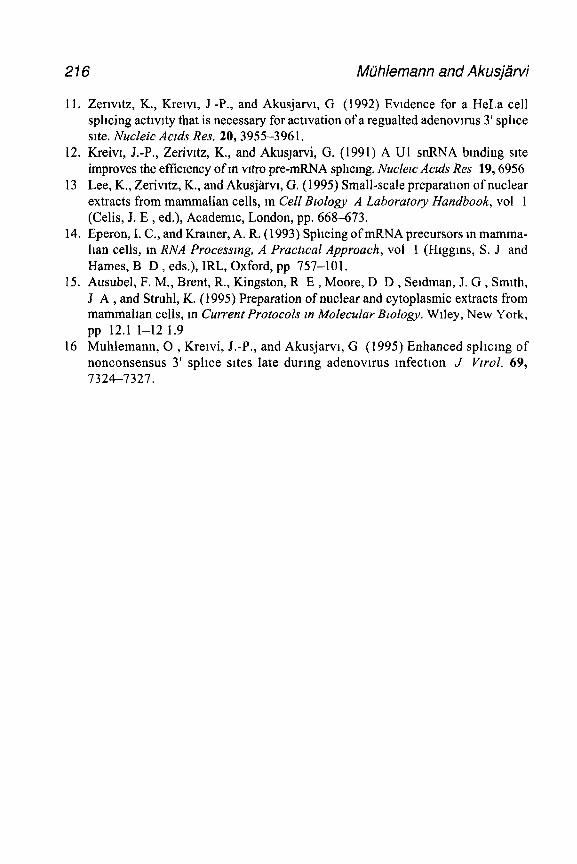
216 Miihlemann and Akusj&vi
11. Zerrvttz, K., Krervt, J -P., and Akusjarvt, G (1992) Evidence for a HeLa cell sphcing actrvrty that is necessary for activation of a regualted adenovn-us 3’ splice sate. Nucleic Acids Rex 20, 3955-3961.
12. Kreivt, J.-P., Zerivrtz, K., and AkusJarvi, G. (1991) A Ul snRNA bmding sate improves the efticrency of m vrtro pre-mRNA sphcmg. Nucleic Aczds Res 19,6956
13 Lee, K., Zerivrtz, K., and Akusjarvt, G. (1995) Small-scale preparation of nuclear extracts from mammalian cells, m CelZ Biology A Laboratory Handbook, vol 1 (Celis, J. E , ed.), Academic, London, pp. 668-673.
14. Eperon, I. C., and Kramer, A. R. (1993) Splicing of mRNA precursors m mamma- lian cells, m RNA Processzng, A Practml Approach, vol 1 (Higgins, S. J and Hames, B D , eds.), IRL, Oxford, pp 757-101.
15. Ausubel, F. M., Brent, R., Kingston, R E , Moore, D D , Serdman, J. G , Smtth, J A , and Struhl, K. (1995) Preparation of nuclear and cytoplasmic extracts from mammalian cells, m Current Protocols zn Molecular Biology. Wrley, New York, pp 12.1 I-12 1.9
16 Muhlemann, 0 , Kretvi, J.-P., and Akusjarvr, G (1995) Enhanced splrcmg of nonconsensus 3’ splice sites late during adenovtrus mfectron J Vzrol. 69, 7324-7327.
18
Adenovirus Entry into Cells
A Quantitative Fluorescence Microscopy Approach
Urs F. Greber, Michel Y. Nakano, and Maarit Suomalainen
1. Introduction Adenovn-uses carry their DNA genome into postmitotic nuclei of a variety
of human cells, either within an organism (in VIVO) or outside an organism m culture (ex VWO) (I). Recombinant adenovnuses are developed m many labo- ratories as gene-delivery vehtcles to treat hereditary and acquired human dis- orders of somatic cells (2,3). Diseased lungs of cystic fibrosis patients have been pioneered for treatment wtth recombinant adenovirus vectors (4) Pre- liminary results are promising, but demonstrate that the disease has not yet been cured by the emerging gene transfer technology (5). One reason for lim- ited success was that the transgenes were not expressed adequately m the dis- eased tissues, either because of low efficiency of virus delivery to the target cell or inefficient DNA import mto the nucleus. In this chapter, we describe a quantitattve method to determine transport of fluorescently labeled wild-type adenovirus 2 to the nucleus of a model cell line, HeLa cells. This protocol should be dtrectly applicable to recombinant adenoviruses in a variety of cell lmes, including peripheral blood cells, fibroblasts, polarized epithehal cells, and differentiated neurons.
1.1. Adenovirus Structure
Adenovnuses contain at least 11 different polypeptides (6). A hierarchically organized network of interactions between capsid proteins encloses a linear double-stranded DNA genome of approx 34 kb, which is linked to the capsid via the internal protein VI (7). Individual building blocks of the major capsid protein hexon join with mmor elements, such as the facet-stabilizmg protein
From Methods m Molecular Mecfmne, Vol 21 Adenowrus Methods and Protocols Echted by W S M Weld OHumana Press Inc , Totowa, NJ
217
218 Greber, Nakano, and Suomalatnen
IIIa and the hexon-cementmg protein IX, as well as the vertex protems penton base and protruding fiber. Inside the nucleus of an infected cell, adenovnus DNA is packaged mto the capsid together with condensing proteins V, VII, 1 p, and cysteine protease L3/p23.
1.2. Internalization and Penetration
Adenovirus type 2 uses a stepwise cell-entry program (8). Its fibers attach to an epithelial-cell-surface receptor of the immunoglobulin gene family (9-11). In the case of hematopoietic cells, an a, p2 integrm has also been reported as a high affinity receptor attaching to the virus penton base protem (12). In epithe- ha1 cells, fibers are shed from the particle and vu-us enters by receptor-medi- ated endocytosis via tibronectm-bmding a& mtegrins binding to penton base (13,14)). After 10 mm of mternalization, most vu-us particles are found within endosomes. Penetration of mdividual virions across the endosomal membrane is facilitated by slightly acidic pH and appears to require bmdmg of penton base to the av& mtegrm (15,26). When added to cells m high amounts, virions can also get into the cytoplasm m the absence of acidified endosomes (14). In the cytoplasm, the internal capsid protein VI 1s degraded by the reacti- vated viral protease and protein IX is dissociated from the capsid. Protease ts reactivated by two signals, penton-base bmdmg to mtegrin receptors at the plasma membrane and the reducing cytoplasmic milieu. These triggers pre- pare the capsid for disassembly near the nuclear membrane (17).
1.3. Nuclear Transport
All the proteins needed for virus assembly must enter the nucleus after syn- thesis m the cytoplasm. They either directly or indirectly contam nuclear tar- geting mformation, such as nuclear localization sequences (NLSs) Cfor revzew of nuclear zmport ofprotezns, see ref. 18). It is possible that NLSs present on capsid protein(s) are involved m nuclear targeting of incoming virus particles In addition, mechamcal forces, generated by cytoplasmic motor proteins, may be required for virus localization to the nucleus In any case, structurally altered adenoviruses reach the nuclear membrane and attach to the cytoplas- mic side of the nuclear-pore complex (14). Nuclear import of the DNA and associated proteins, such as protein VII, then occurs after DNA is dissociated from the capsid (17).
2. Materials
Commonly used chemicals were from Sigma (Buchs, Switzerland) or Fluka (Buchs, Switzerland). All stock solutions were made up m double-distilled water and filtered through 0.2~pm polyether sulfon membrane filters (Semadem, Swit- zerland). Working solutions were diluted mto double-distilled water before use.
Fluorescence Microscopy 219
2.1. Cell Growth and Virus Purification
2.1.1. Cells and Chemicals
1 Cells for virus growth are available from American Type Culture Collection (ATCC, Rockville, MD), e.g., HeLa cells (cervical-eptthelioid carcmoma), HeLa S3 cells (cervical-epithelioid carcinoma), KB cells (nasopharyngal car- cinoma), 293 cells (transformed embryonal-kidney cells), and A549 cells (human-lung carcmoma).
2 loo-mm Dishes (Costar, Canebridge, MA, cell culture grade, 78.5 cm2) 3. Dulbecco’s modified Eagle’s medium (Gibco-BRL, Basel, Switzerland, DMEM)
contaimng 7% Clone III serum (Hyclone, Logan, UT), 1% nonessential ammo acids, 1% glutamme and 100 U/mL streptomycin, 0 1 mg/mL penicillm (all from Gibco-BRL)
4 Bovine serum albumin (BSA, Sigma, A-9418: 10% [w/v] filtered through 0.2~pm membrane)
5 DMEM-containing 0.2% BSA 6. 10% Sodium dodecyl sulfate (SDS, molecular-biology grade) 7. 1X Phosphate-buffered salme (PBS), prepared from a premixed salt stock
(Gibco-BRL) 8 1 MTris-HCI, pH 8 1 9. 5 MNaCl
10. 1 MMgCI, 11 22 4% (w/w) Cesmm chloride (CsCl, ultrapure grade): Dissolve 60 g in 0 05 A4
Tris-HCl, pH 8.0, yieldmg a total of 267 8 g. 12. 42.2% (w/w) CsCl Dissolve 72.5 g in 0.05 A4 Tris-HCI, pH 8 0, yielding a
total of 171 8 g. 13. Immedtately before use, prepare CsCl step gradient for SW 55 rotor 1 5 mL of
22 4% solutton over 1 5 mL of 42 2% solution. 14 Freon (1,1,2-trichloro- 1,2,2-trifluoroethane, sds, France), saturated with 113 vol
of 0.0 1 A4 Tris-HCL, pH 8.0 15 0.2 MPhenyl-methyl-sulfonyl fluoride (PMSF): 34 mg/mL m ethanol, This solu-
tion is stable at -20°C for a few days. 16. Glycerol (autoclaved) 17 2% (w/v) Uranyl-acetate 18. 2% (w/v) Silicotungstic acid, pH 7.0, adjusted with 1 N KOH
2.1.2. Hardware
1 Cell mcubator, equilibrated to 5% humidified COZ atmosphere at 37°C Rocking plate fitting into Incubator.
2. Ultracentrifuge, SW 55 (or SW 50.1) rotor and correspondmg ultra clear thermo- plastic tubes (Beckman)
3 Table-top centrifuge (Heraeus). 4 Low-speed centrtfuge holding 50- and 15-mL screw-capped plastic tubes. 5 Pasteur pipets, autoclaved.
220 Greber, Nakano, and Suomalainen
6 Vacuum dialysis apparatus with ftttmg 75kDa collodton membrane bag (Schletcher and Schuell, Dassel, Germany)
7. 0.45 pm Sterile filters (Mtllex-GS filter, Millipore, Bedford, MA) 8. 50- and 15 mL screw-capped plastic centrifuge tubes 9. Spectrophotometer including quartz cuvet (e.g , Pharmacta Ultrospec 2000,
Uppsala, Sweden) for measurements at 260 and 280 nm 10. Transmtsston electron microscope (e.g., Zeiss EM 902A at acceleration voltage
of 80,000) and pallodmm film and carbon-coated EM grids (SWAP TEK G-2793, Plano, Germany).
11. Sodmm dodecyl sulfate-polyacrylamide gel electrophorests system (SDS-PAGE, Hoefer, San Franctsco, CA).
2.2. Plaque Assay 1 A549 (human-lung carcinoma) cells grown in 30-mm plastic dashes (Costar) as
described m Subheadings 2.1. and 3.1. 2. 5X concentrated DMEM (made up from powder and stored at 4°C for less than 2 mo
protected from light, Gtbco-BRL) 3. BSA (Sigma, A-941 8). 4. IOO-mL Glass flask, autoclaved, 500 mL of ddH,O, autoclaved 5 1X Phosphate buffered salute (PBS), prepared from a premixed salt stock
(Gibco-BRL). 6. 37% formaldehyde For working solution, dilute 10X mto 100 mL 1X PBS 7. 100 mL 1X Maintenance medium Mtx 20 mL of 5X DMEM, 10 mL tryptose
phosphate broth (Gtbco-BRL), 9 mL sodium btcarbonate (2.25 g/100 mL, Gibco-BRL), 2 mL Clone III serum (Hyclone), 2 mL 1 M MgC12, 1 mL pemctl- Im/streptomycin (10,000 U/l0 mg/mL, Gtbco-BRL), 2 mL L-glutamme (100X, Gtbco-BRL), and ddHzO to 80 mL. This solutton can be filtered through a 0 2-pm membrane and kept light protected in the cold for about 4 wk
8. 100 mL Overlay agar medium: Microwave 0.625 g agarose (sea plaque, low gel- ling, FMC) m a screw-capped glass flask contammg 20 mL of ddHzO until agar 1s completely dtssolved (no sign of Schlieren). Equilibrate m 37” C water bath for approx 1-2 h and add to 80 mL of prewarmed maintenance medium Mtx well avoiding au bubbles and add immediately over cells.
9. Cristal violet* To obtain a 50X stock solutton, dissolve 0 25 g of cristal violet (Stgma) in 5 mL of ethanol For workmg solution, dilute into ddH,O
2.3. Fluorescent Virus Entry
2.3.1, Chemicals and Cells
1. Micro BCA assay for protein determinatton (Pierce, Rockford, IL). 2. CsCi-purified adenovirus. 3. Virus dialysis buffer consisting of 0.1 M sodtum bicarbonate, 0.05 A4 sodmm
chlortde, 1 mM MgCl,, pH 8.2. 4. Collodion membrane (75-kDa cutoff) and dtalysts apparatus (Schletcher and
Schuell).
Fluorescence Microscopy 221
5 Texas red X (dissolved at 5 mg/mL in water-free DMSO, Molecular Probes, Eugene, OR).
6. Freshly made 1 5 M hydroxylamine, pH 8.5. 7. Cells grown on glass cover slips in DMEM-clone III serum placed m 24-well
dish (Costar) m a humtdttied 37°C CO;! incubator 8 Virus-binding medium: RPMI-0 2% BSA contaming 15 mM HEPES, pH is
adjusted to 7 4 with concentrated NaOH. 9 Vtrus-mternalizatton medium. DMEM-0.2% BSA, PBS.
10. 3.3% Paraformaldehyde made up m PBS according to standard procedures (29). 11 0.5 M Ammonmm chloride (NH&l). 12 PBS contammg 2% 1,4,-diazabicyclo[2,2,2]octane (DABCO) (see Note 8). 13. Nail polish.
2.3.2. Hardware
1 Round glass cover slips (I 2-mm diameter, Asststent, Winiger, Switzerland)* Wash m 1 N hydrochloric acid for 10 mm (HCl), follow by three changes m ddHzO, methanol, and agam ddH20.
2. Place between two filter papers m a glass Petri dish, autoclave, and dry in an oven at 60°C.
3 Alummntm plate. 4 Ice bucket 5. Wlppmg rocker kept at 4°C 6 Reichert-Jung Polyvar microscope (Merck, Switzerland) equipped with a 40X
oil-Immersion obJectlve (numerical aperature 1 .O), Nomarski differenttal inter- ference optics (DIC) and a Texas red filter set (excttatton filter 530-585 nm, emtsston filter LP 615) linked to a charge-coupled device (CCD) video camera (Hamamatsu C5405, Hamamatsu Photomcs, Germany).
7. Macintosh computer (Quadra 650 Apple Computer, Cupertino, CA) online to the camera system loaded with Argus-20 imaging acqutsitton program (Hamamatsu Photomcs, Germany) and Photoshop Version 3 0.5 (Adobe).
8. NIH image-analysts software (version 1.6) (written by Wayne Rasband). world wide web at http://1 28.23 1 98 16/nib-tmage/download.html.
3. Methods 3.1. A deno virus Purification
The following protocol was modified according to ref. 20.
1. Grow KB cells on ten 100~mm tissue-culture dishes in DMEM contaming 7% Clone III serum to 90% confluency corresponding to approx 8 x lo7 cells.
2 Infect cells with l-5 plaque forming units (PFU) per cell in 3 mL of DMEM- BSA on a rocking platform at 37°C m a CO* incubator for 90 mm
3. Remove moculum, add 7 mL of DMEM-7% Clone III serum, and incubate m CO2 Incubator at 37°C until cytopathic effect (CPE) occurs approx 3 d later Make sure CPE is complete and cells are detached from the dish.
222 Greber, Nakano, and Suomalainen
4. Collect cells wrth a short Pasteur prpet and transfer to 50-mL screw-capped cen- trifuge tube. Pellet cells at 600g for 10 mm. Wash pellet tn 10 mL of PBS and transfer suspensron to 15-mL centrifuge tube. Pellet cells
5. Resuspend cells In 0 01 M Trrs-HCl, pH 8 1, 0 5 mM PMSF at 2 x IO7 cells/ml and freeze-thaw three ttmes rn lrqurd nitrogen and a 37°C water bath At this point, the preparation can be kept frozen at -7O’C for several months.
6 Extract cells wtth an equal volume of Freon by gently vortexmg and shaking by hand for l-2 min. The suspension should become viscous and homogenous Sepa- rate orgamc and aqueous phase by centrrfugatron at 1OOOg for 5 mm at 4°C and collect upper-aqueous phase.
7. To prepare stock vuus, filter-sterilize aqueous phase through 0 45-pm drsk filter and shock-freeze ahquots m liquid mtrogen. Store at -70°C
8. Layer upper-aqueous phase on top of a CsCl step gradient and spin for 2 h at 32,000 r-pm m SW55 rotor (Beckman) at 4’C (see Note 2)
9. Collect virus band by carefully removing liquid from the top using a Pasteur prpet. Dilute virus (approx 400 &) with 0.01 M Trrs-HCl, pH 8.1, to 2 mL and overlay over a second CsCl-step gradient as described m step 8. Spm rsopycmcally for 18 h at 32,000 rpm at 4°C.
IO. Collect vu-us band as descrrbed m step 9. 11 Vacuum-concentrate vuus m collodton membrane by dialysis agamst 0 01 M
Trrs-HCl, pH 8 1,0 15 MNaCl, 1 mMMgC12 Observe approx every 5 mm and concentrate to l-2 mg/mL (approx 100-200 &). Disconnect vacuum and con- tinue dialysis for another 2-3 h on ice. Change buffers at least twice Use vu-us unmedlately or add glycerol to 10% and shock-freeze aliquots m hquid nitrogen Store at -70°C for up to several months
3.2. Quality Control
3.2.1. Optical Measurements
The amount of optical particle units 1s determined by the absorbance of drs- soclated virus at 260 nm.
1. Dissolve a small aliquot of virus m 0.5% SDS, 0.02 MTris-HCl, pH 7 4, at 37°C for 15 min with occasional shaking.
2. Place disrupted vu-us mto quartz cuvet and measure absorbances at 260 nm (OD& and 280 nm
3. Determine virus concentratron by multiplying ODz6a value with the drlutron fac- tor and dividing by the extmction coefficient (E = 9 x lo-l3 OD mL cm vnus- 1) as determined for adenovnus type 5 (21). Optrcally pure vn-us should have an absorbance ratto 260/280 of 1.33-1 45 (22). 1 ODzbO umt equals 1 1 x lOI optr- cal vnus partrcles, based on the measurement that 13% of the vuus dry weight 1s accounted for by DNA (23). 1 ODzhO is equivalent to approx 1.2 mg/mL protem This value roughly corresponds to the amount of protem (0 8 mg/mL), deter- mined in our Micro BCA protein assay (Pierce).
Fluorescence Microscopy 223
3.2.2. Plaque Assay
Plaque assays determine the biologlcal activity of a vnus preparation. They are the most stringent crlterium for virus functionality. Results are expressed as plaque-forming units (PFU).
1. Seed A549 cells 48 h prior to infection mto 30-mm plastic dishes and grow to approx 95% confluency Set up enough dishes to perform test in duplicates including two dishes as noninfected controls.
2 Prepare IO-fold serial dllutlons of VKLIS into 2 mL of DMEM-BSA, typically ranging from 10m5 to 10e9.
3. Remove medium from the cells, wash cells once with DMEM-BSA, and add 0 5 mL of diluted virus Incubate on a gently rocking plate in a humidified CO2 incubator at 37°C for 90 mm.
4. Suck off moculum and add 2 mL of overlay agar medium. Let agar solidify in the cold for 10 min and place dishes into humidified CO;! incubator at 37°C for 2-3 d
5 Overlay with an additional 2 mL of overlay agar medmm and mcubate for another 3-4 d at 37OC as above Examme plaque formation by eye against a dark surface beginning at d 5 after mfection
6 When no more new plaques grow (e g , at d 7), determine the number of plaques by staining cells wrth crlstal violet. Carefully remove agar with a spatula (avold scratching the cells). Fix cells in 3 7% formaldehyde-PBS for 10 mm and stain cells with crlstal violet for 5 mm Suck off solution and count plaques.
3.2.3. Electron Microscopy and Negative Staining
To determine if isolated adenovirus is free of other virus particles, such as adenoassociated virus (AAV), the followmg procedure can be applied. All steps are carried out at room temperature.
1. Spot 5 pL of a 1.10 dilution (into 0.01 MTris-HCl, pH 8.0) of stock virus onto a piece of parafilm foil
2. Place a carbon-coated plastified EM grid (glow discharged) upside down on vu-us droplet and absorb virus to the grid for 2 mm.
3. Pick up grid with a pair of fine tweezers and remove excess liquid with a piece of Whatman filter paper.
4. Place grid upside-down on 5 & of 2% uranyl-acetate and incubate for 20 s Alternatively, stain vnus with 2% sihcotungstlc acid (made up in ddHzO, pH adjusted with 1 N KOH to 7) for 10 s (see Note 3).
5 Blot off excess stam with filter paper and dry specimen for 1 h. 6. Observe sample in the transmission-electron microscope at 80 kV and 80,000- to
200,000-fold magnification.
3.2.4. SDS-PAGE
Vn-us homogeneity can also be tested by SDS-polyacrylamide gel electro- phoresls (SDS-PAGE) followed by Coomassle blue staining, e.g., as described
224 Greber, Nakano, and Suomalainen
in refs. 8 and 24). Pure adenovirus 1s characterized by a predominant hexon band, proteins V and VII, and famter bands representmg penton base, fiber, IIIa, VI, and IX (Fig. 1, right lane) (see Note 4).
3.3. Quantitative Subcellular Analysis of incoming Fluorescent Virus 3.3.1. Texas Red and FITC labeling of Adenovirus
1. Dtalyze purified adenovirus agamst 0.1 M sodmm bicarbonate, 0.05 M sodium chloride, 1 mM MgC12, pH 8.2, using a 75kDa cut-off collodron membrane as described m Subheading 3.1.1., step 10
2 Determine protern concentratron usmg the Macro BCA assay accordmg to the manufacturer’s conditions (Pierce).
3. To 0.4 mL of 0.8 mg/mL adenovnus add dropwise 8 pL of 0.5 mg/mL Texas red (diluted from 5 mg/mL stock with dialysis buffer immedtately before use) Incubate for 1 h m the dark on a rocker at room temperature (for FITC-adenovnus, see Note 6).
4 To block excess texas red dye, add 40 pL of freshly made 1.5 M hydroxylamme, pH 8.5, and incubate for another hour as described in step 3.
5. Repurifjr virus on CsCl-step gradient as described m Subheading 3.1.1., steps 7 and 10 6. Determine protein concentration usrng Micro BCA assay (Pierce) and freeze virus
in aliquots of 0.4 mg/mL (see Notes 5 and 6).
3.3.2. Cold-Synchronized Virus En try in to Cells
1 Two days before infection, seed HeLa cells (or any other cell line) on round glass cover slips in DMEM growth medium placed m a 24-well dish At the day of infection, cells should be 60-90% confluent
2. Transfer 24-well dish to an aluminum plate coated with a wet ktmwipe and kept on ice. Wash cells once with cold-binding medium (RPMI-0 2% BSA, 15 rtuV Hepes-NaOH, pH 7 4).
3. Dilute stock Texas red labeled virus (typically 0 2 $ of 0 26 mg/mL per cover slip, approx 1,000 vnus particles per cell) into cold-binding medmm and add 0 2 mL of this dilution to each cover slip.
4. Bind virus to the cell surface m the cold on a gently rocking platform for 90 mm 5. Wash off unbound virus with cold-binding medium and briefly add 0.5 mL of
warm internalization medium (DMEM-0.2% BSA) to each cover slip Remove medium and add fresh 0 5 mL of warm DMEM-0.2% BSA Incubate for a given time in a 37°C CO, incubator
6 Wash cells quickly in PBS at room temperature and fix immediately m 3.3% paraformaldehyde for 15 min at room temperature
7. Quench unreacted paraformaldehyde with 50 ti NH4Cl m PBS for 5 mm at room temperature and wash briefly with PBS (see Note 7)
8. Mount slide in PBS contammg DABCO and seal edges of cover slip with nail polish (see Notes 8 and 9)
9. For best results, analyze within 24 h
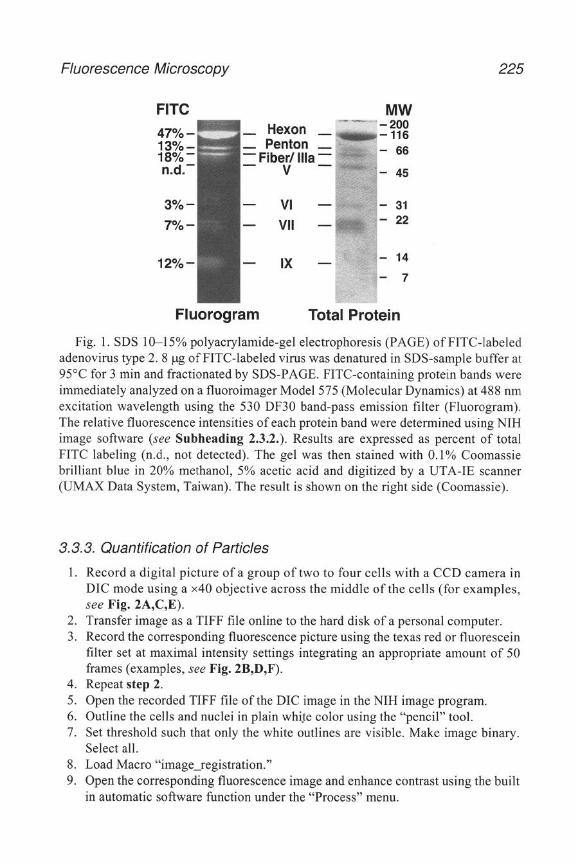
Fluorescence Microscopy 225
FITC MW
- 31 - 22
- 14
- 7
Fluorogram Total Protein
Fig. 1. SDS 10-I 5% polyacrylamide-gel electrophoresis (PAGE) of FITC-labeled adenovirus type 2. 8 pg of FITC-labeled virus was denatured in SDS-sample buffer at 95°C for 3 min and fractionated by SDS-PAGE. FITC-containing protein bands were immediately analyzed on a fluoroimager Model 575 (Molecular Dynamics) at 488 nm excitation wavelength using the 530 DF30 band-pass emission filter (Fluorogram). The relative fluorescence intensities of each protein band were determined using NIH image software (see Subheading 2.3.2.). Results are expressed as percent of total FITC labeling (n.d., not detected). The gel was then stained with 0.1% Coomassie brilliant blue in 20% methanol, 5% acetic acid and digitized by a UTA-IE scanner (UMAX Data System, Taiwan). The result is shown on the right side (Coomassie).
3.3.3. Quantification of Particles
1. Record a digital picture of a group of two to four cells with a CCD camera in DIC mode using a x40 objective across the middle of the cells (for examples, see Fig. ZA,C,E).
2. Transfer image as a TIFF tile online to the hard disk of a personal computer. 3. Record the corresponding fluorescence picture using the texas red or fluorescein
filter set at maximal intensity settings integrating an appropriate amount of 50 frames (examples, see Fig. ZB,D,F).
4. Repeat step 2. 5. Open the recorded TIFF file of the DIC image in the NIH image program. 6. Outline the cells and nuclei in plain white color using the “pencil” tool. 7. Set threshold such that only the white outlines are visible. Make image binary.
Select all. 8. Load Macro “image-registration.” 9. Open the corresponding fluorescence image and enhance contrast using the built
in automatic software function under the “Process” menu.
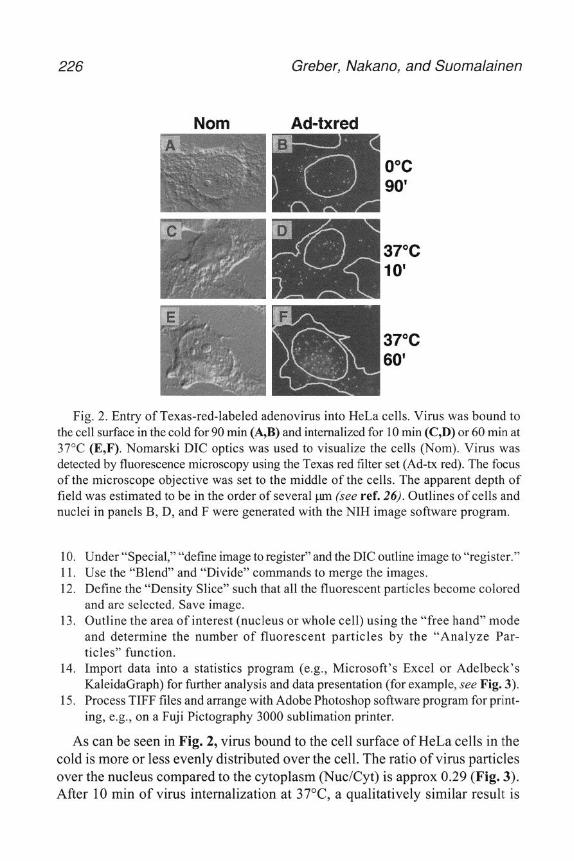
226 Greber, Nakano, and Suomalainen
Nom Ad-txred
37°C 60’
Fig. 2. Entry of Texas-red-labeled adenovirus into HeLa cells. Virus was bound to the cell surface in the cold for 90 min (A,B) and internalized for 10 min (C,D) or 60 min at 37°C (E,F). Nomarski DIC optics was used to visualize the cells (Nom). Virus was detected by fluorescence microscopy using the Texas red filter set (Ad-tx red). The focus of the microscope objective was set to the middle of the cells. The apparent depth of field was estimated to be in the order of several pm (see ref. 26). Outlines of cells and nuclei in panels B, D, and F were generated with the NIH image software program.
10. Under “Special,” “define image to register” and the DIC outline image to “register.” 11. Use the “Blend” and “Divide” commands to merge the images. 12. Define the “Density Slice” such that all the fluorescent particles become colored
and are selected. Save image. 13. Outline the area of interest (nucleus or whole cell) using the “free hand” mode
and determine the number of fluorescent particles by the “Analyze Par- ticles” function.
14. Import data into a statistics program (e.g., Microsoft’s Excel or Adelbeck’s KaleidaGraph) for further analysis and data presentation (for example, see Fig. 3).
15. Process TIFF files and arrange with Adobe Photoshop software program for print- ing, e.g., on a Fuji Pictography 3000 sublimation printer.
As can be seen in Fig. 2, virus bound to the cell surface of HeLa cells in the cold is more or less evenly distributed over the cell. The ratio of virus particles over the nucleus compared to the cytoplasm (NucKyt) is approx 0.29 (Fig. 3). After 10 min of virus internalization at 37”C, a qualitatively similar result is
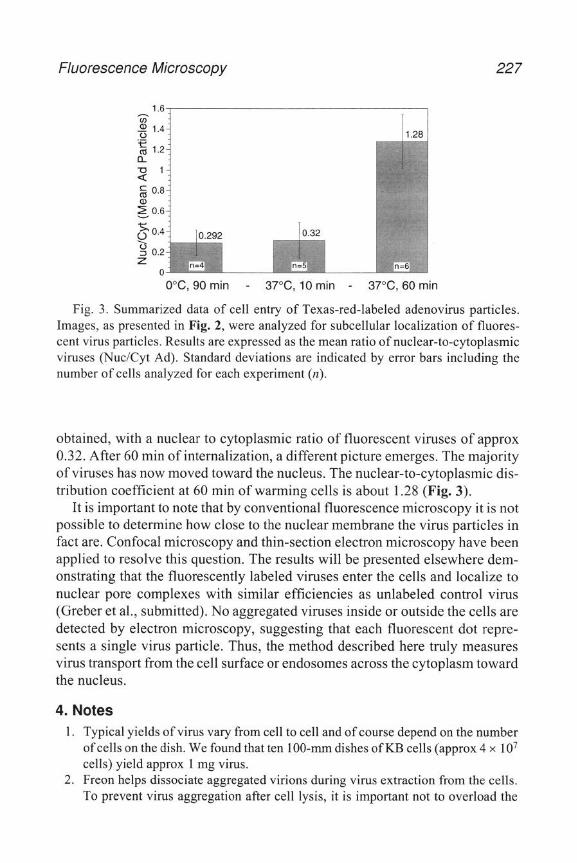
Fluorescence Microscopy 227
To.32
b TI) 0.2
Z 0
O”C, 90 min - 37%, 10 min - 37”C, 60 min
Fig. 3. Summarized data of cell entry of Texas-red-labeled adenovirus particles. Images, as presented in Fig. 2, were analyzed for subcellular localization of fluores- cent virus particles. Results are expressed as the mean ratio of nuclear-to-cytoplasmic viruses (Nuc/Cyt Ad). Standard deviations are indicated by error bars including the number of cells analyzed for each experiment (n).
obtained, with a nuclear to cytoplasmic ratio of fluorescent viruses of approx 0.32. After 60 min of internalization, a different picture emerges. The majority of viruses has now moved toward the nucleus. The nuclear-to-cytoplasmic dis- tribution coefficient at 60 min of warming cells is about 1.28 (Fig. 3).
It is important to note that by conventional fluorescence microscopy it is not possible to determine how close to the nuclear membrane the virus particles in fact are. Confocal microscopy and thin-section electron microscopy have been applied to resolve this question. The results will be presented elsewhere dem- onstrating that the fluorescently labeled viruses enter the cells and localize to nuclear pore complexes with similar efficiencies as unlabeled control virus (Greber et al., submitted). No aggregated viruses inside or outside the cells are detected by electron microscopy, suggesting that each fluorescent dot repre- sents a single virus particle. Thus, the method described here truly measures virus transport from the cell surface or endosomes across the cytoplasm toward the nucleus.
4. Notes 1. Typical yields of virus vary from cell to cell and of course depend on the number
of cells on the dish. We found that ten 100~mm dishes of KB cells (approx 4 x lo7 cells) yield approx 1 mg virus.
2. Freon helps dissociate aggregated virions during virus extraction from the cells. To prevent virus aggregation after cell lysis, it is important not to overload the
228 Greber, Nakano, and Suomalainen
CsCl gradients. One SW50 tube should not contam more than 0.5 mg of vtrus For long-term storage, a concentration of 2 mg/mL vtrus should not be exceeded
3 Check pH of the silicotungstic actd stock solutton each time before use (pH will drop with time).
4. If the adenovirus preparation 1s contaminated with AAV, at least one strong band of AAV protein 3 (VP-3) shows up below the adenovnus I&/fiber bands in SDS- PAGE (data not shown; see also ref. 25). AAV proteins 1 and 2 (VP- 1 and VP-2) are less abundant than VP-3 and stain weakly m Coomassie blue.
5 Texas-red labeled virus prepared under these conditions contams maximally 2 4 molecules of Texas red per hexon monomer. Texas-red labeled vuus has the same specific mfectivity (per protem) as unlabeled virus as determined by plaque as- say This vnus preparation remains active for months
6 Fluorescem tsothiocyanate (FITC)-labeled adenovtrus can be prepared using stmtlar protocol Dialyze virus against 0 01 h4 sodium bicarbonate contaimng 0 14 MNaCl, 1 mMMgCI,, for 2 h and determme the protein concentratton using Micro BCA assay (Pierce) Adjust the pH of the vtrus solution to 9 0 by add- ing l/5 of the volume 0 5 Msodmm carbonate buffer, pH 9 0 Initiate labeling by adding 16 p.L of 0 5 mg/mL FITC solution (dduted tmmedtately before use mto 0 1 M sodium carbonate buffer, pH 9 0 from a 5-mg/mL stock solution made m DMSO) to 125 pL of 1.8 mg/mL virus suspension Incubate for 1 h m the dark on a rocker at room temperature Treat with hydroxylamrne and repurtfy virus on CsCl gradient as descrtbed above Analysis of FITC-labeled vu-us by SDS-PAGE and fluorotmagmg Indicated that 47% of the label 1s mcorporated into hexon, 13% into penton base, 18% into protem IIIa and fiber, 3% into protein VI, 7% mto protein VII, and 12% mto protein IX (Fig. 2, lane 2)
7 PBS contammg 0.1% sodium azide can be used Instead of PBS to mmlmtze bac- terial contammation.
8. DABCO-contammg mounting media only lasts a few weeks and should be made fresh on a regular basts An alternative mounting medmm is based on NPGT (N-Propyl-gallate-Glycerol-T&) For 25 mL, mtx 17 5 mL glycerol (87%), 7.5 mL 0.1 M Tris-HCI, pH 9 5, 2.5 g N-propyl-gallate m a 50-mL screw-cap plastic tube Place tube into water bath sonicator (e g., Branson Model 12 10) and somcate for 15 mm at 37°C. Transfer solution into vacuum flask and degas extensively under house vacuum. Store ahquots at -20°C. NPGT medium IS recommended for Texas-red- or rhodamme-labeled probes, but appears to quench fluorescem- labeled probes
9. A third mounting medium consists of 80% glycerol, 20 mA4 Trts-HCl, pH 8 8, 0.5% Paraphenylene-diamine (Sigma). This medmm has a slightly brownish color and lasts several months tf stored at -20°C. It works equally well with both Texas red and FITC probes.
Acknowledgments We thank Dr. Robert Stldwlll for help with image acqulsltion and analysis
and comments to the manuscript. This work was supported by the SWISS
Fluorescence Microscopy 229
National Science Foundation (grant no. 3 1-43’412.95 to UFG) and the Kanton of Zurich.
References 1 Mulligan, R. C (1993) The basic science of gene therapy. Scrence 260,926932. 2. Trapnell, B. C. and Gorziglia, M. (1995) Gene therapy using adenoviral vectors
Curr. Op Btotech 5,617-625. 3. Hanama, E G., Kavanagh, J , Hortobagyi, G., Giles, R E., Champlm, R., and
Deisseroth, A B. (1995) Recent advances in the applicatton of gene therapy to human disease Am J Med 99,537-552.
4 Rosenfeld, M A. and Collins, F S. (1996) Gene therapy for cystic fibrosts Chest 109,241-252
5. Crystal, R G. (1995) Transfer of genes to humans: early lessons and obstacles to success Scrence 270,404-4 10.
6. Horwitz, M S. (1990) Adenovirtdae and their replication, in Vzrology, vol 1 (Fields, B N. and Knipe, D. M., eds.), Raven, New York, pp 1679-1721
7. Stewart, P. L , Fuller, S D., and Burnett, R. M (1993) Difference imaging of
8.
9
10
11.
12.
13
14
15
16
adenovirus bridging the resolutron gap between x-ray crystallography and elec- tron microscopy. EMBO J 12,2589-2599. Greber, U F , Wllletts, M , Webster, P , and Helenius, A. (1993) Stepwtse dts- mantling of adenovuus 2 during entry mto cells. Cell 75,477486. Bergelson, J M., Cunnmgham, J A., Droguett, G , Kurt-Jones, E. A , Krithtvas, A., Hong, J S., Horwttz, M S , Crowell, R. L., and Finberg, R. W. (1997) lsola- tion of a common receptor for Coxsackte B vnuses and adenovnuses 2 and 5 Sczence 275, 1320-l 323 Tomko, R P., Xu, R., and Philipson, L. (1997) HCAR and MCAR the human and mouse cellular receptors for subgroup C adenoviruses and group B cox- sacktevtruses Proc Nat1 Acad Ser. USA 94,3352-3356. Hong, S. S , Karayan, L , Tournier, J , Curiel, D. T., and Boulanger, P. A (1997) Adenovnus type 5 fiber knob binds to MHC class I alpha2 domam at the surface of human epithehal and B lymphoblastoid cells. EMBO J. 16,2294-2306 Huang, S., Kamata, T., Takada, Y , Ruggeri, Z. M., and Nemerow, G. R (1996) Adenovirus interaction with distinct integrins mediates separate events m cell entry and gene delivery to hematopoietic cells. J. Vzrology 70,4502-4508. Wickham, T J., Mathtas, P , Cheresh, D. A., and Nemerow, G. R. (1993) Integrms alpha v beta 3 and alpha v beta 5 promote adenovtrus mternalization but not virus attachment. CelE 73, 309-3 19 Greber, U. F. and Kasamatsu, H. (1996) Nuclear targeting of SV40 and adenovi- IUS. Trends Cell Biol 6, 189-195. Wrckham, T. J., Ftlardo, E J , Cheresh, D. A , and Nemerow, G. R (1994) Integrm alpha v beta 5 selectively promotes adenovirus mediated cell membrane permeabihzation. J Cell Btol 127,257-264. Pastan, I., Seth, P , FitzGerald, D., and Wlllmgham, M. (1986) Adenovnus entry into cells. some new observatrons on an old problem, in Concepts IYE Viral Patho-
230 Greber, Nakano, and Suomalainen
genesis II (Notkins, A. L. and Oldstone, M. B. A., eds.), Springer Verlag, New York, pp. 141-146
17. Greber, U F., Webster, P , Weber, J., and Helemus, A (1996) The role of the adenovnus protease on virus entry into cells. EMBO J 15, 17661777
18. GBrhch, D. and MattaJ, I W. (1996) Nucleocytoplasmic transport Science 271, 1513-1518.
19. Harlow, E. and Lane, D. (1988) Antzbodzes, A Laboratory Manual (Harlow, E, L., ed ), Cold Sprmg Harbor Laboratory, Cold Spring Harbor, NY.
20. Nevms, J R. (1981) Definition and mappmg of adenovnus 2 nuclear transcrip- tion. Methods Enzymol. 65,768-785.
21. Malzel, J V. J., White, D. O., and Scharff, M D. (1968) The polypeptides of adenovnus. I. Evidence for multiple protein components m the vnion and com- parison of types 2, 7A, and 12. Virology 36, 115-126
22. Chardonnet, Y and Dales, S. (1970) Early events m the Interaction of adeno- viruses with HeLa cells. I. Penetration of type 5 and intracellular release of the DNA genome I’zvology 40,462-477
23 Ginsberg, H. S (1984) The Adenovlruses. Plenum, New York. 24. Laemmh, U. IS. (1970) Cleavage of structural protems during the assembly of the
head of bacteriophage T4 Nature 227,68&685 25 Berns, K 1 (1996) Parvoviridae the viruses and their rephcatron, m Fundamen-
tal Vzrology (Fields, B. N., Kmpe, D. M., and Howley, P M , eds ), Raven, Phtla- delphia, pp. 1017-1041
26 Lacey, A. J. (199 1) The princtples and alms of light microscopy, in Light Mlcros- copy m Biology, A Practical Approach ( Lacey, A. J , ed ), Oxford Umversity Press, Oxford, England, pp l-59
19
Simultaneous Detection of RNA and Proteins in Adenovirus-Infected Cells by Fluorescence /II Situ Hybridization (FISH) and lmmunostaining
Eileen Bridge
1. Introduction Adenovnus (Ad)-infected cells have been used extensively as a model sys-
tem for studying the expression of eukaryotic genes and were instrumental m elucidatmg steps m the production of RNA. Much of this work involved genetic and molecular analyses of viral gene expression. Recent advances m method- ologies for detecting nucleic acid and protein components of cells has trig- gered a renaissance m the study of cellular organization. Cell biologists interested m understandmg functional organization of gene-expression activt- ties are again turnmg to Ad-infected cells as an important model system (reviewed m ref. 1).
A major goal of current research in cell biology is to understand how replt- cation and gene-expression activtttes are organized relative to each other and to the structural framework of the nucleus, The location of transcription and replication activities in Ad-infected cells has been studied by pulse-labeling cells with trttiated nucleotides followed by autoradiography and electron microscopy (2,3). Methods for mcorporation of modified nucleotides followed by fluorescence-based detection have also been developed (4,5), and allow for simultaneous detection of rephcation and transcription activities. Localtzatton of posttranscriptional events such as splicing relies on mnnunostaining tech- niques to determine the localization of the factors involved m catalyzing these reactions, and on in situ hybridizations (ISHs) to determine the localization of precursor and product forms of the RNA (6,7). RNA export involves move- ment of RNA from the location of its transcription to the nuclear pore, where It
From Methods m Molecular Medmne, Vol 21 Adenovrrus Methods and Protocols Edlted by W S M Wold 0 Humana Press Inc , Totowa, NJ
231
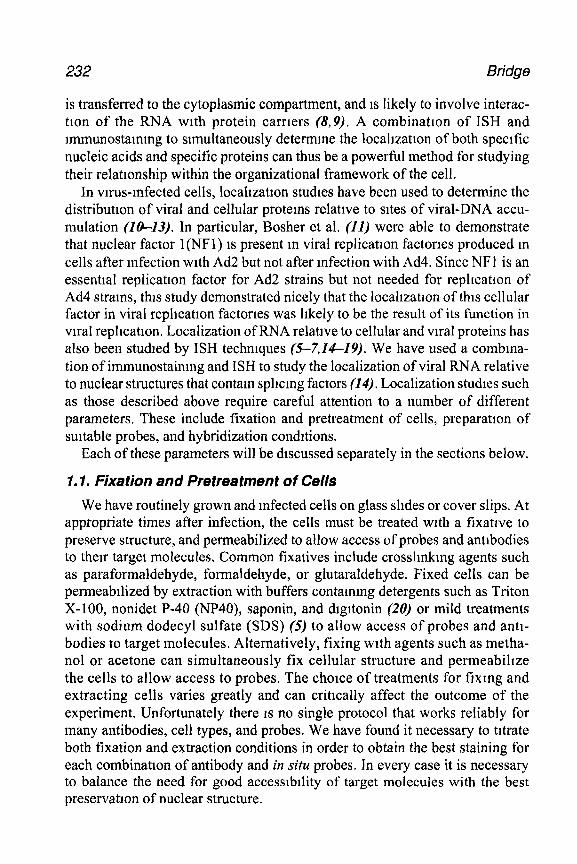
232 Bridge
is transferred to the cytoplasmic compartment, and 1s likely to involve interac- tlon of the RNA wtth protein carriers (8,9). A combination of ISH and nnmunostammg to simultaneously determme the locallzatlon of both specific nucleic acids and specific proteins can thus be a powerful method for studying their relationship within the organizational framework of the cell.
In vu-us-infected cells, localrzatlon studies have been used to determine the distribution of viral and cellular proteins relative to sites of viral-DNA accu- mulation (10-13). In particular, Bosher et al. (II) were able to demonstrate that nuclear factor l(NF1) IS present m viral replication factories produced m cells after infection wtth Ad2 but not after mfection with Ad4. Since NFI is an essential replication factor for Ad2 strains but not needed for rephcatlon of Ad4 strams, this study demonstrated nicely that the locahzatlon of this cellular factor in viral rephcatlon factories was likely to be the result of its function in viral rephcatlon. Localization of RNA relative to cellular and vu-al proteins has also been studied by ISH techniques (S-7,14-19). We have used a combma- tion of immunostainmg and ISH to study the localization of viral RNA relative to nuclear structures that contam sphcmg factors (14). Localization studies such as those described above require careful attention to a number of different parameters. These include fixation and pretreatment of cells, preparation of suitable probes, and hybridization conditions.
Each of these parameters will be discussed separately in the sections below.
1.1. Fixaiion and Pretreatment of Cells
We have routinely grown and Infected cells on glass shdes or cover slips. At appropriate times after infection, the cells must be treated with a fixative to preserve structure, and permeabilized to allow access of probes and antibodies to their target molecules. Common fixatives include crosslmkmg agents such as paraformaldehyde, formaldehyde, or glutaraldehyde. Fixed cells can be permeabllized by extraction with buffers contammg detergents such as Triton X-100, nonidet P-40 (NP40), saponin, and dlgltonin (20) or mild treatments with sodium dodecyl sulfate (SDS) (5) to allow access of probes and antl- bodies to target molecules. Alternatively, fixing with agents such as metha- nol or acetone can simultaneously fix cellular structure and permeabihze the cells to allow access to probes. The choice of treatments for fixmg and extracting cells varies greatly and can critically affect the outcome of the experiment. Unfortunately there 1s no single protocol that works reliably for many antibodies, cell types, and probes. We have found it necessary to titrate both fixation and extraction conditions in order to obtain the best staining for each combination of antibody and in situ probes. In every case it is necessary to balance the need for good accesslbllity of target molecules with the best preservation of nuclear structure.
Fluorescence In Situ Hybridization and lmmunos taining 233
1.2. Probes for ISH
Nucleic acid probes for ISH can be obtained by a variety of methods. We have used synthetic ollgonucleotide probes coupled to biotm or digoxigenin for detection by fluorescence-based methods (14). It IS also possible to use oligonucleotides directly coupled to fluorochromes such as fluorescem lsothiocyanate (FITC) (7,15). Such oligonucleottde probes have been particu- larly useful for identifying spliced forms of RNA in situ since they can be designed to hybridize specifically to splice junctions of the processed RNA. Probes can also be produced by nick-translation, PCR amplification, and in vitro transcription reactions performed in the presence of nucleotides coupled to biotm or digoxigenin (21). Probe length is an important consid- eration for developing a useful reagent for ISH. Ideally, probes should not be much longer than 200-300 nucleotides in order to efficiently enter fixed and permeabihzed cells (22).
7.3. Hybridization to Nucleic Acids in Virus-Infected Cells
Hybridizations are normally done m buffers containing formamide since the presence of formamide reduces the melting temperature of nucleic acid duplexes, This property allows the hybridizations to be done at lower tempera- tures and thus helps to preserve nuclear structure during the procedure (21). Other parameters important for efficient hybridization include temperature, pH, and the concentration of monovalent cations. Many hybridization solutions also contain dextran sulfate which is strongly hydrated in aqueous solutions and can thus increase the effectrve concentration of probes.
Hybridization to double-stranded DNA will require a denaturation step. This can be done by heat-treating the cells or by treatment with NaOH (22). In most studies of cellular genes, hybridization to the gene and hybridization to the RNA produced from the gene are easily distinguished by doing the hybridiza- tion under denaturing or nondenaturmg conditions. In Ad-infected cells, dif- ferentiating between hybridization to DNA and hybridization to RNA is considerably complicated by the fact that the vu-us produces a large amount of single-stranded DNA during its replication (23). These sequences are available for hybridtzmg to many probes even under nondenaturmg conditions. Thus, extra enzymatic treatments with RNase and DNase are required as controls to determine what part of the signal is the result of hybridizing to RNA and what part of the signal is the result of hybridizing to DNA. In Ad-infected cells, the localization of double-stranded DNA (detected m denatured samples) is sepa- rate from that of single-stranded DNA (detected in nondenatured samples) dur- ing the viral late phase (242.5). During the late phase, single-stranded DNA accumulates m nuclear mclusions that also contain the viral 72-kDa DNA- binding protein (72K) (25,261. Antibodies against the 72-kDa protein can thus
234 Bridge
serve as a useful marker for the location of single-stranded DNA during the late phase of Ad infection. In this article I will focus on the methodology we have used for locahzing viral RNA and cellular or viral proteins in double- labeling experiments.
2. Materials Note All solutions and reagents must be kept RNase free for the detection
of RNA.
I 2
3
7.
8
9
10.
11 12. 13 14. 15.
Btotm- 16-dUTP (Boehringer Mannheim, Mannhelm, Germany) G-50 Sephadex spm chromatography G-50 Sephadex from Pharmacta (Uppsala, Sweden) IS prepared for use accordmg to the manufacturers mstructions and usmg precautions to prevent contammation with RNases We routmely autoclave the hydrated G-50 sephadex and store it at 4°C. Glass cover slips. We use 12 x 12-mm glass cover slips and prepare them by washing in 70% ethanol, and then dtstrtbutmg the cover shps between layers of Whatman 3MM paper in a glass Petrt dish The cover slips m the Petri dish are autoclaved and are then ready to use. 20X SSC Rectpe for 1 L of 20X SSC 175 3 g NaCl, 88 2 g sodium citrate. Adjust to pH 7.4 with NaOH. Autoclave. Phosphate buffered salme (PBS) Recipe for 1 L 8 0 g NaCl, 0 2 g KCl, 1 44 g, Na2HP04, 0.24 g KH2P04. Adjust to pH 7.4 with HCl Autoclave. 4 0% paraformaldehyde (PFA) m PBS. MIX PFA with PBS While stirring add NaOH until the paraformaldehyde goes into solutron Filter through a 0.2-w filter. PFA can be frozen m aliquots at-20°C for long-term storage or kept at 4’C and used within 2-3 wk 0 5% Trrton X-100 m PBS. This solutron 1s filtered through a 0 2-w filter and stored at 4°C Hybndizanon soluuon: 50% detomzed formamtde, 2X SSC, 5% dextran sulfate, 50 mM phosphate buffer, pH 7.0,l mg/mLE ~011 t-RNA (Stgma, St Louis, MO). Store at-20°C Hybridizatton chamber. A moist chamber 1s required to prevent the cells from drying out during hybridization Our homemade chambers consist of a box that contains paper towels wetted with 50% formamlde, 2X SSC. Slides contammg the cover slips are placed on stands within the box, and the lid sealed with parafilm before placing at the appropriate temperature Blockmg solution* 0 5% Blocking reagent from Boehrmger Mannheim m 100 nnI4 Trrs-HCl, pH 7.5, 150 mMNaC1 Autoclave the solution to dissolve the blocking reagent. Alrquot and freeze at -20°C Tween-20 ExtrAvidm-FITC (fluorescein tsothlocyanate) (Sigma). Primary anttbody against the protein of interest Secondary antibody conjugated to Texas red or other appropriate fluorochrome Mounting Medium Vecta-Shield from Vector Labs, (Burlingame, CA) This con- tains antifadmg reagents to preserve the fluorescence during microscopy.
Fluorescence In Situ Hybridization and lmmunostah’ng 235
3. Methods 3.1. Preparation of Probes
The procedure that we have used for making biotm-labeled probes by PCR is given here. It should be noted that it is possible to prepare probes by a variety of standard techmques such as random priming, m vitro transcrtptlon, or mck translation (22). Probes can also be made with digoxigenm (21). To synthesize probes by PCR, choose appropriate primers to amplify a target sequence of approx 200 nucleotldes. Perform PCR under standard condltlons except that the concentration of dTTP 1s 134 @4 and biotin- 16-dUTP 1s present at 66 @4. Amplification is done wtth 200 MdATP, dCTP, and dGTP m a 100~& reac- tion volume. Followmg amphficatlon, purify the PCR product by spun-column chromatography using G-50 sephadex (27) to remove unincorporated nucle- otides, precipitate in ethanol, redissolve m a small volume of RNase-free water, and then store at -20°C. Estimate the concentration of the PCR product by gel electrophoresls with standards of known concentration.
3.2. Preparation and fixation of Cells
1 Seed cells growing m monolayers onto tissue-culture dishes contammg sterile glass cover slips and allow to grow on these cover slips for 1 or 2 d to form a subconfluent monolayer Infect cells with virus or mock infect as desired
2. At the desired time after infection, remove cover slips with attached cells with a small forceps and transfer to a separate dish and rinse two times with 2 mL PBS. I find it convenient to process three 12 x 12-mm cover slips m a 3.5-cm Petri dish, and buffer volumes given here are for this size container If other containers are used, buffer volumes should be sufficient to adequately cover the cells.
3 Fix the cells with 14% paraformaldehyde in PBS. First, rmse cells on cover slips with this solution and then Incubate with 1 0 mL for 10 mm at room tem- perature. Rinse cover slips with 0.5% Triton X-100 in PBS and then incubate with 1 0 mL of this buffer for 15 min at room temperature (see Note 1)
4 Wash cover slips three times for 5 mm with 2 0 mL of PBS at room temperature (see Note 2).
5 Wash cells twice for 5 mm at room temperature with 2.0 mL 2X SSC; they are then ready for ISH
3.3. ISH to RNA and/or Single-Stranded DNA and lmmunostaining
1. For each 12 x 12-mm cover slip, dry down approx 50 ng of labeled PCR product m a speed vat (the optimal amount of probe can be determined by titration). Dissolve the probe m 8 $ of hybrldlzatlon solution.
2 Denature the probe by heating to 70°C for 5 mm. Chill on ice. 3. Plpet 8 & of denatured probe onto a clean glass slide. Lift out a cover slip with
forceps, blot the back of the cover slip dry with a tissue, and then carefully layer the cover slip cell-side down onto the drop of hybrldlzation solution contaming
236 Bridge
the probe Incubate the slide and the cover sltp m a hybridization chamber equth- brated with 50% formamide, 2X SSC at 37°C for 1 to 3 h.
4. Loosen the cover slip by ptpetmg 2X SSC around the edges Gently pry up the cover slip usmg a needle and forceps and transfer tt cell-srde up to a 3.5-cm dish containing 2X SSC Wash m 2X SSC for 3X 15 mm at 37°C. Wash m 1X SSC for 15 mm at room temperature (see Note 3)
5. Rinse cover slips with 4X SSC contammg 0.05% Tween-20 Aspirate thts buffer, taking care to dry around the edges of the cover sltp and then add 8 p.L of blocking solution to the top of each cover slip Incubate for 30 min at room temperature.
6 Rmse cover slips with 4X SSC containing 0.05% Tween-20. Aspirate, add 8 u.L of FITC-coupled extravidm (Sigma) diluted l/200 m blockmg solutton ( 12 5 &mL final concentratron), to the top of each cover slip, and incubate for 30 mm at room temperature. When performing double stammgs in which ISHs are per- formed together with rmmunostaming, it is convenient to incubate the primary antibody together with the extravtdm at an approprrate dtlutton (see Note 4).
7 Wash cover slips three times for 5 mm with 4X SSC at room temperature 8. Rmse cover slips with 4X SSC contammg 0 05% Tween-20 Aspirate, add 8 pL
of an appropriate secondary antrbody coupled to Texas red (Southern Biochemicals, Birmmgham, AL) diluted l/50 in blocking solutron (final concentra- tion 0.02 mg/mL) Incubate the cover slip at room temperature for 30 mm
9. Wash cover slips three times for 5 mm with 4X SSC at room temperature. 10 Postfix the cells with 4% paraformaldehyde m PBS for 5 mm at room temperature 11. Wash the cells three times for 5 mm with PBS at room temperature (see Note 5) 12 Mount the cover slips onto a slide contammg a 3.5)Ic spot of Vecta-shield
mounting medmm, seal with nail polish, and then observe the stammg by fluo- rescence mtcroscopy using appropriate filters for the two different fluorochromes
3.4. RNase and DNase Controls
Enzymatic digestions with RNase A, RNase H, and DNase I may be per- formed to determine whether probes are hybrtdtzmg to DNA or RNA (22). These controls are essentral m Ad-infected cells because the large amount of ssDNA produced during viral replrcatton can be available for hybridizatton even under nondenaturmg conditions. When possible, the use of spllce-lunc- tton oligonucleottde probes of 22-24 nucleotldes for detecting spliced RNA can greatly simpltfy the analysis, smce these probes do not hybridize efficiently to smgle stranded Ad DNA (7,14).
3.4. I RNase A Digestion
1. Followmg the fixation procedure (Subheading 3.2.4.), transfer the cover slips to be treated with RNase to separate 3 5-cm dishes (cell-stde up).
2. Rinse the cover slips with 1 .O mL of 2X SSC contammg 0.05% Tween-20. Aspt- rate the buffer and then add 8 l.rL of 100 pg/mL RNase A in 2X SSC to the top of
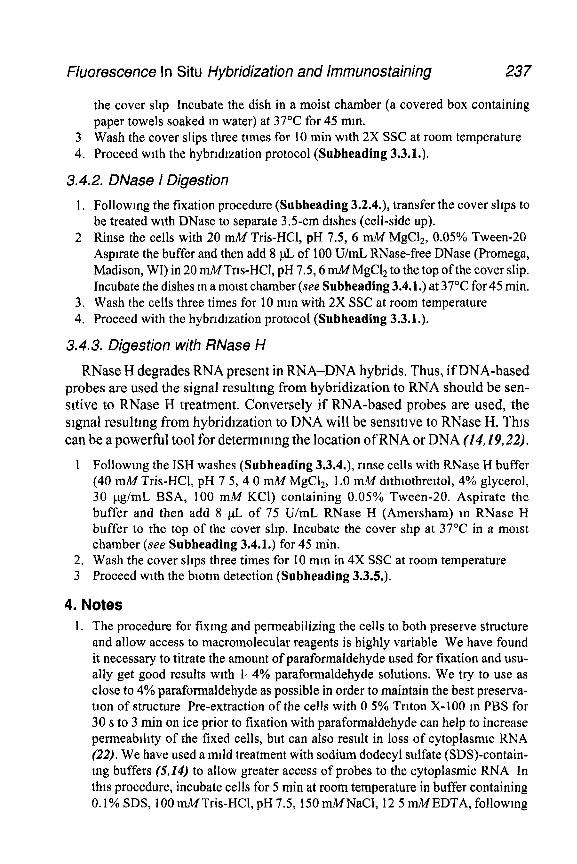
Fluorescence In Situ Hybridization and lmmunostaining 237
the cover shp Incubate the dish in a moist chamber (a covered box containing paper towels soaked m water) at 37°C for 45 mm.
3 Wash the cover slips three ttmes for 10 min with 2X SSC at room temperature 4. Proceed with the hybrtdtzation protocol (Subheading 3.3.1.).
3.4.2. DNase I Digestion
1. Followmg the fixation procedure (Subheading 3.2.4.), transfer the cover slips to be treated with DNase to separate 3.5-cm dishes (cell-side up).
2 Rinse the cells with 20 mM Tris-HCl, pH 7.5, 6 nn!4 MgCl,, 0.05% Tween-20 Aspirate the buffer and then add 8 pL of 100 U/mL RNase-free DNase (Promega, Madison, WI) in 20 mMTris-HCI, pH 7.5,6 mMMgCls to the top ofthe cover slip. Incubate the dishes m a moist chamber (see Subheading 3.4.1.) at 37°C for 45 min.
3. Wash the cells three times for 10 mm with 2X SSC at room temperature 4. Proceed with the hybridtzation protocol (Subheading 3.3.1.).
3.4.3. Digestion with RNase H
RNase H degrades RNA present in RNA-DNA hybrids. Thus, if DNA-based probes are used the signal resultmg from hybridization to RNA should be sen- sitive to RNase H treatment. Conversely if RNA-based probes are used, the srgnal resulting from hybridization to DNA will be sensitive to RNase H, This can be a powerful tool for determtnmg the location of RNA or DNA (14,19,22).
1 Followmg the ISH washes (Subheading 3.3.4.), rinse cells with RNase H buffer (40 mA4 Tris-HCl, pH 7 5, 4 0 mM MgC&, 1 .O mM dtthtothrettol, 4% glycerol, 30 pg/mL BSA, 100 mM KCl) containing 0.05% Tween-20. Aspirate the buffer and then add 8 n.L of 75 U/mL RNase H (Amersham) m RNase H buffer to the top of the cover slip. Incubate the cover slip at 37°C in a moist chamber (see Subheading 3.4.1.) for 45 min.
2. Wash the cover slips three times for 10 mm in 4X SSC at room temperature 3 Proceed with the biotm detection (Subheading 3.3.5.).
4. Notes 1. The procedure for fixing and permeabilizing the cells to both preserve structure
and allow access to macromolecular reagents is highly variable We have found it necessary to titrate the amount of paraformaldehyde used for fixation and usu- ally get good results with 14% paraformaldehyde solutions. We try to use as close to 4% paraformaldehyde as possible in order to maintain the best preserva- tion of structure Pre-extraction of the cells with 0 5% Trtton X-100 m PBS for 30 s to 3 min on ice prior to fixation with paraformaldehyde can help to increase permeablhty of the fixed cells, but can also result in loss of cytoplasmic RNA (22). We have used a mild treatment with sodium dodecyl sulfate (SDS)-contain- mg buffers ($14) to allow greater access of probes to the cytoplasmic RNA In this procedure, incubate cells for 5 min at room temperature in buffer containing 0.1% SDS, 100 mA4Tris-HCl, pH 7.5, 150mMNaC1, 12 5 mMEDTA, followmg
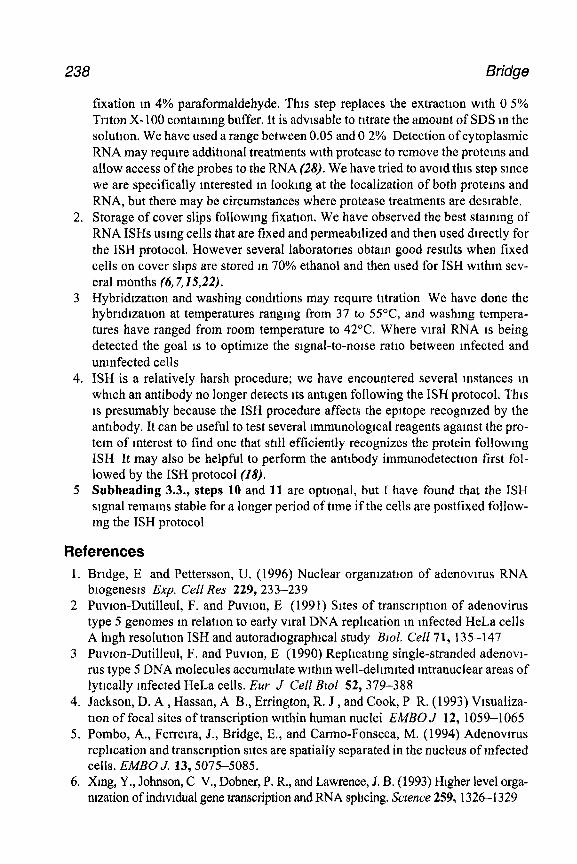
238 Bridge
fixation m 4% paraformaldehyde. This step replaces the extractton with 0 5% Trlton X-100 containing buffer. It is advisable to titrate the amount of SDS m the solution. We have used a range between 0.05 and 0 2% Detection of cytoplasmic RNA may require additional treatments with protease to remove the proteins and allow access of the probes to the RNA (28). We have tried to avold this step since we are specifically interested m looking at the localization of both protems and RNA, but there may be circumstances where protease treatments are desirable. Storage of cover slips followmg fixation. We have observed the best staining of RNA ISHs usmg cells that are fixed and permeabllized and then used directly for the ISH protocol. However several laboratories obtain good results when fixed cells on cover slips are stored m 70% ethanol and then used for ISH within sev- eral months (6,7,15,22). Hybridization and washing conditions may require titration We have done the hybrldlzatlon at temperatures ranging from 37 to 55”C, and washing tempera- tures have ranged from room temperature to 42°C. Where viral RNA IS being detected the goal 1s to optimize the signal-to-noise ratlo between infected and unmfected cells ISH is a relatively harsh procedure; we have encountered several instances m which an antibody no longer detects Its antigen following the ISH protocol. This 1s presumably because the ISH procedure affects the epltope recognized by the antlbody. It can be useful to test several lmmunologlcal reagents against the pro- tem of interest to find one that still efficiently recognizes the protein followmg ISH It may also be helpful to perform the antlbody immunodetectlon first fol- lowed by the ISH protocol (28). Subheading 3.3., steps 10 and 11 are optional, but I have found that the ISH signal remains stable for a longer period of time if the cells are postfixed follow- mg the ISH protocol
References 1. Bridge, E and Pettersson, U. (1996) Nuclear organization of adenovlrus RNA
btogenesls Exp. Cell Res 229,233-239 2 Puvlon-Dutilleul, F. and Puv~on, E (1991) Sites of transcription of adenovirus
type 5 genomes m relation to early viral DNA replication m infected HeLa cells A high resolution ISH and autoradlographlcal study &ol. Cell 71, 135-147
3 Puvlon-Dutilleul, F. and Puvlon, E (1990) Rephcatmg single-stranded adenovl- rus type 5 DNA molecules accumulate within well-delimited mtranuclear areas of lytically infected HeLa cells. Eur J Cell Bzol 52, 379-388
4. Jackson, D. A , Hassan, A B., Errington, R. J , and Cook, P R. (1993) Vlsualiza- tlon of focal sites of transcription within human nuclei EMBOJ 12, 1059-1065
5. Pombo, A., Ferrelra, J., Bridge, E., and Carmo-Fonseca, M. (1994) Adenovnus replication and transcription sites are spatially separated in the nucleus of Infected cells. EMBO J. 13,5075-5085.
6. Xmg, Y., Johnson, C V., Dobner, P. R., and Lawrence, J. B. (1993) Higher level orga- nization of indlvldual gene transcription and RNA splicing. Science 259, 1326-l 329
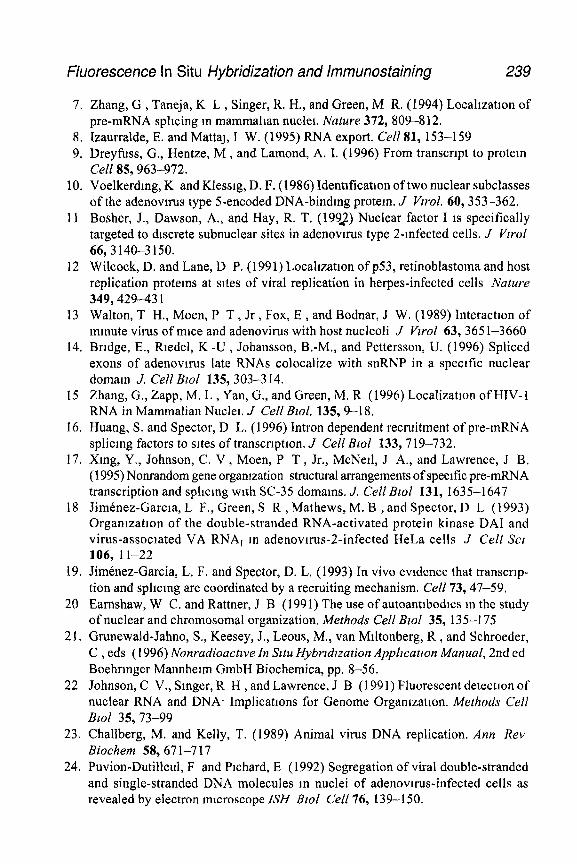
Fluorescence In Situ Hybridization and lmmunostaining 239
7. Zhang, G , Taneja, K L , Singer, R. H., and Green, M R. (1994) Localization of pre-mRNA sphcing m mammalian nuclet. Nature 372, 809-812.
8. Izaurralde, E. and MattaJ, I W. (1995) RNA export. Cell 81, 153-159 9. Dreyfuss, G., Hentze, M , and Lamond, A. I. (1996) From transcript to protein
Cell f&,963-972. 10. Voelkerdmg, K and Klessig, D. F. (1986) Identification oftwo nuclear subclasses
of the adenovn-us type 5-encoded DNA-binding protein. J Vwol. 60,353-362. 11 Bosher, J., Dawson, A., and Hay, R. T. (1992) Nuclear factor I is specifically
targeted to discrete subnuclear sites in adenovnus type 2-infected cells. J Vrrol 66,3140-3150.
12 Wilcock, D. and Lane, D P. (1991) Localization of p53, retinoblastoma and host replication proteins at sites of viral replication in herpes-infected cells Nature 349,429-43 1
13 Walton, T H., Moen, P T , Jr, Fox, E , and Bodnar, J W. (1989) Interaction of minute virus of mice and adenovirus with host nucleoli J Vzrol 63,365 I-3660
14. Bridge, E., Riedel, K -U , Johansson, B.-M., and Pettersson, U. (1996) Spliced exons of adenovnus late RNAs colocalize with snRNP in a spectfic nuclear domam J. Cell BEOI 135, 303-3 14.
15 Zhang, G., Zapp, M. L , Yan, G., and Green, M. R (1996) Localization of HIV- 1 RNA in Mammalian Nuclei. J Cell B~ol. 135, 9-18.
16. Huang, S. and Spector, D L. (1996) Intron dependent recruitment of pre-mRNA splicing factors to sites of transcription. J Cell BEOE 133,719-732.
17. Xmg, Y., Johnson, C. V , Moen, P T , Jr., McNeil, J A., and Lawrence, J B. (1995) Nonrandom gene orgamzation structural arrangements of specific pre-mRNA transcription and sphcmg wtth SC-35 domains. J. Cell Bzol 131, 1635-1647
18 Jimenez-Garcia, L F., Green, S R , Mathews, M. B , and Spector, D L (1993) Organization of the double-stranded RNA-activated protein kinase DA1 and virus-associated VA RNA1 m adenovirus-2-infected HeLa cells J Cell Scr 106, 11-22
19. Jimenez-Garcia, L. F. and Spector, D. L. (1993) In vivo evtdence that transcrip- tion and splicmg are coordinated by a recruiting mechanism. Cell 73,47-59.
20 Earnshaw, W C. and Rattner, J B (1991) The use of autoantlbodles m the study of nuclear and chromosomal organization. Methods Cell BloI 35, 135-I 75
21. Grunewald-Jahno, S., Keesey, J., Leous, M., van Mtltonberg, R , and Schroeder, C , eds (1996) Nonradioactwe In Sttu Hybndzation Application Manual, 2nd ed Boehrmger Mannheim GmbH Biochemica, pp. 8-56.
22 Johnson, C V., Singer, R H , and Lawrence, J B (1991) Fluorescent detection of nuclear RNA and DNA* Implications for Genome Orgamzatton. Methods Cell Blol 35,73-99
23. Challberg, M. and Kelly, T. (1989) Animal virus DNA replication. Ann Rev Biochem 58,67 l-7 17
24. Puvion-Dutilleul, F and Prchard, E (1992) Segregation of viral double-stranded and single-stranded DNA molecules m nuclei of adenovnus-infected cells as revealed by electron microscope ISH Blol Cell 76, 139-150.
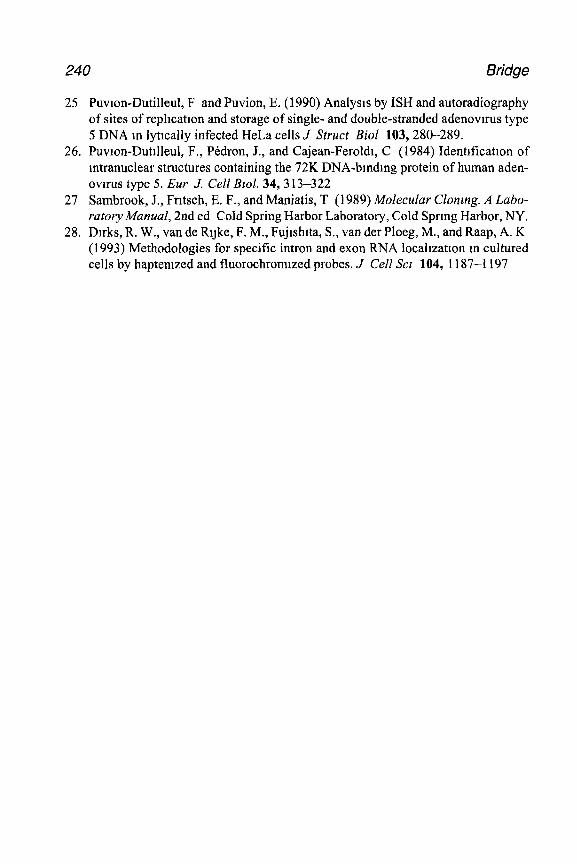
240 Bridge
25 Puvlon-Dutilleul, F and Puvion, E. (1990) Analysis by ISH and autoradiography of sites of replication and storage of single- and double-stranded adenovnus type 5 DNA m lytically infected HeLa cells J Struct Biol 103,280-289.
26. Puvron-Dutllleul, F., Pedron, J., and Cajean-Feroldi, C (1984) Identlficatlon of mtranuclear structures containing the 72K DNA-bmdmg protein of human aden- ovms type 5. Eur J. Cell Blol. 34, 3 13-322
27 Sambrook, J., Fritsch, E. F., and Maniatis, T (1989) Molecular Clonzng. A Labo- ratory Manual, 2nd ed Cold Spring Harbor Laboratory, Cold Sprmg Harbor, NY.
28. Dnks, R. W., van de Ryke, F. M., Fujtshtta, S., van der Ploeg, M., and Raap, A. K (1993) Methodologies for specific intron and exon RNA locallzatton m cultured cells by haptemzed and fluorochromrzed probes. J Cell Scz 104, I 187-l 197
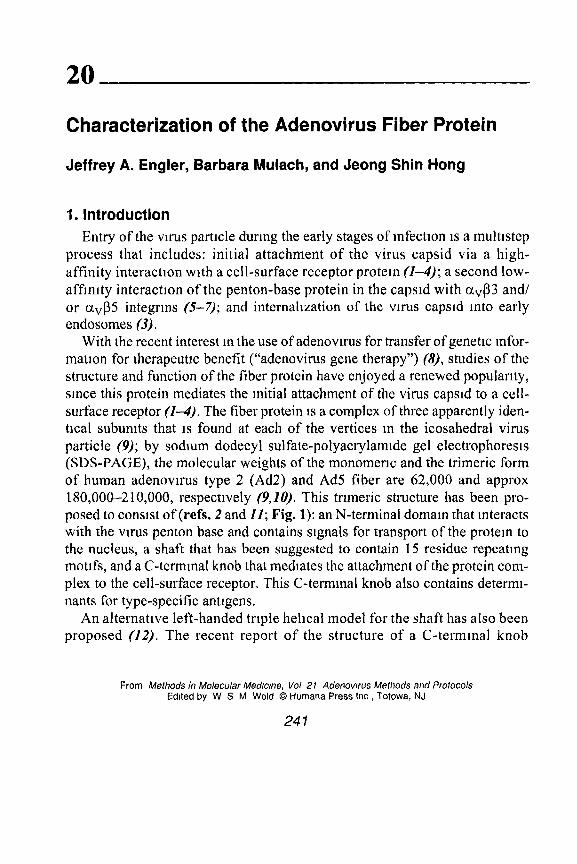
20
Characterization of the Adenovirus Fiber Protein
Jeffrey A. Engler, Barbara Mulach, and Jeong Shin Hong
1. Introduction Entry of the vu-us particle during the early stages of infectton IS a multtstep
process that includes: initial attachment of the virus capsid via a high- affinity interaction with a cell-surface receptor protein (Z-4); a second low- affmrty interaction of the penton-base protein in the capstd with avP3 and/ or avP5 integrms (5-7); and internahzation of the vnus capstd mto early endosomes (3).
With the recent interest m the use of adenovnus for transfer of genetic mfor- matron for therapeuttc benefit (“adenovirus gene therapy”) (a), studies of the structure and function of the fiber protein have enjoyed a renewed populartty, smce this protein mediates the initial attachment of the virus capstd to a cell- surface receptor (Z-4). The fiber protein IS a complex of three apparently iden- tical subumts that IS found at each of the vertices m the icosahedral virus particle (9); by sodium dodecyl sulfate-polyacrylamtde gel electrophorests (SDS-PAGE), the molecular weights of the monomertc and the trimeric form of human adenovnus type 2 (Ad2) and Ad5 fiber are 62,000 and approx lSO,OOO-2 10,000, respectrvely (9,IO). This trtmeric structure has been pro- posed to consist of (refs. 2 and II; Fig. 1): an N-terminal domain that interacts with the vnus penton base and contains signals for transport of the protein to the nucleus, a shaft that has been suggested to contain 15 residue repeating mottfs, and a C-terminal knob that mediates the attachment of the protein com- plex to the cell-surface receptor. This C-terminal knob also contains determt- nants for type-specific antigens.
An alternative left-handed triple helrcal model for the shaft has also been proposed (12). The recent report of the structure of a C-terminal knob
From Methods in Molecular Medicine, I/o/ 21 Adenovrrus Methods and Protocols Edited by W S M Wold 0 Humana Press Inc , Totowa, NJ
241
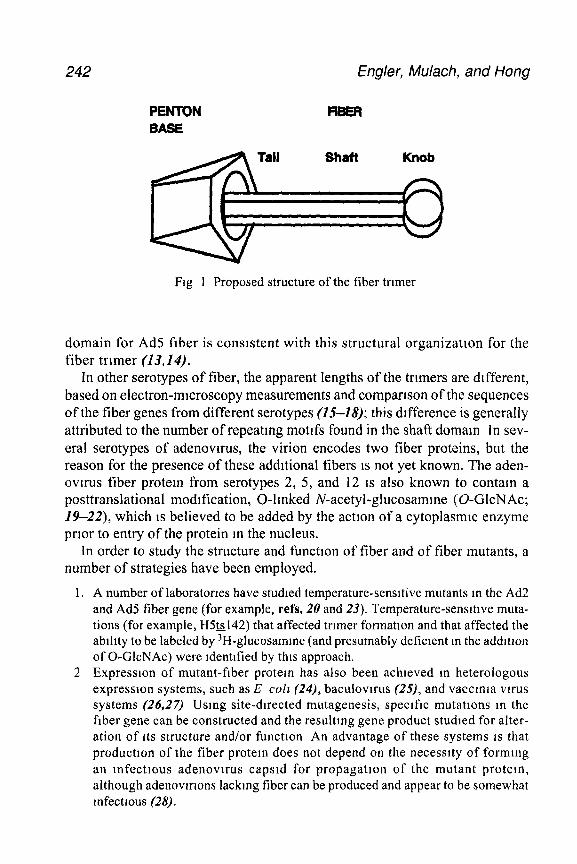
242 Engler, Mulach, and Hong
PENTON BASE
Fig 1 Proposed structure of the fiber trlmer
domain for Ad5 fiber is consistent with this structural organization for the fiber trlmer (13,1#).
In other serotypes of fiber, the apparent lengths of the trlmers are different, based on electron-mlcroscopy measurements and comparison of the sequences of the fiber genes from different serotypes (1548); this difference is generally attributed to the number of repeatmg motifs found in the shaft domain In sev- eral serotypes of adenovn-us, the virion encodes two fiber proteins, but the reason for the presence of these additional fibers IS not yet known. The aden- ov~rus fiber protein from serotypes 2, 5, and 12 1s also known to contam a posttranslational modification, 0-lmked N-acetyl-glucosamme (O-GlcNAc; J9-22), which IS believed to be added by the action of a cytoplasmtc enzyme prior to entry of the protein m the nucleus.
In order to study the structure and function of fiber and of fiber mutants, a number of strategies have been employed.
1, A number of laboratorles have studied temperature-sensitive mutants m the Ad2 and Ad5 fiber gene (for example, refs. 20 and 23). Temperature-sensltlve muta- tions (for example, H.5~142) that affected trlmer formation and that affected the ability to be labeled by 3H-glucosamme (and presumably deficient m the addltlon of 0-GlcNAc) were identified by this approach.
2 Expression of mutant-fiber protein has also been achieved m heterologous expression systems, such as E co11 (24), baculovlrus (25), and vaccmla virus systems (26,27) Using site-directed mutagenesis, specific mutations m the fiber gene can be constructed and the resultmg gene product studied for alter- ation of Its structure and/or function An advantage of these systems IS that production of the fiber protem does not depend on the necessity of formlng an Infectious adenovlrus capsld for propagation of the mutant protem, although adenovmons lackmg fiber can be produced and appear to be somewhat mfectlous (28).
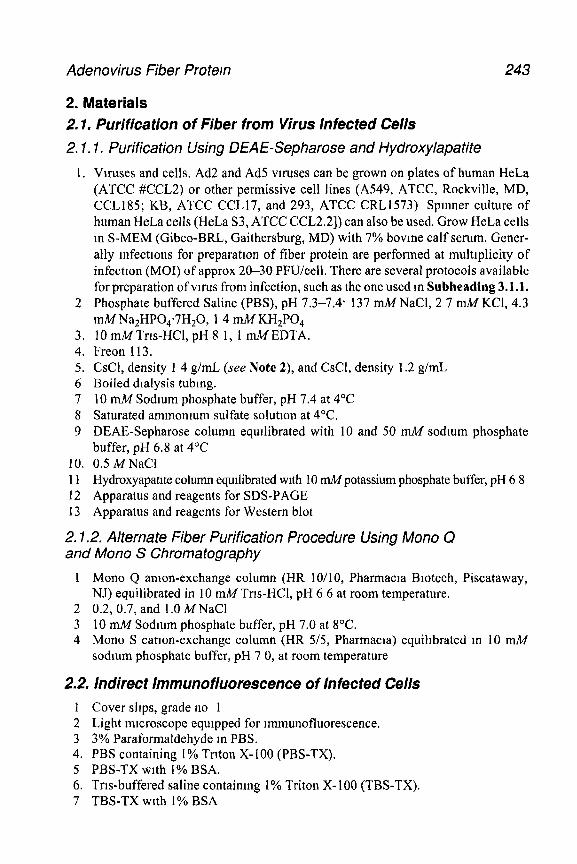
Adenovirus fiber Protern 243
2. Materials 2.1. Purification of Fiber from Virus Infected Cells 2.1.1. Purification Using DEAE-Sepharose and Hydroxylapatite
1. Vu-uses and cells. Ad2 and Ad5 vtruses can be grown on plates of human HeLa (ATCC #CCL2) or other permissive cell lines (A549, ATCC, Rockville, MD, CCL185; KB, ATCC CCL17, and 293, ATCC CRL1573) Spmner culture of human HeLa cells (HeLa S3, ATCC CCL2.21) can also be used. Grow HeLa cells m S-MEM (Gibco-BRL, Gaithersburg, MD) with 7% bovine calf serum. Gener- ally mfecttons for preparatton of fiber protein are performed at multtplicity of infectton (MOI) of approx 2&30 PFU/cell. There are several protocols available for preparation of vuus from infection, such as the one used m Subheading 3.1.1.
2 Phosphate buffered Saline (PBS), pH 7.3-7.4. 137 r&I NaCl, 2 7 mM KCl, 4.3 m&I Na2HP0,*7H,0, 1 4 mM KH2P04
3. 10 mMTrts-HCl, pH 8 1, 1 ti EDTA. 4. Freon 113. 5. CsCl, density 1 4 g/mL (see Note 2), and CsCl, density 1.2 g/mL 6 Boiled dtalysis tubmg. 7 10 mM Sodium phosphate buffer, pH 7.4 at 4°C 8 Saturated ammonmm sulfate solutton at 4°C. 9 DEAE-Sepharose column equilibrated with 10 and 50 m&I sodmm phosphate
buffer, pH 6.8 at 4°C 10. 0.5 MNaCl 1 1 Hydroxyapattte column equdibrated wtth 10 tipotassium phosphate buffer, pH 6 8 12 Apparatus and reagents for SDS-PAGE 13 Apparatus and reagents for Western blot
2.1.2. Alternate Fiber Purification Procedure Using Mono Q and Mono S Chromatography
1 Mono Q amon-exchange column (HR lO/lO, Pharmacta Btotech, Piscataway, NJ) equilibrated in 10 nnI4 Trts-HCl, pH 6 6 at room temperature.
2 0.2, 0.7, and 1.0 MNaCl 3 10 mM Sodium phosphate buffer, pH 7.0 at 8°C. 4 Mono S catton-exchange column (HR 5/5, Pharmacla) equilibrated rn 10 mM
sodium phosphate buffer, pH 7 0, at room temperature
2.2. Indirect Immunofluorescence of Infected Cells 1 Cover slips, grade no 1 2 Light microscope equipped for tmmunofluorescence. 3 3% Paraformaldehyde m PBS. 4. PBS containing 1% Trrton X- 100 (PBS-TX). 5 PBS-TX wnh 1% BSA. 6. Trts-buffered saline containmg 1% Triton X-100 (TBS-TX). 7 TBS-TX with 1% BSA
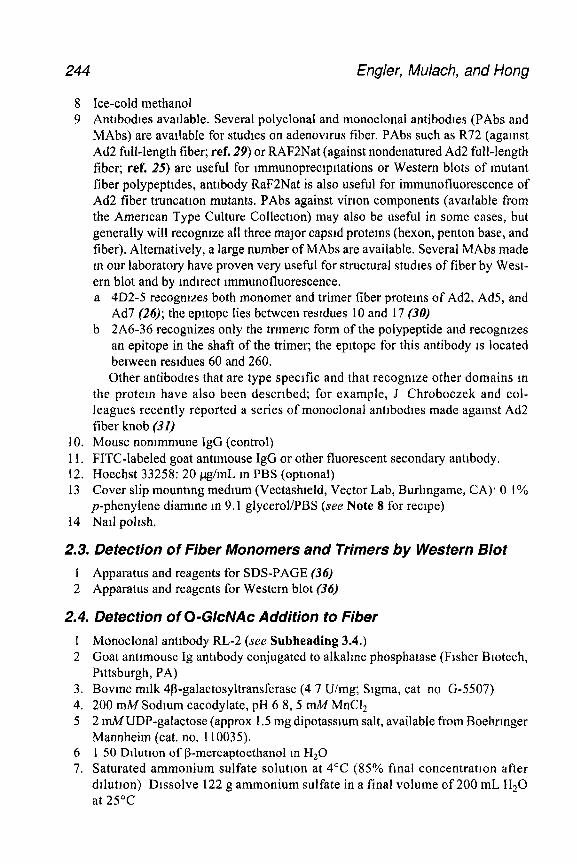
244 Engler, Mulach, and Hong
8 Ice-cold methanol 9 Antibodies available. Several polyclonal and monoclonal antibodies (PAbs and
MAbs) are available for studtes on adenovn-us fiber. PAbs such as R72 (agamst Ad2 full-length fiber; ref. 29) or RAF2Nat (against nondenatured Ad2 full-length fiber; ref. 25) are useful for tmmunoprectpttations or Western blots of mutant fiber polypepttdes, antibody RaF2Nat is also useful for immunofluorescence of Ad2 fiber truncatton mutants. PAbs against virton components (available from the Amerrcan Type Culture Collectton) may also be useful in some cases, but generally will recogmze all three maJor capsrd protems (hexon, penton base, and fiber). Alternatively, a large number of MAbs are available. Several MAbs made m our laboratory have proven very useful for structural studtes of fiber by West- ern blot and by mdnect tmmunofluorescence. a 4D2-5 recogmzes both monomer and trimer fiber protems of Ad2, Ad5, and
Ad7 (26); the epttope lies between residues 10 and 17 (30) b 2A6-36 recognizes only the trimeric form of the polypeptide and recogmzes
an epitope in the shaft of the trimer; the epttope for this antibody is located between residues 60 and 260. Other antibodtes that are type specific and that recognize other domains m
the protem have also been described; for example, J Chroboczek and col- leagues recently reported a series of monoclonal antibodies made against Ad2 fiber knob (32)
10. Mouse nommmune IgG (control) 11. FlTC-labeled goat anttmouse IgG or other fluorescent secondary antibody. 12. Hoechst 33258: 20 pg/mL m PBS (optional) 13 Cover slip mounting medium (Vectashteld, Vector Lab, Burlmgame, CA)* 0 1%
p-phenylene diamme m 9.1 glycerol/PBS (see Note 8 for recipe) 14 Nat1 polish.
2.3. Detection of Fiber Monomers and Trimers by Western Blot 1 Apparatus and reagents for SDS-PAGE (36) 2 Apparatus and reagents for Western blot (36)
2.4. Detection of 0-GlcNAc Addition to Fiber
1 Monoclonal antibody RL-2 (see Subheading 3.4.) 2 Goat antimouse Ig antibody conjugated to alkaline phosphatase (Fisher Btotech,
Pittsburgh, PA) 3. Bovme milk 4P-galactosyltransferase (4 7 U/mg; Stgma, cat no G-5507) 4. 200 mA4 Sodium cacodylate, pH 6 85 mA4 MnCl, 5 2 mMUDP-galactose (approx 1.5 mg dipotassmm salt, available from Boehrmger
Mannheim (cat. no. 110035). 6 1 50 Dilution of l3-mercaptoethanol in HZ0 7. Saturated ammonium sulfate solution at 4°C (85% final concentration after
dtlutron) Dissolve 122 g ammonium sulfate in a final volume of 200 mL Hz0 at 25°C
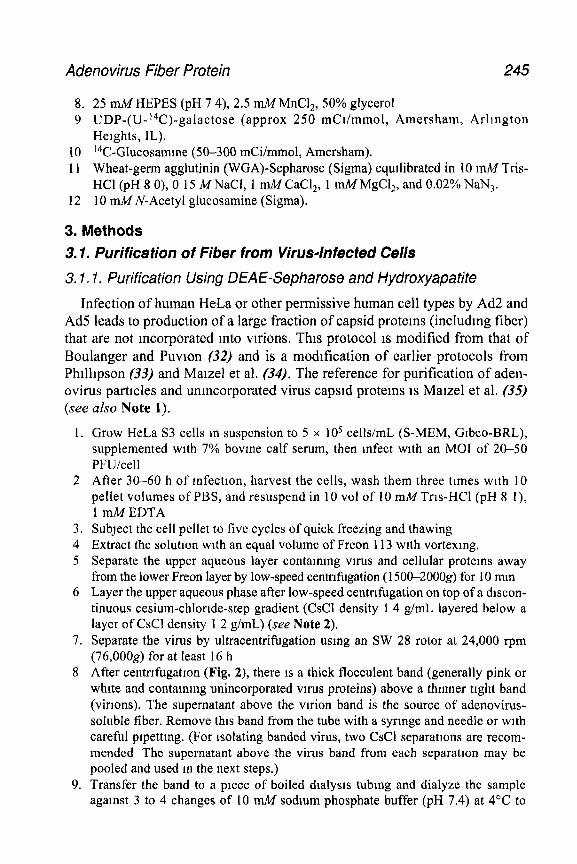
Adenovirus Fiber Protein 245
8. 25 mM HEPES (pH 7 4), 2.5 mM MnCl,, 50% glycerol 9 UDP-(U-r4C)-galactose (approx 250 mCt/mmol, Amersham, Arlmgton
Heights, IL). 10 t4C-Glucosamme (50-300 mCi/mmol, Amersham). 11 Wheat-germ agglutinin (WGA)-Sepharose (Sigma) equilibrated in 10 mA4 Tris-
HCl (pH 8 0), 0 15 MNaCl, 1 mA4 CaCl,, 1 mMMgCI,, and 0.02% NaN,. 12 10 n-&?N-Acetyl glucosamine (Sigma).
3. Methods 3.1. Purification of Fiber from Virus-Infected Cells
3.1.1. Purification Using DEAE-Sepharose and Hydroxyapatite
Infection of human HeLa or other permissive human cell types by Ad2 and Ad5 leads to production of a large fraction of capsid proteins (including fiber) that are not mcorporated mto vtrions. This protocol 1s modified from that of Boulanger and Puvton (32) and is a modtfication of earlier protocols from Phtllipson (33) and Maize1 et al. (34). The reference for purification of aden- ovirus parttcles and unmcorporated virus capsrd proteins 1s Maize1 et al. (35) (see also Note 1).
1. Grow HeLa S3 cells m suspension to 5 x lo5 cells/ml (S-MEM, Gtbco-BRL), supplemented with 7% bovme calf serum, then infect with an MO1 of 20-50 PFU/cell
2 After 30-60 h of infectton, harvest the cells, wash them three times with 10 pellet volumes of PBS, and resuspend in 10 vol of 10 mM Tris-HCI (pH 8 I), 1 mMEDTA
3. Subject the cell pellet to five cycles of quick freezing and thawing 4 Extract the solution wtth an equal volume of Freon 113 with vortexmg. 5 Separate the upper aqueous layer containing vnus and cellular protems away
from the lower Freon layer by low-speed centnmgation (1500-2000g) for 10 mm 6 Layer the upper aqueous phase after low-speed centrtfugation on top of a discon-
tinuous cesium-chlortde-step gradient (CsCI density 1 4 g/mL layered below a layer of CsCl density 1 2 g/mL) (see Note 2).
7. Separate the virus by ultracentrifugation usmg an SW 28 rotor at 24,000 rpm (76,000g) for at least 16 h
8 After centrtfugatton (Fig. 2), there is a thick flocculent band (generally pink or whtte and containing unincorporated vnus proteins) above a thmner ttght band (virions). The supernatant above the vu-ion band is the source of adenovirus- soluble fiber. Remove this band from the tube with a syringe and needle or with careful pipettmg. (For Isolating banded virus, two C&l separations are recom- mended The supernatant above the virus band from each separation may be pooled and used m the next steps.)
9. Transfer the band to a piece of boiled dtalysis tubmg and dialyze the sample agamst 3 to 4 changes of 10 mM sodium phosphate buffer (pH 7.4) at 4°C to
246 Engler, Mulach, and Hong
’ Lipids
\ Low density cytoplasmic components includmg unincorporated viral coat protems
’ Empty Capslds
’ Adenovirus particles
Fig 2 Diagram of expected bands obtamed after centrtfugatton of vu-us lysates to purrfy vrrtons and unmcorporated vrrton proteins, mcludmg fiber. The dense vtrron particle band IS generally observed at the boundary between the 1.2-g/mL and 1.4-g/mL CsCl layers. The diffuse area of virus and cellular proteins 1s generally observed above the 1 2-g/mL CsCl layer.
10.
11 12
13
14.
15.
16
17
18.
19
remove the CsCl from the solutron Each change of buffer should contam l-4 L of solution. Slowly add a saturated solutton of ammonium sulfate at 4°C to a final concentra- tion of 55% ammonium sulfate. Allow the ammonmm sulfate prectpttate to form for 15 h at 4°C and pH 6.5. Spm the precipitate at 500013 for 20 mm at 4°C. Dtssolve the pellet m a minimal amount of 50 mM sodmm phosphate buffer, pH 6.8, at 4°C Dialyze the sample at 4°C agamst 10 volumes of 50 mA4 sodmm phosphate buffer (pH 6.8) over 72 h wrth at least five changes of buffer. After dialysis, centrifuge the solution at 110,OOOg for 2 h This supernatant 1s ready for column purtficatlon or for storage at -20°C (see Note 3) Load the sample onto a DEAE-Sepharose column equilibrated with 50 mM sodmm phosphate buffer, pH 6 8, at 4°C Wash the column with at least 10 column volumes of 50 mM sodium phosphate buffer, pH 6 8, at 4°C. Elute the column with a linear gradient of sodium chlortde (from 0.0 to 0 5 M), m 50 mM sodium phosphate buffer (pH 6.8). Collect fractions and assay for the fractions contaming protein by absorbance at 278 nm Fractions containing fiber are tdentlfied by SDS-PAGE of altquots of frac- ttons on a 10% gel Fractions containing fiber can be tdentrfred by Western blot of the gel, usmg an antrbody specific for fiber (protocol given m Sub- heading 3.3.) Pool the fractrons containing fiber protein and dialyze the pooled fractions against 10 mM potassium phosphate, pH 6.8 (see Note 4)
Adenovirus Fiber Protein 247
20. Load this dialyzed solution onto a hydroxyapatite column equilibrated with 10 mJ4 potassium phosphate buffer, pH 6.8.
21. Wash the column with at least 10 column volumes of buffer. 22. Elute the fiber protein with a linear gradient of 0.01-O 50 M potassium phos-
phate, pH 6 8 23. Collect fractions and test for protein concentration and the presence of fiber as
described m step 18
3.1.2. Alternate Fiber Purification Procedure Using Mono Q and Mono S Chromatography
M. S. Horwitz (personal commumcation) has developed an alternative method for purification of the fiber protein, starting wtth the dialyzed material prepared at the end of the protocol described m Subheading 3.1.1., step 9 This material should be dialyzed against 10 mA4 Tris-HCI (pH 6.6).
I Centrifuge the dialyzed vuus protein sample m an SS-34 rotor (Sorvall, Newtown, CT) at 10,000 rpm (9500g) for 20 min at 4°C to remove msoluble material prior to chromatography.
2. Equilibrate a Mono Q amon-exchange column with 10 mMTris-HCI (pH 6 6) at room temperature
3 Load the dialyzed virus protem sample onto the Mono Q column. 4. Wash the column with 5 mL of 10 ti Tris-HCI (pH 6 6) and then elute the
protein on the column with a 40 mL linear gradient of sodium chloride (@-O 7 IV), followed by 10 mL of 1 0 MNaCl. The flow rate through the column should be 1 mL/min. Collect I -mL fractions and store fractions at 4°C.
5 Check for fractions that contain fiber, usmg SDS-PAGE and Western blottmg, as described in Subheading 3.3. The fiber (approx 50% of the total protem) and other contammatmg protems will elute at approx 150 mM NaCl
6. Pool the fractions that contain fiber and dialyze them against 10 mA4 sodium phosphate buffer, pH 7.0 at 4°C.
7. Equihbrate a Mono S cation-exchange column with 10 mM sodmm phosphate buffer (pH 7 0) at room temperature.
8 Load the dialyzed protein solution onto the Mono S column. 9. Wash the column with 5 mL of 10 n-uV sodium phosphate buffer (pH 7.0) and
then elute the fiber protein with a 35 mL linear gradient of sodmm chloride (O-O.2 M). The flow rate should be 1 mL/min. Collect 1-mL fractions and store at 4’C.
10. The pure fiber protem should elute at approx 60 mA4 NaCl. Check the purity of the protein by SDS-PAGE stamed with Coomassle blue.
3.2. Indirect lmmunofluorescence of Infected Cells
Indirect lmmunofluorescence of infected cells provides one of the most direct means for assessing the expresston of fiber and fiber mutants wlthin Infected cells. With the use of appropriate conformation-specific antibodles,
248 Engler, Mulach, and Hong
information about the ability to form appropriate trrmers inside the infected cell can also be determmed
1. Grow the cells to be infected on cover slips that can be viewed m an appropriate hght microscope. This growth is most easily accomplished by placmg sterile cover slips in the bottom of a 35-mm trssue-culture dash, mto which the cells will be seeded in appropriate medium (DMEM + 5% fetal bovine serum, see Note 5) The cells should be seeded at least 24-36 h prior to mfection, to msure that the infected cells remain attached to the cover shp see Note 6.
2 When 60-80% confluent, infect the cells with adenovu-us (MO1 approx 10) or other recombmant vu-us that expresses fiber
3. After 24-60 h of mfectlon, wash the cells on the cover slip once with phosphate- buffered salme (PBS) and fix them with 3% paraformaldehyde in PBS for 10-l 5 mm at room temperature
4 Wash the cells with Trrs-buffered salme (TBS) or with PBS Do not allow the cells to dry during the procedure
5. Incubate the cells on the cover slip with TBS or PBS contammg 1% Triton X- 100 (TBS-TX or PBS-TX-BSA) to permeabihze the cells for 10 mm at room tem- perature. As an alternative, the cells can be also permeabihzed by treating them with ice-cold methanol for 2 min
6 Block nonspectfic bmdmg with TBS-TX or PBS-TX supplemented with 1% BSA (TBS-TX-BSA or PBS-TX-BSA) in the same buffer for 30 mm at room temperature
7 Incubate the cells wrth a I:100 to 1:500 dtlutron of antrbody (ascites fluid of either 4D2-5 or 2A6-36, the appropriate dilution should be determined experi- mentally) for 1 h at room temperature or 37°C m a humidified chamber Control IgG should be used as a negative control. If you use tissue-culture supernatant taken from hybridoma cells, use it without further dilution (see Note 7)
8 Wash the cells with TBS-TX-BSA or PBS-TX-BSA for 15-30 mm with three changes of buffer.
9 Add an appropriate dilution (approx 1: 100, but the approprrate dilution should be determmed experimentally) of FITC-labeled goat antimouse Ig as a secondary antibody for 1 h at room temperature.
10 The cells on the cover slip are then washed with three changes of TBS-TX-BSA or PBS-TX-BSA (5 min per wash).
11. Optional* If you need to specifically visualize the nucleus, treat the cells with Hoechst 33258 (20 pg/mL rn PBS) for 4 mm at room temperature to stam the nucleus. Rinse the cells on the cover slips briefly with TBS or PBS.
12. Mount the cover slips on slides using mounting medium (see Note 8) Remove any excess mounting medium by absorbing with a small prece of filter paper (the bigger the pore size, the better)
13. Seal the edges of the cover shps wrth nail pohsh Allow the polish to dry thor- oughly before proceedmg further Protect the cover slips from light by covering with aluminum foil while drying.
14 View the infected cells usmg a Nlkon Opttphot mtcroscope equipped for fluores- cent illumination or similar equipment
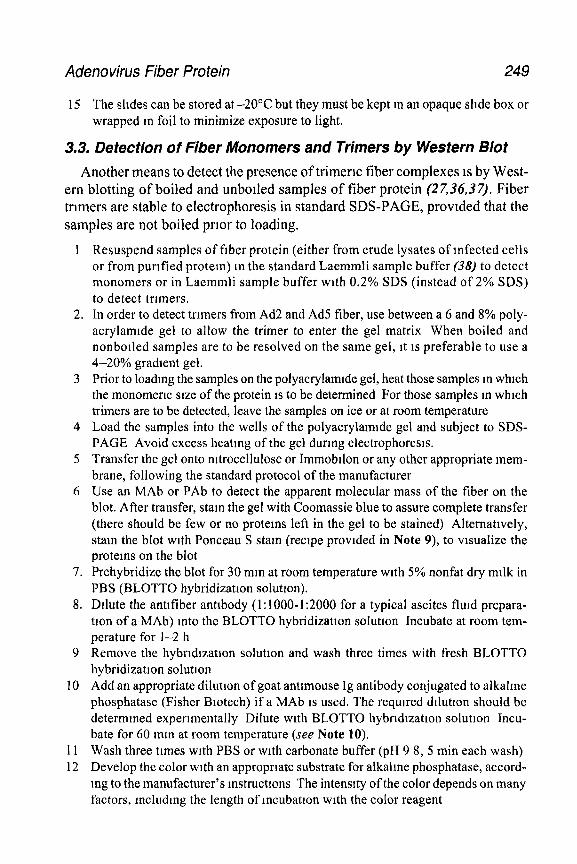
Adenovirus fiber Protein 249
I5 The slides can be stored at -20°C but they must be kept m an opaque shde box or wrapped m foil to minimize exposure to light.
3.3. Defection of Fiber Monomers and Wmers by Western Blot
Another means to detect the presence of trimerlc fiber complexes 1s by West- ern blotting of boiled and unbolled samples of fiber protein (27,36,37). Fiber trlmers are stable to electrophoresis in standard SDS-PAGE, prowded that the samples are not boiled prior to loading.
1
2.
3
7.
8.
9
10
11 12
Resuspend samples of fiber protein (either from crude lysates of mfected cells or from purified protein) m the standard Laemmli sample buffer (38) to detect monomers or in Laemmli sample buffer with 0.2% SDS (instead of 2% SDS) to detect tnmers. In order to detect trlmers from Ad2 and Ad5 fiber, use between a 6 and 8% poly- acrylamlde gel to allow the trimer to enter the gel matrix When boiled and nonbolled samples are to be resolved on the same gel, It IS preferable to use a 4-20% gradlent gel. Prior to loadmg the samples on the polyacrylamlde gel, heat those samples m which the monomeric size of the protein IS to be determined For those samples m which trimers are to be detected, leave the samples on ice or at room temperature Load the samples into the wells of the polyacrylamlde gel and subject to SDS- PAGE Avoid excess heating of the gel durmg electrophoresls. Transfer the gel onto rntrocellulose or Immobllon or any other appropriate mem- brane, following the standard protocol of the manufacturer Use an MAb or PAb to detect the apparent molecular mass of the fiber on the blot. After transfer, stam the gel with Coomassie blue to assure complete transfer (there should be few or no proteins left in the gel to be stained) Alternatively, stain the blot with Ponceau S stam (recipe provided in Note 9), to visualize the proteins on the blot Prehybridize the blot for 30 mm at room temperature with 5% nonfat dry milk in PBS (BLOTTO hybridization solution). Dilute the antifiber antlbody (1:1000-l :2000 for a typical ascites fluld prepara- tlon of a MAb) into the BLOTTO hybridization solution Incubate at room tem- perature for 1-2 h Remove the hybrldlzatlon solullon and wash three times with fresh BLOTTO hybridization solution Add an appropriate dilution of goat antimouse Ig antibody conjugated to alkalme phosphatase (Fisher Blotech) if a MAb 1s used. The required dtlutlon should be determmed experimentally Dilute with BLOTTO hybrldlzatton solution Incu- bate for 60 mm at room temperature (see Note 10). Wash three times with PBS or with carbonate buffer (pH 9 8, 5 min each wash) Develop the color with an appropriate substrate for alkalme phosphatase, accord- mg to the manufacturer’s mstructlons The intensity of the color depends on many factors, mcludmg the length of mcubatlon with the color reagent
250 Engler, Mulach, and Hong
A B 123456 123456
e T2,5-@
-+ M7+
Fig. 3. Western blot of fiber monomers and trimers. Aliquots of cell lysates from Ad2-, Ad5-, and Ad7-infected A549 cells were separated by SDS-PAGE on a 10% gel and blotted onto Immobilon membrane, prior to developing with monoclonal antibody 4D2-5 (A) or 2A6-36 (B). The sizes expected for monomers (M) and trimers (T) of the various molecules are indicated by the arrows. In each panel, the order of the lanes is: lane 1, Ad2 fiber unboiled; lane 2, Ad5 fiber unboiled; lane 3, Ad7 fiber unboiled; lane 4, Ad2 fiber boiled; lane 5, Ad5 fiber boiled; lane 6, Ad7 fiber boiled.
13. Trimers generally run at a molecular mass approx three times larger than that of monomers (see Fig. 3) (see Notes 11 and 12).
3.4. Detection of 0-GlcNAc Addition on Fiber
3.4.1. Detection by RL-a-Antibody Reactivity on Western Blot
The easiest means for detection of 0-GlcNAc on the fiber protein is the use of the MAb, RL-2 (39) as a probe of fiber immobilized on a Western blot. The antibody RL-2 was originally isolated because of its reactivity to nuclear pore proteins that contain O-GlcNAc; this antibody also recognizes the O-GlcNAc on fiber (22).
1. Separate a minimum of l-2 ug of fiber (per lane) by SDS-PAGE on a 10% gel. In crude lysates from infected cells, more protein may have to be loaded per lane in order to detect the fiber present in the extract.
2. Electroblot onto nitrocellulose membrane, Immobilon, or any other appropriate membrane for Western blotting. After transfer, stain the gel with Coomassie blue to ensure complete transfer (there should be few proteins left in the gel to be stained). Alternatively, stain the blot with Ponceau S stain (recipe provided in Note 9) to visualize the proteins on the blot.
Adenovirus Fiber Protein 257
3 Prehybrtdize the blot for 30 mm at room temperature with 5% nonfat dry milk m PBS (BLOTTO hybrtdrzatton solution)
4 Dilute the RL-2 antibody (I* lOOO- 1:2000 for a typical ascites fluid preparation of enzyme) mto the BLOTTO hybridization solution Incubate at room temperature for l-2 h.
5 Remove the hybridization solutron and wash three times wrth fresh BLOTTO hybrtdization solution.
6 Add goat antrmouse Ig antibody ConJugated to alkaline phosphatase (Frsher Brotech) and incubate for 1 h at room temperature (see Note 10)
7. Wash three times with PBS or with carbonate buffer (pH 9.8, 5 mm each wash) 8 Develop the color with an appropriate substrate for alkaline phosphatase, accord-
mg to the manufacturer’s mstructions.
3.4.2. Detection by Labeling of Fiber with 3H-iJDP-Galactose by Bovine Milk Galactosyltransferase
For the best results with this assay, one needs purified fiber protein. Previ- ous work has shown that the O-GlcNAc moieties on fiber are relatively inac- cessible to the enzyme (22) If impure preparations are used, the amount of label added to fiber could be significantly lower, smce many of the possible contaminating proteins may also contain O-GlcNAc that ts more accessible to galactosyltransferase than are the O-GlcNAc moieties on fiber
3 4 2.1. PREGALACTOSYLATION OF THE GALACTOSYLTRANSFERASE ENZYME
1. Prior to the reaction, the enzyme itself must be pretreated with unlabeled UDP- galactose, because the enzyme itself contains significant quantities of O-GlcNAc (40-43). 1.5 mg of bovine mtlk 4/3-galactosyltransferase is added to a I-mL solution that contains 200 mA4 sodmm cacodylate (pH 6.8) and 5 mM MnC12. As an alternative, 50 mM HEPES (pH 7 3-7.5) may be substituted for the cacodylate buffer
2. Add 2 m/k2 unlabeled UDP-galactose, 3.5 pL of a 1:50 dilution of p-mer- captoethanol m H20, and 10 pL aprotmin. The reaction IS carried out for 30 mm on ice, then 60 mm at 37°C
3 Add 5.66 mL of saturated ammonium sulfate solution at 4°C (85% final concen- tration after dtlution) and incubate on ice for 30 min
4 Spin at 10,OOOg for 15 mm m a refrigerated centrifuge. Typically, this centrrfu- gation is performed m an SS-34 rotor (Sorvall)
5. Remove and save the supernatant 6. Resuspend the pellet m 5 mL of 85% ammomum sulfate prechtlled to 4°C. Incu-
bate for 30 min on ice 7 Spm at 10,OOOg for 15 mm m a refrigerated centrifuge. Typically, this centrrfu-
gation IS performed m an SS-34 rotor (Sorvall) 8 Remove and save the supernatant. 9. Resuspend the pellet m 1 mL of 25 mM HEPES (pH 7.4), 2.5 mA4 MnCl,, and
50% glycerol The approximate enzyme activity is 25 mU/mL.
252 Engler, Mulach, and Hong
3.4.2 2. GALACTOSYLATION OF FIBER PROTEIN WITH GALACTOSYLTRANSFERASE
1. In a final volume of 100 pL, resuspend purn‘ied fiber (generally 1.5 pg) m a solu- tion that contains 200 mM sodium cacodylate (pH 6 8), 5 mM MnCI,, and 0 4 ~CI UDP-(U-i4C)-galactose 50 mM HEPES may be substttuted for the cacodylate m the buffer.
2 Add 50 mU of the pretreated 4P-galactosyltransferase to the reaction and incubate for 30 to 120 min at 37°C The ttme depends on how completely the reaction must proceed
3 After the reaction, use tmmunoprectpttatton with an excess of antibody to remove the labeled fiber from the solutton
4. Analyze a portton of the tmmunoprecipitate by SDS-PAGE on a 10% gel. The fiber protein can be visualized by staining with Coomassie blue The band can then be excused from the gel and the amount of 14C label determmed by scm- ttllatton countmg. Alternatively, the gel can be impregnated with EN3HANCE (DuPont) and vtsualtzed by autofluorography for a qualitative result
5. For quantitattve results, two controls must be performed a. After 1 h of reaction, add an addittonal 15-1.18 altquot of purified fiber protein
to the reaction and incubate for an additional 60 mm The number of 14C-cpm mcorporated mto the fiber band should be twice as high, mdtcatmg that the reaction IS linear with time
b. Take an ahquot of the ortgmal reaction at 60 and 120 mm If the reaction has gone to completion, the number of t4C-cpm mcorporated should be very nearly identical
3.4.3. Detection by 14C-Glucosamine Labeling of Adz- or Ad5infected Cells (19,21,44-46)
Another method for detecting O-GlcNAc on fiber IS tn vivo labeling of Ad-Infected cells with 14C-glucosamme. This approach suffers from the expense of the radioactive reagent and that many of the other abundant cellular proteins also contain O-GlcNAc, so that much of the label incorporated 1s found tn proteins not related to fiber.
1. Grow HeLa cells to 5O-70% confluence (on plates) or 5 x lo5 cells/mL (spinner culture) m DMEM supplemented with serum.
2. Infect HeLa cells with Ad2 or Ad5 virus (MO1 10-20). 3 After 12 h of Infection, add 100 @I i4C-glucosamme and label cells for 24 h 4 Remove radioactive medmm and dispose of properly, according to your local
safety regulations 5 Collect infected cells and purify by one of the purificatton methods ltsted above.
Alternatively, the labeled fiber can be tmmunoprectpitated if only a qualitative answer 1s requtred.
3.4.4. Detection by Wheat Germ Agglutinin Agarose Chromatography
Lectin affintty chromatography is also a popular method for detection and identification of carbohydrate modificattons on protein (47). In the case of
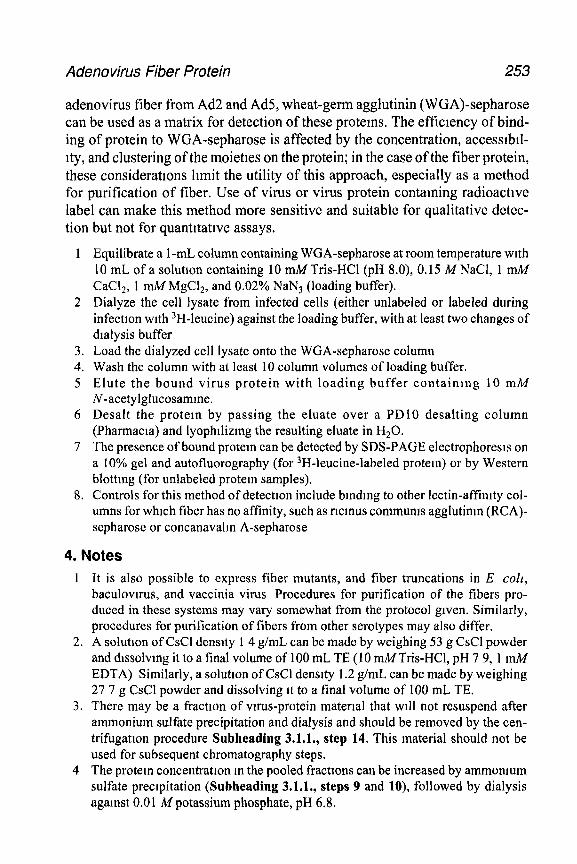
Adeno virus Fiber Protein 253
adenovirus fiber from Ad2 and Ad5, wheat-germ agglutinin (WGA)-sepharose can be used as a matrix for detection of these protems. The efficiency of bind- ing of protein to WGA-sepharose is affected by the concentration, accesslbll- Ity, and clustering of the moieties on the protein; in the case of the fiber protein, these considerattons limit the utility of this approach, especially as a method for purification of fiber. Use of virus or virus protein containing radioactive label can make this method more sensitive and suitable for qualitative detec- tion but not for quantltatlve assays.
1 Equilibrate a 1-mL column containing WGA-sepharose at room temperature with 10 mL of a solution containing 10 mMTris-HCl (pH S.O), 0.15 M NaCl, 1 mM CaCI,, 1 mMMgC12, and 0.02% NaN3 (loading buffer).
2 Dialyze the cell lysate from infected cells (either unlabeled or labeled during infectlon with 3H-leucine) against the loading buffer, with at least two changes of dialysis buffer
3. Load the dialyzed cell lysate onto the WGA-sepharose column 4. Wash the column with at least 10 column volumes of loading buffer. 5 Elute the bound virus protein with loading buffer containing 10 mA4
N-acetylglucosamme, 6 Desalt the protem by passing the eluate over a I’D10 desalting column
(Pharmacla) and lyophllizmg the resulting eluate in H,O. 7 The presence of bound protern can be detected by SDS-PAGE electrophoresls on
a 10% gel and autofluorography (for )H-leucine-labeled protem) or by Western blotting (for unlabeled protem samples).
8. Controls for this method of detectlon include binding to other lectin-affimty col- umns for which fiber has no affinity, such as rtcmus cornmums agglutinm (RCA)- sepharose or concanavalm A-sepharose
4. Notes
1 It is also possible to express fiber mutants, and fiber truncations in E colz, baculovu-us, and vaccinia virus Procedures for purification of the fibers pro- duced in these systems may vary somewhat from the protocol given. Similarly, procedures for purification of fibers from other serotypes may also differ.
2. A solution of CsCl density 1 4 g/mL can be made by weighing 53 g CsCl powder and dlssolvmg it to a final volume of 100 mL TE (10 mMTris-HCl, pH 7 9, 1 mM EDTA) Similarly, a solution of CsCl density 1.2 g/mL can be made by weighing 27 7 g CsCl powder and dissolving It to a final volume of 100 mL TE.
3. There may be a fraction of virus-protein material that ~111 not resuspend after ammonium sulfate precipitation and dialysis and should be removed by the cen- trifugatlon procedure Subheading 3.1.1., step 14. This material should not be used for subsequent chromatography steps.
4 The protem concentration m the pooled fractions can be increased by ammonmm sulfate precipitation (Subheading 3.1.1., steps 9 and lo), followed by dialysis against 0.01 Mpotassium phosphate, pH 6.8.
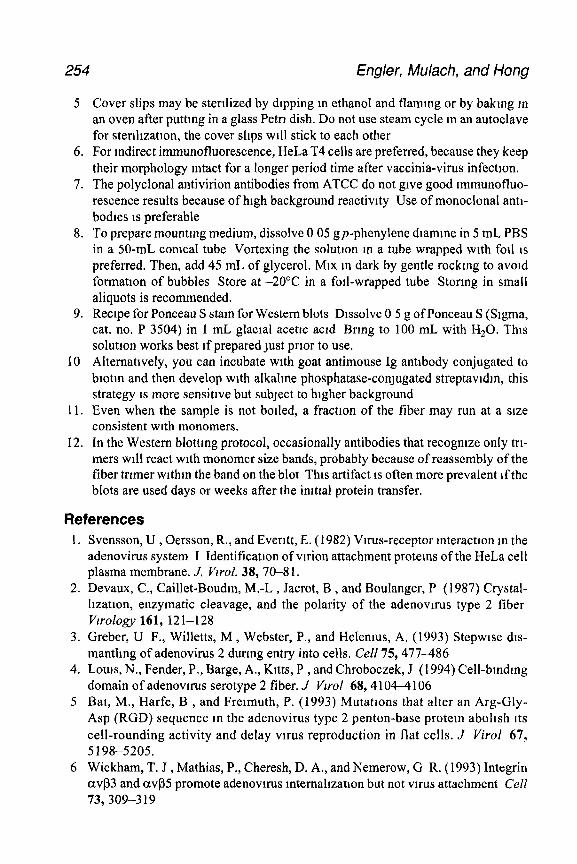
254 Engler, Mulach, and Hong
5 Cover slips may be sterdized by dlpping m ethanol and flaming or by bakmg m an oven after puttmg in a glass Petri dish. Do not use steam cycle m an autoclave for stenllzatlon, the cover slips will stick to each other
6. For indirect immunofluorescence, HeLa T4 cells are preferred, because they keep their morphology intact for a longer period time after vaccinia-virus infection.
7. The polyclonal antivirion antibodies from ATCC do not give good Immunofluo- rescence results because of high background reactivity Use of monoclonal antl- bodies IS preferable
8. To prepare mountmg medium, dissolve 0 05 gp-phenylene dlamme in 5 mL PBS in a 50-mL conical tube Vortexing the solutton m a tube wrapped with foil 1s preferred. Then, add 45 mL of glycerol. Mix m dark by gentle rockmg to avold formation of bubbles Store at -20°C in a foil-wrapped tube Storing in small aliquots is recommended.
9. Recipe for Ponceau S stam for Western blots Dissolve 0 5 g of Ponceau S (Sigma, cat. no. P 3504) in 1 mL glacial acetlc acid Bring to 100 mL with H,O. This solution works best if preparedJust prior to use.
10 Alternatively, you can incubate with goat antimouse Ig antibody conjugated to blotm and then develop with alkaline phosphatase-conJugated streptavldm, this strategy is more sensitive but subJect to higher background
11. Even when the sample is not bolled, a fraction of the fiber may run at a size consistent with monomers.
12. In the Western blottmg protocol, occasionally antibodies that recogmze only tn- mers will react with monomer size bands, probably because of reassembly of the fiber trlmer within the band on the blot This artifact 1s often more prevalent If the blots are used days or weeks after the imtlal protein transfer.
References 1. Svensson, U , Oersson, R., and Ever@ E. (1982) Virus-receptor Interaction m the
adenovirus system I Identification of vlrion attachment proteins of the HeLa cell plasma membrane. J. Vwol. 38, 70-8 1.
2. Devaux, C., Caillet-Boudm, M.-L , Jacrot, B , and Boulanger, P (1987) Crystal- lization, enzymatic cleavage, and the polarity of the adenovlrus type 2 fiber Vzrology 161, 12 l-l 28
3. Greber, U F., Willetts, M , Webster, P., and Helemus, A. (1993) Stepwlse dls- mantlmg of adenovirus 2 during entry into cells. Cell 75477-486
4. Louis, N., Fender, P., Barge, A., Kltts, P , and Chroboczek, J (1994) Cell-binding domain of adenovlrus serotype 2 fiber. J Vwol 68,41044106
5 Bal, M., Harfe, B , and Frelmuth, P. (1993) Mutations that alter an Arg-Gly- Asp (RGD) sequence m the adenovirus type 2 penton-base protein abolish rts cell-rounding activity and delay virus reproduction in flat cells. J Viral 67, 5 198-5205.
6 Wickham, T. J , Mathias, P., Cheresh, D. A., and Nemerow, G R. (1993) Integrin a@3 and a$5 promote adenovlrns mtemahzatlon but not virus attachment Cell 73,309-3 19
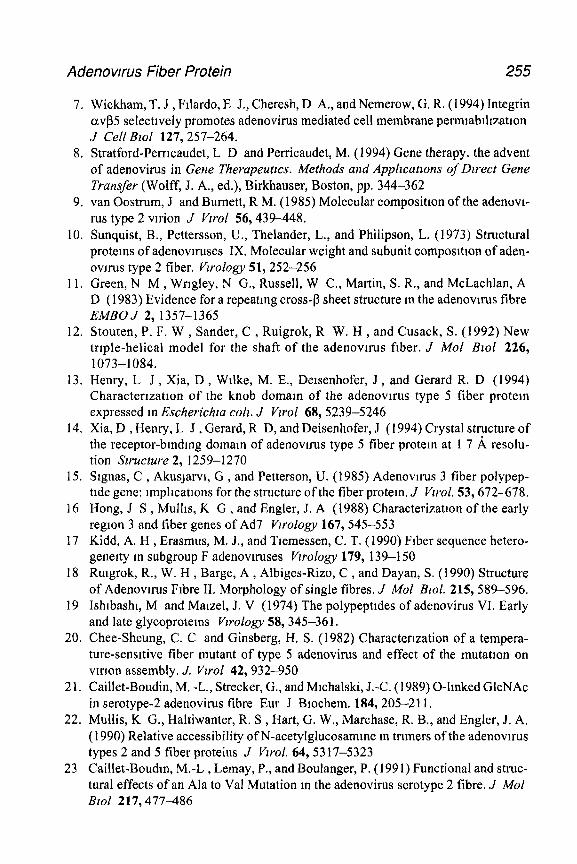
Adenovws Fiber Protein 255
7. Wickham, T. J , Filardo, E J., Cheresh, D A., and Nemerow, G. R. (1994) Integrin avj35 selectively promotes adenovirus mediated cell membrane permrabihzation J Cell Brol 127,257-264.
8. Stratford-Perrrcaudet, L D and Perricaudet, M. (1994) Gene therapy. the advent of adenovirus in Gene Therapeutrcs. Methods and Applxatlons of Dwect Gene Transfer (Wolff, J. A., ed.), Birkhauser, Boston, pp. 344-362
9. van Oostrum, J and Burnett, R M. (1985) Molecular compositton of the adenovi- rus type 2 vrrion J Vu-01 56,439-448.
10. Sunquist, B., Pettersson, U., Thelander, L., and Philipson, L. (1973) Structural proteins of adenovnuses IX. Molecular weight and subunit composmon of aden- ovm.~s type 2 fiber. Vrrology 51,252-256
11. Green, N M , Wrigley, N G,, Russell, W C., Martin, S. R., and McLachlan, A D (1983) Evidence for a repeating cross-p sheet structure m the adenovnus fibre EMBO J 2,1357-1365
12. Stouten, P. F, W , Sander, C , Ruigrok, R W. H , and Cusack, S. (1992) New triple-helical model for the shaft of the adenovuus fiber. J Mol BloE 226, 1073-l 084.
13. Henry, L J , Xia, D , Wilke, M. E., Dersenhofer, J , and Gerard R. D (1994) Characterization of the knob domain of the adenovrrus type 5 fiber protein expressed m Escherichra cob. J Vwol 68,5239-5246
14. Xia, D , Henry, L J , Gerard, R D, and Deisenhofer, J (1994) Crystal structure of the receptor-bmdmg domam of adenovuus type 5 fiber protein at 1 7 A resolu- tion Structure 2, 1259-1270
15. Stgnas, C , AkusJarvi, G , and Petterson, U. (1985) Adenovnus 3 fiber polypep- tide gene: lmplrcations for the structure of the fiber protem. J Vwol. 53,672-678.
16 Hong, J S , Mulhs, K G , and Engler, J. A (1988) Characterization of the early region 3 and fiber genes of Ad7 Vzrology 167,545-553
17 Kidd, A. H , Erasmus, M. J., and Tremessen, C. T. (1990) Fiber sequence hetero- geneity m subgroup F adenovuuses Vzrology 179, 139-150
18 Ruigrok, R., W. H , Barge, A , Albiges-Rizo, C , and Dayan, S. (1990) Structure of Adenovuus Frbre II. Morphology of single fibres. J MOE Blol. 215,589-596.
19 Ishibashl, M and Marzel, J. V (1974) The polypeptides of adenovirus VI. Early and late glycoprotems Vzrology 58,345-36 1.
20. Chee-Sheung, C. C and Ginsberg, H. S. (1982) Characterrzation of a tempera- ture-sensitive fiber mutant of type 5 adenovirus and effect of the mutation on vlrion assembly. J, Vwol 42,932-950
2 1. Caillet-Boudin, M. -L., Strecker, G., and Michalski, J.-C. (1989) O-linked GlcNAc in serotype-2 adenovirus fibre Eur J Blochem. 184,205-211.
22. Mullis, K G., Haltiwanter, R. S , Hart, G. W., Marchase, R. B., and Engler, J. A. (1990) Relative accessibility of N-acetylglucosamme m trimers of the adenovnus types 2 and 5 fiber proteins J Vwol. 64,5317-5323
23 Caillet-Boudm, M.-L , Lemay, P., and Boulanger, P. (1991) Functional and struc- tural effects of an Ala to Val Mutation m the adenovirus serotype 2 fibre. J MOE Blol 217,477-E%
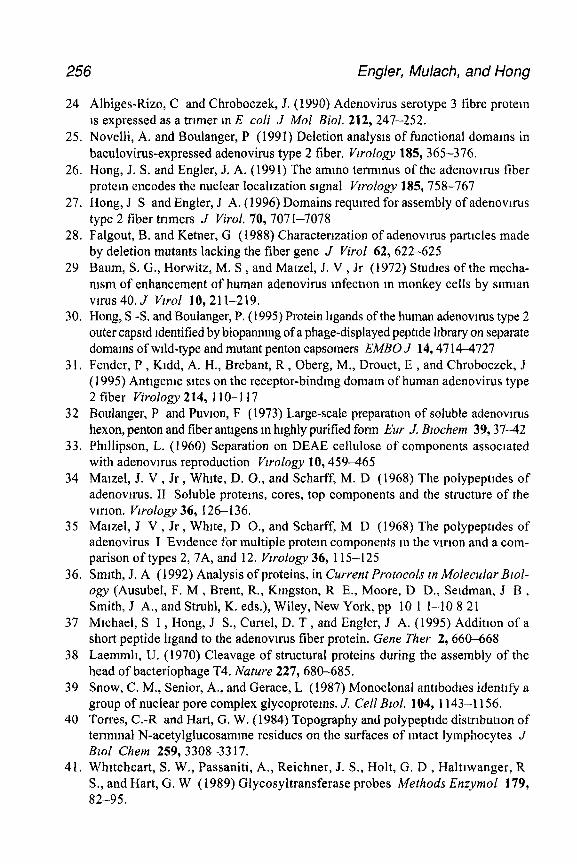
256 Engler, Mulach, and Hong
24 Albiges-Rizo, C and Chroboczek, J. (1990) Adenovirus serotype 3 fibre protem 1s expressed as a trrmer m E coli J Mol Biol. 212,247-252.
25. Novelli, A. and Boulanger, P (1991) Deletion analysis of functional domains in baculovirus-expressed adenovirus type 2 fiber. Vzrology 185,365-376.
26. Hong, J. S. and Engler, J. A. (1991) The ammo termmus of the adenovrrus fiber protein encodes the nuclear localization signal Vzrology 185,758-767
27. Hong, J S and Engler, J A. (1996) Domains requtred for assembly of adenovtrus type 2 fiber trrmers J Viral. 70,7071-7078
28. Falgout, B. and Ketner, G (1988) Characterization of adenovtrus parttcles made by deletion mutants lacking the fiber gene J Virol 62, 622-625
29 Baum, S. G., Horwitz, M. S , and Matzel, J. V , Jr (1972) Studies of the mecha- nism of enhancement of human adenovirus mfectton m monkey cells by stmtan wrus 40. J Vzrol 10, 211-219.
30. Hong, S -S. and Boulanger, P. (1995) Protein bgands of the human adenovnus type 2 outer capsrd identified by biopanmng of a phage-displayed pepttde library on separate domains of wild-type and mutant penton capsomers EMBO J 14,47 14-4727
31. Fender, P , Ktdd, A. H., Brebant, R , Oberg, M., Drouet, E , and Chroboczek, J (1995) Anttgemc sites on the receptor-binding domain of human adenovirus type 2 fiber Virology 214, 110-l 17
32 Boulanger, P and Puvron, F (1973) Large-scale preparation of soluble adenovuus hexon, penton and fiber antigens m highly purified form Eur J, Bzochem 39,37-42
33. Phtllipson, L. (1960) Separation on DEAE cellulose of components associated with adenovn-us reproduction Vwology 10,459-465
34 Matzel, J. V , Jr, Whtte, D. O., and Scharff, M. D (1968) The polypeptldes of adenovtrus. II Soluble proteins, cores, top components and the structure of the vtrion. Vzrology 36, 126-136.
35 Matzel, J V , Jr, White, D O., and Scharff, M D (1968) The polypeptides of adenovirus I Evidence for multiple protein components m the virron and a com- parison of types 2, 7A, and 12. Vwology 36, 115-l 25
36. Smith, J. A (1992) Analysis of proteins, in Current Protocols zn Molecular Blol- ogy (Ausubel, F. M , Brent, R., Kmgston, R E., Moore, D D., Setdman, J B , Smith, J A., and Struhl, K. eds.), Wiley, New York, pp 10 1 l-10 8 21
37 Michael, S I , Hong, J S., Curtel, D. T , and Engler, J A. (1995) Addition of a short peptide hgand to the adenovnus fiber protein. Gene Ther 2,660-668
38 Laemmh, U. (1970) Cleavage of structural proteins during the assembly of the head of bacteriophage T4. Nature 227, 680-685.
39 Snow, C. M., Senior, A., and Gerace, L (1987) Monoclonal antibodres identify a group of nuclear pore complex glycoprotems. J. Ce11 Blol. 104, 1143-l 156.
40 Torres, C.-R and Hart, G. W. (1984) Topography and polypepttde distrtbutron of tern-rural N-acetylglucosamme residues on the surfaces of intact lymphocytes J Blol Chem 259,3308-33 17,
41. Whrteheart, S. W., Passaniti, A., Reichner, J. S., Holt, G. D , Haltiwanger, R S., and Hart, G. W (1989) Glycosyltransferase probes Methods Enzymol 179, 82-95,
Adenovirus fber Protein 257
42. Roquemore, E P , Chou, T. -Y , and Hart, G W. (1994) Detectlon of O-linked N- acetylglucosamme (0-GlcNAc) on cytoplasmlc and nuclear proteins Methods Enzymol. 230,443-4&I.
43 Hayes, B. K. and Hart, G. W. (1996) Analysis of saccharlde structure and function using glycosyltransferases glycoconjugates, m Current Protocols in Molecular &ology (Ausubel, F M., Brent, R., Kingston, R. E., Moore, D. D., Seldman, J. B , Smith, J. A., and Struhl, K. eds.), Wiley, New York, pp. 17.6. l-l 7.6.11.
44 Yurchenco, P D , Ceccarim, C , and Atkinson, P. H. (1978) Labelmg com- plex carbohydrates of animal cells with monosacchandes. Methods Enzymol 50, 175-204
45 Varkl, A (1991) RadioactIve tracer techniques in the sequencing of glycoprotem ohgosaccharldes FASEB J 5,226-235
46. Dlaz, S and Varkl, A (1996) Metabolic radlolabelmg of ammal cell, m Current Protocols zn Molecular Biology (Ausubel, F M., Brent, R., Kingston, R E , Moore, D D., Seldman, J B., Smith, J. A , and Struhl, K. eds.), Wiley, New York, pp. 10 18.1-10 18 9
47. Merkle, R K and Cummmgs, R D. (1987) Lectm affinity chromatography of glycopeptides Methods Enzymol. 138,232-259

21
Large-Scale Purification and Crystallization of Adenovirus Hexon
John J. Rux, Donatelia Pascolini, and Roger M. Burnett
1. Introduction Adenovirus, shortly after its discovery in 1953 (I), was one of the first bio-
logical entities to be imaged using the electron microscope (EM) (2). Since then, It has been under continuous scrutiny by structural btologtsts (reviewed m ref. 3). The characteristic shape of the adenovu-us virion, with its projecting fibers, made it a fascinating object for early EM studies, which focused on how its >lO structural proteins are organized to form the vnton. The size of the vu-ion, with a diameter of 9 14 A at the fivefold verttces (4) and a mass of over 150 x 1 O6 Dalton, presents a formidable challenge for X-ray crystallographic studies.
An alternative approach to determining the virion structure was facilitated by the property that cells infected with adenovu-us contain a lo- to 1 OO-fold excess of most structural proteins in soluble form over those incorporated into virions (s), which permits the isolation of these proteins for structural studies. The major coat protein, hexon, was the first animal-virus protein to be crystal- lized (6), and its three-dimensional structure has since been determined m pro- gressively increasing detail (7-9) As hexon represents >60% of the total particle weight (IO), its initial low-resolution structure could be used to develop a model for the adenovirus capsid (11). Further studres using cryo-electron microscopy and image reconstruction (4) revealed the complete virion to 35 A resolution. Subsequent work combined the crystallographic and EM images and revealed details of the minor proteins (12).
In this chapter, we describe a protocol for the large-scale purification for virions of adenovrrus type 2 (Ad2) and Ad5 and the soluble major coat protein, hexon. The virus particles can be used as seed stock for further rounds of infec-
From Methods m Molecular Medune, Vol 21. Adenovws Methods and Protocols Edlted by W S M Wold 0 Humana Press Inc , Totowa, NJ
259
260 Rux, Pascolini, and Burnett
tion, for EM studies on the intact particle or its fragments (13) or m gene therapy mvestlgatlons (14). The hexon may be used to produce crystals sult- able for high-resolution X-ray crystallographic studres, as described here. An extension of this protocol to other adenovn-us types depends on the ease of viral growth and the quantity of soluble hexon found m the infected cell Sev- eral members of subgroup C (types 1,2, 5, and 6) have been crystallized from soluble protein (15-17), but the fastidious subgroup F vu-uses (types 40 and 41), which grow only in 293 cells, yield little hexon (28). Structural studies on other structural proteins such as the fiber (19), its receptor-bmdmg knob (20), and the complete penton (22), which are present in low quantities m the infected cell, are being faclhtated by expression systems. It may be difficult to extend these to hexon, which has a complicated foldmg pathway requiring the pres- ence of the adenovn-us-coded nonstructural 1 00-kDa protem (22).
The hexon purlficatlon scheme using amon-exchange chromatography has been developed in our laboratory over several years and 1s based upon a variety of other pubhshed protocols (23-28), as well as our own experience. The pro- tocol has been optimized to provide the large amount of protein required for structural studies m as short a time as possible. Once preparations have been made, the procedure requires approx 1 wk to obtain between 10-20 mg of purified hexon (see Note 1).
2. Materials
The materials listed are those routmely used to perform the adenovirus hexon purification protocol. Substltutlons could be made with equivalent items as available.
2.1. Cells and Virus
Human Ad2 and Ad5 are routinely propagated m suspension cultures of HeLa S3 cells as described; Ad2 (ATCC VR-846) and Ad5 (ATCC VR-5) and HeLa S3 cells (ATCC CCL 2.2) are available from the American Type Culture Collection (ATCC, Rockvllle, MD).
2.2. Stock Solutions
All stock-buffer solutions are filtered through 0.22-p bottle-top filters (Corning, Corning, NY, cat. no. 25960-33).
1 Jokhk’s solution (20 L): 2x (10 L) minimal essential medium (S-MEM) powder (Joklik-modified) (Gibco-BRL, Galthersburg, MD, cat no 22300-107), 40 g NaHC03 (Sigma, St. LOUIS, MO), 20 L dlstllled/delomzed water Dissolve pow- der m the water; filter through 0 2-w culture capsule (Gelmin, Ann Arbor, MI) to sterihze Store in 500-mL bottles m the dark at 4°C (stable for at least 6 mo) Warm to room temperature before use (see Note 2)
Hexon Purification and Crys tallizatlon 261
2 Complete media (545.5 mL): 500 mL Joklik’s solution, 40 mL horse serum (Hyclone, Logan, UT, cat. no A-33 1 I-L), 5 mL 200 mM L-Glutamme (J. R H Biosciences, Lenexa, KS, 59-20277), 0.5 mL (50 mg/mL) gentamlcm sulfate (Whlttaker Bloproducts, cat no. 17-5182). Make fresh as needed, keep solution sterile and in the dark at room temperature.
3. Incomplete media Same as complete media without the horse serum. 4 Tris-NaCl (500 mL): 20 mMTris-HCl, pH 8.1, 0.5 MNaCl (Sigma) 5. PBS (500 mL)* Phosphate-buffered salme (Sigma). 6 Tris-CsCl(2x 100 mL)* To 100 mL 20 mMTris-HCl, pH 8.1, add 58.84 g CsCI
(Sigma) to obtain a density of 1.435 (solution refractive index 1 3750) and to another 100 mL 20 mMTns-HCl, pH 8.1, add 45.42 g CsCl to obtain a density of 1.336 (solution refractive mdex 1 3657).
7 BTP (7 L) 10 mMBzs-Trzs-propane, pH 7.0 (U S. Blochemlcal, Cleveland, OH) 8 BTP-NaCl(2 L)* 10 mMBis-Tns-propane, pH 7 0, 0.1 MNaCl (Sigma) 9. Hexon storage buffer (100 mL). 10 mMsodmm phosphate, pH 7 0,O 02% sodmm
azlde (Sigma) 10 Crystalllzatlon buffer (500 mL)* 1 A4 sodium citrate, pH 3 20 (Sigma) (see
Note 3). 11. Leupeptm (1 mL). 2 mg leupeptm (Sigma) m water, store at -20°C Make freshly
for each preparation 12 Pepstatm (1 mL) 1 mg pepstatm (Sigma) m 1 mL (200 proof) ethanol; store at
-20°C. Make freshly for each preparation. 13. PMSF (1 mL). 17 mg phenylmethylsulfonyl fluoride (Sigma) m 1 mL (200 proof)
ethanol, store at -20°C Make freshly for each preparation. Cautzon. Both the powder and solution are highly toxic, gloves are required
14. Trypan blue stain 0 4% (100 mL) (Glbco-BRL) Store at 25°C. 15 Virus assay buffer. 20 mM sodium phosphate, pH 7.2 (Sigma), 0.5% SDS (Blo-
Rad, Hercules, CA) 16. DMSO* dimethylsulfoxlde (Sigma). 17 Freon: 1,l ,ZTnchloro-1,2,2-tnfluoroethane, Cl,FCCC& (Mallinckrodt, Phillipsburg, NJ) 18 High-vacuum grease (Fisher, Pittsburgh, PA) 19. Dlsmfectant cleaning solution. Amphyl (Spectrum Chemical, Houston, TX).
2.3. Equipment
1. Spinner flasks. 2 x 50 mL, 100 mL, 250 mL, 500 mL, 1 L, 3 L (Belco, Vmeland, NJ) 2. Conical-bottom centrifuge bottles: 4 x 750-mL (Belco) 3 37’C COz-incubator, or warm room (see Note 4), two heavy-duty magnetic stir
plates (Bell Stir, Belco) 4. Lammar flow hood. 5 Hemacytometer with improved Neubauer ruling (Fisher); sterile-disposable I -mL
plpets, and microscope. 6. Eppendorf plpetteman pipets: lOOO-, loo-, and lo-@ tips. 7 Dlsposablesn I- and 5-mL syringes (Beckton and Dickinson, Rutherford, NJ),
50-mL tubes (Falcon, Los Angeles, CA); 0.45~pm syringe filters, Centrlprep PM
262 Rux, Pascolini, and Burnett
10 microconcentrators (Amicon, Danvers, MA); 24-well tissue-culture plates (Flow Laboratories, McLean, VA); 22-mm s111conized cover slips (Hampton Research, Laguna Hills, CA).
8. Refractometer (Fisher). 9 SW28 swinging-bucket and T1-50 ulracentrlfuge rotors, Ultra-Clear and Quick-
Seal centrifuge tubes, Quick-Seal tube sealer (Beckman, Fullerton, CA) 10. Spectra/Pov Dialysis membrane, molecular-weight cutoff 50,000 (Spectrum
Chemical, cat no 132 130). 11. Chromatography. FPLC apparatus, DEAE-Sephadex Fast Flow packed media
(100 mL) packed 1n HR 16/50 column; Mono-Q lO/lO Column (Pharmacla, Uppsala, Sweden)
12 Electrophoresls: PhastSystem, 7 5% homogeneous SDS-PAGE gels, 8/l appllca- tors, Silver Stain K1t (Pharmacla)
3. Methods 3.1. Preparations for Hexon Purification
3.1.1. Prepare Solutions
The Jokllk’s solution and complete media, which are required for HeLa cell culture, should be prepared first. To test the sterility of the Jokhk’s solution, it is prepared at least 2 wk in advance and closely examined to make sure the solution remains clear. If the solution 1s cloudy or contains suspended partlcu- lates, 1t is contaminated and must be discarded. The remaining solutions may be prepared after the HeLa cell culture is underway. The density of the Tris- CsCl solutions should be checked by measuring their refractive indices, and adding either distilled/deionized water or CsCl to the solutions as necessary to obtain the correct values.
3.1.2. HeLa Cell Culture
A starting culture of S3 HeLa cells must be obtained from either ATCC or another laboratory. The cells are then maintained 1n a suspension culture as described below (see Notes 4-9). All work with cells is done m the laminar flow hood to maintain sterile conditions (see Note 6). If the cell culture becomes contaminated, it must be discarded and another culture started.
1. Thoroughly clean and autoclave the spinner flasks, letting them cool to room temperature.
2 If a starter culture IS available 1n suspension, skip steps 3-6 3 Warm a 500-mL bottle of complete media 1n a 37°C water bath 4 Thaw the frozen cells 1n a 37°C water bath for 1 min. 5. Within the lamlnar flow hood, transfer cells to a sterile 15-mL tube and add
warm complete media dropwise over a period of 10 mln, slowly bring the volume up to 15 mL
Hexon Purification and Crystallization 263
6
7
8
9.
10
11
12
Sediment the cells at 1OOOg for 10 min, decant off media, add fresh complete media, and resuspend cells by gently and repeatedly drawing the solution mto a sterile 25-mL plpet and releasmg. Sufficient volume IS needed to cover the stir- bar m the spinner flask (e.g., 25-mL culture for a 50-mL spinner flask, or 40 mL for a lOO-mL spinner flask) to keep the cells growing well Remove a l.O-mL fraction from the culture and count the number of cells (see Notes 7-9) AdJust the cell concentration to 2-5 x lo5 cells/ml, cells can be sedimented at 1 OOOg for 10 min and excess media decanted If necessary. Log-phase HeLa cells have a doubling time of 24 h The suspension culture must be split regularly to mamtam a cell concentratton of 2-10 x lo5 cells/ml. Cells are split every 2-3 d by discarding a portion of the culture and replacing the discarded volume with complete media. It is easier and less expensive to maintain a small volume of cells in suspension, and to scale up only when necessary. To scale up the cell-culture volume, do not split the culture, but increase its volume with fresh complete media to bring the cell concentration to 2-5 x IO5 cells/ml. Begin to scale up the volume of the suspension culture from approx 100 mL to 2 5 L 5-6 d before the cells are to be mfected For long-term storage, the cells can be concentrated to 10’ cells/ml, frozen over- night at -70°C m a mixture of 50% Jokllk solution, 40% horse serum, 10% DMSO, then stored under liquid nitrogen.
3.1.3. Assay of Virus Stock
The titer of the virus stock is conveniently estimated with a spectrophoto- metric assay, which 1s based on the absorbance of light at a wavelength of 260 nm (A 260nm). Using a viral plaque assay, Challberg and Ketner (29) determined the appropriate conversion factor (3.5 x lo9 PFU/mL). To estimate the virus titer, add 10 & purified vn-us stock to 990 pL virus assay buffer m a quartz cuvet and measure the absorbance.
Virus titer (PFU/mL) = A260nm x 100 (dilution factor) x 3 5 x log PFU/mL
3.1.4 Chromatography
Column chromatography is conveniently performed using a Pharmacla FPLC within a chromatography refrigerator. The chromatography solvents, columns, and samples are kept at 4°C. The DEAE column must first be packed Then, both the DEAE and Mono-Q columns must be equilibrated with column buffer by flushing with five column volumes of 10 mM BTP (pH 7.0) before use. If an automated system like the FPLC is to be used, methods for sample loading, column flushing, and elution should be programmed before starting (see Note 10). These methods can be quickly modified (e.g., based on sample volume) as necessary Just before use.
264 Rux, Pascolm, and Burnett
3.2. lnfecfion of Cells with Adenovirus
Before mfectmg the cells with adenovu-us, the cells must be removed from the complete media containing horse serum, washed, and re-suspended into mcomplete media. This prevents and interaction of serum proteins with the virus. After the cells have been infected durmg the mcubatlon step, they are returned to complete media.
1 Place the 3 O-L spinner flask containing the 2 5-L HeLa cell culture into the laml- nar flow hood. Remove 1 mL culture. Count the number of cells (see Note 9).
2 Pour the 2.5-L culture mto the four sterile glass 750-mL centrifuge bottles, close 3-L stir flask to maintain sterile conditions.
3 Balance the solution levels m the centrifuge bottles with a sterile 25-mL plpet. 4. Sediment the cells at 1OOOg for 10 min. 5. Calculate the amount of virus needed to infect at 10 PFU per cell 6. Decant the supernatant media back into the 3-L spinner flask under sterile condi-
tions (see Note 11) 7 Wash cell pellets with incomplete media* Add 25 mL mcomplete media, mix
cells by swlrlmg and gently draw the cell suspension up and down twice with a 25-mL pipet.
8. Rinse the sterile 250-mL spinner flask with incomplete media. 9. Plpet cells into the rinsed 250-mL spinner flask, rinse centrifuge bottles with
25 mL mcomplete media, add rmse to spinner flask, and adjust the final volume to 250 mL with incomplete media.
10. Remove vu-us stock from freezer; place m laminar flow hood 11. Use lOOO-& pipetman sterilized with ethanol to add virus mto the 250-mL
cell culture 12. Incubate 250-mL spinner flask at 37°C for 1 h 13 Place virus-contaminated vials, tips, and so on, into a beaker containing
disinfectant. 14 After 1 -h mcubatlon, pour Infected cells back into the 3-L spinner flask contam-
ing the complete media from step 6. 15. Incubate the cells in a 3L spinner culture for 40 h at 37°C
3.3. Harvest of Cells, Virus, and Proteins
All further steps m the purlfkatlon protocol are carried out at 4°C. The cells are harvested, washed, and resuspended m a basic buffer solution before they are disrupted. The basic pH of the buffer and the addition of inhibitors reduce the activity of cellular proteases. Lipids are extracted from the soluble fraction, and then the soluble antigens (including hexon) are separated from the virus particles on a CsCl cushion.
1. Isolate infected cells by centritigatlon as described above (Subheading 3.2., steps 2-3).
2. Place contaminated glass pipets into 250-mL cylinder containing disinfectant
Hexon Purification and Crystallization 265
3. Decant media mto a large spinner flask, leaving enough media to cover 80% of the conical bottom of the four 750-mL centrifuge bottles,
4. Mix the cells and media remaining in the bottles by slowly swu-lmg the solutton. Gently draw the cells up and down with a 25-mL pipet to fully resuspend the cells without breaking them.
5 Transfer the cell suspension to 50-mL Falcon tubes on Ice (three tubes with approx 30 ml/tube).
6. Rinse bottles sequentially with 20 mL media from the 3-L spinner flask, and divide the 20-mL rmse mto the three Falcon tubes.
7. Sediment the cells at 1OOOg for 10 min. 8. Aspirate the supernatant mto a flask containing dtsmfectant. 9 Resuspend the cells mto cold PBS with a 25-mL pipet. Use 10 mL PBS per 1 L of
initial culture volume (e.g., 25 mL PBS for 2.5-L culture). 10 Sediment the cells at 1OOOg for 10 mm at 4°C. 11 Aspirate the supernatant into a flask containing disinfectant 12 Resuspend the cells into cold 20 n-uVTris-HCl + 0 5 MNaCl with a 25-mL ptpet
Use 10 mL Trts-NaCl/l L of mtttal culture volume. 13 Add protease mhibitors. 50 pL leupeptm, 100 pL pepstatin, 100 pL PMSF, per
100 mL of cell suspension 14 Lyse cells by repeatmg five freeze-thaw cycles.
a Freeze cell suspension m an ethanol dry-ice bath for 45 mm b Thaw cells in lOOO-mL beaker of warm water, mix the cell suspension by
swirling the Falcon tubes m the warm water bath c Forcibly pipet the cell suspension up and down 20X with a 25-mL pipet for
each tube to help break up cells and debris. If the color of the solution begins to turn brown, add more Tris-NaCl buffer to each tube to keep the solution basic. After freezmg cells for the fifth time, the solutton can be stored frozen at -20°C overnight
15. Sediment cell debris. a Finish the fifth freeze-thaw cycle. b. Pellet the DNA by centrifugatton at 3000g for 10 mm
16. Decant supernatant mto three new Falcon tubes, store on Ice. 17. Resuspend DNA pellets m 10 mL Tris-NaCl buffer. 18. Pellet DNA by centrtfugation at 3000g for 10 mm. 19 Combme supernatants, mtx them by pouring solutton from tube to tube, and
divide solutton into four tubes of approx 15 mL each. 20. Add 15 mL Freon to each tube, cap tubes tightly, and seal them with paratilm. 2 1 Shake tubes vigorously by hand for 5 mm each. 22. Separate the organic from the aqueous phase by centrtfugation at 2000g for
10 mm. 23. Pipet off the top layer (aqueous phase) and place it m two new Falcon tubes 24. Re-extract the organic phase with an additional 2 mL Tris-NaCl buffer, and com-
bine with the aqueous layer from the previous extraction 25 Cool the ultracentrifuge and the SW-28 rotor to 5°C.
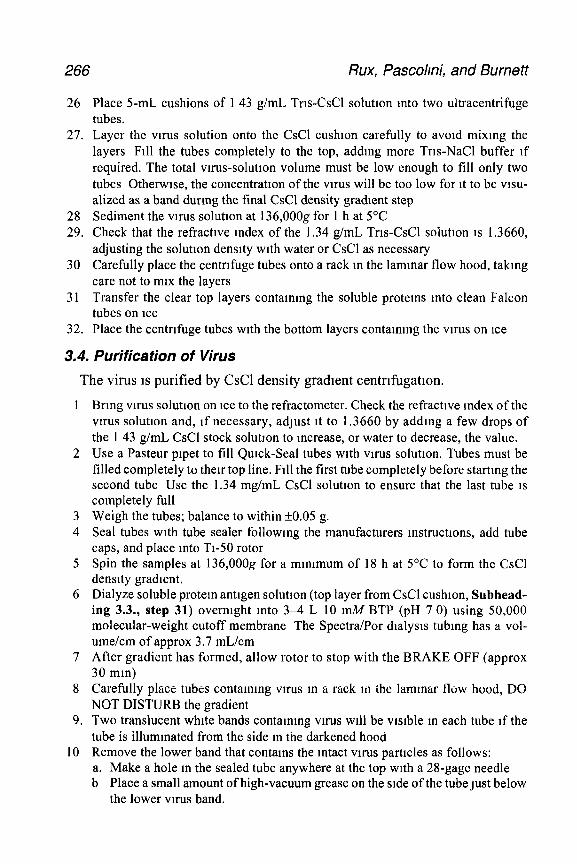
266 Rux, Pascoimi, and Burnett
26 Place 5-mL cushions of 1 43 g/mL Trrs-CsCl solutton mto two ultracentrifuge tubes.
27. Layer the vu-us solution onto the CsCl cushion carefully to avoid mixing the layers F111 the tubes completely to the top, adding more Trts-NaCl buffer If required. The total vuus-solution volume must be low enough to fill only two tubes Otherwise, the concentratron of the vu-us will be too low for rt to be VISU- alized as a band durmg the final CsCl density gradient step
28 Sediment the vtrus solutton at 136,000g for 1 h at 5°C 29. Check that the refractive index of the 1.34 g/mL Trts-CsCl solutton 1s 1.3660,
adjusting the solutton density with water or CsCl as necessary 30 Carefully place the centrifuge tubes onto a rack m the lammar flow hood, taking
care not to mrx the layers 31 Transfer the clear top layers contammg the soluble proteins mto clean Falcon
tubes on ice 32. Place the centrifuge tubes with the bottom layers contammg the vu-us on ice
3.4. Purification of Virus
The virus IS purified by CsCl density gradient centnfugatlon.
1
2
7
8
9.
10
Bring vu-us solutton on tee to the refractometer. Check the refractive index of the vnus solution and, tf necessary, adjust it to 1.3660 by adding a few drops of the 1 43 g/mL CsCl stock solution to increase, or water to decrease, the value. Use a Pasteur ptpet to till Quick-Seal tubes with vu-us solutron. Tubes must be filled completely to then top line. Fill the first tube completely before starting the second tube Use the 1.34 mg/mL CsCl solution to ensure that the last tube is completely full Weigh the tubes; balance to within +0.05 g. Seal tubes with tube sealer followmg the manufacturers mstructtons, add tube caps, and place mto TI-50 rotor Spin the samples at 136,000g for a muumum of 18 h at 5°C to form the CsCl density gradient. Dialyze soluble protein antigen solutton (top layer from CsCl cushion, Suhhead- ing 3.3., step 31) overnight mto 34 L 10 mM BTP (pH 7 0) using 50,000 molecular-weight cutoff membrane The Spectra/Par dtalysis tubing has a vol- ume/cm of approx 3.7 mL/cm After gradient has formed, allow rotor to stop with the BRAKE OFF (approx 30 mm) Carefully place tubes contammg vu-us m a rack m the lammar flow hood, DO NOT DISTURB the gradient Two translucent white bands containing vn-us will be vtstble m each tube If the tube is illuminated from the side m the darkened hood Remove the lower band that contams the intact virus parttcles as follows: a. Make a hole m the sealed tube anywhere at the top with a 28-gage needle b Place a small amount of high-vacuum grease on the side of the tube just below
the lower vu-us band.
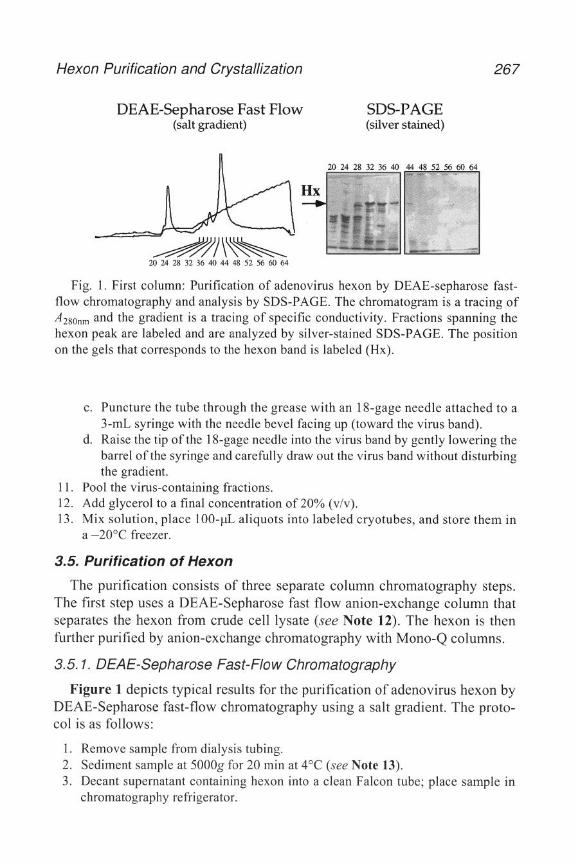
Hexon Purification and Crystallization 267
DEAE-Sepharose Fast Flow (salt gradient)
SDS-PAGE (silver stained)
20 24 28 32 36 40 44 48 52 56 60 64
Fig. 1. First column: Purification of adenovirus hexon by DEAE-sepharose fast- flow chromatography and analysis by SDS-PAGE. The chromatogram is a tracing of A 280nm and the gradient is a tracing of specific conductivity. Fractions spanning the hexon peak are labeled and are analyzed by silver-stained SDS-PAGE. The position on the gels that corresponds to the hexon band is labeled (Hx).
c. Puncture the tube through the grease with an 18-gage needle attached to a 3-mL syringe with the needle bevel facing up (toward the virus band).
d. Raise the tip of the 1 S-gage needle into the virus band by gently lowering the barrel of the syringe and carefully draw out the virus band without disturbing the gradient.
11. Pool the virus-containing fractions. 12. Add glycerol to a final concentration of 20% (v/v). 13. Mix solution, place lOO-uL aliquots into labeled cryotubes, and store them in
a -20°C freezer.
3.5. Purification of Hexon
The purification consists of three separate column chromatography steps. The first step uses a DEAE-Sepharose fast flow anion-exchange column that separates the hexon from crude cell lysate (see Note 12). The hexon is then further purified by anion-exchange chromatography with Mono-Q columns.
3.5.1. DEAE-Sepharose Fast-Flow Chromatography
Figure 1 depicts typical results for the purification of adenovirus hexon by DEAE-Sepharose fast-flow chromatography using a salt gradient. The proto- col is as follows:
1. Remove sample from dialysis tubing. 2. Sediment sample at 5000g for 20 min at 4°C (see Note 13). 3. Decant supernatant containing hexon into a clean Falcon tube; place sample in
chromatography refrigerator.
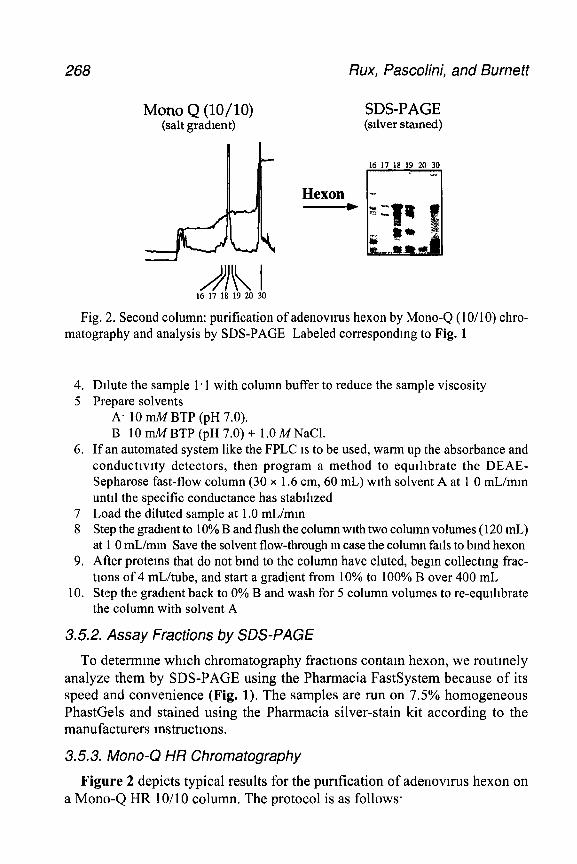
268 Rux, Pascolini, and Burnett
Mono Q (lo/lo) (salt gradient)
SDS-PAGE (silver stained)
A 16 17 18 19 20 30
/II\\ I 16 17 18 19 20 30
Fig. 2. Second column: purification of adenovnus hexon by Mono-Q (lo/lo) chro- matography and analysis by SDS-PAGE Labeled correspondmg to Fig. 1
4. Dilute the sample 1.1 with column buffer to reduce the sample viscosity 5 Prepare solvents
A* 10 m/V BTP (pH 7.0). B 10 & BTP (pH 7.0) + 1 .O MNaCI.
6. If an automated system like the FPLC IS to be used, warm up the absorbance and conductlvlty detectors, then program a method to equlhbrate the DEAE- Sepharose fast-flow column (30 x 1.6 cm, 60 mL) with solvent A at 1 0 mL/mm until the specific conductance has stabilized
7 Load the diluted sample at 1 .O mL/mm 8 Step the gradient to 10% B and flush the column with two column volumes (120 mL)
at 1 0 mL/mm Save the solvent flow-through m case the column falls to bmd hexon 9. After proteins that do not bmd to the column have eluted, begin collectmg frac-
tions of 4 ml/tube, and start a gradient from 10% to 100% B over 400 mL 10. Step the gradient back to 0% B and wash for 5 column volumes to re-equilibrate
the column with solvent A
3.5.2. Assay Fractions by SDS-PAGE
To determine which chromatography fractions contam hexon, we routinely analyze them by SDS-PAGE using the Pharmacia FastSystem because of its speed and convenience (Fig. 1). The samples are run on 7.5% homogeneous PhastGels and stained using the Pharmacia silver-stain kit according to the manufacturers instructions.
3.5.3. Mono-Q HR Chromatography
Figure 2 depicts typical results for the purification of adenovlrus hexon on a Mono-Q HR lO/lO column. The protocol is as follows.
Hexon Purification and Crystall/zation 269
2
3
4
5 6
7 8. 9
10
11
Etther pool and dialyze the fractions contaming hexon, as described above (Subhead- ing 3.4., step 6) or concentrate the protein and exchange its buffer as described below. a. Place up to 15 mL of the fractions into a Centriprep PM 10; add the fractions
contammg the least amount of hexon first. b Spm at 3000g for 30 mm at 4°C c Collect the filtrate, add more fractions, repeat the concentration, and sample
addition cycle until the sample volume is less than 15 mL Dilute the sample 1.1 with 10 mM BTP (pH 7.0) to reduce Its tome strength and viscosity. Prepare solvents:
A. lOmMBTP(pH70). B: 10 mA4BTP (pH 7.0) + 1 OMNaCl
If an automated system like the FPLC is to be used, program a method to equili- brate the Mono-Q column (10 x 1 .O cm, 8 mL) with solvent A at 2.0 mL/min until the specific conductance has stabilized. Load the diluted sample at 2 0 mL/min Flush the column with 30 mL solvent A at 2.0 mL/mm Save the solvent flow- through m case the column fails to bmd hexon Step the gradient to 25% B; flush the column with 30 mL at 2 0 mL/mm Begin to collect fractions of4 ml/tube, and start,a gradient from 25 to 40% B over 50 mL Hold the gradient at 40% B for 12 min (24 mL), step to 100% B, and flush col- umn with 8 mL Step the gradient back to 0% B, and wash with 5 column volumes to re-equih- brate the column with solvent A. Assay the fractions by SDS-PAGE as before (Subheading 3.5.2.).
After anion-exchange chromatography with the Mono-Q (1 O/l 0) column, the hexon-containing fractions may still be contaminated with significant amounts of other proteins, as judged by SDS-PAGE analysis. If further punfi- cation is required, the Mono-Q chromatography step can be repeated with a smaller Mono-Q column as shown in Fig. 3 (see Note 14).
3.5.4. Concentration of Hexon and Buffer Exchange
1. In preparation for crystallization trials, the purified protem must be concentrated and exchanged into the hexon-storage buffer. Concentrate the hexon fractions containing the least amount of hexon first. Add the hexon fractions to Centricon PM- 10 microconcentrators, with up to 2 5 mL per concentrator.
2. Spin at 3000g for 30 mm at 4°C 3 Collect and save the filtrate, add more sample to concentrators, repeat the con-
centration and sample addition cycle until the total volume is small enough to fit into a single concentrator (2.5 mL).
4 Combme the concentrated samples into a single concentrator, carefully rinse the previously used concentrators with a small amount of storage buffer, combine the rinse with the concentrated hexon sample, and continue to concentrate
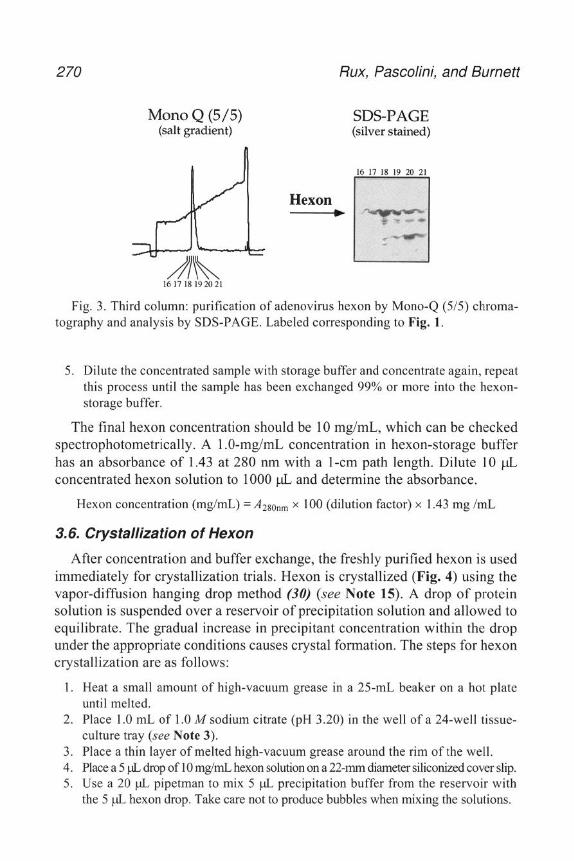
270 Rux, Pascolini, and Burnett
Mono Q (5/5) (salt gradient)
SDS-PAGE (silver stained)
16 17 18 192021
16 17 18 19 20 21
Fig. 3. Third column: purification of adenovirus hexon by Mono-Q (5/5) chroma- tography and analysis by SDS-PAGE. Labeled corresponding to Fig. 1.
5. Dilute the concentrated sample with storage buffer and concentrate again, repeat this process until the sample has been exchanged 99% or more into the hexon- storage buffer.
The final hexon concentration should be 10 mg/mL, which can be checked spectrophotometrically. A 1 .O-mg/mL concentration in hexon-storage buffer has an absorbance of 1.43 at 280 nm with a l-cm path length. Dilute 10 & concentrated hexon solution to 1000 pL and determine the absorbance.
Hexon concentration (mg/mL) = A2sonm x 100 (dilution factor) x 1.43 mg /mL
3.6. Crystallization of Hexon
After concentration and buffer exchange, the freshly purified hexon is used immediately for crystallization trials. Hexon is crystallized (Fig. 4) using the vapor-diffusion hanging drop method (30) (see Note 15). A drop of protein solution is suspended over a reservoir of precipitation solution and allowed to equilibrate. The gradual increase in precipitant concentration within the drop under the appropriate conditions causes crystal formation. The steps for hexon crystallization are as follows:
1. Heat a small amount of high-vacuum grease in a 25-mL beaker on a hot plate until melted.
2. Place 1 .O mL of 1 .O A4 sodium citrate (pH 3.20) in the well of a 24-well tissue- culture tray (see Note 3).
3. Place a thin layer of melted high-vacuum grease around the rim of the well. 4. Place a 5 $ drop of 10 mg/niL hexon solution on a 22-mm diameter siliconized cover slip. 5. Use a 20 pL pipetman to mix 5 clr, precipitation buffer from the reservoir with
the 5 pL hexon drop. Take care not to produce bubbles when mixing the solutions.
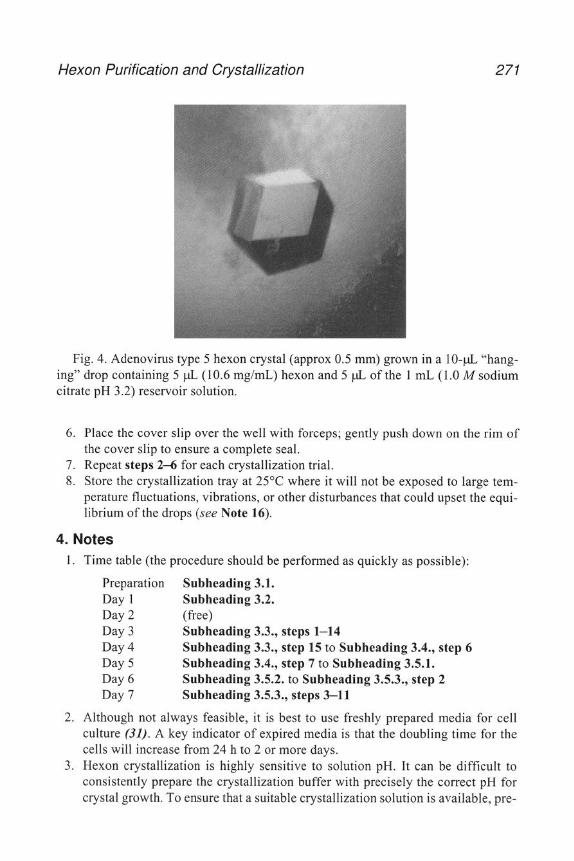
Hexon Purification and Crystallization
Fig. 4. Adenovirus type 5 hexon crystal (approx 0.5 mm) grown in a IO-pL “hang- ing” drop containing 5 pL (10.6 mg/mL) hexon and 5 uL of the 1 mL (1 .O M sodium citrate pH 3.2) reservoir solution.
6. Place the cover slip over the well with forceps; gently push down on the rim of the cover slip to ensure a complete seal.
7. Repeat steps 2-6 for each crystallization trial. 8. Store the crystallization tray at 25°C where it will not be exposed to large tem-
perature fluctuations, vibrations, or other disturbances that could upset the equi- librium of the drops (see Note 16).
4. Notes 1. Time table (the procedure should be performed as quickly as possible):
Preparation Day 1 Day 2 Day 3 Day 4 Day 5 Day 6 Day 7
Subheading 3.1. Subheading 3.2. (free) Subheading 3.3., steps 1-14 Subheading 3.3., step 15 to Subheading 3.4., step 6 Subheading 3.4., step 7 to Subheading 3.5.1. Subheading 3.5.2. to Subheading 3.5.3., step 2 Subheading 3.5.3., steps 3-l 1
2. Although not always feasible, it is best to use freshly prepared media for cell culture (31). A key indicator of expired media is that the doubling time for the cells will increase from 24 h to 2 or more days.
3. Hexon crystallization is highly sensitive to solution pH. It can be difficult to consistently prepare the crystallization buffer with precisely the correct pH for crystal growth. To ensure that a suitable crystallization solution is available, pre-
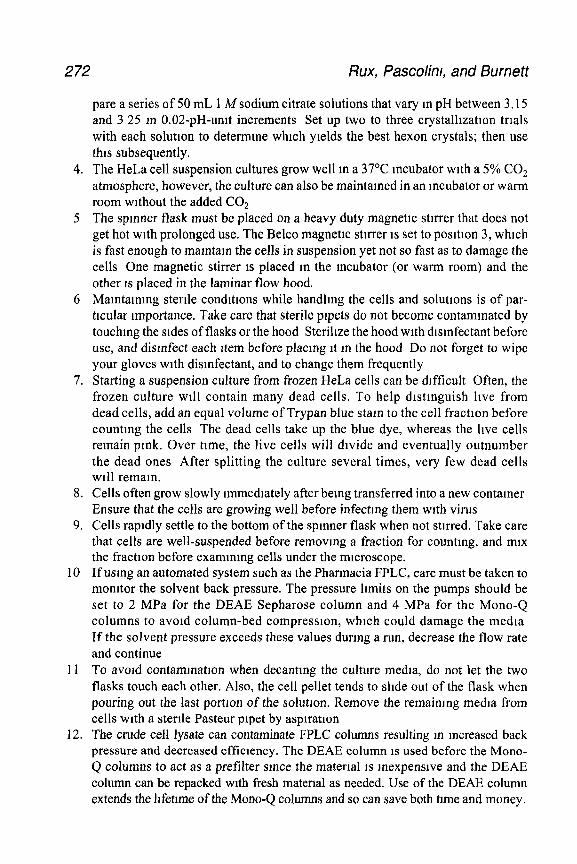
272 Rux, Pascolim, and Burnett
pare a series of 50 mL 1 A4 sodium citrate solutions that vary m pH between 3.15 and 3 25 m 0.02-pH-umt increments Set up two to three crystalhzatlon trials with each solution to determine which yields the best hexon crystals; then use this subsequently.
4. The HeLa cell suspension cultures grow well m a 37’C incubator with a 5% CO2 atmosphere, however, the culture can also be maintamed in an Incubator or warm room without the added CO2
5 The spmner flask must be placed on a heavy duty magnetic stn-rer that does not get hot with prolonged use. The Belco magnetic stirrer 1s set to posltlon 3, which is fast enough to mamtam the cells in suspension yet not so fast as to damage the cells One magnetic stirrer is placed m the Incubator (or warm room) and the other IS placed in the laminar flow hood.
6 Maintaining sterile condltlons while handlmg the cells and solutions is of par- ticular Importance. Take care that sterile plpets do not become contaminated by touchmg the sides of flasks or the hood Sterilize the hood with dlsmfectant before use, and disinfect each item before placing It m the hood Do not forget to wipe your gloves with disinfectant, and to change them frequently
7. Starting a suspension culture from frozen HeLa cells can be difficult Often, the frozen culture will contain many dead cells. To help dlstmguish live from dead cells, add an equal volume of Trypan blue stam to the cell fraction before counting the cells The dead cells take up the blue dye, whereas the hve cells remain pmk. Over time, the live cells will divide and eventually outnumber the dead ones After splitting the culture several times, very few dead cells will remain.
8. Cells often grow slowly immediately after bemg transferred into a new container Ensure that the cells are growing well before infecting them with virus
9. Cells rapldly settle to the bottom of the spmner flask when not stirred. Take care that cells are well-suspended before removing a fraction for countmg, and mix the fraction before examining cells under the microscope.
10 If using an automated system such as the Pharmacia FPLC, care must be taken to monitor the solvent back pressure. The pressure limits on the pumps should be set to 2 MPa for the DEAE Sepharose column and 4 MPa for the Mono-Q columns to avoid column-bed compression, which could damage the media If the solvent pressure exceeds these values during a run, decrease the flow rate and continue
11 To avold contammatlon when decanting the culture media, do not let the two flasks touch each other. Also, the cell pellet tends to slide out of the flask when pouring out the last portlon of the solution. Remove the remaining media from cells with a sterile Pasteur plpet by asplratlon
12. The crude cell lysate can contaminate FPLC columns resulting m Increased back pressure and decreased efficiency. The DEAE column IS used before the Mono- Q columns to act as a prefilter srnce the material is inexpensive and the DEAE column can be repacked with fresh material as needed. Use of the DEAE column extends the hfetlme of the Mono-Q columns and so can save both time and money.
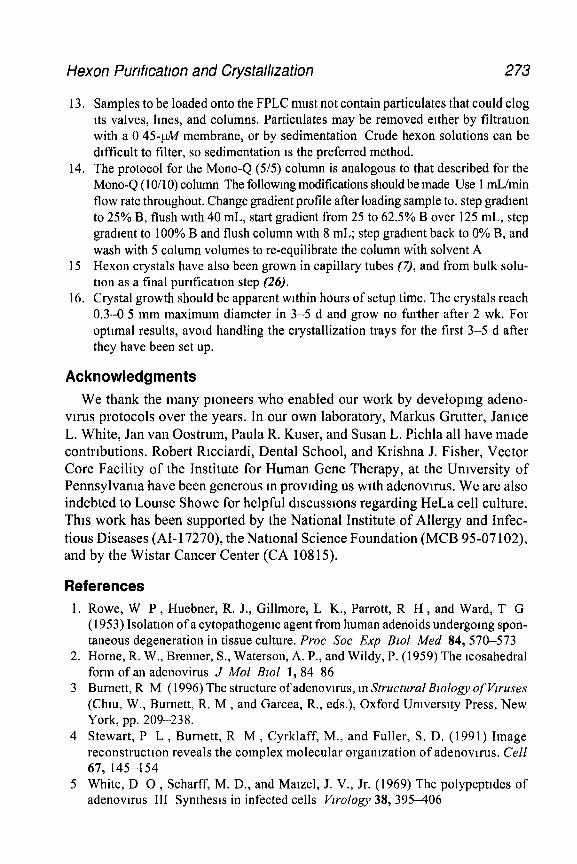
Hexon Punficatlon and Crystalhzation 273
13, Samples to be loaded onto the FPLC must not contain particulates that could clog its valves, lines, and columns. Particulates may be removed either by filtration with a 0 45-w membrane, or by sedimentation Crude hexon solutions can be difficult to filter, so sedimentation IS the preferred method.
14. The protocol for the Mono-Q (5/5) column is analogous to that described for the Mono-Q (lo/IO) column The following modifications should be made Use 1 mL/min flow rate throughout. Change gradient profile after loading sample to. step gradient to 25% B, flush with 40 mL, start gradient from 25 to 62.5% B over 125 mL, step gradient to 100% B and flush column with 8 mL; step gradient back to 0% B, and wash with 5 column volumes to re-equilibrate the column with solvent A
15 Hexon crystals have also been grown in capillary tubes (7), and from bulk solu- tion as a final purrfication step (26).
16. Crystal growth should be apparent within hours of setup time. The crystals reach 0.3-O 5 mm maximum diameter in 3-5 d and grow no further after 2 wk. For optimal results, avoid handling the crystallization trays for the first 3-5 d after they have been set up.
Acknowledgments We thank the many ptoneers who enabled our work by developing adeno-
vn-us protocols over the years. In our own laboratory, Markus Grutter, Jantce L. White, Jan van Oostrum, Paula R. Kuser, and Susan L. Pichla all have made contributions. Robert Rtcciardi, Dental School, and Krishna J. Fisher, Vector Core Facility of the Institute for Human Gene Therapy, at the University of Pennsylvania have been generous m providing us with adenovtrus. We are also indebted to Loutse Showe for helpful dtscusstons regarding HeLa cell culture. This work has been supported by the National Institute of Allergy and Infec- tious Diseases (AI- 17270), the National Science Foundation (MCB 95-07 102), and by the Wistar Cancer Center (CA 108 15).
References 1. Rowe, W P , Huebner, R. J., Gillmore, L K., Parrott, R H , and Ward, T G
(1953) Isolation of a cytopathogemc agent from human adenoids undergoing spon- taneous degeneration in tissue culture. Proc Sot Exp Blol Med 84,570-573
2. Horne, R. W., Brenner, S., Waterson, A. P., and Wildy, P. (1959) The icosahedral form of an adenovirus J A401 Bzol 1,84-86
3 Burnett, R M (1996) The structure of adenovuus, m Structural Bzology of Vwuses (Chm, W., Burnett, R. M , and Garcea, R., eds.), Oxford University Press, New York, pp. 209-238.
4 Stewart, P L , Burnett, R M , Cyrklaff, M., and Fuller, S. D. (1991) Image reconstruction reveals the complex molecular orgamzation of adenovirus. Cell 67,145-154
5 White, D 0 , Scharff, M. D., and Maizel, J. V., Jr. (1969) The polypeptides of adenovirus III Synthesis in infected cells Vzrology 38, 395-406
274 Rux, Pascolini, and Burnett
6
7
8
9
10
11.
12
13
14
15
16
17
18 19.
20
Pereira, H. G , Valentine, R C., and Russell, W C (1968) Crystallization of an adenovirus protein (the hexon) Nature 219,946,947 Burnett, R M , Grutter, M. G., and White, J L (1985) The structure of the aden- ovnus capsid. I An envelope model of hexon at 6 A resolution J A401 Brol 185, 105-123. Roberts, M M., White, J. L., Grutter, M G , and Burnett, R M (1986) Three- dimensional structure of the adenovnus maJor coat protein hexon. Sczence 232, 1148-1151. Athappilly, F K., Murah, R., Rux, J J , Cal, Z , and Burnett, R. M (1994) The refined crystal structure of hexon, the maJor coat protein of adenovuus type 2, at 2 9 A resolution. J Mol BEOI 242,430-455 van Oostrum, J. and Burnett, R M (1985) Molecular composition of the adenovl- rus type 2 virion. J Vwol 56,43!%448 Burnett, R. M (1985) The structure of the adenovtrus capsid II The packing symmetry of hexon and its implications for viral architecture. J Mol. Bzol 185, 125-143 Stewart, P L., Fuller, S D., and Burnett, R M (1993) Difference imaging of adenovn-us. Bridging the resolution gap between X-ray crystallography and elec- tron microscopy. EMBO J 12,2589-2599 Furcmitti, P S , van Oostrum, J , and Burnett, R. M. (1989) Adenovnus polypep- tide IX revealed as capsid cement by dtfference images from electron microscopy and crystallography EMBO J 8, 3563-3570. Kozarsky, K. F. and Wilson, J. M. (1993) Gene therapy. adenovnus vectors Curr Open Genet Dev 3,499-503. Franklin, R M , Petterson, U , Akervall, K , Strandberg, B , and Philipson, L (197 1) Structural proteins of adenovnus V Size and structure of the adenovirus type 2 hexon. J MOE BIOI 57,383-395 Cormck, G , Sigler, P. B , and Ginsberg, H S (197 1) Characterization of crystals of type 5 adenovuus hexon. J. Mol BEOI 57,397-40 1. Dohner, L and Hudemann, H (1972) Untersuchungen zur kristallisation von Hexonen der Adenoviren der Gruppe III Arch Gesamte Vwusforsch 38,279-289 Hay, R. T., personal commumcation Devaux, C , Adrian, M., Berthet-Colommas, C , Cusack, S , and Jacrot, B. ( 1990) Structure of adenovnus fibre. I. Analysis of crystals of fibre from adenovnus serotypes 2 and 5 by electron microscopy and X-ray crystallography J Mol Blol 215,567-588 Xia, D , Henry, L J., Gerard, R D , and Deisenhofer, J (1994) Crystal structure 0 of the receptor-binding domam of adenovnus type 5 fiber protein at 1.7 A resolu- tion Structure 2, 1259-1270
2 1. Schoehn, G , Fender, P , Chroboczek, J , and Hewat, E A. ( 1996) Adenovuus 3 penton dodecahedron exhibits structural changes of the base on fibre bmdmg EMBO J. 15,68414846
22 Cepko, C. L. and Sharp, P. A. (1982) Assembly of adenovnus maJor capsid pro- tem is mediated by a nonvirton protein Cell 31,407-415
Hexon Purification and Crystalhzatlon 275
23 Pettersson, U , Phtbpson, L , and Hbglund, S. (1967) Structural proteins of adenovnuses I Purtfication and characterization of the adenovtrus type 2 hexon antigen. Virology 33, 575-590.
24 Dowdle, W. R., Lambrtex, M , and Hierholzer, J C. (1971) Productton and evalu- ation of a purified adenovirus group-specific (hexon) anttgen for use m the diag- nostic complement fixation test. Appl Mzcrobiol 21,7 18-722
25. Boulanger, P A and Puvton, F (1973) Large-scale preparation of soluble aden- ovnus hexon, penton and fiber antigens in highly purified form Eur J Blochem 39, 37-42.
26 Gmtter, M and Franklin, R. M. (1974) Studies on the molecular weight of the adenovnus type 2 hexon and its subunit. J A401 Bzol 89, 163-l 78
27 Jornvall, H , Pettersson, U , and Phthpson, L (1974) Structural studies of aden- ovnus type-2 hexon protein Eur J Blochem 48, 179-192.
28. Siegel, S A , Hutchms, J E , and Witt, D J. (1987) Purification of adenovirus hexon by high performance hqutd chromatography. J Virol Methods 17,2 1 l-2 17.
29. Challberg, S. S and Ketner, G. (1981) Deletion mutants of adenovtrus 2. Isola- tion and mittal charactertzatton of virus carrying mutations near the rtght end of the vtral genome Vrrology 114, 196-209.
30. McPherson, A (1982) Preparation and analyszs of protew crystals. Wiley, New York
3 1 Owens, J , Walthall, B , and Murphy, T. (1993) The effects of freshly prepared cell culture medium vs stored cell culture medium on high-density cell culture Amer Blotech Lab l&64-66

22
Adenovirus Protease
Joseph M. Weber
1. Introduction Adenoviruses encode a cysteme endopeptldase synthesized late m virus
infection which is essential for virlon maturation and infectivity (I,2) The enzyme 1s encapsldated (approx 20 molecules per vlnon) and may also have a role durmg decapsldation (3-5). Although there are approx 100 adenovirus serotypes known to infect vertebrates, so far only the human adenovirus type 2 (Ad2) enzyme has been studied. The recombinant protein expressed in Escherzchia colz and insect cells has been purified and characterized (3,6-a). The enzyme is a 204-residue monomer of 24,838 Dalton with a pI of 10.59 and optimal activity at 45°C and pH 8.0. The recombinant enzyme is stimulated by an 1 l-amino acid cleavage fragment from viral protein pre-VI. GVQSLKRRRCF. The peptide 1s presumed to regulate enzyme activity in vivo during virus infection. It is bound to Cl04 on the enzyme via a dlsulphide bridge (9). Mutational analysis and X-ray chrystallography identified the active-site triad as H54-C122-E71 (S-11). The substrate specificity of the enzyme 1s (M,I,L)XGG-X or (M,I,L)XGX-G (12). Alky- lating agents and E64 inhibit the protease and virus infection as expected (13). Specific inhibitors are not yet available. To date, 17 protease genes have been sequenced m different virus serotypes. The translated ammo acrd sequences range from 20 1 to 2 14 residues and show both variable and highly conserved regions (1,11).
2. Materials 1. Buffer A: 10 mJ4 Tris-HCl, pH 8 5, 1 mM EDTA, 5 mM mercaptoethanol,
10% glycerol 2 Buffer B* 10 mMphosphate buffer, pH 6 7, 1 WEDTA, 5 mMmercaptoethano1,
10% glycerol.
From Melhods in Molecular Medrone, Vol 21 Adenovrrus Methods and Protocols E&ted by W S M Wold 0 Humana Press Inc , Totowa, NJ
277
278 Weber
3. The fluorescent peptide substrate (Leu-Arg-Gly-Gly-NH)2-rhodamme, called Rl 10, 1s avallable from Molecular Probes (Eugene, OR).
4. Ad2 or other serotypes can be obtained from individual investigators or from the American Type Culture Collection (Rockville, MD). The virus is easily grown to high titer m human cell lines such as HeLa.
5. 12- to 14-kDa Cutoff dialysis membrane 6 300 nuI4 Phosphate buffer. 7. MES buffer: 10 mM 2-[N-morpholmo]ethanesulfonlc acid (Sigma, St
LOUIS, MO) 8. DEAE-Sephacell (Pharmacia Biotech, Uppsala, Sweden)
3. Methods 3.1. Synthesis of Recombinant Protease in E. Coli
The Ad2 protease coding sequence has been cloned into several types of vectors for expression in Insect cells or E colt (3,6-8,14). For practical reasons expression in E. coli is preferable (see Note 1). The following pro- tocol was used with the pLPV construct in E colz. Cloning was descrtbed elsewhere (6,7).
1 Grow a 3-mL culture of AR120 cells containmg pLPV m the recommended medium for about 4 h then add to 1 L prewarmed medium and incubate at 37°C overnight (approx 16 h).
2. Centrifuge out the cells at 25 log for 20 min. 3, Resuspend cells m 8 mL of buffer A and transfer mto a 50-mL tube and pellet
again at 3000 rpm (25 log) for 30 min. 4 Remove supernatant. Resuspend pellet in 5 mL buffer A and freeze-thaw five
times, followed by sonication by 10 x 5 s bursts with a probe at a median settmg. This is done m an ice bath and at intervals to avoid overheating the probe.
5. Centrifuge at 25 log for 30 min. The supernatant may contain variable amounts (5-20% of total) of soluble protease and may be purified separately.
3.2. Chromatographic Purification of Protease 1. Resuspend the pellet from Subheading 3.1., step 5 In 5 mL of saturated urea m
buffer A and vortex it vigorously until the pellet IS completely resuspended 2. Equilibrate DEAE-Sephacell with buffer A to make 15 mL of slurry. This IS done
by washmg with buffer A until the pH of the slurry reaches 8.5 This step is time consuming but very important.
3. Combme the 5-n& suspension (from Subheading 3.2., step I) with the IS-mL DEAE-Sephacell and rotate at 4“C (cold room) for 6 h or overnight
4. Centrifuge at 400g m a bench-top centrifuge and wash the pellet three times with 15 mL each of buffer A Combme the four supernatants To remove all traces of DEAE particles, centrifuge the washes at 3000g in a Sorvall RC-5B superspeed, SS34 rotor.
Adenovirus Protease 279
5 Dialyze against buffer B in a 12- to 14-kDa cutoff membrane If the resultmg volume is too great for chromatography, concentrate It by covermg the dialysis bag with polyvinylpyrrolidone or polyethylene glycol crystals.
6. Pack a K16/20 column in the cold room with buffer B pre-equilibrated hydroxya- patite. Connect the outlet of the column to a peristaltic pump and fraction collec- tor set for 50-drop fractions.
7. Load the dialyzed protein and collect the flowthrough Check this later; If the column is functlonmg correctly the flowthrough should not contain protease
8 Wash column with 10 mL of buffer B. Never allow column to run dry 9 Elute the protease with a gradient by adding seven column volumes ( 100-l 20 mL)
of buffer B to the mlxmg container and the same volume of 300-a phosphate buffer to the second container of the gradient former.
10. Assay the gradient fractions for the protease. Some fractions should achieve between 60 and 90% purity. Greater purity requires an addttlonal SP-Sepharose chromatography step.
11 Combine the protease containing fractions and dlalyse against 10 mM MES buffer, pH 7 0, and 5 mM P-mercaptoethanol.
12. Pre-equilibrate with MES buffer a K16/20 column packed with SP-Sepharose Load the dialyzed protease and elute with a gradient of 10 mMMES, 0.5 MNaCl
3.3. Protease Assays
1 The protease migrates as a 23-kDa band under denaturmg condltlons m SDS-PAGE. Purified Ad2 virlons contain approx 20 molecules of protease and can serve as a convenient marker. Detection 1s by immunoblotting and staining with anti- protease serum (7) The protease runs between viral proteins VI and pre-VII
2 Protease activity (see Notes 2 and 3) can be detected by the cleavage of viral precursor proteins, particularly the abundant pre-VII, actin, or ovalbumm. In a denatured state, to expose the cleavage site, any protem carrying the consensus sites (M,I,L)XGG-X or (M,I,L)XGX-G should be cleavable. Viral precursors can be produced by labeling the proteins for 1 h with 35S-methlonme at 24 h after Infection with adenovirus. After the pulse, the cells are washed, boiled for 3 mm to inactivate endogenous protease and a low-speed supernatant can serve as sub- strate (the 20-kDa viral protein pre-VII).
3. The fluorescent peptlde substrate Rl 10 gives rapid quantitative assays at l-5 pA4 concentration (15,16). The excitation and emission wavelengths are 492 and 523 nm, respectively, both with a 5-nm slit width. Enzyme actlvlty results m increased fluorescence.
4. Notes 1 The protease has been expressed as a fusion protein with N-terminal tags of pro-
tein A or hexahistidme to facilitate purification. These tags did not appear to interfere with enzyme activity.
2 Preparations of recombinant protease require the addition of a peptlde to acquire full-enzyme actlvlty (4,8,15). The enzyme should be incubated (15 min at 37°C)
280 Weber
with 200-fold molar excess of preoxidtzed peptide GVQSLKRRRCF Some enzyme preparations lose activity after a week. Addmon of 1 n-& P-mercaptoethanol was found to restore some activity
3. A vartety of enzyme reaction buffers have been used successfully, such as 20 mM phosphate buffer, 10 mA4 Tris-HCl The pH should be slightly alkaline, between 7.5 and 8 0 and the optima temperature 1s 45°C Addmon of 1 mh4 dtthrothrertol or P-mercaptoethanol or 25 mM NaCl may improve activity
References 1. Weber, J. M. (1995) The adenovtrus endopeptrdase and Its role m vu-us mfectron,
m Molecular Repertowe ofAdenovzruses (Doerfler, W. and Petra Bohm, P , eds ), Curr Topics Mwroblol Immunol. 1994 pp. 227-235
2 Weber, J. M and Trhanyt, K. (1994) Adenovirus endopeptrdases Methods Enzymol 244D, 595S604.
3. Anderson, C. W (1990) The protemase polypepttde of adenovnus serotype 2 vtrt- ons. Vwology 177,259-272.
4. Cotten, M. and Weber, J M. (1995) The adenovnus protease IS required for vnus entry mto host cells. Vwology 213,494-502
5 Greber, U. F., Webster, P , Weber, J., and Helenms, A. (1996) The role of the adenovnus protease m vn-us entry mto cells EMBO J 15, 1766-l 777.
6 Houde, A. and Weber, J M (1990) Adenovnus protemases’ compartson of ammo acid sequences and expression of the cloned cDNA m Escherlchla COIL Gene 88, 269273
7. Tlhanyl, K , Bourbonmere, M., Houde, A, Rancourt, C , and Weber, J M (1993) Isolation and properties of the adenovtrus type 2 protemase J Blol Chem 268, 1780-1785
8 Webster, A., Hay, R. T , and Kemp, G (1993) The adenovuus protease IS actl- vated by a vn-us-coded disulphide-linked peptide. Cell 72,97-104
9 Ding, J , McGrath, W. J , Sweet, R. M , and Mangel, W. F (1996) Crystal struc- ture of the human adenovnus protemase with its 11 ammo acid cofactor. EMBO J 15,1778-1783.
10 Grterson, A W., Nicholson, R., Talbot, P , Webster, A., and Kemp, G. (1994) The protease of adenovn-us serotype 2 requires cysteme residues for both actlvatton and catalysis. J. Gen. Vwol. 75, 2761-2764.
11. Rancourt, C , Tthanyt, K., Bourbonnibre, M , and Weber, J M. (1994) Identrfica- non of active-site residues of the adenovnus endopeptldase Proc Nat1 Acad SCL USA 91,844-847
12 Webster, A., Russell, W. C , and Kemp, G. D (1989) Characterrzatlon of the adenovnus protemase, substrate specificity J Gen Vzrol 70, 32 15-3223
13 Strcar, S., Keyvam-Amineh, H , and Weber, J M. (1996) Inhrbmon of adenovn-us infection with protease inhtbttors. Antlvrral Res 30, 147-153
14 Mangel, W. F , McGrath, W. J., Toledo, D L., and Anderson, C W (1993) Viral DNA and a viral pepttde can act as cofactors of adenovnus vtrton protemase activity. Nature 361,274,275

Adenovirus Protease 281
15. Dloun, M., Geoghegan, K. F , and Weber, J. M. (1995) Functlonal charactenza- tion of the adenovirus proteinase usmg fluorogemc substrates. Protew Pep&e Lett 6,363-370.
16. Mangel, W. F., Toledo, D L., Brown, M. T., Martin, J H., and McGrath, W. J (1996) Characterization of three components of human Adenovu-us proteinase activity in wtro. J Blol Chem 271,536543.

23
Methods for Growth and Purification of Enteric Adenovirus Type 40
Vivien Mautner
1. Introduction The enteric adenoviruses of subgroup F (Ad40 and Ad41) pose some special
problems of cultivation, as they cannot be readily passaged in many of the cell types used to propagate the more commonly used subgroup C serotypes (Ad2 and Ad5), and there is no standard plaque assay: A full dtscusston of the obser- vations from many laboratories is mcluded in a recent revtew (I). For the pur- poses of this chapter, I will describe the methods developed m my laboratory to passage Ad40 m 293 and KB16 cells, to assay the virus by a variety of methods, to purify the vnus by cesium chloride density gradient centrifuga- tion, and to obtain viral DNA. Most of the methods have been derived from those developed for Ad5, but with constraints imposed by the more fasttdtous nature of the entertc adenovnuses.
Ad40 stram Dugan (2) is available from the American Type Culture Collec- tion (ATCC, Rockville, MD). In my laboratory, the virus was passaged nme times m KB 16 cells (31, using a 1: 10 dilution of the total yield at each step to provide a p9 stock with a titer by fluorescent focus assay of 6 x lo6 FFU/mL and a particle count by electron microscopy of 2 x 10” particles/ml. This virus was used for all experimental work, and a virus stock grown from this source was used to make DNA for cloning and sequencing of the complete Ad40 genome (4) (Genbank accession number L19443). The virion DNA was shotgun cloned into bacteriophage M 13mp 19 and sequence data generated ran- domly; from the proportion of nonviral sequences cloned and sequenced, it was possible to estimate that the virion-derived DNA was 98.6% pure.
In order to generate substantial amounts of Ad40, we attempted to passage vn-us seed stocks at a very low multtplicity, as is the procedure for Ad5, but tt
From Methods m Molecular Medune, Vol 21 Adenowrus Methods and Protocols Edlted by W S M Wold 0 Humana Press Inc , Totowa, NJ
283
284 Mauiner
became apparent that seed stocks diluted beyond 1:30 failed to propagate. We therefore routinely maintain virus stocks by serial passage at 1: 10 dilutions, and check the yield of virus at each step by comparing levels of virion pack- aged DNA. It is also important to check the restriction profile for inadvertent contamination with other serotypes; if other adenovtruses are used in the laboratory, this is not a trivial consideration. A comprehensive survey of the restriction profiles of the human adenovirus serotypes (Ad1 to Ad41) is available (5).
Although tt has been reported that A549 cells will support plaque formation of the Sapporo strain of Ad40 (61, the Dugan strain cannot be plaqued in 293 cells, so a fluorescent focus assay has been used to estimate the number of infected cells and thence the titer of virus in a stock. For Ad5, the FFU-to-PFU ratio is approx 10: 1, and the particle-to-PFU ratio ranges from 10 to 100. For Ad40 passaged in 293 or KB16 cells, we find a particle-to-infectivity ratio in the order of 103; and although the reason for this large difference is not estab- lished, a number of explanations have been suggested (I, 7,8)
2. Materials 1. Ad40 strain Dugan. ATCC VR-93 1 (2). 2. 293 cells. ATCC CRL- 1573 (human embryonic primary kidney cells transformed
with sheared Ad5 DNA, expressing E 1 a+b) (9) 3. KB 16 cells: (KB epidermoid-carcmoma continuous cell line (ATCC CCL-17)
further transformed with Ad2 E 1 a+b DNA) (3). 4. Dulbecco’s modified Eagle’s medium (DMEM) Gibco-BRL, Gaithersburg, MD
cat. no 04 1-O 1965 M (without sodium pyruvate, with 4500 mg/L glucose) Store at 4°C a Pen/strep solution Gibco-BRL cat no. 043-05 140 H (1000 m/mL pemclllm,
1000 pg/mL streptomycin). Ahquot and store at -20°C. b L-Glutamme: Glbco-BRL cat no. 043-05030 H (200 mM) Aliquot and store
at -20°C c. Serum (fetal calf): heat treat 56°C for 3&45 mm. Aliquot and store at -20°C
5 Cell-propagation medium. DMEM (500 mL), Pen/strep solution (5 mL), L-glutamine (10 mL), fetal calf serum (50 mL).
6. Infection medium* DMEM (500 mL), Pen/strep solution (5 mL), L-glutamme (10 mL), fetal calf serum (2 5 mL). Working stock should be stored at 4°C and used within 10 d
7. Dulbecco’s PBS (complete). NaCl(l37 mM), KC1 (2.7 mM), NaH2P04 (8.0 mM), KH,PO, (2.4 m&Q, CaCl, (6.8 mM), MgCl, (4 9 mM) For complete (PBS) use 8 parts solution A, 1 part solution B, and 1 part solution C. a. Solution A* NaCl(l0 g), KC1 (0.25 g), Na2HP04 (1 43 g), KH2P04 (0 41 g),
pH72per1LH20. b. Solution B. CaC12*2H20 (1 g) per 1 L
Enteric Adenowrus Type 40 285
c. Solution C MgCl, 6H,O (1 g) per 1 L. Store sterile solutions at 4°C. Make up fresh as required.
8. PBSa: Solutron A (see item 7a) 9. Trts-buffered salme (TBS) NaCl (140 mM), KC1 (30 mM), Na,HPO, (28 mM),
Tris (25 n-&f), Glucose (1 mg/mL), pH 7.0. Store sterile at 4°C 10. Trypsin/versene (T/V): 1 vol trypsin:4 vol versene
a Trypsm 0.25% in TBS (store stertle at -20°C). b Versene 0 6 mA4 EDTA m PBSa, 0.002% phenol red (store sterile at 4°C).
11 Trts/EDTA (T/E). 10 mM Tris-HCI, pH 8 0, 1 it-J4 EDTA Store sterile at room temperature
12. CsCl-gradient solutions For a density of 1.45, dissolve 20 5 g CsCl m 2 9 mL 0 5 MTris-HCl, pH 7 2, and 25 8 mL H,O For a density of 1.32, dissolve 32 0 g CsCl m 6.8 mL 0 5 A4 Tris-HCl, pH 7.9, and 61.2 mL H,O. Filter through Whatman no. 1 paper and store at room temperature The density of the CsCl soluttons can be checked on an Abbe refractometer.
13. 40% Glycerol glycerol (40 g), 0 5 M Trts-HCI, pH 7 9 (2.0 mL), 0.2 A4 EDTA (0 5 mL), H,O to 100 mL. Use stertle reagents, store at room temperature.
14 Hut buffer 10 mM Trts-HCl, pH 7 9, 10 mM EDTA, 0 6% (w/v) SDS Filter- stertltze and store at room temperature.
15 Protemase K: Type XXVIII from Trztrachium album (Sigma, St LOUIS, MO, cat no P-4914); stock solutton 10 mg/mL m H20. Store in ahquots at 4°C
16 Gelvatol. gelvatol 2&30 from Cairns Chemicals, Bucks, UK a Dtssolve 20 g gelvatol in 80 mL: 140 r&f NaCl, 10 mM KH2P0,, 10 mA4
Na2HP04 12 H20. Shake to dtssolve overnight at room temperature. b Add 40 mL glycerol; shake to dissolve overnight at room temperature c Centrifuge 15,000g x 10 min at room temperature Collect supernatant and
check that pH is 6 O-7 0. d. Store ahquots at 4°C
17 Cmfluor (Cittfluor, London). 18 Antibodies:
a. Group-specific adenovirus antibody, e.g., rabbtt polyclonal anttserum to Ad5 hexon
b Fluorescem-conjugated swine antnabbit IgG. c Rhodamme-conjugated BSA (Nordic Immunological Laboratories, PO Box
22 5000 AA Ttlburg, The Netherlands) 19. Latex beads: 225-nm diameter beads, 1.6 x lO”/mL (Agar Sctenttfic, Stanstead,
Essex, UK, cat no S130-4). 20 Blo-Rad Protem Assay dye concentrate (Hercules, CA, cat no 500-0006)
3. Methods 3.1. Propagating Cells
Cell stocks are maintained in 80-cm2 tissue-culture flasks, and passaged on a regular basis before they become confluent; local condtttons and the dtlutton used will deternune the frequency. In my hands, 293 cells can be split 1: 10
286 Mautner
every 7 d to maintain the stock. One 80% confluent flask yields approx 2 x 1 O7 cells, which will provide 20 60-mm plates seeded at IO6 cells/plate. These should reach 80% confluence u-r 2 d. JCL3 16 cells are split 1.4 every 34 d; they are less tolerant of a higher dilution.
1 Remove medium from the cells, add 5 mL prewarmed T/V, gently wash cells untrl pH becomes acid. Dtscard T/V, add a further 5 mL and incubate at 37°C until the cells detach (usually a maxtmum of 5 mm, do not leave longer than necessary).
2 Bang the flask to detach all the cells, allow to dram to base of flask. 3. Add 20 mL prewarmed medium to the flask (serum m the medtum neutraltzes
the trypsm). 4. Disperse the cells by ptpetting up and down three times with a lo-mL ptpet 5. Seed flasks as requrred; e.g., 2.5 mL cell stock + 20 mL medium for a 1 10 spht 6. Regularly test all cell lines for mycoplasma, e.g., once every 2 mo Passage newly
recovered cells four times m anttblotrc-free medium before testing.
3.2. Preparing Plates for lnfecfion
1. Trypsmrze cells from a 90% confluent BO-cm* flask as described above and resuspend in 25-30 mL of medmm
2 Count an aliquot in a hemocytometer, and plate l-2 x 1 O6 cells per 60-mm plate m 4-5 mL medium The exact number of cells will be determined by the growth characteristics of the cells, and whether they are required at 1 or 2 d postplatmg
3.3. Preparation of Virus Seed Stock (see Note 1)
Ad40 seed stock should be generated tn 60-mm plates, by sertal passage of 1: 10 dtluttons. This IS preferable to using large flasks, as spot con- tamination of individual plates can be readrly recognized, and stocks dis- carded accordingly.
1 Remove medium from subconfluent monolayers of 293 or KBa+b cells m 60-mm plates
2 Infect with virus diluted in TBS to gave approx 1 FFU/cell m 0.1 ml/plate (gen- erally a 1: 10 dilution).
3 Adsorb 37°C for 60-90 mm. Rock plates gently at 20-mm Intervals 4. Add 5 mL medium + 0 5% fetal calf serum. 5. Cells should take 5-7 d to show a good cytopathic effect (cpe) (Ad40 has less tendency
than Ad5 to produce a “bunch of grapes” effect, but mdrvtdual cells do round up) 6. When a good cpe 1s apparent, scrape cells into the medmm wrth a pastette or
teflon scraper, and prpet cells gently to drsperse clumps. 7 Pool cell suspensions and centrifuge at 9OOg for 10 mm at 4°C 8. Dram pellets and resuspend in approx 0.25 mL TBS/60-mm plate 9. To release virus, freeze-thaw three times, I.e., freeze m dry me or hqutd nitrogen,
and thaw at 37’C m water bath
Enter/c Adenowrus Type 40 287
10. Centrifuge at 900g for 10 mm at 4°C. Small volumes can be centrifuged in Eppendorf tubes, at 15OOg for 1 min.
11 Ahquot supernatant; store at -20°C.
3.4. Preparation in 80-cn? Flasks
1 Decant medium from flasks 2. Add 2 mL of virus dilution in TBS at l-3 FFU/cell. 3. Incubate for 6&90 mm at 37°C. 4. Add 50 mL medium +0.5% FCS. 5. Incubate for 3-5 d. 6. When good cpe is visible, harvest virus by shaking cells off into medium, spin-
ning down and proceeding as above.
3.5. Rapid Preparation of Banded Virus (10)
1. Make large quantities ofvuus stock (e.g., from thirty 60-mm plates or ten SO-n&. flasks) 2. Add l/l00 volume n-butanol and incubate 4°C for 60 mm 3 Centrifuge at 9008 for 10 mm to remove cell debris 4 Remove supernatant containing virus 5 Layer on a CsCl/glycerol gradient (see below). 6. Centrifuge at 80,OOOg for 90 min at 4°C. Do not use brake to stop. 7. Virus band should be visible to naked eye as the lowest opalescent band To see
more clearly, place m front of a black background and shine a light down the tube from directly above There may be one or more bands above the vuus band, these consist of empty or incomplete virus particles.
8. Collect the virus band by piercing the tube with a hypodermic needle below the band, and collectmg drops into sterile 1-mL cryotubes. The fraction containmg the virus band will be opalescent.
9. Remove CsCl either by dialysis against 10 mA4 Tris-HCI, 1 mM EDTA, pH 8 0, or on a G50 Sephadex desalting column.
10. Mix vn-us with an equal volume of sterile 80% glycerol and store at -70°C.
3.6. CsCl Gradient
Use Beckman 14 x 9%mm Ultraclear tubes (Fullerton, CA, cat. no. 344060) in an SW40Ti swing-out rotor. Prepare the gradient by layermg the following solutions; it is easier to put the glycerol in first, then underlay it with the p = 1.32 CsCl, and underlay this with the p = 1.45 CsCI, and finally to overlay the virus. Use 2 mL of p = 1.45 CsCl, 3 mL of p = 1.32 CsCl, 2 mL of 40% glycerol, and approx 7 mL of virus prep. If necessary, fill up tube with IO mM Tris-HCI, 1 rnM EDTA, pH 8.0. Centrifuge at 80,OOOg for 90 mm at 4°C.
3.7. Equilibrium Banding of Virus
1. Store the vnus band from the rapid purification at 4°C without desalting (pro- longed storage is not recommended)
288 Mauiner
2. Centnfitge on a CsCl step gradtent at 85,000g overnight at 4°C m a 5-mL swing-out rotor CsCl gradient Use 1.5 mL of p = 145,1.8 mL of p = 1 32, and 2 53 mL of virus
3 Add a thm layer of llqutd paraffin to seal. 4 Collect vnus band vta a hypodernnc needle m 10 drop fracttons. 5 Store at 4°C or desalt, add glycerol to 40%, and store at -70°C
3.8. Storage of Banded Virus
Banded virus taken directly from a CsCl gradient can be kept for a few days at 4OC, but there IS a danger that the vu-us wtll aggregate and infecttvtty will be lost. The vnus will remain m suspension for prolonged pet-rods (months or years) rf glycerol 1s added to 40% and the material is aliquoted and stored at -70°C. Such stock can be used for infecting cells after dilution m TBS. To determme the vuus concen- tration, it is a good idea to take an aliquot before adding glycerol.
CsCl can be removed by dialysis or desalting: the vu-us will be diluted some two- to fivefold, and there is a risk that the vu-us wtll aggregate during these procedures. The method of choice for desalting ~111 be determined by the purpose for which the material IS intended. For parttcle counts and other assays of vuus concentratton, vuus can be desalted but glycerol should not be added. Vnus intended for subsequent infection can be stored at -70°C with addition of glycerol after desalting.
1 Desalt on a G50 Sephadex column pre-equilibrated with TBS; or 2 Dialyze vs TBS OY 60 mm Tris-HCl, pH 7.5,lO mA4 EDTA, 2% glycerol or vs
10 mM Trts-HCl, pH 7 6, 1 mM MgC12, 10% glycerol, 0 5% n-butanol (II), and/or
3 Mtx vnus with an equal volume of sterile 80% glycerol and store at -70°C.
3.9. Preparation of Virion DNA from Banded Virus
1. Use vu-us directly from the rapid-banding stage. 2. Add protemase K to 500 ~.tg/tnL and SDS to 0.5% (final concentratton) 3 Incubate at 37°C for 2-3 h 4. Extract DNA once wtth phenol/chloroform (equthbrated m T/E), then once wtth
chloroform (equilibrated in T/E) 5 Ethanol prectpttate with 0 3 M sodmm acetate, pH 5 5, at -70°C for 20 mm, or
overnight at -20°C 6 Wash wtth 70% EtOH at -20°C 7. Dissolve pellet m T/E
3.10. Preparation of Viral DNA from Infected Cells (Modified Hirt Extraction) (12)
1 For 60-mm plate. a If the cells are firmly adhermg, wash m TBS, dram, add 0 6 mL of Htrt
buffer, incubate for 10 mm at room temperature, and scrape lysate mto Eppendorf tube.
Enter/c Adenowrus Type 40 289
b If cells are detaching from plate, scrape cells mto medmm, centrifuge at 2000g for 10 mm or at 15,000g for 1 min, resuspend cell pellet in 0.6 mL Hu-t buffer, transfer to Eppendorf tube, and incubate for 10 mm at room temperature.
2 Add 0.15 mL 5 M NaCl, mix gently by inverting tube. 3 Incubate on ice overnight 4. Centrifuge at 15,000g for 30-45 min. 5 Remove supernatant (sometimes it is easier to remove pellet with a wooden
toothpick). 6. Precipitate DNA from supernatant using either of two methods
a. Add equal volume lsopropanol, incubate -20°C overnight, centrifuge at 12,000g for 5 mm, and drain pellet.
b Add protemase K to final concentration 500 pg/mL, incubate 37°C for 3 h, extract once with phenol/chloroform, extract once with chloroform, EtOH precipitate with 0 3 M sodium acetate, and wash pellet in 70% EtOH
3.17. Preparation of Virion Packaged DNA from Infected Cells (13)
This method is useful for preparing DNA from a seed stock to assess the quality and quantity of the yield by DNA restriction-digest analysis For 150 p.L seed stock, proceed directly to stage 7. For two 60-mm plates of infected cells:
1. Scrape cells Into medium and centrifuge to pellet cells at 900g for 10 min or 15,000g for 1 mm
2 Wash cell pellet once m TBS 3. To drained pellet, add 0 5 mL TBS. 4 Freezsthaw three times 5 Centrifuge at 15,OOOg for 1 mm. 6. Collect supematant. 7. To supernatant, add protemase K to a final concentration of 500 pg/mL 8 Incubate 37°C for 2-3 h. 9 Extract once with phenol/chloroform; extract once with chloroform,
10 EtOH ppt with 0 3 M sodium acetate
For smaller samples (e.g., from Lmbro well), 35mm plate, add salmon sperm DNA or tRNA as carrier for DNA precipltatlon.
3.12. Fluorescent Focus Assay
1 Set up monolayers of cells in 35-mm plates, or Lmbro wells at 3 x lo4 cells/well 2 Wash with complete PBS 3. Infect with 0.1 mL virus dilution m TBS. 4 Adsorb 90 min at 37’C, shaking plates every 20-25 mm 5. Overlay with DMEM + 0.5% FCS. 6. Incubate for 24 or 48 h.
290 Mautner
7 Remove medium; wash twice with complete PBS Inspect cells to confirm mor- phology and adherence.
8 Fix with ice-cold 90% methanol x 4 mm 9. Wash twice with PBS Plates may now be stored at 4°C with 1 mL PBS overlay
10. Add antibody at diluttons 150, 1.150, l-450 m PBS at 0 4 ml/plate As a control, use preimmune serum where available. Additional control* Omit first antibody
11 Incubate at room temperature for 30 mm. 12. Save antiserum and store at 4°C can be re-used at least twice 13. Wash plates twice m PBS. 14 Add 0 4 mL per plate fluorescem-conjugated swme anttrabbtt IgG (Nordic) and
rhodamme-conjugated BSA at appropriate dilutton; this needs to be determmed emptrtcally. Swme anttrabbit serum can be re-used at least twice
15. Shake every 10 min at room temperature for 30 min. 16. Rinse twice in PBS Plates can be stored m dark at 4°C wtth 1 mL PBS 17 Read plates with UV mtcroscope x 10 objective, x 10 eyepiece with 1 mm gratmg
graticule 18 Count total cell number under phase contrast opttcs, and number of fluorescing
cells m same field
3.73. Alternative Fhorescent Focus Assay
1 Prepare cleaned and sterilized cover shps. 2. Set up 16-mm cover slips to be subconfluent, use three or four cover slips in a 60-mm
Petri dish or one in a Lmbro well 3. Infect with virus at various dilutions (e g , 1’ 10, 1 20, 1 40) m TBS, 20 p.L per
cover shp 4 Adsorb virus for 1 h at 37’C Add 4 mL medium; Incubate at 37’C 5 Frx cells at 48 h postmfectton
a Wash twice with me-cold PBS by holding cover slip with forceps and rapidly drppmg in and out of PBSa.
b. Ftx by tmmerston m ice-cold 3: 1 mix of methanolacetone for 10 mm. c Wash twice with PBSa.
6. Store in PBSa at 4°C Can be kept for at least 1 wk 7 Add primary antibody.
a Use antihexon MAb at 1: 100 dilution m PBSa b Centrifuge antibody at 15,OOOg for 2 min before use c Add 20 pL per cover slip. d Incubate at room temperature for 30 mm
8 Wash four ttmes in PBSa 9 Add secondary antibody.
a. Use goat antimouse FITC complex dtluted 1.100 m PBSa b. Pass through 0 45-pm filter and centrifuge at 15,OOOg for 2 mm before use c. Add 20 pL per cover slip. d Incubate at room temperature for 30 min.
10. Wash vigorously seven ttmes in complete PBS then once gently in dtstilled water.
Enter/c Adenovirus Type 40 291
11, Mount cover slips m 1’ 1 glycerol: PBSa mix or gelvatol, inverted onto a glass slide. Samples mounted in PBS cannot be stored, whereas with gelvatol samples can be stored for at least a week at room temperature. An antifade agent such as Citrfluor may be added to the mountmg matertal.
12. View in inverted fluorescence microscope with an FITC filter at x20 magmficatron 13 Count total cell number under phase-contrast optics, and number of fluorescmg
cells m same field
3.14. Virus Concentration (14-l 7)
These methods were devised principally for the subgroup C vu-uses Ad2 and Ad5, but Ad40 is constdered to be sufficiently similar that they remain valid. It should be noted that there are discrepancies between the values obtained by the various methods, and it IS recommended that for consistency, one method should be chosen and adhered to.
3.14.1. Absorbance at Azeonrn
1. Using banded vnus, dilute 1: 10 into 0.5% SDS, 0.1X SSC 1 ODZbO of virus in 0 5% SDS, 0.1X SSC = 0 28 mg/mL protern This is equal to 11 x 10” virus particles
2 Extract viral DNA and measure ODZbO. 1 OD260 = lOi virus particles/ml.
3.14.2. Protem Determination
10 pL CsCl banded vn-us + 100 & Hz0 + 200 & Bio-Rad protein reagent (undtluted). 1 0DSg5 = 3.4 x lOi virus particles.
3.14.3. Virus Particle Count in the Electron Microscope (EM)
This method is from Jim Artken, Institute of Virology, Glasgow. Virus must be desalted.
1 MIX sodium sihcotungstate or phosphotungstrtic acid stain, virus suspension, and beads at room temperature
2. Put a few microliters onto an EM grid (can be formvar, collodion, or carbon coated; 200, 300, or 400 mesh size).
3 Allow to incubate for a few min Drain off excess liquid by lightly drawing Whatman no, 1 filter paper across the grid surface.
4 Count number of vu-us particles, and simultaneously count latex beads If there are a large number of empty or incomplete particles (penetrated by stain) it is worth recording this number also
5. When you get to 100 beads stop counting. 6. Partrcle count = n/100 x concentration of latex beads (where n is number of virus
particles counted). 7 Stain for electron microscope. sodium silicotungstate, pH 7.0, or phosphotung-
stic acid, pH 7.0 (Agar Scientific) 8 Beads latex beads 225-run diameter, concentration 1 6 x IO’ ‘/mL (Agar Scienttfic)
292 Mautner
4. Notes 1 Safety constderations for workmg with Ad40. Ad40 IS generally constdered
to be nonpathogenic to adults, and IS charactertsttcally associated wtth tnfan- tile gastroenteritis (2)
2 The vnus is classified as nontumortgenic, and in fact only partral transformatron can be achieved in vrtro (181. However, gtven that the vuus IS infectious by the oral route, tt is prudent to confine work with large amounts of purified virus to a designated and contained area The extreme resistance of Ad40 to UV irradiation has recently been reported (19) The actual level of contamment ~111 be governed by local regulattons. The use of gloves and an approprrate srde or back-fastening lab coat IS recommended
Manipulations of vu-us infected material should be designed to muumtze the generation of aerosols, if maternal 1s vigorously shaken or vortexed, the tube should be briefly centrtfuged prtor to openmg Waste matertals should be rendered noninfectrous prror to disposal* 1% Virkon or 0 5% SDS IS sufft- ctent to macttvate vtrus, but It 1s important to ensure that soltd waste 1s etther autoclaved or exposed to disinfectant for a sufftcrent length of ttme (at least 30 mm) before discardmg
The use of glassware and hypodernnc needles should be kept to a munmum; any skm contact or needle-suck mJury should be thoroughly flushed with runnmg water Vrrkon is suitable for external skin apphcatlon A drip tray should be used to con- tam spillages, which can be absorbed onto paper tissue soaked m dlsmfectant
Acknowledgments This chapter IS dedicated to the memory of Hello Pereira, m whose labora-
tory I learned the fundamentals of adenovtrology. I am indebted to Gate Brown, Nancy Mackay, and Angela Rinaldi, who helped to develop many of the meth- ods described here, and whose expert technical assistance over many years is much appreciated.
References 1 Mautner, V., Stemthorsdottir, V., and Bailey, A. (1995) The entertc adenovuuses,
in The Molecular Repertoire ofAdenovwuses (Doerfler W and Boehm P., eds ), Curr Topzcs Mlcroblol Immunol 199/III, Springer Verlag, pp. 229-282
2 de Jong, J. C , Wigand, R , Krdd, A. H., Wadell, G., Kapsenberg, J. G , Muzerre, C. J., Wermenbol, A G., and Ftrtzlaff, R. G. (1983) Candtdate adenovtruses 40 and 41. fastidious adenovnuses from human infant stool J Med Vzrol 11, 215-231
3. Babiss, L. E., Young, C. S. H., Fisher, P. B., and Ginsberg, H S. (1983) Expres- sion of adenovirus E 1 A and E 1B gene products and the Escherzchza co11 XGPRT gene in KB cells J Vu-01 46,454465.
4. Davtson, A. J., Telford, E. A. R., Watson, M. S., McBride, K., and Mautner, V (1993)The DNA sequence of adenovnus type 40. J Mol B~ol 234, 1308-l 3 16
Enter/c Adenowrus Type 40 293
5. Adrian, T , Wadell, G., Hlerholzer, J. C., and Wigand, R. (1986) DNA restriction analysis of adenovnus prototypes 1 to 41. Arch Vzrol. 91,277-290.
6. Hashimoto, S , Sakakibara, N., Kumai, H , Nakai, M , Sakuma, S , Chiba, S , and FuJinaga, K (1991) Fastidious adenovirus type 40 can propagate efficiently and produce plaques on a human cell line, A549, derived from lung carcmoma. J. Vu-01 65, 2429-2435
7. Brown, M., Wilson-Friesen, H. L., and Doane, F. (1992) A block m release of progeny virus and a high particle-to-infectious unit ratio contribute to poor growth of enteric adenovlrus types 40 and 41 in cell culture. J Viral 66,3 198-3205
8. Tlemessen,C T. and Kldd, A H. (1994) Adenovn-us type 40 and 4 1 growth m vitro: host range diversity reflected by differences m patterns of DNA replication J Viral 68, 1239-1244.
10 Graham, F. L , Smlley, J., Russell, W. C., and Nann, R. (1977) Characteristics of a human cell lme transformed by DNA from human adenovu-us type 5. J Gen Vwol. 36, 59-72
10. Mautner, V and Wlllcox, H. N A (1974) Adenovirus antigens. a model system m mice for sub-unit vaccmatron. J Gen Vwol 25,325-336.
11, Hannan, C , Raptis, L. H , Dery, C V , and Weber, J. (1983) Biological and struc- tural studies with an adenovnus type 2 temperature-sensitive mutant defective for uncoating. intervzrologv 19,213-223.
12 Hut, B (1967) Selective extraction of polyoma DNA from infected mouse cell cultures. J Idol Blol 26,365-369.
13 Mautner, V , Mackay, N , and Steinthorsdottu-, V. (1989) Complementatlon of enterlc adenovnus type 40 for lytic growth in tissue culture by ElB 55K function of adenovnus types 5 and 12. Vwology 171,619-622.
14. Green, M and Pma, M. (1963) Biochemical studies on adenovlrus multlphcation IV. Isolation and purification and chemical analysis of adenovn-us VwoEogy 20, 199-207.
15. Chardonnet, Y and Dales, S. (1970) Early events m the interaction between adenovn-uses and HeLa cells. II. Penetration of type 5 and intracellular release of the DNA genome. Vwologv 40,462-477.
16. Laver, W. G. (1970) Isolation of an arginine-rich protein from particles of aden- ovirus type 2. Vzrology 41,488-500.
17 Russell, W. C , McIntosh, K., and Skehel, J. J. (197 1) The preparation and proper- ties of adenovlrus cores. J Gen. Vwol. 11,35-46.
18. van Loon, A. E., Maas, R , Vaessen, R. T . Reemst, A. M , Sussenbach, J S., and Rozijn, T. H (1985) Cell transformation by the left terminal regions of the aden- ovn-us 40 and 41 genomes Virology 147,227-230.
19. Meng, Q. S and Gerba, C. P. (1996) Comparative mactlvatlon of enteric adenovnuses, pol~ovu-us and coliphages by ultraviolet n-radiation. Water Res 30, 2665-2668.

24
Transfection Complexes Generated with Adenovirus and Polyethylenimine-Condensed DNA
Matt Cotten, Mediyha Saltik, and Adam Baker
I. Introduction Many types of vtral infection produce a transient permeabilization of the
Infected cell (see refs. I and 2; reviewed in refs. 3 and 4). A large tmprove- ment m transfection efficiency was obtained when this phenomenon was applied to receptor-mediated gene delivery (5). A number of permeabiltzing agents have now been used to enhance gene transfer, but adenovirus is by far the most potent (6,7). The augmentation of DNA delivery by adenovirus par- ticles is primarily due to enhancement of cytoplasmtc entry of DNA; however, viral components may also serve additional functions that promote transfec- tion, such as generating alterations in the cytoskeleton of the transfected cell (81 or m promotmg nuclear entry (9,10). The most efficient varrations of this method employ some form of linkage between the adenovirus and the plasmrd DNA, thus ensuring that each viral entry event is linked to plasmid DNA entry. There are now a number of methods of linking DNA to carrier adenovirus. A versattle method mvolves btotinylatmg the adenovrrion and linking the plas- mid DNA with a streptavtdin-polylysine bridge (6). Other methods include direct chemical linkage between virus and polylysme (I&14), as well as an enzymatic linkage using transglutaminase (15,16). The drawbacks with the direct virus-polylysine linkage methods are the generation of a fixed virus-to- polylysme ratio (limiting titration posstbilittes), and the storage difficulties of polylysme-adenovuus that necessitate the use of high tonic strengths. A cou- pling technique using antibody-polylysine binding to an adenovirus epitope has been described that allows a greater degree of flexibility m vnus-polyl-
From Methods m Molecular Medune, Vol 21. Adenowrus Methods and Protocols EdGxl by W S M Wold 0 Humana Press Inc , Totowa. NJ
295
296 Cotfen, Saltik, and Baker
ysme ratios (13, but requires both an epitope-tagged virus and a special anti- body-polycation conjugate.
A number of reviews on these systems are available. These mclude reviews on receptor-mediated gene-delivery systems (18-20); on adenovirus-aug- mented systems (15,21-23), and reviews on general nonviral gene delivery systems (24,25).
We descrtbe here a simple method of linkmg plasmid DNA to carrier aden- ovnus particles. The method uses the synthetic polycatton polyethylenimine (PEI) to condense the plasmid DNA into a small, postttvely charged complex. PEI m a high-molecular-weight form has been shown to possess DNA transfer activity (26,27). We initially found that PEI was useful in preparing gene trans- fer complexes with high-molecular bacterial arttticial chromosomes (BACs) when polylysme was found to generate precipitatton problems with these large DNA molecules (28). Further mvestrgatron of PEI properties revealed that PEU DNA complexes could be bound ionically to the negatively charged adeno- virus type 5 capsid and these DNA/PEI/adenovnus complexes transfected with efficiencies comparable to the original streptavidm-polylysine complexes (29). This transfection system is illustrated in Fig. 1. The PEI system is inexpensive and the ready availability of the reagents make tt simple to establish.
In addttion to descrtbing the PEI plasmid DNA/vn-us linkage method, this chapter also describes the preparation of psoralen-macttvated carrier adenovi- rus. Furthermore because the plasmid-DNA purity with regard to LPS is cru- cial, especially when transfecting primary-cell types, a simple method for removing LPS from plasmid DNA is provided.
2. Materials
2. I. Psoralen Inactivation of Adenovirus, Quantitation
1. 8-methoxy psoralen. (Sigma, St Lotus, MO, cat. no. M-3501) P A stock solutron of 33 mg/mL m DMSO IS prepared and stored m aliquots at -20°C in the dark Do not refreeze thawed ahquots. TOXIC
2 UV-lrght source: long-wave UV-light source (e.g., UVP model TL-33, San Gabriel, Cahfornra, wtth 6X 15-W bulbs producing 12,000-13,000 VW/cm’ at 3 cm)
3. Nick column (Sephadex G-50 cat. no 17-0855-02) for processmg 400-pL samples (Pharmacra, Uppsala, Sweden)
4. PD-10 columns (Sephadex G-25M cat. no. 17-0851-01) for processmg 2-mL samples (Pharmacla).
5. HBS (HEPES-buffered saline): 150 mMNaC1,20 mA4HEPES, pH 7.4 (20 mL 1 M HEPES, pH 7.4,30 mL 5 MNaCl, water to 1000 mL)
6. HEPES-buffered salme/40% (v/v) glycerol (HBS/40% glycerol) 20 mL 1 A4 HEPES, pH 7.4,30 mL 5 MNaCl, 400 mL 86% glycerol (Fluka, Buchs, Swnzer- land), water to 1000 mL
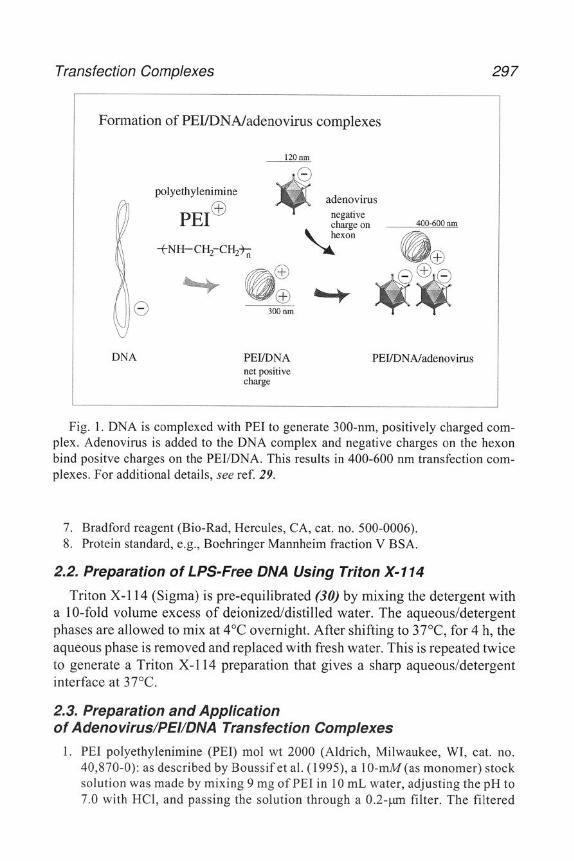
Transfection Complexes
Formation of PEIiDNA/adenovirus complexes
297
polyethylenimine r;\
PEIw fNH-CI$-CH&
adenovirus negative
DNA PEIIDNA net positive charge
PEUDNA/adenovirus
Fig. 1. DNA is complexed with PEI to generate 300-nm, positively charged com- plex. Adenovirus is added to the DNA complex and negative charges on the hexon bind positve charges on the PEI/DNA. This results in 400-600 nm transfection com- plexes. For additional details, see ref. 29.
7. Bradford reagent (Bio-Rad, Hercules, CA, cat. no. 500-0006). 8. Protein standard, e.g., Boehringer Mannheim fraction V BSA.
2.2. Preparation of LPS-Free DNA Using Triton X-l 14
Triton X-l 14 (Sigma) is pre-equilibrated (30) by mixing the detergent with a 1 O-fold volume excess of deionized/distilled water. The aqueous/detergent phases are allowed to mix at 4°C overnight. After shifting to 37°C for 4 h, the aqueous phase is removed and replaced with fresh water. This is repeated twice to generate a Triton X-l 14 preparation that gives a sharp aqueous/detergent interface at 37°C.
2.3. Preparation and Application of Adenovirus/PEI/DNA Trans fection Complexes
1. PEI polyethylenimine (PEI) mol wt 2000 (Aldrich, Milwaukee, WI, cat. no. 40,870-O): as described by Boussif et al. (1995), a 1 0-mM (as monomer) stock solution was made by mixing 9 mg of PEI in 10 mL water, adjusting the pH to 7.0 with HCl, and passing the solution through a 0.2-pm filter. The filtered
298 Cotten, Saltik, and Baker
stock solutton was stored at 4°C Before use, the 10 mM PEI stock solution was vortexed vigorously.
2. Transferrin-polylysme (from Boehringer Ingelhelm, Austria). 3 DMEM (no serum) (Gibco-BRL, Galthersburg, MD, cat no 3 1600) with 3 7 g/L
NaHCO,, 2 mM L-glutamme, 100 IU pemclllm, 100 pg/mL 4 DMEM 10% FCS. (Glbco/BRL cat. no. 31600) with 3 7 g/L NaHC03, 2 mM
glutamme, 100 IU penicillin, 100 pg/mL streptomycin and 10% (v/v) fetal calf serum. All sera are heat inactivated at 56°C for 60 mm before addltlon to medium.
3. Methods 3.1. Psoralen Inactivation of Adenovirus, Quantitation
3. I I 7. Choice of Adenovirus
When psoralen-inactivated virus 1s to be used, the genotype of the vn-us IS not critical because all gene expression from the virus is extinguished by the psoralen treatment. Two other considerations can influence the choice of virus One practical consideration is the growth of the virus. Adenovn-us serotypes such as Ad2 or Ad5 or CELO that can be easily and rapldly grown to high titer wtll facilitate preparative work. Safety conslderatlons also suggest the use of a genetically defective vtrus so that the combined genetic defect and the psoralen inactivation give two blocks to virus replication. We normally use the E4- defective Ad5 dl1014 from Gary Ketner (31) grown on the E4-complementmg cell line W 162 (32) The virus grows nicely, and the complementing cell line IS very easy to handle.
Psoralen mactivation of adenovirus was developed as a method of disrupt- ing the vn-al genome without lmpalrmg the viral capsld and the virus entry properties (33). Whereas other methods of vnus mactlvatlon exist (short wave- length UV light, heat inactivation, formaldehyde treatment), these methods can severely damage the protein component of the virlon as much or more than the nucleic acid and thus generate vlrions that are no longer competent to enter cells (and are no longer useful for codehvery of DNA). Psoralen enters the capsld and intercalates in the viral DNA. Upon exposure to long-wavelength UV light (360 nm), covalent psoralen/DNA crosslinks are generated that effec- tively block DNA replication and RNA synthesis from the viral template
The methods described in this chapter employ CsCl-purified adenovirus particles. Pure adenovu-us IS essential for several reasons, Because the vu-us 1s eventually used m a psoralen-inactivated form, it is not possible to quantltate the virus by plaque assay or other assays that measure the infection or replica- tion properties of the virus. Therefore, physical methods to measure virus par- ticle numbers are used and these requtre that the only protem or DNA m the preparation 1s from the virus particle. A detailed protocol of the CsCl-punfica- tlon method used m our laboratory has been published (16).
Transfection Complexes
1. Place purified adenovirus in HBS/40% glycerol (300 l&/well) m a 4-well tissue ceil-culture dish (NUNC cat. no 176740) or 24-well dish (NUNC cat no 143982). Other adenovirns-storage buffers, for example, containing sucrose, or vuus directly from CsCl gradient should also be suitable
2. Add an aliquot (1.5 pL) of 33 mg/mL 8-methoxy psoralen (m DMSO) to each 300-pL sample and the psoralen and virus are incubated for 20 min at room tem- perature The room-temperature incubation facilitates penetration of the virion by psoralen A psoralen precipitate forms immedtately. This is normal and does not interfere with the mactivation This concentration is at the solubility bmtt of psoralen Curiously, however, lower concentrations of psoralen are not as effec- tive in inactivatmg adenovuus.
3. Place the plate on ice (wtth cover on), 3 cm below the filter of a 365nm light source (UVP model TL-33) The plastic cover functions as a filter, blockmg shorter wavelengths of UV light that could be absorbed by and damage the vmon capstd protems
4 Irradiate the plate for 25 min, repositioning the samples every 10 mm to ensure that no virus remains m a shadow.
5. Remove unmcorporated psoralen by passing the virus over either a Pharmacla PD-10 gel filtration column (for 2 mL volumes) or a Nick column (for 400 pL volumes) equilibrated with HBS/40°h glycerol. Dialysis is not an effective method of removmg free psoralen.
6 Quantitate the purified virus by protein or DNA measurement (see below) and freeze the virus rn aliquots at -70°C.
3.1.2. Quantitating Adenovirus
The tradttional method of quantitatn-tg adenovirus is the plaque assay. However, plaque assays require replicatton-competent virus and are thus not suttable for quan- tttating psoralen-inactivated adenovirus particles. The adenovirus methods described m this chapter use CsCl -purified virus parttcles and the sole proteins and nucleic acids m the preparation are virion proteins and DNA. The virus ttter can therefore be determined by simply measuring either the protein or DNA and using a conversion factor to calculate viral particles. These methods are fast and rela- tively precise and because they do not require virus replication, inactivated vrrus preparations can be quantitated. A method for determining the protein content of an adenovtrus preparation usmg a Bradford protein assay is described below.
1. Pipet a quantity of water (800 pL minus the sample volume) mto an Eppendorf tube. Dilute the vnus sample (IO-40 pL) into the water.
2. Add Bio-Rad protem reagent (200 pL) and mix the contents of the tube are mixed by vortexing.
3. Measure the absorbance of the sample at 595 nm 4 Prepare a standard curve using aliquots of bovme serum albumin (2-50 PL of
1 mg/mL BSA) The standard curve and the absorbance value of the virus sample are used to determme the protein concentration of the vnus sample
300 Cotten, Saltik, and Baker
5. The vu-us parttcle concentration is determined usmg the converston factor of 1 mg/mL protein = 3.4 x lOI2 virus particles/ml (36)
As an alternative to the protein method, adenovn-us can also be determined by DNA content (one absorbance umt (A260) equals 1Or2 virus particles per mL, ref. 34). The disadvantages are that an additional step to liberate the DNA from the vrrion IS required and empty virions cannot be measured accurately because of then limited DNA content. (A thorough discussion of adenovnus quantrtation techniques can be found in ref. 35.)
3.2. Preparation of L PS-Free DNA Using Triton X-7 14
LPS, when internalized during adenovnus entry, can activate a severe toxrc- ity in many primary cell types (37,38). Most plasmrd DNA preparattons are contaminated with a significant amount of LPS unless measures are taken to remove the contaminant. Two methods of removing LPS from DNA have been described (3 7) based on etther a Triton X- 114 extraction of DNA (30,39,40) or a polymyxin B affimty chromatography (16,37). The two methods give com- parable results for LPS removal as well as DNA recovery. The Trrton method is much less expensive and faster but cumbersome for larger volumes and drf- ficult to validate for GMP processes. The Triton method functions because Triton X-I 14 is miscible wrth aqueous samples below its cloud point of 20°C. Above 2O“C, the detergent partrtrons into a separate, denser phase, carrying with rt any LPS in the sample. This extractron IS carried out three times to remove LPS. A final alcohol precrprtatron serves to remove any traces of Tri- ton X-l 14.
3.2.1. Triton X- 17 4 Extraction of Plasmid D/VA
1 Prepare plasmtd DNA from overnight cultures of the plasmtd-transformed bacte- rial strains using a method that gives suttable purtty. These include banding to equtlibrium m CsCl after a lysozyme dtgestton, Trtton X-100 lysts of cells (42), or alkaline lysts of cells followed by ton-exchange chromatography using col- umns from Qtagen (Dtagen GmbH, Hilden, Germany) or Nucleobond (Macherey- Nagel, Duren Germany) following the dtrecttons supplied by the manufacturers
2. Add l/lOth volume 3 Msodium acetate, pH 7.5, to the DNA samples (0 l-l 5 mg/mL in TE)
3 Add 3 p.L of Trtton X-l 14 per 100 pL DNA solution; vortex the sample thoroughly. 4. Incubate on ice for 10 min to allow the Triton and aqueous phases to mix. 5 Transfer the sample to a 30-37’C heating block for 5 mm to allow the two phases
to separate (the cloud pomt of Trtton X- 114 1s approx 20°C) 6. Centrifuge samples in an Eppendorf centrifuge for 2 min at 33Og. 7. Transfer the aqueous phase to a fresh Eppendorf tube. (The aqueous phase 1s
the upper phase, the Trtton accumulates as a small “button” at the bottom of the tube.)
Transfection Complexes 301
8. Repeat this extra&Ion {steps 4-7) two additional times. 9 Preclpltate the DNA m the final aqueous phase by adding 0 7 vol of isopro-
panol at room temperature, mixing well, and centrifuging at room tempera- ture for 8-10 min
10. Wash the precipitate twice with 80% cold ethanol (-20°C), air-dry, and resus- pend the precipitated DNA in TE at approx 0.5-l mg/mL.
11. Quantitate the DNA by absorbance at 260 nm (an absorbance of l= 0 05 mg/mL).
3.22. Monitoring the LPS Content of DA/A
LPS removal can be quantitated using a semiquantitatlve but fast limulus clotting assay (Sigma E-Toxate, cat. no. 210-Dl) or preferably, a colorometrlc assay using a chromogenic substrate (BioWhittaker, QCL-1000). Alternately, a very sensitive assay of LPS contamination involves following the changes m the morphology of primary skin fibroblasts after adenovnus-medlated trans- fectlon of test DNA with DNA contaminated with more than 30 ng/6 c(g of DNA generating a rapid (4-6 h) toxicity in these cells (37,38).
3.3. Preparation and Application of AdenoviruslPElDNA Transfection Complexes
A typical transfectlon experiment might use a 24-well plate with 20- 50,000 cells per well, plated 24 h before the transfection. The transfection complexes are prepared and Just prior to adding the complex to the cells the medium in each well 1s replaced with 2.50 PL of medium without serum. 50 PL of complex IS added per well and at least three wells are trans- fected with each transfection complex; hence a 24-well plate allows one to test eight variations. If only three wells are to be transfected, the com- plex described below can be prepared with half volumes. Alternately, one 500-yL transfection complex can be used to transfect nine wells, allow- mg the investigator to harvest three sets of wells at three different times posttransfection. The 6 I-18 of DNA used in each reaction can be a mixture of several plasmids and many experiments demonstrate that individual cells receive all plasmids in the mixture. It is critical, however, that the ratio of PEI to DNA remam constant. Therefore, a good supply of empty plasmid, prepared by the same method should be available. There are two major cautions to keep in mind with the PEVadenovirus system. First, do not dilute the complex. (Never use less than 50 & of PEI/DNA per 250 of medium.) Second, avoid serum during the 4-h transfection period.
1 Dilute DNA (6 pg) in 250 pL of 20 mM HEPES, pH 7.4. 2 Dilute PEI (24-30 & of 10 mM PEI, pH 7.0) in 250 & of 20 mM HEPES, pH 7 4 3. The 250 pL of PEI solution is added in four to five drops to the DNA, gently
agitating the DNA after each drop is added. Total time of additton 1s approx 1 mm
302 Cotten, Salt/k, and Baker
4. The sample is incubated at room temperature for 20 mm. Add an aliquot of aden- ovnus (1 5-5 pL, 2.5 x lo9 particles/pL in HBS [ 150 mMNaCl,20 WHEPES pH 7.41 containing 40% glycerol) to the PEI/DNA
5. After an additional 20 min at room temperature, add ahquots of the complex to cell culture medium without serum (e.g., 50 pL of transfection complex for 250 pL of medium covermg 20,000-50,000 cells m a 1.5-cm diameter well, e g., the well of a 24-well dish). This is the maximum dilution to be used for the PEI/ DNA/adenovnus complexes Unlike the streptavtdm/btotin adenovnus com- plexes (6), the PEI/DNA/vnus complexes are sensitive to dilution.
6. Followmg a 4-h mcubatton at 37°C replace the transfection medium by fresh normal medium, at optimum volume and FCS concentration.
7. The harvest of cells and analysts of gene expression can begin as early as 12 h posttransfection. Optimum gene expression depends on the cell type, promoter, and gene, and should be determined emptrically.
4. Notes 4.1. Parameters That Can Be Altered to Enhance Gene Expression
1. Titrate the level of PEI m the system, keeping the DNA constant. Small uncer- tainties m the PEI concentration and in the DNA concentration may exist and a modest titration can generate useful improvements.
2 Vary the quantity of adenovirus used, keeping the PEI and DNA constant. Large quantities of adenovirus (e.g , 10,000 particles/cell) give very good gene delivery results at 24 h, they can result in a toxicity at later times More modest virus levels can give useful gene delivery at later times One limitatron with the PEI system relative to the streptavtdm/btotm or chemical linkage methods is that the PEI/DNA complexes are very senstttve to dilution and the PEI/DNA mteractions reverse rapidly upon dilution. Therefore if one wants to lower vnus/cell ratios It 1s better to keep the PEI/DNA constant and add less vtrus to the complex, rather than to simply add less of a PEI/DNA virus complex.
3 If no gene expression is obtained and the treated cells appear similar to untreated controls (density, proliferation), this suggests that the transfection complexes are not entering the cell. There are several reasons why this might happen a. The cells are too confluent because endocytosis and vnus entry are down-
regulated m many cell types upon confluence. Be certain that cells to be trans- fected are not too confluent at the time of transfectlon However, confluency seldom results in a complete block to transfection success.
b The adenovirus preparation is poor. Adenovirus stored m the absence of glyc- erol or sucrose can lose entry functions upon multiple freeze/thaw cycles Use of a short-wavelength UV lamp rather than the 350-nm lamp can damage the protein and entry capacity of the virus.
c. The cell type is not susceptible to entry by the adenovirus serotype used. d. The DNA concentration 1s incorrect. The wrong DNA:PEI ratio can result m
preciprtatron of the complex.
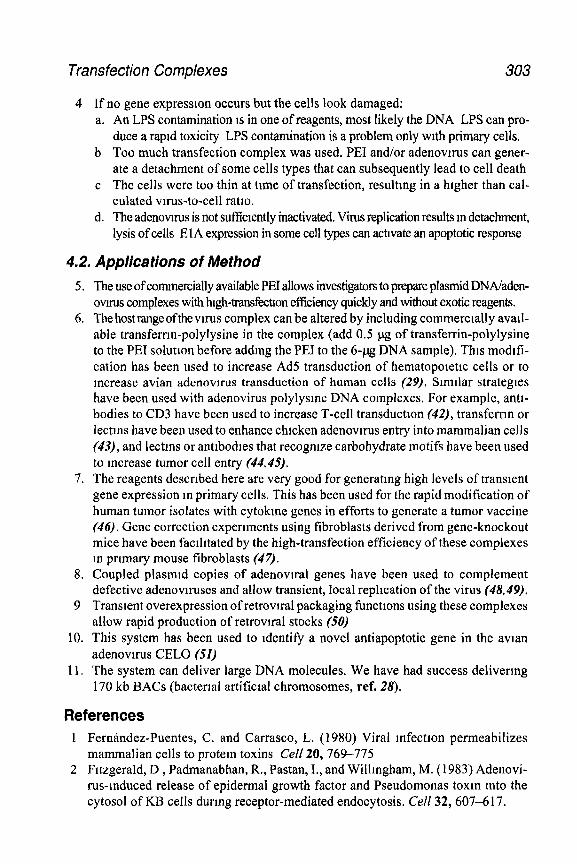
Transfection Complexes 303
4 If no gene expresslon occurs but the cells look damaged: a. An LPS contamination 1s in one of reagents, most likely the DNA LPS can pro-
duce a rapid toxicity LPS contamination is a problem only with primary cells. b Too much transfection complex was used. PEI and/or adenovnus can gener-
ate a detachment of some cells types that can subsequently lead to cell death c The cells were too thin at time of transfection, resultmg in a higher than cal-
culated virus-to-cell ratio. d. The adenovnus is not sufficiently inactivated. Virus replication results m detachment,
lysis of cells E 1A expression in some cell types can activate an apoptotic response
4.2. Applications of Method
5. The use of commercially available PEI allows investigators to prepare plasmid DNA/aden- ovnus complexes with hgh-transfwtion efficiency quickly and without exotic reagents.
6. Thehostrangeofthevn-us complex can be altered by including commerctally avall- able transferrm-polylysine in the complex (add 0.5 pg of transferrin-polylysine to the PEI solution before adding the PEI to the 6-pg DNA sample). This modlfi- cation has been used to increase Ad5 transduction of hematopoletlc cells or to Increase avian adenowrus transduction of human cells (29). Similar strategies have been used with adenovirus polylysme DNA complexes. For example, anti- bodies to CD3 have been used to increase T-cell transduction (42), transferrm or lectms have been used to enhance chlcken adenovlrus entry into mammalian cells (43), and lectms or antIbodies that recognize carbohydrate motifs have been used to increase tumor cell entry (44,45).
7. The reagents described here are very good for generatmg high levels of transient gene expression m primary cells. This has been used for the rapid modification of human tumor isolates with cytokme genes in efforts to generate a tumor vaccine (46). Gene correction experiments using fibroblasts derived from gene-knockout mice have been facrhtated by the high-transfection efficiency of these complexes m primary mouse fibroblasts (47).
8. Coupled plasmld copies of adenovlral genes have been used to complement defective adenovuuses and allow transient, local replication of the virus (48,49).
9 Transient overexpression of retrovlral packaging functions using these complexes allow rapid production of retrovlral stocks (50)
10. This system has been used to identify a novel antiapoptotic gene in the avlan adenovuus CELO (51)
11. The system can deliver large DNA molecules. We have had success delivering 170 kb BACs (bactenal artificial chromosomes, ref. 28).
References 1 FernQndez-Puentes, C. and Carrasco, L. (1980) Viral infection permeabilizes
mammalian cells to protem toxins Cell Z&769-775 2 Fitzgerald, D , Padmanabhan, R., Pastan, I., and Willmgham, M. (1983) Adenovi-
rus-Induced release of epidermal growth factor and Pseudomonas toxm mto the cytosol of KB cells durmg receptor-mediated endocytosis. Cell 32, 607-617.
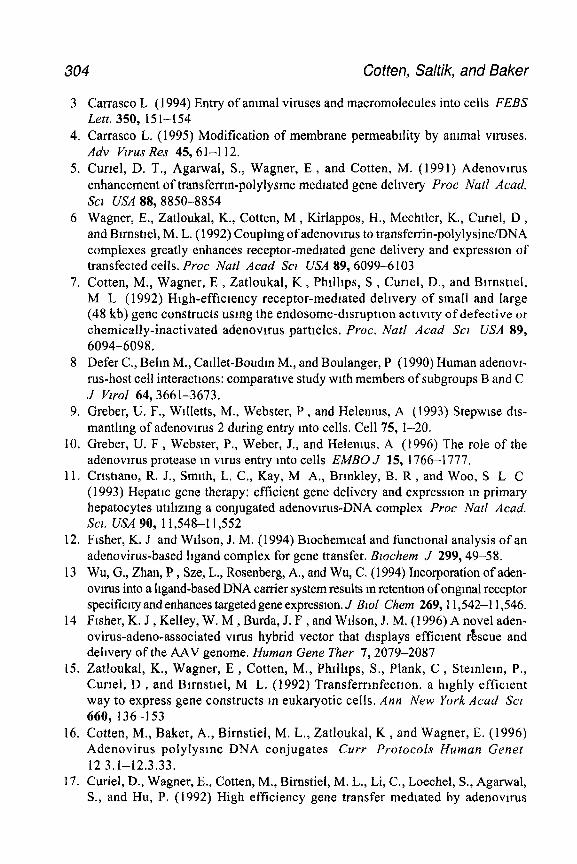
304 Cotfen, Sakik, and Baker
3 Carrasco L (1994) Entry of animal viruses and macromolecules into cells FEBS Lett. 350, 151-154
4. Carrasco L. (1995) Modification of membrane permeability by animal vuuses. Adv Vu-us Res 45,61-l 12.
5. Currel, D. T., Agarwal, S., Wagner, E , and Cotten, M. (1991) Adenovtrus enhancement of transferrm-polylysme mediated gene delivery Proc Nat1 Acad. Scl USA 88,885~8854
6 Wagner, E., Zatloukal, K., Cotten, M , Kirlappos, H., Mechtler, K., Curiel, D , and Bunstiel, M. L. (1992) Coupling of adenovuus to transferrin-polylysine/DNA complexes greatly enhances receptor-mediated gene delivery and expresston of transfected cells. Proc Natl Acad Scz USA 89,6099-6103
7. Cotten, M., Wagner, E , Zatloukal, K , Phillips, S , Currel, D., and Birnstiel, M L (1992) Hugh-efficiency receptor-mediated delivery of small and large (48 kb) gene constructs usrng the endosome-disruption activity of defective or chemically-inactivated adenovtrus particles. Proc. Nat1 Acad Scz USA 89, 6094-6098.
8 Defer C., Belm M., Catllet-Boudm M., and Boulanger, P (1990) Human adenovi- rus-host cell interactions: comparative study with members of subgroups B and C J Vzrol 64,3661-3673.
9. Greber, U. F., Wtlletts, M., Webster, P , and Helenms, A (1993) Stepwise dts- mantlmg of adenovnus 2 during entry mto cells. Cell 75, I-20.
10. Greber, U. F , Webster, P., Weber, J., and Helemus, A (1996) The role of the adenovu-us protease m vnus entry mto cells EMBO J 15, 1766-1777.
11. Crtsttano, R. J., Smith, L. C., Kay, M A., Brinkley, B. R , and Woo, S L C (1993) Hepatic gene therapy: efficient gene delivery and expresston m primary hepatocytes utilizing a coqugated adenovuus-DNA complex Proc Nat1 Acad. SCL USA 90, 11,548-l 1,552
12. Fisher, K. J and Wilson, J. M. (1994) Biochemtcal and functional analysis of an adenovirus-based hgand complex for gene transfer. Blochem J 299,49-58.
13 Wu, G., Zhan, P , Sze, L., Rosenberg, A., and Wu, C. (1994) Incorporation of aden- ovnus into a hgand-based DNA carrier system results m retention of ortgmal receptor specificity and enhances targeted gene expression. J Blol Chem 269,11,542-l 1,546,
14 Fisher, K. J , Kelley, W. M , Burda, J. F , and Wilson, J. M. (1996) A novel aden- ovirus-adeno-associated vnus hybrid vector that displays efficient &cue and delivery of the AAV genome. Human Gene Ther 7,2079-2087
15. Zatloukal, K., Wagner, E , Cotten, M., Philltps, S., Plank, C , Stemlem, P., Curie& D , and Btrnstlel, M L. (1992) Transferrmfection. a highly efficient way to express gene constructs m eukaryotic cells. Ann New York Acad Scl 660, 136-153
16. Cotten, M., Baker, A., Birnstiel, M. L., Zatloukal, K , and Wagner, E. (1996) Adenovirus polylysme DNA conjugates Curr Protocols Human Genet 12 3.1-12.3.33.
17. Curiel, D., Wagner, E., Cotten, M., Birnstiel, M. L., Li, C., Loechel, S., Agarwal, S., and Hu, P. (1992) High efficiency gene transfer mediated by adenovtrus
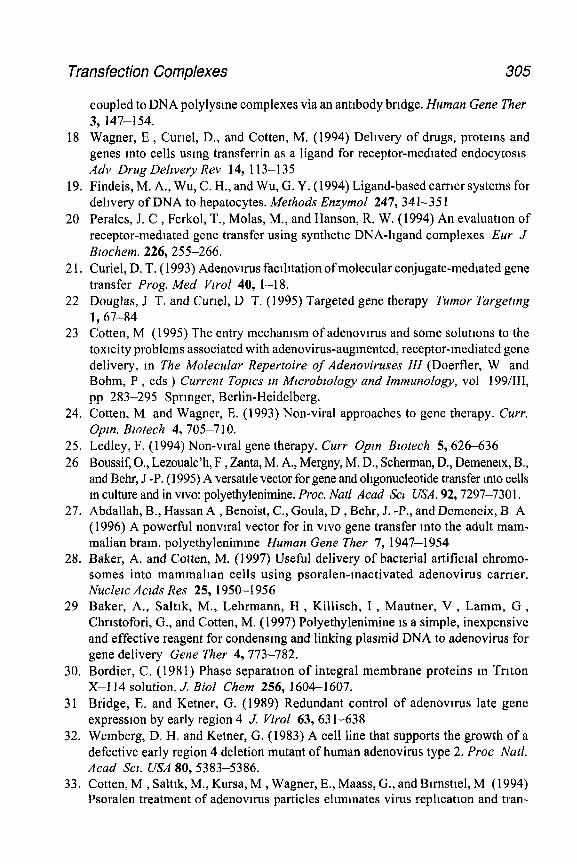
Transfection Complexes 305
coupled to DNA polylysme complexes via an antibody bridge. Human Gene Ther 3, 147-l 54.
18 Wagner, E , Curtel, D., and Cotten, M. (1994) Delivery of drugs, proteins and genes mto cells usmg transferrin as a ligand for receptor-medtated endocytosis Adv Drug Delivery Rev 14,113-135
19. Findeis, M. A., Wu, C. H., and Wu, G. Y. (1994) Ligand-based carrter systems for delivery of DNA to hepatocytes. Methods Enzymol 247, 341-35 1
20 Perales, J. C , Ferkol, T., Molas, M., and Hanson, R. W. (1994) An evaluation of receptor-mediated gene transfer using synthetic DNA-hgand complexes Eur .I Btochem. 226,255-266.
2 1, Curie& D. T. (1993) Adenovnus facthtation of molecular conjugate-mediated gene transfer Prog. Med Vzrol 40, l-18.
22 Douglas, J T. and Curie& D T. (1995) Targeted gene therapy Tumor Targetzng 1,67-84
23 Cotten, M (1995) The entry mechamsm of adenovtrus and some solutrons to the toxicity problems associated with adenovirus-augmented, receptor-mediated gene delivery, m The Molecular Repertoire of Adenoviruses III (Doerfler, W and Bohm, P , eds ) Current Topccs tn Mtcrobtology and Immunology, vol 199/III, pp 283-295 Springer, Berlin-Heidelberg.
24. Cotten, M and Wagner, E. (1993) Non-viral approaches to gene therapy. Curr. Opm. Btotech 4, 705-7 10.
25. Ledley, F. (1994) Non-viral gene therapy. Curr Open Btotech $626-636 26 Boussif, O., Lezoualc’h, F , Zanta, M. A., Mergny, M. D., Scherman, D., Demenetx, B.,
and Behr, J -P. (1995) A versatile vector for gene and ohgonucleotide transfer mto cells m culture and in VIVO: polyethylenimine. Proc. Nat1 Acad Set USA. 92,7297-7301.
27. Abdallah, B., Hassan A , Benoist, C., Goula, D , Behr, J. -P., and Demeneix, B A (1996) A powerful nonvnal vector for in viva gene transfer into the adult mam- malian bram. polyethylenimme Human Gene Ther 7, 1947-1954
28. Baker, A. and Cotten, M. (1997) Useful delivery of bacterial artificial chromo- somes into mammalian cells using psoralen-Inactivated adenovirus carrier. Nuclex Actds Res 25, 1950-l 956
29 Baker, A., Saltik, M., Lehrmann, H , Killisch, I , Mautner, V , Lamm, G , Christofori, G., and Cotten, M. (1997) Polyethylenimine is a simple, inexpensive and effective reagent for condensmg and linking plasmid DNA to adenovirus for gene delivery Gene Ther 4,773-782.
30. Bordier, C. (1981) Phase separatron of integral membrane proteins m Trtton X-l 14 solution. J. Biol Chem 256, 1604-1607.
3 1 Bridge, E. and Ketner, G. (1989) Redundant control of adenovtrus late gene expression by early region 4 J. Virol 63, 63 l-638
32. Wemberg, D. H. and Ketner, G. (1983) A cell line that supports the growth of a defective early region 4 deletion mutant of human adenovirus type 2. Proc Natl. Acad Set. USA 80,5383-5386.
33. Cotten, M , Salttk, M., Kursa, M , Wagner, E., Maass, G., and Bunstiel, M (1994) Psoralen treatment of adenovnus particles eliminates virus replication and tran-
306 Cotten, Saltik, and Baker
scription while maintaining the endosomolytic activity of the vnus capsid Vzrol- ogy 205,254--26 1
34. Chardonnet, Y. and Dales, S (1970) Early events m the mteractton of adenovnuses with HeLa cells: penetration of type 5 and mtracellular release of the DNA genome. Vu-ology 40,462-477.
35. Mtttereder, N., March, K. L , and Trapnell, B C. (1996) Evaluatton of the con- centration and bioactivity of adenovnus vectors for gene therapy J Vwol 70, 7498-7509.
36 Lemay, P., Boudin, M., Milleville, M , and Boulanger, P (1980) Human ad- enovirus type 2 protein IIIa. I Purification and characterization Vzrology 101, 131-143.
37. Cotten, M., Baker, A, Salttk, M., Wagner, E., and Buschle, M. (1994) Lipopolysacchartde IS a frequent contaminant of plasmid DNA preparations and can be toxic to primary cells m the presence of adenovirus. Gene Ther 1, 239-246.
38. Cotten, M. and Salttk, M. (1997) Intracellular delivery of LPS during DNA trans- fectton activates a lipid A-dependent cell death response that can be prevented by polymyxm B. Human Gene Ther 8,555-562.
39 Manthorpe, M , Cornefert-Jensen, F , Hartikka, J , Felgner, J , Rundell, A , Margahth, M., and Dwarki, V. (1993) Gene therapy by mtramuscular inJection of plasmid DNA: studies on firefly luciferase gene expression m mice Human Gene Ther 4,419-431
40. Aida, Y. and Pabst, M. J. (1990) Removal of endotoxin from protein solutions by phase separation using Trtton X-l 14. J Zmmunol. Methods 132, 191-195
41. Cotten, M., Wagner, E , and Bnnstiel, M L (1993) Receptor-mediated transport of DNA mto eukaryotic cells. Methods Enzymol 217, 618-644
42 Buschle, M , Cotten, M., Knlappos, H., Mechtler, K , Schaffner, G , Zauner, W , Birnstiel, M. L., and Wagner, E (1995) Receptor-mediated gene transfer mto hu- man T-lymphocytes via binding of DNA/CD3 antibody particles to the CD3 T cell receptor complex. Human Gene Ther 6,753-76 1
43. Cotten, M., Wagner, E., Zatloukal, K., and Birnstiel, M. L. (1993) Chicken adenovi- rus (CELO virus) particles augment receptor-mediated DNA delivery to mammahan cells and yield exceptional levels of stable transformants. J Vzrol. 67, 3777-3785
44 Thurnher, M., Wagner, E , Clausen, H , Mechtler, K , Ruscom, S , Dmter, A , Berger, E., Birnsttel, M., and Cotten, M. (1994) Carbohydrate receptor-mediated gene transfer to human T-leukemic cells. Glycobzology 4,429-435.
45 Batra, R. K , Wang-Johanning, F., Wagner, E., Garver, R. I , and Curiel, D T (1994) Receptor-mediated gene delivery employmg lectm-bmdmg specificity Gene Ther 1,255-260.
46. Zatloukal, K., Schneeberger, A., Berger, M., Schmidt, W., Koszik, F., Kuttl, R , Cotten, M., Wagner, E., Buschle, M., Maass, G., Payer, E , Stingl, G , and Btrnstiel, M L. (1995) Elicitation of a systemic and protective antimelanoma tm- mune response by an h-a-based vaccine. assessment of critical cellular and mo- lecular parameters. J Immunol. 154, 3406-3419.
Transfection Complexes 307
47 Schrerber, M., Baumann, B., Cotten, M., Angel, P , and Wagner, E. F (1995) c-Fos is an essential component of the mammalian UV response. EMBO J 14, 5338-5349.
48. Goldsmith, K T., Currel, D. T., Engler, J. A., and Garver, R. I. (1994) Trans complementation of an E 1 A-deleted adenovirus with codehvered E 1 A sequences to make recombmant adenovtral producer cells. Human Gene Ther 5,134 l-l 348.
49 Scarra, A , Currel, D T , and Kay, M A. (1995) Complementatron of a human adenovirus early region 4 deletion mutant in 293 cells usmg adenovrrus-polyl- ysme-DNA complexes. Gene Ther 2,295-298.
50 von Ruden, T., Stmgl, L., Cotten, M , Wagner, E , and Zatloukal, K (1995) Gen- eratron of high titer retrovrral vectors following receptor-mediated adenovuus- augmented transfection of packaging cell lines. BzoTechnzques l&484-489
51. Chrocca, S., Baker, A., and Cotten, M. (1997) Identrficatron of a novel anti- apoptotrc protein, GAM-1, encoded by the CELO adenovrrus J Viral 71, 3168-3177.

25
Phylogenetic Analysis of Adenovirus Sequences
Proof of the Necessity of Establishing a Third Genus in the Adenoviridae Fami/y
Balazs Harrach and Mdria Benkii
1. Introduction Bovine adenovrrus (BAV) serotypes 4 through 8 have been found clearly
drstmgutshable from BAVs 1,2,3, and 9 and from all other mastadenovn-uses, and were therefore classified as subgroup 2 BAVs (I) and were considered as candtdate members of a new taxon (2). The distinction was origmally based on biological properties, such as the requirement of primary cell culture for propa- gation, the special appearance of the caused inclusion bodies, and the lack of antigemc crossreaction with other mastadenoviruses (I). The separation was later strengthened by DNA studies revealing special restriction-enzyme pat- tern, smaller genome size (3) and lack of cross-DNA hybridization with sub- group 1 BAVs (4). Similarly, the egg-drop syndrome (EDS) vnus (5) seemed to be an atypical aviadenovirus (a-9) and was described as a candidate mem- ber of a new genus (2). The official classificatron of subgroup 2 BAVs mto a new genus and the EDS virus into a new Aviadenovirus genus was, however postponed, until further evidence is gathered (2,1/I). Recently, a new ovine adenovirus isolate (OAV287) emerged (II) that differed from the offctally accepted OAV serotypes (12,13). The genome of OAV287 has been completely sequenced and was found to have a genomtc orgamzatron different from that of HAV-2 and most of other mastadenoviruses (14,15). Because of the close genetic relationship found (based on comparative study of a single gene sequence), we have informally proposed at different adenovuus meetings that subgroup 2 BAVs, OAV287, and EDS virus should all be classified mto a common taxon. This could be a new (third) genus, with a proposed name of ATadenovirus describing the characteristic high AT content found in theu-
From Methods m Molecular Medmne, Vol 27 Adenovws Methods and Protocols Edlted by W S M Wold 0 Humana Press Inc , Totowa, NJ
309
310 Harrach and BenhO
genomes (16). The idea evoked considerable oppositton, perhaps mainly because all the 5 1 types of human adenovnuses (HAVs) (17,18) are very simt- lar to each other compared to the differences between the two subgroups of BAVs containing only nine offictally accepted serotypes (10). Furthermore, the sequencing and genetic study of BAVs (and generally of all animal adenovn-uses) were missing, but were required before a decision could have been made. The situatton changed sigmficantly recently, since two animal adenovirus genomes have been completely sequenced (15,19), and our group also have sequenced and analyzed characteristic genome parts of different animal adenoviruses.
The use of computers to perform systematic phylogenetic analysts of viral sequences (for summary; see ref. 20) opened a possibility of giving quantita- tive answers to the mam questtons. how different are these “exotic” adeno- vtruses? How does their distinctness relates to that between the “classtcal” members of the Mastadenovzrus and the Aviadenovirus genera? Does the genetic distance merit the establishment of a new genus? We would like to demonstrate that computerized phylogenetrc analysis can be a very valuable tool to answer taxonomical questions, and it should be applied together with the traditional virological methods. Ultimately, the different methods together should form the final picture. Although this mathematical analysts is becoming more and more accepted, it is yet sometimes heavily criticized or ignored. Our intention is to show that the application of phylogenettc analysis is very easy and straightforward for anybody with access to a personal computer. During the description of the recommended methods, we would like to answer some ques- tions and doubts concerning our proposal. We will demonstrate that the evolu- tionary distance between the proposed new genus and the Mastadenovzrus or Aviadenovirus genera is as large as between these two offictally accepted gen- era. If the Mastadenovzrus-Aviadenovzrus distance is an adequate genetic dis- tance for the dtstmction, the same distance of a new cluster logtcally would require the establishment of a third genus. It is especially so, because these tindmgs are not the solely or primary basis of the proposal; on the contrary, they are just supporting and justifying old biological observations.
2. Materials 2.1. Hardware
The usual laboratory computers: IBM-compatible 386s or 486s (with or without mathematical coprocessor), Macinthosh, or UNIX-based computers will suffice. However, having more power (Pentmm processor) and memory (e.g., 16 MB instead of 8) will yield speed. This may be important, e.g., m bootstrap calculation (see Subheading 3.3.3.1.), when distance analysis with a
Phylogenetic Calculations 311
normal 100 data set sampling of a 900-residue-long ammo acid sequence may take 10 h on an IBM 486DX2/66 MHz computer.
2.2, Software We have used the PHYLIP (Phylogeny Inference Package Version 3.5~)
written and freely distributed by Joseph Felsenstein (22,22). It can be down- loaded by anonymous ftp. The procedure to obtain the program package through the Internet, and run It 1s described in detail in Subheading 3.
We describe below the use of the version for Windows 3.1. Some small differences in the use of the program package on platforms DOS and Win95 can be found m Subheading 4.; usage of the Macintosh, PowerMac, and UNIX versions 1s described m the dot files of those versions.
3. Method
3.1. Setup of the PHYLIP Programs 3.1.1. How to Get It
You can get the necessary files (including the documentation) through the World Wrde Web (www). Use any Internet browser program, e.g., Netscape Navigator or Internet Explorer. Open the followmg address (anything to be typed mto the computer 1s shown in courier).
http://evolution.genetics.washington.edu/phylip.html
You will find interesting information about this and similar phylogenetlc programs, and a menu selection will take you to a page to fetch the necessary files. I will assume that you want to run the program under Windows 3 1. It is clearly shown that you have to click on the following files:
Documentation an; C source code 386 Windows executables, part 1 386 Windows executables, part 2 386 Wmdows executables, part 3
Save these files on your computer m a location you will have access to later.
3.1.2. How to Get It to Run
1. Open a subdn-ectory named PHYLIP. 2 Copy the above four files mto this subdirectory 3 Start all four of them (e.g , phylip <enter>, and so on). They will unpack
themselves, resultmg m many files, including very useful document files 4 Move the phyllp.grp group file mto the WIN (or WINDOWS) subdlrectory
(where most probably you will find other .grp files, too) Move the dos4gw file into the DOS subdu-ectory or to the WINDOS (or WIN) subdirectory, where your
312 Harrach and Benkti
Windows program files are. If your computer is a 386 compatible without math coprocessor, you also have to deal with an emulator program of the package according to the description found in the readme.wm text file Rename font2 (or your choice of font from the offered six types) to be called font f i 1 e
5 Start the wmdows (win), and open the group tile (click on Frle, New, Group of files, give the name Phylip 3 .5c, <O.K.>). You will see 30 icons (pro- grams) in a window called Phylip 3 5c
3.2. Choosing and Getting the Sequences for Analysis
You have to analyze homologous sequences, since these programs analyze the occurrence and the number of (supposedly) independent mutations of origi- nally identical sequences. One can expect to find homologous sequences m the penes (as they are coding proteins with special structures requrred for their biological role), whereas the noncoding sequences may evolve faster, with large deletions or insertions, instead of point mutations. To gain statistically significant data, the length of the sequences should be over a certam limit. The required minimal length varies accordmg to the heteronenertv of the studted sequences. Dealing with adenovnuses from different hosts, we have found that, e.g., an amino acid sequence alignment should be longer than 160-190 rest- dues (after removing the nonhomologous regions; see Subheadings 3.3.2. and 4.). This means that shorter sequences (from a single sequencmg reaction) may gave only very tentative data. Certain adenovirus proteins are simply too small to be usable in phylogenetic analysis. For example, It IS practically not pos- sible to make phylogenetic calculations using the amino acid sequences of the 1 1-kDa (pX) protein of different adenovnuses. Srmilarly, pVI1 seems to be useless for this purpose because its amino acid sequences are not only quite short, but they are also constderably heterologous, and then homologous parts (applicable in the analysis) are too short.
For an easy start, a comparison of amino acid sequences may be suggested. It is easier to obtain and align them, and they seem to give more explicit patterns than DNA sequences. To find all the available homologous sequences (or to check if there are new ones submitted that you are not aware of), you may send a query to GenESank. A simple e-mail will let you know all the available sequences (or ensure that you have got all of them). You can send the chosen protein sequence, e.g., to the heurtstic homology search program blast (23,24) of the National Center for Biotechnology Information (NCBI), m the form as follows.
PROGRAM blastp DATALIB nr BEGIN >any name to identify your sequence MGSSEQELKAIVKDLGCGPYFLGTYDKRFPGFVSPHKL......
Phylogenetlc Calculations 313
(No numbers, question marks, and nonIUPAC abbreviations.) Send the e-mail to blas t@ncbi . nlm. nih. gov. If you want to compare nucleo- tides, request program blas tn.
The nicest feature of the blast program is that it may provide useful informa- tion rtght away when the very first crude DNA sequence 1s obtained. The blastx program ~111 translate the DNA sequence in all the three reading frames m both directions, and on the basis of homology to other proteins present m the databanks will find the most closely related proteins. In the case of adenoviruses, this program almost always results in the identification of the genes. This fast identification might be possible even with a very short stretch of DNA sequence. If, e.g , a DNA fragment of cellular origin has been cloned, or if the plasmid is empty, the blastx result will let you know it right away. (For a more detailed description of the program blast, send the word “help” to the same address.)
From the blast answer, you will see what kind of sequences are available in the databank, and that they can be obtained m one of two very easy ways. Started recently, the blast answers may contain hypertext mformation. To get it, write a further line: HTML yes before the lme of BEGIN m an e-mall shown on the previous page.Gtvmg a name to the received file wtth an . htm exten- sion and lookmg at it by a www browser program (e.g., Netscape), the acces- sion numbers will be blue. You simply click on any of them, and Netscape gets the sequences rtght away. To get any sequence by simple e-mall, Just sendane-mailcommandto [email protected]:
DATALIB gb BEGIN <accession number(s)>
(or sp /=SWISS-PROT/)
(Sequences can be requested by keywords, too. However, the naming of vnuses/genes/proteins IS not consistent in the databanks, and therefore the cov- erage might be limited. for example, the word adenovirus will not find Mastadenovnus, the word protease will not identtfy “protemase”.)
It is also possible to perform the blast homology search on-line by the use of Netscape (http://www.ncbi.nlm.nih.gov/). Thesequencetoberun against the databanks can be copied and pasted from another window. From the result, necessary further files can be fetched directly by clicking on then accession numbers. The result can be requested also through e-mail.
3.3. Phylogenefic Analysis The phylogenetic calculation consists of a certain (chosen) set of steps. You
can choose what kind of programs you wish to use, whether you want to apply bootstrapping (see Subheading 3.3.3.1.), and the form in which you want the
314
results to be displayed. This means that there are different routes to perform the complete analysis, and some of them are depicted u-r Fig. 1.
3.3.1. Alignment
Since only homologous regions can be studied, the sequences must be aligned. For this purpose, many multtple alignment programs are available. Clustal V (25,26) or its new version Clustal W (27) are freely distributed. The Internet may be used to get them (http : //www . ebi . ac . uk/). However, most probably, there are some general sequence-analysts programs available m your mstitute, e.g., on-line from a university server In the Wisconsin pro- gram package GCG, you may use the PILEUP. The Lasergene package of DNASTAR offers MEGALIGN. PC/Gene has Clustal V (Fig. 2A) Of course, there are differences m the calculatton and the accuracy of the different align- ment programs; e.g., during the multiple alignment, terminal gaps are penal- ized in Clustal V but not m PILEUP This ~111 make the PILEUP alignments better when the sequences are of very different length (has no effect if there are no large terminal gaps).
It is advisable to start the alignment with the HAVs (our favorite is the com- pletely sequenced HAV-2), as there are so many sequences from the HAVs that it is easy for the program to make consequent alignments. In the lme of the sequences to be aligned, the most “exotic” ones should be at the end, so at the time of their alignment to the other sequences, the program would have already a quite good consensus to align to. The alignment has to be saved into an editable file that will be used to create a specially formatted tile for the phylo- genetic programs. As a preferred optton, this file should be named inf ile.
If DNA sequences that code for proteins are aligned, one should first make a protein alignment to ensure that triplets coding for identical ammo acids are aligned in the DNA alignment, as well. Practically, this means that the size of the gaps m a DNA sequence alignment can only be a number dividable by three. In the case of less stmilar proteins (where more gaps occur), one may experience many mistakes in the alignment. Manual correction and constant comparison to the protein alignment make this work much more time consum- ing than to analyze protein alignments. Making DNA alignment is also more complicated because the DNA sequences contained in databanks are usually longer then the actual genes.
Fig. I. (oppositepage) Flowchart of different types of phylogenetic analysis by the use of PHYLIP programs. Continuous line shows single alignment analysis, dotted line depicts analysis combined with bootstrapping. The use of programs typed in bold IS highly recommended, the use of other programs is optional. The necessary renamings are shown as DOS commands written in Courier. Options to be changed
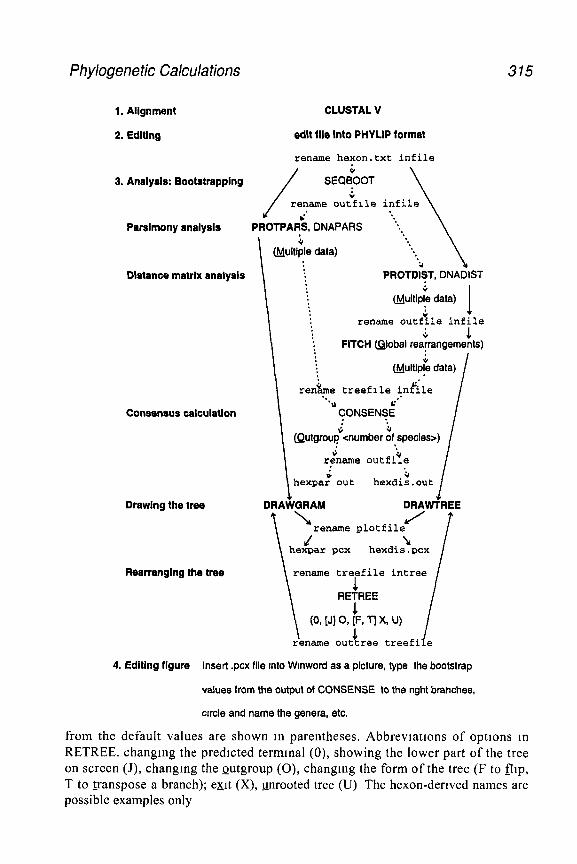
Phylogenefic Calculations
1. Alignment
2. Edlting
3. Analysis: Bootstrapping
CLUSTAL V
edit file into PHYLIP tormat
rename hexon.txt infile
Parsimony analysis
Distance matrlx analysis
Consensus calculation
Drawing the tree
Rearranglng the tree
. . ‘3 ** *.
\ PROTD:ST, DNADIST
6 &<iple data)
:
I rename outf?le infile
t i FITCH &lobal realrangements)
&jultlpb data) I
315
\ REkiEE
(0, [Jl 0, /k Tl Xl U) I \ 4
rename outtree treefi i e
4. Editing figure Insert .pcx file mto Wmword as a picture, type the bootstrap
values from the output of CONSENSE to the nght branches,
circle and name the genera, etc.
from the default values are shown m parentheses. Abbrevtattons of opttons m RETREE. changing the predtcted terminal (0), showing the lower part of the tree on screen (J), changmg the outgroup (0), changmg the form of the tree (F to flop, T to transpose a branch); exit (X), unrooted tree (U) The hexon-dertved names are possible examples only
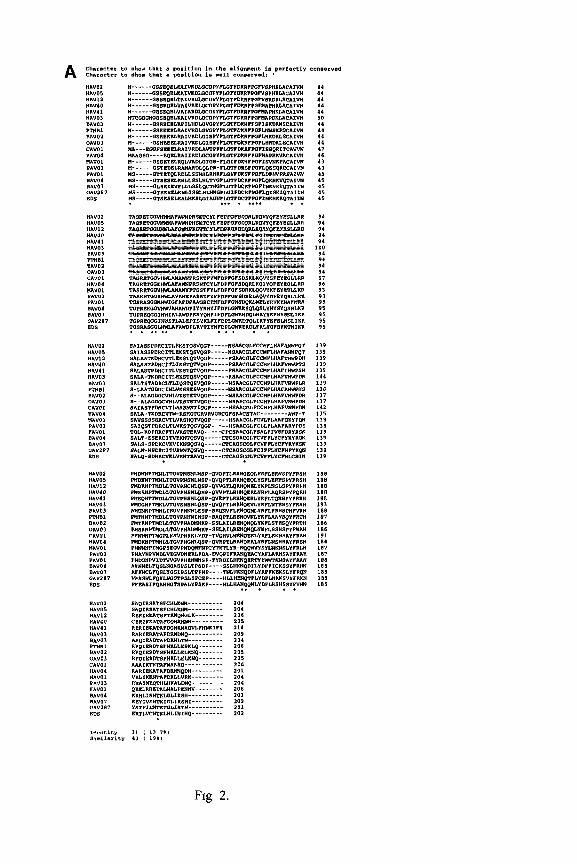
Fig 2.
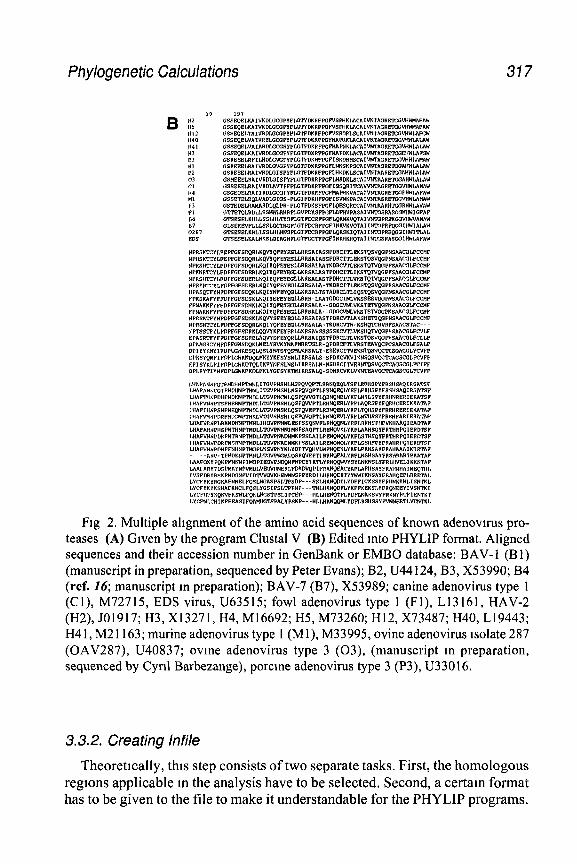
Phylogenetic Calculations 317
Fig 2. Multiple alignment of the amino acid sequences of known adenovnus pro- teases (A) Given by the program Clustal V (B) Edited mto PHYLIP format. Aligned sequences and their accession number in GenBank or EMBO database: BAV- 1 (B 1) (manuscript in preparation, sequenced by Peter Evans); B2, U44124, B3, X53990; B4 (ref. 16; manuscript m preparation); BAV-7 (B7), X53989; canine adenovirus type 1 (Cl), M72715, EDS virus, U63515; fowl adenovirus type 1 (Fl), L13161, HAV-2 (H2), 501917; H3, X13271, H4, M16692; H5, M73260; H12, X73487; H40, L19443; H41, M21163; murine adenovirus type 1 (Ml), M33995, ovine adenovirus isolate 287 (OAV287), U40837; ovine adenovirus type 3 (03), (manuscript m preparation, sequenced by Cyril Barbezange), porcine adenovirus type 3 (P3), U33016.
3.3.2. Creating lnfile
Theoretrcally, this step consists of two separate tasks. First, the homologous regions applicable m the analysis have to be selected. Second, a certain format has to be given to the file to make it understandable for the PHYLIP programs.
318 Harrach and Benkd
3.3.2.1 SELECTING THE HOMOLOGOUS REGIONS
This is the artistic step of the analysis, you have to use your Judgment, and no exact rules can be given on what to include into an analysis. However, do not worry. If the sequences are long enough, and the differences you want to demonstrate are significant, then even quite big changes m the selection of the sequence will result in similar evolutionary trees. Actually, this IS the basis of the bootstrappmg (see Subheading 3.3.3.1.), when you are sampling different parts of the alignment to test if they are yielding the same tree or not.
Our usual policy 1s the removal of any region suspected to be nonhomolo- gous based on the observations that:
1 Deletions (gaps) of more than four to seven residues are present The reason for domg this 1s that a deletion may be the result of a single event, and It should not be counted as an independent mutation for every smgle residue On the other hand, some (smaller) deletions maybe very conclusive, showmg deletions appearing identical m closely related vnuses, e.g , the same three-residue-long deletion m BAV-4, BAV-7, OAV287, and EDS viruses (candidate members of the proposed new genus) (Fig. 2B).
2 Ahgnment regions do not have homologous residues for a length of more than five to eight residues (i.e , you do not see any resemblance, not a single amino acid that 1s the same m at least some of the sequences)
3. Some sequences are longer than the others. The analysis should be ended at the stop codon of the shortest sequence. The stop codon may be represented by an asterisk. (Theoretically, there IS an optlon to put questlon marks after the last residue lmplymg that anything could be there if it were not ended, but m our practice this resulted m mlscalculatlons ) A different case 1s when obtammg pre- liminary results, where a short sequence IS compared to full-length sequences. In this case, some question marks may be Included (not gaps, because they mean existing deletions), yet the sequences must be abbreviated almost to the size of the shortest sequence. Analyzing both the short alignment (with the added new sequence) and the long alignment will show the sigmficance of the results gamed with the short alignment. The detection of large phylogenetlc differences, e g., genus differentiation 1s usually no problem even with short sequences
The computer alignment may be corrected manually if some homology 1s obvious. An example can be seen in Fig. 2, where the deletions of BAV-2 and OAV-3 m position 96-97 (HAV-2 numbering, Fig. 2A) had to be moved to positions 99 and 100 (Fig. 2B).
As it can be seen on Fig. 2, proteases are easy to edit (The reason perhaps IS that the enzymatic function and relatively short size of the protein do not allow great variability.) However, some manual editing and deletions had to be made to this alignment as well. First of all, HAV4 has a rearrangement of its pro- tease sequence after residue 117, and this necessitated the removal of Its
Phylogenetic Calcula tms 319
residues 118-122. Smaller deletions were made at the start and at the end of the alignment.
On the other hand, the hexon or the DNA polymerase protems are very long, and they have some highly variable regions. Aligned amino acid sequences of the hexon and polymerase (and protease) can be found m our “personal” databank (mainly on Adenovzridae) named GeneFarm and available through www(ht tp ://www.vmri.hu/-(harrach). Youmaydownload,edit,and test these alignments on your own computer. This way you may test the effect of different deletions, or if you have sequence from another serotype, you may compare and analyze it Because of the variable regions, both the polymerase and the hexon sequences had to be deleted extensively to consider the resulting sequences homologous. Our final alignments of hexon and polymerase ammo acid sequences can also be found on the GeneFarm pages m ready to analyze PHYLIP “mfile” format.
3.3.2.2. PHYLIP FORMAT
The data prepared for analysis have to start by the number of aligned sequences/species and the number giving the total length of the sequence align- ment (these numbers are 19 and 197 in Fig. 2B). The molecular sequence pro- grams (described m our examples) can take the data in “mterleaved” (aligned) format. Each sequence starts m a new line, has a IO-character species name (if shorter it must be blank-filled up to ten), followed immediately by the ammo acid sequence m one-letter code (Fig. 2B). The blocks of sequences can be separated by an empty line. This format is similar to that yielded by most of the multiple alignment programs, but the names can be present only in the first block, and no sequence numbering and signs showing the homologous resi- dues are allowed. The blocks do not have to have the same length, so the nonhomologous regions can be deleted. Blanks are allowed, e.g , at every tenth position. The blank lme separating the blocks should not contam any extra blank character. Non-IUPAC abbreviation (e.g., end of tile symbol: //) in the sequences or blanks at the ends of the lines are not allowed.
In an alternative format called “sequential,” data are entered continu- ously one after the other. This format is obligatory for certain PHYLIP programs (gene frequencies, discrete and quantitative characters programs) not described herein
A simple editor (e.g., Norton Commander) might be efficient when working with short sequences or introducing minor changes. For longer sequences or extensive editing, however, more sophisticated word processors should be used. It is easier to remove every name after the first block, and all the numbers after the sequences by deleting columns (Control+Schift+F8 m Word for Wmdows). When using Windows based word processors, single spacing
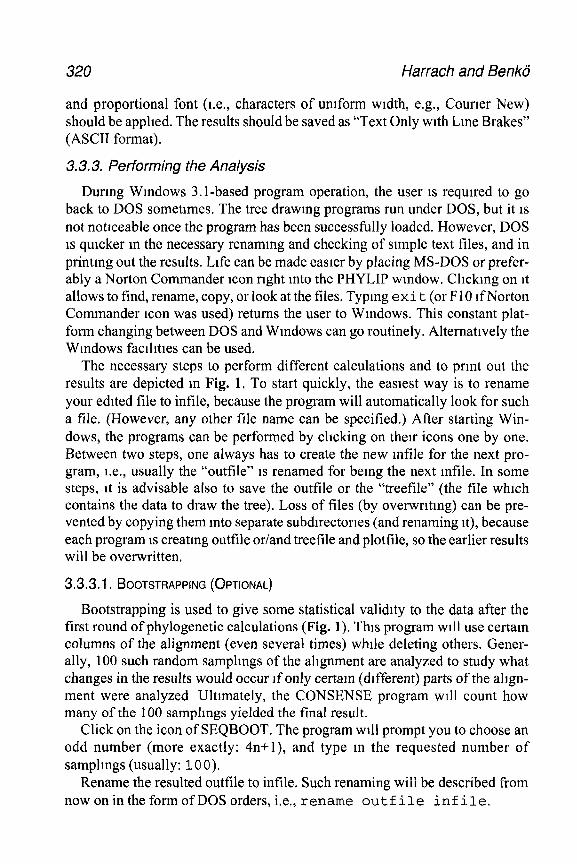
320 Harrach and Benkii
and proportional font (i.e., characters of uniform width, e.g., Courier New) should be applied. The results should be saved as “Text Only with Lme Brakes” (ASCII format).
3.3.3. Performing the Analysis
During Windows 3.1-based program operation, the user 1s required to go back to DOS sometimes. The tree drawing programs run under DOS, but it 1s not noticeable once the program has been successfully loaded. However, DOS 1s quicker m the necessary renaming and checking of simple text files, and in printing out the results. Ltfe can be made easier by placing MS-DOS or prefer- ably a Norton Commander icon right mto the PHYLIP window. Cltckmg on it allows to find, rename, copy, or look at the files. Typing exi t (or FlO If Norton Commander icon was used) returns the user to Wmdows. This constant plat- form changing between DOS and Windows can go routinely. Alternatively the Windows facllltles can be used.
The necessary steps to perform different calculations and to print out the results are depicted m Fig. 1. To start quickly, the easiest way is to rename your edlted file to infile, because the program will automatically look for such a file. (However, any other file name can be specified.) After starting Win- dows, the programs can be performed by clicking on their icons one by one. Between two steps, one always has to create the new mfile for the next pro- gram, I.e., usually the “outfile” 1s renamed for being the next mfile. In some steps, It is advisable also to save the outfile or the “treetile” (the file which contains the data to draw the tree). Loss of files (by overwntmg) can be pre- vented by copying them mto separate subdn-ectorles (and renaming it), because each program 1s creating outfile or/and treefile and plotfile, so the earlier results will be overwritten.
3.3.3.1. BOOTSTRAPPING (OPTIONAL)
Bootstrapping is used to give some statistical validity to the data after the first round of phylogenetic calculations (Fig. 1). This program wrll use certain columns of the alignment (even several times) while deleting others. Gener- ally, 100 such random samplings of the alignment are analyzed to study what changes in the results would occur if only certain (different) parts of the align- ment were analyzed Ultimately, the CONSENSE program will count how many of the 100 samplings yielded the final result.
Click on the icon of SEQBOOT. The program will prompt you to choose an odd number (more exactly: 4n+l), and type m the requested number of samplings (usually: 10 0).
Rename the resulted outfile to infile. Such renaming will be described from now on in the form ofDOS orders, i.e., rename outf ile inf ile.
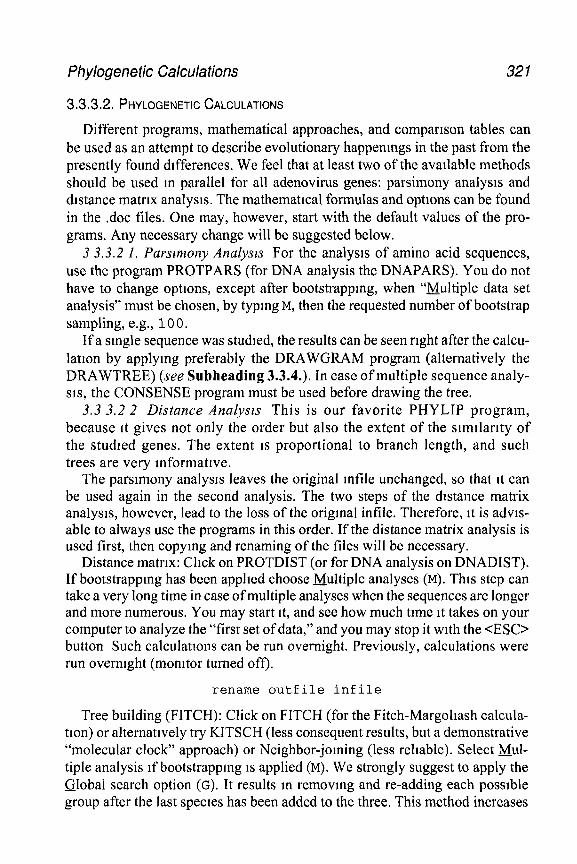
Phylogenetic Calcfflations 321
3.3.3.2. PHYLOGENETIC CALCULATIONS
Different programs, mathematical approaches, and compartson tables can be used as an attempt to describe evolutionary happenmgs in the past from the presently found dtfferences. We feel that at least two of the available methods should be used m parallel for all adenovirus genes: parsimony analysts and distance matrix analysts. The mathematrcal formulas and options can be found in the .doc tiles. One may, however, start with the default values of the pro- grams, Any necessary change will be suggested below.
3 3.3.2 1. Parsimony Analysrs For the analysis of amino acid sequences, use the program PROTPARS (for DNA analysis the DNAPARS). You do not have to change options, except after bootstrappmg, when “Multiple data set analysis” must be chosen, by typing M, then the requested number of bootstrap sampling, e.g., 10 0.
If a single sequence was studied, the results can be seen right after the calcu- lation by applying preferably the DRAWGRAM program (alternatively the DRAWTREE) ( see Subheading 3.3.4.). In case of multiple sequence analy- sts, the CONSENSE program must be used before drawing the tree.
3.3 3.2 2 Distance Analyszs This is our favorite PHYLIP program, because tt gives not only the order but also the extent of the simtlarity of the studied genes, The extent is proportional to branch length, and such trees are very informative.
The parsimony analysis leaves the original mfile unchanged, so that tt can be used again in the second analysis. The two steps of the distance matrix analysts, however, lead to the loss of the original intile. Therefore, it is advts- able to always use the programs in this order. If the distance matrix analysis is used first, then copying and renaming of the tiles will be necessary.
Distance matrix: Click on PROTDIST (or for DNA analysis on DNADIST). If bootstrappmg has been applied choose Multiple analyses (M). This step can take a very long time in case of multiple analyses when the sequences are longer and more numerous. You may start it, and see how much time tt takes on your computer to analyze the “first set of data,” and you may stop it with the <ES0 button Such calculations can be run overnight. Previously, calculations were run overnight (momtor turned off).
rename outfile infile
Tree building (FITCH): Click on FITCH (for the Fitch-Margohash calcula- tion) or alternatively try KITSCH (less consequent results, but a demonstrative “molecular clock” approach) or Neighbor-joining (less reliable). Select Mul- tiple analysis if bootstrappmg is applied (M). We strongly suggest to apply the Global search option (G). It results m removmg and re-adding each possible group after the last species has been added to the three. This method increases
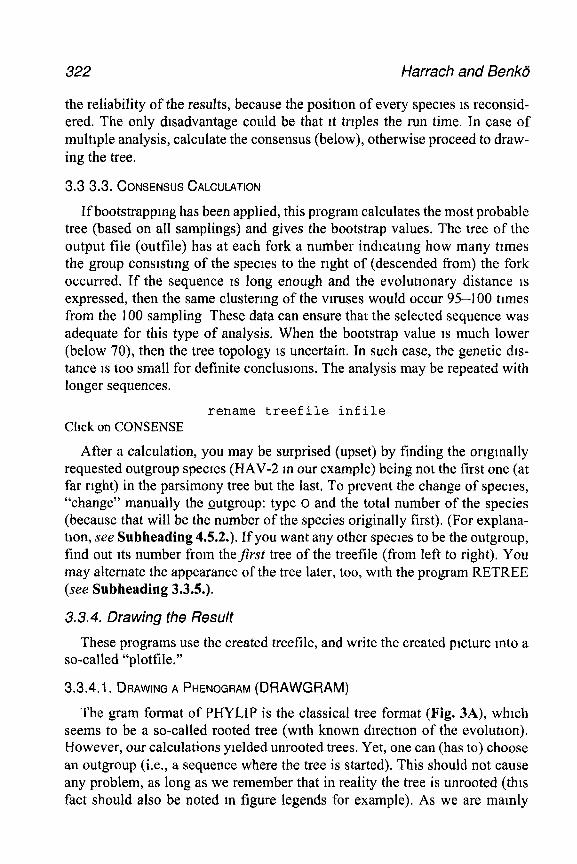
322 Harrach and Benkii
the reliability of the results, because the position of every species 1s reconsid- ered. The only disadvantage could be that It triples the run time. In case of multiple analysis, calculate the consensus (below), otherwise proceed to draw- ing the tree.
3.3 3.3. CONSENSUS CALCULATION
If bootstrapping has been applied, this program calculates the most probable tree (based on all samplings) and gives the bootstrap values. The tree of the output file (outfile) has at each fork a number indlcatmg how many times the group conslstmg of the species to the right of (descended from) the fork occurred. If the sequence IS long enough and the evolutionary distance 1s expressed, then the same clustering of the vn-uses would occur 95-100 times from the 100 sampling These data can ensure that the selected sequence was adequate for this type of analysis. When the bootstrap value 1s much lower (below 70), then the tree topology 1s uncertain. In such case, the genetic dls- tance IS too small for definite conclusions. The analysis may be repeated with longer sequences.
rename treefile infile Click on CONSENSE
After a calculation, you may be surprised (upset) by finding the orlgmally requested outgroup species (HAV-2 m our example) being not the first one (at far right) in the parsimony tree but the last, To prevent the change of species, “change” manually the Qutgroup: type 0 and the total number of the species (because that will be the number of the species originally first). (For explana- tion, see Subheading 4.5.2.). If you want any other species to be the outgroup, find out its number from theflrst tree of the treefile (from left to right). You may alternate the appearance of the tree later, too, with the program RETREE (see Subheading 3.3.5.).
3.3.4. Drawing the Result
These programs use the created treefile, and write the created picture mto a so-called “plotfile.”
3.3.4.1. DRAWING A PHENOGRAM (DRAWGRAM)
The gram format of PHYLIP is the classical tree format (Fig. 3A), which seems to be a so-called rooted tree (with known direction of the evolution). However, our calculations yielded unrooted trees. Yet, one can (has to) choose an outgroup (i.e., a sequence where the tree is started). This should not cause any problem, as long as we remember that in reality the tree is unrooted (this fact should also be noted m figure legends for example). As we are mainly
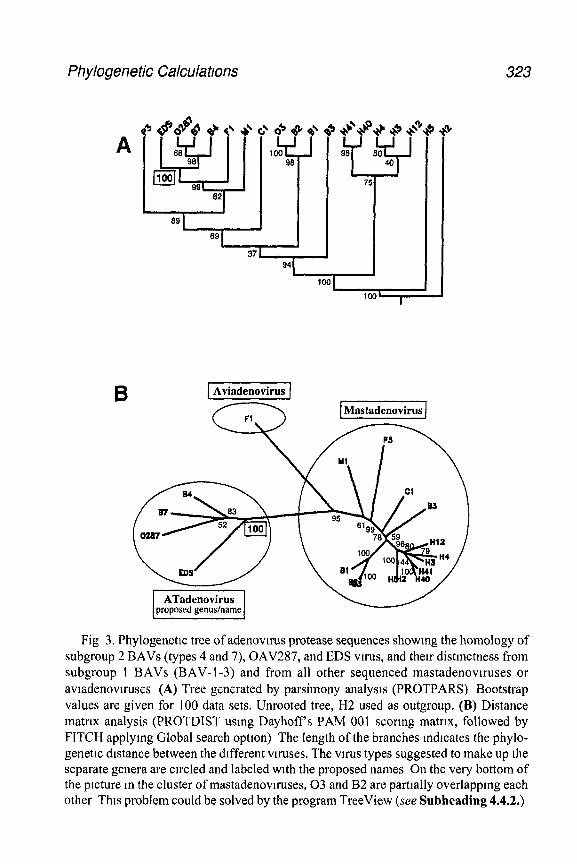
Phylogenetic Calculations 323
B 1 Aviadenovirus 1 Mastadenovirus
cc2 ‘Y----L
I ATadenovirus proposed genus/name I
L’
Fig 3. Phylogenetlc tree of adenovnus protease sequences showing the homology of subgroup 2 BAVs (types 4 and 7), OAV287, and EDS virus, and their distinctness from subgroup 1 BAVs (BAV-1-3) and from all other sequenced mastadenovlruses or avladenovlruses (A) Tree generated by parsimony analysis (PROTPARS) Bootstrap values are given for 100 data sets. Unrooted tree, H2 used as outgroup. (B) Distance matrix analysis (PROTDIST using Dayhoff s PAM 001 scoring matrix, followed by FITCH applying Global search option) The length of the branches mdlcates the phylo- genetic distance between the different vnuses. The virus types suggested to make up the separate genera are circled and labeled with the proposed names On the very bottom of the picture m the cluster of mastadenovlruses, 03 and B2 are partially overlappmg each other This problem could be solved by the program TreeView (see Subheading 4.4.2.)
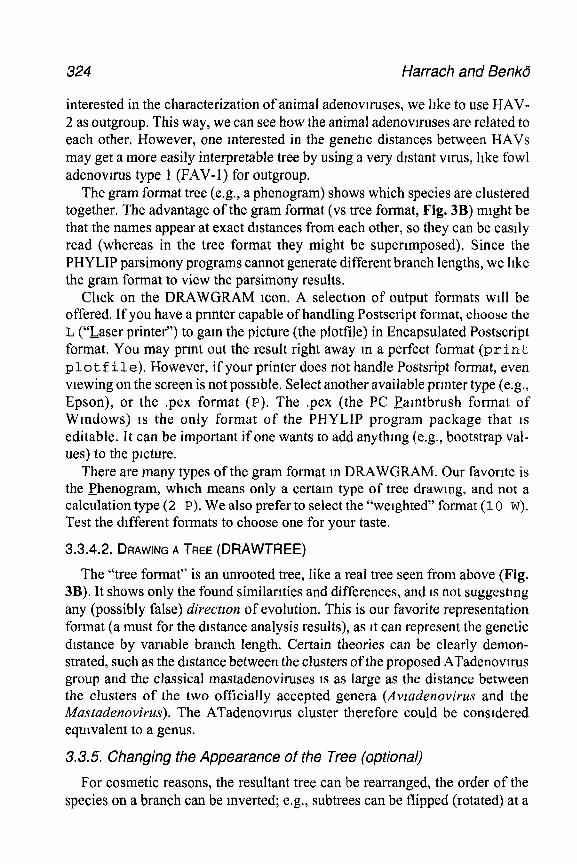
324 Harrach and Benkti
interested in the characterization of animal adenovlruses, we hke to use HAV- 2 as outgroup. This way, we can see how the animal adenovnuses are related to each other. However, one interested in the genetic distances between HAVs may get a more easily interpretable tree by using a very distant virus, like fowl adenovlrus type 1 (FAV-1) for outgroup.
The gram format tree (e.g., a phenogram) shows which species are clustered together. The advantage of the gram format (vs tree format, Fig. 3B) might be that the names appear at exact distances from each other, so they can be easily read (whereas in the tree format they might be superimposed). Since the PHYLIP parsimony programs cannot generate different branch lengths, we like the gram format to view the parsimony results.
Click on the DRAWGRAM icon. A selection of output formats will be offered. If you have a printer capable of handling Postscript format, choose the L (“Laser printer”) to gain the picture (the plotfile) in Encapsulated Postscript format. You may prmt out the result right away m a perfect format (print plot f i 1 e). However, if your printer does not handle Postsript format, even viewing on the screen is not possible. Select another available printer type (e.g., Epson), or the .pcx format (P). The .pcx (the PC Paintbrush format of Windows) IS the only format of the PHYLIP program package that 1s editable. It can be important if one wants to add anything (e.g., bootstrap val- ues) to the picture.
There are many types of the gram format m DRAWGRAM. Our favorite is the Phenogram, which means only a certain type of tree drawing, and not a calculation type (2 P). We also prefer to select the “weighted” format (10 W). Test the different formats to choose one for your taste.
3.3.4.2. DRAWING A TREE (DRAWTREE)
The “tree format” is an unrooted tree, like a real tree seen from above (Fig. 3B). It shows only the found similarities and differences, and IS not suggesting any (possibly false) direction of evolution. This is our favorite representation format (a must for the distance analysis results), as It can represent the genetic distance by variable branch length. Certain theories can be clearly demon- strated, such as the distance between the clusters of the proposed ATadenovnus group and the classical mastadenoviruses 1s as large as the distance between the clusters of the two officially accepted genera (Avzadenovirus and the Mastadenovirus). The ATadenovn-us cluster therefore could be considered equivalent to a genus.
3.3.5. Changing the Appearance of the Tree (optional)
For cosmetic reasons, the resultant tree can be rearranged, the order of the species on a branch can be inverted; e.g., subtrees can be flipped (rotated) at a
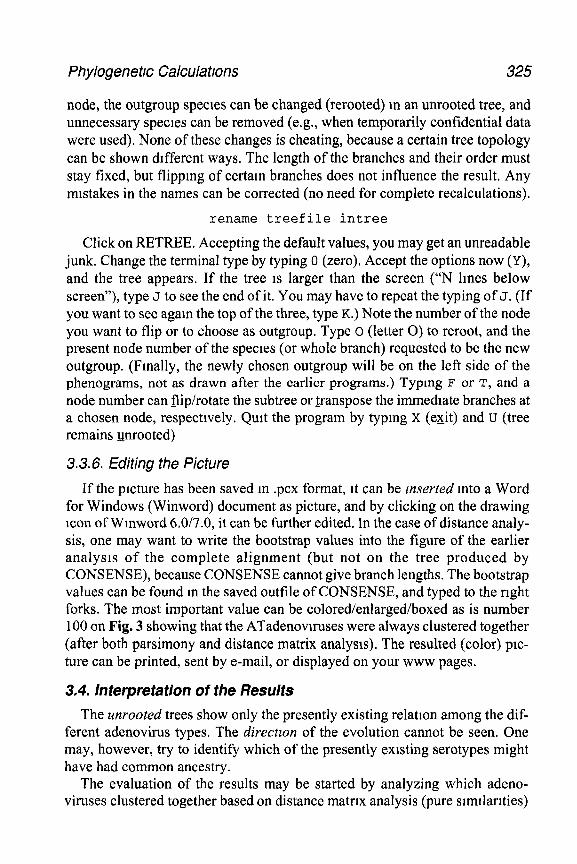
Phylogenetlc Calculations 325
node, the outgroup species can be changed (rerooted) m an unrooted tree, and unnecessary species can be removed (e.g., when temporarily confidential data were used). None of these changes is cheating, because a certain tree topology can be shown different ways. The length of the branches and their order must stay fixed, but flipping of certam branches does not influence the result. Any mistakes in the names can be corrected (no need for complete recalculations).
rename treefile intree
Click on RETREE. Accepting the default values, you may get an unreadable junk. Change the terminal type by typing 0 (zero). Accept the options now (Y), and the tree appears. If the tree 1s larger than the screen (“N lines below screen”), type J to see the end of it. You may have to repeat the typing of J. (If you want to see agam the top of the three, type K.) Note the number of the node you want to flip or to choose as outgroup. Type 0 (letter 0) to reroot, and the present node number of the species (or whole branch) requested to be the new outgroup. (Finally, the newly chosen outgroup will be on the left side of the phenograms, not as drawn after the earlier programs.) Typmg F or T, and a node number can flip/rotate the subtree or transpose the immediate branches at a chosen node, respectively. Quit the program by typing X (esit) and U (tree remains unrooted)
3.3.6. Editing the Picture
If the picture has been saved m .pcx format, it can be inserted mto a Word for Windows (Winword) document as picture, and by clicking on the drawing tcon of Wmword 6.0/7.0, it can be further edited. In the case of distance analy- sis, one may want to write the bootstrap values into the figure of the earlier analysis of the complete alignment (but not on the tree produced by CONSENSE), because CONSENSE cannot give branch lengths. The bootstrap values can be found m the saved outfile of CONSENSE, and typed to the right forks. The most important value can be colored/enlarged/boxed as is number 100 on Fig. 3 showing that the ATadenovlruses were always clustered together (after both parsimony and distance matrix analysis). The resulted (color) plc- ture can be printed, sent by e-mail, or displayed on your www pages.
3.4. lnferprefation of the Results The unrooted trees show only the presently existing relation among the dif-
ferent adenovirus types. The directzon of the evolution cannot be seen. One may, however, try to identify which of the presently existing serotypes might have had common ancestry.
The evaluation of the results may be started by analyzing which adeno- viruses clustered together based on distance matrix analysis (pure slmllanties)
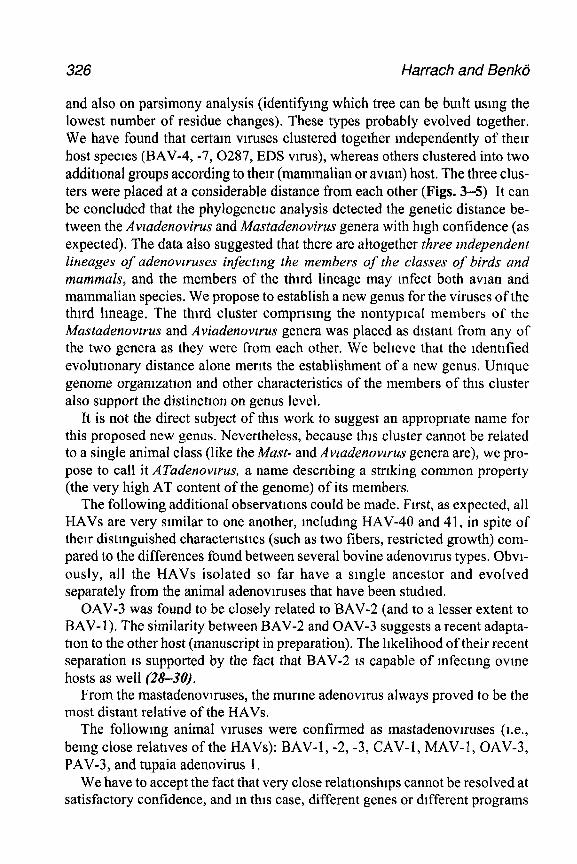
326 Harrach and Benkb
and also on parsimony analysis (identifymg which tree can be built usmg the lowest number of residue changes). These types probably evolved together. We have found that certain viruses clustered together independently of their host species (BAV4, -7,0287, EDS vnus), whereas others clustered into two addittonal groups according to their (mammalian or avtan) host. The three clus- ters were placed at a considerable distance from each other (Figs. 3-5) It can be concluded that the phylogenetlc analysis detected the genetic distance be- tween the Avladenovirus and Mastadenovirus genera with high confidence (as expected). The data also suggested that there are altogether three zndependent lineages of adenovwuses infectmg the members of the classes of birds and mammals, and the members of the thud lineage may infect both avian and mammalian species. We propose to establish a new genus for the viruses of the thud lineage. The third cluster comprtsmg the nontypical members of the Mastadenovwus and Aviadenovlrus genera was placed as distant from any of the two genera as they were from each other. We believe that the identified evolutionary distance alone merits the establishment of a new genus. Unique genome orgamzation and other characteristics of the members of this cluster also support the distinction on genus level.
It is not the direct subject of this work to suggest an appropriate name for this proposed new genus. Nevertheless, because this cluster cannot be related to a single animal class (like the Mast- and Avzadenovzrus genera are), we pro- pose to call it ATadenovzrus, a name descrrbing a sulking common property (the very high AT content of the genome) of its members.
The following additional observations could be made. First, as expected, all HAVs are very similar to one another, mcludmg HAV-40 and 4 1, in spite of then distmguished characteristics (such as two fibers, restricted growth) com- pared to the differences found between several bovine adenovnus types. Obvi- ously, all the HAVs isolated so far have a single ancestor and evolved separately from the animal adenovnuses that have been studied.
OAV-3 was found to be closely related to BAV-2 (and to a lesser extent to BAV- 1). The similarity between BAV-2 and OAV-3 suggests a recent adapta- tion to the other host (manuscript in preparation). The likelihood of their recent separation IS supported by the fact that BAV-2 is capable of mfectmg ovme hosts as well (28-30).
From the mastadenovnuses, the murme adenovmus always proved to be the most distant relative of the HAVs.
The followmg animal viruses were confirmed as mastadenoviruses (I.e., bemg close relatives of the HAVs): BAV-I , -2, -3, CAV- I, MAV- 1, OAV-3, PAV-3, and tupaia adenovirus 1.
We have to accept the fact that very close relationships cannot be resolved at satisfactory confidence, and in this case, different genes or different programs
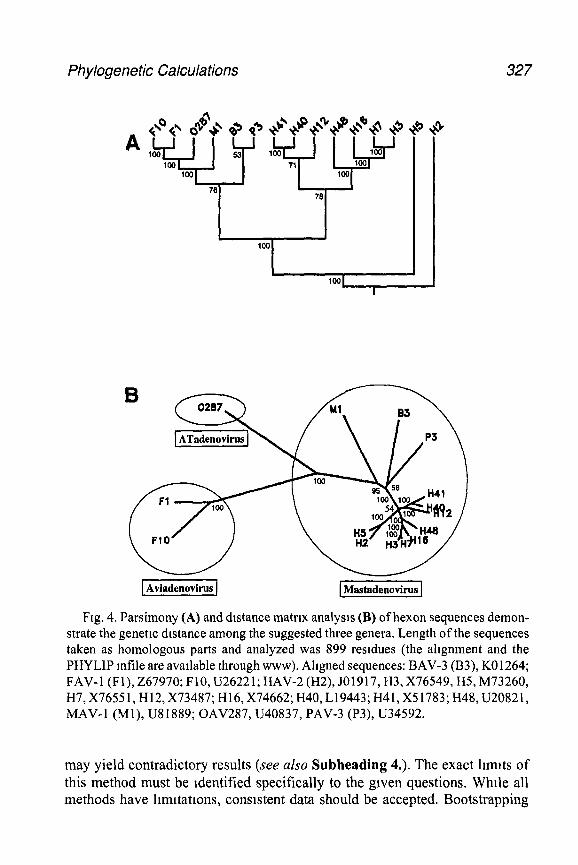
Phylogenetic Calculations 327
Fig. 4. Parsimony (A) and distance matrix analysis (B) of hexon sequences demon- strate the genetlc distance among the suggested three genera. Length of the sequences taken as homologous parts and analyzed was 899 residues (the alignment and the PHYLIP mfile are available through www). Aligned sequences: BAV-3 (B3), K01264; FAV-1 (FI), 267970; FlO, U26221; HAV-2 (H2), J01917, H3, X76549, H5, M73260, H7, X7655 1~ H12, X73487; H16, X74662; H40, L19443; H41, X5 1783; H48, U20821, MAV-1 (Ml), U81889; OAV287, U40837, PAV-3 (P3), U34592.
may yield contradictory results (see also Subheading 4.). The exact hmlts of this method must be Identified specifically to the given questions. While all methods have hmltatlons, consistent data should be accepted. Bootstrapping
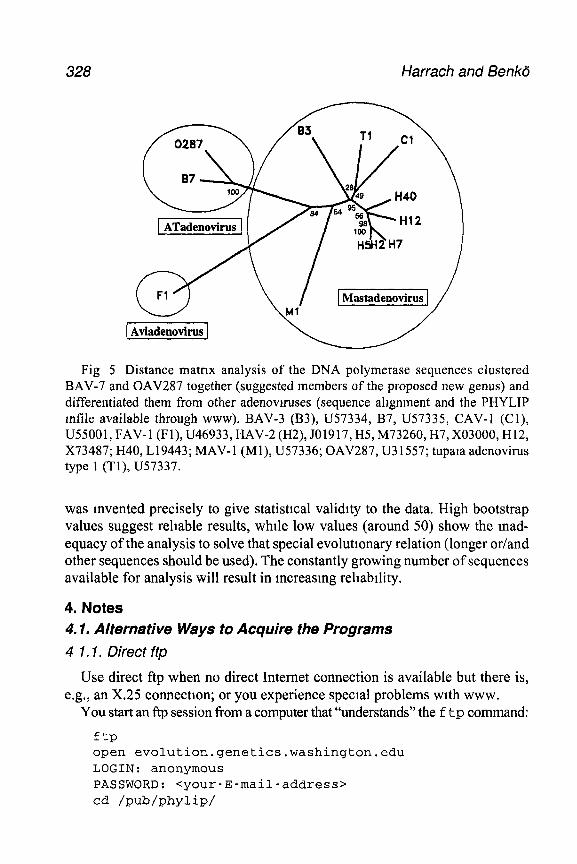
328 Harrach and Benkd
Mastadenovirus
Fig 5 Distance matrtx analysis of the DNA polymerase sequences clustered BAV-7 and OAV287 together (suggested members of the proposed new genus) and differentiated them from other adenovtruses (sequence ahgnment and the PHYLIP mfile available through www). BAV-3 (%3), U57334, B7, U57335, CAV-1 (Cl), U55001, FAV-1 (Fl), U46933, HAV-2 (H2), 501917, H5, M73260, H7, X03000, H12, X73487; H40, L19443; MAV-1 (Ml), U57336; OAV287, U31557; tupaia adenovirus type 1 (Tl), U57337.
was invented precisely to give statistical validity to the data. High bootstrap values suggest reliable results, while low values (around 50) show the mad- equacy of the analysis to solve that special evolutronary relation (longer or/and other sequences should be used). The constantly growing number of sequences available for analysis will result in increasing rehabrlity.
4. Notes 4.1. Alternative Ways to Acquire the Programs
4 7.7. Direct ftp
Use direct ftp when no direct Internet connection is available but there is, e.g., an X.25 connection; or you experience special problems with www.
You start an ftp session from a computer that “understands” the f tp command:
ftP open evolution.genetics.washington.edu LOGIN: anonymous PASSWORD: <your-E-mail-address> cd /wb/phylip/
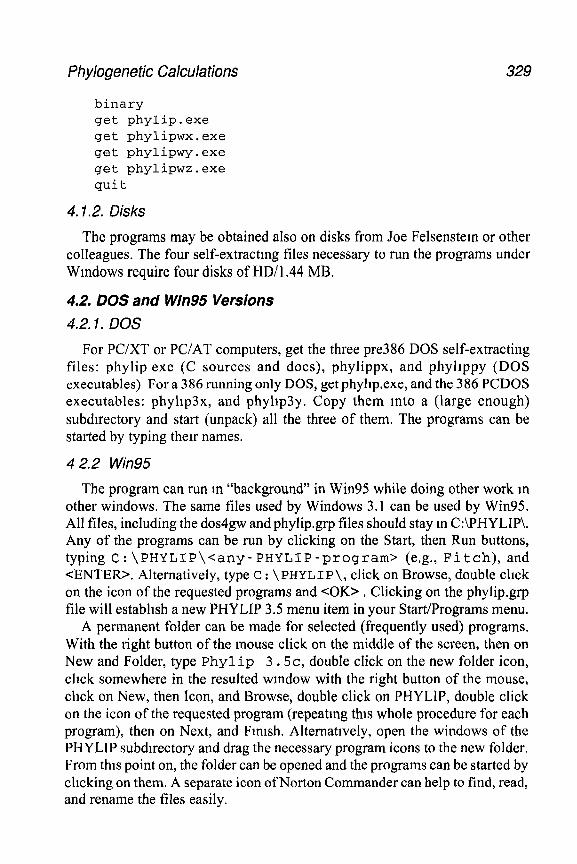
Phylogenetic Calculations 329
binary get phylip.exe get phylipwx.exe get phylipwy.exe get phylipwz.exe quit
4.1.2. Disks
The programs may be obtained also on disks from Joe Felsenstem or other colleagues. The four self-extracting files necessary to run the programs under Windows require four disks of HD/1.44 MB.
4.2. DOS and Win95 Versions
4.2.1. DOS
For PC/XT or PC/AT computers, get the three pre386 DOS self-extracting files: phylip exe (C sources and dots), phylippx, and phyllppy (DOS executables) For a 386 running only DOS, get phyllp.exe, and the 386 PCDOS executables: phyllp3x, and phyllp3y. Copy them mto a (large enough) subdirectory and start (unpack) all the three of them. The programs can be started by typing their names.
4 2.2 Win95
The program can run m “background” in Win95 while doing other work m other windows. The same files used by Windows 3.1 can be used by Win95. All files, including the dos4gw and phylip.grp files should stay m C:\PHYLIP\. Any of the programs can be run by clicking on the Start, then Run buttons, typing C:\PHYLIP\<any-PHYLIP-program> (e.g., Fitch), and <ENTER>. Alternatively, type C : \PHYLIP\, click on Browse, double click on the icon of the requested programs and <OK> . Clicking on the phylip.grp file will establish a new PHYLIP 3.5 menu item in your Start/Programs menu.
A permanent folder can be made for selected (frequently used) programs. With the right button of the mouse click on the middle of the screen, then on New and Folder, type Phylip 3 .5c, double click on the new folder icon, chck somewhere in the resulted wmdow with the right button of the mouse, click on New, then Icon, and Browse, double click on PHYLIP, double click on the icon of the requested program (repeating this whole procedure for each program), then on Next, and Fmlsh. Alternatively, open the windows of the PHYLIP subdu-ectory and drag the necessary program icons to the new folder. From this point on, the folder can be opened and the programs can be started by clicking on them. A separate icon of Norton Commander can help to find, read, and rename the files easily.
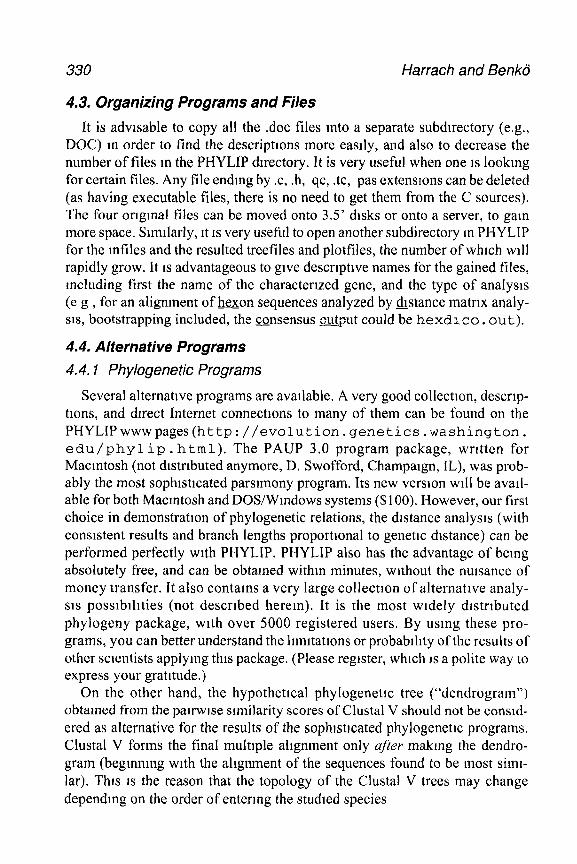
330 Harrach and Benkd
4.3. Organizing Programs and Files
It is advisable to copy all the .doc files mto a separate subdtrectory (e.g., DOC) m order to find the descriptrons more eastly, and also to decrease the number of files m the PHYLIP dtrectory. It is very useful when one IS lookmg for certain tiles. Any file ending by .c, .h, qc, .tc, pas extensions can be deleted (as having executable files, there is no need to get them from the C sources). The four origmal tiles can be moved onto 3.5’ dtsks or onto a server, to gam more space. Simrlarly, it IS very useful to open another subdirectory m PHYLIP for the mfiles and the resulted treefiles and plotfiles, the number of whrch ~111 rapidly grow. It is advantageous to give descriptive names for the gained tiles, mcluding first the name of the characterized gene, and the type of analysis (e g , for an alignment of &on sequences analyzed by &stance matrix analy- sis, bootstrapping included, the consensus output could be hexdl co. out).
4.4. Alternative Programs
4.4.1 Phylogenetic Programs
Several alternative programs are available. A very good collectron, descrip- ttons, and drrect Internet connectrons to many of them can be found on the PHYLIPwwwpages(http://evolution.genetics.washington. edu / phyl ip . h tml). The PAUP 3.0 program package, written for Macintosh (not distributed anymore, D. Swofford, Champaign, IL), was prob- ably the most sophrstrcated parsimony program. Its new version will be avail- able for both Macmtosh and DOS/Wmdows systems ($100). However, our first choice in demonstration of phylogenetic relations, the distance analysis (with consistent results and branch lengths proporttonal to genetic distance) can be performed perfectly with PHYLIP. PHYLIP also has the advantage of being absolutely free, and can be obtamed within minutes, without the nuisance of money transfer. It also contains a very large collection of alternative analy- sis possibihties (not described herem). It is the most widely distrrbuted phylogeny package, with over 5000 registered users. By using these pro- grams, you can better understand the lrmrtatrons or probabrhty of the results of other scientists applying this package. (Please register, which IS a polite way to express your gratitude.)
On the other hand, the hypothettcal phylogenetic tree (“dendrogram”) obtained from the pan-wise similarity scores of Clustal V should not be consid- ered as alternative for the results of the sophlstrcated phylogenetrc programs. Clustal V forms the final multiple ahgnment only after makmg the dendro- gram (beginning with the alignment of the sequences found to be most simr- lar). This 1s the reason that the topology of the Clustal V trees may change depending on the order of entermg the studied species
Phylogenetrc Calculations 331
4.4.2. Alternative Program to View, Rearrange, and Edit the Tree
TreeVtew is an excellent supplementary program of Rod Page (Umverstty of Glasgow, Scotland) for displaying trees on Macmtosh, PowerMac, and Wm- dows PCs (different versions for 16 and 32 bttes platforms). It IS free and can beobtamedthrough www (ht tp://taxonomy.zoology.gla.ac.uk/ rod/ treeview. html). (Please, send an e-mail message as registration.) It can even display bootstrap values and supports the standard Macmtosh PICT and Windows Metafile formats for output, allowmg tree pictures to be applied m other applicattons. TreeVIew has print preview and drag-and-drop factlittes (to get the files from another window).
Both the Windows 3.1 and the Wm95 versions are to be Installed by the provided install programs. TreeView can be started by clicking on its Icon (m Wm95, m Start/Programs). Open (more) treefile( choose the requested for- mat of the tree: Radial, Slanted cladogram, Rectangular cladogram, Phylogram (available only if the tree has branch length, but including consensus trees). Select to “Show internal edge labels” to see e.g., the bootstrap values. You can change the character stze and style of both the species and the internal labels Define outgroup by double clicking on the requested species shown in a win- dow (<O.K.>). Select “Root with outgroup,” otherwise the change of outgroup will not take place. “Save as graphic” will create a Windows Metafile that can be edited, e.g., in Wmword &O/7.0 at every part of it (includmg the possibly overlappmg titles and even the tree itself).
Comparmg TreeVrew/Metafile edttmg to the PHYLIP programs/.pcx file editing, the TreeVtew seems to be much more handy and effective. The for- mats, character style, and outgroup can be changed and viewed very quickly by a single program. It can show the bootstrap values automattcally, which IS not possible in PHYLIP. Trees can be compared on screen. TreeView can solve the problem of overlapping titles. However, TreeView has less options m tree style: no flipping and rotation of branches are possible; no high qualtty Post- script files are produced. In fact, both programs are needed.
4.5. Errors and Solutions
4.5.1, Typical “Fatal” Errors
Error messaees or svmutoms Solution of the nroblem. a No icons m the Phylip box copy phylip.grp c:\win[orwindows]
and run It b “can’t read infile, give renamexwhatever-name> infile ortype
sequence name>” m the vahd name c “ERROR SEQUENCES Check the number and the total length of
OUT OF ALIGNMENT” sequences
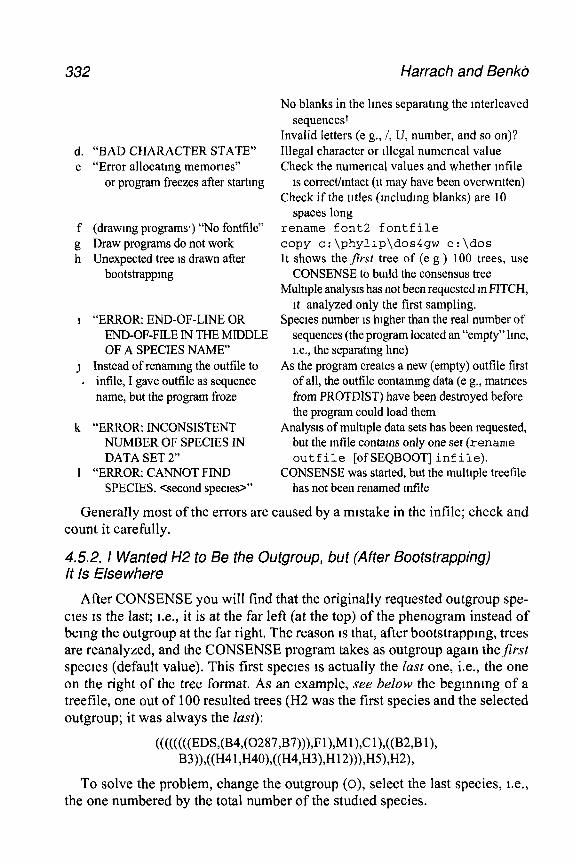
332 Harrach and Benkb
d. “BAD CHARACTER STATE” e “Error allocatmg memories”
or program freezes after starting
f (drawing programs.) “No fontfile” g Draw programs do not work h Unexpected tree is drawn after
bootstrapping
1 “ERROR: END-OF-LINE OR END-OF-FILE IN THE MIDDLE OF A SPECIES NAME”
J Instead of renaming the outtile to , infile, I gave outfile as sequence
name, but the program froze
k “ERROR: INCONSISTENT NUMBER OF SPECIES IN DATA SET 2”
I “ERROR CANNOT FIND SPECIES. <second species>”
No blanks in the lines separating the interleaved sequences!
Invalid letters (e g., /, U, number, and so on)? Illegal character or illegal numerical value Check the numerical values and whether mfile
is correct/mtact (It may have been overwritten) Check if the titles (mcludmg blanks) are 10
spaces long rename font2 fontfile copy c:\phyllp\dos4gw c:\dos It shows the first tree of (e g ) 100 trees, use
CONSENSE to build the consensus tree Multiple analysts has not been requested m FITCH,
it analyzed only the first sampling. Species number is higher than the real number of
sequences (the program located an “empty” Ime, i.e., the separating line)
As the program creates a new (empty) outfile first of all, the outfile contammg data (e g., matrices from PROTDIST) have been destroyed before the program could load them
Analysts of multtple data sets has been requested, but the mtile contams only one set (rename outfile [of SEQBOOT] infile).
CONSENSE was started, but the multiple treefile has not been renamed mfde
Generally most of the errors are caused by a mtstake in the infile; check and count it carefully.
4.5.2. I Wanted H2 to Be the Outgroup, but (After Bootstrapping) It Is Elsewhere
After CONSENSE you will find that the originally requested outgroup spe- cres IS the last; I.e., it is at the far left (at the top) of the phenogram instead of being the outgroup at the far right. The reason IS that, after bootstrappmg, trees are reanalyzed, and the CONSENSE program takes as outgroup again thefirst species (default value). This first species IS actually the last one, i.e., the one on the right of the tree format. As an example, see below the begmnmg of a treefile, one out of 100 resulted trees (H2 was the first species and the selected outgroup; it was always the last):
((((((((EDS,(B4,(0287,B7))),Fl),Ml),Cl),((B2,Bl), W),Wl ,H40),((H4,H3),H12))),H5),H2),
To solve the problem, change the outgroup (0), select the last species, i.e., the one numbered by the total number of the studied species.
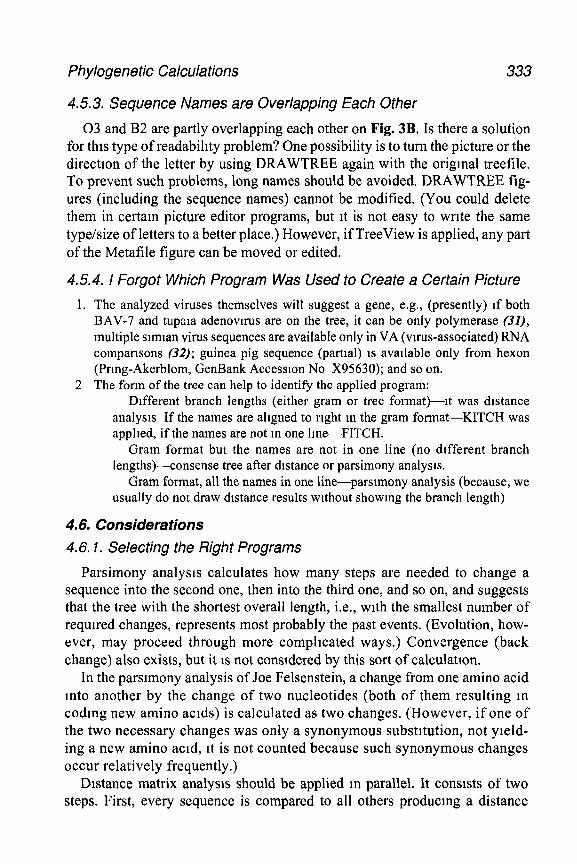
Phylogenetic Calculations 333
4.5.3. Sequence Names are Overlapping Each Other
03 and B2 are partly overlapping each other on Fig. 3B. Is there a solution for this type of readability problem? One possibility is to turn the picture or the direction of the letter by using DRAWTREE again with the original treefile. To prevent such problems, long names should be avoided. DRAWTREE fig- ures (including the sequence names) cannot be modified. (You could delete them in certain picture editor programs, but it is not easy to write the same type/size of letters to a better place.) However, if TreeView is applied, any part of the Metafile figure can be moved or edited.
4.5.4. I Forgot Which Program Was Used to Create a Certain Picture
1. The analyzed viruses themselves will suggest a gene, e.g., (presently) if both BAV-7 and tupara adenovuus are on the tree, it can be only polymerase (3Z), multiple simian virus sequences are available only in VA (virus-associated) RNA comparrsons (32); guinea pig sequence (partial) IS available only from hexon (Prmg-Akerblom, GenBank Accession No X95630); and so on.
2 The form of the tree can help to identify the applied program: Drfferent branch lengths (either gram or tree format)-rt was dtstance
analysis If the names are ahgned to rtght m the gram format-KITCH was applied, if the names are not m one line-FITCH.
Gram format but the names are not in one line (no different branch lengths)--consense tree after dtstance or parsimony analysts.
Gram format, all the names in one line-parnmony analysis (because, we usually do not draw distance results without showmg the branch length)
4.6. Considerations 4.6.1. Selecting the Right Programs
Parsimony analysis calculates how many steps are needed to change a sequence into the second one, then into the third one, and so on, and suggests that the tree with the shortest overall length, i.e., with the smallest number of required changes, represents most probably the past events. (Evolution, how- ever, may proceed through more complicated ways.) Convergence (back change) also exists, but it is not constdered by this sort of calculatton.
In the parsimony analysis of Joe Felsenstein, a change from one amino acid mto another by the change of two nucleotides (both of them resulting m codmg new amino acids) is calculated as two changes. (However, if one of the two necessary changes was only a synonymous substitution, not yteld- ing a new amino acid, it is not counted because such synonymous changes occur relatively frequently.)
Distance matrix analysis should be applied m parallel. It conststs of two steps. First, every sequence is compared to all others producing a distance
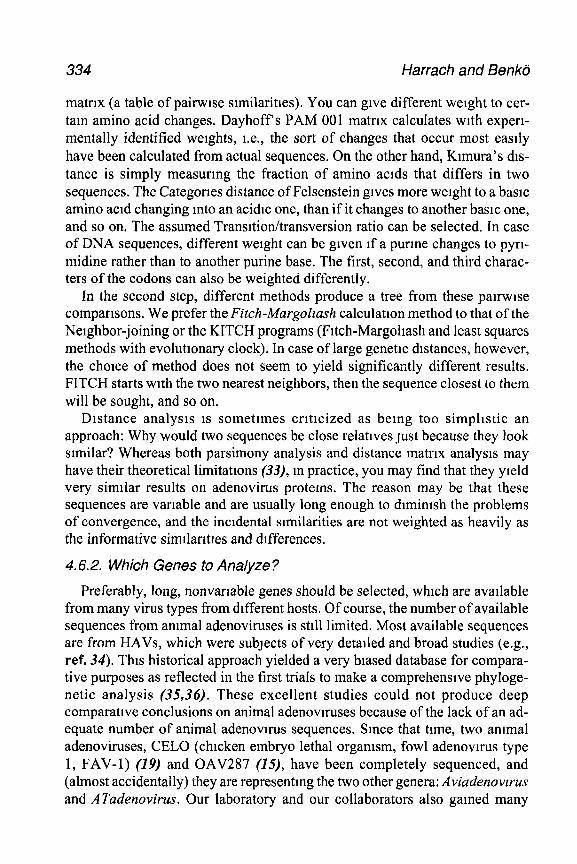
Harrach and Benkli
matrix (a table of pairwtse similarities). You can give different weight to cer- tam amino acid changes. Dayhoff s PAM 001 matrix calculates with experi- mentally identified weights, i.e., the sort of changes that occur most easily have been calculated from actual sequences. On the other hand, Ktmura’s dts- tance is simply measuring the fraction of amino acids that differs in two sequences. The Categorres distance of Felsenstein gives more wetght to a basic amino acid changing mto an acidic one, than if it changes to another basic one, and so on. The assumed Transitiotitransversion ratio can be selected. In case of DNA sequences, different weight can be given if a purme changes to pyn- midine rather than to another purine base. The first, second, and third charac- ters of the codons can also be weighted differently.
In the second step, different methods produce a tree from these pan-wise comparisons. We prefer the Fitch-Margolzash calculation method to that of the Netghbor-joining or the KITCH programs (Fitch-Margohash and least squares methods with evoluttonary clock). In case of large genetic distances, however, the choice of method does not seem to yield significantly different results. FITCH starts with the two nearest neighbors, then the sequence closest to them will be sought, and so on.
Distance analysis is somettmes criticized as being too simplistic an approach: Why would two sequences be close relattves just because they look similar? Whereas both parsimony analysis and distance matrix analysts may have their theoretical limitations (331, m practice, you may find that they yield very simtlar results on adenovirus protems. The reason may be that these sequences are variable and are usually long enough to dtmimsh the problems of convergence, and the incidental similarities are not weighted as heavily as the informative simtlartties and dtfferences.
4.6.2. Which Genes to Analyze ?
Preferably, long, nonvariable genes should be selected, which are available from many virus types from different hosts. Of course, the number of available sequences from ammal adenoviruses is still limited. Most available sequences are from HAVs, which were subjects of very detailed and broad studies (e.g., ref. 34). This historical approach yielded a very biased database for compara- tive purposes as reflected in the first trials to make a comprehenstve phyloge- netic analysis (35,36). These excellent studies could not produce deep comparattve conclusions on animal adenovn-uses because of the lack of an ad- equate number of animal adenovnus sequences. Since that time, two ammal adenoviruses, CELO (chicken embryo lethal organism, fowl adenovnus type 1, FAV-1) (19) and OAV287 (15), have been completely sequenced, and (almost accidentally) they are representing the two other genera: Aviadenovzrus and ATadenovirus. Our laboratory and our collaborators also gamed many
Phylogenetic Calculations 335
sequences from BAV-1, -2, -4, -6, -9, -10, OAV-3, and EDS virus, though many of these sequences are still preliminary and/or partial. Some practical problems are listed m Subheadings 4.6.2.1. and 4.6.2.2.
4.6.2.1 NUMBER OF SPECIES
Some genes are more popular and well represented-eg., the protease, the hexon, the pVII1 genes, and the inverted terminal repeat (ITR) regions- whereas others are available only from the four totally sequenced HAVs (HAV- 2, -5, -12, -40) and from FAV-1 and OAV287 at the submtssion of the manuscript. The exclusive analysis of the completely sequenced viruses can- not give valuable phylogenetic results, since all HAVs cluster together, whereas FAV- 1 and OAV287 are different (as logically expected because of the differ- ent host origin). Nowadays, the most comprehensive results can be seen from the analysis of the protease, because sequences are available from adenoviruses of as many as eight species (cattle, chicken, duck, dog, man, mice, sheep, pig), and the protein itself 1s very well characterized (37-39). It has also the highest number of complete sequences* 19 presently.
4 6.2.2. “INTERESTING" SPECIES
The different species are represented very unevenly; so if you are interested m spectal questlons, you may have to choose different genes for the analysis.
1. Our original interest was m BAVs, smce they were described to be very different from one another. To be able to prove or to disprove the suggested difference among them and the similarity among members of the two subgroups, we haved sequenced many different types By now, we have the protease gene from five BAV types (manuscript m preparation). This 1s the second highest number m terms of representation of one host species (after the HAVs, of course) (Fig. 2) Our results clearly proved the existence of very high genetic distance between subgroups 1 and 2 of BAVs, and the existence of homology within the subgroups. We plan to study further BAV types, especially the newest one (BAV-lo), because of its questlonable subgrouping (4&42).
2. Some host species are represented only by rare sequences not available from many viruses, therefore direct comparison cannot be done. Many slmlan aden- ovlrus sequences are avallable (32), but (with the exception of a partial SAV-30 polymerase sequence) (43) they do not contam useful late genes, but almost ex- clusively Just the VA RNA sequence. This was of little use in our comparisons, since VA RNA has not been identified in ATadenoviruses (and 1s relocated in aviadenovuuses). This demonstrates a special problem, that certain genes cannot be used for the comparison of the members of all genera, if they do not exist m all of them. In the case of underrepresented host species, there IS a pressing need for further sequencing For example, the release of the hexon sequence of equine adenovnus types 1 and 2 will enrich the picture (44).
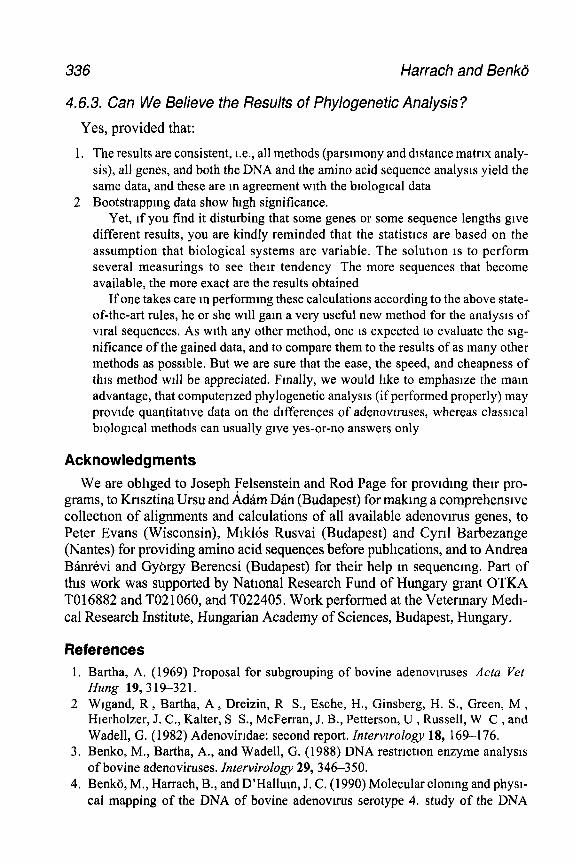
336 Harrach and Benkii
4.6.3. Can We Believe the Results of Phylogenetic Analysis?
Yes, provided that:
1. The results are consistent, i.e., all methods (parsimony and distance matrix analy- sis), all genes, and both the DNA and the amino acid sequence analysis yield the same data, and these are m agreement with the biological data
2 Bootstrapping data show hrgh significance. Yet, if you find it disturbing that some genes or some sequence lengths give
different results, you are kindly reminded that the statistics are based on the assumption that biological systems are variable. The solution is to perform several measurings to see their tendency The more sequences that become available, the more exact are the results obtained
If one takes care m performing these calculations according to the above state- of-the-art rules, he or she will gam a very useful new method for the analysis of vu-al sequences. As with any other method, one is expected to evaluate the sig- nificance of the gained data, and to compare them to the results of as many other methods as possible. But we are sure that the ease, the speed, and cheapness of this method ~111 be appreciated. Finally, we would like to emphasize the main advantage, that computerized phylogenetic analysis (if performed properly) may provide quantitative data on the differences of adenovnuses, whereas classical biological methods can usually give yes-or-no answers only
Acknowledgments
We are obliged to Joseph Felsenstein and Rod Page for providmg then pro- grams, to Krisztina Ursu and Adam Dan (Budapest) for makmg a comprehensive collection of alignments and calculations of all available adenovnus genes, to Peter Evans (Wisconsin), Miklos Rusvai (Budapest) and Cyril Barbezange (Nantes) for providing amino acid sequences before publications, and to Andrea Ban&i and Gyorgy Berencsi (Budapest) for their help m sequencmg. Part of this work was supported by National Research Fund of Hungary grant OTKA TO16882 and TO2 1060, and T022405. Work performed at the Vetermary Medi- cal Research Institute, Hungarian Academy of Sciences, Budapest, Hungary.
References 1. Bartha, A. (1969) Proposal for subgrouping of bovine adenovuuses Acta Vet
Hung 19,319321. 2 Wigand, R , Bartha, A , Dreizin, R S., Esche, H., Ginsberg, H. S., Green, M ,
Hierholzer, J. C., Kalter, S S., McFerran, J. B., Petterson, U , Russell, W C , and Wadell, G. (1982) Adenovindae: second report. Intervzrology 18, 169-l 76.
3. Benko, M., Bartha, A., and Wadell, G. (1988) DNA restriction enzyme analysis of bovine adenoviruses. Intervirology 29, 344-350.
4. Benko, M., Harrach, B., and D’Hallum, J. C. (1990) Molecular cloning and physi- cal mapping of the DNA of bovine adenovn-us serotype 4. study of the DNA
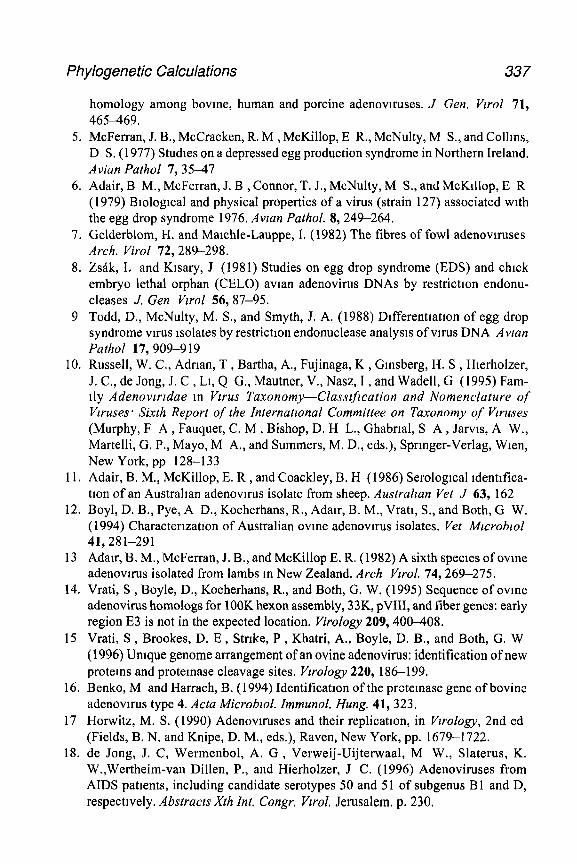
Phylogenetic Calculations 337
homology among bovine, human and porcine adenovnuses. J Gen. Vtrol 71, 465469.
5. McFerran, J. B., McCracken, R. M , McKillop, E R., McNulty, M S., and Colhns, D S. (1977) Studies on a depressed egg production syndrome in Northern Ireland. Avian Path01 7,35-47
6. Adair, B M., McFerran, J. B , Connor, T. J., McNulty, M S., and McKlllop, E R (1979) Btologtcal and physical properties of a virus (strain 127) associated with the egg drop syndrome 1976. Avtan Pathol. 8,249264.
7. Gelderblom, H. and Maichle-Lauppe, I. (1982) The libres of fowl adenovnuses Arch. Virol 72,289298.
8. Zsak, L and Kisary, J (1981) Studies on egg drop syndrome (EDS) and chick embryo lethal orphan (CELO) avian adenovirus DNAs by restriction endonu- cleases J. Gen Vtrol 56,87-95.
9 Todd, D., McNulty, M. S., and Smyth, J. A. (1988) Dtfferenttation of egg drop syndrome vnus isolates by restriction endonuclease analysts of virus DNA Avtan Path01 17,909-919
10. Russell, W. C., Adrian, T , Bartha, A., Fujinaga, K , Gmsberg, H. S , Hterholzer, J. C., de Jong, J. C , Lt, Q G., Mautner, V., Nasz, I , and Wadell, G (1995) Fam- ily Adenovzrtdae m Vtrus Taxonomy-Classtftcation and Nomenclature of Vtruses* Sixth Report of the International Committee on Taxonomy of Vu-uses (Murphy, F A, Fauquet, C. M , Bishop, D. H L., Ghabrial, S A, Jarvts, A W., Martelli, G. P., Mayo, M A., and Summers, M. D., eds.), Springer-Verlag, Wren, New York, pp 128-133
11. Adair, B. M., McKillop, E. R , and Coackley, B. H (1986) Serologtcal tdenttfica- non of an Australian adenovnus isolate from sheep. Australtan Vet J 63, 162
12. Boyl, D. B., Pye, A D., Kocherhans, R., Adatr, B. M., Vratt, S., and Both, G W. (1994) Charactertzation of Australian ovme adenovnus isolates. Vet Mcroblol 41,281-291
13 Adatr, B. M., McFerran, J. B., and McKillop E. R. (1982) A sixth species of ovine adenovnus isolated from lambs m New Zealand. Arch Vtrol. 74,269275.
14. Vrati, S , Boyle, D., Kocherhans, R., and Both, G. W. (1995) Sequence of ovine adenovirus homologs for 1OOK hexon assembly, 33K, pVII1, and fiber genes: early region E3 is not in the expected location. Virology 209,400-408.
15 Vrati, S , Brookes, D. E , Strike, P , Khatri, A., Boyle, D. B., and Both, G. W (1996) Umque genome arrangement of an ovine adenovirus: identification of new protems and protemase cleavage sites. VzroZogy 220, 186-l 99.
16. Benko, M and Harrach, B. (1994) Identification of the protemase gene of bovine adenovnus type 4. Acta Microbtol. Immunol. Hung. 41,323.
17 Horwitz, M. S. (1990) Adenovtruses and their replicatton, in Vzrologv, 2nd ed (Fields, B. N. and Knipe, D. M., eds.), Raven, New York, pp. 1679-1722.
18. de Jong, J. C, Wermenbol, A. G , Verweij-Uijterwaal, M W., Slaterus, K. W.,Wertheim-van Dillen, P., and Hierholzer, J C. (1996) Adenoviruses from AIDS patients, including candidate serotypes 50 and 5 1 of subgenus B 1 and D, respectively. Abstracts Xth Int. Congr. Vwol. Jerusalem. p, 230.
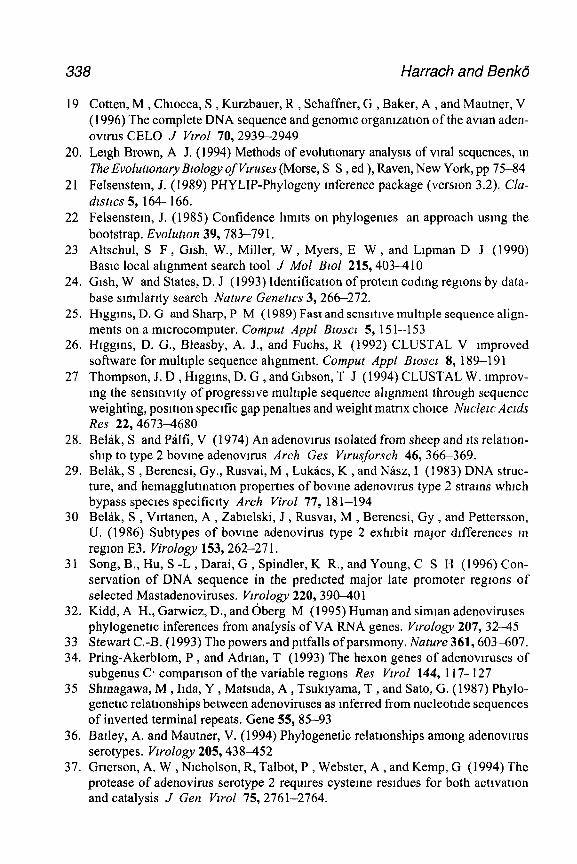
338 Harrach and Benkli
19 Cotten, M , Chlocca, S , Kurzbauer, R , Schaffner, G , Baker, A , and Mautner, V (1996) The complete DNA sequence and genomlc orgamzatlon of the avlan aden- ov~rus CELO J fir01 70,2939-2949
20. Leigh Brown, A J. (1994) Methods of evolutionary analysis of vtral sequences, in The Evolutzonary Bzolow offiruses (Morse, S S , ed ), Raven, New York, pp 75-84
21 Felsenstem, J. (1989) PHYLIP-Phylogeny Inference package (version 3.2). Cla- dlstlcs 5, 164-166.
22 Felsenstem, J. (1985) Confidence hmlts on phylogemes an approach using the bootstrap. Evolutzon 39,783-79 1.
23 Altschul, S F , Glsh, W., Miller, W , Myers, E W , and Llpman D J (1990) Basic local ahgnment search tool J Mel Bzol 215,403-410
24. Glsh, W and States, D. J (1993) Identification of protem coding regions by data- base slmllarlty search Nature Genetlcs 3,266-272.
25. Hlggms, D. G and Sharp, P M (1989) Fast and sensltlve multiple sequence align- ments on a microcomputer. Comput Appl Bzoscz 5, 15 l-l 53
26. Hlggms, D. G., Bleasby, A. J., and Fuchs, R (1992) CLUSTAL V improved software for multiple sequence ahgnment. Comput Appl Bzoscl 8, 189-l 91
27 Thompson, J. D , Hlggms, D. G , and Gibson, T J (1994) CLUSTAL W. Improv- mg the sensitivity of progressive multlple sequence alignment through sequence weighting, posltlon specific gap penaltles and weight matrix choice Nuclezc Aczds Res 22,4673-4680
28. BelBk, S and Pglfi, V (1974) An adenovlrus Isolated from sheep and Its relatlon- ship to type 2 bovine adenovlrus Arch Ges Vwusforsch 46, 366369.
29. BelBk, S , Berencsi, Gy., Rusvai, M , Lukics, K , and N&z, I (1983) DNA struc- ture, and hemagglutmatlon properties of bovine adenovlrus type 2 strains which bypass species specificity Arch Virol 77, 18 1-194
30 BelBk, S , Vlrtanen, A , Zablelski, J , Rusval, M , Berencsi, Gy , and Pettersson, U. (1986) Subtypes of bovine adenovirus type 2 exhibit major differences m region E3. Virology 153,262-27 1,
3 1 Song, B., Hu, S -L , Darai, G , Spindler, K R., and Young, C S H (1996) Con- servation of DNA sequence in the predicted major late promoter regions of selected Mastadenoviruses. Vzrologv 220,390-401
32. Kidd, A H., Garwicz, D., and dberg M (1995) Human and simian adenoviruses phylogenetlc inferences from analysis of VA RNA genes. Vzrologv 207, 32-45
33 Stewart C.-B. (1993) The powers and pitfalls of parsimony. Nature 361,603-607. 34. Pring-Akerblom, P , and Adnan, T (1993) The hexon genes of adenovlruses of
subgenus C* comparison of the variable regions Res Vzrol 144, 117-127 35 Shmagawa, M , Ilda, Y , Matsuda, A , Tsukiyama, T , and Sato, G. (1987) Phylo-
genetic relationships between adenoviruses as inferred from nucleohde sequences of inverted terminal repeats. Gene 55, 85-93
36. Bailey, A. and Mautner, V. (1994) Phylogenetic relatlonships among adenovtrus serotypes. Vzrology 205,438-452
37. Gnerson, A. W , Nicholson, R, Talbot, P , Webster, A , and Kemp, G (1994) The protease of adenovirus serotype 2 requires cysteme residues for both actlvatlon and catalysis J Gen Vwol 75, 2761-2764.
Phylogenetlc Calculations 339
38 Rancourt, C , Trhanyr, K., Bourbonniere, M., and Weber, J. M (1994) Identtfica- tron of active-srte resrdues of the adenovnus endopeptrdase Proc Nat1 Acad Sci USA 91,844847
39 Rancourt, C , Keyvam-Ammeh, H , Srrcar, S, Labrecque, P , and Weber, J. M (1995) Proline 137 IS crttrcal for adenovirus protease encapsrdation and activation but not enzyme actrvrty Vwology 209, 167-l 73
40. Homer, G. W., Hunter, R , Bartha, A., and Benko, M. (1989) A new subgroup 2 bovme adenovrrus proposed as the prototype strain 10 Arch Vwol 109, 12 1-124
4 1. Smyth, J. A., Benko, M., Moffett, D. A., and Harrach, B. (1996) Bovme adenovi- rus type 10 rdentrfied m fatal cases of adenovtms-associated entertc dtsease m cattle by rn sztu hybrrdrzatron. J Clm Mlcroblol 34, 1270-1274
42. Matrz, K , Benko, M , ZBdorr, Z , and Harrach, B (1996) Restrrctron sate mappmg of a bovme adenovnus type 10 strain Acta Vet. Hung 44,389-394
43 Hsrao, C L , Woessner, K J , Cheng, S. M , Dheer, S. K , Vince, T , Lee, S. G. and Hung, P. P (1990) Conservatron of essentral sequences m the maJor late pro- moter and trrpartrte leader of the simran adenovrrus type 30 Gene 89, 275-277
44 Reubel, H. G and Studdert, M J. (1996) Identrficatron, molecular clonmg and determination of the nucleotide sequence of the hexon gene of equine adenovnus type 1 (EAdVl) AbstractsXth Int. Congr Vzrol Jerusalem p 146


![Adenovirus Methods and Protocols 2nd ed. [Vol 2] - W. Wold, A. Tollefson (Humana, 2007) WW](https://img.pdfslide.us/doc/110x75/613caa3a9cc893456e1e969f/adenovirus-methods-and-protocols-2nd-ed-vol-2-w-wold-a-tollefson-humana.jpg)