Embed Size (px)
Citation preview
1
Understanding Trust in a Segmented Society1
Adeline Delavande
RAND Corporation and Nova School of Business and Economics
Basit Zafar2
Federal Reserve Bank of New York
March 2011
1 Funding through a RAND Independent Research and Development grant is gratefully acknowledged. We would
like to thank Elizabeth Setren and, in particular, Elizabeth Brown and Maricar Mabutas for outstanding research
assistance and our field teams and participating institutions. We would also like to thank Olivier Armentier and Luis
Vasconcelos for comments. 2 The views expressed in this paper do not necessarily reflect those of the Federal Reserve Bank of New York or the
Federal Reserve System as a whole.
2
Abstract
This paper investigates how trust operates in Pakistan, a society segmented along social,
religious, and ethnic lines, and mired in conflict. We randomly match 1,521 male students from
four Madrassas (religious seminaries), an Islamic University, and two liberal universities with
each other in several experiments of economic decision-making, and observe differences in their
decisions as match type is varied. These three groups clearly represent three different identities
within the Pakistani society. At one end of the spectrum, participants are young males from
poorer backgrounds who attend religious schools that are thought by many to be linked to
violence. At the other end of the spectrum are wealthy students exposed to Western-type of
education. In this setting, our results are rather surprising. First, we don‘t find any evidence of in-
group bias for any group and can reject the hypothesis that behavior in the experiments differs by
match type. Second, we find a high level of trust among all groups, with students enrolled at
Madrassas being the most likely to trust. Third, we find that students of liberal universities
underestimate the trustworthiness of Madrassa students, suggesting that an important segment of
the society has mistaken stereotypes about students in religious seminaries.
3
I. Introduction
Most human exchanges require some level of trust and cooperation. Trust is a central
component of a community‘s social capital, enhances efficiency, is crucial for overall economic
growth, and an important driver of financial development (Knack and Keefer, 1997; La Porta et
al., 1997; Putnam, 2000; Guiso, Sapienza, and Zingales, 2004). Trust becomes even more crucial
in settings with incomplete contracts or failing institutions (Ostrom, 1990; Fukuyama, 1995).
This paper sets out to address the question of how trust operates in Pakistan.
Pakistani society can be characterized as one with weak institutions, fragmentation and
polarization along social, religious, and ethnic lines. These symptoms of the society make it a
ripe candidate for conflict (Blattman and Miguel, 2010; Esteban, Mayoral and Ray, 2010). In
fact, the country has experienced violent conflict for the last several years: Figure 1 shows that
Pakistan had 2,670 terrorism-related deaths in 2009, placing it third in a worldwide rank, close
behind Iraq and Afghanistan. All these features make the Pakistani society particularly intriguing
to address the question of how trust operates within. On the one hand, the fragmentation of a
society, in particular along ethnic lines, is thought to weaken social cooperation. Several studies
document a negative relationship between ethnic fragmentation and economic growth, especially
at low levels of development and in non-democracies (e.g., Easterly and Levine, 1997; Collier
and Gunning, 1999; Alesina and La Ferrara, 2005). One possible explanation for this is that
social sanctions, which are critical when institutions are weak, are harder to implement in places
that are more ethnically diverse (Easterly, 2001; Alesina and La Ferrara, 2005; Miguel and
Gugerty, 2005; Miguel, 2006). On the other hand, violence and conflict may improve social
capital within a community. Recent evidence suggests that exposure to violent conflicts increases
the willingness to invest in trust-based transactions and to contribute to a collective good
(Gilligan, Pasquale, and Samii, 2010), enhances altruistic behavior toward neighbors (Voors et
al., 2010), and promotes local collective actions and political participation (Bellows and Miguel,
2009; Blattman, 2009). Fragmentation and conflict may thus have opposite effects on trust.
Which effect dominates among various groups of young Pakistanis, where one group is
perceived as fostering violence, is an important empirical question.
We investigate how trust operates within groups that emerge endogenously among
Pakistani youth using an experimental approach. More specifically, we randomly match 1,521
male students from four Madrassas (religious seminaries), an Islamic University, a liberal
university, and a liberal Western-style university in two cities in Pakistan with each other in
several experiments of economic decision-making, and observe differences in their decisions as
match type is varied. These institutions (or groups) are ideologically and socially disparate.
Madrassas usually don‘t impart any secular teaching and use texts going back before the 14th
century. Islamic Universities provide a Liberal Arts curriculum combined with Islamic teaching,
while liberal universities are similar to U.S. colleges. There is substantial sorting by
socioeconomic characteristics and very different levels of religiosity and exposure to Western
4
ideas across the various groups. For example, in our sample, Madrassa students‘ parental income
is one-tenth that of liberal Western-style university students, and their father‘s (mother‘s)
education is about one-half (one-fourth) that of liberal Western-style university students. Self-
reported religiosity (on a scale from 0 to 10) is 9.2 among the Madrassa students and 5.3 among
the Western-style university students. It is also important to note that Madrassas stand out from
the other groups by the fact that they are often claimed to be responsible for fostering militancy
and violence, especially since 9/11, by policy makers and the popular press that sometimes refer
to them ―jihad factory‖ or ―weapons of mass instruction‖ (Rashid, 2000; Stern, 2000; Ali, 2009;
Rahman, 2008). Having Madrassa students participating in experimental games is a unique
feature of this paper. Overall, the groups we consider clearly represent distinct identities within
Pakistan.
We use a multiple-game design that measures trust (trust game), expected trustworthiness
(expectations in the trust game) and other-regarding behavior (dictator game) to test four main
hypotheses: (1) Is there an in-group bias in trust? (2) Do individuals discriminate in their trust in
favor of or against any particular group? (3) Is the discrimination taste-based or statistical
(stereotype-based)? (4) Are the stereotypes accurate?
In this setting with strong sorting into different groups and one group being perceived as
potentially responsible for violence, our results from the trust game are rather surprising. First,
we don‘t find any evidence of in-group bias for any group, and can reject the hypothesis that
behavior in the trust game differs by match type. Second, we find a high level of trust among all
groups, with students enrolled at Madrassas being the most likely to trust. This later result is
consistent with religious teachings that emphasize selflessness, but also casts doubt on the
general perception of Madrassas teaching hatred and indoctrinating their students in narrow
world-views.
There are several dimensions of preferences and beliefs that may motivate a subject in the
trust game, such as unconditional other-regarding preferences, beliefs about trustworthiness of
the partner, and risk preferences (Cox, 2004). While we don‘t find differences in the trust game
by match type, such a behavior may still be consistent with different levels of trust and
preferences towards certain groups. We next try to decompose behavior in the trust game.
Behavior in the dictator game allows us to test for differences in unconditional other-regarding
preferences (taste-based preferences) for the different groups. Again, we don‘t find evidence of
in-group bias, or discrimination in favor or against any particular group. We also have subjective
expectations of students about how much they expect to receive back from the match which
measures expected trustworthiness. We find that students from liberal universities expect
Madrassa students to send back less relative to other groups. Moreover, these beliefs are
statistically very different and lower than the amount that Madrassa students actually send back,
suggesting that some groups within the Pakistani society have mistaken stereotypes about
Madrassas students. We also find that Madrassa students typically over-estimate the
trustworthiness of Liberal University students.
5
These results contrast sharply with the existing literature on group identity and behavior.
The influence of group membership on individual behavior has been widely studied in social
psychology (Tajfel, Billig, and Flament, 1971), where group identity is induced exogenously by
assigning participants to ―minimal‖ groups which are arbitrary labels such as blue or red group.
These studies have found that even ad-hoc and trivial group categorizations lead to in-group bias
and discrimination against the outgroup (Tajfel and Turner, 1986). Since the introduction of
identity into economic analysis by Akerlof and Kranton (2000), several economic studies have
analyzed the impact of social/group identity and behavior, and find similarly a strong impact of
group membership on behavior. One strand of this literature uses induced group membership,
similar to that used in social psychology to study the link between group membership and
individual behavior (see, for, example, Charness, Rigotti, and Rustichini, 2007; Chen and Li,
2009; Heap and Zizzo, 2009; Sutter, 2009; Benjamin, Choi, and Strickland, 2010). The other
approach uses existing groups such as ethnic groups, clans, and residential groups (Fershtman
and Gneezy, 2001; Bernhard, Fehr, and Fischbacher, 2006; Falk and Zehnder, 2007).3 While the
selection into groups makes the causal inference of group membership effect harder (an issue
that does not arise when inducing group membership), using existing groups, like we do in this
study, is a valuable approach to understand, from a policy perspective, how trust operates in a
segmented society mired in conflict.
Studies that focus specifically on behavior in the trust game, using either induced groups
(Heap and Zizzo, 2009) or existing groups (Glaeser et al., 2000; Freshtman and Gneezy, 2001;
Falk and Zehnder, 2007), find evidence of either in-group bias, negative discrimination against
outgroups, or discrimination against a particular group. The study that is closest to the approach
used in this paper is Freshtman and Gneezy (2001) who also use a multiple-game approach and
match students with typical ethnic names in Israel with each other. They find strong evidence of
discrimination against Eastern Jews (by both Ashkenazic and Eastern Jews) in the trust game,
and upon observing similar behavior in the dictator game deduce that this discrimination is based
on (mistaken) stereotypes. One key difference between the two papers, other than the different
settings and different measures of group identity, is that we also have expectations data that is
directly elicited from respondents about their match‘s trustworthiness, which allows us to more
directly decompose the behavior in the trust game. Falk and Zehnder (2007) use a somewhat
similar approach to study trust amongst residents of twelve residential districts of Zurich, and
document evidence of in-group bias as well as (statistical) discrimination that varies by districts.
One possible explanation for the high level of trust in our data may be, as mentioned
above, that violence within the society unifies people and, in our context, consolidates social
capital more than segmentation weakens it. The existing empirical evidence relying on
experimental game documents that, within a country that recently experienced a civil war,
3 A third approach is to use real social groups with random assignment, as in Goette, Huffman, and Meier (2006;
2010). This approach is less common because of the difficulty in finding real groups without selection.
6
individuals or communities with greater exposure to violence display more altruistic or more
trusting behavior towards neighbors (Voors et al. (2010) in Burundi, and Gilligan et al. (2010) in
Nepal). Our paper does not directly test for the impact of individual exposure to violence on trust
and takes place in a country where conflict is still on-going. However, given how widespread
violence is in Pakistan, we speculate that conflict may play a role in explaining our results.
The paper is organized as follows. We provide background information on Pakistan,
Madrassas and the groups we consider in Section II. Section III describes the data and Section IV
the empirical results. We discuss potential confounding factors for our results in Section V and
provide concluding remarks in Section VI.
II. Background
II.A Pakistan: a segmented society mired in conflict
With a population of 184 million and a GDP per capita of $2,400 (The World Factbook,
2010), Pakistan is a populous and rapidly growing middle income country. Since its creation, it
has been in search of a national identity. The various identities coming from religious, regional
and national belonging were articulated about a decade ago by the nationalist Wali Khan when
he declared to have been a Pashtun for 4,000 years, a Muslim for 1,400 years and a Pakistani for
40 years (Talbot, 2009). Today‘s Pakistan is still segmented along various lines.
The first divide is economic. While an estimated 24% of the population live under the
poverty line, estimates based on a multidimensional poverty index such as financial poverty,
illiteracy or children out of school, poor housing and physical household assets show that 54%
percent of Pakistanis live in a state of multiple deprivations, with vast differences between rural
(69%) and (21%) urban poverty rates (Jamal, 2009).
The second divide is religious. Ninety-five percent of the population is Muslim (Sunni
75%, Shia 20%) while the remaining includes Christian and Hindu (The World Factbook, 2010).
In addition to the Sunni-Shia divide, there is also sectarian rivalry within Sunnis between
Barelvis, that uphold devotional practices such as elevating Muslim saints, and Deobandis, that
seek to eliminate such practices (Talbot, 2009).
A third divide is ethnic and linguistic. The larger ethnic minority are Punjabi (45% of the
population), followed by Pashtun (15%), Sindhi (14%), Sariaki (8%), Muhajirs (8%), Balochi
(4%) (The World Factbook, 2010). The language divide mirrors the ethnicity divide. Only 8% of
the population speaks Urdu, the official language (Talbot, 2009).
A fourth divide is regional (see Figure 2). Punjab dominates demographically with 56%
of the population and economically due to a considerable agricultural advantage and industrial
development in the Zia era, along with large remittances from the Middle East (Talbot, 2009).
This status has been the cause of increasing resentment among the other regions. Fifty-two
percent of the Punjab population is classified poor according to Jamal (2009)‘s index, compared
to 74 % in Balochistan.
7
In addition to the segmentation highlighted above, another characteristic of today‘s
Pakistan is violence and terrorism. Figure 1 shows that Pakistan had 2,670 terrorism-related
deaths in 2009, placing it third in a worldwide rank. Terrorism-related incidents are not merely
confined to certain troubled areas and are widespread across the country.4 In a survey we
conducted in 2010 on a random sample of people living in Islamabad/Rawalpindi and Lahore,
we find that 14% of the respondents report knowing a victim of a violent attack. These attacks
have been attributed to a number of causes: sectarian violence, secessionist movements, backlash
effect of the Afghan war (―Kalashnikov culture‖ and jihad mentality), the conflict with India
over Kashmir, Islamist insurgent groups and forces such as the Taliban, and the society‘s
segmentation (Talbot, 2009).
II.B The Madrassas in Pakistan
In recent years, and in particular after 9/11, there have been claims by policy makers and
the popular press that Islamic religious schools—Madrassas—in Pakistan are responsible for
fostering militancy and violence, and have sometimes been labeled as ―weapons of mass
instruction‖ or ―jihad factory‖ (Rashid, 2000; Stern, 2000; Ali, 2009; Rahman, 2008).
Despite popular thinking, there is considerable controversy about the link between
Madrassa and militancy (Billquist and Colbert, 2006; Fair, 2008; Asal, Fair, and Shellman, 2008;
Winthrop and Graff, 2010). According to Winthrop and Graff (2010), while some Madrassas are
linked to sectarian militancy, the majority is non-extremist. Asal et al. (2008), who conducted
surveys in Pakistan with families who have lost a son to militancy in Kashmir and Afghanistan,
conclude that there is no evidence that Madrassas are a principle place for militants‘ recruitment.
One relevant question is whether Madrassas ―teach terror‖. Madrassas admit students of
all ages. At earlier levels, students usually learn to read and memorize the Quran. The Madrassa
curriculum, at advanced stages, focuses on the Dars-e-Nizami, which is taught for 8 years after
the completion of elementary school and covers religious sciences (e.g., jurisprudence, the
Qur‘an and its commentaries) and rational sciences such as Arabic grammar and literature, logic,
and rhetoric (Rahman, 2008).5 The books for these subjects are texts going back to before the
14th
century and classes are typically taught in Urdu (Fair, 2006; Rahman, 2008). Majority of the
Madrassas don‘t impart any secular or vocational training and it has been argued, albeit with
scant evidence, that they deliberately educate their students in narrow worldviews and do not
train them sufficiently for the real world (Ali, 2009). In fact, the Pakistani government (in
particular, during the Musharraf regime) has made a strong push for Madrassa reform at the
behest of the United States (The 9/11 Commission, 2004; Fair, 2008).
Another important question to understand the extent of Madrassas‘ influence in Pakistan
is to determine how many students study in them. The number of Madrassas has undeniably
4 Of the 500 bomb blasts in 2009 and 473 in 2010, 35 occurred in Punjab or Sindh. As for suicide attacks, of the 76
attacks in 2009, 19 occurred in Punjab or Sindh. Of the 49 in 2010, 7 happened in Punjab or Sindh (South Asia
Terrorism Portal). 5 This certification is recognized to be equivalent to a Bachelors or Masters degree by the Ministry of Education.
8
increased, especially in the 1980s during the Soviet war in Afghanistan when Madrassas were
established in Afghan refugee camps to train fighters for the resistance movement (Winthrop and
Graff, 2010). However, there is large disagreement over the extent of the penetration of
Madrassas: Estimates of Madrassas‘ enrollment vary from less than 1% (Andrabi et al., 2006) to
33% (International Crisis Group Report, 2002) of all enrolled students. One reason why figuring
out the extent of enrollment in Madrassas remains challenging is that many are unregistered-
according to Rashid (2000), less than a third of Madrassas are registered. Recent studies put the
enrollment in registered Madrassas in the 1-7% range (Fair, 2008; Pakistan Ministry of
Education). Regardless of the source that one considers credible with regards to Madrassa
enrollment, the picture indicates that a non-trivial fraction of Pakistani youth study in Madrassas.
A key feature of the Madrassas is that they generally tend to be free. In a country with a
dilapidated public educational system (Winthrop and Graff, 2010), it is believed that Madrassas
offer an alternate schooling system to those families which may not be able to afford the more
expensive private schools (Singer, 2001). Therefore, it is believed that it is the poorest families
that send their children to Madrassas (Rahman, 2004; New York Times6).
7 Related to potential
link between Madrassas and militancy, we note that the existing literature does not find a causal
link between low educational attainment/poverty and terrorism (Krueger and Maleckova, 2003;
Abadie, 2006; Berrebi, 2007; Krueger, 2007)
II.C Group identity
We seek to investigate trust among young Pakistanis belonging to distinct groups. We
focus on endogenous groups that vary in socio-economics characteristics, religiosity, exposure to
Western ideas, and type of education they receive.
In our set-up, the ―group‖ is the institution where the students study at the undergraduate
level. Therefore, our notion of group only applies to those who are highly educated. Overall, in
Pakistan in 2008/2009, 8.3% of the males aged 21 or more had a Bachelor degree or more. The
rate increases to 14.8% among those currently working in an urban area.8 Groups are endogenous
because there is selection into schools. We consider three main groups: Madrassas, Islamic
Universities and Liberal Universities.
Madrassas and their curriculum have been discussed above: Students typically come from
modest origins, have limited exposure to Western ideas in school, study in Urdu and base their
studies on religious texts. The higher levels of Madrassas produce an Alim (Islamic scholar
6 Sabrina Tavernise, ―Pakistan‘s Islamic Schools Fill Void, but Fuel Militancy‖, May 3, 2009.
http://www.nytimes.com/2009/05/04/world/asia/04schools.html (accessed January 31, 2011).
7 Andrabi et al. (2006), however, argue against the hypothesis that poverty drives individuals to Madrassas. In their
sample, they find little difference between poor and rich households in the choice of religious schooling.
8 Source: Authors‘ computation from the 2008/2009 Pakistan Labor Force Survey.
9
and/or teacher). Most students who graduate from a Madrassa go on to work in the religious
sector.
Islamic Universities provide a Liberal Arts curriculum combined with Islamic teachings
and courses. For example, Economics is taught with a focus on Islamic principles of finance.
These universities have segregated campuses for males and females, and classes are taught in
Arabic or English. These institutions tend to be public and, therefore, are accessible to low and
middle income groups. Moreover, a relatively large proportion of students at such universities
have typically studied for some time at Madrassas before enrolling.
Liberal Universities are similar to American colleges. They provide a Liberal Arts
curriculum. Classes are taught in English and campuses are mixed. Tuition at such institutions
tends to be very expensive.
These three groups clearly represent three different identities within the Pakistani society.
At one end of the spectrum we have young males from poorer backgrounds who attend religious
schools that are thought by many to be linked to militancy and extremism. At the other end of the
spectrum we have wealthy students exposed to Western-type of education.
Our measure of group identity is both a measure of religious identity as well as social
class. We believe this should strengthen identification with one‘s group. However, this would
also make interpretation of the results harder. For example, if we were to find discrimination by a
particular group, it would be challenging to infer how much of it was because of social class
(selection into institutions by observables) and how much of it was because of teachings at that
particular institution.
III. Data
We conducted experiments in two male Sunni Madrassas from Barelvi school of thought,
two male Sunni Madrassas from Deobandi school of thought, one Islamic University (IU), and
two liberal Universities located in Islamabad/Rawalpindi and Lahore between May and October
2010.9 Because they differ slightly in the students‘ characteristics and tuition level (as we show
below), we classify the two liberal universities into liberal Western-style (LU-W) and liberal
modern (LU-M) universities. The liberal Western-style university is more selective and liberal
than the modern university, and it caters to a higher socioeconomic segment of the society.
The Islamabad/Rawalpindi metropolitan area is the third largest in the country with a
population of about 4.5 million. Islamabad, the country‘s current capital, was constructed in
1960 adjacent to Rawalpindi, an older city which houses the army‘s headquarters. Lahore is the
capital of the province of Punjab and the country‘s second largest city with about 10 million
inhabitants. While both are vibrant urban centers, the Islamabad/Rawalpindi metropolitan area is
located closer to Afghanistan and the tribal areas (see Figure 2), and has greater ethnic diversity
9 Female Madrassas tend to be small. Since large sample sizes are needed for the randomizations in the experiment,
we did not include them in our sample.
10
compared to Lahore. However, Punjabis are the dominant ethnic group in both metropolitan
areas.
The institutions in our sample are amongst the 5 largest and well-regarded institutions in
the relevant category in each city. Among all the institutions we contacted, one university and
one Madrassa refused to participate. We sampled the most senior students in the 4 Madrassas
since they‘re similar in age to university students, and are pursuing degrees that are equivalent to
Bachelor degrees. Though participation was voluntary, almost everyone in the Madrassas
participated in the study. At the other institutions, a random sample of students was selected to
participate based on a listing of students provided by the registrar‘s office. Average response rate
at the universities was about 70%. Overall 1,521 male students participated in the experiments.10
They also answered a questionnaire asking about demographic characteristics, school choice, and
attitudes on social issues. Below we describe our sample and the experimental procedure.
III.A Sample
Table 1 presents the characteristics of the male participants by group (educational
affiliation), and compares them to the characteristics of a random sample of male respondents
from Islamabad/Rawalpindi and Lahore (City sample) obtained from a separate survey we
conducted in 2010. The average age of students varies between 21 and 22. Since we don‘t find
any significant differences within the Madrassas either in terms of demographic characteristics or
in their behavior in the experiments, we combine the 4 Madrassas into one group to keep the
tables and analysis simple (the disaggregated statistics are available from the authors upon
request).
Table 1 highlights the differences across the four groups. Ranking them from the most
liberal to the least liberal institutions as done in Table 1, we see that students at more liberal
schools come from a much more privileged background, with much higher parental income and
parental education and much higher asset ownership. For example, the average years of father‘s
(mother‘s) schooling is 14 (13) for students from the liberal Western-style (LU-W) University
compared to 7.1 (3.4) years in the Madrassas. Similarly, the monthly parental income in the
liberal Western-style University is nearly 10 times that in the Madrassas. Moreover, the
characteristics of students at LU-W and LU-M, both liberal modern universities, are significantly
different from each other in most cases. For example, average parental income for LU-W
students is almost twice that of LU-M students.
10 Female students from the Islamic and liberal universities also participated in the experiments. We restrict the
analysis in this paper to male students who were matched with other male students to focus on group identity,
defined by socioeconomic class and religiosity (proxied by institution). The full sample (before excluding female
students, and male students matched with female students) consists of 2836 students. The Madrassas we surveyed
cater to male students only.
11
Students from the various groups also show different levels of self-reported religiosity
and the number of prayers per day. Students were asked to rate how religious they considered
themselves on a scale from 0 (not religious at all) to 10 (very religious). The average religiosity
is 5.4 in the liberal Western-style University compared to 9.2 in the Madrassas. The former also
pray much less frequently every day (1.7 times vs. 4.9).
Finally, students are likely to be exposed to different types of information and different
peer groups. While only 23% of the Madrassas students report watching BBC and CNN, 60% of
the students of the other groups report watching it. In addition, while fathers of only 4% of
students attending LU-W spent more than 2 years studying in a Madrassa either on a part-time or
full-time basis, the corresponding proportion for Madrassa students is 20%. Similarly, while
about 6% of students at LU-W have at least a sibling or a friend who spent more than 2 years in a
Madrassa either part or full-time, that is the case for nearly a quarter of students at LU-M and
IU.11
This also suggests that the various groups in our setting interact with and have exposure to
each other at some level.
The sorting in terms of observables into these institutions is very drastic but as one would
have expected. As we move from left-most LU-W (column 1) towards Madrassas (column 4) in
Table 1, the average socioeconomic characteristics deteriorate (for example, income and
education decrease). At the same time extent of religiosity increases. If we compare the students
to the City sample (column 5), we see that Madrassa students seem to hail from humbler
backgrounds than the general population in the cities, and that all other institutions fare better in
terms of most indicators of wealth. This is consistent with the hypothesis mentioned above that
poverty may drive families to send their children to Madrassas.
The last row of the table also shows that a non-trivial proportion of respondents (between
13 and 35%) in each setting have an acquaintance who died or was injured as a result of the
violence in the country. This shows again, as pointed out in Section II.A, that violence is
widespread and has affected a large proportion of the general public.
III.B Perception of Madrassas
While the perception of the link between Madrassas and militancy in the popular press
and literature remains controversial (see section II.B above), an important question to ask is how
the Pakistani society and different groups within it view them. For the IU and the City samples,
our survey included a few questions that were meant to shed some light on this.
Columns (1) and (3) of Table 2 report the mean responses for respondents at IU and City.
The two groups have different exposure to Madrassas as nearly half of the students at IU report
to have studied in a religious institution either part-time or full time in the past, compared to only
9% of the city sample. While these numbers may seem high, they reflect a culture in South Asian
11 Because of sensitivity concerns, the set of background questions asked in Madrassas was a subset of that asked at
other institutions. This information was collected after the experiments had been completed.
12
countries for even affluent families to send their children (either full-time or part-time) to
religious institutions (which could be Madrassas or schools run in mosques) to learn to properly
recite or memorize the Quran (Billquist and Colbert, 2006).
In order to evaluate respondents‘ perception of the influence of Madrassas in the society,
we first asked them to guess the percentage of 18-year old males currently enrolled in registered
Madrassas. As with inflated estimates in the popular press about Madrassa enrollment (Andrabi
et al., 2006), our respondents also tend to over-predict the number of students enrolled in
Madrassas with estimates ranging from 38% for IU to 26% for the city sample.12
This suggests
that they see Madrassas as providing education to, and therefore influencing, a large proportion
of the population.
We presented to respondents a list of 7 possible causes for extremism and violence in
Pakistan, and asked them to rank them in order of importance (7 denoting the most important).13
The mean rating assigned to religious institutions is 3.1 for IU students, and 5.7 for the city
sample. Religious institutions are perceived to be the least important cause of extremism by IU
students, but the most important source by City respondents. Since IU students have stronger
exposure to Madrassas (see Table 1 also), their relatively positive view of Madrassas is not
surprising. Even then, it should be noted that both groups do perceive religious institutions to
play some role in fostering extremism.
A third question asked respondents to assign a percent chance that 4 entities (US and
Western countries; Radical Islamic organizations; Afghanistan government; Indian government)
were responsible for violence against civilians in recent times. Both groups assign ―radical
Islamic organizations‖ the lowest chance for being responsible for such acts. However, the mean
likelihood assigned to religious organizations is still very different from zero: 45% for IU
students and 34% for the City respondents.
Exposure to religious institutions could affect perceptions of Madrassas. Columns (2) and
(4) of the table report the corresponding mean responses for the IU and City respondents who
had never attended a Madrassa. We don‘t find that to be the case: their responses are statistically
similar to their counterparts who have been exposed to religious institutions.
Finally, both IU and City respondents overwhelmingly favor the government‘s plan to
reform Madrassas (which, among other things, requires them to register and teach secular
subjects such as Math and Science). This sentiment is similar to that found in Fair, Ramsay, and
Kull (2008) where two-thirds of their sample reportedly supports Madrassa reform.
12 Note that our survey question asks about the enrollment proportion of 18-year old male students, which could be
different from the proportion of enrolled students of all ages.
13 This question is a variant of question MQ. 28 in the 2005 17-Nation Pew Global Attitudes Survey.
13
We interpret these numbers as suggesting that the general public views Madrassas as
playing a large role in educating the youth, as being somewhat involved in militant and extremist
actions, and that reforming them would be positive for society.
III.C Experimental design
Procedure: The experiments were conducted in sessions of 50-100 students in a classroom of the
student‘s institution. The rooms were large enough to ensure respondent anonymity. The
instructions were given to each participant, read out aloud by the experimenters and projected on
a retro-projector.14
Respondents played the games on a paper questionnaire and were matched
with an actual partner ex-post, so they did not learn the identity or action of their partner while
playing the game. The questionnaire was administered in Urdu at all places except the Western-
style liberal University where it was conducted in English, since students there are more used to
reading and writing in English.15
Moreover, the questionnaires were identical across all the
institutions up to the section leading into the experiments.
Games: Students were asked to play the following games:
- Trust game: Player A (the sender) is given a fixed amount of money (Rs. 300) and
decides whether to keep it or give it to Player B (the receiver), i.e. invest it. If given to
Player B, the experimenter triples that amount and gives it to Player B who is asked to
choose whether to transfer any money back to player A (which can be any amount
between zero and Rs. 900). The efficient outcome is for A to invest the money by
transferring it to player B, while the subgame perfect equilibrium is to keep the money.
Lack of trust towards the partner may lead to inefficiencies. This is a binary version of
the ―trust game‖ introduced by Berg, Dickhaut, and McCabe (1995)—it is binary in the
sense that player A can choose to send either nothing or the entire amount. In our setting,
all respondents played the role of Player A and the role of a Player B who received the
money. When put in the role of Player B, we use the strategy method and ask the
respondent to report the amount he would like to send back conditional on Player A
deciding to invest.
- Dictator game: This is a one-stage game in which Player A (the sender) decides on the
division of a fixed amount of money (Rs 400) between himself and Player B (the
receiver). Player B does not make any choice. Again, respondents play the role of both
Player A as well as Player B.
14 Full instructions are available from the authors upon request.
15 The translation was supervised by Zafar who speaks both English and Urdu fluently to ensure that nothing was
lost in translation.
14
- Expectations: Respondents were asked to guess (i) the average amount that students
from their institution chose to give to their matched partner and (ii) the average amount
that students from the partner‘s institution chose to give to their matched partner from the
respondent‘s institution. Note that when students are asked to provide their expectations,
they are asked about the average payoffs for an identical pair of partners (see the exact
instructions in the Appendix). Also expectations were elicited after the respondent had
made the decision in the games.
Treatment: The treatment in this experiment is the randomization of institution and gender of the
pair of players. Each student was randomly matched with one of the following partners: a male
Madrassa student, a male student from a liberal university, or a male student from an Islamic
University. Students from the liberal Modern (Western-style resp.) university who were selected
to be matched with a student from a liberal University were informed that they were matched
with a student from their own university. All other students who were selected to be matched
with a student from a liberal University were informed that they were matched with a student
from a liberal Western-style University. The description of the match (with the exact name of the
match‘s educational institution) was already printed on the paper questionnaire received by each
participant, so students were not aware that other participants in their session were matched with
partners of different educational institutions. Each student was informed that they would play all
the games with the same partner. Table 3 presents the sample sizes of for each institution and
matches. 16
Students were given a short description of the institution they were matched with but
since the selected institutions are amongst the most well-known institutions, most students would
know all of them.
Payoffs: Respondents received financial compensation for their participation in the survey and
the games. They all received a Rs. 200 show-up fee given to them the day of the session. Some
tasks were then randomly chosen for determining the payoffs. One of the four roles (sender or
receiver in the trust game, sender or receiver in the dictator game) was randomly selected for
compensation, along with one of the four expectations questions (Rs. 50 if the respondent
correctly identified the interval where the actual average lies). Students were informed that they
would receive compensation for one of the four roles in the games, chosen at random, before
they made their decisions. Once the sessions were completed, we randomly matched students
with a particular partner from the institution/gender indicated in their questionnaire and
16 Students at Madrassas who were assigned a ―Male Madrassa treatment‖ were either matched with a student at
their own Madrassa or a different Madrassa (but one that belonged to the same school of thought). Since we don‘t
find any systematic differences between the two in our analysis, the two groups are combined. This is why, in Table
3, a much larger number of Madrassa students is matched with Madrassa students than with LU and IU students
(since it combines two treatments).
15
determined the payoffs. Subjects could pick their compensation starting about one week after the
completion of the experiment. Respondents earned on average Rs. 600 from the games. The
overall Rs. 800 average compensation corresponds to about USD 10. The 2009 per capita GNI at
purchasing power parity in Pakistan was $2,710, compared to $46,730 in the US. This means the
average compensation of USD 10 corresponds to 0.4% of the GNI per capita. The US equivalent
would be approximately USD 170. Therefore, the stakes involved in the experiments were very
large.
IV. Experimental results
We now discuss the results of our experiments. To understand trust between the different
groups, we test the following hypotheses:
Hypothesis H1: Does investment behavior in the trust game vary by group (i.e., institution type)?
We begin by investigating whether investment behavior varies systematically by group. The first
column of Table 4 shows the overall proportion of sender who chose to send the Rs. 300 in the
trust game. A few notable patterns stand out about this column. First, respondents are quite
trusting on average as 74.6% of all students decided to send the Rs. 300. This is in the higher
range of what respondents have been found to send in the few studies that use a version of the
binary trust game: the investment rate varies from 32% (Bohnet and Huck, 2004) to 91% (Engle-
Wornick and Slonim, 2004).17
Second, there is heterogeneity of investment behavior by group.
For example, 61% of the Islamic University students chose to send the money compared to 80%
of Madrassa students. When comparing the four groups, we can reject equality of the means
using a F-test and equality of the distribution using a Kolmogorov-Smirnov test (tests presented
in the last two rows Table 4).18
We summarize this result below:
RESULT 1: Investment behavior in the trust game varies by group, with Madrassa students
being more likely to invest.
17 One needs to be cautious in making any comparisons with the few studies that employ a binary trust game since
small modifications in the design (such as stake size, stake increase in the investment game—in our case three times,
specifics of the match that the respondent is informed about, sample characteristics) can result in large differences.
The continuous trust game has been employed by more studies. Players A (trustors) send about 50% of their
endowment in such games (Camerer 2003).
18 Note that this result is not driven by the larger sample size of pairs of Madrassa students matched with other
Madrassa students (see footnote 11) as we get similar results if we look at the investment behavior for a given
partner. For example, among subjects matched with students from the Islamic University, we see that 63% (80%
resp.) of the Islamic University (Madrassas resp.) students decided to invest. We discuss these results below.
16
Hypothesis H2: Do students exhibit an in-group bias and is there differential treatment
(discrimination) in terms of investment against a particular group?
As pointed out earlier, an extensive literature suggests that individuals tend to favor members
from their own group. We now investigate whether this applies for the groups we consider in
Pakistan and test whether there is systematic discrimination in favor of or against a particular
group. For each group, Columns (2)-(4) of Table 4 show the proportion of respondents who sent
the Rs. 300 in the trust game conditional on the group they are matched with. Within each group
(i.e., each row institution), we do not reject the hypothesis that the proportion of respondents
who invest varies by the matched group (as indicated by the F-test for equality of proportion
within group and Kolmogorov-Smirnov test for equality of distribution in columns 5 and 6). This
suggests that there is no systematic discrimination against a particular group in their investment
decision. Moreover, none of the three sets of pairwise hypothesis tests between having a match
from own institution type versus another institution type that we conduct (Wilcoxon rank-sum,
Kolmogorov-Smirnov test, and t-test for equality of the means) are statistically significant at
levels of significance of 5% or higher. This implies that students do not invest more extensively
when interacting with a partner from their own group.
This is a very surprising result, and one that is at odds with the existing literature on
group identity (see Introduction). Even with minimal groups which are arbitrary labels, group
identity typically affects behavior. In a setting such as ours where groups are very distinct in
terms of their socioeconomic characteristics and religiosity, and where (inter-group) conflict is
present, one would have ex-ante expected to observe strong systematic differences in inter-group
behavior.
Table 1 shows that at all institutions, a non-negligible proportion of students‘ parents or
siblings attended a Madrassas. These students may have a systematically different perception of
Madrassa students. To investigate this, we replicated Table 4 excluding respondents who had no
relatives who attended Madrassas and found similar patterns (table not shown). We summarize
this result below:
RESULT 2: There is no evidence of in-group bias or of differential treatment to any particular
group.
Hypothesis 3: Is there taste-based discrimination or stereotyping against a group?
When playing the trust game, there are several dimensions of preferences and beliefs that may
motivate a subject to ―invest‖, i.e., to send the money to the matched partner:
(i) unconditional other-regarding preferences such as altruism (Andreoni and Miller, 2002),
warm glow (Andreoni, 1990), inequity-aversion (Fehr and Schmidt, 1999; Bolton and
Ockenfeld, 2000) or maximin preferences (Charness and Rabin, 2002),
(ii) beliefs about trustworthiness of the partner (Dufwenberg and Gneezy, 2000; Cox, 2004;
Ashraf, Bohnet, and Piankov, 2006), and
(iii) risk preferences (Karlan, 2005; Schecter, 2007).
17
Results from the trust game do not allow the identification of the relative roles of those
dimensions (Cox, 2004). While Result 2 emphasizes a homogenous investment behavior towards
the various groups, such a result could still be consistent with different levels of trust and of
unconditional other-regarding behavior towards certain groups.19
For example, Madrassa
students may invest similarly with Islamic University student and liberal University students
because they do not trust Islamic University students but are altruistic towards them while they
trust liberal University students but do not exhibit altruism towards them.
Our multiple-game experimental design allows us to separately measure unconditional
other-regarding behavior and expected trustworthiness. In the dictator game, the only motive for
sending money to the partner is unconditional other-regarding behavior. We can thus learn more
about other-regarding behavior by analyzing how students played that game. In addition, the
elicitation of expected average amount sent back by each group to students from their own
institution gives us a measure of expected trustworthiness or stereotype towards each group.
Table 5 shows the average amount sent in the dictator game for all pairs of partners. As
shown in the first column, on average, students sent Rs. 171 (42.7% of the total amount) to their
partner and only 6.7% did not send anything at all. This is a very high level of other-regarding
behavior when compared to the standard of dictators sending about 20% of their endowment
(Camerer, 2003). Within liberal Universities and Madrassas, there is some evidence that students
tend to give slightly less to their own group compared to Islamic University students when
looking at the pairwise t-test and Wilcoxon rank-sum test. However, for all groups, we do not
reject equality of distribution based on pairwise Kolmogorov-Smirnov test when comparing own
group versus other groups. One difference in behavior is noticeable however: Madrassa students
give on average more than any other group and are less likely to not give anything. We
summarize this in the following result:
RESULT 3: Within each group (institution type), there is no systematic difference regarding
unconditional other-regarding behavior towards other groups, i.e., there is no taste-based
discrimination. Madrassa students exhibit stronger other-regarding behavior than any other
groups.
Note that we cannot disentangle the exact mechanisms that lead to each group‘s
unconditional other-regarding behavior. As mentioned above, unconditional other-regarding
behavior may be prompted by altruism, warm glow, inequity-aversion, or maximin preferences.
19 Since students were randomly assigned a treatment (i.e., match type), differences in risk preferences cannot
explain any of the results since there is no reason to believe that risk preferences would change by match type. We,
therefore, do not focus on this explanation when decomposing behavior in the trust game. We do have qualitative
measures of risk preferences from the respondents, and they in fact are similar within each treatment conditional on
the student‘s institution.
18
For example, it could be the case that an average LU student has distaste (low altruism) toward
Madrassa students (relative to tastes towards students at other institutions), but is very averse to
income inequality. That could lead to similar average behavior in the dictator game toward
different groups since Madrassa students tend to be from less affluent backgrounds. A structural
approach with institution-match specific parameters would be needed to get at this, which is
beyond the scope of this paper.20
Table 6 and Figure 3 show the expectations reported by individuals regarding the average
amount expected from the matched group, i.e., it reveals expected trustworthiness. Note that
respondents choose an interval for the average and do not report a point estimate for the exact
average. The mean and median amounts presented in Table 6 are those obtained by allocating as
expected average the middle of the chosen interval. To conduct hypothesis testing on various
quantiles of the distribution of expectations, we also present in Table 6 the proportion of
respondents who expect to receive more than Rs. 200, more than Rs. 300 and more than Rs. 400
from the match. Three points from this table and Figure 3 are of note. First, Madrassa students
expect all other groups to be the most trustworthy. Column (1) of Table 6 shows that Madrassa
students expect on average Rs 405 back while all other institutions expect less than Rs 370 and
the differences are statistically significant (see test for equality of means, medians and
distributions of the 4 groups presented in the bottom of Table 6). This, combined with the fact
that Madrassa students exhibit stronger other-regarding behavior, explains why they are more
likely to invest in the trust game. Second, students from liberal Modern University (LU-M) and
Madrassas expect all groups to be equally trustworthy (none of the P-value of the test for
equality of means, medians and distributions of the 3 matches presented in the last 3 columns of
Table 6 are less than 5%). Finally, students from liberal Western-style University (LU-W) and
Islamic University (IU) expect different levels of trustworthiness across the various groups, as is
also apparent in Figure 3. LU-W students believe Islamic University students to be the most
trustworthy and Madrassa students to be the least trustworthy. For example, more than half of the
liberal Western-style University students expect Islamic University students to send back more
than Rs. 400 compared to less than a quarter who expect Madrassa students to send more than
Rs. 400. This difference is statistically significant as shown on the test based on the imputed
expectations and on the proportion of respondents who expect to receive more than Rs 400 (P-
value less than 5% in the last 3 columns of Table 6). In contrast, IU students expect LU students
to be the least trustworthy. We summarize the results from Table 6 and Figure 3 as follows:
20 An alternative would be to run reduced-form regressions controlling for characteristics (religiosity, socioeconomic
characteristics etc.) of the respondent and the match, besides dummies for the respondent‘s institution. This
approach is not informative because most of the variation is between institutions rather than within institutions, and
because socioeconomic characteristics tend to be correlated with institutions (sorting).
19
RESULT 4: There is no systematic difference within group about perceived trustworthiness of
other groups for liberal Modern University and Madrassa students. Madrassa students are the
ones who expect others to be the most trustworthy.
Madrassa students are the most trusting, they also exhibit strongest unconditional other-
regarding behavior and expect to receive back the most from the match in the trust game.
Similarly, LU-M students, who are second-most likely to invest, have the second highest levels
of other-regarding behavior and expectations of return. This would imply that trusting behavior
is related to both unconditional other-regarding behavior as well as expectations of return (a
finding similar to that of Ashraf et al., 2006). We do not quantify the relative roles of other-
regarding behavior and expectations in explaining behavior in the trust game for two main
reasons. One, because the goal of the paper is to primarily focus on inter-group behavior.
Second, there could be unobservable characteristics that explain behavior in both the trust and
dictator game, so a naïve regression which simply regresses trust game behavior on dictator
game behavior and expectations of trust would yield biased estimates.21
Hypothesis 4: Are the stereotypes correct?
We now compare the expected amount sent with the actual amount sent in Table 7. We
show the proportion of students who expected more than Rs 300 from a given group and the
proportion of students from that group who actually sent more than Rs 300. In addition, we also
show the proportion of students who had ―accurate‖ expectations, i.e., those who chose the
interval that contained the actual average, and the proportion of students who under-estimated
the amount sent, i.e., those who chose an interval whose upper-bound was below the actual
average.
Several interesting results stand out. First, liberal university students have inaccurate
expectations about Madrassa students. While 81% of the Madrassas students sent more than Rs.
300 to liberal university students, only 52% of Western-style and 69% of Modern university
students expected to receive more than this amount of money. The differences are statistically
significant at 5% (as indicated by the P-value in the third row of each panel in Table 7).
Moreover, large proportion of respondents from liberal universities under-estimated what
Madrassa students would send back (76% of the Western-style and 54% of the Modern
university students). Note that this result is not solely driven by the fact that Madrassa students
actually send back the most amount relative to other groups (last row in each panel in Table 7),
but also by the fact that liberal universities‘ students expect Madrassa students to be the least
trustworthy (Table 6). Second, Madrassa students expected more from liberal university students
21 Such a regression at the institution level shows that both unconditional other-regarding behavior and expectations
of return are significant in explaining the choice. However, other-regarding behavior seems to be quantitatively
more important.
20
than what they actually received from them: only 13% of the Madrassa students had accurate
expectations while 64% over-estimated the amount they would receive.
Note that those differences however do not seem to be large enough to generate
differences in investment behavior in the trust game (see Result 2), possibly because of the
binary nature of the decision.
RESULT 5: There is incorrect stereotyping. Liberal University students systematically under-
estimate the trustworthiness of Madrassa students, while Madrassa students systematically over-
estimate the trustworthiness of Liberal University students.
V. Potential Cofounding Factors
As mentioned in the Introduction, the literature has found strong effects of group identity even
when using minimal groups. However, other than the finding that there is incorrect stereotyping
of Madrassa students by liberal university students (and vice versa and in opposite directions),
Section IV does not find evidence of group affiliation affecting investment behavior in the trust
game and dictator game in a systematic way. In this section, we provide a list of possible
confounding factors, and argue that they can be ruled out as possible explanations for the result.
Anonymity
Experimental payoffs for each student had to be computed by matching a student with
another student belonging to the designated matched institution, and taking into account the
choices of both students in the match pair. While students knew the institution of the student they
were matched with, they were never told of who they were matched with. Payoffs were only
made available to students starting one week after the completion of the survey. Therefore, we
needed some way to link students to the questionnaire, while at the same time keeping their
identity confidential. In order to achieve this, each student was given a ten rupee bill (that was
initially stapled to their questionnaire) and was asked to enter the serial number of the bill on the
questionnaire. The computed subject payoffs for each student were then put in sealed envelopes
with the corresponding serial number on them. Students simply had to return their ten rupee bill
one week later when they came to collect their payoff. Also during the administration of the
experimental component of the survey, all enumerators were pulled aside so that respondents
didn‘t feel that their responses were being observed by someone else. Our survey administration
method is therefore equivalent to an anonymous questionnaire.
Credibility
Nearly all the students in our sample had never been exposed to incentivized
experimental tasks. Moreover, as mentioned above, payoffs for the games were made at least one
week after the student had taken the survey. Both these factors may lead subjects to believe that
21
payments may not actually be made, and they might not find the offer of monetary incentives
credible. While it is not possible to rule out this factor, we worked with the administrations of the
participating institutions to convey the seriousness of the incentives. Our field teams always
included students and faculty members of the participating institutions. Moreover, experimental
payoffs were available for pickup from the Registrar‘s Office in sealed envelopes with the
respondent‘s serial number written on it. And students received an instantaneous show-up fee of
Rs. 200 for completing the questionnaire. These measures should have made this entire endeavor
look legitimate from the student‘s perspective.
The show-up rate (to pick up compensation) varied between 68% and 100% at the
participating institutions.22
This is a fairly high show-up rate, and one that suggests that students
did find this entire exercise credible.
Stakes
The dictator game employed a pot of Rs. 400 (~USD 4.7), while the trust game employed
an amount of Rs. 300 (~ USD 3.5), which could be tripled. As mentioned earlier, respondents
earned Rs. 600 (USD 7) on average from the experiments. Rescaling the stakes using per capita
GNI numbers at PPP, this corresponds to about USD 120 in the US. Therefore, the stakes
involved in the experiments were very high. This is particularly true for the low-income students
in our sample, who predominantly belong to Madrassas and who are found to exhibit the
strongest trust and other-regarding behavior.
Understanding the game
Given that most students in our sample had never taken a survey, let alone participate in
an experimental game, the possibility of students not being able to comprehend experimental
instructions has to be considered. When designing the questionnaire, we made a conscious effort
to keep the instructions as simple as possible. It was precisely for this reason that we chose the
dictator and trust game to measure discrimination, and not a public good game.23
The
instructions for the games were read out line by line, and projected on a computer screen.
Students were allowed to ask any clarifying questions by raising their hands. Finally, the
decisions involved in both the dictator and trust game really are very simple.
Column 1 of Table 8 shows the summary statistics of amount sent in the dictator game by
institution. Column 4 shows the corresponding statistics for the amount sent back in the trust
22 The show-up rate excludes those respondents who showed up to receive compensation and had either misplaced
their Rs. 10 notes, or had no record of their bill serial numbers.
23 For example, Castillo and Petrie (2010) use a public good game to measure discrimination in the lab. Another
reason why we couldn‘t use a public game setup, besides it being harder to comprehend, was that it would have been
challenging to give feedback (for example, about others‘ contributions) to participants in real time using paper
surveys.
22
game (out of Rs. 900 but scaled down to Rs. 400). Abstracting from effects of stake size, theory
would suggest that respondents send weakly larger amounts back in the trust game than they do
in the dictator game because of the added concern of reciprocity (Cox, 2004).24
This is in fact
what the table shows. The null that the distributions of amount sent in the dictator game and the
rescaled (from Rs. 900 to Rs. 400) amount sent back in the trust game are the same is rejected for
each of the institutions. This provides strong suggestive evidence that respondents understood
the setup of the games.
It is also interesting to note that the findings in the trust game match up fairly well with
the self-reported response to the question ‗‗Generally speaking, on a scale from 0 to 10 would
you say that most people can be trusted?‘‘, where respondents answer on a scale of zero (all
people cannot be trusted) to 10 (all people can be trusted). This question is a variant of the one
asked in the General Social Survey (see Glaeser et al., 2000, for a discussion on this). As shown
in Table 1, the mean response to this question is highest for Madrassa students (5.1) followed by
LU-M students, who are second-most likely to send money in the trust game (Table 4).
Binary nature of the trust game
One possible reason for the lack of effect of group membership may be that the binary
nature of the trust game prevents us to identify effects that we would find with a continuous trust
game. However, this is unlikely to be the case because (i) we do find differences by institutions
in the binary decision to invest the money in the trust game, and (ii) we also do not find a group
membership effect in the dictator game where the decision is not binary.
VI. Discussion
We investigated how, in a segmented society mired in conflict, trust within groups of
young males of very different religiosity, social identity and (perceived) links to extremism
operates. Our results are rather surprising. First, we find very high levels of trust, trustworthiness
and other-regarding behavior when compared to existing studies in the literature. Moreover, it
has been argued that hierarchical religions, such as Catholicism and Islam, weaken trust (Putnam
1993, La Porta et al. 1997). Since our sample consists of Muslims entirely, the high level of trust
found in this study is not consistent with this hypothesis. One possibility could be that Pakistan
stands out in terms of trust when compared to other countries, but evidence from other surveys
suggests that this is not the case. The World Value Surveys of 2000/2001 ask respondents from
70 countries whether ―most people can be trusted‖ or one ―needs to be very careful in dealing
24 Stake size has been found not to matter for amount sent in dictator games (Forsythe et al., 1994; Carpenter,
Verhoogen, and Burks, 2005) or for amount sent back in the trust game (Johansson-Stenman, Mahmud, and
Martinsson, 2005).
23
with people.‖ In Pakistan, 31% of the people surveyed agreed with this statement that most
people can be trusted, which is very similar to the UK (30%) and the US (36%) and well below
countries that are top ranked in terms of trust such as Iran (65%) or Denmark (66%).
Another important finding is that there is no evidence of in-group bias for any of the
groups we consider in the investment decision in the trust game. Despite the fact that opinions
collected from a subset of our respondents reveal that Madrassas are not viewed positively and
are perceived to play some role in fostering violence, and a large proportion of the students have
an acquaintance who died or was injured as a result of the violence in the country (Tables 1 and
2), we do not find that any of the groups behave differently when matched with Madrassa
students. It is important to note that the Madrassas we surveyed are mainstream Madrassas, and
one could argue that students at other institutions possibly took that into account when playing
the games (i.e., students make a distinction between mainstream Madrassas and radical ones).
But since most Madrassas are similar to the ones that participated in the study, our findings
would extend to the vast majority of those institutions.
We do however find that Madrassa students behave systematically differently than other
groups: they are the ones trusting the most and exhibiting the strongest other-regarding behavior.
If Madrassas were fostering extremism and teaching hatred, this finding would be highly
unlikely. So why is it that Madrassa students invest the most, exhibit the strongest other-
regarding behavior, and show more trustworthiness? Lower risk-aversion could explain why they
are more likely to invest in the trust game but Table 1 reveals that Madrassas students are on
average more risk-averse than any of the other group. Another possibility is their higher levels of
religiosity. There is a literature that shows that religious rituals promote pro-social behavior
(Iannacone, 1998; Ruffle and Sossis, 2007), and that trust and trustworthiness are positively
correlated with religiosity (Tan and Vogel, 2008). Since Madrassa students are more religious
and indulge in religious practices more frequently (Table 1), this would be consistent with this
literature. This channel alone, however, cannot explain the patterns that we observe across the
institutions. Note that IU students rank second in terms of their religiosity and adherence to
religious practices, but are less likely to trust (Table 4) and to indulge in other-regarding
behavior (Table 5) than liberal university students. Possibly both religion and income matter in
this context. Alesina and La Ferrera (2002) find that, in the U.S context, high-income groups
tend to trust more. So one factor that may explain that liberal University students are more
trusting than the IU students is the higher income of their parents. IU students may trust less
than the other groups because they are in the middle in terms of both the income and religiosity
scale.
Another finding is that, despite the fact that there is no discriminatory behavior towards
any group, there is some incorrect stereotyping. In particular, Liberal University students
systematically under-estimate the trustworthiness of Madrassa students, while Madrassa students
over-estimate the trustworthiness of liberal University students. These incorrect stereotypes
could influence negatively the social and economic interactions of those two groups outside of
the lab.
24
Still, overall, our findings offer some cautiously optimistic perspective for Pakistan‘s
future. Of course, the high and non-discriminatory levels of trust we find pertain to highly
educated groups. However, those groups are likely to be important actors in the economic
activity of the country. Several African countries have experienced remarkable post-conflict
economic recovery and one of the many channels may be that institutions, including trust, have
improved as a result of the conflicts (Cramer, 2006). We can only hope that Pakistan will have a
similar fate.
25
References
Abadie, A. 2006. ―Poverty, Political Freedom, and the Roots of Terrorism.‖ American Economic Review
(Papers and Proceedings), 96(2): 50-56.
Akerlof, G., and R. Kranton. 2000. ―Economics and identity." Quarterly Journal of Economics, 115(3):
715-753.
Alesina A. and E. La Ferrara. 2005. ―Ethnic Diversity and Economic Performance.‖ Journal of Economic
Literature 43(3): 762-800.
Alesina, A and E. La Ferrara. 2002. "Who trusts others?" Journal of Public Economics, 85(2): 207-234,
Ali, S. 2009. Islam and Education: Conflict and Conformity in Pakistan’s Madrassahs. Karachi: Oxford
University Press.
Andrabi, T., J. Das, A. Khwaja, and T. Zajonc. 2006. ―Religious School Enrollment in Pakistan: A Look
at the Data.‖ Comparative Education Review, 50(3): 446-477.
Andreoni, J. 1990. "Impure Altruism and Donations to Public Goods: A Theory of Warm-Glow Giving?"
Economic Journal, 100(401): 464-77.
Andreoni, J., and J. Miller. 2002. ―Giving According to GARP: An Experimental Test of the Consistency
of Preferences for Altruism.‖ Econometrica, 70(2): 737-53.
Asal, V., C. Fair, and S. Shellman. 2008. ―Consenting to a Child's Jihad.‖ Studies in Terrorism and
Conflict, 20 (5): 1001–1022.
Ashraf, N., I. Bohnet, and N. Piankov. 2006. ―Decomposing Trust and Trustworthiness.‖ Experimental
Economics, Special Issue on Behavioral Economics, 9(3): 193-208.
Bellows, J. and E. Miguel. 2009. ―War and Local Collective Action in Sierra Leone.‖ Journal of
Public Economics 93: 1144-57
Benjamin, D., J. Choi, and A. Strickland. 2010. "Social identity and preferences." American Economic
Review, 100(4): 1913-1928.
Berebbi, C. 2007. ―Evidence about the Link Between Education, Poverty and Terrorism Among
Palestinians.‖ Peace Economics, Peace Science and Public Policy, 13(1): 1-36.
Berg, J., J. Dickhaut, and K. McCabe. 1995. ―Trust, Reciprocity, and Social History.‖ Games &
Economic Behavior, 10: 122-142.
Bernhard, H., E. Fehr, and U. Fischbacher. 2006. ―Group Affiliation and Altruistic Norm Enforcement.‖
American Economic Review (Papers and Proceedings), 96(2): 217-221.
Billquist, D., and J. Colbert. 2006. ―Pakistan, Madrassas, and Militancy.‖ Monterey, CA: Naval
Postgraduate School.
26
Blattman, C., 2009. ―From Violence to Voting: War and Political Participation in Uganda.‖ American
Political Science Review 103: 231-47.
Blattman, C. and E. Miguel. 2010. ―Civil War." Journal of Economic Literature, 48(1): 3-57.
Bohnet, I., and S. Huck. 2004. "Repetition and Reputation: Implications for Trust and Trustworthiness
When Institutions Change." The American Economic Review, 94(2): 362-366.
Bolton, G., and A. Ockenfels. 2000. ―A theory of equity, reciprocity and competition.‖ American
Economic Review, 90(1), 166-93.
Camerer, C. 2003. Behavioral Game Theory. Princeton: Princeton University Press.
Carpenter, J., Verhoogen, E., Burks, S. 2005. ―The Effect of Stakes in Distribution Experiments.‖
Economic Letters, 86: 393-398.
Castillo, M., and R. Petrie. 2010. ―Discrimination in the Lab: Does Information Trump Appearance?‖
Games and Economic Behavior, 68(1): 50-59.
Charness, G., and M. Rabin. 2002. ―Understanding Social Preferences with Simple Tests.‖ Quarterly
Journal of Economics, 117(3): 817–69.
Charness, G., L. Rigotti, and A. Rustichini. 2007. ―Individual Behavior and Group Membership."
American Economic Review, 97(4): 1340-1352.
Chen, Y. and S. Li. 2009. ―Group identity and social preferences." American Economic Review, 99 (1):
431-457.
Collier, P. and J. W. Gunning. 1999. ‖Explaining Africa‘s Economic Performance.‖ Journal of Economic
Literature, 37(1): 64-111.
Cox, J. 2004. ―How to Identify Trust and Reciprocity.‖ Games and Economic Behavior. 46: 260-281.
Cramer, C., 2006. Civil War is not a Stupid Thing. Accounting for Violence in Developing Countries.
London: Hurst & Company.
Dufwenberg, M., and U. Gneezy. 2000. ―Measuring Beliefs in an Experimental Lost Wallet Game.‖
Games and Economic Behavior, 30: 163‐182.
Easterly, W. 2001. ―Can Institutions Resolve Ethnic Conflict?‖ Economic Development and Cultural
Change, 49(4): 687-706.
Easterly, W., and R. Levine. 1997. ―Africa‘s Growth Tragedy: Policies and Ethnic Divisions.‖ Quarterly
Journal of Economics, 111(4): 1203-1250.
Engle-Warnick, J., and R. Slonim. 2004. "The evolution of strategies in a repeated trust game." Journal of
Economic Behavior & Organization, 55(4): 553-573.
27
Esteban, J., Mayoral, L., and D. Ray. 2010. ―Ethnicity and Conflict: An Empirical Study.‖ NYU Working
Paper.
Fair, C. 2006. Islamic Education in Pakistan. United States Institute of Peace.
Fair, C. 2008. The Madrassah Challenge—Militancy and Religious Education in Pakistan. United States
Institute of Peace.
Fair, C., C. Ramsay, S. Kull. 2008. ―Pakistani Public Opinion on Democracy, Islamist Militancy, and
Relations with the U.S.‖ Washington D.C.: USIP/PIPA Report.
Falk, A., and C. Zehnder. 2007. ―Discrimination and in-group favoritism in a citywide trust experiment.‖
IZA DP No. 2765.
Fehr, E., and K. Schmidt. 1999 ―A Theory of Fairness, Competition and Cooperation.‖ Quarterly Journal
of Economics, 114(3): 817-68.
Fershtman, C., and U. Gneezy. 2001. ―Discrimination in a Segmented Society: An Experimental
Approach.‖ Quarterly Journal of Economics, 116(1): 351–77.
Forsythe, R., J. Horowitz, N. Savin, and M. Sefton. 1994. ―Fairness in Simple Bargaining Experiments.‖
Games and Economic Behavior, 6: 347-369.
Fukuyama, F. 1995. Trust : The Social Virtues and the Creation of Prosperity. London: Penguin Books.
Gilligan M, J. B. J. Pasquale, and C. D. Samii. 2010. ―Civil War and Social Capital: Behavioral-Game
Evidence from Nepal.‖ mimeo.
Glaeser, E., D. Laibson, J. Scheinkman, and C. Soutter. 2000. ―Measuring Trust.‖ Quarterly Journal of
Economics, 115(3): 811–46.
Goette, L., D. Huffman, and S. Meier. 2006. ―The impact of group membership on cooperation and norm
enforcement: Evidence using random assignment to real social groups". American Economic Review
(Papers and Proceedings), 96(2): 212-216.
Goette, L., D. Huffman, and S. Meier. 2010. ―The impact of social ties on group interactions: Evidence
from minimal groups and randomly assigned real groups.‖ Working Paper.
Guiso, L., P. Sapienza, and L. Zingales. 2004. ―The role of social capital in Financial Development.‖
American Economic Review, 94(3): 526-556.
Heap, S., and D. Zizzo. 2009. ―The Value of Groups." American Economic Review, 99(1): 295-323.
Iannacone, L. 1998. ―Introduction to the Economics of Religion.‖ Journal of Economic Literature, 36:
1465-1496.
International Crisis Group. 2002. ―Pakistan: Madrassahs, Extremism and the Military.‖ ICG Asia Report
36. Islamabad/Brussels.
28
Jamal, H. 2009. ―Estimation of multidimensional poverty in Pakistan.‖ Social Policy and Development
Centre, Working Paper.
Johansson-Stenman, O., M. Mahmud, and P. Martinsson. 2005. ―Does Stake Size Matter in Trust
Games?‖ Economic Letters, 88: 365-369.
Karlan, D. 2005. "Using Experimental Economics to Measure Social Capital and Predict Financial
Decisions." American Economic Review, 95(5): 1688–1699.
Knack, S. and Keefer, P. 1997. ―Does social capital have an economic payoff? A cross-country
investigation.‖ Quarterly Journal of Economics, 112(4): 1251-1288.
Krueger, A., and J. Maleckova. 2003. ―Education, Poverty, and Terrorism: Is there a Causal Connection?‖
Journal of Economic Perspectives, 17(4): 119-144.
Krueger, A. 2007. What Makes a Terrorist. Princeton: Princeton University Press.
La Porta, R., F. Lopez-de Silane, A. Shleifer, and R. Vishny. 1997. ―Trust in large organizations.‖
American Economic Review, 87(2): 333-338.
Miguel E. 2006. ―Ethnic Diversity and Poverty Reduction (Chapter 12)‖, in Understanding Poverty,
(eds.) Abhijit Banerjee, Roland Benabou, and Dilip Mookherjee, Oxford University Press.
Miguel E. and M. K. Gugerty. 2005. ―Ethnic Diversity, Social Sanctions, and Public Goods in Kenya.‖
Journal of Public Economics, 89(11-12), 2325-2368.
Ostrom, E. 1990. Governing the commons: The evolution of institutions for collective action. Cambridge:
Cambridge University Press.
Putnam, R. (with R. Leonardi and R. Nanetti). 1993. Making Democracy Work: Civic Traditions in
Modern Italy. Princeton, NJ: Princeton University Press.
Putnam, R. 2000. Bowling alone: The collapse and revival of American community. New York: Simon &
Schuster.
Rahman, T. 2004. ―The Madrassa and the State of Pakistan: Religion, Poverty and the Potential for
Violence in Pakistan.‖ Himal South Asian.
Rahman T. 2008. "Madrasas: the potential for violence in Pakistan?" in J. Malik (ed), Madrassas in South
Asia. Teaching terror? Routledge Contemporary South Asia Series, London and New York.
Rashid, A. 2000. Taliban: Militant Islam, Oil and Fundamentalism in Central Asia. New Haven, Conn.
Yale University Press.
Ruffle, B., and R. Sosis. 2007. ―Does it Pay to Pray? Costly Ritual and Cooperation.‖ The B.E. Journal of
Economic Analysis & Policy 7(1): (Contributions), Article 18.
Schechter, L. 2007. "Traditional Trust Measurement and the Risk Confound: An Experiment in Rural
Paraguay." Journal of Economic Behavior and Organization, 62(2): 272-292.
29
Singer, P. 2001. ―Pakistan's Madrassahs: Ensuring a System of Education not Jihad.‖ Brookings
Institution Analysis Paper 41. Washington DC.
South Asia Terrorism Portal. Electronic Database for the Institute of Conflict Management.
http://www.satp.org/.
Stern, J. 2000. ―Pakistan's Jihad Culture.‖ Foreign Affairs 79(6): 115-126.
Sutter, M. 2009. ―Individual behavior and group membership: Comment." American Economic Review,
99(5): 2247-2257.
Tajfel, H., M. Billig, R. Bundy, and C. Flament. 1971. ―Social categorization and intergroup behavior."
European Journal of Social Psychology, 1(2): 149-177.
Tajfel, H., and J. Turner. 1986. ―The Social Identity Theory of Intergroup Behavior.‖ In The Psychology
of Intergroup Relations, ed. Stephen Worchel and William Austin, 7–24. Chicago: Nelson-Hall.
Talbot, I. 2009. Pakistan: A Modern History. Hust & Company, London.
Tan, J. and C. Vogel. 2008. ―Religion and Trust: An Experimental Study.‖ Journal of Economic
Psychology, 29: 832-848.
The 9/11 Commission. 2004. The 9/11 Commission Report: Final Report of the National Commission on
Terrorist Attacks Upon the United States.
The World Factbook 2010. Washington, DC: Central Intelligence Agency, 2010.
https://www.cia.gov/library/publications/the-world-factbook/index.html
Voors, M. E. Nillesen, P. Verwimp, E. Bulte, R. Lensink and D. van Soest. 2010. ―Does Conflict affect
Preferences? Results from Field Experiments in Burundi,‖ MICROCON Research Working Paper 21.
Winthrop, R., and C. Graff. 2010. ―Beyond Madrasas: Assessing the Links between Education and
Militancy in Pakistan‖. Center for Universal Education at Brookings Working Paper 2.
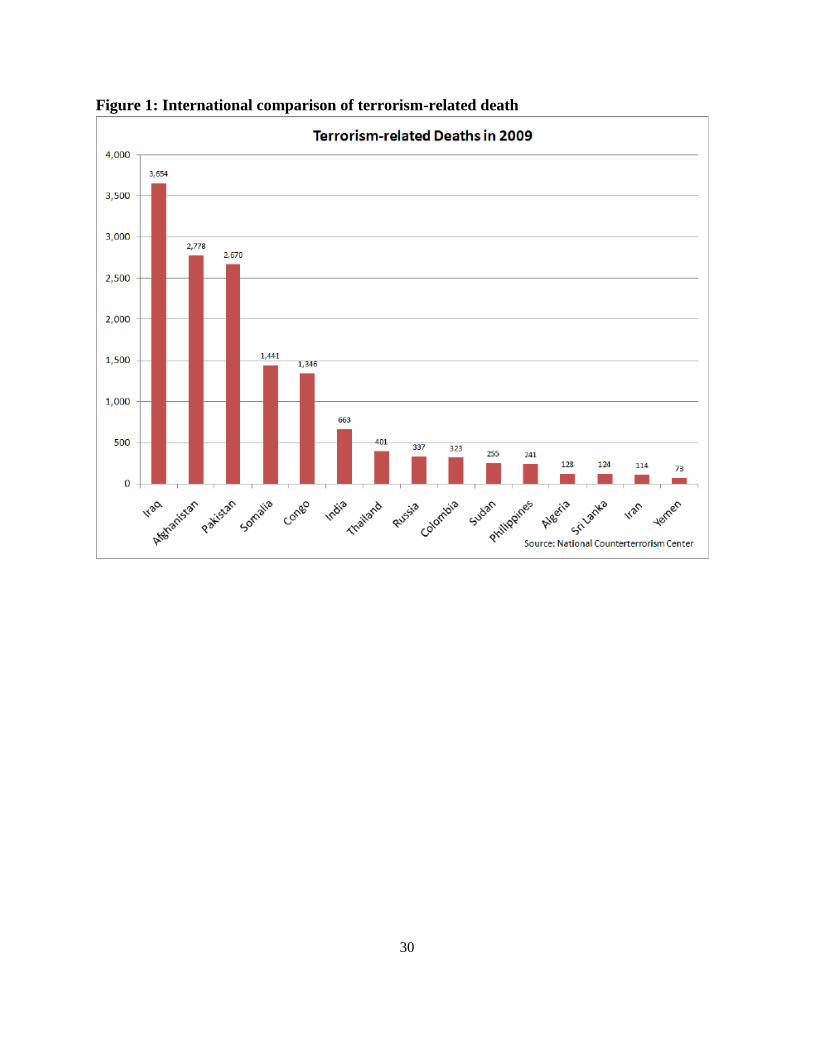
30
Figure 1: International comparison of terrorism-related death
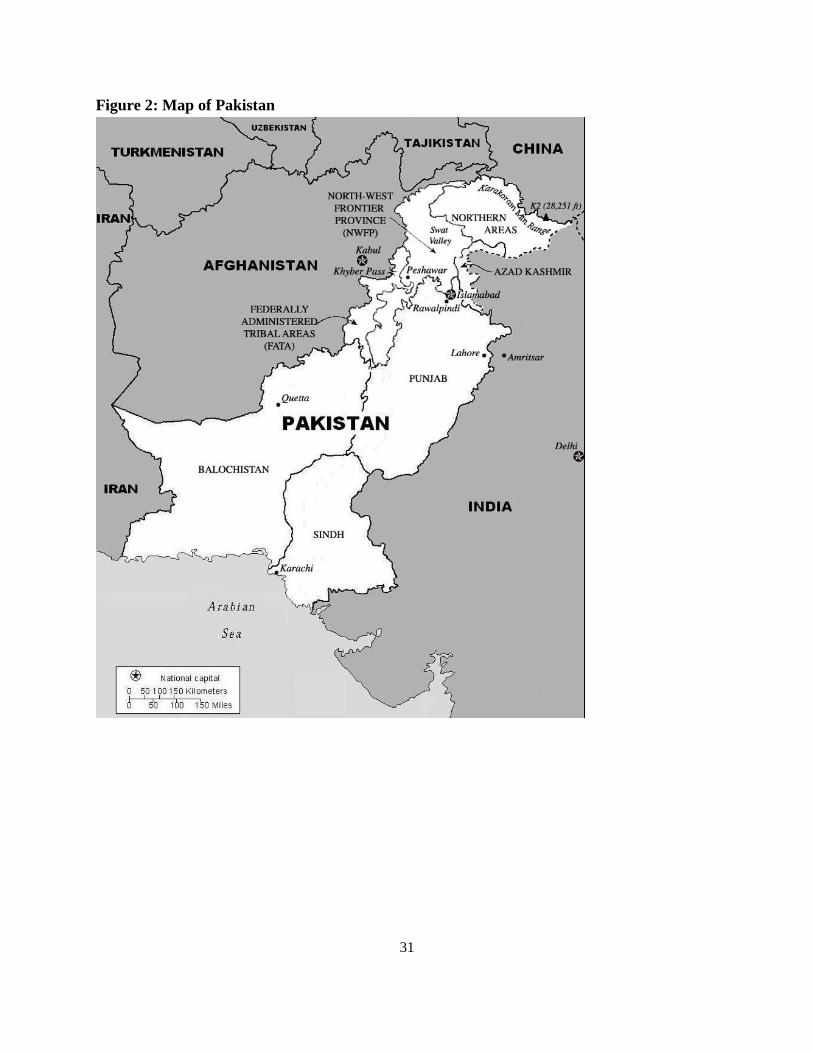
31
Figure 2: Map of Pakistan
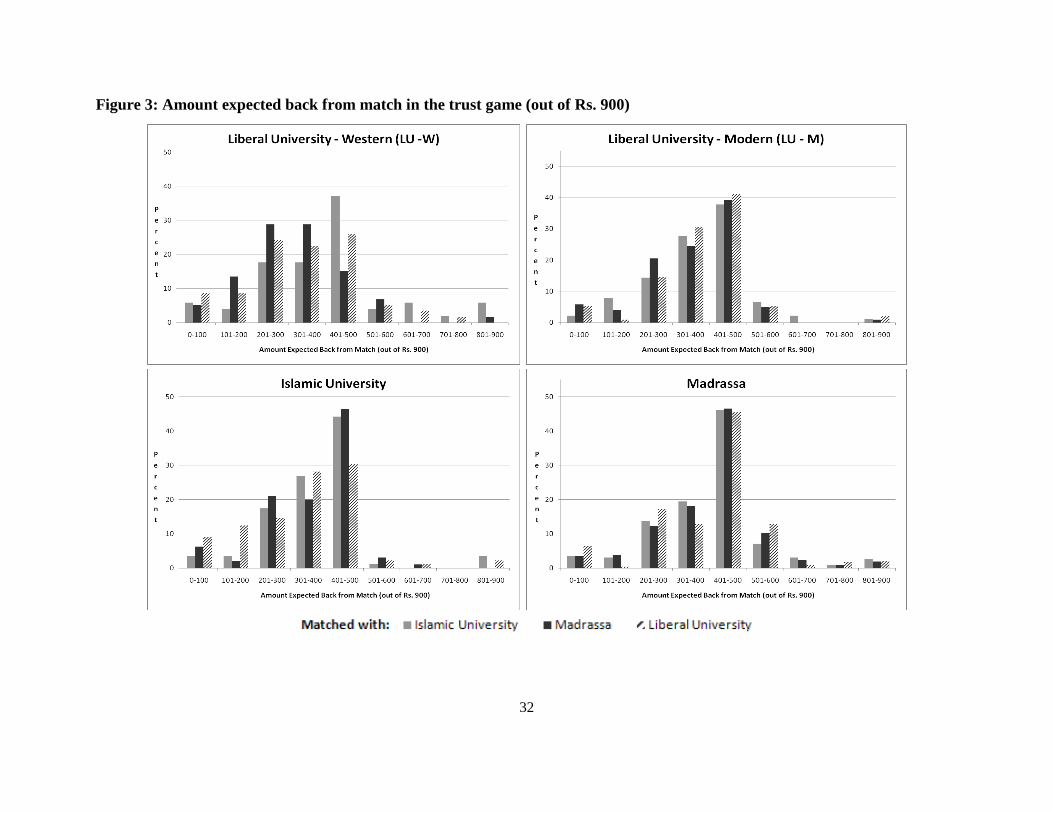
32
Figure 3: Amount expected back from match in the trust game (out of Rs. 900)
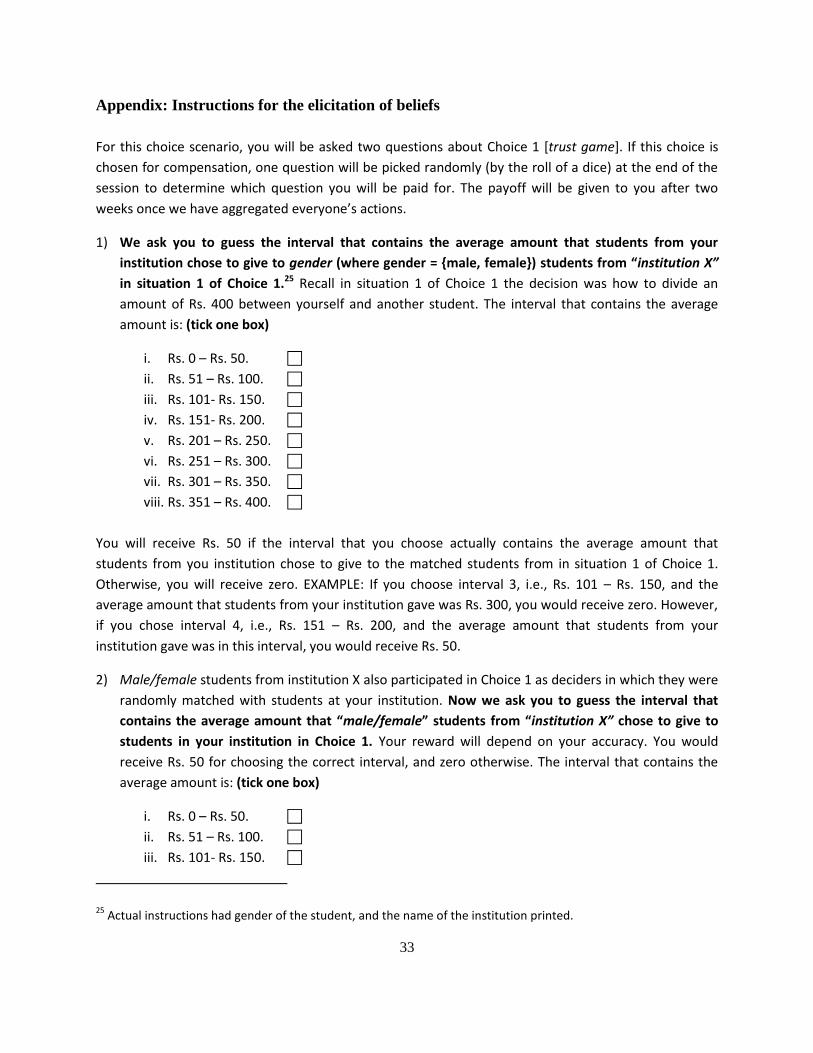
33
Appendix: Instructions for the elicitation of beliefs
For this choice scenario, you will be asked two questions about Choice 1 [trust game]. If this choice is
chosen for compensation, one question will be picked randomly (by the roll of a dice) at the end of the
session to determine which question you will be paid for. The payoff will be given to you after two
weeks once we have aggregated everyone’s actions.
1) We ask you to guess the interval that contains the average amount that students from your
institution chose to give to gender (where gender = {male, female}) students from “institution X”
in situation 1 of Choice 1.25 Recall in situation 1 of Choice 1 the decision was how to divide an
amount of Rs. 400 between yourself and another student. The interval that contains the average
amount is: (tick one box)
i. Rs. 0 – Rs. 50.
ii. Rs. 51 – Rs. 100.
iii. Rs. 101- Rs. 150.
iv. Rs. 151- Rs. 200.
v. Rs. 201 – Rs. 250.
vi. Rs. 251 – Rs. 300.
vii. Rs. 301 – Rs. 350.
viii. Rs. 351 – Rs. 400.
You will receive Rs. 50 if the interval that you choose actually contains the average amount that
students from you institution chose to give to the matched students from in situation 1 of Choice 1.
Otherwise, you will receive zero. EXAMPLE: If you choose interval 3, i.e., Rs. 101 – Rs. 150, and the
average amount that students from your institution gave was Rs. 300, you would receive zero. However,
if you chose interval 4, i.e., Rs. 151 – Rs. 200, and the average amount that students from your
institution gave was in this interval, you would receive Rs. 50.
2) Male/female students from institution X also participated in Choice 1 as deciders in which they were
randomly matched with students at your institution. Now we ask you to guess the interval that
contains the average amount that “male/female” students from “institution X” chose to give to
students in your institution in Choice 1. Your reward will depend on your accuracy. You would
receive Rs. 50 for choosing the correct interval, and zero otherwise. The interval that contains the
average amount is: (tick one box)
i. Rs. 0 – Rs. 50.
ii. Rs. 51 – Rs. 100.
iii. Rs. 101- Rs. 150.
25 Actual instructions had gender of the student, and the name of the institution printed.
34
iv. Rs. 151- Rs. 200.
v. Rs. 201 – Rs. 250.
vi. Rs. 251 – Rs. 300.
vii. Rs. 301 – Rs. 350.
viii. Rs. 351 – Rs. 400.
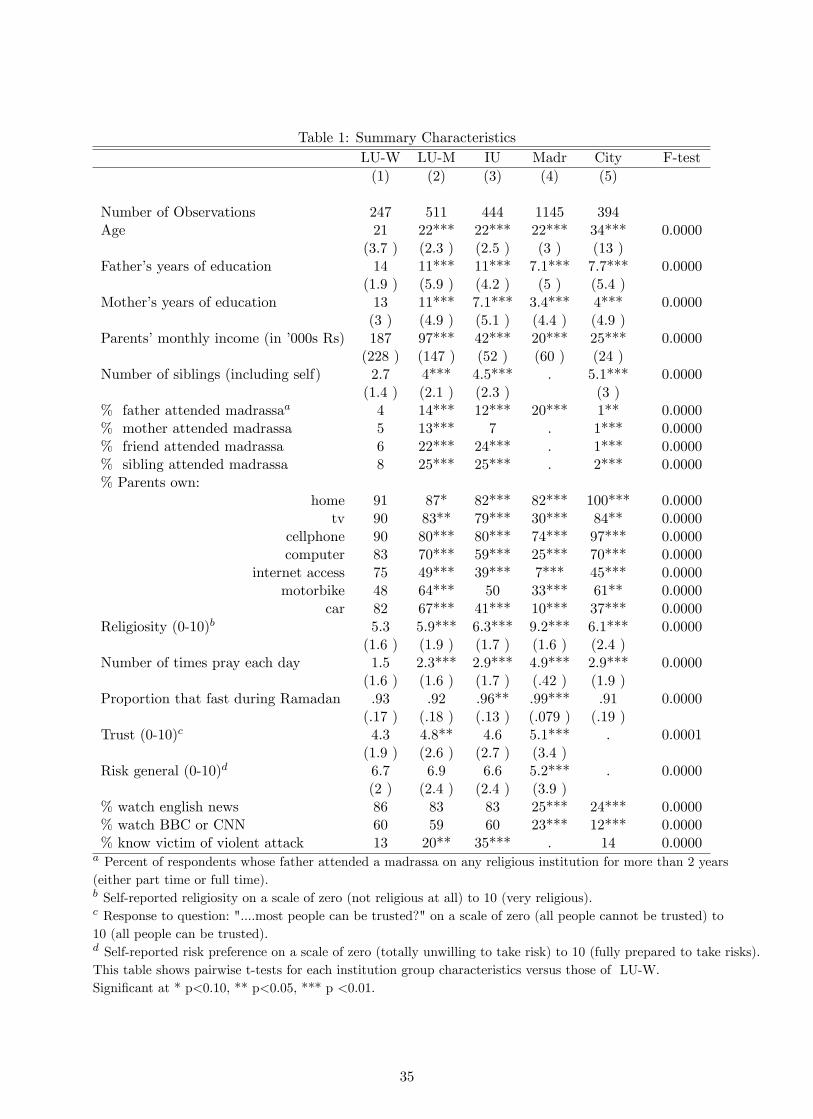
Table 1: Summary CharacteristicsLU-W LU-M IU Madr City F-test(1) (2) (3) (4) (5)
Number of Observations 247 511 444 1145 394Age 21 22*** 22*** 22*** 34*** 0.0000
(3.7 ) (2.3 ) (2.5 ) (3 ) (13 )Father�s years of education 14 11*** 11*** 7.1*** 7.7*** 0.0000
(1.9 ) (5.9 ) (4.2 ) (5 ) (5.4 )Mother�s years of education 13 11*** 7.1*** 3.4*** 4*** 0.0000
(3 ) (4.9 ) (5.1 ) (4.4 ) (4.9 )Parents�monthly income (in �000s Rs) 187 97*** 42*** 20*** 25*** 0.0000
(228 ) (147 ) (52 ) (60 ) (24 )Number of siblings (including self) 2.7 4*** 4.5*** . 5.1*** 0.0000
(1.4 ) (2.1 ) (2.3 ) (3 )% father attended madrassaa 4 14*** 12*** 20*** 1** 0.0000% mother attended madrassa 5 13*** 7 . 1*** 0.0000% friend attended madrassa 6 22*** 24*** . 1*** 0.0000% sibling attended madrassa 8 25*** 25*** . 2*** 0.0000% Parents own:
home 91 87* 82*** 82*** 100*** 0.0000tv 90 83** 79*** 30*** 84** 0.0000
cellphone 90 80*** 80*** 74*** 97*** 0.0000computer 83 70*** 59*** 25*** 70*** 0.0000
internet access 75 49*** 39*** 7*** 45*** 0.0000motorbike 48 64*** 50 33*** 61** 0.0000
car 82 67*** 41*** 10*** 37*** 0.0000Religiosity (0-10)b 5.3 5.9*** 6.3*** 9.2*** 6.1*** 0.0000
(1.6 ) (1.9 ) (1.7 ) (1.6 ) (2.4 )Number of times pray each day 1.5 2.3*** 2.9*** 4.9*** 2.9*** 0.0000
(1.6 ) (1.6 ) (1.7 ) (.42 ) (1.9 )Proportion that fast during Ramadan .93 .92 .96** .99*** .91 0.0000
(.17 ) (.18 ) (.13 ) (.079 ) (.19 )Trust (0-10)c 4.3 4.8** 4.6 5.1*** . 0.0001
(1.9 ) (2.6 ) (2.7 ) (3.4 )Risk general (0-10)d 6.7 6.9 6.6 5.2*** . 0.0000
(2 ) (2.4 ) (2.4 ) (3.9 )% watch english news 86 83 83 25*** 24*** 0.0000% watch BBC or CNN 60 59 60 23*** 12*** 0.0000% know victim of violent attack 13 20** 35*** . 14 0.0000a Percent of respondents whose father attended a madrassa on any religious institution for more than 2 years(either part time or full time).b Self-reported religiosity on a scale of zero (not religious at all) to 10 (very religious).c Response to question: "....most people can be trusted?" on a scale of zero (all people cannot be trusted) to10 (all people can be trusted).d Self-reported risk preference on a scale of zero (totally unwilling to take risk) to 10 (fully prepared to take risks).This table shows pairwise t-tests for each institution group characteristics versus those of LU-W.Signi�cant at * p<0.10, ** p<0.05, *** p <0.01.
35
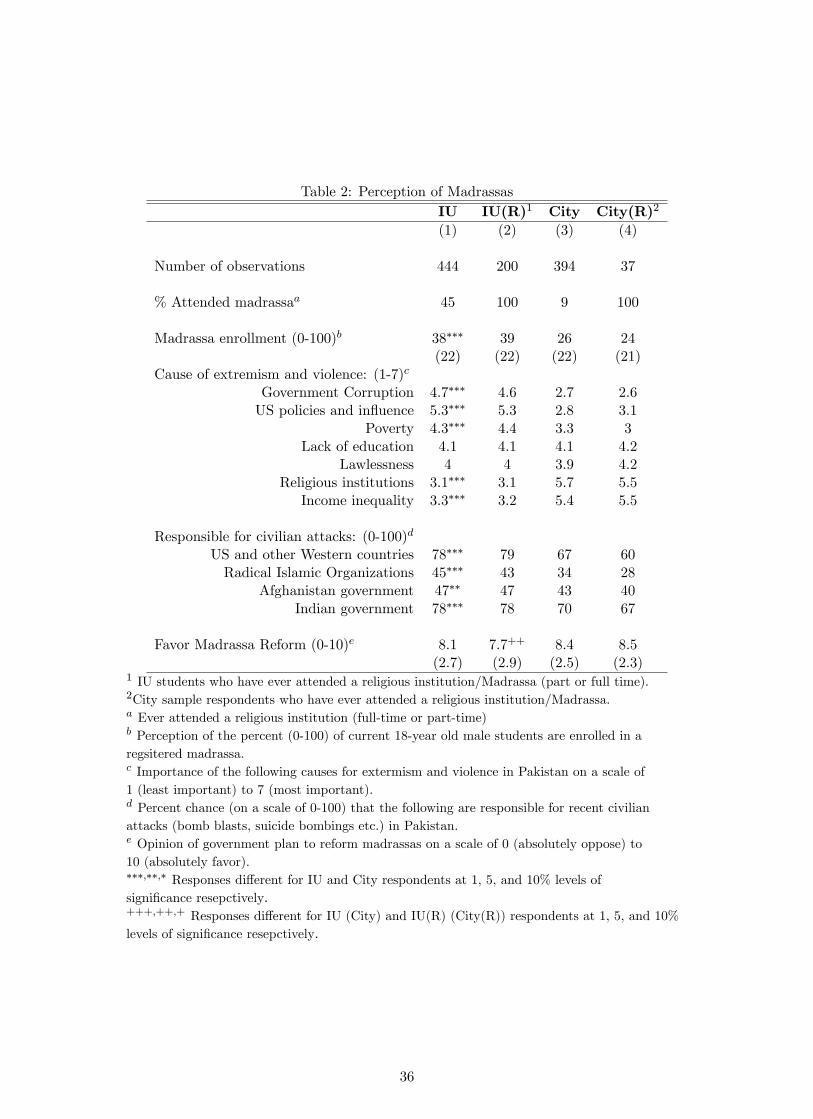
Table 2: Perception of MadrassasIU IU(R)1 City City(R)2
(1) (2) (3) (4)
Number of observations 444 200 394 37
% Attended madrassaa 45 100 9 100
Madrassa enrollment (0-100)b 38��� 39 26 24(22) (22) (22) (21)
Cause of extremism and violence: (1-7)c
Government Corruption 4.7��� 4.6 2.7 2.6US policies and in�uence 5.3��� 5.3 2.8 3.1
Poverty 4.3��� 4.4 3.3 3Lack of education 4.1 4.1 4.1 4.2
Lawlessness 4 4 3.9 4.2Religious institutions 3.1��� 3.1 5.7 5.5Income inequality 3.3��� 3.2 5.4 5.5
Responsible for civilian attacks: (0-100)d
US and other Western countries 78��� 79 67 60Radical Islamic Organizations 45��� 43 34 28
Afghanistan government 47�� 47 43 40Indian government 78��� 78 70 67
Favor Madrassa Reform (0-10)e 8.1 7.7++ 8.4 8.5(2.7) (2.9) (2.5) (2.3)
1 IU students who have ever attended a religious institution/Madrassa (part or full time).2City sample respondents who have ever attended a religious institution/Madrassa.a Ever attended a religious institution (full-time or part-time)b Perception of the percent (0-100) of current 18-year old male students are enrolled in aregsitered madrassa.c Importance of the following causes for extermism and violence in Pakistan on a scale of1 (least important) to 7 (most important).d Percent chance (on a scale of 0-100) that the following are responsible for recent civilianattacks (bomb blasts, suicide bombings etc.) in Pakistan.e Opinion of government plan to reform madrassas on a scale of 0 (absolutely oppose) to10 (absolutely favor).���;��;� Responses di¤erent for IU and City respondents at 1, 5, and 10% levels ofsigni�cance resepctively.+++;++;+ Responses di¤erent for IU (City) and IU(R) (City(R)) respondents at 1, 5, and 10%levels of signi�cance resepctively.
36
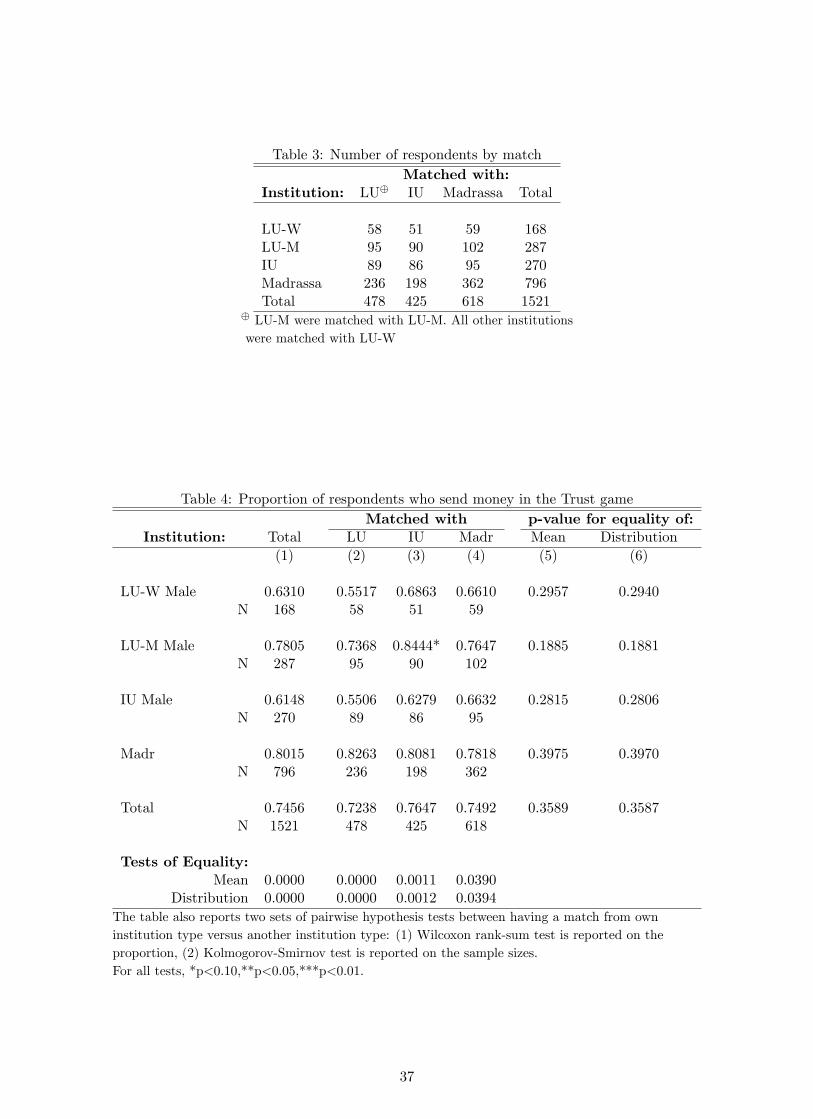
Table 3: Number of respondents by matchMatched with:
Institution: LU� IU Madrassa Total
LU-W 58 51 59 168LU-M 95 90 102 287IU 89 86 95 270Madrassa 236 198 362 796Total 478 425 618 1521
� LU-M were matched with LU-M. All other institutionswere matched with LU-W
Table 4: Proportion of respondents who send money in the Trust gameMatched with p-value for equality of:
Institution: Total LU IU Madr Mean Distribution(1) (2) (3) (4) (5) (6)
LU-W Male 0.6310 0.5517 0.6863 0.6610 0.2957 0.2940N 168 58 51 59
LU-M Male 0.7805 0.7368 0.8444* 0.7647 0.1885 0.1881N 287 95 90 102
IU Male 0.6148 0.5506 0.6279 0.6632 0.2815 0.2806N 270 89 86 95
Madr 0.8015 0.8263 0.8081 0.7818 0.3975 0.3970N 796 236 198 362
Total 0.7456 0.7238 0.7647 0.7492 0.3589 0.3587N 1521 478 425 618
Tests of Equality:Mean 0.0000 0.0000 0.0011 0.0390
Distribution 0.0000 0.0000 0.0012 0.0394The table also reports two sets of pairwise hypothesis tests between having a match from owninstitution type versus another institution type: (1) Wilcoxon rank-sum test is reported on theproportion, (2) Kolmogorov-Smirnov test is reported on the sample sizes.For all tests, *p<0.10,**p<0.05,***p<0.01.
37
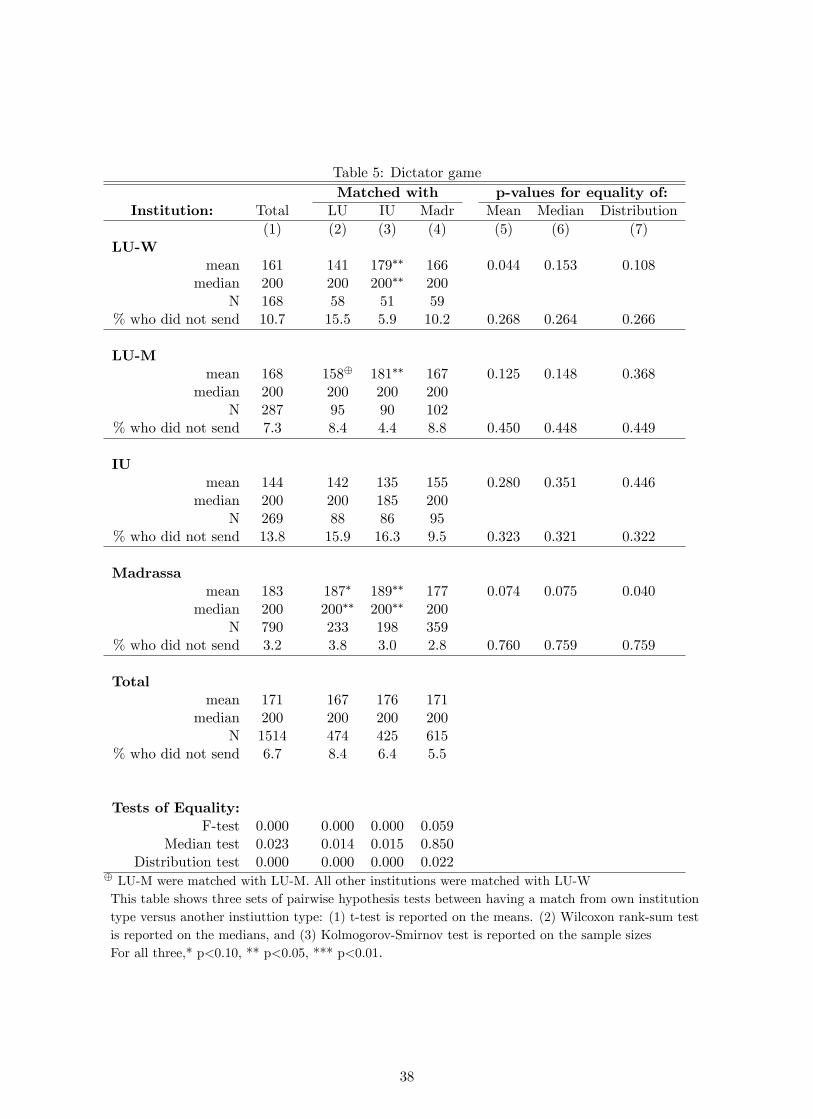
Table 5: Dictator gameMatched with p-values for equality of:
Institution: Total LU IU Madr Mean Median Distribution(1) (2) (3) (4) (5) (6) (7)
LU-Wmean 161 141 179�� 166 0.044 0.153 0.108
median 200 200 200�� 200N 168 58 51 59
% who did not send 10.7 15.5 5.9 10.2 0.268 0.264 0.266
LU-Mmean 168 158� 181�� 167 0.125 0.148 0.368
median 200 200 200 200N 287 95 90 102
% who did not send 7.3 8.4 4.4 8.8 0.450 0.448 0.449
IUmean 144 142 135 155 0.280 0.351 0.446
median 200 200 185 200N 269 88 86 95
% who did not send 13.8 15.9 16.3 9.5 0.323 0.321 0.322
Madrassamean 183 187� 189�� 177 0.074 0.075 0.040
median 200 200�� 200�� 200N 790 233 198 359
% who did not send 3.2 3.8 3.0 2.8 0.760 0.759 0.759
Totalmean 171 167 176 171
median 200 200 200 200N 1514 474 425 615
% who did not send 6.7 8.4 6.4 5.5
Tests of Equality:F-test 0.000 0.000 0.000 0.059
Median test 0.023 0.014 0.015 0.850Distribution test 0.000 0.000 0.000 0.022
� LU-M were matched with LU-M. All other institutions were matched with LU-WThis table shows three sets of pairwise hypothesis tests between having a match from own institutiontype versus another instiuttion type: (1) t-test is reported on the means. (2) Wilcoxon rank-sum testis reported on the medians, and (3) Kolmogorov-Smirnov test is reported on the sample sizesFor all three,* p<0.10, ** p<0.05, *** p<0.01:
38
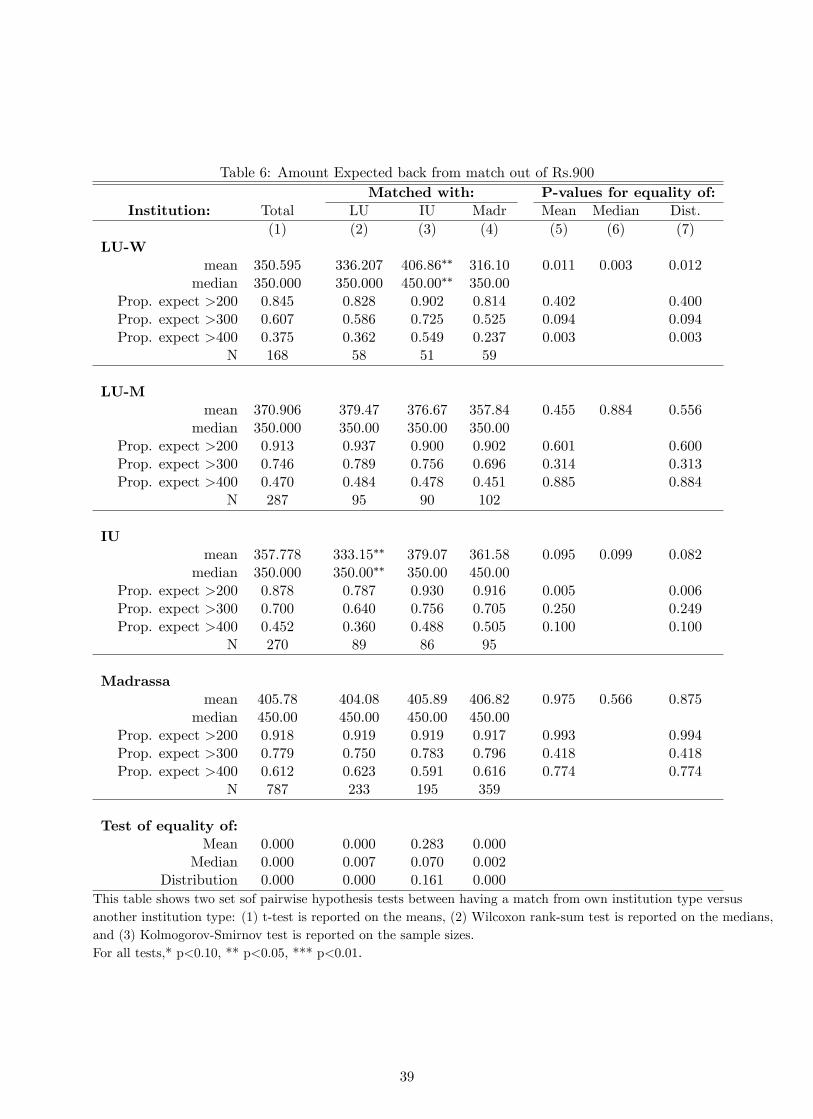
Table 6: Amount Expected back from match out of Rs.900Matched with: P-values for equality of:
Institution: Total LU IU Madr Mean Median Dist.(1) (2) (3) (4) (5) (6) (7)
LU-Wmean 350.595 336.207 406.86�� 316.10 0.011 0.003 0.012
median 350.000 350.000 450.00�� 350.00Prop. expect >200 0.845 0.828 0.902 0.814 0.402 0.400Prop. expect >300 0.607 0.586 0.725 0.525 0.094 0.094Prop. expect >400 0.375 0.362 0.549 0.237 0.003 0.003
N 168 58 51 59
LU-Mmean 370.906 379.47 376.67 357.84 0.455 0.884 0.556
median 350.000 350.00 350.00 350.00Prop. expect >200 0.913 0.937 0.900 0.902 0.601 0.600Prop. expect >300 0.746 0.789 0.756 0.696 0.314 0.313Prop. expect >400 0.470 0.484 0.478 0.451 0.885 0.884
N 287 95 90 102
IUmean 357.778 333.15�� 379.07 361.58 0.095 0.099 0.082
median 350.000 350.00�� 350.00 450.00Prop. expect >200 0.878 0.787 0.930 0.916 0.005 0.006Prop. expect >300 0.700 0.640 0.756 0.705 0.250 0.249Prop. expect >400 0.452 0.360 0.488 0.505 0.100 0.100
N 270 89 86 95
Madrassamean 405.78 404.08 405.89 406.82 0.975 0.566 0.875
median 450.00 450.00 450.00 450.00Prop. expect >200 0.918 0.919 0.919 0.917 0.993 0.994Prop. expect >300 0.779 0.750 0.783 0.796 0.418 0.418Prop. expect >400 0.612 0.623 0.591 0.616 0.774 0.774
N 787 233 195 359
Test of equality of:Mean 0.000 0.000 0.283 0.000
Median 0.000 0.007 0.070 0.002Distribution 0.000 0.000 0.161 0.000
This table shows two set sof pairwise hypothesis tests between having a match from own institution type versusanother institution type: (1) t-test is reported on the means, (2) Wilcoxon rank-sum test is reported on the medians,and (3) Kolmogorov-Smirnov test is reported on the sample sizes.For all tests,* p<0.10, ** p<0.05, *** p<0.01:
39
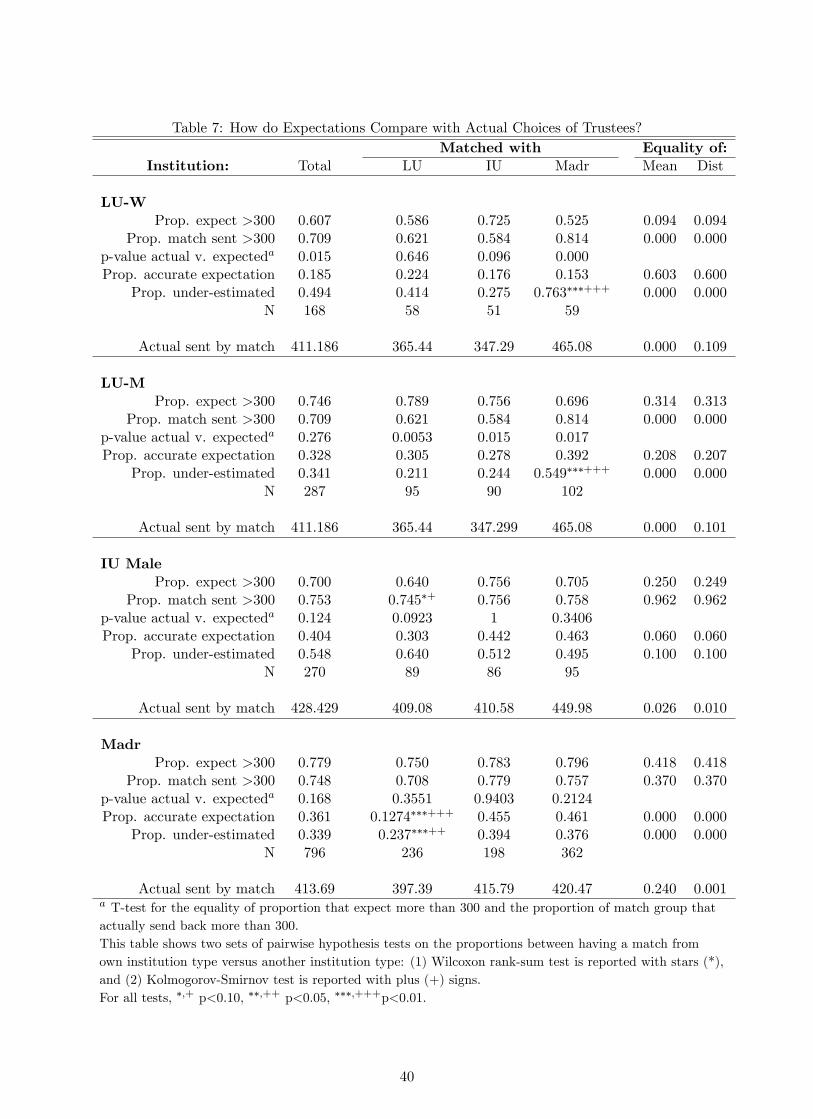
Table 7: How do Expectations Compare with Actual Choices of Trustees?Matched with Equality of:
Institution: Total LU IU Madr Mean Dist
LU-WProp. expect >300 0.607 0.586 0.725 0.525 0.094 0.094
Prop. match sent >300 0.709 0.621 0.584 0.814 0.000 0.000p-value actual v. expecteda 0.015 0.646 0.096 0.000Prop. accurate expectation 0.185 0.224 0.176 0.153 0.603 0.600
Prop. under-estimated 0.494 0.414 0.275 0.763���+++ 0.000 0.000N 168 58 51 59
Actual sent by match 411.186 365.44 347.29 465.08 0.000 0.109
LU-MProp. expect >300 0.746 0.789 0.756 0.696 0.314 0.313
Prop. match sent >300 0.709 0.621 0.584 0.814 0.000 0.000p-value actual v. expecteda 0.276 0.0053 0.015 0.017Prop. accurate expectation 0.328 0.305 0.278 0.392 0.208 0.207
Prop. under-estimated 0.341 0.211 0.244 0.549���+++ 0.000 0.000N 287 95 90 102
Actual sent by match 411.186 365.44 347.299 465.08 0.000 0.101
IU MaleProp. expect >300 0.700 0.640 0.756 0.705 0.250 0.249
Prop. match sent >300 0.753 0.745�+ 0.756 0.758 0.962 0.962p-value actual v. expecteda 0.124 0.0923 1 0.3406Prop. accurate expectation 0.404 0.303 0.442 0.463 0.060 0.060
Prop. under-estimated 0.548 0.640 0.512 0.495 0.100 0.100N 270 89 86 95
Actual sent by match 428.429 409.08 410.58 449.98 0.026 0.010
MadrProp. expect >300 0.779 0.750 0.783 0.796 0.418 0.418
Prop. match sent >300 0.748 0.708 0.779 0.757 0.370 0.370p-value actual v. expecteda 0.168 0.3551 0.9403 0.2124Prop. accurate expectation 0.361 0.1274���+++ 0.455 0.461 0.000 0.000
Prop. under-estimated 0.339 0.237���++ 0.394 0.376 0.000 0.000N 796 236 198 362
Actual sent by match 413.69 397.39 415.79 420.47 0.240 0.001a T-test for the equality of proportion that expect more than 300 and the proportion of match group thatactually send back more than 300.This table shows two sets of pairwise hypothesis tests on the proportions between having a match fromown institution type versus another institution type: (1) Wilcoxon rank-sum test is reported with stars (*),and (2) Kolmogorov-Smirnov test is reported with plus (+) signs.For all tests, �;+ p<0.10, ��;++ p<0.05, ���;+++p<0.01.
40
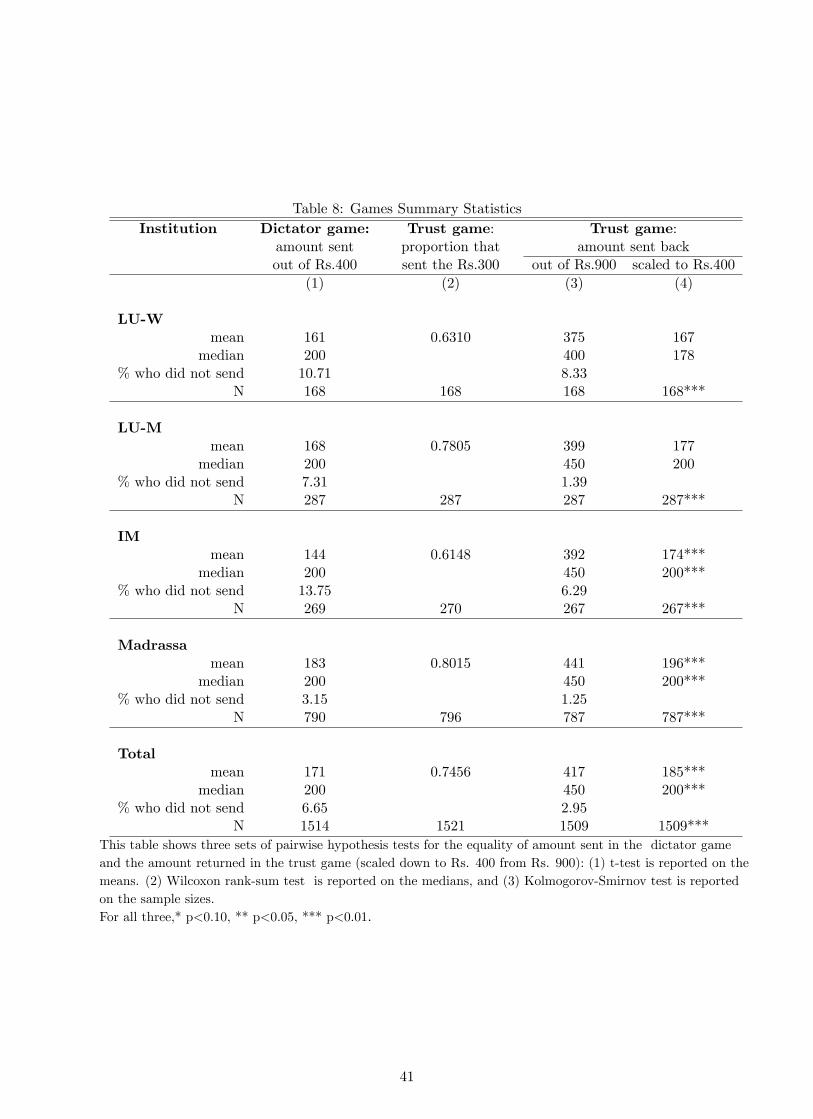
Table 8: Games Summary StatisticsInstitution Dictator game: Trust game: Trust game:
amount sent proportion that amount sent backout of Rs.400 sent the Rs.300 out of Rs.900 scaled to Rs.400
(1) (2) (3) (4)
LU-Wmean 161 0.6310 375 167
median 200 400 178% who did not send 10.71 8.33
N 168 168 168 168***
LU-Mmean 168 0.7805 399 177
median 200 450 200% who did not send 7.31 1.39
N 287 287 287 287***
IMmean 144 0.6148 392 174***
median 200 450 200***% who did not send 13.75 6.29
N 269 270 267 267***
Madrassamean 183 0.8015 441 196***
median 200 450 200***% who did not send 3.15 1.25
N 790 796 787 787***
Totalmean 171 0.7456 417 185***
median 200 450 200***% who did not send 6.65 2.95
N 1514 1521 1509 1509***This table shows three sets of pairwise hypothesis tests for the equality of amount sent in the dictator gameand the amount returned in the trust game (scaled down to Rs. 400 from Rs. 900): (1) t-test is reported on themeans. (2) Wilcoxon rank-sum test is reported on the medians, and (3) Kolmogorov-Smirnov test is reportedon the sample sizes.For all three,* p<0.10, ** p<0.05, *** p<0.01:
41