Embed Size (px)
Citation preview

Records of the Western Australian lvluseum Supplement No. 67: 337-364
Biodiversity patterns and their conservation in wetlandsof the Western Australian wheatbelt
S.A. Halse l , M.N. Lyons!, A.M. Pinder l and R.J. ShieF'Department of Conservation and Land Management, Science Division,
P.O. Box 51 Wanneroo, Western Australia 6946, Australia2Department of Environmental Biology, University of Adelaide, South Australia 5005, Australia
Abstract A total of 197 wetlands were sampled between 1997 and 2000 in asurvey designed to record wetland biodiversity across the wheatbelt andsouth coast of Western Australia, an area of 205000 km2 Altogether, 986wetland-associated plant, 844 aquatic invertebrate and 57 waterbird specieswere recorded, with an average of 73 and a range of 10-174 species perwetland. Thirty-four per cent of species were found at only one wetland.Sixteen types of wetland were recognized, based on their biological
assemblages. Overall, salinity was the factor most responsible fordifferentiation between wetlands in terms of biodiversitv but differencesbetween some freshwater wetland types, such as sedge sw~mps and graniterock pools, were largely attributable to other abiotic factors Among salinewetlands, the biota of naturally saline (and usually very salty) seasonal playaswas distinct from that of wetlands with longer penods of inundation. It wasunclear whether differences related to inundation or salinitv.Usmg cluster analysis, 22 assemblages of co-occur;ing species were
identified and the distributions of 18 of them were modelled. Between 33 and86'/'0 of the species richness of each assemblage at a wetland was explained bytwo to four abiotic variables. The assemblages that modelled most poorlyconsisted of species that were widespread and had broad ecologicaltolerances, with ranges extending beyond the wheatbelt, so that the surveywas unlikely to have circumscribed their ecological requirements. Mostassemblages consisted of a mix of plant, invertebrate and (fewer) waterbirdspecies. Factors affecting the distribution of plants and animals within a co-occurring assemblage often appeared to differ, especially for plants growingon the bank of a wetland. Riparian plants are probably exposed to differentenvironmental factors, especially salinity patterns, than those influencinganimals using the waterbody itself.The dramatic increase in secondary salinisation that has been observed in
the wheatbelt and south coast over the past 100 years, with associated loss offreshwater habitat and changes to naturally saline playas, is likely to lead tosignificant loss of biodiversity. Most assemblages (and species) wereassociated with particular salinity ranges and there was an inverserelationship between overall community richness and salimty, especiallywithin the waterbody. Many species typical of naturally saline playas wererarely found at secondarilv saline wetlands.Th'e predictable occurr~nce of some species assemblages, such as those
characteristic of sedge swamps and saline playas of the north-easternwheatbelt, makes it possible to identify wet lands that, if protected fromsecondary salinisation, will conserve large proportions of them. Some otherassemblages occur at many wetlands and their conservation is assured byalmost any strategy, even if they are unpredictably distributed. However,protection of rare species and assemblages that occur infrequently andsomewhat randomly within the wheatbelt poses a significant challenge towetland managers.
INTRODUCTIONSouth-west Western Australia is an old, deeply
weathered landscape with flat topography andlarge expanses of nutrient deficient soils (Mulcahy,1967; Wyrwoll, 1988). The steep rainfall gradientwith distance from the coast (Figure 1) means the
extreme south-west supports wet sclerophyll forestand permanent wetlands while more inland areascontain open woodland or shrub lands andepisodically flooded waterbodies (Hopper, 1979;Beard, 1990).This paper reports results of a biological survey
DOI: 10.18195/issn.0313-122x.67.2004.337-364
338
PaynesFind
Albany
S.A.Halse,M.N.lyons,A.M.Pinder,R.J.Shiel
Kalgoorlie
ESP
~ ~~
o 200
Kilometres
400j
Figure1 Wheatbeltandsouthcoastofsouth-westWesternAustraliashowingthewetlandssurveyed,rainfallisohyets,IBRAregions(ThackwayandCresswell1995),andtheMeckering line(Mulcahy1967).0,siteonpublicland;e,siteonprivateland;GSP,GeraldtonSandplain;SCP,SwanCoastalPlain;AWB,AvonWhealtbelt;]F,]arrahForest;WR, Warren; ESP,EsperanceSandplain;MR, MalleeRegion.
(WBS)ofwetlandsofthewheatbeltandsouthcoastofWestern Australia, withsmallincursionsintoadjacentforestedoropenwoodlandareas.Manywetlandsinthesurveyedareaweresaline.Salthasbeen accumulating in soil profiles andgroundwatersofthewheatbeltforhundredsofthousandsofyears(Commanderetal.,1994)astheresultofahigherrateofdepositionofmarineaerosolsaltonthelandscapethansaltdischargeviariversandgroundwaterflow(HingstonandGailitis, 1976).Consequently,most playalakesformedbygroundwaterdischargewerenaturallysaline(e.g.Salama,1994),asweresomeriversystemsonthesouthcoast.Evenmost'freshwater'wetlandshadrelativelyhighsaltlevelsbyglobalstandardspriortoclearingofnativevegetation(SchofieldetaI.,1988).However,nowadaysmanyofthesalinewetlandsinthesurveyedareaaresaltybecauseofsecondarysalinisation(Mulcahy,1978;
GeorgeetaI.,1995).Theclearingofperennialnativevegetationanditsreplacementwithannualcropsandpasturescausedrun-offandrechargetoincrease.As aconsequence,groundwaterlevelshaverisenandsaltpreviouslystoredinthesoilprofile,aswell asingroundwater,hasbeenmobilisedandpercolatedtothesurface(Clarkeetal.,2002).Ithasbeenestimatedthatabout6%oflandinthesurveyedareaiscurrentlysalinised(groundwaterwithin2 mofsurface)andthatthiswill eventuallyincreaseto33%(ShortandMcConnell, 2001;George etal., 2002).Theproportionofwetlandsaffectedismuch higherbecauseoftheirlowpositioninthelandscape(Halseetal.,1993b,2000a).Salinityisamajor environmentalgradientstructuringaquaticcommunities(Hammer,1986)andthehistoricalprevalenceofsaltinwetlandsofthesurveyedareahasresultedinanaquaticfauna
Aquatic biodiversity
that is relatively salt-tolerant (Williams et a/' 1991;Halse et a/, 2000a; Kay et aI, 2001; Pinder et aI,2002). Likewise, there has been considerableradiation of salt-tolerant plant species in, andadjacent to, wheatbelt wetlands (Short, 1982;Wilson, 1984; Lyons et ai, 2004). Nevertheless,secondary salinisation has the potential to wreakdevastating changes on the biodiversity of thewheatbelt because of loss of freshwater wetlandsand the likely changes to temporal and spatialpatterns of salinity in naturally saline wetlands(Williams, 1999; Cramer and I-Iobbs, 2002; Halse etai, 2003).The impact of salinisation in south-west Western
Australia is made more acute by the region's highconservation values. The extensive radiation ofvascular plant groups, especially the Myrtaceae,Proteaceae, Papilionaceae and Mimosaceae, haslong been recognized (Diels, 1906; Beard et a/' 2000)and the south-west was listed by Myers et al (2000)as one of 25 global hotspots for biodiversity, basedon a combination of terrestrial (mainly plant)species richness and the extent of land clearing.Many high-conservation value, endemic plantspecies occur in high-rainfall areas (Wardell-Johnson and Horwitz, 1996) but the number isgreater in what Hopper (1979) termed the'intermediate rainfall zone' between 300-800 mmannual rainfall. This is the area covered by the WBS.Hopper (1979) attributed plant richness in the studyarea to the existence of a mosaic of soil types andthe isolation brought about by climatic variability,mostly since the Quaternary.The importance of south-west Western Australia
for aquatic invertebrates is less well documentedthan for plants but it appears to be a region ofsignificant richness and endemism for groups withdrought-resistant eggs, especially crustaceans (Frey,1991; Maly and Bayly, 1991; Thomsen, 1999). Thedistribution of crustaceans has parallels with plants:while many endemic species occur in areas of highrainfall (Storey et a/' 1993; Wardell-Johnson and!-!orwitz, 1996), much of the crustacean endemismoccurs in intermediate and low rainfall zones (Halseand McRae, 2001; Remigio et ai, 2001; Halse, 2002;Timms, 2002).The WBS was a direct response by the
Covernment of Western Australia to the threat ofbroad-scale loss of biodiversity because ofsecondary salinisation (Anonymous, 1996b). It hadthree objectives: (1) to document patterns ofbiodiversity in wetlands of the wheatbelt and southcoast, (2) to investigate the role of salinity and otherenvironmental factors in structuring communities,and (3) to select a set of Natural Diversity RecoveryCatchments as a focus for government andcommunity actions to ameliorate the impact ofsalinity on biodiversity and thus conserverepresentative wetland communities. Existing
339
information relevant to the three objectives isreviewed below.Prior to the survey, there had been little
investigation of biodiversity patterns in wetlands ofthe surveyed area other than for waterbirds (Jaenschet ai, 1988; Halse et a/, 1993b, 1995). Studies ofinvertebrates were limited to a few wet lands (Halse,1981; Williams et al, 1991; Doupe and Horwitz,1995; Halse et a/' 2000a) or focus sed on particulartaxonomic groups (Ceddes et al., 1981; Brock andShiel, 1983). The comprehensive survey of rivers byKay et al. (2001) identified invertebrates only tofamily. Studies of submerged plants were few(Brock and Lane, 1983; Brock and Shiel,1983) and,other than the broadscale survey by Halse et al.(1993a), studies of emergent and riparian vegetationwere restricted to particular wetlands (Froend et al.,1987; Froend and McComb, 1991; Froend and vander Moezel, 1994). Substantially more informationon plants and invertebrates, as well as diatoms, isavailable as a result of the WBS (Pinder et al, 2000,2002, 2004, 2005; Blinn et ai, 2004; Lyons et al.,2004).The general role of salinity in structuring plant
and animal communities within a waterbody isreasonably well understood. While there is a trendfor community richness to be inversely related tosalinity, the affinity of different higher-leveltaxonomic groups for saline conditions varies(Hammer, 1986). These patterns were confirmed inthe WBS with Pinder et al. (2005) showing a tightnegative relationship between invertebrate richnessand salinity at values >4 g L-l across bothsecondarily and naturally saline wetlands.Waterbird and diatom richness also showednegative relationships with salinity (Blinn et a!.,2004; Cale et a!', 2004). The role of salinity instructuring riparian plant communities, especiallythose of naturally saline systems, is less clear (seeHart et al, 1991). Halse et al. (1993a) found norelationship between plant species richness andnatural salinity of wetlands, although secondarysalinisation reduced richness. Lyons et al. (2004)reached similar conclusions, after comparing soilsalinity and plant richness of small quadrats invarious vegetation associations around wetlandsduring the WBS. Richness of riparian plants waspoorly correlated with wet land salinity probablybecause the salt content of riparian soils reflectsmicroscale topography and leaching rather than thesalinity value of wetland water (Cramer and Hobbs,2002).The practice of reserving or managing areas to
protect the biota within them, and thus the floraand fauna of the region, has a significantinternational history (Margules and Pressey, 2000).The first national park in Western Australia (JohnForrest) was gazetted in 1900 but it was another 52years before the first nature reserve was proclaimed

340
(Tammin Railway Dam). Between then and 1980,many wet lands within the surveyed area werereserved to provide habitat for waterfO\vl, as wellas being places where ducks could be shot (Lane,1985). Other wetlands were included in naturereserves where the primary purpose was protectionof terrestrial flora and fauna. Early reservation wasan ad hoc process but, in recent years, a number ofrelatively sophisticated mathematical methods havebeen developed in Australia, and elsewhere, tomaximise the number of species from the regionalspecies pool that are protected by reserving a givenarea. The focus of these methods has been terrestrialecosystems (e.g. McKenzie et ai, 1989; Nicholls,1989; Justus and Sarkar, 2002; Scotts and Drielsma,2003) but many of the principles apply to wetlandreservation. In conjunction with the development ofanalytical methods, there has been a program ofregional surveys in Western Australia to providethe biological data on which to base decisions about
S. A. Halse, M. N. Lyons, A. M. Pinder, R. J. Shiel
reservation (Biological Survey Committee, 1984;McKenzie and Robinson, 1987; McKenzie et ai,1991, 2000), with aquatic ecosystems being includedin these surveys since the mid-1990s (Halse et al,2000b).Selection of Natural Diversity Recovery
Catchments (BRCs) to ameliorate impact of salinityon biodiversitv uses the same information as areserve selection process. There are currently sixBRCs in south-west Western Australia (Figure 2).Each BRC is a sub-catchment of 50 000 - 120 000 hawith several or many wetlands at low points withinthe catchment. All contain a small number of naturereserves, and some remnant vegetation on freeholdland, but much of each catchment is clearedagricultural land. Public money is being spentwithin these catchments on salinity control,revegetation and management of uncleared landwith the objective of maintaining existing levels ofbiodiversity. At the Toolibin BRC, groundwater is
Albany
Kilometres
Figure 2 Wheatbelt and south coast of south-west Western Australia showing existing Natural Diversity RecoveryCatchments (hatched), major nature reserves and the Potential Recovery Wetlands selected as a result of thesurvey.• PRW.

Aquatic biodiversity
being pumped from under Toolibin Lake to lowerthe water-table and maintain health of the lakevegetation (Froend et ai, 1997; Dogramaci, 2003). Itis intended that an additional 10-20 BRCs will beselected and that most of the species assemblagesidentified in the WBS will be protected in thesecatchments (see Anonymous, 1996a; Keighery,2001).
STUDY AREAThe area covered by the WBS is shown in Figure
1. Nearly all wet lands were located between the 600and 300 mm isohvets. The area has a Mediterraneanclimate with hot dry summers and predominantlywinter rainfall, although the proportion of summerrain increases with distance to the north and east(Gentilli, 1972). Annual evaporation varies from1320 to 2750 mm. Rainfall was relatively light, andwetland levels low, during 1997 and 1998 (Figure3). Extensive late summer and au tumn rains in 1999meant that wetlands remained extensively floodedthroughout that year. Rainfall patterns within thesurveyed area during 2000 were similar to 1997 and1998, although there was extensive rain farther east.The different landforrns and vegetation
associations of the surveyed area are reflected inthe IBRA regions it covers. The boundaries of theseregions largely reflect geology and vegetationformations (Thackway and CresswelL 1995). Mostof the wetlands surveyed are in the AvonWheatbelt, Esperance Sandplains and GeraldtonSandplains regions, with a small number in theMallee and Jarrah Forest. Lake Cronin (SPS003) isin the Coolgardie region. In broad terms, the naturalvegetation of the Geraldton and EsperanceSandplains consists of shrub lands, the AvonWheatbelt contains open eucalypt woodlands andthe Mallee contains eucalypt mallee formations(Gibson et aI., 2004). However, surrounding plantformations have relatively little influence on plantspecies occurring within the regularly inundatedparts of wetlands. It must also be recognizedapproximately 90'10 of the Avon-Wheatbelt, 80% ofthe Mallee, 73% of the Geraldton Sandplains and55'i{, of the Esperance Sandplains have been clearedof their original vegetation during the past 100years (Shepherd et al. 2001), with broad-acrecropping now the main activity.Physiognomy and patterns of inundation of
wetlands in the surveyed area are highly variable.No wetland is permanently filled, although some ofthe deeper wetlands in the most south-westerly partof the surveyed area, around Lake Muir, rarely dry.West of the Meckering line (Figure 1) and along thesouth coast, rivers have defined channels, flowseasonally for several months and usually dryduring summer. Farther inland, drainage linesconsist of broad palaeochannels that are rarely
341
connected to active rivers and contain mosaics offlat channels and small playas (Mulcahy. 1967;Beard. 1999). They contain water only briefly afterlarge rainfall events. Lentic waterbodies includesemi-permanent or seasonal basin wetlands, oftenwith rivers flowing into and out of them that mayconnect a series of wetlands, such as L.ake Toolibinon the northern Arthur River (Froend et ai, 1997).Most basin wetlands are in the western andsouthern parts of the surveyed area. In higherrainfall zones, the bed is usually covered by sedgeswhile lower rainfall results in trees growing acrossthe bed unless the centre of the wetland remainswater-logged for prolonged periods (as oftenoccurs), when it will be open (Halse et al. 1993a).Shrubs such as Muehlenbaeckia spp. sometimes occurinstead of trees in wetlands of low rainfall zones.Other lentic wetland types include seasonally or
episodically filled playa lakes. These are morecommon in the eastern part of the surveyed areaand vary in size from a few 100 m 2 to several 100km2. Many are naturally saline and support lunetteson the downwind side (Bowler, 1983) withvegetation in low-lying areas around the wetlandmargin consisting mostly of chenopods. Playa lakesare maintained as landscape features bygroundwater discharge (Salama, 1994; Harper andGilkes, 2003) but most fill only after surface or sub-surface inflow.A variety of vernal pools, claypans and pools on
granite outcrops also occur. Vernal pools areperched above regional water-tables, usually onimpervious clay sediments, and seasonally containshallow water for a few months. They are fed bysurface run-off from their immediate catchment andsupport dense stands of sedges and small shrubsacross the wetland. They form only in areas ofmoderately high rainfall and occur mostly on thewestern edge of the surveyed area. Claypans areanalogous to vernal pools, occurring in low rainfallareas in the eastern part of the surveyed area. Whenflooded they contain either open water (often veryturbid) or emergent plants, such as Tecticorniaverrucosa, Muehlellbaeckia j70nilenta and Eragrostisaustralasica. Granite rock pools have beencomparatively well studied (Hopper et aI., 1997;Bayly, 1999; Pinder et ai, 2000). They occur in smalldepressions on inselbergs and share manysimilarities with vernal pools although, because oftheir rock substrate, they usually do not supportemergent vegetation.The surveyed area extended to both the south and
west coasts (Figure 1) and, near the coastlines,saline lakes of marine origin are present. These areeither part of old estuary systems or shallow lakesin inter-dunal swales (Hodgkin and Hesp, 1998).They usually support extensive chenopd marsheson their margins and sometimes stands of salt-tolerant lvlelalellca cllticularis.

342 S.A.Halse,M.N.lyons,A.M.Pinder,R.J.Shiel
(a)
(c)
"''''-5P'di'".::::::-"?'".........~
~
(b)
IIight:sionRecord
VerYmuchaboveAverageDecile10 '
AboveAverageDeeile8 -<)
AverageDecife4 - 7
BelowAvera"eDecile~ -3"
VerymuchbelowaverageDecile1
Figure3 Rainfalldecilesinthesurveyedareaduring1997-2000,andrainfalloverallWestern Australiaduring1999.(a)1997,(b)1998,(c)1999,(d)2000,(e)wholeStatein1999(datafromBureauofMeteorology).

Aquaticbiodiversity
Secondarysalinisationhasalreadyaffectedmanywetlands ofthesurveyedarea.The most visibleeffectsareincreasedinundation,increasedsalinity,anddeathoflake-bedandriparianvegetation(CramerandHobbs,2002;HalseetaI.,2003)
METHODS
This paperisbaseddatafrom197wetlands(Figure1,Appendix1),whichareasubsetofthosesurveyedforplantsbyLyons etal. (2004)andaquaticinvertebratesbyPinderetal.(2004).Dams,reservoirsandwetlands receivinghypersalinedischargewater were excludedfromouranalysis,whichdealtonlywithnaturallyoccurringwetlands.Most ofthesewereonCrownland(nature,waterorrecreationreservesorunvested)but65were onfreeholdland,which hadusuallybeenclearedforagricultureexceptforanarrowbeltofriparianvegetation,andsevenwere onpastoralleases.Many wetlandsinreservesalsohadlittleunclearedlandaroundthemandinsomecasesthereservedareadidnotencompassthewhole wetland (seeHalseetai,1993a).
TheWBS examinedpatternsincompositionanddistributionoftheoverallbiologicalcommunitiesinwetlands,asrepresentedbythreeelementswithdifferentlifehistorytraits:namelywaterbirds,aquaticinvertebrates,andvascularplantswithinthewetland andriparianzone.We definetheriparianzoneasextendingtothehigh-watermarkofmajor, regular(thoughnotnecessarilyannual)floodevents.Aquaticinvertebratesandwaterbirdsinwetlandsofthecentralthirdofthestudyareaweresurveyedinspring1997,thesouthernthirdinspring1998andthenorthernthirdinspring1999(Pinderetai,2004).Fouradditionalwetlandsweresurveyedin2000.Wetlands ofsouthernandsomecentralpartsofthestudyareaweresurveyedforplantsin1998andthoseinnorthernandtheremainingcentralpartsweresampledin1999withspringandsummervisits toeachwetland tocoincidewith periodsofmaximal floweringactivity(Lyonsetal.,2004).Fivewetlands weresurveyedin2000.
There was temporaldisparitybetweentheanimalandplantdata-setsformany wetlands,includingallthosesampledforfaunain1997.Conditionsdidnotchangemuch betweenanimalandplantsamplingifbothoccurredin1997and1998,becausetheseyearshadsimilarrainfallpatterns (Figure 2), but differences weresometimesmarked ifplantsweresampledin1999
andanimalsduringtheprecedingtwoyears.Wehavebeenunabletocompensatefortemporaldiscrepanciesexceptforsevenwetlands inthedata-setofPinderetal(2004)thatweresampledtwice,indifferentyears.Forthese,faunaldatawereusedfromtheyearwhenwetlandconditions
343
were most similartothosewhen plantdatawerecollected.
Aspecieslistofvascularplants,invertebratesandwaterbirds was compiledforeachwetland basedonscoringallplantspecieswithin avariablenumberof100m2quadratsatthewetland(Lyonsetai,2004), takingtwo50m invertebratesweeps(Pinderetal.,2004),andsurveyingeitherthewholewetland,oralargesectionofit,forwaterbirds.Weusetheterm"species"looselytorefertotheanimalandplantunitsusedinanalysis.Identificationswereusuallyatspecieslevelbutexistingtaxonomickeysenabledsomeinvertebrategroupstobedistinguishedonlyathightaxonomiclevels(e.g.Nematoda).Evenwhenkeyswereadequate,itwassometimesimpossibletoidentifyallanimalsorplantsofagenustospecieslevelbecausespecimenswereimmatureorsterileandthenitwasnecessarytolumpidentificationsatgenuslevelforanalysis.
AnalysisSingletonspecieswereexcludedfromthedata-set
forall multivariate analyses.Wetlands wereclassifiedintotypesaccordingtothesimilarityoftheirbiotausingthePATN analysispackage(Belbin,1993)andpresence/absencespeciesdata.Czekanowski'scoefficientwasusedasameasureofdissimilarityandunder-estimateddissimilarities(>0.95)were re-calculatedusingtheShortestPathoption.TheUnweightedPair-GroupMean Average(UPGMA)fusionmethod, with ~ wasusedtogroupwetlands (SneathandSokal, 1973).Thediscretenessof wetland typesidentifiedbyclassificationwas examinedbyordinationusingSemi-StrongHybrid Multidimensional Scaling(SSH)(Belbin,1991).
Specieswere classifiedintoassemblagesofspecieswith similarpatternsofoccurrenceusingtheTwo-Step coefficientofdissimilarity(AustinandBelbin, 1982)andUPGMA. The degreeofnestednessineachassemblagewascalculatedusingNESTED (AtmarandPatterson, 1993, 1995).Nestednesswasfurtherexaminedbycheckingthatrichnessofeachassemblagewas unimodallydistributedagainstI-dimensionalordinationscoresofcommunitystructure,derivedbySSHwithoutmasking singletons.Whether richnessvaluesofeachassemblagefittedaPoissondistributionwascheckedbyvisualinspectionafterplottingthem.
For eachassemblagethatappearedtobeecologicallymeaningful, therelationshipbetweenspecies richness of the assemblage andenvironmentalattributesacrossthe197wetlandswas modelled usingageneralisedlinearmodel(Poissonregression)intheSTATISTICA analysispackage(StatSoft,2001). The environmentalattributesavailableformodelling relatedtogeography,climate,water physico-chemistryandtwoparticularhabitats(Table1).Environmental

344 S. A. Halse, M. N. Lyons, A. M. Pinder, R. J. Shiel
Table 1 Environmental attributes measured at, or derived for, each wetland and used in modelling. Ionic ratioscalculated using milliequivalent values.
Code Attribute Code Attribute
Mg LI calcium carbonateDissolved persulphate nitrogen (mg L I)Dissolved persulphate phosphorus (mg LI)Chlorophyll a,b,c, Phaeophytin (mg L 1)
GeographicLat Latitude (OS)Long Longitude (OE)Alt Altitude (m)ClimaticTann Annual average temperature (QC)Pann Annual average precipitation (mm)Pdry Driest quarter precipitation (mm)Pcv Coefficient of variation precipitationEvap Annual average pan evaporation (mm)Physico-chemicalSaP Total dissolved solids (mg L-I)pI-PAlkTNTPChi
I Used as either a continuous or categorical variable
TurbColSilNa'Ca2'Mg2'K'Mn2•
ClHCO,SO/-DMCCSCCHabitatRockFlow
Turbidity (NTU)Colour (TCU)Silica (mg LI)Sodium (% meq)Calcium (% meq)Magnesium (% meq)Potassium (% meq)Manganese (% meq)Chloride (% meq)Bicarbonate (% meq)Sulphate (Ya meq)Mgl.+ Cal' : ClCa2': SO/Cal' : HC03+CO/-
Waterbody on granite outcropFlowing water when sampled
attributes were screened before constructing eachmodel and attributes that were not significantlyrelated to richness of the assemblage were excludedfrom the regression analysis. If several attributeswere strongly inter-correlated, only the one withmost obvious biological meaning was included inanalysis. A regression equation was constructedwith two to four environmental attributes, using theBest Subsets routine. Significance of the equationwas assessed using the Wald statistic after checkingthat outliers were not disproportionatelyinfluencing coefficients. The amount of variationexplained was calculated by an Rl-value adjustedfor number of cases and environmental variablesused (Tabachnik and Fiddell, 1983).In an attempt to define the habitat preferences of
different assemblages, their fidelity to each wetlandtype was calculated as:F 4i = PAi • w/w i • (l/LpAi' w/w)
1-nwhere F4i is the fidelity of assemblage A to wetlandtype i, pAi is the proportion of assemblage A inwetland type i, w i is the number of wetlands in typei and w· is the average number of wetlands per type(see Boesch, 1977).The WBS results were used to identify some
Potential Recovery Wetlands (PRWs) that couldform the core of future BRCs. The PRWs representthe surveyed wetlands containing the largestproportion(s) of the assemblages that appeared toneed active protection to persist in the surveyedarea in the face of further salinisation. Theproportion of each assemblage that would beconserved if the PRWs and existing BRCs wereprotected while the remainder of the surveyed area
became salinised was calculated to provide notionalindication of the adequacy of the proposed PRWs.The calculation assumed eventual loss of all speciesoutside the PRWs and BRCs, although we recognizethe assumption is unrealistic (see Halse et aI., 2003).
RESULTSAltogether, 986 wetland or wetland-associated
plant, 844 aquatic invertebrate and 57 waterbirdspecies were recorded, with an average of 73 (range10-174) species per wetland (Appendix 2). Fifteenper cent of plant species were naturalised aliens(weeds). Species occurrence was very patchy with34% of species occurring at a single wetland, 15% attwo wetlands and only 1.1% at more than one-thirdof sites. No species was present at all wetlands andfive of the 10 more common 'species' were higherlevel taxa. The more common true species were thechironomid midge Procladius paludicola (58% ofwetlands), introduced herbs Hypochaeris glabra(54%) and Sonchus oleraceus (43%), introduced grassParapholis incurva (49%) and grey teal Anasgibberifrons (48%).
Species assemblagesAfter deleting singleton species from the data-set,
22 species assemblages were recognized but threeof these appeared to be artefacts driven by thespecies array at individual sites (assemblage 15 byLake Pleasant View SPM024, 19 by Arro SwampSPS183, 22 by Goonaping Swamp SPS023)(Appendix 3). Information about assemblages issummarized in Table 2. The assemblages were:Assemblage 1. A group of 27 species mostly

Table2 matrixofmemberwasrecorded,wetbndsofeach
,lS:il'rnbla\,:l'S(rows)towetlandtypes(columns),Nrepresentsthenumberofwetlandsofeachtypeorthenumberoftimesan"c;,;prnhh"pandSrepresentthemean numberofspeciesperwetlandandthenumberofspeciesineachassemblage,respectively,MeanTOS(gLandforoccurrencesofmembersofeachassemblai!e,andmeanoHatwetlandsofeachtvoearcalsoshown.Scetextformethodofcalculatin"
;;.-..0r:;l:J
Cl
c;-
C'0.
<'re....'"~
53 16Y
74 516 22±06
27 127 2.6±1
8Y 854 30±OA
84 244 3.3±1
51 232 43±1
64 2381 4Y±03
62 191 7.
70 88Y ryI
106 577
61 183 24±3
35 2124 24tI
31 452 26±2
30 43Y 26±2
63 270 32±4
68 2236 44±1
37 802 59±2
44 156 64±4
100 603 90±3
""...(>1
0.000 0000
0002 0002
0.000 o000
0.001 0001
0004 (W05
0008 0000
0.004 0006
0005 0007
0007 0008
0021 0005
0.036 0032
0.033 0.027
0.095 0.036
0043 0.010
0.013
0.302 0.204
Wetland type
VI I VIII IX II VI IV V III XI X XII XV XVI XIII XIVN 13 13 .'1 12 18 11 12 12 10 4 2.'1 11 22 12
100±Y 6Y±13 108±5 78±3 74±5 8th5 68±7 103±4 54±3 5Y±5 73±4 ~ 52±6 50±6
05±O2 1 ±OA 4.0±0.Y 38±]043±lJ6 45±11 58±1.1 16±3 39±6 48±16 5l±8 116±27 128±21 146±35
76±OA 7lJ±lJ2 8.lJ±O.2 7.6±0.2 85±0.2 84±0.2 8.2±0.2 7.6±0.3 8.8±lJ.2 8.6±lJ.2 8.Y±0.2 47±lJ7 8.0±0.1 51 S N TDS
21 •0006 0.102 0.000 0.036 0.007 0024 0018 0007 OODO 0000 0000 0.003 O.OOD
20 •• 0.171 W.il;. 0.081 0.066 0.02Y OODY 0020 0050 0.005 0000 0012 0.010 0000
0(133 0015 O(m 0.014 0025 0042 0021 0.000 0.000 0.0l1
17 0.054 0058 0082 0016 0.093 0.104 0.078 005Y 0.023 0010 0.012 0.003 0002
8 0.055 0007 0.000 0.003 0013 0028 0008 0019 0048 0000 0.000 0002 0.000
16 -0088 0183 0.025 0.021 0019 0.030 0.018 0.068 0011 0.037 0004 0.000
5 0.081 0.149 0.076 0,069 0.110 0.079 0.095 0.096 0.133 0036 0.044 0.009 0.0l2 0001
4 0.051 0051 0024..OOlO..0.146 0035 0006 0.000 0005 0.000 (W05 0008
8 0.069 0.103 0.051 0.082 0036 0.128 0.168 0.124 0.135 0.142 0.046 002] 0.002 DOI(]
2 0.027 0.088 0025 0002 0.097 0.193 0.132 0.134 0.144 0026 0.061 0013 0.023 001
3 0011 0007 002Y 0036 0.011 0.082 0.127 0020 0048..0.023 0.199 0000 0.006
6 0.03Y 0.077 0.025 0033 0.069 0.059 0.093 0.073 0.110 0.067 0.156 0.059 0.056 0.025
7* 0.119 0.142 004Y 0045 0.107 0.032 0.027 0016 0.079 0.061 0.068 0.044 0.061 0017
9 0008 0.007 0022 0.065 O.OIY 0028 0.152 0022 0.078l1li0.060 0.180 0017 0019
12 0.126 0043 0.154 0004...0.037 OOOY 0009 0.056 0.000 0.021 0.019 0.179 0.006
13 0.018 0.030 0010 0004 0.056 0.012 0.028 0.031 0.090 0.050__0.087 0.117 0.039
14 0.022 0004 OOlY 0.000 0.109 0.000 0003 0006 0.048 0005 0.085 0036.0.02Y
11 0000 0.000 0.000 0.000 0.052 0.000 0000 0.010 0.023 0000 0038 0.Cll1 ..'0.015
10 0.002 0003 0.012 0.000 0.030 ()(lOO 0007 0005 0.002 0.005 0.120 0.125 0.100 0.085

346 S.A.Halse,M.N.Lyons,A.M.Finder,R.J.Shiel
•.~..'..
I .'
::.-.•
;, ••••• 0 o.0
•
....-..\,.
00• 0
.0
,.
•
Assemblage4
o'
I .•...o
..t..~
• Assemblage6
••...,,.f··•.\••tt. • •;.,..\...-..
• ••# •I....... ...",. .~..,..••• •.r....:".I : 0
:-0A I·:·,.tl',tII6.·..•••lit:o·~
•....•
I _f
••
•',0
••o
Assemblage5
..• 0
0......
,.••'.~ ,··Iliro•o 0
~~
••
••• • 0
••••••••.'-:..
• o ••'• •..'..
:••eo •
• •....,....
••.'.,.~
f....•
Figure4 Distributionofspeciesassemblagesatwetlandssurveyedinthewheatbelt.Assemblages1-6.
l_________
Aquaticbiodiversity
associatedwithfreshwater(mean2.6±1.0gLI)thatrepresented ~ ofspeciesoccurrencesinthesurvey.Theassemblagecontained11invertebrate,1waterbirdand15plantspecies.Memberswereabsentfrommostwetlandsand
theassemblagetendedtooccurintheeasterncentralandsouthernwheatbelt (Figure4).It
wasbestrepresentedatLakeCronin(SPS003,15species).
Assemblage2.Agroupof106speciesfoundmostlyinassociationwith subsalinewater (mean
10.6±1.1gLl).Theassemblagecontained54invertebrate,10waterbirdand42plantspecies
andrepresented4.3%ofallspeciesoccurrences.Members oftheassemblagewere distributed
throughoutthewheatbelt,withfewatanyone
site(Figure4).Theassemblagewas bestrepresentedatMurchison River (SPSI98,29species).
Assemblage3.Agroupof61speciesfoundmostlyinoradjacenttosalineriversandwetlandsofthesouthcoast(mean23.5±1.1g LI)(Figure4).Theassemblagecontained29invertebrate,1waterbirdand31plantspeciesandrepresented1.4%ofallspeciesoccurrences.Theassemblagewas bestrepresentedattheOldfieldRiver(SPSI23,12species).
Assemblage 4.A groupof62speciesinorassociatedwith freshtosubsaline,flowingwater (mean7.1±2.5gLl).Theassemblage
contained38invertebrateand24plantspeciesandrepresented1.4%ofallspeciesoccurrences.Members wereconcentratedatstreamsitesinwandoowoodlandeastofPerth(Figure4)andtheassemblagewas bestrepresentedat]imperdingBrook(SPS004,20species).
Assemblage 5.A groupof64specieswidelydistributedinthewheatbelt (Figure4)inassociationwithfreshtosubsalinewater(mean4.9±0.3gLl).Theassemblagecontained56
invertebrate,1waterbirdand7plantspecies,representing17.7(),;,ofallspeciesoccurrences,
andwasbestrepresentedatRangeRoadyateswamp(SPS033,39species).
Assemblage6.Agroupof35widespread(Figure4),salt-tolerantspecies(mean23.7±0.9gLI).
Theassemblagecontained12invertebrate,10
waterbird and13plantspecies,representing15.8'Yoofallspeciesoccurrences,andwasbestrepresentedatDulbinning Lake(SPS007,25species).
Assemblage7.Agroupof31speciesfoundoverthefullrangeofsalinities(mean26.1±2.3gLI)
(Table2).Theassemblage,whichcontained10
invertebrate,1waterbirdand20plantspecies,
was patchilydistributedacrossthewholewheatbeltandrepresented3.4°!c,ofallspeciesoccurrences.Plantspecieswerenearlyallexoticweeds, without conservationvalue.The
347
assemblagewas bestrepresentedatArroSwamp(SPSI83,14species).
Assemblage 8.A groupof70speciesfoundmostlyinfreshtosubsalineorweaklysalinewater(mean7.2±0.7g LI).Theassemblage
contained47invertebrate,2waterbirdand21
plantspecies,representing6.6%ofallspecies
occurrences.Itwas patchilydistributed
throughoutthewheatbeltbutwithatendencyforgreaterfrequencyofoccurrenceonthe
southcoast(Figure5).Itwasbestrepresented
atBoyacup Bridge swamp(SPS111,20species).
Assemblage9.Agroupof30halobiontspecies(mean26.1±2.0gLI)thatoccurredmost
frequentlyalongthesouthcoastandsouth-
westernpartofthestudyarea(Figure5).Theassemblagecontained11 invertebrate,1waterbirdand18plantspecies,representing3.3%ofallspeciesoccurrences.ItwasbestrepresentedatOldfield River (SPSI23,15species).
Assemblage10.Agroupof100speciesassociatedwithsalineandhypersalinewater(mean90±3gLl)outsidehighrainfalland,usually,coastal
areas (Figure5). The assemblage wasdominated by plants, containing 22invertebrate,7waterbirdand71plantspecies,which represented4.9% of allspeciesoccurrences.Thesitewithmostspeciesoftheassemblagewas IsthmusLake(SPS058,24species).
Assemblage11.Agroupof44speciesassociatedwithhypersalinewater(mean64±4gLI)ofthenorth-easternwheatbelt (Figure5). The
assemblagecomprisedalmostexclusivelyplantswith2invertebrate,1waterbirdand41plantspecies,whichrepresented1.2%ofallspeciesoccurrences.ItwasbestrepresentedatLakeMoore(SPS148,19species).
Assemblage12.Agroupof63speciesassociatedwithsomeofthefreshestandsomeofthemosthypersalinewetlands(mean31.8±3.6g LI)inthenorth-easternwheatbelt (Figure5).The
assemblagewasdominatedby47plantsspecies
which, togetherwith 16invertebratespecies,represented2.0%ofallspeciesoccurrences.Therewas considerablediscrepancybetween
plantsandinvertebratesintermsofthe
salinitieswith which theywere associated(Table3).Theassemblagewasbestrepresented
atYarraYarraLake(SPSI62,12species).
Assemblage 13.A groupof68speciesmost
commonlyfoundinornearsecondarilysalinewetlands(mean44±1gCl).TheassemblagewasWidespread inthewheatbelt (Figure5)andaccountedfor16.6%ofallspeciesoccurrences.Itcomprised27invertebrate,4waterbirdand37plantspeciesandwasbestrepresentedatLakes

348 S.A.Halse,M.N.Lyons,A.M.Pinder,R.J.Shiel
\
Perth ~ir
Assemblage9PercentageofasseI';lblagesp.x'\esat
.5010<75
.3010<50
•.
r<algcorlil';
•••...
.....
:...•
\per ~
j
\\
~
\.\\
,.
";.Kalgoor!le
"
..
•
..
Assemblage8Percentageotassemblages;;aX;;E:'sateachsile
•:5:0<30
• 5to<15• 0\0<5
.'.........•
...-.·...•
f·"r.\.\\
\
r~..\.
Getaldtotl~ •
\,.
•
Assemblage11Percentageofassemblagespeciesats<lchsite
.30to<50e15tc<30
• 510<15
010<5
o
.,
Kalgooriie...•
~
•••••
•••
•
....,
••• ..•• •••
••
'.
...
'.'
....,fI'
•
.'
·..~•
;.·.
\\
Albany
~.....·
(16)
•
Assemblage13Percentageofassemblagespeciesateac!",sIte
.30te<50815to<30• 510<15
Cto<$
o
e,Ka-lgoofhe
·.•'.
Assemblage12Percentageofassemblagespeciesateachsite
81510<30
• 510<15010<5o
••..•.' ..
•
..
..,..,• •••
Geraldton
Figure5 Distributionofspeciesassemblagesatwetlandssurveyedinthewheatbelt.Assemblages8-13,

Aquaticbiodiversity 349
(4\
.50
.30
• to<30·
•
Assemblage16
P"'M"""'" e~ ..,pspeCle-sate8{:h
••..
...••
~
.",..,
•• ••.' .•.•
...-.-..•
".,...•• 1~..,•,..
Albany
Gen31dton
• Assemblage18of"",mblagespems
~ Kalgoor1:e
•.'.\."
••,.'•.;..,• •
..
•
1 •
Albany
.30la<50
.,5·
Assemblage21Percentage
••
•
Assemblage20Percentageofassemolagespec,t'c'SateaCh
••
•
••
....••
•..•
••..• •
••
••·
Figure6 Distributionof s ern ~esatwetlands~ r r inthewheatbelt.AsseJrntJla);;es14-21.

350
Table3 Mean (±SE)salinityofoccurrence(gLI)ofplant,invertebrateandwaterbirdspeciesineachassemblage.SEshownonlyiftherewere~ occurrencesinacategory
Assemblage Plants Invertebrates Birds
21 0.9±O.7 0.4±0.120 3.7±1.6 1.3±0.21 3.2±1.6 1.0±O.217 4.3±O.8 2.3±O.4 1.4±O.518 4.1±2.2 2.4±O.916 7.6±2.3 1.8±O.65 12.2±2.3 4.2±O.2 6.7±2.14 14.6±6.7 2.7±0.58 11.8±2.0 5.1±0.6 10.7±3.02 20.3±3.1 5.6±0.5 5.6±0.73 25.3±4.8 21.6±3.2 22.06 32.1±1.9 20.6±1.3 15.8±1.27 30.4±3.1 14.5±2.5 23.8±16.69 28.6±2.8 22.6±2.9 12.2±5.112 38.1±4.3 10.7±5.113 50.3±1.8 34.1±1.4 43.1±4.514 58.4±2.2 68.0±12.611 62.5±4.3 67.0 108.0±24.110 88.7±3.9 91.9±5.7 84.9±9.8
BiddyandCoyrecup(SPS067andSPM004,33species).
Assemblage14.Agroupof37speciestypicalofnaturallyhypersalinewetlands(mean59±2gL-l)inthenorthernwheatbelt, althoughmorewidelydistributed(Figure6).Theassemblagecomprisedalmostexclusivelyplants(36species)which, togetherwith 1waterbird species,represented6%ofallspeciesoccurrences.TheassemblagewasbestrepresentedatWeelhambyLakeandMongers samphirepan(SPS169andSPS167,25species).
Assemblage16.Agroupof51speciesoccurringpredominantlyaroundfreshwateralthoughmean salinitywas4.3±1.1gL-I becauseofisolatedplantoccurrencesaroundhypersalinewetlands.Theassemblagewasmorecommoninhighrainfallareasandthesouthcoast(Figure6).Itconsistedof30invertebrateand21plantspecies,representing1.7%ofallspeciesoccurrencesandwas bestrepresentedatYoulabupSwamp(SPS124,26species).
Assemblage17.Agroupof89speciesassociatedwithfreshtosubsalinewater(mean3.O±OAgL,l)predominantlyonthewesternmargin ofthewheatbelt(Figure6).Theassemblagecontained54invertebrate,1waterbird and34plantspecies,representing6.4%ofallspeciesoccurrences.ItwasbestrepresentedatNalyerinLake(SPS031,49species).
Assemblage18.A groupof84speciesalmostcompletelyrestrictedtosedgeswamps,withgreatestoccurrenceinswampsofthesouth-westernpartofthestudyarea(Figure6).Whilethemajorityofoccurrenceswereinfreshwater,
S.A.Halse,M.N.Lyons,A.M.Pinder,R.J.Shiel
meansalinityofoccurrencewas3.3±1.3gL,Iasaresultofafewplantrecordsaroundhypersaline wetlands. The assemblagecontained35invertebrateand49plantspecies,representing1.8%ofallspeciesoccurrences.Itwas bestrepresentedatPoorginupSwamp(SPS103,39species).
Assemblage20.A groupof74speciespatchilydistributedthoughthewheatbelt(Figure6)andoccurringpredominantlyinfreshwater(mean2.2±O.6gL,I).Theassemblagecontained41invertebrate,1waterbirdand32plantspecies,representing3.8%ofallspeciesoccurrences.ItwasbestrepresentedatPunjerwerryClaypanandWeelawadji Lake(SPS197and177,34species).
Assemblage21.Agroupof53speciestypicalofpoolsongraniteoutcrops(meanO.6±O.3gL,l,Figure6).Theassemblagecontained27invertebrateand26plantspecies,representing1.3%ofallspeciesoccurrences.ItwasbestrepresentedatWannara Rock (SPS168,21species),Several trends were noticeable amongassemblages.Firstly,waterbirdsrarelyformedasignificantcomponentofthespeciesrichnessofanassemblage:eveninthemost bird-dominatedassemblage6,waterbirdscomprisedonly29%oftaxa.Plantscomprisedmostofthebiotaofnaturallysaline assemblages. The ratio of plants:plants+invertebrates averaged >0.9 intheassemblagesmosttypicalofnaturallyhypersalinesites(10,11and14)comparedwith<0.5inotherassemblagesSecondly,many assemblagesoccurredatallwetlandtypes,albeitoftenatverylowfrequency(Table2).Thiswaslargelyattributabletomanyplantspeciesthatgrewondunesorrisesaroundawetland notcloselyreflectingconditionsinthewaterbody itselfandbeingwidelydistributedacrosswetlandtypes.Formost assemblages,theaveragewetlandsalinityassociatedwithplantrecordswashigherthanforinvertebraterecords.Thediscrepancyincreasedastheassemblagebecamemorehalophilic,exceptforassemblagesoccurringpredominantlyathypersalinewetlands(Table3).Thirdly,fewassemblagesweretightlydefinedspatiallyandtheoccurrenceofassemblageswasoftenpatchy.Forexample,wetlandscontainingsignificantnumbersofassemblage4specieswerelocatednearGeraldton,PerthandEsperancewithonlyscattered,low-frequencyoccurrenceatwetlands between(Figure4).Thesomewhatstochasticoccurrenceofassemblageswasreflectedintherelativelylownumberofassemblagespeciesatindividualsites.Eventhesitebestrepresentinganassemblagecontained,onaverage,only45%ofassemblagespecies(range20-71%).
Aquaticbiodiversity 351
Table4 EquatIOnspredictingthelogarithmofspeciesrichness ateachsiteforeachspeciesassemblageandthedegreeofnestednessofassemblages.TheadjustedR2 ISameasureofhowmuch variationinassemblagerichnessisexplainedbyeachequation;rand'/0fillaremeasuresofnoiseandthefrequencyofoccurrenceofspeciesIntheassemblage,andPistheprobabilitvthatanassemblageisnotnested(AtmarandPatterson1995).SeeTable1forabbreviationsandfootnoteforcategoriesofsalinity'andpH2.
Assemblage EquationforLog,S AdjR2 T %fill P
1 2.3644-0.0457Pcv+0.0405HCOJ-0.1034sa,-0.0374Sal' 62 16 11 le'S
2 -1244640.0176Sal+0.0024Alk+0.0285Pcv+0.0995Long 33 8 4 4e,223 -11.7119+1.3273flow+0.3931latitude-0.0068elevation- 53 11.3 5 2e'
0.1572Ca:S04meq4 -4.8503+1.3979Flow+0.0050Pann+0.0184Pcv+0.0495Mg 47 11 6 3eJ
5 7.3355-0.0532Sal-0.0362Long 70 33 23 8e"56 2.6369-0.0040Sal-0.7251pHI-0.1397pH2-108641Mn 33 38 31 2e-"8 -.0358+1.0679Sail+1.5586Sal2+0.6770Sal3+00367Mg 55 22 9 3e-2"
00405CC9 -9.6860+0.3569Lat-0.0062Alt-1.9000Sail 0.0681Sal2+ 59 22 12 Se_I;'
0.4372Sal310 3.0831-0.0180Pcv-3.2756Sail-2.8694Sal2-06227Sal3 57 10 6 3e_3S11 -5.3949+0.6050Tann-0.0235Pann-10.6212SaIl 2.8034Sal2- 75 16 8 2e-4
0.6572Sal3+0.3606pH12 3.8148+0.0108Alt-0.0658Mg-0.0030Sal-0.0026Pann 51 12 5 2e-413 3.6323 0.0020Pann-1.2524Sail-0.8087Sal2+0.2018Sal3- 53 26 18 2e_97
0.7926pHI-0.2944pH214 -24369+0.0093Evap-24704Sail-1.4907Sal2 00581Mg 65 23 19 2e_4916 -98974+04045Lat 0.0383Sal 0.3998pH+01901K 43 13 6 e ~
17 10.2881+02703Lat+0.0038Pann+0.0268Pcv 00709Sal 76 9 8 2e-7'18 -14.5642+3.9927logPann-0.6591Tann+1.3916pH2-0.0005TN 84 13 8 2e"020 3.7039+0.6485Rock 0.0930Sal 0.0044Alk-0.0254Cl 633 12 8 4e_3621 -2.7073+2.9708Rock+0.1348S04-0.8150CC 86 15 11 6e-9------
,Sail<150mgL',Sal2<8000mgL',Sal3<50000mgL',Sal4;::50000mgL'2 pHI<6.0,pH2;::6.0dropSPS025,SPS177R2=70%
ModellingassemblageoccurrenceSpecies richnessvalues of all modelledassemblageswere unimodallydistributedacrossordinationscores,suggestingtheassemblageswerenested(seealsoP-valuesinTable4).RichnessvaluesapproximatedPoissondistributionsforallassemblagesotherthan5and13.Equationsdescribingthedistributionofspeciesrichnesswereproducedfor18assemblages(nosatisfactorymodelcouldbeconstructedforassemblage7andnoattemptwas made tomodel theartefactualassemblages15,19and22).AdjustedR'-valuesoftheequationsvariedfrom33-86%(Table4).
Thelowamountofvariation(33%)explainedbyequationsforassemblages2and6appearedtoreflectbiologicalrealityratherthanviolationofmodel assumptions.Bothassemblagescontainedfreshwaterspeciesthatweresalt-tolerantandfoundthroughoutthewheatbelt(Figure4)andbeyond,sothattheWBS didnotcircumscribetheirecologicallimitsefficiently.Aquarterofthespeciesbelongingtoassemblage6weremobilewaterbirds,halftheinvertebrateswerehighertaxa(usuallyfamiliesorphyla)andmanyoftheplantswereweeds.Morethanhalftheinvertebratesinassemblage2hadpoordispersalabilityandtheiroccurrencemay bedeterminedlargelybyhistoricalevents(seeMalyet
aI.,1997foradiscussionofcopepoddistributions)thatarestochasticwithregardtotheenvironmentalparametersmeasuredintheWBS.
Thevariablesusedinmodelsofspeciesrichnessdonotnecessarilyreflectthemainenvironmentaldriversofspeciesdistributionsorassemblagerichness,evenwhenR'-valuesarehigh.However,salinitywas anexplanatoryvariablefor14assemblages(Table4)andforotherassemblagesthereweresignificantcorrelationsbetweensalinityandoneofthevariablesusedinthemodel. Thisstronglysuggestssalinityisamajor driverofcommunitypatterns.Othervariablesthatappearedcommonlyinmodels wereannualrainfall,pH,latitude, alkalinity and magnesium ionconcentration,while thepresenceofagraniteoutcropwasastrongpredictoroftheoccurrenceofassemblage21andflowingwaterwasapredictorofassemblages3and4.
Typesofwetland
Sixteentypesofwetlandwererecognizedinthesurveyedarea,basedontheirplantandanimalassemblages.Themajor splitintheclassificationrelatedtotheseparationofprimarilyandsecondarilysalinesitesfromfreshorsubsalineones(Figure7,AppendiX4).Themajorwetlandtypeswere:
352 S. A. Halse, M. N. Lyons, A. M. Pinder, R. J. Shiel
Type Ill. Biodiverse subsaline wetlands. Fresh tosubsaline water (mean 5.8±1.1 g L 1). Wetlandsin this group had little in common with eachother. Lake Logue (SPM002) on the coastsouth of Geraldton was in the final stages ofdrying and had become saline as it evapo-concentrated, the secondarily saline LakeDulbinning (SPS007) in the central wheatbeltfilled a month or so prior to sampling andwas fresher than usual, Capamouro Swamp(SPS163) in the northern wheatbelt usuallycontains hypersaline water (if water present)but was subsaline when sampled because of alarge flood event, and Peenebup Creek(SPSl15) is a subsaline river flowing towardsthe south coast. Mean richness was 100±3,with Boyacup Bridge swamp (SPS111, 113species) the richest site. Most of theassemblages found at wetlands ofintermediate salinities occurred at lowfrequency in type III wetlands; invertebratesformed a greater percentage of the biota (52%of species) than plants (39%).
Type IV. Semi-permanent subsaline wetlands. Freshto subsaline water (mean 4.3±0.6 g Ll). Mostlyon south coast, usually with extensive fringingtrees. Mean richness was 84±5, which wasalmost 20% lower than type Ill. Theassemblages occurring in the two wetland typeswere similar, with type IV wetlandsdifferentiated largely by a greater proportion ofspecies in assemblages 3 and 9. Invertebratesdominated the biota (57% of species) but morewaterbird species were present (13%) than atany other wetland type except X. The richestsite was Meeking Lake (SPS038, 102 species).
Type V. Disturbed subsaline wetlands. Fresh tosubsaline water (mean 3.6±0.7 g L·l, excludingSPS199 where sampling included areas muchfresher than the recorded salinity). Occurredthroughout the wheatbelt, other than the southcoast. Mean richness was 67±6, which was morethan 30% lower than type III and the number ofassemblages making use of the wetlands wasfewer than for III and IV (Table 2). Invertebrateswere very much the dominant element of thebiota (71% of species) with the lower speciesrichness in type V wetlands largely theconsequence of a depauperate flora. The richestsite was Qualeup Lake (SPS032, 126 species),which had almost twice as many species as anyother wetland in the group.
Type VI. Westward flowing rivers. Fresh tosubsaline water (mean 3.8±1.0 g L·l). Meanrichness was 70±4, with Skelton Gully (SPS193,97 species) being the most species-rich site. Halfthe records of assemblage 4 occurred in thiswetland type and several other assemblages ofintermediate salinities also occurred at
II
I
I
I
IType XV, saline playas (22)Type XVI, species-poor acidichypersaline playas (8)
Type X, secondarily salinewetlands (25)Type XI, saline sou1h coastrivers (4)Type XII, coastal saline lakes(11)Type XIII, alkaline hypersalinelakes (12)
Type XIV, species-rich acidichypersaline playas (9)
Type VII, granite rock andvernal pools (13)Type VIII, daypans andshallow yate swamps(5)Type IX, sedge swamps (12)
Type 11, disturbed northernswamps (18)
Type Ill, biodiverse subsalinewetlands (10)
Type IV, semi-permanentsubsaline wetlands (12)
Type V, disturbed subsalinewetlands (12)
Type VI, westward flowingrivers (11)
Figure 7 UPGMA classification of wetlands into typesbased on their biota. Number of wetlands ineach type shown.
Type I, undisturbed freshwaterswamps (9)
Type I. Minimally disturbed freshwater swamps.Fresh water (mean 0.5±0.1 g Lt) with eitheremergent trees, shrubs or grasses on the lake-bed. Supported a high number of ubiquitousspecies. Mean richness was 95±8, with ArroSwamp (SPS183, 151 species) and WeelawadjiLake (SPS177, 135 species) having the mostspecies-rich communities. Assemblage 1occurred predominantly in this wetland type(Table 2) and invertebrates (61% of species)dominated the biota.
Type II. Disturbed northern swamps. Fresh tosubsaline water (mean 4.0±0.9 g L'l). Allmember wetlands were in the northernwheatbelt and were disturbed to some extent;most contained emergent vegetation. Meanrichness was 76±3, with Tardun CBC swamp(SPS187, 103 species) being the richest. Type IIwetlands were significant habitat (>20% ofrecords, adjusted for group size) for species inassemblage 12 and invertebrates (55% ofspecies) dominated the biota.

Aquatic biodiversity
moderate frequency; invertebrates dominatedthe biota (70(>;) of species),
Type VII. eremite rock pools and vernal pools,With their very small, mostly hard rock,catchments these sites were the least saline ofany wetland type (mean OA±0,2 g LI), Therewere two obvious sub-groups: pools on graniteoutcrops and three shallow, clay-based vernalpools plus a shallow creek high in thelandscape, Mean richness was 82±5, withWanarra Rock (SPS176, 117 species) being themost species-rich site, Type VII wetlands werethe dominant habitat for assemblage 21, withassemblages 20 and 16 also occurring insignificant proportions, Slightly moreinvertebrate species (55'1'0) were present thanplants (45°1<»),
Type VIII. Claypans and shallow yate swamps, Twogroups of wetlands occurred within this type:turbid claypans and clear-water shallow yateswamps, Both were fresh (mean 05±0,2 g LI).Mean richness was 62±12, with PunjerwerryClaypan (SPS197, 100 species) being the richestsite. Assemblages 20, 1 and 16 occurred insignificant proportions; the biota wasdominated by invertebrates (70'1<) of species),
Type IX. Sedge swamps. Fresh water (1 ,1±OA g L,I),Mean richness was 98±5, with Nalyerin Lake(SPS031, 130 species) being the richest site,These wetlands provided the main habitat forassemblage 18, and significant habitat forassemblages 17, 16 and 4, The biota wasdominated by invertebrates (63% of species),
Type X. Secondarily saline wetlands. Almost allthese wetlands contained fresh or subsalinewater prior to land clearing but are now moresaline (Bennetts Lake spson may be a naturallysaline exception), Mean salinity was 38.7±65 gLI and mean richness 54±3, with Stennetts Lake(SPS075, 71 species) the richest site. Thewetlands provided significant habitat forassemblage 13 and most assemblages typical ofsaline water were present at low frequencies.,Half the species were plants, with waterbirdscomprised 13(;<) of the community to make typeX (together with IV) the wetland typesupporting most waterbird species.
Type XL Saline south coast rivers. Three south coastrivers and an adjacent swamp that appeared tocluster with rivers on the basis of plantcomposition, Saline water (16.0±6.5 g LI) andmean richness 68±6, with Oldfield River(SPSI23, 68 species) the richest of the river sites.The sites appeared to be important habitat forspecies of assemblages 3 and 9, although smallgroup size means this conclusion should betreated cautiously, Invertebrates comprised thelargest proportion of the biota (58% of species).
Type XII. Coastal saline lakes. Saline water
353
(47.9±165 g Ll). l'he two subsaline wetlands inthis group (SPS121, SPS122) were saline butfreshened after rain shortly before sampling(Pinder et ai, 2004a). The wetlands were locatedon the coastal plain of the south and west coastsand had mean richness 56±4, with Mullet Lake(SPSI41, 82 species) the richest site,Assemblages 3 and 9 occurred in type XIIwetIands in significant proportions; just overhalf the biota (53%) comprised plant species.
Type XIII. Alkaline hypersaline playas. Hypersaline(128±21 g LI), alkaline (8.0±0.1) water. Primarilyhypersaline playa lakes, mean richness 50±6,with Anderson Lake (SPS106, 94 species) beingthe richest site. Assemblage 10 occurred insignificant proportions and other assemblagesassociated with high salinities were present inlow frequencies. Plants dominated the biota(76% of species).
Type XIV. Species-rich acidic hypersaline playas.Hypersaline (146±35 g L'!), acidic water (4.6±0.6,excluding the alkaline Kondinin samphiremarsh SPS017 which had a salinity of 10 g LIand pH of 9.2). Primarily hypersaline playalakes, mean richness 49±6, with Crook's wetland(SPS076, 58 species) being the richest acidic site.Assemblage 10 occurred in significantproportions and other assemblages associatedwith hypersaline conditions were present in lowfrequencies. Plants dominated the biota (80% ofspecies).
Type XV. Saline playas. Saline water (51±8 g L I).Primarily saline and alkaline, mean richness71±3, with Mongers samphire pan (SPS167, 114species) being the richest site. Assemblages 11and 14 occurred in significant proportions andmost other assemblages typical of salineconditions were present. Plants dominated thebiota (66% of species).
Type XVI. Species-poor acidic hypersaline playas.Hypersaline (116±26 g LI), acidic water(4.7±0.71, including two sites with pH -8).Disturbed primarily hypersaline playa lakes,usually with increased inundation as a result ofsecondary salinisation, these wet lands weredepauperate with mean richness 21±4. Wet landswith most species were Masters saline lakeSPS097 and Kondinin salt marsh lake (43 and 34species, respectively) but neither was typical ofthe type. Only assemblage 10 had more than 5(/0of its occurrences in this wetland type. Plantsdominated the biota (67% of species).
The different wetland groups were comparativelywell separated in ordination space (Figure 8),providing evidence that the wetland typesidentified in Figure 7 represented distinctcommunities. Sedge swamps and granite rock pools(types IX and VII) were the wetland types in freshwater with most clearly distinguished communities.
354 S. A. Halse, M. N. Lyons, A. M. Pinder, R. J. Shiel
20
, 5
10
o Fresh• Saline
10
05
00
.()5
-1.0
•o
20 '5 10 05 00 .() 5 ·'0 ., 5 .20 .25
., 0
00
'()5
05
(b)
(a)The ordination of freshwater wetlands supported adivision within type VII between the vernal pools(Goonaping SPS023, Youlabup SPS124 andNgopitchup SPS102) and granite rock pools,although we did not recognize this in the wetlandclassification. Claypans and shallow yate swamps(type VIII) formed a heterogeneous group withPunjerwerry Claypan (SPS197) and Frank HahnNational Park claypan (SPS087) having differentcommunities from each other and other type VIIIwetlands. Among the saline wetland types, therewas considerable heterogeneity within species-pooracidic hypersaline playas (type XVI), which resultedin some overlap with other hypersaline wetlands(types XIII-XV) (Figure 8). Species-rich acidichypersaline playas and saline playas (types XIV andXV) also showed some overlap with each other.Jurien coastal lake (SPS178) and Hutt Lagoon(SPS189), the only northern wetlands among typeXII (predominantly southern coastal saline lakes),were outliers but grouped together.
os
Figure 8
• X• XIo XIIo XIIIt:. XIV<>xvAXVl
<>1t:. 11o IIIo IV
• VA VI
• VII• VIIIo IX
10os
10
00
00
-os
-1.0
•
o 0o
00 ·10
·2.0
os
-1.S
1.0
Ordination of wetland groups in thewheatbelt as defined by UPGMA clustering.(a) all groups, (b) freshwater groups I-IX, (c)saline groups X-XVI. Stress = 0.19.
·10
1 S
-os
00
-os
O.S
10
1S
00
O.S
10
(c)
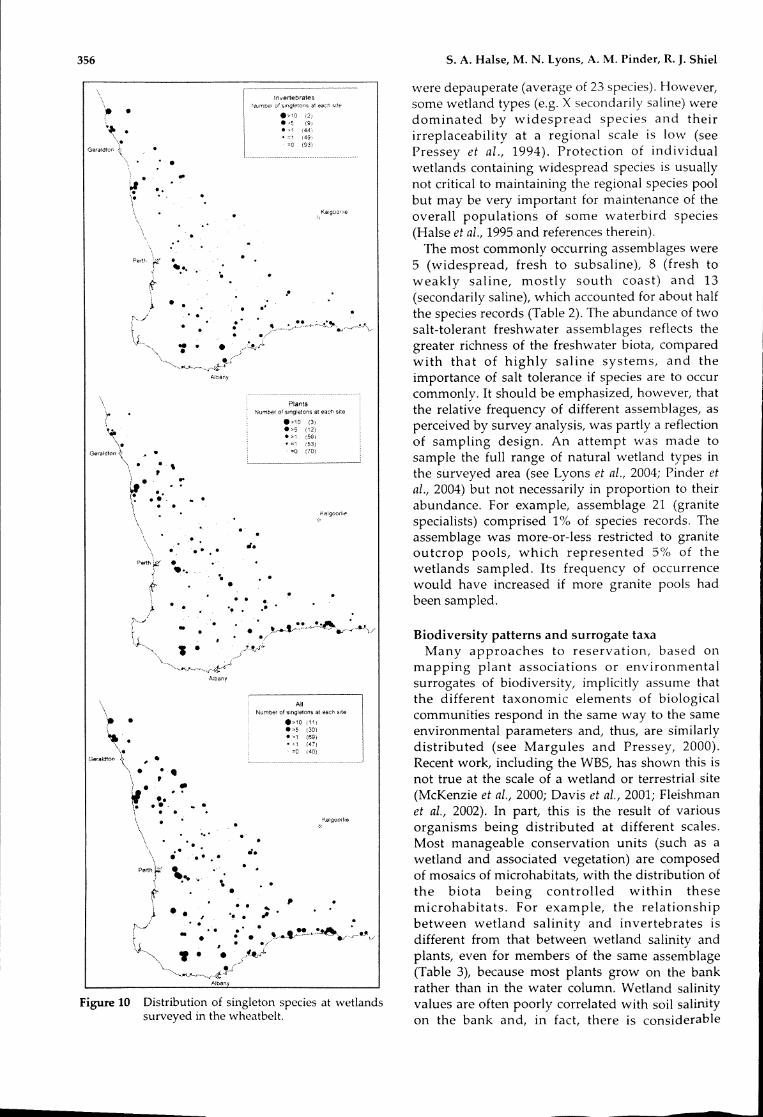
Singleton speciesMore than one-third of species were recorded at
only one wetland and were excluded frommultivariate analyses for mathematical reasons(Belbin, 1993). Plants comprised 55% of allsingletons, invertebrates 43% and waterbirds 2%.Within the three elements the percentage singletonswas similar for plants and invertebrates (36% and33%, Figure 9a,b) but lower for waterbirds (19%).Individual wetlands contributed disproportionatelyto the list of singletons, with 6% of sites accountingfor one-quarter of all singletons. Most of these siteswere either on the wetter, western side of thewheatbelt or in the north (Figure 10) and it is likelythat many of the singletons in these wetlands werespecies with core ranges outside the wheatbelt,either in the south-west forest or the northern aridzone.The number of singleton species was significantly
correlated with overall species richness at each site(r = 0.43) and negatively correlated with salinity (r =-0.23) but the relationships had little explanatorypower. Most wetland types had few singletons,with sedge swamps (type IX) the most obviousexception (Figure 9c). Individual sites with largenumbers of singletons occurred in type I (ArroSwamp SPS183, 23 species), type VI (MurchisonRiver SPS198, 13 species), type VII (GoonapingSwamp SPS023, 24 species) and type IX (PoorginupSwamp SPS103, 22 species). Hypersaline wetlandssupported relatively few singletons (Figure 9c),with the greatest number occurring in Kondinin saltmarsh lake (SPS016, 7 species). However, theproportion of the flora at individual hypersalinewetlands that were singletons was much higherthan for the invertebrate fauna (Figure 9d).Beaumont Nature Reserve (SPS130, 4 species) stood
Aquaticbiodiversity 355
outforitsinvertebratesingletons.Secondarilysalinewetlands (typeX) anddisturbedsubsalinewetlands(typeV)supportedfewsingletonspecies.
DISCUSSION
Waterbird distributionsinthewheatbelt andsouthcoast,andthefactorscontrollingthem,werewell understoodpriortotheWBS asaresultofsurveysintheearly1980s(JaenschetaI.,1988;HalseetaI.,1993b)buttheWBS considerablyimprovedknowledgeofinvertebratesandvascularplants.Forexample,itwas estimatedbyAnonymous (1996a)thattherewere only200aquaticinvertebratespeciesinthewheatbeltcomparedwithnearly1000nowknownfromtheWBS andrelatedmonitoringprograms(Caleetai,2004;Pinderetai,2004).
While thevascularflorawas betterknownthanaquaticinvertebrates,theWBS representedthefirstsystematicfloristicsurveyofwheatbeltwetlands.In
particular, knowledgeofthenaturallysalinesystemswithin inlandpalaeo-channelshasbeengreatly improved.Eight new species werediscovered,aswell asnumerouspopulationsofspeciespreviouslyfoundinfewlocalitiesandconsideredrestricted(LyonsetaI.,2004).Oneofthemajor outcomesoftheWBS hasbeenshowingthatwetland communitiesofthewheatbelt andsouthcoastaresubstantiallyricherandmore complexthanpreviouslyrecognized.Inaddition,thesurveyedareahasamoderately richdiatomfauna(BlinnetaI., 2004).Protectionofthesebiologicalcommunitiesshouldbeaconservationpriority.
Intermsoflocalisedbiodiversitypatterns,nearlyallwetlands intheWheatbelt aresignificant.Average instantaneous numbers of plant,invertebrateandwaterbird speciesassociatedwithwetlands intypesI(freshwater),III(biodiversesubsaline)andIX(sedge)were 2:: 100.Only typeXVI wetlands (species-pooracidichypersaline)
3>
Wetland type
>>....-................
(d)14
::12';;
..10~ 8<:>
<: 6"6ll
~ 4'0 2"I- O-+--.......,............~.......,...-L....L.,,...........,.-...,..
Figure9 Frequencyofoccurrenceofsingletonsinwetlands.(a)invertebrates,(b)plants,(c)percentageofallplantorinvertebratesingletonsineachwetland type,(d)averagepercentagesingletonsintheplantorinvertebratespecieslistatwetlandsofeachtype.Invertebrates,solidbars;plantsopenbars.
356 S.A.Halse,M. N.Lyons,A.M. Pinder,R.J.Shiel
BiodiversitypatternsandsurrogatetaxaMany approachestoreservation,basedon
mapping plantassociationsorenvironmentalsurrogatesofbiodiversity,implicitlyassumethatthedifferenttaxonomicelementsofbiologicalcommunitiesrespondinthesamewaytothesameenvironmentalparametersand,thus,aresimilarlydistributed(seeMargules andPressey, 2000).Recentwork,includingtheWBS, hasshownthisisnottrueatthescaleofawetlandorterrestrialsite(McKenzieetal.,2000;Davisetal.,2001;Fleishmanetal.,2002).Inpart,thisistheresultofvariousorganismsbeingdistributedatdifferentscales.Most manageable conservationunits(suchasawetland andassociatedvegetation)arecomposedofmosaicsofmicrohabitats,withthedistributionofthe biota being controlled within thesemicrohabitats. For example,therelationshipbetweenwetland salinityandinvertebratesisdifferentfromthatbetweenwetland salinityandplants,evenformembers ofthesameassemblage(Table3),becausemost plantsgrowonthebankratherthaninthewater column.Wetland salinityvaluesareoftenpoorlycorrelatedwithsoilsalinityonthebankand,infact,thereisconsiderable
weredepauperate(averageof23species).However,somewetlandtypes(e.g.Xsecondarilysaline)weredominatedbywidespread speciesandtheirirreplaceabilityataregionalscaleislow(seePressey etal., 1994).Protectionofindividualwetlandscontainingwidespread speciesisusuallynotcriticaltomaintainingtheregionalspeciespoolbutmay beveryimportantformaintenance oftheoverallpopulationsofsomewaterbird species(Halseetal.,1995andreferencestherein).
Themostcommonlyoccurringassemblageswere5(widespread,freshtosubsaline),8(freshtoweakly saline,mostly southcoast) and13(secondarilysaline),whichaccountedforabouthalfthespeciesrecords(Table2).Theabundanceoftwosalt-tolerantfreshwaterassemblagesreflectsthegreaterrichnessofthefreshwaterbiota,comparedwith thatofhighlysalinesystems,andtheimportanceofsalttoleranceifspeciesaretooccurcommonly.Itshouldbeemphasized,however,thattherelativefrequencyofdifferentassemblages,asperceivedbysurveyanalysis,waspartlyareflectionofsamplingdesign.An attemptwas made tosamplethefullrangeofnaturalwetland typesinthesurveyedarea(seeLyonsetal.,2004;Pinderetal.,2004)butnotnecessarilyinproportiontotheirabundance.Forexample,assemblage21 (granitespecialists)comprised1%ofspeciesrecords.Theassemblagewas more-or-less restrictedtograniteoutcroppools,which represented5% ofthewetlands sampled.Itsfrequencyofoccurrencewould haveincreasedifmore granitepoolshadbeensampled.
".'
••
•··
•
....
,.
'.KargoOfl!€
1nvertebratesOf !;mqlf>IOlY&ateach
PlantsNumberofslr'lg'etonsateachsite
~
.>5
•
:
,
.•...•
.,.• c ~
~~ ~~ ~ ~~
Albar:y
.,
\er ~ •
1 •..
~
\
f~
~~
1•. •~
'01 '.\. .~ ..\
\
\,
\r\.
(""",Idlon.\\
':- .~ .\.
Geraldtor. '\,
Figure10 Distributionofsingletonspeciesatwetlandssurveyedinthewheatbelt.

Aquatic biodiversity
variation in soil salinity on the b,mk allording tosmall-slale topographiGll variation (Lvons t't ai,2(04). The ability of waterbirds to move betweenwetlands means their distribution may not be fullydetermined by the charalteristils of the wetland atwhich they were recorded. Thev mav feed at aproductive saline microhabitat, flv to a freshwaterseep in another wetland to drink and roost insuitable microhabitat of a third wetland (Norman,1983; see also Roshier et al., 2(01).The varied responses of different taxa to their
environment means that it is rare for one group oforganisms to be an effilient surrogate for theOlcurrence of others at a site and, ideallv, reserveselection should be based on survevs of all the biota(see Gaston, 2(00). This was prevented bv logisticalconstraints in the WBS, as is always likely to Ollurin broad-scale surveys. Nevertheless, the necessityof procedures for reserve (or in this case BRC)selection being explicitly based on a range of taxawas recognized and we surveyed aquaticinvertebrates, waterbirds and plants. Theseelements operate at different spatial sca havedifferent life histories and represent both thewaterbody and its surroundings. In terms ofconservation and public interest, the riparian zone(or immediate surroundings of a vvetland) is asimportant a habitat as the waterbodv itself. Theprotection of terrestrial fauna species, includingfrogs, using the riparian zone was addressed in theWBS by McKenzie et al. (2004).
Reliability of survey patternsOne of the most significant issues with respect to
the WBS is how well single surveys characterisedwetlands and, therefore, whether the wetland typesand species assemblages identified in this paperreally reflect patterns of the wheatbelt and southcoast. Reliability issues fall into two classes: (1) howwell sampling reflected instantaneous communitypatterns, and (2) whether temporal variation inclimate is likely to have affected patterns obtained.We use the term 'instantaneous' principally to referto community composition during the season ofsampling, although our testing of the invertebrateprotocol also examined how well communitycomposition at the actual time of sampling wasdocumented.Halse et al (2002) examined the adequaly of
invertebrate WBS sampling and analyticaltechniques to document patterns of instantaneousinvertebrate communities. Thev were able todiscriminate between communities of five basinwetlands along a salinity gradient. Given the staticnature of vaslular plants and the considerablesurvey effort used, it is likely that instantaneouscommunity patterns of plants were also sufficientlywell documented to characterise a wetland (Lyonset ai, 2(04), although some species of submerged
357
plants found in fresh water at the end of summer,some late-flowering herbs around claypans andRlIppia spp. (identification difficulties) were under-represented in the dataset. We undertook furtheranalysis of some of Cale et al.'s (2004) waterbirdand wetland data to show that, although waterbirdsare highly mobile, instantaneous composition ofwaterbird communities can be characterised wellenough by single surveys during spring, such asused in the WBS, to distinguish broad categories ofwetland (Figure 11; see also Halse et aI., 2000a).Large temporal fluctuations in wetland depth and
salinity (both increases and decreases) sometimescause substantial shifts in wetland communities. Forexample, the waterbird community at Lake Logue(SPM002) showed substantial differences betweenthe dry year of 1997 when the lake was 0.36 m deepin spring and the wet years of 1999 and 2000 whenit was ca 3 m (Figure 11, Table 6). On the otherhand, Halse et al (2000b) found the relationshipbetween sites based on invertebrate samplesremained constant across annual rainfall events inthe southern Carnarvon Basin, and invertebrate andwaterbird data collected in south-west WesternAustralia according to WBS protocols have shown aconsistent relationship between wetlands acrossyears when wet land conditions have been similar(Cale et aI., 2004; Figure 11). Similar results arelikely for plants, with extreme flooding and verylow water levels affecting communitiessubstantially, but the communities remaining stableat intermediate water depths, except for minorrainfall-induced variation in the speciescomposition of annual plants. Even annuals haveadaptations to recruit at varying elevationsdepending on water depth in a given season, sothat overall plant composition is relativelyindependent of the degree of flooding. The WBSplant sampling was designed to capture all zones ofrecruitment and minimise the effect of year onsurvey results (Lyons et al., 2(04).Given that the northern wetlands were flooded
beyond their usual boundaries and were less salinethan usual when sampled in 1999, while wetlandssurveyed in 1997 and 1998 in central and southernareas were experiencing dry, saline conditions (seeFigure 2), it is possible that some long-termrelationships between wetlands of the wheatbeltand south coast were obscured by rainfall patternsduring the WBS by the kind of responses observedat Lake Logue (Figure 11). Extensive rainfallthroughout the northern parts of Western Australiain 1999, at the same time as the northern wheatbeltwas flooded, also allowed some tropicalinvertebrates to extend their ranges southwards tothe wheatbelt (see Pinder et ai, 2004a). Somewaterbird species (e.g. Hima/ltoplls hima/ltopus)made the reciprocal movements and more-or-lessdisappeared from the wheatbelt (S.A, Halse and

358 S. A. Halse, M. N. Lyons, A. M. Finder, R. J. Shiel
0.5 * *<>*
0OA + • •• + Bryde wet0.0 ... <> Bryde++ <> Bryde dry• Logue wet
-0.5 A.0 Logue dry+ Towerinning
OA A CoyrecupA Coyrecup dry
-1.0 * Wheatfield0 Noobijup• Bennett's wet0 Bennett's dry
Coomelberrup dry
Figure 11 Ordination of waterbird communities at a series of wetlands surveyed in spring of different years (see Caleet al. 2004 for survey methods and Table 6 for information on wetland depths and salinities). Stress = 0.18.
G.B. Pearson unpublished data). Nevertheless,conditions at most northern wetlands in 1999 wereprobably not extreme enough to have had majorimpact on community characterisation and wesuggest most of the WBS patterns are reliable.
Potential Recovery WetlandsOne of the major objectives of the WBS was to
identify wetlands that might form parts of BRCs.The approach we adopted to identify PRWs issimilar to that used by McKenzie et al. (1989, 2000)to identify conservation reserve requirements ofterrestrial systems in the Nullarbor and southernCarnarvon Basin regions of Western Australia. Theymodelled the occurrence of each assemblage in theregion of interest to provide the basis for selectingconservation areas in parts of the region that hadnot been surveyed. However, wetland assemblagesare often poorly predicted by models (see Table 4)and only amenable to mapping as species richnessisoclines when the assemblage is almost ubiquitous(see Figures LH'». McKenzie et al. (2000) attemptedto overcome these difficulties by basingconservation recommendations in the southernCarnarvon Basin on a wetland classification ratherthan on assemblages.
-------
In the WBS, species assemblages were adopted asthe units on which conservation measures would bebased but a combination of modelling, fidelityanalysis of species assemblages to wetland types,proportion of assemblages at species-rich sites andassemblage mapping have been used to form thebasis for recommendations about conservation ofassemblages and the wheatbelt biota. Summaries foreach assemblage in terms of types of wetlands andareas where the assemblage is best represented,need for conservation, and the proportion of thewhole assemblage likely to occur at anyone site,are presented in Table 5. Where there is a need forconservation, we have suggested 1-3 surveyedwetlands or complexes that might be protected toconserve the assemblage. These PRWs should beregarded as indicative of the kinds of wetlands inneed of protection; in many cases further surveymay reveal wetlands supporting a higherproportion of the relevant assemblage. The notionalpercentage of each assemblage that wouldconserved by protecting the 19 PRWs, in additionto existing BRCs, in an otherwise salinisedlandscape varied between 42 and 100% (Table 5).This represents 72% of the waterbirds recordedduring the WBS, 59% of the aquatic invertebrates

Aquatic biodiversity 359
Table 5 Suggested focus for conservation of the various wheatbelt and south coast species assemblages. Preferredwetland types, part of the surveyed area where assemblage most common, sensitivity to salinisation, potentialrecovery wet lands (PRWs) and the maximum proportion of the assemblage present at individual wetlandsare listed. The proportion of each assemblage that would be conserved (PC) by protecting the PWRs andexisting Natural Diversity Recoverv Catchments from salinisation is also shown.
Assemblage Comments PC
Type I and VIII wetlands, mostly ll1. south-eastern wheatbelt and south coast with restricted 0.67occurrence, sensitive to salinisation, extends beyond wheatbelt, PRW Lake Cronin,proportion of assemblage at individual sites >0.5
2 Types I, II, III, IV, V, VI wetlands and rivers, Widespread occurrence, some tolerance of 0.42salinisation, no special conservation requirement, proportion of assemblage at individualsites <0.3
3 Types IV, XI and XII rivers and wet lands, mostly on south coast with restricted occurrence, 0.44some tolerance of salinlsation, PRW Lake Warden BRC, Oldfield River, proportion ofassemblage at individual sites <0.3
4 Type VI rivers, mostly in wandoo woodland east of Perth, sensitive to salinisation, PRW 0.47Jimperding Brook, proportion of assemblage at individual sites <0.3
5 All fresh or sub-saline wetland and river types, Widespread occurrence, sensitive to 0.97salinisation, no special habitat requirement, proportion of assemblage at individual sites >0.5
6 All wetland types except some very fresh and some hypersaline ones, widespread occurrence, 1.0tolerant of salinisation, no special habitat requirement, proportion of assemblage atindividual sites >0.5
7 A plant-dominated assemblage, most of which arc weeds, no special habitat requirement 0.878 Most fresh or sub-saline wetland and rIver types, mostly on south coast and higher rainfall 0.81
parts of wheatbelt, sensitive to salinisation, no special habitat requirement, proportion ofassemblage at individual sites <0.3
9 Types IV, XI and XII rivers and wetlands, mostly on south coast, moderately restricted 0.97occurrence, some tolerance of salinisation, PRW Lake Warden BRC, Oldfield River, proportionof assemblage at individual sites 0.3-D.5
10 Types XIII and XIV wetlands, mostly in eastern wheatbelt, some tolerance of salinisation, PRW 0.64Isthmus Lake, Lake Altham, Kondinin Samphire Marsh, proportion of assemblage atindividual sites <0.3
11 Type XV wetlands, in north-eastern wheatbelt, sensitive to salinisation, PRW Lake Moore, 0.80Weelhamby Lake, proportion of assemblage at individual sites 0.3-D.5
12 Stronger affinity to northern and eastern wheatbelt than to wetland type, probably sensitive 0.48to salinisation, no special conservation requirement other than wetland in north-easternwheatbelt (PRW Wannara Claypan), proportion of assemblage at individual sites <0.3
13 Type X and other saline/hypersaline wet lands, Widespread occurrence, tolerant of salinisation, 0.91no special habitat requirement, proportion of assemblage at individual sites 0.3-D.5
14 Type XV wetlands, mostly in north-eastern wheatbelt, sensitive to salinisation, PRW 0.97Buntine-Marchagee BRC, Weelhamby Lake, proportion of assemblage at individual sites >0.5
16 Types VII and IX wetlands, mostly south-east of wheatbelt, sensitive to salinisation, PRW 0.73Youlabup Swamp, Ngopitchup Swamp), proportion of assemblage at individual sites <0.3
17 Type IX wetlands, western edge of wheatbelt, sensitive to salinisation, PRW Nalyerin Lake, 0.93Lake Muir BRC, proportion of assemblage at individual sites <0.3
18 Type IX wetlands, south-western edge of wheatbelt, sensitive to salinisation, PRW Lake 0.95Muir BRC, Nalyerin Lake, proportion of assemblage at individual sites 0.3-D.5
20 Types VII and VIII wetlands, patchy occurrence throughout wheatbelt, sensitive to salinisation, 0.82PRW Punjerwerry Claypan, proportion of assemblage at individual sites 0.3-D.5
21 Type VII wetlands, granite rock outcrops in eastern wheatbelt, protected from salinisation, PRW 0.66Wannara Rock, Dunn Rock, proportion of assemblage at individual sites 0.3-D.5
and 55% of the plants based on single surveys.When additional data from some PRWs and BRCSthat had been sampled on multiple occasions wereincluded in the analysis, 93% of waterbirds weresometimes found in the protected wetlands (seeCall.' et aI., 2004).The above two estimates of waterbird protection
afforded by PRWs demonstrate that levels ofprotection estimated in Table 5 need qualification.Firstly, on the positive side, some assemblages areunlikely to be threatened by salinisation. This ismost obviously true for assemblages 6 and 21. Theformer consists of Widespread salt-tolerant speciesthat occur everywhere, including salinised
360
Table 6 October depth Zind sallnltv (electricalconductivitv) 111 different vears at eightwet lands in the Wheatbelt where waterbirdcommunities were monitored (Call' ct al. 2004).
Year Depth Salinity(m) (mS cm'!)
Lake Bryde 1997 1.74 25401999 0.05 537002001 0.48 9510
Bennett's Lake 1998 0.6 18652000 2.43 38102001 2.95 2770
Lake Coomelberrup 1998 03 328002000 N/A 913002002 0.05 160900
Lake Coyrecup 1997 0.9 561001999 1.09 568002001 0.35 125000
Lake Logue 1997 0.36 120401999 3.65 19292000 2.52 33902002 0.28 35700
Noobijup Swamp 1998 0.7 38002000 N/A 38102002 0.8 5700
Lake Towerinning 1997 3.19 90601999 3.34 93002001 2.37 16880
Lake Wheat field 1997 2.0 109001999 2.5 90102001 1.92 9080
wetlands, and it was the only assemblage fullyprotected by the suggested 19 PRWs. Assemblage21 is the least salt-tolerant assemblage but occurs ina habitat (granite rock outcrops) that will notbecome salinised (Pinder et ai, 2000).Secondly, BRCs will nearly always contain a
greater array of wetlands than we have sampledand, consequently, will support a greaterproportion of some assemblages than the PRWswith which they are associated. For example, theLake Muir BRC contains ca 100 wetlands, of whichwe sampled three. Twenty-seven Muir wetlandswere sampled two or three times each in 1996-97and yielded 488 invertebrate species (A.W. Storey,R.J. Shiel and S.A. Halse unpublished data)compared with 228 from the WBS sampling.Similarly, the Lake Bryde and Buntine-MarchageeRecovery Catchments support some freshwaterwetlands we did not sample, as well as a largenumber of small salt pans in braided palaeo-channels, and are likely to support more speciesthan WBS data suggest. In addition to extrawetlands providing different habitat and extraspecies, annual variation in wetland conditionsusually causes the long-term species list of awetland to be greater than instantaneous lists (e.g.Halse et al, 1993b; Timms, 1998). Provided sourcesof colonization exist, or propagules remain at the
---------
S. A. Halse, M. N. Lyons, A. M. Pinder, R. J. Shiel
wetland, PRWs may help achieve conservi1tion ofmore pli1nt i1nd invertebri1te species than theani1lyses herein suggest.A third, somewhat negative, consideration is the
achievability of complete protection in recoverycatchments. Some PRWs are likely to becomedegraded despite attempts to control salinity(Clarke et ai, 2002) and assemblage membersrelying on these wetlands may be lost (Haise et ai,2003). However, the figures presented here onfuture protection of the biota relate only to thesurveyed area and many species deemed to be atrisk i1lso occur in regions without a salinity threat.For example, the blue-billed duck OXYllra allstralisoccurs on the Swan Coastal Plain (as well as ineastern Australia), the copepod Calamoecia attCll11ataand mayfly Tasmallocoellis tilyardi are widespreadthrough southern Western Australia, the sedgeBaumea articulata is widespread in coastalfreshwater wetlands across southern Australia, andthe chenopod Tecticornia verrucosa grows whereversuitable habitat occurs throughout WesternAustralia. Loss of these species from the wheatbeltwill not cause extinction.
Rare speciesOur analysis of the level of protection afforded to
the aquatic biota by PRWs ignores singleton species,which comprised 34% of the biota. While somesingletons have considerable conservationsignificance, many are not localised, rare species.The occurrence of many singletons on the edge ofthe surveyed area (Figure 10) suggests theirapparent rarity is a sampling artefact. The steeprainfall gradients to the west and south of the studyarea cause considerable turnover in the biota overshort distances (Hopper, 1979), which can beexpected to lead to frequent occurrence ofsingletons in surveys. The invertebrate singletons inthe northern wheatbelt were mostly tropical speciesthat had extended south in a wet year (Pinder et al.,2004).Even within the main body of the study area,
where the highest proportion of singletonsrequiring special conservation focus would beexpected to occur, most singeletons do not warrantprotection. Many plant singletons were species thatoccurred commonly at higher elevations interrestrial habitats around wetlands. Only 5% werePriority Taxa (see Coates and Atkins, 2001) that,along with the single Specially Protected waterbird(Botaurlls poiciloptilllS), will require specialconservation focus. Some of the 20% of singletoninvertebrates that were new species or appeared tobe localised (Pinder et al., 2004a) will also requireconservation focus, although many are likely to befound more widely after further survey.Many of the rare plants, and some rare
invertebrates, occurred in naturally saline wetlands.
Aquaticbiodiversity 361
r('glll1t'Sin
Australia:
11.;11'111
COllllllandl'r,D.l),litil'ld.I.K.Thorpe.PAL.Dalie,R.E.,
Bird, I.R,andTurner,I,V.(1994)Chlurinl'-.16 and
Cclrbon-14 llleasurenwnts on hl'fwrs'llitll'
g1'0undw ateI' in [vI·tia1'1' p,lleoch,1nneI.s Iwar
Western Australia.I)wll'ssior\all\l\,erS
5.1·60, otWl'stern ;\ustralia,Perth,
lkard.1.5.(1990)./'111111 o!\V,'.;lcrll/\II.;lmllll.Kdngaroo
Press,Svdnev.
Beard,IS(1999).Evolution01thcriversvstemsoftIll'south-wcstdrainagedivision,Western Australia
IOllllllllolllic(,;ol/ol 01\Vc.;lcrll/\II.;lm{lo82:1,+7
164.
BC'lI'd.1.5.Ch,lpman,I\.R.,mdCioia,['.(2()()O).SpeciesrichnessandendemisminthcWestern Australian
flora.10111'1101IIIBioxcoxmplll/27:1257-126x.
[klbin.L.(1991).Semi-stronghvbridscaling:,1 ncw
ordinationalgorithm.IOllrJlIII01 S"iclI"c2:
491-496.
Belbin,L.(1993)./'11IN:pllllcm1IIIIIIy.;i.; CSlRO,
Canberra.
Biological SurvcvCommittec. (19x4).Thcbiological
survcvoftheEasternColdficldsofWestern Austra[ia.
Part I.Introductionandmethods. I';ccol'd.;01Illc
\Vc.;lcrllIIw;11'II1i1l;\;II1';CIIIIISlIpp{clIICl/l18:1-19.
Blinn, D.W" Halse, S,A" Pinder,A,M,. Shic[.R.I, and
McRae, I,M.(20(H).Diatom andzooplankton
communitiesandenvironmentaldeterminantsinthe
Wcslcrn Australian wheatbelt: a rcsponseto
secundarvsalinisation.III/dro[lIoloXIII528:229·24x,
Boesch, D.F, (1977). Application of numcrical
classificationinecologicllinvestigationsofwater
pollution, EPA-600/.1-77-0.13, United States
EnvironmentalProtectionAgencv,Washington D.e.
Bowler, I.M,(19x3),Lunettesasindicesofhydrologic
change:AreviewofAustralianevidence,Proceedillg.;
ollheRoyalSocielyot'Victoria95:]47-68.
Brock, M.A, andLane,I,A,K,(19x.1).Theaquatic
macrophyte floraofsalinewetlands inWestern
Australia inrelationtosalinityandpermanence,
Ilydrohioloxia105:6.1-76,
Brock, M,A, andShiel,RJ(19:-:.1),Thecompositionof
aquaticcommunitiesinsalinewaters in\Nestern
Australia,Ifydrohio!ogia105:77-:-:4,
Cale,DJ,Halse,S.A.andWalker, CD.(20lB),Wetland
IllonitoringintheWheatbelt ofsouth-westWestern
Australia: sitedescriptions.waterbird, aquatic
invertebrateandgroundwaterdata.COII.;er('alioll
SciellceWc.;lcl'II A11';I1'111ia5:20-·B5,
CLuke,CLCeorge, R,I" Bell, R.W. andJlatton,TJ
(2002),Drvland salinityinsouth-westernAustralia:
itsorigins,remedies,andfuture'researchdil'l'ctions,
AII,ll'II/lIlIlII'lIl'IIo! o ~ e n 40:en-I1.1,
Coates,DJandAtkins,K.A,(2001),Prioritvsl'lting,1Ild
theconSl'l'\'ationofWestern Australia'sdiverseand
highlvendemicflora, C'II-;C['('IIIIOII97:251
263.
Cranwr,\ A ,md 1lobbs, RI. (2002).LcologiCill
cOllseqlll'nCl'sot,1Itere'dhvdrologiLal
tragmentedecos\'stl'msinsoutlwrn
and m,magellll'nt ~ ""-
27:5,16-564.
1\1\i.;.I.A"llals..,S.A.,mdhOl'IlL!, ~ (2001),l.aLtors
Austin. :vU)dnd[klbill.1 .(]9:-:2).Anewa[JprodchtothespeciescLlSsiticdtionproblcmsinfloristic,1I1,)I\SIS
11'11'1111111110111'11011'1 7:75-:-:9.
I.I\.E.(1999).1';1,,,A:ologc.;.luartllouse.Perth.
REFERENCES
ACKNOWLEDGEMENTS
Anonvmous. (1996a). 11 .;illlOlullI.,IIIIl'IIII'1I1
\Vc.;ICrJl/11I.;ll'IIlill.CovernmentotWestern Australia,
Perth.
Anonvmous. (1996b).\Vc.;lcrll1111.;1I'IIlillll';01111111/ollillll
1'1011.C;overnmentot\VesternAustralia.Perth.
;\tmeH.Wand Patlerson,BD.(199.1).TIll'medsure of
ordl'l',mddisordl'l'inthedistributionotspeciesIII
fragmenll'dhdbit,lt.( 96:.17.1.1:-:2
Atlllar. W. dnd[)dtll'I'son,B.D. (1995).fill'1I1',lc,{lIl'';,
11'IIII'CI'IIIIII'C"0"'111111,'1':II('1'11111/>il'llpl'l'gl'llIlI,
2lJ.j 1IIIIII'uc,. A[C5 ResceHch [nc,
We wish tothankM.R. Williams forstatistical
advice,P. Goia forclimaticdatafromthe
ANUCUM model, andJ.c.CockingandJ.M.
McRae forproducingthefigures.Fundingforthis
studvwas providedaspartoftheStateSalinitvStrategy.
Integratingwetlandanduplandprotection
This paper has focussed on protectingbiodiversityassociatedwith wetlands which,
becausetheyarclowinthelandscape,arc
disproportionatelythreatenedbysalinisation(Halseet11/., 2(03). However, protectionofuplandbiodiversityisequallyimportantandBRCscannot
beselectedonwetlandvaluesalone.Resultsfrom
terrestrialcomponentsoftheWBS (McKenzieeta/.,2004)shouldbecombinedwithrecommendations
aboutPRWs(Table5)andspecies-richexamplesof
theidentifiedwetland types(Figure7)toidentify
catchmentsof50,000-]()O,OOOhawith particularly
highbiodiversityvalue.Irreplaceabilityanalysisis
onemethod ofcombiningdatasetsofdisparate
biodiversityvaluesandWalshe et11/.(2004)haveusedthesurveydatatoidentifypotentialSRCsthat
encompassmuch ofthebiodiversityofthe
wheatbelt andsouthcoastandprovidethe
frameworkforlandscape-scaleconservationefforts.
Inmost G1SeS, whetheronprivateorpublicland,
thesewetlands were threatenedwith increasedinundationbecause of salinisation. When
salinisationistheprincipalthreat,rarespecies
usuallycannotbeprotectedthroughsmall-scalemanagenwnt actionsaimedattheorganismsand
theirimmediatehabitat(seeCoatesandAtkins,
2(01).Catchment-scalesolutions(C1arkeclal.2(02)
orveryexpensivelocalisedengineeringworks(FroendetaI.,1997)arcrequired.

362
influt'ncingbiodiversityincoastalplainwt'tlands of
southwesternAustralia. IIIB. Gopa!' W.J. JunkandJ.A.Davis (t'dsJ, III(('et/lll1ds:IIssessII/e11I.
lilllcllollIIl1dcollscrullllolI:89-100.Backhuys,Leiden.
Diels. L. (1906).Die UOII e ~ us r e
,;udllchde,;Wellderkrel,;es. Engelmann.Leipzig.
Dogramaci, S.,George, R., Mauger, G andRuprecht, J.
(2003). Waler /Jillallcealld sallllllyIrelld. TooJi/JIII
calchll/elll. Weslerll Au,;lralla. Department ofConservationandLandManagement, Perth.
Doupe, R.G. and Horwitz, 1'. (1995).The valueof
macroinvertebrate assemblagesfordetermining
prioritiesinwetland rehabilitation:acasestudyfromLakeToolibin,Western Australia. jourJIlIlofIheRoyalSoclelyofWeslerJI Au,;lralia78:33-38.
Fleishman,E., Betrus, CJ., Blair, RB., MacNally, R. and
Murphy, 0.0. (2002).Nestedness analysisandconservationplanning: theimportanceofplace,
environment,andlifehistoryacrosstaxonomicgroups.Oecologlll133:78-89.
Frey, D.G. (1991).The speciesofPleuro.lus andthree
relatedgenera(Anomopda,Chydoridae)insouthern
Australia andNew Zealand. RecordsoflheAuslrallallMuseul1l 43:291-372.
Froend, IU-I.,Halse, S.A. andStorey, A.W. (1997).
PlanningfortherecoveryofLakeToolibin,Western
Australia.Wellalld,; EcologyalldMallagel1lelll 5:73-85.
Froend,R.H., Heddle, E.M.,Bell,0.1'.andMcComb, AJ.
(1987).Effects ofsalinityandwaterlogging onthe
vegetationofToolibin Lake, Western Australia.AuslralialljourJIalofEcology12:281-298.
Froend,RlI.andMcComb, AJ.(1991).Anaccountofthe
declineofLakeTowerrinning, awheatbelt wetland.
JournalofIheRoyalSocletl/ofWeslerJI Auslralia73:123-8.
Froend,R.H.andvandel'Moeze!, P.G.(1994)Theimpact
of prolonged flooding on thevegetation of
CoomalbidgupSwamp,Western Australia. jourJIalofIheRoyalSoclL'lyofWeslerJI Au,;lralia77:15-22.
Gaston,K.J.(2000).Globalpatternsinbiodiversity.Nalure405:220-227.
Geddes, M.C, De Deckker, 1'.,Williams, W.D., Morton,
D.W. andTopping,M. (198I).On thechemistryandbiotaofsomesalinelakesinWestern Australia.Hydro/Jlologll/82:20I-222.
Gentilli, J.(1972)Auslrallall clll1Ialepal/erns. Nelson,Melbourne.
George, R.J., Clarke, CJ. andHatton, T.J. (2002).
Computer modelled groundwater responsetorechargemanagement fordrylandsalinitycontrolin
Western Australia. Ad1'allces III Ell1'lrolll1lelllalMOllllorlllg alldA10delilllg2:3-35.
Ceorge. I\.J.,McFarlane, DJandSpeed,RJ. (1995).The
consequencesofachanginghydrologicenvironmentfornativevegetationinsouthwesternAustralia. III
D.A Saunders,J.L.Craig andE.M. Mattiske (eds).NalurecollscrUllllolI4:IheroleoflIelworks:9-22.SurreyBeatty&Sons,Sydney.
Cibson, N., Keighery, GJ., Lyons, M.N. andWebb, A.(2004).Terrt'strialfloraandvegetationoftheWestern
Australianwheatbelt. I\ecor,(sofIheWeslem AuslralialllviuseUlI1Supplelllelll67:139-189.
7 _
S.A.Halse,M. N.Lyons,A. M. Pinder,R J.Shiel
Halse, S.A.(1981).Faunalassemblagt'sofsomesaline
lakes near Marchagee, Western Australia./\uslrallllllJournlllofA11/rllleIllldFresllil'lllerResellrdl32:133-142.
lIaIse,S.A.(2002).Diversity ofOstracoda (Crustacea)in
inlandwaters ofWestern Australia. VcrhalldlulIgellIlIlerllallollllle VerellllgulIg fur Iheorelische ulld
allgczl'lllldleLilllllologle28:9I4-918.
Halse,S.A.,Call',D.J.,Jasinska,E.J.andShie!,R.J.(2002).Monitoring change in aquatic invt'rtebrate
biodiversity:samplesizt',faunalelementsand
analyticalmethods. AquallcEcology36:395-410.
Halse, S.A.,McRae, J.M.(2001).Calal1loecla Iri/o/JI/lansp
(Copepoda:Calanoida) fromsaltlakesinsou ~
westt'rn Australia. JoumlllofIheROl/al SocietyofWeslem Au,;lralia84:5-1I.
liaIse,S.A., Pearson, C.B., McRae, J.M.andShiel,R.J.
(2000a).Monitoring aquaticinvertebratesand
waterbirds atToolibin andWalbyring Lakes intheWt'stern Australian wheatbelt. joumalofIheRoyal
SoclelyofWeslerJI Auslralill83:17-28.
Halse, S.A., Pearson, C.B. and I'atrick,S. (1993a)
Vegetation of p ~ u e wetlands innaturereservesofsou ~wes Western Australia. Technical
Report 30.Department ofConservation andLandManagement, Perth.
Halse, S.A.,Pearson,GB., Vervest, R.M.andYung, F.H.
(1995).Annual waterfowl countsinsou ~wes
Western Australia 1991/92.CALMSclellce2:1-24.
Halse, S.A., l\uprecht,J.K.andI'inder,A.M. (2003).
Salinisationandprospectsforbiodiversityinriversandwetlands of sou ~wes Western Australia.
AuslralilllljourJIlIlofHolalll/51:673-688.
Halse, S.A., Shiel, R.J., Storey, AW., Edward, D.H.D.,
Lansbury, I.,Cale, D.J. andHarvey, MS. (2000b).
Aquaticinvertebratesandwaterbirdsofwetlandsand
riversofthesouthernCarnarvon Basin, Western
Australia. Records ofIheWeslem Auslralillll Museul1lSupplell/elll61:217-267.
Halse, S.A., Williams, M.R., Jaensch,R.I'. andLane,
J.A.K.(1993b).Wetland characteristicsandwaterbird
useofwetlands insou ~wes ern Australia. WildliFeResearch20:103-126.
Hammer, U.T. (1986).Salillelakeecosl/slell/sofIheworld.Junk,Dordrecht.
Harper, RJ.andCilkes,R.J.(2003).Aeolianinfluenceson
thesoilsandlandformsofthesouthernYigarnCratonofsem ~ r southwesternAustralia. Geol1lorphology59:215-235.
Hart, B.T., Bailey, P.,Edwards, R., Hortle, K., James,K.,
McMahon, A., Meredith, C andSwadling,K. (1991).
A reviewofthesaltsensitivityoftheAustralianfreshwaterbiota.Hydro/Jlologla210:105-44.
Hingston, F.J. andGailitis, V. (1976).The geographic
variationofsaltprecipitatedoverWestern Australia.Au,;lralillllJournalof5011Resellrch14:319-335.
Hopper, S.D.(1979).Biogeographical ratesofspeciationinthesouthwestAustralian flora.All/l/IIII l\e1'lewof
alld 10:399--422.
Hopper, S.D., Brown, A.I) andMarchant, N.G (1997).
PlantsofWestern Australiangraniteoutcrops.jourJIalofIheRoyal ofWes/ern A1I,;lralill80:141-158.

Aquaticbiodiversity 363
UJI1sl'l'vation planll1l1g;all
taunaspatialdistributiuns
etl/I";,'li',i1/011
C,rholil'ld, N.I., Ruprl'cht,IKandLoh, Le. ~~ fhl'
impattofagriculturaldl'vl'lopml'ntontill'salinitl·01
SUrfarl'wall'r l'l";'Jurrl'S01 south,wl'st\Vl'Sll'1'Il
/\ustralia. W5 27.Watl'r 01Wl'stern
l\ustra!i,l,Pl'rth.
5rotts,D.andDrielsm'l,\:1(201l.1)
Irame\\orkstor
tor
82F254.
5hl'phnd,D.I'., l\cestoll,(;.R.andIlol'kins,I\.I.M.
(21l1l1).Natl\l' \egdatiul1inWl'skrn Australia.
l'inder,I\.M.,lIaise,5.1\.,Mc!\,1l', I.M.and5hil'!,RI
(200'i).Influl'nn'otsalinitvonthl'occurrencl'of
whl'atbelt aqualicinvertebrates.lIydl'o/Jiologill(in
I'rl'ss).
Pindl'r,A.M., lIaise,S.A.,Shil'l, R.I., Cale, D.I. and
McRal', I.M.(2002).IJalophilicinvertl'bratesufsalinl'
wl'tlandsinthl'whl'atbl'ltofsouth-wl'stl'rnAustralIa.
,'1'/11/110/111/<.'1'1/del'1IIII'I'I/ll1lOIlllle
I'indl'r,A.M., Halsl', 5.1\.,Md\,ll', l.:vlandshil'l,R.J.
(2004).Aquatirinvl'rtl'bratl'assemblagl'sofwl'tlands
,llldriversinthewl1l'atlll'lt rl'giunotWl'stl'rn
I\UstLllia PI'IIIIt!,01lill'WI'''II'I'I/ 1I"lmllllll:\111."'1/111
67:7-37
N, \1Jtll'rnll'il'r,1\.A., \:1itll'rnwin,e.C,d a
hll1ll'S,l,CA.B. andKl'I1!.s, I (2000).Biodi\l'rsitv
ho!.sl'o!.slorUl\lSl'rvation I'rioritil's.,'JIIIIIII'403:S'i.1-
~
Nicholls,1\.0.(19S9).Ilowtom,lkJ'""""1-'.'"''surn'vsgo
turtlll'rwith isedIllll'armudl'!.s.
C'OIl"I'I('IIIIOII50:51··75.
Norman,1.1. ~ Cn'\'Tl'a!,Chl'stnutTI',ll,,1l1dPacific
Black Duck at,Is,llinehabitatinVittoria. EIIIII 83:
262270.
28: ~
Pindl'r,;\\:1,Halsc, 5.A.,shil'l,KI. and\:1cRae,I.M.
(2000).(;rallitcoutcroppuolsinsouth-westl'rn
Australia: focifordivnsificationandretugiafor
aqu,lticinvl'rkbratl's.jOlll'l/1I1of1111' 1\111/111 of
Wl'sll'lII AI/slmlill83:117-129.
l'n'ssl'v,R.L., lohnson,I.R.andWilson, P.D.(1994).
5hadl'sofirrl'placl'ability:towardsaml'asurl'ofthl'
contributionofsitestoarl'sl'rvationgoal./)111,117""'-'1,11/
COlIsel'mlioll3:242-262.
Rl'migio, LA., Hl'bl'rt, PD.N.andsavagl',A. (2001).
Phvlogenl'ticrelationshipsandrl'mark,lbll'radiation
inI'lImrll'lllill(Crustacl'a:Anostrara), thl'l'ndl'mic
brinl' shrimp of Australia: l'vidl'ncl' from
mitochondrialDNAsequl'ncl's. 10111'1/111ofI!II'
I.i,lll['i/II 74:59--71.
Roshil'r,D.A.,Robl'rtson,A.I,Kingsford,R.r.,1l1dGrl'en,D.G. (200I).Continl'nt,ll-scaleinkrilctionswith
temporaryresourcl'Smay l'xplainthl'paradoxuf
largepupulatiullsotdl'sl'rtwatl'rbirds inAustralid.
l.lIl1d'lll/1[' 16:547-556.
5alama,R.B. (199,+).Thl'l'\olutionofsalinl'lakl'silltill'
rl'lilitdrain,lgl'ot thl'Yilg,nn Rin'r, Weskrll
Austrdlid. III R. Rl'llaut ,1Ild W. last(l'ds),
IIl1d of1/I0dl'I'I/IIl1d111111"111
1'11111111111011 :i(}:IWJI99.
luls,l,Okldhoma.
(1967). lakrites,1l1dsoils111
suuthwestnnAustralia. IIII.N knllingsalldI.\.
Mabbutt ,llIdl'" 1I"lllllllllllld
C;IIIIII'II: 211·2.10.l\ustralIanNatiollal Universitv,
Callbl'rra.
\1.1.(I 5al1l1isat!oninthesouthwestut
Westl'rn Austr,llia.SI'i!/(!19:26972.
McKell/ie, N.I.,Belbin,L.,M'lrgules, CR.andK,'igherv,
C;·I· Selectingrepresentativeresel'\'esystems
inremotearea:acasestudyintheNullarborregion,
Western Australia. COlhelTllllll1I50:239,261.
\:lcKen/ie,N.L., Halsl',S.A.andC;ibson,N.(2000).Some
g,lpSinthereservesystemofthesouthernCarnarvon
Basin, Western Australia. I\ecordsofIltl'We"lcrn
AIISIIllIill11MliSI'llIII511ppIn11I'llI61:547-567.
McKell/il', N.!.,lohnston,R.B.,lndKendrick, I'C;.(Eds)
(1991) AII"lmlll1. surrevBeattv,
Svdnev.
i'vlcKen/ie,N.I. ,1IldRobinsun, I\e.(l'ds) ~ A
SIIITel/,,/Ill,'Nllllllr/,or SOIlIIt IIlId
ivV,'"I,'rll Irlllll/ III South l\ustr,llian
Departnll'ntotFnvironn1l'ntandI'ldnning,Adelaide.
\:kKen/ie,N.L.,C;ibson,N.,Keighel'\, dndRolfe,IK
(2004) 1',ltternsintheblodiversitvoftnrestridl
environnll'ntsintIll'Western Austr,llian Wlw,ltbelt.
/\"«1nl"ofIhetVe"IClIIAII"IIIIIIIIII ;\111'[1'11111
67:293-335,
1,H'nslh,R1',Vc'nes!,1\1\1.,1ndIkWISh,\:11 (I ~~
vV,lterbirdsurveysotwt'tL1l1d n,ltun'ITSl'rvesIn
south,westernI\ustrali,): ~ ~ Report 30.I\OV,11
Austr,llasianOrnithologistsUnion,\:klbuurne.
lustus,I.,1nllsarkar,S. (2002).Iheprincq,I,'ot
compkmentaritvinthe utreserlent'twurkstu
cunSl'r\'t'biudiversitv:,1 l,relimin,Hvhisturv.1011111111
,11BI'''II''1I1127:421-4.15.
K,n, W.R, Ilalsl"s.A.,scanlun,\:1.1).andSmith,\:11.
(20l1l).Distributionandel1\'irunmenLl1tulerdncesuf
aquaticma(TuinvertebrdtefamiliesintIll'agriniltur,ll
/uneofsuuthwl'sternAustralia. 1011111111 ofIltl'['Jorllt
AIIICllmllBOlllloloSlll11 20: ~
Keigl1l'rv, C (2001).Whl',ltbelt wonders underthreat.
011/1'11."101'<'16.1742.
1,1111',I.I\.K. ~ Importantaspl'ctsutduckhuntingin
Australia, with particuldrreterencetuWestern
l\ustrali,l.III1.1.Bunning (l'd.L of lite
<1/,'"1'0""1/11Oil /!inl"IIlIdIIll11l11Sl'llIelll,1011l11lIle"'lIlrs1983:
~1-307.Witwatersrdnd BirdClub,luhannesburg.
I.vuns,M.N., Cibsun,N., Keiglll'ry,Cl.andIvons,SD.
(20()4).The\vetlandfloraandvcgl'tationufthesuuth
wcst,lgricultural/uneofVVeskrn !\ustraliaPelord,
ofIlle 1I>llIIlllIiI:\/111,,'11111SUPI,!L'mcntNu67:
()(10-000
\:blv,E.J. andB'lvlv, I.A.E.(1991).F,lCtorsinfluencing
patternsufAustralasi,lll centropagid
cupepods.1011111111of 18:455-61.
tvlaly,E.I.,Halse,S.A.andMaly, M.I) (I Distribution
andincidencepatternsufBOl'lkcllll, C1I1111110e1'll1, and
f[ellllZ,ol'ckelll1(Cupepuda:Calanuida) inWestern
Australia.;\;1111'111eI1l1dFrcs/1Z1'I11C1[\I'''l'lIr1'1t48:615-621.
Margules, CR.andPressey,R.L. (2000).Reviewarticle:
systematicconservationplanning.Nalllre 405:243-')r-,..... ~ .
364
Technical Report 249. Department of Agriculture,Perth.
Short, P.S. (1982). Breeding systems and distributionpatterns of some arid Australian genera of thesubtribe Gnaphaliinae (Compositae:lnuleae). In WRBarker and PJM Greenslade (eds), El'olution of the j10raand fauna of arid Australia. Peacock Publications,Adelaide.
Short, Rand McConnell, C. (2001). Extent and impactsof dryland salinity. Resource Management TechnicalReport 202. Agriculture Western Australia, Perth.
Sneath, P.H.A. and Soka\, R.R. (1973). NumericalTaxonomy: the principles and practice of numericalclassification. Freeman, San Francisco.
StatSoft. (2001). Statistica system reference. StatSoft, Tulsa,Oklahoma.
Storey, A.W., Halse, S.A. and Shiel, RJ. (1993). Aquaticinvertebrate fauna of the Two Peoples Bay area,southwestern Australia. Journal of the Royal Society ofWestern Australia 76: 25-32.
Thackway, R. and Cresswell, LD. (eds) (1995). An InterimBiogeographic regitmalisation for Australia: a frameworkfi)/' esta/llishing the national system of reserl'es, l'ersion4.0. Australian Nature Conservation Agency,Canberra.
Thomsen, J.B. (1999). Looking for the hotspots. WorldConserl'atioll 2/99: 6-7.
S. A. HaIse, M. N. Lyons, A. M. Pinder, R. J. ShieI
Timms, B.V. (1998). Further studies on the saline lakes ofthe eastern Paroo, inland New South Wales,Australia. fhldrobiologia 381: 31-42.
Timms, B.V. (2002). The fairy shrimp genus BranchinellaSayee (Crustacea: Anostraca: Thamnocephalidae) inWestern Australia, including a description of fournew species. Hydrobiologia 486: 71-89.
Walshe, T.V., Halse, S.A., McKenzie, N. L. and Gibson,N. (2004). Toward identification of an efficient set ofconservation recovery catchments for WesternAustralian wheatbelt biodiversity. Records of theWestern Australian Museum SupplemCllt 67: 365-384.
Wardell-Johnson, G. and Horwitz, P. (1996). Conservingbiodiversity and the recognition of heterogeneity inancient landscapes: a case study from south-westernAustralia. Forest Ecology alld Management 85: 219-38.
Williams, W.D. (1999). Salinisation: a major threat towater resources in the arid and semi-arid regions ofthe world. Lakes (7' Reserl'oirs: Research and Management4: 85-91.
Williams, W.D., Taaffe, R.G. and Boulton, A.J. (1991).Longitudinal distribution of macroinvertebrates intwo rivers subject to salinisation. Hydrobiologia 210:151-60.
Wilson, P.G. (1984). Chenopodiaceae. III AS. George (ed),Flora of Australia, vof. 4. Phytolaccaceae toChellopodiaceae: 81-235. Austra Iian Governmen t,Canberra.
Wyrwoll, K.-It (1988). Time in the geomorphology ofWestern Australia. Progress ill Physical Geography 12:237-263.
Electronic appendices are on CD inside the back cover


![Adec Preview Generated museum.wa.gov.au/sites/default/files/SuppWAMuseum... · (Woylie) 128 14 3 4 2 2 (1) 6 Pseudomvs fieldi ( ~ Bay Mouse) 2 5 3 ]97 Rattus tunneyi (PaleField-rat)](https://img.pdfslide.us/doc/110x75/60c90e96573f6675ac321231/adec-preview-generated-woylie-128-14-3-4-2-2-1-6-pseudomvs-fieldi-bay-mouse.jpg)