Embed Size (px)
Citation preview
Addressing the Instability of DNANanostructures in Tissue Culture
The Harvard community has made thisarticle openly available. Please share howthis access benefits you. Your story matters
Citation Hahn, Jaeseung, Shelley F. J. Wickham, William M. Shih, andSteven D. Perrault. 2014. “Addressing the Instability of DNANanostructures in Tissue Culture.” ACS Nano 8 (9): 8765-8775.doi:10.1021/nn503513p. http://dx.doi.org/10.1021/nn503513p.
Published Version doi:10.1021/nn503513p
Citable link http://nrs.harvard.edu/urn-3:HUL.InstRepos:21462158
Terms of Use This article was downloaded from Harvard University’s DASHrepository, and is made available under the terms and conditionsapplicable to Other Posted Material, as set forth at http://nrs.harvard.edu/urn-3:HUL.InstRepos:dash.current.terms-of-use#LAA
HAHN ET AL. VOL. 8 ’ NO. 9 ’ 8765–8775 ’ 2014
www.acsnano.org
8765
August 19, 2014
C 2014 American Chemical Society
Addressing the Instability of DNANanostructures in Tissue CultureJaeseung Hahn,†,‡,§, ) Shelley F. J. Wickham,‡,§, ) William M. Shih,‡,§, ) and Steven D. Perrault‡,§, ),*
†Harvard�Massachusetts Institute of Technology (MIT) Division of Health Sciences and Technology, Massachusetts Institute of Technology, Cambridge,Massachusetts 02139, United States, ‡Department of Cancer Biology, Dana Farber Cancer Institute, Boston, Massachusetts 02115, United States, and §Wyss Institutefor Biologically Inspired Engineering and )Biological Chemistry and Molecular Pharmacology, Harvard Medical School, Boston, Massachusetts 02115, United States
DNA nanotechnology1 is a rapidlyprogressing field owing to theease of producing two- and three-
dimensional nanostructures through meth-ods such as DNA origami.2,3 DNA nanostruc-tures can be designed with virtually anyarbitrary geometry4,5 and to display sophis-ticated capabilities (e.g., mechanical,6 logic-gating7) unavailable to other nanoscalematerials. These can act as platforms forprecise spatial organization of functionalmolecular features such as fluorophores,8
biomolecules (e.g., aptamers,9 antibodies10),or synthetic nanomaterials11 (e.g., quantumdots) through coupling to an oligonucleotidethat is integrated into a nanostructure's de-sign. These unique advantages have provided
amplemotivation for nanomedicine research-ers to develop in vitro and in vivo biomedicalapplications for DNA nanotechnology. Recentstudies have demonstrated a long-circulatingvirus-inspired DNA nanodevice,12 a nanocali-per formediating cell ligand�receptor interac-tions,13 a computational molecular cascadefor cell surface receptor characterization,14 asynthetic membrane ion pore,15 an immune-activating programmable adjuvant,16 anda logic-gated nanorobot for therapeuticdelivery.17
In vitro tissue culture model systems arean obvious choice for prototyping newdiagnostic and therapeutic devices, includ-ing those based on DNA nanotechnology.The conditions used for tissue culture are
* Address correspondence [email protected].
Received for review February 7, 2014and accepted August 19, 2014.
Published online10.1021/nn503513p
ABSTRACT DNA nanotechnology is an advanced technique that could contribute
diagnostic, therapeutic, and biomedical research devices to nanomedicine. Although
such devices are often developed and demonstrated using in vitro tissue culture
models, these conditions may not be compatible with DNA nanostructure integrity
and function. The purpose of this study was to characterize the sensitivity of 3D DNA
nanostructures produced via the origami method to the in vitro tissue culture
environment and identify solutions to prevent loss of nanostructure integrity. We
examined whether the physiological cation concentrations of cell culture medium
and the nucleases present in fetal bovine serum (FBS) used as a medium supplement
result in denaturation and digestion, respectively. DNA nanostructure denaturation due to cation depletion was design- and time-dependent, with one of
four tested designs remaining intact after 24 h at 37 �C. Adjustment of medium by addition of MgSO4 prevented denaturation. Digestion of nanostructures
by FBS nucleases in Mg2þ-adjusted medium did not appear design-dependent and became significant within 24 h and when medium was supplemented
with greater than 5% FBS. We estimated that medium supplemented with 10% FBS contains greater than 256 U/L equivalent of DNase I activity in
digestion of DNA nanostructures. Heat inactivation at 75 �C and inclusion of actin protein in medium inactivated and inhibited nuclease activity,
respectively. We examined the impact of medium adjustments on cell growth, viability, and phenotype. Adjustment of Mg2þ to 6 mM did not appear to
have a detrimental impact on cells. Heat inactivation was found to be incompatible with in vitro tissue culture, whereas inclusion of actin had no observable
effect on growth and viability. In two in vitro assays, immune cell activation and nanoparticle endocytosis, we show that using conditions compatible with
cell phenotype and nanostructure integrity is critical for obtaining reliable experimental data. Our study thus describes considerations that are vital for
researchers undertaking in vitro tissue culture studies with DNA nanostructures and some potential solutions for ensuring that nanostructure integrity and
functions are maintained during experiments.
KEYWORDS: DNA nanotechnology . DNA origami . cells . in vitro . tissue culture . nuclease . stability . structural integrity . cation .nanorobot
ARTIC
LETerms of Use
HAHN ET AL. VOL. 8 ’ NO. 9 ’ 8765–8775 ’ 2014
www.acsnano.org
8766
typically determined by what has been empiricallyestablished as appropriate for the cells of interest. Formammalian cells, this means incubation at 37 �C in adefined cell culture medium, such as RPMI or DMEM,containing amino acids, glucose, and vitamins, and at aphysiological pH and concentration of ions. Maintain-ing cell growth and phenotype often requires suchmedium to be supplemented with 2�20% of mamma-lian serum (e.g., fetal bovine serum), which contributesessential but undefined factors. The compatibility ofthe in vitro tissue culture environment with DNAorigami nanostructures has not been systematicallytested but is of obvious importance for biomedicalapplications of these materials.The synthesis or “folding” of DNA nanostructures
involves thermal annealing in the presence of aminimum concentration of cations to overcome thenegative charge-repulsion forces of the nucleic acidphosphodiester backbone. Compact and high-density3D nanostructures produced via DNA origami aretypically produced in a buffer containing the diva-lent cation Mg2þ at a concentration of ∼5�20 mM,3
∼1 order ofmagnitude higher than its concentration inblood and tissue culture media (<1 mM). This discre-pancy between the divalent cation concentration re-quired by DNA nanostructures and that present inbiological environments could cause nanostructuredenaturation. Alternatively, synthesized nanostruc-tures may have some capacity to sequester cationsand may not therefore display sensitivity to diluteMg2þ environments. As well, blood and tissue culturemedia contain high concentrations of the monovalentcation Naþ (∼140 mM) that would likely supportnanostructure integrity. Nevertheless, the sensitivityof DNA nanostructures to cation depletion whentransferred into tissue culture media could impactthe performance of their engineered capabilities.A second concern is in regards to the supple-
mentation of tissue culture medium with fetal bovineserum, a blood product known to contain a varietyof nucleases18�20 that have hindered translationof nucleic acid-based biotechnologies such as genetherapy.21,22 The digestion half-life of unprotectedplasmid DNAhas beenmeasured at 20minwith freshlyisolated plasma21 and 10 min after in vivo intravenousinjection.22 Nuclease digestion of DNA nanostruc-tures23,24 and the crossover motifs25 used in theirarchitecture appear to be partially inhibited whencompared to oligonucleotides or plasmid DNA. How-ever, even partial digestion of DNA nanostructurescould greatly affect their geometry and capabilitiesand could cause release of attached molecular features.In this study, we present a systematic characteriza-
tion of the sensitivity of various DNA nanostructuresto typical mammalian tissue culture conditions. Weexamined the denaturation of nanostructures dueto divalent cation depletion and their digestion by
nucleases present in FBS. On the basis of our findings,we developed strategies to maintain DNA nanostruc-ture stability by making adjustments to tissue culturemedium. We then tested the impact of those adjust-ments on cell growth and viability. Finally, we carriedout two typical tissue culture assays to measurethe impact of nanostructure instability and mediumadjustments on cell phenotype and experimentaloutcomes.
RESULTS AND DISCUSSION
As test cases for this study, we synthesized threenanostructures that were designed using the DNAorigami method (Figure 1a�c and Supporting Infor-mation Figures 1�3). These were produced by anneal-ing three previously described nanostructure-specificoligonucleotide “staple” sets with single-stranded,modified26 M13 phage “scaffold” DNA of 7308 nucleo-tides. Owing to the sensitivity of mammalian cells tobacterial cell wall lipopolysaccharide or “endotoxin”,we developed a protocol for removal of this byproductof M13 scaffold production with Triton X-114(Supporting Information Figure 4).Using a first set of 144 staple strands, we synthesized
a ∼50 nm diameter wireframe DNA nano-octahedron(DNO).12 The DNO struts were each composed of abundle of six DNA double helices27 connected byantiparallel crossover junctions.28,29 A ∼90� curvaturewas added to the struts via targeted insertions anddeletions.4,12 The scaffold and staple strands werecombined in Tris-EDTA (TE) buffer with 14 mM MgCl2,and the nanostructure was produced using a 15 hthermal annealing ramp. Using the same annealingramp and two alternative sets of staple strands,we produced nanotubes26 (NT) composed of a single400 nm long six-helix bundle (168 staple strands,20 mM MgCl2) and a 16 � 89 nm nanorod30 (NR)composed of 24 interconnected helices (178 strands,18 mM MgCl2). Correctly folded nanostructures werepurified using a previously described gradient ultra-centrifugation method.30 After purification of the DNOand NR, we annealed a fluorescent Cy5-labeled oli-gonucleotide to single-stranded DNA “handles” pre-sent on the nanostructure to represent molecularcargo typically added to nanostructures as functionalfeatures.We then characterized the sensitivity of these DNA
nanostructures to Mg2þ depletion in standard RPMImedium (132.9 mM Naþ, 5.3 mM Kþ, 0.4 mM Mg2þ,0.4 mM Ca2þ) without FBS supplementation. To furtherelucidate the dependence of nanostructure integrityon divalent cation concentration, we included a seriesof adjusted RPMI medium samples with Mg2þ concen-trations of 0.7�10 mM and a control previously deter-mined to maintain nanostructure integrity (TE buffer,10 mM Mg2þ). Following incubation at 37 �C for24 h, the products were analyzed by agarose gel
ARTIC
LE
HAHN ET AL. VOL. 8 ’ NO. 9 ’ 8765–8775 ’ 2014
www.acsnano.org
8767
electrophoresis (AGE). In comparison to control sam-ples, the DNO and NR displayed reduced electro-phoretic migration after incubation in standard RPMImedium and adjusted medium with Mg2þ concentra-tions below ∼6 mM (Figure 1d,f). This suggested thatsome degree of denaturation had occurred, whichwould likely increase the dimensions of the nanostruc-tures and slow their travel through the agarose matrix.Surprisingly, NT migration did not appear depen-dent on Mg2þ concentration over the tested range(Figure 1e), demonstrating design-dependent variabil-ity in the sensitivity of nanostructures to Mg2þ deple-tion. Because the DNO and NR were labeled withfluorescent Cy5 oligonucleotides, we were able toexamine via AGE if low divalent cation conditions
may cause a loss of molecular cargo attached to thenanostructures. We imaged the gels for Cy5 fluores-cence and observed a partial Mg2þ-concentration-dependent loss of Cy5 cargo from the DNO and NR,demonstrating that denaturation via divalent cationdepletion can cause release of attached molecularcargo (Supporting Information Figure 5).We further characterized the RPMI incubation pro-
ducts via negative-stain transmission electron micro-scopy (TEM) (Figure 1g�l). Imaging confirmed that theDNO and NR denature in RPMI, and that their structuralintegrity is maintained in medium adjusted to 6 mMMg2þ. Although we observed particles approximatingthe dimensions of the DNO and NR after incubation instandard RPMI (0.4 mM Mg2þ), they were amorphous
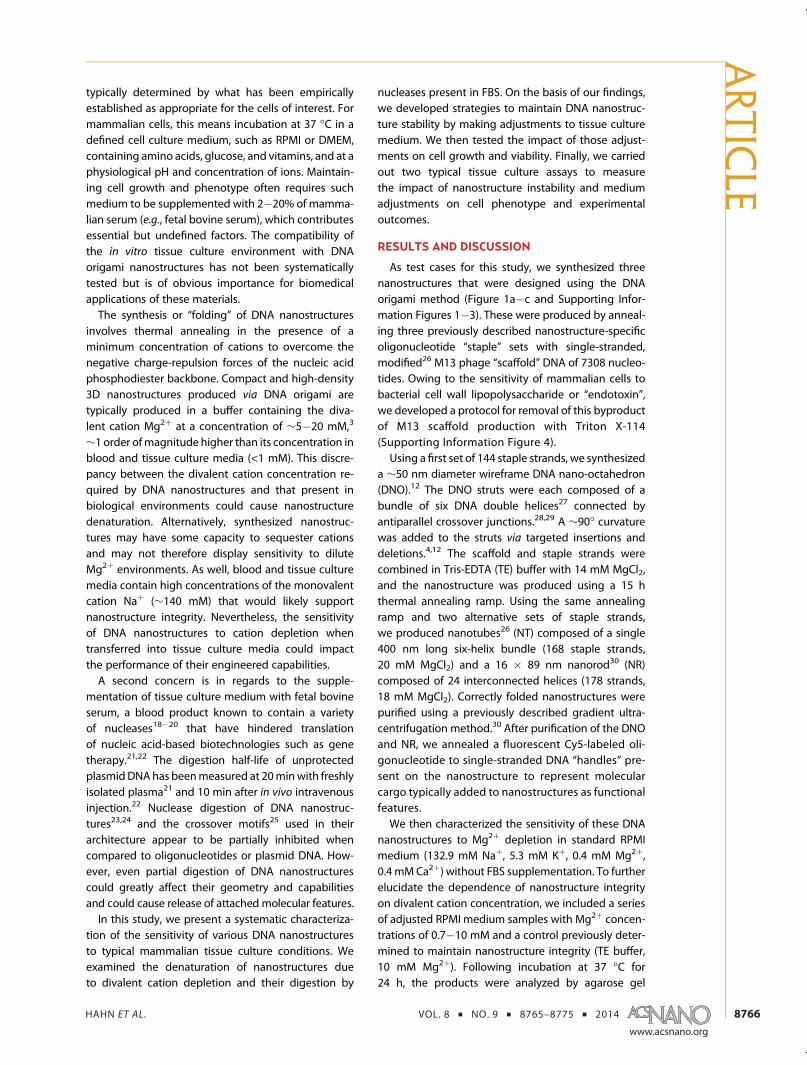
Figure 1. DNA nanostructure sensitivity to cation depletion in tissue culture medium. The three test nanostructures are (a)DNA nano-octahedron (DNO), (b) six-helix bundle nanotube (NT), and (c) 24-helix nanorod (NR). (d�f) Three nanostructureswere incubated for 24 h at 37 �C in unmodified RPMI tissue culture medium containing 0.4 mM Mg2þ or adjusted to0.7�10mMMg2þ, and theproductswere analyzedby agarosegel electrophoresis (AGE). In comparison to the control lanes ofstable sample, migration of the DNO and NR is retarded after low Mg2þ incubation, indicative of denaturation, whereas noobvious difference in migration is observed with the NT. (g�i) Transmission electron microscopy images of nanostructuresincubated in unmodified medium, showing varying levels of denaturation. (j�l) With RPMI medium adjusted to 6 mMMg2þ,structural integrity ismaintained in all three designs.M=molecularweight ladder, C = nanostructure in TEþ 10mMMg2þ, S =M13 scaffold. Scale bar = 100 nm.
ARTIC
LE
HAHN ET AL. VOL. 8 ’ NO. 9 ’ 8765–8775 ’ 2014
www.acsnano.org
8768
and lacked recognizable features. This suggests thatthe low divalent and high monovalent cation concen-trations in the RPMI mediumwere unable to overcomecharge repulsion of the DNA phosphodiester back-bone, and that the Mg2þ ions associated with thenanostructures from the synthesis did not remainsequestered after transfer into RPMI. The impact ofmedium on NT integrity appeared less dramatic. IntactNTs were visible by TEM after incubation in 0.4 mMMg2þ RPMI. Relative to the control sample, therewere farfewer NTs present, but this may be a Mg2þ-dependentartifact of sample preparation for TEM imaging.Based on its stability in medium, the DNA NTmay be
an excellent choice for in vitro tissue culture studies. Tocharacterize a nanostructure with relevance to biome-dical applications, we also examined the logic-gatedDNA nanorobot17 for sensitivity to divalent cationdepletion using the same assay as described above.After incubation at 37 �C for 24 h, AGE analysis showeda difference in migration between controls and thoseincubated in standard RPMI medium and adjustedmedium with Mg2þ concentrations below ∼2 mM(Supporting Information Figure 6a). This shift becameapparent after 30 min of incubation (Supporting In-formation Figure 6b). Imaging of nanostructures incu-bated at 2 mMMg2þ for 24 h revealed nanorobots thatwere intact but which appeared stressed, in compar-ison to the control 10 mM Mg2þ sample (SupportingInformation Figure 6c,d). We were unable to find intactnanostructures after incubation in standard medium,but this might be a false negative, attributable to anartifact of TEM sample preparation. Relative to the NRand DNO, the nanorobot appears to be less sensitive tolow Mg2þ concentrations. In light of the publishedfunctional data,17 it may be possible that electrostaticrepulsion from divalent cation depletion causes someflexing of the nanorobot structure, without a loss of the
logic-gatingmolecular features and open versus closedconformations. Further in-depth studies would beneeded to fully elucidate these details.The variability in nanostructure sensitivity to diva-
lent cation depletion is intriguing. The designs testedhere share a common scaffold strand and GC con-tent. The design-specific oligonucleotide sets of theDNO, NT, and NR are comparable in mean ((standarddeviation) length at 42.0 ( 2.5, 40.6 ( 4.6, and41.9( 0.8 nucleotides, respectively, whereas the nano-robot set is shorter (33.3 ( 7.0). The secondary struc-ture (six-helix bundle motif) is common between theDNO and NT, although curvature included in the DNOstrut design might further stress the structure in a low-Mg2þ environment. The charge density is highest inthe NR, in which 12 of the 24 double helices have threenearest-neighbors, compared to two for the doublehelices of the DNO, NT, and nanorobot. Based on a lackof any clear pattern, it is possible that nanostructuresensitivity to divalent cation depletion could be de-pendent on a variety of design parameters. Until thisis better understood, the stability of nanostructuresintended for use in tissue culture experiments shouldbe tested in appropriate conditions.Next, the various nanostructures were incubated
in RPMI supplementedwith 10%FBS to assess nucleasedigestion kinetics. Note that the FBS used in theseexperiments had been heat-treated at 56 �C bythe vendor for inactivation of immune factors, as isstandard practice. For these experiments, the RPMImedium was adjusted to 6 mM Mg2þ using MgSO4
(a component of RPMI) to prevent nanostructure de-naturation. After incubation of 5 nM DNO at 37 �C for0.25�24 h, samples were analyzed by AGE and com-pared to a control incubated in RPMI þ 6 mM Mg2þ,but lacking FBS, for 24 h. The results show little changein migration of the DNO (Figure 2a), NT, and NR
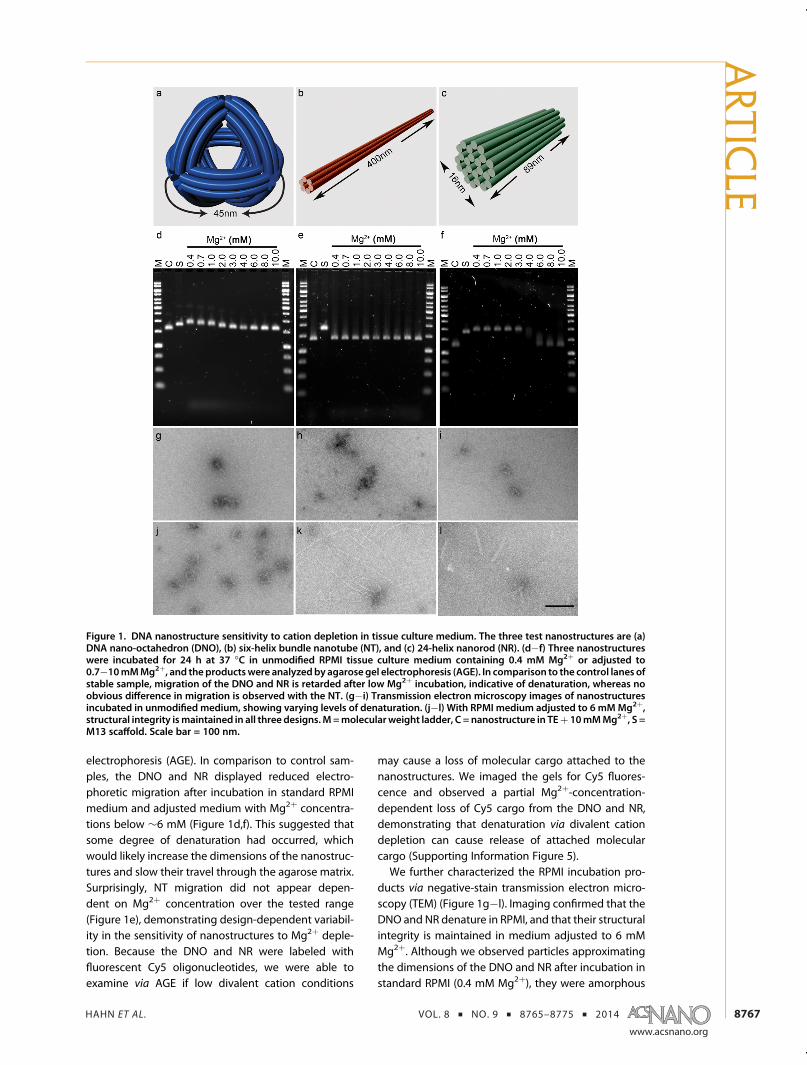
Figure 2. Kinetics of nanostructure digestion by nucleases present in serum and heat inactivation. (a) DNO nanostructure(5 nM)was incubatedat 37 �C for 0.25�24h in RPMIþ 6mMMg2þþ 10%FBS. Analysis byAGE shows smearing anddecreasedintensity of the product band as digestion progresses. (b) TEM image of DNO control sample showing intact nanostructures.(c) Partially digested DNO sample after 2 h incubation in medium þ 10% FBS. Top left: example of a partially digested DNO.(d) Aliquots of FBS were heat-treated for 0.25�10.0min at 75 �C prior to medium preparation. DNOwas incubated for 24 h at37 �C and analyzed by AGE. Medium without nanostructures was analyzed on the right half of the gel, showing a change inappearance from 5 and 10min heat treatment. (e) TEM of a control and (f) DNO incubated in RPMImediumpreparedwith FBSheat-inactivated for 5min.M=molecular weight ladder, C = nanostructure in TEþ 10mMMg2þ, S =M13 scaffold. Scale bars =100 nm.
ARTIC
LE
HAHN ET AL. VOL. 8 ’ NO. 9 ’ 8765–8775 ’ 2014
www.acsnano.org
8769
(Supporting Information Figure 7) over the first 8 h.However, there is an almost complete loss of theprimary product band by 24 h. TEM imaging of theDNO control sample showed no apparent changes(Figure 2b), whereas nanostructures incubated in me-dium with serum for 2 h showed varying degrees ofdigestion (Figure 2c). Based on this, it appears thatsome amount of nuclease activity remains in the FBStypically used to supplement tissue culture medium.We also observed, over numerous repetitions of theseexperiments, that the level of nuclease activity indifferent FBS lots and frozen aliquots can be quitevariable, with digestion progressing faster or muchslower than that presented in Figure 2. As well, thenuclease activity was highest after initial thawing of anFBS stock and was lost over a time span of weeks whenprepared medium was stored at 4 �C (not shown). Thepresence of nuclease in the medium could have adramatic impact on the results of tissue culture studiesthat utilize DNA nanostructures, and care must betaken to ensure that it is absent during experiments.To determine the relative nuclease activity present
in tissue culture medium, we carried out a 12 h, 37 �Cincubation of DNO in 6 mM Mg2þ RPMI mediumsupplemented with 1.25�20% FBS versus 1�4096 U/Lof DNase I (Supporting Information Figure 8). Significantdigestion was apparent at 10 and 20% FBS and at morethan 256 U/L of DNase I, suggesting that typicaltissue culture conditions may contain between 256 and1024 U/L equivalent of DNase I activity. Note thatdigestion was not apparent by AGE for low concentra-tions of FBS (1.25�2.5%), suggesting one potentialsolution for circumventing medium nuclease activitywhen short incubation times and low serum concentra-tions are compatible with the assay and cells of interest.Heat treatment of FBS is a potentially easy and
scalable method for inactivation of nuclease activity.In order to determine the minimum heat treatmentrequired, FBSwas incubated at 75 �C for 0�10min. Thiswas carried out in 1 mL aliquots to allow for efficientheat transfer. We used this to prepare RPMI þ 6 mMMg2þþ 10% FBS, to which the DNO nanostructure wasadded at 5 nM and incubated at 37 �C for 24 h. Analysisof the incubation products by AGE showed that aminimum treatment of 5 min was required to preventalteredmigration of the nanostructure (Figure 2d). TEMimaging confirmed that DNO (Figure 2e,f) incubated inFBS treated thusly remained intact, with no obviousdifference in appearance compared to a control. Heatinactivation of FBS could therefore address the pro-blem of nuclease activity in tissue culture experiments.However, the altered appearance of the 5 and 10 mintreated FBS in our AGE analysis (Figure 2d) suggeststhat it has a more general effect on serum proteins,which could also impact cell growth and phenotype.An alternative to heat inactivation of FBS is inclusion
of a nuclease inhibitor, such as actin protein,31 in tissue
culture medium. Actin inhibition occurs via competi-tive binding to nuclease and should therefore beconcentration-dependent. To test this and determinean appropriate relative concentration of actin, weincubated 5 nM DNO in RPMI þ 6 mM Mg2þ þ 10%FBS and 0�2048 nM actin. After 24 h at 37 �C, weobserved by AGE that a 10-fold or greater molar excessof actin appears to be sufficient to inhibit digestion ofnanostructures (Supporting Information Figure 9). Thecorresponding TEM image of intact DNO is comparableto a control, and both the NT and NR (SupportingInformation Figure 10) were similarly protected, pro-viding a potential alternative to heat inactivation.Next we aimed to determine the effect of our various
medium adjustments on the growth of three differentcell lines: mouse embryonic fibroblast cells (3T3),human embryonic cells (HEK-293), and human adeno-carcinoma cells (H441). These were first establishedin standard medium þ 10% FBS for a minimum of32 population doublings. They were then seeded atlow density in medium modified by (1) adjustment to6 mM Mg2þ, (2) use of 75 �C heat-inactivated FBS, (3)inclusion of 200 nM actin, or (4) a combination of Mg2þ
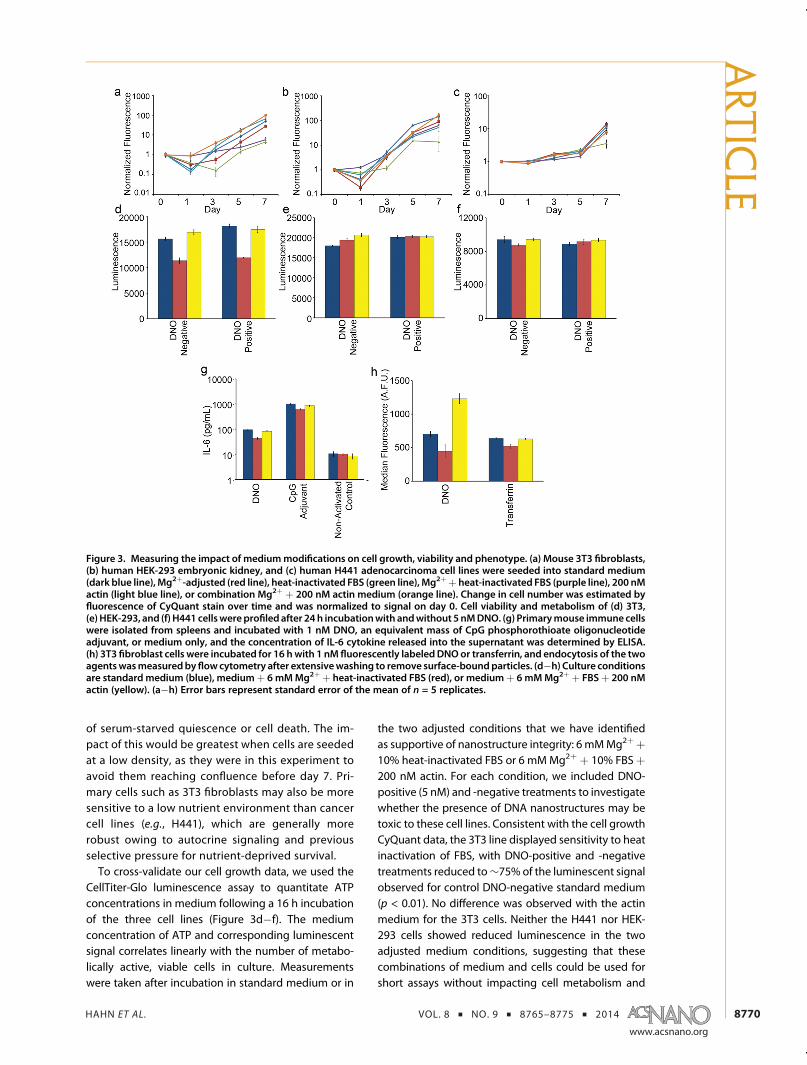
adjustment and heat-inactivated FBS or (5) actin. Incases where the Mg2þ concentration of the mediumwas adjusted, osmolarity wasmaintained by an equiva-lent dilution (∼5%). Cell contentwasmeasured ondays0, 1, 3, 5, and 7 after seeding using the CyQuant cellproliferation assay, which measures fluorescence of acell nucleus stain (Figure 3a�c), and the change overtime was normalized to day 0. Heat treatment of FBSproduced a consistent, detrimental impact on growth,with all three cell lines showing significantly reducedfluorescent signal on day 7 relative to standard medi-um (p < 0.05). Adjustment of medium to 6 mM Mg2þ
had a cell-line-dependent impact on growth. The3T3 cells produced a significantly lower signal by day7 (p < 0.01), whereas HEK-293 and H441 fluorescencewere similar to that of the control medium (p > 0.05).The combination of Mg2þ adjustment and FBS heatinactivation resulted in slower cell growth with onlythe 3T3 cells (p < 0.01). Inclusion of 200 nM actin withand without Mg2þ adjustment produced no signi-ficant differences in signal by day 7 for all three lines(p> 0.05). Taken together, our data suggest that in vitromammalian cell growth may not be sensitive to ad-justment of Mg2þ medium up to a concentration ofat least 6 mM and to the presence of actin at 200 nM.This tolerance to a Mg2þ concentration higher thanthat found in blood (<1 mM) is surprising, but someestablished media such as EGM-2 used for humanumbilical vein endothelial cell (HUVEC) tissue cul-ture contain nonphysiological concentrations of Mg2þ
(10 mM). Heat inactivation of FBS for nuclease re-moval does not appear to be compatible with normalcell growth. It likely causes denaturation of a sub-stantial fraction of serum proteins, leading to a state
ARTIC
LE
HAHN ET AL. VOL. 8 ’ NO. 9 ’ 8765–8775 ’ 2014
www.acsnano.org
8770
of serum-starved quiescence or cell death. The im-pact of this would be greatest when cells are seededat a low density, as they were in this experiment toavoid them reaching confluence before day 7. Pri-mary cells such as 3T3 fibroblasts may also be moresensitive to a low nutrient environment than cancercell lines (e.g., H441), which are generally morerobust owing to autocrine signaling and previousselective pressure for nutrient-deprived survival.To cross-validate our cell growth data, we used the
CellTiter-Glo luminescence assay to quantitate ATPconcentrations in medium following a 16 h incubationof the three cell lines (Figure 3d�f). The mediumconcentration of ATP and corresponding luminescentsignal correlates linearly with the number of metabo-lically active, viable cells in culture. Measurementswere taken after incubation in standard medium or in
the two adjusted conditions that we have identifiedas supportive of nanostructure integrity: 6 mMMg2þþ10% heat-inactivated FBS or 6 mMMg2þ þ 10% FBSþ200 nM actin. For each condition, we included DNO-positive (5 nM) and -negative treatments to investigatewhether the presence of DNA nanostructures may betoxic to these cell lines. Consistent with the cell growthCyQuant data, the 3T3 line displayed sensitivity to heatinactivation of FBS, with DNO-positive and -negativetreatments reduced to∼75% of the luminescent signalobserved for control DNO-negative standard medium(p < 0.01). No difference was observed with the actinmedium for the 3T3 cells. Neither the H441 nor HEK-293 cells showed reduced luminescence in the twoadjusted medium conditions, suggesting that thesecombinations of medium and cells could be used forshort assays without impacting cell metabolism and
Figure 3. Measuring the impact of mediummodifications on cell growth, viability and phenotype. (a) Mouse 3T3 fibroblasts,(b) human HEK-293 embryonic kidney, and (c) human H441 adenocarcinoma cell lines were seeded into standard medium(dark blue line), Mg2þ-adjusted (red line), heat-inactivated FBS (green line), Mg2þþ heat-inactivated FBS (purple line), 200 nMactin (light blue line), or combination Mg2þ þ 200 nM actin medium (orange line). Change in cell number was estimated byfluorescence of CyQuant stain over time and was normalized to signal on day 0. Cell viability and metabolism of (d) 3T3,(e) HEK-293, and (f) H441 cellswereprofiled after 24 h incubationwith andwithout 5 nMDNO. (g) Primarymouse immunecellswere isolated from spleens and incubated with 1 nM DNO, an equivalent mass of CpG phosphorothioate oligonucleotideadjuvant, or medium only, and the concentration of IL-6 cytokine released into the supernatant was determined by ELISA.(h) 3T3 fibroblast cells were incubated for 16 hwith 1 nM fluorescently labeledDNOor transferrin, and endocytosis of the twoagentswasmeasuredbyflowcytometry after extensivewashing to remove surface-boundparticles. (d�h) Culture conditionsare standard medium (blue), mediumþ 6 mMMg2þ þ heat-inactivated FBS (red), or mediumþ 6 mMMg2þ þ FBSþ 200 nMactin (yellow). (a�h) Error bars represent standard error of the mean of n = 5 replicates.
ARTIC
LE
HAHN ET AL. VOL. 8 ’ NO. 9 ’ 8765–8775 ’ 2014
www.acsnano.org
8771
viability. As well, the presence of 5 nM DNO did notindependently reduce luminescence in any of themedium conditions, suggesting that this combinationof nanostructure and assay conditionsmay not be toxicto these specific cell lines.We next aimed to measure the impact of medium
adjustments on cell phenotype using two assays re-levant to nanomedicine. In a first assay, we examinedhow medium adjustment and nanostructure integrityimpact results of immune cell activation by DNAnanostructures (Figure 3g). Immune cells have pre-viously been shown to elicit an inflammatory cytokineresponse to DNA origami nanostructures, includingrelease of the cytokine interleukin-6 (IL-6).16 Primaryimmune cells isolated from mouse spleens werewashed extensively to remove inherent tissue nu-cleases, and we verified that nuclease-free mediumincubated with splenocytes for 24 h does not regainnuclease activity capable of nanostructure digestion(Supporting Information Figure 11). We then incubatedsplenocytes for 16 h with 1 nM DNO in standardmedium or the two adjusted medium conditions thatsupport nanostructure integrity and measured theconcentration of IL-6 released into the tissue culturesupernatant via an ELISA assay. As positive and nega-tive controls, we measured response to a nuclease-resistant DNA adjuvant (CpG 1826) or no activatingagent, respectively, in the same panel of mediumconditions. These controls showed that the cells werephenotypically normal for IL-6 response in all threemedium conditions. IL-6 was produced at high levels inresponse to the CpG adjuvant, and negative controlcells were not activated in the presence of actinor heat-inactivated FBS. The level of IL-6 produced inresponse to DNO (37.7( 3.7 pg/mL) and CpG (743.9(85.8) was significantly reduced in adjusted mediumwith heat-inactivated FBS, in comparison to standardmedium (94.8 ( 6.5 pg/mL for DNO and 1013.4 (50.2 pg/mL for CpG, p < 0.01). No significant differ-ences were observed for either agent in adjustedmedium with actin (81.9 ( 5.4 pg/mL for DNO and862.7( 49.5 pg/mL for CpG, p > 0.05), suggesting thatthis medium environment should produce reliable IL-6response data. Yet having demonstrated that our DNOis not stable in standard medium, we might expect ameaningful difference in immune cell response whennanostructures are intact (i.e., in adjustedmediumwithactin) compared to standardmediumwherewe expectnanostructure instability. Other work from our labora-tory has found that the response of splenocytes to DNAnanostructures is dependent on the total mass of DNApresent and not on their design or integrity (data notshown). Therefore, the results from this assay demon-strate that adjusted medium with actin may be a goodchoice for maintaining normal cell phenotype andnanostructure integrity. Perhaps more importantly,this assay shows that nanostructure integrity cannot
be a priori assumed and indeed may lead to an in-correct interpretation of results.In a second assay and final experiment, we deter-
mined how adjusted medium and nanostructure in-tegrity can impact the results of particle endocytosis(Figure 3h). We incubated 3T3 fibroblast cells with 1 nMDNO fluorescently labeled by Cy5-coupled oligonu-cleotides. A 16 h incubationwas carried out in standardmedium or the two adjusted medium conditions thatsupport nanostructure integrity, and uptake was mea-sured via flow cytometry. Similar to the immune-response assay, we verified that medium enrichedthrough incubation with 3T3 cells does not displaynuclease activity capable of digesting the DNO (datanot shown). As a positive control, we used fluorescentlylabeled transferrin. In comparison to standard culturemedium (637.8 ( 10.4 afu), uptake of transferrin wassimilar in medium þ 6 mM Mg2þ þ actin (631.6 (6.8 afu, p > 0.05) but lower in mediumþ 6mMMg2þþheat-inactivated FBS (520.2 ( 29.7 afu, p < 0.01). Thiswas not surprising based on our earlier observationthat 3T3 growth and metabolism are decreased inmedium with heat-inactivated FBS. After the DNOwas incubated, we observed that 3T3 fluorescencewas lowest inmediumþ 6mMMg2þþ heat-inactivatedFBS (446.6 ( 96.5 afu), but the difference relativeto standard medium was not meaningful (704.8 (38.3 afu, p > 0.05). More remarkably, fluorescenceof cells in medium þ 6 mM Mg2þ þ actin (1230.2 (73.8 afu) was 75% higher than in standard medium(p < 0.01). On the basis of our earlier analysis, we wouldexpect the growth and metabolism of 3T3 cells to besimilar in standardmedium and adjustedmediumwithactin. This increase in uptakemight therefore be due toa difference in DNO integrity between the two condi-tions and would suggest that uptake of intact nano-structures may be higher than Cy5-labeled debris thatwould result from denaturation and digestion of DNOin standard medium. Therefore, this endocytosis assayshows a drastic difference in experimental outcomewhen medium is supportive of normal cell phenotypeand nanostructure integrity, unlike what was observedfrom immune activation.DNA nanotechnology offers unique and exciting
advantages that may contribute to important ad-vances in nanomedicine. However, this in vitro studyand our earlier in vivo12 study have shown that DNAnanostructures produced via the origami method aresusceptible to denaturation and digestion in biologicalenvironments. Previous studies have probed the sta-bility of DNA nanostructures exposed to cell lysate32
and after injection into the lumen of Caenorhabditiselegans.33 DNA origami nanostructures exposed to celllysate were found to remain largely intact, which is incontrast to our findings in cell culture medium. Theintracellular compartment has high total Mg2þ contentof 5�20mM.34 Much of this is associated with proteins
ARTIC
LE
HAHN ET AL. VOL. 8 ’ NO. 9 ’ 8765–8775 ’ 2014
www.acsnano.org
8772
and so should be unavailable, but the cell lysatewas generated using sodium dodecyl sulfate, whichmay have denatured proteins (including nucleases)and released ionic Mg2þ into solution. The nanostruc-tures tested in C. elegans were smaller and so are notdirectly comparable to origami particles butmay be lesssusceptible to Mg2þ depletion and denaturation. Signi-ficant nuclease activity was not observed in either case.This perhaps suggests that not all biomedical applicationsof DNA nanotechnology will face the same challenges tonanostructure integrity, and that systemic injection oforigami-based particles into mammalian systemsmay beone of the most difficult.
CONCLUSIONS
Researchers designing nanodevices for biomedicalapplications should consider what degree of protec-tion strategies, such as compartmentalization in a lipidmembrane,12 is required to maintain integrity withinthe biological environment of interest. Even withoutprotection strategies, in vitro tissue culture studies arehighly useful for development and prototyping of DNAnanodevices and their functions, such as in the caseof the nanorobot.17 On the basis of this rationale, wehave identified and characterized the sources of DNAnanostructure instability within the tissue culture en-vironment and demonstrated methods to overcomethem. Our data show that DNA nanostructures canbe sensitive to depletion of Mg2þ in tissue culturemedium, causing denaturation in a design-dependentmanner, and that they are digested by nucleasespresent in FBS used as a medium supplement.Avoidance of FBS nuclease activity is perhaps the
easier challenge to overcome. Our experience has beenthat the level of nuclease activity present in tissueculture FBS is variable and disappears over days toweeks when prepared medium is stored at 4 �C. Highlevels of nuclease activity may therefore only be a con-cern for a short period following preparation ofmediumfrom freshly thawed FBS. We found that medium sup-plemented with low volumes of FBS (1�2.5%) had littlecapacity to digest a 5 nM concentration of DNA nano-structure over 24 h, suggesting that assays requiringshort incubations could make use of low serum con-centrations to avoid significant nuclease activity. Thismay slow but not drastically alter cell metabolism andphenotype. Various serum-free media are also availablefrom vendors for specific cell types. In any case whereFBS nuclease activity is a concern, our data support theuse of actin as an inhibitor. We did not observe anydifference in cell growth, viability, or phenotype when
actin was included in medium at 200 nM. In contrast,heat inactivation of nuclease activity using a 5min, 75 �Ctreatment of FBS had a consistently detrimental impacton cells and on results ofmurine immune cell activationand 3T3 fibroblast endocytosis assays. Heat inactivationusing these conditions does not therefore appear to bea viable option.The denaturation of DNA origami nanostructures due
to depletion of divalent cations is a major challenge toin vitro and in vivo applications. We observed that thesensitivity of nanostructures to cation depletion is de-sign- and time-dependent. Of the four designs that wetested, only one (DNA nanotube) appeared to be stablein physiological cation concentrations. Adjustment ofMg2þmedium concentration to∼1 order ofmagnitudehigher than that of the physiological conditions wasable to prevent denaturation of the DNO, NR, and DNAnanorobot. Surprisingly, we observed little impact ofMg2þ adjustment on the growth and viability of mouse3T3 fibroblast cells, human H441 adenocarcinoma, andHEK-293 embryonic kidney cells. Similarly, the pheno-type of primary mouse splenocyte immune cells and3T3 fibroblast cells was not sensitive to higher Mg2þ
concentrations during immune activation and uptakeassays, respectively. This, and the fact that other exam-ples of highMg2þ standardmediumarewell-established(e.g., EGM-2 for HUVECs), suggests that many mamma-lian cell types may not be sensitive to higher thanphysiological extracellular Mg2þ concentrations. Addi-tion of MgSO4 to tissue culture medium, and an equiv-alent dilution to prevent osmotic shock, thus appearsto be a potentially viable and perhaps generalizableapproach for maintaining DNA nanostructure integrityduring in vitro experiments.In any case of tissue culturemediummodification, it is
strongly recommended that extensive testing and ap-propriate controls with standard medium are used toensure that the cell property being investigated is notsensitive to the adjustments. Similarly, the data pre-sented in this study reinforce the need formore rigoroustesting and verification of nanostructure integrity inapplications involving biological environments.The medium adjustments tested here will suffice for
some in vitro prototyping studies and applications ofDNA nanotechnology. However, ultimately, many DNAnanotechnology-based diagnostic and therapeutic de-vices will be developed toward in vivo use or inbiological conditions (e.g., blood, urine) that may notbe easily modified. Future studies could therefore aimto develop DNA nanostructure protection strategiesthat obviate the need to alter their environment.
MATERIALS AND METHODS
Chemicals and Supplies. Endotoxin test cartridges (0.05�5.0 EU/mL) were purchased from Charles River. Accugene 10�TBE buffer, PCR tubes, and 96-well PCR plates (Axygen) were
purchased from VWR. SYBR Safe stain and CyQuant directcell proliferation assay were purchased from Life TechnologiesCorporation. Agarose was purchased from Lonza. Glycerol,Tris base, EDTA, Triton X-114, Tween20, magnesium chloride,
ARTIC
LE
HAHN ET AL. VOL. 8 ’ NO. 9 ’ 8765–8775 ’ 2014
www.acsnano.org
8773
magnesium sulfate, and sodium chloride were purchasedfrom Sigma-Aldrich. Actin was purchased from CytoskeletonInc. RPMI, DMEM, PBS, FBS, and penicillin-streptomycin werepurchased fromGibco. Carbon Formvar grids and uranyl formatewere purchased from Electron Microscopy Sciences. AmiconUltra filtration devices and Seton ultracentrifugation tubes werepurchased from Fisher Scientific. DNAgel extraction spin columnwas purchased from Bio-Rad.
M13 Scaffold Prep, Endotoxin Removal, Nanostructure Synthesis, andPurification. The four sets of design-specific staple strands werepurchased reverse-phase-purified from Bioneer or Life Technol-ogies Corporation. The fluorescent Cy5-coupled oligonucleotidefeature (50-GTGAGTTGTGGTAGATAATTT-30) was synthesizedby IDT Technologies. The p7308 scaffold strand was producedfrom M13 phage replication in Escherichia coli, as describedpreviously.26
The scaffold strand was endotoxin-purified using TritonX-114. In brief, surfactant was added to scaffold stock to a finalconcentration of 2% (v/v). This was incubated at 4 �C on aninversion mixer for 30 min to solubilize endotoxin. The solutionwas mixed at 37 �C for 5 min to cause phase separation and thencentrifuged at 37 �C for 30 min at maximum speed. The topaqueous fractionwas transferred toanewtube. Thiswas repeatedfour times to reduce endotoxin in the scaffold stock solution toacceptable levels of less than 5 EU/mL and quantified using theEndosafe-PTS system and test cartridges (Charles River).
Nanostructure synthesis was carried out by mixing 50 nMM13 scaffold with a 5� excess of staples in TE þ 14 mM (DNO),20 mM (NT), 18 mM (NR), or 8 mM (nanorobot) MgCl2. Thesolutions were subjected to a thermal annealing ramp on aTetrad 2 Peltier thermal cycler (Bio-Rad) according to thefollowing schedule: 80 �C for 5 min, decrease to 65 �C at5 min/�C, incubate at 65 �C for 20 min, and decrease to 25 �Cat 20 min/�C. Solutions of folded DNA nanostructures wereconcentrated using a 30k MWCO Amicon Ultra centrifugal filterdevice (Millipore) and then purified by glycerol gradientultracentrifugation.30 Following purification, the stock solutionwas diluted appropriately for TEM imaging to verify quality. Thestock concentration was determined by UV absorbance at260 nm on a Nanodrop spectrophotometer (Thermo Scientific)using disposable cuvettes (Sarstedt). Stock solutions werestored at 4 �C until use.
Agarose Gel Analysis. DNA nanostructures were analyzed bygel (1.5% agarose, 0.5� TBE 10 mM MgCl2, 1� SYBR Safe) elec-trophoresis with Thermo Scientific Owl B2 EasyCast Mini GelSystem apparatus. The samples were loaded into the agarosegel and allowed to migrate for 4 h (running buffer: 0.5� TBE,10mMMgCl2; 4.3 V/cm). The gel was imaged with Typhoon FLA9000 (GE Healthcare Life Sciences). To recover nanostructures,the bandswere visualizedwithUV light and cut out from the gel.Extracted bands were crushed and placed into a DNA gelextraction spin column (Bio-Rad). Then, the nanostructure solu-tion was recovered by centrifugation of the loaded column for3 min at 4000g.
Negative-Stain Transmission Electron Microscopy. TEM imagingwas carried out by dropping 3.5 μL of product onto a plasma-treated carbon Formvar grid (Electron Microscopy Sciences).This was incubated for 1 min. The solution was wicked awayonto filter paper, and 3.5 μL of 2% uranyl formate (in H2O, w/v)was immediately added. This was incubated for 0.5 min andthen wicked away by filter paper. Imaging was carried out on aJEOL 1400 transmission electron microscope.
Cation Depletion Assay. RPMI medium (Gibco) was modifiedto 0.7, 1.0, 2.0, 3.0, 4.0, 6.0, 8.0, and 10 mM Mg2þ by additionof MgSO4 from a 500 mM stock solution. Each nanostructurewas adjusted to 150 ug/mL and then mixed with unmodifiedRPMI medium (0.4 mM Mg2þ) or modified RPMI medium ata 1:10 ratio. The samples were incubated at 37 �C for 24 h ona Tetrad 2 Peltier thermal cycler (Bio-Rad) and analyzed usingagarose gel electrophoresis (AGE) and TEM imaging.
Nuclease Digestion Kinetics Assay. RPMI medium (Gibco) wasadjusted to 6 mMMg2þ by addition of MgSO4 and supplemen-ted with 10% freshly thawed FBS (Gibco; heat-inactivated at56 �C by the vendor). Each nanostructure was adjusted to150 μg/mL and mixed with modified RPMI at a 1:10 ratio.
The samples were incubated at 37 �C for 0.25, 0.5, 1, 2, 4, 8,and 24 h on a Tetrad 2 Peltier thermal cycler (Bio-Rad) andcrushed into ice to stop nuclease digestion. The nanostructureswere immediately analyzed using AGE. Then, the bands wereextracted to recover nanostructures, and the nanostructureswere imaged under TEM.
Nuclease Digestion Quantitation Assay. RPMImedium (Gibco) wasadjusted to 6mMMg2þ by addition ofMgSO4 and supplementedwitheither 1.25�20% freshly thawedFBS (Gibco; heat-inactivatedat 56 �C by the vendor) or 1�4096 U/L of DNase I (New EnglandBiolabs). The DNO was adjusted to 150 μg/mL and mixed witheach medium condition in a 1:10 ratio. These were incubated for12 h at 37 �C, and the products were analyzed by AGE.
Serum Heat Inactvation Assay. Freshly thawed FBS (Gibco) washeat-treated at 75 �C for 0.25, 0.5. 1, 2, 5, and 10 min in 1 mLaliquots on an Eppendorf thermoshaker with rapid shaking.RPMI medium (Gibco) was adjusted to 6 mM Mg2þ by additionof MgSO4 and supplemented with 10% freshly thawed FBS orheat-treated FBS. Each nanostructure was adjusted to 150 μg/mLand mixed with modified RPMI at a 1:10 ratio. The samples wereincubated at 37 �C for 24 h on a Tetrad 2 Peltier thermal cycler(Bio-Rad) and crushed into ice to stop nuclease digestion. Thenanostructures were analyzed using AGE. Then, the bands wereextracted to recover nanostructures, and the nanostructureswere imaged under TEM.
Actin Nuclease Inhihbition Assay. RPMI medium (Gibco) wasadjusted to 6 mMMg2þ by addition of MgSO4 and supplemen-ted with 10% freshly thawed FBS (Gibco; heat-inactivated at56 �C by the vendor). A dilution series of actin protein wasprepared and added to the medium. A 150 μg/mL solution ofeach nanostructure was prepared and mixed with modifiedRPMI þ actin at a 1:10 ratio. The samples were incubated at37 �C for 24 h on a Tetrad 2 Peltier thermal cycler (Bio-Rad) andcrushed into ice to stop nuclease digestion. The nanostructureswere analyzed using AGE. Then, the bands were extracted torecover nanostructures, and the nanostructures were imagedunder TEM.
Cell Proliferation Assay. To prepare medium with 6 mM Mg2þ,equi-osmolar MgSO4 solution was prepared and added to RPMIand DMEM media (149 and 175 mOsM, respectively). Heat-inactivated FBS was prepared by incubation at 75 �C for 5min in1 mL aliquots. 3T3 and HEK-293 cells were grown in DMEMmedium, and H441 cells were grown in RPMImedium. Cells weregrown to confluency in appropriatemedium supplemented with10% freshly thawed FBS (Gibco). 3T3 (2.5 � 103 cells/mL), HEK-293 (1 � 104 cells/mL), and H441 (1.5 � 104 cells/mL) cells wereseeded by adding 200 μL of cell suspension into the wells (n = 5)of a 96-well plate for each time point (0, 1, 3, 5, or 7 days afterseeding), in modified medium prepared as follows: medium þ10% FBS, medium þ 10% FBS þ 6 mM Mg2þ, medium þ 10%heat-inactivated FBS, medium þ 10% heat-inactivated FBS þ6mMMg2þ, mediumþ 10% FBSþ 200 nM actin, andmediumþ10% FBS þ 200 nM actin þ 6 mMMg2þ. At each time point, cellproliferation was measured by CyQuant Direct Cell proliferationassay (Life Technologies) following the vendor protocol exactly.Fluorescence was measured on a BioTek NEO HTS plate readerwith excitation at 480 nm and emission at 530 nm.
Cell Viability Assay. The same methods from the cell prolifera-tion assay were used to modify medium. Each cell line wasseeded by adding 100 μL of 105 cells/mL cell suspension intowells (n = 5) of a 96-well plate for control or experimental groupsin the following medium conditions: medium þ 10% FBS,mediumþ 10%heat-inactivated FBSþ 6mMMg2þ, andmediumþ 10% FBS þ 200 nM actin þ 6 mM Mg2þ. Five microliters of100 ng/μL DNO was added to the experimental group afterovernight incubation to allowcell attachment. Twenty-four hoursfollowing addition of the nanostructure, cell viability was mea-sured by CellTiter-Glo Luminescent cell viability assay (Promega)following the vendor protocol exactly. Luminescence signal wasmeasured on a BioTek NEO HTS plate reader.
Splenocyte Activation Assay. Standard and adjusted mediumwas prepared as described above. Spleens were obtained fromfemale 8 week old C57Bl/6 mice (Charles River). Two spleenswere processed for this experiment. They were transferred into70 μm cell strainers (BD Falcon) and were dissociated using a
ARTIC
LE
HAHN ET AL. VOL. 8 ’ NO. 9 ’ 8765–8775 ’ 2014
www.acsnano.org
8774
sterile syringe plunger. The single cell suspension was washedwith 25 mL of PBS (Gibco) into a Petri dish. The suspension wastransferred to a 50 mL Falcon tube, centrifuged at 500g for5 min, and the supernatant discarded. A total of three washeswere used to remove nuclease activity carried over from thetissue. Two milliliters of ACK lysing buffer (Lonza) was added,and the cells were gently resuspended and incubated for 7 min.Following this, 20 mL of PBS and 20 mL of RPMI medium wereadded, and the suspension was centrifuged as above. Cell con-centrationwas determined, and 1� 106 live cellswere transferredin 450 μL of the various media to 5� wells of a 48-well plate foreach agent to be assayed (DNO, CpG adjuvant, nonactivatedcontrol). Fifty microliter of 10 nM DNO or 50 μg/mL CpG oligo-nucleotide 1826 (InvivoGen) was transferred into thewells (n= 5).These were incubated for 16 h in a CO2 incubator at 37 �C.Supernatants were removed and centrifuged for 10 min at 500g,transferred to new tubes, and assayed for IL-6 concentrationimmediately by ELISA (R&D Systems).
Endocytosis Assay. 3T3 fibroblast cells were first grown instandard culture medium to establish normal growth. The cellswere then trypsinized, collected, and washed three times viacentrifugation at 500g for 5 min with PBS to remove any nucleasepresent in the culture medium. Then, 1 � 104 cells were trans-ferred into the various medium conditions and seeded into wellsof a 96-well plate. After 24 h to allow cell attachment, 1 nMof Cy5-labeled DNO or FITC-labeled transferrin (Life Technologies) wasadded. This was incubated for 16 h. Cells were then washed twicewith ice-cold PBS and incubated with glycine-HCL (50mM) in PBS(pH 2.8) for 10 min at room temperature to dissociate surface-bound particles. The cells were resuspended in standard PBS andanalyzed by flow cytometry on a LSRFortessa (BD), measuring10000 events/sample (n = 5). Gating was performed on the cellsby gating upon the forward scatter and side scatter plot. Identicalgates were applied to all samples. After gating, a negativepopulationwas definedusing thehistogramobtained formedium-only negative control samples. Samples that showed a rightwardpeak shift were determined as positive, andmedian values of eachsample population were reported.
Statistics. ANOVA with post-hoc Dunnet's or Tukey's testswere performed using an excel plug-in, inerSTAT-a v1.3 byMario H. Vargas (Instituto Nacional de Enfermeda Respiratorias,Mexico).
Conflict of Interest: The authors declare the following com-peting financial interest(s): SDP andWMSown apatent coveringthe protection of DNA nanostructures for use in biologicalenvironments.
Supporting Information Available:Nanostructure design dia-grams and staple sequences, as well as additional data onendotoxin removal from the M13 scaffold and nanostructurestability in various conditions. This material is available free ofcharge via the Internet at http://pubs.acs.org.
Acknowledgment. J.H. holds a National Science FoundationGraduate Research Fellowship, S.D.P. holds a Canadian Insti-tutes of Health Research Fellowship and a Wyss InstituteTechnology Development Fellowship, and this work was sup-ported by an NIH grant to W.M.S. and by the Wyss Institute atHarvard. This material is based upon work supported by theNational Science Foundation Graduate Research Fellowshipunder Grant No. 1122374. We thank the Wyss Institute forsupport of this project.
REFERENCES AND NOTES1. Seeman, N. C. Nanomaterials Based on DNA. Annu. Rev.
Biochem. 2010, 79, 65–87.2. Rothemund, P. W. K. Folding DNA To Create Nanoscale
Shapes and Patterns. Nature 2006, 440, 297–302.3. Douglas, S. M.; Dietz, H.; Liedl, T.; Högberg, B.; Graf, F.;
Shih, W. M. Self-Assembly of DNA into Nanoscale Three-Dimensional Shapes. Nature 2009, 459, 414–418.
4. Dietz, H.; Douglas, S. M.; Shih, W. M. Folding DNA intoTwisted and Curved Nanoscale Shapes. Science 2009, 325,725–730.
5. Liedl, T.; Högberg, B.; Tytell, J.; Ingber, D. E.; Shih, W. M. Self-Assembly of Three-Dimensional Prestressed TensegrityStructures from DNA. Nat. Nanotechnol. 2010, 5, 520–524.
6. Mao, C.; Sun, W.; Shen, Z.; Seeman, N. C. A NanomechanicalDevice Based on the B-Z Transition of DNA. Nature 1999,18, 2531–2537.
7. Seelig, G.; Soloveichik, D.; Zhang, D. Y.; Winfree, E. Enzyme-Free Nucleic Acid Logic Circuits. Science 2006, 314, 1585–1588.
8. Dutta, P. K.; Varghese, R.; Nangreave, J.; Lin, S.; Yan, H.; Liu,Y. DNA-Directed Artificial Light-Harvesting Antenna. J. Am.Chem. Soc. 2011, 133, 11985–11993.
9. Liu, Y.; Lin, C.; Li, H.; Yan, H. Aptamer-Directed Self-Assemblyof Protein Arrays on a DNA Nanostructure. Angew. Chem.2005, 117, 4407–4412.
10. He, Y.; Tian, Y.; Ribbe, A. E.; Mao, C. Antibody Nanoarrayswith a Pitch of 20Nanometers. J. Am. Chem. Soc. 2006, 128,12664–12665.
11. Schreiber, R.; Do, J.; Roller, E.-M.; Zhang, T.; Schüller, V. J.;Nickels, P. C.; Feldmann, J.; Liedl, T. Hierarchical Assemblyof Metal Nanoparticles, Quantum Dots and Organic DyesUsing DNA Origami Scaffolds. Nat. Nanotechnol. 2013, 9,74–78.
12. Perrault, S. D.; Shih, W. M. Virus-Inspired MembraneEncapsulation of DNA Nanostructures To Achieve In VivoStability. ACS Nano 2014, 8, 5132–5140.
13. Shaw, A.; Lundin, V.; Petrova, E.; Fördos, F.; Benson, E.;Al-Amin, A.; Herland, A.; Blokzijl, A.; Högberg, B.; Teixeira,A. I. Spatial Control of Membrane Receptor Function UsingLigand Nanocalipers. Nat. Methods 2014, 11, 841–846.
14. Rudchenko, M.; Taylor, S.; Pallavi, P.; Dechkovskaia, A.;Khan, S.; Butler, V. P., Jr.; Rudchenko, S.; Stojanovic, M. N.Autonomous Molecular Cascades for Evaluation of CellSurfaces. Nat. Nanotechnol. 2013, 8, 580–586.
15. Langecker, M.; Arnaut, V.; Martin, T. G.; List, J.; Renner, S.;Mayer, M.; Dietz, H.; Simmel, F. C. Synthetic Lipid Mem-brane Channels Formed by Designed DNA Nanostruc-tures. Science 2012, 338, 932–936.
16. Schüller, V. J.; Heidegger, S.; Sandholzer, N.; Nickels, P. C.;Suhartha, N. A.; Endres, S.; Bourquin, C.; Liedl, T. CellularImmunostimulation by CpG-Sequence-Coated DNA Ori-gami Structures. ACS Nano 2011, 5, 9696–9702.
17. Church, G. M.; Douglas, S. M.; Bachelet, I. A Logic-GatedNanorobot for Targeted Transport of Molecular Payloads.Science 2012, 335, 831–834.
18. Miyauchi, K.; Ogawa, M.; Shibata, T.; Matsuda, K.; Mori, T.;Ito, K.; Minamiura, N.; Yamamoto, T. Development of aRadioimmunoassay for Human Deoxyribonuclease I. Clin.Chim. Acta 1986, 154, 115–123.
19. Koizumi, T. Tissue Distribution of Deoxyribonuclease I(DNase I) Activity Level in Mice and Its Sexual Dimorphism.Exp. Anim. 1995, 44, 181–185.
20. Koizumi, T. Deoxyribonuclease II (DNase II) Activity inMouse Tissues and Body Fluids. Exp. Anim. 1995, 44,169–171.
21. Houk, B.; Hochhaus, G.; Hughes, J. Kinetic Modeling ofPlasmid DNA Degradation in Rat Plasma. AAPS J. 1999, 1,15–20.
22. Kawabata, K.; Takakura, Y.; Hashida, M. The Fate of PlasmidDNA after Intravenous Injection in Mice: Involvement ofScavenger Receptors in Its Hepatic Uptake. Pharm. Res.1995, 12, 825–830.
23. Castro, C. E.; Kilchherr, F.; Kim, D.-N.; Shiao, E. L.; Wauer, T.;Wortmann, P.; Bathe, M.; Dietz, H. A Primer to ScaffoldedDNA Origami. Nat. Methods 2011, 8, 221–229.
24. Keum, J.-W.; Bermudez, H. Enhanced Resistance of DNANanostructures to Enzymatic Digestion. Chem. Commun.2009, 7036–7038.
25. Lu, M.; Guo, Q.; Seeman, N. C.; Kallenbach, N. R. DNase ICleavage of Branched DNAMolecules. J. Biol. Chem. 1989,264, 20851.
26. Douglas, S. M.; Chou, J. J.; Shih, W. M. DNA-Nanotube-Induced Alignment of Membrane Proteins for NMR Struc-ture Determination. Proc. Natl. Acad. Sci. U.S.A. 2007, 104,6644–6648.
ARTIC
LE
HAHN ET AL. VOL. 8 ’ NO. 9 ’ 8765–8775 ’ 2014
www.acsnano.org
8775
27. Mathieu, F.; Liao, S.; Kopatsch, J.;Wang, T.; Mao, C.; Seeman,N. C. Six-Helix Bundles Designed from DNA. Nano Lett.2005, 5, 661–665.
28. Fu, T. J.; Seeman, N. C. DNA Double-Crossover Molecules.Biochemistry (Moscow) 1993, 32, 3211–3220.
29. Li, X.; Yang, X.; Qi, J.; Seeman, N. C. Antiparallel DNADoubleCrossoverMolecules as Components for Nanoconstruction.J. Am. Chem. Soc. 1996, 118, 6131–6140.
30. Lin, C.; Perrault, S. D.; Kwak, M.; Graf, F.; Shih, W. M.Purification of DNA-Origami Nanostructures by Rate-Zonal Centrifugation. Nucleic Acids Res. 2013, 41, e40.
31. Lazarides, E.; Lindberg, U. Actin Is the Naturally OccurringInhibitor of Deoxyribonuclease I. Proc. Natl. Acad. Sci. U.S.A.1974, 71, 4742–4746.
32. Mei, Q.; Wei, X.; Su, F.; Liu, Y.; Youngbull, C.; Johnson, R.;Lindsay, S.; Yan, H.; Meldrum, D. Stability of DNA OrigamiNanoarrays in Cell Lysate. Nano Lett. 2011, 11, 1477–1482.
33. Surana, S.; Bhatia, D.; Krishnan, Y. A Method To StudyIn Vivo Stability of DNA Nanostructures.Methods 2013, 64,94–100.
34. Jahnen-Dechent, W.; Ketteler, M. Magnesium Basics. Clin.Kidney J. 2012, 5, i3–i14.
ARTIC
LE