Embed Size (px)
Citation preview
The author(s) shown below used Federal funds provided by the U.S.Department of Justice and prepared the following final report:
Document Title: Addressing Sentencing-Related Changes inCorrectional Health Care: Building aPractitioner-Researcher Partnership, FinalProject Report
Author(s): Jacques Baillargeon Ph.D.
Document No.: 197354
Date Received: November 14, 2002
Award Number: 2000-CE-VX-001
This report has not been published by the U.S. Department of Justice.To provide better customer service, NCJRS has made this Federally-funded grant final report available electronically in addition totraditional paper copies.
Opinions or points of view expressed are thoseof the author(s) and do not necessarily reflect
the official position or policies of the U.S.Department of Justice.
PHUPLR TY OF National Criminal Justice Reference Service (NCJRS) Box 6000 Rockville. NID 20849-6000 -' '
I I
Addressing Sentencing-related Changes in Correctional Health Care: Building a Practitioner-Researcher Partnership
Final Project Report
March 6,2001
Jacques Baillargeon, Ph.D.
University of Texas Health Science Center at San Antonio
and do not necessarily reflect the official position or policies of the U.S. Department of Justice. been published by the Department. Opinions or points of view expressed are those of the author(s) This document is a research report submitted to the U.S. Department of Justice. This report has not
The purpose of our project, 'Addressing Sentencing-related Changes in
Correctional Health Care: Building a Practitioner-Researcher , Partnership' was to:
1) develop a system-wide data repository and health care review process; 2)
examine disease prevalence and health care delivery patterns in the Texas
Department of Criminal Justice (TDCJ) prison system; 3) develop correctional
health care delivery and policy recommendations based on our findings. The
following summarizes the major findings and accomplishments of our study.
Establishment of a System-wide Data Repository
The TDCJ data repository was constructed by linking clinical,
demographic, health services, and pharmacologic information from a number of
TDCJ databases. Establishment of this database was integral to development of
the subsequent epidemiologic and pharmacoepidemiolgic studies. Prior to
analyses, all data were validated using descriptive statistical techniques. The first
series of analyses focused on a cohort of inmates who were incarcerated for any
duration during 1998. Table 1 shows that the vast majority of inmates were male
and between 30-49 years old. Blacks constituted 44 percent of the total inmate
population; whites represented 30 percent; and Hispanics represented 26 percent.
The distribution of sociodemographic factors was similar in our analyses of two
subsequent cohorts.
2
and do not necessarily reflect the official position or policies of the U.S. Department of Justice. been published by the Department. Opinions or points of view expressed are those of the author(s) This document is a research report submitted to the U.S. Department of Justice. This report has not
Disease Prevalence in the TDC J
Using International Classification of Disease (ICD- 10) codes, we
estimated the prevalence of all medical conditions (physical and psychiatric) for
all inmates who were incarcerated during 1998. Infectious diseases (29.6%)
constituted the most prevalent major disease category among inmates. This was
followed by diseases of musculoskeletal systems and connective tissue (15.3%),
diseases of the circulatroy system (14.0%), mental disorder (lOk%), and diseases
of the respiratory system (6.3%). Among the specific conditions examined,
evidence of tuberculosis infection without active pulmonary disease (20.1%) was I ,
found to be the most prevalent condition, followed hypertension (9.8%), asthma
(5.2%), low pain (5.1%), and viral hepatitis (5.0%). We conducted additional
analyses (see manuscript 1) which included examination of these conditions
according to race, age, and gender. Moreover, we replicated these analyses for
calendar years 1999 and 2000, and found similar distributions.
@
Table 3 presents the 15 most prevalent conditions of the 1998 cohort of
inmates. Of the specific diseases examined, evidence of TB infection (as defined
by a positive tuberculin skin test) was the most common condition in the TDCJ,
occuring in 20.1 percent of inmates. Hypertension was ranked second, followed
by low back pain, viral hepatitis, an affective disorders. Once again, we
conducted additional analyses that included how these conditions varied
according to age, race, and gender (manuscript 1, page 13). Analyses of
subsequent cohorts showed similar distributions of disease.
0 ,
3
and do not necessarily reflect the official position or policies of the U.S. Department of Justice. been published by the Department. Opinions or points of view expressed are those of the author(s) This document is a research report submitted to the U.S. Department of Justice. This report has not

Health Care Delivery and Pharmacotherapy Patterns
Based on our findings of the overall disease profile the TDCJ population,
the advisory board identified a number of specific conditions upon which to focus
our analyses of pharmacotherapy and health care delivery patterns. The following
summarizes some of the major findings of our study.
HIV/AJDS: Antiretroviral Prescribing Patterns
To assess antiretroviral prescribing patterns among "-infected inmates, we I
examined a cohort of 2,360 prison inmates who were incarcerated in the Texas
Department of Criminal Justice (TDCJ) system for any duration during 1998 and who
were diagnosed as HIV-infected. We examined use of three classes of antiretroviral
medication: nucleoside reverse transcriptase inhibitors (NRTIs), non-nucleoside reverse
transcriptase inhibitor (NNRTIs), and protease inhibitors (PIS). HAART was defined as
two NRTIs prescribed with either a PI or a "RTI .
Of all "-infected TDCJ inmates, 48.8 percent were prescribed HAART during
1998 (table 4). Blacks, males, and older inmates all exhibited slightly elevated
proportions of patients on HAART, although none of these associations reached
statistical significance. Inmates with CD4 counts below 500/mm3 exhibited a
substantially higher percentage receiving HAART (66.8 percent) compared to inmates
with CD4 counts at or above 500/mm3 (38.0 percent). We found that the proportion of
inmates receiving HAART increased steadily with each drop in CD4 count category, with
the exception of a slight decrease in the lowest CD4 count category. Assessment of the
95 percent confidence intervals indicates that patients with CD4 counts at or above 500
cells/mm3 and those with missing CD4 information exhibited substantially lower
proportions of inmates on HAART than any of the other subgroups.
Of the 48.8 percent prescribed HAART, 43.2 percent received NRTI with PI
thkhpy, and 1 1.2 percent received NRTI and non-NRTI therapy. 64.2 percent of HIV-
4
and do not necessarily reflect the official position or policies of the U.S. Department of Justice. been published by the Department. Opinions or points of view expressed are those of the author(s) This document is a research report submitted to the U.S. Department of Justice. This report has not
infected inmates were prescribed NRTI only therapy in 1998 (table 4). Inclusion in the
NRTI only category did not preclude having been prescribed HAART in 1998. Overall,
31.1 percent of the HIV-infected inmates were prescribed no antiretroviral therapy during
1998 (table 4). Females, Hispanics and young inmates (18-29 years) all exhibited
elevated percentages of no antiretroviral therapy.
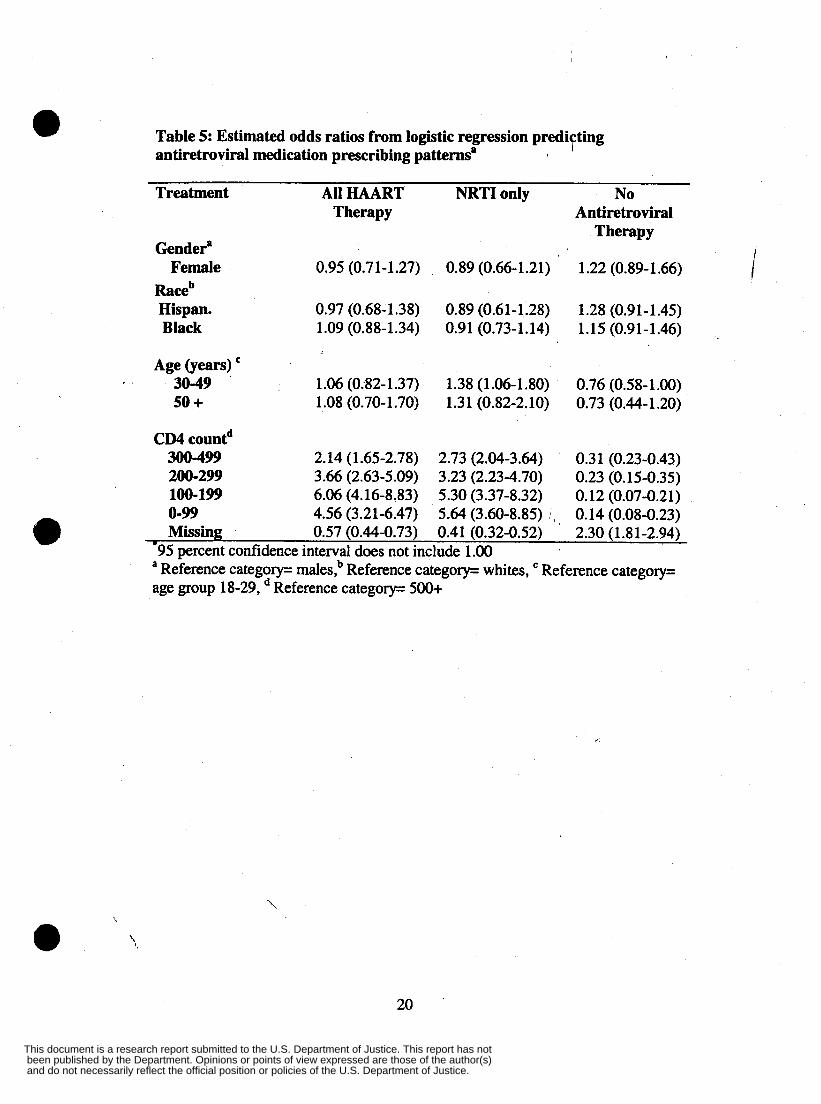
Logistic regression models were used to examine the influence of the study
factors on the dichotomous response variable, HAART prescription during 1998 (table
5). Of the variables included in the model, only CD4 count was predictive of being
prescribed HAART. More specifically, relative to the reference category (patients with
CD4 counts at or above 500/mm3), the other four CD4 categories, patients with CD4
counts of (0-99, 100-199,200-299,300-499 /mm3) all exhibited a significantly increased
likelihood of being prescribed HAART. Alternatively, inmates with missing CD4 counts
had a significant decreased likelihood of receiving HAART. Additional analyses and
discussion. These analyses also served as the basis for a presentation given at the
American College of Epidemiology Annual Meeting in Atlanta, Georgia. 1)
Management of Active Pulmonarv Tuberculosis (TB) in the prison system:
The incidence of active pulmonary TB in the prison population during a
12-month period (March, 1999 through March, 2000) was 27 cases per 100,OOO
inmates. Diagnosis with TB was defined as either having a positive culture for
Mycobacterium tuberculosis, or having met the CDC clinical surveillance case
definition for TB including: positive tuberculin skin test, clinical evidence of
disease, and treatment with at least two antituberculosis drugs. Overall, 59
percent of the sample were prescribed antitubercular therapy for at least the
;defined standard duration; 45 percent were prescribed anti-TB therapy for longer '\~ e '.
5
and do not necessarily reflect the official position or policies of the U.S. Department of Justice. been published by the Department. Opinions or points of view expressed are those of the author(s) This document is a research report submitted to the U.S. Department of Justice. This report has not
than the standard duration; ethambutal was included in the initial therapy among
95 percent of inmates treated with anti-TB therapy; and approximately 33 percent
were prescribed pyrazinamide for a period of less than 56 days. Approximately 36
percent of the study sample began anti-tubercular pharmacotherapy prior to
incarceration, while 7 percent were released from prison prior to completion of
their therapy.
Antidemessant Prescribing Pattkrns among inmates with Depressive Disorders , .
To assess anti-depressant prescribing patterns in TDCJ, we focused on a
cohort of 5,305 TDCJ prison inmates who were incarcerated for any duration
during 1999 and who were diagnosed with one of three depressive disorders:
major depression, dysthymia, and bipolar disorder. Because anti-depressant
medtcation is generally not prescribed for treatment of manic episodes, we '
excluded from analysis all inmates with bipolar disorder who presented with
manic episodes during the aforementioned period.
Table 6 shows that 78.2 percent of inmates with depressive disorder were
prescribed antidepressants in 1998. Of these, 30.9 percent were prescribed SSRIs, and
47.3 percent were TCAs only. Only 21.8 percent were prescribed no antidepressant
medication. Across all diagnostic categories: females, whites, and young inmates (1 8-29
years) were prescribed SSRIs more frequently than their counterparts; males and
Hispanics exhibited elevated proportions of non-treatment; and blacks were more
frequently prescribed TCA only therapy than other inmates.
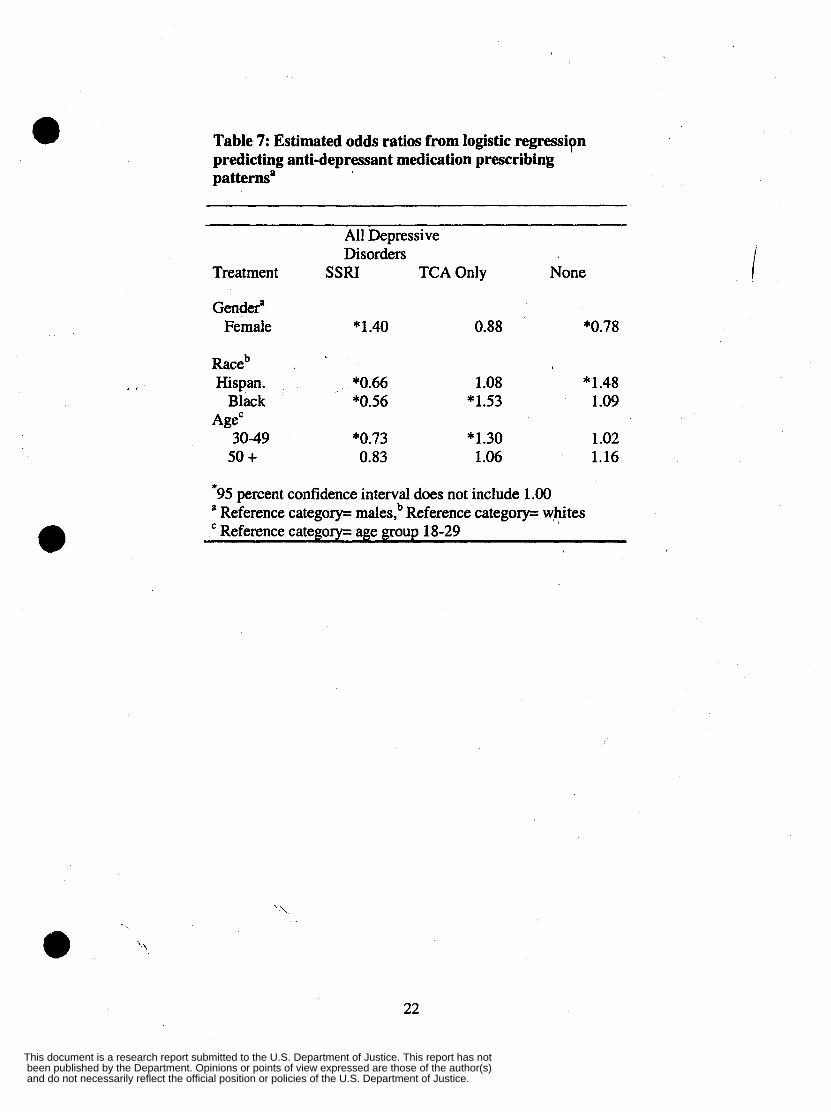
Our logistic regression models (table 7) predicting anti-depressant medication
prescribing patterns show that females were more likely than males to be prescribed e 6
and do not necessarily reflect the official position or policies of the U.S. Department of Justice. been published by the Department. Opinions or points of view expressed are those of the author(s) This document is a research report submitted to the U.S. Department of Justice. This report has not
SSRIs, but were less likely than males to be prescribed no pharmacotherapy. Relative to
whites (the referent), both blacks and Hispanics were less likely to be p,laced on SSFUs,
but were more likely to have been prescribed no anti-depressant treatment. Blacks,
however, were more likely to be prescribed tricyclic anti-depressants than either whites
or Hispanics. Prison inmates who were between the ages of 30-49 exhibited a reduced
number of SSRI prescriptions but an elevated percentage of tricyclic anti-depressant
prescriptions. Additional analyses of this topic were conducted and are presented in
manuscript number 5.
I .
Compliance with Antidepressant Medication
We also examined antidepressant medication compliance scores among inmates
with depressive disorders (table 8). Univariate analysis indicated that antidepressant
medication compliance scores did not fall into a normal distribution. We decided,
therefore, to use a nonparametric one-way analysis of variance procedure, the Kruskal- a Wallis test, to assess differences across the independent variables. When the Kruskal-
Wallis test was significant at the .05 level, pairwise comparisons were made using the
Wilcoxon rank-sum test. The overall median compliance score was .79. Inmates treated
with tricyclic antidepressants had a higher median score than inmates treated with SSRIs
(p<.05); men had a higher median score than women (pc.05); Hispanics had a lower
median score than blacks (p<.05); and compliance scores increased with age (pc.05).
Except for comparison of scores for Hispanics versus blacks, all of these associations
were also found in each of the depressive disorder subgroups.
To determine whether these associations persisted when all of the variables under
study were controlled for, we used a logistic regression model assessing medication
7
and do not necessarily reflect the official position or policies of the U.S. Department of Justice. been published by the Department. Opinions or points of view expressed are those of the author(s) This document is a research report submitted to the U.S. Department of Justice. This report has not
compliance scores above 50 percent (table 9). The model showed that for each
depressive disorder, inmates for whom tricyclic antidepressants were prescribed were
more likely to have compliance scores above 50 percent than those for whom SSRIs were
prescribed. However, the higher likelihood,yas statistically significant in only two of the
dsease categories: bipolar disorder (RR=2.04,95% CI=1.21,3.42) and all depressive
disorders combined (RR=1.52,95% CI=1.17, 1.97).
Likewise, men were significantly more likely than women to have compliance
scores above 50 percent, for all depressive disorders (RR=2.01 ,95% CI=1.51,2.66);
major depression (RR=2.15,95% CI=1.42,3.26); dysthymia (RR=1.77,95% CI=1.07, I .
2.92); and bipolar disorder (RR=2.04,95% CI=1.21,3.42). Moreover, for each disease
subgroup, age was positively associated with the likelihood of having a compliance score
above 50 percent, although this finding was not statistically significant. Only minor
differences in this outcome were associated with race. '
Anti-psvchotic Medication Prescribing Patterns in Inmates
To examine anti-psychotic prescribing patterns in the TDCJ, we assessed a
cohort of 3,750 prison inmates who were: 1) incarcerated for any during 1998; 2)
diagnosed with either a schizophrenic or nonschizophrenic psychotic disorder;
and 3) prescribed antipsychotic medication during 1998. Additional analyses and
discussion of this topic are presented in manuscript number 6. Diagnoses of all
psychotic disorders were made by physicians or mid-level practitioners at the time
of each inmate's initial evaluation and/or subsequent medical encounters. We
examined two broad classes of antipsychotic agents, typical and atypical. Typical
1-
8
and do not necessarily reflect the official position or policies of the U.S. Department of Justice. been published by the Department. Opinions or points of view expressed are those of the author(s) This document is a research report submitted to the U.S. Department of Justice. This report has not
antipsychotics consisted of any of the following: chlorpromazine, fluphenazine,
haloperidol, mesoridazine, molindone, perphenazine, thioridazine, thiothixene, m and trifluoperazine. Atypical antipsychotics consisted of clozapine, olanzapine,
risperidone, and quetiapine. I
Table 10 shows that among inmates diagnosed with schizophrenic disorders who
were treated with antipsychotic agents, 85.4 percent were treated with typical agents
only, and 14.6 percent were treated with atypical antipsychotic agents. Lkewise, among
those with non-schizophrenic Gychotic disorders who were treated with antipsychotic
medication, 89.3 percent were treated with typical agents only, and 10.7 percent were
prescribed atypical agents. Among both subgroups: females, blacks, and non-violent
criminals, were prescribed atypical antipsychotic agents less frequently than their
counterparts. Among the schizophrenic inmates, the youngest age group (18-29) has the
lowest proportion of inmates prescribed atypical antipsychotic agents. Among non-
schizophrenic psychotic inmates, however, the age 30-49 year-old subgroup had the
lowest proportion of patients prescribed the atypical agents. Finally, among inmates with
both schizophrenic and non-schizophrenic psychotic disorders, those incarcerated for
@ '
violent offenses were prescribed atypical antipsychotics slightly more frequently than
those incarcerated for nonviolent crimes. Examination of the ninety-five percent
confidence intervals associated with all of the aforementioned estimates indicates that
only females exhibited a decrease in antipsychotic use that reached statistical
significance.
Our logistic regression analysis (table 11) shows that among those diagnosed with
schizophrenic disorders, only female gender and black race were both positively
predictive of standard antipsychotic agent prescription. Conversely, both of these factors
were negatively predictive of the outcome, novel anti-psychotic prescription. Among
inhates diagnosed with non-schizophrenic psychotic disorders, black race and female e 9
and do not necessarily reflect the official position or policies of the U.S. Department of Justice. been published by the Department. Opinions or points of view expressed are those of the author(s) This document is a research report submitted to the U.S. Department of Justice. This report has not
gender were again both positively predictive of typical anti-psychotic prescription; and
negatively predictive of atypical anti-psychotic prescription. I
Medication Adherence and Prescribing Patterns among Inmates with Diabetes
Mellitus
Our study of antidiabetic agent prescribing practices and adherence among
diabetic prison inmates indicates that 33 percent of the study sample was
prescribed insulin only, 38 percent was prescribed oral hypoglycemic agents
(OHA) only, 13 percent were prescribed both insulin and OHA, and 13 perecnt
received no medication. The median adherence rate with drug therapy were 61
percent for insulin only, and 66 percent for OHA only. For combination therapy,
the medm adherence rate was 56 percent for insulin and 66 percent for OHA.
e We used a logistic regression to assess prescribing patterns among adult
diabetic inmates. Compmd to whites, black inmates exhibited exhibited elevated
odds of insulin only prescriptions, while Hispanics exhibited lower odds.
Compared to the youngest age group, the two older groups of diabetic inmates
exhibited significantly lower odds of insulin only prescriptions. Compared to
whites, Latinos had lower odds of OHA only prescriptions, and compared to the
youngest age category, the two older groups had elevated odds of OHA only
prescriptions. No differences were apparent for combined therapy, however, both
African American and Latinos had lower odds of no medication prescription, in
comparison to whites. Inmates aged fifty and over had lower odds of no
,prescription rnedication'than either of the younger age groups.
10
and do not necessarily reflect the official position or policies of the U.S. Department of Justice. been published by the Department. Opinions or points of view expressed are those of the author(s) This document is a research report submitted to the U.S. Department of Justice. This report has not
Health Care Management and Policy Recommendations
0 The aforementioned findings hold a number of important implications for
correctional administrators and clinicians. The implications listed below are
representative but not exhaustive of the those generated by the study.
Our findings that more than 30 percent of inmates with CD4 counts below
500 mm3 were not prescribed highly active antiretroviral therapy in 1998 prompts
a number of questions that should be investigated. First, now that HAART , .
treatment has become more widely used in the general medical community, do the
current treatment patterns among prison inmates reflect this trend. Our findings
indicate that there were no variations in prescribing patterns according to race,
age, or gender indicate that it will not be important to focus on one demographic
group in particular. However, it will be important to examine the number of HIV-
infected inmates who refuse therapy and their reasons for doing so.
'
Diabetes
Our findings that compliance scores with both insulin and oral
hypoglycemic agents were lowest among inmates in the youngest age group (18-
29) indicates that it may be important to target these young inmates with
educational interventions. It is possible that such rates may be driven, in part, by
lack of knowledge, denial of the seriousness of diabetes, andor fatalistic attitudes
' on the part of younger inmates.
@ 11
and do not necessarily reflect the official position or policies of the U.S. Department of Justice. been published by the Department. Opinions or points of view expressed are those of the author(s) This document is a research report submitted to the U.S. Department of Justice. This report has not
DeDression
We found that inmates age 50 and over with a diagnosis of major depression were
less frequently prescribed pharmacotherap)”than their younger aged counterparts. In
view of their elevated rates of depression, it will be important to determine what factors
contribute to the low medication rate in older inmates.
Psychotic Disorders
Our findings indicate that blacks were prescribed atypical antipsychotic
medication less frequently than whtes and Hispanics. In view of previous reports that
blacks are at increased risk for tardive dyskinesia, a side effect associated with many
typical antipsychotic agents, it will be important to understand the driving forces behind
these presciibing differences. e ’
e ,
12
and do not necessarily reflect the official position or policies of the U.S. Department of Justice. been published by the Department. Opinions or points of view expressed are those of the author(s) This document is a research report submitted to the U.S. Department of Justice. This report has not
Published Manuscripts
1) Baillargeon J, Black S, Pulvino J, Dunn K. (2000). The Disease Profile of Texas
Prison Inmates. Annals of Euidemiology, 10: 74-80.
- Note: The above manuscript was the lead article and featured a guest editorial in
Annals of Epidemiolo& (considered one of the top journals in the field of
Epidemiolgy)
2) Baillargeon J, Borucki M, Zepeda S, Jenson H, Leach C. Antiretroviral
prescribing patterns in the Texas prison system. Clinical Infectious Disease, 3 1.
3) Baillargeon J, Borucki M, Williamson J, Dunn K. (1999). Detenninents of HlV-
related survival among Texas prison inmates. AIDS Patient Care and STDs, 13: 0 355-361.
4) Baillargeon J, Borucki M, Grady J. (1999). Immunologic predictors of HIV-
related survival among Texas prison inmates. AIDS Patient Care and STDs, 14:
183-1 88.
5 ) Baillargeon J, Black S, Contreras S, Grady J, Pulvino J. (2000) Antidepressant
prescribing patterns for prison inmates with depressive disorders. Journal of
Affective Disorders (in press)
6) Baillargeon J, Contreras S, Grady J, Black S, Murray 0. (2000). Compliance with
antidepressant medication among prison inmates with depressive disorders.
Psychiatric Services, 51, 1444-1446. e ;
13
and do not necessarily reflect the official position or policies of the U.S. Department of Justice. been published by the Department. Opinions or points of view expressed are those of the author(s) This document is a research report submitted to the U.S. Department of Justice. This report has not
Manuscripts in Press
1) Baillargeon J, Contreras S. Antipsychotic prescribing patterns in the Texas Prison
system. Journal of the American Adademv of Psychiatry and the Law (in press,
to be published March 2001).
2) Baillargeon J, Linton A, Black S, Zepeda S, Grady J. Medication prescribing and
adherence patterns among prison inmates with diabetes mellitus. Journal of
Correctional Health C i e
Manuscripts Under Review
1) Baillargeon J, Kelley M, Lichtenstein M, Jenson H. Prevalence of tuberculosis in
the Texas prison system (submitted to Clinical Infectious Disease).
2) Black S, Baillargeon J, Dunn K. Disease prevalence in older prison inmates.
American Journal of Public Health (submitted July 1999).
Conference Presentations
1) Baillargeon J, Linton A, Black S, Zepeda S, Grady J. Medication prescribing and
adherence patterns among prison inmates with diabetes mellitus. Pvsented at the
Society for Epidemiolgic Research, Annual Conference, Seattle WA, June 2000.
2) Baillargeon J, Borucki M, Zepeda S, Jenson H, Leach C. Antiretroviral
prescribing patterns in the Texas prison system. Presented at the American
e College of Epidemiology, Atlanta GA, August 2000.
'\
i.
14
and do not necessarily reflect the official position or policies of the U.S. Department of Justice. been published by the Department. Opinions or points of view expressed are those of the author(s) This document is a research report submitted to the U.S. Department of Justice. This report has not
Seminar Presentations
1) Baillargeon J, Kelley M, hchtenstein M, Jenson H. Management of Tuberculosis
in the Texas Prison System. Research Seminar, Department of Pediatrics,
University of Texas Health Science Center at San Antonio, May 2001.
I .'
15
and do not necessarily reflect the official position or policies of the U.S. Department of Justice. been published by the Department. Opinions or points of view expressed are those of the author(s) This document is a research report submitted to the U.S. Department of Justice. This report has not
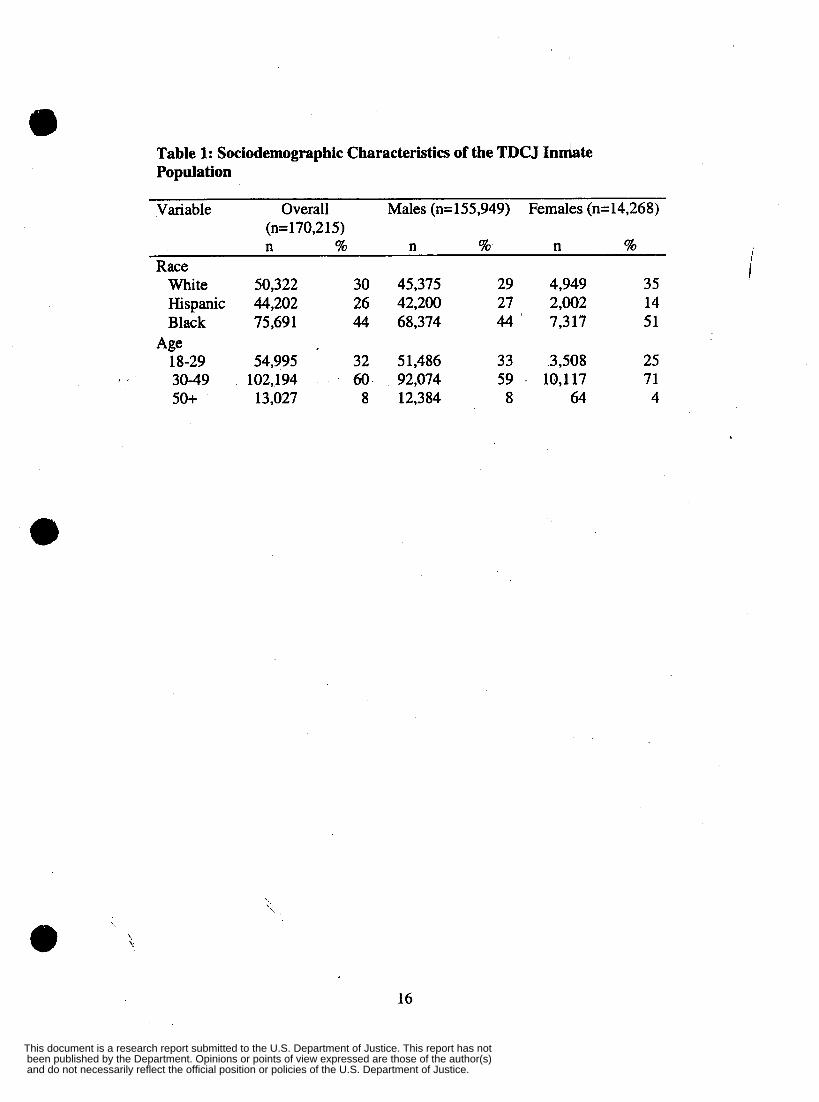
Table 1: Sociodemographic Characteristics of the TDC J Indate Population
Variable Overall Males (n=155,949) Females (n=14,268) (n= 170,2 15) n % n % n %
Race White 50,322 30 45,375 29 4,949 35 Hispanic 44,202 26 42,200 27 2,002 14 Black 75,69 1 44 68,374 44 7,3 17 51
18-29 54,995 32 51,486 33 3,508 25 3049 102,194 60 92,074 59 . 10,117 71 50+ 13,027 8 12,384 8 64 4
Age
'. e 4
16
and do not necessarily reflect the official position or policies of the U.S. Department of Justice. been published by the Department. Opinions or points of view expressed are those of the author(s) This document is a research report submitted to the U.S. Department of Justice. This report has not
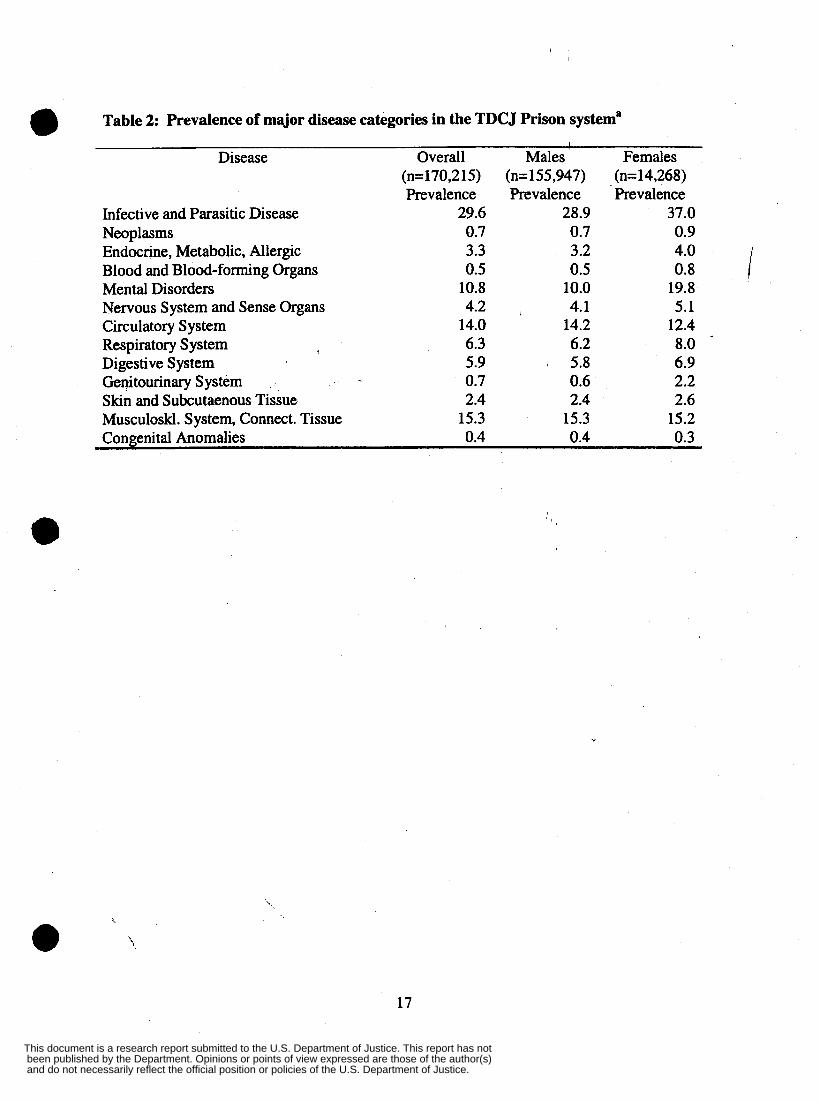
0 Table 2: Prevalence of major disease categories in the TDCJ Prison systema 1
Disease Overall Mdes ' Females (n=170,2 15) (n= 155,947) (n= 14,268) Prevalence Prevalence Prevalence
Infective and Parasitic Disease 29.6 28.9 37.0
Endocrine, Metabolic, Allergic 3.3 3.2 4.0 Blood and Blood-forming Organs 0.5 0.5 0.8 Mental Disorders 10.8 10.0 19.8 Nervous System and Sense Organs 4.2 , 4.1 5.1 Circulatory System 14.0 14.2 12.4 Respiratory System 6.3 6.2 8.0 Digestive System 5.9 I 5.8 6.9
Skin and Subcutaenous Tissue 2.4 2.4 2.6 Musculoskl. System, Connect. Tissue 15.3 15.3 15.2 Congenital Anomalies 0.4 0.4 0.3
Neoplasms 0.7 0.7 0.9
Genitourinary System 0.7 0.6 2.2
Y
17
and do not necessarily reflect the official position or policies of the U.S. Department of Justice. been published by the Department. Opinions or points of view expressed are those of the author(s) This document is a research report submitted to the U.S. Department of Justice. This report has not
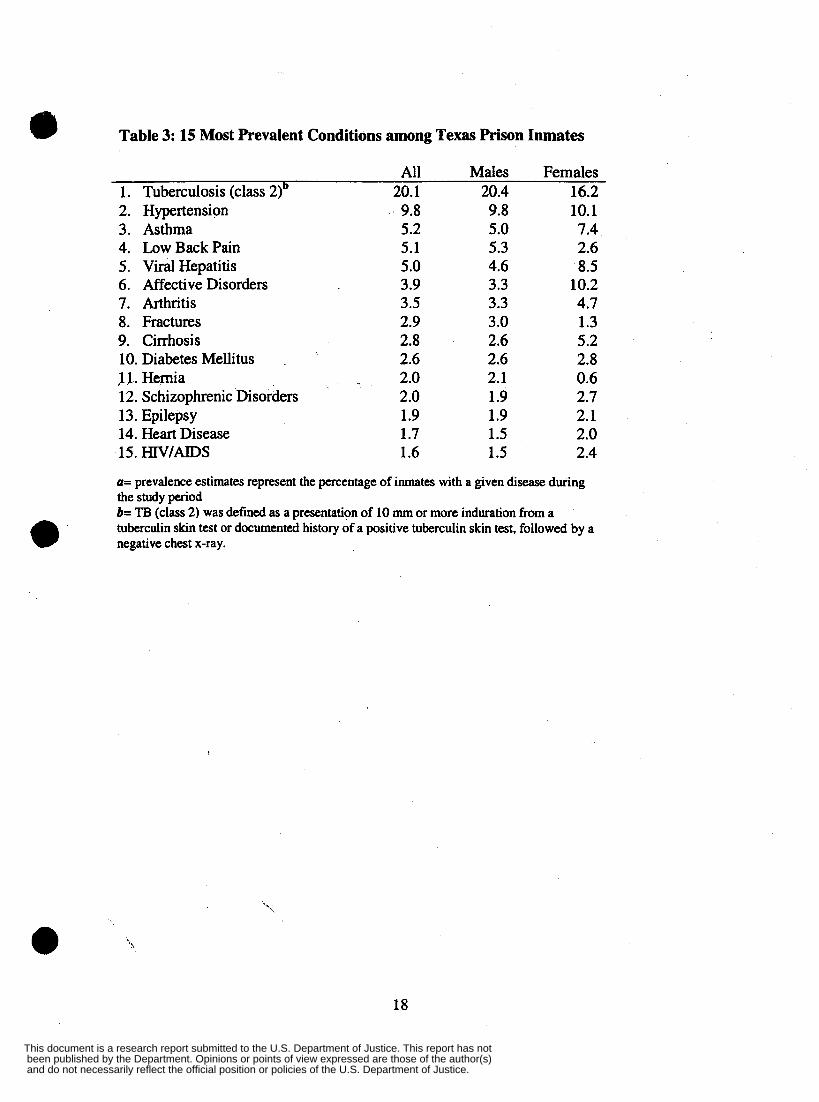
a Table 3: 15 Most Prevalent Conditions among Texas Prison Inmates
All Males Females 1. Tuberculosis (class 2)b 20.1 20.4 16.2 2. Hypertension 3. Asthma 4. LowBackPain 5. Viral Hepatitis 6. Affective Disorders 7. Arthritis 8. Fractures 9. Cirrhosis 10. Diabetes Mellitus . 11. Hernia 12. Schizophrenic Disorders 13. Epilepsy 14. Heart Disease 15. HIVIAIDS
' 9.8 5.2 5.1 5 .O 3.9 3.5 2.9 2.8 2.6 2.0 2.0 1.9 1.7 1.6
9.8 5.0 5.3 4.6 3.3 3.3 3 .O 2.6 2.6 2.1 1.9 1.9 1.5 1.5
10.1 7.4 2.6 8.5
10.2 4.7 1.3 5.2 2.8 0.6 2.7 2.1 2.0 2.4
(I= prevalence estimates represent the percentage of inmates with a given disease during the study period b= TB (class 2) was defined as a presentation of 10 mm or more induration from a tuberculin skin test or documented history of a positive tuberculin skin test, followed by a negative chest x-ray.
18
and do not necessarily reflect the official position or policies of the U.S. Department of Justice. been published by the Department. Opinions or points of view expressed are those of the author(s) This document is a research report submitted to the U.S. Department of Justice. This report has not
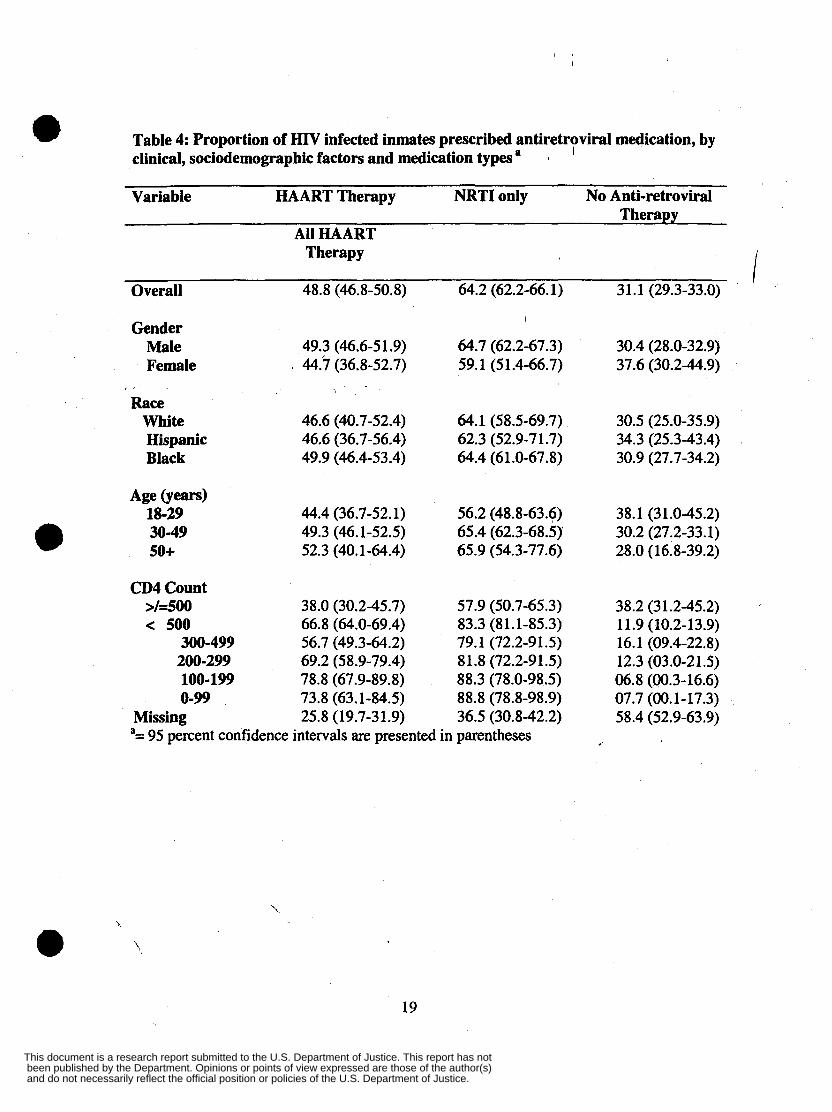
Table 4: Proportion of HIV infected inmates prescribed antiretroviral medication, by clinical, sociodemographic factors and medication types I
1
a Variable HAART Therapy NRTI only No Anti-retroviral
Therapy All HAART
I Therapy I
Overall 48.8 (46.8-50.8) 64.2 (62.2-66.1) 31.1 (29.3-33.0)
Gender I
Male 49.3 (46.6-5 1.9) 64.7 (62.2-67.3) 30.4 (28.0-32.9) Female I 44.7 (36.8-52.7) 59.1 (51.4-66.7) 37.6 (30.2-44.9)
Race White 46.6 (40.7-52.4) 64.1 (58.5-69.7) 30.5 (25.0-35.9) Hispanic 46.6 (36.7-56.4) 62.3 (52.9-7 1.7) 34.3 (25.3-43.4) Black 49.9 (46.4-53.4) 64.4 (61.0-67.8) 30.9 (27.7-34.2)
Age @ears) 18-29 44.4 (36.7-52.1) 56.2 (48.8-63.6) 38.1 (31.0-45.2) 30-49 49.3 (46.1-52.5) 65.4 (62.3-68.5) 30.2 (27.2-33.1) 0 50+ 52.3 (40.1-64.4) 65.9 (54.3-77.6) 28.0 (16.8-39.2)
CD4 Count >/=500 38.0 (30.2-45.7) 57.9 (50.7-65.3) < 500 66.8 (64.0-69.4) 83.3 (81.1-85.3)
300-499 56.7 (49.3-64.2) 79.1 (72.2-91.5) 200-299 69.2 (58.9-79.4) 81.8 (72.2-91.5) 100-199 78.8 (67.9-89.8) 88.3 (78.0-98.5) 0-99 73.8 (63.1-84.5) 88.8 (78.8-98.9)
Missing 25.8 (19.7-31.9) 36.5 (30.8-42.2) a= 95 percent confidence intervals are presented in parentheses
38.2 (31.2-45.2) 11.9 (10.2-13.9) 16.1 (09.4-22.8) 12.3 (03.0-21.5) 06.8 (00.3-16.6) 07.7 (00.1-17.3) 58.4 (52.9-63.9)
e '.
19
and do not necessarily reflect the official position or policies of the U.S. Department of Justice. been published by the Department. Opinions or points of view expressed are those of the author(s) This document is a research report submitted to the U.S. Department of Justice. This report has not
0 Table 5: Estimated odds ratios from logistic regression prediTting antiretroviral medication prescribing patterns’
Treatment All HAART NRTI only No Therapy Antiretroviral
Therapy Gender’
Raceb Female 0.95 (0.71-1.27) 0.89 (0.66-1.21) 1.22 (0.89-1.66)
Hispan. 0.97 (0.68-1.38) 0.89 (0.61-1,.28) 1.28 (0.91-1.45) Black 1.09 (0.88-1.34) 0.91 (0.73-1.14) 1.15 (0.91-1.46)
Age (years) , 30-49 1.06 (0.82-1.37) 1.38 (1.06-1.80) 0.76 (0.58-1.00) 50 + 1.08 (0.70-1.70) 1.31 (0.82-2.10) 0.73 (0.44-1.20)
CD4 countd 300-499 2.14 (1.65-2.78) 2.73 (2.04-3.64) 0.3 1 (0.23-0.43) 200-299 3.66 (2.63-5.09) 3.23 (2.23-4.70) 0.23 (0.15-0.35) 100- 199 6.06 (4.16-8.83) 5.30 (3.37-8.32) 0.12 (0.07-0.21) 0-99 4.56 (3.21-6.47) 5.64 (3.60-8.85) II 0.14 (0.08-0.23) Missing 0.57 (0.44-0.73) 0.41 (0.32-0.52) 2.30 (1.81-2.94)
-95 percent confidence interval does not include 1.00
age group 18-29, Reference category= 500+ a Reference category= males: Reference category= whites, C Reference category=
i.
20
and do not necessarily reflect the official position or policies of the U.S. Department of Justice. been published by the Department. Opinions or points of view expressed are those of the author(s) This document is a research report submitted to the U.S. Department of Justice. This report has not
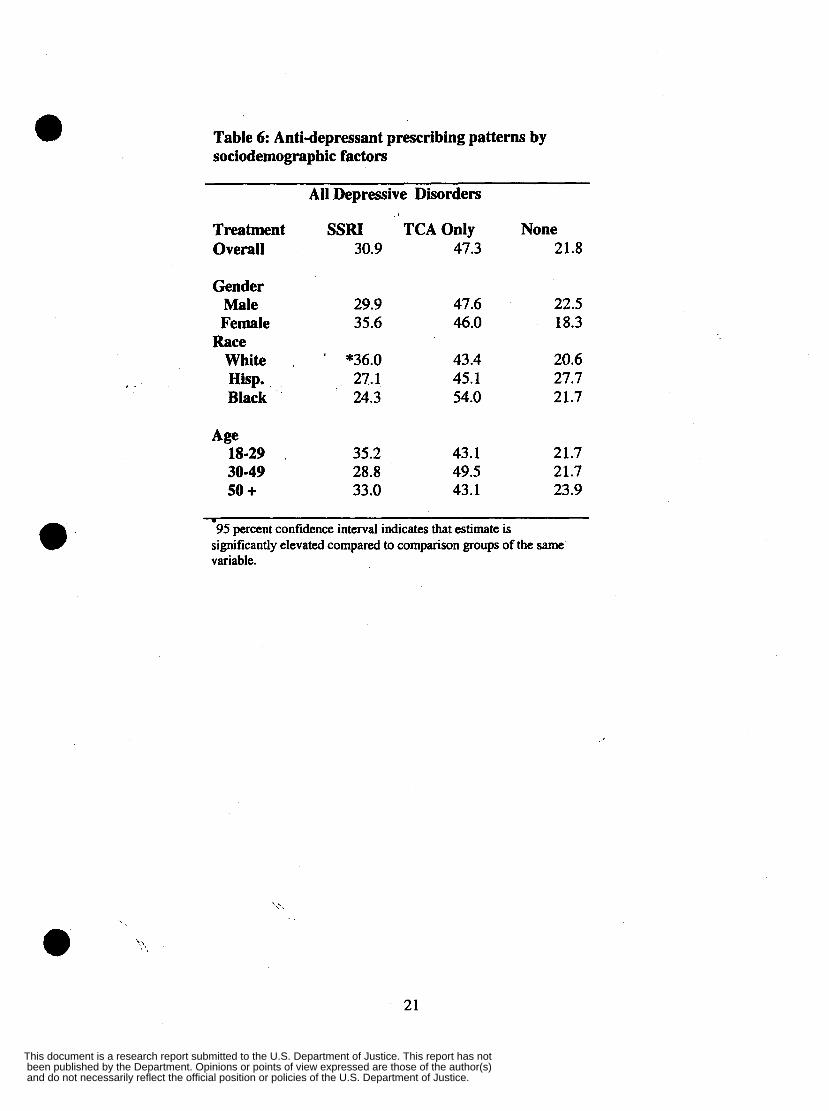
Table 6: Anti-depressant prescribing patterns by sociodernographic factors
All Depressive Disorders
Treatment SSRI TCA Only None Overall 30.9 47.3 21.8
Gender Male 29.9 47.6 22.5 Female 35.6 46.0 18.3
White , ' *36.0 43.4 20.6 , ' Hisp. 27.1 45.1 27.7
Black 24.3 54.0 21.7
Race
Age 18-29 . 35.2 43.1 21.7 30-49 28.8 49.5 21.7 50 + 33.0 43.1 23.9
I
95 percent confidence interval indicates that estimate is significantly elevated compared to comparison groups of the same variable.
21
and do not necessarily reflect the official position or policies of the U.S. Department of Justice. been published by the Department. Opinions or points of view expressed are those of the author(s) This document is a research report submitted to the U.S. Department of Justice. This report has not
, .
Table 7: Estimated odds ratios from logistic regressipn predicting anti-depressant medication prescribing patternsa
All Depressive Disorders
Treatment SSRI TCA Only None
Gendef I
Female * 1.40 0.88 *0.78
Raceb Hispan. *0.66 1.08 * 1.48
Black *OS6 * 1.53 1.09 AgeC
30-49 *0.73 *1.30 1.02 50 + 0.83 1.06 1.16
*95 percent confidence interval does not include 1.00 Reference category= males: Referemce category= wfii tes Reference category= age group 18-29
a
C
22
and do not necessarily reflect the official position or policies of the U.S. Department of Justice. been published by the Department. Opinions or points of view expressed are those of the author(s) This document is a research report submitted to the U.S. Department of Justice. This report has not
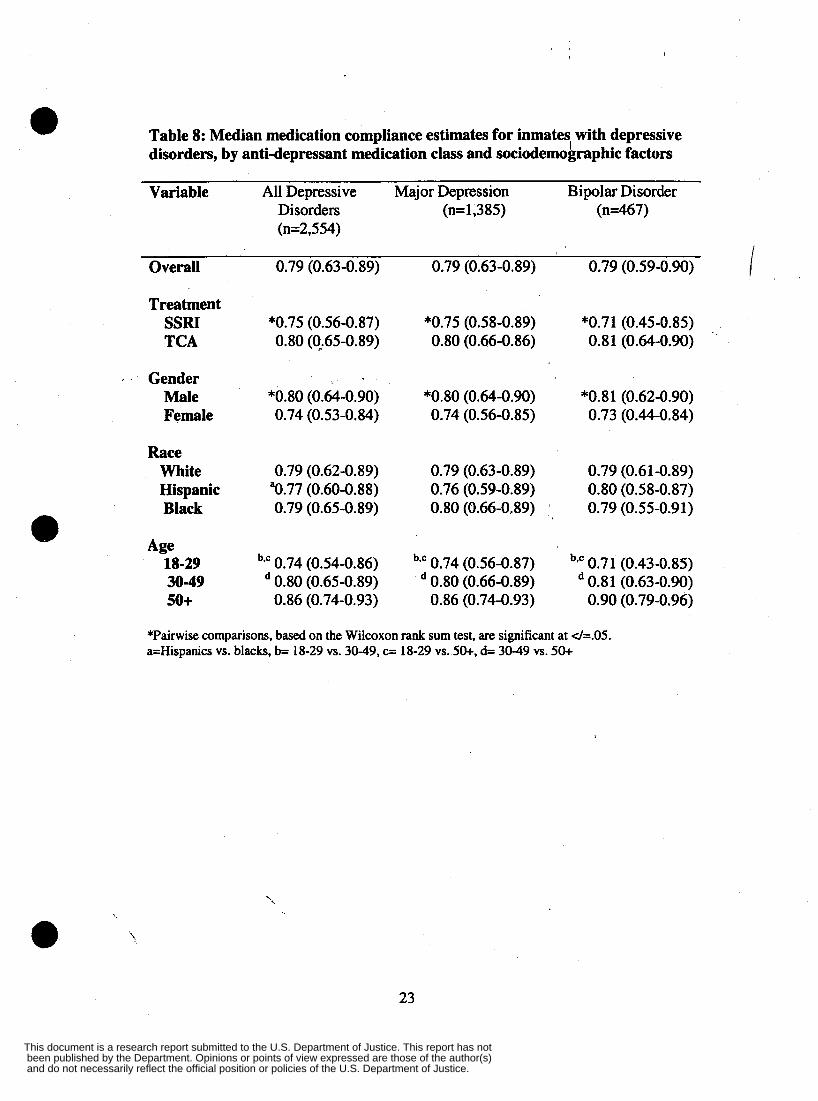
Table 8: Median medication compliance estimates for inmates with depressive disorders, by anti-depressant medication class and sociodemographic factors
e Variable All Depressive Major Depression Bipolar Disorder
Disorders (n=l,385) (n467) (n=2,554)
Overall 0.79 (0.63-0.89) 0.79 (0.63-0.89) 0.79 (0.59-0.90)
Treatment SSRI *0.75 (0.56-0.87) *0.75 (0.58-0.8'9) *0.71 (0.45-0.85) TCA 0.80 (0.65-0.89) 0.80 (0.66-0.86) 0.8 1 (0.64-0.90)
I Gender Male *0.80 (0.64-0.90) *0.80 (0.64-0.90) *0.81 (0.62-0.90) Female 0.74 (0.53-0.84) 0.74 (0.56-0.85) 0.73 (0.44-0.84)
Race White 0.79 (0.62-0.89) 0.79 (0.63-0.89) 0.79 (0.61-0.89) Hispanic "0.77 (0.60-0.88) 0.76 (0.59-0.89) 0.80 (0.58-0.87) Black 0.79 (0.65-0.89) 0.80 (0.66-0.89) 0.79 (0.55-0.91)
Age 18-29 b*c 0.74 (0.54-0.86) bsc 0.74 (0.56-0.87) 0.71 (0.43-0.85) 30-49 0.80 (0.65-0.89) 0.80 (0.66-0.89) 0.81 (0.63-0.90)
e 50+ 0.86 (0.74-0.93) 0.86 (0.74-0.93) 0.90 (0.79-0.96)
*Pairwise comparisons, based on the Wilcoxon rank sum test, are significant at d=.05. a=Hispanics vs. blacks, b= 18-29 vs. 30-49, c= 18-29 vs. 50+, d= 30-49 vs. 50+
23
and do not necessarily reflect the official position or policies of the U.S. Department of Justice. been published by the Department. Opinions or points of view expressed are those of the author(s) This document is a research report submitted to the U.S. Department of Justice. This report has not

Table 9: Estimated odds ratios from logistic regression predicting medication compliance scores below 50 percent
a All Depressive Major Depression Bipolar Disorder
Disorders Pharmacotherapy
SSRI *1.52 (1.17-1.97) 1.26 (0.86-1.83) *2.04 (1.21-3.42)
Gender Female *2.01 (1.51-2.66) *2.15 (1.42-3.26) *2.23 (1.30-3.82)
Race Black *0.73 (0.57-0.94) 0.76 (0.54-1.07) 1.35 (0.75-2.42)
, Hispanic 1.05 (0.75-1.48) 1.16 (0.74-1.83) 0.84 (0.30-2.36)
Age 30-49 *OS0 (0.39-0.63) *0.49 (0.35-0.68) *0.43 (0.26-0.73) 50 + *0.24 (0.13-0.44) *0.22 (0.10-0.50) 0.26 (0.05-1.19)
* 95 percent confidence interval does not include one. aReference category= TCA, Reference category= males, Reference category= whites, Reference category= age group 18-29 0
24
and do not necessarily reflect the official position or policies of the U.S. Department of Justice. been published by the Department. Opinions or points of view expressed are those of the author(s) This document is a research report submitted to the U.S. Department of Justice. This report has not
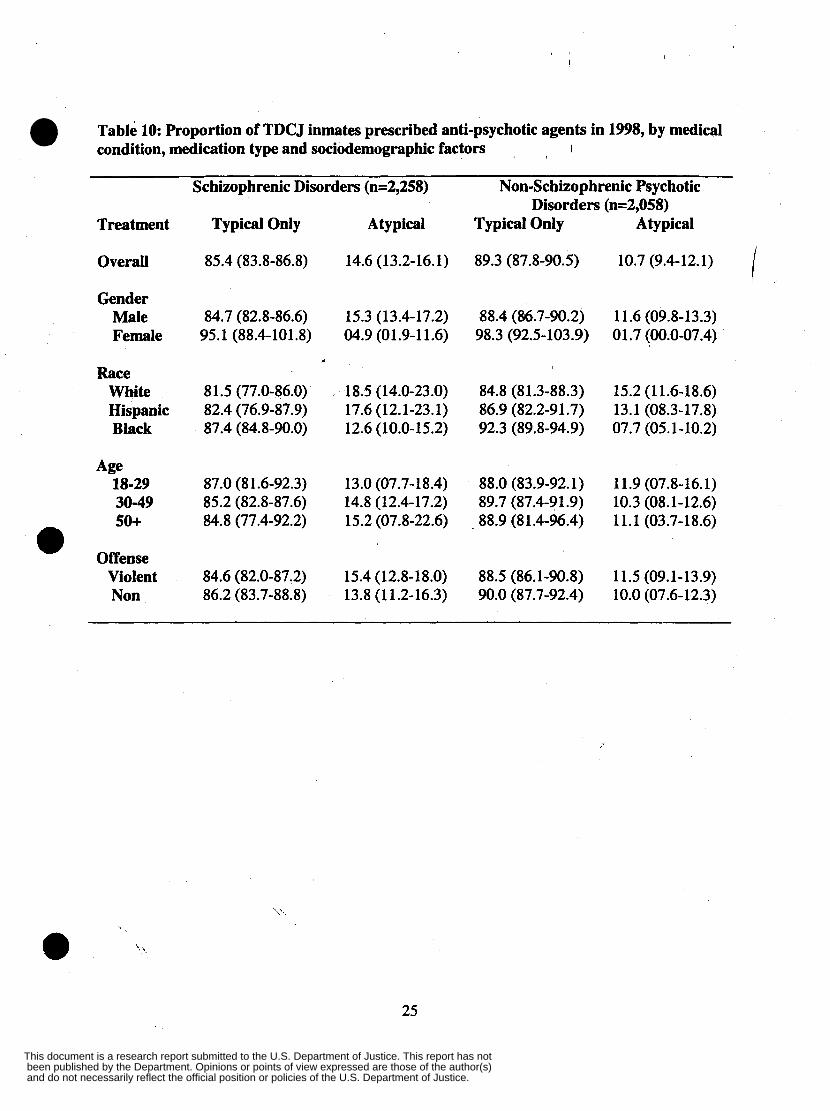
Table 10: Proportion of TDCJ inmates prescribed anti-psychotic agents in 1998, by medical condition, medication type and sociodemographic factors I
Schizophrenic Disorders (n=2,258) Non-Schizophrenic Psychotic Disorders (n=2,058)
Treatment Typical Only Atypical Typical Only Atypical
Overall 85.4 (83.8-86.8) 14.6 (13.2-16.1) 89.3 (87.8-90.5) 10.7 (9.4-12.1)
Gender Male 84.7 (82.8-86.6) 15.3 (13.4-17.2) 88.4 (84.7-90.2) 11.6 (09.8-13.3) Female 95.1 (88.4-101.8) 04.9 (01.9-1 1.6) 98.3 (92.5-103.9) 01.7 (00.0-07.4)
Race White 81.5 (77.0-86.0) 18.5 (14.0-23.0) 84.8 (81.3-88.3) 15.2 (1 1.6-18.6) Hispanic 82.4 (76.9-87.9) 17.6 (12.1-23.1) 86.9 (82.2-91.7) 13.1 (08.3-17.8) Black 87.4 (84.8-90.0) 12.6 (10.0-15.2) 92.3 (89.8-94.9) 07.7 (05.1-10.2)
Age 18-29 87.0 (81.6-92.3) 13.0 (07.7-18.4) 88.0 (83.9-92.1) 11.9 (07.8-16.1) 30-49 85.2 (82.8-87.6) 14.8 (12.4-17.2) 89.7 (87.4-91.9) 10.3 (08.1-12.6) so+ 84.8 (77.4-92.2) 15.2 (07.8-22.6) ~ 88.9 (81.4-96.4) 11.1 (03.7-18.6)
Offense e Violent 84.6 (82.0-87.2) 15.4 (12.8-18.0) 88.5 (86.1-90.8) 11.5 (09.1-13.9) Non 86.2 (83.7-88.8) 13.8 (1 1.2-16.3) 90.0 (87.7-92.4) 10.0 (07.6-12.3)
e 25
and do not necessarily reflect the official position or policies of the U.S. Department of Justice. been published by the Department. Opinions or points of view expressed are those of the author(s) This document is a research report submitted to the U.S. Department of Justice. This report has not
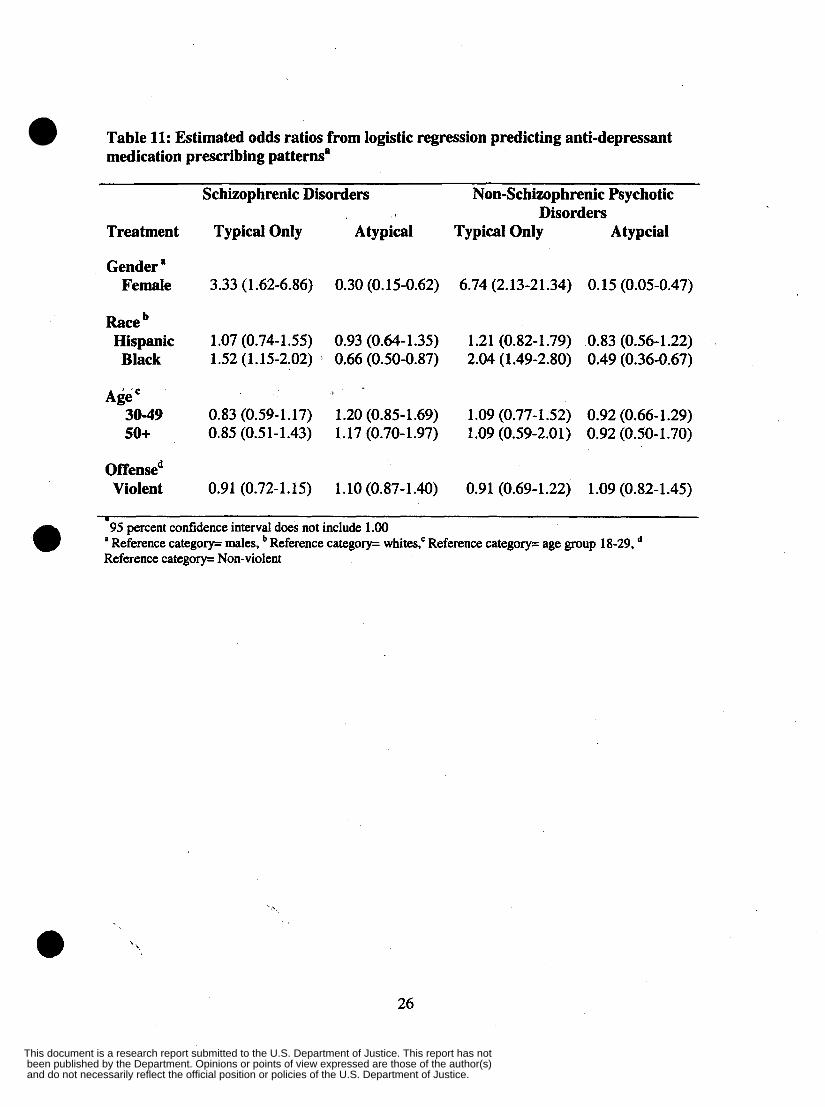
Table 11: Estimated odds ratios from logistic regression predicting anti-depressant medication prescribing patterns'
Schizophrenic Disorders Non-Schizophrenic Psychotic
Treatment Typical Only A typical Typical Only Atypcial Disorders
Gender ' Female 3.33 (1.62-6.86) 0.30 (0.15-0.62) 6.74 (2.13-21.34) 0.15 (0.05-0.47)
Race Hispanic 1.07 (0.74-1.55) 0.93 (0.64-1.35) 1.21 (0.82-1.79) 0.83 (0.56-1.22) Black 1.52 (1.15-2.02) 0.66 (0.50-0.87) 2.04 (1.49-2.80) 0.49 (0.36-0.67)
Age 30-49 0.83 (0.59-1.17) 1.20 (0.85-1.69) 1.09 (0.77-1.52) 0.92 (0.66-1.29) so+ 0.85 (0.51-1.43) 1.17 (0.70-1.97) 1.09 (0.59-2.01) 0.92 (0.50-1.70)
Offensed Violent 0.91 (0.72-1.15) 1.10 (0.87-1.40) 0.91 (0.69-1.22) 1.09 (0.82-1.45)
I
95 percent confidence interval does not include 1 .OO 0 . Reference category= males, Reference category= whites: Reference category= age group 18-29, Reference category= Non-violent
26
and do not necessarily reflect the official position or policies of the U.S. Department of Justice. been published by the Department. Opinions or points of view expressed are those of the author(s) This document is a research report submitted to the U.S. Department of Justice. This report has not
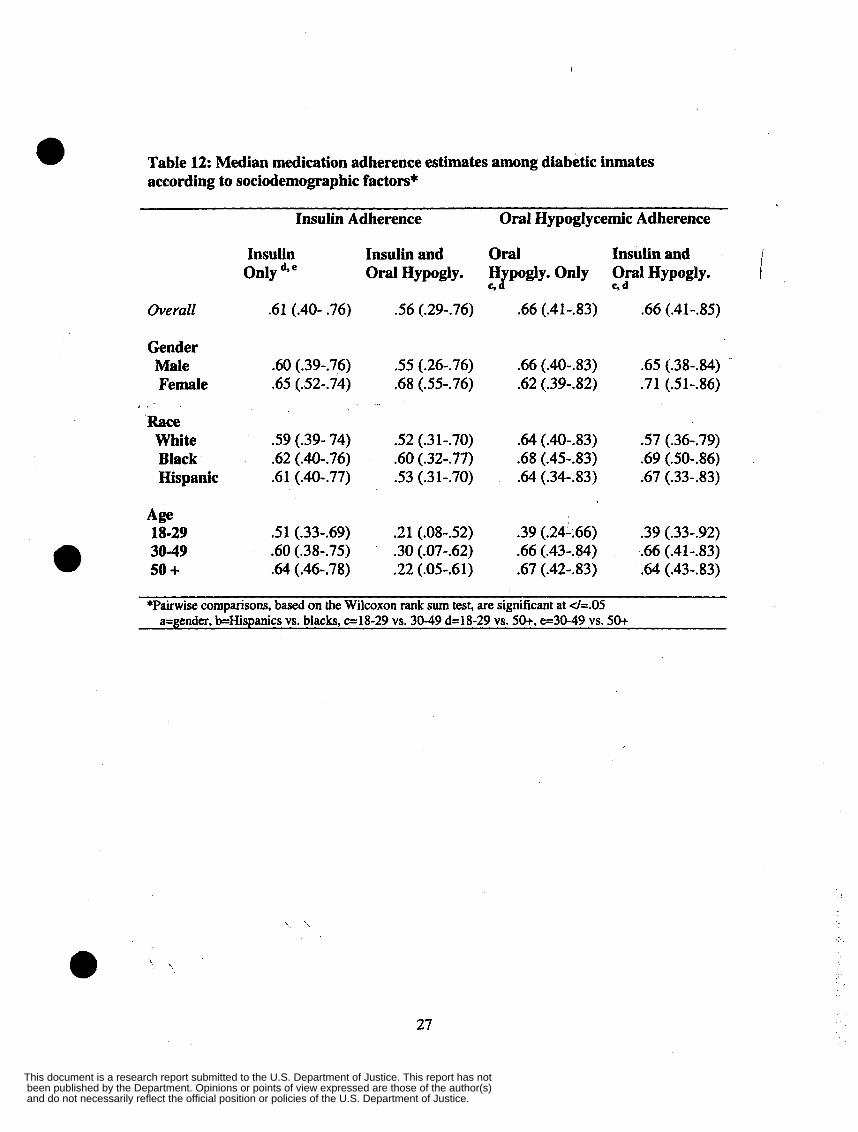
Table 12: Median medication adherence estimates among diabetic inmates according to sociodemographic factors*
0 Insulin Adherence Oral Hypoglycemic Adherence
I Insulin Insulin and Oral Insulin and Only d* e Oral Hypogly. H pogly. Only Oral Hypogly. J e,d e,
Overall .61 (.40- .76) .56 (.29-.76) .66 (.41-.83) -66 (.41-.85)
Gender Male Female
, . Race White Black Hispanic
Age 18-29 30-49 50 +
.60 (.39-.76)
.65 (S2-.74) . I.
.59 (.39- 74)
.62 (.40-.76)
.61 (.40-.77)
.51 (.33--69)
.60 (.38-.75)
.64 (.46-.78)
.55 (.26-.76)
.68 (.55-.76)
.52 (.31-.70)
.60 (.32-.77)
.53 (.3 1-.70)
.21 (.08-.52)
.30 (.07-.62)
.22 (.05-.61)
.66 (.40-.83)
.62 (.39-32)
.64 (.40-.83)
.68 (.45-.83)
.64 (.34-.83)
.39 (.24-.66)
.66 (.43-.84)
.67 (.42-.83)
.65 (.38-.84)
.71 (S1-.86)
.57 (.36-.79)
.69 (SO-.86)
.67 (.33-.83)
.39 (.33-.92)
.66 (.41-.83)
.64 (.43-.83)
*Pairwise comparisons, based on the Wilcoxon rank sum test, are significant at </=.05 a=gender, b=Hispanics vs. blacks, c=18-29 vs. 30-49 d=18-29 vs. 50+, e-30-49 vs. 50+
27
and do not necessarily reflect the official position or policies of the U.S. Department of Justice. been published by the Department. Opinions or points of view expressed are those of the author(s) This document is a research report submitted to the U.S. Department of Justice. This report has not
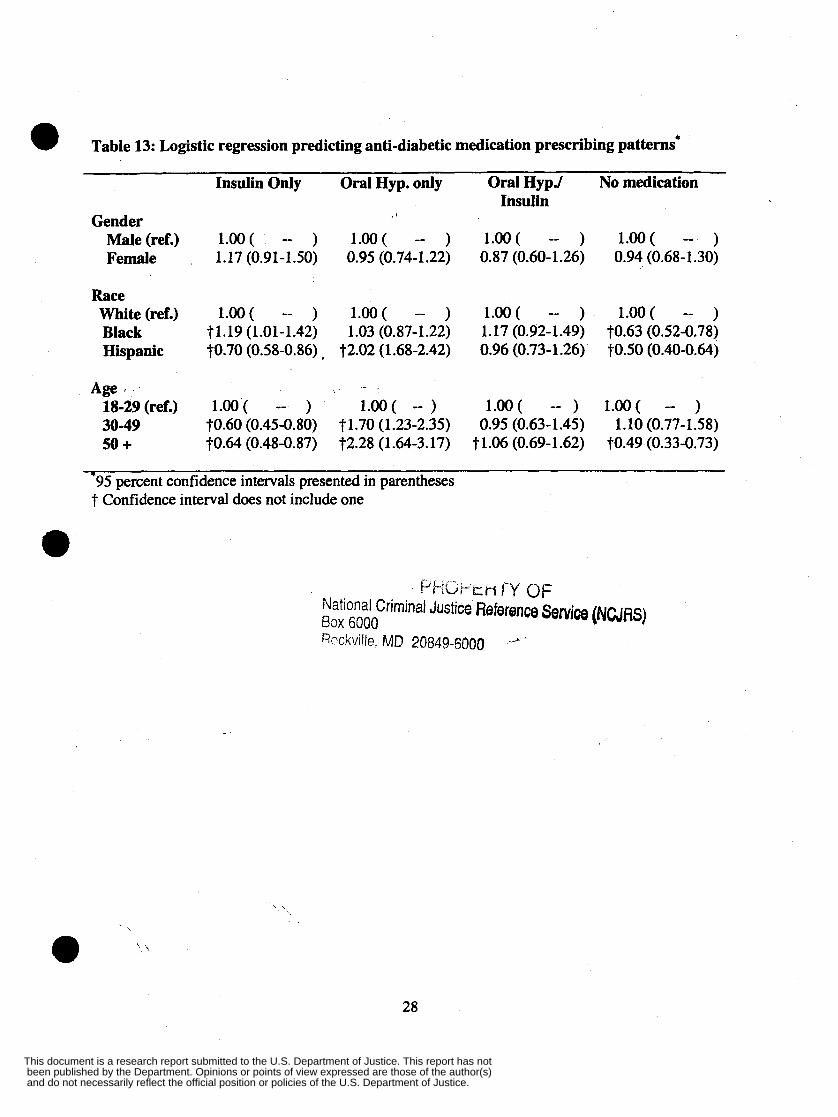
@ Table 13: Logistic regression predicting anti-diabetic medication prescribing patterns*
Insulin Only Oral Hyp. only Oral HypJ No medication Insulin
Gender Male (ref.) Female
Race White (ref.) Black Hispanic
Age I
18-29 (ref.)
50 + 30-49
l.oo( -- ) l.oo( -- ) l.oo( -- ) l.00( -- ) 1.17 (0.91-1.50) 0.95 (0.74-1.22) 0.87 (0.60-1.26) 0.94 (0.68-1.30)
l.oo( -- ) l.oo( -- ) l.oo( -- ) l .OO( -- ) 71.19 (1.01-1.42) 1.03 (0.87-1.22) 1.17 (0.92-1.49) t0.63 (0.52-0,78) t0.70 (0.58-0.86) , 72.02 (1.68-2.42) 0.96 (0.73-1 -26) t0.50 (0.40-0.64)
1.00 ( -- ) 1.00 ( -- ) l.oo( -- ) l.oo( -- ) t0.60 (0.45-0.80) t1.70 (1.23-2.35) 0.95 (0.63-1.45) 1.10 (0.77-1.58) t0.64 (0.48-0.87) t2.28 (1.64-3.17) 71.06 (0.69-1.62) t0.49 (0.33-0.73)
-95 percent confidence intervals presented in parentheses 7 Confidence interval does not include one
~.“p.ic.~ct-r j-y OF National Criminal Justice Reference Senrice (NCJRS) Box 6000 Rockville, MD 20849-6000
28
and do not necessarily reflect the official position or policies of the U.S. Department of Justice. been published by the Department. Opinions or points of view expressed are those of the author(s) This document is a research report submitted to the U.S. Department of Justice. This report has not