Embed Size (px)
Citation preview
CANADIAN COUNCIL OF MOTOR TRANSPORT
ADMINISTRATORS (CCMTA)
ADDRESSING HUMAN FACTORS IN THE
MOTOR CARRIER INDUSTRY IN CANADA
By
Pierre Thiffault (Ph.D.)
Chair of the Human Factors and Motor Carrier Safety Task Force.
May 2011
An important note for the reader The views expressed in this research report are the outcome of independent research, and should not be regarded as being the opinion or responsibility of CCMTA. The material contained in the report should not be construed in any way as policy adopted by CCMTA or indeed by any of CCMTA government members. The report may, however, be used by CCMTA as a reference in the development of policy.

Human Factors in the Motor Carrier Industry in Canada ii
Acknowledgement
The author wishes to express his gratitude to the members of CCMTA’s Human Factors and Motor Carrier Safety Task Force, who supported this project by providing important comments and suggestions. Membership
TC - P. Thiffault (Chair), QC – P. Gobeil (Co-chair) TC - P. Boase/A. Chouinard/S. Peddie YT – T. Erman PE – G. Miner ON – C. Brant/G. Stewart QC – E. Morasse BC – G. Gilks FMCSA – M. Walker CBA – D. Haire CTA – G. Wood Teamsters – P. Benson MCC – B. Crow/D. Carroll OBAC – J. Ritchie PMTC – B. Richards PSAC – P. Delaney HSRT – J. Goss CCMTA - V. Todd Special thanks to Sarah Peddie (Transport Canada) who had the patience of reviewing the entire document and providing editorial oversight. Sarah also completed data analysis on the material that was gathered in the phase II surveys. The author is also very grateful to Dr. Lawrence Lonero who provided important suggestions with regards to the section on decision errors, and to Dr. Peter Burns for his significant support concerning driver distraction. Finally, the author wishes to emphasize the important role played by Mrs. Valerie Todd from CCMTA, who provided constant help and support over the past three years, while this mandate was being conducted.

Human Factors in the Motor Carrier Industry in Canada iii
TABLE OF CONTENT
TABLE OF CONTENT ________________________________________________ III
LIST OF TABLES ____________________________________________________VII
LIST OF FIGURES __________________________________________________ VIII
EXECUTIVE SUMMARY _____________________________________________ III
INTRODUCTION_______________________________________________________1
1. PHASE I: PROBLEM ASSESSMENT ____________________________________3
1.1 ROAD SAFETY STUDIES ________________________________________________6 1.1.1 The Tri-Level Indiana study (1979) _________________________________ 6 1.1.2 The Unsafe Driving Act study (Hendricks et al., 2001) _________________ 8 1.1.3 Studies based on self-reports ______________________________________ 9
1.2 CMV CRASH CAUSATION STUDIES ______________________________________10 1.2.1 The LTCCS __________________________________________________ 10 1.2.2 FMCSA new analyses __________________________________________ 13 1.2.3 The ETAC study ______________________________________________ 15 1.2.4 The bus crash causation study (BCCS) _____________________________ 17 1.2.5 Best practices for truck safety (Jonah et al., 2009) ____________________ 18 1.2.6 Naturalistic studies _____________________________________________ 20 1.2.7 Identifying unsafe driver actions that lead to fatal car-truck crashes ______ 21 1.2.8 The ATRI study on predictors of crash involvement___________________ 22 1.2.9 Self-reported aberrant driving behaviors amongst truck drivers __________ 24
1.3 NATIONAL COLLISION DATABASE 2003-2007 _____________________________25 1.3.1 Driver condition in the NCDB database 2003-2007 ___________________ 28 1.3.2 Driver action in the NCDB database 2003-2007 ______________________ 30
1.4 INDIVIDUAL DIFFERENCES AND CRASH RISK _______________________________34 1.5 CMV CRASH CAUSATION STUDIES: GENERAL DISCUSSION ____________________35 1.6 KEY FINDINGS _____________________________________________________37
2. PHASE I: INTERVENTION LEADS ____________________________________39
2.1 RECOGNITION ERRORS _______________________________________________39 2.1.1 Driver fatigue _________________________________________________ 40
2.1.1.1 Inattention: fatigue or distraction? ______________________________41 2.1.1.2 What is fatigue? ____________________________________________42 2.1.1.3 The causes of driver fatigue ___________________________________43
2.1.1.3.1 The internal circadian time-of-day effect ____________________ 44 2.1.1.3.2 Time awake and time-on-task _____________________________ 45 2.1.1.3.3 Acute and cumulative sleep loss ___________________________ 46 2.1.1.3.4 Obstructive sleep apnea syndrome__________________________ 47 2.1.1.3.5 Road monotony ________________________________________ 48
2.1.1.4 Fatigue and individual differences ______________________________49
Human Factors in the Motor Carrier Industry in Canada iv
2.1.1.4.1 Extraversion ___________________________________________ 50 2.1.1.4.2 Sensation seeking _______________________________________ 51
2.1.1.5 Subjective fatigue, knowledge, attitudes and behavior _______________52 2.1.1.5.1 Theory of planned behavior _______________________________ 55
2.1.1.6 Why are CMV drivers at risk for driver fatigue? ___________________57 2.1.2 Fatigue countermeasures and research needs ________________________ 60
2.1.2.1 National Transport Safety Board (1995)__________________________60 2.1.2.2 Boivin (2000) ______________________________________________61 2.1.2.3 Rogers and Knipling (2007) ___________________________________61 2.1.2.4 Smiley (2008) ______________________________________________62 2.1.2.5 Hours of service ____________________________________________63 2.1.2.6 Fatigue Management Programs ________________________________65 2.1.2.7 Scientifically-sound napping strategies __________________________69 2.1.2.8 Fatigue detection technologies _________________________________70 2.1.2.9 Changing attitudes towards fatigue ______________________________70 2.1.2.10 Promote pre-trip vs. in-transit countermeasures ___________________71 2.1.2.11 Rest areas ________________________________________________71 2.1.2.12 Rumble strips _____________________________________________72 2.1.2.13 Individual differences _______________________________________72 2.1.2.14 Sleep apnea _______________________________________________72 2.1.2.15 Macroergonomics of the motor carrier industry ___________________73
2.1.3 Driver distraction ______________________________________________ 73 2.1.3.1 Distraction: prevalence, definition and basic principles ______________73
2.1.3.1.1 Attention as a single channel process _______________________ 74 2.1.3.1.2 The importance of exposure _______________________________ 75 2.1.3.1.3 Multilevel control model of driver distraction _________________ 77 2.1.3.1.4 A matter of choice ______________________________________ 78
2.1.3.2 Driver distraction in the motor carrier industry ____________________80 2.1.3.2.1 Llaneras et al. (2005) ____________________________________ 81 2.1.3.2.2 Hanowski et al. (2005) ___________________________________ 84 2.1.3.2.3 Olson et al. (2009)______________________________________ 86 2.1.3.2.4 Distraction in the LTCCS ________________________________ 89 2.1.3.2.5 Other studies __________________________________________ 89
2.1.4 Distraction countermeasures and research needs ______________________ 90 2.1.4.1 Interventions aimed at drivers __________________________________90
2.1.4.1.1 Education and training ___________________________________ 93 2.1.4.1.2 Fleet management of driver distraction ______________________ 96
2.1.4.2 Interventions aimed at distractors _______________________________97 2.1.2.4.1 Distraction mitigation technologies ________________________ 100
2.1.4.3 US developments __________________________________________102 2.1.4.4 CCMTA’s Expert Group on Driver Distraction ___________________104
2.2 DECISION ERRORS _________________________________________________105 2.2.1 The concept of risk-taking ______________________________________ 106 2.2.2 Risk-taking, violations and crashes _______________________________ 107 2.2.3 Different approaches to risk-taking _______________________________ 108
2.2.3.1 Psychosocial approach: the problem behavior theory ______________109

Human Factors in the Motor Carrier Industry in Canada v
2.2.3.2 Psychosocial approach: the theory of planned behavior _____________112 2.2.3.3 Personality________________________________________________117
2.2.3.3.1 Sensation seeking ______________________________________ 119 2.2.3.3.2 Aggressive driving _____________________________________ 121 2.2.3.2.3 Type-A personality ____________________________________ 125 2.2.3.2.4 Locus of control _______________________________________ 126 2.2.3.2.5 Personality and driving style _____________________________ 126
2.2.3.4 Risk perception ____________________________________________128 2.3 DECISION ERRORS: COUNTERMEASURES AND RESEARCH NEEDS ______________130
2.3.1 Driver-based interventions ______________________________________ 133 2.3.2 A fresh look _________________________________________________ 137
2.3.2.1 Interventions leads derived from the psychosocial approach _________138 2.3.2.1.1 The PBT _____________________________________________ 138 2.3.2.1.2 The TPB _____________________________________________ 140
2.3.2.2 Interventions leads derived from the personality approach __________145 2.3.2.2.1 Behavior modification __________________________________ 146 2.3.2.2.2 Driver assessment _____________________________________ 147 2.3.2.2.3 Specific considerations with regards to sensation seeking ______ 148 2.3.2.2.4 Specific considerations with regards to aggressive driving ______ 149
2.3.2.3 Considerations with regards to risk perception ____________________153 2.3.3 Traditional intervention domains _________________________________ 154
2.3.3.1 Considerations with regards to driver training ____________________154 2.3.3.2 Considerations with regards to safety culture _____________________160 2.3.3.3 The Safety Management System approach to safety culture _________164 2.3.3.4 Considerations with regards to applied behavior analysis ___________168 2.3.3.5 Considerations with regards to safety technology _________________175 2.3.3.6 Interactions between light and heavy vehicles ____________________181
3. PHASE II: LOOKING AT THE SITUATION IN CANADA _______________188
3.1 MOTOR CARRIERS SURVEY __________________________________________188 3.1.1 Sample overview _____________________________________________ 188 3.1.2 Recognition errors ____________________________________________ 189 3.1.3 Decision errors _______________________________________________ 191 3.1.4 Performance errors ____________________________________________ 192 3.1.5 Non-performance errors ________________________________________ 193 3.1.6 Carriers’ suggestions and comments ______________________________ 193
3.2 INDUSTRY ASSOCIATIONS SURVEY _____________________________________196 3.2.1 Sample overview _____________________________________________ 196 3.2.2 Recognition errors ____________________________________________ 196 3.2.3 Decision errors _______________________________________________ 197 3.2.4 Performance errors ____________________________________________ 197 3.2.5 Non-performance errors ________________________________________ 197 3.2.6 Associations’ suggestions and comments __________________________ 198
3.3 GOVERNMENT SURVEY______________________________________________198 3.4 THE NATIONAL SAFETY CODE ________________________________________208
3.4.1 NSC standards and human factors ________________________________ 210 3.4.2 CSA-2010 __________________________________________________ 215
Human Factors in the Motor Carrier Industry in Canada vi
4. PHASE III: SUGGESTED STRATEGY ________________________________218
4.1 RECOGNITION ERRORS ______________________________________________219 4.1.1 Fatigue _____________________________________________________ 219
4.1.1.1 Hours of service (F1, F2, F3) _________________________________220 4.1.1.2 Determinants of the decision to drive while drowsy (F4, DI1, DE2) ___220 4.1.1.3 Macroergonomics of the motor carrier industry (F5) _______________220 4.1.1.4 Training, testing, licensing (F6, F7) ____________________________220 4.1.1.5 Fatigue Management Programs (F8) ___________________________221 4.1.1.6 Scientifically based napping/recovery guidelines (F9) ______________222 4.1.1.7 Fatigue monitoring technologies (F10, F11) _____________________222 4.1.1.8 Crash avoidance technologies (F12, F13) ________________________222 4.1.1.9 Obstructive sleep apnea (F14) ________________________________223 4.1.1.10 Rest areas (F15) __________________________________________223 4.1.1.11 Rumble strips (F16) _______________________________________223
4.1.2 Distraction __________________________________________________ 225 4.1.2.1 Determinants of the decision to use distractors (F4, DI1, DE2) _______225 4.1.2.2 Training, testing, licensing (DI2, DI3) __________________________225 4.1.2.3 Enforcement: STEP programs (DI4) ___________________________226 4.1.2.4 Fleet level interventions (DI5, DI5a - DI5g) _____________________226 4.1.2.5 Distractors-oriented countermeasures (DI6-DI13) _________________227 4.1.2.6 Other things to consider (DI14-DI17) ___________________________227
4.2 DECISION ERRORS _________________________________________________230 4.2.1 Options based on the Problem Behavior Theory (DE1a, DE1b). ________ 231 4.2.2 Options based on the Theory of Planned Behavior (DE2, DE3, DE4, DE5) 232 4.2.3 Options based on the personality approach (DE2, DE3, DE4, DE5) _____ 233
4.2.3.1 Assessment _______________________________________________234 4.2.3.2 Behavior modification ______________________________________234 4.2.3.3 With regards to sensation seeking: _____________________________235 4.2.3.4 With regards to aggressive driving: ____________________________235
4.2.4 Options based on the notion of risk perception (DE2, DE3, DE4, DE5) __ 236 4.2.5 Training, testing, licensing (DE5) ________________________________ 236 4.2.6 Options based on the notion of safety culture (DE6) __________________ 238 4.2.7 Options based on Applied Behavior Analysis principles (DE7) _________ 239 4.2.8 Options based on the notion of safety technologies (F12, F13, DE8) _____ 240
4.2.8.1 Crash avoidance systems (F12, F13) ___________________________240 4.2.8.2 Driving behavior management system (DE8) _____________________240
4.2.9 Options to address interactions between light and heavy vehicles (DE9) __ 241 4.1.10 Options for government-based initiatives (DE10, DE11) _____________ 241
REFERENCES _______________________________________________________245
APPENDIX I _________________________________________________________277

Human Factors in the Motor Carrier Industry in Canada vii
LIST OF TABLES Table 1: Relative risks of associated factors labeled as critical reasons for crashes _________________________ 13 Table 2: Top 8 causative factors for CMV crashes __________________________________________________ 14 Table 3: Causal factors per type of crash for CMV and LDV drivers. ___________________________________ 15 Table 4: Recommendations from the ETAC study __________________________________________________ 16 Table 5: Percentages of critical reason for CMV driver-initiated critical incidents _________________________ 21 Table 6: Summary of crash predictors (from ATRI, 2005) ____________________________________________ 23 Table 7: Collisions involving heavy trucks and other vehicles by collision severity ________________________ 26 Table 8: Casualties of collisions involving heavy trucks and all other vehicles ____________________________ 27 Table 9: Driver conditions in all CMV fatal crashes, 2003-2007 _______________________________________ 28 Table 10: Driver condition in multiple-vehicle fatal crashes involving a heavy vehicle: CMV drivers __________ 29 Table 11: Driver condition in multiple-vehicle fatal crashes involving a heavy vehicle: LDV drivers __________ 29 Table 12: Driver action in all CMV fatal crashes, 2003-2007 __________________________________________ 30 Table 13: Driver action in multiple-vehicle fatal crashes involving a heavy vehicle: CMV drivers ____________ 31 Table 14: Driver action in multiple-vehicle fatal crashes involving a heavy vehicle: LDV drivers _____________ 31 Table 15: Types of driver errors in crash causation literature __________________________________________ 36 Table 16: Fatigue causes and CMV risk factors ____________________________________________________ 64 Table 17: From Hanowsky, Olson & Bocanegra (2009) ______________________________________________ 87 Table 18: From Hanowsky, Olson & Bocanegra (2009) ______________________________________________ 87 Table 19: Goals of driver education matrix (from Regan, Lee and Young, 2008a) _________________________ 94 Table 20: Correlations between driving style and personality (from Taubman-Ben-Ari et al., 2004) __________ 127 Table 21: Applicability of SMS to small and large motor carrier operations _____________________________ 166 Table 22. Frequency of initiatives being used to address recognition errors (N=42) _______________________ 190 Table 23: Frequency of use of in-vehicle systems by size of the company _______________________________ 190 Table 24: Purchase decision factors for telematic and on-board driver support systems (N=33) ______________ 191 Table 25: Frequency of initiatives being used to address decision errors (N=41) _________________________ 192 Table 26: Initiatives being used to address performance errors (N=31) _________________________________ 193 Table 27: Initiatives being used to address non-performance errors (N=41) _____________________________ 193 Table 28: Does your association have safety initiatives to address this issue? ____________________________ 196 Table 29: Inputs to the government survey as provided by CRA representatives __________________________ 199 Table 30: NSC standards and human factors ______________________________________________________ 210 Table 31: Action items suggested to address fatigue ________________________________________________ 224 Table 32: Action items suggested to address driver distraction _______________________________________ 228 Table 33: Action items suggested to address decision errors _________________________________________ 243

Human Factors in the Motor Carrier Industry in Canada viii
LIST OF FIGURES
Figure 1: Driver condition in multiple-vehicle fatal crashes involving at least one heavy vehicle. _____________ 29 Figure 2: Driver action in multiple-vehicle fatal crashes involving at least one heavy vehicle. ________________ 32 Figure 3: Distribution of CMV driver errors in fatal multiple-vehicle CMV crashes ________________________ 32 Figure 4: Distribution of LDV driver errors in fatal multiple-vehicle CMV crashes ________________________ 33 Figure 5: CMV drivers’ critical reasons in multiple-vehicle crashes in the LTCCS _________________________ 37 Figure 6: LDV drivers’ critical reasons in multiple vehicle CMV crashes in the LTCCS ____________________ 38 Figure 7: Confusion between fatigue and distraction-related inattention (from Stutts et al. 2005) ______________ 41 Figure 8: Importance of hypovigilance as an early manifestation of fatigue ______________________________ 42 Figure 9: Systemic interaction between endogenous and exogenous causes of fatigue ______________________ 43 Figure 10: Distribution of risk ratios for crashes over the 24-hour cycle (Smiley, 2002) _____________________ 45 Figure 11: Theory of planned behavior (Ajzen, 1991) _______________________________________________ 56 Figure 12: Workload and distraction (from Lee, Young & Regan, 2008) _________________________________ 76 Figure 13: Devices use while driving (from Llaneras et al. 2005) ______________________________________ 82 Figure 14: Frequency of safety critical events for 34 distraction types (from Hanowski et al., 2005) ___________ 85 Figure 15: Theory of Planned Behavior (Ajzen, 1991) ______________________________________________ 113 Figure 16: Predictors of adherence with traffic laws (Poulter et al., 2008) _______________________________ 116 Figure 17: Predictors of compliance with CMV regulations (Poulter et al., 2008) _________________________ 116 Figure 18: Contextual model of dangerous driving (from Sümer, 2003) ________________________________ 118 Figure 20: Determinants of driving behaviors (from Lonero et al., 2001) _______________________________ 135 Figure 21: Behavioral, normative and control beliefs _______________________________________________ 140 Figure 22: Maslow’ hierarchy of needs __________________________________________________________ 171 Figure 23: Crash causation (from Hickman and Hanowsky, 2009)_____________________________________ 180 Figure 24: TACT road sign (from Thomas et al. 2008) ______________________________________________ 184 Figure 25: CSA 2010 ________________________________________________________________________ 216
Human Factors in the Motor Carrier Industry in Canada iii
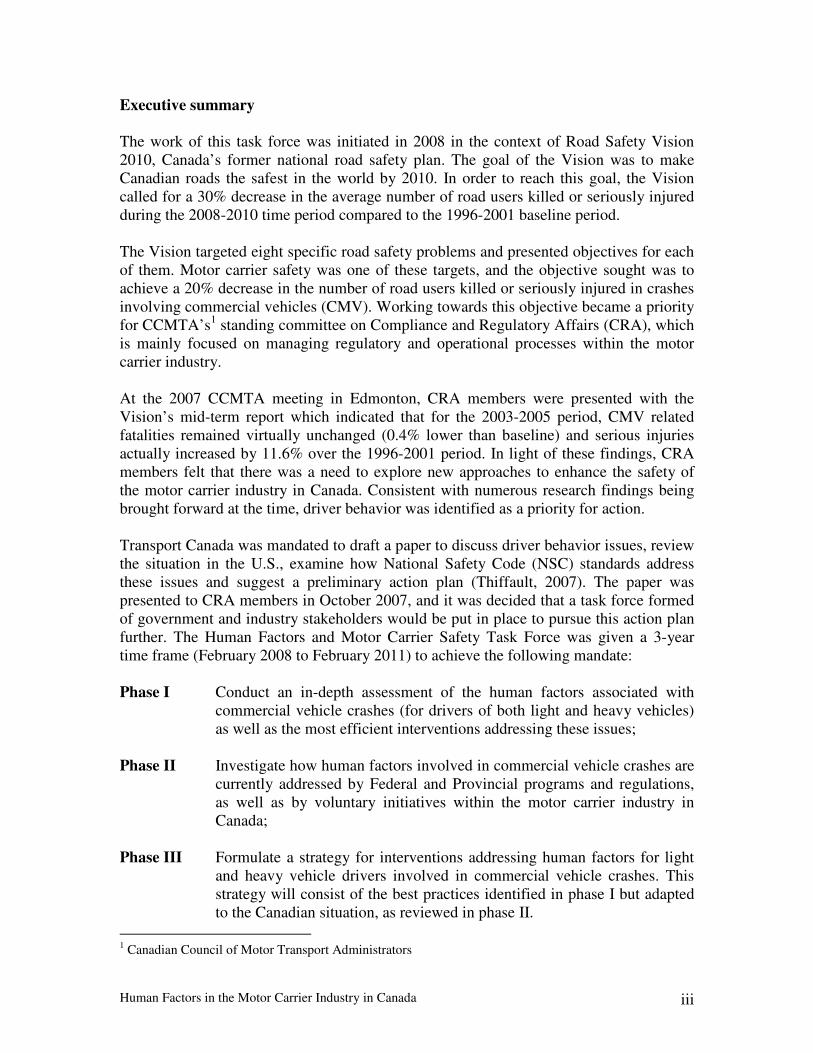
Executive summary
The work of this task force was initiated in 2008 in the context of Road Safety Vision 2010, Canada’s former national road safety plan. The goal of the Vision was to make Canadian roads the safest in the world by 2010. In order to reach this goal, the Vision called for a 30% decrease in the average number of road users killed or seriously injured during the 2008-2010 time period compared to the 1996-2001 baseline period. The Vision targeted eight specific road safety problems and presented objectives for each of them. Motor carrier safety was one of these targets, and the objective sought was to achieve a 20% decrease in the number of road users killed or seriously injured in crashes involving commercial vehicles (CMV). Working towards this objective became a priority for CCMTA’s1 standing committee on Compliance and Regulatory Affairs (CRA), which is mainly focused on managing regulatory and operational processes within the motor carrier industry. At the 2007 CCMTA meeting in Edmonton, CRA members were presented with the Vision’s mid-term report which indicated that for the 2003-2005 period, CMV related fatalities remained virtually unchanged (0.4% lower than baseline) and serious injuries actually increased by 11.6% over the 1996-2001 period. In light of these findings, CRA members felt that there was a need to explore new approaches to enhance the safety of the motor carrier industry in Canada. Consistent with numerous research findings being brought forward at the time, driver behavior was identified as a priority for action. Transport Canada was mandated to draft a paper to discuss driver behavior issues, review the situation in the U.S., examine how National Safety Code (NSC) standards address these issues and suggest a preliminary action plan (Thiffault, 2007). The paper was presented to CRA members in October 2007, and it was decided that a task force formed of government and industry stakeholders would be put in place to pursue this action plan further. The Human Factors and Motor Carrier Safety Task Force was given a 3-year time frame (February 2008 to February 2011) to achieve the following mandate: Phase I Conduct an in-depth assessment of the human factors associated with
commercial vehicle crashes (for drivers of both light and heavy vehicles) as well as the most efficient interventions addressing these issues;
Phase II Investigate how human factors involved in commercial vehicle crashes are
currently addressed by Federal and Provincial programs and regulations, as well as by voluntary initiatives within the motor carrier industry in Canada;
Phase III Formulate a strategy for interventions addressing human factors for light
and heavy vehicle drivers involved in commercial vehicle crashes. This strategy will consist of the best practices identified in phase I but adapted to the Canadian situation, as reviewed in phase II.
1 Canadian Council of Motor Transport Administrators
Human Factors in the Motor Carrier Industry in Canada iv
Phase I was conducted by means of an extensive literature review as well as an examination of a subset of data stemming from the Canadian National Collision Database (NCDB) relative to CMV related crashes during the 2003-2007 time period. Numerous sources, using various methodologies, indicate that the most significant causation factors for CMV crashes relate to drivers recognition and decision errors rather than performance errors or the use of drugs and alcohol. This does not mean that there are no problems in these latter areas, however it implies that from a risk-based perspective, addressing recognition and decision errors should be a priority. A comprehensive review was conducted of the factors and processes that are potentially responsible for these driver errors, as well as of the mechanisms, or behavior modification principles, that could be used to influence them. Next, the main classical interventions in use today were assessed according to the extent that they make use of these mechanisms or principles. Various observations were then made with regards to leads that could be followed in each of these domains. In phase II, 56 motor carriers, 6 industry associations and all Canadian provincial governments were surveyed in order to identify the interventions currently in place to address recognition, decision, performance and non-performance errors in the country. While the information gathered was mostly high-level and did not provide in-depth descriptions of programs and regulations, it nevertheless comprised valuable contextual and descriptive data. A review of NSC standards was also conducted. In phase III, the findings of phases I and II were merged in a form of gap analysis in order to generate a strategy. The resulting discussion presents a set of 44 action items to address fatigue, distraction and risky driving. Note that these recommendations are put forward from a purely scientific perspective. Practical issues such as the operational needs of the industry, the structural makeup of jurisdictions overseeing road safety in Canada as well as within CCMTA, the scarcity of financial resources and research facilities in the country, etc., still need to be taken into consideration. The suggested actions are meant to be taken as a starting point intended to encourage new discussions among stakeholders. They should help in structuring our efforts as we strive towards evidence-based, theory driven and scientifically sound interventions to mitigate driver errors. What options will be retained, how they can be prioritized or regrouped, how these projects should be managed, by whom and with what resources, are all questions that remain to be answered. These issues will be addressed in later stages of the process. The results of phase III are presented below. Results
Recognition errors Recognition errors mainly relate to inattention as it is caused either by fatigue (hypovigilance) or distraction. The prevention of recognition errors therefore involves mitigating the effects of the factors that contribute to fatigue and distraction.

Human Factors in the Motor Carrier Industry in Canada v
Fatigue The main contributors to fatigue were presented and risk factors specific to the motor carrier industry were documented. As noted, hours of service (HOS) regulations theoretically address important risk factors, even though they have significant limitations. The case is made that HOS regulations are necessary but not sufficient to address fatigue in the motor carrier industry. There is therefore a need to make stakeholders understand this reality: HOS rules form the foundation of fatigue management, but they need to be complemented by various initiatives to generate a comprehensive and efficient fatigue management approach. This conclusion is important given the fact that many jurisdictions report HOS rules as the sole and primary means to address driver fatigue. Considerations with regards to complementary initiatives are presented below. But first, with regards to HOS per se: Hours of service
• HOS rules are necessary but they are far from being perfect, nor sufficient. They therefore need to be part of a more comprehensive fatigue management strategy that should be recognised and endorsed by industry and governments;
• HOS rules should be enforced with tamper-proof equipment such as Electronic On-Board Recorders;
• The operational and safety effects of the new HOS rules in Canada should be evaluated.
The determinants of the decision to keep driving while drowsy Even though drivers have good knowledge about fatigue and fatigue countermeasures, they tend to resist and try to fight fatigue with effort - which is clearly ineffective and very risky. This implies that behavioral determinants other than knowledge are at play and that identifying these determinants for Canadian CMV drivers could help develop efficient strategies to influence this decision making process. It is therefore suggested that a study investigating the psychological determinants of the decision to keep driving while experiencing fatigue be conducted. This could be done with the support of a theory such as Theory of Planned Behavior (TPB), as detailed in the report. Macroergonomics of the motor carrier industry On a corollary note, the discrepancy between drivers’ actions and knowledge with regards to the self-management of alertness most certainly has to do with how the macroergonomics of this industry (e.g. compensation schemes, company policies, shippers) are shaping drivers motivations and attitudes. For example, the way the pay structure is designed is most likely a significant determinant of the decision to keep driving while drowsy. It is premature to formulate any recommendations without entering into a formal in-depth investigation. However given the importance of this issue, it is necessary to recommend that such an examination take place in the Canadian context.
Human Factors in the Motor Carrier Industry in Canada vi
Training, testing, licensing As seen in phase II, 69% of carriers acknowledge that fatigue is part of their driver training activities. Governments also identify training as a central piece in their approach to driver fatigue. What is important therefore is to make sure that these training initiatives include specific high-level knowledge elements with regards to driver fatigue. The scientific review suggests that the following areas should be covered in both training and testing:
• The focus should not only be on endogenous risk factors such as time-of-day, time-on-task, time-awake and sleep needs but also on exogenous factors such as road monotony as well as the impacts of various individual differences;
• Drivers should be made aware of the risks of night driving and given proper strategies to deal with them;
• Drivers should be convinced of the superior efficiency of pre-trip fatigue management (getting enough sleep, properly planning journeys with opportunities to rest and take regular breaks, proper food and exercise, etc.) compared to in-transit countermeasures. Training with regards to the self-management of alertness should focus on these pre-trip strategies;
• Drivers should be made to understand the proximal relationship between signs of drowsiness, microsleep and falling asleep per se. This would reveal to them the real level of risk associated with trying to fight drowsiness with effort;
• Drivers should be made to understand the significant impact of early fatigue on attention, which leads to inattention errors. The key is to insist on the fact that early fatigue signs are not felt as drowsiness but rather as mood fluctuations and boredom. Drivers should be convinced that these early fatigue states are associated with crashes that are related to inattention and that there are effective countermeasures that can be adopted while experiencing these early symptoms;
• Drivers should be made to understand the relative efficiency of fatigue countermeasures and they should be taught exactly what is best to do in various specific fatigue inducing contexts.
Globally, there is a need to scrutinize existing driver-training curricula and the various training practices available to CMV drivers to assess if the above-mentioned items are covered and to promote their inclusions if it is not the case. An option would be to develop fatigue-related material that would abide with these principles and to make it available to the training community and the industry. Note that these issues should also be covered in testing and licensing procedures.
Fatigue Management Programs The North American Fatigue Management Program (NAFMP), which will be made available to motor carriers throughout North America on a web-based platform in 2012, represents an important scientifically developed complement to HOS regulations. It is recommended that governments and industry stakeholders vigorously promote the voluntary adoption of the program by motor carriers of all sizes.
Human Factors in the Motor Carrier Industry in Canada vii
As a reminder, the NAFMP is comprised of education components for drivers, dispatchers, company management, family members etc, OSA screening and treatment guidelines, procedures and tools, scheduling guidelines and tools as well as recommendations with regards to the use of fatigue monitoring technologies. Note that all of these interventions, which are central to fatigue management, are not part of HOS regulations. This provides further support to the notion that an approach solely based on respecting these rules - and especially pushing them to the limit - falls short in terms of oversight and most likely effectiveness. Scientific napping/recovery guidelines It is widely understood that sleep is the most efficient way to address fatigue. Naps and recovery periods are therefore central to a comprehensive approach to manage fatigue. Some of the North American stakeholders that brought forward the NAFMP are currently involved in a combined field/lab research project to develop, test and validate various napping and recovery guidelines that will take into considerations factors such as day/night driving as well as individual differences in fatigue susceptibility. The results of this research are intended to: 1) improve highway safety and driver well-being, 2) maximize the potential for schedule flexibility to better accommodate operational and driver needs, and 3) provide improved means for rapid and safe recovery from fatigue in the event of unforeseen schedule variations. It is therefore emphasized that the results of this important research project should be taken into account in further developments of a comprehensive Canadian approach to manage the fatigue of CMV drivers. An efficient way to make this possible will be to incorporate these guidelines into the NAFMP framework. Fatigue monitoring technologies Carriers, industry associations as well as jurisdictions have expressed the need for easy access to affordable and efficient fatigue monitoring technologies. Back in 2003 Transport Canada conducted a study entitled Fleet demonstration of technological aids for the management of fatigue among commercial motor vehicle drivers. There have been many developments in the field of fatigue monitoring since then however, with different technologies based on various approaches entering the market. There is therefore a need to update the 2003 study in order to test various new technologies in an operational setting and to assess their efficiency in detecting early signs of fatigue. Issues related to user acceptance and behavioral adaptation also need to be investigated further. Depending on the results, a strategy for the widespread inclusion of these technologies in the motor carrier industry could be developed and recommended. The use of various forms of incentives to stimulate the adoption of these technologies should also be considered.

Human Factors in the Motor Carrier Industry in Canada viii
Crash avoidance technologies It is becoming increasingly clear that crash avoidance technologies such as electronic stability control (ESC), forward collision warning systems (FCWS), lane-departure warning systems (LDWS) and blind-spot cameras can be beneficial for safety. It is therefore recommended that their utilization be promoted in the motor carrier industry. Government-issued incentives like the ones given in the U.S. to help carriers to equip their fleets should be considered. However, issues such as user acceptance and behavioral adaptation also need to be studied further in this context. This could lead to the development of driver-based interventions that could be implemented as a complement to these systems,in order to mitigate potential negative safety impacts. Obstructive sleep apnea Carriers, industry associations and jurisdictions have expressed the need for an easy access to OSA screening procedures. While OSA screening and treatment is a component of the voluntary NAFMP, this issue nevertheless needs to be addressed more globally. Note that the current situation in the U.S. whereby rulemaking is in development, as well as the discussions of the CCMTA OSA working group, should make the issue progress in 2011. No immediate action items are therefore suggested for the moment, aside from promoting the NAFMP, monitoring what the U.S. does and waiting for the deliverables of CCMTA’s OSA working group. Once all of these pieces in place, a reassessment of the situation should be conducted. Rest areas Assessing the current situation with regards to rest areas in Canada is critical for the development of a comprehensive fatigue management approach. Transport Canada is currently conducting a study to assess the supply and demand for truck parking. The study will determine truck drivers' parking habits and preferences, identify areas where designated truck parking might be difficult to find, and determine how any possible shortages of parking might impact on safety, productivity, and personal well-being. The results of this study will help to identify the magnitude of the problem, which is the first step for the development of effective long-term solutions. Once the study is completed, a strategy should be drafted. Note that since Quebec is revamping its global rest area structure, their experience in this process could be documented and made available to the other jurisdictions. Rumble strips Rumble strips represent a proven countermeasure to mitigate the effects of driver fatigue. Studies indicate decreases of 21% and 25% in single vehicle crashes by lateral and central rumble strips respectively. There is therefore a need to promote the installation of lateral and central rumble strips across the country. Reviewing the Canadian situation and developing safety and business cases are logical next steps that could help promote improvements in this area.

Human Factors in the Motor Carrier Industry in Canada ix
Distraction The determinants of the decision to use distractors while driving Studies have shown that drivers tend to use distractors while driving even knowing this seriously increases crash risk. It was also shown in experimental settings that drivers tend to use distractors impulsively, without considering variations of demands from the driving tasks, even if they are made aware of such variations in advance. These studies indicate that the decision to use distractors while driving is influenced by determinants other than knowledge. Assessing these determinants for the Canadian CMV driver population is an important first step for the development of targeted interventions. There is therefore a need to conduct a study to better understand the determinants of driver distraction in the motor carrier industry in Canada. Based on a representative sample of drivers, the study would assess the impacts of attitudes, motivation, personality dimensions and risk perception on the decision to engage in distracting behaviors while driving. Once completed, such a study would inform the development of interventions based on education, training, awareness, enforcement and company safety programs. Training, testing, licensing Driver education is seen as a key component of driver-based interventions to address distracted driving. There is however a need to assess current educational material and to run a gap analysis on the basis of the specific recommendations expressed in phase I with regards to issues that should be covered. As mentioned, a special focus should be put on high-level goals, motives, and strategic functions. Given the increased penetration of telematics and communication devices in the task environment of CMV drivers, they need to understand the basics of attention processes as well as the notions of workload and task demands. CMV drivers should be made aware that their attention runs on a single channel mode and that simultaneous tasks with fluctuating workloads may create a situation where attention capacity is overloaded, resulting in severely increased crash risk. Once they really understand this dynamic, it is likely that drivers will be more motivated and better equipped to self-manage their attention and to more efficiently plan their use of distracting devices while driving. A legitimate option would be to develop distracted driving material that would abide by the various scientific principles discussed in phase I and to make it available to the industry. STEP programs Strategic enforcement (STEP) programs were shown to be efficient in dealing with DWI, seat-belt use as well as aggressive driving around large trucks and buses. They could also be used to address the use of distractors, including hand-held cell phones and texting, for both the general driving population and CMV drivers. Such alternatives are currently being developed in the U.S. as a follow-up to the Distracted Driving Summit. This avenue needs to be seriously considered in Canada as well.

Human Factors in the Motor Carrier Industry in Canada x
Fleet level interventions The following recommendations are presented in the report with regards to carrier-based interventions to mitigate distracted driving:
• Employers should limit the availability of distracting technologies and devices; • Employers should provide drivers with vehicles equipped with technologies
designed to minimize distraction; • Employers should have clear policies to limit exposure to distractors; • Employees should be provided with guidance as to when it is acceptable to
engage in distracting activities and when it is prohibited; • Employers should provide education and training to teach drivers how to self-
regulate behavior with regards to driver distraction. Education should detail the risk associated with the different types of distractors and provide guidance as to how it can be mitigated;
• Carriers should implement systems to quantify the role of distraction in crashes; • The efficiency of policies should be monitored with proper indicators.
Distractors-oriented countermeasures
• There is a need to make an inventory of current in-vehicle technologies with the potential for distraction in contemporary heavy vehicles in Canada (includes both OEM and nomadic devices, for both driving and non-driving tasks);
• There is a need to assess the distracting potential of these devices - taken both independently and in combination – and to establish their effects on driving performance;
• There is a need to assess how telematics devices (OEM and nomadic) are being developed. More precisely, the government should evaluate whether human factor guidelines are being used and how devices are being tested to determine if they are suitable to be safely used while driving or not;
• Given difficulties in applying design standards (rapidly evolving technology) and performance-based standards (no widely accepted standardized assessment methods), government needs to ensure that industry is following human factor design processes promoting comprehensive, systematic and traceable application of human factors considerations throughout the whole development cycle. Just how prescriptive this approach should be needs to be determined;
• Research in the field of real-time distraction countermeasures should be monitored and encouraged (funded);
• Special attention should be given to fleet dispatching devices and fleet communication devices. These systems should be using workload managers and lockdown functions while the vehicle is in motion, and these functions should be uniformly utilised by the industry. Further R&D is needed in this context and should therefore be encouraged (funded);
• Special attention should be given to instrument panels, which should also be using workload managers and lockdown functions;
• Texting by drivers needs to be banned from all trucks and buses in Canada.
Human Factors in the Motor Carrier Industry in Canada xi
Other things to consider Reflecting on the action items that came out of the Distracted Driving Summit and the recommendations/action items of CCMTA’s Expert Working Group on driver distraction, it appears that most elements are covered in the actions suggested above. The following points however, could be emphasized further:
• Information should be shared between governments on legislative and regulatory options for driver distraction;
• CCMTA should determine and recommend best practices for provincial regulations to address dangerous instances of driver distraction and the use of after-market devices.
Decision errors Decision errors mainly relate to risky driving behaviors. Again, this is not to say that there are no other decision issues with CMV drivers, but rather that from a risk-based perspective risky driving should be prioritized. It was demonstrated that while passive interventions such as crash avoidance technologies as well as vehicle and infrastructure-oriented interventions still hold significant promise and should remain central to our priorities, active driver-oriented interventions also represent an essential component for a comprehensive and systemic approach to the problem. The case was also made that current driver-oriented countermeasures are rarely based on scientific theories of driver behavior and behavior modification and that they are seldom evaluated. There is therefore a need for a significant R&D push to incorporate the vast body of scientific knowledge that currently exists on these issues into new operational interventions, or to use it to revamp existing ones. Naturally, these interventions, once developed and implemented, should be periodically evaluated with sound methodologies so that they can be continually improved on the basis of solid empirical data. Carriers have a central role to play with regards to interventions aimed at mitigating decision errors. There is therefore a need to work with the industry in this respect. The development of scientifically sound and validated safety programs that can be made available to the industry and adopted by carriers on a voluntary basis appears to be a legitimate option. The development of safety and business cases should also be conducted in order to stimulate the adoption of these programs. Risky driving has traditionally been addressed under different theoretical approaches in the fields of risk and traffic psychology. These different approaches bring complementary understandings of these issues and underline the use of various levers for behavior modification. The central themes were discussed and specific observations were made concerning the use of each of these approaches to address the problem of risky driving in the motor carrier industry. The first sets of suggested actions are therefore theory driven. Observations regarding options for traditional means of interventions will follow.
Human Factors in the Motor Carrier Industry in Canada xii
Theory driven recommendations to address risky driving The psychosocial approach Given the interrelationships between risk-taking and health-risk behaviors and given the documented significant prevalence of these problems among CMV drivers, it is recommended that the Problem Behavior Theory (PBT) be used to investigate these issues further and to develop a program to promote a healthy lifestyle targeted specifically at this population. As per the theory, the adoption of a health-enhancing lifestyle should decrease the frequency of risky-driving behaviors. The Theory of planned Behavior (TPB) has important implications for the evaluation of the determinants of risky driving as well as for the development of tailored interventions aimed at altering drivers’ behavioral intentions. The TPB in fact generates various leads regarding the development or the revamping of safety interventions. These applications cut across several domains, which are regrouped in the following statements:
• It is suggested to use the TPB to evaluate the determinants of various risky driving behaviors for CMV drivers in Canada (attitudes, subjective norms, perceived behavioral control - as well as underlying behavioral, normative and control beliefs). Once we have a better understanding of what motivates risky-driving amongst the different sectors of the industry, scientifically sound interventions to alter behavioral intentions should be developed and evaluated;
• It is suggested to include TBP factors in a validated test battery that could be
used:
o By training schools at entry level, to orient trainees towards specific “training clinics” targeted at particular determinants of risky driving as defined in the theory;
o By carriers in the context of driver improvement programs, to orient drivers with safety performance issues towards such specific “training clinics”, and/or;
o In the context of a government-based intervention scheme such as the one Quebec is currently putting in place, where drivers who reach specific thresholds in terms of safety performance would be assessed and funnelled into tailored interventions corresponding to their particular profile and psychological makeup.
• It is further suggested to use the TPB in an effort to develop these new approaches
or to revamp existing driver-oriented interventions to address risky driving behaviors. This work could have implications for a large variety of interventions, especially large-scale awareness campaigns, driver training, driver improvement programs as well as interventions aimed at improving carrier safety culture.
Human Factors in the Motor Carrier Industry in Canada xiii
The personality approach Personality is at the origin of a complex chain of behavioral production factors. Although it is distally related to actual safety performance, it nevertheless has a central role to play since it somewhat defines or conditions the utility of risky driving for individuals who share specific personality dimensions. Furthermore, while personality indeed cannot be changed, it associates with factors that can (attitudes, beliefs, subjective norms, risk perception) and it is in fact through these associations that it generates risky driving. Therefore, since personality outlines different subgroups of risky drivers, it is important to address this issue by (1) assessing these dimensions, and (2) developing tailored interventions aimed at changing what can be changed for these individuals. Consequently, the implications of the personality approach relate to driver assessment, driver training and driver improvement programs. Driver assessment: As mentioned, it is suggested that a driver assessment test battery be developed and validated. The rule of thumb for driver assessment with regards to risky-driving is that it should be multidimensional, including personality dimensions (sensation seeking, aggression/social deviance) attitudes (using TPB and PBT frameworks), risk-perception (computerized hazard perception testing) and actual driving style or driving performance data (on-board monitoring data, vehicle parameters, driver records, driving simulators, etc.). Given the intense ongoing activity in the field of driver assessment, conducting an updated review of these variables and tools seems highly relevant. Also, given their limitations, it appears more appropriate - scientifically speaking - to use these measures in the context of driver training and improvement programs rather than in decision-making processes for hiring or licensing purposes. Behavior modification: In terms of behavior modification, the objective is to change what can be changed within the factors that interact with personality dimensions to produce risky driving. Central to these factors are the psychological determinants identified under the TPB as well as risk perception issues. Therefore, the first step is to assess the attitudes, subjective norms, perceived behavioral control, and risk perception skills for both sensation seekers and aggressive drivers. This can easily be done by adding personality measures to the above-mentioned study on the psychological determinants of risky driving. Once this is done, the observations made earlier concerning the use of the TPB to develop tailored interventions aimed at altering behavioral intentions would also be applicable here, but adapted to these two specific personality subtypes. In other words, there is a need to develop specific means to alter the attitudes, beliefs, subjective norms, risk perception, etc., of sensation seekers and aggressive drivers, and the TPB offers interesting potential in this respect. This mainly has implications in terms of driver training and driver improvement programs, as reviewed in the report.
Human Factors in the Motor Carrier Industry in Canada xiv
The risk perception approach
• It is suggested that a study be conducted to investigate hazard perception skills amongst CMV drivers and how it relates to actual risky driving behaviors;
o This study should include the notions of confidence and over-confidence;
o It could be merged with the above-mentioned study on the determinants of risky driving.
• Hazard-perception skills should be part of driver assessment test batteries, possibly using interactive computer-based driving tasks and/or driving simulators;
• Hazard perception training programs should be included in both entry-level training and driver improvement programs.
Traditional interventions The previous sections presented theory driven options to mitigate risky driving. The following observations will use another angle, which is to focus on traditional means of addressing decision errors in the motor carrier industry. This includes training, safety culture, incentive programs, safety technologies, programs targeting CMV/LV interactions as well as government-based initiatives. Training, testing, licensing Driver training is clearly identified in the literature as a central piece in driver-based interventions to address risky driving. Phase II also showed that carriers, industry associations as well as government stakeholders identify training as one of the main interventions for decision errors in Canada. There was however no information provided as to the content of training curricula or training methods. In this respect, an ongoing project lead by the CTHRC will provide important results with regards to the efficiency of training content and methods. It is therefore emphasized that these results should be factored into future discussions as they become available. Commercial driver training in Canada is not mandatory and drivers are in fact trained with a view to succeed in testing and licensing processes. According to various observers, this may not be sufficient to ensure that they will become safe drivers. As discussed in phase I, it is paramount - from a safety perspective - that efficient training components address fatigue, distraction and risky driving, which are the main crash causation factors. It is also of prime importance that these issues be covered in testing and licensing processes, since the content of testing somewhat dictates the content of the training curricula. The report lists various topics that should be included regarding each of these issues as well as observations about strategies that could be used to trigger attitudinal change through training. Note that these training elements should also be central to driver improvement programs, either from a carrier or a government stand point.
Human Factors in the Motor Carrier Industry in Canada xv
The following points should be taken in consideration when reflecting on the relevance of training to address risky driving per se:
• Based on a significant body of studies on the predictors of safety performance, different authors underline that there is a need to address driving style, rather than focussing only on driving skills in driver education. The question is therefore to determine how driver training can influence the way drivers choose to drive. In other words, how can driver education be used to target the predictors of risky driving (personality, attitudes, subjective norms, lifestyle, risk perception, etc.)?
• A sound strategy to answer this question would be to use the results of the
proposed study on the determinants of risky driving to identify the factors that predict behavioral intention, that can be changed and be targeted through driver education (attitudes, beliefs, risk perception, etc.);
• In terms of how these factors could be changed, a preliminary review of literature
identified the leads listed below. It is however recommended that a comprehensive review of attitudinal change models be conducted, with a special focus on their successful applications within various public health and health promotion domains.
o Training elements should be developed to alter drivers’ behavioral,
normative and control beliefs with regards to specific high-risk driving behaviors;
o Training should involve active issue-relevant thinking from participants (central route persuasion). A classroom format ideally conducted by an individual that shares significant characteristics with the peer groups would be indicated;
o Amongst other things, such sessions should target normative beliefs by depicting a reality where positive safe behaviors are the norm and where risky-driving is marginal and clearly linked with increased crash risk;
o With regards to personality an option is to include high-level information that would make drivers really understand how sensation seeking and aggression impacts on driving behaviors, while giving them precise alternatives as to how they should cope with these personal influences;
o As mentioned, a strategy would be to use the study on the determinants of risky driving to correlate personality dimensions with attitudinal factors and identify the beliefs associated with sensation seeking and aggressive driving that could be changed and therefore should be targeted through driver education;
o In terms of attitude changes, as per the TPB, driver training could also be used to promote a positive health-enhancing lifestyle that would positively impact on CMV drivers’ health as well as their safety on the roads;
o Lastly, driver training should include hazard perception skills.

Human Factors in the Motor Carrier Industry in Canada xvi
Safety culture CMV safety culture has been identified as a critical issue with regards to decision errors. It was shown that the culture of an enterprise or group (carrier) has a direct effect on individuals’ beliefs, attitudes and safety motivations. Since these concepts have been confirmed as the main predictors of risky driving in risk psychology, programs to implement a positive safety culture - or to improve the existing culture of a company - are recognized as legitimate scientifically sound interventions to mitigate risky driving behaviors. The Safety Management System (SMS) approach, widely used throughout the world to manage safety risks, particularly in transport operations, represents a strong strategy to improve carriers’ safety culture and to impact on numerous predictors of risky driving at the individual level. Furthermore, elements of SMS can be adapted to carriers of any size, including owner operators. It is therefore suggested that:
• A state-of-the-art SMS especially crafted for the motor carrier industry in Canada be developed and made available to the industry on a voluntary basis;
• This program should be complemented by safety and business cases that would
stimulate buy-in from the industry;
• The SMS should be adapted to carriers of various sizes with tools made available for the whole spectrum of the truck and bus industry in Canada.
Applied Behavior Analysis Incentive programs were identified as scientifically valid interventions to address risky driving behaviors. As per their impacts on motivation, incentive programs represent a strong strategy to change drivers’ desire do be safe, which is a central factor in risk taking behaviors. The trucking and bus industry can therefore use incentive programs to its advantage in terms of increased safety, enhanced profitability, better company morale, greater productivity, reduction in personnel turnover, etc. These improvements can be achieved either by developing new incentive programs or by analysing and revamping existing ones on the basis of precise scientific knowledge relative to behavior modification. Even though there is little scientific literature on the use of incentive programs within the trucking and bus industry, it appears that they are widely used, but often in an intuitive carrier-specific mode. As reported in phase II, 71 % of the carriers who completed the survey acknowledged the use of some sort of safety incentives. However, in the absence of comprehensive scientific guidelines, it is likely that some of these programs may not reap the desired results and may even bring about unintended negative impacts. This was also echoed in phase II, as many carriers asked for clear scientific guidelines for the development and implementation of incentive programs. It was also central in the recommendations of the 1998 Transport Canada study.

Human Factors in the Motor Carrier Industry in Canada xvii
Given the complexity and the subtleties of such a behavior modification approach, it is suggested that a state-of-the-art incentive program, based on cutting-edge scientific knowledge emanating from the field of applied behavior analysis (such as the use of cues, prompts, feedback, commitments and rewards), be developed and thoroughly evaluated. Once developed and proven to be efficient, this program could be presented to the industry, either to be adopted on a voluntary basis or to serve as a template - or a general set of guidelines - that could be used by carriers to develop their own programs or to test the scientific soundness of existing ones. Such a program should be accompanied by strong safety and business cases that would be used in order to stimulate the use of the approach within the bus and trucking industry. Safety technologies As mentioned in the fatigue section, crash avoidance systems such as FCWS, LDWS and RSC should be part of a comprehensive package to mitigate driver errors. As shown in phase II, stakeholders at every level expressed the need for these technologies. The tools however remain largely absent from fleets, with less than 10% of carriers currently reporting their use. The main reasons for this appear to be related to the costs of these devices as well as their availability to the industry at large. This is why carriers are asking for incentives such as tax rebates to facilitate their inclusion in operations. Given the potential for safety benefits associated with crash avoidance technologies, it is suggested that stakeholders recognize this potential and engage in a policy development process that could set the stage for their large-scale inclusion in heavy vehicle fleets. This process should include looking at incentives that would motivate the industry to adopt these technologies. This process should also include studying behavioral adaptation and driver trust issues and how these phenomena could be mitigated. The use of low cost Driving Behavior Management Systems (DBMS) that record parameters of driver behavior when a critical safety situation occurs is a good opportunity to implement interventions to coach drivers with regards to their safety performance. As mentioned before, the recorded information can also serve as a primary indicator of driving style and could be coupled with other psychometric measures in a driver assessment perspective. Drivers could then be directed through an intervention algorithm that would contain specific options related to different types of risky-driving, or different types of risky drivers. The phase II survey also indicated that carriers are actually calling for easy access to low-cost driver behavior monitoring solutions. It is therefore suggested that stakeholders should recognize the potential of DBMS and engage in a policy development process that could set the stage for a large-scale inclusion of these technologies. DBMS could be used in the context of driver assessment processes and driver improvement programs, both from a carrier or a government perspective.
Human Factors in the Motor Carrier Industry in Canada xviii
Interactions between light and heavy vehicles Interactions between light and heavy vehicles have been identified as a central crash causation factor. Comments received by carriers clearly underline the fact that light vehicle drivers often do not understand the reality of CMV driving and that interventions should be implemented to address these issues. Two programs were reviewed: Ticketing Aggressive Cars and Trucks (TACT) and Operation Safe Driver (OSD). This assessment led to the following observations:
• The TACT program appears to represent an appropriate and scientifically valid approach to address LV/CMV interactions;
o The implementation of theory-driven attitude assessment and attitude modification approaches could improve the awareness raising/education component of the intervention, but this remains to be determined.
• While the TACT approach is well documented and evaluated, less material is available to support the efficiency of OSD. However, since both programs have important similarities, and given the massive support that CVSA gets from government and industry players, OSD also needs to be supported;
o It would be relevant to document the intervention and its underlying behavior modification principles and to have it scientifically evaluated periodically.
• The idea that both programs should take a blitz format could be revisited. As discussed, numerous alternatives are possible. It could be a good thing to analyse these programs and their delivery on the basis of solid behavior modification principles and to assess how they could be improved in order to adhere to these principles.
Options for government-based initiatives NSC standards 7, 12, 14 and 15 all relate to the core of safety programs for motor carriers in Canada. When reflecting on the efficiency of this framework with regards to decision errors, the important issues to consider are (1) the ability of these programs to identify high-risk drivers in a short timeframe and (2) the type of interventions that are implemented to address driver errors. In light of the work being conducted in the U.S. with regards to CSA-2010, it is suggested that a review be conducted to assess the capacity of the NSC framework to identify high-risk drivers and to flag them for interventions. With regards to the interventions per se, it appears like the traditional carrier-based paradigm is set to stay. In Canada - like in the U.S. - it is mainly up to carriers to come up with driver improvement initiatives aimed at high-risk drivers. The case was therefore made that governments could help the industry in this endeavour by providing expertise, scientifically developed and validated programs as well as incentives.
Human Factors in the Motor Carrier Industry in Canada xix
Another possibility is to develop, in parallel, a government-based approach like the one currently being implemented in Quebec. With the new Politique d’évaluation des conducteurs de véhicules lourds, high-risk drivers meeting various negative safety performance thresholds need to meet with the government’s Commission des Transports in order to be evaluated. Remedial interventions will then be prescribed on the basis of the results of this evaluation. This framework appears like an excellent opportunity to apply scientifically sound driver-oriented interventions in a government-based intervention framework. Therefore, it is suggested to explore with Quebec the possibility of using the instalment of this new regulatory framework to (1) study the profile of high-risk drivers and (2) develop and validate new scientifically sound interventions. Note that such options for government-based driver-oriented interventions are not intended to replace the carrier-based framework currently in place, but rather to complement and potentially improve it. Such an approach could have the advantage of (1) ensuring a greater uniformity in driver-based interventions, (2) ensuring that driver-based interventions are scientifically sound and (3) ensuring that these interventions are monitored, and evaluated.
*

Human Factors in the Motor Carrier Industry in Canada 1
Introduction
The work of this task force was initiated in 2008 in the context of Road Safety Vision 2010, Canada’s national road safety plan. The goal of the vision was to make Canadian roads the safest in the world by 2010. In order to reach this goal, the Vision called for a 30% decrease in the average number of road users killed or seriously injured during the 2008-2010 period compared to the 1996-2001 period. The Vision targeted specific road safety problems and presented goals for each of them: Targets and goals of RSV-2010 framework
• A 95% rate of seat belt use and appropriate use of child restraints; • A 40% decrease in the number of fatally or seriously injured unbelted occupants
(exclude bus occupants); • A 40% decrease in the percentage of road users fatally or seriously injured in
crashes involving drinking drivers; • A 20% decrease in the number of road users killed or seriously injured in speed-
or intersection-related crashes; • A 40% decrease in the number of road users fatally or seriously injured on rural
roadways (defined as two-lane roads where the speed limit is 80-90 km/h); • A 20% decrease in the number of road users killed or seriously injured in
crashes involving commercial vehicles (CMV);
• A 20% decrease in the number of young drivers/riders (those aged 16-19 years) killed or seriously injured in crashes;
• A 30% decrease in the number of fatally or seriously injured vulnerable road users (pedestrians, cyclists and motorcyclists).
Task forces, under the auspices of the CCMTA, assume ownership of the various subtargets and are developing and implementing initiatives to achieve them. These task forces usually comprise representatives from the federal and provincial governments, the police community and non-governmental stakeholders with a strong interest in traffic safety.
RSV 2010 Commercial Vehicle Safety Target Contrary to other task forces that were created to reach the Vision’s goals in terms of fatality reductions, the commercial vehicle sub-target falls under the responsibility of CCMTA’s existing Standing Committee on Compliance and Regulatory Affairs (CRA). While other task forces were entirely dedicated to reaching the Vision’s goals, CRA is mainly focused on managing regulatory and operational processes within the industry. Nevertheless, since these processes are initially aimed at increasing safety, it was implicitly understood that core CRA activities fit with the spirit of the Vision. However, it is important to note to date CRA has not developed specific strategies and processes to reach the Vision’s target. This report, which focuses on human factors as legitimate targets for new or revamped interventions, can be seen as a step in this direction.
Human Factors in the Motor Carrier Industry in Canada 2
In the RSV-2010 annual report of 2005, CRA described the main activities that were undertaken to reduce road users fatalities as follow:
• Combining a carrier’s on-road compliance record for convictions, inspections and collision history into a single number safety rating that represents a carrier’s risk;
• Developing interpretation documents and training materials for the redrafting of the provincial/territorial Hours of Service Regulations (January 2007);
• Participating in and funding research aimed at the development of a North American fatigue management program for the motor carrier industry;
• Implementing the new international cargo securement standard and training inspectors to the new protocols;
• Adopting the new national standard for daily vehicle inspections; • Developing training courses for commercial drivers as well as commercial vehicle
enforcement personnel; • Carrying out focused commercial vehicle enforcement campaigns that target seat
belt usage, mechanical inspections and hours of service; • Increasing the number of patrol vehicles to carry out additional motor vehicle
inspections; • Carrying out random on-road blitzes focusing on truck safety; • Providing free air brake inspections to truckers; • Promoting initiatives such as Share the Road and Avoid My Blind Spots to
educate the motoring public and commercial vehicle drivers about the importance of sharing the road safely and the dangers of blind zones around large commercial vehicles.
It is suggested in the 2005 report that these efforts have helped to stabilize the number of road users killed annually in crashes involving commercial vehicles. However, no progress has been made toward achieving the 20% decrease in fatalities and serious injuries. In the 2003-2005 period, fatalities remained virtually unchanged (0.4% lower than baseline) and serious injuries actually increased by 11.6% over the 1996-2001 period. In light of these findings, CRA committee members felt that there was a need to explore new approaches to increase the safety of the motor carrier industry in Canada. There is a growing consensus in the field that driver behaviors and human factors represent the most promising avenues to achieve safety gains, both in road safety and in CMV safety. Transport Canada prepared a paper to discuss key road safety human factor issues, review the situation in the U.S., examine how current National Safety Code (NSC) standards address these factors and suggest an action plan (Thiffault, 2007). This paper was presented to CRA in October 2007, and it was decided during that CCMTA meeting that a task force would be put in place under the RSRP standing committee to pursue this action plan. The main objective of the task force is the development of a sound basic strategy to better address human factors in the Motor Carrier industry in Canada. This chapter covers the first phase of this action plan, which is to review crash-causation studies in order to orient the development of a risk-based, data driven strategy for interventions.

Human Factors in the Motor Carrier Industry in Canada 3
1. Phase I: Problem assessment
It has been clear, for the last 30 years that human factors are involved in about 90% of road crashes. The landmark study on crash causation is the Indiana Tri-level study (Treat et al., 1979), where 420 vehicle crashes were investigated in-depth by a multidisciplinary team. The objectives of the study were to identify causal factors and assess their frequency. The results showed that human, vehicle and environmental factors were implicated and that human factors were responsible for 93% of crashes. Other studies, like the one lead by Najm et al. (1995), also indicate that the vast majority of crashes can be attributed to human factors. The importance of road crashes in terms of public health - with 1 200 000 fatalities yearly (WHO, 2004) - and the now established consensus that preventing driver errors would significantly reduce collisions, has led to the development of a vast and intense research domain related to human factors in road safety. This domain is clearly multidisciplinary but is somewhat concentrated in a field designated as traffic psychology. After more than 25 years of activities, this field has gained a fair understanding of the errors that drivers make and of the factors that influence them. However, while the application of this knowledge for interventions is gaining momentum, there is still a lot of work to be done in this respect. The importance of human factors in the context of crashes involving commercial vehicles was also recently confirmed by the results of the American Large Truck Crash Causation Study (LTCCS) and the European Accident Causation study (ETAC). Like the Tri-level Indiana study, the LTCCS and the ETAC represent major research efforts aimed at understanding CMV crashes in order to steer the development of future interventions. In the LTCCS, the research team investigated 967 crashes that occurred between 2001 and 2003, involving 1,127 large trucks and 959 non-truck motor vehicles, resulting in 251 fatalities and 1,408 injuries. More than 1000 factors were collected for each crash. The LTCCS contains a very large amount of data that will keep on being analyzed in the coming years. To date, only the main findings have been presented to the American congress (US DOT& FMCSA 2006). In brief, driver factors were identified as the critical reason for the crash in 87% of the cases, with the remaining 13% split between vehicle, weather and roadway problems. In the recent ETAC study, the team investigated 624 truck crashes on more than 3000 parameters. The methodology included investigations at the crash scene, data analysis and crash reconstruction. The results showed that human factors are responsible for 85.2% of the crashes, with the remaining 15% split between vehicle (5.3%), infrastructure (5.1%) and weather conditions (4.4%). This data therefore confirm that the causality structure for large truck crashes is similar to what was observed in the case of light vehicles, with an overwhelming emphasis on human factors. Consistent with these findings, research efforts in CMV safety in the U.S. have taken a major shift towards human factors, as was evident at the 2006 International Truck and Bus Safety and Security Symposium as well as at the 2007, 2008, 2009 and 2010 TRB meetings.

Human Factors in the Motor Carrier Industry in Canada 4
Numerous research agencies in the U.S. are currently involved in developing scientific knowledge on CMV driver-related factors and in progressively translating this knowledge into specific interventions. This however is a significant undertaking and changes will gradually shape-up in the coming years, creating the potential for a true paradigm shift in the way CMV safety is understood and managed. As noted by Knipling (2007a), safety programs for motor carriers have so far been oriented towards regulatory compliance rather than true crash causation data. In this context, a closer tie between regulators and researchers is needed and many signs seem to indicate that these groups are indeed coming closer together. The similarities amid the crash causation patterns of heavy vehicles (CMV) and light vehicles (LV) suggest there are significant common grounds between these two phenomena. It is therefore reasonable to think that applying some of the knowledge that has been collected for more than three decades in LDV road safety research to the problem of CMV safety would be strategic, cost effective and scientifically sound. Notwithstanding, differences between these two realities do exist, and they need to be considered. Rogers and Knipling (2007) for example pointed out the macroergonomic context in which commercial drivers operate and the impact that this context can have on safety-related attitudes, motivations and behaviors. Nevertheless, the fundamental knowledge as to how human operators perform while driving a vehicle on a road network is generally applicable to the whole field. In other words, many lessons learned in road safety research could be imported to the field of CMV safety, even though differences need to be respected and qualified accordingly. By taking this step, we open the door to using a vast corpus of data and knowledge to increase the safety of the motor carrier industry. Different studies have shown that LDV drivers tend to be more at-fault in multiple-vehicles crashes involving commercial vehicles, than the CMV drivers themselves. The allocation of causality however appears somewhat inconclusive as percentages significantly differ from one study to another. For example, in the Hanowski et al. (2001) study, more than 75% of the critical incidents involving car/truck interactions were attributed to the driver of the car, but in the Council et al. (2003) study, which examined 1994-1997 North Carolina police-reported truck crashes, CMV drivers were assigned fault in 48% of crashes compared to 40% for car drivers. Looking at the LTCCS, the critical reason for the crash was assigned to the truck in 44% of the cases. In the Jonah et al. (2009) study, using charges laid by the police in B.C. as a result of a collision, truck drivers were slightly more likely to have been charged than the drivers of the other vehicles involved, particularly in the case of fatal crashes. Finally, in the ETAC study (IRU, 2007), the authors concluded that human factors were responsible for 85.2% of truck crashes but that those errors could be attributed to the truck driver in only 25% of the cases. In this regard, Knipling (2007a) talks about the paradox of CMV driving. First, he states that CMV drivers appear very safe when compared to regular road users; they have lower crash rates, commit fewer mistakes and are less likely to be at fault. However, as the LTCCS data supports, they are still significantly involved in the production of road
Human Factors in the Motor Carrier Industry in Canada 5
crashes and road fatalities. CMV drivers have 6 to 10 times more mileage exposure than regular drivers. The physical characteristics of large trucks make them harder to handle, their braking distances are much longer and they are involved in more severe crashes, given their weight and mass. Knipling also notes that per vehicle and annual crash costs were 4 to 5 times higher for commercial vehicles than passenger cars. Using the NHTSA 2001 crash data (NHTSA, 2002) and controlling for exposure, Huang et al. (2005) observed that trucks were 48.7% less likely to be involved in crashes, that fewer trucks were involved in injury-causing crashes than cars yet trucks were 33% more likely to be involved in a fatal crash on a per-mile-driven basis. Therefore, even though CMV drivers are in general safer that LDV drivers, we should nevertheless be strongly motivated to increase the level of safety of truck driving. As observed by Knipling (2007b), regardless of the distribution of critical crash errors between commercial and non-commercial drivers, it is a principal responsibility of the motor carrier industry to reduce the safety risks traceable to their own drivers. However, since it has been clearly shown that the behaviors of other road users interacting with commercial vehicles are a substantial part of the problem, they should also be systematically targeted via research and interventions. Driver behaviors and driver errors The driving task is a complex, ever changing, multilevel activity. The human operator is also a complex system and its ability to meet performance requirements is unstable and hard to predict. The level of difficulty of the driving task is generally low, but for various reasons - internal or external to the driver - extreme, unpredictable variations occur, leading to near misses or crashes. While these circumstances are somewhat unusual in the driving experience of a single individual, they do occur invariably with high frequency on road networks, leading to multiple fatalities and serious injuries daily (3,300 persons killed and 137,000 injured every day, WHO 2004). When trying to better understand why these crashes occur, one is faced with the challenge of classifying driver errors and organizing underlying human processes in categories and/or sequences. When this is done, and when the relative prevalence of each category of human errors is known, it then becomes possible to strategically target the most important factors with specific interventions. The usual approach to investigate crash causation is both conceptual (theory driven, using existing scientific knowledge on human factors) and empirical (data driven). For example, in the Tri-level Indiana study, the ETAC study and the LTCCS, real crash cases were analyzed in depth and the underlying human errors were sorted into categories. These categories in turn parallel specific steps of information processing according to a basic model of human behavior (e.g. recognition, decision, performance and non-performance errors). It is important to note that while this kind of classification is necessary, its validity is always limited and should be qualified as such. The systemic nature of human
Human Factors in the Motor Carrier Industry in Canada 6
functioning and the complexity of the driving situation undeniably make it risky to tear situational factors, driving behaviors and cognitive processes apart from one another. In fact, the true meaning of a phenomenon such as a crash always lies in a combination of the different factors, processes and circumstances that were present at a given point in time. Nevertheless, classifying driving errors and organizing underlying human processes remains a vital operation to develop a better understanding of crash causation. And this understanding is paramount for the development of scientifically sound interventions. 1.1 Road safety studies There are literally thousands of studies on human factors in road safety. The driving situation is multifaceted and has been analyzed from a vast array of different angles. While studies pertaining to specific recognition and decision errors will be addressed later, milestone studies revealing the importance of human factors in crash causation are discussed below. 1.1.1 The Tri-Level Indiana study (1979) The Tri-Level Indiana project is a milestone study that has had a profound impact on the directions that were taken in road safety research for the last 30 years. It was the first large-scale clinical investigation of crash causation and still remains today a relevant reference in the field. The study gave the first strong empirical account of the importance of driver errors in crash causation (93% involvement rate) and paved the way for decades of research on the subject. The human error taxonomy that was developed in the study is still relevant and being utilized in contemporary crash-causation studies. The model assumes that drivers are continuously engaged in perceiving and comprehending information (recognition processes), making decisions (decision processes) and taking actions (performance processes) to achieve necessary control responses. In cases where the operator is impaired and cannot process the information adequately, the driving errors are labeled as non-critical performance errors. In brief, the results of the study identified driver errors in order of prevalence as follows:
• Recognition errors – 41.4% (perception, comprehension, risk perception); • Decision errors – 28.6% (including misbehaviors, speeding, risk-taking); • Performance errors – 6.9% (failure to safely execute driving maneuvers); • Critical non-performance errors – 1.7% (failure to perform as an information
processor, DUI, fatigue, medical blackouts). Recognition and decision problems are the most common driver errors, with a 70% involvement. The authors note that the human errors and deficiencies that cause crashes primarily involve recognition (including both perception and comprehension problems), and decision errors, while performance and critical non-performance errors are less frequent.
Human Factors in the Motor Carrier Industry in Canada 7
The factors associated with critical non-performance errors, which impede the efficiency of the driver as an information processor, were coded as impairment due to psychoactive substances like alcohol and drugs, and driver’s inexperience. They were viewed as potential reasons behind the reasons. In this study, alcohol impairment was the most prevalent factor, followed by drug and fatigue. The very low incidence of these errors is probably related to methodological issues and more recent studies tend to show a greater involvement. Specific direct cause categories were also created under these four major headings. The most common direct crash causes identified were, in this order of prevalence:
• Improper lookout (recognition); • Excessive speed (decision); • Inattention (recognition); • Improper evasive action (decision); • Internal distraction (recognition).
The authors note that the recognition errors improper lookout and inattention can both be taken to reflect reduced alertness, even thought there are no clear signs of an operator state problem in 70% of these crashes. Drivers tend to look but not see, but there are no clear answers that can be extracted from this study as to why this is occurring. Of the many hypotheses that can be brought forward, the problem of hypovigilance, which is associated with the early signs of fatigue or slight (phasic) lowering of alertness, should be carefully considered (Thiffault and Bergeron, 2003a). Excessive speed and improper evasive actions are the two most common decision errors observed in the study. It is acknowledged that excessive speed is more reflective of a personality trait or social maladjustment and that it should be addressed by either attitudinal changes or behavior modification. Improper evasive action, on the other hand, is largely skilled-based and occurs in crisis situations. Tackling this problem would therefore require better training and/or advanced technological safety systems such as anti-lock brakes or electronic stability control. As for internal thoughts, the authors observe that this frequent recognition error is a good example of human information processing limitations. In this case, the distraction is not visual but cognitive, which implies that any cognitive subtask can interfere with driving, even if it does not represent visual or physical impediments to the accomplishment of the task. Overall, it is important to note that recognition and decision errors include a vast array of information processing components that are responsible for how a person appraises a situation and for decisions that are taken with regards to specific driving actions. For example recognition errors can involve failures to perceive, encode, analyze or understand a situation, which may be related to hypovigilance, fatigue, distraction, inattention, substance use, inexperience, etc. Furthermore, in an activity like the driving task, these processes also have a lot to do with perceiving and managing risk. Recognition and decision errors therefore often relate to a misunderstanding of the dangerousness of the situation and/or to the adoption of unnecessary risk-taking
Human Factors in the Motor Carrier Industry in Canada 8
behaviors that may or may not be deliberate. Traveling too fast for conditions, following to closely, weaving in and out of traffic, dangerous overtaking, non-respect of intersection rules are good examples of high-risk behaviors (HRBs) that are central in crash causation. It is therefore important to keep in mind that recognition and decision errors cover a lot of ground and include the most investigated topics in contemporary road safety research, including risk perception, high-risk behaviors, inexperience, distraction, inattention, fatigue, substance use, etc. 1.1.2 The Unsafe Driving Act study (Hendricks et al., 2001) The Unsafe Driving Act (UDA) study followed in the footsteps of the Tri-Level project but with a closer look at unsafe driving acts that lead to crashes, as well as situational, driver and vehicle characteristics associated with these crashes. The study focused on a sample of 723 crashes (involving 1284 drivers) that occurred in the U.S. in 1996 and 1997. The investigators used an 11-step approach to evaluate the crashes and uncover contributing factors. In brief, the results indicate that six main causal factors accounted for most of the problem behaviors:
• Driver inattention 22.7% • Speeding 18.7% • Alcohol impairment 18.2% • Perceptual errors (e.g. look but didn’t see) 15.1% • Decision errors (e.g. turn with obstructed view) 10.1% • Incapacitation (e.g. fell asleep) 6.4%
The types of crash and specific behavioral errors were also identified. The following crash types and associated behavioral errors account for almost 50% of crashes involving driver errors:
• Same direction, rear-end (inattention) 12.9% • Turn, merge, path encroachment (looked but did not see) 12% • Single driver, roadside departure (speed, alcohol) 10.3% • Intersecting paths, straight paths (looked but did not see, etc.) 4.1% • Same traffic-way, opposite direction (inattention, speed) 2.6% • Backing, other, miscellaneous (following too closely, speed) 1.3%
In terms of interventions, the authors made the following recommendations
• Education and training for driver inattention and gap acceptance; • Enforcement to reduce speeding, following too closely, and DWI; • Rear-end crash avoidance systems to compensate for inattention and following
too closely; • Intersection collision avoidance systems to compensate for errors at intersections; • Lane keeping systems to prevent lane encroachment and roadside departure
crashes.
Human Factors in the Motor Carrier Industry in Canada 9
1.1.3 Studies based on self-reports Another strategy to study human factors associated with crashes is by means of self-reports. In the last fifteen years, many self-report studies have been done to try to gain a clearer understanding of the nature of driver errors. A common method consists of analyzing self-reported driving habits and crash history of representative samples of drivers then regrouping them into nominal categories. Several authors have used this approach (Aberg & Rimmo, 1998; Blockey & Hartley, 1995; Lajunen, Parker, & Summala, 2004; Lawton, Parker, Manstead, & Stradling, 1997; Lawton, Parker, Stradling, & Manstead, 1997; Mesken, Lajunen, & Summala, 2002; Parker, Reason, Manstead, & Stradling, 1995; Parker, West, Stradling, & Manstead, 1995; Sullman, Meadows, & Pajo, 2002; West, French, Kemp, & Elander, 1993; West & Hall, 1997). The results mainly suggest a three-factor structure of causal factors composed of:
• Violations (deliberate deviations from safe driving practices); • Errors (serious mistakes or judgment errors); • Lapses (inattention).
It is important to note that violations, which essentially define risk-taking behaviors, are about three times more frequent than dangerous errors and lapses. Furthermore, in the Parker, Reason, Manstead et al. (1995), the Parker, West, Stradling et al. (1995) and the Sullman, Meadows and Pajo (2002) studies, this self-reported tendency to take risks was a significant predictor of collisions, whereas dangerous errors and lapses were not. Note however that Mesken at al. (2002) as well as Sullman (2004) found that it was the errors factor that predicted crashes. Some of the studies also found that the violations factor could be divided into ordinary violations (as described above) and aggressive violation that have to do with expressing hostility toward another road user while driving in an aggressive manner. This four-factor structure was observed by Chapman, Roberts and Underwood (2000), Dimmer and Parker (1999), Lawton, Parker, Manstead et al. (1997) as well as Sullman et al. (2002). These studies therefore bring further empirical validity, confirming the key role of risk-taking behaviors in driving errors and associated injuries and fatalities. Jelalian et al. (2000), Stevenson and Palarama (2001), Rajalin (1994), Turner et al. (2004) as well as Clarke et al. (2005) also observed empirical links between collisions and risk-taking behaviors. These authors generally suggest that strategies aimed at reducing risk-taking by drivers in general and by young drivers in particular need to be developed. Evaluation procedures aimed at screening the riskiest individuals also represent a legitimate approach (Iversen and Rundmo, 2002). Once these individuals are identified, specific interventions could be conducted in order to decrease their level of risk-taking (education, training, motivational interventions, enforcement, clinical approach, close monitoring etc.). High-risk behaviors at the wheel and interventions aimed at risk-taking will be addressed in the decision errors section of this report.
Human Factors in the Motor Carrier Industry in Canada 10
1.2 CMV crash causation studies 1.2.1 The LTCCS The Tri-level Indiana study used a clinical approach based on the assessment of a team of experts to determine which factors were responsible for crashes. The LTCCS used a different methodology, with the aim of gathering more robust, complex and objective results. While expert analysts still conducted in-depth examinations of each crash situation, the process to relate overall contributing factors to the occurrence of motor carrier crashes was statistical rather than clinical, thus relying more on mathematical relationships and facts and less on clinical judgment. The goal of the study was not to determine direct causality per se, but rather to identify factors that increase the risk of motor carrier crashes in order to provide an empirical basis for countermeasures. Blower (2005) notes that the concept of causation is a complex phenomenon and that elements that influence the occurrence of a crash can take place months, days or hours before it occurs. Furthermore, factors like fatigue and speeding are major contributors in road crashes, but they do not always result in a crash. In the LTCCS, causality is thus described in terms of increased risk for a crash and is assessed by looking at the critical event (that led to the crash), the critical reason (why the critical event happened) and over 1000 driver, vehicle and environment associated factors, which need to be understood in a correlational perspective rather than causal. While the methodology is different, the conceptualization of driver factors is similar to the Tri-level Indiana study. Contributing factors are either driver, vehicle or environment related and driver factors are classified as recognition (driver was inattentive, distracted or failed to observe and recognize the situation adequately), decision (e.g. driving too fast for condition, misjudge speed of others, follow too closely, etc.), performance (e.g. driver panicked, overcompensated, exercised poor directional control, etc.) and non-
performance errors (fell asleep, was disabled by hearth attack or seizure, was physically impaired, etc.). For each of the 963 truck crashes that were analyzed, the study team identified the critical event, the critical reason and the associated factors, and these were then classified on the basis of the above-mentioned error taxonomy. The 963 crashes selected were determined to be representative of the 120,000 large truck crashes that occurred between April 2001 and December 2003 in the U.S. (FMCA, 2007). Each of the 963 crashes was therefore given a sampling weight and a national estimate in terms of total crashes was created for the different analyses. It is therefore important to remember that the results of the LTCCS are often expressed in terms of weighted data and not absolute, observed values. It is also important to underline that the LTCCS has been criticized (e.g. Donaldson, 2005). The main criticisms were that the study did not use any exposure data and did not include a control group. While these criticisms bring forward relevant and important elements for discussion (see Hedlund, 2006), the LTCCS nevertheless contributes a unique and robust database that generates a better understanding of motor carrier crashes
Human Factors in the Motor Carrier Industry in Canada 11
and provides some empirical basis for the orientation and the development of safety interventions. In fact, with crash causation studies such as the Tri-level Indiana study, the ETAC study the LTCCS and studies based on self-reports, it becomes possible for safety practitioners to target risk factors that were empirically identified instead of relying solely on conceptual analyses, judgment and perceptions. Research leads to intervention in a risk-based, theory driven and data driven process. This is the kind of strategic and responsible approach that should be followed when addressing public health issues such as road safety. The main results of the LTCCS can be summarized as follows:
• For all of the crashes analyzed in the study (includes single and multiple vehicle crashes):
- Trucks were assigned the critical reason in 55% of the cases and driver
factors accounted for 87% of these critical reasons. Truck drivers were therefore assigned 48% of the critical reasons of all the crashes. Note that vehicle-related factors, the most traditional target in motor carrier safety interventions, only represent 10.1% of the critical reasons.
- When the truck driver was assigned the critical reason, the following
categories of driver errors were observed:
o Recognition errors: 28.4%; o Decision errors for: 38%; o Performance errors: 9.2 %; o Non-performance errors: 11.6%
- Three types of critical events accounted for 82.4 % of crashes:
o Running out of the lane (into other lane or off the road): 32.1%; o Vehicle loss of control (due to traveling too fast for condition,
cargo shift, vehicle failure, road conditions, other): 28.6%; o Colliding with rear end of other vehicle in truck’s travel lane:
21.7%.
- The most prevalent associated factors involve the driver:
o Prescription drugs: 26.9%; o Over-the-counter drugs: 17.3 %; o Traveling too fast for conditions: 22.9%; o Driver fatigue: 13%; o Illegal drugs, alcohol and driver illness are very rare.
Human Factors in the Motor Carrier Industry in Canada 12
• In multiple-vehicle crashes involving a truck and a car:
- Trucks were assigned the critical reason in 44% of the cases and driver factors accounted for 88% of these reasons (89 % for cars);
- As critical reasons, the following category of driving errors were
observed: o Recognition errors: 35.5% for trucks and 30.3% for cars; o Decisions errors: 42.6% for trucks and 23.5% for cars: o Performance errors 6.8% for trucks but 19.3% for cars; o Non-performance 2.8% for trucks and 15.6% for cars.
- With regards to most frequent associated factors:
o Legal drugs: 28% for trucks, 33.9% for cars; o Driving too fast for conditions: 15.2% for trucks, 10.4% for cars; o Fatigue: 7.5% for trucks, 14.5% for cars.
The results of the LTCCS are very significant. They confirm that human factors and driver errors are the main reasons for truck crashes, with an involvement of roughly 90%, similar to what is observed in general road safety studies. Again, recognition and decision errors are the most recurrent and they are associated with problems such as traveling too fast for conditions, fatigue and legal drug use. The data shows that recognition and decision errors are more salient for CMV drivers (78.1% of critical reasons) than for LDV drivers involved in CMV crashes (53.8% of critical reasons). This suggests that the processes involved in recognition errors (perception, distraction, hypovigilance, fatigue) and decision errors (risk perception, risk-taking, aggressive driving, judgment problems) should be the primary targets for CMV safety interventions. In a risk-based perspective, performance and non-performance errors would appear less of a priority for truck drivers (9.6% of critical reasons) than for light vehicle drivers involved in CMV crashes (34.9% of critical reasons). In the case of fatigue-related crashes, it is interesting to note that compared to current trends in international data (with prevalence rates of +/- 20% of crashes, see for example, SAAQ, 2007), the prevalence appears lower for CMV drivers in the LTCCS (7.5%, as an associated factor). One explanation could be that crashes identified as fatigue-related in the LTCCS may be associated with extreme drowsiness and falling-asleep-at-the-wheel episodes, as it is typically understood in mainstream contemporary driver fatigue research. However, if one refers to the vigilance research paradigm rather than to the sleep research paradigm, it becomes clear that a significant share of recognition errors, currently associated with either distraction or inattention, could in fact be caused by fatigue-related fluctuation of attention.
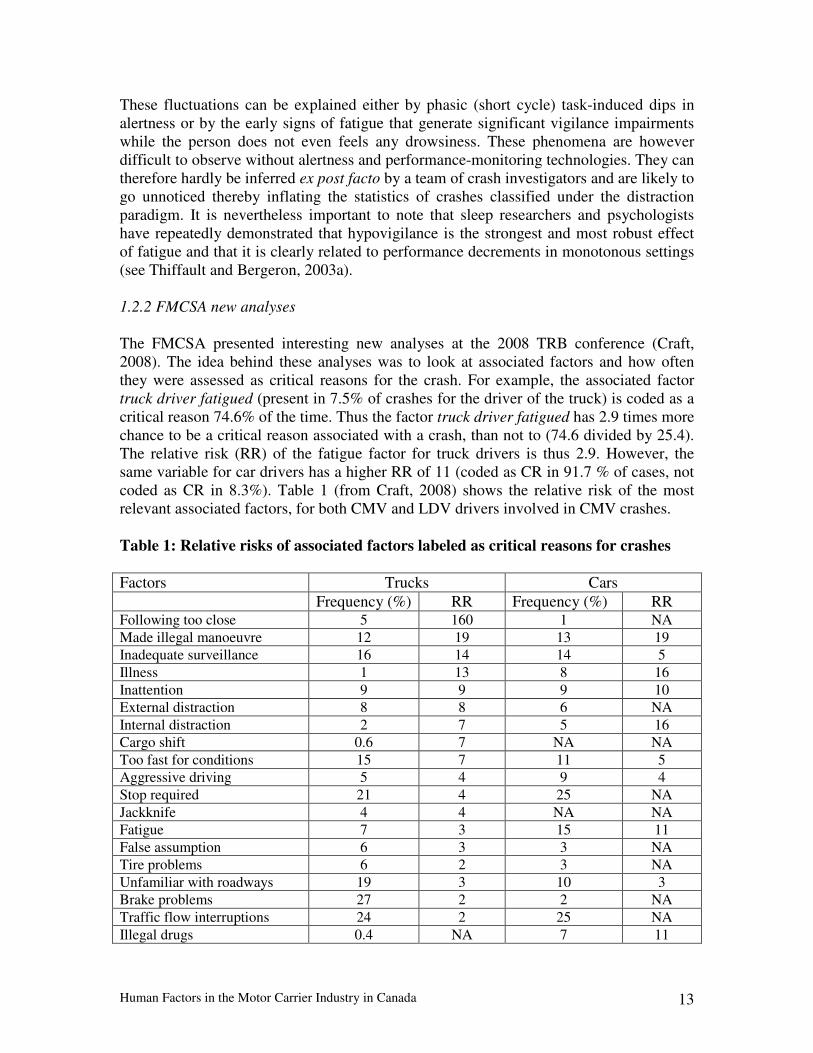
Human Factors in the Motor Carrier Industry in Canada 13
These fluctuations can be explained either by phasic (short cycle) task-induced dips in alertness or by the early signs of fatigue that generate significant vigilance impairments while the person does not even feels any drowsiness. These phenomena are however difficult to observe without alertness and performance-monitoring technologies. They can therefore hardly be inferred ex post facto by a team of crash investigators and are likely to go unnoticed thereby inflating the statistics of crashes classified under the distraction paradigm. It is nevertheless important to note that sleep researchers and psychologists have repeatedly demonstrated that hypovigilance is the strongest and most robust effect of fatigue and that it is clearly related to performance decrements in monotonous settings (see Thiffault and Bergeron, 2003a). 1.2.2 FMCSA new analyses The FMCSA presented interesting new analyses at the 2008 TRB conference (Craft, 2008). The idea behind these analyses was to look at associated factors and how often they were assessed as critical reasons for the crash. For example, the associated factor truck driver fatigued (present in 7.5% of crashes for the driver of the truck) is coded as a critical reason 74.6% of the time. Thus the factor truck driver fatigued has 2.9 times more chance to be a critical reason associated with a crash, than not to (74.6 divided by 25.4). The relative risk (RR) of the fatigue factor for truck drivers is thus 2.9. However, the same variable for car drivers has a higher RR of 11 (coded as CR in 91.7 % of cases, not coded as CR in 8.3%). Table 1 (from Craft, 2008) shows the relative risk of the most relevant associated factors, for both CMV and LDV drivers involved in CMV crashes. Table 1: Relative risks of associated factors labeled as critical reasons for crashes
Factors Trucks Cars Frequency (%) RR Frequency (%) RR Following too close 5 160 1 NA Made illegal manoeuvre 12 19 13 19 Inadequate surveillance 16 14 14 5 Illness 1 13 8 16 Inattention 9 9 9 10 External distraction 8 8 6 NA Internal distraction 2 7 5 16 Cargo shift 0.6 7 NA NA Too fast for conditions 15 7 11 5 Aggressive driving 5 4 9 4 Stop required 21 4 25 NA Jackknife 4 4 NA NA Fatigue 7 3 15 11 False assumption 6 3 3 NA Tire problems 6 2 3 NA Unfamiliar with roadways 19 3 10 3 Brake problems 27 2 2 NA Traffic flow interruptions 24 2 25 NA Illegal drugs 0.4 NA 7 11
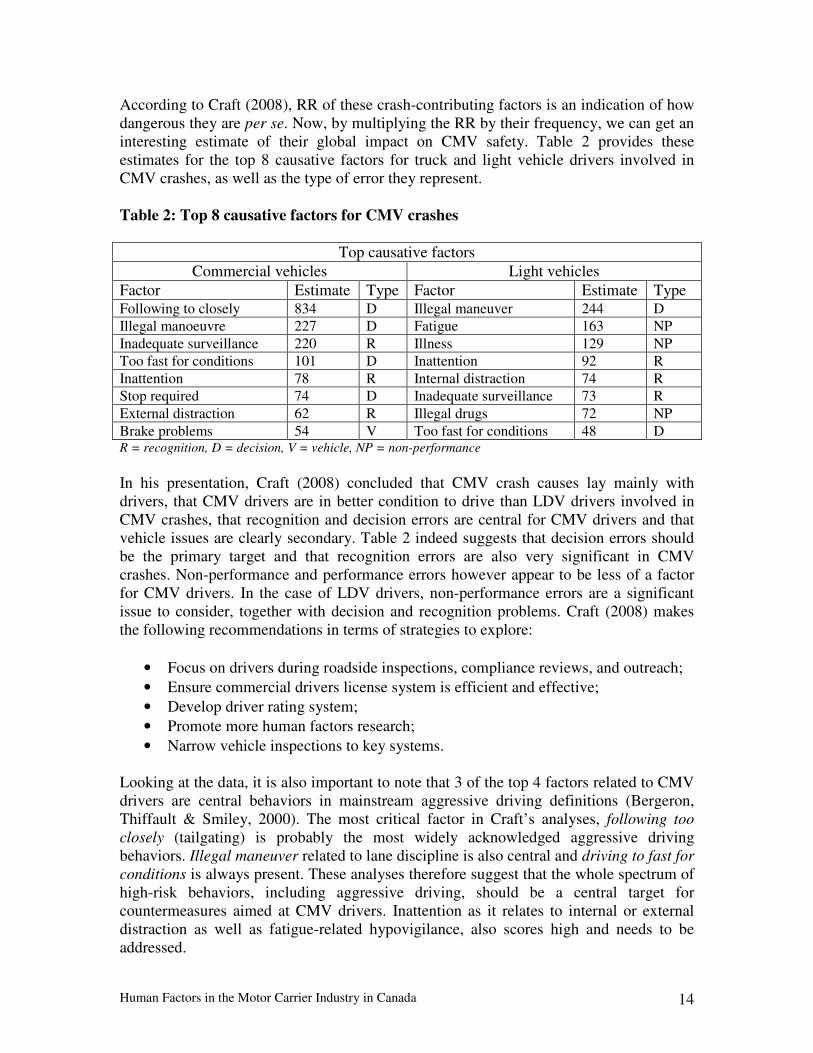
Human Factors in the Motor Carrier Industry in Canada 14
According to Craft (2008), RR of these crash-contributing factors is an indication of how dangerous they are per se. Now, by multiplying the RR by their frequency, we can get an interesting estimate of their global impact on CMV safety. Table 2 provides these estimates for the top 8 causative factors for truck and light vehicle drivers involved in CMV crashes, as well as the type of error they represent. Table 2: Top 8 causative factors for CMV crashes
Top causative factors
Commercial vehicles Light vehicles Factor Estimate Type Factor Estimate Type Following to closely 834 D Illegal maneuver 244 D Illegal manoeuvre 227 D Fatigue 163 NP Inadequate surveillance 220 R Illness 129 NP Too fast for conditions 101 D Inattention 92 R Inattention 78 R Internal distraction 74 R Stop required 74 D Inadequate surveillance 73 R External distraction 62 R Illegal drugs 72 NP Brake problems 54 V Too fast for conditions 48 D R = recognition, D = decision, V = vehicle, NP = non-performance In his presentation, Craft (2008) concluded that CMV crash causes lay mainly with drivers, that CMV drivers are in better condition to drive than LDV drivers involved in CMV crashes, that recognition and decision errors are central for CMV drivers and that vehicle issues are clearly secondary. Table 2 indeed suggests that decision errors should be the primary target and that recognition errors are also very significant in CMV crashes. Non-performance and performance errors however appear to be less of a factor for CMV drivers. In the case of LDV drivers, non-performance errors are a significant issue to consider, together with decision and recognition problems. Craft (2008) makes the following recommendations in terms of strategies to explore:
• Focus on drivers during roadside inspections, compliance reviews, and outreach; • Ensure commercial drivers license system is efficient and effective; • Develop driver rating system; • Promote more human factors research; • Narrow vehicle inspections to key systems.
Looking at the data, it is also important to note that 3 of the top 4 factors related to CMV drivers are central behaviors in mainstream aggressive driving definitions (Bergeron, Thiffault & Smiley, 2000). The most critical factor in Craft’s analyses, following too closely (tailgating) is probably the most widely acknowledged aggressive driving behaviors. Illegal maneuver related to lane discipline is also central and driving to fast for conditions is always present. These analyses therefore suggest that the whole spectrum of high-risk behaviors, including aggressive driving, should be a central target for countermeasures aimed at CMV drivers. Inattention as it relates to internal or external distraction as well as fatigue-related hypovigilance, also scores high and needs to be addressed.
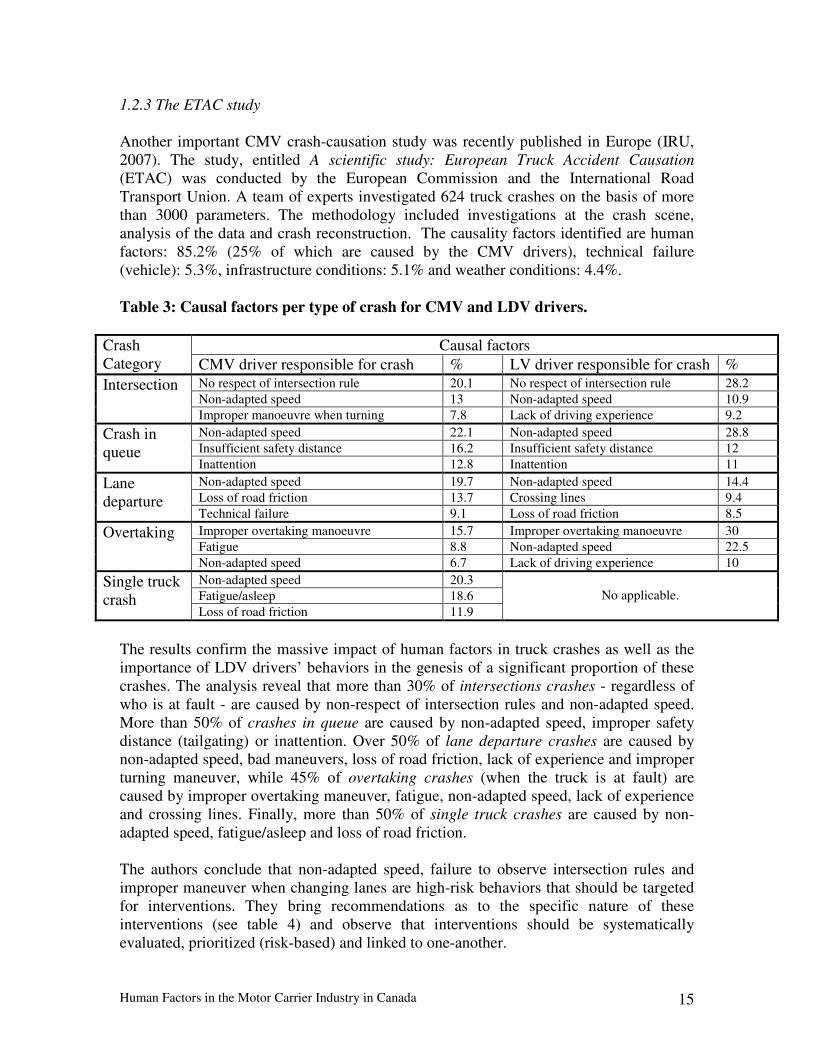
Human Factors in the Motor Carrier Industry in Canada 15
1.2.3 The ETAC study Another important CMV crash-causation study was recently published in Europe (IRU, 2007). The study, entitled A scientific study: European Truck Accident Causation (ETAC) was conducted by the European Commission and the International Road Transport Union. A team of experts investigated 624 truck crashes on the basis of more than 3000 parameters. The methodology included investigations at the crash scene, analysis of the data and crash reconstruction. The causality factors identified are human factors: 85.2% (25% of which are caused by the CMV drivers), technical failure (vehicle): 5.3%, infrastructure conditions: 5.1% and weather conditions: 4.4%. Table 3: Causal factors per type of crash for CMV and LDV drivers.
Crash Category
Causal factors CMV driver responsible for crash % LV driver responsible for crash %
Intersection No respect of intersection rule 20.1 No respect of intersection rule 28.2 Non-adapted speed 13 Non-adapted speed 10.9 Improper manoeuvre when turning 7.8 Lack of driving experience 9.2
Crash in queue
Non-adapted speed 22.1 Non-adapted speed 28.8 Insufficient safety distance 16.2 Insufficient safety distance 12 Inattention 12.8 Inattention 11
Lane departure
Non-adapted speed 19.7 Non-adapted speed 14.4 Loss of road friction 13.7 Crossing lines 9.4 Technical failure 9.1 Loss of road friction 8.5
Overtaking Improper overtaking manoeuvre 15.7 Improper overtaking manoeuvre 30 Fatigue 8.8 Non-adapted speed 22.5 Non-adapted speed 6.7 Lack of driving experience 10
Single truck crash
Non-adapted speed 20.3 No applicable. Fatigue/asleep 18.6
Loss of road friction 11.9
The results confirm the massive impact of human factors in truck crashes as well as the importance of LDV drivers’ behaviors in the genesis of a significant proportion of these crashes. The analysis reveal that more than 30% of intersections crashes - regardless of who is at fault - are caused by non-respect of intersection rules and non-adapted speed. More than 50% of crashes in queue are caused by non-adapted speed, improper safety distance (tailgating) or inattention. Over 50% of lane departure crashes are caused by non-adapted speed, bad maneuvers, loss of road friction, lack of experience and improper turning maneuver, while 45% of overtaking crashes (when the truck is at fault) are caused by improper overtaking maneuver, fatigue, non-adapted speed, lack of experience and crossing lines. Finally, more than 50% of single truck crashes are caused by non-adapted speed, fatigue/asleep and loss of road friction. The authors conclude that non-adapted speed, failure to observe intersection rules and improper maneuver when changing lanes are high-risk behaviors that should be targeted for interventions. They bring recommendations as to the specific nature of these interventions (see table 4) and observe that interventions should be systematically evaluated, prioritized (risk-based) and linked to one-another.

Causal Factors
Manufacturers Infrastructure Providers
Governments Truck Drivers Other Users Media
Non-adapted speed
-Adaptive cruise control -Speed control system related to the used infrastructure.
Effective traffic signing and traffic warning to inform drivers about the speed limit of the road.
Increase enforcement specifically regarding non-adapted speed.
Adapt speed according to conditions.
Adapt speed according to conditions.
- Awareness campaign regarding speeding and safety distance; - Report objectively and based on facts and figures on who is causing the accident.
Failure to observe intersection rules
- Ultrasonic guard system for collision zones with vulnerable road users; - Warning of local dangers by vehicle to vehicle communication; - Blind spot mirrors.
- Improved visibility of vertical signs may help the driver to observe the traffic rules; - Effective traffic signing and traffic warning.
- Revising driving school regulations to help new drivers to understand truck maneuvers; - Awareness campaign regarding intersection rules; - Train drivers (truck and other drivers to respect intersection rules, to have an adapted speed and to fill the lack of driving experience, etc.); - Increase enforcement.
- Plan your trip in advance (be informed about infrastructure limitations and restrictions); - Remember limitations of your visibility; - Try to anticipate maneuvers of other road users; - Respect traffic regulations at all times.
- Increase driving experience by refresher training; - Respect traffic regulations at all times.
Awareness campaigns aiming at helping to understand truck maneuvers.
Improper maneuvers when hanging lanes
- Lane guard system; - Turning and lane change assistance; - Traction and stability control system; - Active roll stabilization.
- Loss of road friction is a cause often linked to an improper manoeuvre when changing lane; - A special focus on the state of the road is necessary.
Plan and maintain safe road infrastructure appropriate to current and foreseeable traffic demand.
Increase driving experience by refresher training (braking with old and bad habits).
Increase driving experience by refresher training.
Awareness campaign regarding speeding, safety distance and driving maneuvers of trucks.
Table 4: Recommendations from the ETAC study
Human Factors in the Motor Carrier Industry in Canada 17
The authors also bring interesting information with regards to the contribution of fatigue. They observe that fatigue was the main cause in only 6% of the crashes, of which 37% were fatal and 29% were single vehicle crashes. They note that most of these crashes occurred between 02:00 and 02:59 or between 15:00 and 15:59, corresponding to circadian low points, and that they mainly occurred on inter-urban roads, where monotony is likely to be a factor. They however also observe that stages of hypovigilance related to minor decreases of alertness are also likely to produce crashes and that these are often accredited to inattention or distraction. Since this type of hypovigilance is a robust effect of fatigue, these crashes should be understood as fatigue-related and should be addressed as such. The problem lies with their detection and classification, since fatigue-related hypovigilance is hard to detect by looking at an accident scene or by analyzing drivers testimonies. Laboratory studies however show fast-induced vigilance deterioration under monotonous driving conditions and large individual differences in susceptibility to road monotony (Thiffault & Bergeron, 2003a; Thiffault & Bergeron, 2003b, Meuter et al., 2005). The ETAC study also describes blind spot accidents, referring to areas around a truck that are not visible for the driver. The data show that of the 30 crashes that occurred at intersections, 14 involved a vulnerable road user (pedestrian or two-wheeler) in a blind spot. When the crash was attributable to blind spots, 75% of crashes were fatal. In accordance with the Tri-level Indiana study and the LTCCS, the principle recommendation of the ETAC project is that safety programs for motor carriers need to be focused on human factors, where 86% of crash causation lies. It is stated that attention however needs to be focused on all road users involved in CMV crashes, and not only truck drivers. 1.2.4 The bus crash causation study (BCCS) In 2009, the FMCSA (FMCSA, 2009a) tabled to congress the report of the Bus Crash Causation Study (BCCS). In its introduction, the report states that on average 50 people die in the US in cross-country or intercity bus-related crashes, contrasting this number with the 4,800 that die annually as a results of crashes involving large trucks. It might be important to note however that even though these numbers are quite small, bus crashes get significant exposure and are considered as a very serious issue. Initially, the intent of this crash causation study was to use a methodology similar to the LTCCS and to gather a nationally representative sample of bus crashes for the analyses. However, given the limited frequency of bus crashes, it was decided to run the analyses from data collected only in New Jersey, part of the New-York city area and home of large bus fleets. Overall, the analyses were conducted on a sample of 39 crashes. In brief, the results indicate that of the 39 bus crashes that occurred in New-Jersey over 2 years (05-06):
Human Factors in the Motor Carrier Industry in Canada 18
• 35 were caused by human errors (90%); • In 19 cases, the critical reason for the crash was assigned to the bus (48.7%) of
which 15 were identified as driver errors (79%); • Of these 15 driver errors, 10 were classified as recognition errors (66%) and 2 as
decision errors (13%); • Other causes identified were 2 fires, 1 brake failure and 1 icy road conditions; • For the other 20 crashes, the critical reason was assigned to the other driver in 16
cases of which recognition and decision errors represented 35% of cases 25% respectively;
• Note that in 4 cases the critical reason was assigned to pedestrians, and these were all recognition errors.
In their conclusions, the authors emphasized that once again human errors were the main causes for crashes. They observe that most of bus driver human errors like inattention, distraction and decision errors are not violations to laws and regulations per se and that therefore laws, regulations and enforcement alone cannot be sufficient to produce safer drivers. They acknowledged the need to widen the scope with regards to driver-based interventions that could complement enforcement. 1.2.5 Best practices for truck safety (Jonah et al., 2009) In 2009, the Traffic Injury Research Foundation published a study aimed at analyzing the causes of fatal collisions involving heavy trucks in B.C. with the objective of identifying effective prevention programs and policies to improve CMV safety. After having characterized these truck crashes, the authors conducted a review of literature of best practices in other regions and formulated recommendations for government, motor carriers, industry and policy services. Below are important highlights from this study:
• Using charges laid by police as a result of the collision, CMV drivers were slightly more likely to have been charged that the other drivers involved, particularly in the case of fatal crashes;
• Alcohol involvement was considerably lower for CMV drivers than for other fatally injured drivers;
• Based on the analysis, the key contributors of CMV crashes are: o Speeding; o Inattention; o Impairment by alcohol and drugs; o Fatigue;
• The key characteristics of crashes are: o Run-off-road collisions; o Head-on collisions; o Undivided roads; o Curved roads; o Poor surface conditions.
Human Factors in the Motor Carrier Industry in Canada 19
Bellow is a high level summary of the key best practices that were recommended by the authors: For governments:
• Periodical analysis of collision data to track trends in crash causation factors; • Establish provincial multi-stakeholder committee; • Establish strategy based on a safe-system approach; • Develop specific actions and provide specific funding; • Establish quantified objectives in safety performance, and track actual
performance on the basis of these objectives; • Encourage provinces and territories to review licensing standards and testing
procedures; • Encourage more female drivers; • Create program with 100% tuition funding for driver training; • Establish Certificate of Professional Competence; • Develop and evaluate standard curriculum for driver training programs; • Use a safety assessment system like the CSA-2010 approach; • Require electronic stability control (ESC); • Speed limiters on trucks fixed and 105 kph; • Require tire under-inflation warning system and alcohol interlock; • Concrete barriers on divided highways, 2 + 1 lane system, high tension cable
systems; • Lateral and central rumble strips; • Use roadside variable message signs to warn drivers of poor conditions ahead; • Awareness/education programs for the public and for the motor carrier industry
about key crash contributors; • Recognize safer motor carriers (PIC program); • Monitor safety performance, evaluate effectiveness of interventions; • Produce annual reports
For industry
• Using safety data, demonstrate to senior management the importance of safety management;
• Adopt SMS process that encourage leadership and accountability from senior management;
• Safe system approach within the SMS, looking at drivers, vehicle, infrastructure, culture;
• Multidisciplinary approach to safety issues; • Fleet safety committees; • Measurable target for safety performance; • Formal safety policy; • Valid recruitment and selection processes (assess risk-taking potential); • Adopt driver performance & fitness standards;
Human Factors in the Motor Carrier Industry in Canada 20
• Implement FMPs; • Select safe vehicles; • Implement EOBRs, event data recorders; • Develop incentive programs; • Regular risk assessment; • Monitor safety performance; • Produce annual safety reports;
For police services
• Identify high-risk corridors on the basis of collision data; • Multi-stakeholders committees; • Regular enforcement campaigns aimed at seat-belt use and impaired driving; • Hot lines for public complaints about unsafe truck driver behaviors.
1.2.6 Naturalistic studies Hanowski et al. (2007) conducted analyses on two sets of data stemming from commercial vehicle naturalistic studies. The first study was initially aimed at studying fatigue within local/short-haul (LSH) operations (Hanowski et al., 2000), and the second one was focused on fatigue in long haul operations with sleeper-berth (SB) (Dingus et al., 2002). Across both studies, 210 critical car/truck interactions were identified and analyzed. The contributing factors (why the critical interaction occurred) were assessed and the results suggest that that the main contributing factor for CMV drivers is the Driving Technique factor whereas the lead factor for LDV drivers, who initiated 78% of these critical incidents, was aggressive driving. Consequently, the authors recommend that the focus of countermeasure should be put on aggressive driving from light vehicles and overall better training for truck drivers, including defensive driving skills. These studies also included the identification of the critical reason to describe why the critical event occurred. Note that critical reasons are defined in the text with the exact same terms as contributing factors. It is noted that this category was also used in the LTCCS, so the reader is led to understand that this is the reason why it was also used here. Interestingly, the analyses of critical reasons however bring data that is somewhat different from what is observed with regards to contributing factors, and this data is not really processed further in the discussion or in the above-mentioned recommendations stemming from the study. Table 5 (from Hanowski et al., 2007) presents the critical reason for CMV driver-initiated critical incidents for both datasets.

Human Factors in the Motor Carrier Industry in Canada 21
Table 5: Percentages of critical reason for CMV driver-initiated critical incidents
Looking at this data, it is clear that speeding and aggressive driving are important contributing factors, representing 32% of the critical reasons in the L/SH study and 47.6% in the SB study. Therefore it would appear justified to recommend that countermeasures targeting aggressive driving and risk-taking behaviors also be aimed at CMV drivers, not just LDV drivers. The two studies described above address CMV/LV interactions from the point of view of the heavy vehicle. Dingus at al. (2005) also looked at car/truck interactions in a naturalistic setting using 100 instrumented cars. The results indicate that the most frequent factors in critical car/truck interaction were late braking for stopped/stopping traffic and lane change without sufficient gap. Of the 246 events recorded, LDV drivers were deemed at fault in 56% of the cases and CMV drivers in 32% of the cases. The most frequent factors for CMV drivers at-fault incidents were lane change without sufficient gap (26.6%), followed by lateral deviation through vehicle (21.5%) and left-turn without clearance (13.9%). Like Hanowski et al., (2007), Dingus et al. (2005) recommend focusing on aggressive driving for light vehicle drivers and driving technique training for CMV drivers. 1.2.7 Identifying unsafe driver actions that lead to fatal car-truck crashes (Kostyniuk et al. (2002) In order to gain a better understanding of causal factors for car/truck crashes, Kostyniuk et al. (2002) compared car/car crashes to car/truck crashes in 1995-1998 data from the Fatal Accident Reporting System (FARS). The FARS database contains information from police reports as well crash survivors and other witness testimonies. The analysis file contained 35,244 fatal car/car crashes and 10,732 fatal car/truck crashes.
Human Factors in the Motor Carrier Industry in Canada 22
The results suggest that car/car and car/truck crashes are caused by the same driver errors. The most common of these errors are: failing to keep in lane, failing to yield right of way, driving too fast for conditions, disobeying traffic control and laws and inattention. They represent 65% of reported unsafe driving acts in both classes of crashes. Four factors nevertheless were more likely to be found in fatal car/truck crashes than in fatal car/car crashes: following improperly, driving with vision obscured, drowsy or fatigued driving and improper lane change. However, these factors were recorded in only 5% of the fatal crashes. In a second set of analyses, the authors closely examined a random sample of 529 car/truck crashes in light of the four differentiating factors listed above. The results suggest that car drivers are responsible for more unsafe actions than truck drivers and that they represented 98 % of the fatalities. The authors also note the following:
• Drowsy or fatigued driving and following improperly were more likely to be reported for male than female car drivers;
• Car drivers in crashes in which vision was obstructed tended to be older than other drivers;
• Car drivers who were drowsy/fatigued were likely to be younger than other drivers;
• Younger truck drivers were more likely than older truck drivers to follow improperly, speed, and use alcohol or drugs.
The authors finally discuss the relevance of their findings for the development of educational material. They suggest the following:
• Teaching motorists how to operate around large trucks, focusing instruction on the four unsafe factors;
• Creating an interactive web site that educates drivers about the dangers associated with driving near trucks and allows them to test their knowledge;
• Personal computer–based driving simulations, demonstrations, or computer games showing interactions between cars and large trucks.
1.2.8 The ATRI study on predictors of crash involvement In an important longitudinal study done for the American Transportation Research Institute (ATRI), Murray et al. (2005) evaluated the crash predictive value of different driver-related variables such as violations discovered at roadside inspections, driver traffic conviction information and past crash occurrence in a sample of 540,750 drivers. As can be seen in table 6, regression analyses showed that reckless driving is associated with the highest increase in likelihood of future crashes. When cited for this offense, drivers’ future crash probability increases by 325%. An examination of table 6 further reinforces that risky and aggressive driving behaviors are at the top of the list in terms of crash predictive value.
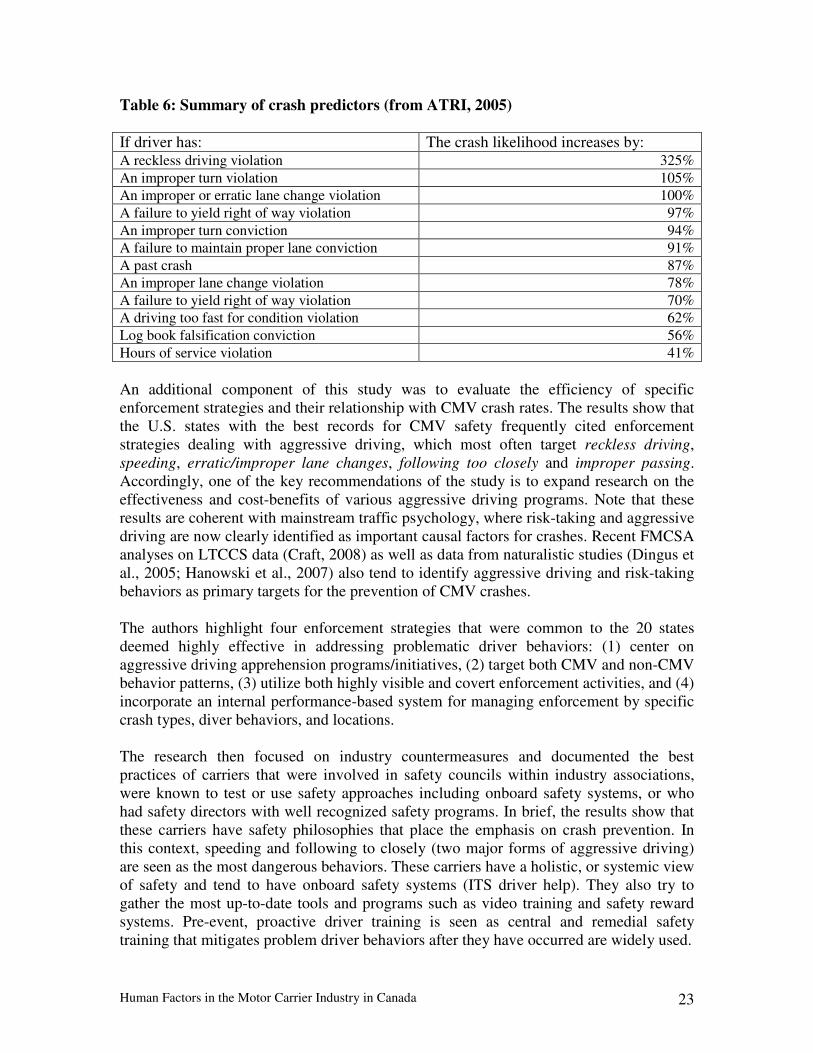
Human Factors in the Motor Carrier Industry in Canada 23
Table 6: Summary of crash predictors (from ATRI, 2005)
If driver has: The crash likelihood increases by: A reckless driving violation 325% An improper turn violation 105% An improper or erratic lane change violation 100% A failure to yield right of way violation 97% An improper turn conviction 94% A failure to maintain proper lane conviction 91% A past crash 87% An improper lane change violation 78% A failure to yield right of way violation 70% A driving too fast for condition violation 62% Log book falsification conviction 56% Hours of service violation 41% An additional component of this study was to evaluate the efficiency of specific enforcement strategies and their relationship with CMV crash rates. The results show that the U.S. states with the best records for CMV safety frequently cited enforcement strategies dealing with aggressive driving, which most often target reckless driving, speeding, erratic/improper lane changes, following too closely and improper passing. Accordingly, one of the key recommendations of the study is to expand research on the effectiveness and cost-benefits of various aggressive driving programs. Note that these results are coherent with mainstream traffic psychology, where risk-taking and aggressive driving are now clearly identified as important causal factors for crashes. Recent FMCSA analyses on LTCCS data (Craft, 2008) as well as data from naturalistic studies (Dingus et al., 2005; Hanowski et al., 2007) also tend to identify aggressive driving and risk-taking behaviors as primary targets for the prevention of CMV crashes. The authors highlight four enforcement strategies that were common to the 20 states deemed highly effective in addressing problematic driver behaviors: (1) center on aggressive driving apprehension programs/initiatives, (2) target both CMV and non-CMV behavior patterns, (3) utilize both highly visible and covert enforcement activities, and (4) incorporate an internal performance-based system for managing enforcement by specific crash types, diver behaviors, and locations. The research then focused on industry countermeasures and documented the best practices of carriers that were involved in safety councils within industry associations, were known to test or use safety approaches including onboard safety systems, or who had safety directors with well recognized safety programs. In brief, the results show that these carriers have safety philosophies that place the emphasis on crash prevention. In this context, speeding and following to closely (two major forms of aggressive driving) are seen as the most dangerous behaviors. These carriers have a holistic, or systemic view of safety and tend to have onboard safety systems (ITS driver help). They also try to gather the most up-to-date tools and programs such as video training and safety reward systems. Pre-event, proactive driver training is seen as central and remedial safety training that mitigates problem driver behaviors after they have occurred are widely used.
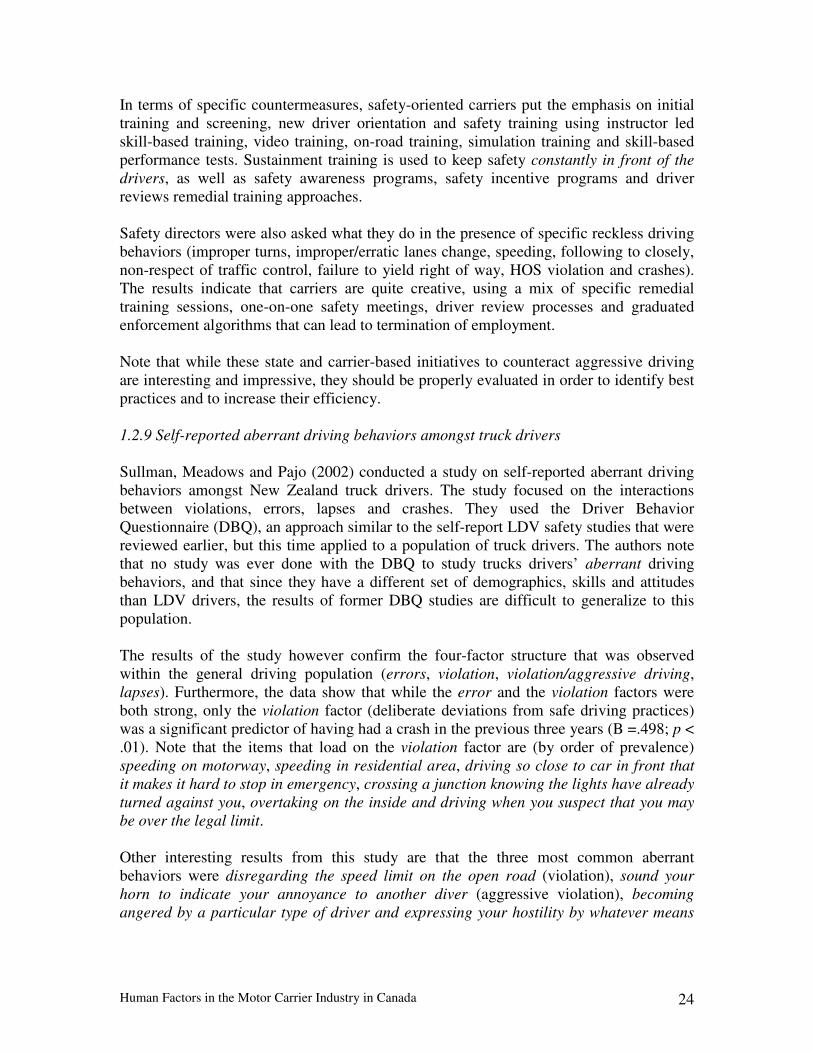
Human Factors in the Motor Carrier Industry in Canada 24
In terms of specific countermeasures, safety-oriented carriers put the emphasis on initial training and screening, new driver orientation and safety training using instructor led skill-based training, video training, on-road training, simulation training and skill-based performance tests. Sustainment training is used to keep safety constantly in front of the drivers, as well as safety awareness programs, safety incentive programs and driver reviews remedial training approaches. Safety directors were also asked what they do in the presence of specific reckless driving behaviors (improper turns, improper/erratic lanes change, speeding, following to closely, non-respect of traffic control, failure to yield right of way, HOS violation and crashes). The results indicate that carriers are quite creative, using a mix of specific remedial training sessions, one-on-one safety meetings, driver review processes and graduated enforcement algorithms that can lead to termination of employment. Note that while these state and carrier-based initiatives to counteract aggressive driving are interesting and impressive, they should be properly evaluated in order to identify best practices and to increase their efficiency. 1.2.9 Self-reported aberrant driving behaviors amongst truck drivers
Sullman, Meadows and Pajo (2002) conducted a study on self-reported aberrant driving behaviors amongst New Zealand truck drivers. The study focused on the interactions between violations, errors, lapses and crashes. They used the Driver Behavior Questionnaire (DBQ), an approach similar to the self-report LDV safety studies that were reviewed earlier, but this time applied to a population of truck drivers. The authors note that no study was ever done with the DBQ to study trucks drivers’ aberrant driving behaviors, and that since they have a different set of demographics, skills and attitudes than LDV drivers, the results of former DBQ studies are difficult to generalize to this population. The results of the study however confirm the four-factor structure that was observed within the general driving population (errors, violation, violation/aggressive driving, lapses). Furthermore, the data show that while the error and the violation factors were both strong, only the violation factor (deliberate deviations from safe driving practices) was a significant predictor of having had a crash in the previous three years (B =.498; p < .01). Note that the items that load on the violation factor are (by order of prevalence) speeding on motorway, speeding in residential area, driving so close to car in front that it makes it hard to stop in emergency, crossing a junction knowing the lights have already turned against you, overtaking on the inside and driving when you suspect that you may be over the legal limit. Other interesting results from this study are that the three most common aberrant behaviors were disregarding the speed limit on the open road (violation), sound your horn to indicate your annoyance to another diver (aggressive violation), becoming angered by a particular type of driver and expressing your hostility by whatever means

Human Factors in the Motor Carrier Industry in Canada 25
you can (aggressive violation). It is important to note that younger drivers reported significantly higher violation scores, higher preferred driving speeds and more crashes. The authors therefore suggest that a reduction in violations (as defined above) committed by CMV drivers should be a way to reduce truck crash involvement. They echoed Parker et al. (1995) and suggested that this could be achieved through improvements to the safety culture, including changes in attitudes, beliefs and norms. Further research should consequently look at the efficacy of safety culture initiatives as a means to reduce violations and crashes fro CMV drivers.
1.3 National collision database 2003-2007 Transport Canada periodically compiles data related to heavy vehicles crashes taken from the National collision database (NCDB). NCDB is a national database that contains detailed police report data on fatal, injury and property damage crashes. Although the database is subject to limitations inherent to police report data, it nevertheless represents a relevant source of information that needs to be presented here. Note that the province of Quebec is absent from analyses because of data compatibility issues. NCDB data stems from observations that were made by police officers at the scene of crashes. It is not the result of comprehensive analyses made by crash reconstruction or crash causation experts. It is limited by the format under which police reports are recorded (mainly pre-established boxes to be checked), by the scope of the information considered and by the depth of the analyses that are made on site. NCDB data therefore does not compare to datasets like the LTCCS or the ETAC crash causation studies, which are much more comprehensive and robust. It represents crude data that should be considered as a global trend indicator rather than true crash causation analyses. NCDB however appears to be the only updated Canadian empirical dataset detailing contributing factors to road crashes. It is thus important and relevant to summarize its content with regards to drivers’ conditions and actions in the context of heavy vehicle crashes. Based on the numbers presented in table 7, for the 2003-2007 period, there was an annual average of 50,372 heavy vehicle collisions (straight trucks of over 4536 kg: 28,754, tractor trailers: 22,338), which represents 7.6% of all road crashes. However, as can be seen in table 8, for this five-year period heavy vehicle collisions were responsible for an average of 538 fatalities (19.5% of all road fatalities), of which 448 (84%) occurred outside of the heavy vehicle (other vehicle occupants, pedestrians, cyclists). In terms of injuries, heavy vehicle crashes were responsible for a yearly average of 12,414 injuries (6% of total) of which 8360 (67%) occurred outside of the heavy vehicle.

Human Factors in the Motor Carrier Industry in Canada 26
Table 7: Collisions involving heavy trucks and other vehicles by collision severity
2003 2004 2005 2006 2007 Average Fatal Collisions Involving: Straight trucks > 4536 kg 165 147 169 187 166 167 Tractor-trailers 311 318 292 304 307 306 Heavy trucks 470 454 453 477 463 463 Vehicles other than heavy trucks 2,019 1,982 2,098 2,122 1,999 2,044 Total Fatal Collisions 2,489 2,436 2,551 2,599 2,462 2,507 Personal Injury Collisions Involving: Straight trucks > 4536 kg 4,621 4,787 5,046 5,076 5,166 4,939 Tractor-trailers 4,094 4,147 4,278 3,987 3,903 4,082 Heavy trucks 8,562 8,771 9,177 8,921 8,913 8,869 Vehicles other than heavy trucks 141,983 136,477 136,426 133,610 129,719 135,643 Total Injury Collisions 150,545 145,248 145,603 142,531 138,632 144,512 Property Damage Only (PDO)
Collisions Involving: Straight trucks > 4536 kg 21,678 22,154 23,371 24,203 26,835 23,648 Tractor-trailers 17,829 18,049 18,485 17,184 18,200 17,949 Heavy trucks 38,964 39,623 41,298 40,842 44,471 41,040 Vehicles other than heavy trucks 466,858 458,019 470,502 472,178 508,445 475,200 Total PDO Collisions 505,822 497,642 511,800 513,020 552,916 516,240 All Collisions Involving: Straight trucks > 4536 kg 26,464 27,088 28,586 29,466 32,167 28,754 Tractor-trailers 22,234 22,514 23,055 21,475 22,410 22,338 Heavy trucks 47,996 48,848 50,928 50,240 53,847 50,372 Vehicles other than heavy trucks 610,860 596,478 609,026 607,910 640,163 612,887 Total All Collisions 658,856 645,326 659,954 658,150 694,010 663,259
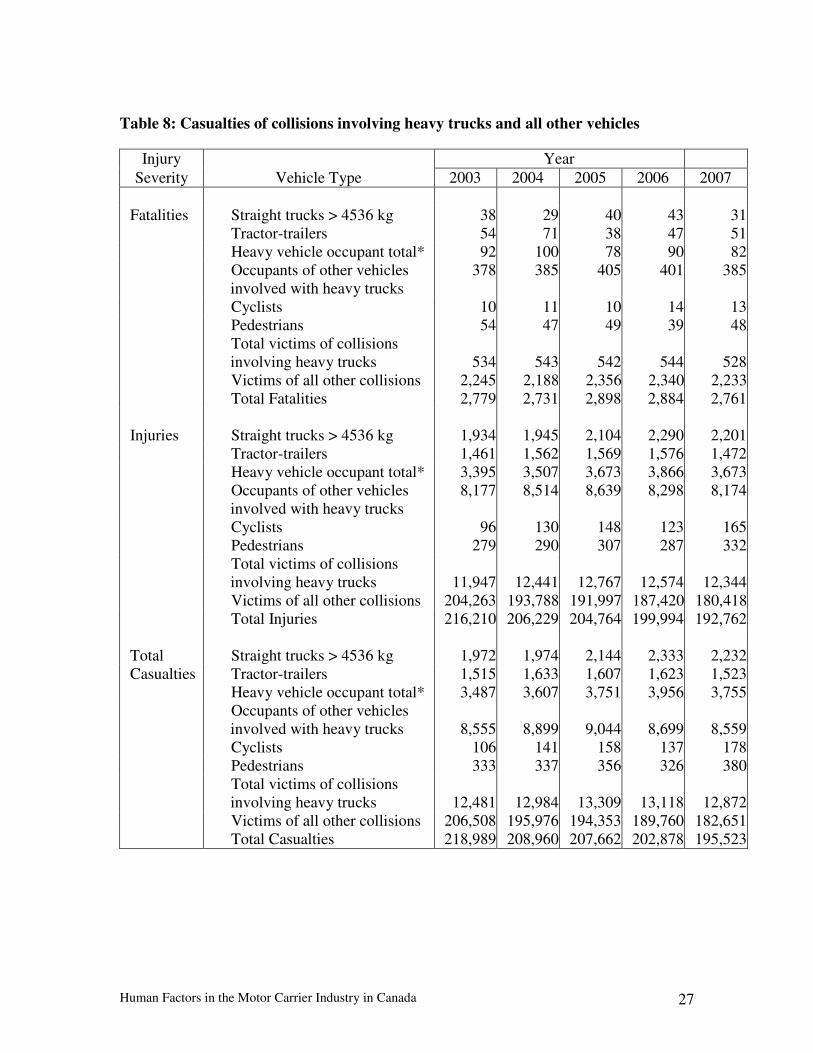
Human Factors in the Motor Carrier Industry in Canada 27
Table 8: Casualties of collisions involving heavy trucks and all other vehicles
Injury Year Severity Vehicle Type 2003 2004 2005 2006 2007
Fatalities Straight trucks > 4536 kg 38 29 40 43 31
Tractor-trailers 54 71 38 47 51 Heavy vehicle occupant total* 92 100 78 90 82
Occupants of other vehicles involved with heavy trucks
378 385 405 401 385
Cyclists 10 11 10 14 13 Pedestrians 54 47 49 39 48
Total victims of collisions involving heavy trucks 534 543 542 544 528
Victims of all other collisions 2,245 2,188 2,356 2,340 2,233 Total Fatalities 2,779 2,731 2,898 2,884 2,761
Injuries Straight trucks > 4536 kg 1,934 1,945 2,104 2,290 2,201 Tractor-trailers 1,461 1,562 1,569 1,576 1,472 Heavy vehicle occupant total* 3,395 3,507 3,673 3,866 3,673
Occupants of other vehicles involved with heavy trucks
8,177 8,514 8,639 8,298 8,174
Cyclists 96 130 148 123 165 Pedestrians 279 290 307 287 332
Total victims of collisions involving heavy trucks 11,947 12,441 12,767 12,574 12,344
Victims of all other collisions 204,263 193,788 191,997 187,420 180,418 Total Injuries 216,210 206,229 204,764 199,994 192,762
Total Straight trucks > 4536 kg 1,972 1,974 2,144 2,333 2,232Casualties Tractor-trailers 1,515 1,633 1,607 1,623 1,523
Heavy vehicle occupant total* 3,487 3,607 3,751 3,956 3,755
Occupants of other vehicles involved with heavy trucks 8,555 8,899 9,044 8,699 8,559
Cyclists 106 141 158 137 178 Pedestrians 333 337 356 326 380
Total victims of collisions involving heavy trucks 12,481 12,984 13,309 13,118 12,872
Victims of all other collisions 206,508 195,976 194,353 189,760 182,651 Total Casualties 218,989 208,960 207,662 202,878 195,523

Human Factors in the Motor Carrier Industry in Canada 28
1.3.1 Driver condition in the NCDB database 2003-2007 Looking at all fatal crashes involving a commercial vehicle (including single and multiple vehicle crashes), the data from table 9 indicate that CMV driver’s condition was qualified as impaired (other than normal) in 6% of crashes (118 out of 1933). In terms of what type of impairment was identified, the data indicate the following:
• Alcohol and/or drugs were identified as factors for 53 drivers (2.7%); • Fatigue and falling asleep was identified for 29 drivers (1.5%); • Sudden illness, lost consciousness was identified in 7 cases (.4%); • Inexperience was labeled in this category; it was identified for 4 drivers (.2%); • Note that inattention was not identified as a condition, but rather as a form of
action. However, as emphasized in the current review, inattention relates mainly to fatigue and distraction, which are rather understood as conditions than actions. Nevertheless, as will be seem in the action category, in multiple-vehicle fatal crashes involving at least one heavy vehicle, inattention was identified in 3.7% of the cases for CMV drivers and in 7.2% of the cases for the LDV drivers involved. It is the stronger single contributor for CMV drivers when both conditions and actions are considered.
Table 9: Driver conditions in all CMV fatal crashes, 2003-2007
Severity Driver Condition 2003 2004 2005 2006 2007
Fatal Apparently normal 363 351 335 377 389 Under the influence of alcohol 7 7 9 7 13 Under the influence of drugs 3 5 1 0 1 Fatigued, fell asleep 8 9 4 4 4 Sudden illness, lost consciousness 1 1 1 3 1 Inexperience 2 1 0 1 0 Other driver condition 1 5 3 8 8 Total 385 379 353 400 416
Personal Apparently normal 6,461 6,541 6,805 6,716 6,683Injury Under the influence of alcohol 86 77 94 86 94 Under the influence of drugs 5 10 5 8 8
Fatigued, fell asleep 97 99 111 115 108 Sudden illness, lost consciousness 19 22 20 23 16 Inexperience 46 31 30 30 15 Other driver condition 17 103 121 137 158 Total 6,731 6,883 7,186 7,115 7,082 The data from tables 10 and 11 show that when only multiple-vehicle fatal crashes involving at least one heavy vehicle are considered (without single vehicle CMV fatal crashes), CMV driver’s condition was labeled as “other than normal” in 3% of the cases compared to 16.3% for LDV drivers (see also figure 1). This indicates that impairment is therefore far more prevalent for the LDV drivers than for the CMV drivers involved. Also, note that the difference between 6% of impairment for CMV drivers when all

Human Factors in the Motor Carrier Industry in Canada 29
crashes are considered vs. 3% when multiple-vehicle crashes only are factored-in underlines the prevalence of impairment for CMV drivers in single-vehicle crashes, which is widely based on the contribution of fatigue (1.5% when including single vehicle crashes, vs. .4% when only multiple-vehicle collisions are factored-in). Table 10: Driver condition in multiple-vehicle fatal crashes involving a heavy
vehicle: CMV drivers
2003 2004 2005 2006 2007 Total Alcohol 2 6 3 2 8 21 Drugs 0 2 0 0 0 2 Fatigued 2 2 1 1 1 7 Illness 0 1 0 3 1 5 Inexperience 1 0 0 1 0 2 No Condition 297 297 293 330 333 1550 Other Driver Condition 0 0 2 4 5 11 Total 302 308 299 341 348 1598 Table 11: Driver condition in multiple-vehicle fatal crashes involving a heavy
vehicle: LDV drivers
2003 2004 2005 2006 2007 Total Alcohol 28 28 29 23 26 134 Drugs 9 7 5 0 7 28 Fatigued 7 10 6 8 6 37 Illness 2 2 4 3 1 12 Inexperience 0 3 2 4 1 10 No Condition 274 247 232 286 285 1324 Other Driver Condition 6 4 10 6 11 37 Total 326 301 288 330 337 1582
Condition "other than normal" for CMV and
LV drivers involved in fatal CMV crashes
2003-2007
0%
20%
40%
60%
80%
100%
CMV LV
Other than normal
Normal
Figure 1: Driver condition in multiple-vehicle fatal crashes involving at least one heavy vehicle.
Human Factors in the Motor Carrier Industry in Canada 30
1.3.2 Driver action in the NCDB database 2003-2007 Looking at all fatal crashes involving a commercial vehicle (including single and multiple vehicle crashes), the data from table 12 indicate that CMV driver’s action was qualified as improper (other than driving properly) in 26% of cases (507 out of 1933). In terms of what type of improper action was identified, the data indicates the following:
• Disobey traffic signal is identified for 46 cases (2.4%); • Fail to yield is identified in 38 cases (2%); • Improper passing is identified 40 cases (2%); • Inattention is identified in 89 cases (4.6%); • Lost control is identified in 31 cases (1,6); • Driving too close is identified in 18 cases (1%); • Driving too fast for conditions is identified in 85 cases (4,4%); • Driving on the wrong side of the road is identified in 27 cases (1.4%); • Other driver action is identified in 127 cases (6.6%).
Table 12: Driver action in all CMV fatal crashes, 2003-2007
Severity Driver Action 2003 2004 2005 2006 2007 Fatal No apparent improper action 296 267 267 300 294
Disobeyed traffic control 6 5 13 9 13 Failed to yield 7 4 6 8 13 Improper passing 3 8 8 7 14 Inattention 19 22 18 15 15 Lost control 7 9 2 5 8 Reversed unsafely 2 0 0 0 2 Followed too closely 1 3 4 5 5 Drove too fast 16 27 10 13 19 Wrong direction 0 1 0 0 1 Wrong side of road 2 10 3 7 5 Other driver action 26 23 22 31 27 Total 385 379 353 400 416
Personal No apparent improper action 3,763 3,904 4,088 4,073 4,084 Injury Disobeyed traffic control 168 153 180 176 171
Failed to yield 265 231 234 209 217 Improper passing 378 351 436 398 390 Inattention 600 635 713 747 724 Lost control 157 164 156 130 146 Reversed unsafely 35 33 27 30 48 Followed too closely 542 531 466 505 495 Drove too fast 377 346 330 325 350 Wrong direction 2 3 2 2 3 Wrong side of road 29 38 39 38 34 Other driver action 415 494 515 482 420 Total 6,731 6,883 7,186 7,115 7,082
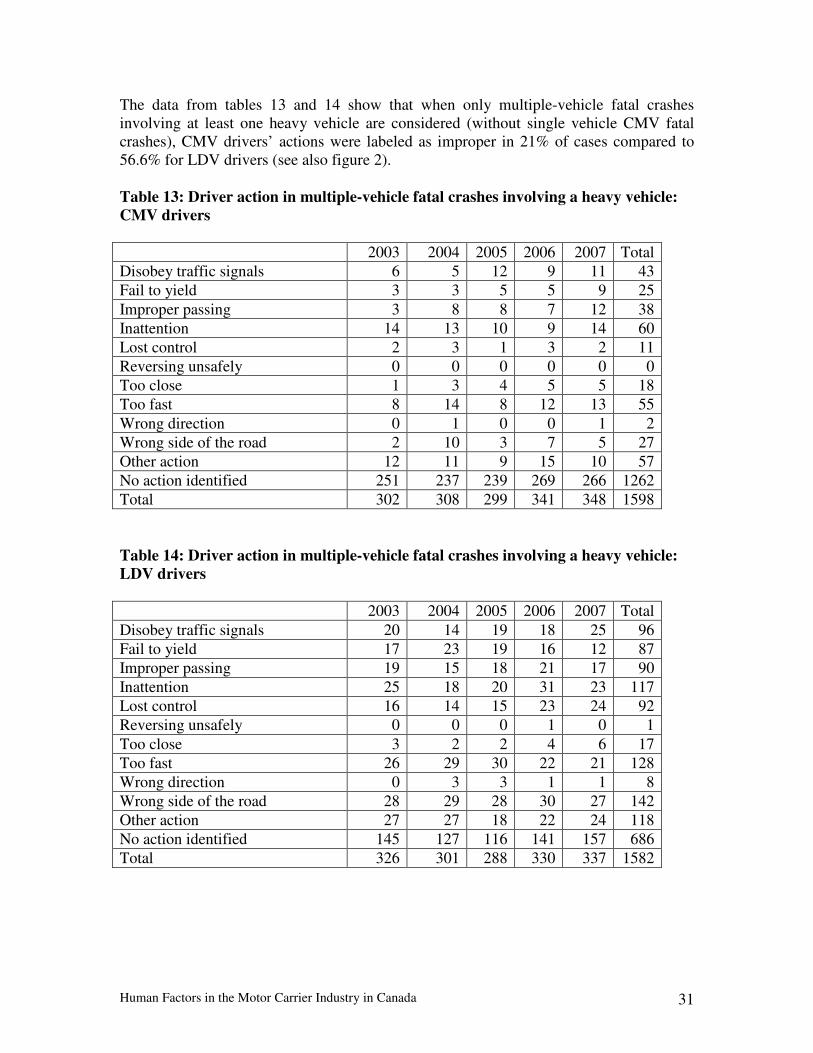
Human Factors in the Motor Carrier Industry in Canada 31
The data from tables 13 and 14 show that when only multiple-vehicle fatal crashes involving at least one heavy vehicle are considered (without single vehicle CMV fatal crashes), CMV drivers’ actions were labeled as improper in 21% of cases compared to 56.6% for LDV drivers (see also figure 2). Table 13: Driver action in multiple-vehicle fatal crashes involving a heavy vehicle:
CMV drivers
2003 2004 2005 2006 2007 Total Disobey traffic signals 6 5 12 9 11 43 Fail to yield 3 3 5 5 9 25 Improper passing 3 8 8 7 12 38 Inattention 14 13 10 9 14 60 Lost control 2 3 1 3 2 11 Reversing unsafely 0 0 0 0 0 0 Too close 1 3 4 5 5 18 Too fast 8 14 8 12 13 55 Wrong direction 0 1 0 0 1 2 Wrong side of the road 2 10 3 7 5 27 Other action 12 11 9 15 10 57 No action identified 251 237 239 269 266 1262 Total 302 308 299 341 348 1598 Table 14: Driver action in multiple-vehicle fatal crashes involving a heavy vehicle:
LDV drivers 2003 2004 2005 2006 2007 Total Disobey traffic signals 20 14 19 18 25 96 Fail to yield 17 23 19 16 12 87 Improper passing 19 15 18 21 17 90 Inattention 25 18 20 31 23 117 Lost control 16 14 15 23 24 92 Reversing unsafely 0 0 0 1 0 1 Too close 3 2 2 4 6 17 Too fast 26 29 30 22 21 128 Wrong direction 0 3 3 1 1 8 Wrong side of the road 28 29 28 30 27 142 Other action 27 27 18 22 24 118 No action identified 145 127 116 141 157 686 Total 326 301 288 330 337 1582
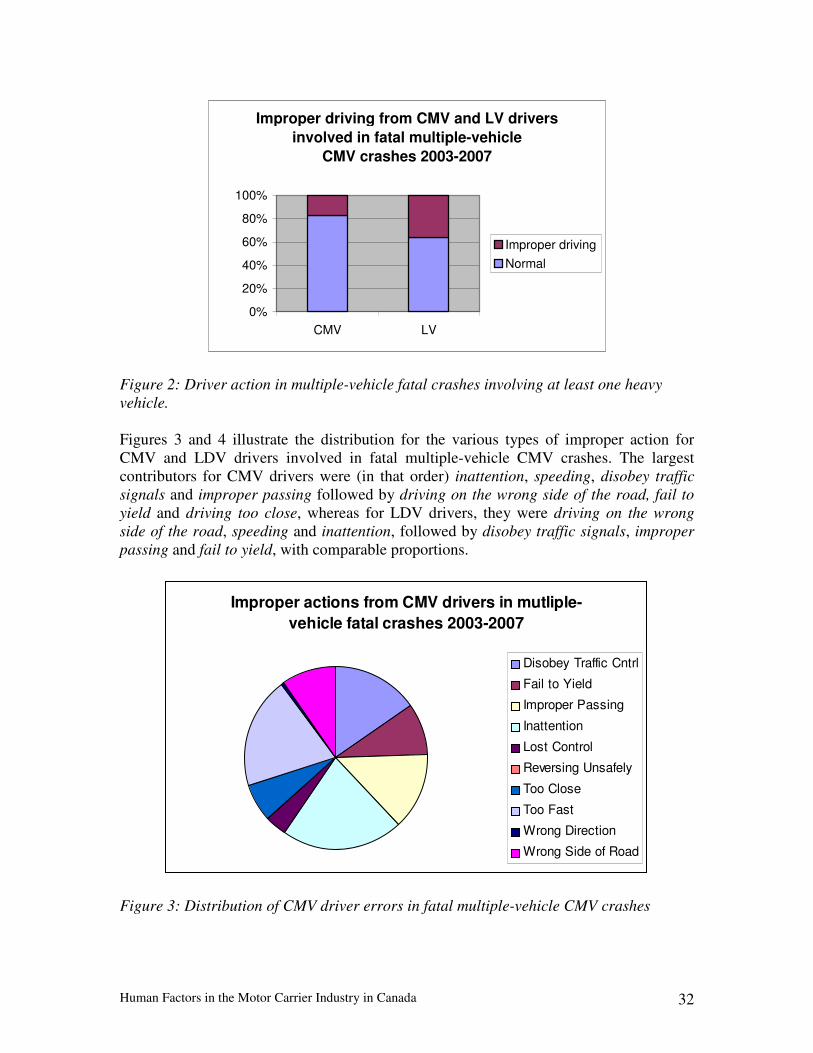
Human Factors in the Motor Carrier Industry in Canada 32
Improper driving from CMV and LV drivers
involved in fatal multiple-vehicle
CMV crashes 2003-2007
0%
20%
40%
60%
80%
100%
CMV LV
Improper driving
Normal
Figure 2: Driver action in multiple-vehicle fatal crashes involving at least one heavy vehicle. Figures 3 and 4 illustrate the distribution for the various types of improper action for CMV and LDV drivers involved in fatal multiple-vehicle CMV crashes. The largest contributors for CMV drivers were (in that order) inattention, speeding, disobey traffic signals and improper passing followed by driving on the wrong side of the road, fail to yield and driving too close, whereas for LDV drivers, they were driving on the wrong side of the road, speeding and inattention, followed by disobey traffic signals, improper passing and fail to yield, with comparable proportions.
Improper actions from CMV drivers in mutliple-
vehicle fatal crashes 2003-2007
Disobey Traffic Cntrl
Fail to Yield
Improper Passing
Inattention
Lost Control
Reversing Unsafely
Too Close
Too Fast
Wrong Direction
Wrong Side of Road
Figure 3: Distribution of CMV driver errors in fatal multiple-vehicle CMV crashes

Human Factors in the Motor Carrier Industry in Canada 33
Improper actions from LV drivers involved in fatal
crashes with a heavy vehicle
2003-2007
Disobey Traffic Cntrl
Fail to Yield
Improper Passing
Inattention
Lost Control
Reversing Unsafely
Too Close
Too Fast
Wrong Direction
Wrong Side of Road
Figure 4: Distribution of LDV driver errors in fatal multiple-vehicle CMV crashes The key elements that can be deducted from the NCDB database with regards to crash contributors for CMV fatal crashes are the following:
• In all crashes, driver’s condition is cited less often (118) than driver actions (507). This implies that from a risk-based perspective impairment is an important contributor, but improper driving actions are even more significant, and should be prioritized.
• It is however important to underline the significant contribution of inattention,
which conceptually should be related to driver’s conditions - under fatigue and distraction - rather driver’s actions. Note that in the CCMTA framework, fatigue and distraction are processed under the wide umbrella of driving while impaired, which represent conditions, not actions. Inattention is in fact the stronger single crash contributor identified in these datasets for CMV drivers when all improper actions and all forms of impairment are considered individually. If we make the exercise of adding the inattention cases to driver impairment, where we believe it belongs, the count for driver impairment increases to 207 cases and the count for improper driving actions would be reduced to 418, which nevertheless remains more than 50% superior in terms of crash contribution.
• It is also important to emphasize that police report have serious limitations to
address fatigue and distraction and that they tend to severely underreport these issues. For example, while NCDB data imply that fatigue is involved in only 1.5% of fatal CMV crashes, estimates derived from the operational definition of fatigue created by CCMTA’s Fatigue Expert Group estimates that overall fatigue is responsible for 21% to 23% of road fatalities in the country. Therefore, note that it is important to use caution when referring to NCDB data to assess the contribution of various forms of impairment.
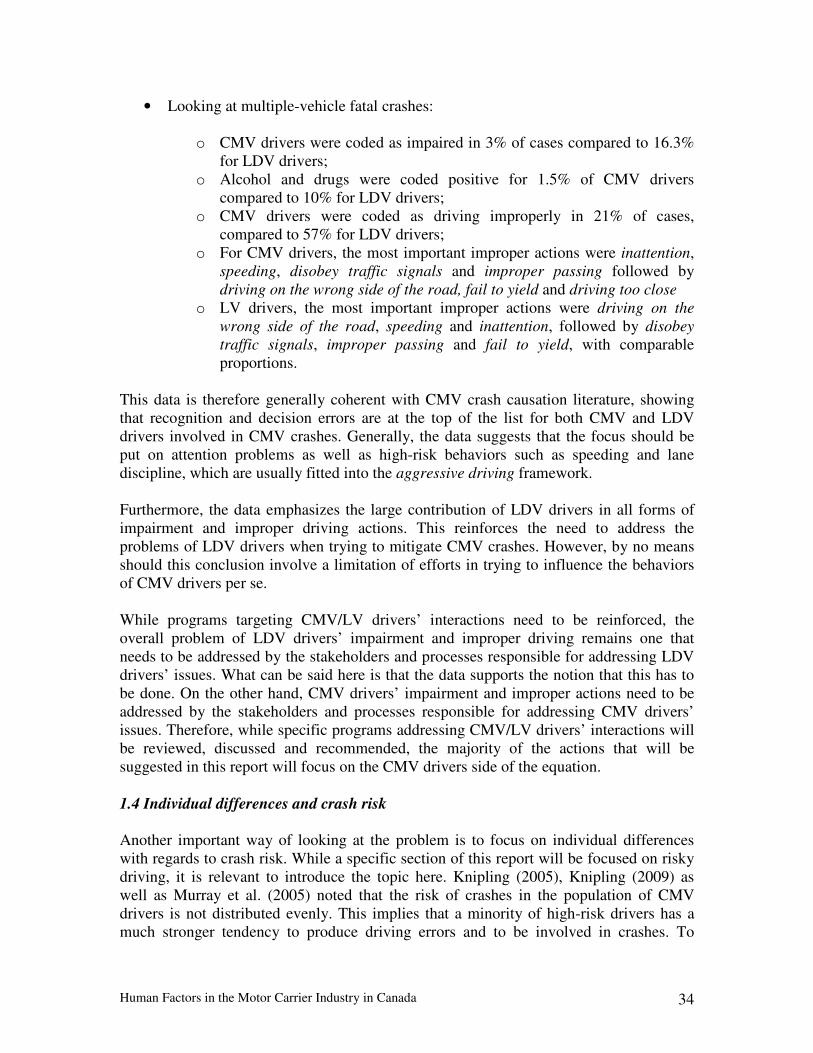
Human Factors in the Motor Carrier Industry in Canada 34
• Looking at multiple-vehicle fatal crashes:
o CMV drivers were coded as impaired in 3% of cases compared to 16.3% for LDV drivers;
o Alcohol and drugs were coded positive for 1.5% of CMV drivers compared to 10% for LDV drivers;
o CMV drivers were coded as driving improperly in 21% of cases, compared to 57% for LDV drivers;
o For CMV drivers, the most important improper actions were inattention, speeding, disobey traffic signals and improper passing followed by driving on the wrong side of the road, fail to yield and driving too close
o LV drivers, the most important improper actions were driving on the wrong side of the road, speeding and inattention, followed by disobey traffic signals, improper passing and fail to yield, with comparable proportions.
This data is therefore generally coherent with CMV crash causation literature, showing that recognition and decision errors are at the top of the list for both CMV and LDV drivers involved in CMV crashes. Generally, the data suggests that the focus should be put on attention problems as well as high-risk behaviors such as speeding and lane discipline, which are usually fitted into the aggressive driving framework. Furthermore, the data emphasizes the large contribution of LDV drivers in all forms of impairment and improper driving actions. This reinforces the need to address the problems of LDV drivers when trying to mitigate CMV crashes. However, by no means should this conclusion involve a limitation of efforts in trying to influence the behaviors of CMV drivers per se. While programs targeting CMV/LV drivers’ interactions need to be reinforced, the overall problem of LDV drivers’ impairment and improper driving remains one that needs to be addressed by the stakeholders and processes responsible for addressing LDV drivers’ issues. What can be said here is that the data supports the notion that this has to be done. On the other hand, CMV drivers’ impairment and improper actions need to be addressed by the stakeholders and processes responsible for addressing CMV drivers’ issues. Therefore, while specific programs addressing CMV/LV drivers’ interactions will be reviewed, discussed and recommended, the majority of the actions that will be suggested in this report will focus on the CMV drivers side of the equation. 1.4 Individual differences and crash risk
Another important way of looking at the problem is to focus on individual differences with regards to crash risk. While a specific section of this report will be focused on risky driving, it is relevant to introduce the topic here. Knipling (2005), Knipling (2009) as well as Murray et al. (2005) noted that the risk of crashes in the population of CMV drivers is not distributed evenly. This implies that a minority of high-risk drivers has a much stronger tendency to produce driving errors and to be involved in crashes. To
Human Factors in the Motor Carrier Industry in Canada 35
illustrate this notion, Knipling observes that in the Hanowski et al. (2000) study, 6 out of 42 CMV drivers covered 12% of the total driving time but were responsible for 38% of truck-initiated critical incidents. In contrast, the 25 best drivers out of 42 covered 63% of the mileage but were only responsible for 16% of critical incidents. In the Murray et al. (2005) study, a minority of drivers (10-15%) was responsible for a disproportionate percentage of total fleet crash risk (30-50%). It is therefore not only important to identify the processes at the root of driving errors and the factors that influence them, but also which of these factors or processes are likely to fluctuate in the population and modulate crash risk. Note that in their 2004 report, Knipling et al. identified age, gender, medical condition, health, substance use, fatigue and personality as relevant factors. Individual differences in fatigue susceptibility is also seen as an important attribute to investigate, since the confirmation of such a personal trait could have implications in terms of regulations. It is suggested that if individuals differ in fatigue susceptibility (which is a constant result in fatigue and vigilance research), and if knowledge and technology enabled it, fatigue regulations could be performance-based. However, this issue is in need for some heavy fundamental R&D. Rogers and Knipling (2007) mentioned that apart from driver fatigue and driver interaction with intelligent transportation systems, most studies on human factors in road safety in the past two decades focused on LDV drivers in the general population. There is therefore a lot of research and development needed, and much is underway, to better understand CMV driver errors and how they should be addressed. The authors identify driver training as one of the most promising interventions under investigation. Rogers and Knipling (2007) also describe the macroergonomic aspect of the motor carrier industry and how the general context of operations can influence safety motivations. According to them, management strategies such as Behavior-Based Safety (BBS) and self-management represent promising strategies to actively engage drivers into safety-oriented behaviors and attitudes. These issues will be addressed further later in the report.
1.5 CMV crash causation studies: general discussion
Table 15 regroups a simple listing of different driver errors and processes cited in the crash causation literature as well as in the Canadian NCDB dataset. It shows that CMV driver errors evolve around a limited, redundant, set of factors. Overall, inattention, lane discipline and reckless, aggressive or simply risky driving come out as the most important broad categories of factors to consider for interventions. Looking at this list, one however realizes that there are multiple levels of analyses, that there is confusion in taxonomies and that it is not always simple to classify errors within discrete categories. This difficulty mainly rests upon the complexity of the driving task and the systemic nature of human information processing. Error taxonomies certainly have limitations that need to be acknowledged when processing the results of crash
Human Factors in the Motor Carrier Industry in Canada 36
causation studies. These limitations are even augmented by the diversity of taxonomies used in different studies, making it hazardous to draw general conclusions from this body of research. It is with this in mind that the researchers behind the LTCCS, the UDA study and the heavy-vehicles naturalistic studies opted to use the taxonomy of the milestone Tri-level Indiana project, which includes recognition, decision, performance and non-performance errors. Note that this taxonomy will also be used in this report. If one’s objective is to use crash causation data to orient the development of strategies for intervention, there is however a need to go further than simply classify driver errors. The real questions that should be asked are the following: Why do drivers commit these errors? Why do they fail to perceive, recognize and understand driving situation? Why do they deliberately deviate from safe driving practices and adopt risky behaviors? Why do they fail to perform the driving manoeuvre that they intended to do? Why do they operate their vehicle under the influence of fatigue or psychoactive substances? To answer these questions, one needs to go beyond error classification. The key is to identify the processes at the root of recognition, decision, performance and non-performance errors, as well as the mediating factors that impact on these processes. Once this is done, it becomes possible to identify the best interventions to counteract the effects of these factors. Most of this knowledge is available in general human factors and road safety science and will be addressed later in this report. Table 15: Types of driver errors in crash causation literature
� Improper lookout � Driving too fast for conditions � Inattention � Improper evasive action � Internal distraction � Impairment due to psychoactive substances � Driver’s inexperience � Fatigue � Violations (deliberate deviations from safe
driving) � Dangerous errors (serious mistakes or
judgment errors) � Harmless lapses (inattention) � Over the lane or off the road � Loss of control - traveling too fast for
condition/other � Other vehicle in travel lane � Turning, crossing and intersection � Prescription drugs � Over-the-counter drugs � Erratic/improper lane changes � Following too closely � Improper passing
� Lanes changes without sufficient gap
� Roadway entrances without clearance
� Late braking for stopped or stopping traffic
� Lateral deviation through vehicle � Left-turn without clearance � Failing to keep in lane � Failing to yield right of way � Disobeying traffic control and laws � Reckless driving � Improper turn � Improper or erratic lane change � Failure to yield the right of way � Failure to keep in proper lane
conviction � Log book falsification � Hours of service violation
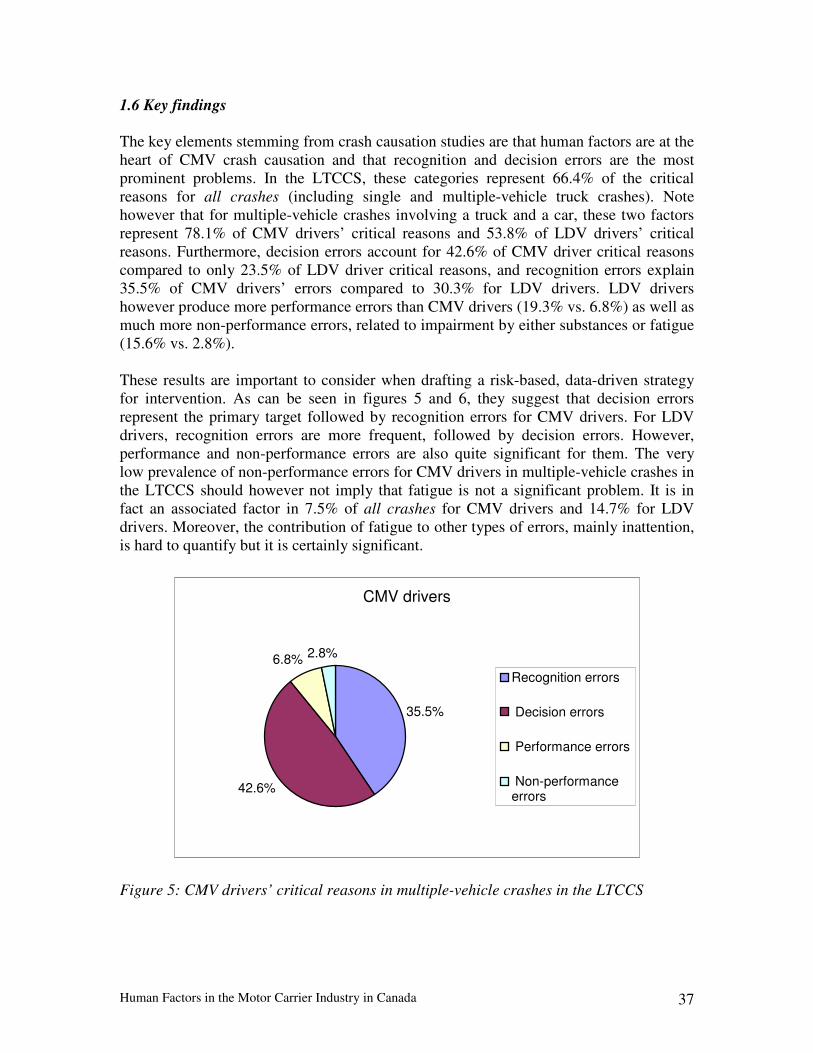
Human Factors in the Motor Carrier Industry in Canada 37
1.6 Key findings
The key elements stemming from crash causation studies are that human factors are at the heart of CMV crash causation and that recognition and decision errors are the most prominent problems. In the LTCCS, these categories represent 66.4% of the critical reasons for all crashes (including single and multiple-vehicle truck crashes). Note however that for multiple-vehicle crashes involving a truck and a car, these two factors represent 78.1% of CMV drivers’ critical reasons and 53.8% of LDV drivers’ critical reasons. Furthermore, decision errors account for 42.6% of CMV driver critical reasons compared to only 23.5% of LDV driver critical reasons, and recognition errors explain 35.5% of CMV drivers’ errors compared to 30.3% for LDV drivers. LDV drivers however produce more performance errors than CMV drivers (19.3% vs. 6.8%) as well as much more non-performance errors, related to impairment by either substances or fatigue (15.6% vs. 2.8%). These results are important to consider when drafting a risk-based, data-driven strategy for intervention. As can be seen in figures 5 and 6, they suggest that decision errors represent the primary target followed by recognition errors for CMV drivers. For LDV drivers, recognition errors are more frequent, followed by decision errors. However, performance and non-performance errors are also quite significant for them. The very low prevalence of non-performance errors for CMV drivers in multiple-vehicle crashes in the LTCCS should however not imply that fatigue is not a significant problem. It is in fact an associated factor in 7.5% of all crashes for CMV drivers and 14.7% for LDV drivers. Moreover, the contribution of fatigue to other types of errors, mainly inattention, is hard to quantify but it is certainly significant.
CMV drivers
35.5%
42.6%
6.8%2.8%
Recognition errors
Decision errors
Performance errors
Non-performanceerrors
Figure 5: CMV drivers’ critical reasons in multiple-vehicle crashes in the LTCCS
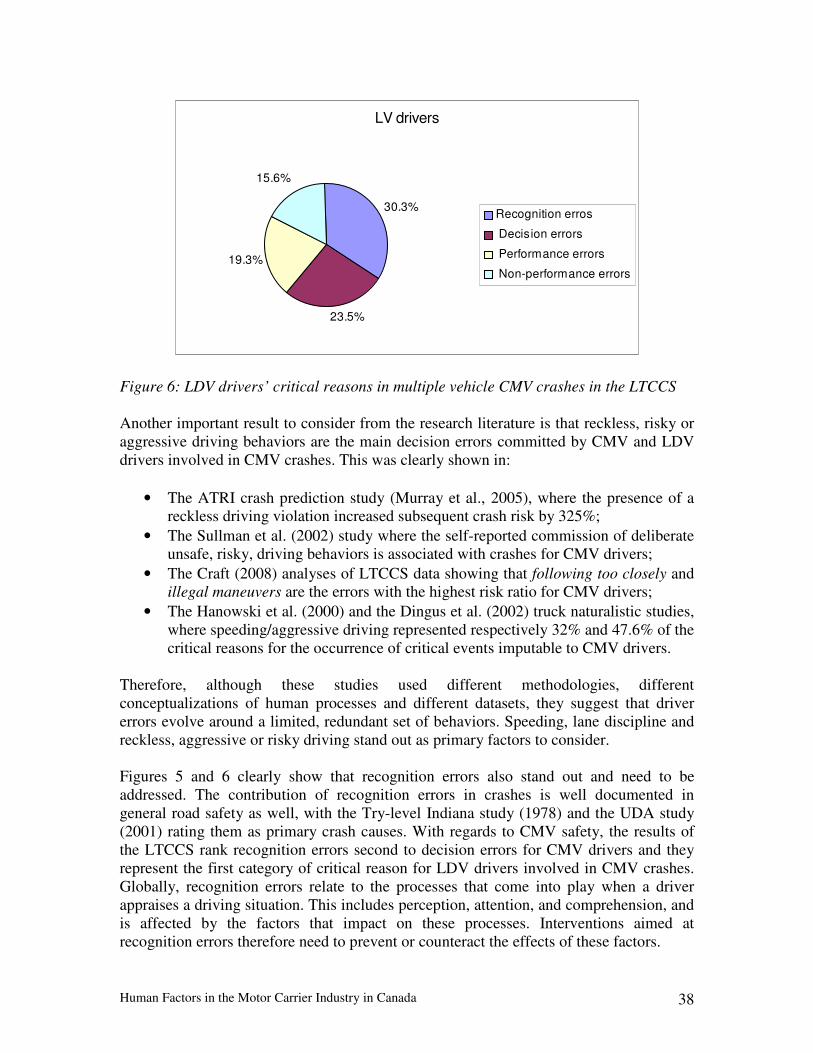
Human Factors in the Motor Carrier Industry in Canada 38
LV drivers
30.3%
23.5%
19.3%
15.6%
Recognition erros
Decision errors
Performance errors
Non-performance errors
Figure 6: LDV drivers’ critical reasons in multiple vehicle CMV crashes in the LTCCS Another important result to consider from the research literature is that reckless, risky or aggressive driving behaviors are the main decision errors committed by CMV and LDV drivers involved in CMV crashes. This was clearly shown in:
• The ATRI crash prediction study (Murray et al., 2005), where the presence of a reckless driving violation increased subsequent crash risk by 325%;
• The Sullman et al. (2002) study where the self-reported commission of deliberate unsafe, risky, driving behaviors is associated with crashes for CMV drivers;
• The Craft (2008) analyses of LTCCS data showing that following too closely and illegal maneuvers are the errors with the highest risk ratio for CMV drivers;
• The Hanowski et al. (2000) and the Dingus et al. (2002) truck naturalistic studies, where speeding/aggressive driving represented respectively 32% and 47.6% of the critical reasons for the occurrence of critical events imputable to CMV drivers.
Therefore, although these studies used different methodologies, different conceptualizations of human processes and different datasets, they suggest that driver errors evolve around a limited, redundant set of behaviors. Speeding, lane discipline and reckless, aggressive or risky driving stand out as primary factors to consider. Figures 5 and 6 clearly show that recognition errors also stand out and need to be addressed. The contribution of recognition errors in crashes is well documented in general road safety as well, with the Try-level Indiana study (1978) and the UDA study (2001) rating them as primary crash causes. With regards to CMV safety, the results of the LTCCS rank recognition errors second to decision errors for CMV drivers and they represent the first category of critical reason for LDV drivers involved in CMV crashes. Globally, recognition errors relate to the processes that come into play when a driver appraises a driving situation. This includes perception, attention, and comprehension, and is affected by the factors that impact on these processes. Interventions aimed at recognition errors therefore need to prevent or counteract the effects of these factors.

Human Factors in the Motor Carrier Industry in Canada 39
2. Phase I: Intervention leads
The first section of this report reviewed the scientific literature about crash causation for both general road safety and CMV safety. The objective was to gather the empirical evidence that would lay the basis for a risk-based data-driven strategy for interventions. The analyses clearly indicate that recognition and decision errors – from both CMV and LDV drivers involved in CMV crashes - are the main causes for truck crashes, and that this is where interventions are likely to generate the strongest safety gains. In the next sections, countermeasures aimed at these categories of errors will be addressed. Given the actual state of scientific knowledge, the scope of this project and its 36 months timeframe, it will not be possible to articulate specific, ready-to-use, scientifically proven recommendations for every problem identified in the first section. Rather, specific interventions can be recommended in cases where the science is more evolved, and a course of action - most likely involving research and development – will be suggested in other areas that are less advanced in terms of fundamental and applied science. It is also important to note that CMV driver issues are currently the scope of significant research in the U.S. As described in the interim report of this task force, the FMCSA embarked in an intensive problem assessment research program more than a decade ago, which led to the realization of the LTCCS and naturalistic studies amongst other things. The results of theses studies, confirming the primary role of human factors in crashes, had a significant impact on the orientations of ongoing and future research in the agency. Most of these new studies are however still ongoing and results will progressively be released in the coming years. Since it is very relevant that our reflection in Canada benefits from the results of these studies, our review process needs to be seen as an ongoing effort rather than a close-ended, isolated task. The current 36 months project in fact represents a basic initial step in the development and application of human factors interventions for motor carrier safety in this country.
2.1 Recognition errors As mentioned in the previous section, recognition errors relate to processes that come into play when a driver appraises, or recognizes, a driving situation. This mainly includes perception and attention. Interventions aimed at recognition errors therefore need to try to prevent or counteract the effects of factors that would negatively influence these processes. The first step when addressing this problem is therefore to identify these factors and to try to understand how they impact on perception and attention. The most basic process at the core of recognition errors is attention. Before an individual even perceives and processes sensory information, he/she needs to be either receptive to, or actively seeking it. Attention processes are therefore responsible for the selection and detection of information that is relevant for driving. A problem at this level would generate an overall dysfunction of the information processing system.
Human Factors in the Motor Carrier Industry in Canada 40
Generally speaking, attention problems are labeled under the inattention concept. It is understood in the field that inattention problems are mainly related to fatigue (hypovigilance and drowsiness) or distraction (Desai and Haque, 2006; Gander et al. 2006; Bunn et al., 2005; Stutts et al, 2005). Overall, including the problems caused by both fatigue and distraction, inattention is a critical road safety issue. In their recent naturalistic study, Klauer et al, (2006) observed that inattention was included as a contributing cause in 80% of crashes and 65% of near misses. Countermeasures for both fatigue and distraction therefore need to be addressed systematically when looking for means to prevent recognition errors. 2.1.1 Driver fatigue
Driver fatigue has received considerable attention from road safety practitioners throughout the world. Although estimates of its contribution to road crashes vary from one study to another, it is understood that the problem of fatigue is very significant and tends to be under-reported in most crash databases. In 1995, the National Transportation Safety Board estimated that fatigue was related to 31% of fatal truck crashes (NTSB, 1995). Issues like the causes of fatigue, its prevalence as well as safety interventions are still being heavily studied, both in general road safety and CMV safety (Adams-Guppy & Guppy, 2003; Balkin et al., 2011; De Croon, Sluiter, Blonk et al., 2004; Dawson et al., 2011; Di Milia et al., 2011; Gander, Marshall, Bolger et al., 2005; Gander et al., 2011; Horrey et al., 2011; Huang, Roetting, McDevitt et al, 2005; Morrow,& Crum, 2004; Smolensky et al., 2011; Thiffault & Bergeron, 2003a; Williamson et al., 2011, etc.). The objective here is not to generate a comprehensive assessment of the multiple angles of the driver fatigue literature, but rather to identify a set of countermeasures for the motor carrier industry. The approach will therefore be to cover the essentials concerning the causes of fatigue, with a special focus on the motor carrier industry, and to formulate up-to-date recommendations with regards to interventions. Again, given the mandate of this task force and its timeframe, the challenge is to simplify and focus rather than expand and discuss. General background information nevertheless needs to be introduced first to generate a relevant description of the problem. Fatigue and distraction are troublesome concepts in road safety. While it is conceptually and scientifically easy to justify generating research and interventions into these areas, there are inherent difficulties in assessing their true prevalence and in profiling them accurately. These difficulties mainly lie in the fact that fatigue and distraction are very difficult to measure, both through self-reports and safety data, including crash reports and even in-depth crash causation investigations. Conceptual problems in understanding and defining fatigue have also plagued the field and are certainly responsible for some of the difficulties in addressing the issue. The phenomenon is complex, multifaceted and subtle. For instance, there are different types of fatigue - or different reasons why operators experience fatigue - and it is very difficult to empirically demonstrate which factors are involved for a specific driver at a given
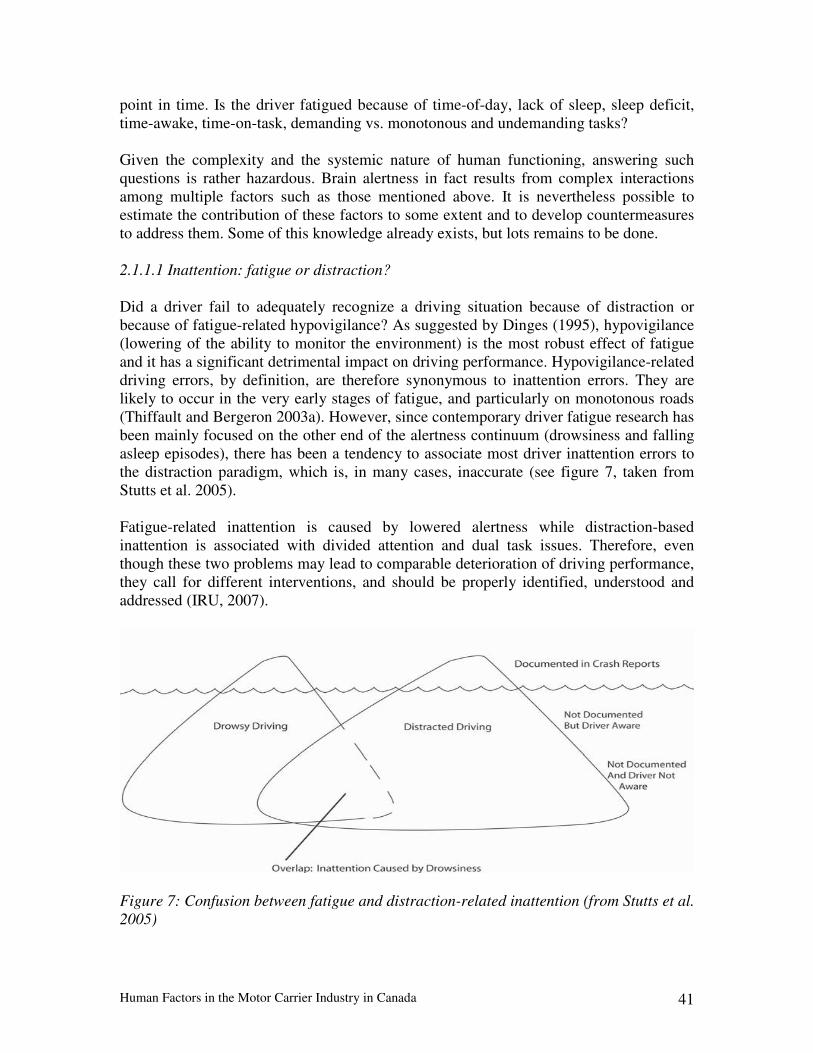
Human Factors in the Motor Carrier Industry in Canada 41
point in time. Is the driver fatigued because of time-of-day, lack of sleep, sleep deficit, time-awake, time-on-task, demanding vs. monotonous and undemanding tasks? Given the complexity and the systemic nature of human functioning, answering such questions is rather hazardous. Brain alertness in fact results from complex interactions among multiple factors such as those mentioned above. It is nevertheless possible to estimate the contribution of these factors to some extent and to develop countermeasures to address them. Some of this knowledge already exists, but lots remains to be done. 2.1.1.1 Inattention: fatigue or distraction? Did a driver fail to adequately recognize a driving situation because of distraction or because of fatigue-related hypovigilance? As suggested by Dinges (1995), hypovigilance (lowering of the ability to monitor the environment) is the most robust effect of fatigue and it has a significant detrimental impact on driving performance. Hypovigilance-related driving errors, by definition, are therefore synonymous to inattention errors. They are likely to occur in the very early stages of fatigue, and particularly on monotonous roads (Thiffault and Bergeron 2003a). However, since contemporary driver fatigue research has been mainly focused on the other end of the alertness continuum (drowsiness and falling asleep episodes), there has been a tendency to associate most driver inattention errors to the distraction paradigm, which is, in many cases, inaccurate (see figure 7, taken from Stutts et al. 2005). Fatigue-related inattention is caused by lowered alertness while distraction-based inattention is associated with divided attention and dual task issues. Therefore, even though these two problems may lead to comparable deterioration of driving performance, they call for different interventions, and should be properly identified, understood and addressed (IRU, 2007).
Figure 7: Confusion between fatigue and distraction-related inattention (from Stutts et al. 2005)
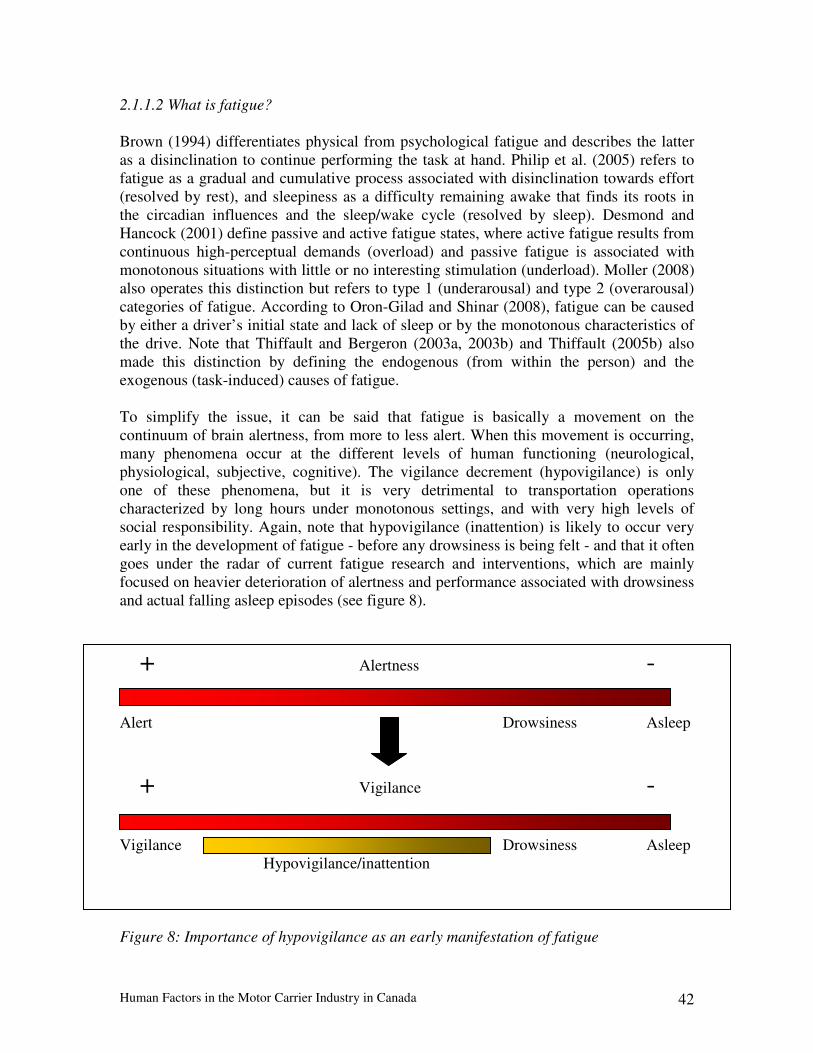
Human Factors in the Motor Carrier Industry in Canada 42
2.1.1.2 What is fatigue? Brown (1994) differentiates physical from psychological fatigue and describes the latter as a disinclination to continue performing the task at hand. Philip et al. (2005) refers to fatigue as a gradual and cumulative process associated with disinclination towards effort (resolved by rest), and sleepiness as a difficulty remaining awake that finds its roots in the circadian influences and the sleep/wake cycle (resolved by sleep). Desmond and Hancock (2001) define passive and active fatigue states, where active fatigue results from continuous high-perceptual demands (overload) and passive fatigue is associated with monotonous situations with little or no interesting stimulation (underload). Moller (2008) also operates this distinction but refers to type 1 (underarousal) and type 2 (overarousal) categories of fatigue. According to Oron-Gilad and Shinar (2008), fatigue can be caused by either a driver’s initial state and lack of sleep or by the monotonous characteristics of the drive. Note that Thiffault and Bergeron (2003a, 2003b) and Thiffault (2005b) also made this distinction by defining the endogenous (from within the person) and the exogenous (task-induced) causes of fatigue. To simplify the issue, it can be said that fatigue is basically a movement on the continuum of brain alertness, from more to less alert. When this movement is occurring, many phenomena occur at the different levels of human functioning (neurological, physiological, subjective, cognitive). The vigilance decrement (hypovigilance) is only one of these phenomena, but it is very detrimental to transportation operations characterized by long hours under monotonous settings, and with very high levels of social responsibility. Again, note that hypovigilance (inattention) is likely to occur very early in the development of fatigue - before any drowsiness is being felt - and that it often goes under the radar of current fatigue research and interventions, which are mainly focused on heavier deterioration of alertness and performance associated with drowsiness and actual falling asleep episodes (see figure 8).
+ Alertness - Alert Drowsiness Asleep
+ Vigilance - Vigilance Drowsiness Asleep Hypovigilance/inattention Figure 8: Importance of hypovigilance as an early manifestation of fatigue
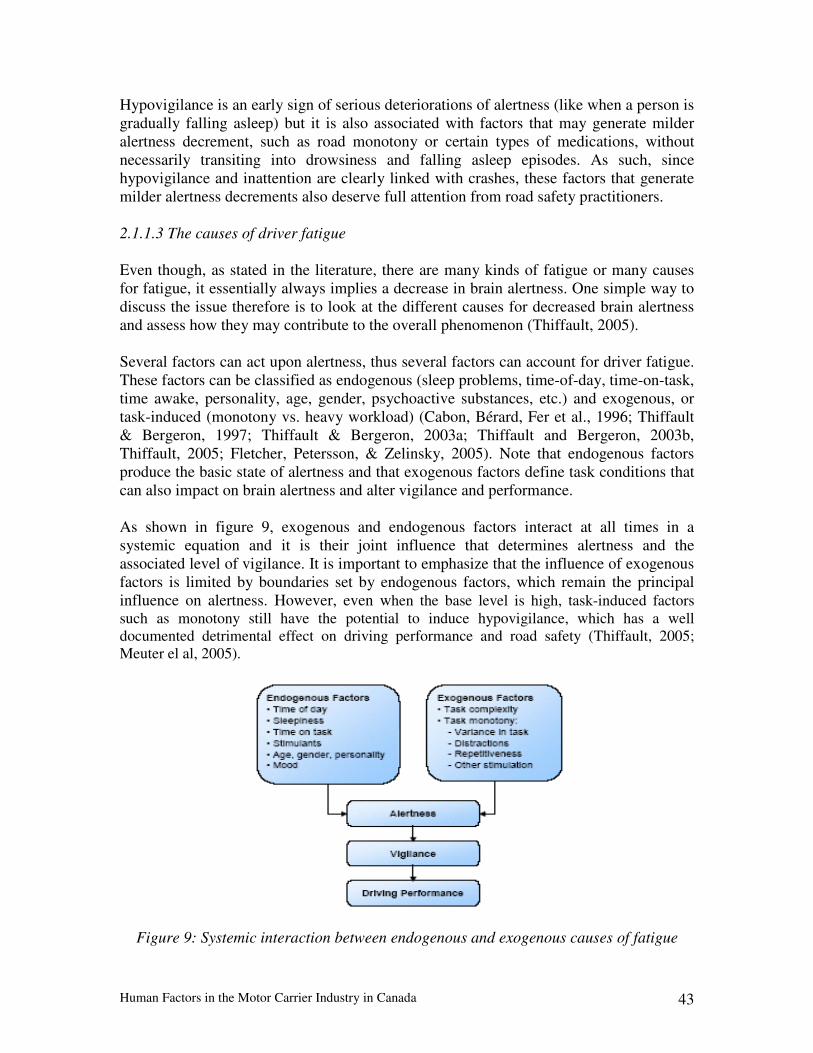
Human Factors in the Motor Carrier Industry in Canada 43
Hypovigilance is an early sign of serious deteriorations of alertness (like when a person is gradually falling asleep) but it is also associated with factors that may generate milder alertness decrement, such as road monotony or certain types of medications, without necessarily transiting into drowsiness and falling asleep episodes. As such, since hypovigilance and inattention are clearly linked with crashes, these factors that generate milder alertness decrements also deserve full attention from road safety practitioners. 2.1.1.3 The causes of driver fatigue Even though, as stated in the literature, there are many kinds of fatigue or many causes for fatigue, it essentially always implies a decrease in brain alertness. One simple way to discuss the issue therefore is to look at the different causes for decreased brain alertness and assess how they may contribute to the overall phenomenon (Thiffault, 2005). Several factors can act upon alertness, thus several factors can account for driver fatigue. These factors can be classified as endogenous (sleep problems, time-of-day, time-on-task, time awake, personality, age, gender, psychoactive substances, etc.) and exogenous, or task-induced (monotony vs. heavy workload) (Cabon, Bérard, Fer et al., 1996; Thiffault & Bergeron, 1997; Thiffault & Bergeron, 2003a; Thiffault and Bergeron, 2003b, Thiffault, 2005; Fletcher, Petersson, & Zelinsky, 2005). Note that endogenous factors produce the basic state of alertness and that exogenous factors define task conditions that can also impact on brain alertness and alter vigilance and performance. As shown in figure 9, exogenous and endogenous factors interact at all times in a systemic equation and it is their joint influence that determines alertness and the associated level of vigilance. It is important to emphasize that the influence of exogenous factors is limited by boundaries set by endogenous factors, which remain the principal influence on alertness. However, even when the base level is high, task-induced factors such as monotony still have the potential to induce hypovigilance, which has a well documented detrimental effect on driving performance and road safety (Thiffault, 2005; Meuter el al, 2005).
Figure 9: Systemic interaction between endogenous and exogenous causes of fatigue
Human Factors in the Motor Carrier Industry in Canada 44
The contemporary approach to the study of fatigue and driving is largely oriented towards sleep research and factors related to endogenous fluctuation of alertness. While it is clear that this approach is fundamental, basic psychophysiological science also indicates that an ergonomic analysis of the driving task, which includes exogenous factors, represents an important complement that needs to be investigated further. Below is some basic factual information on the main causes of driver fatigue. The objective is to convey up-to-date widely accepted rules and knowledge for these fatigue causes rather than conduct extensive reviews of literature on each of them. The specific fatigue risk factors in the motor carrier industry will be then addressed. 2.1.1.3.1 The internal circadian time-of-day effect Biological functions, alertness, performance and mood fluctuate on a 24-hour cycle in relation with internal circadian mechanisms. Human beings are programmed to be more alert during the day than during the night, even though there is a low alertness period in the middle of the afternoon. As a result, it is now well documented that there is a more important proportion of sleep-related crashes during the early morning hours (02:00–06:00) and to a lesser extent during the afternoon period (14:00–16:00) (Caskadon & Roth, 1991; Folkard and Monk, 1979, Mitler et al, 1988; Mitler et al., 1997; Horne & Reiner, 1995; Pack et al., 1995; Sagberg, 1999; Otmani et al., 2005; NCSDR/NHTSA Expert panel on Driver Fatigue, 2000; Knipling, 1998; Boivin, 2000). Smiley (2002) integrated the data of three different studies into a single figure in order to illustrate their accordance with regards to the distribution of risk ratios for crashes over the 24-hour cycle (see figure 10). The figure clearly shows the increased crash risk associated with night driving. In the milestone Fatigue and Alertness Study (Wylie et al., 1996), 82% of drowsy driving episodes occurred between midnight and 07:00. In fact, the data shows that the time-of-day effect was a far more important predictor of fatigue in professional drivers than time-on-task. Consequently, it should be understood that a driver working at night and sleeping during the day does so in contradiction with his natural biological cycle. In this regard, Di Milia (2006) observed that long-haul drivers operating on night shifts have a greater incidence of severe sleepiness. Night driving tends to combine chronic sleep loss and long hours of passive driving in very monotonous and low demanding settings. Driving after a night shift to commute home is also linked with acute sleepiness at the wheel, as observed in this study. Globally, as noted by Rosekind (2005), scheduling practices in the motor carrier industry can disrupt sleep, performance and the circadian clock due to day/night variability, changing start time, non 24-hrs cycles and time zone changes. According to Rosekind (2005), given the extreme complexity of the circadian fluctuations of alertness and the very significant societal need for 24/7 trucking operations, there is virtually no hours of service (HOS) structure in the world that currently account for the risks of night driving. However, having an HOS structure that is based on a 24-hour cycle, as it is the case in Canada, is a positive thing since in theory it should help preventing phase shifting.
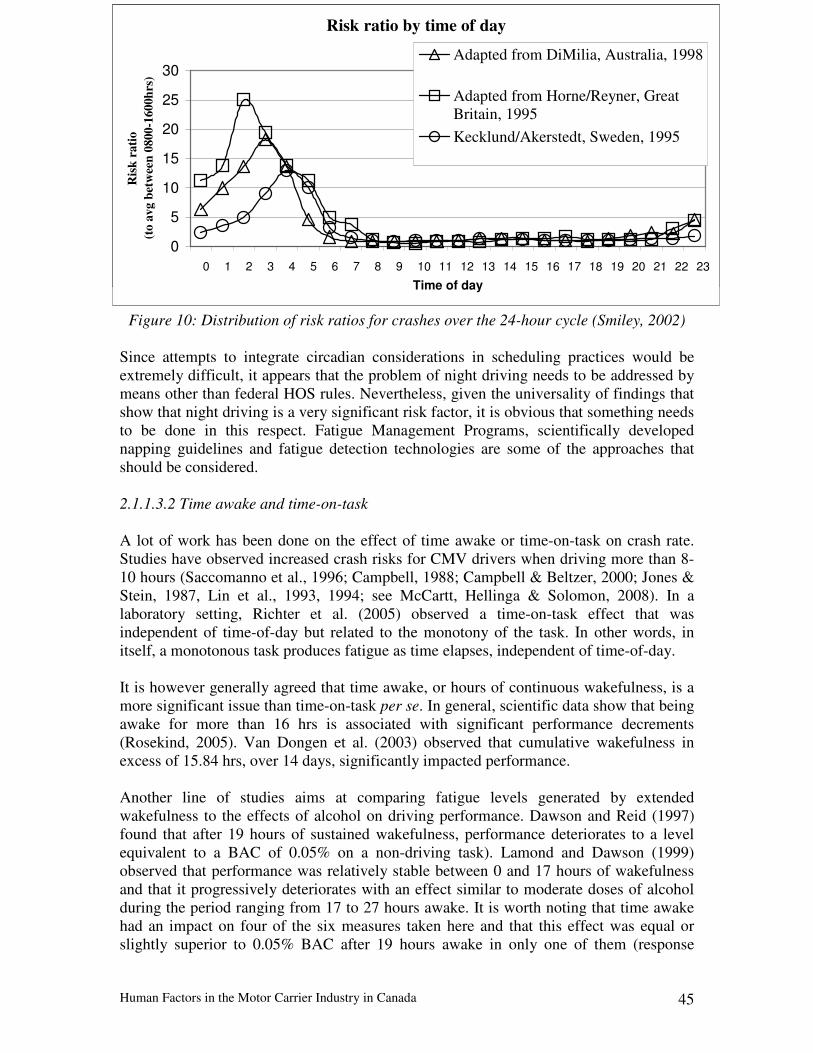
Human Factors in the Motor Carrier Industry in Canada 45
Figure 10: Distribution of risk ratios for crashes over the 24-hour cycle (Smiley, 2002) Since attempts to integrate circadian considerations in scheduling practices would be extremely difficult, it appears that the problem of night driving needs to be addressed by means other than federal HOS rules. Nevertheless, given the universality of findings that show that night driving is a very significant risk factor, it is obvious that something needs to be done in this respect. Fatigue Management Programs, scientifically developed napping guidelines and fatigue detection technologies are some of the approaches that should be considered. 2.1.1.3.2 Time awake and time-on-task A lot of work has been done on the effect of time awake or time-on-task on crash rate. Studies have observed increased crash risks for CMV drivers when driving more than 8-10 hours (Saccomanno et al., 1996; Campbell, 1988; Campbell & Beltzer, 2000; Jones & Stein, 1987, Lin et al., 1993, 1994; see McCartt, Hellinga & Solomon, 2008). In a laboratory setting, Richter et al. (2005) observed a time-on-task effect that was independent of time-of-day but related to the monotony of the task. In other words, in itself, a monotonous task produces fatigue as time elapses, independent of time-of-day. It is however generally agreed that time awake, or hours of continuous wakefulness, is a more significant issue than time-on-task per se. In general, scientific data show that being awake for more than 16 hrs is associated with significant performance decrements (Rosekind, 2005). Van Dongen et al. (2003) observed that cumulative wakefulness in excess of 15.84 hrs, over 14 days, significantly impacted performance. Another line of studies aims at comparing fatigue levels generated by extended wakefulness to the effects of alcohol on driving performance. Dawson and Reid (1997) found that after 19 hours of sustained wakefulness, performance deteriorates to a level equivalent to a BAC of 0.05% on a non-driving task). Lamond and Dawson (1999) observed that performance was relatively stable between 0 and 17 hours of wakefulness and that it progressively deteriorates with an effect similar to moderate doses of alcohol during the period ranging from 17 to 27 hours awake. It is worth noting that time awake had an impact on four of the six measures taken here and that this effect was equal or slightly superior to 0.05% BAC after 19 hours awake in only one of them (response
Risk ratio by time of day
0
5
10
15
20
25
30
0 1 2 3 4 5 6 7 8 9 10 11 12 13 14 15 16 17 18 19 20 21 22 23
Time of day
Ris
k r
ati
o
(to
avg b
etw
een
0800-1
600h
rs)
Adapted from DiMilia, Australia, 1998
Adapted from Horne/Reyner, GreatBritain, 1995
Kecklund/Akerstedt, Sweden, 1995
Risk ratio by time of day
0
5
10
15
20
25
30
0 1 2 3 4 5 6 7 8 9 10 11 12 13 14 15 16 17 18 19 20 21 22 23
Time of day
Ris
k r
ati
o
(to
avg b
etw
een
0800-1
600h
rs)
Adapted from DiMilia, Australia, 1998
Adapted from Horne/Reyner, GreatBritain, 1995
Kecklund/Akerstedt, Sweden, 1995
Human Factors in the Motor Carrier Industry in Canada 46
latency component). Also, in the Arnedt et al. (2001) simulator study, 16-hours awake was equal to 0.0% BAC, whereas it took 18.5 hours to reach a deterioration comparable to that of a 0.05% BAC and 21 hours to reach 0.08%. Overall, these comparisons between fatigue and alcohol levels need to be taken with caution. First, it is arguable that because of their methodological structure, these studies were confounded by the fact that the effects of time-of-day and time-awake were undistinguishable. The stronger effects of time-awake on performance were indeed observed between 02:00 and 06:00, which corresponds to the lower circadian points and the higher proportion of fatigue-related crashes. In this regard, Arnedt et al. (2001) acknowledged that their comparison of the effects of time-awake and alcohol did not take into consideration the effects that circadian rhythms had on performance. Williamson et al. (2001) also pointed out that it was possible that the changes observed in performance in their study may have been entirely or in part due to the circadian effects. It is moreover important to note that the time-of-day effect is known to be much stronger than the time-on-task effect (Wylie et al., 1996). Hence, since simulator studies have also shown strong circadian influences on performance (Lenné et al., 1997), these results should be confirmed with a methodology that would control for the time-of-day effect. Another point to note is that these studies were done in laboratory settings and consisted mainly of simple sub-tasks of driving performance. In this respect, Williamson et al. (2001) observed an effect of fatigue on the simpler task, but not on more complex processes observed in the study. It is also important to underline that while alcohol deteriorates driving performance through its effects on visual-motor coordination, tracking and reaction time, it’s main detrimental effects on driving behavior comes through it’s impacts on higher levels of decision making, mainly the processes involved in risk-taking behaviors. It is indeed by its acute behavioral disinhibiting effects and its impact on risky-driving that alcohol impacts on road safety (Fillmore et al., 2008). It is definitively doubtful that fatigue has similar effects on inhibition processes, impulsivity and risky-driving. To sum-up, scientific studies suggest that extending continuous hours awake to more than 16 hours can significantly impact on performance. The current Canadian HOS rules limiting duty time to 14 hours (13 driving, 1 on-duty not driving) within a 16-hour window is a step in trying to limit the effects of extended wakefulness on driving performance. The mandatory restart period after a duty cycle (36 hours for a 70 hours cycle, 72 hours for a 120 hours cycle), as well as the cycle limits (70/7 or 120/14) are also intended to have positive effects on drivers’ alertness by eliminating the negative effects of cumulative extended wakefulness. 2.1.1.3.3 Acute and cumulative sleep loss As noted by Rosekind (2005), scientific studies show that on average humans need around 8 hours of sleep. There is however a significant tendency in our society to get less sleep than our physiological needs require, which certainly impacts on a variety of factors, including road safety. Multiple studies have shown that getting 2 hours less sleep

Human Factors in the Motor Carrier Industry in Canada 47
than the 8 hours required (acute sleep loss) results in performance decrement. For this reason, it is important that HOS rules provide drivers with the opportunity to take 8 consecutive hours of sleep, plus enough time to attend to other personal activities and needs, in any 24-hour period. In this respect, current Canadian rules, with mandatory 10 hours off-duty daily (8 of which need to be consecutive), are a significant step in this direction. Note however that what drivers actually do in their off-duty time is up to them, and cannot be regulated. Fatigue management programs can however be instrumental in shaping their knowledge and attitudes in order to increase their motivations to get the sleep that they really need. Cumulative sleep debt is also a significant problem. If acute sleep loss occurs over consecutive nights, it tends to add up and create a significant sleep debt that needs to be “reimbursed” by sleep. The effects of cumulative sleep loss are dose dependant, so that the bigger the dept, the more important the performance decrement. As noted by Rosekind (2005) two consecutive sleep periods can erase a sleep dept. This rule is the main scientific reason behind the HOS provision for a mandatory off-duty restart period after each duty cycles. 2.1.1.3.4 Obstructive sleep apnea syndrome Obstructive Sleep Apnea Syndrome (OSA) is a condition in which breathing frequently stops or is substantially reduced on a regular basis throughout the night. Each apnea is associated with partial awakening as breathing is restored, and these consecutive awakenings lead to a lack of restorative sleep. It is a common sleep disorder that is associated with increased daytime sleepiness, memory and concentration problems, irritability, impaired vigilance and reaction time as well as road crashes (Moscovitch et al., 2006). Epidemiological studies show that sleep apnea is more prevalent in men then women (24% vs. 9%, see Young et al., 1997). It is also associated with middle age, obesity, snoring and having a large collar size. As such, CMV drivers appear to represent a high-risk population. There are inconsistencies in studies looking at the prevalence of OSA among the population of truck drivers. Pack et al. (2002) found that 17.6% of drivers holding a CDL suffered from mild OSA, 5.8% had moderate levels and 4.7% had severe levels. These results contrast with the Stoohs et al. (1995) study were it was suggested that 78 % of drivers with a CDL had mild sleep apnea, as well as the Moscovitch et al. (2006) study where, of 35 drivers, 25 (or 71%) had OSA, of which fourteen (56%) were mild, seven (28%) were moderate and four (16%) were severe. Robert and York (2000) observe that obesity is the primary risk factor for OSA. Given the rate of obesity in the motor carrier industry, they claim that the rate of OSA could be twice more important in the population of CMV driver than in the general population. Sleep apnea is therefore a serious risk factor for fatigue-related road crashes, both in the general population and amongst CMV drivers. The crash rate of drivers with untreated sleep apnea is 2-3 times higher than other drivers (American Thoracic Society, 1994; George & Smiley, 1999; Horstmann et al., 2000; Lloberes et al., 2000; Smolensky et al.,
Human Factors in the Motor Carrier Industry in Canada 48
2011; Suratt & Findley, 1999; Teran-Santos et al., 1999). However, most importantly, sleep apnea can easily be diagnosed and treated and doing so could have a significant positive impact on driving performance and road crashes (Pizza et al., 2008, Hack et al., 2000; Cassel et al., 1996; Findley et al., 2000; George, 2001). This is why the diagnosis and treatment of sleep apnea amongst CMV drivers is one of the core components of the North American Fatigue Management Program (NAFMP) that is currently being pilot-tested by a Canada-US team led by Transport Canada.
Gurubhagavatula et al. (2008) observe that the standard diagnosis for sleep apnea is in-laboratory polysomnography. Since this technique is expensive and relatively inaccessible, its large-scale application to the trucking industry remains questionable. The authors ran a cost/benefit analysis of three different scenarios for the screening and treatment of CMV drivers. On the basis of an estimate of the costs of fatigue-related crashes, they evaluated the profitability of (1) in-lab polysomnography, (2) selective in-lab polysomnography for high-risk drivers (where high-risk is first identified by body mass index, ages and gender, followed by oxiometry in a subset of drivers) and (3) not screening. Assuming that sleep apnea treatment prevents fatigue-related crashes, the results indicate that a decision not to screen for sleep apnea could cost as much as $2.4 billion a year in the US. Full in-lab polysomnography is nevertheless not cost-effective because it is more expensive than the cost of crashes when no screening is done. Screening with BMI, age and gender with confirmatory in-lab polysomnography is however cost-effective if a high proportion (73.8%) of screened drivers accept treatment. Overall, these findings indicate that strategies that reduce reliance on in-lab polysomnography may be 50% more cost efficient that no screening. Treatment acceptance, however, may need to be a condition of employment for affected drivers. 2.1.1.3.5 Road monotony Fatigue corresponds to a loss of alertness on the sleep/wake continuum (Thiffault, 2004; Thiffault, 2005a). In this perspective, monotony is a fatigue facilitator: it has the potential to exacerbate or to counteract (to some extent) the impact of endogenous factors by pulling alertness towards the sleep end of the continuum. According to Kecklund and Åkerstedt (2004), monotony mediates the relationship between sleepiness, performance and crashes. When coupled with long time-on-task and/or low circadian points, the impact of monotony can be catastrophic as it accentuates the decline in alertness. On the other hand, as suggested by Balkin (2004), while sleepiness is reversed by sleep, monotony is relieved by stimulation. Stimulation has the same kind of systemic input on alertness as monotony, but in the opposite direction. As such, under monotonous conditions, stimulation could be viewed as an alertness facilitator. When experiencing fatigue, drivers indeed naturally tend to increase their workload by engaging in stimulating activities such as dinking beverages, tuning the radio, talking to a passenger or stretching/shifting in their seat, as was recently shown in the Barr, Yang, Hanowski et al. (2005) study.
Human Factors in the Motor Carrier Industry in Canada 49
Almost every paper related to driver fatigue states that the problem is more frequent on monotonous roads such as highways in rural environments. Models such as the habituation theory, the ecological perspective of driver fatigue, highway hypnosis and driving without awareness mode, have been put forward to explain how monotony can contribute to fatigue (see Thiffault and Bergeron 2003a for a review). Generally speaking, it is suggested that monotony decreases alertness, which in turn reduces vigilance, resulting in a detrimental impact on many aspects of driving performance. In every model it is suggested that alleviating monotony could have a positive effect by allowing at least a temporary restoration of alertness and associated level of vigilance. Monotony can be viewed as a work-related stressor for commercial drivers. According to the dynamic model of stress and sustained attention, underload and overload are stressors to which one has to adapt (Hancock and Warm, 1989). As observed by Fairclough and Houston (2004), mental effort is a compensatory strategy that can be used in low alertness situations, however this energy mobilization can only be temporary and will eventually accentuate the fatigue response. Adams-Guppy and Guppy (2003) as well as Barr, Yang, Hanowski et al. (2005), pointed out that road monotony is an important factor associated with truck driver fatigue. In countries such as Canada, the United-States and Australia, long-haul commercial drivers indeed spend a significant portion of their working time enduring very low-demanding task conditions. Furthermore, in a study focusing on bus driver fatigue, it was acknowledged that the comfort of buses could accentuate the monotony of the driving task and result in even more severe losses of alertness and attention (FMCSA, 1999). It was also shown that there are individual differences with regards to the sensitivity to monotony and that these differences can be linked to the psychophysiological need for stimulation underlying personality dimensions such as extraversion and sensation seeking, which can be measured (Thiffault and Bergeron, 2003b). These conclusions have important implications in terms of interventions, mainly with regards to fatigue detection and management as well as driver evaluation. 2.1.1.4 Fatigue and individual differences There is a growing interest in trying to better understand the causes of individual differences in driver fatigue susceptibility. Data from the Driver Fatigue and Alertness Study (DFAS) show that 29 of the 80 drivers were never drowsy while 11 of them were responsible for 54% of the drowsiness episodes (Wylie et al., 1996). Looking at the data of three instrumented vehicle studies that were conducted to monitor driver fatigue, Knipling (2005) observed that high, medium and low fatigue risk groups could consistently be identified. While studying the impact of sleep duration on driving performance, Balkin et al. (2000) observed that performance was related to amount of sleep but that there were significant intragroup differences between subjects who slept the same number of hours.
Human Factors in the Motor Carrier Industry in Canada 50
Van Dongen et al. (2004) did a study to investigate if neurobehavioral response to sleep loss was related to sleep history or to a trait-like differential vulnerability. The results showed that interindividual variability was more important than the effect of prior sleep and thus support the latter explanation. The authors therefore suggest that neurobehavioral deficits from sleep loss involve a trait-like differential vulnerability for which neurobiological correlates remain to be discovered. In a study looking at the impact of sleep restriction on driving performance (line crossing), Philip et al. (2005) noted that two of their six subjects were responsible for 93 of the 94 observed line-crossing events. The authors advocate the presence of variability in the activation of waking systems and stress that research is needed to identify individuals more vulnerable to sleep restriction. According to Knipling (2005), commercial drivers have important interindividual differences in fatigue susceptibility, which may largely rely on individual physiological factors and/or long-term behavioral differences related to sleep hygiene habits. It is interesting to note that the above-mentioned recent studies relate to endogenous sources of fatigue. However, older studies conducted under the vigilance paradigm also consistently reported the presence of individual differences in subject performance and related them to differential reactions to the low demanding and monotonous characteristic of vigilance tasks. Hence, while current efforts aim at explaining individual differences in endogenous fatigue susceptibility, differences in the reaction to monotony could also play a role by mediating the effect of exogenous factors on alertness. Two main dimensions were identified in the vigilance literature as mediating precursors of task-induced fatigue: extraversion and sensation seeking (see Thiffault and Bergeron 2003b for a comprehensive review). 2.1.1.4.1 Extraversion The extraversion-introversion dimension, as formulated by Eysenck (1967), is the most extensively studied personality trait in the vigilance field. It has also been implicated as a possible mediator of fatigue and driving (Brown, 1995), related to the development of subjective fatigue (Matthews and Desmond, 1998), and shown to have a significant relationship with the occurrence of fatigue-related driving errors during simulated driving conditions (Verwey & Zaidel, 2000, Thiffault and Bergeron, 2003b). Very briefly, using Hockey’s control theory, Eysenck (1988, 1989), points to the existence of a high-level control system that would regulate the instigation of effortful activities aiming to compensate for sub-optimal internal states. Applying the control theory to explain the relation between extraversion and vigilance, he suggested that introverts would make more use of the control system and tend to invest more effort than extraverts when compensating for the effects of monotonous task conditions. Alternatively, extraverts would invest less effort and show greater performance decrement.
Human Factors in the Motor Carrier Industry in Canada 51
2.1.1.4.2 Sensation seeking Sensation seeking (SS) is a personality trait defined by the need for varied, novel and complex sensations and experiences and the willingness to take physical and social risks for the sake of such experiences (Zuckerman, 1979). The relationship between sensation seeking and road safety has been observed mainly in terms of risky-driving. It is largely acknowledged that high sensation seekers (HSS) tend to take risks because of their need for novelty, sensations and thrills. Alternatively, because of their aversion to boredom, monotony and low demanding task conditions, it is possible that HSS may react more negatively to monotonous road environments. In their simulator study on the personal predictors of driver fatigue, Verwey and Zaidel (2000) observed that the dishinibition dimension of sensation seeking is related to more frequent solid lane-marking crossings and erratic driving. Verwey and Zaidel suggest that professional drivers should not be sensation seekers, so that they do not engage in exploratory and risky behaviors under boring driving conditions. The over-representation of younger male drivers in fatigue-related crashes may also be linked to sensation seeking. Many have suggested that the high prevalence of young males in these crashes is related to a more fatigue-inducing lifestyle. Higher levels of sensation seeking were however also observed for this population (Ball et al., 1984; Butkovic and Bratko, 2003; Farmer et al., 2001; Zuckerman & Need, 1979; Zuckerman, 1994). It is thus possible that on top of their fatigue-inducing lifestyle - which can also be linked to sensation seeking - a significant portion of young males would react more negatively to monotonous driving conditions because of their higher levels of sensation seeking. In the Otmani, Rogé and Muzet (2005) study, looking at the effect of age and time-of-day on sleepiness in professional drivers, young drivers showed more pronounced decreases in alertness than middle-aged drivers and were more likely to feel sleepy in the low traffic, monotonous condition. This difference can be interpreted as a differential reaction to monotony, which can be linked to higher levels of sensation seeking and associated boredom susceptibility. The suggestion that young drivers could be more influenced by boredom and that this vulnerability feeds into driver fatigue is also supported by Oron-Gilad and Shinar (2000). Thiffault and Bergeron (2003a, 2003b) ran a simulator study to investigate both the impacts of road monotony on driver fatigue as well as individual differences in the sensitivity to monotony. The methodology involved comparing fatigue-related driving performance in two low-demanding driving scenarios, one of which was extremely monotonous and the other containing disparate visual stimulation aimed at interrupting monotony. The results reveal an early time-on-task effect on driving performance (as early as 20 minutes into the task) and more frequent large steering wheel movements when driving in the more monotonous environment, which implies greater fatigue and vigilance decrements. In terms of individual differences, subjects who acknowledged having fallen asleep at the wheel in the past were likely to score significantly higher on sensation seeking than those who claimed not to have done so. This result thus points to a relationship between SS and
Human Factors in the Motor Carrier Industry in Canada 52
driver fatigue. This relationship is further supported by the fact that SS, and particularly the experience seeking dimension, is a significant predictor of the fatigue indicators used in the study. These results tend to corroborate those obtained by Verwey and Zaidel (2000), which support a relationship between SS and driver fatigue. Similar findings were also found in recent studies where HSS were more impacted by fatigue under monotonous settings than LSS (Karrer et al., 2004, Michael & Meuter, 2007). The significant interaction between extraversion and SS is also important because it implies that individuals scoring high on both dimensions could represent a particularly high-risk population for task-induced fatigue. Measures of these personality dimensions may thus provide valuable practical information for the screening, training and coaching of professional drivers as well as for the management of their work. It could for example be possible, with the approval of the drivers, to consider their profile when assigning them to different types of driving routes. The more monotonous driving journeys would preferably not be given to high sensation seekers or to extraverts who score high on sensation seeking. This could help by improving both job satisfaction and road safety. These personality dimensions could theoretically also be logged in monitoring devices and algorithms aimed at detecting/predicting driver fatigue since they are likely to mediate the effects of monotony. Therefore, while current efforts to investigate individual differences in driver fatigue mainly evolve around the differential vulnerability to sleep loss, an approach looking at exogenous fatigue susceptibility would provide an important complement. 2.1.1.5 Subjective fatigue, knowledge, attitudes and behavior Based on sleep science, the decision to stop driving and take a nap when one is feeling fatigued is certainly the more appropriate thing to do. Other reactive or “in transit” countermeasures like opening the window, talking to passengers, or taking a break without napping are also available to drivers, even though they are far less efficient. Recent studies (Vanlaar et al., 2008; Nordbakke & Sagberg, 2007; Smith et al., 2005) however show that albeit drivers are well aware of the onset of drowsiness, perceive fatigue as a significant road safety issue and recognize the relative efficiency of countermeasures, they do not act on this knowledge. Instead, they keep on driving while drowsy, trying to fight fatigue trough effort, which is by far the riskiest thing to do. The reasons as to why this is happening deserve attention because it can have a direct impact on the type of countermeasures that should be suggested to address driver fatigue. Self-management of alertness would indeed be the best natural way to address driver fatigue. There is however controversy as to whether drivers are reliable in assessing their own level of alertness. According to Baulk et al. (1998) as well as Horne and Reyner (2001), drivers are well aware of the onset of fatigue. Data from the DFAS (Wylie et al., 1996) however shows little correlation between subjective ratings of alertness and objective performance measures. Other authors such as Itoi et al. (1993) and Dingus (2005) also conclude that drivers are not good at predicting the likelihood of imminent sleep.
Human Factors in the Motor Carrier Industry in Canada 53
These issues are complex, discussion can be guided in many directions and there are many implications for interventions. For example, consider the following:
• There are probably individual differences in the reliability of self-assessment of alertness;
• Drivers may be aware of increasing drowsiness, yet do not feel the onset of fatigue-related hypovigilance, which is likely to occur early in the development of fatigue. This makes the whole inattention spectrum of fatigue-related driver errors even more hazardous;
• Drivers may feel large variations in alertness but their ability to detect minor changes may be weak and/or mediated by individual differences. Since fatigue onset is very gradual, it may go unnoticed;
• Minor phasic or task-induced variations of alertness caused by monotony or medication are likely to go unnoticed. This is an important challenge, since these minor alertness variations are associated with inattention, a known significant predictor of road crashes;
• Drivers may feel drowsy but probably underestimate the possibility of actually falling asleep at the wheel as a result of this drowsiness;
• The very proximal relationship between being drowsy, microsleep episodes and actual falling asleep is most likely poorly understood, which could explain why drowsy drivers underestimate the risks and keep on driving, trying to fight fatigue with effort.
The debate whether or not drivers are efficient in detecting decreases in alertness is certainly important, however the fact that most of them do not act properly and keep on driving when they do feel fatigued is another problem which appears even more relevant. Smith et al. (2005) indeed observed that young drivers were able to perceive variations in objective alertness across the day but that they nevertheless kept on driving in low alertness situations (e.g. night driving). Citing Horne and Reyner (1999) the authors suggest that young drivers underestimate the probability of falling asleep when drowsy and therefore underestimate the risk of crash and potential injuries when driving sleepy. In other words, their physiological perceptions are somewhat accurate, but their behaviors are influenced by other determinants of risk-taking behaviors. As noted by the authors, interventions aimed at convincing drivers to stop driving when feeling drowsy might be most effective. Accordingly, instead of simply educating drivers on the signs of fatigue, it would be more efficient to reinforce the link between perceived sleepiness, driving impairment and increased crash risk. It is however debatable whether the simple transmission of knowledge about the risk of falling asleep and crashing when driving drowsy would be sufficient. Models like the Theory of Planned Behavior (TPB) clearly demonstrate that intentions to commit a behavior are the result of complex interactions where simple factual knowledge has limited predictive value. This implies that fighting driver fatigue while focussing solely on educational programs may have limited impacts.
Human Factors in the Motor Carrier Industry in Canada 54
Nordbakke and Sagberg (2007) conducted a large-scale survey to better understand drivers’ actions when feeling drowsy. The authors noted that incidents of falling asleep at the wheel are usually preceded by subjective symptoms of sleepiness, which should ideally be sufficient for drivers to take adequate countermeasures. They therefore hypothesized that continued driving by drivers who are aware of their sleepiness should either be the product of a lack of knowledge of the risks associated with fatigued-driving or a failure to act according to this knowledge. The results show that drivers had good knowledge of the risk of falling asleep while driving as well as its associated hazards. The severity of sleep-related crashes was however underestimated, which could have prevented them from taking fatigue seriously enough. Most surprisingly, of the 3.5% of drivers that fell asleep at the wheel in the past, 26% report that they kept on driving after having woken up, without taking a break. Overall, 73% of respondents report they usually continue to drive when they feel sleepy. Reasons for doing so are mainly ascribed to time pressure and the desire to get back home. The results also indicate that the countermeasures believed to be the most efficient are not the ones being employed most frequently. For example, taking a nap is identified as the second best countermeasures (after changing drivers), but only 10% of drivers report doing it when feeling drowsy. In fact, drivers tend to rely on in-transit strategies that can be done in the car without stopping (music, opening windows, talking), instead of pre-trip countermeasures, which they know represent a better approach (see Smiley, 2008). Again, the problem does not appear to be one of knowledge; most drivers in the study were aware of the importance of getting enough sleep prior to long drives but a large proportion of them do not act accordingly and do not get sufficient sleep beforehand. Like Smith et al. (2005), Nordbakke and Sagberg (2007) conclude from their study that drivers do experience various signs of sleepiness before falling asleep at the wheel, but that these signs are not taken seriously enough. The relationship between physiological fatigue signals and the risk of falling asleep is not well understood and drivers tend to overestimate their capacity to fight sleepiness with effort (see also Dinges, 1992; Lucidi et al. 2006). The authors suggest that drivers may in fact lack the knowledge of when they should act on their sleepiness. They should be made to understand that the transition from fully awake to drowsy is very gradual and poorly perceptible and they should be convinced to pay more attention to the early signs of fatigue. Even more importantly, they should be convinced to act early in the fatigue process with efficient strategies. The results of Nordbakke and Sagberg (2007) also show that the discrepancy between knowledge and action with regards to the efficiency of countermeasures is impacted by drivers’ age. While younger drivers tend to use less effective in-transit countermeasures, older drivers rely more on efficient pre-trip strategies like getting enough sleep. It is suggested that older drivers have learned by experience and that strategies should be developed to change the behavior of young drivers without exposing them to the experience of falling asleep at the wheel. Again, pure transmission of knowledge may not be sufficient and it might be necessary to work on attitudes and behavioral intentions.
Human Factors in the Motor Carrier Industry in Canada 55
The Traffic Injury Research Foundation conducted a large-scale survey to look at public attitudes, opinions and practices with regards to driver fatigue (Vanlaar et al., 2008). The majority of drivers (59.6%) admitted to occasionally driving while fatigued, 14.5% stated that they had fallen asleep at the wheel at least once in the past year, 0.6% indicated that they were involved in a crash while they had fallen asleep and 1.3% reported being in a fatigue-related crash caused by another driver. Since this survey was designed to be representative of the population in Ontario, an extrapolation of the results suggest that around 167,000 drivers in the province had a fatigue-related crash in the past year. The data also indicate that there are discrepancies between perceived efficiency of fatigue countermeasures and the tactics that drivers report using. As in the Nordbakke and Sagberg (2007) study, drivers have a fairly good understanding of the relative effectiveness of countermeasures but they did not report acting on this knowledge. For example, they ranked “stopping to take a nap” second best countermeasures after changing drivers, but only 14.8% reported using it in the past 12 months. Again, most tactics used were inefficient in-transit countermeasures such as opening the windows and talking to passengers. Furthermore, the data shows that Ontario drivers recognize that driver fatigue is a serious risk, but that they are less concerned about it than other road safety issues such as impaired driving, speeding and distracted driving. The authors conclude that drivers believe they can control driver fatigue, that they use many strategies to cope with it but that these tactics are the least effective. There is therefore dissonance between this perception of control over the situation, the understanding of the efficiency of the strategies that are being used and the actions that are taken: drivers know fatigue is a serious problem but they nevertheless try to control it by using strategies that they perceive as ineffective. The authors nevertheless recommend increasing public awareness about the problem of driver fatigue and effective ways to deal with it. However, like in the Nordbakke and Sagberg (2007) study, the data did show that the knowledge was good but that the actions taken were inadequate. Again, it seems very likely that other factors than knowledge - most likely attitudes, social norm and external pressures - might be heavily involved in predicting behavioral intentions with regards to coping with driver fatigue. These variables can be investigated under the Theory of Planned Behavior (TPB), which is briefly presented below, and will be addressed in more debt in the upcoming section on decision errors. 2.1.1.5.1 Theory of planned behavior Many hypotheses can be brought forward to explain why drivers keep driving when feeling fatigued. One of them certainly relates to knowledge. Studies suggest that drivers might not understand the proximal relationship between feeling drowsy and actually falling asleep. In other words, they would underestimate the likelihood of falling asleep when feeling drowsy and would keep on driving, not being conscious of the seriousness of the situation that they are generating. From this perspective, increasing awareness

Human Factors in the Motor Carrier Industry in Canada 56
about the suddenness or the unpredictability of microsleep or falling asleep episodes when one is in a state of drowsiness would be a legitimate strategy, and needs to be recommended. It is however also probable that the behavioral intentions of drivers with regards to managing driver fatigue is related to concepts such as attitudes, subjective norms, or perceived behavioral control (PBC), which are the main components of the theory of planned behavior (Ajzen, 1988, see figure 11). In brief, attitudes relate to perceived consequences of the behavior, subjective norm to the perceived social pressure to engage in the behavior and PBC to perceived control over the behavior. Understanding which of these three components predicts the intention, for a specific behavior within a specific group, provides relevant information as to what should be done to change this behavior. The TPB has been extensively used in road safety studies and has provided important information for the development of interventions aimed at changing drivers behavioral intentions (Beck, 1981; Elliott et Baughan, 2003; Forward, 1997; Grube et Voas, 1996; Parker et Manstead, 1996; Parker et al., 1992a; Parker et al., 1992b; Parker et al., 1995; Parker, Lajunen et Stradling, 1998; Marcil, Bergeron et Audet, 2001; Marcil, Audet et Bergeron, 1999, Rothengatter, 1994; Rutter et al. 1995; West et Hall, 1997, Yagil, 1998, see Thiffault 2005b).
Figure 11: Theory of planned behavior (Ajzen, 1991) Poulter et al. (2008) recently used the TPB to gain a better understanding of risky-driving and behaviors related to vehicle compliance amongst a sample of truck drivers. In brief, the results indicate that behaviors on the road are driven by attitudes and intentions, which indicates that drivers are not braking the law by accident but that their behaviors are rather intended, and therefore predictable. In terms of vehicle compliance, the data show that these behaviors are related to the PBC component, which suggest that drivers are non-compliant when they do not feel in control of keeping their vehicle legal. In terms of interventions, the authors observe that different approaches should be used for these two categories of behavior. While risky-driving should be addressed by improving attitudes and intentions, vehicle compliance behavior would benefit from providing operators with more time, resources and incentives, and changing their awareness of factors in or out of their control, as well as changing the occupational safety culture of the company.

Human Factors in the Motor Carrier Industry in Canada 57
Given what was observed in the above-mentioned studies relating to the discrepancy between drivers’ knowledge and actions with regards to fatigue management, it would be pertinent to explore the reasons for the lack of proper action from drowsy drivers in light of this theory. The TPB could help foster an understanding of whether CMV drivers fail to act because they do not really appreciate the negative consequences of drowsy driving (attitudes), because as a group they feel a social pressure to keep driving when they are experiencing fatigue (subjective norm) or because given the macroergonomics of this industry, they feel that they are not empowered to stop driving, take a break or nap when fatigued, as was proposed in the Filiatrault et al. (2002) paper. Such a study would shed some light on the problem of fatigue-related crashes for CMV drivers and provide significant direction for interventions. 2.1.1.6 Why are CMV drivers at risk for driver fatigue? As pointed out by Williamson and Boufous (2007), CMV drivers have been shown to have the highest rate of work-related traffic crashes (see also Bunn & Struttman, 2003; Herbert & Landrignan, 2000; Rossignol & Pineault, 1993). They also observe that fatigue is a recognised risk factor for crashes and that truck driving is characterized by known fatigue risk factors. In this regard, the National Transportation Safety Board (NTSB, 1995) estimated that 58% of all single truck crashes are fatigue-related, Bunn et al. (2005) observed that sleepiness, fatigue and inattention were statistically related to fatal commercial vehicle crashes and McCartt et al., (2000) found that 47,1% of a sample of 593 CMV drivers reported falling asleep at the wheel in the past, of which 25.4% in the past year. Williamson and Boufous (2007) also note that occupational road fatalities have been empirically distinguished from general road crashes by driver distraction, inattention and falling asleep (see also Bunn and Struttman, 2003). In fact, studies of professional drivers have repeatedly shown high levels of self-reported fatigue due to long work hours, long hours spent on passive monotonous tasks, and irregular schedules (Brown, 1994; Williamson et al., 2002). To get a better understanding of the involvement of fatigue in work-related crashes, Williamson and Boufous (2007) compared data from a workers compensation dataset and a general road safety crash dataset in New South Whales. Their results show that there are important similarities between work-related and non work-related fatigue crashes. Fatigue crashes, whether work-related or not, are more likely to result in fatalities, to entail higher costs, to involve trucks and to include alcohol and speeding. Furthermore, within each dataset, fatigue-related crashes were more likely to occur just before dawn compared to other types of crashes, which, again, confirms the dangers of night driving. A key statement from Williamson and Boufous (2007) is that, even though fatigue crashes occur in similar ways regardless of work/non work status, strategies addressing professional driver fatigue should not be left only to general road safety strategies. As there is more control in the workplace over some of the fundamental causes of driver fatigue, work-related fatigue management strategies are more likely to be successful.

Human Factors in the Motor Carrier Industry in Canada 58
This statement is important. Because of the nature and the complexity of the phenomena, the prevention of fatigue-related crashes in general is a difficult endeavour. However, given the potential control over drivers in the motor carrier industry, it is possible to do more for this segment of the population, which, as it happens, represents a high-risk group for fatigue crashes. Several authors have identified specific risk factors that can contribute to fatigue in the motor carrier industry. Below are key elements described in recent noteworthy papers:
• According to Rogers and Knipling (2007), the most important factors are recurring lack of sleep in principal sleep periods, extended work and/or commuting periods, work/sleep periods conflicting with circadian rhythms, changing, rotating, unpredictable schedules, lack of rest/naps during work, sleep disruption, inadequate opportunities for exercise, poor diet and environmental stressors;
• Friswell and Williamson (2008) identified long irregular hours and sleep restriction caused by round-the-clock schedules for long-haul drivers and high-pressure work environments and long daily work hours for short-haul drivers;
• Moscovitch et al. (2006) organized fatigue contributors for CMV drivers in terms of driver, environment and operational risk-factors:
o Driver factors: time-of-day, sleep deprivation/sleep debt, sleep disorders, sleep hygiene practices, health, lifestyle (e.g. fitness, physical activity, use of drugs and alcohol), diet, emotional state and domestic factors;
o Environmental factors: weather, road conditions, seasonal variations, engineering/ergonomics (including vibration, thermal environment, cab design, sleeper berth design, etc.);
o Operational factors: HOS, Owner/Operator issues and contracting, loading/unloading practices, dispatching practices, rest areas, sleeper berth regulations and corporate culture;
• Moscovitch et al. (2006) also note that little can be done about environmental factors but that driver and operational factors can be changed trough educational and training modules targeted at key stakeholders in the industry (drivers, dispatchers, managers, driver families and shippers) which, together with sleep apnea screening and treatment, should form the nucleus of comprehensive FMPs for motor carriers;
• In their review of the literature, Gander et al. (2006) documented the impacts of extended wakefulness, acute sleep loss, sleep dept, sleep disorders and circadian low points on CMV drivers’ fatigue;
• According to Otmani et al. (2005), time-on-task and time-of-day are the main fatigue contributors for CMV drivers. However, they also observed that age was a factor as younger CMV drivers were more fatigued than older ones in low traffic monotonous conditions. Individual differences in the sensitivity to road monotony, which has been linked to sensation seeking (Thiffault & Bergeron, 2003b) represents a relevant hypothesis, since levels of sensation seeking are at their highest for young drivers and decrease with age;
Human Factors in the Motor Carrier Industry in Canada 59
• Looking at the specific situation of fatigue in the motorcoach industry, Krueger et al. (2005) identified constant contact with passengers contributing additional sources of stress, multiple role of the driver, extended workdays and inverted duty/sleep cycles, absence of berths, as well as high work-demands reducing the opportunity for extended rest periods (see also Crum et al., 2002, Brock et al., 2005);
• For Morrow and Crum (2004), the fatigue risk factors in this industry are work overload (time-on-task), schedule irregularity, disturbance in sleep patterns, insufficient recovery, macroergonomics and non-driving duty tasks;
• Filiatrault et al. (2002) reviewed studies showing impacts of sleep restriction, sleep fragmentation (sleep quantity and quality negatively impacted by work demands, family obligations, personal life, medication), irregular sleep periods, sleep apnea, excessive noise and concerns about own safety;
• McCartt et al. (2000) cited studies looking at the effects of schedules, monotony and repetiveness of the driving task, high levels of exposure with irregular hours, limited opportunities to obtain sufficient restorative sleep resulting in sleep dept, unhealthy lifestyles, lack of exercise and improper diet;
• For Boivin (2000), fatigue risk-factors in the trucking industry are: reduced amount of sleep, split sleep patterns, schedule irregularity, use of sleeper berths, inverted duty/sleep periods, long hours awake, low sleep duration, sedating drugs, sleep disorders, non-driving on-duty tasks and time-of-day, which would be the strongest consistent predictor.
Filiatrault et al. (2002) recognized other high-level characteristics of the motor carrier industry that are likely to contribute to fatigue-related crashes. In brief, they observe that the competitive nature of surface transportation poses a unique challenge to CMV drivers, compared with other road users, in that they continually have to balance the need for rest with perceived or real consequences that could arise should they fail to maintain externally imposed schedule demands (see also McCartt et al., 1997; Hanowsky et al., 1998 and Abrams et al., 1997). This statement is interesting as it explains how a competitive working context globally structured around economic considerations can condition drivers’ reactions to perceived decreases in alertness. Because of the nature of this industry, drivers may resist (even more than light-vehicle drivers do) to engage in fatigue countermeasures if these could delay the delivery of goods: (…) in this environment, commercial drivers may not feel they are adequately empowered to stop and rest when the onset of sleep develops. Filiatrault et al. (2002) indeed observed a correlation between sleep quality and preference given by subject, when fatigued, to elect whether to rest or comply with real or perceived duty to maintain schedule demands. Precisely, sleep quality was poorer for subjects who were work-demand oriented when they felt fatigued. This, in turn, should logically have a negative impact on road safety and on public health. Fatigued drivers also represent increased costs for carriers because of the financial impacts of safety incidents and crashes.
Human Factors in the Motor Carrier Industry in Canada 60
In this line of thought, Rogers and Knipling (2007) promote a macroergonomic perspective of the motor carrier industry (see also Hendrick and Kleiner, 2001) in which economic, organizational and regulatory (e.g. dispatch, schedules, pay method, HOS) issues are integrated with driver factors (attitudes, motivation, behaviors) in a systemic analysis of motor carrier safety. Such a perspective enables a comprehensive understanding of this complex system that has significant impacts on public health through road crashes. It is also efficient for generating new global approaches to safety such as Safety Management Systems (SMS), or Behavior Base Safety (BBS), two approaches that aim to generate positive changes in safety-related behaviors by modifying the safety culture, both at the organizational and individual, driver level: (…) the purpose of macroergonomic assessment is to enhance carrier and driver safety motivation, practices and outcomes by helping to develop systematic top-down, harmonized approaches to motor carrier organizational and work systems design. 2.1.2 Fatigue countermeasures and research needs The general causes of diver fatigue were identified above. Studies basically show that time-of-day, time-on-task, time-awake, acute and cumulative sleep loss, sleep apnea, monotonous driving conditions as well as the macroergonomics of the industry all contribute to the fatigue phenomenon for CMV drivers. Further examination of specific risk factors in the motor carrier industry provided more precise considerations with regards to these broad fatigue contributors. With the causes now identified and confirmed, the next step is to address approaches for countermeasures. Below are sets of recommendations stemming from key publications on the issue. 2.1.2.1 National Transport Safety Board (1995) The NTSB conducted a study entitled Factors that influence fatigue in heavy truck accidents. Further to this study, the NTSB formulated the following recommendations:
• Require sufficient rest provisions to enable drivers to obtain 8 continuous hours of sleep after driving for 10 hours and being on duty for a maximum of 15 hours;
• Eliminate HOS provision which allowed drivers with sleeper berth to cumulate the 8 hours off duty in two separate periods;
• Examine pay compensation scheme to determine any effects on HOS violations, fatigue and crashes;
• Complete rulemaking to prohibit employers, shippers, receivers, brokers or drivers from accepting or scheduling shipments that would require drivers to exceed HOS regulations (related to the chain of responsibility concept);
• Develop training and education module to inform truck drivers about hazards of driver fatigue (similar to what may achieved with FMPs);
• Industry associations should urge members to incorporate latest research on fatigue in scheduling practices, particularly as it pertains to the need of 8 hours of continuous sleep;
• Mandate automated tamper-proof electronic on-board recorder devices (EOBRs) to identify truck drivers who exceed hours-of-service regulations.
Human Factors in the Motor Carrier Industry in Canada 61
2.1.2.2 Boivin (2000) In the report Best practices compendium of fatigue in transport operations, Boivin (2000) makes the following recommendations for the trucking industry:
• Implement FMPs oriented towards education; • Provide incentives for accident free performance; • Screen sleep disorders; • Promote strategies to increase alertness (proactive and reactive napping,
caffeine); • Consider strategies to increase stimulation, although they have a short, limited
impact and further validation research is needed. These could include light physical activity, uncomfortable sitting position, noise, interactions with workmate, cold air, sugar and increased lighting;
• Reorganize work schedules (limit night driving, minimum of two full night of sleep after extended driving period, develop work schedules closer to the natural circadian sleep/wake cycle, restrict driving time to 12 hours, protect rest and break periods – maximum of 5 hours of driving before a 30 min. break, minimum of 9 hours between two consecutive shifts);
• Improve cabin environment and sleeping facilities; • Implement technological devices that can be used as alertometers and/or warn
drivers when reaching low levels of alertness (rumble strips, SNAP - Sonic Nap Alert Program, in-cab alertness detection technologies, PERCLOS and other eye closure measures, lane-keeping measures of performance, PVT – Psychomotor Vigilance Test);
• Fitness for duty/readiness to perform testing; • Fatigue management algorithms based on actigraphy technology and
biomathematical modeling; • ITS in-vehicle driver monitoring coupled with intervention algorithms
(advisory messages and/or alerting stimulus). 2.1.2.3 Rogers and Knipling (2007) In the report Domain of Truck and Bus Safety Research, Rogers and Knipling (2007) provide a list of research leads relevant to fatigue countermeasures:
• Post-implementation evaluation of new HOS regimes in U.S. and Canada:
o Determine benefice of extended 10 hours off-duty period; o Determine impacts of driving time increase from 10 to 11 hours; o Study relationships between sleep (consolidated and naps), time-of-day
and work schedules; o Determine sufficiency of restart period (34 in the U.S., 36 in Canada); o Determine optimal berth off-duty splitting scenarios; o Global evaluation of new HOS rules to demonstrate net benefice
compared to older rule.

Human Factors in the Motor Carrier Industry in Canada 62
• Validate on-board alertness and performance monitoring; • Study effects of night driving schedules, develop test to identify persons
more suited for night driving; • Study effects of naps and rest breaks; • Study individual differences with regard to fatigue and circadian variations
of alertness; • Study individual differences in fatigue susceptibly, develop ways to
identify high-risk individuals; • Develop fatigue management strategies in the context of compliance with
HOS as well as proactive strategies that go beyond (toolbox to improve CMV driver fatigue management);
• Demonstrate efficiency/relevance of driver training and driver training options – also with regards to fatigue self management;
• Study the impacts of the macroergonomics of the industry and the potential benefits of safety culture changes as it pertains to safety-related attitudes and motivations.
2.1.2.4 Smiley (2008) In the proceedings of the Working together to understand driver fatigue symposium, Smiley (2008) observed that pre-planned countermeasures (taken before driving) are more efficient than post-driving countermeasures (taken en route). She suggested the following regarding pre-planning strategies:
• Time-of-day (night driving and night shifts) is a demonstrated risk factor. In the Stutts et al. (1999) study, drivers of night shifts were six times more likely to be involved in a fatigue-related crash than any other type of crash. Commercial drivers should therefore be especially conscious of the risk and they should plan accordingly;
• Sleep quantity and quality are very important, thus drivers should always maintain sufficient core sleep periods. In a NTSB study, commercial drivers involved in a fatigue crash had on average 5.5 hours of sleep and for those crashes where fatigue was not a factor, the sleep average was 8 hours. It is clear that commercial drivers should always plan to have sufficient core sleep period, this is probably the more important principle of fatigue management;
• Shift-workers (split shifts, night shifts, rotating shifts) are at risk. Smiley observes that north-American shifts in the motor carrier industry are very inappropriate and should be redesigned. She also pointed out that shift workers should never have to do overtime because they can hardly cope with the stress of shift-work. It is moreover suggested that redesigning schedule practices would require the involvement of employers;
• Treatment for sleep apnea is highly recommended; • Drivers that need to use medications with sedative side-effects should be very
conscious about timing issues, since lengthy hangover periods may be present, even if driver feel the drug should have worn off.
Human Factors in the Motor Carrier Industry in Canada 63
With regards to post-driving interventions:
• Caffeine can have a positive effect for 1 to 1.5 hours after consumption; • Rest breaks and naps are effective but they do not replace core sleep.
Regarding highway designs and technology:
• Secure, frequent rest areas are needed; • Roads with rumble strips have 18 to 21% less single-vehicle crashes, the cost-
benefit ratio is therefore very positive. Similarly, center-line rumble strips reduce head-on crashes by 25%;
• Clear zone improvements (clearing up the roadside, creating transversal slopes) reduces injuries should a driver leave the road;
• ITS fatigue-management technology may be the way of the future. However, as noted by Smiley, their effectiveness is still in doubt; drivers are warned, but what they decide to do with the signal is still up to them.
Finally, Smiley notes that public education is essential. Drivers need to be convinced foremost that pre-planning is the most effective way to avoid fatigue-related crashes. Some post-driving countermeasures to address existing fatigue are also effective, but with clear limitations that need to be understood by both the public and professional drivers. 2.1.2.5 Hours of service Table 16 lists main fatigue causes and risk factors in the motor carrier industry. Looking at this table, it is clear that HOS rules can have a positive impact on most of these causes and risk factors, but not all of them. HOS can impact on time-on-task, time-awake, acute and cumulative sleep loss. In fact, the new US and Canadian HOS rules are based on core sleep science principles (see Rosekind 2005 for a review). In brief:
• Human operators need at least 8 hours of continuous sleep every day, before starting a new shift: Canadian rules provide drivers with 10 hours off duty in any 24-hour work period, 8 of which have to be consecutive. This provision should address the problem of acute sleep loss, and therefore prevent cumulative sleep loss from occurring over a cycle. By combining two sets of shift and day requirements, the Canadian rule also limits phase shifting and promotes more circadian stability within a cycle;
• Napping is a key component of fatigue management: Canadian HOS rules provide drivers with a supplement of two hours daily to take beaks and nap;
• Two consecutive sleep periods can erase sleep debt: This is the main reason behind the HOS provision for a mandatory 36-hours restart after a duty cycle;
• Extending continuous hours awake to more than 16 hours can significantly impact on performance: The Canadian HOS rules limiting duty time to 14 hours (13 driving, 1 on-duty not driving) within a 16-hour window is a step in trying to limit the effects of extended wakefulness on driving performance.
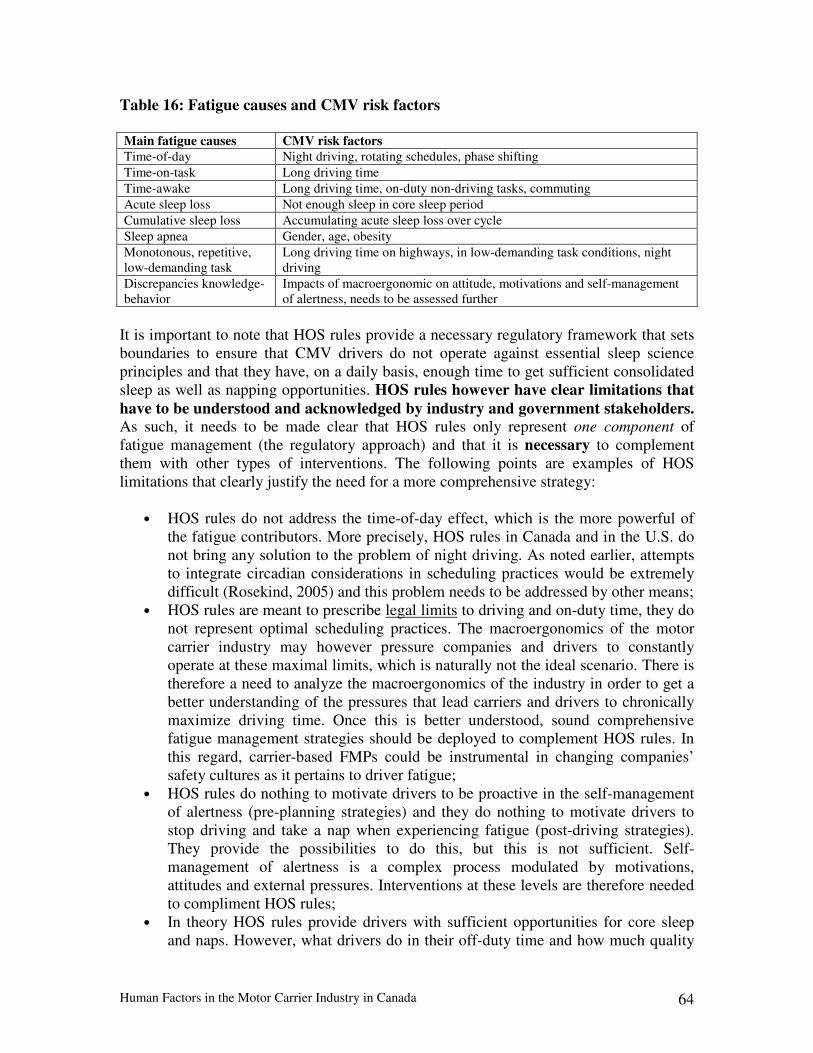
Human Factors in the Motor Carrier Industry in Canada 64
Table 16: Fatigue causes and CMV risk factors
Main fatigue causes CMV risk factors
Time-of-day Night driving, rotating schedules, phase shifting Time-on-task Long driving time Time-awake Long driving time, on-duty non-driving tasks, commuting Acute sleep loss Not enough sleep in core sleep period Cumulative sleep loss Accumulating acute sleep loss over cycle Sleep apnea Gender, age, obesity Monotonous, repetitive, low-demanding task
Long driving time on highways, in low-demanding task conditions, night driving
Discrepancies knowledge-behavior
Impacts of macroergonomic on attitude, motivations and self-management of alertness, needs to be assessed further
It is important to note that HOS rules provide a necessary regulatory framework that sets boundaries to ensure that CMV drivers do not operate against essential sleep science principles and that they have, on a daily basis, enough time to get sufficient consolidated sleep as well as napping opportunities. HOS rules however have clear limitations that
have to be understood and acknowledged by industry and government stakeholders. As such, it needs to be made clear that HOS rules only represent one component of fatigue management (the regulatory approach) and that it is necessary to complement them with other types of interventions. The following points are examples of HOS limitations that clearly justify the need for a more comprehensive strategy:
• HOS rules do not address the time-of-day effect, which is the more powerful of the fatigue contributors. More precisely, HOS rules in Canada and in the U.S. do not bring any solution to the problem of night driving. As noted earlier, attempts to integrate circadian considerations in scheduling practices would be extremely difficult (Rosekind, 2005) and this problem needs to be addressed by other means;
• HOS rules are meant to prescribe legal limits to driving and on-duty time, they do not represent optimal scheduling practices. The macroergonomics of the motor carrier industry may however pressure companies and drivers to constantly operate at these maximal limits, which is naturally not the ideal scenario. There is therefore a need to analyze the macroergonomics of the industry in order to get a better understanding of the pressures that lead carriers and drivers to chronically maximize driving time. Once this is better understood, sound comprehensive fatigue management strategies should be deployed to complement HOS rules. In this regard, carrier-based FMPs could be instrumental in changing companies’ safety cultures as it pertains to driver fatigue;
• HOS rules do nothing to motivate drivers to be proactive in the self-management of alertness (pre-planning strategies) and they do nothing to motivate drivers to stop driving and take a nap when experiencing fatigue (post-driving strategies). They provide the possibilities to do this, but this is not sufficient. Self-management of alertness is a complex process modulated by motivations, attitudes and external pressures. Interventions at these levels are therefore needed to compliment HOS rules;
• In theory HOS rules provide drivers with sufficient opportunities for core sleep and naps. However, what drivers do in their off-duty time and how much quality
Human Factors in the Motor Carrier Industry in Canada 65
sleep they really get is outside the scope of HOS. Since this is the most important component of fatigue management and since it has a significant impact on road safety, it should be addressed by other means aimed at educating drivers and their families as well as changing their attitudes and motivations towards sleep;
• It is impossible to address individual differences in fatigue vulnerability with HOS rules. It is however the same with other road safety regulatory frameworks. Even though there are large differences in most of the factors that influence driving performance (vision, psychomotor coordination, reaction time, risk-taking tendencies, etc.) drivers need to abide by a single set of rules and additional interventions can be put forward to address the variability of the population. A similar comprehensive approach is needed for the management of driver fatigue;
• HOS rules need to be enforced to be effective. In Canada, the limits to driving and on-duty time currently prescribed are really not on the conservative end of the continuum. Not respecting these limits certainly represents a risk for the safety of road users. Since there are numerous accounts of logbook falsification in the industry, tamper-proof EOBRs need to be implemented to enforce these rules.
The following conclusions can be drafted with regards to HOS rules:
• HOS rules are necessary but they are far from perfect, nor sufficient. They need to be part of a more comprehensive fatigue management strategy that should be recognised and endorsed by industry and governments;
• HOS rules should be enforced with tamper-proof equipment such as EOBRs; • The impacts of the new HOS rules in Canada need to be evaluated.
2.1.2.6 Fatigue Management Programs Transport Canada is focusing on FMPs in all modes of transportation (road, air, rail and marine). FMPs are used throughout Canadian transportation sectors to complement HOS rules. Note that the nature of the mix between prescriptive HOS rules and non-prescriptive FMPs depends on the nature of each transportation sector. Speaking at the 2005 International Truck and Bus Safety and Security Symposium, Derek Sweet (then Director General of TC’s Road Safety Directorate) stated the following:
• Fatigue-oriented regulations range from more to less prescriptive; • FMPs bring flexibility and a comprehensive approach to fatigue while the
legislation of hours of service brings much-needed boundaries in witch operators, unions and the industry need to find balance;
• These orientations are not exclusive but rather complimentary and the perfect formula depends on the context;
• For example, more structured and less fatigue-sensible sectors like railway operations may benefit from the flexibility of FMPs to a greater extend than the trucking industry, which is more fatigue-sensible and complex, and where a more prescriptive approach is therefore needed;

Human Factors in the Motor Carrier Industry in Canada 66
• However, in all cases, the key to success is likely to reside in an eclectic blend of rules complemented by flexible FMPs;
• As a good example, in the north-American trucking industry, clear sets of rules regulate hours of service while a strong complementary FMP approach is currently being developed under the North American Fatigue Management Program (NAFMP) that will complement these rules.
In this last point Derek Sweet was referring to the program that was recently developed in a joint Canada-U.S. effort. A pilot study was recently conducted in three different jurisdictions to evaluate the impacts of the initiative. In brief, as stated in a news release prepared by Transport Canada’s Transportation Development Center (TDC), the NAFMP has been developed to provide Canadian and American motor carrier companies and their drivers with information and tools to enhance their current fatigue management practices. The program provides a framework for driver training and education on fatigue management, work and rest practices, and sleep disorder screening and treatment. It aims to enhance existing safety culture within the industry, reduce fatigue-related incidents, and decrease personal and economic costs of fatigue-related incidents to drivers, companies, workers' compensation programs, and insurance companies (TDC, 2007). The pilot study (phase 3) aimed at implementing a comprehensive FMP protocol on carriers in Quebec (29 drivers completed study), California (25 drivers completed study) and Alberta (23 drivers completed study) and to assess its impacts on a wide range of driver measures (sleep-wake log, actigraphy, mood/fatigue assessment, workload assessment, critical incidents, factors contributing to fatigue, Psychomotor Vigilance Test - PVT) as well as on corporate measures (crashes, violations, absent days, total driving time, total waiting time during duty, total rest time, distances traveled, panic brake, excessive speed, workers compensation data, black box data, insurance claims and sleep apnea claims). Below is high-level summary of the results, which are presented at length in the Smiley et al. (2011) report. For the sake of this review, the hypotheses of the study are identified and the main results for each are simply listed. Hypothesis 1: FMP will improve drivers’ awareness of good sleep practices
resulting in increased sleep time and quality. The analyses comparing post-FMP to pre-FMP indicate that reported sleep quality improved on duty days. Furthermore, for the main sleep period:
• Sleep duration increased by 20 min; • Sleep duration and efficiency improved compared to rest days; • There was an increase in the percentage of drivers reporting more than six hours
of sleep before their shift; • More drivers defined themselves as “night drivers” (unexpected) but the
proportion of night driving hours remained unchanged.
Human Factors in the Motor Carrier Industry in Canada 67
Hypothesis 2: FMP will reduce subjective fatigue, improve psychomotor performance, and reduce critical events (near accidents) during duty days
The analyses comparing post-FMP to pre-FMP indicate the following:
• There was trend showing less fatigue reported; • The proportion of drivers reporting safety critical events was reduced
from 46% to 29%; • Overall the proportion of the number of safety critical events by km travelled was
reduced by 40%; • With regards to the PVT, there was an unexpected increase in minor lapses at end
of the day. Hypothesis 3: Sleep disorder screening and treatment is feasible and will reduce
fatigue and improve sleep for affected drivers.
The analyses comparing post-FMP to pre-FMP indicate the following:
• 71% of drivers were diagnosed with sleep apnea (OSA) based on home recorders and physician visits;
• Drivers in the severe OSA group were more likely to report a critical event pre FMP, however, this Severe OSA group showed greater reduction in critical events post FMP than other OSA groups.
• On rest days, CPAP (Continuous Positive Airway Pressure) adherent group had better PVT performance
• The no-CPAP group & no-OSA group reported more sleep time in a 24-hr period. Hypothesis 4: FMP will improve corporate measures & fatigue management
practices in the company (Alertness Management Strategies Evaluation).
The analyses comparing post-FMP to pre-FMP indicate the following:
• There were improvements in education, alertness strategies and healthy sleep; • There were more night drivers but same night driving overall; • There were reductions in crashes and infractions; • There was a trend showing reduced sick days at Quebec site.
Overall:
• On duty days FMP lead to more sleep during the main sleep period, improved sleep quality, less reported fatigue, fewer reported critical events but more PVT minor lapses;
• Drivers with more severe sleep apnea reported more critical events pre FMP and had greater reductions post vs. pre FMP;
Human Factors in the Motor Carrier Industry in Canada 68
• For drivers diagnosed with sleep apnea and who were adherent to CPAP treatment, FMP lead to better PVT performance (reaction time, minor lapses) but only on rest days;
• Drivers in No CPAP group & OSA group reported more sleep time in a 24-hr period but there were no difference in the other CPAP or OSA groups;
• At the company level, FMP lead to improved knowledge, perceived effort and better experience regarding fatigue management and, in Quebec, to a reduction in crashes & convictions as well as and trend towards reduced sick days.
Conclusion:
• A comprehensive FMP approach at the company and industry level is a promising approach for a long-term reduction in fatigue;
• Such systematic interventions can allow the identification of obstacles and solutions, thereby leading to cultural changes that will allow all players, especially individual drivers, to put in place effective fatigue countermeasures.
Phase IV: The research team just triggered the last phase of the project, which is to develop further the FMP material in order to make it available for the industry on a web-based platform. The program is expected to be available to carriers that want to adopt it on a voluntary basis by the end of 2011. It should include the following elements:
• Modular performance-based training materials; • Scheduling guide for dispatch; • Technology use information and guidelines; • Medical guidelines (screening, lab, intervention, company rule/driver,
protocol/process); • Scientifically developed recovery and napping strategies (considering individual
differences as well as day/night driving); • Corporate culture support; • Certification / accreditation schemes.
Based on what was said about the limitations HOS rules, and considering the results of the pilot study, it is legitimate to suggest that industry and governments in Canada should push for the voluntary use of FMPs that will complement prescriptive HOS rules. It is suggested that stakeholders develop creative incentive to promote this approach within the industry. However, given the nature of the trucking industry (complexity, unpredictability, competitive, economic and societal pressure) and the fact that Canadian HOS rules are already allowing long driving time, it does not appear legitimate - scientifically speaking - to consider extending driving time further for companies that would use a certified FMP. In any event, suggestions to promote HOS flexibility for companies using FMPs should be based on a strong safety case, with a clear demonstration that any such initiative would make the roads safer and promote public health.

Human Factors in the Motor Carrier Industry in Canada 69
2.1.2.7 Scientifically-sound napping strategies As was shown in the above sections, sleep is the best remedy for fatigue. Whereas sufficient core sleep periods are paramount to generate a solid alertness base level, napping strategies also represent a vital approach to fatigue management in transportation. Naps can be planned according to different day or night driving schedules (proactive napping) or they can be used to remediate the effects of fatigue when experienced by the driver (reactive napping). Since 2001, Transport Canada’s Transportation Development Centre and the FMCSA have joined efforts in a scientific examination of napping strategies for commercial vehicle drivers. The objective of the overall research program is to develop scientifically sound napping guidelines that reflect the needs of the motor carrier industry. So far, Transport Canada and the FMCSA have completed a detailed review of existing napping protocols and practices within and outside the motor carrier industry. This has included a review of different factors in the recovery of fatigue such as irregular shifts, night driving, daytime sleeping, periods of recovery (during the week and weekends), and the differences between individual drivers when recovering from fatigue. In addition, 150 long-haul drivers in Québec, Ontario and Alberta were asked to complete a survey on fatigue-related matters, followed by a workshop with various experts and industry stakeholders. In the current phase of the program, a research team is developing scientifically sound napping strategies on the basis of a validated biomathematical model and testing these strategies on a sample of 80 commercial vehicle drivers, gathering data during both real and simulated truck driving tasks. The results of this study, conducted by IBR consulting (Mallis et al.) should be made available in 2011. Globally, the objectives of there study are the following:
• Improve highway safety and driver well being; • Maximize the potential for schedule flexibility to better accommodate operational
and driver needs; • Provide improved means for rapid and safe recovery from fatigue in the event of
unforeseen schedule variations, all within the confines of obtaining sufficient recovery sleep to ensure safe performance in the driving task;
• Develop “recommended approach and guidelines” for optimal napping and recovery sleep strategies for CMV drivers.
Once the study is completed, the guidelines will be finalized and incorporated in a manual of best practices under the NAFMP, together with other innovative tools such as education and training materials, work practices, sleep disorder screening and treatment guidelines, and applicable policies and procedures.
Human Factors in the Motor Carrier Industry in Canada 70
2.1.2.8 Fatigue detection technologies As stated by Boivin (2000), Rogers and Knipling (2007) as well as Smiley (2008) and Balkin et al. (2011), on-board fatigue monitoring systems are likely the way of the future. There are currently a multitude of systems under development and validation and it appears that progress is being made very fast in this area. Satisfactory systems should be available in the short term. For example, a large carrier in Canada is currently testing, on a significant scale, a system that is able to generate warnings very early in the development of fatigue. The system detects early signs of hypovigilance and as such could be a useful tool to address the inattention component of the driver fatigue problem, which would be highly beneficial. Such a system would enable drivers to act early in the development of fatigue and therefore prevent further sliding on the alertness continuum by making use of proper countermeasures. Apart from ongoing validation studies, other aspects that need to be considered are (1) user acceptance, (2) drivers’ reaction s when hypovigilance and fatigue are detected as well as (3) potential adverse effects of the technology. In brief, if the technology is not well accepted by drivers, they might not be receptive to the signal delivered, which would prevent safety benefits. It has also been suggested that drivers are already astute in monitoring their level of alertness, but that they simply do not act when fatigue is experienced. It is therefore entirely possible that they would similarly not act when delivered a warning signal from a device. This phenomenon relates to concepts such as attitudes and motivation rather than knowledge or sensitivity to fatigue signals. It is also possible that drivers would be less motivated to engage in pre-planning countermeasures given the fact they will benefit from a system that will warn them if they are tired. It appears legitimate to suggest that these issues should be addressed trough research before this technology is used on a large scale. Such research would for example enable the development of specific motivational or attitude changing interventions that could accompany the introduction of these technologies. At the very least, they could provide effective guidelines as to how these devices should be implemented within fleets of professional drivers. Overall, while further validation studies need to be conducted and published, it is clear that if such studies were done and if the results were satisfactory, the use of fatigue detection technology would need to be heavily promoted. 2.1.2.9 Changing attitudes towards fatigue As was shown in the section on subjective fatigue, attitudes, knowledge and behavior, even though drivers can feel decreases in alertness, are aware that driver fatigue is a significant road safety issue and understand the effectiveness of different fatigue countermeasures, a majority of them continue driving when feeling drowsy and persist in using countermeasures that they know are ineffective. There is a need to investigate further the reasons for these discrepancies between knowledge and actions and especially in the context of CMV drivers, which has never been done.
Human Factors in the Motor Carrier Industry in Canada 71
As mentioned, such an investigation could be conducted by focusing on the components of the Theory of Planned Behavior. It is a rather straightforward methodology that involves administering questionnaires to a representative sample of CMV drivers. It is
therefore suggested that a research aimed at studying CMV drivers’ knowledge, attitudes and intentions with regards to drowsy driving be conducted. This study would provide much needed data to help identify proper targets for interventions and it would be particularly precious for the development of interventions addressing safety culture, such as fatigue management programs. 2.1.2.10 Promote pre-trip vs. in-transit countermeasures Smiley (2008) made an excellent point when suggesting that pre-trip countermeasures, aimed principally at organizing duty and off-duty time in order to get sufficient core sleep, were a lot more effective than in-transit countermeasures. This statement is clearly backed-up by the science. Apart from taking a nap, or, to a lesser extent, drinking coffee, in-transit countermeasures have limited efficiency. This very simple and strong message should be heavily promoted to drivers, together with the importance of self-management of alertness, by means of educational programs such as FMPs. Again, it might be important to investigate commercial drivers’ attitudes toward both classes of countermeasures in order to facilitate the shift towards the pre-trip approach. 2.1.2.11 Rest areas Most of the recommendations aimed CMV drivers suggest that they get more sleep, either through longer consolidated sleep periods or naps. The new HOS rules in Canada have increased the opportunity to rest from 8 to 10 hours daily, which represents a 25 % improvement. Therefore, if fatigue countermeasures are to be efficient, there should be an increase in the use of rest areas along highways. There are however many issues with rest areas in Canada:
• Currently, there appears to be a shortage of available secure rest areas and parking spaces for CMV drivers;
• Privately owned areas often have time limits and charge a fee; • There are safety concerns because commercial vehicle are often parked on the
roadside or the entrance and exit ramps of rest areas, since there is a lack of designated parking spots for them;
• There is an increase in recreational vehicles and campers competing with heavy trucks for available parking spaces;
• Apart from lighting guidelines, there are no national design, singing, and pavement marking standards for rest areas;
• Most rest areas, which were installed years ago, did not take into consideration the increased length of commercial vehicles in Canada;
• One can therefore question whether the number and adequacy of rest areas along Canadian roads have been keeping up with the increasing commercial vehicle demand and regulatory requirements.
Human Factors in the Motor Carrier Industry in Canada 72
Transport Canada is conducting a study aimed at assessing the adequacy of Canadian rest areas with regards to the needs of the trucking industry. Phase 1 of the project is to gain knowledge of the processes used in the US to address and identify the needs of the motor carrier industry, conduct a review of rest areas in Canada and their amenities, and develop a database inventory of rest areas. Because of the significant relevance of this research program, it is suggested that the Human Factors and Motor Carrier Safety Task Force remain close to this project and factor in the results as they become available. 2.1.2.12 Rumble strips According to Smiley (2008), roads with shoulder rumble strips have 18-21% less single vehicle crashes and this number increases to 25 % for head-on crashes on roads with center-line rumble strips, which represents a very high cost/benefit ratio. The Noyce and Elango (2004) study also found positive safety impacts for centerline rumble strips. As indicated by these authors, centerline rumble strips were found to be effective at gaining drivers’ attention, and therefore can be seen as an effective traffic control device and safety countermeasure. The issue of centerline and shoulder rumble strips in Canada should therefore be investigated further, most likely by means of cost/benefit analysis. 2.1.2.13 Individual differences There is a need to investigate further the individual predictors of driver fatigue. As was mentioned earlier, the sleep research field is currently involved in studying neurobiological predictors of endogenous fatigue such as vulnerability to sleep loss. It is important to note that the joint TC/FMCSA napping study that was recently launched will also investigate these issues. It is therefore important to emphasize that the task force should also stay close to this project and factors-in the results as they become available. Researchers are also currently investigating individual differences with regards to task-induced fatigue and monotony. This approach is a complement to the investigation of individual differences with regards to endogenous fatigue. Overall, there is need to monitor these research areas and to consider the results as they become available. Reliable predictors of driver fatigue would be relevant in terms of driver testing and they could have significant implication for different classes of fatigue countermeasures. 2.1.2.14 Sleep apnea Given the importance of sleep apnea as a fatigue predictor and given its high prevalence in the motor carrier industry, it is clear that something needs to be done about this problem. In the best scenario, commercial drivers would be screened for sleep apnea and treated. This is however a complex problem that should be handled carefully. For example, there are issues with screening procedures since proper screening needs to be done in a sleep lab. Nevertheless Gurubhagavatula et al. (2008) suggested a cost beneficial approach that involves pre-screening drivers by body mass index, age and gender and only selectively conducting in-lab polysomnography for high-risk drivers. Such an approach could be considered on a large-scale.
Human Factors in the Motor Carrier Industry in Canada 73
There are also issues with regards to treatment. In order to be cost effective the approach mentioned above necessitates that at least 74% of drivers with a positive sleep apnea diagnosis accept treatment. Given the intrusive nature of CPAP, the authors have suggested that accepting treatment should be a condition of employment. The reactions of the industry to such a proposition, as well as the logistics of large-scale treatment for CMV drivers, are sensitive issues that need to be investigated systematically. Another element to consider on this issue is that the NAFMP has screening and treatment for sleep apnea as one of its core components. However, this a voluntary approach to the problem. This, in turn needs to be analyzed in light of the policy positions that will be developed by the new CCMTA OSA working group. Note that the group is expected to develop a draft modified medical standard that will include OSA by the fall of 2010. 2.1.2.15 Macroergonomics of the motor carrier industry As described earlier, there is a discrepancy between drivers’ knowledge and their actions when it comes to self-management of alertness. One of the reasons for this discrepancy undoubtedly has to do with how the macroergonomics of the motor carrier industry shape drivers motivations and attitudes. The principle of paying drivers by the mile, for example, cannot be a positive thing for fatigue management. It would appear gratuitous or premature to formulate specific recommendations about these issues without entering into a formal in-depth investigation. Given the importance of the problem, it is necessary that such an investigation take place. Note that this relates is also related to the safety culture research trend. 2.1.3 Driver distraction Distraction represents the other main cause of recognition errors. Like fatigue, the concept is complex and difficult to define and measure. However, contrary to fatigue, the focus in this field is largely oriented towards general road users and very little research has been conducted pertaining to the motor carrier industry (Salmon et al, 2008 & Perrin et al. 2008). The following sections will define the distraction concept, present some prevalence data, discuss the situation for the motor carrier industry and articulate recommendations for mitigating actions as well as relevant R&D leads. 2.1.3.1 Distraction: prevalence, definition and basic principles The distinction was made earlier, but it needs to be repeated here: distraction is not fatigue. While fatigue encompasses attention difficulties caused by lowered brain alertness, distraction is related to difficulties caused by the division of attention under a dual or multiple-task paradigm. The result – inattention - may be somewhat similar, but the problem is different and calls for different interventions. However, since both do relate to inattention, there are interactions between fatigue and distraction that also need to be detailed (Williamson, 2008).
Human Factors in the Motor Carrier Industry in Canada 74
Similar to the fatigue concept, there have been significant debates over the definition of driver distraction (see Lee et al., 2008). It has been suggested that the lack of a widely accepted definition is partly responsible for measurement problems and inconsistent prevalence data, which in turn have prevented road safety practitioners from justifying the allocation of sufficient resources to efficiently address the problem (Regan, Young and Lee, 2008b). The resolution of the definition problem is therefore seen as a capital first step. It is understood that resolving these conceptual issues would generate a chain reaction that could lead the way to better prevalence data, better social awareness, resource mobilization and eventually efficient interventions. Two benchmark definitions have been formulated recently. In 2006, a significant conference took place in Toronto to go over the main aspects of the driver distraction problem, including conceptual issues. In a published summary of this conference, Hedlund et al. (2006) defined distraction as: a diversion of attention from driving, because the driver is temporarily focusing on an object, person, task, or event not related to driving, which reduces the driver’s awareness, decision-making, and/or performance, leading to an increased risk of corrective actions, near-crashes, or crashes. More recently, in the book entitled Distraction: Theory, Effects and Mitigation, Lee et al. (2008) suggested that driver distraction could simply be defined as a diversion of attention away from activities critical for safe driving toward a competing activity. This last definition is the one that will be adopted in the current review. On the basis of this definition, Gordon (2008) observes that distraction is acknowledged in 10 to 12% of crashes in traditional databases, recognizing however that this is probably an understatement, given the difficulties of assessing the role of distraction in crashes through police reports. According to Llenaras (2000) and Minter (2000) the incidence of distraction in crashes is likely in the 20-25% range. Wang et al. (1996) estimated that global inattention is a contributor in 26% of crashes, half of which would be explained by distraction. Using the more thorough behavioral analyses methodology of naturalistic studies, Klauer et al. (2006) found that distraction associated with secondary activities was involved in 23% of crashes in the 100-car study. 2.1.3.1.1 Attention as a single channel process Central to the above-mentioned definitions is the fact that attention works on a single channel basis and that it is a limited resource. Simply put, attention can be compared to a beam of light; the information present in the light is actively processed and the rest is generally ignored. The idea that a person can do two things at the same time therefore refers to attention swapping, whereby the operator rapidly displaces attention from one source to the other and uses working memory to maintain control over both tasks. Note that the operator usually has control over where attention is directed, however this is not necessarily the case. Attention can also be taken away from the main task by competing subtask or specific characteristics of a driving situation (i.e. incoming communication, salient external stimulation, publicity, etc.). Furthermore, it has to be underlined that the act of resisting those external attentional demands and maintaining attention focused on critical driving tasks in the presence of significant non-task stimulation is an effort that
Human Factors in the Motor Carrier Industry in Canada 75
can lead to stress, fatigue and performance decrement. Therefore, in an unpredictable context such as contemporary fast-paced busy road networks, the more the driving task is polluted or corrupted by non-task stimulation or non-task activities, the higher the safety risks. The driving task is complex and comprised of sub-tasks (such as tracking and maintaining inter-vehicle gaps) that require high levels of monitoring. Given the single channel property of attention, when a driver focuses on something other than these basic constituents of driving, his driving performance is likely to be affected, especially if rapid changes occur in the environment. It is now well understood that reaction time increases when drivers are distracted (Caird et al., 2004) and this negatively impacts on safety, as made evident by the significant contribution of distraction to rear-end crashes (Neyens & Boyle, 2006). Drivers involved in non-driving tasks such a talking on the phone, monitoring a GPS device or processing roadside advertisement are indeed less efficient in managing inter-vehicles gaps in fast and busy traffic on highways. If traffic suddenly slows down, increased reaction time can lead to serious incidents. In the Klauer et al. (2006) naturalistic studies, 93% of rear-end crashes involved inattention to the roadway as a contributing factor. Given the lower braking and maneuvering capacities of heavy vehicles and their disproportionate mass compared to light vehicles, the effects of CMV drivers’ distraction on road safety needs to be taken seriously. Consequently, the reasons why drivers would focus their attention on tasks or activities competing with the primary driving task are significant safety issues that need to be addressed. Moreover, the social norms, attitudes and motivations that influence drivers’ decisions to engage or not in distracting activities while driving should be investigated and understood, both for the general population and for CMV drivers. 2.1.3.1.2 The importance of exposure As a general rule, the more a driver is involved in non-driving activities, the higher the safety risks. However, given the complexity and the multilevel nature of the driving task - and even more so in the case of CMV drivers - there can be conceptual difficulties in defining which specific activities should be labeled as critical to driving and which should not (e.g. forward visual scanning, tracking vs. monitoring and management of on-board systems, interacting with company communication technologies, etc.). There is however less difficulty in identifying non-driving activities that present unnecessary risks and should be avoided or limited as much as possible. Cellular phones use - either for talking or texting – operation of on-board entertainment systems and Internet web browsing or emailing are examples of activities that represent additional burden to attention resources while providing very limited benefits, at least safety wise. Exposure to these distracters should therefore be limited as much as possible, or simply prohibited, when the vehicle is in motion.

Human Factors in the Motor Carrier Industry in Canada 76
As observed by Lee, Young and Regan (2008), driver distraction has been a concern for road safety professionals for many years. However, recent increases in the use of on-board communication devices and cell phones, and the fact that telematics systems are becoming multifunctional and portable, have made an already significant problem become even worse. There is growing competition for drivers’ attention and this increase is occurring in an uncontrolled/unregulated environment, creating unprecedented safety risks. In a recent survey of 1,201 drivers in Canada, 70 % reported that driver distraction was a serious problem, a significant increase from the 40 % that were observed in 2001 (Vanlaar, Simpson, Mayhew, & Robertson, 2007). Furthermore, 96% of respondents report that there is more distracted driving today than 5 years ago. Risk is generally related to exposure to hazards. However, in the case of driver distraction, it depends on many factors such as the nature of the distraction, the timing of the distracting activity (synchronicity with variation of the driving task), its intensity, frequency, duration and visual demands (Hanowski et al., 2005; Burns, 2008). In other words, the risk depends on how the distracting activity coincides with the driving task, in real time, and how it influences the distribution of attention relative to the demands of the roadway (Lee, Regan and Young, 2008). It is important to underline that the demands of the driving task tend to be relatively low, which probably encourages drivers to engage in various secondary activities. The problem is that these demands are essentially unpredictable and that changes may occur very fast. Therefore, if a sudden increase in driving workload happens at a time when attention is invested in a demanding secondary task, the risk of crash will be significantly increased (see figure 12). Distracting activities that are frequent, demanding and enduring - such as talking to a cell phone (hand held and hands free) - thus represent higher exposure, and higher safety risks, especially in heavy traffic and driving situations with high workload. A steady increase of such activities in the daily experience of drivers, within the population at large, has to be seen as a public health issue that needs to be addressed promptly.
Figure 12: Workload and distraction (from Lee, Young & Regan, 2008)
Human Factors in the Motor Carrier Industry in Canada 77
2.1.3.1.3 Multilevel control model of driver distraction The multilevel control model of driver distraction proposes that distraction emanates from disruptions of driver’s control over different levels of the driving task (Lee, Regan and Young, 2008). The operational level pertains to lateral and longitudinal control of the vehicle (driver controls resource investment in competing activities), the tactical level corresponds to choices of lane and speed (driver controls task timing of competing activities) and the strategic level relates to choices of route and travel patterns (driver controls global exposure to distracters). It is suggested that distraction can come from disruptions at all three levels. At the operational level, it stems from competing demands from simultaneous tasks, at the tactical level it relates to problems in task timing, and at the strategic level it is a matter of inappropriate priority calibration. Consequently, the model also implies that drivers are not simply passively responding to demands of the driving task and competing activities. They are rather actively controlling the mechanisms that create the distractions that they experience. Drivers indeed decide how they distribute their attention and how they choose to engage in secondary tasks while driving (Lee & Stayer, 2004; Lerner, 2005; Lee, Regan & Young, 2008, Horrey & Lesch, 2009). This statement is interesting since it associates at least part of the driver distraction problem to a decision process that could in theory be influenced or modified. The model also relates to different classes of mitigation strategies. For example, at the operational level, there would be a need to develop In-Vehicle-Information-Systems (IVIS) that are less attention demanding and at the tactical level, context sensitive Advanced Driver Assistance System (ADAS) could manage secondary task interactions on the basis of actual driving conditions. The authors however emphasize that interventions aimed at the strategic level are likely to have the strongest impacts on individual driver behaviors:
Subtle design modifications that reduce distraction at the operational level of behavior may have a much smaller effect on driving safety compared with changes in societal norms that influence the strategic level and make the use of a device while driving taboo.
- Lee, Regan and Young (2008), p.53.
It is indeed suggested that the risk associated with a distracting activity depends as much on the decision to engage in the activity in a demanding environment than on the timing of the activity and the attentional resources that are needed. The factors that influence this decision are defined as drivers’ awareness of the demands associated with using the device in this environment, their perceived ability to manage these demands in this environment, their risk-taking tendencies (personality, attitudes), the presence or absence of laws or company regulations, productivity pressures, driving culture and social norms.

Human Factors in the Motor Carrier Industry in Canada 78
Speaking of driving culture and social norms, Lee, Regan and Young (2008) also observe that the safety margins in driving are not very salient, allowing for production pressures to progressively migrate the situation into increasingly unsafe situations. Since there are no real operational standards as to what level of attention is needed for driving (like the BAC of .08 for alcohol), and since there are no widely accepted standardized procedures to assess the distraction potential of various distracters, the industry is left in the vague as to the boundaries of safety. At the same time, fast-paced expressways with high traffic volumes represents a growing proportion of drivers’ exposure, increasing the potential for high-risk situations where tasks demands are high and drivers’ attention is increasingly challenged. 2.1.3.1.4 A matter of choice Lee, Young and Regan (2008) observe that distracted driving imposes a cost on society. They cite Cohen and Graham (2003) who estimated that cell-phone related crashes represent $43 billion in annual costs for the U.S. The authors however note that some of these costs are probably offset by certain benefits associated with distracting activities. The main argument is that IVIS such as entertainment and information systems, MP3 players, cell phones and navigation systems, can help drivers reduce the experience of monotony, thereby increasing alertness and helping to alleviate fatigue. This is consistent with Williamson (2008), who suggests that limiting access to strategies aimed at gaining stimulation trough the use of distracting activities may not be entirely beneficial since drivers use stimulation to self-manage their level of alertness. This reasoning is also line with the results of the Thiffault and Bergeron (2003a, 2003b) simulator study, where alleviating monotony using visual stimulation in low demanding driving conditions was found to have a significant positive effect on fatigue-related driving performance. It has to be emphasized however that those benefits are only attainable in highly monotonous driving conditions such as rural highways and cannot be generalized to driving in urban settings or in busy traffic on highways. The use of IVIS in busy traffic or urban settings can only add workload to an already demanding task, and necessarily represents additional risk. Creating stimulation to increase alertness is however not the only benefit considered by drivers when opting to engage in a secondary activity while driving. These may include gains such as simply enjoying a phone conversation, using the Internet, sending and receiving emails in order to be productive or getting directions with a GPS navigation system. It has been suggested that the decision to engage in these types of distracting tasks relies on a tradeoff between perceived benefits vs. perceived risks (Lesch & Hancock, 2004; Horey, Lesch & Gabaret, 2008). The authors however note that for a number of reasons, the perceived risk is usually very low and poorly calibrated in terms of actual performance decrements. This would have a negative impact on road safety by increasing the number of drivers who choose to drive distracted, based on these faulty assumptions.
Human Factors in the Motor Carrier Industry in Canada 79
Horrey, Lesch and Gabaret (2009) studied the relationship between drivers’ performance and subjective performance estimates during distracting driving conditions. The results show that performance was more affected when the distracting task was more demanding and when dual task conditions were present. There were however significant dissociations between performance and subjective reports; participants had a propensity to overestimate their performance on more engaging tasks, while in reality it was worse. Also, and more importantly, they were not able to detect fluctuations in single task difficulty while operating in dual task conditions. Globally, the authors concluded that drivers are not aware of their performance deterioration due to distraction and that they tend to overestimate their capacity to multitask, which has an effect on their decisions to engage in distracting behavior and their ability to do so strategically. In another study, Horey and Lesh (2009) observed that although they were made aware of the distribution of road demands along a pre-planned route, drivers did not tend to strategically postpone engaging in distracting tasks when demands were high and rather initiated secondary tasks regardless of conditions. Using the multi-level control model, the authors noted that drivers did not rely on the strategic level to adapt (planning the decision to engage in distracting activities and the timing to do so given road situations), but rather engaged in secondary tasks impulsively and tried to adapt at the operational level by swapping attention between driving and secondary tasks. This strategy was however not effective, as shown by higher error rates and poorer driving performance. Considering these studies, it is evident that most of the time drivers have a choice as to whether or not to engage in distracting activities. Furthermore, they have significant control over the way they do it. The problem seems to be that they are poor judges of the risks associated with these tasks. Consequently, they do not use efficient strategies to mitigate these risks. Perceived risks and benefits therefore appear to be central concepts in the self–management of driver distraction. These processes are fueled by factors such as social and subjective norms (culture), beliefs, attitudes, motivations, personality, perception of own abilities, optimism bias, etc. Investigating how these factors shape the decision to engage in distracting activities while driving is therefore a relevant step in the development of various interventions aimed at modifying drivers’ behaviors with regards to distracted driving. Understanding the factors that condition the decision to use distracting activities while driving for different segments of the population (e.g. young drivers, CMV drivers etc.) can indeed be instrumental in the development of tailored interventions aimed at influencing this decision for these specific groups. As previously mentioned, these choices, which involve making safety concessions for the gains associated with distracting activities, are often made on poorly calibrated assumptions of the risk that they represent. In other words, drivers may choose to make phone calls while driving because they are not fully aware of the negative impacts of these actions on their performance and of the risks associated with this deterioration of their driving skills. In such cases, drivers should be made to understand the dynamics of the processes by which distraction and cell phone use can alter driver performance.
Human Factors in the Motor Carrier Industry in Canada 80
In other cases, drivers may be aware of the risks associated with the activity, but nevertheless decide to engage in it. This situation is likely to be caused by the attitudes, personality dimensions and/or motivations that shape drivers’ intentions to engage in risky behaviors. Interventions aimed at addressing these factors could target the safety culture and drivers’ motivations through safety management practices and enforcement rather than simply creating awareness trough knowledge transmission. Such a tailored approach would be particularly relevant when addressing the problem for a specific population, such as professional drivers in the motor carrier industry. The perceived risks, benefits, attitudes and motivations associated with the use of distractors first need to be assessed, and then a tailored approach can be designed and implemented. A model such as the Theory of Planned Behavior can be instrumental in such a context, as demonstrated by Zhou et al. (2009) who successfully used the theory to investigate the determinants of young drivers’ intention to use cell phones while driving. Note that according to Horey, Lesch & Gabaret (2008) understanding why drivers misperceive the risks associated with distraction can also inform the application of distraction mitigating technologies, since a gap between estimated effects of distraction and actual performance deterioration can play a role in determining users trust and acceptance of these systems. 2.1.3.2 Driver distraction in the motor carrier industry Considering the magnitude of the driver distraction research field, surprisingly little was done to explore the problem in the motor carrier industry. According to Llaneras et al. (2005) and Perrin et al. (2007), commercial vehicles are often the first to adopt on-board safety technologies and the trucking industry is characterized by a widespread use of fleet management devices that have the potential to impact on drivers’ attention. Driver distraction, as it relates specifically to in-vehicle distractors, is therefore an issue that needs to be addressed in this specific context. According to Llaneras et al. (2005), the different types and functions of in-vehicle devices, their placement in the cab, specific tasks related to truck driving, as well as truck driving vehicle control demands create a situation that is distinct from what is experienced by LDV drivers. The authors note that while a lot is known about cell phone use and navigation systems, less research has been conducted on newer devices that present large amount of information in dynamic modes and provide unrestricted access to demanding complex and multistep tasks. There is concern that a widespread use of these devices in the trucking industry could lead to reduced situational awareness, attentional narrowing, slowed reaction times as well as reduced visual search and sampling. The authors warned that these technologies might increase crash risks by encouraging more frequent and lengthy use while driving. In addition, they noted that current trend by designers is to increase the capacity of their systems and the range of tasks that can be accessed while driving. There is therefore a need to monitor the safety impacts of this trend, and this is what they indented to do.

Human Factors in the Motor Carrier Industry in Canada 81
2.1.3.2.1 Llaneras et al. (2005) Llaneras et al. (2005) conducted a study that they describe as an initial step in determining the need for an approach to developing guidelines and standards to limit the exposure of truck drivers to unsafe distraction. Globally, the study aimed at clarifying the magnitude of the distraction problem for truck drivers, comparing the problem for CMV and LDV drivers, examining a sample of in-truck devices in terms of human factors requirements and identifying the need for truck-specific distraction research. To reach these objectives, they carried out driver and fleet interviews, device inventory and analysis and examined industry design and evaluation practices. The results are presented below. The results of the interview process reveal that distraction is perceived as a potential problem, but not to the same degree as other issues, such as fatigue and the shortage of rest areas. While 65% of drivers and safety officers believe distraction is a problem for truck drivers, 91% of them think that the problem is worst for LDV drivers. Basically, it is felt that truck drivers are less susceptible to distraction because of their professionalism, increased safety awareness and driving experience compared to LDV drivers. Truck drivers believe that they know when it is safe to interact with a distracting device, even when the vehicle is moving. Safety officers however pointed out that some drivers hold misconceptions about when it is safe to use distracting devices. Driving demands full concentration, even in situations that appear to be safe, because unexpected events are likely to occur. Safety officers also consider that work pressures may lead drivers to take unnecessary risks and engage in distracting activities such as accessing emails while driving. Furthermore, 82% of them believe that distraction is becoming increasingly worse because drivers have more and more access to distracting technologies (96% use CB, 87% use devices such as Qualcomm text messaging, 70% use cell phones, 26% have access to laptops and 35% to televisions). Regarding Qualcomm text messaging, 13% of drivers simply read messages, but 30% engage in more complex tasks such as sending emails while driving (see figure 13. It is interesting to note that 65% of drivers and 67% of safety officers believe that devices such as cell phones and fleet communication systems are not well designed for use while driving. However, as pointed out by the authors, even though drivers perceive this risk, they are willing to accept it. Furthermore, a majority of drivers (83%) report that they can tell if they are distracted from the primary driving task while using on-board distracting devices. It is interesting to relate this perception with the findings from Horey, Lesch and Gabaret (2009) who observed that even though drivers think they are aware of distraction-related performance degradation, they are in fact poor judges of these variations and consequently tend to overestimate their capacity to deal with distracting activities while driving. It is therefore probable that CMV drivers also underestimate the impact of distraction on their driving performance, which would prevent them from properly adapting and compensating for this degradation.
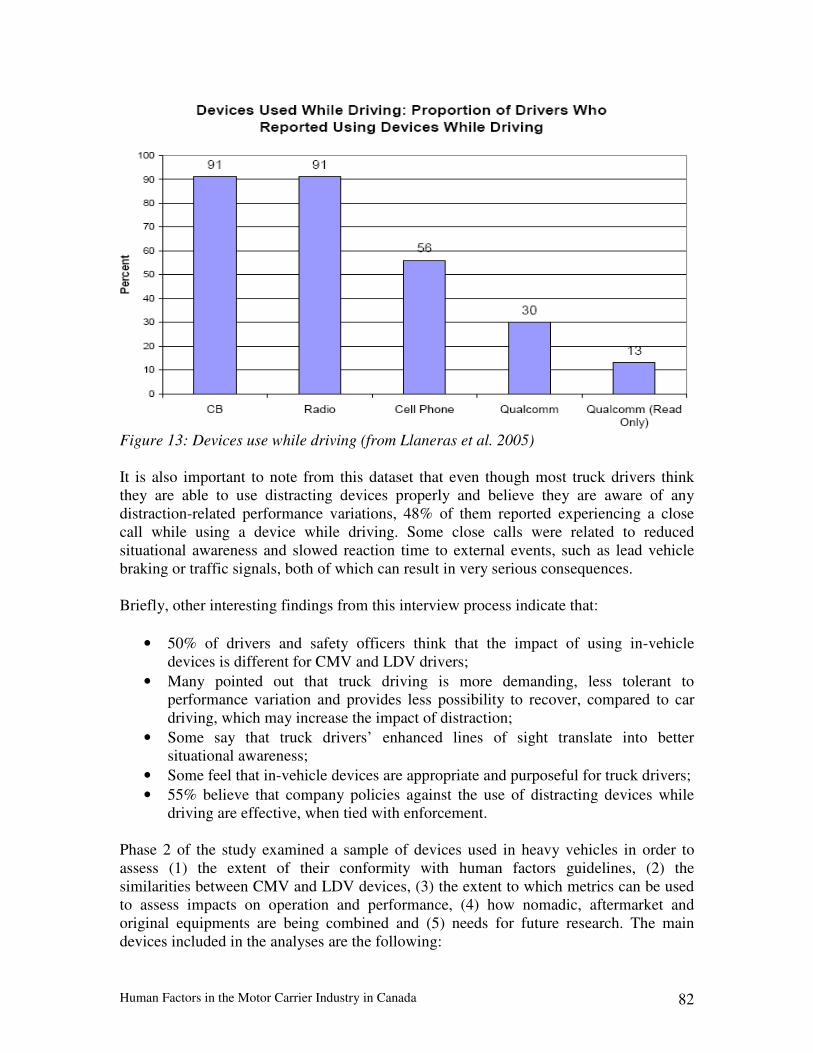
Human Factors in the Motor Carrier Industry in Canada 82
Figure 13: Devices use while driving (from Llaneras et al. 2005) It is also important to note from this dataset that even though most truck drivers think they are able to use distracting devices properly and believe they are aware of any distraction-related performance variations, 48% of them reported experiencing a close call while using a device while driving. Some close calls were related to reduced situational awareness and slowed reaction time to external events, such as lead vehicle braking or traffic signals, both of which can result in very serious consequences. Briefly, other interesting findings from this interview process indicate that:
• 50% of drivers and safety officers think that the impact of using in-vehicle devices is different for CMV and LDV drivers;
• Many pointed out that truck driving is more demanding, less tolerant to performance variation and provides less possibility to recover, compared to car driving, which may increase the impact of distraction;
• Some say that truck drivers’ enhanced lines of sight translate into better situational awareness;
• Some feel that in-vehicle devices are appropriate and purposeful for truck drivers; • 55% believe that company policies against the use of distracting devices while
driving are effective, when tied with enforcement. Phase 2 of the study examined a sample of devices used in heavy vehicles in order to assess (1) the extent of their conformity with human factors guidelines, (2) the similarities between CMV and LDV devices, (3) the extent to which metrics can be used to assess impacts on operation and performance, (4) how nomadic, aftermarket and original equipments are being combined and (5) needs for future research. The main devices included in the analyses are the following:
Human Factors in the Motor Carrier Industry in Canada 83
• AutoVue Lane Departure Warning System • Bendix X-Vision (night vision system) • Delphi Truck Productivity Computer (multi-functional device, similar to the
AutoPC) • Eaton Vorad and Smart Cruise (Adaptive Cruise Control) • Freightliner Driver Message Center • Freightliner Rollover Stability Advisor • Global T-Fleet communications and tracking system • Mack VIP display (multi-functional message center) • MobileMax communications system (text messaging) • Mobuis TTS Onboard Computer • PACCAR Driver Message Center • People Net Wireless Fleet Solutions • Qualcomm Fleet Advisor & MvPC (text-messaging) • VDO FM System • Volvo Driver Information Display & Volvo Link (text messaging)
In brief, the results of these analyses show that there is widespread use of multi-functional devices in the industry, with text messaging and driver communication functions being the most prevalent. It is important to note that many of these multi-functional systems offer the possibility to limit driver interactions with the unit when the vehicle is in motion, for example by locking functions or ordering messages by importance and allowing only urgent messages to be communicated. More important however is the fact that there appear to be no universality in the application of these lockdown features. Given the risk that these devices represent, recommendations should be made regarding the use of these safety features. More precisely, the notion of making the use of lockdown features mandatory should be explored. The authors also observed that most device manufacturers are familiar with standards related to the “physical workspace aspect of design”, but less with those addressing cognitive and attention demands. They note that the industry tends to rely on market research to maximise users’ satisfaction instead of focussing on human factors guidelines to increase the cognitive ergonomy of their products. In conclusion, Llaneras et al. (2005) emphasize that distraction appears to be ranked low as a safety issue for both drivers and safety officers. Most of the fleets contacted have crash investigation mechanisms and the results of their investigations suggest that distraction is not a salient crash causation factor. This is to be expected since there are significant difficulties to assess the contribution of inattention to crashes without using advanced crash investigation techniques, which carriers are not likely to be using (see Gordon 2008). Inattention, as it relates to both fatigue or distraction, therefore often gets underrepresented in crash databases, which is an impediment to the mobilization of resources and interventions, as discussed earlier. The perception by fleets that distraction is not a significant safety issue is just another example of this problem.
Human Factors in the Motor Carrier Industry in Canada 84
Furthermore, the fact that in-vehicle devices are instrumental to the operations of the industry probably impacts on the cost/benefit considerations of fleets. Their crash databases do not imply that there is a problem with in-vehicle devices and they are helpful in their daily operations, therefore no change is required. However, most participants in this study nevertheless believe that distraction from in-vehicle devices could emerge as a significant problem since they are becoming more complex, widely available, and used. Good device design, testing and lockdown policies are all seen as critical steps the industry should take to improve safety. The authors recognize the need to objectively identify the contribution of distraction in crashes and convene the industry to further explore practices and develop evaluation procedures and criteria to assess the suitability of multifunctional systems that are used while the vehicle is in motion. It is important to note that the FMCSA is currently conducting the analysis of more than 20,000 safety critical events collected in naturalistic driving conditions in order to identify secondary tasks and activities that drivers engage into prior to event occurrence. The results of this study will be of great significance for the identification of various distraction types and their associated risks. 2.1.3.2.2 Hanowski et al. (2005) Hanowski et al. conducted a naturalistic study to investigate driver distraction in long-haul drivers. In the course of this study, they analysed the causation of 2737 Safety Critical Events (SCE) experienced by 41 truck drivers. The results indicated that the most important categories of driver error included judgement errors (77%), followed by other vehicle (9.7%) and distraction (6.7%). Specifically, distraction accounted for 178 SCE, involving 33 of the 41 drivers. Distraction was therefore identified as the second most prevalent CMV driver error. Note that two drivers were responsible for 24.2% of the distraction errors, which suggests the fact that individual differences may be an issue. Single drivers were also over-represented, with 115 events out of 178. The analysis reveal 34 different categories of distraction organized into seven clusters (see figure 14). Only four distraction causes were related to work tasks (looking at CB, talking on CB, adjusting CB, looking at paperwork). The other causes included interacting with passengers, eating, adjusting the radio, smoking-related activities, adjusting the seat, cell phone activities (answering, dialing and looking at phone), and personal factors such as grooming (e.g., brushing hair, using a toothpick, rubbing one’s face, etc.).
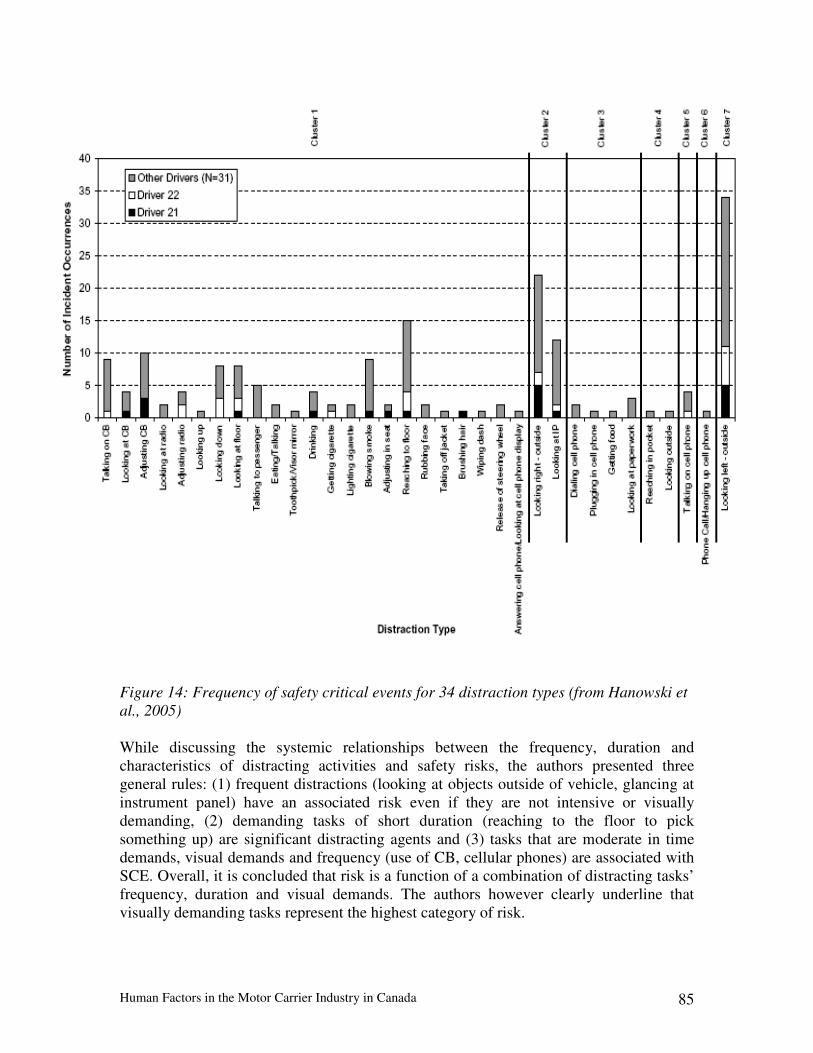
Human Factors in the Motor Carrier Industry in Canada 85
Figure 14: Frequency of safety critical events for 34 distraction types (from Hanowski et al., 2005) While discussing the systemic relationships between the frequency, duration and characteristics of distracting activities and safety risks, the authors presented three general rules: (1) frequent distractions (looking at objects outside of vehicle, glancing at instrument panel) have an associated risk even if they are not intensive or visually demanding, (2) demanding tasks of short duration (reaching to the floor to pick something up) are significant distracting agents and (3) tasks that are moderate in time demands, visual demands and frequency (use of CB, cellular phones) are associated with SCE. Overall, it is concluded that risk is a function of a combination of distracting tasks’ frequency, duration and visual demands. The authors however clearly underline that visually demanding tasks represent the highest category of risk.
Human Factors in the Motor Carrier Industry in Canada 86
2.1.3.2.3 Olson et al. (2009) Olson et al. (2009) emphasize that limitations of previous driver distraction studies have prevented the field from gaining a clear understanding of the problem of distraction for CMV drivers. They observe that previous studies were mainly oriented towards LDV drivers and that most were conducted using police report data, which has severe limitations with regards to assessing the contribution of inattention to crashes. They therefore opted to use two existing naturalistic driving databases (Drowsy Driver Field Operational Test & Naturalistic Truck Driving Study) in order to determine what drivers were doing prior to safety incidents. The objective of the study is (1) to characterize distraction-based SCE, (2) to look at secondary distracting tasks (driving related, e.g., turn signal use, checking mirrors, etc.) as well as tertiary distracting tasks (non driving related, e.g. cell phone use, interacting with dispatching device, etc.) and (3) to classify inattention by conducting eye glance analysis. The analysis considered 4,452 SCE, which were associated with 21 crashes, 197 near-cashes, 3,019 crash-relevant conflicts and 1,215 unintentional lane deviations. A total of 19,888 baseline epochs of normal driving were also included. The SCE were processed by video review and the analysis led to the determination of odds ratio (OR, or the possibility of a crash occurring when comparing the presence of a condition to its absence) and to population attributable risk (PAR, or the incidence of crashes in the population that would be eliminated if exposure was eliminated). In brief, the results of the study indicate that distraction is a very significant safety issue fro CMV drivers. Overall, distraction was involved in 81% of SCE. As can be seen in table 17, texting on a cell phone is an extremely risky activity with an OR of 23. Interacting with dispatching device, using a calculator, looking at a map and dialing on a cell phone are also very risky. The analysis in terms of PAR brings another angle by including the frequency of distracting behaviors. As can be seen in table 18, significant safety gains could be attained by eliminating all non-driving distracting (tertiary) activities. More precisely, significant risks are attributed to the use of dispatching devices, cell phone dialing, reading, texting and using a calculator. Note that texting on a cell phone does not rank as strong as in the OR analysis because it not a frequent behavior. The analysis of visual behavior was conducted by calculating the duration of glances away from the road. The results indicate that drivers were 2.9 times more likely to be involved in a SCE when time with eyes off the road was greater than 2 seconds. Text messaging - the behavior with the highest OR - involved glances away from the road from 4.7 to 6 seconds, interacting with dispatching devices was associated with 4.2 seconds glances, dialing on a cell phone with 3.8 seconds glances, while it was only 1.3 seconds for talking/listening to CB radio.
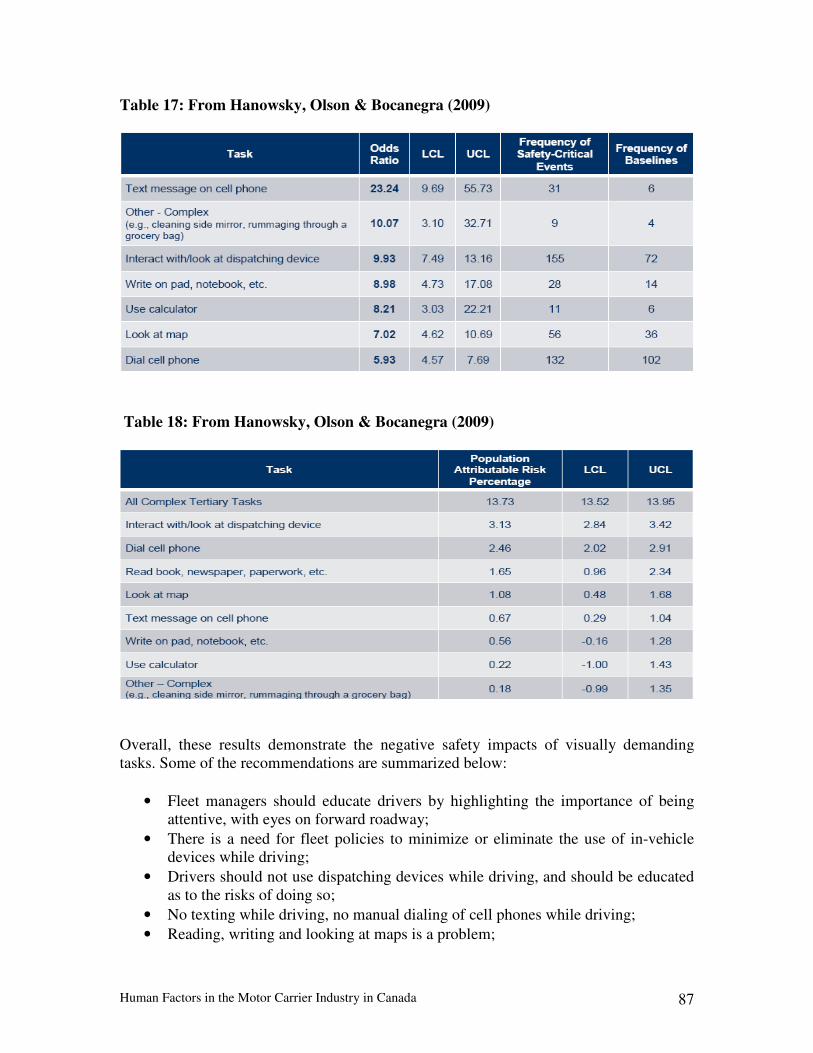
Human Factors in the Motor Carrier Industry in Canada 87
Table 17: From Hanowsky, Olson & Bocanegra (2009)
Table 18: From Hanowsky, Olson & Bocanegra (2009)
Overall, these results demonstrate the negative safety impacts of visually demanding tasks. Some of the recommendations are summarized below:
• Fleet managers should educate drivers by highlighting the importance of being attentive, with eyes on forward roadway;
• There is a need for fleet policies to minimize or eliminate the use of in-vehicle devices while driving;
• Drivers should not use dispatching devices while driving, and should be educated as to the risks of doing so;
• No texting while driving, no manual dialing of cell phones while driving; • Reading, writing and looking at maps is a problem;
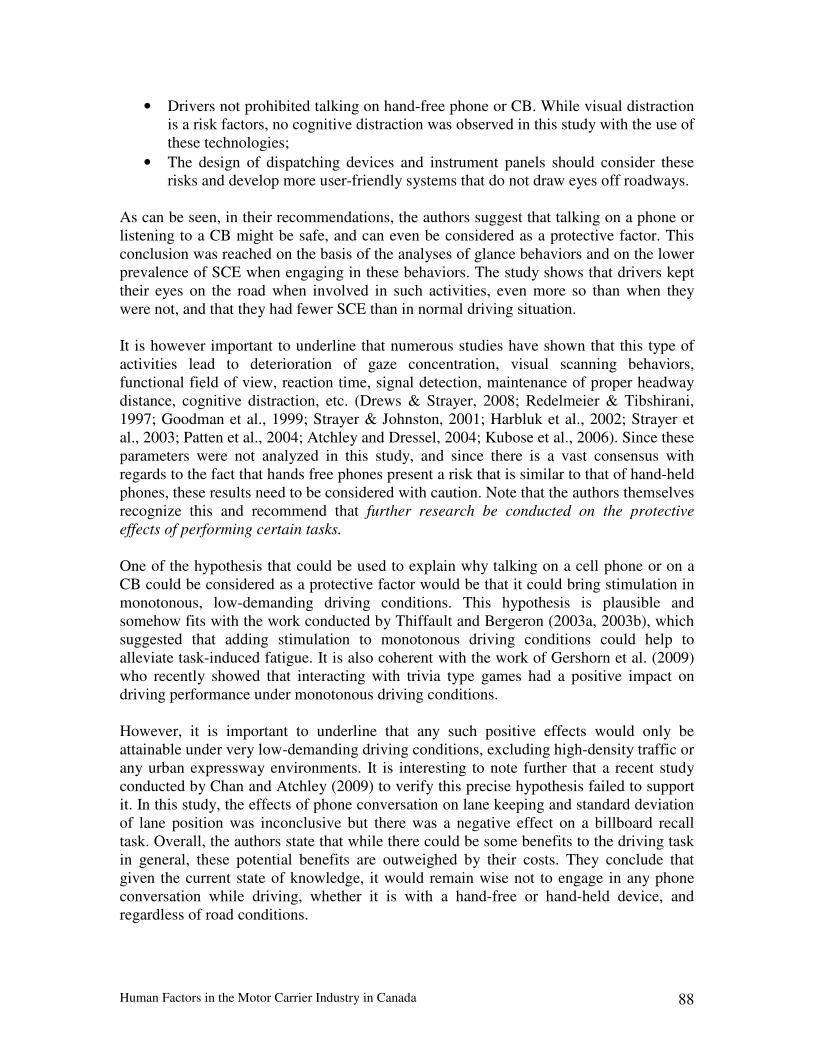
Human Factors in the Motor Carrier Industry in Canada 88
• Drivers not prohibited talking on hand-free phone or CB. While visual distraction is a risk factors, no cognitive distraction was observed in this study with the use of these technologies;
• The design of dispatching devices and instrument panels should consider these risks and develop more user-friendly systems that do not draw eyes off roadways.
As can be seen, in their recommendations, the authors suggest that talking on a phone or listening to a CB might be safe, and can even be considered as a protective factor. This conclusion was reached on the basis of the analyses of glance behaviors and on the lower prevalence of SCE when engaging in these behaviors. The study shows that drivers kept their eyes on the road when involved in such activities, even more so than when they were not, and that they had fewer SCE than in normal driving situation. It is however important to underline that numerous studies have shown that this type of activities lead to deterioration of gaze concentration, visual scanning behaviors, functional field of view, reaction time, signal detection, maintenance of proper headway distance, cognitive distraction, etc. (Drews & Strayer, 2008; Redelmeier & Tibshirani, 1997; Goodman et al., 1999; Strayer & Johnston, 2001; Harbluk et al., 2002; Strayer et al., 2003; Patten et al., 2004; Atchley and Dressel, 2004; Kubose et al., 2006). Since these parameters were not analyzed in this study, and since there is a vast consensus with regards to the fact that hands free phones present a risk that is similar to that of hand-held phones, these results need to be considered with caution. Note that the authors themselves recognize this and recommend that further research be conducted on the protective effects of performing certain tasks. One of the hypothesis that could be used to explain why talking on a cell phone or on a CB could be considered as a protective factor would be that it could bring stimulation in monotonous, low-demanding driving conditions. This hypothesis is plausible and somehow fits with the work conducted by Thiffault and Bergeron (2003a, 2003b), which suggested that adding stimulation to monotonous driving conditions could help to alleviate task-induced fatigue. It is also coherent with the work of Gershorn et al. (2009) who recently showed that interacting with trivia type games had a positive impact on driving performance under monotonous driving conditions. However, it is important to underline that any such positive effects would only be attainable under very low-demanding driving conditions, excluding high-density traffic or any urban expressway environments. It is interesting to note further that a recent study conducted by Chan and Atchley (2009) to verify this precise hypothesis failed to support it. In this study, the effects of phone conversation on lane keeping and standard deviation of lane position was inconclusive but there was a negative effect on a billboard recall task. Overall, the authors state that while there could be some benefits to the driving task in general, these potential benefits are outweighed by their costs. They conclude that given the current state of knowledge, it would remain wise not to engage in any phone conversation while driving, whether it is with a hand-free or hand-held device, and regardless of road conditions.
Human Factors in the Motor Carrier Industry in Canada 89
2.1.3.2.4 Distraction in the LTCCS Given the above-mentioned subtleties with regards to the definition of driver distraction and that distraction is related to fatigue and inattention, it is difficult to get a clear understanding of LTCCS data concerning these issues. In brief, as stated in the report to congress the data show that: In all the crashes:
• Inadequate surveillance by the truck driver is involved in 13.2% of cases; • Inattention by the truck driver is involved in 8.5% of crashes; • External distraction for the truck driver is involved in 8% of the cases.
In multiple-vehicle crashes involving a truck and a car:
• Inadequate surveillance is an associated factor in 15.8% of cases for CMV drivers and 13.2% for LDV drivers;
• Driver inattention to driving is an associated factor in 8.5% of cases for CMV drivers and 9.2% for LDV drivers;
• External distraction is an associated factor in 7.7% of cases for CMV drivers and 5.6% for LDV drivers.
With regards to the supplemental analysis that were presented by Craft in 2008, inattention, external distraction and internal distraction ranked 5, 6 and 7 in terms of their relative probability of being critical reasons for crashes (see table 1). Further, inattention ranks fifth in the top 8 causative factors, after following to closely, illegal manoeuvre, inadequate surveillance and driving too fast for conditions. 2.1.3.2.5 Other studies Looking at a database of CMV collisions that occurred between 1998 and 2003 in the US, Bunn et al. (2005) reported that fatigue and distraction were strongly associated with fatal crashes: drivers who were fatigued were 21 times more likely to be involved in a fatal crash, compared to 3 times more likely for drivers who were distracted/inattentive. Barr, Yang and Ranney (2003) reported the results of a naturalistic driving study designed to study truck drivers’ distraction problems. Analyses were made of 121 hours of video data, which resulted in the identification of 4329 distraction episodes. The authors noted that drivers were engaged in distracting activities for as much as 52% of driving time. Distracting events included personal activities such as scratching one’s heads, yawning, coughing, eating, drinking, smoking and grooming. The data revealed that drivers spent almost 50% of their driving time engaged in talking, eating, drinking, or smoking. Activities reducing the amount of time spent looking at the road also included adjusting the radio, interactions with passenger and cell phone use.

Human Factors in the Motor Carrier Industry in Canada 90
In a simulator study, Chen et al. (2006, see Salmon et al. 2008) investigated the effects of cell phone use and wireless communication devices on bus driver performance. The results show that both devices increased drivers’ response times to sudden events, such as when a lead vehicle brakes suddenly. Salmon, Young and Regan (2008) investigated distraction amongst urban transit bus drivers. The authors emphasized the need for this research because most distraction research has been conducted on LDV drivers and what little had been done that was done on heavy vehicles focused on long-haul drivers. Furthermore, they observed that working in urban transit bus operations generates great potential for distraction. On top of the distractions associated with conventional driving, bus drivers also face many additional attention-demanding tasks (selling tickets, communication with control operations, monitoring passengers), which often involve interacting with non-driving devices such as ticket machines, communication technology (radio, cell phones, etc.) and passengers. Distractions were organized into categories and 51 specific sources were identified, of which 15 were classified as instances where drivers engaged in violational (prohibited by the company) activities such as cell phone use. Overall, the authors concluded that bus driver distraction is a significant road safety issue that should be addressed. Distraction sources related to violational activities could be mitigated though the development and strict enforcement of company rules and regulations. Training and procedural design could help in reducing interactions with distraction sources. Ergonomic bus cabin designs that remove distractors could also be considered. 2.1.4 Distraction countermeasures and research needs There has been a lot of discussion in the literature about interventions to mitigate driver distraction. However, contrary to the situation with regards to fatigue, less was produced to address the within the motor carrier industry specifically. Looking at the body of material, interventions can be organized under two broad categories: strategies targeting drivers and strategies targeting distractions sources per se. 2.1.4.1 Interventions aimed at drivers As stated in NHTSA (2009) Countermeasures that work document, driver distraction, like fatigue, is in large part the result of lifestyle patterns and choices and can be considered as a social/cultural problem. While self-management of alertness is key to reducing driver fatigue, self-management of attention is a cornerstone of distraction mitigation strategies. Drivers need to be persuaded to pay attention to their driving and to stop taxing their resources with unnecessary secondary tasks while the vehicle is in motion. This is however difficult since drivers consider most distracting subtasks (eating, drinking, adjusting radio/MP3/cd player, talking/texting on cell phones, etc.) as important activities with significant benefits that they are not likely to want to give up. In the case of CMV drivers, the problem is even more serious since interacting with telematics and on-board safety systems has become part of the job.
Human Factors in the Motor Carrier Industry in Canada 91
There are many ways to convince drivers to change their behaviors. The success of these different approaches partly relies on their capacity to factor-in the reasons why drivers are engaging in the behavior and to target the behavior while considering its underlying mechanisms and its true meaning, or function, for the individual. In general, tailored interventions that consider the dynamics of behaviors and the characteristics of high-risk populations will be more effective than global generic approaches aimed at all drivers. As an example, using a cell phone for talking or texting while driving may have different significance, or serve different functions, for different individuals. It can be related to a lack of understanding of the mechanisms of driver distraction, to poorly calibrated risk perception, to risk-taking tendencies, to anti-social attitudes and/or to job-related needs. Although the resulting behaviors appear similar on the surface, from a psychological point of view these are essentially different behaviors with different intentions. As such, they call for different mitigating strategies, at least when considering driver-oriented interventions. It therefore appears important, when developing interventions aimed at a specific behavior for a specific population (e.g. use of cell phone in the motor carrier industry), to first assess the meaning of the behavior in this specific context. Once this assessment is done, program developers are provided with a more detailed understanding of the phenomenon, informed about its underlying mechanisms and about the different levers that are likely to influence it. The first recommendation therefore with regards to driver distraction for CMV drivers is that research be conducted to study the determinants of driver distraction in the motor carrier industry. In brief, a study looking at drivers’ attitudes, motivations, risk-perception and risk-taking tendencies in relation to the use of in-vehicle distractors would help determine why drivers engage in these secondary tasks, which could in turn inform the development of tailored mitigating strategies in key areas, including enforcement, education and training. Before discussing different driver-oriented intervention options, it is relevant to briefly define central psychological factors and how they can be influenced. Note that most of these concepts will be described at length in the upcoming section on decision errors and high-risk behaviors.
• Attitudes refer to the positive or negative values associated with a specific behavior by the individual. They are strongly conditioned by socio-cultural pressure, education and life experience. Attitudes can therefore be influenced by education, training, cultural changes and the positive/negative consequences of behaviors that can be created by safety programs and/or enforcement.
• Motivation is the driving force of behavior. It represents an underlying drive by
which behavior is directed to attain specific objectives. As such, motivations are directly related to the needs that the behaviors are aiming to satisfy. Motivations can therefore be influenced by manipulating the needs associated with the
Human Factors in the Motor Carrier Industry in Canada 92
behavior, by removing the possibility of this behavior to fulfill these needs, or by increasing its efficiency in doing so. For example, if drivers are paid by the mile, they might be motivated to drive faster because financial resources, which are related to their primary needs of subsistence and security, are tied to driving speed. By changing the way drivers are paid (e.g. annual salary), driving faster would not be perceived as beneficial therefore driving speed would likely be related to other factors, such as attitudes, personality, or simply comfort. Motivations can therefore be influenced by the macroergonomic structure of the motor carrier industry and by manipulating the positive or negative consequences of the behavior through specific remuneration options, company safety programs and/or enforcement.
• Knowledge refers to drivers’ understanding of the processes and dynamics
involved in driving and of their specific impacts on safety. It is widely accepted today that imparting knowledge is important but education strategies only aimed at transmitting factual information have limited impacts if other stronger behavioral determinants are at work. For example, a driver may be well informed about the dangerousness of a behavior but still be inclined to engage in it because of positive attitudes towards the behavior and/or motivations to attain specific gains. Knowledge is also related to skills. Indeed, drivers can be trained to properly execute tasks such as dealing with multiple sources of information at the same time. Overall, education should be considered an important component of a comprehensive multifaceted approach, but should not be used in isolation.
• Personality refers to global inclinations of an individual towards groups of
behaviors and lifestyles. Some are closely related to physiological roots (e.g. need for stimulation, extraversion and sensation seeking), others condition individual styles in interpersonal relationships (trait anger, anti/pro-social tendencies, social deviance, etc.) and many impact on high-risk behaviors while driving. Note that personality traits can hardly be changed via external interventions. They however establish the meaning or the function of behaviors for an individual and can be used to define high-risk groups as well as to develop tailored approaches to communicate with them and to try to impact on their behaviors. Furthermore, while personality traits per se are not the object of interventions, the attitudes and motivations towards high-risk behaviors that are associated with each of these different personality dimensions can be changed and therefore represent legitimate targets. In road safety, the most relevant personality traits to consider are traditionally sensation seeking and aggressiveness.
• Risk perception refers to subjective estimates of the dangerousness of a
situation or activity. It is a combination of the assessment of objective risk and of one’s ability to manage it. Risk perception calibrates risk-taking processes and is therefore central to decisions to engage in high-risk behaviors and high-risk driving. A driver with inadequate risk perception abilities, for example
Human Factors in the Motor Carrier Industry in Canada 93
because of a lack of experience or optimism bias, will fail to properly adapt when faced with high-risk situations. Risk perception can be modified by training. Computer-based approaches and driving simulators have proven to be efficient in this regard.
In view of the above, driver-oriented interventions to address the problem of driver distraction could legitimately target attitudes, motivations, knowledge, personality and risk perception. Interventions could be aimed at these determinants individually, or an approach could target many processes at the same time. However, as stated earlier, it is important to first empirically assess the nature of the problem before developing a strategy. Is the problem one of attitudes, motivations, knowledge, risk-taking tendencies and/or improper risk calibration? Once this is known, a more efficient risk-based approach can be put in place. While some relevant information can be found in the literature concerning with general road users, an investigation targeted specifically at CMV drivers in Canada is warranted. 2.1.4.1.1 Education and training Regan, Lee and Young (2008a) analyzed the potential of education and training to address driver distraction. Referring to data collected by Mayhew and Simpson (2002), they suggest that drivers have a poor understanding of the risks associated with sources of distraction, of the impact of distraction on performance, of the mechanisms that mediate these effects and of the need to self-regulate attention while driving. Consequent to their review, the authors observe that there appears to be a paucity of material addressing driver distraction in driver education and training programs, even though the management of distraction by drivers can be regarded as an ability that can be developed and improved through education and training. Although the evidence that driver education has positive impacts on safety is inconsistent, studies have shown that targeting specific skills critical to safe driving is indeed effective in improving these skills. In their discussion, Regan, Lee and Young (2008a) use the Goals of Driving Education (GDE) matrix as well as the multilevel control model (described earlier) to identify areas of operational, strategic and tactical control levels where education and training can be instrumental to address driver distraction. Note that both these models refer to the notion of a hierarchy of functions and processes, ranging from micro tasks like vehicle manoeuvring to macro concepts such as life goals and the influences of attitudes, values, lifestyles, motivations, personality, etc. Table 19 (from Regan, Lee and Young (2008a, who adapted it from Hattaka et al. 2003) illustrates how the GDX matrix can be used to identify skills and competencies that can be targeted through driver education and training.
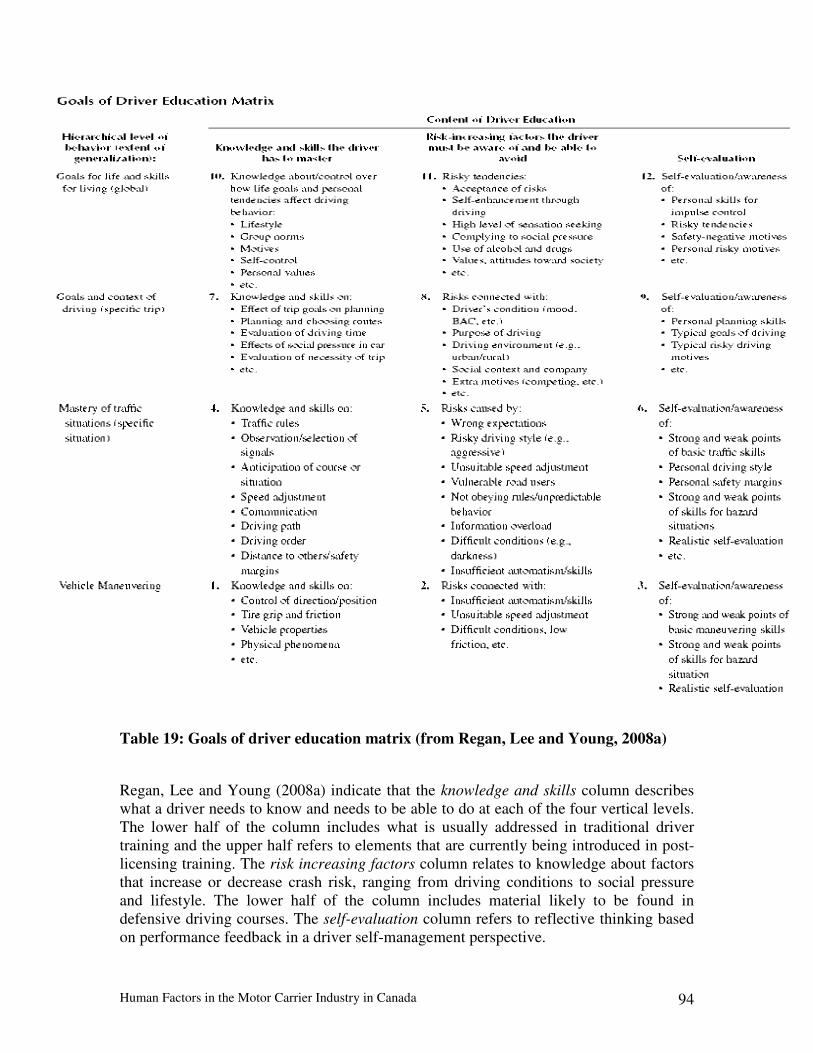
Human Factors in the Motor Carrier Industry in Canada 94
Table 19: Goals of driver education matrix (from Regan, Lee and Young, 2008a) Regan, Lee and Young (2008a) indicate that the knowledge and skills column describes what a driver needs to know and needs to be able to do at each of the four vertical levels. The lower half of the column includes what is usually addressed in traditional driver training and the upper half refers to elements that are currently being introduced in post-licensing training. The risk increasing factors column relates to knowledge about factors that increase or decrease crash risk, ranging from driving conditions to social pressure and lifestyle. The lower half of the column includes material likely to be found in defensive driving courses. The self-evaluation column refers to reflective thinking based on performance feedback in a driver self-management perspective.

Human Factors in the Motor Carrier Industry in Canada 95
In the paper, the authors make suggestions as to what can be done in terms of training and education for each cell of the table. They also recommend that drivers be made to understand what can be done at the operational, tactical and strategic levels to mitigate driver distraction. Given the fact that there are no empirical evaluations of the efficiency of education and training to address driver distraction, the authors specify that these proposals come from their professional judgment, based on the actual status of science in this field. They also observe that the paucity of evaluation studies prevent them from identifying which of the proposed initiatives is likely to be the most efficient. They do however suggest that the competencies higher in the hierarchy of the GDE matrix and the multilevel control model - which are the least developed and researched – are the ones that are likely to have the greatest influence. The authors highlight that the skills lower in the hierarchy are exercised under the guidance of higher levels goals and motives. This is coherent with the views of Lee et al. (2008) who underlined that changes in societal norms that influence the strategic level and make driver distraction taboo could be more influential than technical interventions aimed at the distractors per se. Overall, the key message is that it appears legitimate to target high-level determinants of driver distraction in a comprehensive strategy to address this problem. It is further recommended to supplement education and training by creating public awareness campaigns aimed at increasing drivers’ understanding of the driver distraction problem as a whole, the relative risk of specific distracting activities as well as the risk and protective factors. The authors also note that it would be important to raise employers’ awareness of the tools available to them to limit employees’ exposure to distraction while driving company vehicles. Finally, the results from Horrey et al. (2009), Lesh and Hancock (2004), Nelson et al. (2009) and Wogalter and Mayhorn (2005) suggest that drivers decide to engage in distracting activities while driving because they fail to realize that their performance is degraded, or because they are overconfident about their abilities to deal with these tasks while keeping a safe level of performance. These concepts relate to the notion of risk perception, which will be presented at length in the section on decision errors. It is however important to note here, as indicated by Horrey et al. (2009), that improper calibration of risk can be corrected by training programs focused on helping drivers to pay more attention to their driving performance, in order to recognize dangerous performance fluctuations while engaging in distracting activities. Horrey et al. (2009) however also observe that drivers may continue to perform distracting activities while driving even if their risk perception is perfectly calibrated. In this case, the issue would be one of risk tolerance, or risk-taking, rather than risk perception. Thus, while some drivers indeed engage in high-risk situations because they are not able to decode the level of risk and consequently fail to adapt, in other cases the risk is well decoded but nevertheless tolerated, or even sought by the individual, because of specific attitudes, motivations or personality dimensions. These factors can be targeted trough fleet safety programs and enforcement.
Human Factors in the Motor Carrier Industry in Canada 96
2.1.4.1.2 Fleet management of driver distraction
Regan, Young and Lee (2008a) emphasized that 50% of work-related fatalities in Australia are road crashes and that about 25 % of all crashes there involve business vehicles. They suggested that this situation is similar in most developed countries. In this paper, the authors discuss driver distraction mitigation approaches that can be implemented through fleet management practices. Globally, the assumption is that fleet owners and employers have responsibilities towards their drivers’ safety. It is also emphasized that they are in a perfect position to develop and implement policies that limit exposure to distractions while driving, or to purchase vehicles that are designed to minimize driver distraction. In terms of road safety interventions, there is a lot more that can be done with professional drivers than with general road users. CMV drivers are regulated and their safety performance is monitored. They are involved in company structures where safety programs and enforcement algorithms can be used to modify driving habits and behaviors. Examples of fleet-based distraction mitigation strategies are discussed below. Considering the multilevel control theory, Regan, Young and Lee (2008a) note that employers can influence drivers at the strategic level by limiting the availability of distracting technologies and devices to employees and reducing productivity pressures to use mobile phones on the job. Employers can also have an impact at the tactical level through education and training by teaching drivers how to self-regulate behavior in response to driver distraction and they can have an effect at the operational level through the provision to drivers of vehicles equipped with technologies designed to minimize distraction. Regan, Young and Lee (2008a) note further that employers have a captive audience to whom a wide range of interventions can be applied:
• Exposure control: company regulations prohibiting the use of certain technology while driving (e.g. cell phones);
• Crash prevention: on-board distraction mitigation technology; • Injury control: passive safety features; • Behavior modification: education and enforcement of company regulations; • Postinjury control: automatic crash notification systems.
The authors provide a comprehensive list of recommendations to mitigate driver distraction from a fleet perspective. These recommendations are organized as responsibilities, company policies and licensing. Below is a summary:
• With regards to responsibilities, governments should play a leading role in providing fleets with guidance on (1) strategies that can be adopted, (2) legal responsibilities/liabilities related to driver distraction and (3) product information to stimulate the purchase of vehicles and nomadic telematics devices that minimize distraction.
Human Factors in the Motor Carrier Industry in Canada 97
• It is recommended that companies develop evidence-based policies to address driver distraction. Employees should be provided with guidance as to when it is acceptable to engage in distracting activities and when it is prohibited. Drivers should also be made to understand the legal implications, as well as company penalties for violations and/or incentives for compliance. Policies should detail the risk associated with the different types of distractors and provide guidance as to how they can be mitigated. Companies should implement systems to properly quantify the contribution of distraction to safety incidents. The efficiency of policies should be monitored with proper safety indicators. In general, policies should aim to limit exposure to distractors by means of enforcement, either by penalties for failing to respect the rule or by incentives for compliance.
• Education should be used in parallel with policies to explain the company
approach while covering different aspects of the problem (risk and mediating factors, self-management strategies, regional legislations, etc.). In terms of company training, knowledge and skills should be developed regarding mobile phone features (voice recognition), proper use of vehicle technologies and nomadic telematics devices in order to minimize distraction, optimal modes of self-regulation (slowing down, increasing following distances etc.), self-awareness of performance degradations given different distracting activities, etc.
2.1.4.2 Interventions aimed at distractors The above-mentioned initiatives were mainly concerned with changing drivers’ behaviors with regards to exposure to distractors. Interventions aimed at distractors per se will be reviewed in the following section. The study from Llaneras et al. (2005) indicated that most CMV telematics device manufacturers are familiar with standards related to the “physical workspace aspect of design” but less with those addressing cognitive and attention demands. It appears that industry relies on market research rather than focussing on human factors guidelines. Since such guidelines and performance standards do exist, there is a need to promote a series of measures that would prompt the industry to consider the potential for distraction as a central factor in the development of telematics devices. There has been a lot of research on the distraction potential of in-hand and hand-free cellular phones and the risks associated with their use are now understood. The field is however faced with new challenges related to the rapid increase of various information technologies on board vehicles. As summarized by Hedlund et al. (2006), these challenges relate to the fact that (1) telematics devices are becoming multifunctional, (2) devices are becoming increasingly portable (nomadic) and individuals bring communication and entertainment technologies on board vehicles, (3) the industry is diverse, ranging from original manufacturers’ equipment (OEM) to aftermarket and consumer electronic industry, which does not fit with the traditional regulatory structure and (4) products are developed and introduced in the market very rapidly. Accordingly, there is a need to assess the distracting potential of new technology and take proactive steps to prevent it from increasing crash risk while preserving its potential benefits (Hedlund et al., 2006).

Human Factors in the Motor Carrier Industry in Canada 98
According to Regan, Victor, Lee and Young (2008) there are two main avenues for countermeasures addressing distractors: they can be aimed at the design phase of telematics products or they can be carried out by distraction mitigation on-board systems. The key to design-phase countermeasures is to influence design processes so that systems are created as to minimize distraction. The questions of who designs these systems and how their distraction potential is evaluated are therefore central issues to consider. Citing Stevens (2008), Regan, Victor, Lee and Young (2008) note that multiple individuals and organizations may be involved in the design of systems and that therefore these designers and organizations need to be considered as legitimate targets for countermeasures. Peter Burns from Transport Canada operates in the field of driver distraction. In 2009 he presented a summary of his team’s activities at La Table Québécoise de la Sécurité Routière du Québec. Since the content of this presentation is directly related to interventions aimed at distractors, the following provides a high-level summary of this communication. Burns first noted that providing the industry with guidelines and standards is a key countermeasure for the design-phase of telematics systems. As he described, there are three types of standards: design standards (precise system specifications), performance-based standards (system minimum level of performance when tested with a specific prescribed method) and process-oriented standards (processes that should be followed during development/implementation cycle). Design standards provide basic principles to help designers reduce distractions. Examples of such include principles to protect performance, to set basic restrictions (e.g. lockdown mechanism while vehicle is in motion) and to ISO standardization processes. Burns also notes that design standards may limit innovation, that complex devices may require many standards and that standards need to be updated as technology evolves. Available standards include the European statement of principles (ESOP, 2005), the standard from the Japanese Automobile Association (JAMA 2, 2004, see Akamatsu, 2008) and the standard from the Alliance of Automobile Manufacturers (AAM, see Green, 2008). Performance standards impact on product development processes. Performance is used to determine if specific targets are being achieved. Testing is therefore paramount during development stages as well as to ensure regulatory compliance. The key is to determine if a product is safe for driving or not. Such testing however requires assessment methods that are practical, meaningful and repeatable, and there is currently no such standard assessment method available. Burns nevertheless provides examples of performance measures that can be used, focussing on secondary task performance, driver assessment, performance assessment and surrogate performance measurement. In terms of process or human factors process standards, Burns notes that the emphasis is on product design and development processes rather than on the end product per se. These standards include requirements for organizations to consider driver distraction as a priority while designing and developing telematics. They promote a comprehensive, systematic and traceable application of human factors considerations throughout the whole project cycle. These processes are already in use in the industry, however there is now a need to extend their focus to the safety and usability of telematics devices.

Human Factors in the Motor Carrier Industry in Canada 99
Burns also presented the underlying principles of the AAM’s voluntary best practices manual to address the safety aspects of drivers’ interactions with telematics devices, as well as a the results of an evaluation of these principles that was conducted by TC (Go et al., 2006). A consultation process was also conducted by TC to outline public concerns about driver distraction, obtain detailed information on what industry is currently doing, and identify potential leads for countermeasures (Rudin-Brown, 2005). In brief, the public believes that (1) research and testing of telematics should be an ongoing process, (2) government should not assume that drivers use telematics properly, (3) a broad awareness campaign should be undertaken, and (4) a purely voluntary approach by the industry does not seem sufficient but a regulatory approach might be premature at this stage. Thus, it was recommended by TC that a cooperative approach, based on the signing of a Memorandum of Understanding (MOU) between industry and the government should be adopted. The industry was positive with respect to the MOU option and suggested that public awareness initiatives should be conducted regarding distraction as a whole, with a specific focus on in-vehicle telematics. Industry also advocated for more scientific research, particularly on the impact of telematics on collision frequency. After these consultations were conducted, establishing a MOU was made a priority at Transport Canada. Burns however notes that despite intensive efforts, the MOU failed to materialize. Transport Canada proposed statements of scope for key issues, basic design principles and safety design process for limiting driver distraction. The industry expressed a preference for self-regulation (status-quo) and leaned towards performance-based requirements for telematics. Further, they were not interested in applying a Safety Management System (SMS) approach to the issue, sought harmonization with the U.S. and deemed the aftermarket consumer electronics industry (nomadic devices) to be the real problem. When consulted, representatives from this industry expressed that they were not aware of the Alliance’s activities with regards to cognitive ergonomics of telematics devices, that they preferred the warning labels approach and that nomadic devices introduce safety issues that are different from that of OEMs. In his conclusions, Burns underlines that driver distraction is a significant road safety issue and that public concern is increasing in parallel with increased exposure to distractors. Interestingly, he suggests that Canadian drivers falsely believe that in-vehicle devices have been tested and deemed to be safe, and notes that Canadians expect government to protect them from unsafe technologies. He further points out that there is currently no standard tests to assess distraction potential of devices but recognizes that feasible and effective countermeasures for driver distraction do exist. Finally, Burns recommends that the following actions should be undertaken (note that these recommendations relate to the general driver population):
• Ask OEM to describe their efforts to limit distraction on their products; • Continue research on distraction assessment methods for devices; • Monitor technology trends and distraction risks;
Human Factors in the Motor Carrier Industry in Canada 100
• Participate in international harmonized research and standards development; • Discuss and collaborate with the US on distraction research and policy
development; • Continue to evaluate new crash avoidance technologies (e.g., lane-departure
warning systems, intelligent speed adaptation); • Continue to monitor cell phone use rates; • Large-scale field study of driving behavior (naturalistic driving) to collect
exposure data and identify pre-crash factors; • Monitor and evaluate the impact of cell phone legislation and enforcement; • Monitor public opinion, attitudes and behavior regarding the issue of driver
distraction on a regular basis; • Identify distraction, and source of distraction, as a contributing factor on collision
reporting forms; • Raise public awareness and understanding of the risks of distraction; • Inform road users, and new drivers, on how to avoid being distracted - include a
section on distracted driving in driver’s licence manuals and testing; • Encourage employers to adopt policies for their employees to reduce potential
driving distractions; • Promote efforts to keep distracted drivers safe
o Behavior - e.g., speed enforcement o Vehicle - promotion of vehicle safety features (e.g., ESC) o Infrastructure – e.g., rumble strips
• With TC and provinces, ask the aftermarket and consumer electronics industry to describe what they are currently doing to limit distraction on their products.
2.1.2.4.1 Distraction mitigation technologies Engström and Victor (2008) reviewed the field of real-time distraction countermeasures. The authors note that traditional avenues to address driver distraction primarily focus on drivers (e.g. raising public awareness of risks) or distractors (optimizing the design of in-vehicle systems to reduce potential for distraction). They however underline that a third option is currently being developed with real-time distraction countermeasures (RDCs). RDCs can be seen as driver support systems that would intervene earlier in the crash causal chain than other technologies such as lane-keeping support and forward collision warnings. RDCs aim to prevent or mitigate distractions that might lead to crashes.
“If recent conclusions are correct regarding the impact of inattention to the forward roadway on traffic safety, then RDCs certainly offer huge potential to save lives.” P. 480
Engström and Victor make the distinction between two categories of RDCs: real-time distraction prevention systems (or workload managers - WM) and real-time distraction mitigation. While WM aim to prevent distraction from occurring by prioritizing and scheduling the delivery of system-related information according to current driving situation and driver state, distraction mitigation systems aim to deal with distraction when it occurs, by redirecting attention towards important aspects of the task.
Human Factors in the Motor Carrier Industry in Canada 101
WM systems help manage or prevent workload peaks that are created when heavy driving task demands coincide with high non-driving task demands. The authors note that drivers normally tend to adapt to workload peaks (e.g. slowing down, stop talking), but since they are poor judges of task demands, these adaptation efforts are often not sufficient. They also note that secondary tasks tend to create a psychological attraction, making it difficult to resist engaging in them (e.g. answering the phone). WM would prevent this situation from occurring by stopping secondary tasks from interfering during risky-driving situations. WM functions include scheduling of information transmission; they assure that drivers receive only needed information and only when they have the capacity to do so. A good example is the delaying of an incoming phone call or email in the middle of a busy intersection. WM can execute lockdown functions, which involve completely disabling functions pending certain conditions. It is also possible to alter the format under which the information is communicated on the basis of the characteristics of the situation (e.g. use an auditory message in highly visually loaded contexts). Visual distraction alert system is a good example of distraction mitigation functions: the system helps the driver realize he is gazing away from the road. Since it warns drivers of inappropriate visual activities, it could also be a good training tool for the self-regulation of attention. As reviewed by Engström and Victor, several studies show high user acceptance for RDC functions, and driving performance improvements have been observed with workload managers (see Rimini-Döring, 2007). With regards to distraction mitigation systems, the results of evaluations show safety-enhancing effects on visual time-sharing but no clear improvements in terms of driving performance. The authors indicate that this latter result is probably related to methodological difficulties in the studies. They also note that it does not take into account the potential long-term effects that these distraction feedback systems can have on drivers’ behaviors. Given their training potential, they may indeed change the way drivers engage in distracting activities while driving. Further research is needed in this respect. The authors conclude that RDCs represent a very active but somewhat immature research field. They recommend the use of data from naturalistic driving studies to analyse distraction-related safety critical events and identify the RDC functions with the greatest potential. They also recommend the use of large-scale field operational tests to investigate further the potential of these systems. Overall, it is understood that RDCs represent a valuable complements to driver-oriented and distractors-oriented countermeasures (as reviewed above), but that more work is needed to identify the functions that would have the largest impacts on safety and to develop efficient systems that would provide these benefits with a maximum of comfort for drivers. Hodges (2008) provides examples of RDC systems that are currently being deployed in the motor carrier industry. The article describes how a known truck manufacturer began using lockdown features on dashboards in 2005. The author notes that modern trucks are fully wired and that an increasing amount of information is being made available to drivers. There is therefore a need to prioritize what is communicated and when:
Human Factors in the Motor Carrier Industry in Canada 102
“Dashboard simplification is not a matter of fewer bells and whistles but of better choices about what is shown and when.”
In the example described by Hodges (2008), lockdown features are used so that only essential information (e.g. gear selection, real-time fuel economy, malfunction warnings) is presented while the vehicle is in motion. Once stopped, the driver can access more than 73 items, from diagnostics to vehicle parameters. Hodges also describes an OEM’s effort to design proper systems to transmit information, with a preference for using a simple screen behind the steering wheel rather than pull-down menus and heads-up displays, which are more distracting. There also appears to be a significant push to make on-board communication devices more user-friendly and less distracting. Systems such as Qualcomm’s Omni-Vision computer are opting for auditory turn-by-turn information. Other companies are considering motion disablement of functionalities such as full-text display of messages and navigation details. Overall, these advances are encouraging since they indicate a push from industry to incorporate human factors considerations in the development of telematics. However, the significance of this trend, the extent to which human factors are integrated in design and the processes by which devices are tested is unknown and should be investigated further. 2.1.4.3 US developments In 2009, US Transportation Secretary Ray LaHood generated a significant push towards a culture change with regards to distracted driving. The USDOT Distracted Driving Summit that was held in DC - with 300 invited guests and 30,000 participants via webcast – was aimed at reviewing issues related to data and definitions, risk assessment, impact of technology and impact of awareness campaigns. The summit resulted in many action items, some of which are summarized below:
• Obama executive order banning all text messaging by four million federal employees while they are driving government vehicles or on official government business;
• As off January 26, 2010, texting prohibited by CMV drivers, including buses; • Restriction of the use of cell phones by truck drivers and interstate bus operators; • USDOT currently working on rules to restrict use of electronic devices by rail
operators; • Revoke commercial licenses for school bus drivers convicted of texting while
driving; • Call on state and local government to make distracted driving part of their state
highway plans and to pass laws against distracted driving in all types of vehicles, particularly school buses;
• USDOT release sample legislation to encourage states to adopt tough distraction laws (30 states so far have enacted texting ban, 5 states enacted ban of handheld devices while driving);

Human Factors in the Motor Carrier Industry in Canada 103
• Encourage states to use high visibility enforcement (STEP programs - increased enforcement combined with public service announcements and evaluation of impacts);
• Launch of NHTSA’ phone in one hand, ticket in other STEP program; • Working with advocates and industry groups to change culture and mark this
behavior as unacceptable; • USDOT launched new distraction.gov website; • Creation of FocusDriven, first non-profit distracted-driving victim’s advocacy
organization; • High visibility media interventions, including Oprah’s no phone zone day and
American Idol X the text campaign; • Meeting involving UN Secretary General Ban Ki-Moon, American and Russian
representatives to launch global effort to address the growing and deadly epidemic of distracted driving.
CVSA participated actively in the summit and drafted a set of guiding principles to combat distracted driving, some of which are summarized below:
• Distracted driving is wide in scope, and needs to be addressed as such. It includes technology and non-technology distractions. Much more than cell phones, also laptops, mini computers, GPS systems, dispatching devices, on-board safety systems, etc.
• Legislation should therefore not be too narrow, but rather flexible to include upcoming evolutions of the phenomenon. Legislation should be performance-based rather than prescriptive;
• There is a need for more government-funded research, especially with regards to crashes caused by different types of distraction (technological vs. non-technological, hand-held phone vs. hands-free, other technologies that impact on attention);
• While processing results of such studies, government must balance the needs of the industry to remain safe while having on-board communication devices;
• All on-board electronic devices need to have lockdown mechanism when the vehicle is moving;
• Countermeasures should include enforcement, engineering and education. STEP programs should be used;
• Need for government funding to support special enforcement and education programs targeted at distracted driving in CMV operations;
• Distracted driving should be addressed in driver training, testing and licensing processes;
• Need for nationally uniform safety data and data collection procedures; • Distracted driving legislation should be enacted as primary law, not secondary
law.
Human Factors in the Motor Carrier Industry in Canada 104
2.1.4.4 CCMTA’s Expert Group on Driver Distraction As it is the case for fatigue, there is a CCMTA working group to address driver distraction. Experts from the group have drafted an action plan to deal with the problem for the general driving population. As of October 2nd 2009, the main recommendations/action items were the following:
1. Monitor current and emerging technologies, both original equipment and aftermarket, with respect to potential driver distractions;
2. Monitor jurisdictions’ & public opinion, attitudes and behaviour regarding the issue of driver distraction on a regular basis. Share information with F/P/T governments on legislative and regulatory options on driver distraction.
3. Jurisdictions to develop educational materials specifically to guide the use of emerging telematics systems in vehicles;
4. P/T should include a section on distracted driving in their driver’s license manuals;
5. Determine and recommend best practices for P/T regulations to address dangerous instances of driver distraction and the use of after-market devices;
6. Encourage employers to adopt policies for their employees to reduce potential driving distractions.
*
Human Factors in the Motor Carrier Industry in Canada 105
2.2 Decision errors Previous sections focused on processes involved in recognition errors, which relate to problems that occur during the intake of information. This section will center on decision errors. Simply put, decision errors regroup different phenomena that impact on information processing as well as high-level psychological factors involved in decision-making, influencing the course of action that drivers choose to adopt. Contributing factors, science-driven intervention leads and priorities for R&D will be identified. It is important to recall that decision errors come out as the largest crash contributor in various studies looking at CMV safety. In the LTCCS, when CMV drivers are attributed the critical reason for a crash, decision errors are the most prevalent cause, amounting to 38% of cases. Decision errors are also the lead cause of multiple-vehicle crashes involving a truck and a light vehicle, with 42.6% of cases for CMV drivers and 23.5% for LDV drivers. Also, in a more recent set of analyses presented by Craft (2008) on LTCCS data, decision errors are the most critical problem faced by CMV drivers in terms of absolute risk. The data show that following too closely, illegal manoeuvre and driving too fast for conditions - traditionally identified as core aggressive driving behaviors - are at the top of the list. The results of the 2005 ATRI study on crash predictors also point in this direction, with a 325% increase in crash risk for drivers committing reckless driving violations. In the Jonah et al. (2009) study, speeding and inattention are identified as the top crash causation factors, which confirms the need to address both recognition and decision errors in the Canadian environment. Therefore, from a risk-based perspective, the science indicates that decision errors, mainly risk-taking and aggressive driving behaviors, should be a top priority in terms of R&D and interventions. The problem is not only one of drivers’ skills and how they cope with task difficulty (what they cannot do) but also what they actually do willingly (Clarke et al., 2005; Forward, 2009a). Different authors have indeed made the distinction between driving skills (related to knowledge, skills and experience) and driving style (influenced by motivation, attitudes and personality), observing that these two categories define distinct yet complementary sets of human factors involved in the production of high-risk behaviors (see Sundström 2008, Sommer et al., 2008, Sümer et al., 2006). It is understood that both categories have different impacts on safety; driving skills are related to errors while driving style corresponds to driving violations (risk-taking, deliberate deviation of safe driving practices). Many studies have confirmed that violations are far more prevalent than errors and that contrary to errors they empirically predict crashes. Interestingly though, it appears that training programs for the population at large and in the motor carrier industry have so far traditionally been oriented towards skills rather than style. This situation is certainly not optimal since studies repeatedly show that the latter also needs to be systematically addressed and, theoretically, should be prioritized.

Human Factors in the Motor Carrier Industry in Canada 106
According to Lonero and Clinton (1997), road safety interventions in the past 40 years have focused on the passive (engineering) approach, by making safer roads and safer vehicles, rather than active (behavioral) strategies2. They attribute this situation to the weakness of past, overly simplistic, behavioral interventions. They further note that while large safety gains were achieved under the passive safety paradigm, it has now become clear that the modification of behavior is also essential in effective road safety management and that passive and active approaches are complementary rather than exclusive. Given the above, the crucial issue is therefore to understand what motivates specific groups of drivers to knowingly commit acts that put themselves and others at risk (Hatfield & Fernandes, 2009; Forward, 2006, Forward, 2009). Once this is done, targeted scientific interventions respecting the true meaning and the dynamic of these behaviors, for these drivers, can be developed, evaluated and adopted (Zuckerman, 2008). 2.2.1 The concept of risk-taking There is now a well-established body of research on risk-taking. The term risk psychology is commonly used in road safety literature. Turner, McClure and Pirozzo (2004) carried out a review to determine whether there is sufficient empirical evidence to support an association between risk-taking and injuries in general. The authors concluded that research data clearly support this relationship but that the field lacks a systematic approach and that it is marked by conceptual confusion. This confusion creates problems in the identification of target behaviors, stands in the way of consensus building and makes it difficult to regroup studies in a single analytic framework. The authors note that an effort is needed to develop a precise operational conceptual framework with clearly defined variables, valid measuring instruments and tested research methodologies. It is therefore important to begin this discussion by establishing the meaning of the concepts that will be used further on. According to Cvetkovich and Earle (1988) as well as Jonah (1986), risk-taking is defined as an observable behavior that increases the likelihood of a crash. For others, such as Irwin and Millstein (1992), Wagenaar (1992), Yates & Stone (1992) and Shtarkshal (1987), it necessarily involves awareness of the risk involved. Thuen, Klepp and Wold (1992) affirm that awareness is necessary and add that the risk is also deliberately sought. Leight (1999) observes that engaging in a behavior that puts one at risk, epidemiologically speaking, may be very different from risk-taking, considering the psychological meaning of the term. An individual may be at risk with regards to certain activities without necessarily having a tendency to take risk. A young, inexperienced person who drives under the influence of alcohol is not necessarily taking risks from the point of view of his experience at the time, but he is nevertheless at risk of being involved in a crash. Millstein and Igra (1995) point out that young drivers’ risky behaviors do not always involve risk-taking as such; young drivers may expose themselves to health and safety hazards while indulging in dangerous behaviors without consciously and willingly taking risks while driving.
2 Note that this classification, as used by these authors, differs from the notions of passive safety (crashworthiness) and active safety (crash avoidance), as it is often used in human factors engineering.
Human Factors in the Motor Carrier Industry in Canada 107
It is therefore important to distinguish high-risk behaviors, which may have a negative effect on safety and health, from risk-taking behaviors, which unlike the former always involve conscious, deliberate self-exposure to a dangerous situation. These are different realities that need to be addressed with different interventions. Shtarkshal (1987) emphasized the importance of three factors with regards to risk-taking. First, risk must be perceived as such; when a child who knows nothing about electricity touches a wire, no risk is being taken. Knowledge, or at least a certain awareness of risk is necessary. Failing such awareness, the person is engaging in high-risk behaviors but is not taking risks per se. Second, risk-taking includes an evaluation of one’s ability to deal with a risky situation; drivers who think they have strong abilities to deal with a situation will subjectively be taking a lower risk than drivers who believe the opposite. However, an overconfident driver may underestimate risk and fail to adapt accordingly to a driving situation, which exposes him to higher levels of objective risk. The notion of overconfidence in the motor carrier industry is an issue that needs to be looked at. The third factor is the acceptance of risk. Two drivers who perceive the same level of risk in a given situation, and who have a similar evaluation of their abilities, may differ in the extent to which they are willing to accept the risk. This difference is mainly related to personality traits, attitudes and motivations; it varies from one person to another and it can be assessed. According to Shtarkshal, acceptance of risk is the strongest predictor of risk-taking, violations and crashes. Turner and McClure (2004) observed that drivers who have a high acceptance of risk are up to eight times more likely to be involved in a crash. 2.2.2 Risk-taking, violations and crashes Several authors have analysed the categories of factors that lead to inappropriate driving behaviors and increased crash risk (Aberg and Rimmö, 1998; Blockey and Hartley, 1995; Lawton, Parker, Manstead and Stradling, 1997; Lawton, Parker, Stradling and Manstead, 1997; Parker, Reason, Manstead and Stradling, 1995; Parker, West, Stradling and Manstead, 1995; Özkan, Lajunen and Summala, 2006; West, French, Kemp and Elander, 1993; West and Hall, 1997; Furnham and Saipe, 1993). The method used in these studies is to analyse self-reported driving behaviors in order to regroup factors with specific influences into nominal categories. Note that Sullman, Meadows and Pajo (2002) applied this method to a sample of CMV drivers, obtaining results that are similar to what is observed from the general driving population, as described below. In brief, the results of these studies reveal a three-fold structure of inappropriate driving behaviors: (1) violations (deliberate deviations from safe driving practices), (2) serious judgment errors, and (3) lapses of attention. Note that violations (speeding, aggressive driving, following too closely, dangerous overtaking, sudden acceleration, late braking, etc.) are up to three times more common than serious judgement errors and lapses. Furthermore, adding self-reported crashes to the analysis, Parker, Reason, Manstead et al. (1995), Gras, Cunill, Sullman, Planes, and Aymerich (2004) as well as Sullman, Meadows and Pajo (2002) demonstrated that violations are the only statistically significant predictor of crashes.
Human Factors in the Motor Carrier Industry in Canada 108
This body of research reveals important information. First the significant linkage between violations and crashes identifies deliberate risk-taking as a legitimate target for intervention. Note that Blows, Ameratunga, Ivers, Lo and Norton (2005), Jelalian, Alday, Spirito, Rasile and Nobile (2000), Stevenson and Palarama (2001), Rajalin (1994) as well as Turner, McClure, and Pirozzo (2004), also observed empirical relationships between crashes and risk-taking and all point to the urgent necessity of developing strategies to reduce risky-driving. These factor analyses also indicate that risk-taking is distinct from other types of driving errors. It stems from a combination of specific psychological factors and therefore needs to be targeted via appropriate, targeted interventions. Lapses in attention and judgment errors arise from information processing problems as well as skills and knowledge issues that can be addressed through traditional forms of training (Blockey and Hartley, 1995). Risk-taking on the other hand arises from personal characteristics and motivational factors that should be targeted through approaches addressing motivations, emotions, attitudes and beliefs about dangerous driving (Fernandes, Job and Hatfield, 2007; Forward, 2006; Forward, 2009a, Forward, 2009b; Parker, Manstead, Stradling and Reason, 1992a; Parker, Manstead, Stradling and Reason, 1992b; Parker, Reason, Manstead et al., 1995; Reason, Manstead, Stradling, Baxter and Campbell, 1990; Rosenbloom, Eldror, Sharar, 2009; Sullman et al., 2002; West and Hall, 1997). Note that novel approaches to training could also be applicable in this context, as will be discussed later. Finally, the recognition of the link between risk-taking behavior and crashes also opens the way to procedures aimed at identifying those individuals who are more at risk (Knipling et al., 2004; Iversen and Rundmo, 2002; Sommer et al, 2008; Thiffault, 2005b). 2.2.3 Different approaches to risk-taking
The following discussion is aimed at clarifying the different approaches to risk-taking and risky-driving. This is done in order to bring forward a comprehensive description of the problem and to generate diversified intervention strategies that could be applied to the motor carrier industry. Also, since some of these intervention approaches involve assessing the “risk profile” of CMV drivers, it is important that the main predictors of risky-riving amongst each of these approaches be discussed.
Risk-taking has been addressed from several angles, depending on the type of behaviors involved and the areas of public health likely to be affected. A look at existing databases shows evidence of very active lines of research in the fields of HIV, addiction, gambling, delinquency and road safety. The fact that high levels of covariation are observed among risk-taking behaviors has led authors to see them as a constellation. It is suggested that this covariation reveals the presence of a general tendency to take risks. This tendency can be associated with various health issues, including road crashes. Theories have been formulated to account for the tendency to take risks. For example, Arnett (1992) and Jessor (1992), proposed a biopsychosocial model taking into consideration the diversity and the systemic nature of the determinants of risk-taking behaviors. Ajzen and Fishbein (1980) presented a psychosocial motivational theory in

Human Factors in the Motor Carrier Industry in Canada 109
which behavioral intention arises from a set of interactions among attitudes, subjective norms and perceived behavioral control. Other models, such as those of Wilde (1982), Taylor (1964) and Naatanen and Summala (1976) do not explain risk-taking by referring to psychosocial factors or attitudes but rather focus on behavioral adaptation and risk perception (see Thiffault, 1991, 2005b). All these theories are presented as general explanations of risk-taking behaviors but they most often operate in silos, ignoring aspects addressed by concurrent theories, and therefore suffer from a reductionism that limits their scope. They also fail to factor-in the influence of stable personality traits in the production of risk-taking behaviors. For example, while studies repeatedly show that sensation seeking and aggression are closely related to risky-driving and crashes (see Iverson and Rundmo, 2002), these factors are hardly considered or not considered at all in most risky-driving theories. This is rather surprising, given that personality determines the nature or utility of risk-taking for individuals sharing specific profiles. Exceptions to this are the recent study of Chen (2009) as well as the work of Ulleberg and Rundmo (2003). Chen observes that social cognitive research addressing risky-driving leads to interventions aimed at changing drivers attitudes and risk perception, while personality research emphasizes the predictive power of traits such as sensation seeking, aggression and social deviance. According to the author, … the integration of both social cognitive and personality psychology approaches provides an understanding of the mechanisms underlying drivers’ risky-taking behaviors and is therefore important and under-researched. The results of Chen’s study in fact show that attitudes serve as mediators in the relationship between personality traits and dangerous driving, a result similar to the conclusions of Ulleberg and Rundmo (2003), who also combined both approaches. Rothengatter (2002) observed that risk-taking theories could be organized as behavioral control theories (such as Wilde’s risk-homeostasis theory or Summala’s zero-risk theory), theories based on the relationship between attitude and behavior (such as the Problem Behavior Theory or the Theory of Planned Behavior) and models based on personality traits and individual differences. On the basis on this classification - and others that were reviewed by Thiffault (2005b) - it is possible to organize the literature in the following broad categories: the psychosocial approach, the personality approach, the behavior regulation approach and the risk perception approach. 2.2.3.1 Psychosocial approach: the problem behavior theory One of the most important theories within the psychosocial approach to risk-taking is Jessor’s Problem Behavior Theory (PBT) (Jessor, 1987; Jessor and Jessor, 1977). This theory has a central place in the contemporary understanding of risk-taking behaviors. Its premise is that these behaviors form a constellation that constitutes a lifestyle. This lifestyle is functional; it has utility, even though it exposes the individual to health risks (Moller and Gregersen, 2008). The theory has mainly been applied to teenagers and young adults but some of its aspects are applicable to CMV drivers.
Human Factors in the Motor Carrier Industry in Canada 110
For example, the PBT can help us to understand how risky-driving fits into typical risk-oriented and unhealthy lifestyles found among CMV drivers. Such an understanding could provide significant input for the development of health and wellness interventions that attempt to address truck drivers’ health and safety issues with a global, lifestyle-oriented approach. It also has clear implications in terms of driver assessment and for the identification of risk and protective factors with regards to dangerous driving. When it was formulated, the PBT differed from existing risk-taking models because it incorporated social factors to account for the production of behavior. The main models at the time, such as Wilde’s risk-homeostasis theory or Naattanen and Summala’s zero-risk theory, offered explanations that focused on the person and on internal control mechanisms but did not consider the utility or the psychosocial meaning of behavior. The PBT provides a completely different perspective by incorporating interactions among situational factors and personality elements that influence the adoption of risky behaviors. The main contribution of the PBT is the demonstration that risk-taking behaviors have a common function for the individual and that they are related by this function. This explains why some of these behaviors, for example related to addictions and risky-driving, are resistant to change. The significant correlations observed among these behaviors also imply that the situational and personal factors that influence and predict a specific behavior may be the same ones that influence and predict another totally different behavior in another situation. In this approach, risk-taking is explainable by a relatively small number of determinants called risk factors. In the same way, the absence or low prevalence of risk-taking can be predicted and explained by a limited set of protective factors. Jessor (1987) defines risk-taking as behaviors that deviate from the social and legal norms of society. He stresses that these behaviors are neither perverse nor arbitrary; they have psychological meaning and are developmentally and socially important (Jessor, 1985). Thus, in his view, these behaviors are instrumental rather than pathological, and the only way to understand them is to properly situate them in the context of their utility. For example, applying the theory to the context of risk-taking among youth reveals that the main functions of these behaviors are: identification with the peer group, affirmation of independence, expression of opposition to social values, coping with feelings of inadequacy, failure and stress related to fluctuations in self-esteem, establishing one’s own identity, making the transition to greater maturity, and experience of pleasure. Jessor points out that this lifestyle exposes the individual to health risks, just as other lifestyles have been related to health problems, notably the relationship between type-A personality and cardio-vascular diseases. However, with certain risk-taking activities such as risky-driving, individuals are not only endangering themselves but also others. Thus the utility ascribed to these behaviors is not a justification; it simply identifies their meaning. Jessor also mentions that these functions do not always lead to risk-taking and that there are significant interindividual variations in this respect. He refers to a conventionality – unconventionality continuum to explain these variations.
Human Factors in the Motor Carrier Industry in Canada 111
The PBT is based on three systems of psychosocial influences that are independent of each other but related: the behavioral system, the personality system and the perceived environment system. In each of these systems, there are variables explaining the instigators (risk factors) and inhibitors (protective factors) for the behaviors. These variables interact, and arising from these interactions is a general risk-taking tendency. Note that interventions should generally be aimed at limiting the influence of risk factors and increasing the influence of protective factors. In brief, the behavioral system is a constellation of behaviors such as alcohol and drug abuse, sexual activity, driving while impaired, failing to use a seat belt, and speeding. This system also includes conventional behaviors related to traditional institutions such as church, education and work. These conventional behaviors are negatively correlated with the risk-taking behaviors and thus represent protective factors that should be encouraged. Given such system, it can for example be expected that impaired driving is positively correlated with other risk-taking behaviors and negatively correlated with conventional behaviors such as religiosity and having a stable job. According to Jessor (1987), risk-taking behaviors arise from an interaction between the individual and the environment, between the personality and perceived environment systems. There are three constructs within the personality system: a motivational construct, a personal beliefs and a personal control construct. Studies show that the probability of risk-taking behavior increases when a low value is placed on grades, a high value is placed on independence, there are low expectations about achieving desired objectives, greater social criticism, low self-esteem, external locus of control, greater tolerance for deviance, lower religiosity, and dominance of the utility of risk-taking over its disutility. The perceived environment system encompasses environmental features that may be perceived and encoded by the person. Globally, it was observed that individuals are more prone to engage in risk-taking when there is low family control and support, low compatibility between family and peers, high peer influence, low family disapproval of risk-taking behaviors and strong peer support and peer models for these behaviors. The PBT has been used to explain risky-driving (Jessor, Turbin and Costa, 1997; Jonah, 1990a; Jonah and Dawson, 1987; Moller and Gregersen, 2008; Swisher, 1988; Wilson and Jonah, 1988). Jessor, Turbin and Costa (1997) note that dangerous driving is positively correlated with other norm-transgressing behaviors such as delinquency, alcohol abuse and cannabis use, and that these behaviors are influenced by personality traits and a social environment that encourages deviancy. Donovan et al. (1983), Donovan (1993), and Hedlund (1994) emphasize that risky-driving behaviors are correlated with each other, implying common utility. Jonah (1990a), Jonah and Dawson (1987), and Yu and Williford (1993) observe that high-speed driving, following too closely, illegal passing and failure to signal intentions are the most commonly interrelated behaviors. Note that these are core aggressive driving behaviors.

Human Factors in the Motor Carrier Industry in Canada 112
Jessor, Turbin and Costa (1997) validated certain aspects of the PBT when they observed that behavioral and psychosocial unconventionality is a predictor of dangerous driving. Unconventionality was reflected in a set of high-risk behaviors such as cannabis use, alcohol abuse, unsafe sex and delinquency. The authors noted that the more these behaviors are present, the greater is the likelihood of dangerous driving. These authors also observed a linear reduction in high-risk behaviors between the ages of 18 and 25, which they explain by the fact that unconventionality drops off as one matures. Note that the instrument used by Jessor et al. (1997), the Young Adult Driving Questionnaire, was developed by Jessor and Jessor in 1977, and modified by Jessor et al. in 1991. This instrument includes questions that measure aspects of personality, perceived social environment and certain self-reported behaviors. Wilson and Jonah (1988) carried out a study on a sample of 935 subjects (average age 35) in order to observe the relationships between PBT components and risky-driving amongst an adult population. The results show that risky-driving is indeed an integral part of a system of problem behaviors that is influenced by the personality system and the perceived social environment. The system most directly related to risky-driving was the behavioral system, followed by the personality system and perceived social environment. The authors mention that contrary to what was observed by Jessor, the personality system explained twice the variance explained by the perceived social environment. They noted further that the most powerful factors in the personality system were thrill seeking and aggressiveness, two variables not found in Jessor’s formulation. The authors concluded that the theory predicts risky-driving and can also be useful in predicting its consequences, both legal (violations) and physical (crashes) in an adult population. Moller and Gregersen (2008) confirmed the relationship between risky-driving and a risk-oriented lifestyle in which dangerous activities serve a psychosocial function. They concluded that drivers not only need to master the skills necessary for handling the vehicle and reading the traffic, but that they also need skills to handle the influences from motives stemming from their lifestyle and that can impact on the safety of their driving. Example of such would be learning to control the impulse to let off steam through driving behavior or resisting the motivation to gain social status among peers through driving. Globally, there is a need to increase drivers’ awareness of these social influences on their driving style and their safety. This could be done via peer group interventions. 2.2.3.2 Psychosocial approach: the theory of planned behavior The Theory of Planned Behavior (TPB) formulated by Ajzen and Fishbein (1980) is the other central psychosocial approach to risk-taking. The theory is largely based on the importance of subjective social norms that are present in a specific environment, among individuals that share various key characteristics, i.e. young adults, or CMV drivers. As shown in Figure 15, Ajzen and Fishbein (1980) and Ajzen (1991) propose that the immediate determinant of behavior is the intention of the individual to engage in that behavior. Intention is in turn predicted by attitudes toward the behavior as well as subjective norms and perceived behavioral control (PBC).
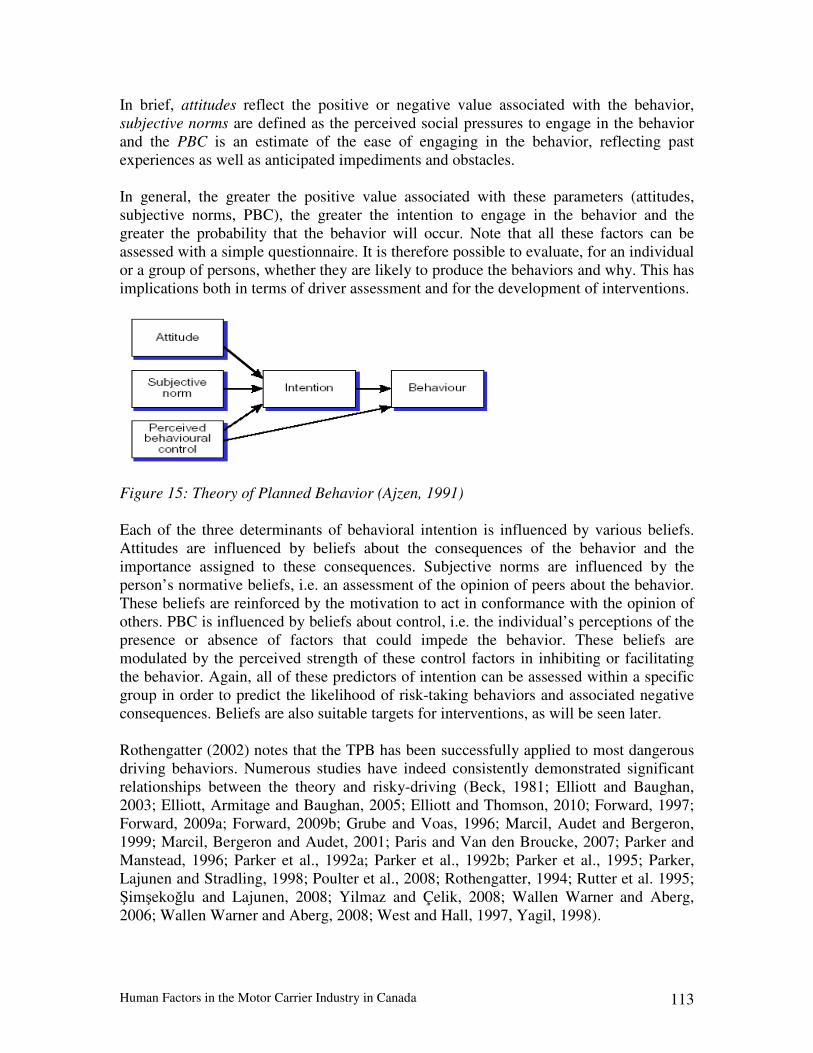
Human Factors in the Motor Carrier Industry in Canada 113
In brief, attitudes reflect the positive or negative value associated with the behavior, subjective norms are defined as the perceived social pressures to engage in the behavior and the PBC is an estimate of the ease of engaging in the behavior, reflecting past experiences as well as anticipated impediments and obstacles. In general, the greater the positive value associated with these parameters (attitudes, subjective norms, PBC), the greater the intention to engage in the behavior and the greater the probability that the behavior will occur. Note that all these factors can be assessed with a simple questionnaire. It is therefore possible to evaluate, for an individual or a group of persons, whether they are likely to produce the behaviors and why. This has implications both in terms of driver assessment and for the development of interventions.
Figure 15: Theory of Planned Behavior (Ajzen, 1991) Each of the three determinants of behavioral intention is influenced by various beliefs. Attitudes are influenced by beliefs about the consequences of the behavior and the importance assigned to these consequences. Subjective norms are influenced by the person’s normative beliefs, i.e. an assessment of the opinion of peers about the behavior. These beliefs are reinforced by the motivation to act in conformance with the opinion of others. PBC is influenced by beliefs about control, i.e. the individual’s perceptions of the presence or absence of factors that could impede the behavior. These beliefs are modulated by the perceived strength of these control factors in inhibiting or facilitating the behavior. Again, all of these predictors of intention can be assessed within a specific group in order to predict the likelihood of risk-taking behaviors and associated negative consequences. Beliefs are also suitable targets for interventions, as will be seen later. Rothengatter (2002) notes that the TPB has been successfully applied to most dangerous driving behaviors. Numerous studies have indeed consistently demonstrated significant relationships between the theory and risky-driving (Beck, 1981; Elliott and Baughan, 2003; Elliott, Armitage and Baughan, 2005; Elliott and Thomson, 2010; Forward, 1997; Forward, 2009a; Forward, 2009b; Grube and Voas, 1996; Marcil, Audet and Bergeron, 1999; Marcil, Bergeron and Audet, 2001; Paris and Van den Broucke, 2007; Parker and Manstead, 1996; Parker et al., 1992a; Parker et al., 1992b; Parker et al., 1995; Parker, Lajunen and Stradling, 1998; Poulter et al., 2008; Rothengatter, 1994; Rutter et al. 1995; Şimşekoğlu and Lajunen, 2008; Yilmaz and Çelik, 2008; Wallen Warner and Aberg, 2006; Wallen Warner and Aberg, 2008; West and Hall, 1997, Yagil, 1998).

Human Factors in the Motor Carrier Industry in Canada 114
An in-depth review of this literature is not needed here, however examples of the types of relationships brought forward by studies using the TBP to analyze risky-driving behaviors are provide below:
• Elliott and Baughan (2003) observed that attitudes, subjective norms and PBC are positively associated with behavioral intention to speed;
• Parker et al. (1998) found that beliefs and attitudes related to aggressive driving scenarios are significant predictors of self-reported aggressive driving behaviors;
• Moyano (2002) noted that younger drivers have more positive attitudes than older ones toward dangerous behavior. Younger drivers’ subjective norms regarding these behaviors are less inhibitory. Further, they have less control over behavior, more positive intention to commit violations and report more dangerous behaviors and more serious errors and lapses of attention;
• In a study of impaired driving among youth, Grube and Voas (1996) observed that impaired driving and riding onboard a vehicle driven by an intoxicated driver are predicted by expectations concerning associated physical risks, subjective norms regarding peer disapproval of the behavior, perception of control with respect to the ability to avoid behaviors, and self-reported drinking;
• In a study of self-reported speeding, Marcil et al. (1999) noted that the intention to exceed the speed limit is predicted by attitudes and perceived behavioral control. In a comparable study, Marcil et al. (2001) observed that the intention to drive while under the influence is predicted by attitudes and perceived behavioral control and to a lesser extent by the subjective norm;
• Other authors have also observed that attitudes about risky-driving are significant predictors of the intention to engage in such behavior and that they are also significantly correlated with crash risk (Assum, 1997; Parker et al., 1995; Rothengatter and Manstead, 1997).
According to Elliot, Armitage and Baughan (2005), in order to persuade drivers to comply with road regulations, it is necessary to understand the mechanisms by which these behaviors are influenced. The authors underline that the TPB is the most significant account of behavior in social psychology and has much to offer in terms of the development of remedial interventions. They conducted a study to identify the beliefs at the root of attitudes, subjective norms and PBC that most strongly predict behavioral intentions and that represent legitimate targets for countermeasures. These results will be discussed in the upcoming section on interventions. Yilmaz and Çelik (2008) point out that attitude is one of the most important concepts related to driving behavior. Like motivation, it has a significant impact on driving style and risk-taking. The authors note that in the context of the TPB, the results of behaviors are rationally considered before behavior is even attempted. Individuals’ intentions can therefore be investigated and behaviors predicted. Furthermore, according to these authors, if behaviors are to be modified, their underlying beliefs and attitudes should first be evaluated and changed.
Human Factors in the Motor Carrier Industry in Canada 115
Forward (2009a) recalls that of the three categories of human errors associated with crashes (violations, errors and lapses), violations represent the most important causal factor and the highest priority for interventions aimed at driver behavior. She observed that the TPB is the most widely used approach to develop an understanding of what predicts these behaviors. Forward (2009b) indeed used the TPB in order to assess what specifically motivates drivers to commit violations. The detailed assessment of the psychological factors involved in the theory enabled her to make specific recommendations in terms of intervention development. These will be reviewed in the upcoming section on interventions. In brief, Forward’s analyses showed that there are significant differences between those who intend to commit violations and those who do not, with respect to: beliefs about the consequences of behaviors (speeding is seen as emotionally rewarding and overtaking is based on a denial of negative consequences), normative beliefs associated with the behavior (male violators receive greater consensus from man of same age) and perceived behavioral control (violators perceive less risk). Poulter, Chapman, Bibby, Clarke and Crundall (2008) applied the TPB to develop an understanding of truck drivers’ risky-driving behaviors and compliance with CMV regulations. The authors first acknowledged that while road crashes are at the top of work-related fatalities, very little has been done to explore the human factors underlying risky-driving behaviors for professional drivers, compared to the amount of research dedicated to the same issue for the general driving population. The authors observe that while CMV drivers share some of the risks faced by other road users, they also have their own characteristics and risks that require specific attention. Accordingly, they conclude that there is a need to identify psychological precursors of behavior in order to help inform future interventions with CMV drivers that are aimed at reducing risk and crash involvement. They suggest that the TPB is the best tool to achieve these objectives since it generates an understanding of why drivers do or do not engage in risky behaviors by providing a measure of their attitudes towards the behavior, the perceived social pressure associated with the behavior, and the level of confidence in controlling the behavior. In their study, Poulter et al. identified two principal factors underlying CMV crash causation: inappropriate driving behaviors (violations) and non-compliance with CMV regulations. As reviewed earlier, Sullman et al. (2002) indeed observed that violations were related to crashes for CMV drivers, Murray et al. (2005) found a 325% increase in crash risk for CMV drivers who committed violations for reckless driving in the past and in the UK, an out-of-service rate of 22.1% was observed on 465,000 roadside inspections, with HOS and overloading violations being the most prevalent issues indentified. The authors therefore opted to investigate both these problems with the TPB. The results indicate that both categories of behaviors are explained by different sets of interactions between TPB predictors. As can be seen in figure 16, the intention to respect traffic laws (relates to violations) has a direct and significant effect on actual behavior (.30), followed by subjective norms (.17) and PBC (.15). Note that as expected attitudes, subjective norms and PBC all predicted intention. According to Poulter et al., these data indicate that drivers who intend to obey the law are more likely to report driving within the law. Also, the direct effect of subjective norms on behavior implies that a strong
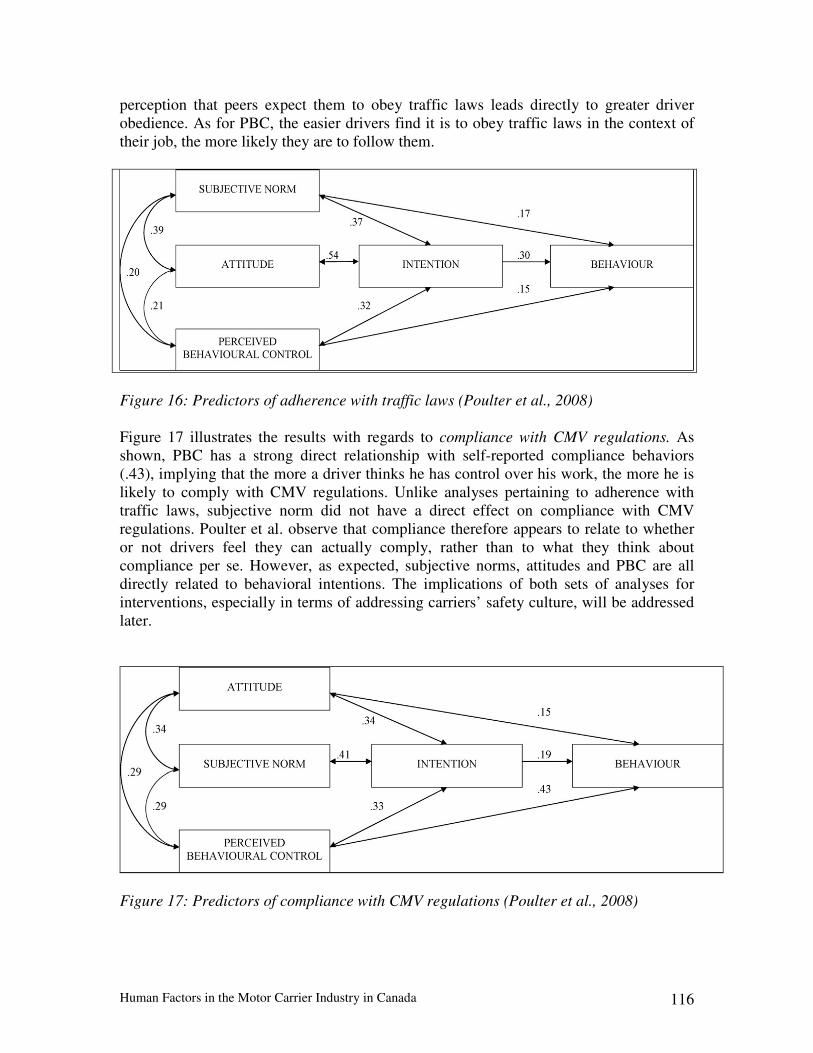
Human Factors in the Motor Carrier Industry in Canada 116
perception that peers expect them to obey traffic laws leads directly to greater driver obedience. As for PBC, the easier drivers find it is to obey traffic laws in the context of their job, the more likely they are to follow them.
Figure 16: Predictors of adherence with traffic laws (Poulter et al., 2008) Figure 17 illustrates the results with regards to compliance with CMV regulations. As shown, PBC has a strong direct relationship with self-reported compliance behaviors (.43), implying that the more a driver thinks he has control over his work, the more he is likely to comply with CMV regulations. Unlike analyses pertaining to adherence with traffic laws, subjective norm did not have a direct effect on compliance with CMV regulations. Poulter et al. observe that compliance therefore appears to relate to whether or not drivers feel they can actually comply, rather than to what they think about compliance per se. However, as expected, subjective norms, attitudes and PBC are all directly related to behavioral intentions. The implications of both sets of analyses for interventions, especially in terms of addressing carriers’ safety culture, will be addressed later.
Figure 17: Predictors of compliance with CMV regulations (Poulter et al., 2008)
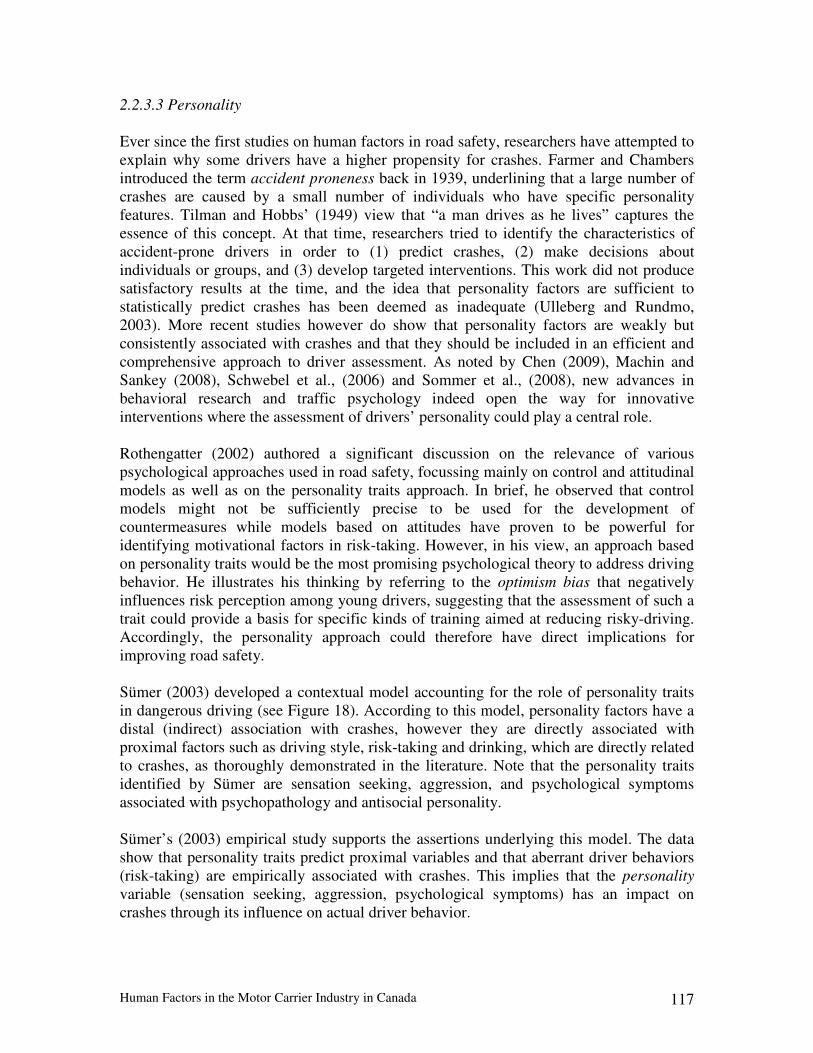
Human Factors in the Motor Carrier Industry in Canada 117
2.2.3.3 Personality
Ever since the first studies on human factors in road safety, researchers have attempted to explain why some drivers have a higher propensity for crashes. Farmer and Chambers introduced the term accident proneness back in 1939, underlining that a large number of crashes are caused by a small number of individuals who have specific personality features. Tilman and Hobbs’ (1949) view that “a man drives as he lives” captures the essence of this concept. At that time, researchers tried to identify the characteristics of accident-prone drivers in order to (1) predict crashes, (2) make decisions about individuals or groups, and (3) develop targeted interventions. This work did not produce satisfactory results at the time, and the idea that personality factors are sufficient to statistically predict crashes has been deemed as inadequate (Ulleberg and Rundmo, 2003). More recent studies however do show that personality factors are weakly but consistently associated with crashes and that they should be included in an efficient and comprehensive approach to driver assessment. As noted by Chen (2009), Machin and Sankey (2008), Schwebel et al., (2006) and Sommer et al., (2008), new advances in behavioral research and traffic psychology indeed open the way for innovative interventions where the assessment of drivers’ personality could play a central role. Rothengatter (2002) authored a significant discussion on the relevance of various psychological approaches used in road safety, focussing mainly on control and attitudinal models as well as on the personality traits approach. In brief, he observed that control models might not be sufficiently precise to be used for the development of countermeasures while models based on attitudes have proven to be powerful for identifying motivational factors in risk-taking. However, in his view, an approach based on personality traits would be the most promising psychological theory to address driving behavior. He illustrates his thinking by referring to the optimism bias that negatively influences risk perception among young drivers, suggesting that the assessment of such a trait could provide a basis for specific kinds of training aimed at reducing risky-driving. Accordingly, the personality approach could therefore have direct implications for improving road safety. Sümer (2003) developed a contextual model accounting for the role of personality traits in dangerous driving (see Figure 18). According to this model, personality factors have a distal (indirect) association with crashes, however they are directly associated with proximal factors such as driving style, risk-taking and drinking, which are directly related to crashes, as thoroughly demonstrated in the literature. Note that the personality traits identified by Sümer are sensation seeking, aggression, and psychological symptoms associated with psychopathology and antisocial personality. Sümer’s (2003) empirical study supports the assertions underlying this model. The data show that personality traits predict proximal variables and that aberrant driver behaviors (risk-taking) are empirically associated with crashes. This implies that the personality variable (sensation seeking, aggression, psychological symptoms) has an impact on crashes through its influence on actual driver behavior.
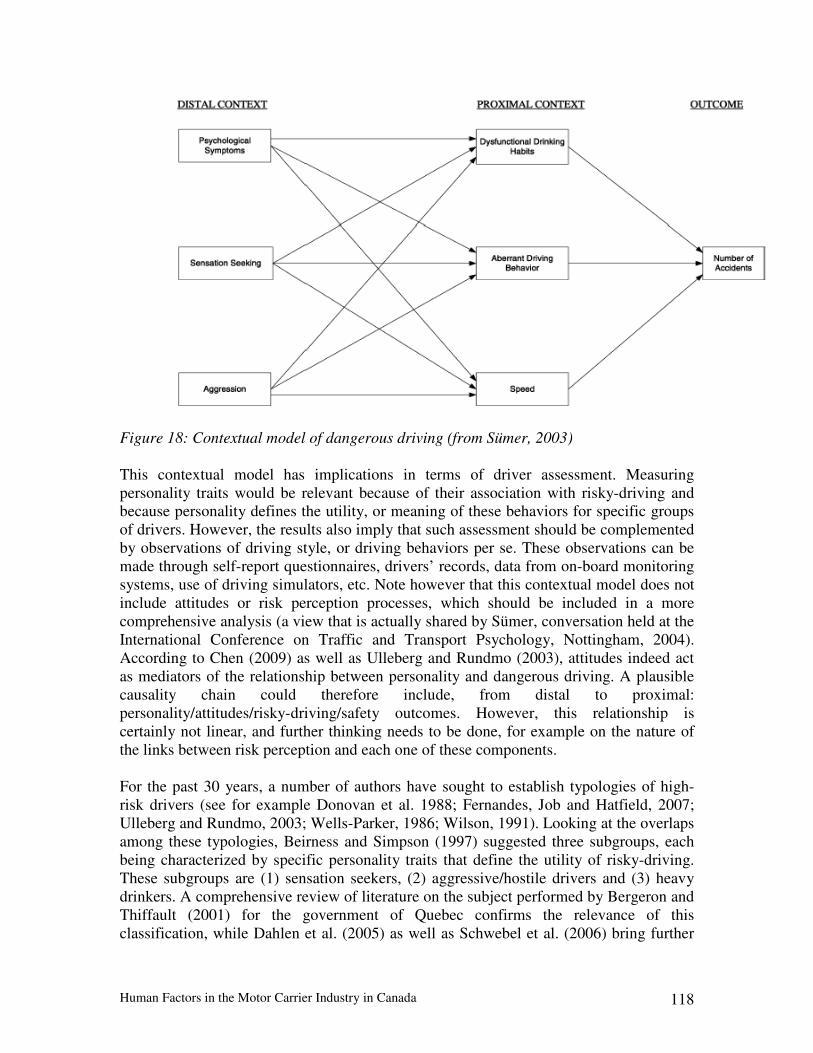
Human Factors in the Motor Carrier Industry in Canada 118
Figure 18: Contextual model of dangerous driving (from Sümer, 2003) This contextual model has implications in terms of driver assessment. Measuring personality traits would be relevant because of their association with risky-driving and because personality defines the utility, or meaning of these behaviors for specific groups of drivers. However, the results also imply that such assessment should be complemented by observations of driving style, or driving behaviors per se. These observations can be made through self-report questionnaires, drivers’ records, data from on-board monitoring systems, use of driving simulators, etc. Note however that this contextual model does not include attitudes or risk perception processes, which should be included in a more comprehensive analysis (a view that is actually shared by Sümer, conversation held at the International Conference on Traffic and Transport Psychology, Nottingham, 2004). According to Chen (2009) as well as Ulleberg and Rundmo (2003), attitudes indeed act as mediators of the relationship between personality and dangerous driving. A plausible causality chain could therefore include, from distal to proximal: personality/attitudes/risky-driving/safety outcomes. However, this relationship is certainly not linear, and further thinking needs to be done, for example on the nature of the links between risk perception and each one of these components. For the past 30 years, a number of authors have sought to establish typologies of high-risk drivers (see for example Donovan et al. 1988; Fernandes, Job and Hatfield, 2007; Ulleberg and Rundmo, 2003; Wells-Parker, 1986; Wilson, 1991). Looking at the overlaps among these typologies, Beirness and Simpson (1997) suggested three subgroups, each being characterized by specific personality traits that define the utility of risky-driving. These subgroups are (1) sensation seekers, (2) aggressive/hostile drivers and (3) heavy drinkers. A comprehensive review of literature on the subject performed by Bergeron and Thiffault (2001) for the government of Quebec confirms the relevance of this classification, while Dahlen et al. (2005) as well as Schwebel et al. (2006) bring further

Human Factors in the Motor Carrier Industry in Canada 119
empirical evidence to it. The working hypothesis that can be drawn from the scientific literature is therefore that sensation seeking and aggression are dominant characteristics of high-risk drivers. Drinking is also important and is a third major source of risky-driving, however with minimal impacts in the motor carrier industry, as suggested by the results of the LTCCS. Impulsiveness, which is linked to both sensation seeking and aggression, is significant as well. It should also be noted that the process of establishing typologies like these has clear limitations. The heterogeneity of the general population also finds expression within a specific typology, with non-exclusive combinations of personality traits and attitudes where all configurations are possible. The goal therefore should not be to rigidly categorize high-risk drivers but rather to identify personality features that assign different utilities to dangerous driving. Instead of saying that there are sensation seekers on the one hand and aggressive drivers on the other, it would be better to consider that sensation seeking and aggression both underlie dangerous driving, but for different reasons. It then becomes possible to inform the development of intervention strategies that consider the meaning of risky-driving for those who are actually doing it in order to improve road safety (Fernandes, Job and Hatfield, 2007, Lonczak et al., 2007). Indications as to what these interventions could be will be presented in the upcoming section on interventions. 2.2.3.3.1 Sensation seeking
Sensation seeking, a concept put forward by Zuckerman (1979, 1983), is a personality trait that involves a tendency to seek out new, complex, varied and intense sensations and to take physical, social, legal or financial risks simply for the gratification associated with these activities. The concept is composed of four factors: (1) thrill and adventure seeking –TAS (attraction to excitement and challenges), (2) experience seeking – ES (looking for new and unconventional experiences, (3) disinhibition – Dis (loss of control), and (4) boredom susceptibility – BS (intolerance to monotonous and predictable situations). Central to the concept is a tendency to search for new stimulations and to explore the environment, as well as intolerance for repeating past experiences. These two factors are particularly important when looking at risky-driving: a desire for thrills and excitement may give rise to dangerous behaviors that will increase crash risk, while boredom susceptibility may lead to hypovigilance, fatigue and risky behaviors that could be adopted in order to compensate the lack of stimulation (Rosenbloom and Wolf, 2002; Thiffault and Bergeron, 2003a, Thiffault and Bergeron, 2003b). Sensation seeking can therefore be related to both recognition errors (hypovigilance, fatigue) and decision errors (risky-driving). According to Burns and Wilde (1995), Donovan et al. (1986), Furnham and Saipe (1993), Moe and Jenssen (1993) as well as Rimmö and Aberg (1999), the relationship between crashes and the sensation seeking scale (SSS) is not particularly strong. Rimmö and Aberg (1999) explain that while many studies have been done to establish relationships between personality and crashes, success has been modest, and only 5 to 10% of the variability is usually explained. The authors also observe that procedures for measuring

Human Factors in the Motor Carrier Industry in Canada 120
personality (self-reports) and crashes (police reports) are both subject to errors. They further note that crashes may have multiple causes, which implies that a single predictor can measure only a small portion of the variance in terms of causality. Also, given that a crash can be seen as the outcome of a lengthy chain of events – where personality is just the first link – it is important to include relationships amongst the other links when attempting to understand the role of personality. Furthermore, as noted by Sümer (2003), the rather distal relationship of personality with crashes does not disqualify it as a significant factor to consider in road safety. The use of other safety proxies such as driving style or violations confirms this assumption. It is now widely understood that the role of personality is mediated by attitudes and driving style and that it is therefore an essential component of the big picture. As was said, sensation seeking influences attitudes, driving style and risk-taking, which are associated with crashes. The measurement of attitudes and actual risk-taking behaviors therefore complements the assessment of personality traits and all these parameters need to be observed for a comprehensive and systemic evaluation of drivers’ risk. Such an assessment would without a doubt generate more predictive power, and more meaningful predictions, than either one of these predictors taken in isolation. The phenomenon under study is complex, systemic and articulated, and the methods used to address it need to account for this complexity. The relationship between sensation seeking and factors associated with dangerous driving or violations, which are both clearly linked to crashes, is thus stronger than the direct relationship that is observed between sensation seeking and crashes per se (Dahlen et al., 2005; Rimmo, 2002; Schwebel et al., 2006). In a literature review of over 40 studies on the issue, Jonah (1997) indeed noted that the majority of studies show a positive relationship between sensation seeking and dangerous driving, with correlations of the order of 0.30 to 0.40, depending on gender and on how risky-driving is being measured. Jonah observed that thrill and adventure seeking was the strongest subscale. Sensation seeking is the factor that has most often been associated with risky-driving. It has been related to drunk driving (Arnett, 1990, 1991, 1996; Donovan and Marlatt, 1982; Donovan et al., 1986; Farrow et Brissing, 1990; Lastovicka, Murry, Joachimstaler, Bhalla & Scheurich, 1987; Little & Robinson, 1989; McMillen, Smith & Wells-Parker, 1989; McMillen, Pang, Wells-Parker, & Anderson, 1992; Stacy, Newcomb & Bentler, 1991; Vingilis, Stoduto, Macartney-Filigate, Liban & McLellan, 1994; Wieczorek, 1995; Wilson, 1990; Yu & Williford, 1993), to speeding and careless driving (Arnett, 1996; Burns & Wilde, 1995; Clement & Jonah, 1984; Furnham & Saipe, 1993; Horvath & Zuckerman, 1993; Moe & Jenssen, 1993, 1995; Zuckerman & Need, 1980) and to other dangerous behaviors such as failure to wear seat belts, weaving in and out of traffic,
and competitive driving (Arnett, 1991, 1996; Burns et Wilde, 1995; Furnham & Saipe, 1993; Homant, Kennedy & Howton, 1993; McMillen et al., 1989; Wilson, 1990). More recently, Iversen and Rundmo (2002) as well as Schwebel et al, (2006) noted a significant relationship between sensation seeking and self-reported dangerous driving. All in all, these studies tell us that sensation seekers are clearly a high-risk population that should be targeted with interventions.
Human Factors in the Motor Carrier Industry in Canada 121
2.2.3.3.2 Aggressive driving
Lawton, Parker and Stradling (1997) conducted a study to identify the motivations underlying self-reported risky driving behaviors. Factor analysis indicated that risky driving behaviors can be divided into two major categories: instrumental behaviors associated with thrill-seeking, such as speeding, and emotional behaviors associated with affect, such as aggressive, hostile or antisocial driving. After having reviewed the concepts of sensation seeking and thrill seeking, the following section will therefore focus on the other type of psychological factor associated with risky behavior, namely psychosocial and emotional phenomena related to social interactions on the road, especially aggression, hostility and antisocial tendencies. In recent years, the phenomenon of road rage has been vastly discussed in the media. Sensational coverage of road assaults has led the media to depict the situation as a road rage epidemic. Because there is little scientific evidence for such an assertion, some road safety researchers reacted by refuting the problem as a whole. However, by doing so, they somewhat trivialized the dangers associated with aggressive driving actions routinely committed by drivers. It therefore quickly became clear that there was a need to distinguish road rage episodes (assaults and battery, criminal act - low impact on road safety) from aggressive driving behaviors, which are omnipresent on the road, are associated with crashes and have a significant road safety impact. The result of this debate is that aggressive driving is now acknowledged as a very significant risk factor for road fatalities and injuries and that numerous researchers worldwide are currently attempting to articulate strategies to deal with the problem. In a review of literature on the issue, Bergeron, Thiffault and Smiley (2000) confirmed the presence of conceptual problems between road rage and aggressive driving and articulated an operational definition of aggressive driving. In brief, they observed that aggression is a fundamental human emotion that manifests in all forms of social interaction, including driving, and that it is recognized as a significant predictor of dangerous driving and crashes. They explain that the experience of aggression leads to psychophysiological changes that may interfere with driving (stress, arousal, hypervigilance, information processing problems, increased mental load, impulsiveness, etc.) and also gives rise to competitive and hostile overt driving behaviors that increase crash risk. In contrast, they define road rage episodes as anecdotal consequences of aggressive driving which do not represent a significant public health issue (see Figure 19).
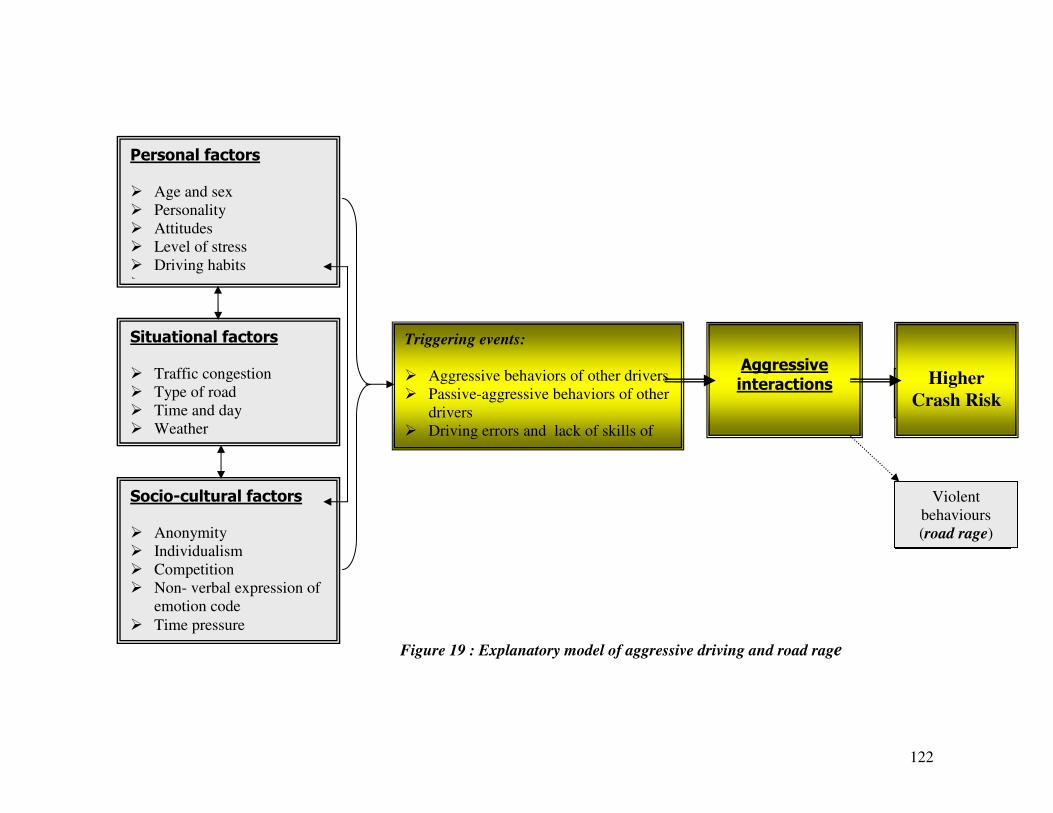
122
Violent behaviors(road rage)
Personal factors � Age and sex � Personality � Attitudes � Level of stress � Driving habits � exposure
Situational factors � Traffic congestion � Type of road � Time and day � Weather
Socio-cultural factors � Anonymity � Individualism � Competition � Non- verbal expression of
emotion code � Time pressure
Figure 19 : Explanatory model of aggressive driving and road rage
Triggering events:
� Aggressive behaviors of other drivers � Passive-aggressive behaviors of other
drivers � Driving errors and lack of skills of
other drivers
Aggressive
interactions Actes violents (road rage)
Higher
Crash Risk
Violent behaviours (road rage)
Human Factors in the Motor Carrier Industry in Canada 123
Bergeron, Thiffault and Smiley (2000) propose the following operational definition of aggressive driving: General definition Aggressive driving implies interactions between two or more individuals; it refers to dangerous, intimidating, competitive or impulsive driving manoeuvres, to the emotional experience of the drivers involved and to the expression of that emotional content. Specific components
• The most frequent aggressive driving manoeuvres are: tailgating, weaving in traffic, unsafe passing, passing on the right, competitive speeding, failure to yield, and failure to signal.
• The drivers’ emotional experience is defined by irritation, frustration, aggressiveness, hostility and in some cases impulsiveness.
• The verbal and non-verbal expression of emotions includes insults, obscene
gestures, facial expressions, eye contact, body language, improper use of high-beams, immoderate horn sounding, as well as certain modifications in the driving style that express a driver’s emotion.
This definition provides a suitable basis for an operational definition. It refers, in a general manner, to intimidating, competitive and dangerous driving manoeuvres, which is not restrictive. It then identifies benchmarks for outside observers by specifying precise driving behaviors. It also adds an essential dimension by referring to the emotions that accompany aggressive driving and to the modes of expression of these emotions. This definition, therefore, covers the whole field of aggressive driving by including all components of this phenomenon that have already been linked with dangerous behaviors, violations and crashes in the context of scientific studies. It also has implications in terms of measurement and remedial action. According to Sümer (2003), aggression is one of the two main personality traits that influence risk-taking and driving style. There has been a large quantity studies on the issue (e.g. Beck et al., 2006; Beirness and Simpson, 1997; Bliersbach and Dellen, 1980; Deffenbacher et al., 1994; Donovan et al., 1990; Ellison et al., 1995; Glendon et al., 1993; Gulian et al., 1989; Harding et al., 1998; Hauber, 1980; Hemenway and Solnick, 1993; Hennessy and Wiesenthal, 1997; Hennessy and Wiesenthal, 2005; Jonah et al., 1997; Kenrick and MacFarlane, 1986; Lawton, Parker and Stradling, 1997; Lynch et al., 1995; Lowenstein, 1997; Marsh and Collett, 1987; Matthews et al., 1998; Matthews et al., 1999; Novaco, 1991; Paleti et al., 2010; Simon and Corbett; 1996). The work by West et al. (1993) and by Lawton, Parker and Stradling (1997) has shown that mild social deviance, as measured by the Social Motivation Questionnaire, is also related to violations and crashes.
Human Factors in the Motor Carrier Industry in Canada 124
There is no need here for a full and comprehensive review of the literature on the issue, however examples of what researchers have observed are listed below:
• Aggression has been identified as a major source of risky-driving (Beirness and Simpson, 1997; Lawton, Parker and Stradling, 1997; Deffenbacher et al., 1994);
• In a study carried out with the Driver Behavior Inventory, Matthews et al. (1999) report that aggression is the best predictor of crashes and violations. Matthews et al. (1991, 1997; see Matthews et al., 1998) observed a relationship between aggression and involvement in crashes in British, American and Japanese drivers;
• Simon and Corbett (1996) compared a group of high-risk drivers to a control group and found that regardless of age, sex or crash record, drivers with many violations are significantly more aggressive than drivers with few violations;
• Ulleberg and Rundmo (2003) observed influences of personality traits (aggression, altruism, anxiety and normlessness) on dangerous driving. They pointed out that these influences were probably indirect (distal) and modulated by attitudes which themselves have a direct influence;
• Iverson and Rundmo (2002) noted that aggression is a significant factor in explaining dysfunctional reactions on the road. Drivers who reported more aggression when driving engaged in more risky behavior and had more crashes;
• Miles and Johnson (2003) revealed the extent of aggressive driving in the United States and related Type-A personality to this behavior. They also distinguished road rage from aggressive driving;
• Ulleberg (2002) noted that sensation seeking is the personality trait most often evoked to explain dangerous driving, but that social deviance, hostility, aggression, impulsiveness, quality of emotional adjustment and low altruism have also been related to risk-taking and involvement in crashes;
• Wells-Parker et al. (2002) pointed out that there is a great deal of empirical evidence to the effect that aggressive tendencies are associated with crash risk;
• Deffenbacher et al. (2000) found relationships between aggressive driving, violations and crashes: aggressive drivers engage in 1.5 to 2 times more high-risk driving behavior and have more near-misses, loss of control and crashes;
• Shinar and Compton (2004) report that aggressive driving is identified as the most important road safety problem by 39% of respondents in the U.S. (see Bureau of Transportation Statistics, 2000). Citing various authors, they note that male drivers are more aggressive than females and that young drivers are at higher risk. Their results also suggest that congestion and time pressure are key situational factors, and that their effects is mediated by the value of time to the driver; with congestion during the afternoon rush hour having more impact than the same degree of traffic density later in the evening;
• Houston, Harris and Norman (2003) related aggressive driving to hostility, hyper-competitiveness, aggressive thoughts and negative emotions while driving. They developed an 11-item scale (the Aggressive Driving Behavior Scale), which measures aggressive driving correlated with these dimensions. After testing the scale on a sample of 200 drivers, they noted that the data reveal two principal factors (speeding and conflict behavior) that are positively correlated with all four dimensions. They suggest using the scale for research and self-evaluation.
Human Factors in the Motor Carrier Industry in Canada 125
A question that arose from the public debate on road rage is whether aggressive driving is on the increase. Since there are no well-established operational definitions or objective measures of these behaviors (Dulla and Geller, 2003), it is hard to assess their prevalence, let alone changes in prevalence. Whether the phenomenon is increasing or not however is not the key issue. The important conclusions stemming from the literature is that aggression is a basic human emotion that manifests on the road where it may interfere with driving performance and engender dangerous driving actions. As noted, numerous studies have associated aggressive driving with risk-taking, violations and crashes. This dimension of personality should therefore be included in any driver assessment procedure and it is of high-value for interventions, examples of which will be addressed in the following section on interventions aimed at decision errors. 2.2.3.2.3 Type-A personality Tay, Champness and Watson (2003) noted that while sensation seeking is an established predictor of risky-driving, few studies have considered the contribution of type-A personality. The authors observe that the utility of risky driving behaviors such as speeding is determined by personality traits, which should be taken into consideration when designing interventions. For example, they outline that drivers’ decision to engage in risky-driving is based on a form of cost/benefit analysis; while increases in costs (e.g. fines for speeding) may have significant impacts on the decision to speed, the evaluation of the benefits of speeding, which depend on personality, is also very influential. A sensation seeker will assign a greater benefit to speeding and will therefore be more willing to drive fast in order to satisfy his need for excitement. A low sensation seeker will not see these benefits as the evaluation will be dominated by potential costs and thus will be less willing to drive fast. Therefore, according to Tay, Champness and Watson (2003), speed does not have the same type of attraction for people with type-A personalities that it does for sensation seekers. Type-A individuals are competitive; they have feelings of time urgency and aggressiveness, but not necessarily a need for stimulation or an aversion to monotony. Studies indicate however that type-As also take more risks at the wheel, have more violations and crashes, drive more erratically, and report more aggressive driving and speeding than the rest of the population (Perry & Baldwin, 2000; West, Elander, & Fench, 1993; Evans, Palsane, & Carrere, 1987; Shahidi, Henley, Willow, & Furnham, 1991; Perry, 1986). However, according to Tay et al., dangerous driving by type-As does not arise from thrill seeking and this has implications in terms intervention design. In their 2003 study, the authors observed the relationships between type-A personality, sensation seeking and self-reported driving behavior in a sample of 139 drivers. They found positive correlations between speeding and sensation seeking (r = .275, p< .001) and between speeding and type-A (r = .235, p < .006). The data also show that sensation seeking declines with age, whereas type-A remains constant. The authors concluded that sensation seeking would be a somewhat better predictor of speeding, especially in young drivers, but that type-A personality should also be considered in driver assessment since it is associated with risk-taking, crashes and violations, although based on different
Human Factors in the Motor Carrier Industry in Canada 126
motivations than sensation seeking. The authors point out that this type of personality is probably more open to attempts to change driver attitudes and that a variety of treatment programs and stress management exercises are already available for type-As. 2.2.3.2.4 Locus of control Another personality factor that has been related to dangerous driving is the concept of locus of control. It should however be mentioned that the results of this line of research are rather inconclusive. Locus of control reflects an individual’s perception of the control over the events in his/her life. “Internals” have the feeling that they control events, while “externals” feel that it is generally others who are in control and that events are governed by external factors (Rotter, 1966). Some authors (Gore and Rotter, 1963; Higbee, 1972; Horswill and McKenna, 1999; Klonowitz and Sokolowska, 1993), suggest that internals tend to take more risks because they have a feeling of greater control over what happens to them, while others (DuCette et Wolk, 1972; Hoyt, 1973; Janicak, 1996; Phares, 1978; Salminen and Klen, 1994; Terry Galligan and Conway, 1993; Williams, 1972), submit that externals take fewer precautions when driving because they think crashes are caused by external agents. The two situations are however not mutually exclusive. In a recent study, however, Iversen and Rundmo (2002) did not find any relationship between external locus and dangerous driving or self-reported accidents. Finally, it is worth noting that this dimension can be linked to the PBC concept, as understood in the TPB. 2.2.3.2.5 Personality and driving style Taubman-Ben-Ari, Mikulincer and Gillat (2004) developed a scale to identify driving styles. The scale is of interest because it measures factors directly related to driving and therefore in a proximal relationship with violations and crashes, and because it assesses personality dimensions that are involved in risk-taking. This is consistent with the findings of West and Hall (1997), Rimmo and Aberg (1999) and Sümer (2003), for whom the effect of personality traits on the probability of being involved in a crash is based on their impact on driving style. Observation of driving style is thus important when attempting to explain or predict crashes. After analysing existing scales used to assess driving behavior, the authors hypothesized that driving styles can be integrated into four broad dimensions: (1) reckless and careless driving, (2) anxious driving, (3) angry and hostile driving, and (4) patient and careful driving. They developed the Multidimensional Driving Style Inventory (MDSI), a 44 items instrument that measures these four dimensions. It was administered to 328 subjects. Analysis revealed eight factors, explaining 55% of the variance. Factor 1 (explaining 20% of the variance), called dissociative driving style, includes eight items reflecting the tendency to be easily distracted and to make distraction-related errors while driving. Factor 2 (10% of the variance), called anxious driving style, reflects the tendency to feel distress, doubt and lack of self-confidence when driving. Factor 3 (6% of the variance), called risky-driving, reflects the tendency to seek stimulation and risk and to make risky-driving decisions. Factor 4 (5% of the variance), called angry driving style,

Human Factors in the Motor Carrier Industry in Canada 127
reflects the tendency to feel hostility toward other drivers and to behave aggressively. Factor 5 (4% of the variance), called high-velocity driving style, reflects the tendency to drive fast and experience time pressure while driving. Factor 6 (4% of the variance), called distress-reduction driving style, reflects the tendency to engage in relaxing activities to reduce distress while driving. Factor 7 (3% of the variance), called patient driving style, reflects the tendency to be polite toward other drivers and to display patience. Finally, factor 8 (3% of the variance), called careful driving style, reflects the tendency to be careful when driving, to plan the driving trajectory and to adopt a problem-solving attitude towards driving-related problems and obstacles. There are significant positive correlations among risky, high-velocity, angry and dissociative driving styles. According to Taubman-Ben-Ari et al. (2004), this implies the existence of a maladaptive way of driving, possibly associated with emotional maladjustment, violations and crashes. These styles are inversely associated with the careful and patient styles. ANOVAs reveal differences related to gender, with women having significantly higher scores for dissociative and anxious driving styles and men having higher scores for careful driving. It is also of interest to note that age is inversely correlated with dissociative, angry, risky and high-velocity driving. Also of interest are the relationships between the driving styles and personality factors that may be indicators of emotional adjustment, as shown in Table 20. Table 20: Correlations between driving style and personality (from Taubman-Ben-
Ari et al., 2004)
As shown, low self-esteem is related to dissociative and risky-driving; need for control is related to careful and angry driving; sensation seeking is positively correlated with risky-driving and negatively correlated with careful driving, and extraversion is related to dissociative and anxious driving. Also, the number of self-reported crashes had a significant correlation with scores for angry driving (r = .22, p< 0.01), risky-driving (r = .35, p< 0.01) and dissociative driving (r = .26, p< 0.01), while being negatively correlated with careful driving (r = -.23, p< 0.01). Partial correlations, controlling for age and amount of driving, revealed that the number of violations was significantly and positively correlated with risky-driving (r = .19, p< 0.01) and high-velocity driving (r = .22, p< 0.01).

Human Factors in the Motor Carrier Industry in Canada 128
The authors conclude that MDSI scores predict involvement in crashes and violations. Maladaptive styles such as risky and high-velocity driving contribute significantly to such involvement, even when one controls for socio-demographic variables and personality traits. It would therefore be of interest to consider using the MDSI when preparing tests to predict dangerous driving. Finally, Sommer, Herle, Hausler et al. (2008) made the distinction between ability and personality determinants of driving, pointing out that both sets of determinants have been related to driving but in separate theoretical conceptions. In order to clarify the roles of these factors in the production of behavior, the authors refer to the three-level hierarchical model of Michon (1985). In brief, they observe that personality traits such as social responsibility, self-control, sensation seeking and willingness to take risks impact mainly on the tactical level, where decision and cognitive processes adjust driving behavior to task demands. Also, according to Sümer et al. (2006) as well as Harré and Sibley (2007) better skills do not necessarily correlate with safety, since skilled drivers tend to increase task demands, thereby increasing the objective level of risk of their driving. These authors furthermore warn about the potential negative effects of driver training that would only target driving skills, and point to the need for also addressing driving style and promoting safety skills. 2.2.3.4 Risk perception
Sensation seeking implies that one engages in risky-driving behaviors in order to experience the physiological changes that are associated with these activities (Zuckerman, 1979). Risk-taking is then explained in large part by a motivational factor; it is instrumental in reaching a valued psychophysiological state. Aggressive driving on the other hand implies that dangerous driving can be related to the expression of an uncontrolled emotional response. In both cases, risky-driving has a utility, it serves a purpose. It may however happen that a driver exposes himself to dangers without being fully aware of it, because of problems in understanding the risk of the situation (Borowsky et al., 2009; Deery, 1999, Isler et al., 2009; Machin et al., 2008; Rosenbloom et al., 2008; Sundström, 2008; Wallis & Horswill, 2007). Musselwhite (2006) conducted a study on the social motivations and attitudes related to risky-driving. They observed that drivers who took risk unintentionally did indeed form a significant group. Risk perception is a central factor in the production of risky behaviors. According to Deery (1999), it can be defined as the subjective experience of a person in a potentially hazardous situation. Since the degree of difficulty of the driving task is in large part determined by driver actions, this subjective experience, together with the individual’s target (desired) level of risk, has a determining impact on risk management, driving performance and actual safety (Horswill & McKenna, 2004). Risk perception is a cornerstone of most risk-taking control models. It has previously been shown that a faulty assessment of risky situations is associated with risky-driving (Thiffault, 1991; Wilde, Robertson & Pleiss, 2002). Given that individuals base their
Human Factors in the Motor Carrier Industry in Canada 129
behavior on perceived risk, a problem at this level alters the whole process of risk management. The driver is not really taking risks per se, but is more exposed to hazards because these are not properly perceived, and adapted to. In this context, the explanation of risky-driving is therefore not motivational but rather based on cognitive appraisal. This observation is important because it underlies two different approaches to intervention; one seeks to change behavior by acting on motivation, attitudes and emotions while the other focuses on cognition by means of education and training. Renge (1998) as well as Finn and Bragg (1986) emphasize the importance of clearly distinguishing these two causes of dangerous driving when designing interventions. According to Brown and Groeger (1988), Harré and Sibley (2007) as well as Tronsmoen (2008), risk perception includes the evaluation of potentially risky situations but also the evaluation by the driver of his own abilities to cope with perceived risk. Various studies suggest that novice drivers have problems with both these evaluations. First, they have more difficulty in perceiving hazards in the environment (Brown and Groeger, 1988; Renge, 1980; Benda and Hoyos, 1983; Ogawa, Renge & Nagayama, 1993). Mourant and Rockwell (1972) indeed found that their visual search patterns differs from that of more experienced drivers in that they pay less attention to distant objects. McKnight and McKnight (2000) also report that young drivers are less efficient in detecting hazards and that their monitoring strategies are inadequate. McKenna and Crick (1991) as well as Quimby and Watts (1981) observed that young drivers have longer latency times for risk perception, and according to Quimby, Maycock, Carter, Dixon, & Wall (1984), latency time is associated with higher crash rates. Second, while younger drivers have limited experience, they tend to overestimate their driving skills (Delhomme, 1991; Harré & Sibley, 2007; Liu et al., 2009; Matthews & Morand, 1986; Sivak, Soler & Trankle, 1989; Williams, Paek & Lund, 1995). Partly because of this tendency, they under-evaluate the probability of being involved in a crash. It was shown that young drivers believe that they are less likely to have a crash than their peers or older drivers. As a result, they are less careful and have greater exposure to hazards (Finn and Bragg, 1986). It is important to note however that while younger drivers have a higher tendency for overconfidence, this problem is not limited to them. As discussed by Harré and Sibley (2007), many studies indeed indicate that most drivers tend to consider themselves superior to their peers on numerous dimensions such as driving skills, reflexes, judgment and safety. It is also widely understood that such overconfidence, for the general driving population, is negatively correlated with safety. Rothengatter (2002) points out that a number of different concepts have been put forward to explain these phenomena. There is the concept of self-enhancement when a drivers thinks he is better than others, either through inflatory self-assessment or deflatory assessment of others. Rothengatter refers to Walton (1999), who suggested that this self-enhancement is based on a need for self-justification, and to McKenna, Stanier and Lewis (1991), for whom this optimism bias comes from the expectancy of positive outcomes arising from illusory optimal control over the driving situation.
Human Factors in the Motor Carrier Industry in Canada 130
Rothengatter refers to the explanation given by Summala (1997) and by Fuller (2000) that novice drivers must learn to match their capabilities with the task demands. The problem would be that capabilities increase during the learning process and that errors are only rarely followed by a crash. There is therefore usually no negative feedback or adverse events to warn drivers that they are in a situation where task demands have exceeded their capabilities. This phenomenon would create an illusion of control and therefore would generate a form of self-enhancement that can only be negative for safety. Rothengatter argues that these processes are of interest for road safety since they can be assessed, and since they are modifiable through specific training approaches. It is interesting here to look back at the result of the Llaneras et al. (2005) study on CMV drivers’ distraction. The data showed that CMV drivers perceive themselves as better than light vehicle drivers at handling distracting activities while driving because they are professional drivers, have more experience and know what to do. Safety officers however revealed that this overconfidence might not be entirely justified since drivers held misconception about when it is safe to use distracting devices. Also, even though they believe that they are fully capable of managing distracting activities, 48% of CMV drivers reported experiencing a close call while using a distracting device while driving. The notion of overconfidence and how it relates to safety should therefore be carefully addressed in the specific context of CMV drivers. As professional drivers, in control of large and powerful vehicles, it is indeed possible that CMV drivers would become overly confident in their abilities to cope with traffic situations. In this regard, Thomas and Walton (2007, 2008) observed that SUV drivers possess a lower level of perceived risk compared to light vehicle drivers, a condition that could potentially be exacerbated for CMV drivers because of the nature of their vehicle relative to surrounding light-vehicle traffic. The situation of risk perception for CMV drivers should be properly assessed since understanding drivers’ mental processes is a critical part of planning interventions (Harré and Sibley, 2007). There is a clear research gap here that should be addressed. 2.3 Decision errors: countermeasures and research needs
As briefly discussed earlier, Lonero and Clinton (1997), Lonero (2007) as well as Gielen and Sleet (2003) noted the presence of a tension between passive safety strategies, focused on developing safer roads and safer vehicles, and active strategies, aimed at changing the way people drive. They observed that the passive safety paradigm has been central in road safety for the last four decades, a situation which they attribute to the weakness of former traditional behavioral interventions, as well as to the substantial safety gains that were once easily achieved by equipping cars with better occupant protection systems and building safer roads. The authors however note that the potential for safety gains under the passive safety paradigm is progressively declining and that we are still faced with an unacceptable situation regarding road fatalities. They quote NHTSA former administrator Martinez (2000) who observed that the easy gains from passive safety have been achieved and that additional gain from occupant protection and safer roads is progressively becoming more difficult and more expansive.

Human Factors in the Motor Carrier Industry in Canada 131
Given the above, these authors emphasize that new active safety interventions, aimed at changing driver behaviors, are becoming an essential component for a novel, more comprehensive approach to road safety. As discussed by Lonero (2007), this situation is even likely to evolve into a paradigm shift, moving from a field mainly centered on passive safety to a more global approach where drivers are also seen as a significant and workable part of the solution. Note that such a paradigm shift is already taking place in the motor carrier industry in the United-Sates and Europe following recent crash-causation studies where the extent of the contribution of driver errors to CMV crashes was made very obvious. It is becoming clearer every day that governments and research agencies are looking at driver-based interventions to address truck crashes. However, it is also clear that these interventions will not replace passive safety developments, but rather complement them, in a more systemic approach to the problem. A close look at current trends with regards to interventions in the motor carrier industry indeed shows that the passive safety approach still has the potential to provide significant safety gains. Amongst other things, important progress has been made with regards to crash avoidance technologies and driver assistance/monitoring systems. Looking at data from the LTCCS, Hauser and Flannery (2008) demonstrated that recent technologies such as roll stability control (RSC), lane-departure warning systems (LDWS) and forward collision warning systems (FCWS) could have prevented or mitigated at least 19% of truck driver errors related to physical, recognition and decision factors in the study sample. ATRI (House et al. 2009, Murray et al. 2009a, Murray et al. 2009b) have also demonstrated that the adoption of these technologies would be cost-efficient for the industry. Other technologies currently being developed such as on-board safety monitoring systems (OBSM), fatigue-monitoring devices, electronic-on-board-recorders (EOBR) as well as real-time distraction mitigation technologies, also hold great promises for safety gains. Some of these technologies will be presented in a latter section. It is safe to say that their adoption, or in some cases their further development and validation, will undoubtedly be a key component of our recommendations to Canadian stakeholders. Nevertheless, as pointed out by Lonero (2007), these passive safety strategies all have driver behavior implications and should therefore be coordinated with complementary active driver-based interventions. The field of ergonomics and human factor engineering, focused on designing and testing on-board telematics systems that respect human factors standards, also represents a significant domain that needs to be emphasized and resourced. Given recent changes in the driving task, created by an incremental and unregulated penetration of computer-based applications and devices in the day-to-day experience of truck drivers, it is indeed paramount that all forms of telematics be designed in order to be efficient with regards to issues such as usability, mental workload, perceptual and attentional cost, etc. However, even though the passive safety paradigm is still central for motor carrier safety interventions, the continuing high prevalence of driver decision errors and their heavy
Human Factors in the Motor Carrier Industry in Canada 132
contribution to crashes - even in the context of well-engineered trucks and roads - substantiates the need to develop new innovative behavioral approaches to address these issues directly. Again, the idea is not so much to shift the focus from passive safety to behavior modification, but rather to complement the engineering approach with driver-oriented strategies in order to maximize the scope of available interventions. It was evident from the TRB 2010 FMCSA ART forum that the U.S. government is considering unsafe driving as a top crash-causation factor and a priority for action. With the new upcoming safety-rating framework (CSA-2010), FMCSA has developed a novel strategy that will be more efficient in detecting and monitoring high-risk CMV drivers. It is however apparent that a gap exists with regards to interventions that could be applied to change the behaviors of these drivers. CSA-2010 will generate a more detailed safety profile of drivers, but as of January 2010 the framework does not include the prescription of adapted, scientifically sound, intervention strategies. A similar situation exists in Canada; high-risk drivers may be identified trough the carrier safety-rating regime, but no advances have been made with regards to driver-based interventions, at least from a government perspective. It is one thing to detect high-risk driving and high-risk drivers, but it is another to address these problems to prevent road crashes. It is therefore apparent that driver-based interventions need to be developed, evaluated and implemented. Traffic psychology and health promotion offer a vast body of evidence-based knowledge from which they can be derived. It is time to seriously consider tapping into this knowledge to develop and implement these interventions. Considering the different determinants of risky-driving outlined above, there appears to be clear opportunities to articulate interventions that will factor-in and/or target the attitudes, personality traits, motivations and risk-perception skills of drivers. In some cases such as driver assessment, the leads to follow are rather straightforward. In other cases, such as the promotion of lasting attitudinal and motivational changes, there will be further R&D needed. Note however that while such evidence-based and theory-driven interventions may not have been developed yet, the science with regards to the basic rules and principles that should be followed is readily available in the specialized literature (Foss, 2007). It is important to underline that the CMV driver population represents a specific target that offers more opportunity for driver-based interventions, and better odds for success, than that of the general population. Professional drivers have a social responsibility and are subject to diverse monitoring/control mechanisms that are likely to encourage the adoption of safer behaviors. When a driver deviates from this line of conduct, there are numerous opportunities for both the company and the authorities to intervene. Also, since a significant segment of the CMV population operates within organizations, much can be done to change individuals’ attitudes and motives through company safety programs. For example, recent developments in the areas of organizational safety culture, Safety Management Systems (SMS) as well as behavior-based safety and incentive programs are good indicators that the promotion of proactive safety attitudes and motivations is already seen as a priority at the carrier level.
Human Factors in the Motor Carrier Industry in Canada 133
2.3.1 Driver-based interventions It is generally understood that although widely used and conceptually appealing, interventions such as awareness campaigns, education and driver training tend to produce marginal effects on actual driving behaviors. As stated before, given these alleged minor effects, more focus was placed on passive safety and engineering approaches to address road crashes. The idea was that rather than trying to change behavior, it could be more efficient to change the nature of the driving task so that drivers have fewer opportunities to make errors, and less risks of being injured when doing so. While this reasoning makes a good case for further advancements in the engineering of roads, vehicles and telematics, there are serious reasons today to emphasize that investing resources in passive safety should by no means entail the abandonment or the disinvestment of driver-based interventions. First, the results of crash-causation studies indicate that the main causes of crashes are not drivers’ lack of skills but rather violations and risky-driving style. It is difficult to envision how engineering approaches alone could satisfactorily alter the way people opt to drive, even when considering new driver assistance and crash-avoidance technologies. As long as drivers control tracking and speed, the task will remain vulnerable to risk-taking behaviors. Second, the fact that driver-based approaches such as awareness, education and training have not lived up to expectations should not lead to their rejection, but rather to their re-examination. It is indeed surprising to realize that most of these interventions have so far remained insensible to the advancements in traffic psychology and health promotion; they are seldom based on scientific theories of driving behavior or behavior modification and are rarely tailored to the psychological determinants of risk-taking for targeted populations. Clearly, much more can be done in terms of driver interventions and fresh analysis of the problem is warranted.
In sum, given that decisions errors cannot be fully addressed by engineering
strategies alone, driver-based interventions need to be incorporated in a
comprehensive approach to road safety countermeasures. However, they need to be
reconsidered in light of existing evidence-based theories of risk-taking and behavior
modification.
In 1994, Lonero et al. published a seminal report on interventions aimed at changing driver behavior and later followed up on their main ideas in a series of publications, creating a significant input for discussions regarding driver-based interventions (see Gielen and Sleet, 2003; Lonero et al., 1994; Lonero and Clinton, 1997; Lonero et al., 2001; Lonero, 2002; Lonero et al., 2004; Lonero, Clinton and Sleet, 2006; Lonero, 2007). Although they use somewhat different angles, some of their key arguments are similar to the main themes developed in the current review on potential interventions to address risky-driving behaviors. The main themes of this body of literature are briefly summarized below.
Human Factors in the Motor Carrier Industry in Canada 134
In a discussion on the application of behavior-change theories to injury prevention, Gielen and Sleet (2003) make the case that behaviors that lead to injuries are largely preventable and that behavioral science is therefore an integral part of a comprehensive prevention strategy. However, like Lonero and Clinton (1998), they observe that contrary to other fields - such as public health and health promotion - behavioral solutions have been seriously deemphasized in road safety because of weak past results. The authors furthermore emphasized that these former interventions were based on common sense rather than derived from sound theories and research. Most traditional driver-based road safety interventions indeed usually fail to use models of human behavior, to apply theories of behavior change, to incorporate the determinants of high-risk behaviors for targeted populations and to use evaluative studies in order to develop and maintain efficiency on the basis of empirical data. For example, there is still a widespread belief that raising drivers’ awareness of the dangers of speeding with catchy phrases on the roadside will change their behaviors. According to the authors, this is by all means a simplistic and inaccurate assumption deprived of any scientific basis. These arguments are also central to an important discussion authored by Robert Foss (Foss, 2007) on the use of behavioral elements in traffic safety. In brief, Foss observes that far less progress was achieved in altering the behaviors of drivers compared to the engineering of roads and vehicles. According to him, and like Lonero et al. suggest, this situation can be attributed to the fact that driver-based interventions in road safety have been overly simplistic and based on common sense and scientifically unfounded concepts, such as the idea that providing information through awareness programs or increasing the severity of penalties - two of most widely used interventions - will automatically change driver behavior. Such views completely fail to account for the complex organization of the multiple determinants of human behavior and the fact that it is resistant to change. Foss observes that we need to take a far more enlightened approach to developing and implementing programs and policies than what is currently the case. Continuing to use a common sense and instinctive approach to change driver behaviors is doomed to fail at influencing safety while wasting large amounts of limited resources and impeding the development of scientifically sound driver-based interventions. The key to Foss arguments, and he makes it very clear, is that there are multiple proven evidence-based theories of human behavior and behavior modification and that we need to take advantage of these vast stores of scientific knowledge. In order to be effective in saving lives, it is imperative that interventions are based on human behavior theories and that they respect and factor-in the essence of these theories in every step of implementation. He identifies the TPB as a well-proven theory from which interventions could be derived.
Accordingly, it is important to foster a deep-rooted dedication to developing approaches that tap into fundamental principles of human behavior as detailed in accumulated literature of the behavioral and social sciences.
- Robert Foss, 2007 (P.12)
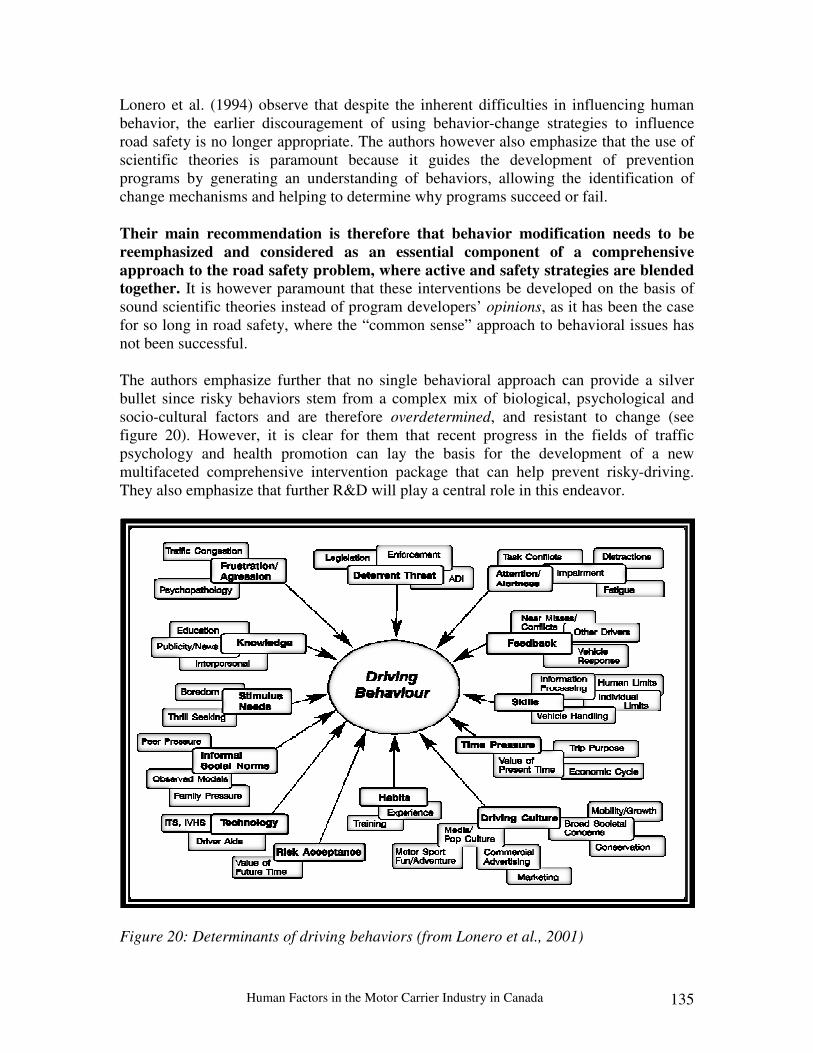
Human Factors in the Motor Carrier Industry in Canada 135
Lonero et al. (1994) observe that despite the inherent difficulties in influencing human behavior, the earlier discouragement of using behavior-change strategies to influence road safety is no longer appropriate. The authors however also emphasize that the use of scientific theories is paramount because it guides the development of prevention programs by generating an understanding of behaviors, allowing the identification of change mechanisms and helping to determine why programs succeed or fail. Their main recommendation is therefore that behavior modification needs to be
reemphasized and considered as an essential component of a comprehensive
approach to the road safety problem, where active and safety strategies are blended
together. It is however paramount that these interventions be developed on the basis of sound scientific theories instead of program developers’ opinions, as it has been the case for so long in road safety, where the “common sense” approach to behavioral issues has not been successful. The authors emphasize further that no single behavioral approach can provide a silver bullet since risky behaviors stem from a complex mix of biological, psychological and socio-cultural factors and are therefore overdetermined, and resistant to change (see figure 20). However, it is clear for them that recent progress in the fields of traffic psychology and health promotion can lay the basis for the development of a new multifaceted comprehensive intervention package that can help prevent risky-driving. They also emphasize that further R&D will play a central role in this endeavor.
Figure 20: Determinants of driving behaviors (from Lonero et al., 2001)
Human Factors in the Motor Carrier Industry in Canada 136
Lonero et al. (1994), Gielen and Sleet (2003) and Jonah (1990b) stress that the utilization of behavior-based interventions has been much more serious and successful in the field of public health and heath promotion, where it has strong political backing. As a result, individuals today are more involved, responsible and proactive with regards to the management of their own health than they were twenty years ago. It is however understood that in this context, interventions are based on strong empirically-driven theories of behavior change and are comprehensive, multifaceted, participative, socially supportive and lifestyle oriented, in contrasts with the common sense decentralized approach that has been used in road safety. It is therefore strongly recommended that road safety program developers import some of this precious applied knowledge in order to develop comprehensive scientific approaches to address risky-driving. According to Lonero et al. (1994) as well as Lonero, Clinton and Sleet (2006), successful scientific behavior-change theories include cognitive models (psychosocial approach), behavioral models (use of behavior modification and motivation) and risk-utility/decision models. In turn, the four traditional domains of intervention in road safety are legislation, enforcement, reinforcement and education. Looking at a vast amount of scientific evidence stemming from the theories, Lonero et al. (2006) developed a comprehensive discussion on the current and potential efficiencies of each of these four domains of applications. Some of their conclusions are highlighted below. With regards to legislation the authors observe that laws form the core of the cultural package that determines how drivers should perform on the roads. It has a declarative function by communicating socially acceptable standards and a deterrent function by threatening sanctions for violators. The effectiveness of laws is related to factors such as regulatory philosophy (desirability of restrictions to individual liberties/paternalistic protection of us from ourselves), moral suasion (efficiency in declaring social values that would impact on behaviors), deterrent effects (support needed to maximize impacts on behavior and maintain effect over time) and encouraging internal controls (development of value change, self-control and informal social norms over time). The authors conclude that while informal rules and traffic culture often predominate, legislation remains key to progress although it needs more support from the other behavior-change domains. Enforcement is described as the means to deliver in practice the deterrent effect of legislation. If efficient in delivering a sanction, it has a specific deterrent effect, limiting reoccurrence of the behavior and is a disincentive (general deterrence) since it prevents others from engaging in it. Effectiveness factors include short-term short-range effects stemming from increased subjective risk of being caught even in the presence of low objective threat enforcement, as well as general deterrence, which depends on perceived threat and intensity of surveillance. The main limitations of enforcement stem from the fact that (1) punishment is a weak behavior modifier (in comparison to reinforcement) and (2) there are severe practical limitations to the amount of police (or CVSA, for that matter) surveillance that can reasonably be generated. Note that automatic enforcement (speed cameras, on-board data-recorders and driver monitoring systems) offers efficient solutions to the latter.

Human Factors in the Motor Carrier Industry in Canada 137
Reinforcement is based on the simple rule that a positive reinforcement following the production of a behavior will increase the ulterior production of the said behavior. Note that reinforcement is the basic principle at the root of incentive programs that have been successfully applied in the motor carriers industry (Wilde, 2001). Reinforcement consolidates the internal controls that help create desirable habits and internalised social norms. It is widely understood that reinforcement (positive consequence) is far more efficient than enforcement (negative consequence) to change behaviors. According to Lonero et al. (1994) it is in fact the most powerful influence domain to change driver behavior, even though it is rather scarcely implemented. The authors note that transferring behavior analytic technologies to operational programs is seen as a high priority. The development of incentive programs in the motor carrier industry would perfectly fit this recommendation. This notion will be discussed further in a latter section. Education covers various skill and knowledge transfer activities, ranging from general driving reminders to advanced driver training. The authors however note that the choices have traditionally been between narrow, intensive training and shallow information programs. They emphasize that what makes education work is quite well known but that it has seldom been put in practice in the context of driver education and training programs. They observe that there is a controversy in the methodologies used to assess the efficiency of these programs and that safety improvements are not always the best indicators of success. They also emphasize that traditional mass media program have little effects but that the use of a social marketing approach could significantly improve their efficiency. In terms of driver education and training, they observe that crash reduction is not likely to occur if hazard perception is not included nor if motivational approaches aimed at increasing drivers’ desire to be safe are not used. 2.3.2 A fresh look As mentioned above, the field of driver-based interventions needs to be re-examined in light of theories of driver behavior and behavior change. It is important to note that this field has been in a renewed R&D phase for the last decade or so. Numerous studies are being conducted to expand the scientific knowledge about the determinants of risky-driving and how to influence these behaviors. It is clear however that further work needs to be done to translate these fundamental ideas and scientific principles into practical interventions, especially with regards to their application to the motor carrier industry. Such an undertaking cannot be achieved under the current mandate and timeframe of this task force, nevertheless the following sections will provide an update on these fundamental ideas and principles and provide guiding principles for next steps. In the previous section on the determinants of risky-driving, three broad approaches were described: (1) the psychosocial theories, (2) personality dimensions, and (3) risk-perception. Each one of these approaches brings specific leads as to what could be done to influence drivers’ risk-taking behaviors. In fact these three interrelated fields have implications with regards to two intervention domains: driver assessment and behavior modification. Note that applied behavior analysis principles stemming from behavioral psychology also offer strong behavior modification strategies that need to be addressed.
Human Factors in the Motor Carrier Industry in Canada 138
On the one hand, there are the leads for interventions according to the above-mentioned approaches. These approaches provide explanations as to why individuals take risks when they drive and rationales as to what should be done to prevent them from doing so. On the other hand, there are the intervention domains through which driver-based interventions have traditionally been conducted in the motor carrier industry. The following section will first describe what could, or should be done from a theoretical, perspective to impact on risky driving. Next, the traditional domain of intervention will be discussed with the objective of making recommendations regarding potential complements and/or modifications to current practices. 2.3.2.1 Interventions leads derived from the psychosocial approach Two broad psychosocial theories were reviewed in the previous section: the Problem Behavior Theory and the Theory of Planned Behaviors. Their implications for interventions are discussed below. 2.3.2.1.1 The PBT Jessor (1989) explains that advances in health promotion have shown that the burden of injuries is mainly behavior-related and that efforts to promote health therefore need to be based on a complete understanding of behaviors. The PBT has been successfully applied to health promotion, showing that risk-taking and unhealthy behaviors can be regrouped in an instrumental system, or lifestyle, which generates clear benefits that outweigh perceived costs for the individual. Risky behaviors have a utility, which explains why they are resistant to change and why simplistic interventions such as the transmission of information about their dangerousness (awareness programs) are not likely to alter them. Jessor notes that while the PBT has been successful in addressing risk-prone lifestyles in the field of health promotion, it also has applications for road safety. It could for example be used to investigate whether truck drivers’ health-risk behaviors (poor diet, over-the-counter medication, speed drinks, smoking, poor sleep hygiene, sedentary lifestyle, etc.) and various risky-driving behaviors (driving while fatigued, use of distractors, speeding, following to closely, etc.) are organized into a risk-prone lifestyle that would have some utility for them. If such a lifestyle were confirmed, it would be possible to identify its specific positive functions, based on an equation of the perceived benefits (time efficiency & distance covered, peer acceptance, social support) and perceived costs (illness, injuries, sanctions). As it was successfully done in health promotion, such an analysis could feed the development of strategic interventions for CMV drivers. Note that interventions in this context are not behavior-specific but rather lifestyle oriented, and can be based on two different rationales. First the PBT allows the identification of risk and protective factors (i.e. factors that increase or decrease the likelihood that risk behaviors are adopted). Once these factors are identified, it becomes possible to cluster protective factors into a typical positive and healthy lifestyle and to promote its adoption. Theoretically, this should have the effect of decreasing the
Human Factors in the Motor Carrier Industry in Canada 139
frequency of risk behaviors as a whole in the life of the individual. Second, since the PBT allows the identification of perceived benefits of risk-prone lifestyles for specific populations, it would be strategic to identify and promote new healthy and safe behaviors that would make it possible to reach those benefits while avoiding health risks. It is important to emphasize that such a lifestyle intervention approach is coherent with the expanding health and wellness domain that attempts to address truck drivers’ health and safety issues with a global health-oriented strategy (see Krueger et al. 2007 for a review). It is also coherent with the recommendations from Lonero et al. (1994), Lonero et al (2006) and Gielen and Sleet (2003), who suggest using an approach similar to the health promotion model to target risky-driving behaviors.
Rather than aiming specifically at crash reduction, Lonero et al. (1994) indeed recommend the promotion of a globally competent driver that would be highly skilled, crash-free, energy-efficient, socially responsible, non-obtrusive to other drivers, etc. As mentioned above, under the PBT, the clustering of these protective behaviors trough a lifestyle approach would imply that the adoption of one behavior would make the adoption of the other ones easier.
Jessor (1989) indeed observed that like health-risk behaviors, health-enhancing behaviors are organized as systems or positive syndromes. Associating these positive driving behaviors with positive health behaviors could therefore be beneficial; someone who spends time keeping healthy and fit might indeed be motivated to take protective actions in other situations, such as driving. Jessor (1989) notes that this lifestyle approach marks a shift from an emphasis on the prevention and deterrence of risk and unhealthy behaviors to the promotion of health and safety. Offering positive support to health-enhancing behaviors and lifestyles weakens the likelihood of behaviors that are incompatible with these lifestyles in general. In this context, the idea of safety is therefore embedded with health, or being folded as a rubric of health and fitness. Practical implications with regards to the PBT: Given the above, the application of the PBT to both health-risk and risky-driving behaviors of CMV drivers should be seriously considered and is therefore recommended. The first step would be to specify the whole range of health-risk and risky-driving behaviors among this population. The second step would be to conduct a scientific examination of their frequencies and variations in occurrence, looking closely at personal and contextual variables as well as at the dynamics of their interactions. This would create a social psychology of risk behaviors for CMV drivers that, according to Jessor (1989), would provide the information needed for the creation of intervention programs with a logical basis for success. The final step would be to define and efficiently promote a positive health-enhancing lifestyle that should positively impact on CMV drivers’ health as well as their safety on the roads.

Human Factors in the Motor Carrier Industry in Canada 140
2.3.2.1.2 The TPB
The second psychosocial theory that was considered is the TPB. This theory is described in the literature as holding promise for the development of new theoretically sound and tailored interventions to address risky-driving amongst specific populations of drivers, such as those that operate in the motor-carrier industry. Forward (2009a) observed that the number one cause for crashes is deliberate risky-driving behaviors, which are closely related to attitudes and their underlying beliefs. She underlines that traditional interventions to tackle these issues have been united under the 3Es concept (Education, Engineering, Enforcement), but while it is known that the 3Es should ideally be combined and coordinated, this is rarely happening. Education has in fact been seen as the principal means to change drivers’ attitudes and behaviors, but poor results have been achieved so far. However, instead of trying to improve the methods, many have simply abandoned the concept and moved to passive safety approaches. Like Lonero (2007), Forward argues that one way to improve our approach to risky-driving would be to rely on proper theoretical models as the basis for interventions. The TPB is seen a appropriate, potent theory since it enables to predict risky-driving, to understand the motivations of high-risk drivers and to potentially change their behaviors. However, while the first two applications (predict and understand) are camera ready, it is understood in the literature that further R&D is needed for the latter (change behavior).
In order to change a behavior, the cognition underlying the decision to perform the action need to be changed.
Fishbein and Middlestadt (1989)
The notion of changing beliefs appears to be central in the application of the TPB to influence driving behaviors. As a reminder, behavioral beliefs (consequence of the act) are an antecedent of attitudes, normative beliefs (what peers think of behavior) are an antecedent of subjective or descriptive norms and control beliefs (factors that may facilitate or impede the performance of behavior) are an antecedent of PBC (see figure 21).
Figure 21: Behavioral, normative and control beliefs
Human Factors in the Motor Carrier Industry in Canada 141
After using the theory to study what factors predict and motivate drivers to violate, Forward (2009a) gives the following recommendations regarding the use of the TPB to address risky-driving behaviors:
• Strategies tailored for specific populations are more successful than strategies aimed at the general population. They however need to be based on an assessment of the motivations of these specific populations;
• The framing and the content of the strategy also need to be violation-specific, since different motivations may be found for specific behaviors within a single population;
• The beliefs (indirect measures) at the basis of attitudes, subjective norms and PBC (direct measures) provide a deeper understanding of what motivates drivers and should therefore be targeted in efforts to both understand and modify behaviors. Efforts so far to use the TPB to change behavior have been limited to direct measures, which may not be specific enough;
• Given the importance of subjective norms on behaviors (perception of what others think of the behavior), the source of the message need to be appropriate - ideally a peer member of the target population;
• Interventions programs should focus on the target group’s normative beliefs and control beliefs about the specific behaviors that need to be addressed.
In another study, Forward (2009b) validated the impact of descriptive norms on the intentions relative to risky-driving. She makes the following observations:
• Intenders (those who intend to do the behavior) regard the risky-driving behavior as being fairly normal and they overestimate the proportion of the population that commit the behavior;
• It would therefore be strategic in an intervention to portray the behavior as not normal, for example by focusing on drivers that obey the rules and making them the norm, rather than the opposite;
• Shifting the focus to positive and safe behaviors could be more strategic since the long lasting focus on the fact that violations and crashes are endemic probably contributed to their installment as perceived normative behaviors (everybody does it, I do it too);
• The re-positioning of safe driving practices as the descriptive norm should be done using peer group members of intenders to convey the message.
Elliott et al. (2005) conducted a study to evaluate the contribution of TPB’s underlying beliefs structure as predictors of the intention to comply with speed limits. According to the authors, the results validate Ajzen and Fishbein’s (1980) hypothesis that changing TPB’s underlying beliefs should lead to corresponding changes in attitudes, subjective norm, PBC, intention, and ultimately behaviors. In this study, the authors identified the specific beliefs that made important contributions to attitudes, subjective norms, PBC and intentions. They observe that those beliefs could be used to help design road safety interventions to persuade drivers to comply with speed limits.
Human Factors in the Motor Carrier Industry in Canada 142
Elliott et al. reviewed former interventions that attempted to alter drivers’ beliefs, attitudes, intentions and behaviour using the TPB (1) for learner drivers (Meadows and Stradling, 1999), (2) while using video-based technology (Parker et al., 1996) and (3) through a large-scale media campaign (Stread et al., 2002). Only small changes were attained in these studies. Elliott et al. discuss these results by stating that long-term attitudinal changes are hard to achieve since the formation of attitudes start early in life, long before driving age. Changing attitudes through driver education and training is therefore not an easy task, so even small effects could be regarded as successful. They note further that these studies’ weak results could be related to the use of ineffective techniques to change attitude, producing effects that are not sufficient to impact on behavior over time. Elliott et al. indeed observe that one of these studies was done in a laboratory setting (Parker et al., 1996), which might not be conductive to changes in real world attitudes, and that another one (Meadows and Stradling, 1999) was conducted with an extremely small sample of 10 subjects by experimental conditions. Another important explanation brought forward is the type of exposure that participants had to persuasive messages during these interventions. It is understood in the attitude literature that exposure to persuasive messages will be more effective if a high quality argument is presented and reinforced at many occasions, rather than as a one-off presentation. It is also demonstrated in this literature that attitudinal change will be effective if participant have the possibility and the motivation to actively engage in issue-relevant thinking within the framework of the intervention. According to Elliott et al., participants who are actively involved in issue-relevant thinking experience changes in the cognitions that underpin attitudes, a process that is called central route persuasion. Attitudinal changes without these cognitive modifications, called peripheral route persuasion, are not permanent, are very dependent on peer pressure and are unlikely to alter behaviors (Petty and Cacioppo, 1986). The authors observe that the methods used in the above-mentioned studies (video-based presentations and media interventions) were not likely to bring about active issue-relevant thinking and central route persuasion. According to the attitude literature, interventions would require active involvement from motivated participants to be more efficient at generating enduring attitudinal changes that could impact on actual behaviors. Elliott et al. observe that classroom-based interventions such as those used in driver-skill training course or driver-rehabilitation programs (or advance training programs – see Lonero et al., 2001) allow for sufficient levels of participative interaction between student and teacher to favour the type of issue-relevant thinking that is needed. They also suggest that interactive computer-based interventions could have the required prerequisite. Globally however, it is clear that further R&D is needed to develop these interventions, and that this R&D needs to be based on sound scientific theories such as the TPB.

Human Factors in the Motor Carrier Industry in Canada 143
Wallén Warner and Aberg (2008) validated that attitudes, subjective norms and PBC predict intention to exceed the speed limit. They also discuss the above-mentioned studies that provided mixed results for attitudinal changes, observing that one study only allowed participant to passively view a video once, while another was not based on beliefs derived from an assessment of the target population. Nevertheless, since even these experiments with such notable limitations still managed to alter some of the latent variables, the authors believe that future interventions, with better designs, could influence intentions and behaviors. They emphasize that it is essential that these interventions be based on a belief-based measure shown to contribute to drivers’ intention and actual speeding behavior. This means that prior to developing an intervention, an assessment of these beliefs needs to be conducted for the target population. The authors also note that speeding is closely related to a driver’s lifestyle, and that trying to change speeding behaviors involves addressing the whole lifestyle issue. This is coherent with the previous section on health-promotion and the PBT. As a final note, the authors conclude that once validated for a specific behavior and a specific population, TPB’s underlying beliefs should be targeted when designing campaigns, used in educational material and driver training as well as guidelines when implementing new safety measures. De Pelsmaker and Janssens (2007) validated the significant value of normative beliefs to predict the intention to speed. They also made observations with regards to implications for interventions. First, like Aberg (1999), they recognize that TPB-related scales could be used by program managers and government to track the intentions to commit specific risky-driving behaviors for specific populations. Second, they acknowledge that the main challenge for government is changing bad driving habits, recognize that it is an enormous and long-term challenge and affirm that awareness campaigns will not be enough. They observe that drivers are not likely to change their attitudes towards risky-driving as long as they do not perceive that the majority of their peers are doing so. The key is therefore to change the normative beliefs of the target population with campaigns aimed at changing their perception of what the majority of their peers find important. According to Simsekoglu and Lajunen (2008), given the importance of subjective norms in predicting intentions for risky-driving, intervention messages should indeed emphasize positive opinions of significant others (peers, family members) towards safe driving practices. Chen (2009) provides a similar recommendation, stating that education and training-based interventions should target the widespread normative belief that drivers can speed safely. Yilmaz and Çelik (2008) provide information on another application of the TPB to road safety interventions, namely that of driver assessment. They emphasize that the assessment of drivers’ attitudes toward traffic should be done before and during drivers’ learning process in order to orient them towards specialized or tailored training programs, a suggestions that was also developed by Thiffault (2005b). It would indeed be possible to channel drivers towards particular training components aimed at changing specific sets of beliefs underlying the TPB, either before they start to drive or in the context of driver improvement programs.
Human Factors in the Motor Carrier Industry in Canada 144
Poulter et al. (2008) realized an important study using the TPB to predict truck drivers’ intentions regarding risky-driving violations and compliance with regulations. As reviewed in the previous section, the results indicate that different sets of predictors were applicable to both categories of behaviors. The authors made specific recommendations for interventions while discussing both these sets of results. Since these two categories of behavior have different predictors - or motivators - recommended intervention approaches have different orientations. However, since in both cases intentions predicted behavior, the authors introduced a common intervention approach based on the psychological notion of implementation intentions. This notion involves the drafting of social contracts with drivers where agreements are made with regards to specific behavioral responses under specific circumstances (e.g. when situation x arises I will perform response y, or if other cars cut in when I am following at a safe distance from the vehicle in front, I will reduce speed in order to maintain a safe following distance). The authors specify that contracts with implementation intentions provide a specific behavioral strategy to attain a specific goal (in this case, safety) instead of vague intentions such as “I intend to drive safely”. They note that the efficiency of this approach has been empirically demonstrated (Elliott and Armitage, 2006). They therefore recommend the development and the use of such social contracts to address risky-driving and compliance with regulations in the motor carrier industry. With regards to respecting traffic laws (which relate to risky-driving and violations) the analyses reveal that behavioral intention indeed predicted behaviors, that intention was strongly related to subjective norm (.30) and to a lesser extent to PBC (.15). These results imply that (1) drivers who say they intend to stick to the law are likely tor report driving within the law, (2) a stronger perception that others expect them to abide by the law directly leads to obedience to traffic laws and (3) the easier truck drivers believe it is to abide by the laws, the more likely they are to follow them. In terms of recommendations, the authors therefore advocate targeting subjective norms by making clear to CMV drivers that not all their peers have negative attitudes with regards to traffic laws and that those who do are more involved in crashes, which is clearly the case. The analyses regarding compliance with regulations also revealed that intention to comply predicted behavior. In this case however, the largest direct effect was PBC (.43), meaning that the more control a driver has over his work, the more likely he is to comply with the rules. While subjective norms had a direct effect on obedience to traffic laws and risky-driving, they had no direct effect on compliance behavior. Compliance stemmed from whether drivers thought they could comply rather then what they thought about compliance per se. Poulter et al. therefore observe that compliance with CMV regulations may not relate so much to drivers themselves, but rather to the circumstances under which they operate. They provide the example of making sure that drivers have (or rather perceive they have) enough time to conduct vehicle inspections. With regards to recommendations, Poulter et al. (2008) suggest interventions aimed at carriers to ensure drivers not only understand that they should undertake specific behaviors (vehicle checks, rest break, etc.) but also that there are no other pressure on
Human Factors in the Motor Carrier Industry in Canada 145
drivers that detract them from such compliance behaviors. Poulter et al. emphasize the importance of company safety culture, stating that carriers with more extensive organizational policies positively influence drivers’ perceived control over their work (driver empowerment). They recommend that future research should directly address the constraints in driver behavior created by the working environment imposed by the carrier. Practical implications with regards to the TPB:
• It would be relevant to use the TPB to develop approaches to target CMV drivers beliefs, attitudes and behavioral intentions with regards to risky-driving;
• The first step would be to assess CMV drivers’ attitudes, subjective norms and PBC (direct measures) as well as underlying behavioral, normative and control beliefs (indirect measures) towards specific high-risk driving behaviors. This should be determined amongst different samples, from different sectors of the industry (long haul, short haul, bus drivers, etc.);
• Once we have a better understanding of what motivates risky-driving amongst the different sectors of the industry, interventions to alter TPB’s underlying sets of beliefs should be developed and evaluated;
• These interventions should be population and behavior specific; • There is a need to involve active issue-relevant thinking from participants. This
could be done by using a classroom format such as what can be found in training programs, advance driver training, driver improvement programs, etc;
• Given the importance of subjective norms, these sessions should be conducted by individuals that share significant characteristics with the peer groups (such as a former truck or bus driver);
• There is a need to target normative beliefs with content that would aim at depicting a reality where positive safe behaviors are seen as the norm and risky-driving is marginal and clearly linked with increased crash risk;
• There is a need to investigate perceived constraints imposed by carriers upon drivers, which impacts on drivers PBC in the context of compliance with rules and regulations;
• There is a need to enable drivers to gain more control and responsibilities over the management of their activities (driver empowerment), this can be done by working both on drivers perceptions and working conditions in the context of a strong carrier safety culture;
• The issue of social contracts and implementation intentions between drivers and carriers also hold a lot of promises and should be investigated further.
2.3.2.2 Interventions leads derived from the personality approach A popular critique from the tenants of passive safety - stemming mainly from the field of human factor engineering - is that personality cannot be changed, and that therefore studies undertaken to understand the role of personality traits in the production of risky-driving are of little interest. This line of thinking however is now being replaced, or at least rivaled, by recent considerations stemming from the progressive revival of the field of active safety and traffic psychology (Chen, 2009; Hatfield and Fernandes, 2009;

Human Factors in the Motor Carrier Industry in Canada 146
Loncsak et al., 2007; Machin and Sank, 2007; Moller and Gregersen, 2008; Schwebel et al., 2006; Sommer et al., 2008, etc.). While these authors all agree that by definition stable personality traits indeed cannot be changed, they could nonetheless be targeted in the context of new, innovative, evidence-based intervention strategies. Some of these ideas are presented below. 2.3.2.2.1 Behavior modification As mentioned earlier, personality traits are at the beginning of a chain that includes attitudes, risk-perception and risky-driving behaviors. While personality is clearly related to attitudes and violations, it has a weak but consistent relationship with crashes. It is therefore rather indirectly (or distally), through its association with attitudes and violations, that personality impacts on safety. There are indeed most likely specific configurations of beliefs, attitudes, risk perception factors and risky-driving behaviors that are typically associated with sensation seeking and aggressive driving. Consequently, while personality cannot be changed, it impacts on factors that can, and it is these factors that are directly responsible for crashes. It would therefore be relevant to look at these personality-driven configurations within specific populations (such as CMV drivers) and develop targeted interventions aimed at changing what can be changed. The recommendations made earlier with regards to changing specific beliefs at the root of risky-driving attitudes would certainly be applicable in this context as well. Empirical studies on personality and driving indeed reveal that personality dimensions should be factored in since they determine the orientation and the utility of the behavior production system. From this viewpoint, it is legitimate to recommend that interventions aimed at changing beliefs, attitudes and risk perception factors for sensation seekers and for aggressive drivers – the leading personality dimensions for risky-driving - be developed. Below are further examples of interventions as well as R&D leads that were recently suggested in the literature with regards to personality dimensions. The data from the study of Chen (2009) clearly support the notion that personality - in this case sensation seeking - has a direct effect on safety attitudes. Chen observes that although personality did not have a direct effect on risky-driving, it most likely affected behavior by influencing its attitudinal and normative determinants, as they are depicted in the TPB. Chen therefore suggests that an assessment of drivers’ personality could be used as a screening procedure when drivers undertake initial training, and that strategies could be implemented to change drivers’ safety attitudes in the course of this training. Based on the results of their study on personality, risk perception and risky-driving, Machin and Sankey (2008) recommended to include elements in driver education that would make drivers really understand how their sensation seeking, the importance they place (or not) on the welfare of others, as well as the (low level of) danger that they perceive may affect their intention to speed. They also observe that road safety campaigns should strengthen drivers’ appreciation of the impact of their actions on others through positive reinforcement of altruistic norms, stating that a golden rule should be to drive unto others as you would have them drive unto you.

Human Factors in the Motor Carrier Industry in Canada 147
Moller and Gregersen (2008) emphasized that drivers are influenced by motives related to their lifestyle. This implies that not only do they need to acquire skills to master the driving task, but also to handle the influences stemming from their life situation, such as learning to control the impulse to let-off-steam trough driving or the motivation to gain status among peer by their driving style. It is important that drivers be made to really understand the impact of these influences on their driving behaviors. Because of the impacts of normative beliefs on risky-driving intentions, peer group based interventions are recommended to achieve this objective. These observations are shared by Hatfield and Fernandes (2009) who emphasize from their study results that risk-motivations are amenable to change and that interventions should be aimed at reducing excitement, social influences, irrelevance-of-risk and letting-off-steam motives for risky drivers. Also, they suggest that the idea of impressing on risky drivers the importance of the risk associated with their behaviors may in fact encourage dangerous driving, given its psychosocial utility. Lonczak et al. (2007) observe that a number of factors uniquely affect an individual’s driving style, that drivers should be made more cognisant of their own triggers for aggressive and risky-driving and that they should practice positive coping strategies. They observe further that tailoring intervention programs is crucial and that interventions should include teaching drivers the reality of risk in particular situations while helping them to shift towards a safety-focussed driving style. 2.3.2.2.2 Driver assessment Driver assessment can be conducted with different objectives. Most personality researchers would however say that the measurement of personality dimensions and attitudes could hardly be a decisive factor in terms of driver selection. While known relationships exist between these factors in isolation and specific measures of risky-driving, in reality the impact of personal variables on safety stem from a complex and systemic organization where multiple influences combine to define the risk for a specific individual in a specific situation. It is therefore hard to believe, at this point in time, that a single personality measure could be strong enough to make legitimate career decisions for professional drivers. Note that Knipling et al. are preparing a CTBSSP report that will cover issues related to the assessment of driver risk with psychometric instruments. As discussed, the idea of driver assessment makes a lot of sense in the context of tailored interventions. While it is difficult to predict crashes, it is a lot easier to predict risky-driving and to understand it’s utility for individuals with specific personality traits and attitudes. Once their profile assessed, drivers could be channeled towards specific interventions (could be labeled advanced driver education, problem driver remediation, driver improvement programs, or plainly driver training) where factors that can be changed (attitudes, motivations, risk-perception, risky-driving behaviors) are targeted. Note that these interventions need further R&D, and that this R&D plays a central role in the attainment of a new road safety paradigm where passive and active strategies efficiently complement each other.
Human Factors in the Motor Carrier Industry in Canada 148
The rule of thumb for driver assessment with regards to risky-driving is that it should be multidimensional, including personality dimensions (sensation seeking, aggression/social deviance, type A) attitudes (i.e. using TPB and PBT frameworks), risk-perception (i.e. computerized hazard perception testing) and risky-driving behaviors (on-board safety monitoring data, vehicle parameters, driver records, driving simulators, etc.). Thiffault (2005b) made specific recommendations with regards to variables and assessment tools, however given ongoing intense activity in the field, conducting an updated review would be relevant. 2.3.2.2.3 Specific considerations with regards to sensation seeking
There is ample evidence to support the notion that sensation seeking plays a significant role in dangerous driving. Sensation seekers have a tendency to look for the sensations they seek while driving and take risks in order to experience the psychophysiological changes that come with danger. In this context, risk originates from biology, or psychophysiology, and dangerous driving does not have clear psychosocial triggers. In other words, sensation seekers may take risks even when they are alone on the road. In this context, the risk does not stem from social interactions between drivers, like in the case of aggressive driving. Beirness and Simpson (1997) as well as Jonah (1997) underline the importance of the biological basis of sensation seeking, suggesting that this aspect of personality is in fact a largely inherited or genetic predisposition. Given these strong physiological characteristics, they emphasize that behavioral changes in this context could be very difficult. This would justify the use of deterrent methods such as speed cameras rather than attempting to change behavior when trying to address risky-driving. Other arguments however suggest that it could be useful to take a fresh look at this idea. For example, Zuckerman (2007), as well as Tay, Champness and Watson (2003), observe that encouraging sensation seekers to satisfy their need for excitement through activities that do not threaten public health or their own safety is a possibility. Furthermore, clinical psychology shows that despite a significant physiological basis, the expression of various personality-related phenomena such as depression, anxiety, aggression and addictions can be altered through targeted interventions. As such, it can be suggested that innovative approaches could indeed be used to influence the driving behavior of sensation seekers, especially in a structured organizational entity such as a motor carrier, where professional drivers can be submitted to company-based interventions. As mentioned above, while sensation seeking is a stable dimension, it is naturally tampered by other factors that influence the production of behavior such as attitudes, values, beliefs and motivations, all of which can be impacted through various forms of interventions. Therefore, while sensation seeking per se cannot be modified by external influences, the attitudinal patterns and the motivations typically associated with it are clearly potential targets for road safety interventions. Not all sensation seekers take risks while driving; some have other personality traits or attitudes that censure or inhibit
Human Factors in the Motor Carrier Industry in Canada 149
dangerous driving. Racing car drivers and gamblers take risks at the track or the casino, but they will not necessarily drive dangerously on the highway. The difference between the sensation seekers that indulge in risky-driving and those who do not is not innate, but rather learned. It is this material that can be targeted. In other words, if sensation seeking is genetically grounded, the values, attitudes and beliefs that mediate its impact on driving are acquired and open to environmental influence, which reinforces the possibility of using certain forms of remedial action. The recommendations made with regards to changing specific beliefs at the root of risky-driving attitudes are applicable here as well. It would indeed be legitimate to use a theory such as the TPB to assess the belief structure of sensation seekers, and to develop appropriate approaches to alter these beliefs for this specific population. Techniques from cognitive-behavioral psychology could be drawn upon for this purpose. They could be used to inspire the development of specific training and clinically oriented activities such as advanced driver improvement courses within a motor carrier organization. Combining the knowledge about sensation seeking with behavior modification strategies from clinical psychology or health promotion could lead to new prevention approaches that would complement currently existing deterrent measures. Larger scale prevention campaigns could also attempt to modify driving behaviors of sensation seekers, perhaps by effectively promoting values and beliefs about social responsibility and respect for other people’s lives. To be effective, the form and content of the message would need to be calibrated to the characteristics of this particular audience and the source should be acceptable for the target audience - ideally someone from the peer group. It would not be a matter of condemning sensation seeking as such, but rather of attempting to channel it through other activities that are designed for this purpose, such as sports and recreational activities (Zuckerman, 2007). The case of drinking and driving shows that this type of change is possible; drunk driving is now deemed as socially unacceptable, but drinking remains completely normal and is even promoted in many other contexts. In terms of driver assessment, the empirical relationships between sensation seeking and factors such as self-reported risk-taking, violations, and to a lesser degree crashes, clearly identify it as a predictor of risky-driving. As such, there is no question that sensation seeking should be a component in a comprehensive driver assessment approach. However, as mentioned, it is only one factor and should be combined with other measures of personality, attitudes and behavior (Sommer et al., 2008). As was stated, such tests battery should be used in a soft approach, ideally to work with the driver to address his risky-driving, and not as a criterion for legal decisions or to take actions with regards to driver’s licences. The fact that someone is a sensation seeker indeed does not by itself imply that he or she will be a danger on the roads. 2.3.2.2.4 Specific considerations with regards to aggressive driving In 2003, the National Cooperative Highway Research Program (NCHRP) published a guide for addressing aggressive driving collisions (Neuman et al., 2003). The main conclusions stemming from this work are that intervention programs can adopt two

Human Factors in the Motor Carrier Industry in Canada 150
strategies: (1) deter aggressive driving in specific populations, including those with a history of such behaviors and (2) improve the driving environment to eliminate or minimize triggers for aggressive driving. With regards to the motor carrier industry, there are potential program elements for both these strategies. In terms of deterrence, targeted enforcement, aimed at the detection of specific driving behaviors, is a widely used approach. One of the difficulties with this lies in the identification of what constitutes aggressive driving behaviors. Indeed, these campaigns have often been concentrated on speeding, instead of other behaviors such as tailgating or improper lane changes, which have clear implications in terms of crash risk when heavy trucks are considered. Programs such as Ticketing Aggressive Driving have been put forward to address the problem in the context of the motor carrier industry. These will be discussed in the upcoming section on interactions between light and heavy vehicles. The other strategy discussed by Neuman et al. (2003) is the educational approach, which can be applied either as a prevention measure for the general driving population or for repeat offenders. The core objectives of the educational approach are to teach drivers how to cope with the aggressive behaviors of other drivers and to help them to recognize and modify their own tendencies with regards to aggressive driving. It is suggested that educational campaign should be coordinated with targeted enforcement efforts. Empirical evaluations of information programs alone have shown little impacts on actual driving behaviors. In this regard, it is interesting to bring forth the notions of issue-relevant thinking and central route persuasion that were discussed earlier (Elliott et al., 2005). Large-scale media campaign directed at aggressive driving cannot provide opportunities to engage in the persuasion process, decreasing the possibility of attitudinal and behavioral intention changes. As such, achieving the goals for educating drivers with regards to aggressive driving would be better served through formal driver training settings where interactions between students and teachers are likely to occur. Nevertheless, large-scale media campaigns would undeniably be a helpful component in a comprehensive approach aimed at changing the safety culture with regards to aggressive driving. Bergeron, Thiffault and Smiley (2000) situate aggressive driving in the context of non-verbal expression of emotions. Studies show that emotions are expressed through an arbitrary code (display rules) that varies from culture to culture. Marsh and Collett (1987) indeed noted that aggressive driving behaviors were associated with social norms. The implications of this are that aggressive driving is learned, and could therefore be unlearned through a change of display rules in a specific culture, or sub-culture. It also points to the presence of a potential social chain reaction that could reduce the expression of aggression on the roads. For example, large-scale campaigns promoting courtesy could change the popular perception that aggression can be expressed openly on the road and lead to changes in habits. Such campaigns should however be based on an assessment of the psychological determinants of aggressive driving for targeted populations and make use of informed behavioral change models, which is usually lacking.
Human Factors in the Motor Carrier Industry in Canada 151
According to Björklund (2008), drivers’ irritability and aggressive driving is largely based on their interpretations of the behaviors of others (e.g. the behaviors of others is unfair, against the norm or counter to expectations). The author notes that these interpretations are of course subjective and may not reflect the actual intentions of obstructive drivers. Also, obstructive drivers are not necessarily aware that their behavior is provocative, nor do they necessarily intend it to be. Nonetheless, irritated drivers communicate their frustration by exhibiting aggressive driving behaviors, which will trigger irritation, frustration and aggressive responses in other road users, creating a dangerous chain reaction. In this context, drivers’ interpretation of driving interactions might therefore be a legitimate target for intervention. Drivers should be made to better understand the subjective nature of their own interpretations and the dangerous reality of their reactions. Björklund further notes that insights into the rationales behind other drivers’ behavior might be a way to decrease irritation in traffic and consequently to decrease aggressive behavior among drivers. According to Neuman et al. (2003), the educational approach can also be used to address the problem of repeat aggressive driving offenders. Once identified, aggressive driving recidivists would be submitted to courses with structured curricula aimed at countering specific aggressive driving behaviors while teaching anger management techniques. The intent is to help these drivers understand the dangers of aggressive driving and provide ways to recognize and change their own aggressive driving behaviors. The Defensive Driving-Attitudinal Dynamics of Driving Course, from the National Safety Council, is provided as an example. The authors however note that this type of program is experimental and that few evaluations are available yet. It is nevertheless clear in the literature that similar clinical approaches have been developed and proven to be efficient in the context of sound evaluation studies. Sarkar et al. (2003) evaluated the impacts of an aggressive driving seminar aimed at changing aggressive driving attitudes and behavioral intentions. They report significant positive results following the sessions, with a stronger effect for young male drivers, the more at-risk population. The authors also note the possibility that work-conditions for professional drivers, who are pressured to make just-in-time deliveries, can lead to an increase in impatience and frustration with regards to congestion and the behaviors of other road users. It is widely understood that these conditions prelude aggressive driving behaviors. The authors therefore conclude that specific aggressive driving interventions targeting those who drive for a living need to be developed, evaluated and adopted. There is sufficient empirical support for the use of clinical approaches to treat aggressive drivers. Treatment approaches could therefore be an option for the motor carrier industry, in order to address drivers with repeated aggressive driving incidents. Deffenbacher (2009) has shown that cognitive-behavioral interventions such as relaxation coping skills, cognitive restructuring and behavior skill building can reduce, and maintain reductions, with regards to driving anger, aggressive anger expression, aggression, risky-driving behaviors and general anger. Note that Smith (2009) obtained similar positive results with a different population.
Human Factors in the Motor Carrier Industry in Canada 152
Galovski et al. (2006a, 2006b) also demonstrated the effectiveness of cognitive-behavioral interventions amongst court-referred as well as self-referred aggressive drivers. They observed that even small changes in driving behaviors can greatly affect the lives of drivers and that these changes are mainly perpetuated by gaining insights into the level of anger experienced in driving situations: understanding that one’s own thought contribute to one’s anger allowed the drivers to begin to challenge some of their distorted thoughts. Many began to take ownership of their anger and, subsequently, more responsibility for their diving behavior (Galovski et al., 2006a). Neuman et al. (2003) also make recommendations with regards to reducing or eliminating environmental triggers of aggressive driving. The recommended approach involves the identification and the modification of factors in the driving environment that may contribute to aggressive driving. While the NCHRP report makes this recommendation for the general driving population, a similar approach should be undertaken with CMV drivers, who have a very different experience of roadways, and may be faced with different frustration triggering factors than light vehicle drivers. It could also be relevant to extend this analysis to the macroergonomics of the motor carrier industry. A factor such as just-in-time-delivery, that pressures drivers to keep moving at all times, may indeed generate impatience, frustration and aggressive driving behaviors when roadways are obstructed by other drivers. It is also important to note that on-board information about traffic delays and alternative routes to avoid traffic congestion may have a positive effect on aggressive driving. Practical implications with regards to personality oriented interventions:
• Personality dimensions such as sensation seeking and aggression should be part of a comprehensive driver assessment package that would also include psychosocial issues related to health risk and risky-driving behaviors, TPB direct and indirect measures as well driving style, crashes, violations and hazard perception skills;
• There is a need to assess the psychological determinants of risky-driving that are typically associated with sensation seeking and aggressive driving amongst samples of CMV drivers, while focusing on elements of the behavior production system that can be changed (attitudes, subjective norms, PBC, risk perception);
• Once this is done, strategies to change these determinants can be developed; • Strategies to change beliefs and attitudes amongst sensation seekers and
aggressive drivers would be somewhat similar to what has been discussed under the previous section on TPB applications;
• Various authors suggest that drivers need to understand, or become more cognizant of the impacts of their personality and lifestyle on their driving. Material to make them understand these issues as well as coping strategies to master those influences should be developed and transmitted to CMV drivers by appropriate means (such as classroom interventions);
• Attitudes, beliefs and risk perception of sensation-seekers could be targeted both through carrier-based “clinical” interventions and large-scale campaigns;
• Targeted aggressive driving enforcement as well as programs that deal with CMV/LV drivers’ interactions should be encouraged and resourced;
Human Factors in the Motor Carrier Industry in Canada 153
• Tailored programs for aggressive CMV drivers should be developed. These programs should be based on cognitive-behavioral notions and aimed at teaching drivers how to cope with other aggressive drivers as well as with their own aggressive responses in the presence of frustration, impatience and irritation;
• Large-scale campaigns focussed on safe and courteous driving are recommended. 2.3.2.3 Considerations with regards to risk perception
Some drivers are more exposed to risky situations on the road because of problems with risk perception. Being less aware of hazards, they do not adapt efficiently to variations in objective risk and are more exposed to crashes (Horswill and McKenna, 2004). However, Ferguson (2003), Borowsky et al. (2009) as well as Wallis and Horswill (2007) point out that hazard perception skills can be learned and should be part of driver education curricula. Isler et al. (2009) also emphasize that higher-level skills such as hazard perception as well as visual search and attention should be part of training. McKenna and Crick (1997), Isler et al. (2009), McKenna et al., (2006), Regan, Deery and Triggs (1998b) as well as Rosenbloom et al. (2008) developed approaches for training drivers in risk perception and observed significant improvements. These authors emphasize that such techniques allow drivers to acquire experience in assessing hazards without being exposed to crash risk. Ferguson (2003) also observes that drivers’ ability to perceive risk can be evaluated. Such an assessment would have many implications in the context of CMV operations, both in terms of driver evaluation and driver improvement. According to Blank and McCord (1998), Fisher, Laurie, Glaser et al. (2002), Lonero, Clinton and Douglas (1998), McKenna and Crick, (1997), Regan, Deery and Triggs (1998b), Triggs (1994), Triggs and Regan (1998), Triggs and Stanway (1995) as well as Willis (1998), personal computers can be used for the evaluation and the training of risk perception. Fisher et al. (2002) sought to evaluate the effectiveness of this method of risk perception training by comparing the driving behaviour on simulators of three groups of subjects: young drivers who were inexperienced but had been trained on the program, young, inexperienced and untrained drivers, and experienced drivers. The results show that young, inexperienced but trained drivers drive more safely in risky situations than untrained young drivers. Their driving was comparable to that of experienced drivers.
Driving simulators can also be used to assess the tendency to take risks, to evaluate the various cognitive processes involved in risk perception and to train young drivers with regards to issues they may have with hazard perception. Note that while simulators vary a great deal in terms of scope, complexity, cost and effectiveness, fairly simple equipments such as PC-based equipment with a steering wheel, accelerator and brake pedals can achieve most objectives with regard hazard perception training.
As mentioned in the theoretical section, risk perception consists of both an evaluation of the objective risk of the situation and an evaluation of one’s ability to cope with it. While the assessment of the former can be achieved with static tests that do not provide possibilities to interact with the task (paper & pencil tests, computer-based, video, slides, etc), such interaction is favourable for the assessment of the latter (Thiffault 1991). Subjects who are evaluating risk in situ, while involved in real or simulated driving task,

Human Factors in the Motor Carrier Industry in Canada 154
indeed evaluate both the objective risk of the situation and their ability to deal with it. Note however that Tronsmoen (2008) validated a psychometric paper and pencil instrument that could be used to evaluate drivers’ assessment of driving ability and that Harré and Sibley (2007) report having successfully used a reaction time task (Implicit Association Test) that enables the implicit measurement of self-enhancement tendencies while avoiding any social desirability bias. Practical implications with regards to risk perception:
• There is a need to study hazard perception issues specific to CMV drivers, including the notions of confidence and over-confidence;
• Hazard-perception should be diagnosed during the training of new drivers, using interactive computer-based driving tasks and/or driving simulators;
• Hazard perception training programs should be included in both entry-level training and driver improvement programs.
2.3.3 Traditional intervention domains
The above sections were aimed at exploring the practical implications of each of the three broad theoretical approaches addressing the problem of risky-driving, which constitute the core of decision errors related to road rashes in the motor carrier industry. The idea was to generate a fresh look at driver-based interventions inspired by up-to-date scientific knowledge with regards to driving behavior and behavior modification approaches. The following sections will discuss more specifically the applications of these notions to some of the traditional domains of intervention currently in use. Issues related to driver training, safety culture, incentive programs as well as safety-related technologies will be addressed. 2.3.3.1 Considerations with regards to driver training Driver training is a very active domain where multiple regulatory oriented processes and R&D efforts are currently being conducted. The issue is complex, multifaceted, and somewhat controversial, both for the general population and in the context of the motor carrier industry. As such, there would be an enormous amount of information to process in order to draft a comprehensive review of the situation. Given the mandate of this task force and the timeframe under which it operates, such a review is neither possible nor necessary. The objective here is to make recommendations in light of the science that was reviewed so far, rather than to make an in-depth assessment of what is currently happening in this field. Programs developers and other stakeholders involved in CMV driver training can reflect on the following discussion and decide whether they want to adapt their activities. Without making a comprehensive review of the situation, certain considerations stemming from benchmark publications still need to be brought forward:

Human Factors in the Motor Carrier Industry in Canada 155
• In 2003, Knipling, Hickman and Bergoffen wrote in the CTBSSP synthesis # 1 that the level of driving proficiency and knowledge required to earn a CDL is widely regarded in the industry as being well below the level required to be a safe and reliable driver;
• In the CTBSSP synthesis # 13, Brock et al. (2007) observed that: o The content of driver training programs is there because experts believe it
should be, resulting from an informal approach to the problem that took place over the last 20 years, on the basis of the 1984 FHWA model curriculum. Therefore the systematic (scientific) development of a modern driver training curriculum is recommended. Such a process should incorporate new knowledge about what impacts on driving behaviors (fatigue, distraction, etc.);
o Most of the research findings on adult learning in the past 30 years has not been incorporated into many training enterprises;
o There are still serious questions as to how material should be transmitted to drivers, and how the efficiency of training should be evaluated;
o It has been shown that computer-based instructions and simulation technologies can improve student performance;
o With a better understanding of learning styles and cognitive strategies, students could be evaluated and funnelled into unique optimum learning opportunities.
• Rogers and Knipling (2007) noted the following: o The number one recommendation from the 2002 International Truck &
Bus Research and Policy Symposium was that the federal government should develop and mandate standardized CMV driver training that should include entry-level, in service as well as remedial training approaches;
o A study from Swezey and Andrews (2001) suggests that driver training for entry-level is inadequate and that only 31% of drivers were adequately trained;
o Many driving school are reputed as “CDL mills” that only aim to teach what is sufficient to pass the CDL, without really preparing drivers for the rigors of actual CMV operations, a situation which has prompted carriers to develop their own in-house training programs. However, there were no published scientific evaluations of these in-house programs.
• In a study looking to evaluate the impacts of truck driver training, ATRI (2008) concluded that:
o There were no effects of the instructional environment; o Only the category “accident procedure instructions” had a positive
impact; o The credentials of training program staff had no effect; o Training program duration had no effect; o The field has traditionally been based on an outcome-centered approach,
which deemphasizes the importance of learning processes and generates narrow-focussed training aimed at passing CDL tests, while most often providing little safety benefits;
Human Factors in the Motor Carrier Industry in Canada 156
o Robust programs have nevertheless been developed and implemented, but little research has been conducted to evaluate their effectiveness;
o There is therefore a lack of scientific knowledge on effective truck driving training methods;
o Most programs employ similar transmission methods but there is no general agreement regarding the content of training;
o There is no national standard in the US with regards to training curriculum, apart from the 1984 effort. Since then, there have been significant advances in terms of understanding the human factors that impact on safety and the driving task has been significantly modified by diverse on-board technologies. There is therefore a need to update the curriculum and teaching material to reflect these changes and new crash-causation knowledge.
One of the key and most controversial issues with respect to driver training is its effectiveness. Numerous studies have shown that training has not been efficient to prevent road crashes in the general population - a situation that prompted its relative disinvestment in the past decades. Very few have however assessed the efficiency of training in the motor carrier industry. Nevertheless, as reported by Rogers and Knipling (2007), Horn and Tardif (1999) observed a 14% reduction in crashes following the application of a training program in a U.S. carrier, while driver retention program led to a 50% decrease in crashes in a 1,300 driver company in Germany. Cleaves (1997) reported a 50% decrease in crashes after training. Authors such as Dorn and Barker (2005), Boyle (2010) and Tronsmoen (2010) contend that a reduction in crashes is not the proper proxy to assess the efficiency of driver training. According to Dorn, there are well-established problems in the reliability of crash records when using them as a criterion measures: crashes may be due to factors that were not considered in driver training and crash frequency is an unreliable criterion given the rarity of these events. Dorn suggests using other proxies, such as the impact of training on the occurrence of risky behaviors, which have a clear relationship with crashes. Boyle (2010) also emphasizes that evaluative studies using crashes as a criterion have methodological issues, for example by omitting to control for exposure (miles driven), by failing to account for specific types of crashes or by underreporting significant crash contributors such as fatigue or distraction. It is interesting to note that Robson et al. (2010) have used different categories of outcome in their meta-analysis on studies aimed at assessing the effectiveness of training to prevent injuries in organizational health and safety (OHS). In particular, the use of knowledge, beliefs, attitudes and behavioral intention as immediate outcome measures appears very promising since these variables have been shown to predict risky-driving behaviors and since they are also recommended targets for driver-based interventions, as suggested earlier. Note that it is concluded from the Robson et al. (2010) review that there is strong evidence for the effectiveness of OHS training on worker behavior and that the size and direction of the effect observed to date on knowledge, attitudes and beliefs are consistent with the evidence on behavior. Comparable variables were used by

Human Factors in the Motor Carrier Industry in Canada 157
Tronsmoen (2010) and similar associations were observed between training, attitudes, and risky driving. In Canada, the Canadian Trucking Human Resources Council is currently involved in a two-phased research program aimed at developing a business case for improving the training and licensing processes for new drivers of heavy trucks. The research consists mainly of an evaluation of the effectiveness of driver training. Phase 1, completed by the Traffic Injury Research Foundation (TIRF) in May 2009 was a scoping study to determine the feasibility of accessing the required data (TIRF, 2009). Phase 2, also conducted by TIRF, involves completing the research and building the business case. In brief, the objectives of Phase 2 are (1) to identify the relationship among commercial truck driver training programs and the safety performance of new drivers in British Columbia, Alberta and Manitoba and (2) to use this information to develop a business case for the improvement of training and licensing processes for entry-level drivers of heavy trucks. The results of this process, expected in the summer of 2011, will provide significant information that will pave the way for a potential revamping of training programs for CMV drivers in Canada. Whether or not past or current driver training programs are efficient, there is a consistent trend in the literature suggesting that driver education remains a primary means to positively impact on driver behavior, and that training programs should not be abandoned or toned down, but rather emphasized, resourced and made more efficient, both in terms of content and delivery methods. Interestingly, while documented scientific efforts are being made to evaluate what works and what does not in training programs, it appears that researchers have been less keen to actually develop scientifically sound driver-training curricula that would target crash-causation factors as they are indentified in recent crash-causation efforts. One of the key issues to investigate therefore is whether actual training programs are aimed at the right targets with regards to road safety. Answering this question starts by the identification of what these targets should be. With regards to the work undertaken here, these targets are the main crash-causation factors identified in section 1: fatigue, distraction and risky-driving. An exercise that should consequently be conducted is to evaluate if various training approaches currently in use in the motor carrier industry are indeed targeting these broad crash-causation factors, to what extent, and how it is actually being done, in light of both the scientific knowledge about these behaviors and how they should be modified. Such an exercise goes beyond the scope of our mandate. However, based on our review, there is a need to stress the importance of addressing these issues through driver training in the context of the motor-carrier industry. There is no question that drivers need to be made to understand how to deal with these main crash-causation factors and that by providing this training - as part of a larger comprehensive approach to these problems - one is most likely to positively impact on road safety. The driver training implications with regards to fatigue and distraction have already been discussed in the sections dealing with these respective issues, however a brief reminder of key elements follows below.
Human Factors in the Motor Carrier Industry in Canada 158
With regards to fatigue, there is a need to provide drivers with essential knowledge about key fatigue contributors (time-of-day, time-awake, time-on-task, sleep problems, sleep needs, naps & recovery, effects of lifestyle, impacts of monotony, individual differences in reaction to monotony, efficiency of countermeasures, etc.). There is also a need to raise the perceived risk associated with drowsy driving. It was indeed shown that drivers do experience various signs of sleepiness before falling asleep at the wheel, but that these signs are not taken seriously enough and that drivers overestimate their capacity to fight sleepiness with effort (Nordbakke and Sagberg, 2007). Drivers therefore need to be made to understand when they should act on their sleepiness, given the significance of the risk of actually losing consciousness and falling asleep when already feeling drowsy. They should also be made to understand that the transition from fully awake to drowsy is very gradual and poorly perceptible and that they should pay more attention to the early signs of fatigue. Even more importantly, they should be convinced to act early in the fatigue process with efficient strategies and to use proactive (preventive) rather than only reactive in-transit coping skills in order to self-manage their alertness. Note that a study of the psychological determinants of the decision to continue driving while drowsy would inform the development of targeted interventions to alter this decision process, which would most likely include driver-training components. Notions such as the attitudinal and motivational inputs to the problem, and factors such as social responsibility amongst professional drivers, subjective peer norms with regards to drowsy driving and perceptions of control concerning the capacity to stop driving when feeling drowsy, are likely to come up as significant predictors and should be addressed within revamped training initiatives. It is also important to note that driver education is a key component of the fatigue management program (FMP) approach that was discussed in the earlier fatigue section. While FMPs are indeed highly recommended to carriers of all sizes, we do believe that driver education about fatigue should not be limited to these programs and that it needs to be part of entry-level, in service as well as remedial driver training programs. The second main crash causation factor that was identified in this review is driver distraction. As mentioned in the distraction section, driver education is seen as a key component of driver-based interventions to address distracted driving: the management of distraction by drivers should be regarded as an ability that can be developed and improved through education and training (Regan, Lee and Young, 2008a). Given the increased penetration of telematics devices in the task environment of CMV drivers, there is no question that they must be made aware of the basics of attention processes as well as notions such as workload and task demands. CMV drivers should indeed be aware that their attention runs on a single channel mode and that simultaneous tasks with fluctuating workloads may create a situation where attention capacity is overloaded, resulting in severely increased crash risk. Once they really understand this dynamic, it is likely that drivers will be more motivated and better equipped to self-manage their attention and to more efficiently plan the use of distracting devices while driving.
Human Factors in the Motor Carrier Industry in Canada 159
There is also an understanding in the traffic psychology literature that driver training has clear implications for the prevention of risky-driving. As reviewed earlier, different authors stressed the need to address driving style, rather than focussing solely on driving skills, in driver education. Recall that driving style – or the way drivers choose to drive – has been identified as the most important contributor to crashes. In this context, the question then is how can driver training influence the way drivers choose to drive? More specifically, looking back at the predictors of risky-driving, how can driver education be beneficial with respect to the impacts of factors such as personality, attitudes, subjective norms, lifestyle and risk perception on driving behavior? With regards to personality, recall that Machin and Sankey (2008) recommended to include elements in driver education that would make drivers truly understand how their sensation seeking impacts on their driving behaviors. Chen (2009) suggested that driver training could be used to change the safety attitudes of sensation-seekers. Moller and Gregersen (2008) proposed that driver training could be used to make drivers acquire the skills to master the potential impacts of their lifestyle, personality or life situation on their driving behaviors and Lonczak et al. (2007) suggested that it could be used to make drivers aware of their own triggers for aggressive and risky-driving, as well as to introduce them to alternative, more adaptive, coping strategies. In other words, driver training should address high-level processes in order to make drivers really understand the dynamics by which personal factors such as personality and attitudes impact on driving behaviors while providing them with acceptable behavioral coping strategies. This is coherent with observations from Regan, Lee and Young (2008a) who emphasize that the competencies higher up in the hierarchy of the Goal of Driver Education matrix are likely to have the greatest influence on driving behaviors, given that skills lower in the hierarchy are exercised under the guidance of higher levels goals and motives. Overall, the key message is that it appears legitimate to target high-level psychological determinants of driver behaviors through driver training. In terms of attitude changes, following up on what was said earlier with regards to the problem behavior theory, driver training could be used to promote a positive health-enhancing lifestyle that would positively impact on CMV drivers’ health and wellness as well as on their safety on the road. With regards to elements related to the theory of planned behaviors, once we get a clearer picture of how they explain and predict risky-driving intentions among CMV drivers, training components should be developed to alter drivers’ behavioural, normative and control beliefs with regards to specific high risk driving behaviors. As suggested, training should involve active issue-relevant thinking from participants. Ideally, a classroom format conducted by an individual that shares significant characteristics with the participant groups (i.e. a peer, such as a former truck or bus driver) should used. Amongst other things, such sessions would target normative beliefs by depicting a reality where positive safe behaviors are the norm and where risky-driving is marginal and clearly linked with increased crash risk. Note that Tronsmoen (2010) was successful in altering safety attitudes and risk behaviors trough driver training.
Human Factors in the Motor Carrier Industry in Canada 160
Lastly, it is clear in the literature that driver training should include hazard perception skills. Recall that risk perception is indeed central in the risk management process of drivers and that empirical evidence has shown that it can be altered and made more efficient via either static or interactive computer-based training systems. 2.3.3.2 Considerations with regards to safety culture Even though interventions addressing safety culture (SC) may not be seen as traditional per se, new perspectives as well as recent publications on the issue clearly show that the notion incorporates established processes and concepts related to the way carriers manage their staff with regards to safety issues and how they go about their business in general. Hedlund (2007) discusses the notion of SC at a macro, societal level. According to him, SC defines the beliefs, values, norms, and things people use, which will guide their social interactions. In other words, it is the implicit shared values, norms and beliefs in which society (or a group) organizes and acts with regards to matters that influence safety. It relates to the values and priority that a society or group (such as the motor carrier industry as a whole, or a specific carrier) gives to safety through its policies, actions, commonly accepted behavioral norms and actions towards individuals who violate these behavioral norms. Hedlund (2007) notes that there is a strong safety culture in the U.S. in many areas such as food, medicine, airline, train and subway industries to prevent fatalities, but that the 40,000 deaths and 2,500,000 injuries each years related to traffic safety are more or less accepted, at least to the extent that no serious actions are adopted to reduce the toll (as demonstrated by the constancy of this toll). He observes that stability in this deadly toll creates the illusion of an absence of crisis and calls this culture one of indifference and complacency. He notes further that real progress in traffic safety depends far more on changing this culture of indifference than on developing and implementing specific countermeasures. On countermeasures, like Foss (2007), Lonero et al. (2006) as well as Gielen & Sleet (2003) and Thiffault (2005b), Hedlund underlines that driver-oriented interventions have far too often been based on wishful thinking rather than science and adds that while one must apprentice in carpentry, road safety can be delivered on the basis of opinion, folklore, tradition, intuition and personal experience. Hedlund explains the culture of indifference by factors such as:
• A sense of individual vulnerability and apathy to crash risk, given that fatality rates per miles travelled is very low;
• A sense of individual control, where most drivers believe that their skills are above average and that crashes are caused by other drivers;
• A sense of anonymity on the road that goes against the likelihood of a cooperative social experience characterized with mutual respect and observance of laws and traffic control;
Human Factors in the Motor Carrier Industry in Canada 161
• A sense of privacy in the car, where individuals feel they can do whatever they want.
Hedlund then identifies the following elements as factors that contribute to the safety culture in countries that show the best road safety tolls:
• Government more willing to intervene to protect individual safety; • A more scientific approach to countermeasures; • Support and funding for those measures; • Easier implementation due to fewer decision makers; • A public that is more accepting of government decisions.
There are many definition issues that need to be considered when dealing with the notion of SC. It can be defined as the norms, attitudes, values and beliefs of an organization and their manifestation in the behaviors of its agents (Short el al., 2007). It is a set of shared values (what is important) and beliefs (how things work) that interact with an organization’s structure and control systems to produce behavioral norms (how things are done around here) (Uttal, 1983, see Short et al., 2007). After looking at various SC definitions to identify common factors, Fernandez-Muniz et al. (2007) suggest the following definition: A set of values, perceptions, attitudes and patterns of behavior with regards to safety shared by member of an organization, as well as a set of policies, practices and procedures relating to the reduction of employees’ exposure to occupational risks, implemented at every level of the organization, and reflecting a high level of concern and commitment to the prevention of accident and illnesses. In other words, safety culture reflects the general context or ambiance with regards to safety as well as safety-related practices within a company. Recently, there has been significant discussion related to SC that can be applied to the motor carrier industry (e.g. Arboleda et al., 2003 ; Fernandez- Muniz et al., 2007; Short et al., 2007). As noted by Arboleda et al. (2003) the relationship between a strong SC and accident frequency has been recognized for some time in various industrial settings. They further observe that employees’ perception of SC is the strongest determinant of safety, especially in an industry such as this one, where most of the time drivers are physically removed from the company when conducting their tasks. In their study, focussed on identifying what determines employees’ perception of SC in the trucking industry, they observed that driver safety training, driver autonomy regarding safety, opportunities for safety input (driver empowerment) and top management commitment towards safety were the strongest predictors, from a driver point of view. On the basis of these results, they concluded that driver fatigue training, driver opportunity for safety input and top management commitment to safety are measures that should be implemented to strengthen drivers’ perception of a strong positive safety culture. According to Fernandes-Muniz et al. (2007), the aim of a positive SC is to create an atmosphere in which employees are aware of risk in their workplace and continually on guard against them. They see it as an important management tool to help control beliefs, attitudes and behavior with regards to safety. In this study, which is comparable to the
Human Factors in the Motor Carrier Industry in Canada 162
above-mentioned Arborela et al. (2003) investigation, they identified key dimensions of SC. The results indicate that commitment to safety by top managers is of primary importance, having a direct effect on employees’ attitudes and safety-related behaviors and an indirect effect through the adoption of a Safety Management System (SMS). The other dimensions that stand out are having an adequate SMS and employees’ involvement in the management of safety, or driver empowerment. With regards to the SMS, the authors specify that an adequate SMS will (1) define safety policies, (2) establish incentives for workers involvement, (3) provide continuous safety training, (4) provide fluid information about safety risks and how to deal with them, (5) plan for both effective proactive (preventive) and reactive (emergency) safety management actions and procedures and (6) conduct continuous internal and external risk assessment. They further observe that the efficiency of the SMS will depend on its ability to encourage the involvement of the workforce and to decentralize decision-making with regards to safety. Such situation leads to autonomy in control and reduced supervisory and monitoring costs, which enables improvement of working conditions without increasing prevention costs. They however note that significant training is needed for this type of operation and that firm manager commitment and involvement in safety activities is paramount. In the CTPSSB synthesis # 14, Short et al. (2007) discuss the role of SC in preventing CMV crashes and provide guidelines for the implementation of a strong positive SC. Anyone interested in establishing a strong SC in a motor carrier enterprise should process this report. Below are important highlights. The authors first make the point that en route risk behaviors initiated by drivers are a primary cause for crashes. They also point out that unsafe carriers attract unsafe drivers and that safe carriers produce, attract and retain safe drivers, which reveals the importance of the whole SC issue. They emphasize the importance of specific attitudes, values, norms and beliefs as well as safety practices and procedures that characterize safe carriers. However, what appears to be missing, is an emphasis on the potential effects of SC on drivers own attitudes, beliefs and norms towards risky-driving, and the impacts of these predictors of behavioral intention on driving behaviors per se, as demonstrated in the context of the TPB. In brief, Short et al. emphasize the following concepts:
• There is a clear connection between safety and culture; • Safety culture is defined by an organization’s norms, attitudes, values and beliefs
(interestingly these concepts are the nucleus of the TPB); • Top down safety communication/interaction enhances SC; • Organization subgroups can have their own specific SC; • Rewarding safe behaviors is an effective component of SC; • Driver experience enhances SC, therefore high turnover rates have a negative
impact on SC, and most likely on safety per se; • SC communication needs to be dynamic and multilevel, given the remote
workforce characteristic of the CMV industry; • Policies, procedures, safety responsibility need to be clear and simple;
Human Factors in the Motor Carrier Industry in Canada 163
• Hiring and training are key components of SC; • Monitoring safety performance of drivers and carriers as a whole is key to SC.
The authors recommend a list of activities that will aid the development of a positive SC:
• Develop a definition of safety; • Conduct Swiss cheese analysis (identify safety gaps, as understood by Reason,
1997); • Dispel safety myths; • Develop safety knowledge within the organization; • Top down definition of roles and responsibility in company’s safety management; • Put in place efficient safety communication; • Put in place efficient safety monitoring practices; • Develop motivational tools; • Improve driver retention.
Finally, they recommend a four-step continuous approach to develop a positive SC: the organization should first assess its current SC, then identify improvement areas, develop improvement strategies, implement these strategies and finally reassess its SC and so on.
Looking back at the previous discussions on the psychosocial determinants of risky-driving, it is interesting to realize to what extent the creation of a strong positive safety culture within a carrier - or the whole industry - fits with all that was said with regards to using the TPB in order to change driver’s behaviors. A strong positive safety culture could indeed alter the three sets of beliefs (behavioral, normative and control) at the basis of the TPB, which should alter behavioral intention and ultimately safety related (driving) behaviors. The constituents of safety culture (top management commitment to safety, safety policies, safety training, safety communication, safety practices, driver empowerment and transparent and active monitoring of safety performance) could indeed alter behavioral beliefs (what drivers think of risky-driving), normative beliefs (internalized norm about what peers think of risky behaviors) and control beliefs (the extent to which drivers think they are able to avoid unsafe driving). These, as we know, predict behavioral intention, behavior and eventually safety. Therefore, from a scientific point of view, the implementation of a positive safety culture is a legitimate strategy to increase motor carrier safety while relying on a sound behavior-change theory. Furthermore, in the section on recognition errors, it was shown that the decision to keep driving while feeling drowsy as well as the decision to use distractors while driving was probably closely related to drivers’ attitudes and behavioral intent as understood in the TPB. Therefore, the implementation of a strong positive safety culture could theoretically also have positive safety impacts by altering these processes as well. In sum, the implementation of a strong positive safety culture within the industry, or within individual carriers, provides a scientifically sound approach to problems that were empirically identified as the main causes for CMV crashes (fatigue, distraction, risky-driving). Thus, implementing a strong positive safety culture to prevent driver errors is one of the key recommendations of this task force.

Human Factors in the Motor Carrier Industry in Canada 164
2.3.3.3 The Safety Management System approach to safety culture SMS is used by Transport Canada to address safety culture and to manage safety in all the modes it regulates. As will be seen, it incorporates most of the notions that were defined in the publications on SC that were presented above. In brief, SMS defines an operator-based approach to safety management. It refers to a precise conceptual framework influenced by the Model of Accident Origins (Reason, 1997; see also SMS project team, 2004 & Transport Canada, 2001). It is a business-like approach to safety that uses an organizational point of view rather than the conventional health and safety framework. In this perspective, an accident is the result of a chain of events that occurred at different levels in the organization and preventing accidents thus involves intervening at all these levels. The SMS becomes part of the safety culture; it is rooted in the way people do their jobs throughout the organization. It is both proactive and reactive and relies largely on risk-management. Note further that an SMS can be used to address specific safety issues - such as driver fatigue - where it becomes a Fatigue Risk Management System (FRMS) that incorporates the elements of an FMP approach under the SMS protocol (Gander et al., 2011). Applying an SMS is considered to be financially viable since increased safety significantly lowers operating costs and increases the efficiency of the company (e.g., reduced collisions, better health and wellness of the employees, etc.). In the Railway Safety Act, SMS is referred to as a formal framework for integrating safety into day-to-day operations, which includes safety goals and performance targets, risk assessments, responsibilities and authorities, rules and procedures, and monitoring and evaluation processes. In publication TP 13881 from the Commercial and Business Aviation Branch (Transport Canada, 2002), it is described as being a systematic, explicit and comprehensive process for the management of safety risks, that integrates operations and technical systems with financial and human resources management, for all activities related to the operation of the organization. In 2000, the Standards Council of Canada (SCC) published National Standard B619-00 outlining an SMS program for Motor Carriers in Canada as well as guidelines for implementation (CSA, 2000). On the basis of this standard, the Canadian Standard Association (CSA International) offers a certification program (for a fee) within which carriers who have an SMS in place are being audited yearly and get a decal that recognizes their SMS status. Discussions with CSA officials however revealed that due to the absence of financial or regulatory benefits, the uptake on the program is quite low. In 2005, Transport Canada initiated a study to assess the applicability of SMS to the motor carrier industry in Canada. Given current regulatory regimes in the country, SMS was not discussed in a regulatory perspective, but rather for its pure alleged positive impacts on safety. In other words, TC was not investigating the possibility to use SMS to enforce any regulations, but rather simply to improve motor carrier safety through its impacts on safety culture and safety practices. SMS could be used on a voluntary basis, like FMP is used to mitigate drowsy driving. This parallels what Short et al. (2007) offer to the industry: guidelines for the voluntary application of a strong positive SC.

Human Factors in the Motor Carrier Industry in Canada 165
The feasibility study was conducted by Sypher (Bol and Tardif, 2006). The objectives were to:
1. Assess the applicability of the SMS approach to the reality of the Motor Carrier industry in Canada, considering the nature of the industry (including the proportion of small owners/operators undertakings), the Canadian jurisdictional and regulatory framework and any other relevant operational factors;
2. Discuss the societal costs and benefits of adopting such an approach for the federal and provincial governments, for the industry and for the Canadian public at large;
3. If a viable option, make high-level suggestions as to the form an SMS for Motor Carriers in Canada should take in order to maximize societal benefits.
4. If a viable option, make recommendations as to the next steps needed to move forward;
5. Review the presence of SMS in the Motor Carrier industry on the world scene and report on evaluation studies, if any;
6. Review SCC National Standard B619-00 and CSA International SMS program for Motor Carriers, analyze reasons for low uptake and recommend solutions.
In their study, Bol and Tardif defined SMS as a management system within an organization to manage safety risks. The major components typically include the following: 1. Commitment by the organization’s senior management to safety as evidenced by the endorsement, of:
• Safety policies; • Measurable safety objectives; • Clear organizational responsibilities and accountabilities for safety including
appointment of a senior manager (or officer) responsible for safety as well as a safety committee.
2. Procedures for monitoring safety performance and reporting safety hazards, incidents and accidents. 3. A safety assessment process to identify hazards, evaluate the safety risks of these hazards, and to take corrective action. 4. A plan for communicating the SMS to all employees. 5. Safety training of employees. 6. Periodic audits. 7. Documentation of the organization’s SMS.
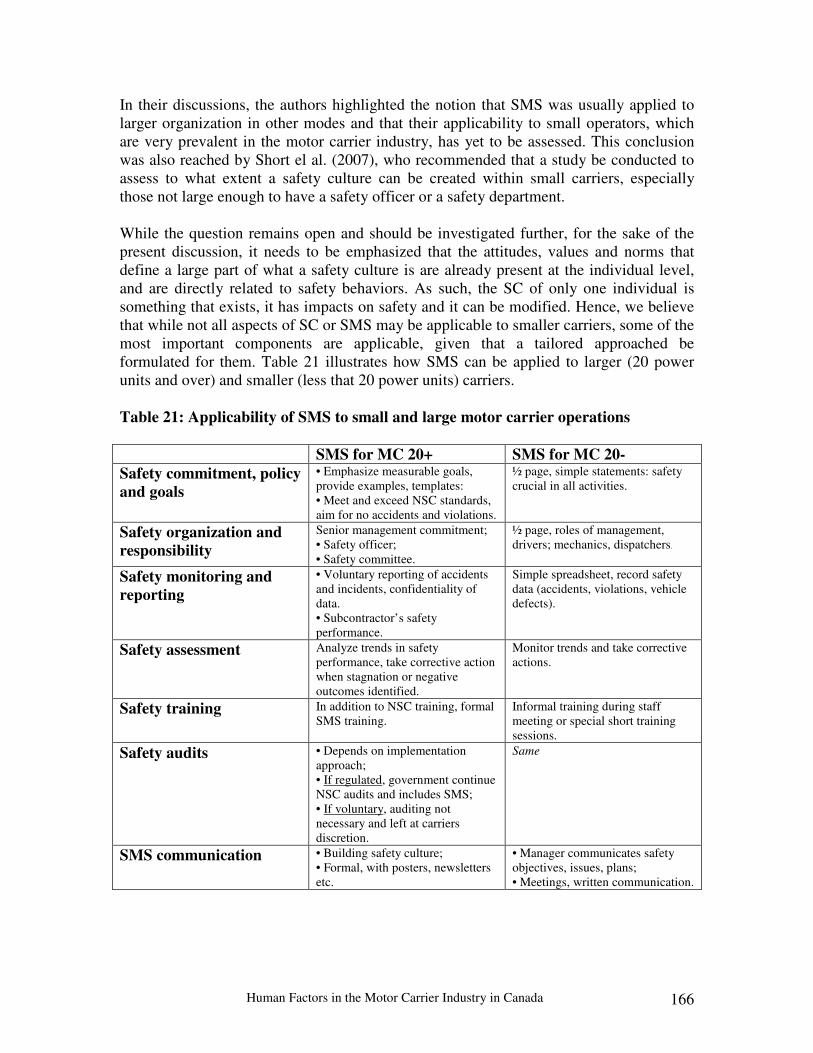
Human Factors in the Motor Carrier Industry in Canada 166
In their discussions, the authors highlighted the notion that SMS was usually applied to larger organization in other modes and that their applicability to small operators, which are very prevalent in the motor carrier industry, has yet to be assessed. This conclusion was also reached by Short el al. (2007), who recommended that a study be conducted to assess to what extent a safety culture can be created within small carriers, especially those not large enough to have a safety officer or a safety department. While the question remains open and should be investigated further, for the sake of the present discussion, it needs to be emphasized that the attitudes, values and norms that define a large part of what a safety culture is are already present at the individual level, and are directly related to safety behaviors. As such, the SC of only one individual is something that exists, it has impacts on safety and it can be modified. Hence, we believe that while not all aspects of SC or SMS may be applicable to smaller carriers, some of the most important components are applicable, given that a tailored approached be formulated for them. Table 21 illustrates how SMS can be applied to larger (20 power units and over) and smaller (less that 20 power units) carriers. Table 21: Applicability of SMS to small and large motor carrier operations
SMS for MC 20+ SMS for MC 20- Safety commitment, policy
and goals • Emphasize measurable goals, provide examples, templates: • Meet and exceed NSC standards, aim for no accidents and violations.
½ page, simple statements: safety crucial in all activities.
Safety organization and
responsibility Senior management commitment; • Safety officer; • Safety committee.
½ page, roles of management, drivers; mechanics, dispatchers.
Safety monitoring and
reporting • Voluntary reporting of accidents and incidents, confidentiality of data. • Subcontractor’s safety performance.
Simple spreadsheet, record safety data (accidents, violations, vehicle defects).
Safety assessment Analyze trends in safety performance, take corrective action when stagnation or negative outcomes identified.
Monitor trends and take corrective actions.
Safety training In addition to NSC training, formal SMS training.
Informal training during staff meeting or special short training sessions.
Safety audits • Depends on implementation approach; • If regulated, government continue NSC audits and includes SMS; • If voluntary, auditing not necessary and left at carriers discretion.
Same
SMS communication • Building safety culture; • Formal, with posters, newsletters etc.
• Manager communicates safety objectives, issues, plans; • Meetings, written communication.
Human Factors in the Motor Carrier Industry in Canada 167
With regards to owner/operators, who represent a significant portion of trucks on the roadways, the following SMS components could be applicable:
• Promotion of proactive safety policy, with safety goals; • Development and implementation of tools to monitor safety information and
trends; • Corrective actions if trend show negative outcomes (with guidelines as to
what these actions could be, given what the problems are); • Training on certain aspects of SMS (brochure); • Filing all safety information of the company in an SMS framework.
Bol and Tardif (2006) recommend that a strong business and a safety case be developed to increase the likelihood that SMS be applied within the industry. While it was clear in the report that safe carriers are financially more viable than unsafe ones and that a proactive safety attitude is above all things a cost-efficient initiative, fewer arguments were presented to support the notion that SMS would in fact generate objective safety improvements. However, looking at the above-mentioned publications on SC and its relationships with safety, there does not seem to be any doubt in other industrial settings that a strong positive SC is associated with a lower frequency of accidents. Since SMS is basically a SC management tool, the proposal that it shapes safety attitudes, values and norms within an organization holds. This in turn calls upon the notion that it could be used to alter the safety attitudes, values and norms of individual drivers, all of which are empirically validated predictors of behavioral intention and risky-behaviors. Therefore, keeping with the spirit of the work undertaken by this task force, the promotion of SMS, or other initiatives aimed at creating strong positive SC within the motor-industry is a scientifically sound recommendation to prevent drivers’ decision errors. Also, as discussed earlier, given the role most likely played by these attitudinal concepts in fatigue and distraction-related crashes, such programs could also have positive impacts on the occurrence of these recognition errors. It is therefore recommended that an SMS program be developed, with a significant emphasis on its SC components aimed at promoting proactive positive safety attitudes, values and norms. In this respect, top management commitment as well as the adoption of company safety policies, safety objectives as well as clear organizational responsibilities and accountabilities for safety are key components. This SMS program should be made available to carriers of all sizes and adapted to small operations, including owner operators. A business and a safety case should be drafted and made available to the industry in order to stimulate the adoption of SMS as a cost-efficient comprehensive management tool. Strategies such as SMS certification as well as lower insurance premiums for SMS-certified carriers should also be explored. It is also recommended to include driver incentive programs in the SMS. These programs are clearly identified in SC publications but are somewhat lacking in the SMS literature. Incentive programs have been shown to impact on driver safety motivation, which is a known predictor of risk-taking behaviors, as will be seen below. Also, while it is rather a meta-level approach to safety management, the SMS should be informed with best

Human Factors in the Motor Carrier Industry in Canada 168
practices in terms of interventions to address fatigue, distraction and high-risk driving, the most important crash-causation factors. As such, the SMS becomes more than a structure of high-level concepts and provides clear insights as to exactly what needs to be done to prevent crashes, as we understand it today. 2.3.3.4 Considerations with regards to applied behavior analysis Another important behavior modification approach to consider is the concept of Applied Behavior Analysis (APA). APA includes a fairly large family of behavior modification strategies that have shown to be efficient in various public health and environmental domains as well as in road safety interventions. It was for example successfully used to increase seat-belt use and to decrease DWI (see Lonero et al. 1994 for a comprehensive review). In brief, APA approaches are based on the classical behavioral psychology tradition that emanates from the work of B.F. Skinner. It is therefore essentially focussed on observable factors such as the conditions that elicit or trigger the targeted behavior (antecedents) and the (reinforcing or punitive) consequences, or influences, that follow this behavior. At the root of the approach is the notion that by manipulating the antecedents and/or the consequences of behavior, it is possible to establish (shape) behavior, maintain positive behaviors and extinct negative or ones. Road safety interventions using the antecedent approach have for example been successful in increasing seat belt use (Geller, 1990; see Lonero et al., 1994). Antecedents can take the form of signals that are used to trigger the positive behavior, like cues and prompts. In the case of seat belt, these would include vehicle reminder buzzers, buckle-up reminders, education programs, modelling, etc. (see Geller et al., 1987). Lehman and Geller (2004) observe that using prompts is an attractive intervention since it is low cost and can have a considerable impact when used properly. According to these authors, prompts will work better if the target behavior is easy to perform, clearly defined and if the message is delivered in the vicinity (time and space) of where and when the behavior should be produced. The message should also be polite - or soft - to avoid reactance. The classical behavioral modeling approach can also be considered as an antecedent strategy. Modeling involves making the demonstration of the target behavior to the target population, which will generate observational learning. Note that modeling can be done in vivo, but will reach much wider audiences if conducted my means of video or web-based applications. Antecedent interventions can also take the form of commitments, where drivers would for example commit to drive safely and could communicate this commitment by placing a reminder in their vehicle. They could also be rewarded to do so, and would loose this reward if improper behaviors were to occur. Note that this somehow relates to the social contract approach, which has already been introduced.
Human Factors in the Motor Carrier Industry in Canada 169
Education and awareness can also be considered as an antecedent approach. Lehman and Geller (2004) observe that providing information and awareness is an important component of most strategies but that it is seldom sufficient to change behavior. They note further that providing information and a strong rationale for the intervention will increase the likelihood that the effects of the intervention last after the intervention. However awareness and education alone should not constitute the intervention per se, but should rather be just a component of an intervention package that makes use of various behavior modification strategies. While antecedent approaches were shown to be effective in various settings, multiple forms of scientifically sound consequence-based interventions are also available and implemented. The use of feedback, which involves providing the individual with information about the target behavior, ideally in real time, is a good example of such strategies. Feedback has proven to be efficient with or without reward or punishment. It is however traditionally used in association with an anticipated consequence, since it makes this consequence more salient while the behavior is being produced. A good example of a feedback approach is the low-cost driver behavior monitoring system (DBMS) that has been developed and evaluated by Hickman and Hanowski (2010). As will be seem in the next section, a visual cue warns the driver when a safety critical event has been flagged by the system, which triggers the recording of driver monitoring data in the moments surrounding the event. This data will then be processed by a safety officer and discussed with the driver in a subsequent “coaching” session. The most widely applied consequences-based intervention is probably the use of reinforcements, rewards and incentives. In this regard, Lonero et al. (1994) emphasize that reinforcing positive behavior is more efficient than punishing the person once a negative action has taken place. They note further that punishment is rarely used in behavioral intervention, only when reinforcement is not possible, or when dealing with abnormal populations. APA is therefore more suited to create positive behaviors than to eliminate negative ones. For example, instead of trying to eliminate speeding and risky driving through punishment, APA principles underscore that it is more strategic to reinforce the positive behaviors of slower and safer defensive driving. The approach to make undesirable driving behaviors disappear is to increase the occurrence of positive behaviors that are incompatible with the undesired ones (e.g. defensive driving vs. aggressive driving), as stated by Geller (1990). Incentive programs, widely used in the motor carrier industry, therefore represent a key opportunity to influence driver behaviors while relying on solid behavioral science. Two broad scientific notions need to be brought forward to explain how and why these programs can achieve behavior modification: motivation and the concept of operant (or instrumental) conditioning. Motivation is the force that drives and organizes behavior. It is conceived as a latent variable that activates behavior and makes it effective in achieving goals. To better understand the notion, one must first understand the concept of needs. The principle of energy economy is central for human and animal survival and well-being. Our actions are

Human Factors in the Motor Carrier Industry in Canada 170
seldom wasted or useless and we have to invest our energy in behaviors that best serve our needs. Individuals who are healthy, strong and happy are those who best invest their (limited) energy in terms of fulfilling the various levels of human needs. In order to motivate someone into a specific behavioral direction, one must ensure that these behaviors will allow the fulfillment of needs that are significant (activated) at this given moment of his life. If these needs are not naturally associated with these behaviors, the relationship can be created by establishing a system of reward, for example in the context of an incentive program, much in the same way it is done in publicity, where the satisfaction of a significant need is artificially associated with a targeted behavior. The notion of hierarchy of needs (Maslow, 1970) is also important to consider. Needs are never equally activated, some are more important - or more activated - than others at any given point in time. Therefore it is paramount, when trying to motivate someone into doing something, to associate targeted behaviors with the right needs at the right time. In this respect, Maslow talks about primary needs (physiological needs, need of shelter, security, etc.) and secondary needs (being loved, being accepted, need of self-esteem, self actualization, etc.). He organized a complex hierarchy, known as the pyramid of Maslow (see figure 22) where primary needs are at the base and more evolved, secondary needs are higher up in the pyramid. The key idea is that needs higher in the pyramid are not activated as long as needs at lower levels are not fully or at least partially satisfied. In other words, higher-level needs are not good motivators if primary needs are not met: an individual with little money, poor shelter and not much to eat will not be driven by a program that would associate certain behaviors (e.g. safe driving) with needs of self-esteem or self-actualization. Following this reasoning, if a carrier wishes to encourage safe driving behaviors, clean safety records or fuel-efficient driving through driver incentive programs, these behaviors need to be associated with a reinforcement that corresponds with actual driver needs. The choice of reinforcement is therefore of prime importance, as discussed in Smith (2005). The second scientific principle underlying incentive programs’ efficiency is called operant or instrumental conditioning. It is the principle by which all animals (including humans) are sensitive to the consequences of their actions and learn how to adapt to their environment in order to prevail. Skinner talks about the natural selection of behaviors, where the behaviors that bring positive results survive and those that bring negative or neutral results tend to naturally disappear. As mentioned, different types of consequences can indeed occur after a behavior is produced. They can be positive (reinforcing) or negative (punitive). A positive reinforcement is when we try to increase the frequency of a behavior by adding something good, and a negative reinforcement will aim to achieve it by taking away a negative agent. A positive punishment decreases the frequency of a behavior by adding a negative agent and a negative punishment will do it by taking away something good.

Human Factors in the Motor Carrier Industry in Canada 171
Figure 22: Maslow’ hierarchy of needs Behavioral science and APA principles clearly indicate that it is more efficient to use positive reinforcement to modify behaviors, rather than negative reinforcement or punishment. In brief, punishment creates negative emotions, negative social interactions and dysfunctional organizational climate where resentment, uncooperativeness, antagonism and sabotage are likely to occur (Barton et al., 1998). This would have negative consequence on a carrier’s safety culture and can even stimulate the production of behaviors that it intends to eliminate. The use of positive reinforcement, where the reinforcing agent is significant for the individual (meets an activated need) is therefore the most efficient behavior modification strategy according to behavioral science (see Lonero et al., 1994, Barton et al., 1998, as well as Wilde, 2001). In the Barton et al. (1998) study, Gerald Wilde brings further important theoretical considerations that should be presented here. He first emphasizes that there is a major increase worldwide in the use of incentive programs to alter driver behaviors, suggesting that this increase is due to …the large amount of empirical evidence compiled in occupational, clinical and health psychology that shows benefits of applying the behavior modification approach to the treatment of dysfunctional behaviors and the shaping of desirable behaviors (p.6).

Human Factors in the Motor Carrier Industry in Canada 172
Wilde also makes the point that this behavior modification approach is very different from the traditional “3Es” approach to road safety (engineering, enforcement, education). He notes that engineering provides opportunities to be safe, that education improves knowledge and skills and that enforcement can discourage some individuals from engaging in some specific actions. However, none of these approaches increase the desire to be safe, which is the principal determinant of risk-taking behaviors. To understand this argument, one needs to refer to Wilde’s risk-homeostasis theory. In brief, the theory stipulates that an operator is constantly comparing the perceived level of risk to the target level of risk. When there is a discrepancy between both, there is behavioral adaptation in order to maintain risk homeostasis. In other words, when the perceived risk becomes lower that the target level of risk (which varies from one person to another), the driver will increase objective risk (e.g. drive faster) in order to bring about a conformable balance and regain risk homeostasis. The opposite case is also true. According to Wilde, any intervention that does not address the target level of risk (desire to be safe) is likely to fail. For example, engineering efforts to make safer roads and safer vehicles may lead to lower perceived risk, which will be adapted to by increased risk-taking by the individual, and in fact, by the population at large. Advanced training programs will naturally increase the level of skills, but they may also increase the level of confidence (lower risk perception), which can lead to potentially dangerous behavioral adaptation. Wilde notes further that the scientific evidence to support the use of punishment (ticketing, violations) to act on driver’s motivation to drive safely still needs to be presented. He adds further that deterring one specific high-risk behavior may not impact on global crash rates since other high-risk behaviors are likely to be adopted to regain risk homeostasis. Under this angle, an intervention strategy that is likely to be efficient is one that would act on the motivation or the desire of drivers to be safe. Such motivational intervention is in fact the only way to alter the target level of risk (or risk acceptance), which, as previously stated, is the strongest determinant of risk taking behaviors. Incentive programs that associate safe behaviors with the satisfaction of activated needs are likely to generate such effect: they will alter the cost/benefit ratio at the root of the equation that determines the target level of risk for an individual. Driver incentive programs in the motor carrier industry have proven to be effective and cost-efficient (Barton et al., 1998). They are usually aimed at increasing safety performance and fuel efficiency. In a fine general introduction to the concept, Smith (2005) interviewed renowned experts in the field. Below are key statements that should be highlighted from this discussion:
• Incentive programs are performance improvement strategies using performance tracking coupled with incentives to reward drivers who are meeting goals that will help carriers solve problems;
• Punishment begets dysfunctional safety climate and may increase the inclination to beat the system;

Human Factors in the Motor Carrier Industry in Canada 173
• Incentive programs bring about greater safety performance and positive safety climate;
• FMCSA survey shows that incentive programs can reduce driver turnover by 65%;
• Canadian study (Barton et al. 1998) shows that one carrier’s turnover rate dropped from 98% to 15% and that despite an increase in miles driven, crashes decreased 25%. Program costs were estimated at 60 K yearly, with savings of 228K. In the same study, another carrier showed a reduction in turnover of 40% after implementation of a safety program with annual costs of 150K and estimated savings of 800 K;
• An incentive program is only one tool in a management package, it needs to be part of a comprehensive system that includes training for skills and knowledge (synergy between motivation and training to change behavior);
• Driver recognition needs to focus on company key values; • Outcome variable (e.g. safety or fuel economy) are the basis for reward, rather
than processes; • Point systems for safe behaviors - as measured by different proxies – are
nevertheless recommended; • Recognition should not be limited to a few, but rather to all that meet the
objective. It should also be swift (contingent with behavior) and frequent (monthly rather than quarterly or annually);
• Program needs to be communicated with vigor from management; • Public recognition of drivers is important; • Need to find what motivates drivers (consult them); • Focus on the whole organization, not just drivers; • Not short term, need at least three years commitment; • Cash reward is short lived, (slippery awards), other more meaningful
recognition's (sticky award) may be more efficient. With regards to effectiveness, Lonero et al. (1994) provide examples of evaluation studies for incentive programs used for the general driving population. In the study from Harano and Hubert (1974) it was observed that drivers who had caused crashes and committed violations in the previous year would see their license extended free of charge if they maintained a clean record for the following year. Results indicate that fewer drivers in this incentive group had collisions, compared to a control group where drivers did not get this free extension. In another scenario, a group of drivers were given the free extension without being warned of the need to keep a clean record for a year. The results indicate that they had worse performance after the extension than before. Lonero et al. also emphasize that incentive programs have been successfully used to increase seat belt usage. However, they conclude with a caution that these powerful behavioral techniques need to be handled with care since they can lead to negative consequences if badly designed. They also point to the need for carrying out evaluation studies with control groups.

Human Factors in the Motor Carrier Industry in Canada 174
Barton et al. (1998) conducted a study on incentive programs to enhance truck safety and productivity in Canada. The study identified programs in place as well as their strengths, weaknesses and obstacles for successful implementation. They also made recommendations on further actions needed to enhance the use of safety incentive programs in the country. In their executive summary, the authors note that:
• Of currently available accident countermeasures, those that affect people’s motivation seem to be the most promising;
• Programs that reward accident free performance and enhance motivation towards safety hold the greater potential;
• Combining incentive programs improving motivation to be safe with proper tools and knowledge will result in improved safety;
• An estimated $30 to $50 millions is spent annually by the industry on these programs (as of 1998), which are understood to be remarkably efficient, with crash reductions in the order of 80% and cost/ratios typically greater than 2 to 1 being reported;
• For the two carriers that were reviewed in-depth, the cost-ratio was 3 to 1 and insurance rebates due to reduced claims covered the costs of employee bonuses paid out under the programs;
• Of 40 carriers surveyed, 70% had an incentive program in place, and the use appears to be growing (again, study dates back to 1998);
• Companies however do not have guidelines or reference points to develop programs, which are therefore sometimes being developed on the basis of intuition, judgment or common sense;
• Surveyed carriers clearly expressed the need for such scientific guidelines. Barton et al. (1998) observed that companies where the incentive program is implemented within a comprehensive safety programs (related to the concept of SMS) have more success. Elements of such a comprehensive program would include the following:
• Company management with demonstrated commitment to safety; • Driver recognition through award programs; • Good communication and safety meetings; • Training for new drivers before they develop bad habits or attitudes; • Drivers advised of inadequate performance and corrective measures applied; • In other words, the carrier has to have a strong positive safety culture for an
incentive program to achieve its potential. The authors also identified key requirements for effective incentive programs:
1. Strong managerial vigor and commitment; 2. Program planned in consultation with the target population; 3. Incentives extended to different levels in the organization; 4. Simple rules; 5. Fair adjudication of responsibility for accidents;
Human Factors in the Motor Carrier Industry in Canada 175
6. Rewards focused on not having an accident; 7. Attractive rewards; 8. Progressive accumulation of safety credits; 9. Rewards perceived as equitable; 10. Rewards perceived as attainable; 11. Supplementing incentives with safety training; 12. Under-reporting of lesser accidents discouraged; 13. Peer pressure toward safe conduct enhanced; 14. Short incubation periods; 15. Proper program evaluation.
Therefore, as emphasized by Barton et al. (1998), the trucking industry can use incentive programs to its advantage in terms of increased safety, enhanced profitability, better company morale, greater productivity and a reduction in personnel turnover. These improvements can be achieved by either developing incentive programs or by monitoring and refining already existing ones on the basis of sound scientific knowledge. Even literature on the use of incentive programs within the trucking industry is scarce, it appears that they are widely used in a decentralized, intuitive carrier-specific mode. In the absence of comprehensive scientific guidelines, it is likely that some of these programs are not reaping the desired results and may even be generating negative effects. Hence, given the complexity and the subtleties of such behavior modification approach, it is highly suggested that a state-of-the-art incentive program, based on cutting-edge scientific knowledge emanating from ABA principles (such as the use of cues, prompts, feedback, commitments and rewards), be developed and thoroughly evaluated, in an effort similar to what was undertaken for driver fatigue under the NAFMP program. Once developed and proven to be efficient, this program could be presented to the industry, either to be adopted on a voluntary basis or to serve as a template, or a general set of guidelines, that could be used by carriers to develop their own programs, or to test the scientific soundness of existing ones. Such a program should be accompanied by strong safety and business cases that would be used in order to increase the utilization of the approach within the motor carrier industry. 2.3.3.5 Considerations with regards to safety technology The distinction between active and passive safety interventions was discussed earlier, and it was made clear that a new paradigm where active and passive safety measures are seen as complementary is progressively shaping up. While this task force’s work is oriented towards discussing the nature and the potential of active safety interventions, it is important to present significant advances in passive safety that have potential to help prevent some driver errors, or to mitigate their impacts when they do occur. There is currently a lot of emphasis for three specific crash-avoidance technologies: forward collision-warning systems (FCWS), lane-departure warning systems (LDWS) and roll stability control (RSC) (see FMCSA, 2007).
Human Factors in the Motor Carrier Industry in Canada 176
The FMCSA is currently engaged with the industry in an effort to test, evaluate and encourage the deployment of these onboard safety systems. Three benefits/costs analysis (BCA), one for each of the three technologies, were conducted with ATRI as part of these efforts (Houser et al., 2009, Murray et al., 2009a and Murray et al., 2009b). As described in the 2009 OECD report: data from 2001 through 2005 were used to estimate the average annual numbers and costs of crashes preventable by each of the three systems. The primary data for benefits and crash costs paid by the industry came from insurance companies, motor carriers, legal experts, and others. Crash avoidance costs were calculated for annual VMT values between 80,000 and 160,000 miles. Only key results are listed below. The reader should consult the reports for more information. Houser et al. (2009) conducted the BCA for LDWS. These systems use optical sensors and image processing to establish vehicle state (lateral position, lateral velocity, heading, etc.) and roadway alignment (lane width, road curvature, etc.). They alert the driver to which side of the lane the vehicle is drifting and may also indicate how well the vehicle is centred in the lane on a time-averaged basis (OECD/JTRC, 2009). The technology in fact warns drivers about unintended weaving and lane drifts when the vehicle is travelling above a certain speed (approx 35 mph) and the turn signal is not on. The results of the BCA indicate that the LDWS would represent a cost-efficient investment for a carrier, with a return of $1.37 to $6.55 for each dollars spent, depending on which parameters are used (see also FMCSA, 2009b). Murray et al. (2009a) conducted the BCA for the RSC system. Roll stability control systems use sensors and algorithms to detect when there is a risk that the vehicle could rollover and will reduce engine torque and/or apply the brakes to reduce the speed and lateral acceleration experienced by the vehicle in order to prevent crashes (OECD/JTRC, 2009). Murray et al. estimated that the use of the RSC could prevent between 1,422 and 2,037 combination vehicle rollover crashes in curves annually. In terms of cost efficiency, the BCA estimates that for each dollar invested carriers will get a return between $1.66 and $9.36, depending on which parameters are used. Murray et al. (2009b) conducted the BCA for the FCWS. These systems are intended to provide warnings to the driver when a vehicle (or object) comes within a predefined interval in the front of the truck. Hence, when the truck approaches slower moving traffic or stationary objects, progressively more urgent warnings will be issued. FCWS thus have the potential to prevent rear-end crashes as well as tailgating, which is a key aggressive driving behavior. The BCA indicates that FCWS could annually prevent between 8,597 and 18,013 rear-end crashes and that for every dollar invested, a carrier would get a return of $1.33 to $7.22, again depending on which parameters are used. In a 2009 Techbrief presenting these three studies, FMCSA concludes that heavy truck crashes result from a series of critical events and factors, many of which can be prevented with the use of these onboard safety systems, and therefore these systems should be accepted as cost-effective practices to improve CMV safety. Similar conclusions can be found in the OECD/JTRC (2009) report where these in-vehicle driver support systems are identified as technologies with demonstrated potential to increase safety.
Human Factors in the Motor Carrier Industry in Canada 177
Using data from the LTCCS, Houser and Flannery (2008) conducted a series of analyses to identify driver errors contributing to CMV crashes that could have been prevented or mitigated by the above-mentioned safety technologies. They identified recognition, decision and performance errors as critical reasons for crashes that could be prevented or mitigated and rollovers, lane departures and rear-end crashes as the types of crashes most likely to be avoided. The analysis shows that 60 rollover crashes, of the 963 crash sample, could have been prevented/mitigated by RSC, of which 8% were caused by recognition errors (inattention) and 75% by decision errors (faulty judgement, speeding and aggressive driving). In terms of lane departure crashes, 35 crashes could have been prevented/mitigated by LDWS, of which 46% were associated with fatigue, 24% with inattention or distraction and 30% with overcompensation or poor directional control. Finally, 91 rear-end crashes could have been prevented/mitigated by FCWS, of which 43% were caused by decision factors such as high-risk driving (speeding, following to closely), 40% by recognition factors such as inattention, 6% by performance errors and 11% by unknown factors. Overall these represent a very significant number of crashes (186), accounting for 19% of this nationally representative sample of truck crashes. It is therefore clear that these crash-avoidance technologies should be part of a comprehensive package to address driver errors and that their adoption is recommended. Drivers’ reactions to these systems could however be investigated further, focussing on notions such as behavioral adaptation and drivers’ acceptance or trust. It is indeed possible, as implied in Wilde’s risk-homeostasis theory, that these technologies could decrease the subjective level of risk, which could generate an increase in risk-taking (behavioral adaptation) in order to return to a state of equilibrium with the target level of risk. Drivers may also overly rely on these systems and take more risks because they feel protected by them. There is also the case where they would not accept or trust the technologies and would fail to properly react when presented with warning signals. In other words, even though the technologies should be recommended, it is likely best that they be associated with some driver-based interventions in order to prevent the likelihood of such adverse effects. However, the nature of these effects and of any associated driver-based interventions needs to be investigated further. In this respect, it is important to emphasize the Integrated Vehicle-Based Safety Systems (IVBSS) program, a five-year research initiative conducted by an industry consortium led by the University of Michigan Transportation Research Institute (UMTRI, see Sayer et al., 2009). The objective of this program was to assess the safety benefits and driver acceptance associated with a prototype integrated crash warning system designed to address rear-end, roadway departure, and lane change/merge crashes for light vehicles and heavy commercial trucks. The program, which was just recently completed (see Sayer et al., 2010), included a comprehensive FOT of the above-mentioned crash-avoidance technologies installed on a sample of 10 heavy-vehicles operated by 18 drivers for a period of 10 months. Safety

Human Factors in the Motor Carrier Industry in Canada 178
benefits were being assessed on the basis of an estimation of the number of crashes that could be avoided by full deployment of the integrated system in the U.S. as well as by analyzing driver behavior to determine the presence of any unintended consequences that could have negative effects on road safety. In brief, the experimentation compared baseline driving with a treatment condition (system activated) in order to assess any positive or negative effects during normal driving as well as during conflict and near-crash situations. The assessment of drivers’ acceptance focussed on the following five elements:
• Ease of using the system, principally in terms of the driver interface implementation;
• Perceived usefulness of the system based on drivers’ subjective assessments of safety while using it, and their perception of how use of the system affects their driving skills and workload;
• Ease of learning, including drivers’ understanding of the system, how long it takes to learn to use it, and utility of the instructional process;
• Drivers’ advocacy of the system, expressed willingness to pay for the system and to endorse its use to others;
• Drivers’ assessment of their own driving performance and their judgment of whether system use leads to behavioral adaptation such as changes in their attention to driving tasks, trip making, or vehicle use.
The main results indicate that the IVBSS improved some aspects of driver performance (mainly headway keeping), that the majority of drivers accepted the system and that no behavioral adaptation issues were observed. Overall, the lack of evidence for any signs of increased risk taking or behavioral adaptation suggest that if there are negative behavior consequences to the system, they are relatively minor and would be outweighed by the benefits. Note that the new results are multiple and complex and that they should be more heavily processed, along with the results of any similar or related studies, in further examinations/discussions related of this issue. Below are some items that need to be emphasized. In brief:
• The IVBSS system did not prompt drivers to engage in secondary (distracting) tasks while driving;
• Drivers stated that the system made them more aware of traffic environment and lane position;
• Large majority of drivers prefer driving equipped trucks, perceive that integrated crash warning systems would increase driving safety and would recommend the purchase of system;
• Seven drivers reported that the integrated system potentially prevented them from having a crash;
• Drivers generally found the system convenient to use; • However, invalid warning rate for lane-change merge warnings and forward
collision warnings led some drivers to describe the warnings as distracting or annoying;
Human Factors in the Motor Carrier Industry in Canada 179
• Drivers who received higher percentages of invalid warnings reported that they began to ignore the system and nearly one-third of drivers reported that invalid warnings affected their understanding of the system, therefore a reduction in the number of invalid warnings would reduce both the likelihood of drivers ignoring the system and increase their understanding of the technology;
• Nevertheless, there was no relationship between drivers’ subjective ratings of each subsystems and the rate of false warnings signals;
• Of the three subsystems, drivers clearly preferred the LDW system, rating it the most satisfying of the three subsystems, even though FCW being rated the most useful;
• LDW was a particular favorite for line-haul drivers, given the long hours and great distances covered on limited access roadways;
• Line-haul drivers also mentioned the headway time display of the FCW subsystem as being particularly helpful;
• The reader is invited to consult directly the Saye et al (2010) report for a detailed summary of the results for each subsystem.
Another technological approach that needs to be described is the notion of onboard safety monitoring of driver behavior (OBSM). At the 2010 TRB annual meeting, FMCSA reported on a study to evaluate the safety benefits of a low-cost driving behavior management system (DBMS) for CMV operations. Similar material was presented during a FMCSA webinar (Hickman and Hanowsky, 2009). Below is a brief summary of this material. The case is first made that high-risk behaviors from drivers are the primary cause for crashes and that an objective and reliable measure of driver behavior is needed to address the problem of high-risk driving through behavioral approaches (see figure 23). This study, conducted by Hickman and Hanowsky for FMCSA, therefore focussed on a comprehensive driver-behavior management approach that includes low-cost in-vehicle monitoring technologies as well coaching, or feedback, provided by a safety officer. The technology itself is composed of two cameras (driver face, forward view) and three accelerometers that record in a loop. The data is however only considered (or activated) by potential safety critical events (SCE: accelerometers = 0.5g) and only four seconds before and after the event are considered. Note that any such event recording is signalled to the driver by an event status light, therefore enabling some performance feedback, as understood in applied behavior analysis. Hickman and Hanowsky (2009) note that monitoring technology alone is not likely to alter driver behavior and that a hybrid approach coupling technology and coaching feedback has potential to be a powerful tool to reduce high-risk driving. Note that such an approach is coherent with Behavioral-Based Safety techniques (BBS), which aim to identify unsafe behaviors, monitor those behaviors and provide feedback to encourage safe behaviors and discourage unsafe ones (see Hickman et al., 2007 for a comprehensive review). In the Hickman et al review, it is concluded that contrary to other industrial settings, systematic BBS programs have not been widely embraced in the motor carrier industry. This is partly attributed to the solitary nature of CMV operations, which
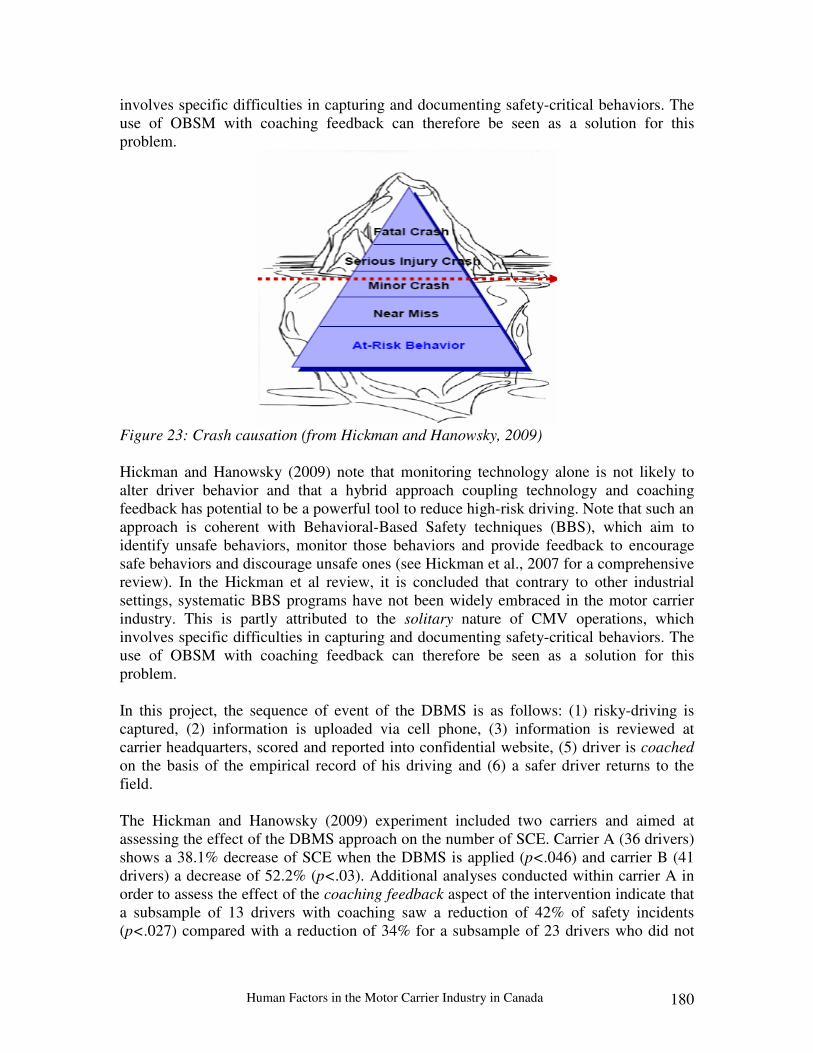
Human Factors in the Motor Carrier Industry in Canada 180
involves specific difficulties in capturing and documenting safety-critical behaviors. The use of OBSM with coaching feedback can therefore be seen as a solution for this problem.
Figure 23: Crash causation (from Hickman and Hanowsky, 2009) Hickman and Hanowsky (2009) note that monitoring technology alone is not likely to alter driver behavior and that a hybrid approach coupling technology and coaching feedback has potential to be a powerful tool to reduce high-risk driving. Note that such an approach is coherent with Behavioral-Based Safety techniques (BBS), which aim to identify unsafe behaviors, monitor those behaviors and provide feedback to encourage safe behaviors and discourage unsafe ones (see Hickman et al., 2007 for a comprehensive review). In the Hickman et al review, it is concluded that contrary to other industrial settings, systematic BBS programs have not been widely embraced in the motor carrier industry. This is partly attributed to the solitary nature of CMV operations, which involves specific difficulties in capturing and documenting safety-critical behaviors. The use of OBSM with coaching feedback can therefore be seen as a solution for this problem. In this project, the sequence of event of the DBMS is as follows: (1) risky-driving is captured, (2) information is uploaded via cell phone, (3) information is reviewed at carrier headquarters, scored and reported into confidential website, (5) driver is coached on the basis of the empirical record of his driving and (6) a safer driver returns to the field. The Hickman and Hanowsky (2009) experiment included two carriers and aimed at assessing the effect of the DBMS approach on the number of SCE. Carrier A (36 drivers) shows a 38.1% decrease of SCE when the DBMS is applied (p<.046) and carrier B (41 drivers) a decrease of 52.2% (p<.03). Additional analyses conducted within carrier A in order to assess the effect of the coaching feedback aspect of the intervention indicate that a subsample of 13 drivers with coaching saw a reduction of 42% of safety incidents (p<.027) compared with a reduction of 34% for a subsample of 23 drivers who did not
Human Factors in the Motor Carrier Industry in Canada 181
participate in any coaching. However, in this case the reduction did not reach statistical significance (p<.136). Hence, globally the results suggest that the overall DBMS approach was efficient in reducing SCE by up to 52 % and also substantiate the importance of using a video-based coaching feedback procedure with drivers. In light of the previous sections on potential driver-based interventions to address risky-driving, the use of this DBMS or BBS framework appears like a good opportunity to implement new scientifically valid interventions at the coaching stage of the process. The recorded information can indeed serve as a primary indicator of driving style, and could be coupled with other psychometric measures that would characterize the utility of risky-driving for specific individuals. Drivers could then be directed through an algorithm that would contain different intervention options according to different types of risky-driving, or different types of risky drivers. However, as mentioned earlier, if the objective is to base these interventions on sound behavior modification science, most of them still need to be developed and evaluated. It is important to note that another project conducted for FMCSA by a team led by the University of California (Misener et al. 2007) also developed a comprehensive suite of OSBM hardware to be used in the context of a DBMS. In contrast with the low-cost technology presented above, this system measures a broad set of indicators of unsafe driving (speed, following distance, lane keeping, safety belt use, turn signal use). Coherent with the applied behavior analysis and the BBS approach, the authors indicate that this data should be used to provide feedback to drivers, either directly in real time, or through carrier management in order to improve their safety performance. The strengths of this approach are that (1) it proposes a form of “expert system” that can provide an in-depth profiling of drivers’ risky-driving behaviors and (2) that it allows for real-time feedback. The research team prepared a prototype but the status of a subsequent FOT is unknown at this time. In the absence of data from an evaluative study, it is therefore difficult to comment on the relative efficiency of this type of system (considering its costs) compared to the low-cost alternative that was developed and evaluated by Hickman and Hanowsky (2009). However, given that this last approach is low-cost and that it was shown to be efficient in reducing SCE, we believe that it does offer great potential, especially if used in conjunction with novel scientifically-sound driver-based interventions, as mentioned above. 2.3.3.6 Interactions between light and heavy vehicles Studies addressing interactions between light and heavy vehicle were discussed in section 1 (e.g. LTCCS, EPAC study, Dingus et al., 2002; Dingus at al., 2005; Hanowski et al., 2000; Hanowski et al., 2007, Kostyniuk et al., 2002). Some of the key messages stemming from these studies are summarized below:
• Interactions between light and heavy vehicles represent a significant problem that needs to be addressed;
Human Factors in the Motor Carrier Industry in Canada 182
• There is a trend showing that LDV drivers tend to be more at fault than CMV drivers, however there are inconsistencies in study results (in the LTCCS, the assignment of the critical reason for the crash nears a 50/50 split);
• The logical strategy is therefore to address the problem as a whole, rather than focusing only on either side of the equation;
• Studies indicate that inattention, speeding and aggressive driving come out as main causation factors for both LDV and CMV drivers involved in CMV crashes;
• Behaviors such as following too closely, driving with vision obscured, drowsy or fatigued driving and improper lane change appear predominant;
• Authors mainly recommend interventions such as aggressive driving mitigation approaches, defensive driving skills training for CMV drivers and LDV drivers education focused on the risks associated with driving near commercial vehicles trucks and how to operate around them.
Since the causation factors identified in LV/CMV crashes (inattention, speeding, aggressive driving) were identified and processed in this review, the main recommendations that were made regarding these problems are likely to generate positive results on LV/CMV interactions. For example, with regards to inattention, interventions aimed at preventing fatigue and distraction among CMV drivers are intended to help them to remain vigilant, which should translate into fewer lane departure incidents as well as better reaction times in the presence of slower moving or stopped traffic. Likewise, any efficient intervention aimed at decreasing CMV drivers risky-driving behaviors will undoubtedly generate positive impacts on LV/CMV interactions, in particular in the context of aggressive driving behaviors, which are related to social interactions on roadways. Therefore the first observation that can be made with regards to preventing LV/CMV crashes is that engaging in the various activities that were discussed so far in this review to address recognition and decision errors would be beneficial. There is also a need to stress the importance of addressing these problems for general road users, which also contribute to CMV crashes. However, while it is important to emphasize that inattention and risky-driving interventions for CMV and LDV drivers are likely to have positive effects on LV/CMV interactions, given the significance of this problem and the dramatic consequences experienced by the more vulnerable LDV drivers, road safety initiatives designed specially to deal with LV/CMV interactions also need to be promoted. Two of these interventions are discussed below. In the United-States, the FMCSA and the NHTSA funded the development, evaluation and implementation of a targeted enforcement program called Ticketing Aggressive Cars and Trucks (TACT), which mainly focuses on passenger vehicles interacting with CMVs (NHTSA/FMCSA, 2007; Nerup et al., 2006; Thomas et al., 2008). TACT is described as a program that combines outreach, education, and evaluation with targeted enforcement activities to raise awareness among passenger vehicles and CMV drivers about safe driving behaviors. Unsafe driving include unsafe lane changes, tailgating, failing to signal, failing to yield, speeding and aggressive driving.
Human Factors in the Motor Carrier Industry in Canada 183
Note that the TACT program is based on the STEP model (Selective Traffic Enforcement Program), which was successfully applied to address seat-belt use (Solomon et al., 2004), impaired driving (Zwicker et al., 2007) and speeding (Blomberg & Cleven, 2006). TACT programs are currently implemented in twelve states in the U.S. As can be seen in NHTSA/FMCSA’s (2007) implementation guidelines, the STEP model is based on the principle that an individual discomfort or fear of being stopped for a traffic safety violation outweighs the desire not to comply with the law. This component of the program is in line with the traditional enforcement approach and could therefore be qualified in light of what was said about the limitations of using fear, threats and punitions to alter human behavior. Nevertheless, although limited in scope, enforcement will always be essential in a comprehensive road safety package, and the fact that in this case it is repetitive, intensive, supported by publicity and targeted at specific behaviors, significantly increases the likelihood of success (see Lonero et al, 1994). Thomas et al. (2008) emphasized that TACT programs are not only based on enforcement but also incorporate awareness and education: TACT is a newly developed STEP that uses education, enforcement and media in an attempt to alter aggressive driving behaviors around CMVs. The program therefore combines enforcement (threat of punition) with the transmission of knowledge using an intensive media campaign that has the potential to impact on driver attitudes. The notion of knowledge transmission is particularly relevant in this context because it is apparent that LDV drivers are most of the time not aware of the realities of trucks and truck driving as well as of the objective risks associated with interacting with heavy vehicles. Making them understand these issues will increase their subjective risk, most likely generating positive behavioral adaptation and safer driving. On the other hand, the attitudinal component - which could alter behavioral intentions of motorists in the vicinity of CMVs - does not seem to be theory-driven in this program, like it is the case in most road safety interventions. To our knowledge, there is no mention of any attitude theory, attitude change model, or attitude assessment approach at the basis of TACT interventions. Using an empirically validated theory to assess the (attitudinal) determinants of risky-driving of LDV drivers around CMVs and to develop a tailored media intervention aimed at these determinants (attitudes, subjective norms, perceived behavioral control, etc.) could increase the efficiency of the program as a whole. But this remains an open question. Nevertheless, the program was scientifically evaluated and shown to be efficient on many accounts (Thomas et al., 2008). In this study, a TACT program was initiated on two highway segments while two comparable control sites remained free of TACT interventions. The program consisted of two waves of police enforcement that lasted two weeks each. Police officers also rode onboard CMVs to observe LDV drivers behaviors, communicating any violations to other officers that would conduct interceptions. There were also aviation units as well as unmarked vehicles involved.
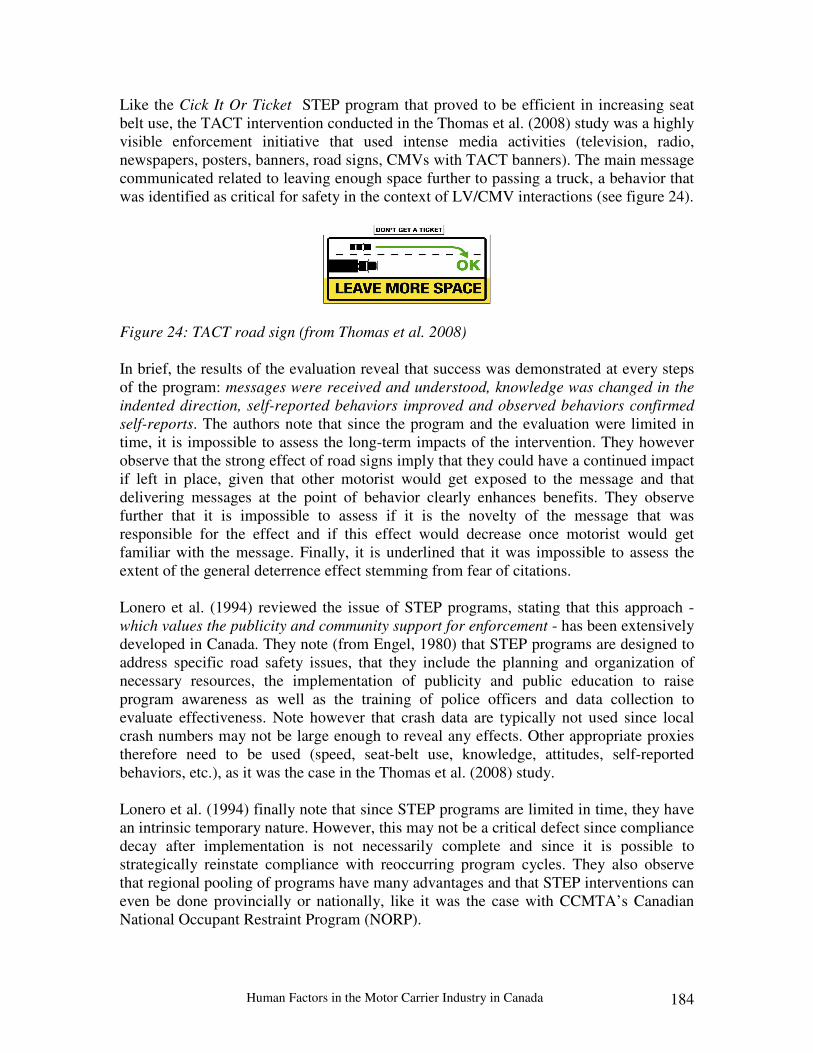
Human Factors in the Motor Carrier Industry in Canada 184
Like the Cick It Or Ticket STEP program that proved to be efficient in increasing seat belt use, the TACT intervention conducted in the Thomas et al. (2008) study was a highly visible enforcement initiative that used intense media activities (television, radio, newspapers, posters, banners, road signs, CMVs with TACT banners). The main message communicated related to leaving enough space further to passing a truck, a behavior that was identified as critical for safety in the context of LV/CMV interactions (see figure 24).
Figure 24: TACT road sign (from Thomas et al. 2008) In brief, the results of the evaluation reveal that success was demonstrated at every steps of the program: messages were received and understood, knowledge was changed in the indented direction, self-reported behaviors improved and observed behaviors confirmed self-reports. The authors note that since the program and the evaluation were limited in time, it is impossible to assess the long-term impacts of the intervention. They however observe that the strong effect of road signs imply that they could have a continued impact if left in place, given that other motorist would get exposed to the message and that delivering messages at the point of behavior clearly enhances benefits. They observe further that it is impossible to assess if it is the novelty of the message that was responsible for the effect and if this effect would decrease once motorist would get familiar with the message. Finally, it is underlined that it was impossible to assess the extent of the general deterrence effect stemming from fear of citations. Lonero et al. (1994) reviewed the issue of STEP programs, stating that this approach - which values the publicity and community support for enforcement - has been extensively developed in Canada. They note (from Engel, 1980) that STEP programs are designed to address specific road safety issues, that they include the planning and organization of necessary resources, the implementation of publicity and public education to raise program awareness as well as the training of police officers and data collection to evaluate effectiveness. Note however that crash data are typically not used since local crash numbers may not be large enough to reveal any effects. Other appropriate proxies therefore need to be used (speed, seat-belt use, knowledge, attitudes, self-reported behaviors, etc.), as it was the case in the Thomas et al. (2008) study. Lonero et al. (1994) finally note that since STEP programs are limited in time, they have an intrinsic temporary nature. However, this may not be a critical defect since compliance decay after implementation is not necessarily complete and since it is possible to strategically reinstate compliance with reoccurring program cycles. They also observe that regional pooling of programs have many advantages and that STEP interventions can even be done provincially or nationally, like it was the case with CCMTA’s Canadian National Occupant Restraint Program (NORP).
Human Factors in the Motor Carrier Industry in Canada 185
All considered, the TACT program appears to represent a legitimate and scientifically valid approach to address LV/CMV interactions and should be recommended. As stated, the implementation of theory-driven attitude assessment and attitude modification approaches could improve the awareness raising/education component of the intervention, but this remains to be determined. Another program designed specifically to deal with LV/CMV interactions is CVSA’s Operation Safe Driver (OSD), which was launched in 2007. OSD is a one-week intensive program focused on enforcement, education and awareness to address unsafe behaviors of CMV and non-CMV drivers. It is a reoccurring event that so far took place on three occasions (2007-2009). Contrary to the TACT intervention, there is to our knowledge no detailed background material or scientific evaluation of OSD. The content of this review is therefore based on material that is available through the CVSA website and other web searches. CVSA (2009a) underline the results of the LTCCS showing that driver recognition, decision and performance errors are responsible for 88% of CMV crashes. Similar to TACT, the mission of OSD is therefore to improve CMV and non-CMV driver behavior through effective enforcement, education and awareness strategies. The specific objectives are to increase CMV and non-CMV traffic enforcement, to increase roadside inspections, to increase safety-belt usage as well as general regulatory compliance, to implement education and awareness programs in the CMV population and to increase awareness of non-CMV drivers about safe driving behaviors around CMVs. The strategies that CVSA is using to address these objectives are the following (from CVSA, 2009a):
• Remove unsafe and fatigued commercial vehicle drivers from the highways; • Implement commercial driver focused enforcement and education strategies
which are based on performance data; • Educate commercial vehicle drivers and others about the importance of safe
driving and of proper driving techniques; • Take enforcement action against commercial drivers who fail to buckle up; • Take enforcement action against non-commercial drivers operating in an unsafe
manner around trucks and buses; • Raise awareness of the motoring public about the hazards of operating around
commercial vehicles and of proper steps they can take to enhance safe operations; • Educate government, industry and the public about the important role roadside
enforcement plays in saving lives on North America’s highways and helping to provide a safe and secure place to travel.
It is impossible to scientifically discuss the approach on the basis of available material. However, it needs to be stated that since OSD shares important similarities with TACT - especially in terms of using intense enforcement, education and awareness - the recommendation that was made to support TACT could also apply to OSD. It would however be relevant to conduct peer-reviewed evaluations of the program, like Thomas et al. (2008) did for TACT, in order to (1) support the initiative, (2) identify strengths and weaknesses and (3) continually increase its efficiency on the basis of empirical data.
Human Factors in the Motor Carrier Industry in Canada 186
Although it is not a systematic program evaluation, CVSA nevertheless tracks specific activities related to the program, mainly enforcement efforts from police forces as well as roadside inspections. This data is compiled yearly and a profile of out-of-service (OOS) violations and traffic citations is produced. In a press release, CVSA (2009b) therefore revealed that the 2009 edition of OSD produced mixed results, with a decrease in OOS violation but an increase in traffic citations. It is concluded that more work is needed to educate both passenger and CMV drivers about operating their vehicle more safely. It could be debated that CVSA’s interpretation of this data somewhat confounds the treatment with the outcome. The level of enforcement and the number of citations can indeed be interpreted as one of the core component of OSD “treatment”. As such, an increase in these numbers can be seen as a good thing (e.g. the treatment in 2009 was more intense than in 2008) and may not necessarily reflect that there are objectively more deviant behaviors on the roads. Also, since OSD is a one week event, it is not likely that it will generate noticeable effects during that same week, nor any carryover effect the following year, at least on a variable such as the number of citation, which reflects the intensity of enforcement rather than driver behaviors. If the intent is to evaluate the effectiveness of OSD (which is recommended), a number of scientific methodologies, using different safety proxies, could be put in place. For the moment, it is our understanding that profiling OOS and traffic citations traces the level of enforcement rather that its effects on road safety or changes in road users behaviors. Finally, note that in 2009, after considering analyses showing that young drivers are over-represented in CMV crashes (13.1% of license holder vs. 23.2% of CMV-related fatalities), CVSA included the Teen and Truck component to OSD. More than 2000 teens received a training course focussing on unsafe and distracted driving practices around large trucks by young drivers. While this initiative appears like a very good idea, no background information is available and no evaluation is reported. On a more general note about STEP programs, Robert Foss (2007) brings relevant elements of discussion. First, he observes that STEP programs are based on sound underlying behavior modification principles (enforcement + widespread publicity) and that it is capital that their implementation really translates these sound principles into operational interventions (implementation fidelity). He brings as an example the fact that often high-visibility enforcement turns into pure enforcement with insufficient focus on the “widespread publicity” aspect of the concept, adding that: doing enforcement alone fails to invoke the underlying mechanism by which enforcement works most efficiently – persuading large numbers of drivers that detection and punishment are more likely. In another comment, he argues that the benefits of general deterrence (at the basis of TACT and OSD - two enforcement-based initiatives) can easily be lost if the all-important publicity about the program informs drivers that it will only last a couple of weeks: delimiting the time period such a program covers is comparable to publicizing that a DWI checkpoint will be implemented at a particular location, at a particular night, thereby providing the population with the necessary information to avoid program activities.
Human Factors in the Motor Carrier Industry in Canada 187
To illustrate his point, Foss describes two programs with opposing philosophies. In Tennessee, a high-visibility enforcement program deploying DWI checkpoints was implemented throughout the year, with several checkpoints at different locations every weekend. The program resulted in a massive 20% reduction in fatal alcohol-related crashes. Another program in North Carolina adopted a blitz approach, concentrating enforcement and publicity within 2-3 week periods, and announcing when these periods would be occurring. Even though they deployed thousands more checkpoints that the Tennessee program, this North Carolina blitz approach resulted in only small, short-term decline in alcohol-related crashes, lasting only during periods when enforcement and widespread publicity were in place. Foss concludes that the yearlong Tennessee approach produces much greater safety benefits, albeit with less efforts and substantially lower costs. Foss finally suggests that neither programs nor policies or laws really affect behaviors, stating that are rather tools by which important (behavior modification) principles can be invoked. These programs should therefore be based on sound behavior modification principles, and these principles should be carefully implemented. Ideally, the whole process should be documented and peer-reviewed and the programs should periodically be evaluated using sound scientific methodologies. While the TACT approach is well documented and evaluated, there is less material to promote the efficiency of OSD. However, since both programs have important similarities, and given the massive support that CVSA gets from government and industry players, OSD also needs to be supported. As suggested, it would however be relevant to document the intervention and its underlying behavior modification principles and to have it scientifically evaluated on a periodical basis. As per the above-mentioned comments from Foss (2007), the idea that both these programs take a blitz format could also be revisited. Numerous alternatives are possible and could be recommended. For example, an option would be to keep the widespread publicity active for longer periods of time (or throughout the year), while concentrating enforcement in blitzes that are supported by the publicity, but without being openly situated in time. Of course these are complex operations and funding issues need to be considered. It nevertheless could be a good thing to analyse these programs and the way they are delivered on the basis of solid behavior modification principles and to assess how they could be improved in order to adhere to these principles.
*
Human Factors in the Motor Carrier Industry in Canada 188
3. Phase II: Looking at the situation in Canada
Phase 1 of this work provided a scientific assessment of crash-causation factors involved in CMV crashes. A prior discussion paper drafted as a preamble to this task force (Thiffault, 2007) demonstrated that crash-causation data had not been factored into any strategic planning of interventions aimed at motor carriers in Canada. The reason for this is very simple; this data did not exist prior to 2005. However, now that it does exist, it needs to be factored-in. After reviewing crash-causation studies, peer-reviewed research and naturalistic driving data, it was concluded that the three most important targets in a risk-based approach to driver-oriented interventions should be fatigue, distraction and high-risk driving. A scientific assessment of the situation in terms of remedial interventions was also developed and recommendations regarding countermeasures and further R&D leads were sketched. In brief, while phase 1 provided a picture of what are the problems and what should be done, the objective of phase 2 is to look at the current situation in Canada and to try to answer the question what are we doing now? Phase 3 will build on the results of the two prior phases: given what the problems are, what should be done and what we are currently doing, a gap analysis will be conducted to elaborate a strategy. Phase 2 was conducted through surveys. This was the only methodology available, given the timeframe and resources of the task force. Three online surveys were created, specifically the Carrier survey, the Industry Associations survey and the Government survey. The objective of each survey was to assess what is currently being done to address fatigue, distraction and high-risk driving, and to collect respondents’ suggestions as to what should be done to mitigate these problems. Survey instruments are available on demand. An additional step consisted of reviewing the National Safety Code (NSC) to assess the extent to which principal crash-causation factors (fatigue, distraction and high-risk driving) have been considered and addressed in the standards. Note that a brief summary of the American CSA-2010 initiative is presented in this section. 3.1 Motor Carriers Survey 3.1.1 Sample overview The recruitment of carriers was conducted with the help of the Canadian Trucking Alliance (CTA) as well as provincial trucking associations. The carrier survey was more difficult to carry out than anticipated, mainly because there was less participation east of Ottawa. Various recruiting efforts were conducted to try to garner more participation from Quebec and the Atlantic provinces, but without much success. Note that the survey timeframe was extended to accommodate for these difficulties. However, as noted by CTA representative, regardless of location of home terminal, most carriers do operate all over the country.
Human Factors in the Motor Carrier Industry in Canada 189
The survey is therefore somewhat regionally biased. Nevertheless, it was not intended to be a scientific survey per se, but rather a gathering of input from industry. Conducting a scientific survey would have required controlling numerous variables likely to impact on the safety of motor carriers, creating the need for a vast number of cells and a very large sample. Given the mandate of this task force, its limitations and timeframe as well as the objective of phase 2 (which was to get an clearer understanding of what is currently being done in the country to address these issues), such a methodology was neither possible nor necessary. The sample was made up of motor carriers from six provinces as follows: British Columbia (~13%), Alberta (~26%), Saskatchewan (~7%), Manitoba (~14%), Ontario (~31%) and Quebec (~9%). The primary scope of operations for most of the respondents was freight. Fewer than 10 percent indicated that the primary scope of their operations involved passengers. A large majority of the sample was for hire (80%). Approximately half of the motor carriers in the sample indicated long and short haul status, while just over on third indicated they were private carriers and 16% were owner operators. Further, about 18% of the sample had operations dependent on seasonal variations (ex. ice roads, farming, etc.). Around three quarters of the sample operated both intra-provincially and extra-provincially. Approximately 55% of the sample represented large fleets of more than 50 power units, while 20% represented medium fleets between 20 and 50 power units, and 25% represented small fleets of less than 20 power units. The sample size varied throughout the survey. Initially, 56 participants responded to the section on recognition errors, however 45 provided responses to the section on decision errors, and only 43 contributed to the segments on performance and non-performance errors. Note that the question “Is your company addressing these issues by any safety initiatives” was asked at the start of each category (recognition, decision, performance, non-performance errors). This contributed to some of the variability in sample size throughout the survey because, for the most part, carriers who answered “no” did not continue further. 3.1.2 Recognition errors
Recognition processes mainly involve perception and attention. Examples of recognition errors include inadequate surveillance, blind spot crashes and inattention crashes caused by distraction or fatigue. At the outset, participants were given examples of recognition errors and asked to indicate whether their company was addressing these types of errors through safety initiatives. Participants who responded “yes” were then provided with a list of safety initiatives related to recognition errors and asked to identify all that were being employed in their company. Initially, 51 respondents (91%) indicated that their company was addressing recognition errors through safety initiatives; however only 42 respondents (75%) went on to check examples from the list provided or give examples of their own.
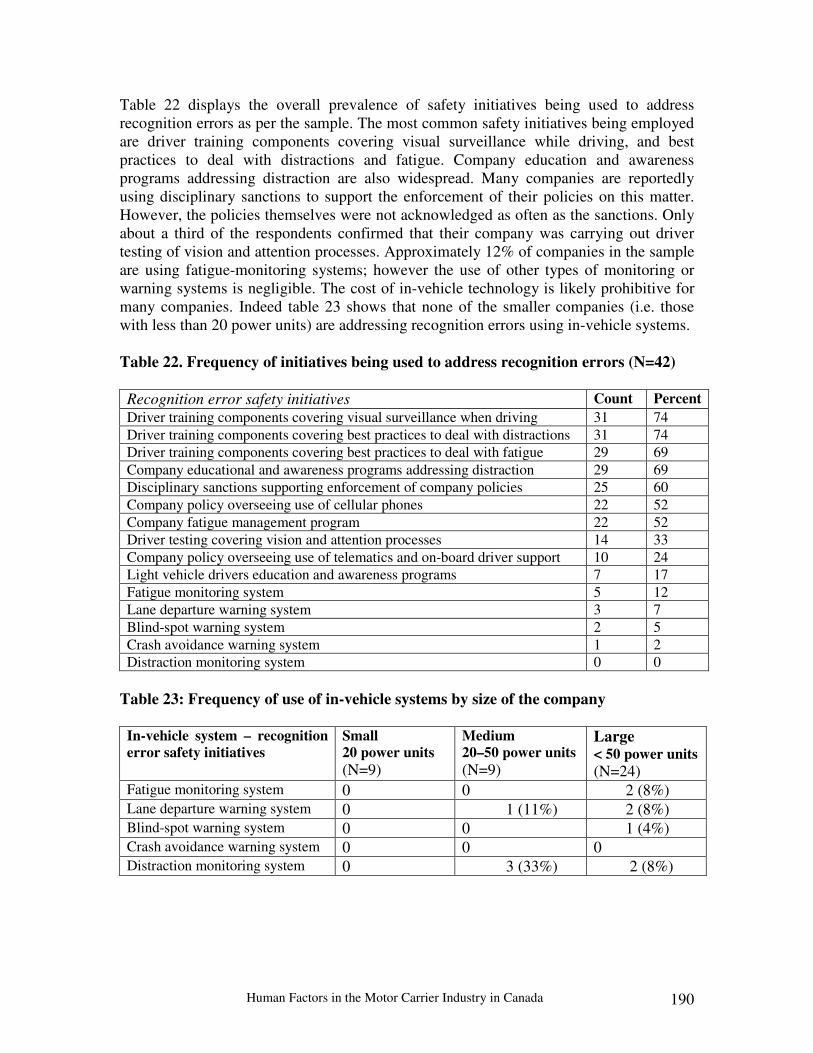
Human Factors in the Motor Carrier Industry in Canada 190
Table 22 displays the overall prevalence of safety initiatives being used to address recognition errors as per the sample. The most common safety initiatives being employed are driver training components covering visual surveillance while driving, and best practices to deal with distractions and fatigue. Company education and awareness programs addressing distraction are also widespread. Many companies are reportedly using disciplinary sanctions to support the enforcement of their policies on this matter. However, the policies themselves were not acknowledged as often as the sanctions. Only about a third of the respondents confirmed that their company was carrying out driver testing of vision and attention processes. Approximately 12% of companies in the sample are using fatigue-monitoring systems; however the use of other types of monitoring or warning systems is negligible. The cost of in-vehicle technology is likely prohibitive for many companies. Indeed table 23 shows that none of the smaller companies (i.e. those with less than 20 power units) are addressing recognition errors using in-vehicle systems. Table 22. Frequency of initiatives being used to address recognition errors (N=42)
Recognition error safety initiatives Count Percent
Driver training components covering visual surveillance when driving 31 74 Driver training components covering best practices to deal with distractions 31 74 Driver training components covering best practices to deal with fatigue 29 69 Company educational and awareness programs addressing distraction 29 69 Disciplinary sanctions supporting enforcement of company policies 25 60 Company policy overseeing use of cellular phones 22 52 Company fatigue management program 22 52 Driver testing covering vision and attention processes 14 33 Company policy overseeing use of telematics and on-board driver support 10 24 Light vehicle drivers education and awareness programs 7 17 Fatigue monitoring system 5 12 Lane departure warning system 3 7 Blind-spot warning system 2 5 Crash avoidance warning system 1 2 Distraction monitoring system 0 0
Table 23: Frequency of use of in-vehicle systems by size of the company
In-vehicle system – recognition
error safety initiatives
Small
20 power units
(N=9)
Medium
20–50 power units
(N=9)
Large < 50 power units
(N=24) Fatigue monitoring system 0 0 2 (8%) Lane departure warning system 0 1 (11%) 2 (8%) Blind-spot warning system 0 0 1 (4%) Crash avoidance warning system 0 0 0 Distraction monitoring system 0 3 (33%) 2 (8%)
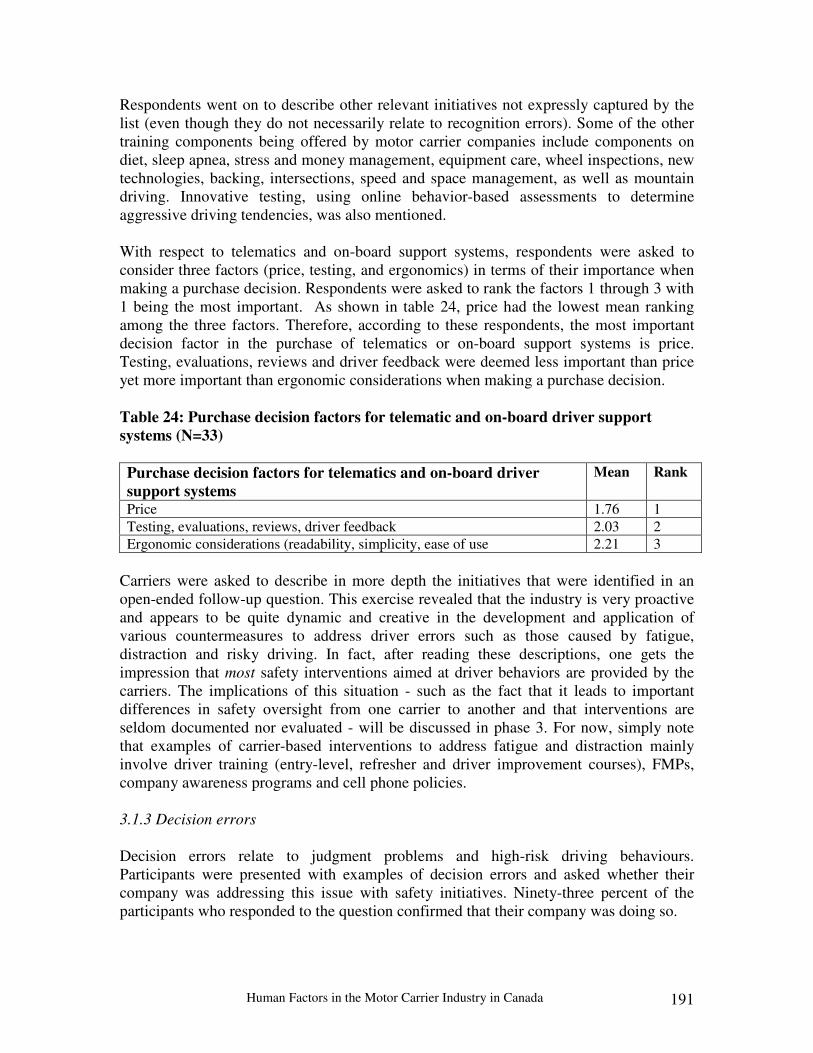
Human Factors in the Motor Carrier Industry in Canada 191
Respondents went on to describe other relevant initiatives not expressly captured by the list (even though they do not necessarily relate to recognition errors). Some of the other training components being offered by motor carrier companies include components on diet, sleep apnea, stress and money management, equipment care, wheel inspections, new technologies, backing, intersections, speed and space management, as well as mountain driving. Innovative testing, using online behavior-based assessments to determine aggressive driving tendencies, was also mentioned. With respect to telematics and on-board support systems, respondents were asked to consider three factors (price, testing, and ergonomics) in terms of their importance when making a purchase decision. Respondents were asked to rank the factors 1 through 3 with 1 being the most important. As shown in table 24, price had the lowest mean ranking among the three factors. Therefore, according to these respondents, the most important decision factor in the purchase of telematics or on-board support systems is price. Testing, evaluations, reviews and driver feedback were deemed less important than price yet more important than ergonomic considerations when making a purchase decision. Table 24: Purchase decision factors for telematic and on-board driver support
systems (N=33)
Purchase decision factors for telematics and on-board driver
support systems
Mean Rank
Price 1.76 1 Testing, evaluations, reviews, driver feedback 2.03 2 Ergonomic considerations (readability, simplicity, ease of use 2.21 3
Carriers were asked to describe in more depth the initiatives that were identified in an open-ended follow-up question. This exercise revealed that the industry is very proactive and appears to be quite dynamic and creative in the development and application of various countermeasures to address driver errors such as those caused by fatigue, distraction and risky driving. In fact, after reading these descriptions, one gets the impression that most safety interventions aimed at driver behaviors are provided by the carriers. The implications of this situation - such as the fact that it leads to important differences in safety oversight from one carrier to another and that interventions are seldom documented nor evaluated - will be discussed in phase 3. For now, simply note that examples of carrier-based interventions to address fatigue and distraction mainly involve driver training (entry-level, refresher and driver improvement courses), FMPs, company awareness programs and cell phone policies. 3.1.3 Decision errors
Decision errors relate to judgment problems and high-risk driving behaviours. Participants were presented with examples of decision errors and asked whether their company was addressing this issue with safety initiatives. Ninety-three percent of the participants who responded to the question confirmed that their company was doing so.

Human Factors in the Motor Carrier Industry in Canada 192
Table 25 shows the type and frequency of safety initiatives being used to address decision errors. Disciplinary sanctions in support of company policies, speed-limiter devices and driver training components covering defensive driving skills are the most common safety initiatives being employed. A high percentage of carriers represented in the sample have safety programs/safety management systems and safety incentives in place as well. Only half of the carriers are using on-board monitoring of high-risk driving behaviors and 46% are conducting driver evaluations that cover factors associated with high-risk behaviors. Light vehicle drivers’ education and awareness programs are relatively uncommon. Some other initiatives, not shown below, that respondents mentioned include effective and realistic orientations and training on recognizing extreme weather or road conditions. Table 25: Frequency of initiatives being used to address decision errors (N=41)
Decision error safety initiatives Count Percent Disciplinary sanctions supporting enforcement of company policy 34 83 Speed-limiter device 33 81 Driver training components covering defensive driving skills 33 81 Safety program, safety management system 29 71 Safety incentives 29 71 Driver training components covering high-risk behaviours 27 66 Company policy with regards to high-risk behaviours 26 63 Driver education and awareness programs covering high-risk driving beh. 25 61 Dispatch policies and procedures 25 61 Driver evaluation covering high-risk behaviours 21 51 Driver schedules 21 51 On-board monitoring of high-risk driving behaviours 20 49 Driver evaluation covering factors associated with high-risk behaviours (risk-taking tendencies, risk perception, personality traits, attitudes, etc.)
19 46
Light vehicle drivers education and awareness programs 6 15 3.1.4 Performance errors Performance errors relate to problems that occur during the execution of the driving task when a driver does not succeed in properly achieving an intended maneuver. Poor directional control, failing to react in time and overcompensating are examples of performance errors. Based on the responses, performance errors are not as widely targeted as other types of errors; seventy-two percent of respondents indicated that their company had initiatives in place to address these issues. For those companies with safety initiatives targeting performance errors, driver training is used extensively (see table 26). Driver testing is also a typical method being used. On-board driver monitoring systems is less common to deal with these issues while the use of electronic stability control systems is rare in this sample.
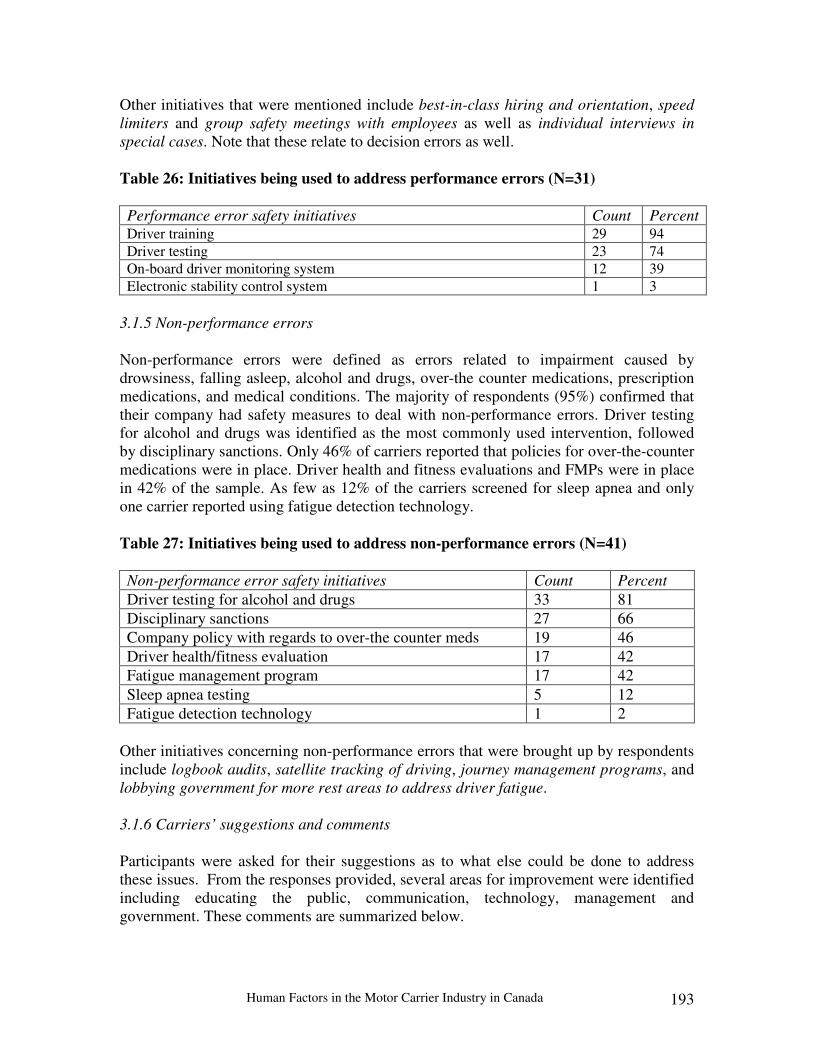
Human Factors in the Motor Carrier Industry in Canada 193
Other initiatives that were mentioned include best-in-class hiring and orientation, speed limiters and group safety meetings with employees as well as individual interviews in special cases. Note that these relate to decision errors as well. Table 26: Initiatives being used to address performance errors (N=31)
Performance error safety initiatives Count Percent Driver training 29 94 Driver testing 23 74 On-board driver monitoring system 12 39 Electronic stability control system 1 3
3.1.5 Non-performance errors
Non-performance errors were defined as errors related to impairment caused by drowsiness, falling asleep, alcohol and drugs, over-the counter medications, prescription medications, and medical conditions. The majority of respondents (95%) confirmed that their company had safety measures to deal with non-performance errors. Driver testing for alcohol and drugs was identified as the most commonly used intervention, followed by disciplinary sanctions. Only 46% of carriers reported that policies for over-the-counter medications were in place. Driver health and fitness evaluations and FMPs were in place in 42% of the sample. As few as 12% of the carriers screened for sleep apnea and only one carrier reported using fatigue detection technology. Table 27: Initiatives being used to address non-performance errors (N=41)
Non-performance error safety initiatives Count Percent Driver testing for alcohol and drugs 33 81 Disciplinary sanctions 27 66 Company policy with regards to over-the counter meds 19 46 Driver health/fitness evaluation 17 42 Fatigue management program 17 42 Sleep apnea testing 5 12 Fatigue detection technology 1 2
Other initiatives concerning non-performance errors that were brought up by respondents include logbook audits, satellite tracking of driving, journey management programs, and lobbying government for more rest areas to address driver fatigue. 3.1.6 Carriers’ suggestions and comments
Participants were asked for their suggestions as to what else could be done to address these issues. From the responses provided, several areas for improvement were identified including educating the public, communication, technology, management and government. These comments are summarized below.
Human Factors in the Motor Carrier Industry in Canada 194
Educating the public Many insisted that there is a need to disseminate more information to general road users, since they felt like the general public does not really understand the consequences of cutting off a CMV lane or hanging out in the blind spots of CMVs. It was suggested that because we act on the basis of perceived rather than actual risk, car drivers need to be trained how to behave around CMVs: the fear of trucks causes a lot of inappropriate car driving behavior and causes car drivers to interpret truck actions as aggressive. A participant commented that there is too much focus on professional drivers and that the global safety culture in fact needed to be changed: to make a wholesale change in road safety all users of public roads need to be addressed. Similar to campaigns against smoking and drunk driving, large public effort is needed to make people aware of the dangers of driving while tired or distracted or driving too fast. As a means to educate the public, it was suggested that television be used, since it captures the most attention. Interacting with CMVs should also be incorporated in training programs for general road users. Communication It was suggested by carriers that more statistical information could be readily available for distribution to drivers and that better communication via driver training is also needed. Some carriers acknowledged the important role of provincial transportation associations, which, as they say, already support their membership by issuing safety and regulatory memos on a regular basis. Also, a carrier emphasized that if there were more free guidelines as to how to implement safety programs, carriers would be likely to take advantage of them. Technology Carriers are asking for enhanced on-board equipment to monitor driver performance in order to determine whether drivers are properly adjusting to changes in driving conditions, local speed limits, weather, etc. One carrier stated that electronic driver-monitoring devices should be low cost and mandatory. Another mentioned that installing portable camera systems in power units to monitor driving habits - when poor driving habits are identified through the EOBR - could reduce the amount of man-hours required for ride-alongs while being more efficient. Carriers are also asking for lower-priced collision avoidance systems. One carrier noted that drivers’ attention is constantly shifting away from driving to countless other distractions, adding that there is a need to make sure that they are getting meaningful sensory input that allows for sound reaction to road and traffic conditions (this relates to the notions of real-time distraction countermeasures and workload manager that were discussed in the distraction section).

Human Factors in the Motor Carrier Industry in Canada 195
Management Multiple carriers made the observation that the attitude of upper management toward safety is paramount: upper management support is the single largest factor in determining a successful safety/risk management department… …excellent leadership is necessary to start, support and follow through… if the leadership is not available at the top, the entire organization will suffer… if persons implementing or attempting to control risk factors do not have budgets or reasonable control over decision-making trough the support of upper management, improvements cannot be made. The use of Safety Management Systems (like Alberta PIC program or other safety programs from insurers) is recommended, as well as incentive programs based on safety performance rather than punishment. It was stated that drivers should be empowered to make decisions about fatigue. Hire Smart initiatives were also brought forward. Government
It is felt that governments need to do more at many levels. For example, since governments have identified fatigue as a critical factor in the motor carrier industry, they should therefore make programs available to professional drivers (sleep apnea clinics and equipment) that do not financially burden the driver and influence his decision to attend, as is the case now. The government should give further incentives to transport companies to take advantage of the fatigue-monitoring technologies available, which are currently cost-prohibitive for most carriers. Also, it is suggested that government focus more on fatigue management programs than on hours of service. A tremendous amount of responsibility rests with the carrier to be vigilant and it is costly to be responsible. Government incentives should be offered to companies who train and supervise responsibly. Many carriers do not and thus overheads are less and so are their rates. Government must take more financial responsibility for the cost of keeping the roads safe and making them safer: the amount of dollars this industry injects into this country in taxes on fuel is staggering in comparison to how much is actually put back in. Seemingly every industry in this country gets incentives to work safer, except for the motor carrier industry, which remains a source of income for every provincial, municipal and federal government at will. A carrier noted further that governments need to realize that they are going to have to get involved with the issue of commercial vehicle parking: there is a critical shortage of places to park commercial vehicles in this country - coupled with towns and cities that want no part of trucks within their limits, it creates a challenging situation for drivers to take rest when needed; mandated sleep or rest is impossible if there is next to nowhere to park. It was also underlined that better and more standardized enforcement of current regulations is needed, that CVSA roadside inspections should focus even more attention on the condition of the driver and that government needs to update testing procedures of all entry-level drivers.
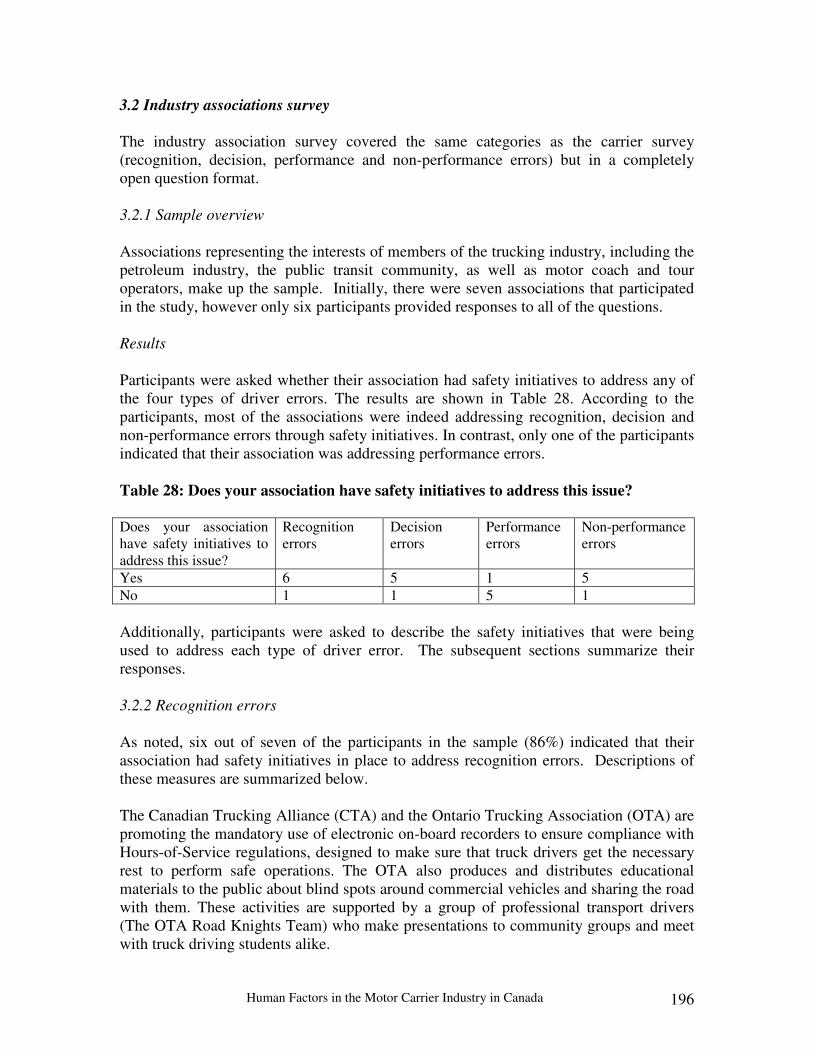
Human Factors in the Motor Carrier Industry in Canada 196
3.2 Industry associations survey The industry association survey covered the same categories as the carrier survey (recognition, decision, performance and non-performance errors) but in a completely open question format. 3.2.1 Sample overview Associations representing the interests of members of the trucking industry, including the petroleum industry, the public transit community, as well as motor coach and tour operators, make up the sample. Initially, there were seven associations that participated in the study, however only six participants provided responses to all of the questions.
Results Participants were asked whether their association had safety initiatives to address any of the four types of driver errors. The results are shown in Table 28. According to the participants, most of the associations were indeed addressing recognition, decision and non-performance errors through safety initiatives. In contrast, only one of the participants indicated that their association was addressing performance errors. Table 28: Does your association have safety initiatives to address this issue?
Does your association have safety initiatives to address this issue?
Recognition errors
Decision errors
Performance errors
Non-performance errors
Yes 6 5 1 5 No 1 1 5 1 Additionally, participants were asked to describe the safety initiatives that were being used to address each type of driver error. The subsequent sections summarize their responses. 3.2.2 Recognition errors
As noted, six out of seven of the participants in the sample (86%) indicated that their association had safety initiatives in place to address recognition errors. Descriptions of these measures are summarized below. The Canadian Trucking Alliance (CTA) and the Ontario Trucking Association (OTA) are promoting the mandatory use of electronic on-board recorders to ensure compliance with Hours-of-Service regulations, designed to make sure that truck drivers get the necessary rest to perform safe operations. The OTA also produces and distributes educational materials to the public about blind spots around commercial vehicles and sharing the road with them. These activities are supported by a group of professional transport drivers (The OTA Road Knights Team) who make presentations to community groups and meet with truck driving students alike.

Human Factors in the Motor Carrier Industry in Canada 197
Enform, the petroleum industry's training and safety arm, offers driver-training courses including those designed specifically for operators of heavy duty and light duty vehicles. In addition, a number of member companies of the Petroleum Services Association of Canada (PSAC) have developed sophisticated driver-training courses for their employees. In conjunction with other industry associations, PSAC has developed a guide on fatigue management. The Manitoba Trucking Association and the Alberta Motor Transport Association (AMTA) provide and certify instructors for the Professional Driver Improvement Course (PDIC), which has components to address recognition errors. The AMTA also mounts two to three No-Zone campaigns each year. Motor Coach Canada (MCC) provides logbooks, manuals and guides to drivers so that they can record hours of service and comply with regulations. MCC has also issued a cell phone use policy for drivers that bus companies can voluntarily choose to use or adapt for their use. 3.2.3 Decision errors Five out of six participants in the sample (83%) reported that their association was addressing decision errors through safety initiatives. The examples provided by respondents are highlighted below. Both the CTA and the OTA are advocates for the introduction of speed limiter regulation in Ontario and throughout Canada. The OTA is also working with the Ontario Provincial Police (OPP) and the Ontario Ministry of Transportation (MTO) to develop strategies to target problem drivers and improve enforcement. It was noted that the driver training courses offered by Enform and member companies of PSAC have elements relevant to decision errors. The Professional Driver Improvement Course offered by the MTA and AMTA was also referenced. 3.2.4 Performance errors
Only one of six respondents (17%) indicated that their association was addressing performance errors (Professional Driver Improvement Course). 3.2.5 Non-performance errors
Five of six respondents specified that their association had safety measures to address non-performance errors and gave the following examples. In addition to promoting the use of EOBRs, the CTA and OTA support continued research into developing systems that will detect the onset of drowsiness in a driver, such as devices that monitor the eye movements. Both organizations also encourage participation in drug and alcohol testing programs.
Human Factors in the Motor Carrier Industry in Canada 198
Alongside its recommended practice on fatigue management, the petroleum industry has also developed an Alcohol and Drug Policy Model. Moreover, the Professional Driver Improvement Course was mentioned as having content relevant to this type of driver error.
3.2.6 Associations’ suggestions and comments
Finally, participants were asked whether they had suggestions as to what else could be done to address these issues. The following suggestions were put forward.
• Need for government publications and additional driver education and examination components for the general public with respect to sharing the road with commercial vehicles;
• Investigate the effectiveness of technology such as blind spot cameras, intelligent cruise control, collision warning systems, lane departure warning systems, anti-rollover systems and fatigue detection systems; and
• Encourage federal and provincial levels of government to provide tax incentives for more carriers to introduce the available technology.
3.3 Government survey The government survey was also conducted using completely open-ended questions. Provinces and Territories Compliance and Regulatory Affairs (CRA) representatives, who are specifically involved in the management of motor carrier safety, were asked to describe what their jurisdiction was currently doing to address recognition, decision, performance and non-performance errors from CMV and LDV drivers in order to prevent CMV crashes. They were also asked to provide suggestions as to what more should be done. Table 29 presents the raw data, as logged in by jurisdictional representatives. Note that since the material from Quebec was transmitted in French and is too voluminous to be included as is in the table, a translation of key points is included and the raw data is presented in appendix I. Finally note that Ontario and Nunavut did not provide any input.

Human Factors in the Motor Carrier Industry in Canada 199
Table 29: Inputs to the government survey as provided by CRA representatives
Recognition Decision Performance N-Performance
Yukon What Yukon is looking into distracted driver legislation that would provide enforcement capability in this area. The Road Safety Section has developed a driver fatigue survey that has been handed out at various locations to get input from both private and commercial drivers.
Enforcement of motor Vehicle Regulations by the RCMP.
Nil Yukon motor Vehicles has a Drive Able program that allows doctors to recommend that if there is a possible medical condition that may affect a individuals driving ability - the person can be referred and be given a computer generated test to determine their ability to pass a road test. This is a program out of the University of Alberta and has been used here for a year and a half. For commercial drivers we enforce Federal Hours of service requirements at our Weigh Stations and at Roadside Inspections.
Sugg Develop educational materials to make people more aware of the consequences of distraction and fatigue.
A mandatory defensive driving course for people involved in accidents that were their fault would be helpful - definitely for heavy vehicle operators.
Again more educational materials would be helpful.
NS What Policy for shoulder rumble strips on new highways, rumble strips on approaches to toll plaza, cell phone ban.
None other than typical enforcement of rules of the road.
None Driver abstracts, compliance officers trained to recognize impairment, low tolerance for impaired drivers, hours of service regulations
Sugg Improved education programs, improved driver fatigue awareness.
Education & training. Education Dynamic hours of service, education, more enforcement (zero policy). Education is big part of solution, especially in terms of decision and performance errors. Government can do things to help (e.g. rumble strips), but ultimately, drivers should be educated to recognize these issues.
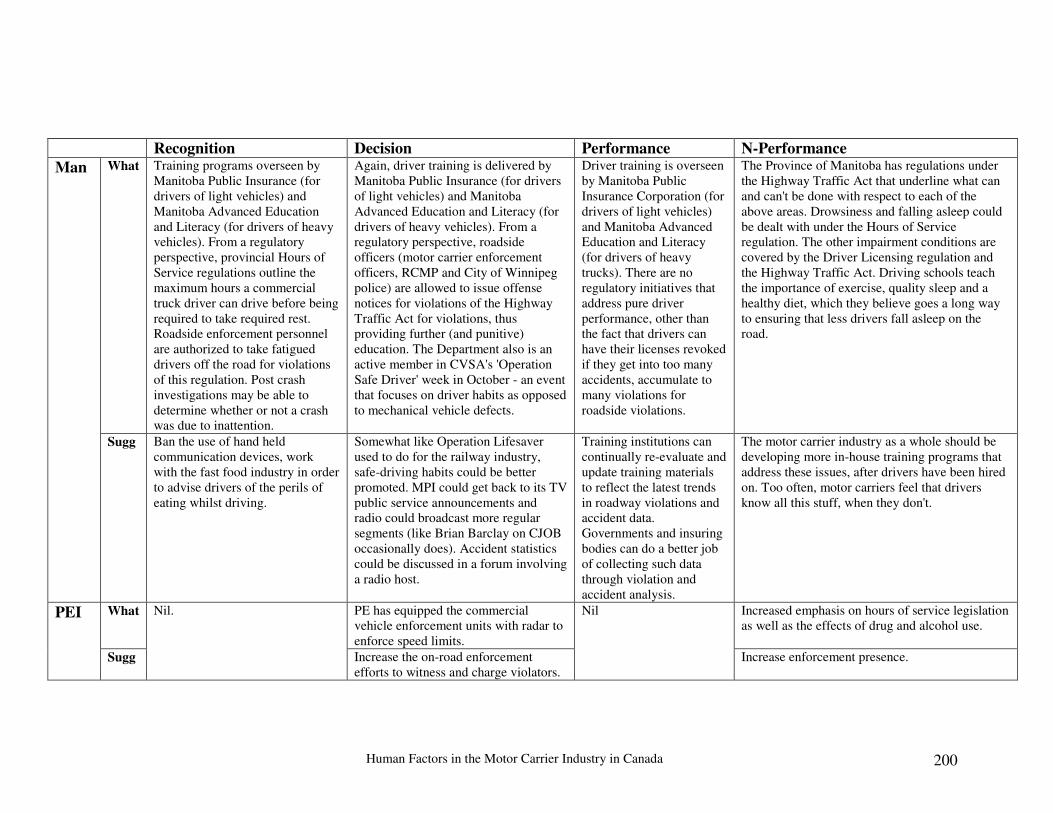
Human Factors in the Motor Carrier Industry in Canada 200
Recognition Decision Performance N-Performance
Man What Training programs overseen by Manitoba Public Insurance (for drivers of light vehicles) and Manitoba Advanced Education and Literacy (for drivers of heavy vehicles). From a regulatory perspective, provincial Hours of Service regulations outline the maximum hours a commercial truck driver can drive before being required to take required rest. Roadside enforcement personnel are authorized to take fatigued drivers off the road for violations of this regulation. Post crash investigations may be able to determine whether or not a crash was due to inattention.
Again, driver training is delivered by Manitoba Public Insurance (for drivers of light vehicles) and Manitoba Advanced Education and Literacy (for drivers of heavy vehicles). From a regulatory perspective, roadside officers (motor carrier enforcement officers, RCMP and City of Winnipeg police) are allowed to issue offense notices for violations of the Highway Traffic Act for violations, thus providing further (and punitive) education. The Department also is an active member in CVSA's 'Operation Safe Driver' week in October - an event that focuses on driver habits as opposed to mechanical vehicle defects.
Driver training is overseen by Manitoba Public Insurance Corporation (for drivers of light vehicles) and Manitoba Advanced Education and Literacy (for drivers of heavy trucks). There are no regulatory initiatives that address pure driver performance, other than the fact that drivers can have their licenses revoked if they get into too many accidents, accumulate to many violations for roadside violations.
The Province of Manitoba has regulations under the Highway Traffic Act that underline what can and can't be done with respect to each of the above areas. Drowsiness and falling asleep could be dealt with under the Hours of Service regulation. The other impairment conditions are covered by the Driver Licensing regulation and the Highway Traffic Act. Driving schools teach the importance of exercise, quality sleep and a healthy diet, which they believe goes a long way to ensuring that less drivers fall asleep on the road.
Sugg Ban the use of hand held communication devices, work with the fast food industry in order to advise drivers of the perils of eating whilst driving.
Somewhat like Operation Lifesaver used to do for the railway industry, safe-driving habits could be better promoted. MPI could get back to its TV public service announcements and radio could broadcast more regular segments (like Brian Barclay on CJOB occasionally does). Accident statistics could be discussed in a forum involving a radio host.
Training institutions can continually re-evaluate and update training materials to reflect the latest trends in roadway violations and accident data. Governments and insuring bodies can do a better job of collecting such data through violation and accident analysis.
The motor carrier industry as a whole should be developing more in-house training programs that address these issues, after drivers have been hired on. Too often, motor carriers feel that drivers know all this stuff, when they don't.
PEI What Nil. PE has equipped the commercial vehicle enforcement units with radar to enforce speed limits.
Nil Increased emphasis on hours of service legislation as well as the effects of drug and alcohol use.
Sugg Increase the on-road enforcement efforts to witness and charge violators.
Increase enforcement presence.
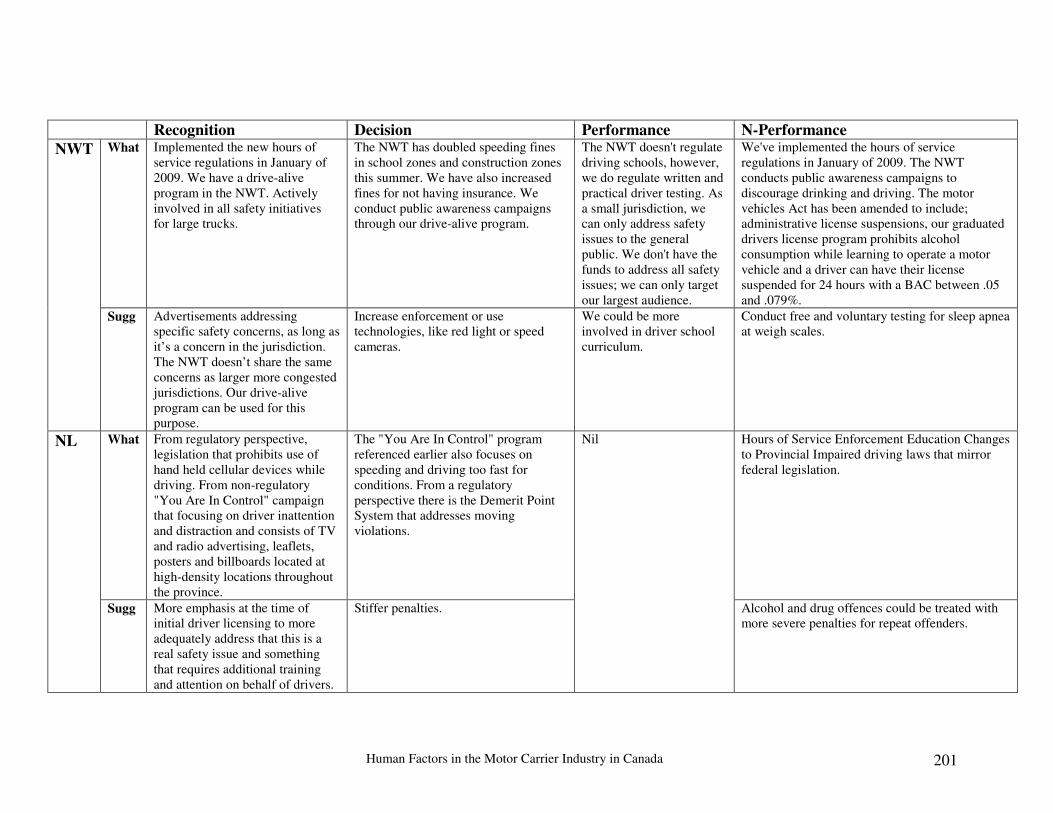
Human Factors in the Motor Carrier Industry in Canada 201
Recognition Decision Performance N-Performance
NWT What Implemented the new hours of service regulations in January of 2009. We have a drive-alive program in the NWT. Actively involved in all safety initiatives for large trucks.
The NWT has doubled speeding fines in school zones and construction zones this summer. We have also increased fines for not having insurance. We conduct public awareness campaigns through our drive-alive program.
The NWT doesn't regulate driving schools, however, we do regulate written and practical driver testing. As a small jurisdiction, we can only address safety issues to the general public. We don't have the funds to address all safety issues; we can only target our largest audience.
We've implemented the hours of service regulations in January of 2009. The NWT conducts public awareness campaigns to discourage drinking and driving. The motor vehicles Act has been amended to include; administrative license suspensions, our graduated drivers license program prohibits alcohol consumption while learning to operate a motor vehicle and a driver can have their license suspended for 24 hours with a BAC between .05 and .079%.
Sugg Advertisements addressing specific safety concerns, as long as it’s a concern in the jurisdiction. The NWT doesn’t share the same concerns as larger more congested jurisdictions. Our drive-alive program can be used for this purpose.
Increase enforcement or use technologies, like red light or speed cameras.
We could be more involved in driver school curriculum.
Conduct free and voluntary testing for sleep apnea at weigh scales.
NL What From regulatory perspective, legislation that prohibits use of hand held cellular devices while driving. From non-regulatory "You Are In Control" campaign that focusing on driver inattention and distraction and consists of TV and radio advertising, leaflets, posters and billboards located at high-density locations throughout the province.
The "You Are In Control" program referenced earlier also focuses on speeding and driving too fast for conditions. From a regulatory perspective there is the Demerit Point System that addresses moving violations.
Nil Hours of Service Enforcement Education Changes to Provincial Impaired driving laws that mirror federal legislation.
Sugg More emphasis at the time of initial driver licensing to more adequately address that this is a real safety issue and something that requires additional training and attention on behalf of drivers.
Stiffer penalties. Alcohol and drug offences could be treated with more severe penalties for repeat offenders.
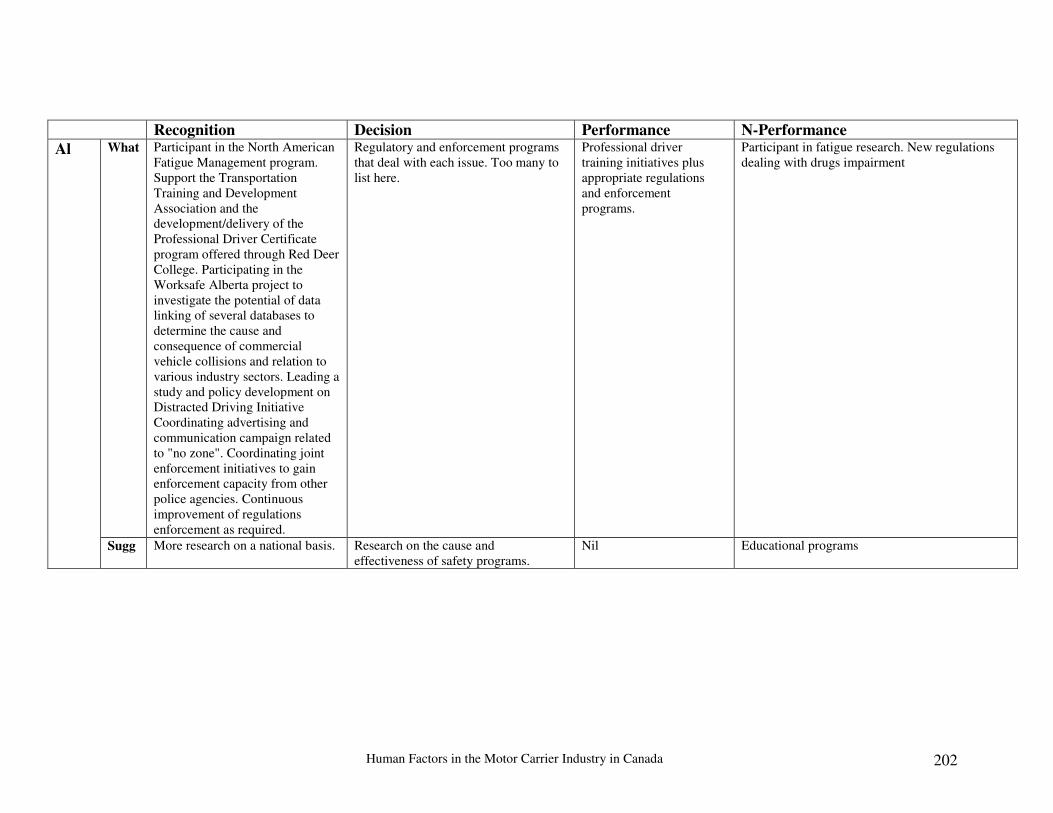
Human Factors in the Motor Carrier Industry in Canada 202
Recognition Decision Performance N-Performance
Al What Participant in the North American Fatigue Management program. Support the Transportation Training and Development Association and the development/delivery of the Professional Driver Certificate program offered through Red Deer College. Participating in the Worksafe Alberta project to investigate the potential of data linking of several databases to determine the cause and consequence of commercial vehicle collisions and relation to various industry sectors. Leading a study and policy development on Distracted Driving Initiative Coordinating advertising and communication campaign related to "no zone". Coordinating joint enforcement initiatives to gain enforcement capacity from other police agencies. Continuous improvement of regulations enforcement as required.
Regulatory and enforcement programs that deal with each issue. Too many to list here.
Professional driver training initiatives plus appropriate regulations and enforcement programs.
Participant in fatigue research. New regulations dealing with drugs impairment
Sugg More research on a national basis.
Research on the cause and effectiveness of safety programs.
Nil Educational programs

Human Factors in the Motor Carrier Industry in Canada 203
Recognition Decision Performance N-Performance
NB What Ongoing enforcement of related National Standards/Provincial legislation i.e. Hours of service, etc. - Currently reviewing issues related to driver distraction. Promote "No Zone" principles. Information/discussion session held with carriers twice a year, open invitation.
Nil Other than continued enforcement of existing driver requirements, we have no initiatives in this specific area.
Other than continued enforcement of existing driver requirements, we have no initiatives in this specific area
Sugg More public awareness prevention -recognition and promotion of fatigue management programs.
Obviously there should be a more concentrated focus on addressing the problems and issues related to driver behaviours and attitudes. Ultimately this should be included in the curriculum for commercial driving schools.
Generally speaking, we need to significantly enhance our commercial driver training and testing requirements.
We need to continue our efforts to improve tools and methods to detect and ultimately measure fatigue. We need to consider implementing mandatory random roadside drug/impairment testing of truck drivers.

Human Factors in the Motor Carrier Industry in Canada 204
Recognition Decision Performance N-Performance
Qc What - April 1, 2008 law banning hand-held cell phones; - Awareness programs about risks of using a hand-held cellular phone while driving; - Road signs ongoing revision process; - Pilot test of new road sign for CMV drivers reg. construction zones; - Increase utilization of variable message signs to keep motorists informed of traffic conditions, etc.; - Mandatory reflecting material on truck trailers; - New mandatory presignaling system for school bus; - General road users awareness programs reg. interactions with CMVs (safe inter-vehicle and following distance, importance of yielding, CMV’s blind spots and braking distance, etc.)
- Multiple awareness programs for general road users addressing speeding, winter driving, safe driving in construction zones, courteous driving, etc. - Demerit points; - Increased penalties for speeding and DWI recidivists; - Advisory committee on fatigue and distraction of the Table Québécoise de la Sécurité Routière; - Mandatory speed limiters set at 105 km/h for CMVs; - Targeted police enforcement operations at construction zones; - Driver safety records made available to drivers and carriers (with driver’s consent); - SAAQ is currently developing an evaluation policy for high-risk drivers aimed at implementing progressive driver-oriented interventions (implemented when predefined thresholds e.g. 50%, 75%, 100% are reached). - Once the maximum is reached, supplemental corrective measures would be taken, including training, driver rehabilitation programs and even termination of license to drive a CMV.
- Utilization of continuously revised engineering standards for road design and forgiving roadsides, in order to mitigate the consequences of driver errors when they do occur; - Improvements at problem road sites; - Road safety audits.
- Federal Criminal code sections to address impaired driving; - Education and assessment programs for drivers with DWI convictions; - Alcohol ignition interlock program; - Quebec has a massive driver fatigue program (see appendix I for details); - Quebec is currently revamping its rest area program, making existing facilities more efficient and adding new ones where they are needed; - Drivers have to advise SAAQ when experiencing health issues, medical evaluation can then be asked; - For higher class license holders, mandatory medical examinations at 45, 55, 60, 65 and every 2 years after that.
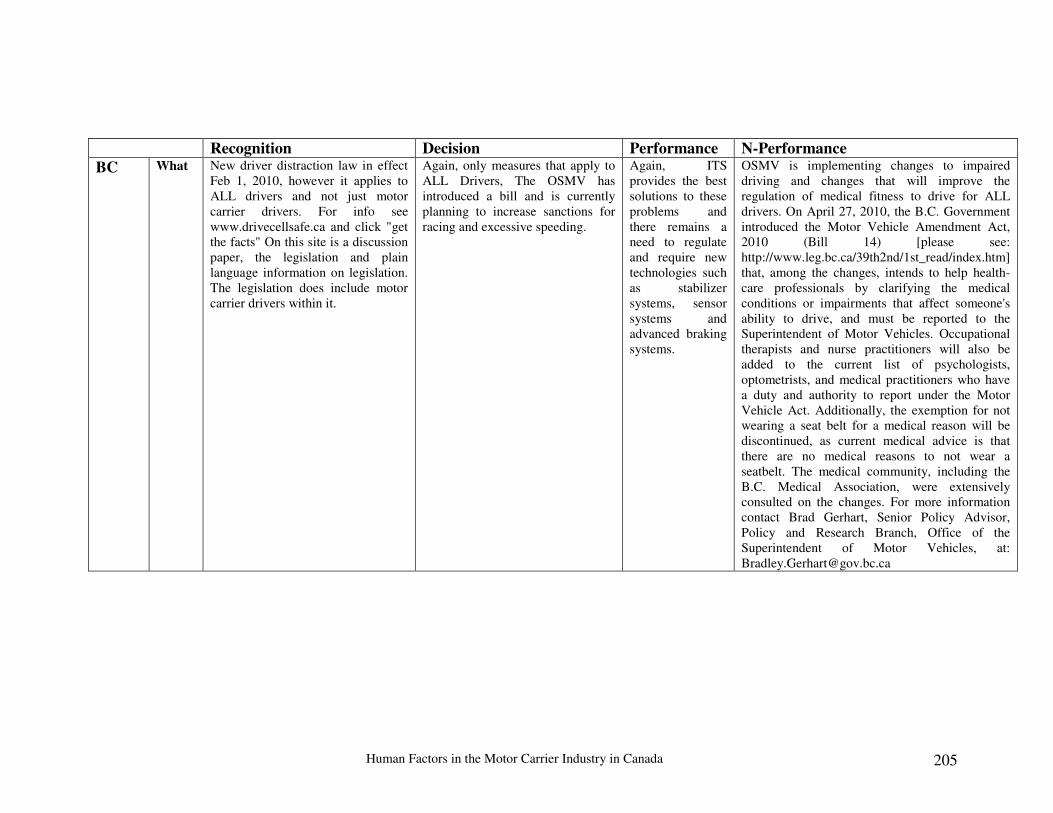
Human Factors in the Motor Carrier Industry in Canada 205
Recognition Decision Performance N-Performance
BC What New driver distraction law in effect Feb 1, 2010, however it applies to ALL drivers and not just motor carrier drivers. For info see www.drivecellsafe.ca and click "get the facts" On this site is a discussion paper, the legislation and plain language information on legislation. The legislation does include motor carrier drivers within it.
Again, only measures that apply to ALL Drivers, The OSMV has introduced a bill and is currently planning to increase sanctions for racing and excessive speeding.
Again, ITS provides the best solutions to these problems and there remains a need to regulate and require new technologies such as stabilizer systems, sensor systems and advanced braking systems.
OSMV is implementing changes to impaired driving and changes that will improve the regulation of medical fitness to drive for ALL drivers. On April 27, 2010, the B.C. Government introduced the Motor Vehicle Amendment Act, 2010 (Bill 14) [please see: http://www.leg.bc.ca/39th2nd/1st_read/index.htm] that, among the changes, intends to help health-care professionals by clarifying the medical conditions or impairments that affect someone's ability to drive, and must be reported to the Superintendent of Motor Vehicles. Occupational therapists and nurse practitioners will also be added to the current list of psychologists, optometrists, and medical practitioners who have a duty and authority to report under the Motor Vehicle Act. Additionally, the exemption for not wearing a seat belt for a medical reason will be discontinued, as current medical advice is that there are no medical reasons to not wear a seatbelt. The medical community, including the B.C. Medical Association, were extensively consulted on the changes. For more information contact Brad Gerhart, Senior Policy Advisor, Policy and Research Branch, Office of the Superintendent of Motor Vehicles, at: [email protected]
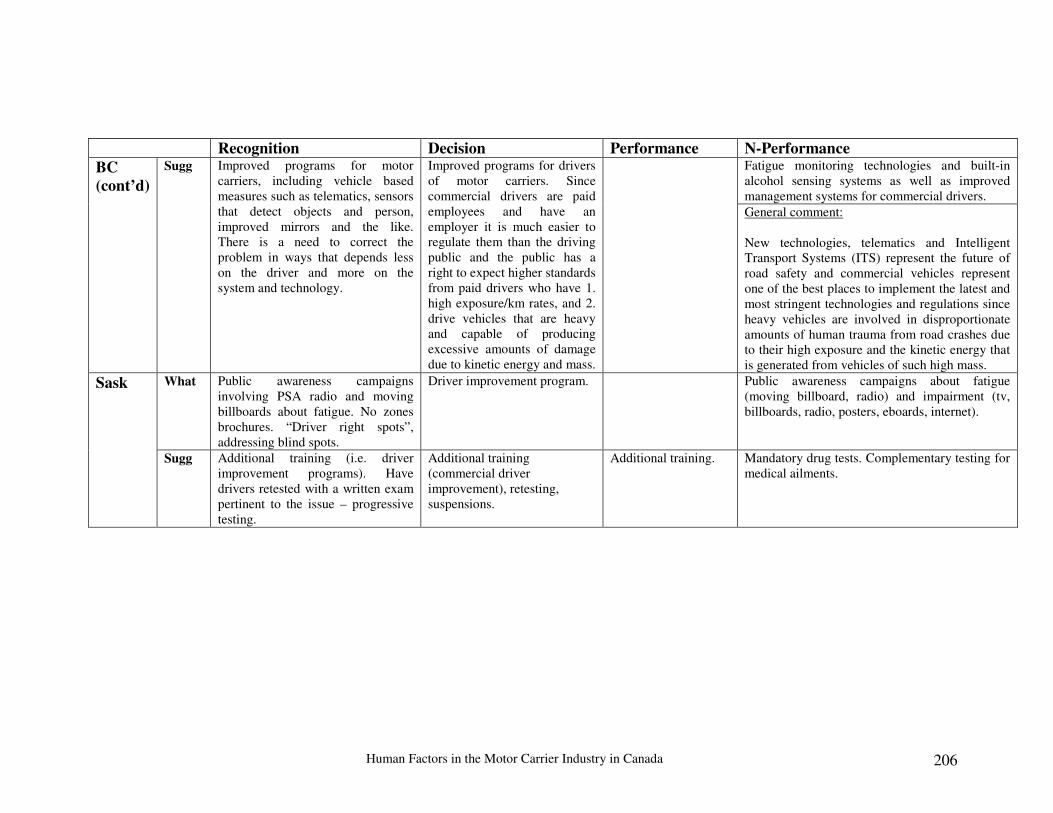
Human Factors in the Motor Carrier Industry in Canada 206
Recognition Decision Performance N-Performance
BC
(cont’d)
Sugg Improved programs for motor carriers, including vehicle based measures such as telematics, sensors that detect objects and person, improved mirrors and the like. There is a need to correct the problem in ways that depends less on the driver and more on the system and technology.
Improved programs for drivers of motor carriers. Since commercial drivers are paid employees and have an employer it is much easier to regulate them than the driving public and the public has a right to expect higher standards from paid drivers who have 1. high exposure/km rates, and 2. drive vehicles that are heavy and capable of producing excessive amounts of damage due to kinetic energy and mass.
Fatigue monitoring technologies and built-in alcohol sensing systems as well as improved management systems for commercial drivers. General comment: New technologies, telematics and Intelligent Transport Systems (ITS) represent the future of road safety and commercial vehicles represent one of the best places to implement the latest and most stringent technologies and regulations since heavy vehicles are involved in disproportionate amounts of human trauma from road crashes due to their high exposure and the kinetic energy that is generated from vehicles of such high mass.
Sask What Public awareness campaigns involving PSA radio and moving billboards about fatigue. No zones brochures. “Driver right spots”, addressing blind spots.
Driver improvement program. Public awareness campaigns about fatigue (moving billboard, radio) and impairment (tv, billboards, radio, posters, eboards, internet).
Sugg Additional training (i.e. driver improvement programs). Have drivers retested with a written exam pertinent to the issue – progressive testing.
Additional training (commercial driver improvement), retesting, suspensions.
Additional training. Mandatory drug tests. Complementary testing for medical ailments.

Human Factors in the Motor Carrier Industry in Canada 207
As can be seen, the government survey mainly provided high-level information regarding interventions. On the basis of such data, it is difficult to gather a detailed picture of what is really being done, and of the efficiency of the said measures. The information is nevertheless important and will be helpful to conduct phase 3 of our mandate, which is to carry out a gap analysis and to provide recommendations for an action plan. The first striking factor is the variability in reported interventions across the country. Some of this phenomenon can probably be explained by different “levels of efforts” from survey respondents, with some appearing more committed in the process of describing their jurisdiction’ initiatives than others. However, it remains that the content varies significantly from one jurisdiction to another, and that this most probably reflects the status of road safety interventions aimed at preventing CMV crashes throughout Canada. The significant difference in financial and human resources between smaller and larger jurisdictions is certainly a central factor to consider. Solutions should therefore be brought forward to achieve greater uniformity, for example by centrally developing and making available efficient theory-driven interventions that can be promoted by jurisdictions and voluntarily adopted by the industry. In terms of content, the key initiatives brought forward with regards to driver fatigue were mainly HOS regulation, awareness programs for the general driving population and CMV drivers, fatigue research and participation in FMPs. Suggestions as to what should be done included more education/public awareness efforts, affordable fatigue monitoring technologies and easy access to sleep apnea testing. For distraction, the main initiatives were legislation banning the use of hand-held cellular phones, education and training. Suggestions included more driver education focussed on the issue, more awareness programs, more research on a national basis as well as an emphasis on telematics and crash avoidance technologies, both as a source of distractions and as a solution. Decision errors are currently mainly addressed through police enforcement of existing laws and regulations, driver training, “punitive driver education”, STEP programs like “operation safe driver” and awareness programs such as “drive alive”. Quebec referred to the development of a progressive driver-oriented intervention program where corrective interventions would be implemented, such as supplemental training, driver rehabilitation programs and even termination of license to drive a CMV, when various predefined thresholds of negative safety performance are reached. As will be seen in phase 3, this kind of program falls well in line with the implementation of theory-driven interventions aimed at making CMV drivers safer, as discussed in phase 2. In terms of suggestions for decision errors, respondents recommend mandatory defensive driving courses for CMV drivers, more targeted awareness programs, widespread use of enforcement technologies like speed and red light cameras, stiffer penalties, more research on crash causes, evaluation of the effectiveness of interventions, more interventions to address risky-driving behaviors and driver attitude problems as well as increased availability of on-board driving performance monitoring technologies.
Human Factors in the Motor Carrier Industry in Canada 208
3.4 The National Safety Code In Canada, the regulations aimed at intra-provincial carriers are under provincial jurisdiction. However, under the Motor Vehicle Transport Act (MVTA), provinces and territories also enforce the federal regulations aimed at extra provincial carriers. In theory, this results in intra and extra provincial carriers being regulated in a consistent manner. The National Safety Code3 (NSC) represents the set of rules, processes and standards that govern motor carrier safety regulations and safety programs nationally. The approach is expected to be uniform throughout the country, as per an MOU that was signed by all the provinces and territories on September 21st 2001. The development, maintenance and application of the NSC is under the responsibilities of CCMTA’s Compliance and Regulatory Affairs (CRA) and Driver and Vehicle (D&V) standing committees, two structures formed of delegates of all provinces and territories as well as the federal government and stakeholders. The activities of CRA and D&V represent a joint effort aimed at developing and enforcing rules, regulations and safety programs in a uniform way across Canada. However, even if this is qualified as a joint effort, both committees somehow operate in silos and global strategic planning of road safety interventions, based on science and crash-causation knowledge, appears to be somewhat lacking. Indeed, since it is mainly CRA and D&V that are responsible for steering safety programs for Motor Carrier safety in this country, there should ideally be within these committees’ activities dynamic interactions between regulators and researchers in order to (1) assess, identify and understand CMV crash causation factors, (2) steer a regulatory agenda that systematically targets identified risk factors and (3) generate a scientific research program that serves as a base for regulations and interventions and that periodically measures their effectiveness. To assess to what extent these processes are taking place, it is therefore relevant to address the following issues in order:
• Has there been, or is there, a scientific problem assessment effort at the base of the National Safety Code?
• Do the regulatory agendas of CRA and D&V take into consideration the results of problem assessment and crash causation research?
• To what extent do CRA and D&V generate scientific research to support the development of regulations and to evaluate the effectiveness of safety programs?
Looking at the first issue, there does not seem to be a scientific problem assessment procedure at the root of the NSC and there is no clear signs that CRA and D&V currently haven a systematic process to analyse or factor-in the results of ongoing crash causation studies (apart from the work of this task force). Therefore, the development and the actual steering of safety programs for motor carriers does not seem to be oriented on the basis of crash causation studies or a systematic problem assessment approach, as is the case in the U.S.
3 See CCMTA website for background and standards: http://www.ccmta.ca/english/producstandservices/publications/publications.cfm#NSC
Human Factors in the Motor Carrier Industry in Canada 209
It is however important to note that apart from the Tri-Level Indiana study that was published in 1979 - and which was oriented towards the general driving population - CMV crash-causation research projects such as the LTCSS, the EPAC and naturalistic studies have only recently been conducted. Also, given their limitations to assess subtle causation factors associated with driver errors, police reports were (and still are) of limited utility. There was therefore limited material available with regards to crash causation in the specific context of CMV safety at the time of the formulation of the National Safety Code. This likely explains the low input from crash-causation knowledge at the time, and a similar situation could certainly be observed internationally. This science is however available now and this new knowledge should be taken into account and factored-in by means of a dynamic ongoing problem assessment approach, somewhat similar to what has been happening in the U.S. in the past 10 years or so. Regarding the second issue, since there is no crash-causation or scientific problem assessment approach, it cannot be said that the regulatory agenda of CRA and D&V (at least with regards to motor carrier issues) relies on a systematic strategy based on the results of problem assessment and crash causation research. As an example, the NSC standards are not all enforced and the process by which a standard should or should not be enforced or regulated does not seem to rely on a risk-based data-driven approach to allocate resources and attention. As for the third issue, it is reasonable to say that CRA and D&V partially rely on science for the development of regulations. For example, while most recent regulations like cargo securement and HOS definitely included a scientific approach, it appears that the standing committees have a rather sporadic relationship with the research world, essentially seeking scientific input from consultants on a project basis to answer specific questions. There is no long-term comprehensive scientific program in place to support and steer the development of regulations like what exists in the U.S. There appears to be a network of consultants and researchers, but this network could be wider, organized and include more involvement from the university research world. It should also be noted that scientific evaluation of safety programs is currently lacking. As is often the case in road safety, reviewing program effectiveness is not seen as a priority. Ideally, as happens in most public health intervention domains, the evaluation mechanisms of a safety regulation should be developed and put in place at the same time as the regulation itself, since it is the only way to know if it is effective and to improve it over time. To sum up, the orientations of safety programs in Canada should be based on a systematic problem assessment approach focussed on crash-causation science which is somewhat lacking at this time. Once targets are identified, a clear strategy should be put forward and a research program should be set up to steer, support and feed future and ongoing regulatory activities and safety programs. A special focus should also be put on the evaluation of safety interventions, similar to what the Volpe center does in the U.S. for the FMCSA.
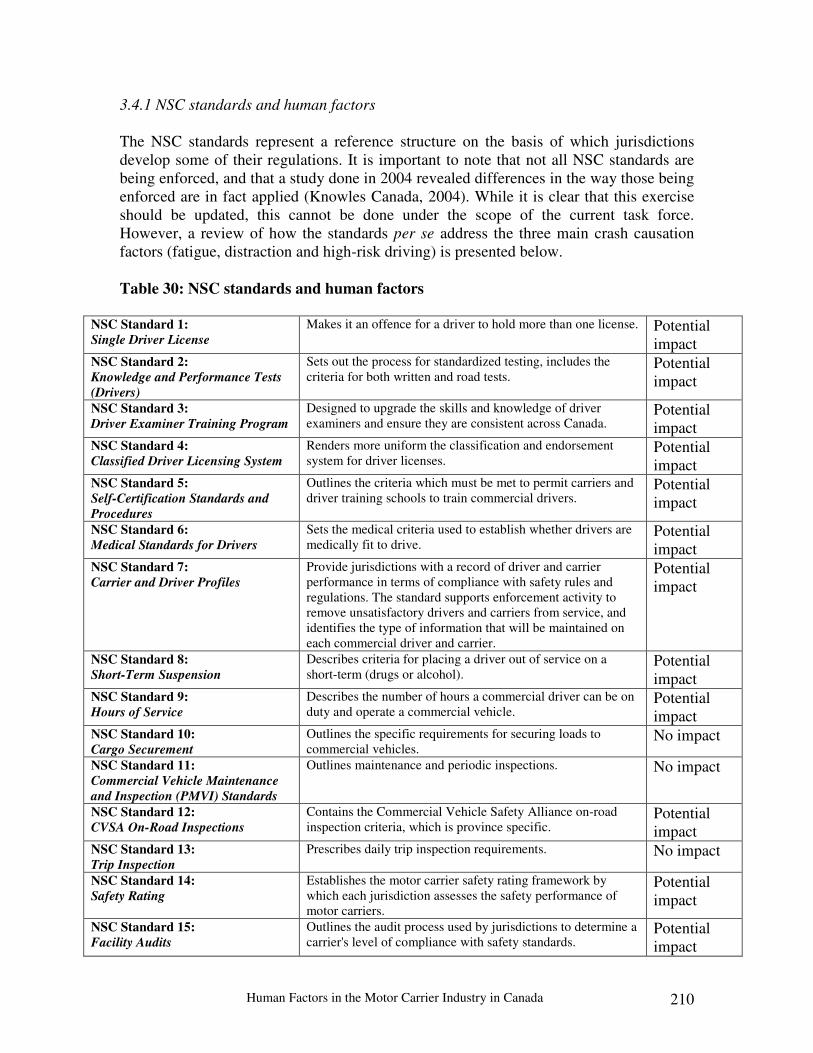
Human Factors in the Motor Carrier Industry in Canada 210
3.4.1 NSC standards and human factors The NSC standards represent a reference structure on the basis of which jurisdictions develop some of their regulations. It is important to note that not all NSC standards are being enforced, and that a study done in 2004 revealed differences in the way those being enforced are in fact applied (Knowles Canada, 2004). While it is clear that this exercise should be updated, this cannot be done under the scope of the current task force. However, a review of how the standards per se address the three main crash causation factors (fatigue, distraction and high-risk driving) is presented below. Table 30: NSC standards and human factors
NSC Standard 1:
Single Driver License Makes it an offence for a driver to hold more than one license. Potential
impact NSC Standard 2:
Knowledge and Performance Tests
(Drivers)
Sets out the process for standardized testing, includes the criteria for both written and road tests.
Potential impact
NSC Standard 3:
Driver Examiner Training Program Designed to upgrade the skills and knowledge of driver examiners and ensure they are consistent across Canada.
Potential impact
NSC Standard 4:
Classified Driver Licensing System Renders more uniform the classification and endorsement system for driver licenses.
Potential impact
NSC Standard 5:
Self-Certification Standards and
Procedures
Outlines the criteria which must be met to permit carriers and driver training schools to train commercial drivers.
Potential impact
NSC Standard 6:
Medical Standards for Drivers
Sets the medical criteria used to establish whether drivers are medically fit to drive.
Potential impact
NSC Standard 7:
Carrier and Driver Profiles Provide jurisdictions with a record of driver and carrier performance in terms of compliance with safety rules and regulations. The standard supports enforcement activity to remove unsatisfactory drivers and carriers from service, and identifies the type of information that will be maintained on each commercial driver and carrier.
Potential impact
NSC Standard 8:
Short-Term Suspension Describes criteria for placing a driver out of service on a short-term (drugs or alcohol).
Potential impact
NSC Standard 9:
Hours of Service Describes the number of hours a commercial driver can be on duty and operate a commercial vehicle.
Potential impact
NSC Standard 10:
Cargo Securement Outlines the specific requirements for securing loads to commercial vehicles.
No impact
NSC Standard 11:
Commercial Vehicle Maintenance
and Inspection (PMVI) Standards
Outlines maintenance and periodic inspections. No impact
NSC Standard 12:
CVSA On-Road Inspections Contains the Commercial Vehicle Safety Alliance on-road inspection criteria, which is province specific.
Potential impact
NSC Standard 13:
Trip Inspection Prescribes daily trip inspection requirements. No impact
NSC Standard 14:
Safety Rating Establishes the motor carrier safety rating framework by which each jurisdiction assesses the safety performance of motor carriers.
Potential impact
NSC Standard 15:
Facility Audits Outlines the audit process used by jurisdictions to determine a carrier's level of compliance with safety standards.
Potential impact
Human Factors in the Motor Carrier Industry in Canada 211
Table 30 shows that only 3 standards (10, 11, 13) are clearly not oriented towards human factors while the rest of them can have a potential impact. This suggests that the NSC represents a structure that is viable for the development of a strategy targeting human factors. CCMTA moreover notes that standards are subject to periodic review by CCMTA members to enhance their effectiveness or respond to new regulatory issues. From a research point of view, this position is both responsible and efficient as it strengthens the ability of the regulatory structure to factor-in new elements stemming from the scientific community. This review process should however be empirical, organized, recurrent, dynamic and creative. NSC standards 1 through 5 deal with training, testing and licensing. As discussed in this report, these components are likely to be important in a strategy targeting human factors because they can impact on processes underlying recognition and decision errors. As was noted, this field is evolving and new training and testing strategies are being developed and tested. In Canada, driver training is not mandatory for CMV drivers, and the process by which candidates get educated and licensed is outcome oriented, rather than process oriented. In other words, the approach is based on testing and licensing rather than training itself. Driver licensing evaluation - and most specifically the content of this evaluation - is therefore critical, because it mobilizes drivers to train and specifies the areas that should be covered in order for the driver to succeed. In this regard, standard 2 is central because it specifies what should be tested during written and on-road driver examination procedures. It is important to note that the content of these examinations are oriented towards knowledge, procedures and skills. It is also stated in the introduction of the standard that recent efforts have lead to the development of tests to assess an applicant’s ability to logically work out problems, and others designed to assess an applicant’s psychological makeup. While there is some evidence in the standard of the former, no substantial information is given with regards to the latter, apart from considerations in the section explaining how driver re-examination and driver improvement interviews should be conducted. Interestingly, it is mentioned in the standard that driver testing has to be considered as an educational medium and that examiners should provide comprehensive feedback to applicants while correcting the tests. In so doing they are both motivating the applicant to train further while orienting him/her towards the areas that need to be addressed before re-attempting to get licensed. Also, it is mentioned that a thorough driving test with high standards will encourage the drivers to study carefully before hand, resulting in much greater training benefits that could be accomplished by the driving test itself (p.14). While this reasoning is indeed sound, it needs to be emphasized that a process-oriented approach that makes training mandatory while providing a training curriculum that is clearly oriented towards crash-causation factors appears like a logical alternative, or complement.
Human Factors in the Motor Carrier Industry in Canada 212
Looking at the content of standard 2, it appears that driver testing is aimed at assessing the risks of performance errors rather than the main crash-causation factors, namely recognition and decisions errors caused by fatigue, distraction and high-risk driving. By focussing mainly on the knowledge, procedures and skills needed to prevent performance errors, this approach to testing in turn has en impact on the orientation of driver training. In order to prepare for the test, candidates therefore learn what is necessary to prevent these performance errors, and it appears that far less emphasis is put on the prevention of recognition and decision errors. It is important to reiterate here that performance errors come out as the weakest contributor in crash causation studies, while recognition and decision errors represent the most significant problems that need to be addressed. In terms of recognition errors, it therefore needs to be recommended that drivers be tested on the contributors of fatigue and distraction and on how these problems should be mitigated. With regards to decision errors, it was discussed earlier that the problem is related to driving “style” (risk-taking) rather than knowledge and skills. There are however limitations as to what can be assessed in terms of psychological predictors of risky-driving during a licensing examination process - either written or road test- because candidates can easily produce socially desirable responses and behaviors. This type of intervention is more appropriately delivered from a driver improvement perspective, which is discussed further in phase 3. However, there are still some basic knowledge items related to how personality, attitudes, social norms, work pressure and risk-perception can negatively impact on driving behaviors and driving style. Testing drivers on these issues would prompt the driver-training field to develop this material, which would certainly be beneficial. As observed earlier, making drivers fully cognisant of what fuels aggressive and risky-driving can be seen as a first step towards attitudinal and behavioral change. Defensive driving skills should also be included in testing; this would indeed reinforce their promotion during preparatory training. Standard 2 concludes with the specification of standards for interviews conducted in the context of re-examination and driver improvement programs. With regards to recognition errors, the text simply informs interviewers about the risks of inattention caused by fatigue or alcohol and their contribution to crashes. More is said however concerning decision errors:
Personality and attitude are of paramount importance in determining the reasons for lack of driving conformity. Clues to emotional maladjustment may become apparent through casual interrogation. Lack of personal restraint, the tendency to act on impulse, take risks and perform aggressively, especially in the company of other persons, immaturity, juvenile delinquency, resentment of authority or similar personal difficulties are keys to driver behavior (p. 36).
Human Factors in the Motor Carrier Industry in Canada 213
(…) It is desirable for an interviewer to have some basic knowledge of elementary practical psychology. He should be able to recognize basic human behavior patterns and motivating factors to make a practical analysis of the driver’s problem (p. 36). (…) Success or failure of the Driver Improvement Program depends largely on the interviewer. He must have the ability to analyze the problems of the driver correctly and then aid him in solving them (p. 36). (…) The driver’s response will give the interviewer an opportunity to formulate an opinion of his attitude and personality. Irrational beliefs or prejudices on the part of the driver may lead the interviewer to the source of his problem (p. 37).
It is interesting to realize that the standard does recognize the impact of personality and attitudes on driving, as well as the importance for the interviewer to consider these things in the context of driver improvement programs. However, it is simply stated that the interviewer should have knowledge in elementary psychology, which would lead him to formulate an opinion of the candidate’s attitude and personality. As was discussed in the section on decision errors, what is in fact needed is rather a comprehensive scientific testing procedure, which includes psychometric assessments of personality and attitudes as well as hazard perception testing, and could possibly include driver records, on-board monitoring data, performance on a simulator, etc. Such an assessment would provide program management with a diagnosis of what motivates risky driving for an individual and could be used to identify and apply tailored interventions. Authors in both CMV and road safety research indeed believe that novel approaches to training and testing can be used to deal with high-risk drivers. In brief, it is suggested that training and testing procedures could lead to the identification of high-risk drivers and to the modification of their attitudes towards risky driving (Deery & Fildes, 1999; Iversen & Rundmo, 2002; McKenna & Crick, 1997; Regan, Deery & Triggs, 1998). It is suggested that training and testing be used to assess the profile of drivers and to apply tailored interventions aimed at changing their risk-taking behaviors, while considering the utility of risk-taking in their system, or personality (Thiffault et al, 2005). Driving simulators can also be used to assess risk perception processes and risk taking tendencies as well as to train drivers to adopt safer behaviors in high-risk situations that can potentially lead to recognition and decision errors (Ferguson, 2003; Fisher, Laurie, Glaser et al., 2002). Standard 3 relates to driver examiner programs. It describes what examiners should know and how they should be trained. Surprisingly, the standard does not mention fatigue, distraction or risky driving, nor does it refer to any crash-causation science. It would be logical that examiners receive some kind of training as to why drivers get involved in crashes. The inclusion of material related to human factors and driver errors in driver examiner training program curriculum therefore needs to be recommended.
Human Factors in the Motor Carrier Industry in Canada 214
NSC standard 9 relates to hours of service (HOS) regulations. This set of rules is aimed at addressing the problem of driver fatigue. It is important to underline that the development of the Canadian approach towards driver fatigue is a good example of collaborations between researchers and regulators. The process was indeed quite iterative; the Transportation Development Center (TDC) was actively involved and generated research projects that set the basis for the regulation. While developing the rules, regulators also reached out to different panels of scientists with specific questions in need for answers and subsequently fed this information into the decision making process. It is important to note that some of the recommendations were adopted while others were not. From a regulatory perspective, rules indeed need to factor-in operational constraints and economical considerations together with scientific principles. What certainly appears to be lacking is a systematic strategy to evaluate the impacts of the new HOS regulations. While they were developing the HOS regulations, governments were also busy setting up the North-American Fatigue Management Program (NAFMP), a Canada-US initiative that represents a comprehensive approach to dealing with the problem of driver fatigue. The NAFMP complements the HOS regulation by addressing important factors that cannot be targeted using a single set of rules. An additional study aimed at developing scientific napping guidelines is also being conducted at this time, and the results will be a significant complement to the NAFMP. Overall, the Canadian process to deal with the problem of driver fatigue is comprehensive, systematic and scientifically sound. It is a good example of the involvement of researchers and regulators in a complex process generating both regulatory and non-regulatory sets of countermeasures. Further recommendations however need to be underlined, as will be seen in phase 3. Standards 7, 12, 14 and 15 relate to the core of safety programs for motor carriers. Standard 7 describes carrier and driver safety information that needs to be recorded, including information about fatigue (HOS violations) and risky driving (violations). Standard 12 contains the criteria for CVSA on-road inspections, standard 14 prescribes the safety rating framework and standard 15 offers guidelines for facility audits. These safety programs are of capital importance for human factors interventions; they prescribe the processes by which high-risk drivers and carriers are identified and provide general guidelines as to how they should be dealt with. It is however important to note that the efficiency of this framework has never been assessed, in contrast to the US model, where the safety impacts of compliance reviews and roadside inspections are estimated yearly through collaborations with the Volpe center. When reflecting on the efficiency of this framework, important issues to consider are (1) the ability of these programs to identify high-risk drivers in a short time period and (2) the type of interventions that are being prescribed. These interventions being the key to behavior modification - both at the carrier and driver level - this framework represents a legitimate context to develop and implement new driver oriented interventions. Another important aspect to consider is the reorientation of safety programs in the U.S. under the CSA-2010 program, keeping in mind that Canada and the U.S. continue to work towards reciprocity and harmonization.
Human Factors in the Motor Carrier Industry in Canada 215
3.4.2 CSA-2010 CSA-20104 holds a lot of promises with regards to addressing driver errors. It is fitting to present a brief description of the initiative in this section as it ties in well with the national safety code. The direction taken by CSA-2010 is to include more driver-related information and to evaluate the safety fitness of drivers like it does for motor carriers. This decision stemmed from the results of problem assessment research showing that human factors are causing roughly 90% of CMV crashes. Note however that the intervention component with regards to drivers under CSA-2010 is still unclear. Finally, if Canada was to adopt an approach similar to CSA-2010, it is interesting to observe that most of the required data appears to be collected, as per standard 7, and could be available. A detailed investigation would however need to be conducted to assess the fit of Canadian data and the requirements of such a system. The development of regulation is closely linked to research in the U.S. The CSA-2010 initiative, a major revamping of FMCSA’s global approach to CMV safety, is a good illustration of this process. First, a problem assessment research domain was put in place with the active participation of scientists and industry representatives. Significant research efforts like the LTCCS and the truck naturalistic studies were then conducted to investigate further accident causation and to generate an empirical basis to steer new research and regulation efforts. Once a deeper understanding of the issues was gathered - revealing the importance of human factors in CMV crashes - an overhaul of safety interventions was triggered, with the aim of directly assessing and targeting driver factors. The development of the program, which now spans over a number of years, is being done in parallel with various research activities aimed at scientifically validating and calibrating every component and the process involved. Briefly looking at the program per se, FMCSA describes it as a new operational model aimed at developing and implementing more effective and efficient ways to reduce CMV crashes, fatalities and injuries. It will use improved data to better identify high-risk carriers and drivers, and apply a wider range of interventions to correct high-risk behaviours. Note that intense stakeholder consultations were part of the development of the overall concept. FMCSA points out that this new approach was deemed necessary because the current compliance review process is too resource-intensive and reaches only a small fraction of the industry and because the results of the LTCCS made clear that increased attention should be given to the driver, both in terms of monitoring and intervention. The approach will therefore not only evaluate the safety fitness of carriers, but also that of drivers. As shown in Figure 25, the driver information to be monitored corresponds to various behavioural categories (BASICs) and it will be monitored through multiple sources. 4 See FMCSA website for information: http://csa.fmcsa.dot.gov/default.aspx
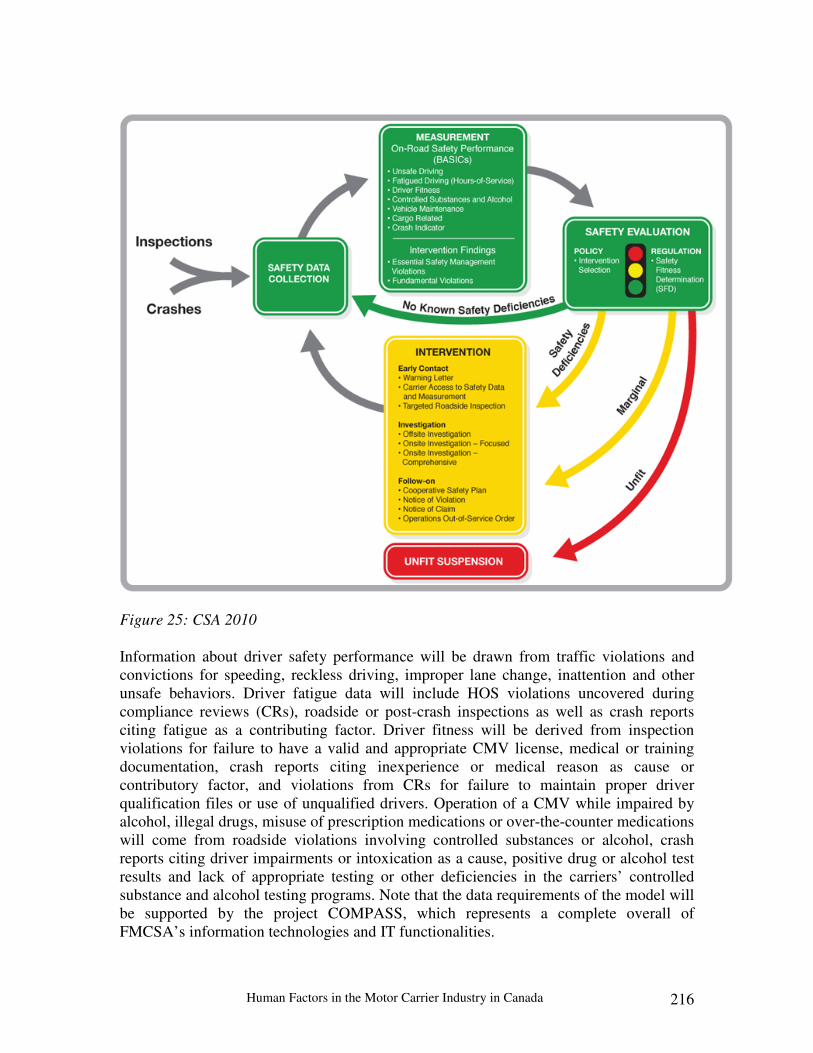
Human Factors in the Motor Carrier Industry in Canada 216
Figure 25: CSA 2010 Information about driver safety performance will be drawn from traffic violations and convictions for speeding, reckless driving, improper lane change, inattention and other unsafe behaviors. Driver fatigue data will include HOS violations uncovered during compliance reviews (CRs), roadside or post-crash inspections as well as crash reports citing fatigue as a contributing factor. Driver fitness will be derived from inspection violations for failure to have a valid and appropriate CMV license, medical or training documentation, crash reports citing inexperience or medical reason as cause or contributory factor, and violations from CRs for failure to maintain proper driver qualification files or use of unqualified drivers. Operation of a CMV while impaired by alcohol, illegal drugs, misuse of prescription medications or over-the-counter medications will come from roadside violations involving controlled substances or alcohol, crash reports citing driver impairments or intoxication as a cause, positive drug or alcohol test results and lack of appropriate testing or other deficiencies in the carriers’ controlled substance and alcohol testing programs. Note that the data requirements of the model will be supported by the project COMPASS, which represents a complete overall of FMCSA’s information technologies and IT functionalities.

Human Factors in the Motor Carrier Industry in Canada 217
It is interesting to note that the model so far seems to propose limited real driver-oriented interventions. There is an intervention selection component and it is stated that this component would identify appropriate FMCSA interventions, for drivers and for carriers, depending on the outcomes of the safety fitness determination and measurement components. The intervention per se is defined as any action FMCSA would take to correct unsafe behaviors and achieve safety compliance and they would be targeted at drivers and carriers, depending on their specific safety fitness, or safety profile. However, the progressive interventions that are being suggested in the model (data request, website education, warning letter, document request, targeted roadside, focussed review, comprehensive review, enforcement) clearly fit the more classical carrier safety paradigm than interventions targeting human factors and driver errors. FMCSA is however involved in numerous human factor studies and it is most likely that driver oriented intervention will be incorporated, in or outside the framework of CSA-2010. Overall, it is felt that this is probably the kind of iterative process between researchers and regulators that should be used to develop a strategy to target human factors in the motor carrier industry in Canada, keeping in mind that interventions do not necessarily need to fit a specific regulatory framework to be legitimate. At present, it appears that the industry is leading the charge in human factors interventions, both because it makes sense for safety and because safety is good for business. The role of governments, over and above developing and enforcing regulations, should be to develop a strong empirical theory-driven knowledge base that will pave the way for future interventions. This knowledge could translate into regulatory changes and it could also take the form of best practices or MOUs to be developed with industry. In other words, governments should be more active in leading the industry in this matter, with the aim of reaching a scientifically sound and efficient approach that would be consistent throughout the country. Looking at what is happening in the U.S., the FMCSA is deeply involved in human factors research at this time, even if many of the issues being looked at do not necessarily have regulatory implications. Basically, the issues are being addressed because they are likely to make the roads safer, even though implementation strategies are not always clear. In brief, the knowledge base is being expanded via an intensive program of applied and fundamental research, and the government will most likely push for the implementation of the best measures using different strategies. It is highly recommended that Canada stay very close, and when applicable, collaborate on the development of these research projects. To sum up, it needs to be said that while fatigue is covered by standard 9 and that high-risk driving is covered under standard 7 (carrier and driver profile) and standard 14 (safety rating), distracted-driving appears to be left out of the equation. Suggestions were made to include material on these crash-causation factors in driver testing (standard 2) and the training of driver examiners (standard 3). A description of CSA-2010 was brought forward and an emphasis was made on the importance of problem assessment and interactions between researchers and regulators for the development of regulatory and non-regulatory safety programs.
Human Factors in the Motor Carrier Industry in Canada 218
4. PHASE III: Suggested strategy
The most significant crash causation factors were identified in phase 1 of the report. Numerous sources indicate that these mainly relate to recognition and decision errors rather than performance errors or the use of drugs and alcohol. This does not imply that there are no problems in these areas, but rather that recognition and decision errors need to be prioritized, from a risk-based perspective, if the intent is to prevent CMV crashes. Once these crash-causation factors were identified, a comprehensive review was made of the factors and processes that are responsible for these driver errors as well as of the mechanisms, or behavior modification principles, that could be used to prevent them from happening or to mitigate their effects. Most classical interventions in use today were also discussed in order to assess to what extent they actually use these levers or mechanisms. Various observations were made with regards to leads that could be followed, or things that could be done, in each of these domains. In phase 2, a review was done of the interventions currently in place in Canada to address recognition, decision, performance and non-performance errors. While the information gathered is mostly high-level and does not provide in-depth descriptions of programs and regulations, it nevertheless brings forward valuable contextual and descriptive data. In phase 3 the findings of phase 1 (what are the problems, what should be done) and phase 2 (what we are currently doing) are merged in order to develop a suggested strategy. Note that these recommendations are seen as the best leads from a purely scientific perspective. This does not take into consideration practical issues such as the operational needs of the industry, the structural makeup of jurisdiction overseeing road safety in the country as well as within CCMTA, the scarcity of financial resources, etc. The options suggested in phase 3 can be seen as a starting point that could stimulate discussions among stakeholders and help structuring their efforts in the creation of new means to mitigate driver errors. What options will be retained, how they can be prioritized, how these projects could be done, by whom and with what resources, are all questions that remain to be answered. These issues will be discussed once stakeholders have processed the content of this report. Note that the scientific justification for each suggested action items was developed in phase 1 of the report and will not be repeated here, apart from general considerations. Also, the action items are only presented in a high-level format and further methodological or operational considerations for each need to be developed further once accepted or activated by stakeholders. As mentioned, this will be done through a process that still needs to be clarified and that falls outside the mandate of the task force. Finally note that tables 31, 32, 33 simplify the content of phase 3 by providing a high-level listing of the action items that are suggested to address fatigue, distraction and high-risk driving. The options presented in the text are linked to the tables with a specific code and the tables are presented at the end of each section.
Human Factors in the Motor Carrier Industry in Canada 219
4.1 Recognition errors As presented in phase 1, recognition errors mainly relate to inattention as it is caused either by fatigue (hypovigilance) or distraction. The prevention of recognition errors therefore involves mitigating the effects of the factors that contribute to fatigue and distraction for CMV drivers. 4.1.1 Fatigue As can be seen from the information gathered in the Carriers survey (see table 22), from a company perspective, CMV driver fatigue is mainly addressed via best practices transmitted through driver training (69%) and some form of FMP (52%). Only 12% of carriers (the larger ones) use fatigue detection technologies and only 12% report testing for OSA. Carriers are asking for more accessible fatigue detection technologies (cheaper/tax incentives), available and efficient programs for OSA testing/treatment, more parking facilities and rest areas and recommend that CVSA should focus more on driver condition and less on vehicles. Note that industry associations are promoting the use of EOBRs to enforce HOS regulations and are also asking for tax incentives to incent carriers to make use of fatigue detection technologies. From a government perspective (see table 29), some jurisdictions simply report the implementation of the new HOS regulations while others have more comprehensive programs to deal with the issue through initiatives aimed at both CMV and LDV drivers (see for example Quebec’s comprehensive approach, as detailed in appendix I). In brief, when more than HOS is cited, fatigue is mainly addressed using awareness programs, driver training, FMPs, funding for fatigue research (e.g. Quebec and Alberta) as well as the revamping of the rest area structure (in Quebec, comprehensive overhaul provides CMV drivers and other road users with regular - maximum every 100 kilometres - opportunities to park and get some sleep in clean, secured, fully serviced facilities). Also, note that CCMTA’s STRID expert group on driver fatigue has developed a comprehensive strategy to be adopted by jurisdictions. However, as per a 2010 survey, only six jurisdictions have so far fully adopted the strategy. A first recommendation could therefore be to promote the adoption of this strategy at a national level. The main fatigue contributors were presented in phase 1 and the specific risk factors for the motor carrier industry were also documented. As noted, the HOS regulations theoretically address important risk factors, even though they have significant limitations. The case is therefore made that HOS regulations are necessary but not sufficient to address fatigue in the motor carrier industry. There is therefore a need to make all stakeholders understand this reality: HOS rules form the foundation of fatigue management, but they need to be complemented by various initiatives to generate a comprehensive and efficient fatigue management approach. Note that this conclusion is important given the fact that many jurisdictions in the country report HOS rules as the primary means to address driver fatigue. Considerations with regards to complementary initiatives are presented below. First, with regards to HOS per se:
Human Factors in the Motor Carrier Industry in Canada 220
4.1.1.1 Hours of service (F1, F2, F3)
• HOS rules are necessary but they are far from being perfect, nor sufficient. They therefore need to be part of a more comprehensive fatigue management strategy that should be recognised and endorsed by industry and governments;
• HOS rules should be enforced with tamper-proof equipment such as Electronic On-Board Recorders;
• The operational and safety effects of the new HOS rules in Canada should be evaluated.
4.1.1.2 Determinants of the decision to drive while drowsy (F4, DI1, DE2) It was shown that even though drivers have good knowledge about fatigue and fatigue countermeasures, they tend to resist and try to fight fatigue with effort - which is clearly ineffective and very risky. This implies that behavioral determinants other than knowledge alone are at play and that identifying these determinants for Canadian CMV drivers could help develop efficient strategies to influence this decision process. It is therefore suggested that a study investigating the psychological determinants of the decision to keep driving while experiencing fatigue be conducted. This could be done with the support of a theory such as theory of planned behavior, as detailed in the report. 4.1.1.3 Macroergonomics of the motor carrier industry (F5) On a corollary note, the discrepancy between drivers’ actions and knowledge with regards to the self-management of alertness most certainly has to do with how the macroergonomics of this industry (e.g. compensation schemes, company policies, shippers) are shaping drivers motivations and attitudes. For example, the way the pay structure is designed is most likely a significant determinant of the decision to keep driving while drowsy. It is premature to formulate any recommendations without entering into a formal in-depth investigation. However given the importance of this issue, it is necessary that such an examination take place. This process could be done subsequent to the previous action item, as a study on the determinants of the decision to keep driving while drowsy could help in orienting this specific examination towards the most significant issues for the development of interventions. 4.1.1.4 Training, testing, licensing (F6, F7) As seen in phase 2, 69% of carriers acknowledge that fatigue is part of their driver training activities. Governments also identify training as a central piece in their approach to driver fatigue. What is important therefore is to make sure that these training initiatives include specific high-level knowledge elements with regards to driver fatigue. In other words, not only should there be a special focus on fatigue in driver training curricula - at all the levels of training (entry-level, driver improvement, etc.) – but the scientific review suggests that the following areas should be covered in both training and testing:
Human Factors in the Motor Carrier Industry in Canada 221
• The focus should not only be on endogenous risk factors such as time-of-day, time-on-task, time-awake and sleep needs but also on exogenous factors such as road monotony as well as the impacts of various sources of individual differences such as personality dimensions;
• Drivers should be made aware of the risks of night driving and given proper strategies to deal with them;
• Drivers should be convinced of the superior efficiency of pre-trip fatigue management (getting enough sleep, properly planning journeys with opportunities to rest and take regular breaks, proper food and exercise, etc.) compared to in-transit countermeasures. Training with regards to the self-management of alertness should focus on these pre-trip strategies;
• Drivers should be made to understand the proximal relationship between signs of drowsiness, microsleep and falling asleep per se. This would reveal to them the real level of risk associated with trying to fight drowsiness with effort;
• Drivers should be made to understand the significant impact of early fatigue on attention, which leads to dangerous inattention errors. The key is to insist on the fact that early fatigue signs are not felt as drowsiness but rather as being bored, depressed, etc. Drivers need to be convinced that these early fatigue states are associated with a significant share of the crashes that are related to inattention and that there are effective countermeasures that can be adopted while experiencing these early symptoms;
• Drivers should be made to understand the relative efficiency of fatigue countermeasures and they should be taught exactly what they should opt to do in various specific fatigue inducing contexts;
• Globally, there is a need to scrutinize existing driver-training curricula and the various training practices available to CMV drivers to assess if the above-mentioned items are covered and to promote their inclusions if it is not the case;
• An option would be to develop fatigue-related material that would abide with these principles and to make it available to the training community and the industry;
• Note that these issues should also be covered in testing and licensing procedures.
4.1.1.5 Fatigue Management Programs (F8) The NAFMP, which should be made available to motor carriers throughout North America on a web-based platform early 2012, represents an important scientifically developed complement to HOS regulations. It is recommended that governments and industry stakeholders vigorously promote the voluntary adoption of the program by motor carriers of all sizes. As a reminder, the NAFMP is comprised of education components for drivers, dispatchers, company management, family members etc, OSA screening and treatment guidelines, procedures and tools, scheduling guidelines and tools as well as recommendations with regards to the use of fatigue monitoring technologies. Note that all of these interventions, which are central for fatigue management, are not part of the HOS regulations. This provides another example of how an approach solely based on respecting these rules - and especially pushing them to the limit - falls short in terms of oversight and most likely effectiveness.
Human Factors in the Motor Carrier Industry in Canada 222
4.1.1.6 Scientifically based napping/recovery guidelines (F9) It is widely understood that sleep is the most efficient way to address fatigue. Naps and recovery periods are therefore central to a comprehensive approach to manage fatigue. Some of the North American stakeholders that brought forward the NAFMP are currently involved in a combined field/lab research project to develop, test and validate various napping and recovery guidelines that will take into considerations factors such as day/night driving as well as individual differences in fatigue susceptibility. The results of this research are intended to: 1) improve highway safety and driver well-being, 2) maximize the potential for schedule flexibility to better accommodate operational and driver needs, and 3) provide improved means for rapid and safe recovery from fatigue in the event of unforeseen schedule variations. It is therefore emphasized that the results of this important research project should be taken into account in further developments of a comprehensive Canadian approach to manage the fatigue of CMV drivers. An efficient way to make this possible will be to incorporate these guidelines into the NAFMP framework. 4.1.1.7 Fatigue monitoring technologies (F10, F11) Carriers, industry associations as well as jurisdictions have expressed the need for an easy access to affordable and efficient fatigue monitoring technologies. Back in 2003 Transport Canada conducted a study entitled “Fleet demonstration of technological aids for the management of fatigue among commercial motor vehicle drivers”. However there have been many developments in the field of fatigue monitoring since then, with different technologies based on various approaches entering the market. There is therefore a need to update the 2003 study in order to test the various new technologies in an operational setting and to assess their efficiency in detecting early signs of fatigue. Issues related to user acceptance and behavioral adaptation also needs to be investigated further. Depending on the results, a strategy for the widespread inclusion of these technologies in the motor carrier industry could be developed and recommended. The use of various forms of incentive programs for the adoption of these technologies should also be considered. 4.1.1.8 Crash avoidance technologies (F12, F13) It is becoming increasingly clear that crash avoidance technologies such as electronic stability control, forward collision warning systems, lane-departure warning systems and blind-spot cameras can be beneficial for safety. It is therefore recommended that their utilisation be promoted in the motor carrier industry. Government-issued incentives like the ones given in the U.S. to help carriers to equip their fleets should be considered. However, issues such as user acceptance and behavioral adaptation also need to be studied further. This could lead to the development of active safety interventions that should be implemented as a complement to these systems in order to mitigate the risk of negative safety impacts.
Human Factors in the Motor Carrier Industry in Canada 223
4.1.1.9 Obstructive sleep apnea (F14) Carriers, industry associations and jurisdictions have all expressed the need for an easy access to OSA screening procedures. While OSA screening and treatment is a component of the voluntary NAFMP that is going to be made available to the industry in 2012, this issue nevertheless needs to be addressed more globally. Note that the current situation in the U.S. whereby rulemaking is in development, as well as the discussions of the CCMTA OSA working group, should make the issue progress in 2010 and 2011. No immediate action items are therefore suggested for the moment, aside from promoting the NAFMP, monitoring what the U.S. does and waiting for the deliverables of CCMTA’s OSA working group. Once all these pieces fall in place, a reassessment of the situation should be conducted. 4.1.1.10 Rest areas (F15) As discussed in phase 1, assessing the current situation with regards to rest areas in Canada is critical for the development of a comprehensive fatigue management approach. Transport Canada is currently conducting a study to assess the supply and demand of truck parking. The study will determine truck drivers' parking habits and preferences, identify areas where designated truck parking might be difficult to find, and determine how any possible shortages of parking might impact on safety, productivity, and personal well-being. The results of this study will help to understand the magnitude of the problem, which is the first step for the development of effective long-term solutions. Therefore no immediate action items are suggested here. Once the study is completed, a strategy should be drafted. Note that since Quebec is revamping its global rest area structure, their experience in this process could be documented and made available to the other jurisdictions. 4.1.1.11 Rumble strips (F16) As described in phase 1, rumble strips represent a proven countermeasure to mitigate the effects of driver fatigue. Studies indicate decreases of 21% and 25% in single vehicle crashes by lateral and central rumble strips respectively. There is therefore a need to promote the installation of lateral and central rumble strips across the country. Reviewing the Canadian situation and developing safety and business cases are logical next steps that could help promote improvements in this area.

Human Factors in the Motor Carrier Industry in Canada 224
Table 31: Action items suggested to address fatigue
# Suggested actions F1 Make stakeholders understand that HOS rules are necessary but not sufficient. HOS
needs to be part of a comprehensive fatigue management strategy that should be endorsed by industry and governments.
F2 HOS rules should be enforced with tamper-proof equipment such as Electronic On-Board Recorders.
F3 The operational and safety effects of the new HOS rules in Canada should be assessed. F4 Investigate the determinants of the decision to keep driving while experiencing fatigue.
This could be done with the support of a theory such as theory of planned behavior (link with DE2).
F5 Investigate the impacts of the macroergonomics of the industry on CMV driver fatigue in Canada.
F6 Scrutinize existing driver-training curricula and various training practices available to CMV drivers with regards to driver fatigue in light of the criteria listed in the report. If the suggested items are not covered, promote their inclusion. As a corollary, this material should be covered in driver testing and licensing procedures.
F7 Develop fatigue-related material that would cover the notions listed in the report and make it available to the training community and the industry at large.
F8 Governments and industry stakeholders should vigorously promote the voluntary adoption of the NAFMP by motor carriers of all sizes.
F9 Include upcoming results of the recovery/napping study into the NAFMP framework; promote the use of scientifically based napping guidelines and tools stemming from the research.
F10 Update 2003 Transport Canada study on fatigue detection technologies to assess their effectiveness in detecting early signs of fatigue as well as issues related to users acceptance and behavioral adaptation.
F11 Depending on results of F10, develop an approach for a widespread inclusion of fatigue-detection technologies in the motor carrier industry. The use of various forms of incentive programs for their adoption should be considered.
F12 Promote the adoption of crash avoidance technologies (ESC, FCWS, LDWS) in the motor carrier industry. Government-issued incentives to help carriers to equip their fleet should be considered.
F13 Investigate issues such as user acceptance and behavioral adaptation with regards to crash avoidance technologies; this could lead to the development of complementary active safety interventions that could be implemented to mitigate the risk of negative safety impacts.
F14 With regards to OSA, promote the NAFMP and track new development in the U.S. as well as results from CCMTA’s OSA working group in order to put forward a global policy position.
F15 With regards to rest areas, process results of TC study and develop global Canadian perspective. The recent experience in Quebec can help pave the way.
F16 With regards to central and lateral rumble strips: review Canadian situation and develop safety and business cases to promote the adoption of the intervention.
Human Factors in the Motor Carrier Industry in Canada 225
4.1.2 Distraction As revealed in the carrier survey (see table 22), driver distraction is currently being addressed mainly through driver training (74%), driver education & awareness programs (69%) and cell phone policies (52%). Note that very few carriers (less than 10%) report using crash avoidance technologies. In terms of industry association, Motor Coach Canada has issued a cell phone policy that companies can voluntarily choose to use. From a government perspective (see table 29), some jurisdictions have enacted distracted driving legislation, some are looking into the matter and others are not mentioning any specific efforts in this respect. Note that there is currently significant pressure for banning the use of hand held phones and texting while driving following the recent stands taken by U.S. Transportation Secretary Ray LaHood. Jurisdictions also report various education and awareness programs to prevent distracted driving for the general driving population. Again, there appears to be significant variability in the country. Driver oriented countermeasures 4.1.2.1 Determinants of the decision to use distractors (F4, DI1, DE2) Studies have shown that drivers tend to use distractors while driving even though they know this seriously increases crash risk. It was also shown that drivers tend to use distractors impulsively, without considering variations of demands from the driving tasks, even if they are made aware of these variations in advance in experimental settings. These studies indicate that the decision to use distractors while driving is influenced by determinants other than knowledge alone. Assessing these determinants for the Canadian CMV driver population is an important first step for the development of targeted interventions. There is therefore a need to conduct a study to better understand the determinants of driver distraction in the motor carrier industry in Canada. Based on a representative sample of drivers, the study would assess the impacts of attitudes, motivation, personality dimensions and risk perception on the decision to engage in distracting behaviors while driving. Once completed, such a study would inform the development of interventions based on education, training, awareness, enforcement and company safety programs. 4.1.2.2 Training, testing, licensing (DI2, DI3) Driver education is seen as a key component of driver-based interventions to address distracted driving: the management of distraction by drivers should be regarded as an ability that can be developed and improved through education and training (Regan, Lee and Young, 2008a). There is however a need to assess current educational material and to run a gap analysis on the basis of the specific recommendations expressed in phase 1. Recall that the discussion presented detailed suggestions as to what can be done in terms of education and training to counteract driver distraction at all levels of two different driving behavior models. Note that a special focus should be put on high-level goals, motives, and strategic functions, as presented in both models.

Human Factors in the Motor Carrier Industry in Canada 226
Given the increased penetration of telematics and communication devices in the task environment of CMV drivers, there is indeed no question that they need to be made to understand the basics of attention processes as well as the notions of workload and task demands. CMV drivers should be made aware that their attention runs on a single channel mode and that simultaneous tasks with fluctuating workloads may create a situation where attention capacity is overloaded, resulting in severely increased crash risk. Once they really understand this dynamic, it is likely that drivers will be more motivated and better equipped to self-manage their attention and to more efficiently plan their use of distracting devices while driving. A legitimate option would be to develop distracted driving material that would abide by the various scientific principles discussed in phase 1 and to make it available to the industry. This specific material about driver distraction should be included in company training programs. In this regard, governments should also play a leading role in providing fleets with guidance on strategies that can be adopted, legal responsibilities/liabilities related to driver distraction and product information to stimulate the purchase of vehicles and telematic nomadic devices that minimize distraction. Finally, the basic principles of driver distraction should be part of driver testing and licensing processes, since these mechanisms are currently the ones dictating the content of CMV driver training in Canada. 4.1.2.3 Enforcement: STEP programs (DI4) STEP programs - combining intensive enforcement with high-visibility public messaging and impact evaluation - were recently shown to be efficient in dealing with DWI, seat-belt use as well as aggressive driving around large trucks and buses. They could also be used to address the use of distractors, including hand-held cell phones and texting, for both the general driving population and CMV drivers. Such alternatives are currently being developed in the U.S. as a follow-up to the Distracted Driving Summit. This avenue therefore needs to be seriously considered. 4.1.2.4 Fleet level interventions (DI5, DI5a - DI5g) Note that the following items are largely based on Regan, Young and Lee (2008a).
• As stated in phase 1, employers should limit the availability of distracting technologies and devices. In this regards, a total ban of hand-held cellular phones and texting while the vehicle is in motion should seriously be considered;
• The banning of hands-free cellular phones should also be considered because of the very significant risk involved;
• Employers should provide drivers with vehicles equipped with technologies designed to minimize distraction;
• Employers should have clear policies to limit exposure to distractors by means of enforcement, either by penalties for failing to respect the rule or by incentives for compliance;
Human Factors in the Motor Carrier Industry in Canada 227
• Employees should be provided with guidance as to when it is acceptable to engage in distracting activities and when it is prohibited;
• Employers should provide education and training to teach drivers how to self-regulate behavior with regards to driver distraction. Education should detail the risk associated with the different types of distractors and provide guidance as to how it can be mitigated;
• Companies should implement systems to quantify the role of distraction in safety incidents;
• The efficiency of policies should be monitored with proper indicators. 4.1.2.5 Distractors-oriented countermeasures (DI6-DI13)
• There is a need to make an inventory of current in-vehicle technologies with a potential for distraction in contemporary heavy vehicles in Canada (includes both OEM and nomadic devices, for both driving and non-driving tasks);
• Once we have a clear understanding of the situation, there is a need to assess the distracting potential of these devices - taken both independently and in combination – and to establish their effects on driving performance;
• There is a need to assess how telematics devices (OEM and nomadic) are being developed. More precisely, the government should evaluate whether human factor guidelines are being used and how devices are being tested to determine if they are suitable to be safely used while driving or not;
• Given difficulties in applying design standards (rapidly evolving technology) and performance-based standards (no widely accepted standardized assessment methods), government needs to ensure that industry is following human factor design processes promoting comprehensive, systematic and traceable application of human factors considerations throughout the whole development cycle. Just how prescriptive this approach should be needs to be determined;
• Research in the field of real-time distraction countermeasures should be monitored and encouraged (funded);
• Special attention should be given to fleet dispatching devices and fleet communication devices. These systems should be using workload managers and lockdown functions while the vehicle is in motion, and these functions should be uniformly utilised by the industry. Further R&D is needed in this context and should therefore be encouraged (funded);
• Special attention should be given to instrument panels, which should also be using workload managers and lockdown functions;
• Texting by drivers needs to be banned from all trucks and buses in Canada. 4.1.2.6 Other things to consider (DI14-DI17) Reflecting on the action items that came out of the Distracted Driving Summit, the recommendations/action items of the CCMTA’s Expert Working Group on driver distraction as well as CVSA’s guidelines to address distracted driving, it appears that most elements are covered in the actions suggested above. The following points however, could also be emphasized further:
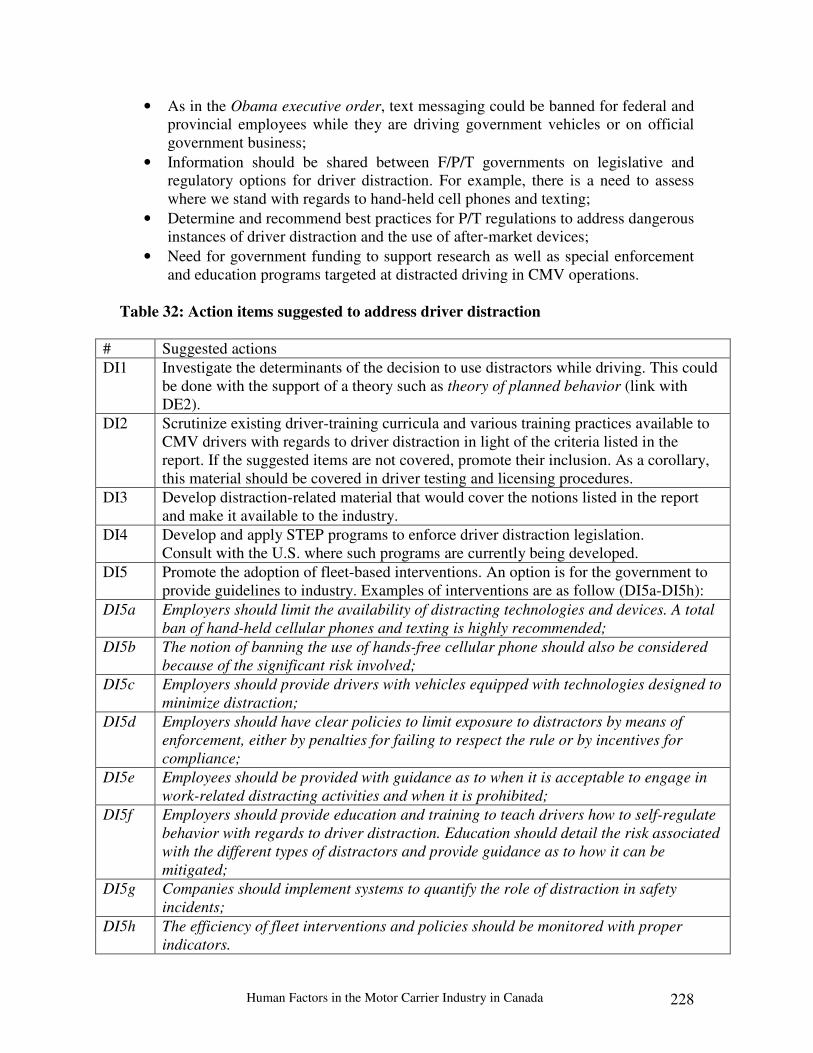
Human Factors in the Motor Carrier Industry in Canada 228
• As in the Obama executive order, text messaging could be banned for federal and provincial employees while they are driving government vehicles or on official government business;
• Information should be shared between F/P/T governments on legislative and regulatory options for driver distraction. For example, there is a need to assess where we stand with regards to hand-held cell phones and texting;
• Determine and recommend best practices for P/T regulations to address dangerous instances of driver distraction and the use of after-market devices;
• Need for government funding to support research as well as special enforcement and education programs targeted at distracted driving in CMV operations.
Table 32: Action items suggested to address driver distraction
# Suggested actions DI1 Investigate the determinants of the decision to use distractors while driving. This could
be done with the support of a theory such as theory of planned behavior (link with DE2).
DI2 Scrutinize existing driver-training curricula and various training practices available to CMV drivers with regards to driver distraction in light of the criteria listed in the report. If the suggested items are not covered, promote their inclusion. As a corollary, this material should be covered in driver testing and licensing procedures.
DI3 Develop distraction-related material that would cover the notions listed in the report and make it available to the industry.
DI4 Develop and apply STEP programs to enforce driver distraction legislation. Consult with the U.S. where such programs are currently being developed.
DI5 Promote the adoption of fleet-based interventions. An option is for the government to provide guidelines to industry. Examples of interventions are as follow (DI5a-DI5h):
DI5a Employers should limit the availability of distracting technologies and devices. A total ban of hand-held cellular phones and texting is highly recommended;
DI5b The notion of banning the use of hands-free cellular phone should also be considered because of the significant risk involved;
DI5c Employers should provide drivers with vehicles equipped with technologies designed to minimize distraction;
DI5d Employers should have clear policies to limit exposure to distractors by means of enforcement, either by penalties for failing to respect the rule or by incentives for compliance;
DI5e Employees should be provided with guidance as to when it is acceptable to engage in work-related distracting activities and when it is prohibited;
DI5f Employers should provide education and training to teach drivers how to self-regulate behavior with regards to driver distraction. Education should detail the risk associated with the different types of distractors and provide guidance as to how it can be mitigated;
DI5g Companies should implement systems to quantify the role of distraction in safety incidents;
DI5h The efficiency of fleet interventions and policies should be monitored with proper indicators.

Human Factors in the Motor Carrier Industry in Canada 229
DI6 Make an inventory of current in-vehicle technologies with a potential for distraction in contemporary heavy vehicles in Canada (includes both OEM and nomadic devices, for both driving and non-driving tasks).
DI7 Investigate the distracting potential of these devices, taken both independently and in combination, and establish their effects on driving performance.
DI8 Assess how telematics devices (OEM and nomadic) are being developed; evaluate to what extent human factor guidelines are being used and how devices are being tested to determine if they can be safely used while driving or not.
DI9 Ensure that the industry is following human factor design processes that promote comprehensive, systematic and traceable application of human factors considerations throughout the whole development cycle.
DI10 Research in the field of real-time distraction countermeasures needs to be monitored and encouraged (funded).
DI11 Special attention should be given to fleet dispatching devices and fleet communication devices. These systems should be using workload managers and lockdown functions while the vehicle is in motion, and these functions should be uniformly utilised by the industry. Further R&D is needed and should therefore be encouraged (funded).
DI12 Special attention should be given to instrument panels, which should also be using workload managers and lockdown functions concepts.
DI13 Texting by drivers should be banned from all trucks and buses in Canada. DI14 Text messaging should be banned for federal and provincial employees while they are
driving government vehicles or on official government business. DI15 Share information between F/P/T governments on legislative and regulatory options on
driver distraction. Assess where we stand in the country with regards to hand-held cell phones and texting.
DI16 Determine and recommend best practices for P/T regulations to address dangerous instances of driver distraction and the use of after-market devices.
DI17 Need for government funding to support research as well as special enforcement and education programs targeted at distracted driving in CMV operations
Human Factors in the Motor Carrier Industry in Canada 230
4.2 Decision errors Looking at the carrier survey (see table 25), decision errors are mainly addressed by company disciplinary sanctions, use of speed limiters, defensive driving training, various forms of safety management systems, incentive programs and some forms of driver assessment. Interestingly, carriers were quite productive in terms of suggestions as to what should be done. They acknowledge the need for a global safety culture change, ask for free guidelines on how to implement safety programs, call for low-cost on-board monitoring technologies, emphasize the need for upper management commitment to safety from an SMS perspective, call for an update of testing procedures at the entry-level and express the need for more government inputs at large as well as incentives for the use of safety technologies. Industry associations identified the use of speed limiters as well as driver training and improvement courses to deal with these issues. From a government perspective (see table 29), decision errors are addressed through police enforcement, driver training, “punitive driver education”, STEP programs like “operation safe driver” and awareness programs such as “drive alive”. The progressive driver-oriented approach described by Quebec deserves specific attention since it represents a good opportunity to anchor scientifically sound behavior modification interventions designed for drivers showing issues with regards to safety performance. This will be addressed later. In terms of suggestions for interventions aimed at decision errors, government respondents mainly recommended mandatory defensive driving courses, targeted awareness programs, enforcement technologies, stiffer penalties, research, evaluation of interventions, more interventions to address risky-driving behaviors and driver attitude problems as well as increased availability and accessibility of on-board driving performance monitoring technologies. As presented in phase 1 of this report, decision errors mainly relate to risky driving behaviors. Again, this is not to say that there are no other decision issues with CMV drivers, but rather that from a risk-based perspective, risky and dangerous driving should be prioritized. It was demonstrated that while passive interventions such as crashworthiness and crash avoidance technologies still hold significant promise and should remain central to our priorities, active driver-oriented interventions also represent an essential component for a comprehensive and systemic approach to the problem. The case was also made that the current driver-oriented countermeasures are rarely based on scientific theories of driver behavior and behavior modification and that they are seldom evaluated. There is therefore a need for a significant R&D push to incorporate the vast body of scientific knowledge that currently exists on these issues in new operational interventions, or to use it to revamp existing ones. Naturally, these interventions, once developed and implemented, should periodically be evaluated with sound methodologies so that they can continually be improved on the basis of solid empirical data.
Human Factors in the Motor Carrier Industry in Canada 231
As seen in phase 2, carriers have a central role to play with regards to interventions aimed at mitigating decision errors. There is therefore a need to support the industry in this respect. Given this context, the development of scientifically sound and validated safety programs that can be made available to the industry and adopted by carriers on a voluntary basis appears to be a legitimate option for consideration. The development of safety and business cases should also be conducted in order to stimulate the adoption of these programs. Such an approach is currently being developed under the NAFMP, and initial evaluations suggest that the model is both feasible and effective. Providing the industry with incentives for the use of various safety technologies (fatigue detection, on-board monitoring, crash avoidance systems) is also a strategy to consider. As shown in phase 1, risky driving has traditionally been addressed under different approaches in the fields of risk and traffic psychology. These different approaches bring complementary understandings of these issues and underline the use of various levers for behavior modification. These central themes were discussed in phase 1 and specific recommendations were made concerning the use of each approach to address the problem of risky driving in the motor carrier industry. After considering the information gathered in phase 2 with regards to the situation in Canada, these observations stand and most are being reinforced. The first exercise is therefore to articulate what could be done to address CMV drivers’ decision errors in light of each one of these theoretical approaches to risky driving. The first suggested options are therefore theory driven and observations concerning more traditional means of interventions are addressed subsequently. Note that the choice was made here, as in phase 1, to systematically specify the opportunities brought forward by each angles of analysis, which may generate some redundancy. Table 33 however simplifies the content of the section by presenting a clear high-level listing of what is ultimately suggested. 4.2.1 Options based on the Problem Behavior Theory (DE1a, DE1b). Interestingly, nowhere in the data collected in phase 2 did the notion of CMV driver health and wellness come up. Given the interrelationships between risk-taking and health-risk behaviors and given the documented significant prevalence of these problems among this population, it is recommended that the PBT be used to investigate these issues further and to develop a program to promote a healthy lifestyle targeted specifically at this population. As per the theory, the adoption of a health-enhancing lifestyle should decrease the frequency of risky-driving behaviors. Such a program would involve specifying the range of health-risk and risky-driving behaviors among CMV drivers in Canada and conducting an examination of their variations in occurrence while looking closely at personal and contextual variables (risk and protective factors) as well as at the dynamics of their interactions. This data would provide the basic information for the creation of a program aimed at promoting a healthy lifestyle that would positively impact on CMV drivers’ health as well as their safety on the roads. This scientifically sound intervention – call it a health and wellness program - could then be made available to the industry.
Human Factors in the Motor Carrier Industry in Canada 232
4.2.2 Options based on the Theory of Planned Behavior (DE2, DE3, DE4, DE5) As discussed in phase 1, the TPB has important implications for the evaluation of the determinants of risky driving and for the development of tailored interventions to alter drivers’ behavioral intentions. The TPB in fact generates various leads regarding the development or the revamping of safety interventions. These applications cut across several domains, which are regrouped in the following statements:
• It is suggested to use the TPB to evaluate the determinants of various risky driving behaviors for CMV drivers in Canada (attitudes, subjective norms, perceived behavioral control - as well as underlying behavioral, normative and control beliefs). Once we have a better understanding of what motivates risky-driving amongst the different sectors of the industry, scientifically sound interventions to alter behavioral intentions could be developed and evaluated.
� This investigation should be conducted amongst different samples, from
different sectors of the industry (long haul, short haul, bus drivers, etc.); � It would generate important data that would inform the development or the
revamping of various intervention strategies such as driver testing, entry-level training, driver improvement/rehabilitation programs, awareness campaigns, incentive programs, safety management programs, cultural change initiatives, applied behavior analysis, etc;
� Since there were already suggestions made to use the TPB to investigate the determinants of driver decision to continue driving while fatigued as well as to use distractors while driving, these two aspects could be merged with this study;
� It is also suggested to use this opportunity to investigate the attitudinal determinants of risky driving as they relate to the two most powerful personality predictors: sensation seeking and aggressive driving tendencies. Overall this simply involves adding two psychometric instruments in the test battery (the implications of this addition to the study will be underlined in the upcoming observations regarding personality dimensions).
• It is further suggested to include the TBP in a test battery that could be used (1)
by training schools at entry level, to orient trainees towards specific “training clinics” targeted at particular determinants of risky driving as defined in the theory, and/or (2) by carriers in the context of driver improvement programs, to orient drivers with safety performance issues towards such specific “training clinics”, and/or (3) in the context of a government-based intervention scheme such as the one Quebec is currently putting in place, where drivers who reach specific thresholds in terms of safety performance would be assessed and oriented within an algorithm of tailored interventions corresponding to their profile and to the specific meaning of risky driving according to their particular psychological makeup.
Human Factors in the Motor Carrier Industry in Canada 233
� An option at entry level would be to use the data from the above-mentioned general study and to transmit specific training material regarding the various determinants of risky driving to all drivers preparing for the entry-level examination, without assessing them per se, at this early stage;
� An in-depth driver assessment battery is however very relevant for driver improvement programs and should be implemented.
• It is suggested to use the TPB in an effort to develop new approaches or to
revamp existing driver-oriented interventions to address risky driving behaviors. As mentioned, this work could have implications for a large variety of interventions, especially large-scale awareness campaigns, driver training, driver improvement programs as well as interventions aimed at improving the carrier safety culture. Below are specific leads derived from phase 1:
� The objective is to develop the means to change what can be changed in
the high-risk driver’s behavior production system; � While this still needs to be investigated in depth, the literature points to the
fact that the TPB’s underlying set of beliefs (behavioral, normative, control) are likely to be legitimate targets to alter behavioral intentions;
� Issue relevant thinking and central route persuasion in an interactive classroom format whereby the “teacher” shares important characteristics or similarities with the peer group has emerged as a strong lead that should be followed;
� Targeting normative beliefs with training content that depicts positive safe behaviors as the norm and risky-driving as marginal with clear links with crash risk is recommended;
� Enabling drivers to gain more control and responsibility over the management of their activities (driver empowerment) is also recommended. This can be done by working both on drivers’ perceptions of behavioral control as well as on their objective working conditions in the context of safety culture improvement;
� The issues of social contracts and implementation intentions between drivers and carriers also hold promise and should be investigated further.
4.2.3 Options based on the personality approach (DE2, DE3, DE4, DE5) As mentioned in phase 1, personality is at the origin of a complex chain of behavioral production factors. Although it is distally related to actual safety performance, it nevertheless has a central role to play since it defines the meaning or utility of risky driving for individuals who share specific personality dimensions. While personality cannot be changed, it associates with elements that can (attitudes, beliefs, subjective norms, risk perception, etc.) and it is mainly through these associations that it generates risky driving.
Human Factors in the Motor Carrier Industry in Canada 234
Therefore, since personality outlines different subgroups of risky drivers, it is important to address this issue by (1) assessing these dimensions, and (2) developing tailored interventions aimed at changing what can be changed for these individuals. The implications of the personality approach therefore mainly relate to driver assessment, driver training and driver improvement programs. 4.2.3.1 Assessment
• Personality dimensions (mainly sensation seeking and aggression – aggressive driving measures) should be included in a driver assessment test battery.
� As discussed in phase 1, it appears more appropriate, scientifically
speaking, to use these measures in the context of driver improvement programs rather than in decision-making for hiring or licensing purposes;
� The rule of thumb for driver assessment with regards to risky-driving is that it should be multidimensional, including personality dimensions (sensation seeking, aggression/social deviance, type A, etc.) attitudes (using TPB and PBT frameworks), risk-perception (computerized hazard perception testing) and actual driving style or driving data (on-board monitoring data, vehicle parameters, driver records, driving simulators, etc.).
� It is therefore suggested that such a comprehensive test battery be developed and validated;
� Given ongoing intense activity in the field of driver assessment, conducting an updated review of variables and tools is relevant;
� In this respect, the results of the upcoming CTBSSP synthesis report on driver selection tests and measurement - currently being drafted by Knipling et al. - will be of great value, and should be factored-in.
4.2.3.2 Behavior modification The objective is to change what can be changed in the factors that interact with personality dimensions to produce risky driving behaviors. Central to these factors are the psychological determinants identified under the TPB. Therefore, once the attitudes, subjective norms, perceived behavioral control factors (direct measures), as well as their underlying sets of belief (indirect measures), are assessed for both sensation seekers and aggressive drivers (as suggested above), the observations concerning the development of tailored interventions to change behavioral intentions will be also applicable here, but adapted to these specific personality subtypes. In other words, there is a need to develop means to alter the attitudes, beliefs, subjective norms, risk perception, etc., of sensation seekers and aggressive drivers. This mainly has implications for driver training and driver improvement programs. While further R&D is needed in this respect, the following leads were identified in phase 1 and are put forth as a starting point for this investigation:
Human Factors in the Motor Carrier Industry in Canada 235
4.2.3.3 With regards to sensation seeking:
• It is suggested to develop material aimed at convincing sensation seekers that they should indulge in thrill seeking activities in contexts that do not threaten their own safety as well as the safety of others, such as controlled recreational activities and sports.
� Large-scale prevention campaigns could be used to promote this
information as well as positive values and beliefs about social responsibility and respect for lives and property of others;
� To be effective, the form and content of the message would need to be calibrated to the characteristics of sensation seekers and transmitted by someone from the peer group;
� It is not a matter of condemning sensation seeking as such, but rather of attempting to channel it through other activities that are designed for this purpose.
• It is suggested to include notions about sensation seeking in CMV driver training
material. � The objective is to really make drivers understand the basis of this
concept and how it can impact on their behaviors, their health and that of others. It would also be important to present CMV drivers with safe alternatives to achieve the physiological need for thrills;
� This material could be developed and made available to the driver training community as well as to motor carriers for both entry-level training and driver improvement programs.
4.2.3.4 With regards to aggressive driving:
• It is suggested to develop material aimed at educating drivers about the mechanisms that fuel aggressive driving behaviors while presenting them with coping strategies to deal with aggressive driving situations.
� As for sensation seeking, large-scale prevention campaigns could be used
to promote this information as well as positive values and beliefs about social responsibility and respect for lives of others.
• It is suggested to include notions about aggressive driving in training material.
� Authors emphasize that drivers need to understand, or become more
cognizant of the impacts of their personality and lifestyle on their driving; � Material to make them understand these issues as well as coping strategies
to deal with those influences should be developed and transmitted to CMV drivers by appropriate means (such as classroom interventions in driver improvement programs);

Human Factors in the Motor Carrier Industry in Canada 236
� It is also suggested to include material that would make drivers understand the subjective nature of their interpretations of the behaviors of others as well as the role that these interpretations play in fuelling real, objective and dangerous driving behaviors.
• STEP programs targeting aggressive driving as well as dangerous CMV/LV
driver interactions should be encouraged, reinforced and resourced. • Tailored programs to treat chronic aggressive CMV drivers should be developed,
validated and adopted.
� These programs should be based on cognitive-behavioral notions and aimed at teaching drivers how to cope with other aggressive drivers as well as with their own aggressive driving responses in the presence of frustration, impatience and irritation.
• Large-scale campaign focussed on defensive, safe and courteous driving should
be developed, implemented and evaluated. 4.2.4 Options based on the notion of risk perception (DE2, DE3, DE4, DE5)
• It is suggested that a study be conducted to investigate hazard perception skills amongst CMV drivers and how it relates to actual risky driving behaviors.
� This study should include the notions of confidence and over-confidence; � It could be merged with the above-mentioned (DE2) study on the
determinants of risky driving.
• Hazard-perception skills should be part of driver assessment test batteries, possibly using interactive computer-based driving tasks and/or driving simulators;
• Hazard perception training programs should be included in both entry-level
training and driver improvement programs. The previous sections presented theory driven options to address risky driving. The following observations will use another angle, which is to focus on more traditional means of addressing decision errors in the motor carrier industry, including training, safety culture, incentive programs, crash avoidance technologies, driver behavior monitoring as well as programs targeting CMV/LV interactions. 4.2.5 Training, testing, licensing (DE5) Driver training is clearly identified in the literature as a central piece in driver-based interventions to address risky driving. Phase 2 has shown that carriers, industry associations as well as government stakeholders identify training as one of the main interventions for decision errors.

Human Factors in the Motor Carrier Industry in Canada 237
There was however no information provided as to the content of training curricula or training methods. In this respect, the ongoing project lead by the CTHRC (see phase 1) will provide important results with regards to the efficiency of training content and methods. It is therefore recommended that these results be factored into our decision making process when they become available. Commercial driver training in Canada is not mandatory and drivers are in fact trained with a view to succeed in the licensing/examination processes which, according to various observers, may not be sufficient to ensure that they will become safe drivers. As discussed in phase 1, from a safety perspective it is paramount that efficient training components address the main crash causation factors: fatigue, distraction and risky driving. It is also of prime importance that these issues be covered in testing and licensing processes, since the content of testing somewhat dictates the content of training curricula. Finally, training elements about these causation factors should be central to driver improvement programs, either from a carrier or a government perspective. With regards to the applicability of training to address risky driving per se, the following points should be taken in consideration, as discussed in phase 1:
• Based on a significant body of studies on the predictors of safety performance,
different authors underline that there is a need to address driving style, rather than focussing only on driving skills in driver education. Therefore, the questions are:
� How can driver training influence the way drivers choose to drive? � In other words, how can driver education be used to target the predictors
of risky driving (personality, attitudes, subjective norms, lifestyle, risk perception, etc.)?
• A sound strategy to answer these questions would be to use the results of the
study on the determinants of risky driving (DE2) to identify the factors that predict behavioral intention, that can be changed, and that could be targeted trough driver education (attitudes, beliefs, risk perception, etc.).
• In terms of how these factors could be changed, a preliminary review of literature
identified the leads that were already mentioned in the TPB section. Briefly:
� Training elements should be developed to alter drivers’ behavioural, normative and control beliefs with regards to specific high-risk driving behaviors;
� Training should involve active issue-relevant thinking from participants. A classroom format ideally conducted by an individual that shares significant characteristics with the peer groups (such as a former truck or bus driver) would be indicated;
� Amongst other things, such sessions should target normative beliefs by depicting a reality where positive safe behaviors are the norm and where risky-driving is marginal and clearly linked with increased crash risk.

Human Factors in the Motor Carrier Industry in Canada 238
� It is however recommended that a comprehensive review of attitudinal change models be conducted, with a special focus on their successful applications within various public health and health promotion domains.
• With regards to personality, as mentioned earlier, an option is to include high-
level information that would make drivers really understand how sensation seeking and aggression impacts on driving behaviors, while giving them precise alternatives as to how they should cope with these personal influences.
� It is suggested to use the results of the study on the determinants of risky
driving (DE2) - and more specifically with regards to personality dimensions - to identify the attitudinal factors and the beliefs associated with sensation seeking and aggressive driving that could be changed and therefore should be targeted through driver education.
• In terms of attitude changes, as per the theory of problem behaviors, driver
training could also be used to promote a positive health-enhancing lifestyle that would positively impact on CMV drivers’ health as well as their safety on the roads.
• Lastly, and as mentioned above, driver training should include hazard perception
skills. 4.2.6 Options based on the notion of safety culture (DE6) The CMV safety culture has been identified as a critical issue with regards to decision errors in phase 1. It was shown that the culture of an enterprise or group (carrier) has a direct effect on individuals’ beliefs, attitudes and safety motivations. Since these concepts have been identified as the main predictors of risky driving, programs to implement a positive safety culture - or to improve the existing culture of a company - are identified as legitimate scientifically sound interventions for risky driving behaviors. Phase 2 data indicate that up to 71 % of carriers report the use of safety programs, or some form of safety management systems. However, as reviewed by Sypher and Tardif (2006), there is a wide variety of programs used in the industry - most of which have never been evaluated - and there are very few management system alternatives for smaller carriers, who represent a significant portion of heavy vehicles on Canadian roads. As reviewed in phase 1, the Safety Management System (SMS) approach, widely used throughout the world to manage safety risks, particularly in transport operations, represents a strong strategy to improve carriers’ safety culture and to impact on numerous predictors of risky driving at the individual level. Furthermore, as shown in the Sypher and Tardif (2006) report and as discussed in phase 1, elements of SMS can be adapted to carriers of any size, including owner operators.
Human Factors in the Motor Carrier Industry in Canada 239
• It is suggested that a state-of-the-art SMS especially crafted for the motor carrier industry in Canada be developed and made available to the industry on a voluntary basis;
• This program should be complemented by safety and business cases that would stimulate buy-in from the industry;
• The SMS should be adapted to carriers of various sizes with tools made available for the whole spectrum of the truck and bus industry in Canada.
4.2.7 Options based on Applied Behavior Analysis principles (DE7) Incentive programs were identified as scientifically valid interventions to address risky driving behaviors. As per their impacts on motivation, incentive programs represent a strong strategy to change drivers desire to be safe, which is a central factor in risk taking behaviors. The trucking and bus industry can use incentive programs to its advantage in terms of increased safety, enhanced profitability, better company morale, greater productivity, reduction in personnel turnover, etc. These improvements can be achieved either by developing new incentive programs or by analysing and revamping existing ones on the basis of precise scientific knowledge relative to behavior modification. Even though there is little scientific literature on the use of incentive programs within the bus and trucking industry, it appears that they are widely used, mostly in a decentralized, rather intuitive carrier-specific mode. This is validated by the fact that 71 % of carriers in phase 2 acknowledge the use of some sort of safety incentives. However, as stated in phase 1, in the absence of comprehensive scientific guidelines, it is likely that some of these programs may not reap the desired results and may even bring about unintended negative impacts. This is also echoed in phase 2, where carriers have asked for clear scientific guidelines for the implementation of incentive programs. Note that this request from the industry is also central in the results of Barton et al. (1998) who recommended that scientifically sound safety incentive programs be made available to the industry.
• Given the complexity and the subtleties of such a behavior modification approach, it is suggested that a state-of-the-art incentive program, based on cutting-edge scientific knowledge emanating from the ABA (such as the use of cues, prompts, feedback, commitments and rewards), be developed and thoroughly evaluated;
• Once developed and proven to be efficient, this program could be presented to the industry, either to be adopted on a voluntary basis or to serve as a template, or a general set of guidelines, that could be used by carriers to develop their own programs or to test the scientific soundness of existing ones;
• Such a program should be accompanied by strong safety and business cases that would be used in order to increase the utilization of the approach within the bus and trucking industry.
Human Factors in the Motor Carrier Industry in Canada 240
4.2.8 Options based on the notion of safety technologies (F12, F13, DE8) 4.2.8.1 Crash avoidance systems (F12, F13) It was made clear in phase 1 that crash avoidance systems such as FCWS, LDWS and RSC should be part of a comprehensive package to mitigate driver errors. As disclosed in phase 2, stakeholders at every level expressed the need for these technologies. The tools however remain largely absent from fleets, with less than 10% of carriers currently reporting their use. The main reasons for this appear to be related to the costs of these devices as well as their availability to the industry at large. This is why carriers are asking for incentives such as tax rebates to facilitate their inclusion in operations. As detailed in phase 1, drivers’ reactions to these systems should however be investigated further, focussing on notions such as behavioral adaptation and driver acceptance or trust in the systems. In other words, even though the technologies should be recommended, it is probable that they should be associated with some driver-based (active) interventions in order to prevent the likelihood of adverse effects. The nature of these effects and of any associated driver-based interventions that would prevent them from occurring is what needs to be investigated further. In this respect, the results of the Integrated Vehicle-Based Safety Systems (IVBSS) research program recently completed in the US bring valuable information that will need to be factored into further examinations/discussions of this issue. Overall, given the potential for safety benefits associated with crash avoidance technologies:
• It is suggested that stakeholders recognize the potential of crash avoidance technologies and engage in a policy development process that could set the stage for their large-scale inclusion in heavy vehicle fleets;
• This process should include looking at incentives that would motivate the industry to adopt these technologies;
• This process should also include studying behavioral adaptation and driver trust issues and how these phenomena should be mitigated.
4.2.8.2 Driving behavior management system (DE8) As discussed in phase 1, the use of DBMS systems that record various parameters of driver behavior when a critical safety situation occurs is a good opportunity to implement interventions to coach drivers with regards to their safety performance. As mentioned in the context of driver assessment and driver improvement programs, the recorded information can also serve as a primary indicator of driving style and could be coupled with other psychometric measures that would characterize the meaning, or utility of risky-driving for specific individuals. Drivers could then be directed through an algorithm that would contain different intervention options according to different types of risky-driving, or different types of risky drivers. Furthermore, as indicated in phase 2, it is important to note that carriers are indeed calling for low-cost driver behavior monitoring solutions. Therefore:
Human Factors in the Motor Carrier Industry in Canada 241
• It is suggested that stakeholders recognize the potential of DBMS and engage in a policy development process that could set the stage for a large scale inclusion of these technologies;
• DBMS could be used in the context of driver assessment processes and driver improvement programs, both from a carrier or a government perspective.
4.2.9 Options to address interactions between light and heavy vehicles (DE9) Interactions between light and heavy vehicles have been identified as a central crash causation factor. Comments received by carriers clearly underline the fact that light vehicle drivers often do not understand the reality of CMV driving and that interventions should be implemented to address these issues. Two main programs were reviewed in phase 1: TACT and OSD. This assessment led to the following observations:
• The TACT program appears to represent an appropriate and scientifically valid approach to address LDV/CMV interactions.
� As stated, the implementation of theory-driven attitude assessment and attitude modification approaches could improve the awareness raising/education component of the intervention, but this remains to be determined.
• While the TACT approach is well documented and evaluated, less material is available to promote the efficiency of OSD. However, since both programs have important similarities, and given the massive support that CVSA gets from government and industry players, OSD should also be supported.
� As suggested, it would be relevant to document the intervention and its underlying behavior modification principles and to have it scientifically evaluated on a periodical basis.
• The idea that both programs should take a blitz format could however be revisited. As discussed in phase 1, numerous alternatives are possible. It could be a good thing to analyse these programs and their delivery on the basis of solid behavior modification principles and to assess how they could be improved in order to adhere to these principles.
� For example, an option could be to keep widespread publicity active for longer periods of time (or throughout the year), while concentrating enforcement in blitzes that are supported by the publicity, but without being openly situated in time and space.
4.1.10 Options for government-based initiatives (DE10, DE11) As discussed in phase 2, NSC standards 7, 12, 14 and 15 all relate to the core of safety programs for motor carriers in Canada. When reflecting on the efficiency of this
Human Factors in the Motor Carrier Industry in Canada 242
framework with regards to decision errors, the important issues to consider are (1) the ability of these programs to identify high-risk drivers in a short timeframe and (2) the type of interventions that are implemented to address driver errors.
• In light of the work being conducted in the U.S. with regards to CSA-2010, it is suggested that a review be conducted to assess the ability of the NSC framework to identify high-risk drivers and to flag them for interventions.
With regards to the interventions per se, it appears that the traditional carrier-based paradigm is set to stay. In Canada - like in the U.S. - it is mainly up to carriers to come up with driver improvement initiatives aimed at high-risk drivers. Another alternative however could be to develop in parallel an approach like the one currently being implemented in Quebec. With the Politique d’évaluation des conducteurs de véhicules lourds, high-risk drivers meeting various negative safety performance thresholds will need to meet government’s Commission des transports in order to be evaluated. Remedial interventions will then be prescribed on the basis of the results of this evaluation. As mentioned in phase 2, this framework appears like an excellent opportunity to apply scientifically sound driver-oriented interventions. Quebec notes that at least 100 drivers annually will follow this process. Therefore:
• It is suggested to explore with Quebec the possibility of using the instalment of this new regulatory framework to (1) study the profile of high-risk drivers and (2) develop and validate new scientifically sound interventions.
� The profile of high-risk drivers could be assessed and compared with drivers from another program that Quebec will put in place in 2011 (Programme d’excellence des conducteurs de véhicules lourds), aimed at recognizing drivers excellence. This would help to validate the differences between excellent and high-risk drivers;
� This profile could later be used to proactively identify potential high-risk drivers and intervene with preventative measures before they start to generate negative safety outcomes;
� In terms of interventions, working with Quebec in this context could also
allow exploring various strategies and provide opportunities for evaluative studies aimed at assessing their effectiveness in a genuine operational setting.
Note that these options for government-based driver-oriented interventions are not intended to replace the carrier-based framework currently in place, but rather to complement and potentially improve it. Such an approach could have the advantage of (1) ensuring a greater uniformity in driver-based interventions, (2) ensuring that driver-based interventions are scientifically sound and (3) ensuring that these interventions are monitored, and evaluated.
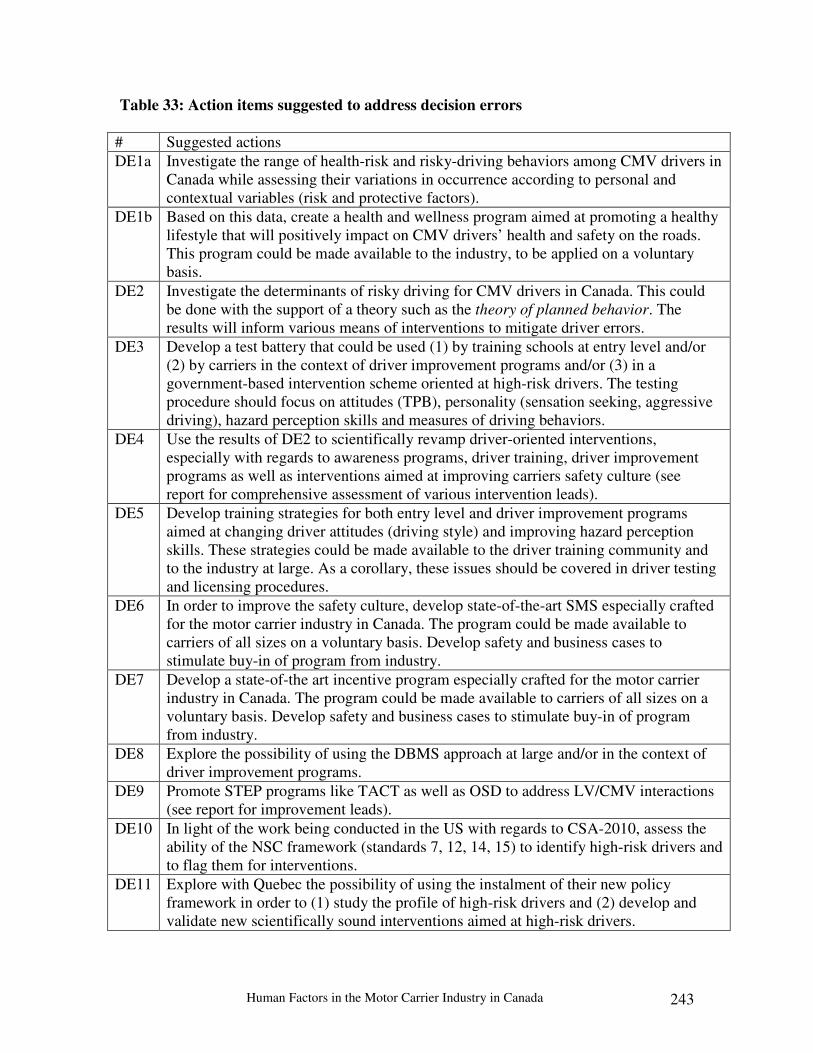
Human Factors in the Motor Carrier Industry in Canada 243
Table 33: Action items suggested to address decision errors
# Suggested actions DE1a Investigate the range of health-risk and risky-driving behaviors among CMV drivers in
Canada while assessing their variations in occurrence according to personal and contextual variables (risk and protective factors).
DE1b Based on this data, create a health and wellness program aimed at promoting a healthy lifestyle that will positively impact on CMV drivers’ health and safety on the roads. This program could be made available to the industry, to be applied on a voluntary basis.
DE2 Investigate the determinants of risky driving for CMV drivers in Canada. This could be done with the support of a theory such as the theory of planned behavior. The results will inform various means of interventions to mitigate driver errors.
DE3 Develop a test battery that could be used (1) by training schools at entry level and/or (2) by carriers in the context of driver improvement programs and/or (3) in a government-based intervention scheme oriented at high-risk drivers. The testing procedure should focus on attitudes (TPB), personality (sensation seeking, aggressive driving), hazard perception skills and measures of driving behaviors.
DE4 Use the results of DE2 to scientifically revamp driver-oriented interventions, especially with regards to awareness programs, driver training, driver improvement programs as well as interventions aimed at improving carriers safety culture (see report for comprehensive assessment of various intervention leads).
DE5 Develop training strategies for both entry level and driver improvement programs aimed at changing driver attitudes (driving style) and improving hazard perception skills. These strategies could be made available to the driver training community and to the industry at large. As a corollary, these issues should be covered in driver testing and licensing procedures.
DE6 In order to improve the safety culture, develop state-of-the-art SMS especially crafted for the motor carrier industry in Canada. The program could be made available to carriers of all sizes on a voluntary basis. Develop safety and business cases to stimulate buy-in of program from industry.
DE7 Develop a state-of-the art incentive program especially crafted for the motor carrier industry in Canada. The program could be made available to carriers of all sizes on a voluntary basis. Develop safety and business cases to stimulate buy-in of program from industry.
DE8 Explore the possibility of using the DBMS approach at large and/or in the context of driver improvement programs.
DE9 Promote STEP programs like TACT as well as OSD to address LV/CMV interactions (see report for improvement leads).
DE10 In light of the work being conducted in the US with regards to CSA-2010, assess the ability of the NSC framework (standards 7, 12, 14, 15) to identify high-risk drivers and to flag them for interventions.
DE11 Explore with Quebec the possibility of using the instalment of their new policy framework in order to (1) study the profile of high-risk drivers and (2) develop and validate new scientifically sound interventions aimed at high-risk drivers.

Human Factors in the Motor Carrier Industry in Canada 244

Human Factors in the Motor Carrier Industry in Canada 245
References
Åberg, L. (1999). The role of attitudes in decisions to violate traffic regulations.
Presented at the European Conference of Transport Psychology in Angers, France, June 1999.
Åberg, L., & Rimmö, P.-A. (1998). Dimensions of aberrant driver behaviors. Ergonomics, 41, 39-56.
Abrams, C., Schultz, T., & Wylie, C.D. (1997). Commercial Motor Vehicle Driver Fatigue, Alertness, and Countermeasures Survey. (Report No. FHWA-MC-99-067), Federal Highway Administration, Washington, DC.
Adams-Guppy, J., & Guppy, A. (2003). Truck driver fatigue risk assessment and management: a multinational survey. Ergonomics, 46, 763-779.
Ajzen, I. (1988). Attitudes, personality, and behavior. Milton-Keynes, England: Open University Press.
Ajzen, I. (1991). The theory of planned behavior. Organizational Behavior and Human Decision Processes, 50, 179–211.
Ajzen, I., & Fishbein, M. (1980). Understanding attitudes and predicted social behavior. Englewood Cliffs, NJ: Prentice-Hall.
Akamatsu, M. (2008). Japanese principles, codes, guidelines, and checklists for designing in-vehicle HMI to limit distraction. In: M.A., Regan et al. (Eds.), Driver
distraction theory, effects, and mitigation. Guilford Press. American Thoracic Society, (1994). Sleep apnea, sleepiness, and driving risk. American
Journal of Respiratory and Critical Care Medicine, 150, 1463-1473. Arboleda, A., Morrow, P., Crum, M., & Shelley, M. (2003). Management practices as
antecedents of safety culture within the trucking industry: Similarities and differences by hierarchical level. Journal of Safety Research, 34, 189−197.
Arnedt J.T, Wilde G.J., Munt P.W., & MacLean A.W. (2001). How do prolonged wakefulness and alcohol compare in the decrements they produce on a simulated driving task? Accident Analysis and Prevention, 33, 337–344.
Arnett, J.J (1990). Drunk driving, sensation seeking, and egocentrism among adolescents. Personality and Individual Differences, 11, 541–546.
Arnett, J.J (1991). Still crazy after all these years: Reckless behavior among young adults aged 23-27. Personality and Individual Differences, 12, 1305–1313.
Arnett, J.J. (1992). Reckless driving in adolescence: A developmental perspective. Developmental Review, 12, 339–373.
Arnett, J.J. (1996). Sensation seeking, aggressiveness, and adolescent reckless behavior. Personality and Individual Differences, 20, 693–702.
Assum, T. (1997). Attitudes and road accident risk. Accident Analysis and Prevention, 29, 153–159.
Atchley, P., & Dressel, J. (2004). Conversation limits the functional field of view. Human Factors, 46(4), 664-673.
ATRI (1998). A technical analysis of driver training impacts on safety. Arlington, VA. (http://www.atri-online.org/research/results/driver_training_impacts_on_safety2.pdf).
Human Factors in the Motor Carrier Industry in Canada 246
Balkin, T. (2004). The heart of the matter: management of performance in the operational environment. CARRS-Q Workshop on Monitoring Hypovigilance in Monotonous Conditions, held in Brisbane, Australia.
Balkin, T., Horrey, W.J., Graeber, R.C., Czeisler, C.A., & Dinges, D.F. (2011). The challenges and opportunities of technological approaches to fatigue management. Accident Analysis and Prevention, 43, 565, 572.
Balkin, T., Thorne, D., Sing, H., Thomas, M., Redmond, D., Wesensten, N., Williams, J., Hall, S., & Belenky, G. (2000) Effects of Sleep Schedules on Commercial Motor Vehicle Driver Performance. Walter Reed Army Institute of Research under DOT Contract DTFH61-94-Y-00090, Report No. DOT-MC-00-133.
Ball, I.L., Farnhill, D., & Wangeman, J.F. (1984). Sex and age differences in sensation seeking: Some national comparisons. British Journal of Psychology, 75, 257–267.
Barr, L., Yang, C.Y.D., Hanowski, R.J., & Olson R. (2005). An assessment of driver fatigue, distraction, and performance in a naturalistic setting. TRB Paper #05-0373.
Barr, L.C., Yang, C.Y.D., & Ranney, T.A. (2003). An exploratory analysis of truck driver distraction using naturalistic driving data. In: Proceedings of the Transportation Research Board 82nd Annual Meeting. Washington, D.C., USA.
Barton, R., Tardif, L-P., Wilde J.G.S., & Bergeron, J. (1998). Incentive Programs for enhancing truck safety and productivity?: A Canadian perspective. Prepared for Transport Canada, report # TP13256E
Baulk, S.D., Axelsson, J.S., Reyner, L.A., & Horne, J.A. (1998). Driver sleepiness: ‘‘Real world’’ validation of simulator studies. Journal of Sleep Research, 7 (Suppl. 1), 19.
Beck, K.H. (1981). Driving while under the influence of alcohol: Relationship to attitudes and beliefs in a college population. American Journal of Drug and Alcohol Abuse, 8, 377–388.
Beck, K.H., Wank, Q.M., & Mitchell, M.M. (2006). Concerns, dispositions and behaviors of aggressive drivers: What do self-identified aggressive drivers believe about traffic safety? Journal of Safety Research, 37, 150-165.
Beirness, D.J., & Simpson, H.M. (1997). Study of the profile of high-risk drivers. TP-13108. Ottawa, Ont. Transport Canada, Road Safety and Motor Vehicle Regulation. March.
Benda, H.V., & Hoyos, C.G. (1983). Estimating hazards in traffic situations. Accident Analysis and Prevention, 15, 1–10.
Bergeron, J., Thiffault, P., & Bélanger Bonneau, H. (2001). Le profil psychologique des conducteurs à haut risque. Revue de littérature préparée pour la Société de l’Assurance Automobile du Québec, le Ministère des Transports du Québec et le Fonds FCAR, projet PRUSR 99-04.
Bergeron J., Thiffault, P., & Smiley, A. (2000). Aggressive driving: definitions and assessment tools. Rapport de recherche préparé pour la Canadian Automobile Association (CAA). Versions française et anglaise disponibles.
Björklund, G.M. (2008). Driver irritation and aggressive behaviour. Accident Analysis and Prevention, 40, 1069-77.

Human Factors in the Motor Carrier Industry in Canada 247
Blank, D., & McCord, R. (1998). Design and presentation of a CD-ROM driving program (Driver-ZED). In: Proceedings of the Human Factors and Ergonomics Society 42nd Annual .Meeting (pp. 1401-1402), Santa Monica, CA: Human Factors and Ergonomics Society.
Bliersbach, G., & Dellen, R.G. (1980). Interaction conflicts and interaction patterns in traffic situations. International Review of Applied Psychology, 29, 475–489.
Blockey, P.N., & Hartley, L.R. (1995). Aberrant driving behavior : Errors and violations. Ergonomics, 38, 1759-1771.
Blomberg, R., & Cleven, A. (2006). Pilot test of Heed the Speed, a program to reduce speeds in residential neighborhoods. Washington, DC: U.S. Department of Transportation, National Highway Traffic Safety Administration (DOT HS 810 468).
Blower, D. (2005). Methodology of the large truck crash causation study. US DOT. Blows, S., Ameratunga, S., Ivers, R.Q., Lo, S.K. & Norton, R. (2005). Risky driving
habits and motor vehicle driver injury. Accident Analysis and Prevention, 37, 619-624.
Boivin, D.B. (2000). Best practices compendium of fatigue countermeasures in transport operations. Transport Canada, publication # TP 13620E.
Bol, M., & Tardif, L-P. (2006). Feasibility study concerning safety management systems for the motor carrier industry in Canada. Study conducted for Transport Canada.
Borowsky, A., Oron-Gilad, T., & Parmet, Y. (2009). Age and skill differences in classifying hazardous traffic scenes. Transportation Research Part F: Traffic Psychology and Behaviour, 12, 277–287.
Boyle, L. (2010). Examining outcomes of driver education programs. Presented at the 89th TRB annual meeting, Washington, DC.
Brock, J.F., Golembiewski, G.A., Krueger, G.P., Daecher, C., Bishop, R. & Bergoffen, G. (2005). CTBSSP Synthesis 7: Motorcoach Industry Hours of Service and Fatigue Management Techniques. Transportation Research Board of the National Academies, Washington DC.
Brock, J.F., McFann, J., Inderbitzen, R., & Bergoffen, G. (2007). CTBSSP Synthesis 13: Commercial Motor Vehicle Driver Training Curricula and Delivery Methods and Their Effectiveness. Transportation Research Board of the National Academies, Washington DC.
Brown, I.D. (1994). Driver fatigue. Human factors, 36, 298–314. Brown, I.D. (1995). Methodological issues in driver fatigue research. In L. Hartley (Ed.),
Driver impairment, driver fatigue and driving simulation (pp. 155–166). London: Taylor and Francis.
Brown, I.D., & Groeger, J.A. (1988). Risk perception and decision making during the transition between novice and experienced drivers status. Ergonomics, 31, 585–597.
Bureau of Transportation Statistics (2000). Omnibus Household Transportation Results. August 2000. US Department of Transportation, Office of Statistical Programs, Washington, DC, 20590.
Bunn, T.L., & Struttmann, T.W. (2003). Characterization of fatal occupational versus non-occupational motor vehicle collisions in Kentucky (1998–2000). Traffic Injury Prevention, 4(3), 270–275.
Human Factors in the Motor Carrier Industry in Canada 248
Bunn, T.L., Slavova, S., Struttmann, T.W., & Brwonin, S.R. (2005). Sleepiness/fatigue and distraction/inattention as factors for fatal versus nonfatal commercial motor vehicle driver injuries. Accident analysis and prevention, 37, 862-869.
Burns, P. (2009). Driver Distraction. Presented at the Groupe de travail sur la capacité de conduite affaiblie et les distractions au volant, Table Québécoise de la Sécurité Routière du Québec, Québec.
Burns, P.C., & Wilde, G.J.S. (1995). Risk-taking in male taxi drivers: Relationship among personality, observational data and driver record. Personality and Individual Differences, 18, 267-278.
Butkovic, A, & Brako, D. (2003). Generation and sex differences in sensation seeking: Results of the family study. Perceptual and Motor Skills, 97, 965-970.
Cabon, P., Bérard, R., Fer, B., Coblentz, A. (1996). Vigilance et conduite. ISIS - Urgence Pratique, 19, 55-60.
Caird, J.K., Scialfa, C.T., Ho, G., & Smiley, A. (2004). Effects of cellular telephones on driving behaviour and crash risk: results from a meta-analysis. CAA Foundation for Traffic Safety, Edmonton, AB. Campbell K.L. (1988). Evidence of fatigue and the circadian rhythm. Proceedings of
Federal Highway Administration symposium on truck and bus driver fatigue, pp. 20–38, U.S. Department of Transportation, Washington, DC.
Campbell K.L, & Belzer M.H. (2000) Hours of service regulatory evaluation analytical support; task 1: Baseline risk estimates and carrier experience. Prepared for the Federal Motor Carrier Safety Administration, Report no. UMTRI-2000-11, University of Michigan Transportation Research Institute, Ann Arbor, MI.
Caskadon, M.A., & Roth, T. (1991). Sleep restriction. In: T.H. Monk, (Ed.), Sleep, sleepiness and performance. Wiley: Chichester, p. 155-167.
Cassel, W., Ploch, T., Becker, C., Dugnus, D., Peter, H.P., von Wichert, P. (1996). Risk of traffic accidents in patients with sleep-disordered breathing: Reduction with nasal CPAP. Eur Respir J, 9, 2606–2611
Chapman, P., Roberts, K., & Underwood, G. (2000). A study of the accidents and behaviours of company car drivers. In G.B. Grayson (Ed.), Behavioural research in roadsafety X. Crowthorne: Transport Research Laboratory.
Chen, C.F. (2009). Personality, safety attitudes and risky driving behaviors – Evidence from young Taiwanese motorcyclists. Accident, Analysis and Prevention, 41, 963-968.
Chen, D.D, & Atchley, P. (2005). Effects of cell phone conversations on driver performance while driving under highway monotony. In: Proceedings of the Fifth International Driving Symposium on Human Factors in Driver Assessment, Training and Vehicle Design.
Chen, W.-H., Lin, T.-W., Su, J.-M., Lee, S.-W., Hwang, S.-L., Hsu, C.-C., & Lin, C.-Y. (2006). The effect of using in-vehicle communication system on bus drivers’ performance in car-following tasks. In: 13th World Congress on Intelligent Transport Systems, London, UK, 2006.
Clarke, D.D., Ward, P., Truman, W. (2005). Voluntary risk taking and skill deficits in young driver accidents in the UK. Accident Analysis and Prevention, 37, 523–529.
Cleaves, E. (1997). The sharpening: Improving your drivers’ knowledge and skills. Commercial Carrier Journal, November, 58–62
Human Factors in the Motor Carrier Industry in Canada 249
Clement, R., & Jonah, B.A. (1984). Field dependence, sensation seeking and driving behavior. Personality and Individual Differences, 5 , 87-93.
Cohen, J.T., & Graham, J.D. (2003). A revised economic analysis of restrictions on the use of cell phones while driving. Risk Analysis, 23,1–14.
Council, F.M., Harkey, D.L., Khattak, A.J., and Mohamedsha, Y.M. (2003). Examination of “fault”, “unsafe driving acts”, and “total harm” in car-truck collisions. Transportation Record Record, 1830, 63-71.
Craft, R. (2008). Why trucks and buses collide with cars. Presented at 2008 TRB conference.
Crum, M. R., Morrow, P. C., and Daecher, C. (2002). The influence of carrier scheduling practices on motor coach driver fatigue. In A.G. Zacharia (Ed.), Proceedings of the International Truck & Bus Safety Research & Policy Symposium at the University of Tennessee Center for Transportation Research; Knoxville, TN; April 3–5, pp. 327–340. Knoxville, TN: University of Tennessee Center for Transportation Research and National Safety Council.
Canadian Standards Association (CSA) (2000). Carrier Safety Management Systems, Standard B619-00.
Cvetkovich, G., & Earle, T. (1988). Decision making and risk taking of young drivers: Conceptual distinctions and issues. Alcohol, Drugs & Driving, 4, 9–19.
CVSA (2009a). Operation safe driver. Web document: (http://www.cvsa.org/programs/op_safe_driver.cfm).
CVSA (2009b). Press release: Operation safe driver has mixed results. Web document: (http://www.cvsa.org/news/2009_press.aspx).
Dahlen, E.R., Martin, R.C., Ragan, K., & Kuhlman, M.M. (2005). Driving anger, sensation seeking, impulsiveness, and boredom proneness in the prediction of unsafe
driving. Accident Analysis and Prevention, 37, 341–348. Dawson, D., Noy, I.Y., Härma, M., Akerstedt, T., & Belenky, G. (2011). Modelling
fatigue and the use of fatigue models in work settings. Accident Analysis and Prevention, 43, 549-564.
Dawson, D., & Reid, K. (1997). Fatigue, alcohol and performance impairment. Nature, 388, 235.
De Croon, E.M., Sluiter, J.K., Blonk, R.W.B., Boersen, J.P.J., & Frings-Dresen, M.H.W. (2004). Stressful work, psychological job strain, and turnover: A 2-year prospective cohort study of truck drivers. Journal of Applied Psychology, 89, 442-454.
DePelsmacker, P., & Janssens, W. (2007). The effect of norms, attitudes and habits on speeding behavior: Scale development and model building and estimation. Accident Analysis and Prevention, 39(1), 6–15
Deery, H.A. (1999). Hazard and risk perception among young drivers. Journal of Safety Research, 30, 225–236.
Deery, H.A., & Fildes, B.B. (1999). Young novice driver subtypes: Relationship to high-risk behavior, traffic accident record, and simulator driving performance. Human Factors, 41, 628-643.
Deffenbacher, J. L. (2009). Angry drivers: characteristics and clinical interventions. Revista Mexicana de Psicologia, 26, 5-16.
Human Factors in the Motor Carrier Industry in Canada 250
Deffenbacher, J. L., Huff, M. E., Lynch, R. S., Oetting, E. R., & Salvatore, N. (2000). Characteristics and treatment of high-anger drivers. Journal of Counseling Psychology, 47, 5-17.
Deffenbacher, J.L., Oetting, E.R., & Lynch, R.S. (1994). Development of a driving anger scale. Psychological Reports, 74, 83-91.
Delhomme, P. (1991). Comparing one’s driving with others’: Assessment of abilities and frequency of offenses. Evidence for a superior conformity of self-bias? Accident Analysis and Prevention, 23, 493–508.
Desai, A.V., & Haque, M.A. (2006). Vigilance monitoring for operator safety: A simulation study on highway driving. Journal of safety research, 37, 139-147.
Desmond, P.A., & Hancock, P.A. (2001). Active and passive fatigue states. In: P.A. Hancock, & P.A. Desmond (Eds.) Stress, workload and fatigue pp. 455-456. LEA publishers, London.
Di Milia, L. (2006). Shift work, sleepiness and long distance driving. Transportation research part F, 9, 278-285.
Di Milia, L., Smolensky, M.H., Costa, G., Howarth, H.D, Ohayon, M., & Philip, P. (2011). Demographic factors, fatigue, and driving accidents: An examination of the published literature. Accident Analysis and Prevention, 43, 516-532.
Dimmer, A.R., & Parker, D. (1999). The accidents, attitudes and behaviour of company car drivers. In G. B. Grayson (Ed.), Behavioural research in road safety IX. Crowthorne: Transport Research Laboratory.
Dinges, D.F. (1992). Probing the limits of functional capability: The effects of sleep loss on short duration tasks. In: Broughton, R., Ogilvie, R. (Eds.), Sleep, arousal and performance. Birkhauser-Boston Inc., Boston.
Dinges, D.F. (1995). An overview of sleepiness and accidents. Journal of sleep research, 4, 4–14.
Dingus, T.A., Klauer, S.G., Neale, V.L., Petersen, A., Lee, S.E., Sudweeks, J., Perez, M.A., Hankey, J., Ramsey, D., Gupta, S., Bucher, C., Doerzaph, Z.R., Jermeland, J., & Knipling, R.R. (2005). The 100 cars naturalistic driving study, Phase 2 – Results of the 100 cars field experiment. Virginia Tech Transportation Institute, Blacksburg, Virgina.
Dingus, T.A., Neale, V.L., Garness, S.A., Hanowsky, R.J., Keisler, A.S., Lee, S.E., Perez, M.A., Robinson, G.S., Belz, S.M., Casali, J.G., Pace-Schott, E.F., Stickgold, R.A. & Hobson, J.A. (2002). Impact of sleeper berth usage on driver fatigue: Draft final project report. Contract no. DTFH61-96-00068. Federal Motor Carrier Safety Administration, Washington, DC.
Donovan, D.M. (1993). Young adult drinking-driving: Behavioral and psychosocial correlates. Journal of Studies on Alcohol, 54, 600–613.
Donovan, D.M., & Marlatt, G.A. (1982). Personality subtypes among driving-while-intoxicated offenders: Relationship to drinking behavior and driving risk. Journal of Consulting and Clinical Psychology, 50, 241–249.
Donovan, D.M., Marlatt, G.A., & Salzberg, P.M. (1983). Dinking behavior, personality factors and high-risk driving: A review and theoretical formulation. Journal of studies on alcohol, 44, 395–428.
Donovan, D.M., Salzberg, P.M., Chaney, E.F., Quesser, H.R., & Marlatt, G.A. (1990). Prevention skills for alcohol-involved drivers. Alcohol, Drugs & Driving, 6, 169-188.
Human Factors in the Motor Carrier Industry in Canada 251
Donovan, D.M., Umlauf, R.L., Queisser, H.R., & Salzberg, P.M. (1986). Personality subtypes among driving-while-intoxicated offenders: Follow-up of subsequent driving records. Journal of Consulting and Clinical Psychology, 54, 563–565.
Dorn, L., & Barker, D. (2005). The effects of driver training on simulated driving performance. Accident Analysis and Prevention, 37, 63–69.
Donaldson, J. (2005). The large truck crash causation study: A lost opportunity. Final proceedings of the International Truck and Bus Safety & Security symposium, Alexandria, Virginia.
Drews, F.A., & Strayer, D.L. (2008). Cellular phones and driver distraction. In: M.A., Regan et al. (Eds.), Driver distraction theory, effects, and mitigation. Guilford Press.
Dulla, C.C., & Geller, E.S. (2003). Aggressive driving: Definition, laws and prevalence. Journal of Safety Research, 34, 559-566.
Elliot, M.A., Armitage, C.J., & Baughan, C.J. (2005). Exploring the beliefs underpinning drivers' intentions to comply with speed limits. Transportation Research Part F: Psychology and Behaviour, 8, 459-479.
Elliott, M.A., & Armitage, C.J. (2006). Effects of implementation intentions on the self-reported frequency of drivers' compliance with speed limits. Journal of Experimental Psychology: Applied, 12, 108-117.
Elliott, M. A. ,& Baughan, C. J. (2003). Adolescent road users behaviour: A survey of 11-16 year old. TRL Report 561. Crowthorne, U.K.: Transport Research Laboratory.
Elliott, M.A., & Thompson, J.A. (2010). The social cognitive determinants of offending drivers’ speeding behaviors. Accident Analysis and Prevention, 42, 1595-1605.
Ellison, P.A., Govern, J.M., Petri, H.L., & Figler, M.H. (1995). Anonymity and aggressive driving behavior: A field study. Journal of Social Behavior and Personality, 10, 265–272.
Engström, J., & Victor, T. (2008). Real-time distraction countermeasures. In: M.A., Regan et al. (Eds.), Driver distraction theory, effects, and mitigation. Guilford Press.
ESOP (2005). European Statement of Principles on the Design of Human Machine Interaction. Draft, June 2005. (http://www.europa.eu.int/information_society/programmes/esafety/index_en.htm).
Evans, G., Palsane, M. & Carrere, S. (1987). Type-A- behaviour and occupational stress: A cross cultural study of blue collar workers. Journal of Personality and Social Psychology, 52, 1002–1007.
Eysenck, H.J. (1967). The biological basis of personality. Springfield, IL: Charles C. Thomas.
Eysenck, M.W. (1988). Individual differences, arousal, and monotonous work. In J. P. Leonard (Ed.), Vigilance: Methods, models and regulation (pp.111-118). Peter Lang.
Eysenck, M.W. (1989). Individual differences in vigilance performance. In A.Coblentz (Ed.), Vigilance and performance in automatized systems/Vigilance et performance de l’homme dans les système automatisés (pp. 31-40). NATO ASI series. Series D : Behavioural and Social Sciences : vol. 49. Netherlands: Kluwer Academic Publishers.
Fairclough, S.H., & Houston, K. (2004). A metabolic measure of mental effort. Biological Psychology, 66, 177-190.
Farmer, E., & Chambers, E.G. (1939). A study on accident proneness among motor drivers. Report No. 84, HMSO. London: Industrial Health Research Board.
Human Factors in the Motor Carrier Industry in Canada 252
Farmer, A., Redman, K., Harris, T., Mahmood, A., Sadler, S., & McGuffin, P. (2001) Sensation-seeking, life events and depression: The Cardiff Depression Study. British Journal of Psychiatry, 178, 549-552.
Farrow J.A., & Brissing P. (1990). Risk for DWI: A new look at gender differences in drinking and driving influences, experiences, and attitudes among new adolescent drivers. Health Educational Quarterly, 17, 213–221.
Ferguson, S.A. (2003). Other high risk factors for young drivers: How graduated licensing does, doesn’t, or could address them. Journal of Safety Research, 34, 71–77.
Fernandes, R., Job, R.F.S., & Hatfield, J. (2007). A challenge to the assumed generalizability of prediction and countermeasures: Different factors predict different risky driving behaviors. Journal of Safety Research, 38, 59-70
Fernandez-Muniz, B., Montes-Peon, J.M., & Vazquez-Ordas, C.J. (2007). Safety culture: Analysis of the causal relationships between its key dimensions. Journal of Safety Research, 38, 627-641. Fisher, D.L., Laurie, N.E., Glaser, R., Connerney, K., Pollatsek, A., Duffy, S.A., &
Brock, J. (2002). Use of a fixed-base driving simulator to evaluate the effects of experience and PC-based risk awareness training on drivers' decisions. Human Factors, 44(2), 287–302.
Filiatrault, D.D., Vavrik, J., Kuzeljevic, B., & Cooper, P.J. (2002). The effect of rest-schedule orientation on sleep quality of commercial drivers. Traffic Injury Prevention, 3, 13–18.
Fillmore, M.T., Blackburn, J.S., & Harrison. E.L.R. (2008). Acute disinhibiting effects of alcohol as a factor in risky driving behavior. Drug and Alcohol Dependence, 97-106.
Findley, L., Smith, C., Hooper, J., Dineen, M., & Suratt, P.M. (2000). Treatment with nasal CPAP decreases automobile accidents in patients with sleep apnea. Am. J. Respir. Crit. Care Med., 161, 857-859.
Finn, P., & Bragg, B.W.E (1986). Perception of the risk of an accident by young and older drivers. Accident Analysis and Prevention, 18, 289–298.
Fishbein, M., & Middlestadt, S.E. (1989). Using the theory of reasoned action as a framework for understanding and changing AIDS-related behaviors. In: V.M. Mays et al. (Eds.), Primary prevention of AIDS: Psychological approaches pp. 61-78. New York: Plenum Press.
Fisher, D.L., Laurie, N.E., Glaser, R., Connerney, K., Pollatsek, A., Duffy, S.A., & Brock, J.J. (2002). Use of a fixed-base driving simulator to evaluate the effects of experience and PC-based risk awareness training on drivers' decisions. Human factors, 44, 287-302.
Fletcher L., Petersson , L., & Zelinsky, A. (2005). Road scene monotony detection in a fatigue management driver assistance system. 2005 IEEE Intelligent Vehicles Symposium, Las Vegas.
FMCSA, (1999). Bus driver fatigue and stress issues: Final report. Federal Highway Administration, Office of Motor Carriers, Washington D.C.
FMCSA, (2007). Deployment of on-board safety systems. Federal Motor Carrier Research Administration, US DOT. Research, technology and analysis research programs. (http://www.fmcsa.dot.gov/facts-research/systems-technology/product-guides/deployment-of-on-board-safety-systems.pdf).
Human Factors in the Motor Carrier Industry in Canada 253
FMCSA, (2009a). The bus crash causation study report to congress. Federal Motor Carrier Research Administration, US DOT. Research, technology and analysis research programs. (http://www.fmcsa.dot.gov/documents/congress-reports/Bus-Crash-Causation-Study-Report-to-Congress.pdf).
FMCSA, (2009b). Tech brief: Benefit-cost analysis of onboard safety systems. Federal Motor Carrier Research Administration, US DOT. Research, technology and analysis research programs. (http://www.fmcsa.dot.gov/facts-research/research-technology/tech/09-023-TB-Onboard-Safety-Systems-508.pdf).
Folkard, S., & Monk, T.H. (1979). Shiftwork and performance. Human factors, 21, 483-492.
Forward, S. (1997). Measuring attitudes and behavior using the theory of planned behaviour. In J. A. Rothengatter, & E. Carbonell Vaya (Eds.), Traffic and transport psychology: Theory and application. Oxford: Pergamon.
Forward, S. (2006). The intention to commit driving violations – A qualitative study. Transportation Research Part F, 9, 412-426.
Forward, S. (2009a). An assessment of what motivates road violations. Transportation Research Part F, 12, 225-234.
Forward, S. (2009b). The theory of planned behavior: The role of descriptive norm and past behavior in the prediction of drivers’ intentions to violate. Transportation Research Part F, 12, 198-207.
Foss, R. (2007). Addressing behavioral elements in traffic safety: A recommended approach. In: Improving Traffic Safety Culture in the United States; The Journey Forward. Washington, D.C., AAA Foundation for Traffic Safety.
Friswell, R, Williamson, A. (2008). Exploratory study of fatigue in light and short haul transport drivers in NSW, Australia. Accident Analysis and Prevention, 40, 410-417.
Fuller, R. (2000) The task-capability interface model of the driving process. Journal Recherche-Transports- Sécurité, 66, 47–59.
Furnham, A. & Saipe, J. (1993). Personality correlates of convicted drivers. Personality, Individual Differences, 14, 329-336.
Gander, P.H., Hartley, L., Powell, D., Cabon, P., Hitchcock, E., Mills, A., & Pokin, S. (2011). Fatigue risk management: Organizational factors at the regulatory and industry/company level. Accident Analysis and Prevention, 43, 573-590.
Gander, P.H., Marshall, N.S., James, I., & Quesne, L.L. (2006). Investigating driver fatigue in truck crashes: Trial of a systematic methodology. Transportation research part F, 9, 65-76.
Galovski, T.E., Malta, L.S., & Blanchard, E.B. (2006a). Aggressive driving treatment manual. Road rage: Assessment and treatment of the angry, aggressive driver. Galovski, T.E., Malta, L.S., & Blanchard, E.B.; pp.171-213, Washington DC: Amrican Psychological Association.
Galovski, T.E., Malta, L.S., & Blanchard, E.B. (2006b). Aggressive driving treatment manual. Road rage: Assessment and treatment of the andry, aggressive driver. Galovski, T.E., Malta, L.S., & Blanchard, E.B.; pp.153-170, Washington DC: Amrican Psychological Association.
Gander, P.H, Marshall, N.S., Bolger, W., & Girling, I. (2005). An evaluation of driver training as a fatigue countermeasure. Transportation Research Part F, 8, 47-58.
Human Factors in the Motor Carrier Industry in Canada 254
Geller, E.S. (1990). Preventing injuries and death from vehicle crashes: Encouraging belts and discouraging booze. Social Influence Processes and Prevention, 1, 249-277.
Geller, E.S., Rudd, J.R., Kalsher, M.J., Streff, F.M., & Lehman. G.R. (1987). Employer-based programs to motivate safety belt use: A review of short-term and long-term effects. Journal of Safety Research, 18, 1-17.
George, C.F.P. (2001). Reduction in motor vehicle collisions following treatment of sleep apnoea with CPAP. Thorax, 56, 508.
George, C.F.P., & Smiley, A. (1999). Sleep apnea and automobile crashes. Sleep, 22, 790-795
Gielen A.C, & Sleet D.A. (2003). Application of behavior-change theories and methods to injury prevention. Epidemiol Review,25, 65-76.
Glendon, A.I., Dorn, L., Matthews, G., Gulian, E., Davies, D.R., & Debney, L.M. (1993). Reliability of the driving behaviour inventory. Ergonomics, 36, 719–726.
Goodman, M.J., Bents, F.D., Tijerena, L., Wierwille, W., Lerner, N., & Benel, D. (1997). An investigation of the safety implications of wireless communications in vehicles. Washington, DC: U.S. Department of Transportation, National Highway Traffic Safety Administration (DOT HS 806-635).
Gordon, C.P. (2008). Crash studies of driver distraction. In: M.A., Regan et al. (Eds.), Driver distraction theory, effects, and mitigation. Guilford Press.
Gershon, P., Ronen, A., Oron-Gilad, T., & Shinar, D. (2009). The effects of an interactive cognitive task (ICT) in suppressing fatigue symptoms in driving. Transportation Research Part F, 12, 21-28.
Go, E., Morton, A., Famewo, J.,& Angel, H. (2006). Final report: Evaluation of industry safety principles for in-vehicle information and communication systems. Report prepared for Transport Canada (Contract No. T8080-040240) Humansystems Inc, 2006.
Gras, M.E., Cunill, M., Sullman, J.M., Planes, M., & Aymerich, M. (2004). Self-reported aberrant driving behaviour in a sample of Spanish drivers. Paper presented at the International Conference on Traffic and Transport Psychology, Nottingham, UK.
Green, P. (2008). Driver interface safety and usability standards: an overview. In: M.A., Regan et al. (Eds.), Driver distraction theory, effects, and mitigation. Guilford Press.
Grube, J.W., & Voas, R.B. (1996). Predicting underage drinking and driving behaviors. Addictions, 91, 1843–1857.
Gulian, E., Matthews, G., Glendon, A.I., Davies, D.R., & Debney, L.M. (1989). Dimensions of driver stress. Ergonomics, 32, 585–602.
Gurubhagavatula, I., Nkwuo, J.E., Maislin, G., & Pack, A.I. (2008). Estimated cost of crashes in commercial drivers supports screening and treatment of obstructive sleep apnea. Accident Analysis and Prevention, 40, 104-115.
Hack, M., Davies, R.J., Mullins, R., Choi, S.J., Ramdassigh-Dow, S., Jenkinson, C., & Stradling, J.R. (2000). Randomised prospective parallel trial of therapeutic versus subtherapeutic nasal continuous positive airway pressure on simulated steering performance in patients with obstructive sleep apnoea. Thorax, 55, 224–231.
Hancock, P.A., Warm, J.S. (1989). A dynamic model of stress and sustained attention. Human Factors, 31, 519–537.
Human Factors in the Motor Carrier Industry in Canada 255
Hanowski, R.J., Hickman, J.S., Wierwille, W.A., & Keisler, A. (2007). A descriptive analysis of light vehicle-heavy vehicle interactions using in situ driving data. Accident Analysis and Prevention, 39, 169, 179.
Hanowski, R.J., Keisler, A.S., and Wierwille, W.W. (2000). Study of light vehicle-heavy vehicle interaction. FMCSA Final Report, Contract DTFH61-96-C-00105.
Hanowski R.J., Olson R.J., & Bocanegra, J. (2009). Driver distraction in commercial vehicle operations (webinar, June 3 2009). Washington, DC: Federal Motor Carriers Safety Administration.
Hanowski, R.J., Perez, M.A., & Dingus, T. (2005). Driver distraction in long-haul truck drivers. Transportation Research Part F, 8, 441-458.
Hanowski, R.J., Wierwille, W.W., Gelaty, A.W., Early, N., and Dingus, T.A. (1998). Impact of local/short haul operations on driver fatigue. Task 1: Focus group: summary and analysis. (Report No. FHWA-MC-98-029), Federal Highway Administration, Washington, DC.
Harano, R.M., & Hubert, D.E. (1974). An evaluation of California’s “Good driver” incentive program (report No.6). Sacramento, CA: California Department of Motor Vechiles.
Harbluk, J.L., Noy, Y.I., & Eizenman, M. (2002). The impact of cognitive distraction on driver visual behaviour and vehicle control. Report # TP13889E. Transport Canada.
Harding, R.W., Morgan, F.H., Indermaur, D., Ferrante, A.M., & Blagg, H. (1998). Road rage and the epidemiology of violence: Something old, something new. Studies on Crime and Crime Prevention, 7, 221–238.
Harré, N., & Sibley, C. (2007). Implicit and explicit biases in drivers and their relation to crash-risk optimism. Accident Analysis and Prevention, 39, 1155-1161.
Hatakka, M., Keskinen, E., Hernetkoski, K., Gregerson, N.P., & Glad, A. (2003). Goals and contents of driver education. In: Dorn, L. (Ed.), Driver Behaviour and Training. Ashgate,England, United Kingdom.
Hatfield, J., & Fernandes, R. (2009). The role or risk-propensity in the risky driving of young drivers. Accident Analysis and Prevention, 41, 25-35.
Hatfield, J., Fernandes, R., Faunce, G., & Job, R.F. (2008). An implicit non-self-report measure of attitudes to speeding: Development and validation. Accident Analysis and Prevention, 40, 616, 627.
Hauber, A.R. (1980). The social psychology of driving behaviour and the traffic environment : Research on aggressive behaviour in traffic. International Review of Applied Psychology, 29, 461–474.
Hedlund, J. H. (1994). “If they didn’t drink, would they crash anyway?” – The role of alcohol in traffic crashes. Alcohol, drugs and driving, 10, 115–125.
Hedlund, J. (2006). Large Truck Crash Causation Study (LTCCS) Analysis Series: Using LTCCS data for statistical analyses of crash risk. US DOT, Publication #: FMCSA-RI-05-037.
Hedlund, J. (2007). Improving traffic safety culture in the United States: Summary and synthesis. In: Improving Traffic Safety Culture in the United States; The Journey Forward. Washington, D.C., AAA Foundation for Traffic Safety.
Hedlund, J., Simpson, H., & Mayhew, D., (2006). Summary of proceedings and recommendations, International Conference on Distracted Driving. International conference on distracted driving, Toronto, Ontario, Canada.
Human Factors in the Motor Carrier Industry in Canada 256
Hemenway, D., & Solnick, S. J. (1993). Fuzzy dice, dream cars, and indecent gestures: Correlates of driver behavior? Accident Analysis and Prevention, 25, 161–170.
Hendrick, H.W., & Kleiner B.M. (2001). Macroergonomics: An introduction to work system design. Human factors and ergonomic society, volume 2.
Hendricks, D.L., Fell, & J.C, Freedman, M. (2001). The relative frequency of unsafe driving acts in serious traffic offenses. Prepared for the NHTSA, contract # DTNH22-94-C-05020.
Hennessy, D.A., & Wiesenthal, D.L. (1997). The relationship between traffic congestion, driver stress and direct versus indirect coping behaviours. Ergonomics, 40, 348–361.
Hennessy, D.A .& Wiesenthal, D.L. (2005). Driving vengeance and willful violations: Clustering of problem driving attitudes. Journal of Applied Social Psychology, 35, 61-79 .
Herbert, R., & Landrigan, P.J. (2000). Work-related death: A continuing epidemic. American Journal of Public Health, 90(4), 541–545.
Hickman J.S., & Hanowski, R.J. (2009). Evaluating the safety benefits of a low-cost driving behavior management system in commercial vehicle operations. FMCSA webinar, July 22nd, 2009.
Hickman J.S., & Hanowski, R.J. (2010). Evaluating the safety benefits of a low-cost driving behavior management system in commercial vehicle operations. FMCSA, report # FMCSA-RRR-10-033.
Hickman, J.S., Knipling, R.R., Hanowski, R.J., Wiegand, D.M., Inderbitzen, R.E., & Bergoffen, G., & (2007). CTBSSP Synthesis 11: The impact of behavior-based safety techniques on commercial motor vehicle drivers. Transportation Research Board of the National Academies. Washington DC.
Hodges, S.L., (2008). Dashboard dichotomy: More data, less distraction. Transport Topics, September 2008. (http://www.allbusiness.com/manufacturing/transportation-equipment-mfg/11651239-1.html).
Homant, R.J., Kennedy, D.B., & Howton, J.D. (1993). Sensation seeking as a factor in police pursuit. Criminal Justice and Behavior, 20, 293-305.
Horn, B.E., & Tardif, L. (1999). Licensing and training of truck drivers: New and continuing challenges. Journal of International Association of Traffic and Safety Services, 23, 16–21.
Horne, J.A., Reyner, L.A. (1995). Sleep related vehicle accidents. Br. Med. J., 310, 565–567.
Horne, J.A., Reyner, L.A. (2001). Sleep-related vehicle accidents: Some guides for road safety policies. Transportation Research Part F, 4, 63-74.
Horne, J.A., Reyner, L.A. (1999). Vehicle accidents related to sleep: A review. Occup. Environ. Med., 56, 289-294.
Horrey, W.J., & Lesch, M.F. (2009). Driver-initiated distractions: Examining strategic adaptation for in-vehicle task initiation. Accident Analysis and Prevention, 41, 115–122.
Horrey, W.J., Lesch, M.F., & Garabet, A. (2008). Assessing the awareness of performance decrements in distracted drivers. Accident Analysis and Prevention, 40, 675–682.
Human Factors in the Motor Carrier Industry in Canada 257
Horrey, W.J., Lesch, M.F., & Garabet, A. (2009). Dissociation between driving performance and drivers' subjective estimates of performance and workload in dual-task conditions. Journal of Safety Research, 40, 7-13.
Horrey, W.J., Noy, I.Y., Folkard, S., Popkin, S.M., Howarth, H.D., & Courtney, T.K. (2011). Research needs and opportunities for reducing the adverse safety consequences of fatigue. Accident Analysis and Prevention, 43, 591-594.
Horstmann, S., Hess, C.W., Bassetti, C., Gugger, M., & Mathis, J. (2000). Sleepiness-related accidents in sleep apnea patients. Sleep, 23, 383-389.
Horswill, M.S., & McKenna, P.P. (1999). The effect of perceived control on risk taking. Journal of Applied Social Psychology, 29, 377–391.
Horswill, M.S., & McKenna, F.P. (2004). Drivers' hazard perception ability: Situation awareness on the road. In S. Banbury & S. Tremblay (Eds.). A cognitive approach to situation awareness: Theory and Application (pp. 155-175). Aldershot, UK: Ashgate
Horvath, P., & Zuckerman, M. (1993). Sensation seeking, risk appraisal, and risky behavior. Personality & Individual Differences, 14(1), 41–52.
Houser, A. & Flannery, A. (2008). Driver factors in large truck crashes prevented by onboard safety systems. Presented at the Fourth International Conference on Traffic and Transport Psychology, Washington DC.
Houser, A., Murray, D., Shackelford, S., Kreeb, R., & Dunn, T. (2009). Analysis of benefits and costs of lane departure warning systems for the trucking industry. FMCSA-RRT-09-022.
Houston, J.M, Harris, P.B., & Norman, M. (2003). The aggressive driving behavior scale. North American Journal of Psychology, 5, 269–278.
Huang, Y-H., Roetting, M., McDevitt, J.R., Melton, D., & Smith, G.S. (2005). Feedback by Technology: Attitudes and Opinions of Truck Drivers, Transportation Research Part F, 8, 277-297.
International Road Transport Union (2007). A scientific study: “ETAC” European Truck Accident Causation.
Irwin, C., & Millstein, S. (1992). Risk-taking behaviors and biopsychosocial development during adolescence. In: Susman, E.J., Feagans, L.V. et al. (Eds.). Emotion, cognition, health, and development in children and adolescents (pp. 75-102). vi, 183pp.
Isler, R.B., Starkey, N.J., & Williamson, A. (2009). Video-based road commentary training improves hazard perception of young drivers in a dual task. Accident Analysis and Prevention, 41, 445-452.
Itoi, A., Cilveti, R., Voth, M., Bezalel, D., Hyde, P., Gupta, A., & Dement, W.C. (1993). Can drivers avoid falling asleep at the wheel? Relationship between awareness of sleepiness and ability to predict sleep onset. AAA Foundation for Traffic Safety.
Iverson, H., & Rundmo, T. (2002). Personality, risky driving and accident involvement among Norwegian drivers. Personality and Individual Differences, 22, 1251-1263.
Jelalian, E., Alday, S., Spirito, A., Rasile, D., & Nobile, C. (2000). Adolescent motor vehicle crashes: The relationship between behavioral factors and self-reported injury. Journal of Adolescent Health, 27, 84-93.
Jessor, R. (1987). Problem behavior theory, psychosocial development, and adolescent problem drinking. British Journal of Addiction, 82, 331-342.
Human Factors in the Motor Carrier Industry in Canada 258
Jessor, R. (1989). Road safety and health behavior: Some lessons for research and education. Health and Education Research, 5, 281-283.
Jessor, R. (1992). Risk behavior in adolescence: A psychosocial framework for understanding and action. Developmental review, 12, 374–390.
Jessor, R., Donovan, D.M., & Costa, F.M. (1991). Beyond adolescence: Problem behavior and young adult development. NY: Cambridge University Press.
Jessor, R., Jessor, S.L. (1977). Problem behavior and psychosocial development: A longitudinal study of youth. New York, Academic Press.
Jessor, R., Turbin, M., & Costa, F. (1997). Predicting developmental change in risky driving: The transition to young adulthood. Applied Developmental Science, 1, 4–16.
Jonah, B.A. (1986). Accident risk and risk-taking behaviour among young drivers. Accident Analysis and Prevention, 18, 255–271.
Jonah, B.A. (1990a). Age differences in risky driving. Health Education Research, 5, 139–150.
Jonah, B.A. (1990b). Preventing road accident casualties: Integrating two solitudes. Health Education Quarterly, 5, 109-110.
Jonah, B.A. (1997). Sensation seeking and risky driving: A review and synthesis of the literature. Accident Analysis and Prevention, 29, 651-665.
Jonah, B.A., & Dawson, N. (1987). Youth and risk: Age differences in risky driving, risk perception and risk utility. Alcohol, Drugs and Driving, 3, 13–29.
Jonah, B.A., Mayhew, D.R., Brown, S.W., Vanlaar, W.G.M., & Marcoux, K.D. (2009). Best practices in truck safety. Traffic Injury Research Foundation.
Jonah, B.A., Thiessen, R., Au-Yeung, E., & Vincent, A. (1997). Sensation seeking and risky driving. Presented at risk-taking behavior and traffic safety symposium, Cape Cod, Massachusetts.
Jones, I.S, & Stein, H.S. (1987). Effect of driver hours of service on tractor-trailer crash involvement. Insurance Institute for Highway Safety, Arlington, VA.
Karrer, K., Vöhringer-Kuhnt, T., Baumgarten, T., & Briest, S. (2004). The role of individual differences in driver fatigue prediction. Third International Conference on Traffic and Transport Psychology, Nottingham, UK.
Kecklund, G., & Akerstedt, T. (2004). Report on methods and classification of stress, inattention and emotional states. Project Sensation, Information Society Technologies Program.
Kenrick, D.T., & MacFarlane, S.W. (1986). Ambient temperature and horn honking; A field study of the heat/aggression relationship. Environment and behavior, 18, 179–191.
Klauer, S.G., Dingus, T.A, Neale, V.L, Sudweeks, J.D, & Ramsey, D.J. (2006). The impact of driver inattention on near-crash/crash risk: An analysis using the 100-car naturalistic driving study data. Washington, DC: U.S. Department of Transportation, National Highway Traffic Safety Administration
Knipling, R.R. (1998). The technologies, economics, and psychology of commercial motor vehicle driver fatigue monitoring. Proceedings of ITS America’s Eighth Annual Meeting and Exposition. Intelligent Transportation Society of America, Detroit.
Human Factors in the Motor Carrier Industry in Canada 259
Knipling, R.R. (2005). Evidence and dimensions of commercial vehicle differential crash risk. Proceedings of the third International Driving Symposium on Human Factors in Driving Assessment, Training and Vehicle Design, Rockport.
Knipling, R.R. (2007a). The human factors of commercial driving. TRB Human Factor Worksop # 144.
Knipling, R.R. (2007b). Introduction. In: The domain of truck and bus safety research. Transportation Research Circular E-C117.
Knipling, R.R. (2009). Safety for the long haul. Large truck crash risk, causation & prevention. American Trucking Association.
Knipling, R.R., Boyle, L.N., Hickman, J.S., York, J.S., Daecher, C., Olsen, E.C.B., & Prailey, T.D. (2004). CTBSSP Synthesis 4: Individual Differences and the High-Risk Commercial Driver. Transportation Research Board of the National Academies. Washington DC.
Knipling, R.R., Hickman, J.S., & Bergoffen, G. (2003). CTBSSP Synthesis 1: Effective commercial truck and bus safety management techniques. Transportation Research Board of the National Academies. Washington DC.
Knowles Canada (2004). Carrier safety rating project readiness review: Final report. Prepared for the CCMTA: (http://www.ccmta.ca/english/pdf/safety_rating_knowlesreport.pdf).
Kostiniuk, L.P., Streff, F.M., Zakrajsek, J. (2002). Identifying unsafe driver actions that lead to fatal car-truck crashes. Washington DC: AAA Foundation for Traffic Safety.
Krueger, G.P., Brock, J.F., Golembiewski, G.A., Daecher, C., Bishop, R., & Bergoffen, G. (2005). Bus and Motorcoach Hours of Service and Fatigue Management Techniques. Proceedings of the International Truck and Bus Safety & Security Symposium, Alexandria, Virginia.
Krueger, G.P., Brewster, R.M., Dick, V.T., Inderbitzen, R.E., & Staplin, L. (2007). CTBSSP Synthesis 15: Health and wellness for commercial drivers. Transportation Research Board of the National Academies. Washington DC.
Kubose, T., Bock, J.K., Dell, G.S., Garnsey, S.M., Kramer, A.F., & Mayhugh, J. (2006). The effects of speech production and speech comprehension on simulated driving performance. Journal of Applied Cognitive Psychology, 20, 43–63.
Lajunen, T., Parker, D. & Summala, H. (2004). The Manchester Driving Questionnaire; A cross-cultural study. Accident Analysis and Prevention, 36, 231-238.
Lamond N., & Dawson D. (1999). Quantifying the performance impairment associated with fatigue. Journal of sleep research, 8, 255-262.
Lastovicka, J.L., Murry, J.P. Jr., Joachimsthaler, E.A., Bhalla, G., & Scheurich, J. (1987). A lifestyle typology to model young male drinking and driving. Journal of Consumer Research, 14, 257–263.
Lawton, R., Parker, D., Manstead, A.S.R., & Stradling, S.G. (1997). The role of affect in predicting social behaviors: The case of road traffic violations. Journal of Applied Social Psychology, 27, 1258-1276.
Lawton, R., Parker, D., & Stradling, S.G. (1997). Predicting road traffic accidents; The role of social deviance and violations. British Journal of Psychology, 88, 249-262.
Lawton, R., Parker, D., Stradling, S.G., & Manstead, A.S.R. (1997). Self-reported attitude towards speeding and its possible consequences in five different road contexts. Journal of Community and Applied Social Psychology, 7, 153-165.

Human Factors in the Motor Carrier Industry in Canada 260
Lee, J.D., Regan. M.A., & Young, K.L. (2008). What drives distraction? Distraction as a breakdown of multilevel control. In: M.A., Regan et al. (Eds.), Driver distraction theory, effects, and mitigation. Guilford Press.
Lee, J.D., Young, K.L., & Regan. M.A. (2008). Defining driver distraction. In: M.A., Regan et al. (Eds.), Driver distraction theory, effects, and mitigation. Guilford Press.
Lehman, P.K., & Geller, E.S. (2004). Behavior analysis and environmental protection: Accomplishments and potential for more. Behavior and Social Issues, 13, 13-32.
Leight, B. (1999). Peril, chance, adventure: Concept of risk, alcohol use and risky behavior in young adults. Addiction, 94, 371–383.
Lenné M.G., Triggs T.J., & Redman J.R. (1997). Time of day variations in driving performance. Accident Analysis and Prevention, 431-437.
Lerner, N., & Boyd, S., (2005). Task Report: On-road Study of Willingness to Engage in Distracting Tasks. Washington, DC: U.S. Department of Transportation, National Highway Traffic Safety Administration (DOT HS 809 863).
Lesch, M.F., & Hancock, P.A. (2004). Driving performance during concurrent cell-phone use: Are drivers aware of their performance decrements? Accident Analysis and Prevention 36, 471–480.
Lin T.D., Jovanis P.P., & Yang C.Z. (1994). Time of day models of motor carrier accident risk. Transport. Res. Record, 1467, 1–8.
Liu, C.C., Hosking, S.G., & Lenné, M.G. (2009). Hazard perception abilities of experienced and novice motorcyclists: An interactive simulator experiment. Transportation Research Part F, 12, 325-334.
Little, G.L., & Robinson, K.D. (1989). Treating drunk drivers with moral reconation therapy: A one-year recidivism report. Psychological Reports, 64, 960–962.
Lloberes, P., Levy, G., Descals, C., Sampol, G., Roca, A., Sagales, T., & De la Calzada, M.D. (2000). Self-reported sleepiness while driving as a risk factor for traffic accidents in patients with obstructive sleep apnoea syndrome and in non-apnoeic snorers. Respiratory Medicine, 94, 971–976.
Llaneras, R.E., Singer, J.P., & Bowers-Carnahan, R. (2005). Assessment of truck driver distraction problem and research needs. Washington, DC: U.S. Department of Transportation, National Highway Traffic Safety Administration (DOT HS 809 883).
Lonczak, H., Neighbors, C., & Donovan, D.M. (2007). Predicting risky and angry driving as a function of gender. Accident Analysis and Prevention, 38, 536-545.
Lonero, L.P. (2002). Driver Skill. In J.P. Rothe (Ed.), Driving Lessons: Exploring Systems That Make Traffic Safer. Edmonton, Alberta: University of Alberta Press.
Lonero, L.P. (2007). Finding the next cultural paradigm for road safety. In: Improving Traffic Safety Culture in the United States; The Journey Forward. Washington, D.C., AAA Foundation for Traffic Safety.
Lonero, L.P., & Clinton, K.M. (1997). Objectives for behavioural driver safety programs. Web document, available on www.drivers.com (www.drivers.com/article/302).
Lonero, L.P., & Clinton, K.M. (1998). Changing road user behavior: What works and what doesn’t. PDE Publications. Available on www.drivers.com.
Lonero, L.P., Clinton, K.M., & Douglas, M.B. (1998). Driver education curriculum outline. In: Proceedings of the Human Factors and Ergonomics Society 42nd Annual Meeting (pp. 1396-1400). Santa Monica, CA: Human Factors and Ergonomics Society.
Human Factors in the Motor Carrier Industry in Canada 261
Lonero, L.P., Clinton, K.M., & Sleet, D. (2006). Behavior change interventions in road safety. In: A.C. Geilen, D.A. Sleet, & R.J. DiClemente (Eds), Injury and violence prevention: Behavioral science theories, methods, and applications. San Francisco, California: Jossey-Bass.
Lonero, L.P., Clinton, K.M., Peck R., Mayhew, D., Smiley, A. & Black, D. (2001). Driver improvement programs: State of knowledge and trends (Part 2). Ottawa, Ontario: Transport Canada.
Lonero, L.P., Clinton, K.M., Wilde G.J.S., Roach, K., McKnight, J., MacLean, H., Guasltello, S.J., & Lamble, R.W. (1994). The roles of legislation, education and reinforcement in changing road user behaviour. Toronto, Ontario. Ontario Ministry of Transportation.
Lonero, L.P., Clinton, K.M., Sleet, D., Lee-Gosselin, M., Simpson, H. & Roach, K. (2002). Road safety as a social construct. Ottawa, Ontario: Transport Canada.
Lowenstein, L.F. (1997). Research into causes and manifestations of aggression in car driving. The Police Journal, July, 263–270.
Lucidi, F., Russo, P.M., Mallia, L., Devoto, A., Lauriola, M., & Violani, C. (2006). Sleep-related car crashes: Risk perception and decision-making processes in young drivers. Accident Analysis and Prevention, 38, 302-309.
Lynch, R.S., Deffenbacher, J.L., Oetting, E.R., & Yingling, D.A. (1995). Driving anger as a health risk factor. Paper presented at the American Psychological Association, New-York, New-York.
Machin, M.A., & Sankey, K.S. (2008). Relationships between young drivers’ personality characteristics, risk perceptions, and driving behavior. Accident Analysis and Prevention, 41, 963-968.
Marcil, I., Audet, T., Bergeron, J., (1999). Déterminants motivationnels des excès de vitesse en milieu urbain chez de jeunes conducteurs québécois. Science et comportement, 27, 1–17.
Marcil, I., Bergeron. J., & Audet, T. (2001). Motivational factors underlying the intention to drink and drive in young male drivers. Journal of Safety Research, 32, 363–376.
Marsh, P., & Collett, P. (1987). The car as a weapon. Et Cetera, 44, 146–150. Martinez, R. (2000). The status of traffic safety in the United States. In H. von Holst, A.
Nygren, A. E. and A. E. Andersson, (Eds). Transportation, traffic safety and health— Human behavior. pp. 7–13. Fourth International Conference, Tokyo, Japan, 1998. Berlin: Springer.
Maslow, A. (1970). Motivation and personality. New York: Harper and Row. Matthews, G., & Desmond, P.A. (1998). Personality and multiple dimensions of task-
induced fatigue: A study of simulated driving. Personality and Individual Differences, 25, 443–458.
Matthews, M.L., & Moran, A.R. (1986). Age differences in male drivers’ perception of accident risk: the role of perceived driving ability. Accident Analysis and Prevention, 18, 299–313.
Matthews, G., Dorn, L., Hoyes, T.W., Davies, D.R., Glendon, A.I, & Taylor, R.G. (1998). Driver stress and performance on a driving simulator. Human Factors, 40, 136-149.
Matthews, G., Tsuda, A., Xin, G., & Ozeki, Y. (1999). Individual differences in driver stress vulnerability in a Japanese sample. Ergonomics, 42, 401-415.

Human Factors in the Motor Carrier Industry in Canada 262
Mayhew, D.R., & Simpson, H.M. (2002). The safety value of driver education and training. Injury Prevention, 8, ii3-ii8 (Suppl II).
McCartt, A.T., Hammer, M.C., and Fuller, S.Z. (1997). Work and sleep/rest factors associated with driving while drowsy: Experience among long-distance truck Drivers. 41st Annual Proceedings, Association for the Advancement of Automotive Medicine, Des Plaines, IL, pp. 95–108.
McCartt, A.T., Rohrbaugh, J.W., Hammer, H.C., & Fuller, S.Z. (2000). Factors associated with falling asleep at the wheel among long-distance truck drivers. Accident Analysis and Prevention, 32, 493-504.
McCartt, A.T., Hellinga, L.A., & Solomon, M.G. (2008). Work schedules of long distance truck drivers before and after 2004 hours of service rules change. Traffic Injury Prevention, 9, 201-210.
McKenna, F.P., Stanier, R.A., & Lewis, C. (1991). Factors underlying self-assessment of driving skills in males and females. Accident Analysis and Prevention, 23, 45–52.
McKenna, F.P., Horswill, M.S., & Alexander, J. (2006). Does anticipation training affect drivers’ risk taking? Journal of Experimental Psychology, 12, 1-10.
McKenna, F. & Crick, J. (1997). Developments in hazard perception. Transport Research Laboratory Report 297. Crowthorne, U.K.: Transport Research Laboratory.
McKnight, A.J., & McKnight, A.S. (2000). Young novice drivers: Careless or clueless? Accident Analysis and Prevention, 35, 921–925.
McMillen, D.L., Pang, M.G., Wells-Parker, E., & Anderson, B.J. (1992). Alcohol, personality traits, and high risk driving: A comparison of young, drinking driver groups. Addictive Behaviors, 17, 525–532.
McMillen, D.L., Smith, S.M., & Wells-Parker, E. (1989). The effects of alcohol, expectancy, and sensation seeking on driving risk taking. Addictive Behaviors, 14, 477–483.
Meadows, M.L., & Stradling, S.G. (1999). The effect of resources on learner drivers attitudes to road safety. In G. B. Grayson (Ed.), Behavioural research in road safety IX (pp. 125–137). Crowthorne, England: Transport Research Laboratory.
Mesken, J., Lajunen, T., & Summala, H. (2002). Interpersonal violations, speeding violations and their relation to accident involvement in Finland. Ergonomics, 45, 469-483.
Meuter, R., Rakotonirainy, A., Johns, B., Tran, P., & Wagner, P. (2005). The dual vigilance task: Tracking changes in vigilance as a function of changes in monotonous contexts. Proceedings of the 2005 International Conference on Fatigue Management in Transportation Operations. Seatle, State of Washington.
Michael, R., Meuter, R. (2007). The negative effect of task monotony and sensation seeking tendencies on sustained attention. ESCop, XV Conference, Marseille.
Michon, J.A. (1985). A critical view of driver behavior models: What do we know, what should we do? In L. Evans and, & R.C. Schwing (Eds.), Human Behavior and Traffic Safety, 1985 (pp. 485-520). New York: Plenum Press.
Middlestadt, S.E. (1989). Using the theory of reasoned action as a framework for understanding and changing AIDS-related behaviors. In V.M. Mays, G.W. Albee, and S.F. Schneider (Eds.), Primary prevention of AIDS: Psychological approaches (pp. 93-110). London: Sage Publications.

Human Factors in the Motor Carrier Industry in Canada 263
Miles, D.E., & Johnson, G.L. (2003). Aggressive driving behaviors: Are there psychological and attitudinal predictors. Transportation Research Part F, 6, 147-161.
Millstein, S., & Igra, V. (1995). Theoretical models of adolescent risk-taking behavior. In: Jan L. Wallander, & Lawrence J. Siegel (Eds), Adolescent health problems: Behavioral perspectives. Advances in pediatric psychology (pp. 52-71). xii, 314pp.
Minter, S.G. (2000). Driver safety is no distraction. Occupational Hazards, 10 (October). Misener, J.A., Nowakowski, C., Lu, X-Y., Koo, T., Margulici, J.D., Spring, J., Johnson,
S., Kim, Z.W., Dickey, S., Kuhn, K., Kretz, P., Robin, J., & Walker, M. (2007). On-board monitoring and reporting for commercial motor vehicle safety: Final report. FMCSA, report # FMCSA-RRT-07-030.
Mitler, M.M., Caskadon, M.A., Czeiler, C.A., Dement, W.C., Dinges, D.F., & Graeber, R.C. (1988). Catastrophes, sleep and public policy: Consensus report. Sleep, 100-109.
Mitler, M.M., Miller, J.C., Lipsitz, J.J., Walsh, J.K., Dennis, C., & Wylie, B.A. (1997). The sleep of long-haul truck drivers. New England Journal of Medicine, 755-762.
Moe, D., & Jenssen, G.D. (1993). Young drivers and risk taking. Sintef Report N. 93009. Foundation for Scientific and Industrial Research, University of Trondheim, Trondheim. Moe, D., & Jenssen, G.D. (1995). Young drivers risk-taking behaviors and accidents.
First interdisciplinary conference on young drivers (pp. 12-14), December 1994. Cologne, Germany.
Moller, H. (2008). Medical Perspective: Driver Drowsiness, Fatigue and Alertness. In: Working together to understand driver fatigue. Report on Symposium Proceedings, symposium of the Highway safety roundtable.
Moller, M., & Gregersen, N.P. (2008). Psychosocial function of driving as predictor of risk-taking behaviors. Accident Analysis and Prevention, 20, 209-215.
Morrow, P., & Crum, M.R. (2004). Antecedent of fatigue, close calls, and crashes among commercial motor-vehicle drivers. Journal of Safety Research, 35, 59-69.
Moscovitch, A., Reimer, M., Heslegrave, R., Boivin, D., Hirshkowitz, M., Rhodes, W., & Kealey, M. (2006). Development of educational material and testing of tools and procedures to be used in phase 3 fatigue management program. Report submitted to Transport Canada.
Mourant, R.R, & Rockwell, T.H. (1972). Strategies of visual search by novice and experienced drivers. Human Factors, 14, 325–335.
Moyano, D.E. (2002). Theory of planned behavior and pedestrians' intentions to violate traffic regulations. Journal of Transportation Research Part F: Traffic Psychology and Behaviour, 5, 169–175.
Murray, D.C., Lantz, B., & Keppler, S.S. (2005). Predicting truck crash involvement: Developing a commercial driver behavior-based model and recommended countermeasures. American Transportation Research Institute, Alexandria.
Murray, D.C., Shackelford, S., & Houser, A. (2009a). Analysis of benefits and costs of roll stability control systems for the trucking industry. FMCSA-RRT-09-020.
Murray, D.C., Shackelford, S., & Houser, A. (2009b). Analysis of benefits and costs of forward collision warning systems for the trucking industry. FMCSA-RRT-09-021.
Musselwhite, C. (2006). Attitudes towards vehicle driving behaviour: Categorising and contextualising risk. Accident Analysis and Prevention, 38, 324-334.

Human Factors in the Motor Carrier Industry in Canada 264
Näätänen, R., & Summala, H. (1976). Road user behavior and traffic accidents. Amsterdam, North Holland Cy.
Najim, W.G., Mironer, M., Koziol, J.S., Wang, J.S., & Knipling, R.R. (1995). Examination of target vehicular crashes and potential ITS Countermeasures. DOT-VNTSC-NHTSA-95-4, Washington, DC, June, 1995, DOT HS 808 263.
National Transportation Safety Board (1995). Factors that affect fatigue in heavy truck accidents. Safety Study 95/01, Washington, DC: National Transportation Board.
National Highway Traffic Safety Administration (NHTSA) and National Center for Sleep Disorders Research (NCSDR). Drowsy driving and automobile crashes: Report and recommendations. NCSDR/NHTSA Expert Panel on Driver Fatigue and Sleepiness. DOT Report HS-808-707, NHTSA, Washington, D.C., April 1998b. (http://www.nhtsa.dot.gov/people/injury/drowsy_driving1/Drowsy.html).
Nelson, E., Atchley, P., & Little, T.D. (2009). The effects of perception of risk and importance of answering and initiating a cellular phone call while driving. Accident Analysis and Prevention, 41, 438-444.
Neyens, D.M., & Boyle, L.N. (2006). The effect of distractions on the crash types of teenage drivers. Accident Analysis and Prevention, 39, 206-212.
Neuman, T.R., Pfefer, R., Slack, K.L., Raub, R., Luke, R., Wark, R. (2003). NCHRP report 500. Volume 1: A guide for addressing aggressive-driving collisions. Transportation Research Board, Washington DC.
NHTSA, (2002). Traffic safety facts 2001: A compilation of motor vehicle crash data from the fatality analysis reporting system and the general estimates system. Washington, DC: U.S. Department of Transportation, National Highway Traffic Safety Administration (DOT HS 809 484).
NHTSA, (2009). Countermeasures that work: A highway safety countermeasure guide for state highway safety offices. Fourth Edition.
NHTSA/FMCSA, (2007). Guidelines for developing a high-visibility enforcement campaing to reduce unsafe driving behaviors among drivers of passenger and commercial motor vehicles. Washington, DC: U.S. Department of Transportation, National Highway Traffic Safety Administration (DOT HS 819 851).
Nerup, P., Salzberg, P., VanDyk, J., Porter, L., Blomberg, R., Dennis T., & Cosgrove, L. (2006). Ticketing Aggressive Cars and Trucks (TACT) in Washington state: high visibility enforcement applied to share the road safely. Washington, DC: U.S. Department of Transportation, National Highway Traffic Safety Administration (DOT HS 810 603).
Nordbakke, S., & Sagberg, F. (2007). Sleepy at the wheel: Knowledge, symptoms and behaviour among car drivers. Transportation Research Part F: Traffic psychology and behaviour, 10, 1-10
Novaco, R.W. (1991). Aggression on roadways. In R. Baenninger (Ed.), Targets of Violence and Aggression (pp. 253-326). North-Holland : Elsevier Science Publishers B.V.
Noyce, D.A., & Elango, V.V. (2004). Safety evaluation of centerline rumble strips crash and driver behavior analysis. Transportation Research Record, 1862, 44-53.
Human Factors in the Motor Carrier Industry in Canada 265
OECD/JTRC (2009). Heavy vehicles: Regulatory, operational and productivity improvements. (http://www.internationaltransportforum.org/jtrc/infrastructure/heavyveh/Truc
ksSum.pdf) Ogawa, K., Renge, K., & Nagayama, Y. (1993). A positive study on the structure and the
function of hazard perception. Japanese Journal of Applied Psychology, 18, 37–54. Olson, R.L., Hanowski, R.J., Hickman, J.S., & Bocanegra, J. (2009). Driver distraction
in commercial vehicle operations. FMCSA, report # FMCSA-RRR-09-042. Oron-Gilad, T., & Shinar, D. (2000). Driver fatigue among military truck drivers.
Transportation Research Part F, 3, 195-209. Oron-Gilad, & Shinar, D. (2008). Alertness maintaining tasks (AMTs) while driving.
Accident analysis and prevention, 40, 851-860. Otmani, S., Rogé, J., & Muzet, A. (2005). Sleepiness in professional drivers: Effect of
age and time of day. Accident Analysis and Prevention, 37, 930-937. Özkan, T., Lajunen, T. & Summala, H. (2006). Driver Behaviour Questionnaire: A
follow-up study. Accident Analysis and Prevention, 38, 386-395. Pack, A.I., Dinges, D., & Maislin, G. (2002). A study of prevalence of sleep apnea among
commercial truck drivers. FMCSA Report No. RT-02-030. Pack, A.I., Pack, A.M., Rodgman, E., Cucchiara, A., Dinges, D.F., Schwab, C.W. (1995).
Characteristics of crashes attributed to the driver having fallen asleep. Accident Analysis Prevention, 27, 769–775.
Paleti, R., Eluru, N., & Bhat, C.R. (2010). Examining the influence of aggressive driving behaviors on driver injury severity in traffic crashes. Accident Analysis and Prevention, 42, 1839-1854.
Paris, H., & Van den Broucke, S. (2008). Measuring cognitive determinants of speeding: An application of the theory of planned behaviour. Transportation Research Part F, 11, 168-180.
Parker, D., Lajunen, T., & Stradling, S., (1998). Attitudinal predictors of interpersonally aggressive violations on the road. Transportation Research Part F, 1, 11–24.
Parker, D., & Manstead, A. (1996). The social psychology of driver behavior. In G. R. Semin, & F. Klaus (Eds.), Applied social psychology (pp.198-224). London: Sage.
Parker, D., Manstead, A.S.R., Stradling, S.G., & Reason, J.T. (1992a). Intention to commit driving violations: An application of the theory of planned behavior. Journal of Applied Psychology, 77(1), 94–101.
Parker, D., Manstead, A.S.R., Stradling, S.G., & Reason, J.T. (1992b). Determinants of intention to commit driving violations. Accident Analysis and Prevention, 24(2), 117–131.
Parker, D., Reason, J.T., Manstead, A.S.R., & Stradling, S.G. (1995). Driving errors, driving violations and accident involvement. Ergonomics, 38, 1036-1048.
Parker, D., Stradling, S.G., & Manstead, A.S.R. (1996). Modifying beliefs and attitudes to exceeding the speed limit: An intervention study based on the theory of planned behavior. Journal of Applied Social Psychology, 26, 1–19.
Parker, D., West, R., Stradling, S., & Manstead, A.S.R. (1995). Behavioral characteristics and involvement in different types of traffic accident. Accident Analysis and Prevention, 27, 571-581.
Human Factors in the Motor Carrier Industry in Canada 266
Patten, C.J.D., Kircher, A., Östlund, J., & Nilsson, L. (2004). Using mobile telephones: Cognitive workload and attention research allocation. Accident Analysis & Prevention 36, 341–350.
Perrin, D.A., Clarke, R.M., Knee, H.E., Kreeb, R., Peel, M., Rau, P., & Svenson, A. (2007). Chapter 7: Vehicle design and technology. In: The domain of truck and bus safety research. Transportation Research Circular E-C117.
Perry, A. (1986). Type A behaviour pattern motor vehicle drivers behaviour. Perceptual and Motor Skills, 63, 875–878.
Perry, A., & Baldwin, D. (2000). Further evidence of associations of type A personality scores and driving related attitudes and behaviours. Journal of Perceptual and Motor Skills, 91, 147–154.
Petit, P., Sagaspe, P., Moore, S., Taillard., J., & Charles, A. (2005). Fatigue, sleep restriction and driving performance. Accident analysis and prevention, 473-478.
Petty, R.E., & Cacioppo, J.T. (1986). The elaboration likelihood model of persuasion. Advances in Experimental Social Psychology, 19, 123–205.
Philip, P., Sagaspe, P., Moore, N., Taillard, J., Charles, A., Guilleminault, C., & Bioulac, B. (2005). Fatigue, sleep restriction and driving performance. Accident Analysis and Prevention, 37, 473-478.
Pizza, F., Contardi, S., Ferlisi, M., Mondini, S., & Cirignotta, F. (2008). Daytime driving simulation performance and sleepiness in obstructive sleep apnea patients. Accident Analysis and Prevention, 40, 602, 609.
Poulter, D.R., Chapman, P., Bibby, P.A., Clarke, D.D., & Crundall, D. (2008). An application of the theory of planned behaviour to truck driving behaviour and compliance with regulations. Accident Analysis & Prevention, 40, 2058-2064.
Quimby, A.R., Maycock, G., Carter, I.D, Dixon, R., & Wall, J.G. (1984). Perceptual abilities of accident involved drivers. Report no RR27. Crowthorne, Berkshire, U.K.: Transport Research Laboratory.
Quimby, A.R., & Watts, G.R. (1981). Human factors and driving performance. Report no. RR1004. Crowthorne, Berkshire, U.K.: Transport and Road Research Laboratory.
Rajalin, S. (1994). The connection between risky driving and involvement in fatal accidents. Accident Analysis & Prevention, 26, 555-562.
Reason J. (1997). Managing the risks of organizational accidents. Aldershot, UK: Ashgate.
Reason, D., Manstead, A., Stradling, S., Baxter, B., & Campbell, K. (1990). Errors and violations on the road: A real distinction? Ergonomics, 33, 1315–1332.
Redelmeier, D.A., & Tibshirani, R.J. (1997). Association between cellular telephone calls and motor vehicle collisions. The New England Journal of Medicine 336 (7), 453–458.
Regan, M.A, Deery, H.A, & Triggs, T.J. (1998). A technique for enhancing risk perception in novice car drivers. In: Proceedings of the Road Safety Research, Policing and Education Conference (pp. 51–56). New Zealand.
Regan, M.A., Lee, J.D., & Young, K.L. (2008). Driver distraction injury prevention countermeasures—Part 2: Education and training. In: M.A., Regan et al. (Eds.),
Driver distraction theory, effects, and mitigation. Guilford Press.
Human Factors in the Motor Carrier Industry in Canada 267
Regan, M.A., Victor, T., Lee, J.D., & Young, K.L. (2008). Driver distraction injury prevention countermeasures: Part 3—Vehicle, technology, and road design. In: M.A., Regan et al. (Eds.), Driver distraction theory, effects, and mitigation. Guilford Press.
Regan, M.A., Young, K.L., & Lee, J.D. (2008a). Driver distraction injury prevention countermeasures—Part 1: Data collection, legislation and enforcement, vehicle fleet management, and driver licensing. In: M.A., Regan et al. (Eds.), Driver distraction theory, effects, and mitigation. Guilford Press.
Regan, M.A., Young, K.L., & Lee, J.D. (2008b). Some Concluding Remarks. In: M.A., Regan et al. (Eds.), Driver distraction theory, effects, and mitigation. Guilford Press.
Renge, K. (1980). The effects of driving experience on a driver's visual attention. International Association of Traffic Safety Sciences Research, 4, 95–106.
Renge, K. (1998). Drivers’ hazard and risk perception, confidence in safe driving, and choice of speed. IATSS Research, 22, 103–110.
Richter, S., Marsalek, K., Glatz, C., & Gundel, A. (2005). Task-dependent differences in subjective fatigue scores. Journal of sleep research, 14, 393-400.
Rimini-Döring, M. (2007). ITSA—Traffic safety assessment in a simulator experiment with integrated driver information and assistance systems. Abstract submitted to the 2007 Driving Assessment Conference, Stevenson, Washington, USA.
Rimmö, P.-A. (2002). Aberrant driving behaviour: Homogeneity of a four-factor structure in samples differing in age and gender. Ergonomics, 45, 569-582.
Rimmö, P.-A., & Åberg, L. (1999). On the distinction between violations and errors: Sensation seeking associations. Transportation Research Part F, 2, 151–166.
Robert, S., & York, J. (2000). Design, development and evaluation of driver wellness programs. FMCSA, # MC-00-193.
Robson, L., Stephenson, C., Schulte, P., Amick, B., Chan, S., et al. (2010). A systematic review of the effectiveness of training & education for the protection of workers. Toronto: IWH; Cincinnati, OH: NIOSH; 2010.
Rogers, C.R., & Knipling, R.R. (2007). Commercial driver human factors. In: The domain of truck and bus safety research. Transportation Research Circular E-C117.
Rosekind, M. (2005). Managing safety, alertness and performance through federal hours of service regulations: Opportunities and challenges. Alertness solutions.
Rosenbloom, T., & Wolf, Y. (2002). Signal detection in conditions of everyday life traffic dilemmas. Accident Analysis and Prevention, 34, 763–772.
Rosenbloom, T., Eldror, E., & Shahar, A. (2009). Approaches of truck drivers and non-truck drivers toward reckless on-road behaviors. Accident Analysis and Prevention, 41, 723-728.
Rosenbloom, T., Shahar, A., Elharar, A., & Danino, O. (2008). Risk perception of driving as a function of advanced training aimed at recognizing and handling risks in demanding driving situations. Accident Analysis and Prevention, 40, 697-703.
Rossignol, M., & Pineault, M. (1993). Fatal occupational injury rates: Quebec, 1981 through 1988. American Journal of Public Health, 83(11), 1563–1566.
Rothengatter, J.A. (1994). Attitudes towards law violation and enforcement. In: Proceedings of the 37th AAAM Conference, Portland: American Association of Automotive Medicine.
Human Factors in the Motor Carrier Industry in Canada 268
Rothengatter, J.A., & Manstead, A.S.R. (1997). The role of the subjective norm in predicting the intention to commit traffic violations. In T. Rothengatter, & E. Carbonell Vaya (Eds.), Traffic and Transport Psychology: theory and application (pp. 389-394). Oxford: Elsevier Science.
Rothengatter, T. (2002). Driver illusion: no more risks. Transportation Research Part F: Traffic Psychology & Behavior, 5, 249-258.
Rudin-Brown, C. (2005). Strategies to reduce driver distraction from in-vehicle telematics devices: Report on industry and public consultations. Transport Canada, report # TP 14409 E.
Rutter, D.R., Quine, L., & Chesman, D.J. (1995). Predicting safe riding behaviour and accidents: Demography, beliefs and behaviour in motorcycling safety. Psychology and Health, 10, 369–386.
SAAQ (2007). Données québécoises sur la fatigue au volant 2000-2006. Rapport interne.
Saccomanno, F., Shortreed, J.H., & Yu, M. (1996). Effect of fatigue on commercial vehicle accidents. In: Saccomanno, F., & Shortreed, J. (Eds). Truck safety: perceptions and reality. IRR.
Sagberg, F. (1999). Road accidents caused by drivers falling asleep. Accident Analysis and Prevention, 31, 639–649.
Salmon, P.M., Young, K.L., & Regan, M.A. (2008). Distraction in public transport: Case study of bus driver distraction. In: M.A., Regan et al. (Eds.), Driver distraction theory, effects, and mitigation. Guilford Press.
Sarkar., S., de Faria, F., & Andreas, M. (2003). Aggressive driving attitude and intentions: An evaluation of an aggressive driving seminar. TRB 2003 Annual meeting CD-ROM.
Sayer, J., LeBlanc, D., Bogard, S., Nodine, E., & Najm, W. (2009). Integrated Vehicle-Based Safety Systems: Third final report. Washington, DC: U.S. Department of Transportation, National Highway Traffic Safety Administration (DOT HS 811 221).
Sayer, J.R., Bogard, S.E., Funkhouser, D., LeBlanc, D.J., Bao, D., Blankespoor, A.D., Buonarosa, L.M., & Winkler, C.B. (2010). Integrated Vehicle-Based Safety Systems: Heavy-truck field operational test key findings report. Washington, DC: U.S. Department of Transportation, National Highway Traffic Safety Administration (DOT HS 811 362).
Schwebel, D.C., Severson, J., Ball, K.K., & Rizzo, M. (2006). Individual difference factors in risky driving: The roles of anger/hostility, conscientiousness, and sensation-seeking. Accident Analysis and Prevention, 38, 801-810.
Shahidi, S., Henley, S., Willows, J., & Furnham, A. (1991). Type A behaviour pattern: The effect of competition on heart rate and performance on a driving game. Personality and Individual Differences, 12, 1277–1282.
Shinar, D., & Compton, R. (2004). Aggressive driving: An observational study of driver, vehicle, and situational variables. Accident Analysis & Prevention, 36(3) 429–437.
Short, .J, Boyle, L., Shackelford, S., Inderbitzen, B., & Bergoffen, G. (2007). CTBSSP Synthesis 14: The role of safety culture in preventing commercial motor vehicle crashes a synthesis of safety practice. Transportation Research Board of the National Academies. Washington DC.

Human Factors in the Motor Carrier Industry in Canada 269
Shtarkshall, R. (1987). An examination of the concept “risk taking” and its application to the contraceptive behavior of youth. International Journal of Adolescent Medicine & Health, 3, 121–134.
Simon, F., & Corbett, C. (1996). Road traffic offending, stress, age and accident history among male and female drivers. Ergonomics, 39, 757-780.
Şimşekoğlu, Ö. & Lajunen, T. (2008). Social psychology of seat belt use: A comparison of theory of planned behavior and health belief model. Transportation Research Part F: Traffic psychology and Behavior, 11, 181-191.
Sivak, M., Soler, J., & Trankle, U. (1989). Cross-cultural differences in driver self-assessment. Accident Analysis and Prevention, 21, 371–375.
Smiley, A. (2002). Chapter 6: Fatigue and driving. In: P. Olson and R. Dewar (Eds.), Human factors and traffic safety. Lawyers & Judges Publishing Company, Inc. Tucson, Arizona.
Smiley, A. (2008). Session Three – Countermeasures. Report on Symposium Proceedings, symposium of the Highway safety roundtable.
Smiley, A., Smahel, M., Boivin, D.B., Boudreau, P., Remmers, J., Turner, M., Rosekind, M.R., & Gregory, K.B. (2011). Effects of a fatigue management program on fatigue in the commercial motor carrier industry. Research report prepared for Transport Canada.
Smith, H. (2009). Client factors predicting outcome in group treatment for driving anger. Dissertation Abstract International: Section B: The Science and Engineering, 69, 4445.
Smith, P. (2005). Bonus & incentive programs: do they work? Trucking. (http://truckinginfo.com/hdt/archives/2005/06/048a0506.asp).
Smith, S., Carrington, M., & Trinder, J. (2005). Subjective and predicted sleepiness while driving in young adults. Accident Analysis and Prevention, 37, 1066-1073.
Smolensky, M.H., Di Milia, L., Ohayon, M.M., & Philip, P. (2011). Sleep disorders, medical conditions, and road accident risk. Accident Analysis and Prevention, 43, 533-548.
SMS project team (2004). Background and fundamentals of safety management systems (SMS) for airlines. The Air Line Pilots Association, International.
Solomon, M., Compton, R., & Preusser, D. (2004). Taking the Click It or Ticket model nationwide. Journal of Safety Research, 35, 197−201.
Sommer, M., Herle, M., Häusler, J., Risser, R., Schützhofer, B., & Chaloupka, Ch. (2008). Cognitive and personality determinants of fitness to drive. Transportation Research Part F, 11, 362, 375.
Stacy, A.W., Newcomb, M.D., & Bentler, P.M. (1991). Cognitive motivation and problem drug use: A 9-year longitudinal study. Journal of Abnormal Psychology, 100, 502–515.
Stevens, A. (2008). European approaches to principles, codes, guidelines, and checklists for in-vehicle human-machine interaction. In: M.A., Regan et al. (Eds.), Driver distraction theory, effects, and mitigation. Guilford Press.
Stevenson, M.R., & Palarama, P. (2001). Behavioral factors as predictors of motor vehicle crashes: Differentials between young urban and rural drivers. Aust. N.Z.J. Public Halth, 24, 245-249.
Human Factors in the Motor Carrier Industry in Canada 270
Strayer, D.L., Drews, F.A., & Johnston,W.A. (2003). Cell phone-induced failures of attention during simulated driving. Journal of Experimental Psychology: Applied 9 (1), 23–32.
Strayer, D.L., & Johnston, W.A. (2001). Driven to distraction: Dual-task studies of simulated driving and conversing on a cellular telephone. Psychological Science, 12 (6), 1–5.
Stoohs, R.A., Bingham, L.A., Itoi, A., Guillemenault, C., & Dement, W.C. (1995). Sleep and sleep-disordered breathing in commercial long-haul truck drivers. Chest, 1275-82.
Stead, M., MacKintosh, A.M., Tagg, S., & Eadie, D. (2002). Changing speeding behaviour in Scotland: An evaluation of the ‘Foolsspeed’ campaign. Edinburgh: Scottish Executive Social Research Unit.
Stutts, J., Wilkins, J.W., & Vaughn, B.B. (1999). Why Do People Have Drowsy Driving Crashes? American Automobile Association Foundation for Traffic Safety, Washington, D.C.
Stutts, J., Knipling, R.R., Pfefer, R., Neuman, T.R., Slack, K.L., & Hardy, K.K. (2005). NCHRP report 500: Volume 14: A guide for reducing crashes involving drowsy and distracted drivers. Transportation Research Board, Washington D.C.
Sullman, M.J.M. (2004) Dimensions of aberrant behavior and their relation to crash involvement. Third International Conference on Traffic and Transport Psychology, Nottingham, UK.
Sullman, M.J.M., Meadows, M.L., & Pajo, K. (2002). Aberrant driving behaviors amongst New Zealand truck drivers. Transportation Research - Part F Traffic Psychology and behavior, 5, 217-232.
Summula, H. (1997). Hierarchical model of behavioural adaptation and traffic accidents. In: J. A. Rothengatter, & E. Carbonell Vaya (Eds.), Traffic and transport psychology: Theory and application. Oxford: Pergamon.
Sümer, N. (2003). Personality and behavioral predictors of traffic accidents: Testing a contextual mediated model. Accident Analysis & Prevention, 35, 949–964.
Sümer, N., Özkan, T., & Lajunen, T. (2006). Asymmetric relationship between driving and safety skills. Accident Analysis and Prevention, 38, 703-711.
Sundström, A. (2008). Self-assessment of driving skills – A review from measurement perspective. Transportation Research Part F, 11, 1-9.
Suratt, P. & Findley, L. (1999). Driving with sleep apnea. New England Journal of Medicine, 340, 881-882
Swisher, J. (1988). Problem-behavior theory and driving risk. Alcohol, Drugs and Driving, 4, 205–219.
Taubman-Ben-Ari, O., Mikulincer, M., & Gillath, O. (2004). The Multidimensional Driving Style Inventory – Scale construct and validation. Accident Analysis and Prevention, 36, 323–332.
Taylor, D. (1964). Driver’s galvanic skin response and the risk of accidents. Ergonomics, 7, 439-451.
TDC (2007). Development of a North American fatigue management program for commercial motor carriers – R & D project profile: Transport Canada: (http://www.tc.gc.ca/media/documents/innovation-eng/9664.pdf ).

Human Factors in the Motor Carrier Industry in Canada 271
Tay, R., Champness, P., & Watson, B. (2003). Personality and speeding: Some policy implications. International Association of Traffic and Safety Sciences (IATSS) Research, 27(1), 68–74.
Terán-Santos, J., Jimenez-Gomez, A., & Cordero-Guevara, J. (1999). The association between sleep apnea and the risk of traffic accidents. New England Journal of Medicine, 340, 847-851.
Thiffault, P. (1991). Étude de la perception du risque en situation de conduite automobile simulée. Mémoire de maîtrise. Montréal, QC : Université de Montréal.
Thiffault, P. (2004). Environmental and personality precursors of driver fatigue and hypovigilance. CARRS-Q Workshop on Monitoring Hypovigilance in Monotonous Conditions, Brisbane, Australia.
Thiffault, P. (2005a). When the road makes you drowsy: Individual differences related to task-induced fatigue. Final proceedings of the 2005 International Truck and Bus Safety & Security Conference. Alexandria, Virginia.
Thiffault, P. (2005b). Les déterminants de la prise de risque. In: F. Bellavance et al.: Les nouveaux conducteurs: Profil de risque, évaluation des compétences et tests. Centre de Recherche sur les Transports, CRT-2005.
Thiffault, P. (2007). Towards a strategy targeting human factors in the motor carrier industry in Canada. Transport Canada, internal report.
Thiffault, P., Bergeron, J. (1997). Vigilance et conduite sur autoroute : Différences interindividuelles et résistance à la monotonie. In: Proceedings of the Xth Canadian Multidisciplinary Conference on Road Safety. Toronto, pp. 454-464.
Thiffault, P., & Bergeron, J. (2003a). Monotony of road environment and drivers fatigue: A simulator study. Accident Analysis and Prevention, 35, 381-391.
Thiffault, P., & Bergeron, J. (2003b). The impact of individual differences on driver fatigue. Personality and Individual Differences, 34, 159-176.
Thomas, F.D., Blomberg, R.D., Peck, R.C., Cosgrove, L.A., & Salzberg, P.M. (2008). Evaluation of a high visibility enforcement project focused on passenger vehicles interacting with commercial vehicles. Journal of Safety Research, 39, 459-468.
Thomas, J.A., & Walton, D.K. (2007). Measuring perceived risk: Self-reported and actual hand positions of SUV and car drivers. Transportation Research Part F, 10(3), 201 -207.
Thomas, J.A., & Walton, D. (2008). Vehicle size and driver perceptions of safety. International Journal of Sustainable Transportation, 1556-8334, Volume 2, Issue 4, 260 – 273
Thuen, F., Klepp, K., & Wold, B. (1992). Risk-seeking and safety-seeking behaviours: A study of health-related behaviours among Norwegian school children. Health Education Research, 7, 269–276.
Tilmann, W. A., & Hobbs, G. E. (1949). The accident-prone automobile driver. American Journal of Psychiatry, 106, 321–331.
TIRF (2009). Program of research on the link between commercial truck driver licensing standards, training programs and safety performance. Phase 1: study conducted for the CTHRC.
Transport Canada (2001). Introduction to Safety Management Systems. Publication # TP13739, Transport Canada.
Human Factors in the Motor Carrier Industry in Canada 272
Transport Canada (2002). Safety Management Systems for flight operations and aircraft maintenance organizations: A guide for implementation. Publication # TP13881. Prepared by the Commercial and Business Aviation Branch and the Aircraft Maintenance and Manufacturing Branch.
Treat, J. R., Tumbas, N. S., McDonald, S. T., Shinar, D., Hume, R. D., Mayer, R. E., Stansifer, R. L., & Castellan, N. J (1979). Tri-level study of the causes of traffic crashes: Final report volume I: Causal factor tabulations and assessments. Institute for Research in Public Safety, Indiana University, DOT HS-805 085.
Triggs, T.J. (1994). Human performance and driving: The role of simulation in improving younger driver safety. In Proceedings of the 12th Triennial Congress of the International Ergonomics Association (Vol. 1. pp. 23-26). Toronto. ON: Human Factors Association of Canada.
Triggs, T.J., & Regan, M.A. (1998). Development of a cognitive skills training product for novice drivers. In Proceedings of the 1998 Road Safety Research, Education and Enforcement Conference (pp. 46-50). Wellington, New Zealand: Land Transport Authority.
Triggs, T.I., & Stanway, J. (1995). Simulation in driver training: A report of an Australian research program. In: Proceedings of the Road Safety in Europe, 2a (part 3, pp. 1-17).
Tronsmoen, T. (2008). Associations between self-assessment of driving ability and accident risk among young drivers. Transportation Research Part F: Traffic Psychology and Behaviour, 11, 334–346. Tronsmoen, T. (2010). Associations between driver training, determinants of risky
driving behaviour and crash involvement. Safety Science, 28, 35-45. Turner, C., & McClure, R. J. (2004). Quantifying the role of risk taking behaviour in
causation serious road crash related injury. Accident Analysis and Prevention, 36, 383–389.
Turner, C., McClure, R., & Pirozzo S. (2004). Injury and risk-taking behavior – A systematic review. Accident Analysis and Prevention, 36, 93-101.
Ulleberg, P. (2002). Personality subtypes of young drivers. Relationship to risk-taking preferences, accident involvement, and response to a traffic safety campaign. Transportation Research Part F, 4, 279-297.
Ulleberg, P., & Rundmo, T. (2003). Personality, attitudes and risk perception as predictors of risky driving behavior among young drivers. Safety Science, 41, 427-443.
U.S. DOT & FMCSA (2006). Report to the Congress on the Large Truck Crash Causation Study.
Uttal, B. (1983). Corporate Culture Vultures. Fortune, October 17, 1983. Van Dongen, H.P.A., Maislin, G., Mullington, J.M., & Dinges, D.F. (2003). The
cumulative cost of additional wakefulness: Dose-response effects on neurobehavioral functions and sleep physiology from chronic sleep restriction and total sleep deprivation. Sleep, 26, 117-136.
Van Dongen, H.P.A., Baynard, M.D., Maislin, G., & Dinges, D.F. (2004). Systematic inter-individual differences in neurobehavioral impairment from sleep loss: Evidence of trait-like differential vulnerability. Sleep, 27, 423–433.
Human Factors in the Motor Carrier Industry in Canada 273
Verwey, W.B., & Zaidel, D.M. (2000). Predicting drowsiness accidents from personal attributes, eye blinks and ongoing driving behaviour. Personality and Individual Differences, 28, 123–142.
Vingilis, E., Stoduto, G., Macartney-Filigate, M.S., Liban, C.B., & McLellan, B.A. (1994). Psychosocial characteristics of alcohol-involved and non-alcohol-involved seriously injured drivers. Accident Analysis and Prevention, 26, 195-206.
Wagenaar, W. (1992). Risk taking and accident causation. In: J.F. Yates (Ed), Risk-taking behavior. Wiley series in human performance and cognition. (pp. 257-281). xxii, 345pp.
Wallis, T.S., & Horswill, M.S. (2007). Using fuzzy signal detection theory to determine why experienced and trained drivers respond faster than novices in a hazard perception test. Accident Analysis and Prevention, 39, 1177-1185.
Wallén Warner, H., & Åberg, L. (2006). Drivers’ decision to speed: A study inspired by the theory of planned behavior. Transportation Research Part F, 9, 427–433. Wallén Warner, H., & Åberg, L. (2008). Drivers’ beliefs about exceeding the speed
limits. Transportation Research Part F, 11, 376–389. Walton, D. (1999). Examining the self-enhancement bias: Professional truck drivers_
perception of speed, safety, skill and consideration. Transportation Research Part F, 2, 91–114.
Ward Vanlaar, W., Simpson, H., Mayhew, D., & Robertson, R. (2008). Fatigue and drowsy driving: A survey of attitudes, opinions and behaviors. Transportation Research Part F, 39, 393-309.
Wieczorek, W.F., (1995). DWI offenders and alcohol-related crashes. In: C. N. Kloeden, & A. J. McLean, Proceedings of the 13th conference on alcohol, drugs and traffic safety, ICADTS -T95 (pp. 231-236). International Council on Alcohol, Drugs and Traffc Safety, Adelaide, Australia.
Wells-Parker, E., Cosby, P.J., & Landrum, J.W. (1986). A typology for drinking driving offenders: Methods for classification and policy implications. Accidents Analysis and Prevention, 18(6), 443-453.
Wells-Parker, E., Ceminsky, J., Hallberg, V., Snow, R. W., Dunaway, G., Guiling S., Williams, M., & Anderson, B. (2002). An exploratory study of the relationship between road rage and crash experience in a representative sample of US drivers. Accident, Analysis and Prevention, 34, 271-278.
West, R., Elander, J., & French, D. (1993). Mild social deviance, type-A behaviour pattern and decision-making style as predictors of self-reported driving style and traffic accident risk. British Journal of Psychology, 84, 207–219.
West R.J., French D.J., Kemp R. & Elander J. (1993) Direct observation of driving, self-reports of driver behavior and accident involvement. Ergonomics, 36, 557-567.
West, R., & Hall, J. (1997). The role of personality and attitudes in traffic accident risk. Applied Psychology: An International Review, 46, 253-264.
Wilde, G.J.S. (1982). The theory of risk homeostasis: Implications for safety and health. Risk Analysis, 2, 209–225.
Wilde, G.J.S. (2001). Target risk 2: A new psychology of safety and health. Toronto, Ontario: PDE Publications.
Human Factors in the Motor Carrier Industry in Canada 274
Wilde, G.J.S., Robertson, L.S., & Pless, B. (2002). For and against: Does risk homoeostasis theory have implications for road safety. British Medical Journal, 324, 1149–1152.
Williams, A.F., Paek, N.N, & Lund, A.K. (1995). Factors that drivers say motivate safe driving practices. Journal of Safety Research, 26, 119–124.
Williamson, A.M. (2008). The relationship between driver fatigue and driver distraction. In: The domain of truck and bus safety research. Transportation Research Circular E-C117.
Williamson, A.M., Feyer, A.-M., Friswell, R., & Finlay-Brown, S. (2002). Driver Fatigue: A survey of long distance heavy vehicle drivers in Australia. Australian Transport Safety Bureau report, # CR198.
Williamson, A.M., Feyer, A.-M., Mattick, R.P., Friswell, R., & Finlay-Brown, S. (2001). Developing measures of fatigue using an alcohol comparison to validate the effects of fatigue on performance. Accident Analysis and Prevention, 33, 313–326.
Williamson, A.M., & Boufous, S. (2007). A data-matching study of the role of fatigue in work-related crashes. Transportation Research Part F, 10, 242-253.
Williamson, A.M., Lombardi, D.A., Folkard, S., Stutts, J., Courtney, T.K., & Connor, J. (2011). The link between fatigue and safety. Accident Analysis and Prevention, 43, 498-515.
Willis, D.K. (1998). The impetus for the development of a new risk management training program for teen drivers. In: Proceedings of the Human Factors and Ergonomics Society 42nd Annual Meeting (pp. 1394-1395). Santa Monica, CA: Human Factors and Ergonomics Society.
Wilson, R.J., & Jonah, B.A. (1988). The application of problem behavior theory to the understanding of risky driving. Alcohol, Drugs and Driving, 4, 173–191.
Wilson, R.J. (1990). The relationship of seat belt non-use to personality, lifestyle and driving record. Health Education Research; Theory and Practice, 5, 175–185.
Wilson, R.J. (1991). Subtypes of DWIs and high-risk drivers: Implications for differential intervention. Alcohol, Drugs and Driving, 7, 1-12.
Wogalter, M.S., & Mayhorn, C.B. (2005). Perceptions of driver distraction due to cellular phones by cellular phone owners and non-owners. Human Factors, 47, 455-467.
World Health Organization (2004). World report on road traffic injury prevention. Geneva.
Wylie, C.D., Shultz, T., Miller, J.C., Mitler, M. M., & Mackie, R.R. (1996). Commercial motor vehicle driver fatigue study: Technical summary. Technical Report FHWA-MC-97-001. Springfield, VA: National Technical Information Service.
Yagil, D. (1998). Gender and age-related differences in attitudes towards traffic laws and traffic violations. Transportation Research Part F, 1, 123–135.
Yates, J.F., & Stone, E.R. (1992). The risk construct. In J. F. Yates (Ed.), Risk-taking behavior (pp. 1-25). New York: Wiley.
Yilmaz, V., & Çelik, H.E. (2008). A model for explanation of personal attitudes toward traffic of candidate drivers attending driver’s course: Risky candidate drive’s attitude model. Transportation Research Part F, 11, 233-241.
Human Factors in the Motor Carrier Industry in Canada 275
Young, T., Blustein, J., Finn, L., & Palma, M. (1997). Sleep-disorder breathing and motor vehicle accidents in population-based sample of employed adults. Sleep, 20, 608-613.
Yu, J., & Williford, W.R. (1993). Alcohol and risk/sensation seeking: Specifying a causal model on high-risk driving. Journal of Addictive Diseases, 12, 79–95.
Zhou, R., Wu., C., Rau., P., & Zhang, W. (2009). Young driving learners’ intention to use a handheld or hands-free mobile phone while driving. Transportation Research Part F, 12, 208-217.
Zuckerman, M. (1979). Sensation seeking : Beyond the optimal level of arousal. London : Lawrence Erlbaum Associates. Zuckerman, M. (1983). Biological bases of sensation seeking, impulsivity and anxiety.
London : Lawrence Erlbaum associates. Zuckerman, M. (1994) Behavioural expressions and biosocial bases of sensation-seeking.
Cambridge: Cambridge University Press. Zuckerman, (2007). Sensation seeking and risky behaviors. American Psychological Association, Washington DC.
Zuckerman, M. & Neeb, M. (1979) Sensation-seeking and psychopathology. Psychiatry Research, 1, 255-264.
Zuckerman, M., & Neeb, M. (1980). Demographic influences in sensation seeking and expressions of sensation seeking in religion, smoking, and driving habits. Personality and Individual Differences, 1, 197–206.
Zwicker, T., Chaudhary, N., Solomon, M., Siegler, J., & Meadows, J. (2007). West Virginia's impaired driving high-visibility enforcement campaign, 2003-2005. Washington, DC: U.S. Department of Transportation, National Highway Traffic Safety Administration (DOT HS 810 792).

Human Factors in the Motor Carrier Industry in Canada 276
Human Factors in the Motor Carrier Industry in Canada 277
Appendix I Quebec’s original input to phase II survey (French). Concernant les erreurs de reconnaissance : Plus spécifiquement pour la distraction, le gouvernement du Québec a introduit au Code de la sécurité routière depuis le 1er avril 2008, une interdiction d’utiliser un téléphone cellulaire tenu en main, c’est-à-dire sans la fonction « mains libres ». La Société produit depuis plusieurs années des outils de sensibilisation sur l’augmentation du risque d’être impliqué dans un accident, tout comme l’augmentation du risque de commettre des infractions lorsqu’on conduit en utilisant un téléphone cellulaire tenu en main. Les normes de signalisation routière de la collection des Normes - Ouvrages routiers du ministère des Transports, font l’objet d’un processus permanent de mise à jour. Les normes ont pour objectif d’aider l’usager de la route tout au long de son parcours, en lui permettant d’adapter sa conduite aux diverses situations qui se présentent et d’éviter de fausses manœuvres. Amélioration de la signalisation (uniformité, visibilité des panneaux, etc.) à l’approche et dans les zones de travaux routiers. Publication annuelle d’un plan d’action en matière de sécurité sur les sites des travaux routiers. La sécurité et la communication par l’utilisation d’une signalisation adéquate constituent deux grandes orientations du plan d’action. Réalisation d’un projet pilote sur l’utilisation d’un nouveau panneau de signalisation à l’intention des camionneurs pour les informer du risque de renversement. Ce panneau pourra éventuellement être intégré aux normes de signalisation. Utilisation accrue des systèmes de transports intelligents (panneaux à messages variables) afin de fournir aux usagers de la route des renseignements opportuns et précis. Utilisation de tête de feux de circulation munis de lanternes de type module à diodes électroluminescentes (DEL) pour assurer une plus grande visibilité des signaux. Pour améliorer leur visibilité, les remorques et les semi-remorques dont la masse nette est de plus de 3000 kg, doivent être munies de matériaux réfléchissants (bandes réfléchissantes) conformément à la Loi sur la sécurité des véhicules automobiles. Pour les autobus scolaires, ajout d’une nouvelle mesure rendant obligatoire le présignalement d’arrêt scolaire avec feux jaunes d’avertissement alternatifs qui avertissent que l’autobus s’apprête à s’immobiliser pour y faire monter ou descendre des élèves. Sensibilisation auprès des automobilistes : campagne de sécurité sur les angles morts des véhicules lourds (à l’avant, à l’arrière et de chaque côté du véhicule). Note : nous sommes d’avis que plusieurs erreurs de reconnaissance sont dues à un manque de connaissance des règles du Code de la sécurité routière (ex : céder le passage, garder la droite, etc.) et des particularités propres aux autres usagers de la route (ex : angles morts d’un véhicule lourd, les distances de freinage des véhicules lourds, etc.) Le cours de conduite en développement à la Société devrait contribuer à améliorer le niveau de connaissance chez les nouveaux conducteurs et améliorer ainsi la prise de décision en situation de conduite.
Human Factors in the Motor Carrier Industry in Canada 278
Concernant les erreurs de décision :
Campagnes de sensibilisation sur la vitesse. Campagnes de sensibilisation sur la sécurité aux abords et dans les zones de travaux. Campagnes de sensibilisation sur la sécurité en conditions hivernales. Campagnes de sensibilisation sur la courtoisie au volant. En déclarant l’année 2007, l’Année de la sécurité routière, l’accent a été mis sur l’importance d’adapter des comportements de conduite sécuritaires : dans 80 % des accidents, le comportement est en cause. Il y a eu au cours de cette année, de nombreuses campagnes de sensibilisation, en plus des activités de mobilisation et de contrôle. Adoption le 19 décembre 2007 du projet de loi modifiant le Code de la sécurité routière et le Règlement sur les points d’inaptitude. La nouvelle loi introduit des sanctions plus sévères à l’égard des récidivistes pour la conduite avec les facultés affaiblies ainsi que pour les grands excès de vitesse. Par ailleurs, le thème de la capacité de conduite affaiblie et les distractions au volant est actuellement discuté au sein de la Table Québécoise de la Sécurité Routière. À compter du 1er janvier 2009, nouvelle obligation visant les véhicules lourds pour l’activation permanente des limiteurs de vitesse de manière à les empêcher de dépasser 105 km/h. Au cours de l’année 2009, début d’un projet pilote de radars photo et de caméras aux feux rouges, à 15 endroits répartis dans trois régions du Québec. Contrôle policier : · Présence accrue sur le réseau routier. · Opération spécifique par exemple Opération vitesse orange pour inciter les conducteurs à adopter leur conduite à l’environnement routier, à l’approche et dans une zone de travaux. Depuis environ 4 ans, la Société et ses partenaires rappellent aux conducteurs les règles élémentaires de la courtoisie au volant et l’importance d’un respect mutuel entre les usagers de la route. L’accent est ainsi mis sur des règles du Code de la sécurité routière qui permettent d’éviter des accidents tels que : suivre de trop près, couper un autre véhicule, le respect des limites de vitesse dans les zones urbaines, etc. Cette activité comprend deux volets : sensibilisation et contrôle policier Note : Nous sommes d’avis que les erreurs de décision décrites ci-haut sont davantage en lien avec les comportements à risque que l’on retrouve chez certaines catégories de titulaires de permis de conduire, en autres, chez les jeunes conducteurs.
Concernant les erreurs de performance : Utilisation des normes de conception routière de la collection des Normes - Ouvrages routiers du ministère des Transport, qui font l’objet d’un processus permanent de mise à jour. Conception routière selon le concept des abords de route qui pardonnent (élimination, déplacement ou protection des obstacles, largeur d’accotement, pente de talus, courbes, etc.) de manière à réduire les conséquences d’une perte de contrôle suivie d’une sortie de route. Accentuation des mesures visant à pardonner les erreurs de conduite (installation de bandes rugueuses, pavage des accotements, etc.) Correction des sites ayant une problématique de sécurité. Réalisation d’audits de sécurité routière aux différentes étapes d’un projet routier pour en garantir la qualité en matière de sécurité routière.
Human Factors in the Motor Carrier Industry in Canada 279
Concernant les erreurs de non-performance : Bien entendu, le Code criminel, de juridiction fédérale, s’applique pour sanctionner certaines actions en lien avec la non-performance au volant, en particulier les articles 253 à 255. Au niveau provincial, nous avons le Code de la sécurité routière qui sanctionne la conduite avec les facultés affaiblies en prévoyant des suspensions de permis, la saisie du véhicule, la révocation du permis. Dans certains cas, la personne doit obligatoirement suivre une session éducative appelée « Alcofrein ». Dans tous les cas de conduite avec les facultés affaiblies par l’alcool et/ou la drogue, la personne doit subir une évaluation pour établir si son rapport à l’alcool ou aux drogues ne compromet pas la conduite sécuritaire d’un véhicule (la teneur et la durée de l’évaluation dépend de l’infraction commise). Le Code établit également des périodes obligatoires pour l’utilisation d’un antidémarreur éthylométrique. Si vous voulez davantage de précisions par rapport aux différentes sanctions en fonction des infractions commises, je vous invite à consulter nos différentes publications, disponibles sur notre site Web : http://www.saaq.gouv.qc.ca/documents/documents_pdf/index.php En lien avec la condition médicale, le Code de la sécurité routière oblige le titulaire d’un permis à informer la SAAQ de tout changement concernant sa condition de santé, dans un délai de 30 jours suivant le changement. De plus, il nous permet d’exiger un examen médical ou une évaluation sur la santé d’un titulaire de permis. La SAAQ a même le pouvoir de désigner nommément le médecin spécialiste ou le professionnel de la santé qu’elle désire. La personne a alors un délai de 90 jours pour fournir le rapport d’examen demandé. Si elle refuse de se soumettre à l’examen ou à l’évaluation ou qu’elle omet de remettre à la Société le rapport demandé, nous suspendons le permis. Les demandes d’examen médical peuvent être faites à tout moment. Cependant, certains contrôles médicaux sont statutaires et se font à des âges précis. Pour les détenteurs de permis des classes supérieures, les contrôles se font à 45 ans, 55 ans, 60 ans, 65 ans et tous les 2 ans par la suite. Quant aux titulaires de permis de classe 5, le premier contrôle statutaire se fait à 75 ans, le second à 80 ans et tous les deux ans par la suite. En complément au Code, nous avons un Règlement sur les conditions d’accès à la conduite d’un véhicule routier relatives à la santé des conducteurs qui dicte les exigences précises en matière de condition de santé. Concernant l’ensemble des erreurs de non performance, la SAAQ publie des dépliants, anime des activités de sensibilisation lors de colloques, organise des programmes spécialisés dans les écoles ainsi qu’en entreprise, sensibilise le réseau des établissements licenciés, en plus de payer des campagnes publicitaires visant le grand public. De plus, nous réalisons des séances de sensibilisation auprès des médecins et des professionnels de la santé de la province pour améliorer le dépistage et le signalement des conducteurs potentiellement à risque sur la route.

Human Factors in the Motor Carrier Industry in Canada 280
Nous entretenons également des liens avec les différents corps policiers à ce sujet. La SAAQ est aussi un partenaire important de l’Opération Nez Rouge qui se déroule chaque année en décembre et qui vise le raccompagnement des conducteurs qui ont consommé de l’alcool. Campagnes de sensibilisation sur les heures de conduite et de repos pour les conducteurs de véhicules lourds. Utilisation et amélioration du réseau d’aires de repos sur le réseau routier québécois. Installation de bandes rugueuses latérales sur le réseau autoroutier. Réalisation d’un projet pilote pour l’utilisation de bandes rugueuses médianes lorsque opportun (par exemple sur des autoroutes à chaussée unique bidirectionnelle). Contrôle policier à l’égard de la conduite avec les capacités affaiblies par l’alcool, la fatigue, les médicaments ou autres drogues. Pour tous les conducteurs : Publication de plusieurs articles dont le contenu vise à sensibiliser tous les conducteurs à l'importance de la problématique de la fatigue au volant et à les informer des moyens à privilégier pour la prévenir et la contrer. Réalisation en français et en anglais, d’un dépliant « Arrêtez-vous dès les premiers signes de fatigue » (octobre 2007), dépliant qui s'adresse à l'ensemble des usagers de la route. Ce document apprend à l'usager à reconnaître les premiers signes de fatigue, il révèle les principaux facteurs aggravants l’état de fatigue et il propose des moyens de prévenir et de gérer la fatigue à la maison, avant de prendre la route et sur la route. Sensibilisation de tous les formateurs du Club automobile du Québec (CAA) à la problématique de la fatigue au volant. Il est prévu qu'une mise à niveau de cette formation sera réalisée à l’automne 2009. Réalisation au printemps 2007 d’un sondage auprès des policiers et des contrôleurs routiers (937 répondants). Ce sondage avait pour objectif d'orienter les actions de la Société en matière de prévention contre la fatigue, la somnolence et l'endormissement au volant; de recueillir les perceptions, connaissances et opinions des policiers et des contrôleurs routiers sur la fatigue au volant; de constituer une base de données servant à orienter les actions de la Société en matière de prévention contre la fatigue au volant. Les résultats obtenus par cette démarche ont été présentés à la table Société-COPS. Ils ont notamment conduit au développement d'un feuillet de sensibilisation s'adressant à l'ensemble des usagers de la route, feuillet que le policier peut remettre à un conducteur fatigué lors d'un contrôle sur route. Analyse de 127 rapports de coroners (octobre 2007) où la fatigue était identifiée comme étant la cause probable de l’accident. Faits saillants : 87 % des conducteurs décédés sont des hommes et 45 % ont moins de 29 ans; plus de 60 % des accidents ont eu lieu durant les creux circadiens (début d’après-midi et la nuit); 84 % ont lieu sur les autoroutes, routes et rangs (voies rapides, trajets droits et monotones). Ces constats nous permettront d’orienter nos actions en matière d’éducation et de sensibilisation des usagers de la route. Production en juin 2008, en collaboration avec le ministère des Transports du Québec (MTQ), de messages destinés aux panneaux lumineux placés aux abords des autoroutes dans le but de sensibiliser les conducteurs aux risques d’accidents liés à la fatigue au volant.
Human Factors in the Motor Carrier Industry in Canada 281
La Société vient de réaliser un sondage (janvier 2009) qui vient confirmer la méconnaissance des dangers liés à la fatigue et le profil des conducteurs à risque, notamment les jeunes de 16 à 24 ans. Notons que 36 % des répondants avancent que le fait d’être fatigué n’a pas d’impact sur leur manière de conduire, cette proportion grimpe à 44 % chez les 16 à 24 ans. Pour les conducteurs professionnels : La Société a donné plusieurs conférences sur la fatigue au volant lors de congrès annuels des associations de transports et à l’occasion des journées portes ouvertes organisées par Contrôle routier Québec. Participation depuis l’automne 2000, au projet pilote nord-américain visant le développement, la mise en application et l’évaluation des mérites d’un Programme de gestion de la fatigue (PGF) à l’intention de l’industrie du transport routier. La mise au point du programme est prévue pour décembre 2009. En participant activement à l’élaboration du programme de gestion de la fatigue, la Société s’assure une position de leader aux niveaux national et international au plan de la mécanique de la fatigue et du sommeil. Production d’un dépliant de sensibilisation dont le thème est la « Fatigue au volant » et qui vise à sensibiliser les conducteurs professionnels aux principaux facteurs aggravants l’état de fatigue et sur l’importance de s’arrêter dans un endroit sécuritaire pour se reposer aussitôt que les premiers signes de fatigue se manifestent. Rédaction et diffusion via le site Internet de la SAAQ (au printemps 2009) d’un Guide de gestion de la fatigue à l’usage de l’industrie du transport routier. Réalisation en collaboration avec une entreprise de transport routier, d’une vidéo sur la fatigue au volant. Outil de formation et de sensibilisation aux risques de conduire en état de fatigue, ladite vidéo est disponible à toutes les entreprises de transport. La Société vient de réaliser un sondage (janvier 2009) qui vient confirmer les conducteurs professionnels comme clientèle à risques en raison de l’importance du kilométrage parcouru.