Embed Size (px)
Citation preview

Nomura Global Chemical Industry Leaders Conference
Addressing Essential Needs for Life
Venice, March 21-22, 2013

P. 2
Important Legal Notes
The information delivered or to be delivered to you does not constitute an offer or a recommendation to do any transaction in Israel Chemicals Ltd. (ICL) securities. Although our shares may be bought and sold on the Tel Aviv Stock Exchange (TASE) at any trading time, they do not trade out of Israel - neither in the United States, nor EU ,nor elsewhere and this presentation does not constitute an offer or investment advice to any US or other person at this time. If we ever do so, our offer will only be made by a prospectus or a registration statement conforming with all requirements of U.S., EU or any other applicable law. Certain statements in this presentation and other oral and written statements made by ICL from time to time, are forward-looking statements, including, but not limited to, those that discuss strategies, goals, outlook or other non-historical matters; or project revenues, income, returns or other financial measures. These forward-looking statements are subject to risks and uncertainties that may cause actual results to differ materially from those contained in the statements, including, among others, the following: (a) Crisis in financial markets;(b) War or terror operations;(c) Impacts on sales of fertilizers (product prices, government policies and weather); (d) Subjection to legislative and licensing restrictions;(e) Exposure relating to environmental protection and safety;(f) Third party liability and product liability; (g) Volatility in the markets that affects the demand for some of the products; (h) Concessions and permits; (i) Natural disasters; (j) Water level in Pond 150 in Dead Sea;(k) Dependence on seaports, transportation and loading in Israel. We caution you that the above list of important factors is not comprehensive. We refer you to filings that we have made and shall make with the TASE. They may discuss new or different factors that may cause actual results to differ materially from this information. All information included in this document speaks only as of the date on which they are made, and we do not undertake any obligation to update such information afterwards. Some of the market and industry information is based on independent industry publications or other publicly available information, while other information is based on internal studies. Although we believe that these independent sources and our internal data are reliable as of their respective dates, the information contained in them has not been independently verified and we can not assure you as to the accuracy or completeness of this information. Readers and viewers are cautioned to consider these risks and uncertainties and to not place undue reliance on such information.

P. 3
Company Basics
From Basic Minerals to Downstream Products and Performance Solutions

P. 4
A global manufacturer of fertilizers & specialty chemicals. Headquartered in Israel, worldwide operations.
2012 revenues: US$ 6.6 billion; Net Income: US$ 1.3 billion.
About 46% of revenues derived from production activities outside of Israel; ~95% of sales occur outside of Israel.
12,280 employees as of December 2012.
Trading: Tel-Aviv Stock Exchange (TASE: ICL).
Market cap*:~$16.3 billion
Dividend yield: 2012: 6.4%; Decade average: 5.2%.
ICL – A Global Player
* As of March 14 , 2013
Israel Corp (ILCO) 52%
Public 34%
Potash Corp (POT)
14%
ICL Shareholders
P. 5
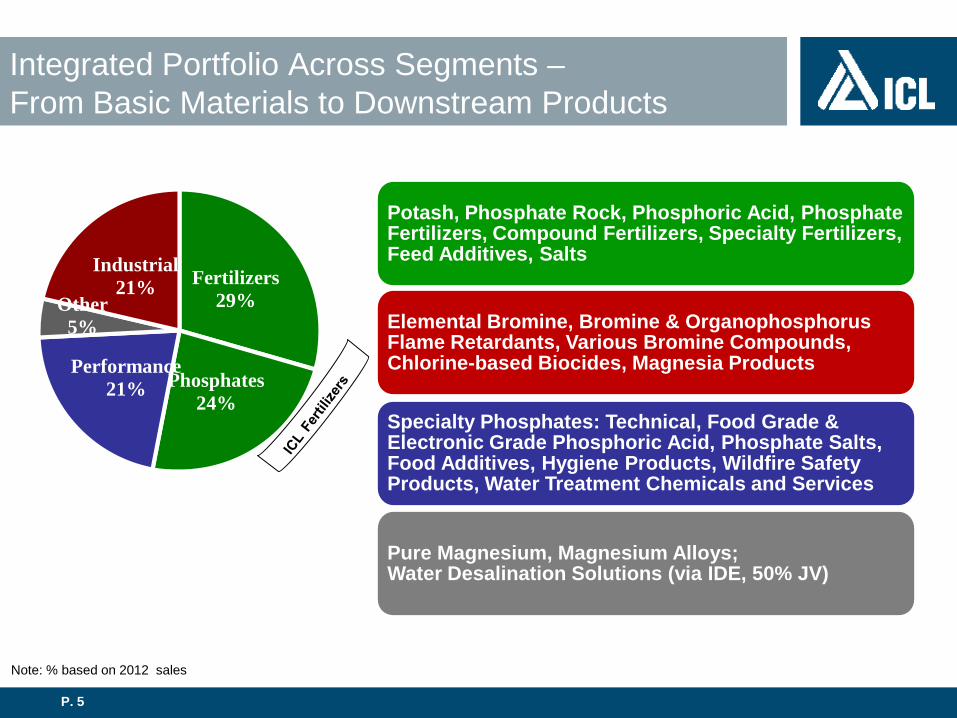
Fertilizers 29%
Phosphates 24%
Performance 21%
Other 5%
Industrial 21%
Integrated Portfolio Across Segments – From Basic Materials to Downstream Products
Note: % based on 2012 sales
Potash, Phosphate Rock, Phosphoric Acid, Phosphate Fertilizers, Compound Fertilizers, Specialty Fertilizers, Feed Additives, Salts
Elemental Bromine, Bromine & Organophosphorus Flame Retardants, Various Bromine Compounds, Chlorine-based Biocides, Magnesia Products
Specialty Phosphates: Technical, Food Grade & Electronic Grade Phosphoric Acid, Phosphate Salts, Food Additives, Hygiene Products, Wildfire Safety Products, Water Treatment Chemicals and Services
Pure Magnesium, Magnesium Alloys; Water Desalination Solutions (via IDE, 50% JV)

P. 6
An Essential Needs Company, Contributing to Humanity’s Core Necessities in Agriculture, Food, Materials & Energy
Agriculture Food
Materials Water & Energy
ICL
Development of a stricter regulatory
environment & growing ecological
awareness
Globalization & rapid
growing rate of the world’s
population
Global
warming
Growing public
awareness of health issues
Shifting economic growth to
developing countries
Shortages in arable land per capita
Better nutrition in
the emerging markets

P. 7
Access to Vast, Low Cost Natural Resources
Potash
Phosphates
The Negev Desert
The Dead Sea Bromine
Magnesium
Salts
Iberpotash (Spain) & CPL (England)
Polyhalite
Peat Mining Sites (UK)
(Israel)
(Israel)

P. 8
• Environmentally friendly pond evaporation system, saves the burning of about 10 million tons of coal or diesel oil each year.
• Use of natural gas in Israel, as of mid 2010, reduces CO emissions to the atmosphere.
Dead Sea Potash - Unique Solar driven Technology and Open Air Storage
Dredging Operation
2 Production Lines
Evaporation Process
Open Air Storage Capacity
2

P. 9
Most Concentrated Source of Bromine in the World
10-12 g/l
2-6 g/l
0.2 g/l
0.05 g/l
Dead Sea Brine
Brine Wells )USA* and Russia(
Underground Wells )China(
Sea Water )China, India, Japan(
Bromine: Lowest Cost, Virtually Unlimited Reserves
* Arkansas – brine wells of Chemtura & Albemarle
P. 10
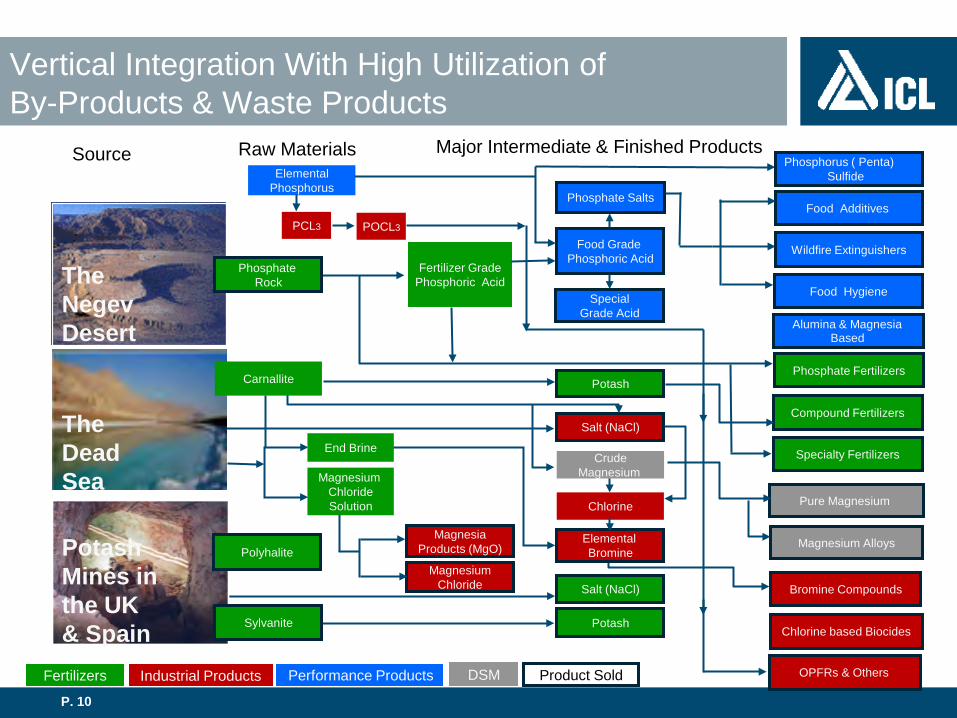
Vertical Integration With High Utilization of By-Products & Waste Products
The Negev Desert
Phosphate Fertilizers
Fertilizer Grade Phosphoric Acid
Food Grade Phosphoric Acid
Salt (NaCl)
Phosphate Salts
Pure Magnesium
Magnesium Alloys
Compound Fertilizers
Salt (NaCl)
Potash
Specialty Fertilizers
Chlorine based Biocides
Bromine Compounds
Magnesium Chloride Solution
Magnesium Chloride
Raw Materials
Potash
The Dead Sea
Potash Mines in the UK & Spain Sylvanite
Crude Magnesium
Fertilizers Industrial Products Performance Products DSM Product Sold
End Brine
Carnallite
Elemental Bromine
Phosphate Rock
Chlorine
Elemental Phosphorus
Special Grade Acid
OPFRs & Others
Magnesia Products (MgO)
Source Major Intermediate & Finished Products
Food Hygiene
Wildfire Extinguishers
Food Additives
Phosphorus ( Penta) Sulfide
Alumina & Magnesia Based
Polyhalite
PCL3 POCL3
P. 11
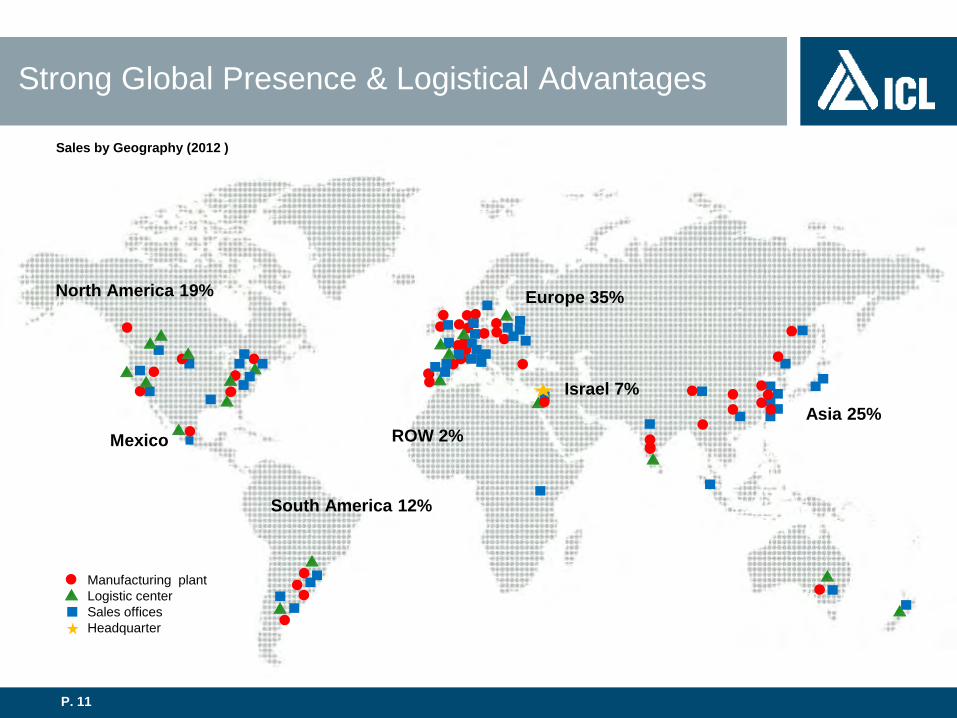
Strong Global Presence & Logistical Advantages
Europe 35%
Asia 25% Israel 7%
ROW 2%
North America 19%
South America 12%
)Sales by Geography (2012
Manufacturing plant Logistic center Sales offices Headquarter
Mexico

P. 12
Leading Player in Global Industries
#1 in elemental bromine ~40% of global production capacity
#1 in phosphorus-based flame retardants
#1 in specialty phosphates
#1 in wildfire safety products
#1 producer of PK fertilizers (compound potash & phosphate fertilizers)
#2 Europe and #6 Worldwide in potash sales
#2 Western world magnesium production, and...
Major player in specialty fertilizers & specialty chemical niche markets

P. 13
1,981 2,271 2,715 2,986 3,2584,103
6,904
4,554 5,692
7,068 6,672
$ millions
Leading Market Positions & Balanced Portfolio Counterbalance External Headwinds
Sales
* 2002-2006 figures are based on Israeli GAAP, 2007-2012 are based on IFRS
92 103 251 422 374 553
2,004
7701,025
1,5121,301
199 203 354561 536
743
2,336
9381,346
1,9261,577
2002 2003 2004 2005 2006 2007 2008 2009 2010 2011 2012
Net Income Operating Income
P. 14
Company & Market Updates

P. 15
Meeting the Challenge of Growing Demand for Food
ICL Fertilizers

P. 16
Potash55%Fertilizers &
Phospates45%
ICL Fertilizers: A Variety of Commodity & Specialty Fertilizers
Segment Sales - 2012: $ 3.5 Billion
Based on 2012 external sales

P. 17
-
2
4
6
8
10
12
-
50
100
150
200
250
300
USA EU-27 China Brazil Mexico India
Nut
rient
u
sage
, Kg
per
Ha
N P2O5 K2O Yield [t/ha]
Potential for Increasing Crop Yield in Major Food Growing Countries by Improved Fertilizer Application
Source: USDA, IFA
Example: Corn
Cro
p Yi
eld
Tonn
es, p
er H
a
P. 18
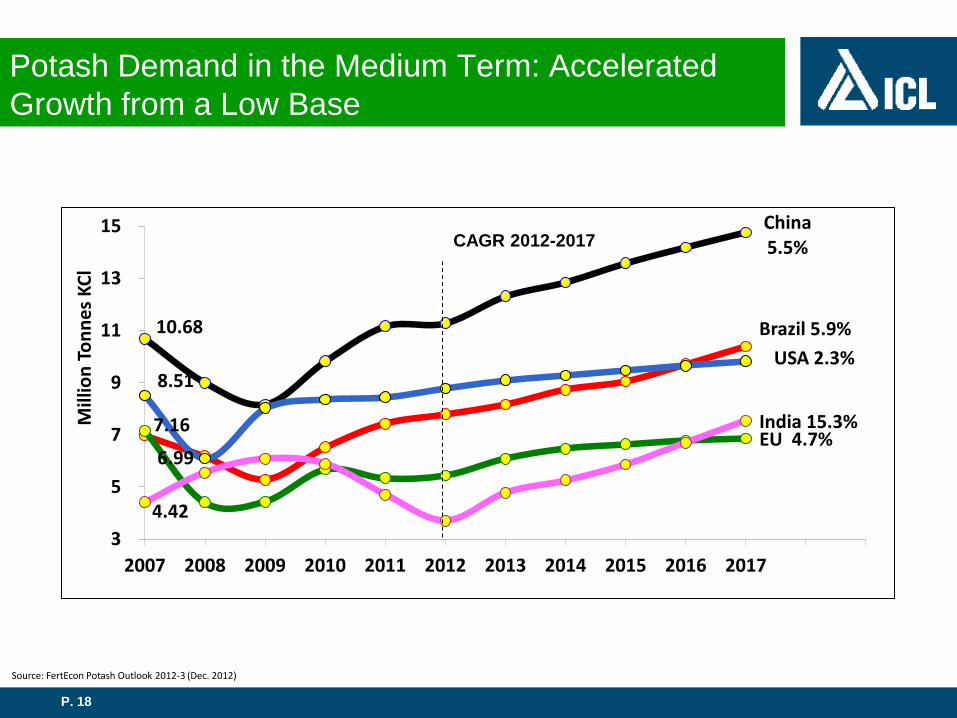
Potash Demand in the Medium Term: Accelerated Growth from a Low Base
6.99
Brazil 5.9% 10.68
China 5.5%
7.16 EU 4.7%
4.42
India 15.3%
8.51 USA 2.3%
3
5
7
9
11
13
15
2007 2008 2009 2010 2011 2012 2013 2014 2015 2016 2017
Mill
ion
Tonn
es K
Cl
Source: FertEcon Potash Outlook 2012-3 (Dec. 2012)
CAGR 2012-2017

P. 19
China imports (total 6.3Mt)
India imports (total 3.4Mt)
Brazil imports (total 7.3Mt)
ICL’s 2012 Potash Market Share Is Consistent with its Strategy to Benefit from the Fast Growing Emerging Markets
Sources: China Fertilizer Weekly Market Report, Sindicaro Da Industria DE Adubose Corretivos Agricolas No Estado De Sao Paulo, Company estimates
* India, China & Brazil imports for January—December 2012
BPC 49.7%
Canpotex 12.8%
ICL 21.6%
APC 7.6%
K+S 4.5%
Other 3.8% BPC
33.3%
Canpotex 25.8%
ICL 13.8%
K+S 16.5%
Mosaic 0.4%
PCS 5.9%
SQM 4.4%
Uralkali 45.3%
Belaruskali 13.1%
Canpotex 15.9%
K+S 3.9%
ICL 12.9%
APC 7.2%
SQM 1.0% 0.6%

P. 20
ICL Maintained its Potash Market Share in China & India based on 2013 Seaborne Contracts
India China
• Source: Companies announcements through March 17.
Canpotex 33%
BPC 33%
ICL 21%
APC 8%
K+S 5%
Total Contracted 2.76 Mt
Canpotex 31%
BPC 28%
ICL 25%
APC 11%
K+S 5%
Total contracted 3.6 Mt
P. 21
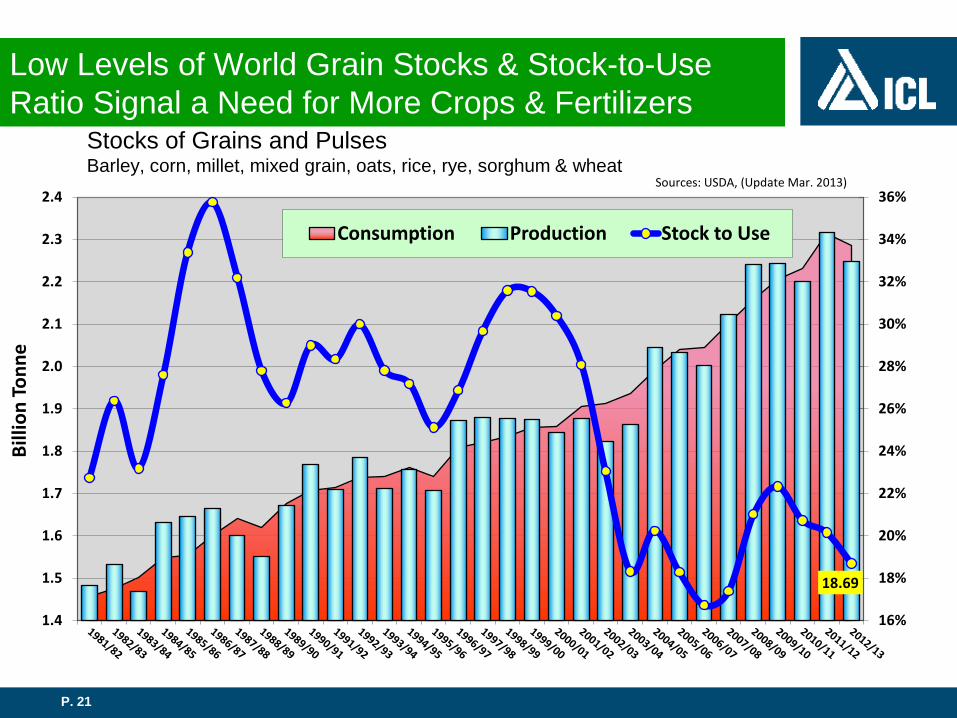
Low Levels of World Grain Stocks & Stock-to-Use Ratio Signal a Need for More Crops & Fertilizers
Stocks of Grains and Pulses Barley, corn, millet, mixed grain, oats, rice, rye, sorghum & wheat
18.69
16%
18%
20%
22%
24%
26%
28%
30%
32%
34%
36%
1.4
1.5
1.6
1.7
1.8
1.9
2.0
2.1
2.2
2.3
2.4
Billi
on To
nne
Consumption Production Stock to Use
Sources: USDA, (Update Mar. 2013)
P. 22
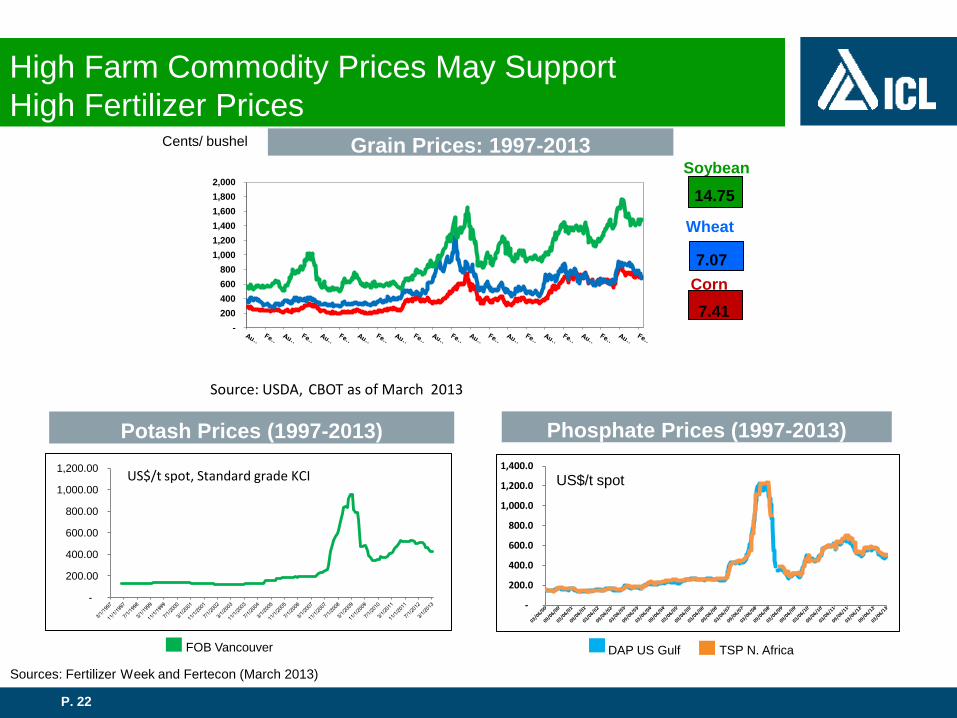
High Farm Commodity Prices May Support High Fertilizer Prices
Sources: Fertilizer Week and Fertecon (March 2013)
Potash Prices (1997-2013)
FOB Vancouver
Phosphate Prices (1997-2013)
TSP N. Africa DAP US Gulf
Grain Prices: 1997-2013
Source: USDA, CBOT as of March 2013
Wheat
Corn
Soybean Cents/ bushel
14.75
7.41
7.07
-
200.00
400.00
600.00
800.00
1,000.00
1,200.00 US$/t spot, Standard grade KCI
- 200 400 600 800
1,000 1,200 1,400 1,600 1,800 2,000
-
200.0
400.0
600.0
800.0
1,000.0
1,200.0
1,400.0 US$/t spot
P. 23
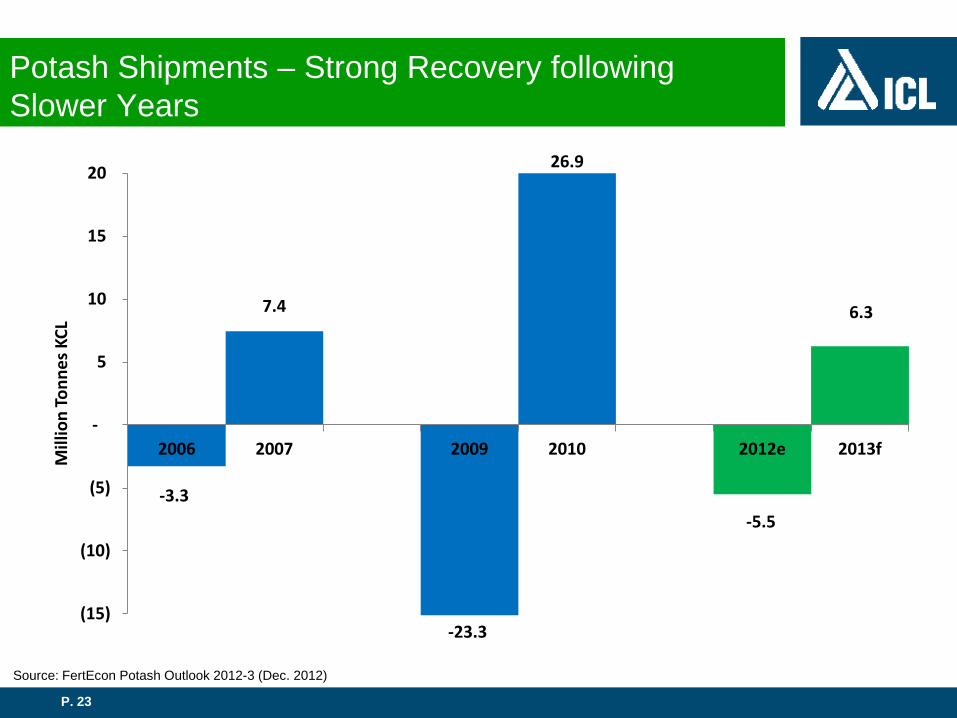
Potash Shipments – Strong Recovery following Slower Years
-3.3
7.4
-23.3
26.9
-5.5
6.3
(15)
(10)
(5)
-
5
10
15
20
2006 2007 2009 2010 2012e 2013f Mill
ion
Tonn
es K
CL
Source: FertEcon Potash Outlook 2012-3 (Dec. 2012)

P. 24
Most of the Additional Potash Capability in the Medium Term Will Come from Existing Players
* Potash capability – 90% of potential capacity.
Source: Company Reports, FertEcon , ICL calculations
Potash Capability* Forecast 2012-2016, By Region
65
81
5.3 4.5
3.4 2.8
Total Consumption 53
Total Consumption 67
0
10
20
30
40
50
60
70
80
90
Capability 2012E Potash Corp Other NA FSU Other Capability 2016F
Mill
ion
Tonn
es K
Cl

P. 25
Expanding Capacity (Stage 11) Increasing the annual production capacity of the potash plants in Sodom. Benefit from the project to begin in 2015.
Pond no.5 Dikes’ Solidification Construction of a new partition in the middle of the dike to minimize seepage,
as well as raising the dike by 1 meter. Total cost - $475 million to be spent over 2011-2014.
Pond no. 5 Salt Dredging Project ICL established the “Meshivim” division to execute the project. ICL will finance 80% of the salt dredging costs estimated at ILS ~3 billion in PV. Environmentally Friendly Power Plant in Sodom 250 MW capacity to serve the plant’s growing needs for steam and electricity. Cogeneration Power Plant based on natural gas (dual-fuel). Total cost - $320 million. To be completed in 2H2015. Pumping Station P-9 Replacing the existing main pumping station P-88.
Transforming ICL’s Potash Operations to Improve Competitiveness – Major Projects at Dead Sea Works (Israel)

P. 26
Phoenix Project – Phase 1 (Spain) Create a single production site based on a high-grade mine (Cabanasas): From two mines and plants to one mine and plant with similar capacity. 0.75M tonnes/yr vacuum salt. Utilizing economies of scale to reduce costs. Total cost: €160 million. To be completed in 2014. Phase 2: Increasing MOP annual output to 1.1 million tonnes: Increasing vacuum salt annual capacity to 1.5 million tonnes.
Polyhalite (PolysulphateTM) at CPL (England): The first company in the world to market this new product. A natural fertilizer with 14% K2O, 50% SO3, 7% MgO & Chlorine<2%. Vast reserves – 1 billion tonnes. Easy accessibility, Favorable mineralogy. Using existing infrastructure. First sales in 2012.
Transforming ICL’s Potash Operations to Improve Competitiveness - Iberpotash (Spain) & CPL (England)

P. 27
Phosphates – Mined from the Negev Desert in Israel
3 Open Pit Mines Restored Mine
Potential Production Capacity (bulk products):
Phosphate rock: ~4.5 million tonnes
Phosphoric acid: ~550 thousand tonnes
Phosphate & compound fertilizers (TSP, SSP, NPKs): ~1.9 million tonnes
Bulk production sites: Rotem (IS), Amsterdam (ND), Ludwigshafen (GE)
In addition: Specialty fertilizers, animal feed additives

P. 28
Faster growing markets (5%-8% per annum)
Environmentally-friendly products to global agricultural market: WSNPK, CRF, SRF, MKP, MAP & liquids for the specialty agriculture, ornamental horticulture and turf markets
Unique coating technologies:
Extends ICL’s fertilizer business downstream and creates a platform for geographical expansion Strong advantages: wide and strong sales force and Best-in-Class R&D and technology
ICL is One of the Global Leaders in Specialty Fertilizers
1. NPK granules are partially coated with an elastic polymer
2. After application, water enters through the pores
3. The nutrients are dissolved in the water, resulting in a concentrated nutrient solutions
4. Controlled nutrient release over 3, 6, 9 or 12 mos
The Controlled Release (CRF) Concept

P. 29
ICL Industrial Products
From Minerals of the Dead Sea to New Products and ‘Green’ Applications

P. 30
Flameretardants
41%Brominated
inorganic & Ag chemicals
46%
Watertreatmentbiocides
7%
Other 6%
ICL Industrial Products & End Markets
Segment Sales - 2012: $ 1.4 Billion Based on 2012 external sales ; * Expected growth rate.
Water treatment for
shale gas fracking
6-8%*
FRs for textile and soft drink bottles 5-7%
Mercury emission reduction 20-30%
Clear Brine
Fluids 4-6%
Flame retardants electronics, construction, automotive 4-6%
Bromobutyl rubber for the tire industry 4-6%
Industrial water
treatment 2-3%
Source: Electronics: Prismark study August 2012 ; Construction and automotive: AMI consulting study August 2012

P. 31
down from 24% in 2007
World's Leader in Elemental Bromine
Sources: US Bureau of Mines, Arkansas Oil & Gas Commission publications, ICL IP estimates.
ICL is the largest elemental-bromine producer in the world (capacity 280kt/y) ICL is one of the 3 leading players in the bromine-compounds industry Largest transportation capacity (fleet of iso-containers)
Advanced R&D (Israel, US) developing eco-friendly products Strong HSE (health, safety, environment )
Global Bromine Market in 2012 ~520Kt
ICL 35%
Albemarle 26%
Chemtura 15%
China 17%
Others 7%

P. 32
Source: IPC Association, SIA – Semiconductors Industry Association, The Bishop Report
Ongoing Slowdown in the Electronics Industry Dampens Demand for FRs
Bishop World Connectors Confidence Index
Book-to-Bill Ratio for the North American Rigid PCB
Global Semiconductors Shipments ($ million)
A change in trend?
P. 33
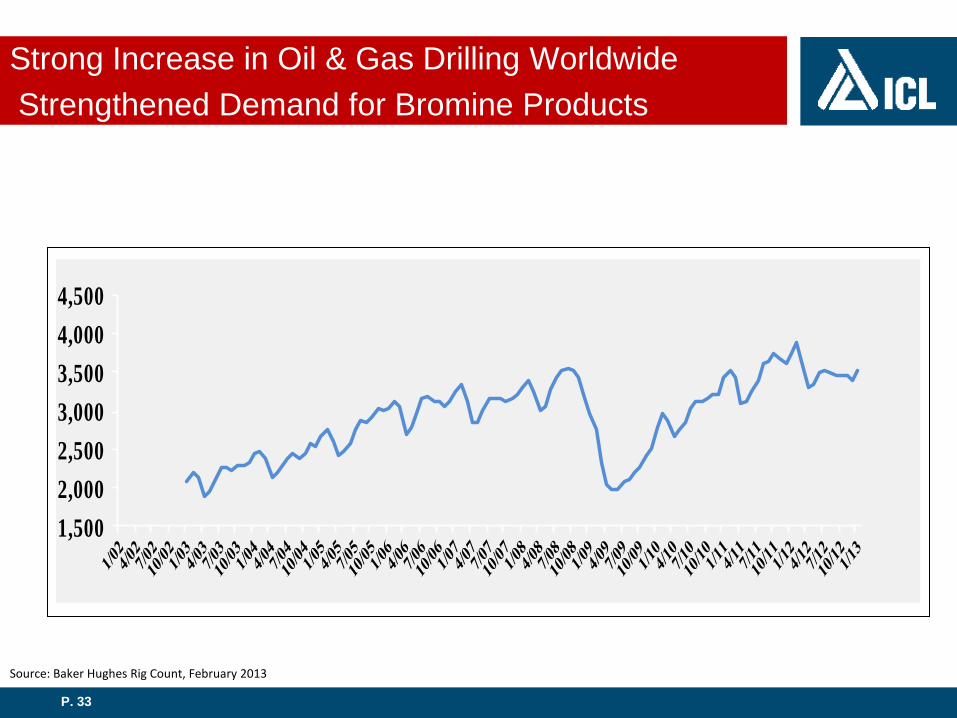
Strong Increase in Oil & Gas Drilling Worldwide Strengthened Demand for Bromine Products
1,5002,0002,5003,0003,5004,0004,500
Source: Baker Hughes Rig Count, February 2013

P. 34
Regulation & Energy Fire Safety Oil & gas drillings Shale gas Future pipeline
Increased demand for usable water Water treatment biocides
Industrial & waste water treatment
Drinking & farm animal
water purification
Clearon Bleach Tablets
Growing population & standard of living Intermediates for agro, food and pharma
Growing environmental awareness Merquel for Mercury emission
Green FR product lines – Polyquel TM, FR122P,
Halogen-free & low VOCs (Volatile organic compounds) FR for flexible polyurethane
Growth Driven by Global Megatrends, Stricter Regulations & Innovation
Major opportunities: green FR products, phosphorous FRs, MerquelTM, bromine based biocides for the shale gas industry.

P. 35
G
ICL Performance Products
Global Leader in Specialty Phosphates

P. 36
Segment Sales - 2012: $1.4 Billion
ICL Performance Products: Phosphate Downstream Applications
* Food, technical & electronic grade acids Based on 2012 external sales
76% phosphate & phosphorus-based products 24% other
Phosphate Salts and
Food Additives
Phosphoric Acid*
Other Phosphate
Based Products
Non-Phosphates
Based Products

P. 37
The Most Vertically Integrated Specialty Phosphates Company
Services and Solutions
Food Additives
Phosphate Salts
Phosphoric Acid (MGA) Commodity
Fertilizers
Phosphate Rock
Food Hygiene
Basic Products
From Raw Materials to Downstream Products & Services
High price
Low price
#1 in specialty phosphates
Food Grade Phosphoric
Acid
P. 38
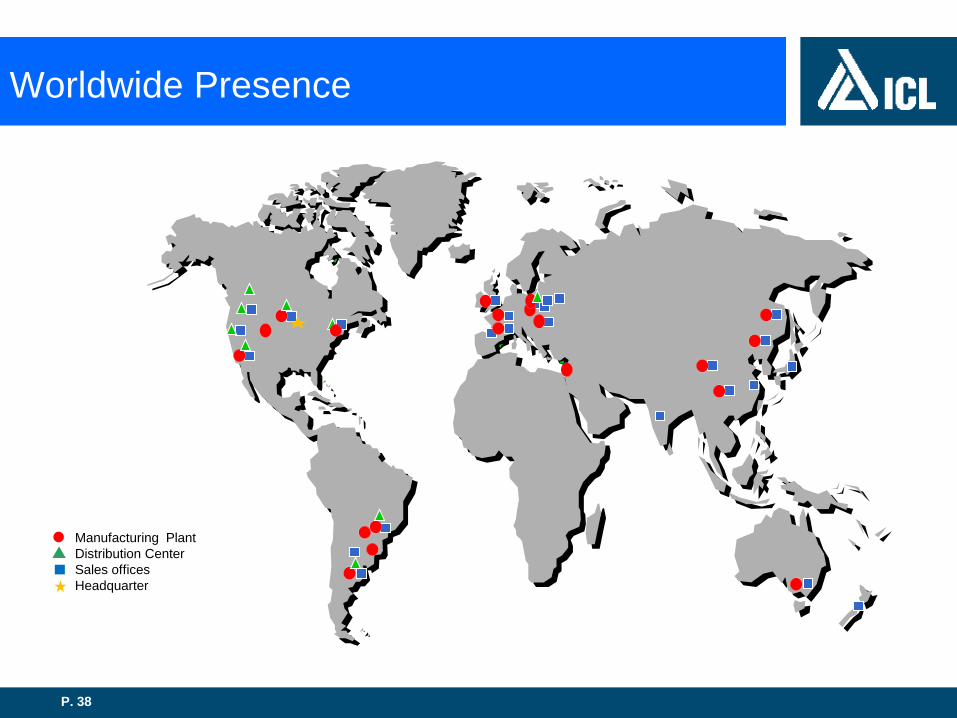
Worldwide Presence
Manufacturing Plant Distribution Center Sales offices Headquarter
P. 39
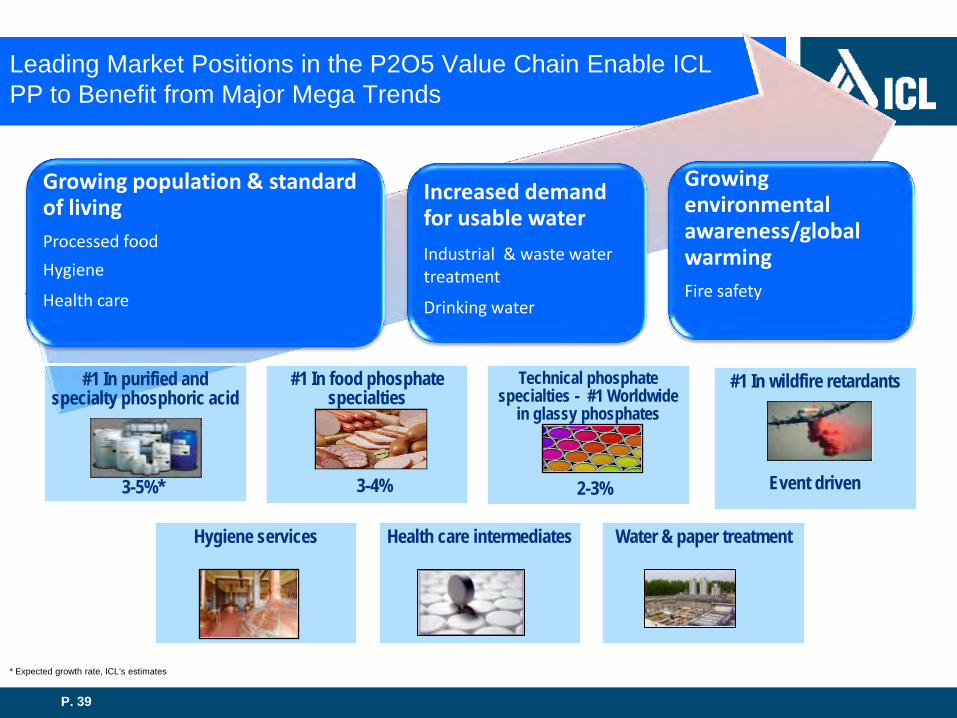
Increased demand for usable water Industrial & waste water treatment
Drinking water
Growing population & standard of living Processed food Hygiene
Health care
Growing environmental awareness/global warming Fire safety
#1 In purified and specialty phosphoric acid
#1 In food phosphate specialties
Technical phosphate specialties - #1 Worldwide
in glassy phosphates
#1 In wildfire retardants
Hygiene services Health care intermediates Water & paper treatment
Leading Market Positions in the P2O5 Value Chain Enable ICL PP to Benefit from Major Mega Trends
3-5%* 3-4% 2-3% Event driven
* Expected growth rate, ICL’s estimates

P. 40
Financial Information
Strong Financial Position Enables ICL to Take Advantage of Business Opportunities

P. 41
2012 Q4 12 $ millions
Gross profit
Gross margin
2,757.2
41.3%
507.1
37.9%
Operating income
Operating margin
1,576.5*
23.6%
194*
14.5%
Sales (CIF) 6,672.2 1,338.1
% change Vs. Q4 11
(34.6%)
(58.4%)
(21.9%)
Net income to the Company’s shareholders
1,300.5 209.5 (43.3%)
Q4 11
775.4
45.3%
466.5
27.2%
1,712.4
369.6
% change VS. 2011
(12.6%)
(18.1%)
(5.6%)
(14%)
2011
7,067.8
3,155.7
44.6%
1,926.0
27.2%
1,511.8
Q4 2012 and 2012 Financials
* Includes a one time expense associated with early retirement plans, in the amount of $55 million, which was recognized during the fourth quarter of 2012 . Also includes one time gain, associated with VAT refund in the amount of $ 11 million, which was received by a foreign subsidiary during the fourth quarter of 2012.
P. 42
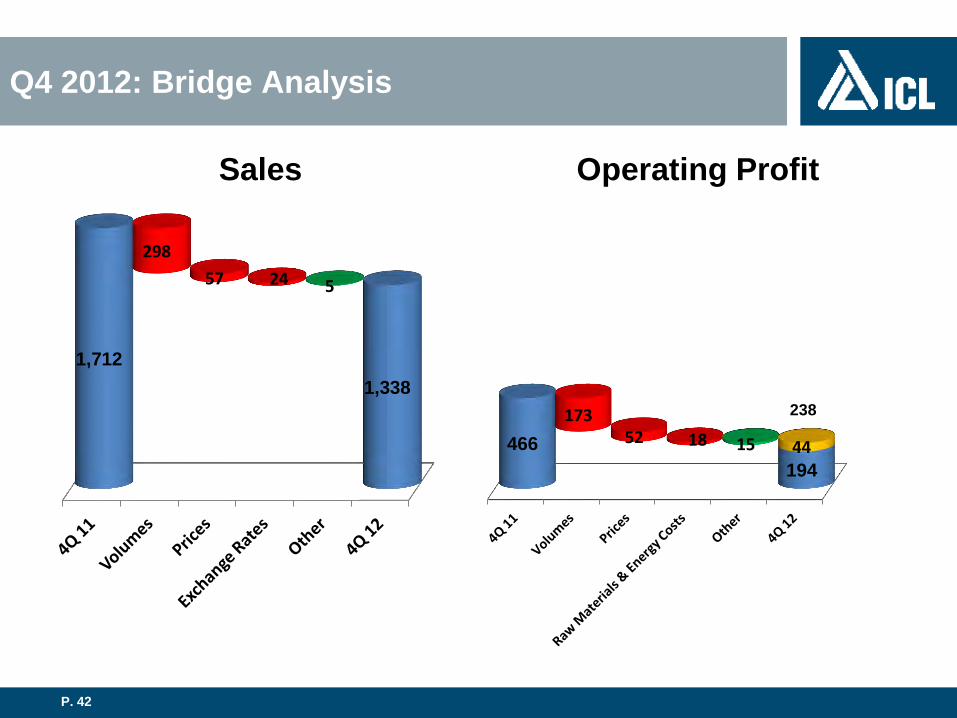
Sales Operating Profit
Q4 2012: Bridge Analysis
1,712 1,338
298 57 24 5
466 194
173 52 18 15 44
238
P. 43
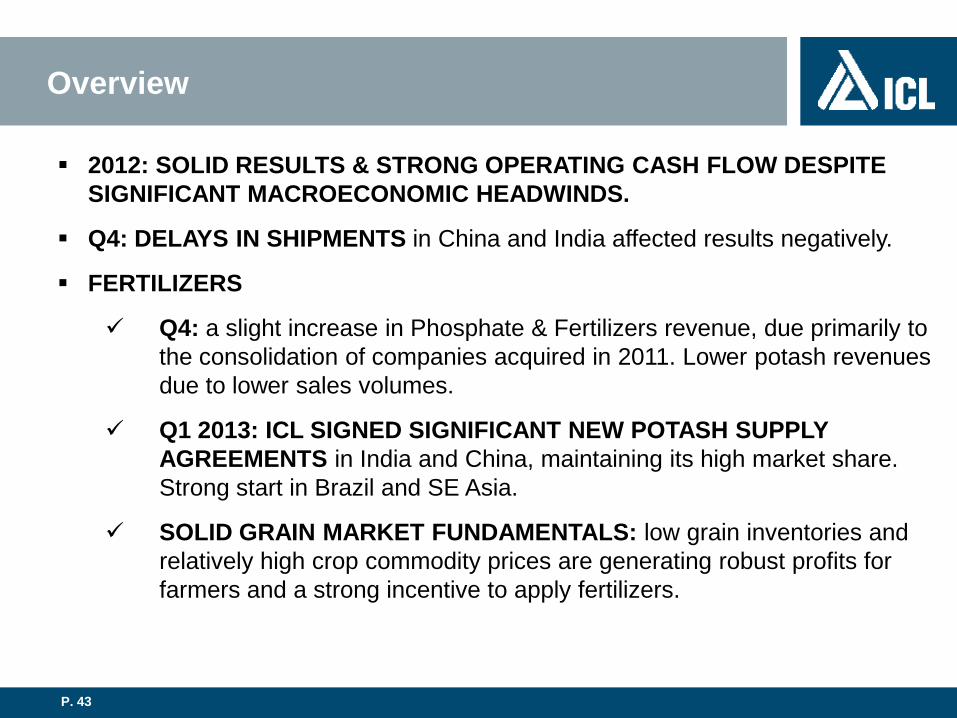
Overview
2012: SOLID RESULTS & STRONG OPERATING CASH FLOW DESPITE SIGNIFICANT MACROECONOMIC HEADWINDS.
Q4: DELAYS IN SHIPMENTS in China and India affected results negatively.
FERTILIZERS
Q4: a slight increase in Phosphate & Fertilizers revenue, due primarily to the consolidation of companies acquired in 2011. Lower potash revenues due to lower sales volumes.
Q1 2013: ICL SIGNED SIGNIFICANT NEW POTASH SUPPLY AGREEMENTS in India and China, maintaining its high market share. Strong start in Brazil and SE Asia.
SOLID GRAIN MARKET FUNDAMENTALS: low grain inventories and relatively high crop commodity prices are generating robust profits for farmers and a strong incentive to apply fertilizers.

P. 44
Overview (cont.)
SPECIALTY CHEMICALS BUSINESSES WERE AFFECTED BY GLOBAL ECONOMIC UNCERTAINTY
INDUSTRIAL PRODUCTS : soft demand for FR’s for the electronics & construction industries, countered partially by strong sales & new applications in the energy and water markets for other brominated products.
PERFORMANCE PRODUCTS: solid volumes in North America partially offset lower volumes in Europe.
Q4: volumes in the European market improved whereas customers reduced inventories significantly in December in the U.S.
Sales in the beginning of 2013 indicate no further deterioration of the market.
ICL PP recently acquired Thermphos’ P2S5 business to support its global platform in the fuel additives market.

P. 45
10.9% 8.1% 10.4% 10.5% 22.4%
31.2% 23.2% 31.4%
94.5%
29.5% 38.0%
53.1% 40.3%
5.5% 4.2% 5.5% 5.3% 9.6% 14.4% 12.9% 19.1%
52.0%
19.4% 21.4% 33.5% 31.3%
2000 2001 2002 2003 2004 2005 2006 2007 2008 2009 2010 2011 2012
Strong Returns
ROIC
ROE
ROE (Return on equity) = net income / shareholders' equity, average
ROIC (Return on invested capital ) = (operating income ×(1-0.20)) / ((trade receivables + inventory – trade payables) + PP&E, net), average
2000-2006 figures are based on Israeli GAAP, 2007-2012 are based on IFRS

P. 46
$ millions
Very Strong Annual Cash Flow Delivery
* 2006 figures are based on Israeli GAAP, 2007-2012 are based on IFRS
2006 2007 2008 2009 2010 2011 2012
75 91 206 239 220 142 274 65 177
456 400 521
284 360
119 147
717
242 370
499
680
75 150
475
318.7
427
344.4
275 Q4 Q3 Q2 Q1 360
565
1,855
1,200
1,538 1,269
1,593
P. 47
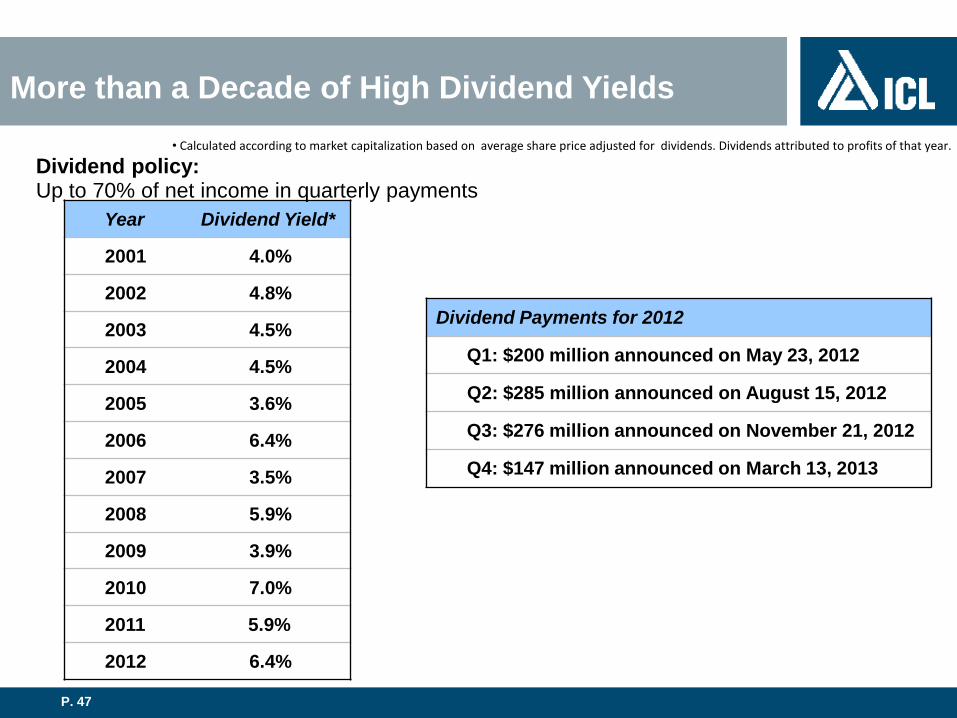
• Calculated according to market capitalization based on average share price adjusted for dividends. Dividends attributed to profits of that year.
Year Dividend Yield*
2001 4.0%
2002 4.8%
2003 4.5%
2004 4.5%
2005 3.6%
2006 6.4%
2007 3.5%
2008 5.9%
2009 3.9%
2010 7.0%
2011 5.9%
2012 6.4%
Dividend policy: Up to 70% of net income in quarterly payments
Dividend Payments for 2012
Q1: $200 million announced on May 23, 2012
Q2: $285 million announced on August 15, 2012
Q3: $276 million announced on November 21, 2012
Q4: $147 million announced on March 13, 2013
More than a Decade of High Dividend Yields

P. 48
Summary: Well Positioned to Achieve Sustainable Growth
Access to vast, low cost natural resources.
Proven competencies and execution capabilities.
Global footprint with strong infrastructure.
Well-positioned segments with high barriers to entry.
Strong long-term fundamentals of our markets.
New market drivers and opportunities.
Dedicated to sustainability and HSE.
With the salt dredging & potash royalties issues resolved, ICL is well positioned for future development & sustainability.
P. 49
ICL: Committed to Responsible Value Creation
Thank you www.icl-group.com